Page 1
Ordine dupa
EBITDA 2017Denumire companie AN EBITDA
Marja
EBITDA (%)Cifra de afaceri Rezultat Brut Capitaluri Proprii
Rentabilitatea
capitalului
propriu
Levier Financiar Nr. de angajati
Position by
EBITDA 2017Company Name year EBITDA
EBITDA
Margin (%)Net Turnover Profit/Loss Before Tax Shareholders Equity
Return on
EquityLeverage
Number of
Employees
1 OMV PETROM SA 2017 5,742,574,352 39% 14,764,836,448 2,722,964,109 27,560,118,459 9% 14% 13,322
1 2016 3,201,217,201 26% 12,523,026,161 1,051,712,321 26,000,813,309 3% 13% 14,380
1 Diferenta / Difference (%) 79% 18% 159% 6% -7%
2 ORANGE ROMANIA SA 2017 1,565,717,746 29% 5,364,891,173 369,692,369 1,752,367,427 18% 63% 2,361
2 2016 1,608,716,684 33% 4,917,728,697 461,506,111 1,752,136,048 22% 62% 2,371
2 Diferenta / Difference (%) -3% 9% -20% 0% 0%
3 KAUFLAND ROMANIA SCS 2017 1,112,809,474 11% 10,086,636,311 796,767,482 4,966,928,600 13% 33% 13,519
3 2016 1,043,060,656 11% 9,691,424,899 751,923,130 4,208,551,393 16% 34% 14,070
3 Diferenta / Difference (%) 7% 4% 6% 18% -4%
4 AUTOMOBILE-DACIA SA 2017 1,097,545,246 5% 23,143,498,839 550,532,371 4,354,284,173 12% 51% 14,261
4 2016 1,038,735,704 5% 20,764,966,545 505,904,389 3,891,014,014 12% 50% 13,835
4 Diferenta / Difference (%) 6% 11% 9% 12% 3%
5 DEDEMAN SRL 2017 1,076,803,573 17% 6,333,363,177 1,007,823,515 3,613,110,445 25% 19% 9,818
5 2016 860,418,243 16% 5,255,561,777 818,537,317 2,923,981,678 24% 23% 8,421
5 Diferenta / Difference (%) 25% 21% 23% 24% 17%
6 RCS & RDS SA 2017 996,910,436 30% 3,339,403,562 294,553,497 696,015,345 42% 88% 11,703
6 2016 819,571,448 25% 3,295,399,250 (59,296,912) 455,167,083 -13% 92% 11,122
6 Diferenta / Difference (%) 22% 1% -597% 53% 5%
7 CONTINENTAL AUTOMOTIVE PRODUCTS SRL 2017 977,615,242 31% 3,130,805,436 831,322,466 1,164,483,064 60% 27% 2,423
7 2016 1,053,196,828 35% 2,970,479,739 903,533,038 1,156,942,416 65% 25% 2,445
7 Diferenta / Difference (%) -7% 5% -8% 1% -1%
8 VODAFONE ROMANIA SA 2017 758,104,616 21% 3,653,902,366 86,112,811 739,250,311 8% 73% 2,508
8 2016 855,127,942 24% 3495231400 176,638,424 722,674,216.00 26% 74% 2787
8 Diferenta / Difference (%) -11% 5% -51% 2% -10%
9 FORD ROMANIA SA 2017 641,281,724 13% 4,824,809,466 95,467,314 774,746,963 12% 81% 3,201
9 2016 607,640,609 16% 3,714,955,356 29,022,551 574,814,193 5% 79% 2,623
9 Diferenta / Difference (%) 6% 30% 229% 35% 22%
10 PRO TV SRL 2017 628,260,475 82% 768,677,901 252,430,031 613,811,075 35% 37% 909
10 2016 571,777,284 82% 700,862,832 176,406,268 401,425,659 42% 53% 863
10 Diferenta / Difference (%) 10% 10% 43% 53% 5%
11 DELGAZ GRID S.A. 2017 601,526,908 40% 1,487,774,196 245,291,731 3,926,199,563 5% 8% 3,946
11 2016 622,131,544 41% 1,533,442,897 288,976,085 3,745,614,191 6% 9% 3,737
11 Diferenta / Difference (%) -3% -3% -15% 5% 6%
12 OMV PETROM MARKETING SRL 2017 545,492,580 4% 15,063,976,049 366,237,050 1,914,729,555 17% 37% 210
12 2016 522,718,364 4% 14,401,855,760 444,555,395 1,945,225,370 20% 50% 220
12 Diferenta / Difference (%) 4% 5% -18% -2% -5%
13 STAR ASSEMBLY SRL 2017 510,572,850 7% 7,328,061,605 309,132,349 959,360,480 26% 69% 1,811
13 2016 161,169,087 11% 1,496,048,984 69,704,606 713,323,436 7% 63% 547
13 Diferenta / Difference (%) 217% 390% 343% 34% 231%
14 ROMPETROL RAFINARE SA 2017 500,825,717 4% 11,192,755,314 418,336,728 2,579,458,450 16% 67% 1,061
14 2016 527,675,006 6% 8,774,321,849 26,666,077 1,326,900,989 5% 80% 1,085
14 Diferenta / Difference (%) -5% 28% 1469% 94% -2%
15 LIDL DISCOUNT SRL 2017 485,971,753 7% 6,510,008,485 391,190,210 1,084,133,366 33% 66% 4,815
15 2016 351,001,318 6% 5,577,887,360 289,394,566 731,367,267 30% 66% 4,265
15 Diferenta / Difference (%) 38% 17% 35% 48% 13%
Page 2
Ordine dupa
EBITDA 2017Denumire companie AN EBITDA
Marja
EBITDA (%)Cifra de afaceri Rezultat Brut Capitaluri Proprii
Rentabilitatea
capitalului
propriu
Levier Financiar Nr. de angajati
Position by
EBITDA 2017Company Name year EBITDA
EBITDA
Margin (%)Net Turnover Profit/Loss Before Tax Shareholders Equity
Return on
EquityLeverage
Number of
Employees
16 ALRO SA 2017 463,258,114 19% 2,480,775,721 377,819,779 1,379,281,912 23% 45% 2,501
16 2016 243,529,347 11% 2,139,862,434 80,286,925 1,131,666,599 6% 52% 2,449
16 Diferenta / Difference (%) 90% 16% 371% 22% 2%
17 COCA-COLA HBC ROMANIA SRL 2017 449,650,886 20% 2,218,998,534 400,720,688 996,695,693 34% 26% 1,476
17 2016 425,969,482 19% 2,224,228,133 340,032,594 920,214,333 30% 26% 1,427
17 Diferenta / Difference (%) 6% 0% 18% 8% 3%
18 DELPHI DIESEL SYSTEMS ROMANIA SRL 2017 414,622,486 20% 2,075,725,930 243,955,291 996,049,121 20% 28% 2,011
18 2016 368,948,620 19% 1,913,001,399 201,703,417 800,636,149 21% 35% 1,719
18 Diferenta / Difference (%) 12% 9% 21% 24% 17%
19 J.T. INTERNATIONAL (ROMANIA) SRL 2017 401,611,892 37% 1,086,551,930 400,145,445 431,305,225 78% 53% 686
19 2016 219,963,564 6% 3,608,063,837 196,430,093 252,541,747 64% 71% 706
19 Diferenta / Difference (%) 83% -70% 104% 71% -3%
20 MEGA IMAGE SRL 2017 358,166,639 7% 4,910,452,187 244,772,117 1,232,631,450 16% 36% 9,313
20 2016 272,326,971 6% 4,325,099,808 167,373,945 1,030,853,376 13% 37% 8,658
20 Diferenta / Difference (%) 32% 14% 46% 20% 8%
21 HOLCIM (ROMANIA) SA 2017 347,781,451 33% 1,051,272,937 178,447,585 649,714,175 23% 51% 755
21 2016 329,700,999 32% 1,015,648,887 165,861,906 697,017,865 18% 50% 745
21 Diferenta / Difference (%) 5% 4% 8% -7% 1%
22 CARREFOUR ROMANIA SA 2017 343,710,375 5% 6,748,911,268 261,129,375 1,213,977,170 17% 62% 9,939
22 2016 287,621,776 5% 5,673,677,672 205,096,963 1,136,041,004 14% 62% 9,101
22 Diferenta / Difference (%) 20% 19% 27% 7% 9%
23 URSUS BREWERIES SA 2017 342,980,880 20% 1,705,841,267 194,302,058 806,026,733 20% 36% 1,443
23 2016 324,946,491 20% 1,638,808,749 177,108,217 656,169,918 22% 34% 1,409
23 Diferenta / Difference (%) 6% 4% 10% 23% 2%
24 BRITISH AMERICAN TOBACCO (ROMANIA) TRADING SRL2017 342,186,444 4% 8,870,586,009 364,055,830 307,330,957 99% 74% 679
24 2016 821,863,858 10% 8,178,790,135 807,824,030 674,185,712 100% 67% 674
24 Diferenta / Difference (%) -58% 8% -55% -54% 1%
25 PIRELLI TYRES ROMANIA SRL 2017 312,028,459 14% 2,255,260,255 102,077,786 1,259,418,701 6% 49% 3,053
25 2016 255,339,146 14% 1,860,674,582 94,285,443 1,180,961,162 7% 42% 2,751
25 Diferenta / Difference (%) 22% 21% 8% 7% 11%
26 HELLA ROMÂNIA SRL 2017 306,930,656 11% 2,735,581,988 181,159,547 512,781,205 28% 58% 3,684
26 2016 284,463,268 12% 2,285,980,392 189,067,404 417,238,573 38% 57% 3,145
26 Diferenta / Difference (%) 8% 20% -4% 23% 17%
27 E-DISTRIBUŢIE MUNTENIA S.A. 2017 306,523,477 41% 750,558,664 85,901,292 4,614,677,162 2% 11% 929
27 2016 405,556,550 50% 809,289,788 180,975,100 4,463,121,921 3% 11% 953
27 Diferenta / Difference (%) -24% -7% -53% 3% -3%
28 SOCIETATEA DE DISTRIBUŢIE A ENERGIEI ELECTRICE TRANSILVANIA SUD S.A.2017 298,167,652 45% 662,433,751 121,248,657 1,235,607,967 8% 26% 1,763
28 2016 296,091,272 44% 671,766,969 135,715,959 1,228,983,370 9% 19% 1,721
28 Diferenta / Difference (%) 1% -1% -11% 1% 2%
29 PROFI ROM FOOD SRL 2017 288,915,208 6% 4,730,021,461 163,842,572 1,608,896,770 8% 56% 11,662
29 2016 217,660,064 6% 3,549,852,949 148,266,978 227,508,131 56% 80% 9,469
29 Diferenta / Difference (%) 33% 33% 11% 607% 23%
30 ROMPETROL DOWNSTREAM SRL 2017 265,273,266 3% 8,873,204,128 168,542,938 538,476,411 31% 73% 561
30 2016 238,073,629 3% 8,202,373,776 62,094,813 386,776,326 16% 75% 894
30 Diferenta / Difference (%) 11% 8% 171% 39% -37%
Page 3
Ordine dupa
EBITDA 2017Denumire companie AN EBITDA
Marja
EBITDA (%)Cifra de afaceri Rezultat Brut Capitaluri Proprii
Rentabilitatea
capitalului
propriu
Levier Financiar Nr. de angajati
Position by
EBITDA 2017Company Name year EBITDA
EBITDA
Margin (%)Net Turnover Profit/Loss Before Tax Shareholders Equity
Return on
EquityLeverage
Number of
Employees
31 APA NOVA BUCURESTI SA 2017 265,084,947 37% 719,949,803 148,451,702 821,529,129 16% 39% 1,832
31 2016 253,056,965 36% 693,536,738 142,036,456 822,623,468 14% 39% 2,016
31 Diferenta / Difference (%) 5% 4% 5% 0% -9%
32 DAFORA SA 2017 260,127,736 348% 74,811,161 252,766,957 (15,780,340) -1609% 114% 317
32 2016 (109,428,011) -224% 48,952,372 (105,248,978) (268,646,659) 40% 396% 250
32 Diferenta / Difference (%) -338% 53% -340% -94% 27%
33 SOCIETATEA DE DISTRIBUȚIE A ENERGIEI ELECTRICE TRANSILVANIA NORD S.A.2017 255,810,460 40% 632,318,705 100,995,819 1,281,678,962 7% 30% 1,857
33 2016 297,820,386 45% 656,289,021 154,422,481 1,228,138,245 10% 23% 1,830
33 Diferenta / Difference (%) -14% -4% -35% 4% 1%
34 SILCOTUB SA 2017 255,786,037 14% 1,785,980,667 107,756,695 2,068,361,278 4% 9% 1,723
34 2016 225,415,029 18% 1,234,287,117 153,621,755 1,890,789,438 7% 8% 1,521
34 Diferenta / Difference (%) 13% 45% -30% 9% 13%
35 MOL ROMANIA PETROLEUM PRODUCTS SRL 2017 254,836,780 5% 5,469,740,835 215,531,292 813,698,966 23% 31% 228
35 2016 248,984,477 5% 4,735,385,166 178,332,277 745,147,118 21% 31% 213
35 Diferenta / Difference (%) 2% 16% 21% 9% 7%
36 CAMERON ROMÂNIA SRL 2017 254,728,305 24% 1,069,839,527 132,206,760 689,391,652 16% 22% 1,112
36 2016 313,275,147 28% 1,113,958,345 330,372,613 1,395,784,982 20% 14% 1,086
36 Diferenta / Difference (%) -19% -4% -60% -51% 2%
37 HEINEKEN ROMANIA SA 2017 254,350,975 22% 1,160,229,860 143,427,262 815,267,976 16% 29% 1,157
37 2016 296,906,947 24% 1,214,365,597 184,788,651 819,654,250 20% 29% 1,123
37 Diferenta / Difference (%) -14% -4% -22% -1% 3%
38 HEIDELBERGCEMENT ROMÂNIA S.A. 2017 253,829,505 29% 890,530,183 165,004,877 1,116,788,764 12% 13% 955
38 2016 254,483,160 31% 824,947,076 146,861,920 1,027,219,348 12% 11% 946
38 Diferenta / Difference (%) 0% 8% 12% 9% 1%
39 DISTRIBUȚIE ENERGIE OLTENIA S.A. 2017 250,051,899 32% 771,917,745 (3,074,392) 2,214,945,275 -1% 23% 1,257
39 2016 280,124,345 36% 787,176,173 24,322,192 1,976,244,809 0% 26% 1,213
39 Diferenta / Difference (%) -11% -2% -113% 12% 4%
40 SMITHFIELD ROMANIA SRL 2017 239,884,416 26% 920,125,715 186,315,993 1,234,011,779 14% 25% 1,168
40 2016 127,631,061 17% 732,781,251 89,344,806 999,478,672 9% 26% 1,141
40 Diferenta / Difference (%) 88% 26% 109% 23% 2%
41 LINDE GAZ ROMANIA SRL 2017 238,692,981 40% 597,858,329 142,268,575 700,679,649 17% 17% 507
41 2016 220,197,807 39% 570,574,881 125,980,662 766,851,756 14% 11% 482
41 Diferenta / Difference (%) 8% 5% 13% -9% 5%
42 AUTOLIV ROMANIA SRL 2017 229,642,210 6% 3,921,743,766 120,325,158 859,910,391 13% 49% 9,758
42 2016 232,906,216 7% 3,543,715,060 122,402,543 746,876,516 15% 50% 8,961
42 Diferenta / Difference (%) -1% 11% -2% 15% 9%
43 E-DISTRIBUŢIE BANAT S.A. 2017 229,589,689 48% 483,205,577 92,883,260 2,685,532,346 3% 8% 750
43 2016 240,147,885 46% 519,604,225 113,149,359 2,572,553,122 4% 8% 793
43 Diferenta / Difference (%) -4% -7% -18% 4% -5%
44 AUCHAN ROMÂNIA SA 2017 222,616,314 4% 5,223,286,301 87,000,400 1,291,876,496 6% 57% 9,290
44 2016 153,875,240 3% 4,895,591,739 3,150,391 1,217,438,771 -2% 58% 9,337
44 Diferenta / Difference (%) 45% 7% 2662% 6% -1%
45 EGGER ROMANIA SRL 2017 213,004,374 14% 1,536,948,231 63,245,233 1,093,704,204 5% 13% 730
45 2016 224,453,041 17% 1,355,441,394 64,802,228 1,061,378,720 5% 27% 693
45 Diferenta / Difference (%) -5% 13% -2% 3% 5%
Page 4
Ordine dupa
EBITDA 2017Denumire companie AN EBITDA
Marja
EBITDA (%)Cifra de afaceri Rezultat Brut Capitaluri Proprii
Rentabilitatea
capitalului
propriu
Levier Financiar Nr. de angajati
Position by
EBITDA 2017Company Name year EBITDA
EBITDA
Margin (%)Net Turnover Profit/Loss Before Tax Shareholders Equity
Return on
EquityLeverage
Number of
Employees
46 SCHAEFFLER ROMANIA SRL 2017 211,835,151 11% 1,981,310,236 60,542,962 849,318,085 7% 30% 4,366
46 2016 264,598,276 15% 1,794,522,592 88,033,777 791,054,011 9% 34% 4,194
46 Diferenta / Difference (%) -20% 10% -31% 7% 4%
47 CRH CIMENT (ROMANIA) S.A. 2017 210,818,240 22% 943,070,301 107,688,998 1,109,741,848 7% 15% 821
47 2016 230,112,482 28% 815,627,220 93,530,983 981,122,526 9% 19% 491
47 Diferenta / Difference (%) -8% 16% 15% 13% 67%
48 MICHELIN ROMANIA S.A. 2017 199,148,117 8% 2,564,597,480 60,384,347 413,119,592 12% 80% 3,282
48 2016 270,875,825 13% 2,163,704,892 129,016,912 459,281,830 23% 71% 3,022
48 Diferenta / Difference (%) -26% 19% -53% -10% 9%
49 ROBERT BOSCH SRL 2017 195,111,565 9% 2,285,588,976 100,500,951 268,352,129 31% 80% 2,491
49 2016 120,837,172 8% 1,504,737,615 55,735,137 184,814,626 24% 80% 2,124
49 Diferenta / Difference (%) 61% 52% 80% 45% 17%
50 PHILIP MORRIS TRADING SRL 2017 193,032,163 8% 2,378,469,259 175,474,377 199,567,867 70% 57% 233
50 2016 118,743,679 5% 2,235,392,822 114,996,597 166,372,072 57% 63% 198
50 Diferenta / Difference (%) 63% 6% 53% 20% 18%
51 TERAPIA SA 2017 192,172,955 29% 671,028,265 152,439,132 824,904,590 16% 12% 867
51 2016 192,932,457 34% 567,979,693 167,784,894 693,505,289 21% 14% 861
51 Diferenta / Difference (%) 0% 18% -9% 19% 1%
52 ZARA BUCURESTI SRL 2017 182,863,473 23% 795,973,779 155,077,553 159,127,140 82% 28% 964
52 2016 169,883,585 25% 686,886,490 141,418,726 147,631,497 80% 27% 908
52 Diferenta / Difference (%) 8% 16% 10% 8% 6%
53 E-DISTRIBUȚIE DOBROGEA S.A. 2017 170,919,400 41% 412,584,278 58,735,586 1,768,365,570 3% 9% 622
53 2016 197,145,713 45% 442,904,820 87,304,766 1,679,776,587 4% 10% 660
53 Diferenta / Difference (%) -13% -7% -33% 5% -6%
54 METRO CASH & CARRY ROMANIA SRL 2017 170,387,577 4% 4,729,779,600 139,441,174 933,206,507 12% 45% 3,908
54 2016 180,470,781 4% 4,356,994,496 134,956,188 858,467,279 12% 47% 4,140
54 Diferenta / Difference (%) -6% 9% 3% 9% -6%
55 LUKOIL ROMANIA SRL 2017 168,024,282 3% 5,922,290,967 110,939,600 424,428,479 20% 64% 2,599
55 2016 154,764,513 3% 5,365,592,822 (7,882,404) 338,682,170 -5% 69% 2,819
55 Diferenta / Difference (%) 9% 10% -1507% 25% -8%
56 SOCIETATEA DE DISTRIBUTIE A ENERGIEI ELECTRICE MUNTENIA NORD S.A.2017 167,901,567 26% 636,612,471 45,277,712 1,610,448,128 3% 19% 1,836
56 2016 241,239,364 36% 679,429,617 120,515,599 1,595,358,779 6% 10% 1,851
56 Diferenta / Difference (%) -30% -6% -62% 1% -1%
57 BOSCH REXROTH SRL 2017 165,487,278 9% 1,772,494,278 92,604,878 278,241,373 27% 72% 2,718
57 2016 81,260,017 8% 1,042,655,305 27,990,483 202,705,326 11% 76% 1,773
57 Diferenta / Difference (%) 104% 70% 231% 37% 53%
58 PORSCHE ROMANIA SRL 2017 159,048,132 5% 2,904,687,484 143,834,814 150,443,098 71% 65% 144
58 2016 142,036,792 6% 2,467,034,397 130,899,568 147,950,583 71% 64% 141
58 Diferenta / Difference (%) 12% 18% 10% 2% 2%
59 OVIDIU DEVELOPMENT SRL 2017 153,863,190 86% 178,677,752 184,495,010 1,394,848,383 13% 1% 5
59 2016 61,798,700 35% 176,764,455 (70,115,999) 1,204,237,483 -6% 1% 1
59 Diferenta / Difference (%) 149% 1% -363% 16% 400%
60 UNICREDIT LEASING FLEET MANAGEMENT SRL 2017 151,197,119 79% 191,651,012 2,739,497 22,265,363 12% 96% 13
60 2016 122,558,761 77% 158,486,120 5,134,113 19,525,866 26% 96% 11
60 Diferenta / Difference (%) 23% 21% -47% 14% 18%
Page 5
Ordine dupa
EBITDA 2017Denumire companie AN EBITDA
Marja
EBITDA (%)Cifra de afaceri Rezultat Brut Capitaluri Proprii
Rentabilitatea
capitalului
propriu
Levier Financiar Nr. de angajati
Position by
EBITDA 2017Company Name year EBITDA
EBITDA
Margin (%)Net Turnover Profit/Loss Before Tax Shareholders Equity
Return on
EquityLeverage
Number of
Employees
61 BANEASA DEVELOPMENTS SRL 2017 149,167,989 64% 232,641,892 95,170,140 122,361,484 66% 75% 154
61 2016 139,002,469 63% 221,137,223 84,535,671 115,629,590 62% 77% 180
61 Diferenta / Difference (%) 7% 5% 13% 6% -14%
62 UNIVERSAL ALLOY CORPORATION EUROPE SRL 2017 146,214,536 32% 462,158,949 68,158,703 218,572,962 28% 71% 1,194
62 2016 112,792,974 32% 347,130,334 47,892,490 163,501,701 26% 74% 1,023
62 Diferenta / Difference (%) 30% 33% 42% 34% 17%
63 DISTRIGAZ SUD RETELE SRL 2017 144,272,654 12% 1,170,672,418 151,084,998 222,508,987 55% 58% 2,545
63 2016 161,207,801 14% 1,171,309,512 121,586,929 192,737,574 48% 58% 2,611
63 Diferenta / Difference (%) -11% 0% 24% 15% -3%
64 STABILUS ROMANIA SRL 2017 143,447,603 19% 754,984,956 130,821,751 325,914,155 33% 26% 1,106
64 2016 96,513,667 16% 602,438,215 82,292,909 216,665,754 36% 34% 1,085
64 Diferenta / Difference (%) 49% 25% 59% 50% 2%
65 GALLI GALLO SRL 2017 141,847,144 1295% 10,949,501 136,145,822 2,326,699 5851% 97% 2
65 2016 1,686,906 1% 144,509,821 (6,351,377) (133,819,123) 5% 254% 244
65 Diferenta / Difference (%) 8309% -92% -2244% -102% -99%
66 PREMIUM AEROTEC SRL 2017 139,970,604 47% 300,251,408 106,727,639 227,677,828 39% 26% 804
66 2016 129,473,907 47% 274,587,401 94,583,494 207,255,808 38% 29% 755
66 Diferenta / Difference (%) 8% 9% 13% 10% 6%
67 COTROCENI PARK SA 2017 138,006,703 81% 171,382,287 (36,864,860) 1,606,047,517 -3% 37% 46
67 2016 142,091,866 86% 164,590,991 207,211,945 1,447,504,826 14% 39% 44
67 Diferenta / Difference (%) -3% 4% -118% 11% 5%
68 ROMAQUA GROUP SA 2017 137,772,022 19% 725,126,678 81,621,238 313,570,667 23% 56% 1,911
68 2016 146,347,091 21% 693,317,570 91,377,841 266,907,183 28% 60% 1,902
68 Diferenta / Difference (%) -6% 5% -11% 17% 0%
69 ISB MEDIA HOLDING LTD. - SEDIU PERMANENT DESEMNAT2017 137,141,660 87% 158,273,458 20,666,905 1,309,580 1578% 96% 1
69 2016 129,978,831 85% 153,419,431 254,790 (19,357,325) -1% 168% 1
69 Diferenta / Difference (%) 6% 3% 8011% -107% 0%
70 TAKATA ROMANIA SRL 2017 136,096,912 5% 2,749,498,310 62,482,415 574,243,345 8% 40% 4,830
70 2016 172,757,914 7% 2,572,562,638 143,382,710 350,394,620 32% 48% 4,347
70 Diferenta / Difference (%) -21% 7% -56% 64% 11%
71 FAN COURIER EXPRESS SRL 2017 133,821,780 23% 585,946,144 79,400,028 305,265,566 22% 25% 2,473
71 2016 132,520,674 26% 512,375,946 104,648,886 268,220,582 33% 22% 2,190
71 Diferenta / Difference (%) 1% 14% -24% 14% 13%
72 UPC ROMANIA SRL 2017 133,316,316 21% 626,100,482 (120,906,851) 57,548,722 -210% 95% 1,084
72 2016 112,273,677 19% 579,066,283 (277,299,599) 178,455,573 -155% 84% 1,198
72 Diferenta / Difference (%) 19% 8% -56% -68% -10%
73 ARCTIC SA 2017 132,458,765 6% 2,217,159,118 81,055,736 1,036,703,518 7% 24% 2,822
73 2016 243,955,076 12% 2,023,079,692 200,139,540 962,695,548 18% 27% 2,791
73 Diferenta / Difference (%) -46% 10% -60% 8% 1%
74 SELGROS CASH & CARRY SRL 2017 131,619,897 4% 3,645,073,094 59,624,474 1,166,484,000 4% 34% 4,341
74 2016 111,313,024 3% 3,296,805,068 36,996,187 1,552,419,015 2% 25% 4,039
74 Diferenta / Difference (%) 18% 11% 61% -25% 7%
75 JUMBO EC.R SRL 2017 131,514,936 33% 400,222,596 121,502,992 529,190,424 19% 24% 798
75 2016 86,085,113 32% 268,239,559 80,001,691 426,987,852 16% 12% 559
75 Diferenta / Difference (%) 53% 49% 52% 24% 43%
Page 6
Ordine dupa
EBITDA 2017Denumire companie AN EBITDA
Marja
EBITDA (%)Cifra de afaceri Rezultat Brut Capitaluri Proprii
Rentabilitatea
capitalului
propriu
Levier Financiar Nr. de angajati
Position by
EBITDA 2017Company Name year EBITDA
EBITDA
Margin (%)Net Turnover Profit/Loss Before Tax Shareholders Equity
Return on
EquityLeverage
Number of
Employees
76 PEPCO RETAIL SRL 2017 131,346,422 20% 659,849,575 115,411,331 151,013,882 63% 25% 1,409
76 2016 71,071,830 21% 335,531,474 65,138,877 55,626,657 97% 56% 806
76 Diferenta / Difference (%) 85% 97% 77% 171% 75%
77 AGRICOST S.A. 2017 128,147,952 36% 359,222,555 83,470,054 297,007,832 25% 36% 834
77 2016 122,111,281 32% 387,270,924 82,011,860 227,463,302 31% 49% 917
77 Diferenta / Difference (%) 5% -7% 2% 31% -9%
78 PHILIP MORRIS ROMANIA SRL 2017 126,229,618 42% 302,868,602 59,922,799 241,199,249 18% 71% 672
78 2016 76,723,679 36% 215,369,129 45,354,675 263,158,316 14% 51% 674
78 Diferenta / Difference (%) 65% 41% 32% -8% 0%
79 FILDAS TRADING SRL 2017 126,049,829 5% 2,662,430,250 115,678,513 272,230,718 38% 86% 895
79 2016 114,408,226 5% 2,419,793,192 105,841,782 269,506,150 35% 82% 773
79 Diferenta / Difference (%) 10% 10% 9% 1% 16%
80 NESTLE ROMÂNIA SRL 2017 124,000,723 15% 820,647,470 103,505,517 143,976,791 61% 50% 865
80 2016 110,646,383 14% 783,621,223 102,812,355 136,404,120 64% 51% 901
80 Diferenta / Difference (%) 12% 5% 1% 6% -4%
81 IBM ROMANIA SRL 2017 122,893,431 14% 906,742,778 96,999,482 132,978,878 60% 36% 3,096
81 2016 97,944,206 12% 814,463,546 91,600,531 90,988,044 83% 54% 2,653
81 Diferenta / Difference (%) 25% 11% 6% 46% 17%
82 MONSANTO ROMANIA SRL 2017 122,510,836 28% 442,734,199 85,736,396 780,638,479 9% 7% 140
82 2016 162,421,499 33% 492,279,256 115,034,892 756,176,416 12% 14% 145
82 Diferenta / Difference (%) -25% -10% -25% 3% -3%
83 MASTWEIGHT SRL 2017 120,767,271 508% 23,784,876 109,932,805 139,240,520 79% 34% 1
83 2016 9,820,506 47% 20,869,594 4,657,029 (153,462,355) -3% 254% 1
83 Diferenta / Difference (%) 1130% 14% 2261% -191% 0%
84 MARQUARDT SCHALTSYSTEME SCS 2017 117,887,207 8% 1,520,950,512 23,754,462 183,638,799 12% 70% 2,874
84 2016 143,337,971 10% 1,408,470,635 69,672,994 174,777,638 38% 72% 2,595
84 Diferenta / Difference (%) -18% 8% -66% 5% 11%
85 PORR BAU GMBH VIENA - SUCURSALA BUCURESTI 2017 117,049,636 158% 73,918,228 108,697,947 74,463,926 128% 76% 1
85 2016 (92,987) -1% 12,170,450 198,707 (21,060,458) -1% 111% 1
85 Diferenta / Difference (%)-125977% 507% 54603% -454% 0%
86 ZENTIVA SA 2017 116,134,841 25% 458,377,044 106,926,031 368,094,967 24% 21% 511
86 2016 0% 420,004,308 89,462,094 305,801,650 24% 24%
86 Diferenta / Difference (%) 9% 20% 20%
87 ARVAL SERVICE LEASE ROMANIA SRL 2017 115,062,566 55% 209,344,165 14,882,105 19,874,010 63% 96% 55
87 2016 98,886,452 53% 187,376,120 15,124,990 19,271,835 61% 95% 52
87 Diferenta / Difference (%) 16% 12% -2% 3% 6%
88 FARMEXPERT D.C.I. SRL 2017 113,245,290 4% 2,954,723,113 103,612,983 214,740,959 42% 84% 959
88 2016 112,558,854 4% 2,877,865,376 106,777,177 259,604,973 35% 82% 988
88 Diferenta / Difference (%) 1% 3% -3% -17% -3%
89 SAP ROMANIA SRL 2017 112,969,518 37% 306,989,842 112,803,799 164,698,282 57% 15% 582
89 2016 103,066,312 40% 255,947,057 98,041,324 117,770,222 69% 19% 401
89 Diferenta / Difference (%) 10% 20% 15% 40% 45%
90 PREMIER RESTAURANTS ROMANIA SRL 2017 112,953,264 17% 676,681,344 86,807,309 162,967,170 49% 44% 3,232
90 2016 103,754,836 17% 606,296,359 68,025,929 259,435,776 20% 14% 3,068
90 Diferenta / Difference (%) 9% 12% 28% -37% 5%
Page 7
Ordine dupa
EBITDA 2017Denumire companie AN EBITDA
Marja
EBITDA (%)Cifra de afaceri Rezultat Brut Capitaluri Proprii
Rentabilitatea
capitalului
propriu
Levier Financiar Nr. de angajati
Position by
EBITDA 2017Company Name year EBITDA
EBITDA
Margin (%)Net Turnover Profit/Loss Before Tax Shareholders Equity
Return on
EquityLeverage
Number of
Employees
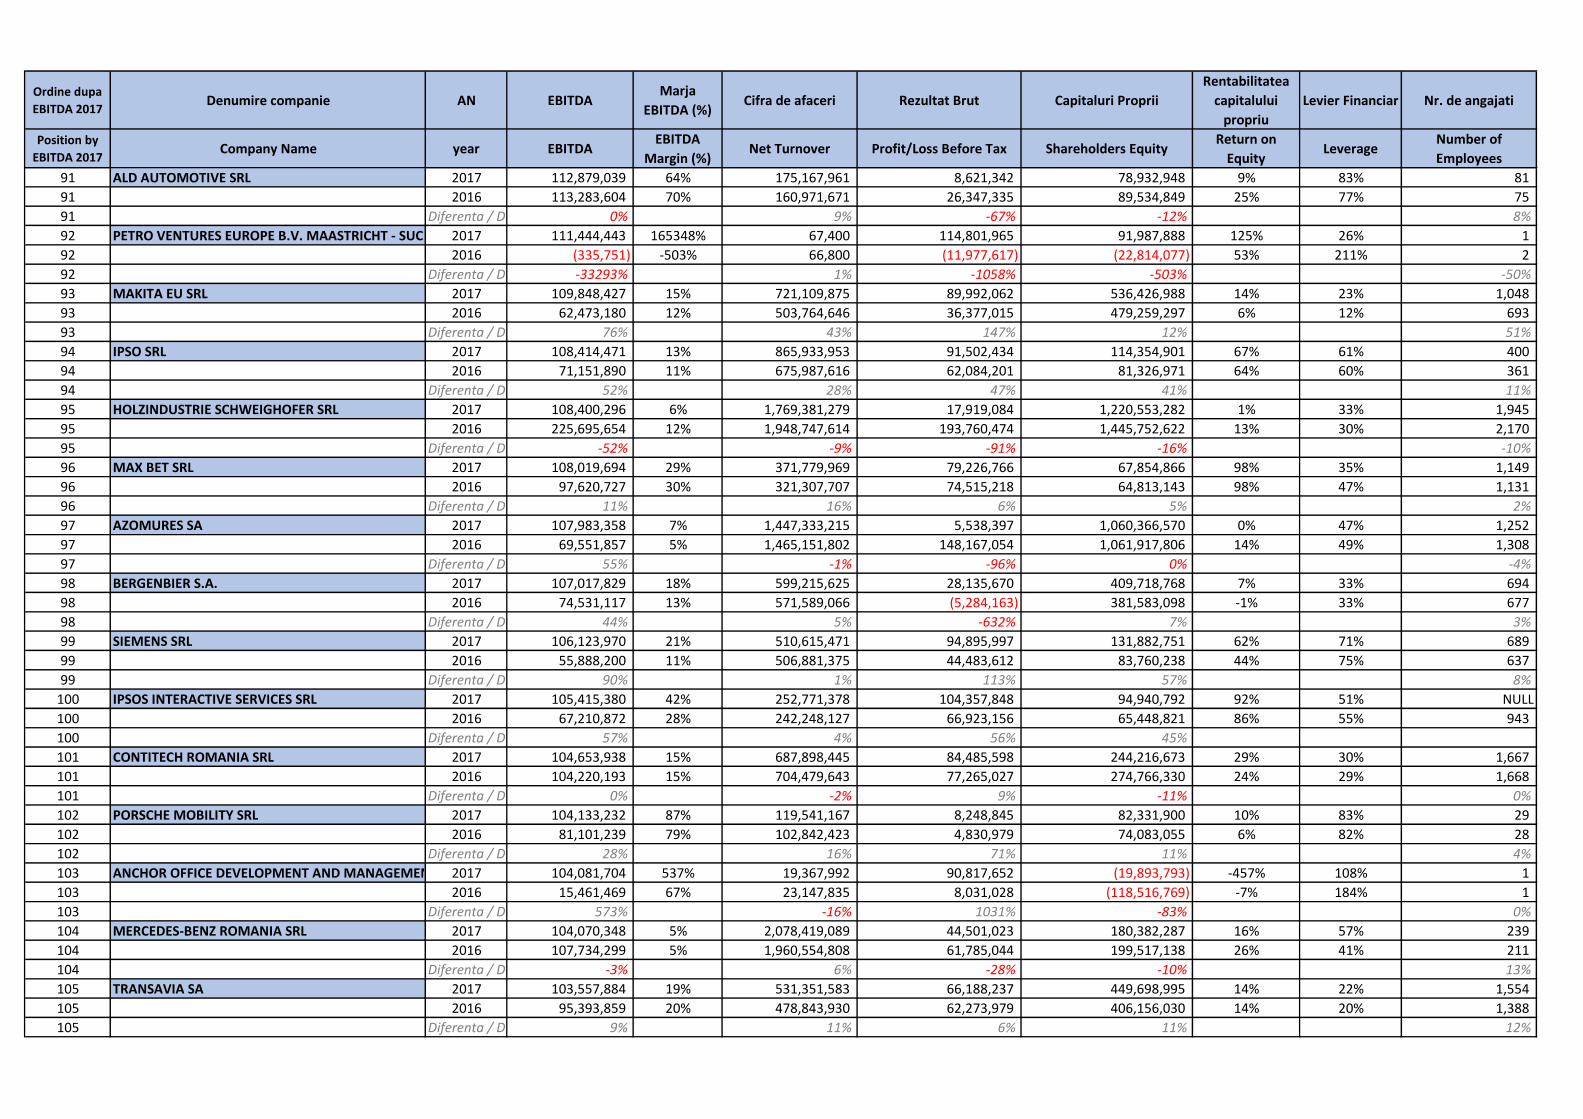
91 ALD AUTOMOTIVE SRL 2017 112,879,039 64% 175,167,961 8,621,342 78,932,948 9% 83% 81
91 2016 113,283,604 70% 160,971,671 26,347,335 89,534,849 25% 77% 75
91 Diferenta / Difference (%) 0% 9% -67% -12% 8%
92 PETRO VENTURES EUROPE B.V. MAASTRICHT - SUCURSALA BUCURESTI2017 111,444,443 165348% 67,400 114,801,965 91,987,888 125% 26% 1
92 2016 (335,751) -503% 66,800 (11,977,617) (22,814,077) 53% 211% 2
92 Diferenta / Difference (%)-33293% 1% -1058% -503% -50%
93 MAKITA EU SRL 2017 109,848,427 15% 721,109,875 89,992,062 536,426,988 14% 23% 1,048
93 2016 62,473,180 12% 503,764,646 36,377,015 479,259,297 6% 12% 693
93 Diferenta / Difference (%) 76% 43% 147% 12% 51%
94 IPSO SRL 2017 108,414,471 13% 865,933,953 91,502,434 114,354,901 67% 61% 400
94 2016 71,151,890 11% 675,987,616 62,084,201 81,326,971 64% 60% 361
94 Diferenta / Difference (%) 52% 28% 47% 41% 11%
95 HOLZINDUSTRIE SCHWEIGHOFER SRL 2017 108,400,296 6% 1,769,381,279 17,919,084 1,220,553,282 1% 33% 1,945
95 2016 225,695,654 12% 1,948,747,614 193,760,474 1,445,752,622 13% 30% 2,170
95 Diferenta / Difference (%) -52% -9% -91% -16% -10%
96 MAX BET SRL 2017 108,019,694 29% 371,779,969 79,226,766 67,854,866 98% 35% 1,149
96 2016 97,620,727 30% 321,307,707 74,515,218 64,813,143 98% 47% 1,131
96 Diferenta / Difference (%) 11% 16% 6% 5% 2%
97 AZOMURES SA 2017 107,983,358 7% 1,447,333,215 5,538,397 1,060,366,570 0% 47% 1,252
97 2016 69,551,857 5% 1,465,151,802 148,167,054 1,061,917,806 14% 49% 1,308
97 Diferenta / Difference (%) 55% -1% -96% 0% -4%
98 BERGENBIER S.A. 2017 107,017,829 18% 599,215,625 28,135,670 409,718,768 7% 33% 694
98 2016 74,531,117 13% 571,589,066 (5,284,163) 381,583,098 -1% 33% 677
98 Diferenta / Difference (%) 44% 5% -632% 7% 3%
99 SIEMENS SRL 2017 106,123,970 21% 510,615,471 94,895,997 131,882,751 62% 71% 689
99 2016 55,888,200 11% 506,881,375 44,483,612 83,760,238 44% 75% 637
99 Diferenta / Difference (%) 90% 1% 113% 57% 8%
100 IPSOS INTERACTIVE SERVICES SRL 2017 105,415,380 42% 252,771,378 104,357,848 94,940,792 92% 51% NULL
100 2016 67,210,872 28% 242,248,127 66,923,156 65,448,821 86% 55% 943
100 Diferenta / Difference (%) 57% 4% 56% 45%
101 CONTITECH ROMANIA SRL 2017 104,653,938 15% 687,898,445 84,485,598 244,216,673 29% 30% 1,667
101 2016 104,220,193 15% 704,479,643 77,265,027 274,766,330 24% 29% 1,668
101 Diferenta / Difference (%) 0% -2% 9% -11% 0%
102 PORSCHE MOBILITY SRL 2017 104,133,232 87% 119,541,167 8,248,845 82,331,900 10% 83% 29
102 2016 81,101,239 79% 102,842,423 4,830,979 74,083,055 6% 82% 28
102 Diferenta / Difference (%) 28% 16% 71% 11% 4%
103 ANCHOR OFFICE DEVELOPMENT AND MANAGEMENT SRL2017 104,081,704 537% 19,367,992 90,817,652 (19,893,793) -457% 108% 1
103 2016 15,461,469 67% 23,147,835 8,031,028 (118,516,769) -7% 184% 1
103 Diferenta / Difference (%) 573% -16% 1031% -83% 0%
104 MERCEDES-BENZ ROMANIA SRL 2017 104,070,348 5% 2,078,419,089 44,501,023 180,382,287 16% 57% 239
104 2016 107,734,299 5% 1,960,554,808 61,785,044 199,517,138 26% 41% 211
104 Diferenta / Difference (%) -3% 6% -28% -10% 13%
105 TRANSAVIA SA 2017 103,557,884 19% 531,351,583 66,188,237 449,698,995 14% 22% 1,554
105 2016 95,393,859 20% 478,843,930 62,273,979 406,156,030 14% 20% 1,388
105 Diferenta / Difference (%) 9% 11% 6% 11% 12%
Page 8
Ordine dupa
EBITDA 2017Denumire companie AN EBITDA
Marja
EBITDA (%)Cifra de afaceri Rezultat Brut Capitaluri Proprii
Rentabilitatea
capitalului
propriu
Levier Financiar Nr. de angajati
Position by
EBITDA 2017Company Name year EBITDA
EBITDA
Margin (%)Net Turnover Profit/Loss Before Tax Shareholders Equity
Return on
EquityLeverage
Number of
Employees
106 OSCAR DOWNSTREAM SRL 2017 102,569,321 5% 2,048,715,688 86,740,317 146,198,199 51% 79% 424
106 2016 76,627,117 4% 1,717,258,396 58,973,380 194,159,489 27% 65% 411
106 Diferenta / Difference (%) 34% 19% 47% -25% 3%
107 LEAR CORPORATION ROMANIA SRL 2017 101,748,661 7% 1,376,246,816 75,007,763 176,146,677 35% 64% 6,232
107 2016 75,733,451 6% 1,198,580,166 54,044,735 114,341,353 38% 75% 5,650
107 Diferenta / Difference (%) 34% 15% 39% 54% 10%
108 EMERSON SRL 2017 100,126,772 15% 679,604,575 56,991,556 281,203,291 17% 53% 2058
108 2016 101,494,046 15% 671990088 49,613,436 231,164,516.00 18% 60% 2180
108 Diferenta / Difference (%) -1% 1% 15% 22% -6%
109 MEDIPLUS EXIM SRL 2017 99,296,994 3% 3,888,023,746 57,562,338 195,816,899 24% 93% 1,002
109 2016 151,488,243 4% 3,992,297,908 119,020,541 179,104,883 57% 93% 949
109 Diferenta / Difference (%) -34% -3% -52% 9% 6%
110 SAMSUNG ELECTRONICS ROMANIA SRL 2017 98,931,607 2% 4,227,369,794 80,498,477 412,610,671 15% 40% 190
110 2016 84,226,698 2% 3,643,174,063 67,143,221 349,872,096 16% 47% 163
110 Diferenta / Difference (%) 17% 16% 20% 18% 17%
111 TOMIS TEAM S.A. 2017 97,295,649 44% 220,676,942 163,580,806 1,362,584,552 12% 9% 17
111 2016 50,878,172 20% 248,880,565 (189,130,180) 1,196,365,778 -16% 13% 17
111 Diferenta / Difference (%) 91% -11% -186% 14% 0%
112 ADIENT AUTOMOTIVE ROMANIA SRL 2017 96,544,022 8% 1,253,325,316 65,339,469 129,936,309 41% 68% 4,546
112 2016 62,473,805 7% 892,054,598 39,489,631 76,870,957 43% 85% 4,390
112 Diferenta / Difference (%) 55% 40% 65% 69% 4%
113 METEX BIG S.A. 2017 95,868,601 280% 34,239,621 117,777,216 339,017,474 28% 6% 33
113 2016 65,675,829 182% 35,997,330 59,636,610 291,859,481 17% 4% 32
113 Diferenta / Difference (%) 46% -5% 97% 16% 3%
114 AVON COSMETICS (ROMANIA) SRL 2017 94,692,353 17% 560,192,567 87,880,201 91,083,563 81% 48% 308
114 2016 80,671,929 15% 550,709,271 73,554,050 78,708,007 78% 50% 330
114 Diferenta / Difference (%) 17% 2% 19% 16% -7%
115 MURFATLAR ROMANIA SA 2017 94,202,177 319% 29,501,760 (50,626,786) (186,891,282) 27% 116% 79
115 2016 (10,993,321) -16% 67,915,424 (81,971,421) (127,397,997) 64% 110% 165
115 Diferenta / Difference (%) -957% -57% -38% 47% -52%
116 AGRANA ROMANIA SA 2017 92,409,713 11% 863,985,043 67,186,537 103,289,901 65% 75% 424
116 2016 (31,160,290) -4% 787,365,376 (49,549,710) 36,103,365 -137% 93% 440
116 Diferenta / Difference (%) -397% 10% -236% 186% -4%
117 STRATUM ENERGY ROMANIA LLC WILMINGTON SUCURSALA BUCUREȘTI2017 91,901,514 54% 168,665,606 26,304,588 (26,907,464) -82% 110% 62
117 2016 72,830,097 45% 161,827,877 (7,621,098) (49,014,697) 19% 117% 65
117 Diferenta / Difference (%) 26% 4% -445% -45% -5%
118 ROMARTA S.A. 2017 91,498,222 223% 41,037,304 116,707,451 328,135,544 29% 5% 45
118 2016 75,278,353 168% 44,858,768 54,862,632 270,157,891 16% 3% 46
118 Diferenta / Difference (%) 22% -9% 113% 21% -2%
119 SANOFI ROMANIA SRL 2017 89,994,096 8% 1,101,172,456 72,776,343 166,497,077 35% 68% 170
119 2016 71,055,851 7% 957,174,907 53,649,062 142,428,690 30% 70% 158
119 Diferenta / Difference (%) 27% 15% 36% 17% 8%
120 ALTEX ROMANIA SRL 2017 89,756,064 3% 3,283,840,109 56,447,231 212,741,700 23% 82% 2,995
120 2016 73,128,003 3% 2,745,385,511 47,999,798 163,209,437 24% 84% 3,011
120 Diferenta / Difference (%) 23% 20% 18% 30% -1%
Page 9
Ordine dupa
EBITDA 2017Denumire companie AN EBITDA
Marja
EBITDA (%)Cifra de afaceri Rezultat Brut Capitaluri Proprii
Rentabilitatea
capitalului
propriu
Levier Financiar Nr. de angajati
Position by
EBITDA 2017Company Name year EBITDA
EBITDA
Margin (%)Net Turnover Profit/Loss Before Tax Shareholders Equity
Return on
EquityLeverage
Number of
Employees
121 LIDL ROMANIA SCS 2017 89,356,183 67% 133,188,419 (11,245,597) 309,619,864 -4% 89% NULL
121 2016 71,739,061 66% 108,429,806 16,527,609 320,865,462 5% 86% NULL
121 Diferenta / Difference (%) 25% 23% -168% -4%
122 SOCIETATE DEZVOLTARE COMERCIAL SUDULUI (SDCS) SRL2017 88,852,535 113% 78,532,486 51,967,881 336,339,005 15% 58% NULL
122 2016 59,583,296 81% 73,345,440 22,086,101 182,842,906 12% 67% 1
122 Diferenta / Difference (%) 49% 7% 135% 84%
123 BA GLASS ROMANIA S.A. 2017 88,351,778 33% 267,790,868 51,025,726 316,868,450 13% 35% 403
123 2016 77,259,606 29% 267,307,856 23,119,164 293,406,029 6% 42% 424
123 Diferenta / Difference (%) 14% 0% 121% 8% -5%
124 EURO AUTO PLASTIC SYSTEMS SRL 2017 88,321,991 19% 476,151,235 82,346,112 113,442,827 60% 54% 609
124 2016 70,736,294 15% 457,950,000 64,571,697 96,561,985 53% 56% 575
124 Diferenta / Difference (%) 25% 4% 28% 17% 6%
125 BAYER SRL 2017 87,116,824 9% 929,788,443 31,930,631 91,025,260 30% 77% 196
125 2016 66,452,845 9% 760,147,580 15,510,832 73,509,778 16% 78% 202
125 Diferenta / Difference (%) 31% 22% 106% 24% -3%
126 SANTIERUL NAVAL DAMEN GALATI SA 2017 86,377,785 16% 531,767,045 21,383,146 317,991,062 3% 61% 2,271
126 2016 82,498,773 15% 548,359,211 9,324,659 306,926,758 0% 61% 2,253
126 Diferenta / Difference (%) 5% -3% 129% 4% 1%
127 MEGA MALL BUCUREŞTI SRL 2017 86,332,341 70% 123,417,383 (77,740,552) 153,848,266 -51% 89% 3
127 2016 104,902,206 88% 118,629,617 (94,635,517) 62,232,299 -152% 95% 17
127 Diferenta / Difference (%) -18% 4% -18% 147% -82%
128 TIMKEN ROMANIA SA 2017 86,258,611 23% 376,868,432 55,965,219 381,603,613 12% 12% 890
128 2016 87,914,997 24% 366,222,030 70,329,046 336,953,680 17% 12% 864
128 Diferenta / Difference (%) -2% 3% -20% 13% 3%
129 TMK-ARTROM SA 2017 85,652,197 8% 1,065,470,332 33,102,201 520,417,600 6% 55% 1,324
129 2016 55,135,777 7% 761,920,075 1,247,068 487,326,193 0% 51% 1,304
129 Diferenta / Difference (%) 55% 40% 2554% 7% 2%
130 DEICHMANN COMERCIALIZARE INCALTAMINTE SRL 2017 84,827,734 24% 349,255,923 71,743,543 145,271,787 41% 13% 556
130 2016 75,323,037 24% 317,681,505 67,410,209 137,024,338 42% 12% 530
130 Diferenta / Difference (%) 13% 10% 6% 6% 5%
131 COMPA SA 2017 84,644,645 12% 704,042,288 42,642,814 404,515,100 9% 28% 2,031
131 2016 80,235,180 13% 638,659,554 53,422,195 366,160,825 14% 31% 1,954
131 Diferenta / Difference (%) 5% 10% -20% 10% 4%
132 TMD FRICTION ROMANIA SRL 2017 84,122,992 31% 273,368,863 77,121,763 243,719,313 27% 11% 500
132 2016 89,838,559 35% 259,511,212 77,134,459 178,963,852 37% 36% 462
132 Diferenta / Difference (%) -6% 5% 0% 36% 8%
133 REWE (ROMANIA) SRL 2017 83,871,380 3% 2,996,698,015 29,981,692 239,883,004 8% 65% 4,190
133 2016 73,998,028 3% 2,865,256,831 34,354,407 226,586,100 10% 65% 3,502
133 Diferenta / Difference (%) 13% 5% -13% 6% 20%
134 STAR TRANSMISSION SRL 2017 83,489,655 28% 303,028,685 38,550,883 270,816,035 13% 55% 1,046
134 2016 75,810,712 22% 340,880,057 12,126,197 225,746,685 4% 73% 1,456
134 Diferenta / Difference (%) 10% -11% 218% 20% -28%
135 RENAULT MECANIQUE ROUMANIE SRL 2017 83,345,300 10% 811,376,308 14,913,924 392,836,584 3% 33% 707
135 2016 74,651,729 10% 727,593,004 13,550,631 380,771,813 3% 32% 670
135 Diferenta / Difference (%) 12% 12% 10% 3% 6%
Page 10
Ordine dupa
EBITDA 2017Denumire companie AN EBITDA
Marja
EBITDA (%)Cifra de afaceri Rezultat Brut Capitaluri Proprii
Rentabilitatea
capitalului
propriu
Levier Financiar Nr. de angajati
Position by
EBITDA 2017Company Name year EBITDA
EBITDA
Margin (%)Net Turnover Profit/Loss Before Tax Shareholders Equity
Return on
EquityLeverage
Number of
Employees
136 AEROSTAR SA 2017 83,077,328 24% 340,172,330 58,786,610 252,967,021 21% 14% 1,834
136 2016 81,242,224 23% 356,219,105 65,865,005 213,908,224 26% 21% 1,719
136 Diferenta / Difference (%) 2% -5% -11% 18% 7%
137 NY'ER ROMANIA SRL 2017 82,009,793 30% 273,249,180 81,088,005 68,792,859 99% 26% 370
137 2016 68,929,211 29% 234,503,171 67,240,503 66,944,780 84% 23% 338
137 Diferenta / Difference (%) 19% 17% 21% 3% 9%
138 ARAMIS INVEST SRL 2017 81,638,368 8% 1,001,204,362 38,716,679 214,145,205 17% 65% 4,544
138 2016 86,263,555 10% 838,324,225 49,763,477 162,147,751 28% 67% 4,133
138 Diferenta / Difference (%) -5% 19% -22% 32% 10%
139 ELSID S.A. 2017 80,471,100 27% 298,709,240 21,045,368 153,768,696 11% 74% 252
139 2016 74,313,687 29% 256,495,305 8,104,528 160,905,875 3% 74% 291
139 Diferenta / Difference (%) 8% 16% 160% -4% -13%
140 OMV PETROM GAS SRL 2017 80,442,717 2% 3,314,587,409 63,568,876 86,218,430 64% 85% 51
140 2016 68,308,442 2% 3,162,115,304 85,575,492 104,944,738 70% 88% 54
140 Diferenta / Difference (%) 18% 5% -26% -18% -6%
141 REWE PROJEKTENTWICKLUNG ROMANIA SRL 2017 80,327,023 82% 97,563,058 23,024,526 406,042,151 4% 75% NULL
141 2016 68,402,655 79% 86,226,517 27,090,622 388,272,881 7% 72% NULL
141 Diferenta / Difference (%) 17% 13% -15% 5%
142 INSTITUTUL NATIONAL DE CERCETARE - DEZVOLTARE PENTRU FIZICA SI INGINERIE NUCLEARA " HORIA HULUBEI " - IFIN - HH2017 79,986,072 58% 137,526,703 1,026,277 296,138,247 0% 48% 905
142 2016 33,526,971 29% 117,522,216 2,326,925 295,906,352 1% 34% 825
142 Diferenta / Difference (%) 139% 17% -56% 0% 10%
143 CIECH SODA ROMÂNIA SOCIETATE PE ACŢIUNI 2017 79,838,704 20% 389,511,192 23,508,763 290,685,217 5% 22% 587
143 2016 77,823,744 21% 367,095,868 36,195,836 275,684,450 13% 21% 590
143 Diferenta / Difference (%) 3% 6% -35% 5% -1%
144 JT INTERNATIONAL MANUFACTURING SA 2017 79,098,652 10% 819,247,275 40,129,333 464,631,804 7% 23% 366
144 2016 59,954,940 8% 754,284,343 34,304,980 432,504,729 6% 29% 319
144 Diferenta / Difference (%) 32% 9% 17% 7% 15%
145 M.W. TEAM INVEST SRL 2017 78,486,202 133% 58,896,958 83,492,763 369,332,078 23% 2% 1
145 2016 21,847,364 60% 36,299,714 (5,209,125) 285,365,438 -2% 9% 1
145 Diferenta / Difference (%) 259% 62% -1703% 29% 0%
146 BRITISH - AMERICAN TOBACCO ROMANIA INVESTMENT SRL2017 78,112,648 31% 252,264,734 25,857,626 1,019,657,431 2% 6% 641
146 2016 80,794,708 36% 225,423,397 20,532,531 594,741,816 3% 24% 578
146 Diferenta / Difference (%) -3% 12% 26% 71% 11%
147 CHIPITA ROMANIA SRL 2017 77,579,445 17% 448,638,270 51,275,953 139,013,459 30% 63% 975
147 2016 78,213,114 18% 428,476,386 56,333,642 178,341,570 26% 46% 880
147 Diferenta / Difference (%) -1% 5% -9% -22% 11%
148 HENKEL ROMANIA SRL 2017 76,807,703 10% 754,376,234 77,646,133 107,201,900 60% 45% 207
148 2016 (46) 0 (46) 63 -73% 94% NULL
148 Diferenta / Difference (%)-166973367% -168796041% 170161646%
149 WEBASTO ROMANIA SRL 2017 76,701,770 7% 1,049,131,163 37,919,450 150,229,873 19% 64% 1,167
149 2016 67,991,888 6% 1,060,824,897 32,474,521 123,490,574 22% 72% 1,160
149 Diferenta / Difference (%) 13% -1% 17% 22% 1%
150 ARCELORMITTAL GALAŢI SA 2017 76,555,394 2% 4,661,907,896 (153,182,434) 1,067,009,878 -14% 66% 5,682
150 2016 (34,108,723) -1% 3,466,867,877 (271,358,373) 1,220,192,312 -22% 56% 6,006
150 Diferenta / Difference (%) -324% 34% -44% -13% -5%
Page 11
Ordine dupa
EBITDA 2017Denumire companie AN EBITDA
Marja
EBITDA (%)Cifra de afaceri Rezultat Brut Capitaluri Proprii
Rentabilitatea
capitalului
propriu
Levier Financiar Nr. de angajati
Position by
EBITDA 2017Company Name year EBITDA
EBITDA
Margin (%)Net Turnover Profit/Loss Before Tax Shareholders Equity
Return on
EquityLeverage
Number of
Employees
151 CONSTANTA SOUTH CONTAINER TERMINAL SRL 2017 76,288,287 39% 195,513,886 52,312,839 269,609,775 16% 6% 453
151 2016 78,970,703 40% 195,436,162 71,459,365 292,069,942 20% 4% 457
151 Diferenta / Difference (%) -3% 0% -27% -8% -1%
152 GRUP FEROVIAR ROMAN SA 2017 76,193,256 11% 724,305,014 5,410,669 536,502,616 1% 44% 2,783
152 2016 58,304,770 8% 710,156,943 3,096,322 547,349,531 0% 41% 2,760
152 Diferenta / Difference (%) 31% 2% 75% -2% 1%
153 AVIVA SRL 2017 76,170,637 23% 329,337,696 42,580,915 124,880,946 34% 77% 1,660
153 2016 49,683,621 16% 302,862,327 20,681,425 82,348,556 24% 81% 1,640
153 Diferenta / Difference (%) 53% 9% 106% 52% 1%
154 SAINT-GOBAIN GLASS ROMANIA SRL 2017 74,475,597 17% 433,283,170 30,667,138 524,361,405 6% 36% 302
154 2016 71,889,178 17% 413,724,511 26,754,866 493,694,267 5% 34% 280
154 Diferenta / Difference (%) 4% 5% 15% 6% 8%
155 COFICAB EASTERN EUROPE SRL 2017 74,408,436 5% 1,651,014,446 61,832,680 376,817,514 14% 39% 419
155 2016 91,407,425 6% 1,414,363,698 77,566,161 331,475,910 20% 32% 449
155 Diferenta / Difference (%) -19% 17% -20% 14% -7%
156 HUAWEI TECHNOLOGIES SRL 2017 74,310,236 6% 1,347,363,735 40,821,941 131,223,066 15% 58% 1,352
156 2016 54,775,694 4% 1,253,112,764 47,445,969 126,649,773 29% 72% 1,447
156 Diferenta / Difference (%) 36% 8% -14% 4% -7%
157 CARRION EXPEDITION SRL 2017 73,655,672 9% 823,457,924 13,413,495 141,869,312 8% 66% 2394
157 2016 74,399,013 12% 646700419 23,404,724 130,509,320.00 15% 70% 2,024
157 Diferenta / Difference (%) -1% 27% -43% 9% 18%
158 AUTONET IMPORT SRL 2017 73,273,702 6% 1,268,948,301 52,915,589 295,572,081 17% 59% 1,344
158 2016 65,939,398 6% 1,177,271,461 51,278,545 244,759,756 18% 62% 1,188
158 Diferenta / Difference (%) 11% 8% 3% 21% 13%
159 IMPACT DEVELOPER & CONTRACTOR S.A. 2017 72,627,931 62% 117,795,064 62,114,015 431,854,275 12% 32% 58
159 2016 37,460,394 25% 148,746,857 29,610,138 390,776,564 8% 19% 55
159 Diferenta / Difference (%) 94% -21% 110% 11% 5%
160 PROMENADA MALL BUCUREŞTI S.R.L. 2017 72,467,198 85% 84,775,285 3,593,499 507,746,789 1% 53% NULL
160 2016 75,368,975 100% 75,223,917 7,455,115 396,435,880 2% 58% NULL
160 Diferenta / Difference (%) -4% 13% -52% 28%
161 H&M HENNES & MAURITZ SRL 2017 71,636,723 9% 826,540,307 34,310,797 129,531,420 21% 48% 1,122
161 2016 57,172,427 8% 760,562,655 21,174,100 101,791,804 14% 54% 1,226
161 Diferenta / Difference (%) 25% 9% 62% 27% -8%
162 RENAULT TECHNOLOGIE ROUMANIE SRL 2017 69,864,202 8% 893,138,101 31,221,635 424,426,418 7% 32% 1,882
162 2016 64,910,008 8% 782,178,913 28,139,882 419,937,671 7% 31% 1,761
162 Diferenta / Difference (%) 8% 14% 11% 1% 7%
163 ARABESQUE SRL 2017 69,859,088 4% 1,703,216,760 13,544,913 606,875,718 2% 48% 3,169
163 2016 89,740,642 6% 1,584,874,149 61,746,584 597,243,062 8% 50% 2,844
163 Diferenta / Difference (%) -22% 7% -78% 2% 11%
164 HUTCHINSON SRL 2017 69,837,255 15% 471,512,186 60,606,918 75,459,770 69% 71% 1,136
164 2016 68,663,515 16% 429,204,004 57,945,913 72,167,778 67% 72% 1,068
164 Diferenta / Difference (%) 2% 10% 5% 5% 6%
165 ADEPLAST S.A. 2017 69,678,842 17% 420,899,961 36,122,714 103,823,804 29% 66% 351
165 2016 60,983,755 18% 346,117,308 30,200,868 96,819,843 26% 66% 325
165 Diferenta / Difference (%) 14% 22% 20% 7% 8%
Page 12
Ordine dupa
EBITDA 2017Denumire companie AN EBITDA
Marja
EBITDA (%)Cifra de afaceri Rezultat Brut Capitaluri Proprii
Rentabilitatea
capitalului
propriu
Levier Financiar Nr. de angajati
Position by
EBITDA 2017Company Name year EBITDA
EBITDA
Margin (%)Net Turnover Profit/Loss Before Tax Shareholders Equity
Return on
EquityLeverage
Number of
Employees
166 KASTAMONU ROMANIA SA 2017 69,665,133 9% 755,818,555 (14,366,259) 460,755,358 -3% 63% 909
166 2016 74,229,513 11% 670,014,225 9,049,618 287,640,683 3% 67% 832
166 Diferenta / Difference (%) -6% 13% -259% 60% 9%
167 COMBINATUL DE CELULOZĂ ŞI HÂRTIE S.A. 2017 69,103,968 42% 165,097,243 23,322,445 113,683,241 18% 49% 329
167 2016 16,422,042 22% 73,017,835 2,694,370 95,853,054 3% 43% 247
167 Diferenta / Difference (%) 321% 126% 766% 19% 33%
168 ATOS IT SOLUTIONS AND SERVICES SRL 2017 68,945,577 20% 341,111,361 61,285,858 153,524,628 33% 21% 1,871
168 2016 44,108,070 18% 243,291,673 40,409,486 102,132,691 35% 27% 1,563
168 Diferenta / Difference (%) 56% 40% 52% 50% 20%
169 APTIV TECHNOLOGY SERVICES & SOLUTIONS S.R.L. 2017 68,249,062 5% 1,427,653,123 13,571,278 190,291,125 4% 78% 4909
169 2016 80,117,859 5% 1,533,078,000 45,879,456 186,240,722 20% 76% 6,416
169 Diferenta / Difference (%) -15% -7% -70% 2% -23%
170 CINEMA CITY ROMANIA SRL 2017 67,701,305 25% 266,634,586 46,780,030 93,703,822 47% 56% 227
170 2016 56,603,634 24% 233,871,720 40,420,758 48,826,843 75% 74% 214
170 Diferenta / Difference (%) 20% 14% 16% 92% 6%
171 SAINT-GOBAIN CONSTRUCTION PRODUCTS ROMANIA SRL2017 67,117,564 19% 348,803,640 47,663,041 301,366,143 14% 21% 446
171 2016 53,383,325 17% 308,678,197 32,660,752 299,724,640 10% 17% 444
171 Diferenta / Difference (%) 26% 13% 46% 1% 0%
172 ROMSTAL IMEX SRL 2017 66,603,094 10% 659,217,381 44,000,918 538,396,902 7% 32% 1,132
172 2016 72,342,886 12% 612,368,064 52,545,856 508,334,030 9% 32% 1,120
172 Diferenta / Difference (%) -8% 8% -16% 6% 1%
173 EATON ELECTRO PRODUCTIE SRL 2017 66,436,501 6% 1,077,701,832 54,316,315 246,158,848 18% 23% 2,162
173 2016 71,202,935 7% 997,167,740 58,473,753 200,802,465 24% 30% 2,008
173 Diferenta / Difference (%) -7% 8% -7% 23% 8%
174 BIOTEHNOS SA 2017 66,295,964 67% 98,304,059 62,371,233 145,274,275 36% 22% 144
174 2016 70,364,603 75% 93,440,612 66,479,340 148,902,307 38% 9% 142
174 Diferenta / Difference (%) -6% 5% -6% -2% 1%
175 OMV PETROM GLOBAL SOLUTIONS SRL 2017 65,820,278 13% 500,495,232 17,358,150 205,155,188 8% 37% 1,082
175 2016 70,449,135 14% 493,238,538 16,605,538 197,768,890 8% 30% 1,122
175 Diferenta / Difference (%) -7% 1% 5% 4% -4%
176 DE'LONGHI ROMANIA SRL 2017 65,610,357 7% 921,360,595 36,310,344 231,393,195 13% 58% 1,599
176 2016 65,833,437 9% 713,400,909 39,595,280 108,217,430 31% 69% 1,112
176 Diferenta / Difference (%) 0% 29% -8% 114% 44%
177 MAIRON GALATI SA 2017 65,569,134 6% 1,019,017,996 60,310,760 348,966,655 15% 31% 379
177 2016 55,093,893 7% 819,187,658 49,627,812 297,463,178 14% 25% 389
177 Diferenta / Difference (%) 19% 24% 22% 17% -3%
178 HAULOTTE ARGEŞ SRL 2017 65,300,215 13% 491,753,078 61,475,310 232,527,224 22% 21% 208
178 2016 53,255,962 13% 403,627,758 49,618,435 181,026,365 23% 22% 184
178 Diferenta / Difference (%) 23% 22% 24% 28% 13%
179 US FOOD NETWORK SA 2017 64,032,030 13% 477,279,295 65,821,519 61,595,927 100% 60% 2,429
179 2016 63,998,790 16% 405,291,813 53,775,272 46,385,747 100% 55% 2,193
179 Diferenta / Difference (%) 0% 18% 22% 33% 11%
180 AMROMCO ENERGY SRL 2017 63,970,125 39% 162,496,765 4,711,922 56,532,503 8% 70% 195
180 2016 32,693,829 13% 248,386,001 10,950,532 51,820,581 21% 79% 252
180 Diferenta / Difference (%) 96% -35% -57% 9% -23%
Page 13
Ordine dupa
EBITDA 2017Denumire companie AN EBITDA
Marja
EBITDA (%)Cifra de afaceri Rezultat Brut Capitaluri Proprii
Rentabilitatea
capitalului
propriu
Levier Financiar Nr. de angajati
Position by
EBITDA 2017Company Name year EBITDA
EBITDA
Margin (%)Net Turnover Profit/Loss Before Tax Shareholders Equity
Return on
EquityLeverage
Number of
Employees
181 IMMOCHAN IMOBILIARE SRL 2017 63,240,175 50% 127,198,665 28,805,237 503,954,463 5% 49% NULL
181 2016 44,627,414 41% 109,259,351 11,043,176 365,327,661 3% 49% 23
181 Diferenta / Difference (%) 42% 16% 161% 38%
182 THYSSENKRUPP BILSTEIN S.A. 2017 62,426,468 19% 333,585,054 43,817,430 71,762,014 49% 79% 828
182 2016 16,746,735 8% 214,611,780 5,455,457 36,477,182 5% 77% 550
182 Diferenta / Difference (%) 273% 55% 703% 97% 51%
183 IKEA ROMANIA S.A. 2017 62,417,240 10% 632,038,554 32,423,691 172,959,666 14% 55% 691
183 2016 63,388,245 11% 556,060,865 36,424,890 151,927,165 19% 65% 520
183 Diferenta / Difference (%) -2% 14% -11% 14% 33%
184 KRONOSPAN SEBES SA 2017 62,348,895 7% 936,907,235 (76,598,190) 214,847,193 -36% 77% 425
184 2016 77,232,580 8% 997,155,030 (52,097,692) 291,445,383 -18% 69% 440
184 Diferenta / Difference (%) -19% -6% 47% -26% -3%
185 ZES ZOLLNER ELECTRONIC SRL 2017 62,315,006 8% 762,523,231 37,436,676 199,983,221 18% 59% 1,779
185 2016 62,606,555 10% 656,950,849 29,996,760 163,076,831 16% 60% 1,527
185 Diferenta / Difference (%) 0% 16% 25% 23% 17%
186 CASTROL LUBRICANTS RO SRL 2017 60,654,550 24% 248,339,759 58,701,665 49,963,654 95% 33% 19
186 2016 56,137,412 28% 204,133,853 55,404,465 47,222,014 94% 25% 26
186 Diferenta / Difference (%) 8% 22% 6% 6% -27%
187 RODBUN GRUP SRL 2017 60,436,414 18% 334,020,958 31,223,727 62,511,003 42% 82% 256
187 2016 42,750,014 16% 260,122,590 12,742,636 36,455,178 29% 86% 225
187 Diferenta / Difference (%) 41% 28% 145% 71% 14%
188 AUTONOM SERVICES S.A. 2017 60,422,481 60% 100,217,839 4,193,699 34,339,082 11% 83% 252
188 2016 53,004,146 64% 83,352,325 10,440,869 30,715,691 30% 80% 224
188 Diferenta / Difference (%) 14% 20% -60% 12% 13%
189 CTP INVEST BUCHAREST SRL 2017 60,229,957 14% 444,479,562 53,461,315 15,208,295 285% 97% 35
189 2016 (3,347,299) -2% 167,039,756 (8,681,027) (31,046,520) 28% 113% 18
189 Diferenta / Difference (%) -1899% 166% -716% -149% 94%
190 DIGITAL CABLE SYSTEMS SA 2017 59,020,608 33% 178,912,535 (7,384,734) 69,937,809 -11% 63% 1,323
190 2016 50,333,891 29% 175,685,041 (18,595,177) 49,131,206 -38% 69% 1,335
190 Diferenta / Difference (%) 17% 2% -60% 42% -1%
191 AMEROPA GRAINS SA 2017 58,241,891 2% 2,961,385,659 34,164,147 131,402,016 21% 83% NULL
191 2016 42,209,307 2% 2,647,748,817 17,592,082 103,340,239 14% 84% 303
191 Diferenta / Difference (%) 38% 12% 94% 27%
192 BAMESA OŢEL SA 2017 58,080,963 12% 486,968,226 48,262,146 241,695,918 18% 36% 106
192 2016 57,893,104 14% 419,947,014 46,553,744 229,580,102 17% 21% 105
192 Diferenta / Difference (%) 0% 16% 4% 5% 1%
193 C&A MODA RETAIL SRL 2017 57,404,997 13% 441,725,881 48,732,015 103,280,529 43% 16% 270
193 2016 33,333,255 9% 375,076,371 25,629,426 75,443,437 30% 15% 299
193 Diferenta / Difference (%) 72% 18% 90% 37% -10%
194 ORACLE ROMANIA SRL 2017 57,231,888 6% 1,029,332,399 32,997,251 65,071,533 35% 66% 4,142
194 2016 49,821,411 5% 908,621,778 32,943,191 108,263,387 22% 51% 3,635
194 Diferenta / Difference (%) 15% 13% 0% -40% 14%
195 TRANSPECO LOGISTICS & DISTRIBUTION SA 2017 56,853,591 52% 108,299,658 39,005,276 59,616,888 55% 42% 312
195 2016 54,685,936 55% 99,786,080 38,725,531 57,021,985 57% 37% 322
195 Diferenta / Difference (%) 4% 9% 1% 5% -3%
Page 14
Ordine dupa
EBITDA 2017Denumire companie AN EBITDA
Marja
EBITDA (%)Cifra de afaceri Rezultat Brut Capitaluri Proprii
Rentabilitatea
capitalului
propriu
Levier Financiar Nr. de angajati
Position by
EBITDA 2017Company Name year EBITDA
EBITDA
Margin (%)Net Turnover Profit/Loss Before Tax Shareholders Equity
Return on
EquityLeverage
Number of
Employees
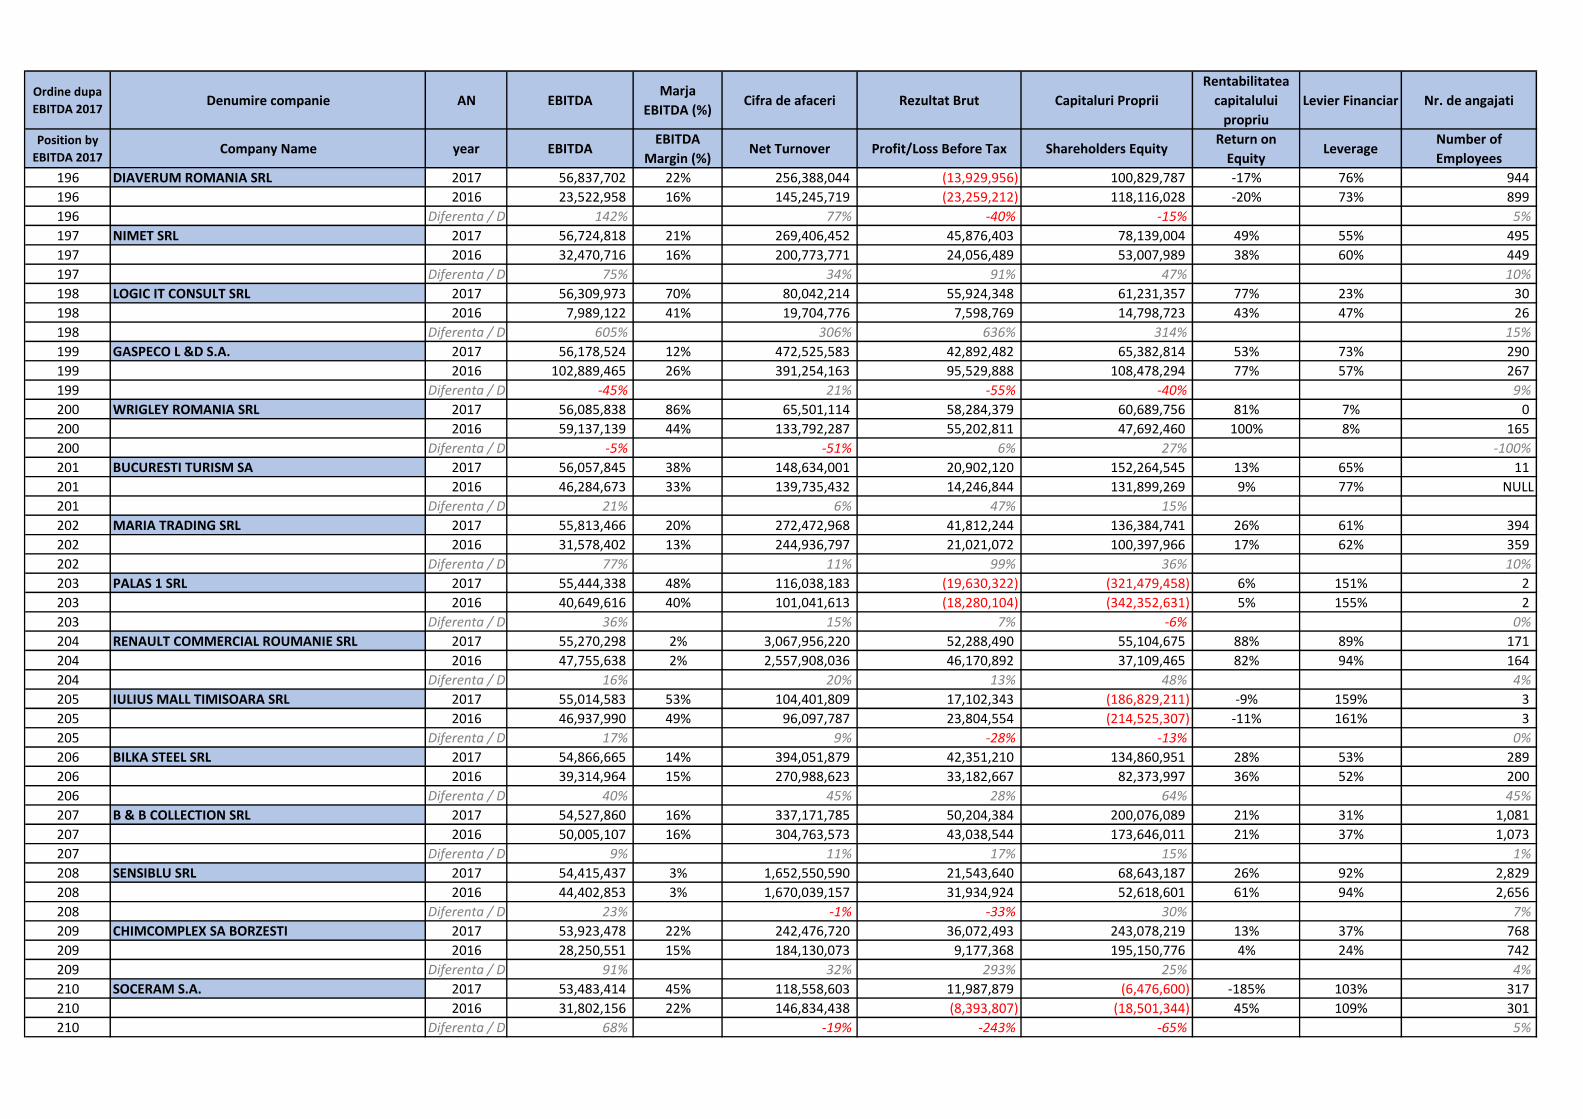
196 DIAVERUM ROMANIA SRL 2017 56,837,702 22% 256,388,044 (13,929,956) 100,829,787 -17% 76% 944
196 2016 23,522,958 16% 145,245,719 (23,259,212) 118,116,028 -20% 73% 899
196 Diferenta / Difference (%) 142% 77% -40% -15% 5%
197 NIMET SRL 2017 56,724,818 21% 269,406,452 45,876,403 78,139,004 49% 55% 495
197 2016 32,470,716 16% 200,773,771 24,056,489 53,007,989 38% 60% 449
197 Diferenta / Difference (%) 75% 34% 91% 47% 10%
198 LOGIC IT CONSULT SRL 2017 56,309,973 70% 80,042,214 55,924,348 61,231,357 77% 23% 30
198 2016 7,989,122 41% 19,704,776 7,598,769 14,798,723 43% 47% 26
198 Diferenta / Difference (%) 605% 306% 636% 314% 15%
199 GASPECO L &D S.A. 2017 56,178,524 12% 472,525,583 42,892,482 65,382,814 53% 73% 290
199 2016 102,889,465 26% 391,254,163 95,529,888 108,478,294 77% 57% 267
199 Diferenta / Difference (%) -45% 21% -55% -40% 9%
200 WRIGLEY ROMANIA SRL 2017 56,085,838 86% 65,501,114 58,284,379 60,689,756 81% 7% 0
200 2016 59,137,139 44% 133,792,287 55,202,811 47,692,460 100% 8% 165
200 Diferenta / Difference (%) -5% -51% 6% 27% -100%
201 BUCURESTI TURISM SA 2017 56,057,845 38% 148,634,001 20,902,120 152,264,545 13% 65% 11
201 2016 46,284,673 33% 139,735,432 14,246,844 131,899,269 9% 77% NULL
201 Diferenta / Difference (%) 21% 6% 47% 15%
202 MARIA TRADING SRL 2017 55,813,466 20% 272,472,968 41,812,244 136,384,741 26% 61% 394
202 2016 31,578,402 13% 244,936,797 21,021,072 100,397,966 17% 62% 359
202 Diferenta / Difference (%) 77% 11% 99% 36% 10%
203 PALAS 1 SRL 2017 55,444,338 48% 116,038,183 (19,630,322) (321,479,458) 6% 151% 2
203 2016 40,649,616 40% 101,041,613 (18,280,104) (342,352,631) 5% 155% 2
203 Diferenta / Difference (%) 36% 15% 7% -6% 0%
204 RENAULT COMMERCIAL ROUMANIE SRL 2017 55,270,298 2% 3,067,956,220 52,288,490 55,104,675 88% 89% 171
204 2016 47,755,638 2% 2,557,908,036 46,170,892 37,109,465 82% 94% 164
204 Diferenta / Difference (%) 16% 20% 13% 48% 4%
205 IULIUS MALL TIMISOARA SRL 2017 55,014,583 53% 104,401,809 17,102,343 (186,829,211) -9% 159% 3
205 2016 46,937,990 49% 96,097,787 23,804,554 (214,525,307) -11% 161% 3
205 Diferenta / Difference (%) 17% 9% -28% -13% 0%
206 BILKA STEEL SRL 2017 54,866,665 14% 394,051,879 42,351,210 134,860,951 28% 53% 289
206 2016 39,314,964 15% 270,988,623 33,182,667 82,373,997 36% 52% 200
206 Diferenta / Difference (%) 40% 45% 28% 64% 45%
207 B & B COLLECTION SRL 2017 54,527,860 16% 337,171,785 50,204,384 200,076,089 21% 31% 1,081
207 2016 50,005,107 16% 304,763,573 43,038,544 173,646,011 21% 37% 1,073
207 Diferenta / Difference (%) 9% 11% 17% 15% 1%
208 SENSIBLU SRL 2017 54,415,437 3% 1,652,550,590 21,543,640 68,643,187 26% 92% 2,829
208 2016 44,402,853 3% 1,670,039,157 31,934,924 52,618,601 61% 94% 2,656
208 Diferenta / Difference (%) 23% -1% -33% 30% 7%
209 CHIMCOMPLEX SA BORZESTI 2017 53,923,478 22% 242,476,720 36,072,493 243,078,219 13% 37% 768
209 2016 28,250,551 15% 184,130,073 9,177,368 195,150,776 4% 24% 742
209 Diferenta / Difference (%) 91% 32% 293% 25% 4%
210 SOCERAM S.A. 2017 53,483,414 45% 118,558,603 11,987,879 (6,476,600) -185% 103% 317
210 2016 31,802,156 22% 146,834,438 (8,393,807) (18,501,344) 45% 109% 301
210 Diferenta / Difference (%) 68% -19% -243% -65% 5%
Page 15
Ordine dupa
EBITDA 2017Denumire companie AN EBITDA
Marja
EBITDA (%)Cifra de afaceri Rezultat Brut Capitaluri Proprii
Rentabilitatea
capitalului
propriu
Levier Financiar Nr. de angajati
Position by
EBITDA 2017Company Name year EBITDA
EBITDA
Margin (%)Net Turnover Profit/Loss Before Tax Shareholders Equity
Return on
EquityLeverage
Number of
Employees
211 ENTERPRISE SERVICES ROMANIA SRL 2017 53,437,004 39% 136,009,648 40,020,425 124,011,902 25% 14% 594
211 2016 38,668,429 16% 247,594,939 30,628,955 93,026,555 23% 37% 397
211 Diferenta / Difference (%) 38% -45% 31% 33% 50%
212 JYSK ROMÂNIA SRL 2017 53,271,060 13% 415,181,233 41,958,991 112,022,550 31% 44% 610
212 2016 50,272,804 17% 290,484,249 44,197,755 77,806,731 52% 31% 452
212 Diferenta / Difference (%) 6% 43% -5% 44% 35%
213 SOCIETATEA COMPANIILOR HOTELIERE GRAND SRL 2017 53,039,208 41% 128,948,184 3,716,248 (101,620,900) 0% 117% 310
213 2016 45,386,391 37% 122,121,383 8,248,849 (101,476,088) -2% 117% 311
213 Diferenta / Difference (%) 17% 6% -55% 0% 0%
214 GLOBAL E-BUSINESS OPERATIONS CENTRE SRL 2017 52,723,889 30% 174,615,595 40,460,569 108,086,889 31% 11% 1,173
214 2016 24,222,089 10% 250,704,149 13,560,837 74,741,407 14% 20% 1,974
214 Diferenta / Difference (%) 118% -30% 198% 45% -41%
215 MAX BET JOCURI ELECTRONICE SRL 2017 52,686,883 50% 105,427,323 39,974,033 33,826,630 100% 15% 242
215 2016 43,067,653 50% 86,479,349 30,009,981 25,577,005 100% 50% 211
215 Diferenta / Difference (%) 22% 22% 33% 32% 15%
216 CARPATHIAN SPRINGS SA 2017 52,204,539 28% 186,044,386 39,876,399 69,022,049 52% 65% 201
216 2016 56,652,561 37% 154,819,932 46,993,431 53,704,836 77% 62% 174
216 Diferenta / Difference (%) -8% 20% -15% 29% 16%
217 MASPEX ROMANIA SRL 2017 52,107,768 13% 409,052,029 27,050,784 299,800,719 8% 39% 1,290
217 2016 62,399,337 17% 361,565,503 39,822,442 211,152,537 16% 41% 996
217 Diferenta / Difference (%) -16% 13% -32% 42% 30%
218 EDPR ROMÂNIA SRL 2017 51,918,997 29% 180,247,737 16,277,584 861,073,493 2% 23% 30
218 2016 82,771,232 54% 151,935,146 31,489,356 844,795,909 4% 28% 0
218 Diferenta / Difference (%) -37% 19% -48% 2%
219 BERSHKA CARPATI SRL 2017 51,917,068 22% 238,501,235 40,078,063 41,949,810 80% 47% 317
219 2016 48,545,588 24% 201,548,853 38,339,358 40,474,184 79% 36% 274
219 Diferenta / Difference (%) 7% 18% 5% 4% 16%
220 ENDAVA ROMANIA SRL 2017 51,618,839 13% 384,427,550 44,773,542 136,738,073 27% 27% 1,861
220 2016 69,829,278 22% 311,995,342 63,914,291 88,574,618 61% 30% 1,812
220 Diferenta / Difference (%) -26% 23% -30% 54% 3%
221 HERAEUS ROMANIA SRL 2017 51,443,731 28% 186,744,489 15,422,483 33,326,067 34% 87% 122
221 2016 19,218,178 15% 126,402,363 10,350,977 21,963,846 47% 88% 112
221 Diferenta / Difference (%) 168% 48% 49% 52% 9%
222 E.ON ENERGIE ROMÂNIA SA 2017 51,380,881 1% 4,735,371,630 76,906,035 698,070,903 10% 62% 182
222 2016 222,719,836 5% 4,823,634,172 196,252,148 1,088,699,251 16% 64% 186
222 Diferenta / Difference (%) -77% -2% -61% -36% -2%
223 ROUMASPORT SRL 2017 51,378,323 7% 760,555,708 42,519,045 56,138,356 58% 74% 960
223 2016 45,949,562 7% 613,276,246 40,895,881 53,583,858 59% 69% 698
223 Diferenta / Difference (%) 12% 24% 4% 5% 38%
224 AMBRO SA 2017 51,189,813 16% 329,281,701 39,383,399 345,850,029 11% 24% 601
224 2016 28,229,639 10% 284,197,474 17,324,086 308,642,166 6% 30% 592
224 Diferenta / Difference (%) 81% 16% 127% 12% 2%
225 DRAGONUL ROSU SA 2017 51,163,348 71% 71,858,630 36,633,075 149,379,601 21% 22% 13
225 2016 45,214,302 73% 62,258,185 31,180,210 117,864,165 23% 31% 10
225 Diferenta / Difference (%) 13% 15% 17% 27% 30%
Page 16
Ordine dupa
EBITDA 2017Denumire companie AN EBITDA
Marja
EBITDA (%)Cifra de afaceri Rezultat Brut Capitaluri Proprii
Rentabilitatea
capitalului
propriu
Levier Financiar Nr. de angajati
Position by
EBITDA 2017Company Name year EBITDA
EBITDA
Margin (%)Net Turnover Profit/Loss Before Tax Shareholders Equity
Return on
EquityLeverage
Number of
Employees
226 COMPUTER GENERATED SOLUTIONS ROMANIA SRL 2017 51,041,450 21% 240,433,648 35,167,107 96,923,556 30% 24% 2,707
226 2016 65,570,443 28% 232,270,118 61,877,073 109,538,168 47% 20% 2,612
226 Diferenta / Difference (%) -22% 4% -43% -12% 4%
227 UNICARM SRL 2017 50,795,351 8% 653,222,857 23,099,727 168,140,987 12% 58% 2,820
227 2016 50,405,930 8% 651,264,423 21,937,143 148,499,826 13% 63% 2,807
227 Diferenta / Difference (%) 1% 0% 5% 13% 0%
228 VERBUND WIND POWER ROMANIA SRL 2017 50,718,135 49% 104,066,103 34,240,734 585,217,135 6% 5% NULL
228 2016 (44,906,829) -106% 42,279,306 (80,580,473) 182,084,766 -44% 3% 10
228 Diferenta / Difference (%) -213% 146% -142% 221%
229 PHOENIX SLAG SERVICES SRL 2017 50,633,234 47% 107,339,394 31,344,417 107,947,094 24% 11% 277
229 2016 50,474,263 48% 104,795,763 29,197,161 118,035,328 21% 14% 274
229 Diferenta / Difference (%) 0% 2% 7% -9% 1%
230 COCA-COLA ROMANIA SRL 2017 50,507,276 60% 84,312,651 47,824,607 280,296,715 14% 3% 28
230 2016 50,460,188 59% 85,980,611 50,534,362 239,964,176 17% 4% 26
230 Diferenta / Difference (%) 0% -2% -5% 17% 8%
231 NOVO VLTECH SOLUTIONS SRL 2017 50,254,988 50% 99,662,463 24,548,897 43,303,800 57% 49% 124
231 2016 37,279,289 44% 84,624,581 9,627,251 18,754,903 51% 77% 135
231 Diferenta / Difference (%) 35% 18% 155% 131% -8%
232 EDENRED ROMANIA SRL 2017 50,245,257 49% 101,587,125 48,250,304 102,401,393 40% 75% 148
232 2016 34,350,750 43% 80,650,264 31,624,013 107,535,973 25% 71% 147
232 Diferenta / Difference (%) 46% 26% 53% -5% 1%
233 L'OREAL ROMANIA SRL 2017 50,018,381 14% 369,582,168 45,585,354 39,080,292 87% 66% 223
233 2016 42,949,216 14% 314,090,033 40,023,877 37,688,740 83% 62% 186
233 Diferenta / Difference (%) 16% 18% 14% 4% 20%
234 LUXOFT PROFESSIONAL ROMANIA SRL 2017 49,929,719 16% 310,588,230 24,853,655 109,240,722 19% 20% 1,723
234 2016 32,289,195 11% 286,126,026 16,970,596 86,651,481 16% 26% 1,730
234 Diferenta / Difference (%) 55% 9% 46% 26% 0%
235 RONDOCARTON SRL 2017 49,880,774 12% 412,332,384 36,254,312 288,335,424 12% 15% 417
235 2016 49,255,705 14% 351,813,858 28,845,483 247,146,546 10% 12% 350
235 Diferenta / Difference (%) 1% 17% 26% 17% 19%
236 DEGARO SRL 2017 49,121,519 34% 143,237,625 28,209,918 96,861,539 25% 54% 97
236 2016 31,244,590 26% 118,345,381 13,150,656 53,707,745 22% 74% 108
236 Diferenta / Difference (%) 57% 21% 115% 80% -10%
237 BEKAERT SLATINA SRL 2017 49,094,587 14% 340,181,239 29,652,823 246,209,743 11% 48% 594
237 2016 71,406,721 20% 356,366,290 54,613,432 215,892,630 21% 29% 562
237 Diferenta / Difference (%) -31% -5% -46% 14% 6%
238 SUPERBET BETTING & GAMING S.A. 2017 48,845,637 18% 273,894,513 55,408,639 48,639,042 98% 67% 2,314
238 2016 34,662,544 17% 207,461,789 32,839,944 35,891,144 76% 50% 1,709
238 Diferenta / Difference (%) 41% 32% 69% 36% 35%
239 AGRI TERENURI SA 2017 48,682,169 181% 26,886,830 74,955,309 394,074,032 19% 42% 29
239 2016 21,116,173 84% 25,254,401 338,757 319,118,723 0% 53% 24
239 Diferenta / Difference (%) 131% 6% 22027% 23% 21%
240 VOESTALPINE STEEL SERVICE CENTER ROMANIA SRL 2017 48,462,395 14% 356,694,225 38,410,945 78,887,501 40% 63% 66
240 2016 32,555,661 14% 236,328,504 23,919,381 47,360,201 44% 72% NULL
240 Diferenta / Difference (%) 49% 51% 61% 67%
Page 17
Ordine dupa
EBITDA 2017Denumire companie AN EBITDA
Marja
EBITDA (%)Cifra de afaceri Rezultat Brut Capitaluri Proprii
Rentabilitatea
capitalului
propriu
Levier Financiar Nr. de angajati
Position by
EBITDA 2017Company Name year EBITDA
EBITDA
Margin (%)Net Turnover Profit/Loss Before Tax Shareholders Equity
Return on
EquityLeverage
Number of
Employees
241 FRIGOGLASS ROMANIA SRL 2017 48,344,594 8% 623,114,268 27,274,335 87,113,186 26% 78% 1,268
241 2016 25,175,537 6% 419,973,498 (2,630,001) 69,921,157 -6% 77% 939
241 Diferenta / Difference (%) 92% 48% -1137% 25% 35%
242 NOVO INVESTMENT RO SRL 2017 48,330,106 77% 62,578,005 (56,661,464) 127,502,596 -47% 43% 107
242 2016 30,865,489 78% 39,748,637 1,135,150 186,888,150 1% 29% 63
242 Diferenta / Difference (%) 57% 57% -5092% -32% 70%
243 CORPORATE RECOVERY MANAGEMENT S.A. 2017 48,006,577 0 48,033,598 47,676,520 101% 0% 0
243 2016 (18,996) 0 (116,522) (357,077) 33% 119% 0
243 Diferenta / Difference (%)-252819% -41323% -13452%
244 HONEYWELL GARRETT SRL 2017 47,909,478 30% 162,008,305 13,697,281 238,508,708 6% 31% 530
244 2016 48,140,093 28% 172,611,895 18,145,123 225,145,001 8% 40% 633
244 Diferenta / Difference (%) 0% -6% -25% 6% -16%
245 COFICAB PLOIEŞTI SRL 2017 47,818,097 7% 685,030,394 31,860,965 83,145,228 33% 77% 261
245 2016 48,241,443 9% 561,284,539 36,104,723 56,245,540 54% 82% 259
245 Diferenta / Difference (%) -1% 22% -12% 48% 1%
246 CROCO SRL 2017 47,758,967 33% 146,741,890 41,174,971 51,962,211 70% 44% 389
246 2016 50,668,246 37% 136,908,781 44,025,268 53,300,499 71% 22% 239
246 Diferenta / Difference (%) -6% 7% -6% -3% 63%
247 CAN-PACK ROMANIA SRL 2017 47,682,769 12% 389,080,040 41,250,165 244,884,217 14% 24% 201
247 2016 55,770,348 15% 360,417,223 46,298,110 210,225,462 18% 11% 181
247 Diferenta / Difference (%) -15% 8% -11% 16% 11%
248 FABRICA DE LAPTE BRAȘOV S.A. 2017 47,624,773 11% 431,950,759 (810,186) 186,622,986 -1% 65% 391
248 2016 37,135,225 10% 370,418,528 (1,931,613) 187,578,992 -1% 63% 380
248 Diferenta / Difference (%) 28% 17% -58% -1% 3%
249 ASO CROMSTEEL S.A. 2017 47,599,092 14% 343,435,055 33,591,576 131,768,717 21% 50% 535
249 2016 29,999,728 9% 325,923,822 16,385,494 116,356,995 12% 52% 537
249 Diferenta / Difference (%) 59% 5% 105% 13% 0%
250 WIND RIVER SYSTEMS ROMANIA SRL 2017 47,463,538 100% 47,296,675 46,099,677 52,745,086 73% 8% 145
250 2016 6,030,483 11% 52,439,755 4,669,546 14,059,103 27% 33% 207
250 Diferenta / Difference (%) 687% -10% 887% 275% -30%
251 MARS ROMANIA SRL 2017 47,341,278 9% 503,033,387 37,281,837 55,638,995 52% 67% 213
251 2016 24,476,450 6% 434,746,887 18,980,343 26,702,543 56% 82% 219
251 Diferenta / Difference (%) 93% 16% 96% 108% -3%
252 URGENT CARGUS S.A. 2017 47,309,700 13% 372,367,963 7,999,355 2,949,329 77% 99% 1,044
252 2016 18,500,368 6% 308,888,900 (18,642,924) 1,335,694 -1497% 99% 1,122
252 Diferenta / Difference (%) 156% 21% -143% 121% -7%
253 ROECHLING AUTOMOTIVE PITEŞTI SRL 2017 47,131,724 31% 153,145,490 41,877,116 57,021,540 65% 62% 68
253 2016 39,028,082 42% 93,318,544 33,752,833 45,061,794 64% 48% 50
253 Diferenta / Difference (%) 21% 64% 24% 27% 36%
254 VIMERCATI EAST EUROPE SRL 2017 46,897,913 15% 312,955,308 42,175,184 53,946,565 68% 57% NULL
254 2016 30,771,745 17% 185,476,485 27,380,706 30,938,431 75% 59% 580
254 Diferenta / Difference (%) 52% 69% 54% 74%
255 HIRSCHMANN ROMANIA SRL 2017 46,392,172 13% 362,535,084 20,786,489 90,316,011 19% 65% 942
255 2016 34,756,867 10% 361,382,445 16,659,939 73,640,108 20% 71% 766
255 Diferenta / Difference (%) 33% 0% 25% 23% 23%
Page 18
Ordine dupa
EBITDA 2017Denumire companie AN EBITDA
Marja
EBITDA (%)Cifra de afaceri Rezultat Brut Capitaluri Proprii
Rentabilitatea
capitalului
propriu
Levier Financiar Nr. de angajati
Position by
EBITDA 2017Company Name year EBITDA
EBITDA
Margin (%)Net Turnover Profit/Loss Before Tax Shareholders Equity
Return on
EquityLeverage
Number of
Employees
256 QUADRANT - AMROQ BEVERAGES SRL 2017 46,354,574 5% 854,864,686 14,415,109 130,171,641 6% 73% 665
256 2016 72,538,793 10% 760,151,250 26,531,602 114,444,412 23% 72% 612
256 Diferenta / Difference (%) -36% 12% -46% 14% 9%
257 LEONI WIRING SYSTEMS ARAD SRL 2017 46,331,898 6% 792,053,832 8,584,181 77,467,954 9% 81% 3,788
257 2016 33,718,425 5% 736,469,370 6,179,469 70,408,841 8% 80% 3,988
257 Diferenta / Difference (%) 37% 8% 39% 10% -5%
258 SE BORDNETZE SRL 2017 45,920,712 6% 781,158,485 25,979,908 5,636,225 461% 98% 5,891
258 2016 12,572,585 2% 637,138,424 (5,571,943) (20,343,684) 27% 110% 5,487
258 Diferenta / Difference (%) 265% 23% -566% -128% 7%
259 X GAMING S.A. 2017 45,801,571 55% 83,980,842 43,076,574 53,916,947 67% 15% 43
259 2016 21,733,460 44% 49,731,953 18,796,094 17,553,441 91% 28% 40
259 Diferenta / Difference (%) 111% 69% 129% 207% 8%
260 CRAMELE RECAS SA 2017 45,559,712 31% 148,433,629 38,911,623 102,891,941 34% 34% 110
260 2016 39,065,052 33% 120,100,205 33,123,122 67,981,142 43% 51% 103
260 Diferenta / Difference (%) 17% 24% 17% 51% 7%
261 IULIUS MANAGEMENT CENTER SRL 2017 45,440,341 35% 129,926,676 38,256,534 34,255,476 95% 73% 398
261 2016 30,317,350 21% 144,303,068 25,691,731 51,088,924 43% 87% 793
261 Diferenta / Difference (%) 50% -10% 49% -33% -50%
262 AAYLEX PROD S.A. 2017 45,305,364 9% 488,955,750 10,677,305 (773,422) -1381% 100% 818
262 2016 34,544,253 7% 472,812,038 10,342,090 (11,450,727) -90% 106% 803
262 Diferenta / Difference (%) 31% 3% 3% -93% 2%
263 KOBER SRL 2017 45,277,797 14% 317,747,124 30,229,288 253,225,904 10% 19% 839
263 2016 49,764,980 17% 289,722,214 36,765,795 228,689,971 14% 20% 744
263 Diferenta / Difference (%) -9% 10% -18% 11% 13%
264 ADEVARUL HOLDING SRL 2017 45,217,564 93% 48,808,516 44,576,731 (370,455,807) -12% 2632% 241
264 2016 (6,508,624) -12% 53,404,102 (5,298,033) (415,223,516) 1% 3123% 150
264 Diferenta / Difference (%) -795% -9% -941% -11% 61%
265 CENTRUL MEDICAL UNIREA SRL 2017 45,097,791 12% 381,064,468 (63,152,975) 344,702,521 -19% 61% 1,977
265 2016 40,590,687 13% 310,882,553 11,789,062 384,166,562 3% 54% 1,522
265 Diferenta / Difference (%) 11% 23% -636% -10% 30%
266 NEW KOPEL ROMANIA SRL 2017 45,016,616 64% 70,588,432 3,272,928 26,159,556 13% 87% 86
266 2016 39,836,899 66% 60,104,511 2,790,246 24,878,270 11% 85% 74
266 Diferenta / Difference (%) 13% 17% 17% 5% 16%
267 DANUBE BRIDGE VIDIN - CALAFAT AD BULGARIA - SUCURSALA CALAFAT ROMANIA2017 44,967,545 91% 49,549,617 46,406,751 71,363,184 55% 4% 34
267 2016 38,061,974 91% 41,747,012 38,560,475 89,427,736 36% 3% 34
267 Diferenta / Difference (%) 18% 19% 20% -20% 0%
268 ELBA SA 2017 44,932,711 18% 250,246,514 20,225,510 209,749,070 8% 41% 1,086
268 2016 39,174,985 17% 225,265,592 13,816,110 195,430,809 6% 39% 1,020
268 Diferenta / Difference (%) 15% 11% 46% 7% 6%
269 GLOBAL LEATHER SUPPLIER SRL 2017 44,918,147 38% 117,265,050 43,475,412 36,531,819 100% 40% 314
269 2016 41,481,274 46% 89,456,989 39,460,061 33,164,077 100% 34% 235
269 Diferenta / Difference (%) 8% 31% 10% 10% 34%
270 ANA HOTELS SA 2017 44,633,658 31% 145,128,387 24,401,727 395,085,070 6% 23% 592
270 2016 43,086,517 30% 141,268,817 22,030,027 278,413,923 7% 33% 591
270 Diferenta / Difference (%) 4% 3% 11% 42% 0%
Page 19
Ordine dupa
EBITDA 2017Denumire companie AN EBITDA
Marja
EBITDA (%)Cifra de afaceri Rezultat Brut Capitaluri Proprii
Rentabilitatea
capitalului
propriu
Levier Financiar Nr. de angajati
Position by
EBITDA 2017Company Name year EBITDA
EBITDA
Margin (%)Net Turnover Profit/Loss Before Tax Shareholders Equity
Return on
EquityLeverage
Number of
Employees
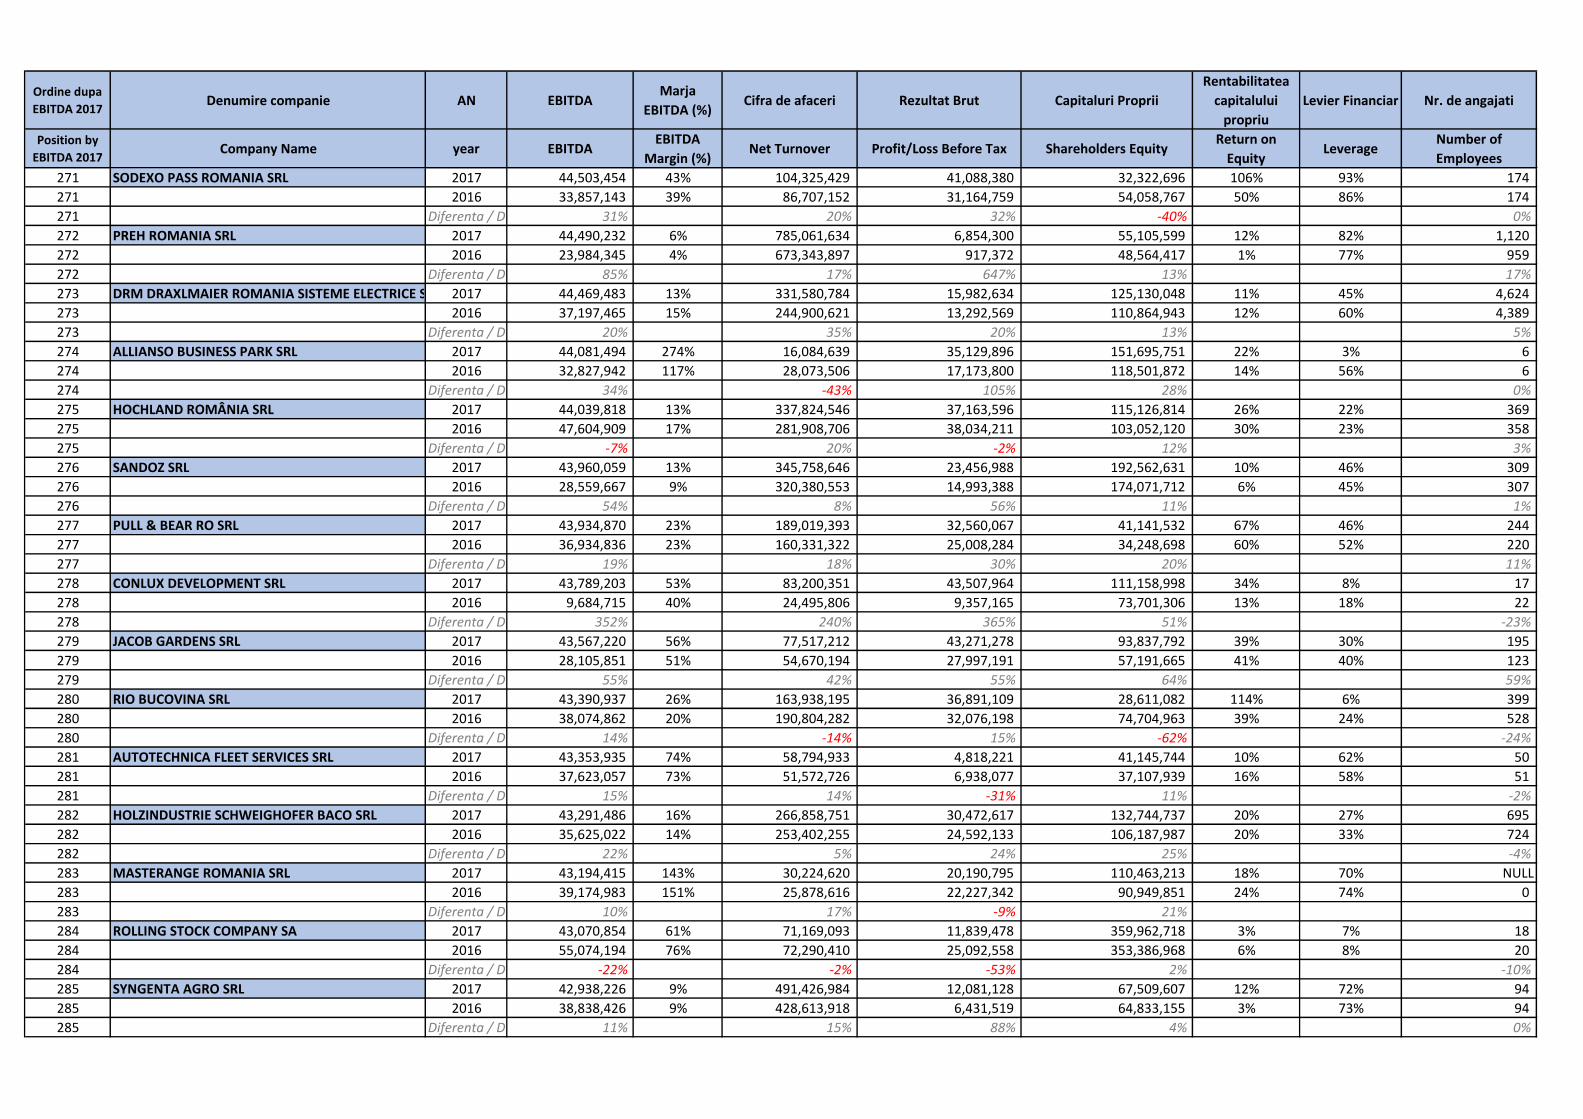
271 SODEXO PASS ROMANIA SRL 2017 44,503,454 43% 104,325,429 41,088,380 32,322,696 106% 93% 174
271 2016 33,857,143 39% 86,707,152 31,164,759 54,058,767 50% 86% 174
271 Diferenta / Difference (%) 31% 20% 32% -40% 0%
272 PREH ROMANIA SRL 2017 44,490,232 6% 785,061,634 6,854,300 55,105,599 12% 82% 1,120
272 2016 23,984,345 4% 673,343,897 917,372 48,564,417 1% 77% 959
272 Diferenta / Difference (%) 85% 17% 647% 13% 17%
273 DRM DRAXLMAIER ROMANIA SISTEME ELECTRICE SRL 2017 44,469,483 13% 331,580,784 15,982,634 125,130,048 11% 45% 4,624
273 2016 37,197,465 15% 244,900,621 13,292,569 110,864,943 12% 60% 4,389
273 Diferenta / Difference (%) 20% 35% 20% 13% 5%
274 ALLIANSO BUSINESS PARK SRL 2017 44,081,494 274% 16,084,639 35,129,896 151,695,751 22% 3% 6
274 2016 32,827,942 117% 28,073,506 17,173,800 118,501,872 14% 56% 6
274 Diferenta / Difference (%) 34% -43% 105% 28% 0%
275 HOCHLAND ROMÂNIA SRL 2017 44,039,818 13% 337,824,546 37,163,596 115,126,814 26% 22% 369
275 2016 47,604,909 17% 281,908,706 38,034,211 103,052,120 30% 23% 358
275 Diferenta / Difference (%) -7% 20% -2% 12% 3%
276 SANDOZ SRL 2017 43,960,059 13% 345,758,646 23,456,988 192,562,631 10% 46% 309
276 2016 28,559,667 9% 320,380,553 14,993,388 174,071,712 6% 45% 307
276 Diferenta / Difference (%) 54% 8% 56% 11% 1%
277 PULL & BEAR RO SRL 2017 43,934,870 23% 189,019,393 32,560,067 41,141,532 67% 46% 244
277 2016 36,934,836 23% 160,331,322 25,008,284 34,248,698 60% 52% 220
277 Diferenta / Difference (%) 19% 18% 30% 20% 11%
278 CONLUX DEVELOPMENT SRL 2017 43,789,203 53% 83,200,351 43,507,964 111,158,998 34% 8% 17
278 2016 9,684,715 40% 24,495,806 9,357,165 73,701,306 13% 18% 22
278 Diferenta / Difference (%) 352% 240% 365% 51% -23%
279 JACOB GARDENS SRL 2017 43,567,220 56% 77,517,212 43,271,278 93,837,792 39% 30% 195
279 2016 28,105,851 51% 54,670,194 27,997,191 57,191,665 41% 40% 123
279 Diferenta / Difference (%) 55% 42% 55% 64% 59%
280 RIO BUCOVINA SRL 2017 43,390,937 26% 163,938,195 36,891,109 28,611,082 114% 6% 399
280 2016 38,074,862 20% 190,804,282 32,076,198 74,704,963 39% 24% 528
280 Diferenta / Difference (%) 14% -14% 15% -62% -24%
281 AUTOTECHNICA FLEET SERVICES SRL 2017 43,353,935 74% 58,794,933 4,818,221 41,145,744 10% 62% 50
281 2016 37,623,057 73% 51,572,726 6,938,077 37,107,939 16% 58% 51
281 Diferenta / Difference (%) 15% 14% -31% 11% -2%
282 HOLZINDUSTRIE SCHWEIGHOFER BACO SRL 2017 43,291,486 16% 266,858,751 30,472,617 132,744,737 20% 27% 695
282 2016 35,625,022 14% 253,402,255 24,592,133 106,187,987 20% 33% 724
282 Diferenta / Difference (%) 22% 5% 24% 25% -4%
283 MASTERANGE ROMANIA SRL 2017 43,194,415 143% 30,224,620 20,190,795 110,463,213 18% 70% NULL
283 2016 39,174,983 151% 25,878,616 22,227,342 90,949,851 24% 74% 0
283 Diferenta / Difference (%) 10% 17% -9% 21%
284 ROLLING STOCK COMPANY SA 2017 43,070,854 61% 71,169,093 11,839,478 359,962,718 3% 7% 18
284 2016 55,074,194 76% 72,290,410 25,092,558 353,386,968 6% 8% 20
284 Diferenta / Difference (%) -22% -2% -53% 2% -10%
285 SYNGENTA AGRO SRL 2017 42,938,226 9% 491,426,984 12,081,128 67,509,607 12% 72% 94
285 2016 38,838,426 9% 428,613,918 6,431,519 64,833,155 3% 73% 94
285 Diferenta / Difference (%) 11% 15% 88% 4% 0%
Page 20
Ordine dupa
EBITDA 2017Denumire companie AN EBITDA
Marja
EBITDA (%)Cifra de afaceri Rezultat Brut Capitaluri Proprii
Rentabilitatea
capitalului
propriu
Levier Financiar Nr. de angajati
Position by
EBITDA 2017Company Name year EBITDA
EBITDA
Margin (%)Net Turnover Profit/Loss Before Tax Shareholders Equity
Return on
EquityLeverage
Number of
Employees
286 RIFIL SA 2017 42,914,610 12% 349,986,723 35,186,648 217,457,586 15% 42% 688
286 2016 52,501,731 16% 332,930,970 42,610,723 190,639,572 20% 44% 666
286 Diferenta / Difference (%) -18% 5% -17% 14% 3%
287 INTERGAME SELECT SRL 2017 42,883,576 30% 144,909,559 49,978,813 34,904,095 138% 33% 496
287 2016 24,859,857 20% 123,430,576 23,137,951 (13,655,432) -143% 150% 525
287 Diferenta / Difference (%) 73% 17% 116% -356% -6%
288 PEERAJ BRANDS INTERNATIONAL SRL 2017 42,825,411 14% 296,833,156 33,427,741 41,011,818 71% 58% 815
288 2016 20,657,209 9% 229,552,942 11,796,852 14,204,073 58% 80% 659
288 Diferenta / Difference (%) 107% 29% 183% 189% 24%
289 POLUS TRANSILVANIA COMPANIE DE INVESTITII SA 2017 42,728,539 53% 80,667,385 6,956,138 519,397,718 1% 31% NULL
289 2016 78,761,295 106% 74,374,880 55,147,040 454,876,991 12% 41% 0
289 Diferenta / Difference (%) -46% 8% -87% 14%
290 RO NATURSTEIN SRL 2017 42,520,671 312% 13,620,873 27,902,282 141,378,047 17% 60% 13
290 2016 31,134,430 238% 13,096,222 22,963,511 150,851,787 13% 62% 15
290 Diferenta / Difference (%) 37% 4% 22% -6% -13%
291 ROMPHARM COMPANY SRL 2017 42,386,559 31% 138,457,594 30,520,631 66,458,840 42% 66% 321
291 2016 16,748,412 18% 92,369,823 10,696,543 38,260,487 25% 76% 280
291 Diferenta / Difference (%) 153% 50% 185% 74% 15%
292 ALCEDO SRL 2017 42,365,870 6% 681,165,274 38,484,743 60,539,937 52% 86% 279
292 2016 49,094,144 8% 582,573,417 35,643,455 52,725,756 54% 85% 255
292 Diferenta / Difference (%) -14% 17% 8% 15% 9%
293 MICROSOFT ROMANIA SRL 2017 42,328,493 13% 321,331,590 25,953,918 116,086,770 11% 21% 582
293 2016 66,364,541 24% 277,792,740 54,425,292 103,533,773 44% 23% 470
293 Diferenta / Difference (%) -36% 16% -52% 12% 24%
294 TCE MOBILE DRYERS S.R.L. 2017 42,182,539 40% 104,883,265 46,803,331 40,518,686 98% 62% 75
294 2016 36,458,293 54% 67,982,853 35,472,220 30,534,943 97% 67% 70
294 Diferenta / Difference (%) 16% 54% 32% 33% 7%
295 CON-A SRL 2017 41,935,244 8% 548,400,844 33,895,193 123,469,795 23% 58% 634
295 2016 25,964,274 7% 362,614,350 20,493,875 112,648,416 16% 61% 580
295 Diferenta / Difference (%) 62% 51% 65% 10% 9%
296 CHIMPEX SA 2017 41,758,942 31% 133,073,428 24,325,836 239,086,663 9% 35% 280
296 2016 39,319,203 33% 118,077,795 29,127,714 218,259,736 11% 31% 261
296 Diferenta / Difference (%) 6% 13% -16% 10% 7%
297 MISYS INTERNATIONAL FINANCIAL SYSTEMS SRL 2017 41,558,334 32% 131,522,647 44,150,827 25,249,228 172% 87% 545
297 2016 NULL 60,467,581 (22,512,359) (271,053) 9449% 100% 568
297 Diferenta / Difference (%) 118% -296% -9415% -4%
298 ARTIMA SA 2017 41,555,546 3% 1,453,119,130 10,169,503 53,700,347 8% 90% 2,986
298 2016 21,511,264 2% 1,172,661,251 (2,197,316) 49,623,795 -11% 89% 2,614
298 Diferenta / Difference (%) 93% 24% -563% 8% 14%
299 METAPLAST SRL 2017 41,169,794 18% 231,965,056 23,094,300 86,421,434 27% 57% 984
299 2016 33,780,632 20% 166,177,397 20,280,869 64,379,759 32% 60% 702
299 Diferenta / Difference (%) 22% 40% 14% 34% 40%
300 IRIS TITAN SHOPPING CENTER S.R.L. 2017 41,049,811 85% 48,402,505 11,023,936 274,551,394 4% 40% 0
300 2016 21,979,490 48% 45,780,364 (7,639,404) 231,517,716 -3% 45% NULL
300 Diferenta / Difference (%) 87% 6% -244% 19%
Page 21
Ordine dupa
EBITDA 2017Denumire companie AN EBITDA
Marja
EBITDA (%)Cifra de afaceri Rezultat Brut Capitaluri Proprii
Rentabilitatea
capitalului
propriu
Levier Financiar Nr. de angajati
Position by
EBITDA 2017Company Name year EBITDA
EBITDA
Margin (%)Net Turnover Profit/Loss Before Tax Shareholders Equity
Return on
EquityLeverage
Number of
Employees
301 IULIUS MALL CLUJ SRL 2017 41,033,842 57% 71,474,552 21,544,749 (33,597,055) -54% 109% 2
301 2016 37,090,987 57% 65,576,299 25,907,613 (67,004,568) -33% 129% 2
301 Diferenta / Difference (%) 11% 9% -17% -50% 0%
302 BT OPERATIONAL LEASING S.A. 2017 40,913,489 69% 58,916,389 2,198,086 11,245,882 16% 94% 24
302 2016 26,784,283 69% 38,825,073 4,684,232 9,427,973 43% 93% 22
302 Diferenta / Difference (%) 53% 52% -53% 19% 9%
303 REAL HYPER MAGAZINE SRL 2017 40,736,212 16% 254,371,112 31,555,524 251,206,687 13% 11% 461
303 2016 (37,442,253) -13% 280,968,753 (45,996,871) 32,414,485 -142% 62% 735
303 Diferenta / Difference (%) -209% -9% -169% 675% -37%
304 HAMILTON CENTRAL EUROPE SRL 2017 40,564,830 42% 97,192,230 36,340,627 83,390,463 37% 23% 135
304 2016 35,336,227 42% 83,284,735 31,508,790 52,899,180 51% 42% 104
304 Diferenta / Difference (%) 15% 17% 15% 58% 30%
305 CLAAS REGIONAL CENTER SOUTH EAST EUROPE SRL 2017 40,533,421 8% 478,889,323 35,421,665 34,163,395 76% 63% 25
305 2016 4,303,915 6% 68,346,118 3,269,439 9,364,141 26% 73% 21
305 Diferenta / Difference (%) 842% 601% 983% 265% 19%
306 PROMAT COMIMPEX SRL 2017 40,404,576 7% 541,463,900 37,377,368 175,164,757 18% 48% 90
306 2016 56,432,257 15% 383,082,999 36,422,922 145,788,158 21% 33% 57
306 Diferenta / Difference (%) -28% 41% 3% 20% 58%
307 AGRO-CHIRNOGI SA 2017 40,221,391 5% 880,615,909 5,376,455 105,648,389 4% 80% 548
307 2016 57,553,456 6% 960,125,675 15,509,997 100,004,450 12% 86% 623
307 Diferenta / Difference (%) -30% -8% -65% 6% -12%
308 KOYO ROMÂNIA SA 2017 40,047,656 12% 335,704,465 18,719,553 289,021,690 5% 17% 1,474
308 2016 61,398,239 18% 332,941,839 42,430,477 273,442,072 13% 16% 1,462
308 Diferenta / Difference (%) -35% 1% -56% 6% 1%
309 COMPANIA ROMPREST SERVICE SA 2017 40,026,293 15% 264,471,808 21,136,675 131,638,121 12% 43% 3,449
309 2016 57,210,087 24% 242,588,068 28,392,058 112,188,473 20% 54% 3,310
309 Diferenta / Difference (%) -30% 9% -26% 17% 4%
310 PEEK & CLOPPENBURG SRL 2017 39,981,770 16% 250,564,934 36,659,921 152,282,825 20% 12% 241
310 2016 37,217,152 18% 208,889,378 34,993,402 121,631,345 24% 9% 190
310 Diferenta / Difference (%) 7% 20% 5% 25% 27%
311 DOGAN MEDIA INTERNATIONAL SA 2017 39,816,228 33% 119,840,563 12,443,470 14,702,677 85% 82% 270
311 2016 33,470,191 31% 107,410,817 12,875,168 2,259,206 570% 97% 249
311 Diferenta / Difference (%) 19% 12% -3% 551% 8%
312 INTERBRANDS MARKETING & DISTRIBUTION SRL 2017 39,587,220 5% 856,065,522 27,167,180 88,783,396 26% 64% 1,965
312 2016 40,227,120 5% 781,748,702 29,547,876 67,563,586 37% 69% 1,830
312 Diferenta / Difference (%) -2% 10% -8% 31% 7%
313 CARPATAIR SA 2017 39,522,341 46% 86,631,788 28,432,651 77,185,289 37% 19% 99
313 2016 80,218,330 117% 68,531,327 52,162,279 48,752,638 107% 39% 96
313 Diferenta / Difference (%) -51% 26% -45% 58% 3%
314 DB GLOBAL TECHNOLOGY SRL 2017 39,506,896 18% 222,658,291 28,828,553 98,860,766 24% 49% 722
314 2016 44,897,726 27% 165,722,422 37,763,826 75,149,467 42% 56% 567
314 Diferenta / Difference (%) -12% 34% -24% 32% 27%
315 PLANTAGRO-COM SRL 2017 39,368,057 9% 439,754,096 17,634,085 32,174,982 47% 87% 140
315 2016 32,005,058 8% 380,313,429 15,903,501 20,160,953 68% 91% 140
315 Diferenta / Difference (%) 23% 16% 11% 60% 0%
Page 22
Ordine dupa
EBITDA 2017Denumire companie AN EBITDA
Marja
EBITDA (%)Cifra de afaceri Rezultat Brut Capitaluri Proprii
Rentabilitatea
capitalului
propriu
Levier Financiar Nr. de angajati
Position by
EBITDA 2017Company Name year EBITDA
EBITDA
Margin (%)Net Turnover Profit/Loss Before Tax Shareholders Equity
Return on
EquityLeverage
Number of
Employees
316 ROMBAT SA 2017 39,306,102 10% 386,005,630 24,801,477 213,697,805 10% 24% 733
316 2016 40,716,178 12% 350,461,426 25,769,310 214,328,590 10% 23% 724
316 Diferenta / Difference (%) -3% 10% -4% 0% 1%
317 INTERCEREAL SA 2017 39,181,958 35% 113,219,816 27,431,803 136,036,064 17% 43% 276
317 2016 50,600,313 46% 109,636,849 36,918,867 144,397,332 22% 31% 306
317 Diferenta / Difference (%) -23% 3% -26% -6% -10%
318 SYNEVO ROMANIA SRL 2017 39,125,258 18% 214,667,339 28,491,825 48,860,654 49% 34% 898
318 2016 30,657,938 17% 181,407,880 19,808,661 52,281,346 31% 38% 829
318 Diferenta / Difference (%) 28% 18% 44% -7% 8%
319 FLORISAL SA 2017 39,088,126 41% 94,944,887 35,437,875 62,220,472 48% 54% 229
319 2016 6,508,626 27% 24,424,623 4,758,565 35,311,927 11% 72% 221
319 Diferenta / Difference (%) 501% 289% 645% 76% 4%
320 CITY GATE SRL 2017 39,017,270 147% 26,490,118 21,089,368 159,784,111 13% 58% NULL
320 2016 21,113,796 75% 28,063,524 6,428,176 (64,194,041) -10% 140% NULL
320 Diferenta / Difference (%) 85% -6% 228% -349%
321 ALCATEL - LUCENT ROMÂNIA SRL 2017 38,957,184 9% 425,562,256 23,354,167 179,746,857 10% 43% 1,686
321 2016 36,146,803 9% 393,824,745 20,916,878 221,343,973 8% 36% 0
321 Diferenta / Difference (%) 8% 8% 12% -19%
322 MACROMEX SRL 2017 38,859,538 5% 722,680,669 20,101,595 75,340,155 21% 62% 390
322 2016 14,170,140 2% 711,900,215 (2,477,556) 72,925,451 -7% 74% 345
322 Diferenta / Difference (%) 174% 2% -911% 3% 13%
323 MED LIFE SA 2017 38,843,323 10% 379,664,698 (1,714,888) 153,944,273 -2% 66% 1,745
323 2016 41,162,652 12% 341,731,549 (6,944,448) 88,900,859 -9% 74% 1,629
323 Diferenta / Difference (%) -6% 11% -75% 73% 7%
324 SEALYNX AUTOMOTIVE ROMANIA SRL 2017 38,838,766 26% 147,690,853 33,463,895 78,534,243 36% 41% 251
324 2016 50,445,083 36% 138,710,759 46,540,122 87,733,972 44% 18% 230
324 Diferenta / Difference (%) -23% 6% -28% -10% 9%
325 DETERGENTI S.A. 2017 38,799,701 38% 100,838,957 13,214,474 267,266,037 4% 5% 279
325 2016 35,139,872 37% 95,289,108 12,712,207 256,237,756 4% 9% 278
325 Diferenta / Difference (%) 10% 6% 4% 4% 0%
326 D DEVELOPEMENT INEU SRL 2017 38,781,989 892% 4,349,357 37,712,801 23,199,859 142% 13% NULL
326 2016 2,125,154 38% 5,632,895 (30,893) (8,596,004) 1% 153% NULL
326 Diferenta / Difference (%) 1725% -23% -122176% -370%
327 INTERNAŢIONAL ALEXANDER SRL 2017 38,655,858 15% 254,002,031 15,647,477 59,013,447 24% 68% 791
327 2016 32,269,089 16% 207,190,986 10,433,858 44,175,470 23% 73% 724
327 Diferenta / Difference (%) 20% 23% 50% 34% 9%
328 CITY PARK CONSTANTA SRL 2017 38,559,852 123% 31,299,354 16,154,239 520,719,700 3% 21% 0
328 2016 39,788,230 130% 30,709,635 10,045,166 424,774,893 2% 23% 1
328 Diferenta / Difference (%) -3% 2% 61% 23% -100%
329 GENERAL ELECTRIC INTERNATIONAL INC. - WILMINGTON SUCURSALA ROMANIA2017 38,353,897 25% 153,786,036 39,049,589 31,798,053 100% 86% 52
329 2016 83,142,219 31% 268,059,204 80,084,192 192,151,980 35% 39% 88
329 Diferenta / Difference (%) -54% -43% -51% -83% -41%
330 AMBIENT SA 2017 38,341,412 27% 142,380,983 8,536,561 (171,987,522) -5% 361% 360
330 2016 (5,790,321) -4% 135,876,258 (14,704,359) (182,383,467) 8% 304% 418
330 Diferenta / Difference (%) -762% 5% -158% -6% -14%
Page 23
Ordine dupa
EBITDA 2017Denumire companie AN EBITDA
Marja
EBITDA (%)Cifra de afaceri Rezultat Brut Capitaluri Proprii
Rentabilitatea
capitalului
propriu
Levier Financiar Nr. de angajati
Position by
EBITDA 2017Company Name year EBITDA
EBITDA
Margin (%)Net Turnover Profit/Loss Before Tax Shareholders Equity
Return on
EquityLeverage
Number of
Employees
331 VODAFONE ROMÂNIA TECHNOLOGIES SRL 2017 38,084,098 15% 249,396,409 35,873,838 40,412,804 76% 84% 1,543
331 2016 21,336,252 17% 126,443,016 9,705,343 16,318,545 46% 70% 784
331 Diferenta / Difference (%) 78% 97% 270% 148% 97%
332 COFCO INTERNATIONAL ROMANIA SRL 2017 37,865,748 1% 2,598,601,895 13,374,128 50,570,634 22% 91% 67
332 2016 10,474,252 1% 1,285,685,170 16,824,358 39,210,674 39% 80% 59
332 Diferenta / Difference (%) 262% 102% -21% 29% 14%
333 INTERTRANSCOM IMPEX SRL 2017 37,680,648 8% 466,183,904 29,109,019 65,530,317 38% 54% 179
333 2016 25,557,859 8% 303,897,608 20,165,444 41,654,002 43% 68% 169
333 Diferenta / Difference (%) 47% 53% 44% 57% 6%
334 DOLO TRANS OLIMP SRL 2017 37,679,939 21% 176,328,456 4,407,013 11,351,658 34% 94% 376
334 2016 27,182,381 17% 157,359,416 4,051,836 6,539,299 53% 96% 286
334 Diferenta / Difference (%) 39% 12% 9% 74% 31%
335 GEDEON RICHTER ROMANIA SA 2017 37,645,791 24% 154,368,514 (14,499,445) 354,717,696 -4% 23% 551
335 2016 22,039,280 16% 136,293,905 7,202,610 319,012,250 2% 32% 538
335 Diferenta / Difference (%) 71% 13% -301% 11% 2%
336 VEL PITAR SA 2017 37,640,234 9% 396,592,069 17,919,277 76,200,605 21% 51% 2,552
336 2016 38,500,355 11% 357,266,552 12,527,070 67,265,258 15% 50% 2,440
336 Diferenta / Difference (%) -2% 11% 43% 13% 5%
337 NORTH STAR SHIPPING S.R.L. 2017 37,636,443 55% 68,078,041 23,641,244 75,123,167 25% 13% 141
337 2016 33,116,117 54% 61,297,256 17,795,567 70,026,608 20% 28% 142
337 Diferenta / Difference (%) 14% 11% 33% 7% -1%
338 DR. OETKER RO SRL 2017 37,565,840 14% 261,558,581 25,934,645 134,676,216 17% 20% 493
338 2016 41,664,824 15% 285,538,897 24,289,586 135,043,876 14% 18% 515
338 Diferenta / Difference (%) -10% -8% 7% 0% -4%
339 HORNBACH IMOBILIARE SRL 2017 37,557,411 111% 33,888,810 9,978,982 222,242,940 2% 23% 1
339 2016 42,405,857 122% 34,621,220 23,912,909 216,980,410 11% 39% 3
339 Diferenta / Difference (%) -11% -2% -58% 2% -67%
340 DIANTHUS COMPANY SRL 2017 37,428,918 21% 180,966,436 22,922,092 47,608,189 42% 52% 353
340 2016 37,334,710 24% 154,513,091 20,388,043 27,802,887 63% 68% NULL
340 Diferenta / Difference (%) 0% 17% 12% 71%
341 BOGARIS RESIDENTIAL ROM CUATRO SRL 2017 37,377,355 32478% 115,084 37,720,532 101,404,236 37% 2% NULL
341 2016 (537,245) -3941% 13,631 (554,228) 72,752,643 -1% 3% NULL
341 Diferenta / Difference (%) -7057% 744% -6906% 39%
342 RCI FINANTARE ROMANIA SRL 2017 37,224,114 56% 66,295,868 16,219,818 17,954,932 89% 88% 14
342 2016 33,436,373 56% 59,922,678 15,667,862 17,153,576 89% 85% 14
342 Diferenta / Difference (%) 11% 11% 4% 5% 0%
343 EXPUR SA 2017 37,109,672 3% 1,132,742,748 (7,199,206) 391,598,429 -2% 56% 443
343 2016 26,592,804 2% 1,110,569,759 (32,777,898) 363,528,516 -9% 60% 460
343 Diferenta / Difference (%) 40% 2% -78% 8% -4%
344 IMOBILIA LEASE SRL 2017 37,003,544 375% 9,873,676 38,824,407 33,721,253 93% 8% 2
344 2016 26,272,113 103% 25,415,616 17,704,037 95,179,640 16% 2% 2
344 Diferenta / Difference (%) 41% -61% 119% -65% 0%
345 OPTIBELT POWER TRANSMISSION SRL 2017 36,991,917 21% 179,416,090 12,159,856 68,560,422 15% 57% 415
345 2016 28,637,955 22% 127,968,381 10,035,679 67,548,621 12% 56% 338
345 Diferenta / Difference (%) 29% 40% 21% 1% 23%
Page 24
Ordine dupa
EBITDA 2017Denumire companie AN EBITDA
Marja
EBITDA (%)Cifra de afaceri Rezultat Brut Capitaluri Proprii
Rentabilitatea
capitalului
propriu
Levier Financiar Nr. de angajati
Position by
EBITDA 2017Company Name year EBITDA
EBITDA
Margin (%)Net Turnover Profit/Loss Before Tax Shareholders Equity
Return on
EquityLeverage
Number of
Employees
346 AGRICOLA INTERNATIONAL SA 2017 36,988,840 9% 401,324,318 24,365,738 179,200,776 12% 50% 1,876
346 2016 34,472,269 9% 387,002,257 10,064,505 163,064,076 4% 55% 1,812
346 Diferenta / Difference (%) 7% 4% 142% 10% 4%
347 GRIVITA SA 2017 36,954,013 17463% 211,612 36,944,535 33,963,961 92% 10% 3
347 2016 (274,711) -703% 39,075 (309,684) 12,337,278 -3% 4% 3
347 Diferenta / Difference (%)-13552% 442% -12030% 175% 0%
348 JIDVEI SRL FILIALA ALBA 2017 36,937,531 23% 158,244,217 20,493,177 130,764,020 13% 52% 178
348 2016 31,344,854 21% 150,692,856 16,346,556 113,226,278 12% 53% 169
348 Diferenta / Difference (%) 18% 5% 25% 15% 5%
349 EXPO MARKET DORALY SRL 2017 36,795,788 70% 52,712,943 7,605,450 132,452,895 6% 72% NULL
349 2016 32,241,489 69% 46,794,082 11,307,621 95,159,242 12% 78% NULL
349 Diferenta / Difference (%) 14% 13% -33% 39%
350 DAR DRAXLMAIER AUTOMOTIVE SRL 2017 36,774,577 17% 215,190,993 11,535,149 84,763,021 14% 72% 3,082
350 2016 28,813,393 17% 171,095,757 6,878,209 73,227,872 9% 68% 2,691
350 Diferenta / Difference (%) 28% 26% 68% 16% 15%
351 NIRO INVESTMENT SA 2017 36,735,068 31% 118,917,118 28,066,679 232,257,756 10% 39% 331
351 2016 26,601,951 27% 97,246,580 18,162,873 208,804,728 7% 42% 343
351 Diferenta / Difference (%) 38% 22% 55% 11% -3%
352 BCR FLEET MANAGEMENT SRL 2017 36,690,100 68% 53,635,610 (5,232,383) (1,913,969) 273% 101% 4
352 2016 28,377,210 68% 41,880,296 2,166,013 6,257,285 35% 97% 4
352 Diferenta / Difference (%) 29% 28% -342% -131% 0%
353 CUMMINS GENERATOR TECHNOLOGIES ROMANIA SA 2017 36,672,944 10% 351,911,002 16,588,798 137,590,531 9% 59% 613
353 2016 59,259,876 19% 303,918,974 47,032,699 102,716,691 38% 60% 577
353 Diferenta / Difference (%) -38% 16% -65% 34% 6%
354 THERME NORD BUCURESTI SRL 2017 36,585,006 36% 100,717,599 3,518,249 1,739,458 161% 100% 452
354 2016 6,953,878 11% 64,492,585 (20,382,280) 1,131,260 -1802% 100% 427
354 Diferenta / Difference (%) 426% 56% -117% 54% 6%
355 ROMSTYL IMPEX SRL 2017 36,467,441 30% 120,595,211 9,921,282 47,347,654 18% 57% 400
355 2016 35,141,890 31% 112,695,632 17,982,165 40,726,633 37% 62% 402
355 Diferenta / Difference (%) 4% 7% -45% 16% 0%
356 PRUTUL SA 2017 36,427,750 6% 649,419,738 453,092 50,387,397 1% 88% 458
356 2016 26,346,111 4% 751,964,319 (26,563,391) 26,656,562 -100% 94% 539
356 Diferenta / Difference (%) 38% -14% -102% 89% -15%
357 SOUFFLET MALT ROMANIA SA 2017 36,422,690 18% 199,536,084 23,384,882 177,839,102 11% 24% 24
357 2016 39,457,966 19% 204,446,748 26,098,817 158,105,602 14% 30% NULL
357 Diferenta / Difference (%) -8% -2% -10% 12%
358 SCHENKER LOGISTICS ROMANIA S.A. 2017 36,405,656 6% 568,828,300 30,102,166 197,751,936 12% 28% 1,132
358 2016 24,287,740 5% 484,112,937 16,819,107 204,564,184 6% 26% 1,106
358 Diferenta / Difference (%) 50% 17% 79% -3% 2%
359 AQUILA PART PROD COM SRL 2017 36,377,013 4% 906,729,739 13,392,533 58,374,098 17% 84% 2,251
359 2016 43,132,815 5% 797,946,438 17,415,371 57,839,611 24% 84% 2,183
359 Diferenta / Difference (%) -16% 14% -23% 1% 3%
360 WIPRO TECHNOLOGIES SRL 2017 36,314,336 22% 162,495,375 29,441,180 64,512,942 39% 29% 1,093
360 2016 28,804,499 22% 131,793,170 21,992,167 48,210,114 38% 31% 860
360 Diferenta / Difference (%) 26% 23% 34% 34% 27%
Page 25
Ordine dupa
EBITDA 2017Denumire companie AN EBITDA
Marja
EBITDA (%)Cifra de afaceri Rezultat Brut Capitaluri Proprii
Rentabilitatea
capitalului
propriu
Levier Financiar Nr. de angajati
Position by
EBITDA 2017Company Name year EBITDA
EBITDA
Margin (%)Net Turnover Profit/Loss Before Tax Shareholders Equity
Return on
EquityLeverage
Number of
Employees
361 GAME WORLD ROMANIA SRL 2017 36,264,083 24% 148,680,900 31,034,422 24,622,620 99% 52% 391
361 2016 24,070,247 18% 132,635,712 18,100,044 13,832,505 98% 70% 373
361 Diferenta / Difference (%) 51% 12% 71% 78% 5%
362 CAROLI FOODS GROUP SRL 2017 36,198,634 9% 420,126,062 20,161,730 69,961,713 23% 63% 972
362 2016 33,886,248 8% 429,746,687 19,665,136 64,595,517 24% 65% 1,042
362 Diferenta / Difference (%) 7% -2% 3% 8% -7%
363 XPO TRANSPORT SOLUTIONS ROMANIA SRL 2017 36,144,005 13% 276,003,085 (13,428,690) 5,298,213 -253% 98% 699
363 2016 34,854,385 12% 287,281,676 (14,733,272) 18,726,901 -83% 93% 789
363 Diferenta / Difference (%) 4% -4% -9% -72% -11%
364 LAGARDERE TRAVEL RETAIL SRL 2017 36,094,473 6% 557,806,181 32,461,155 34,515,721 84% 66% 150
364 2016 33,024,788 7% 485,926,199 27,312,197 28,321,897 80% 68% 150
364 Diferenta / Difference (%) 9% 15% 19% 22% 0%
365 LABORMED-PHARMA SA 2017 35,954,665 22% 164,409,567 13,941,920 179,274,621 8% 24% 275
365 2016 33,877,710 23% 148,627,350 13,187,018 126,121,701 10% 45% 251
365 Diferenta / Difference (%) 6% 11% 6% 42% 10%
366 FARMEXIM SA 2017 35,889,680 2% 1,965,596,477 16,812,055 92,854,420 16% 92% 794
366 2016 44,924,838 2% 1,851,421,689 21,905,970 78,252,062 24% 92% 793
366 Diferenta / Difference (%) -20% 6% -23% 19% 0%
367 CLUJ BUSINESS CENTRE SRL 2017 35,774,346 80% 44,660,580 3,474,440 275,772,322 1% 57% 0
367 2016 20,734,256 68% 30,443,897 (5,829,202) 166,061,107 -4% 64% 0
367 Diferenta / Difference (%) 73% 47% -160% 66%
368 WIENERBERGER - SISTEME DE CARAMIZI SRL 2017 35,703,330 18% 203,055,482 13,817,248 134,879,488 8% 42% 299
368 2016 36,998,798 20% 181,464,186 16,422,961 123,606,192 11% 44% 271
368 Diferenta / Difference (%) -4% 12% -16% 9% 10%
369 BOC REAL PROPERTY SRL 2017 35,635,995 61% 58,018,695 (4,233,642) 113,236,130 -4% 81% 3
369 2016 40,244,913 68% 59,301,312 10,809,076 93,161,522 12% 86% 3
369 Diferenta / Difference (%) -11% -2% -139% 22% 0%
370 ALEXANDRION GRUP ROMANIA SRL 2017 35,569,382 21% 165,549,056 28,769,935 148,359,816 16% 48% 209
370 2016 31,595,744 21% 149,611,378 24,178,796 138,910,065 14% 49% 196
370 Diferenta / Difference (%) 13% 11% 19% 7% 7%
371 SMART HOUSE CONCEPT SRL 2017 35,550,948 53% 67,333,630 35,249,849 49,197,070 60% 5% 7
371 2016 5,830,152 55% 10,657,769 5,592,723 26,128,539 18% 33% 5
371 Diferenta / Difference (%) 510% 532% 530% 88% 40%
372 EGGER TECHNOLOGIA SRL 2017 35,357,775 11% 321,301,107 19,406,186 123,648,678 14% 27% 50
372 2016 32,658,271 12% 266,738,245 14,693,316 108,112,698 12% 45% 48
372 Diferenta / Difference (%) 8% 20% 32% 14% 4%
373 ECOPAPER S.R.L. 2017 35,336,991 15% 237,178,451 11,027,338 176,555,723 5% 65% 212
373 2016 19,279,785 13% 151,547,433 3,027,897 166,992,401 1% 66% 198
373 Diferenta / Difference (%) 83% 57% 264% 6% 7%
374 BRĂILA PROMENADA MALL SRL 2017 35,172,133 115% 30,514,025 (5,409,203) 61,246,050 -9% 85% 0
374 2016 16,112,527 59% 27,327,951 (24,455,851) 43,735,214 -56% 88% 1
374 Diferenta / Difference (%) 118% 12% -78% 40% -100%
375 DELTA INVEST SRL 2017 35,040,753 18% 192,257,785 25,481,676 104,684,258 22% 48% 565
375 2016 27,526,665 19% 142,201,445 19,413,099 87,304,444 19% 52% 503
375 Diferenta / Difference (%) 27% 35% 31% 20% 12%
Page 26
Ordine dupa
EBITDA 2017Denumire companie AN EBITDA
Marja
EBITDA (%)Cifra de afaceri Rezultat Brut Capitaluri Proprii
Rentabilitatea
capitalului
propriu
Levier Financiar Nr. de angajati
Position by
EBITDA 2017Company Name year EBITDA
EBITDA
Margin (%)Net Turnover Profit/Loss Before Tax Shareholders Equity
Return on
EquityLeverage
Number of
Employees
376 MEWI IMPORT EXPORT AGRAR INDUSTRIETECHNIK SRL2017 35,033,114 11% 315,949,629 31,412,519 120,152,122 22% 12% 162
376 2016 25,015,858 9% 273,372,610 22,961,974 93,183,158 21% 27% 140
376 Diferenta / Difference (%) 40% 16% 37% 29% 16%
377 TTS ( TRANSPORT TRADE SERVICES ) SA 2017 35,004,279 11% 312,294,991 21,813,118 215,684,695 8% 24% 107
377 2016 17,545,349 6% 275,797,694 13,450,022 246,789,763 5% 20% 108
377 Diferenta / Difference (%) 100% 13% 62% -13% -1%
378 CORINTHIAN FIVE SRL 2017 34,962,972 57% 60,924,016 (675,395) 363,826,824 0% 52% 2
378 2016 19,371,941 45% 42,915,874 1,128,539 341,502,420 0% 54% 2
378 Diferenta / Difference (%) 80% 42% -160% 7% 0%
379 PREMIUM LEASING SRL 2017 34,961,069 67% 52,362,320 122,370 25,341,675 0% 84% 26
379 2016 27,473,452 60% 45,765,414 2,662,701 25,238,048 9% 80% 24
379 Diferenta / Difference (%) 27% 14% -95% 0% 8%
380 PUROLITE SRL 2017 34,945,789 17% 206,645,558 19,845,467 127,786,750 13% 27% 271
380 2016 27,175,795 16% 174,763,728 8,020,916 105,054,093 6% 34% 264
380 Diferenta / Difference (%) 29% 18% 147% 22% 3%
381 A & S INTERNATIONAL 2000 SRL 2017 34,753,218 73% 47,490,177 28,190,024 87,226,444 28% 17% 116
381 2016 18,002,409 30% 59,180,496 6,338,233 62,766,711 9% 28% 215
381 Diferenta / Difference (%) 93% -20% 345% 39% -46%
382 CITY GATE BUCHAREST SRL 2017 34,711,244 124% 28,082,986 17,296,849 135,206,350 13% 61% NULL
382 2016 16,262,425 58% 28,248,551 2,094,398 (56,348,666) -4% 136% NULL
382 Diferenta / Difference (%) 113% -1% 726% -340%
383 BIOCHEM SRL 2017 34,548,439 13% 261,576,928 29,875,287 111,130,616 23% 64% 94
383 2016 33,516,296 15% 218,050,016 27,223,286 92,523,073 26% 61% 81
383 Diferenta / Difference (%) 3% 20% 10% 20% 16%
384 SHOPPING CITY TIMIŞOARA SRL 2017 34,533,035 58% 59,194,315 (31,591,877) 214,314,598 -15% 63% NULL
384 2016 16,181,851 38% 42,303,495 (37,776,096) 85,977,041 -44% 84% NULL
384 Diferenta / Difference (%) 113% 40% -16% 149%
385 PORSCHE INTER AUTO ROMANIA SRL 2017 34,369,372 3% 1,113,890,284 18,953,382 42,523,412 31% 72% 474
385 2016 23,239,978 2% 948,102,478 11,631,395 37,898,545 22% 74% 455
385 Diferenta / Difference (%) 48% 17% 63% 12% 4%
386 TORO MANUFACTURING AND SALES SRL 2017 34,147,967 37% 92,406,841 27,897,922 111,627,023 21% 12% 103
386 2016 NULL 96,327,280 24,820,508 93,433,373 22% 7% 107
386 Diferenta / Difference (%) -4% 12% 19% -4%
387 ALUM SA 2017 33,831,448 5% 636,079,551 13,429,115 253,138,523 5% 48% 725
387 2016 (15,927,014) -3% 556,144,083 (16,632,600) 240,058,602 -7% 49% 711
387 Diferenta / Difference (%) -312% 14% -181% 5% 2%
388 HORNBACH CENTRALA SRL 2017 33,762,693 5% 697,095,548 22,757,934 133,241,523 13% 47% 648
388 2016 22,635,012 4% 636,786,050 14,635,128 116,504,086 11% 52% 724
388 Diferenta / Difference (%) 49% 9% 56% 14% -10%
389 OLTYRE SRL 2017 33,758,718 26% 130,938,927 21,012,675 46,816,863 40% 86% 126
389 2016 36,127,331 35% 104491517 17,851,104 50,134,391 30% 85% 98
389 Diferenta / Difference (%) -7% 25% 18% -7% 29%
390 PLOIESTI SHOPPING CITY SRL 2017 33,713,095 98% 34,277,569 (2,555,596) 198,856,244 -1% 62% 11
390 2016 30,401,363 96% 31,788,548 (7,744,699) 60,918,164 -13% 85% 11
390 Diferenta / Difference (%) 11% 8% -67% 226% 0%
Page 27
Ordine dupa
EBITDA 2017Denumire companie AN EBITDA
Marja
EBITDA (%)Cifra de afaceri Rezultat Brut Capitaluri Proprii
Rentabilitatea
capitalului
propriu
Levier Financiar Nr. de angajati
Position by
EBITDA 2017Company Name year EBITDA
EBITDA
Margin (%)Net Turnover Profit/Loss Before Tax Shareholders Equity
Return on
EquityLeverage
Number of
Employees
391 METALIMPEX ROMANIA SRL 2017 33,674,617 12% 275,269,014 32,625,666 46,441,189 59% 33% 117
391 2016 15,448,005 8% 192,352,012 12,288,988 30,265,467 33% 38% 112
391 Diferenta / Difference (%) 118% 43% 165% 53% 4%
392 PRYSMIAN CABLURI ŞI SISTEME SA 2017 33,453,464 4% 866,284,789 14,371,745 181,423,215 6% 66% 688
392 2016 31,013,500 5% 662,929,910 11,091,221 170,632,145 4% 55% 423
392 Diferenta / Difference (%) 8% 31% 30% 6% 63%
393 EXPERT PETROLEUM SRL 2017 33,437,907 34% 99,805,178 17,163,247 32,588,118 53% 67% 372
393 2016 21,180,465 23% 92,622,216 724,260 15,424,871 5% 82% 393
393 Diferenta / Difference (%) 58% 8% 2270% 111% -5%
394 SEFAR SRL 2017 33,419,961 26% 130,686,469 21,833,506 182,520,823 10% 14% 271
394 2016 24,059,298 25% 97,904,498 13,011,871 163,924,893 7% 11% 252
394 Diferenta / Difference (%) 39% 33% 68% 11% 8%
395 RUS-SAVITAR SRL 2017 33,281,790 24% 138,879,093 23,512,756 92,923,156 23% 36% 710
395 2016 32,917,013 26% 128,602,818 23,720,412 73,461,622 28% 44% 663
395 Diferenta / Difference (%) 1% 8% -1% 26% 7%
396 DANLIN XXL SRL 2017 33,162,860 37% 88,866,112 18,614,660 70,642,763 24% 20% 140
396 2016 36,341,774 40% 91,063,503 25,428,133 63,538,746 38% 16% 136
396 Diferenta / Difference (%) -9% -2% -27% 11% 3%
397 INTERACTIVE SYSTEMS & BUSINESS DEVELOPMENT SRL 2017 33,078,690 98% 33,797,386 32,611,173 27,491,587 100% 0% 3
397 2016 3,256,016 70% 4,652,687 3,244,922 2,739,528 100% 29% 3
397 Diferenta / Difference (%) 916% 626% 905% 904% 0%
398 LUXTEN LIGHTING COMPANY SA 2017 32,966,563 18% 179,762,757 19,364,090 317,198,692 5% 18% 346
398 2016 25,914,667 17% 153,869,781 20,359,349 337,506,736 5% 19% 370
398 Diferenta / Difference (%) 27% 17% -5% -6% -6%
399 ROMANIA HYPERMARCHE SA 2017 32,930,550 2% 1,772,976,330 6,390,806 60,132,543 6% 85% 3,951
399 2016 23,732,083 1% 1,744,276,944 (4,146,999) 57,192,664 -10% 85% 4,316
399 Diferenta / Difference (%) 39% 2% -254% 5% -8%
400 HONEST GENERAL TRADING SRL 2017 32,882,423 18% 180,642,779 32,037,928 183,115,921 15% 25% 337
400 2016 29,661,893 19% 154,600,942 25,195,479 157,506,845 13% 25% 326
400 Diferenta / Difference (%) 11% 17% 27% 16% 3%
401 SOLAREX IMPEX SRL 2017 32,812,402 27% 122,032,174 29,495,252 135,463,223 19% 13% 118
401 2016 30,488,804 27% 111,891,346 27,747,539 114,470,264 21% 13% 117
401 Diferenta / Difference (%) 8% 9% 6% 18% 1%
402 KROMBERG & SCHUBERT ROMÂNIA ME SRL 2017 32,804,288 5% 652,441,727 11,381,697 53,734,330 18% 69% 4,292
402 2016 34,216,940 5% 709,111,427 13,809,130 48,887,566 25% 73% 4,696
402 Diferenta / Difference (%) -4% -8% -18% 10% -9%
403 INDUSTRIAL ACCESS SA 2017 32,683,588 40% 81,689,221 14,642,522 46,941,054 28% 48% 103
403 2016 20,985,732 48% 44,061,443 7,024,327 33,900,517 20% 50% 70
403 Diferenta / Difference (%) 56% 85% 108% 38% 47%
404 LAKEVIEW OFFICE BUILDING SRL 2017 32,641,376 105% 31,185,897 55,507 129,357,910 0% 63% 0
404 2016 25,290,821 86% 29,419,518 (7,619,269) 105,659,149 -7% 68% 0
404 Diferenta / Difference (%) 29% 6% -101% 22%
405 BANVIT FOODS SRL 2017 32,525,584 20% 158,661,577 15,110,269 223,774,376 6% 3% 173
405 2016 33,050,794 23% 143,418,907 19,496,204 212,239,748 9% 4% 136
405 Diferenta / Difference (%) -2% 11% -22% 5% 27%
Page 28
Ordine dupa
EBITDA 2017Denumire companie AN EBITDA
Marja
EBITDA (%)Cifra de afaceri Rezultat Brut Capitaluri Proprii
Rentabilitatea
capitalului
propriu
Levier Financiar Nr. de angajati
Position by
EBITDA 2017Company Name year EBITDA
EBITDA
Margin (%)Net Turnover Profit/Loss Before Tax Shareholders Equity
Return on
EquityLeverage
Number of
Employees
406 FORMENS SRL 2017 32,386,400 10% 322,402,131 25,339,735 79,300,859 27% 57% 1,093
406 2016 27,946,140 11% 245,221,657 23,742,607 72,259,263 27% 53% 1,015
406 Diferenta / Difference (%) 16% 31% 7% 10% 8%
407 MASSIMO DUTTI RO SRL 2017 32,334,210 25% 126,957,761 26,905,072 32,946,780 68% 21% 134
407 2016 32,610,304 29% 111,685,781 28,620,110 34,260,030 70% 19% 120
407 Diferenta / Difference (%) -1% 14% -6% -4% 12%
408 LA FÂNTÂNA SRL 2017 32,173,735 17% 188,353,435 (15,570,913) 199,105,190 -9% 56% 750
408 2016 (2,250,677) -154% 1,465,217 (3,198,002) 88,896,974 -4% 49% 15
408 Diferenta / Difference (%) -1530% 12755% 387% 124% 4900%
409 FERMADOR SRL 2017 32,091,958 24% 136,139,532 17,746,593 88,554,944 18% 39% 426
409 2016 21,450,945 18% 121,816,481 10,388,432 74,667,157 13% 35% 386
409 Diferenta / Difference (%) 50% 12% 71% 19% 10%
410 WEST GATE SRL 2017 32,073,989 61% 53,010,623 17,873,071 55,691,234 27% 77% 1
410 2016 33,192,234 68% 48,754,588 21,497,147 40,479,167 52% 82% 1
410 Diferenta / Difference (%) -3% 9% -17% 38% 0%
411 NETWORK ONE DISTRIBUTION SRL 2017 32,045,454 3% 1,088,522,362 20,386,637 87,616,571 20% 79% 302
411 2016 33,716,768 3% 993,600,367 11,887,659 79,385,533 12% 79% 277
411 Diferenta / Difference (%) -5% 10% 71% 10% 9%
412 VARD BRĂILA S.A. 2017 32,005,210 22% 148,692,260 28,973,777 258,565,438 11% 40% 1,559
412 2016 (8,852,119) -5% 170,856,188 (17,129,077) 230,677,854 -7% 31% 1,390
412 Diferenta / Difference (%) -462% -13% -269% 12% 12%
413 EDEN CAPITAL DEVELOPMENT SRL 2017 31,986,091 36% 89,022,057 32,371,981 93,668,118 29% 39% 36
413 2016 51,872,407 47% 111,151,017 51,048,340 66,175,574 65% 44% 33
413 Diferenta / Difference (%) -38% -20% -37% 42% 9%
414 NETCITY TELECOM SRL 2017 31,889,209 75% 42,293,714 21,339,960 40,110,759 45% 73% 22
414 2016 29,826,591 71% 41,854,780 20,683,313 110,583,160 16% 19% 22
414 Diferenta / Difference (%) 7% 1% 3% -64% 0%
415 BMW VERTRIEBS GMBH SALZBURG SUCURSALA BUCURESTI 2017 31,844,991 5% 700,339,841 28,878,209 36,013,337 66% 83% 30
415 2016 NULL 641,874,414 5,687,339 14,145,371 32% 90% 22
415 Diferenta / Difference (%) 9% 408% 155% 36%
416 PANDUIT EUROPEAN SOLUTIONS SRL 2017 31,813,045 19% 163,332,742 25,378,183 38,658,297 61% 62% 483
416 2016 16,882,075 18% 94,438,123 11,453,678 16,911,767 58% 81% 278
416 Diferenta / Difference (%) 88% 73% 122% 129% 74%
417 ALSTOM TRANSPORT SA 2017 31,568,101 10% 304,462,967 14,992,795 123,897,239 7% 67% 441
417 2016 13,148,783 4% 369,605,893 172,694 114,863,451 0% 73% 456
417 Diferenta / Difference (%) 140% -18% 8582% 8% -3%
418 FABRYO CORPORATION SRL 2017 31,501,014 15% 215,628,206 20,104,682 58,004,584 27% 67% 355
418 2016 33,812,339 16% 207,044,971 26,967,032 69,731,444 33% 57% 373
418 Diferenta / Difference (%) -7% 4% -25% -17% -5%
419 PROCEMA - INSTITUT DE CERCETARE, PROIECTARE SI PRODUCTIE EXPERIMENTALA IN DOMENIUL CONSTRUCTIILOR SI AL MATERIALELOR DE CONSTRUCTII SA2017 31,469,943 15% 213,524,045 26,674,113 201,287,474 11% 33% 156
419 2016 13,128,558 7% 181,051,042 7,247,928 203,410,152 3% 31% 138
419 Diferenta / Difference (%) 140% 18% 268% -1% 13%
420 ROTAR RESIDENCE SRL 2017 31,369,442 27% 116,373,944 31,236,280 49,508,029 53% 62% 8
420 2016 19,795,027 0 18,851,997 8,125,034 201% 90% 6
420 Diferenta / Difference (%) 58% 66% 509% 33%
Page 29
Ordine dupa
EBITDA 2017Denumire companie AN EBITDA
Marja
EBITDA (%)Cifra de afaceri Rezultat Brut Capitaluri Proprii
Rentabilitatea
capitalului
propriu
Levier Financiar Nr. de angajati
Position by
EBITDA 2017Company Name year EBITDA
EBITDA
Margin (%)Net Turnover Profit/Loss Before Tax Shareholders Equity
Return on
EquityLeverage
Number of
Employees
421 HANNER RD SRL 2017 31,342,997 35% 89,251,554 28,444,438 45,770,860 62% 33% 2
421 2016 3,472,524 11% 32,507,911 (2,769,011) 17,331,576 -20% 80% NULL
421 Diferenta / Difference (%) 803% 175% -1127% 164%
422 GUHRING SRL 2017 31,232,919 25% 125,754,855 10,500,148 113,322,254 9% 39% 263
422 2016 22,342,551 20% 111,905,780 9,479,091 103,064,265 7% 30% 236
422 Diferenta / Difference (%) 40% 12% 11% 10% 11%
423 AGROTEX SRL 2017 31,164,806 9% 358,202,881 30,138,893 175,390,653 15% 38% 69
423 2016 30,847,012 11% 277,244,932 29,467,644 149,377,499 17% 33% 66
423 Diferenta / Difference (%) 1% 29% 2% 17% 5%
424 MACON SRL 2017 31,055,440 21% 148,561,106 13,225,646 66,851,386 19% 61% 599
424 2016 15,445,518 12% 123,983,648 (7,514,083) 43,340,663 -17% 73% 593
424 Diferenta / Difference (%) 101% 20% -276% 54% 1%
425 HELP NET FARMA SA 2017 31,037,806 5% 585,643,731 24,867,790 66,720,102 31% 78% 1,495
425 2016 35,292,190 6% 549,900,156 29,601,906 52,622,310 47% 81% 1,452
425 Diferenta / Difference (%) -12% 7% -16% 27% 3%
426 GREENFIBER INTERNATIONAL SA 2017 30,890,890 11% 282,434,249 28,367,013 154,221,379 18% 59% 638
426 2016 38,861,380 14% 280,768,986 33,946,350 135,636,013 22% 44% 596
426 Diferenta / Difference (%) -21% 1% -16% 14% 7%
427 OTELINOX SA 2017 30,865,210 19% 158,307,651 8,798,181 205,984,840 3% 11% 686
427 2016 30,532,534 20% 153,803,789 6,949,521 198,905,042 3% 10% 699
427 Diferenta / Difference (%) 1% 3% 27% 4% -2%
428 SARANTIS ROMANIA SA 2017 30,665,167 10% 298,426,277 28,371,734 69,601,837 34% 43% 224
428 2016 26,561,753 10% 258,666,033 25,228,748 55,173,965 37% 48% 226
428 Diferenta / Difference (%) 15% 15% 12% 26% -1%
429 SOMESUL CALD PRODUCTIE SRL 2017 30,660,731 56% 54,730,226 30,533,457 38,616,189 67% 28% 11
429 2016 14,252,588 50% 28,773,967 14,085,130 22,189,807 54% 27% 11
429 Diferenta / Difference (%) 115% 90% 117% 74% 0%
430 BUILD CORP SRL 2017 30,615,282 32% 96,063,312 20,400,998 30,281,062 53% 61% 72
430 2016 8,282,840 5% 169,833,584 10,482,441 20,345,152 44% 75% 62
430 Diferenta / Difference (%) 270% -43% 95% 49% 16%
431 CTPARK BUCHAREST SRL 2017 30,542,674 79% 38,668,274 (1,065,281) 140,752,814 -1% 70% 0
431 2016 29,064,090 89% 32,817,140 2,879,647 84,422,986 3% 80% 0
431 Diferenta / Difference (%) 5% 18% -137% 67%
432 COMFERT SRL 2017 30,520,925 5% 561,197,474 21,980,624 2,858,011 745% 99% 239
432 2016 26,893,663 5% 496,614,574 16,842,485 (18,440,254) -91% 107% 219
432 Diferenta / Difference (%) 13% 13% 31% -115% 9%
433 ELIT SRL 2017 30,518,328 8% 381,702,605 22,951,986 69,606,006 28% 48% 1,446
433 2016 47,668,930 14% 339,218,546 39,498,770 117,363,837 29% 30% 1,173
433 Diferenta / Difference (%) -36% 13% -42% -41% 23%
434 BIP FRONT 87 SRL 2017 30,473,953 122469% 24,883 30,175,595 (3,007,286) -990% 105% 1
434 2016 278,881 87% 319,807 285,485 (32,779,947) -1% 176% NULL
434 Diferenta / Difference (%)10827% -92% 10470% -91%
435 KARELIA - UPOFLOOR SRL 2017 30,411,550 17% 179,626,457 13,499,780 (7,238,749) -136% 105% 382
435 2016 11,426,774 8% 141,695,590 (3,480,073) (17,092,704) 26% 114% 341
435 Diferenta / Difference (%) 166% 27% -488% -58% 12%
Page 30
Ordine dupa
EBITDA 2017Denumire companie AN EBITDA
Marja
EBITDA (%)Cifra de afaceri Rezultat Brut Capitaluri Proprii
Rentabilitatea
capitalului
propriu
Levier Financiar Nr. de angajati
Position by
EBITDA 2017Company Name year EBITDA
EBITDA
Margin (%)Net Turnover Profit/Loss Before Tax Shareholders Equity
Return on
EquityLeverage
Number of
Employees
436 DEVA SHOPPING CITY S.R.L. 2017 30,351,018 72% 42,091,695 (8,413,614) 57,925,225 -15% 84% NULL
436 2016 23,355,512 59% 39,726,125 (16,471,906) 26,255,894 -63% 92% NULL
436 Diferenta / Difference (%) 30% 6% -49% 121%
437 WIN MAGAZIN SA 2017 30,283,951 71% 42,680,054 15,916,800 421,909,205 3% 2% 0
437 2016 27,974,033 70% 39,967,073 7,597,554 428,587,830 1% 1% 0
437 Diferenta / Difference (%) 8% 7% 109% -2%
438 HAMMERER ALUMINIUM INDUSTRIES SANTANA SRL 2017 30,283,932 6% 508,939,928 15,456,266 64,633,082 20% 71% 117
438 2016 23,531,869 5% 508,041,518 9,397,660 51,516,987 15% 75% 115
438 Diferenta / Difference (%) 29% 0% 64% 25% 2%
439 CELCO SA 2017 30,149,539 26% 115,720,751 24,117,294 188,936,633 11% 4% 288
439 2016 26,466,343 25% 107,441,517 19,960,077 172,274,346 11% 5% 285
439 Diferenta / Difference (%) 14% 8% 21% 10% 1%
440 SEPHORA COSMETICS ROMANIA S.A. 2017 30,123,205 13% 229,384,509 21,731,893 56,397,039 31% 47% 311
440 2016 25,128,891 13% 194,402,310 17,703,983 38,728,366 37% 54% 293
440 Diferenta / Difference (%) 20% 18% 23% 46% 6%
441 CER CLEANING EQUIPMENT SRL 2017 30,097,379 13% 232,225,532 10,130,297 75,449,506 12% 51% 265
441 2016 (4,093,272) -25% 16,587,634 (7,950,811) 66,549,251 -12% 41% 81
441 Diferenta / Difference (%) -835% 1300% -227% 13% 227%
442 CASA NOASTRA S.A. 2017 29,920,522 11% 274,120,150 15,416,495 56,666,144 23% 79% 1,174
442 2016 26,812,376 12% 218,593,982 16,482,793 39,546,691 37% 81% 1,071
442 Diferenta / Difference (%) 12% 25% -6% 43% 10%
443 NGY PROPERTIERS INVESTMENT SRL 2017 29,869,667 77% 38,582,832 11,782,533 (35,523,878) -33% 108% NULL
443 2016 2,692,197 15% 18,308,440 (7,545,205) (46,271,114) 16% 110% NULL
443 Diferenta / Difference (%) 1009% 111% -256% -23%
444 SOCIETATEA FILIALA DE INTRETINERE SI SERVICII ENERGETICE "ELECTRICA SERV" S.A.2017 29,834,339 8% 362,507,449 18,494,574 273,739,654 7% 18% 2,117
444 2016 17,771,515 5% 366,534,308 4,563,059 229,323,121 2% 31% 2,890
444 Diferenta / Difference (%) 68% -1% 305% 19% -27%
445 TRIMSOL ROMÂNIA SRL 2017 29,791,706 14% 213,031,195 28,085,725 54,673,864 44% 24% 921
445 2016 23,246,925 10% 228,569,455 21,714,931 41,980,094 45% 35% 818
445 Diferenta / Difference (%) 28% -7% 29% 30% 13%
446 PIONEER HI - BRED SEEDS AGRO SRL 2017 29,694,297 11% 267,918,860 21,744,230 242,276,627 8% 30% 108
446 2016 29,896,624 13% 229,587,345 18,767,054 223,125,341 8% 28% 110
446 Diferenta / Difference (%) -1% 17% 16% 9% -2%
447 ROM PACK MANAGEMENT S.A. 2017 29,672,127 31% 97,224,860 29,067,416 24,861,371 98% 34% 11
447 2016 NULL 63,119,114 21,540,004 18,512,835 98% 48% 7
447 Diferenta / Difference (%) 54% 35% 34% 57%
448 NTT DATA ROMANIA S.A. 2017 29,644,284 12% 238,846,992 23,623,305 66,196,577 31% 34% 902
448 2016 22,282,796 14% 163,059,819 17,863,322 52,587,067 29% 22% 646
448 Diferenta / Difference (%) 33% 46% 32% 26% 40%
449 VOLVO ROMANIA SRL 2017 29,640,870 10% 284,973,800 21,156,327 68,643,756 26% 50% 228
449 2016 18,758,158 8% 243,706,989 11,633,784 57,945,445 16% 48% 220
449 Diferenta / Difference (%) 58% 17% 82% 18% 4%
450 DIRECT ONE SA 2017 29,606,805 62% 47,891,926 15,254,082 83,584,411 15% 45% 36
450 2016 29,086,066 64% 45,524,014 18,895,683 75,929,992 21% 33% 30
450 Diferenta / Difference (%) 2% 5% -19% 10% 20%
Page 31
Ordine dupa
EBITDA 2017Denumire companie AN EBITDA
Marja
EBITDA (%)Cifra de afaceri Rezultat Brut Capitaluri Proprii
Rentabilitatea
capitalului
propriu
Levier Financiar Nr. de angajati
Position by
EBITDA 2017Company Name year EBITDA
EBITDA
Margin (%)Net Turnover Profit/Loss Before Tax Shareholders Equity
Return on
EquityLeverage
Number of
Employees
451 ACCENTURE SERVICES SRL 2017 29,584,635 11% 278,047,198 22,146,459 48,698,802 36% 44% 1,761
451 2016 23,082,782 10% 225,012,015 12,311,300 31,005,640 31% 59% 1,538
451 Diferenta / Difference (%) 28% 24% 80% 57% 14%
452 EUROPEAN INTERIOR SRL 2017 29,478,782 18% 164,498,387 27,827,549 23,513,034 100% 60% 367
452 2016 28,487,009 16% 174,510,376 26,178,793 21,789,134 100% 63% 386
452 Diferenta / Difference (%) 3% -6% 6% 8% -5%
453 M LOGISTIC DISTRIBUTION SRL 2017 29,462,796 270% 10,916,582 25,311,384 16,319,054 133% 0% 0
453 2016 5,070,156 43% 11,901,482 970,935 (5,363,473) -13% 109% NULL
453 Diferenta / Difference (%) 481% -8% 2507% -404%
454 DNATA CATERING SRL 2017 29,428,879 30% 99,578,313 25,891,794 30,409,172 80% 39% 576
454 2016 26,230,244 29% 90,055,720 22,743,393 28,889,679 64% 44% 565
454 Diferenta / Difference (%) 12% 11% 14% 5% 2%
455 SAVINI DUE SRL 2017 29,417,113 25% 117,415,651 11,345,325 26,375,028 36% 65% 379
455 2016 30,899,128 28% 111,568,072 12,621,172 20,633,392 51% 67% 341
455 Diferenta / Difference (%) -5% 5% -10% 28% 11%
456 UNITED ROMANIAN BREWERIES BEREPROD SRL 2017 29,392,403 7% 392,402,408 (2,794,711) 116,622,261 -2% 75% 366
456 2016 37,894,762 10% 373,458,620 10,474,305 119,416,973 7% 73% 318
456 Diferenta / Difference (%) -22% 5% -127% -2% 15%
457 REDOXIM SRL 2017 29,354,249 9% 337,767,388 16,362,109 98,355,943 13% 40% 219
457 2016 46,867,313 14% 335,915,946 33,910,414 125,734,868 22% 32% 200
457 Diferenta / Difference (%) -37% 1% -52% -22% 10%
458 HEWLETT PACKARD ENTERPRISE ROMANIA SRL 2017 29,354,126 21% 140,732,725 17,430,147 37,647,428 32% 57% 134
458 2016 (1,100) 0 (1,100) 116,400 -1% 0
458 Diferenta / Difference (%)-2668657% -1584659% 32243%
459 AVX ELECTRONICS SENSING AND CONTROL SRL 2017 29,335,730 14% 215,132,619 19,536,073 23,913,820 67% 79% 409
459 2016 6,091,886 3% 180,309,575 (2,290,231) 7,984,951 -29% 90% 398
459 Diferenta / Difference (%) 382% 19% -953% 199% 3%
460 AMROM INDUSTRIAL PARK SRL 2017 29,318,659 1206% 2,431,579 28,856,360 24,239,054 100% 16% 3
460 2016 2,475,771 91% 2,715,642 2,114,627 31,269,031 6% 1% 3
460 Diferenta / Difference (%) 1084% -10% 1265% -22% 0%
461 DAS SRL 2017 29,311,361 22% 135,960,494 28,536,300 75,946,654 32% 31% 264
461 2016 11,233,257 8% 132,391,706 10,102,896 62,455,998 13% 50% 269
461 Diferenta / Difference (%) 161% 3% 182% 22% -2%
462 JLG MANUFACTURING CENTRAL EUROPE SRL 2017 29,259,204 10% 302,704,876 25,025,453 80,985,998 27% 10% 404
462 2016 9,759,345 3% 291,868,345 8,210,332 59,195,947 10% 43% 375
462 Diferenta / Difference (%) 200% 4% 205% 37% 8%
463 RAAL SA 2017 29,243,806 10% 279,467,526 9,363,980 98,181,765 8% 68% 2,004
463 2016 24,564,761 11% 233,248,311 10,786,127 92,291,364 11% 66% 1,808
463 Diferenta / Difference (%) 19% 20% -13% 6% 11%
464 INTERAGROALIMENT SRL 2017 29,216,825 10% 282,170,997 25,543,026 41,113,880 55% 78% 166
464 2016 7,282,117 4% 185,069,102 8,231,391 18,449,198 39% 87% 224
464 Diferenta / Difference (%) 301% 52% 210% 123% -26%
465 IMPRIMERIA BANCII NATIONALE A ROMANIEI RA 2017 29,212,641 36% 80,365,098 20,005,983 70,176,345 24% 14% 139
465 2016 32,201,811 39% 81,616,931 21,994,763 70,277,201 26% 25% 140
465 Diferenta / Difference (%) -9% -2% -9% 0% -1%
Page 32
Ordine dupa
EBITDA 2017Denumire companie AN EBITDA
Marja
EBITDA (%)Cifra de afaceri Rezultat Brut Capitaluri Proprii
Rentabilitatea
capitalului
propriu
Levier Financiar Nr. de angajati
Position by
EBITDA 2017Company Name year EBITDA
EBITDA
Margin (%)Net Turnover Profit/Loss Before Tax Shareholders Equity
Return on
EquityLeverage
Number of
Employees
466 SISTEME DE PRODUCTIE CABLAJE SRL 2017 29,103,289 11% 275,825,491 14,490,062 34,385,944 39% 68% 4,215
466 2016 17,396,840 11% 155,359,206 8,854,137 21,056,409 42% 79% 3,844
466 Diferenta / Difference (%) 67% 78% 64% 63% 10%
467 ALTIUS SRL 2017 29,037,613 32% 91,010,748 30,228,290 36,636,773 71% 18% 80
467 2016 25,598,184 31% 81,882,576 26,604,783 49,529,801 46% 16% 79
467 Diferenta / Difference (%) 13% 11% 14% -26% 1%
468 MGI COUTIER ROM SRL 2017 28,975,524 8% 359,936,867 19,341,082 131,261,379 12% 30% 694
468 2016 49,935,952 15% 332,809,262 41,444,773 115,010,074 31% 35% 589
468 Diferenta / Difference (%) -42% 8% -53% 14% 18%
469 WESTGATE ROMANIA SRL 2017 28,940,384 25% 114,747,931 26,934,491 23,996,049 94% 31% 393
469 2016 21,138,078 34% 61,688,541 19,493,975 17,570,810 93% 41% 76
469 Diferenta / Difference (%) 37% 86% 38% 37% 417%
470 UNITED SHIPPING AGENCY S.R.L. 2017 28,936,556 44% 65,608,805 19,577,384 149,800,219 11% 16% 250
470 2016 20,265,195 35% 58,407,623 8,220,976 153,770,776 4% 20% 281
470 Diferenta / Difference (%) 43% 12% 138% -3% -11%
471 BLACK SEA SUPPLIERS SRL 2017 28,779,600 7% 416,912,778 12,078,588 33,620,848 30% 90% 565
471 2016 25,217,950 7% 372,876,622 11,587,768 23,531,668 41% 92% 565
471 Diferenta / Difference (%) 14% 12% 4% 43% 0%
472 CELESTICA ( ROMANIA ) SRL 2017 28,740,799 3% 1,149,043,844 12,147,373 200,220,832 6% 75% 1,240
472 2016 44,278,547 4% 1,148,680,414 5,050,606 75,064,118 7% 87% 878
472 Diferenta / Difference (%) -35% 0% 141% 167% 41%
473 VERNICOLOR S.A. 2017 28,699,913 16% 175,835,765 23,023,898 40,402,024 49% 48% 782
473 2016 15,916,613 11% 138,997,499 10,179,169 22,771,200 42% 71% 564
473 Diferenta / Difference (%) 80% 27% 126% 77% 39%
474 FRESENIUS NEPHROCARE ROMANIA SRL 2017 28,693,847 10% 276,612,077 19,771,419 168,406,990 10% 17% 1080
474 2016 32,123,638 12% 262,575,935 20,997,715 152,276,702 11% 30% 1,057
474 Diferenta / Difference (%) -11% 5% -6% 11% 2%
475 SERMEDIC SRL 2017 28,672,809 5% 558,428,664 20,815,108 47,105,597 38% 83% 12
475 2016 29,795,428 6% 474,765,851 17,115,761 43,160,839 33% 82% 12
475 Diferenta / Difference (%) -4% 18% 22% 9% 0%
476 DELEA VECHE 24 OFFICES S.R.L. 2017 28,668,016 279% 10,273,395 (4,388,944) 6,639,024 -66% 86% 2
476 2016 3,811,344 49% 7,821,463 1,449,524 11,027,968 13% 87% 1
476 Diferenta / Difference (%) 652% 31% -403% -40% 100%
477 RECUNOSTINTA PRODCOM IMPEX SRL 2017 28,644,704 6% 463,940,282 11,121,159 79,044,650 13% 65% 851
477 2016 24,325,776 7% 370,612,550 8,252,005 76,192,294 11% 76% 753
477 Diferenta / Difference (%) 18% 25% 35% 4% 13%
478 ELJ AUTOMOTIVE S.A. 2017 28,641,959 16% 183,342,259 12,471,187 78,646,322 15% 47% 558
478 2016 19,464,801 12% 161,674,238 3,256,173 67,981,353 5% 51% 503
478 Diferenta / Difference (%) 47% 13% 283% 16% 11%
479 SMART DIESEL SRL 2017 28,639,975 3% 942,010,955 24,916,418 35,093,999 62% 62% 85
479 2016 19,847,854 3% 707,028,205 17,463,475 21,313,977 71% 62% 65
479 Diferenta / Difference (%) 44% 33% 43% 65% 31%
480 SANADOR SRL 2017 28,638,417 10% 289,608,194 14,757,847 22,450,929 53% 83% 1,220
480 2016 20,391,656 9% 233,755,926 7,618,239 10,934,806 56% 89% 1,108
480 Diferenta / Difference (%) 40% 24% 94% 105% 10%
Page 33
Ordine dupa
EBITDA 2017Denumire companie AN EBITDA
Marja
EBITDA (%)Cifra de afaceri Rezultat Brut Capitaluri Proprii
Rentabilitatea
capitalului
propriu
Levier Financiar Nr. de angajati
Position by
EBITDA 2017Company Name year EBITDA
EBITDA
Margin (%)Net Turnover Profit/Loss Before Tax Shareholders Equity
Return on
EquityLeverage
Number of
Employees
481 RULMENTI SA 2017 28,619,291 17% 167,831,922 5,509,897 340,065,872 2% 29% 1,254
481 2016 (2,146,415) -2% 119,080,538 (26,330,785) 285,565,670 -9% 34% 1,380
481 Diferenta / Difference (%) -1433% 41% -121% 19% -9%
482 ELIS PAVAJE SRL 2017 28,600,193 18% 161,199,746 9,350,867 55,840,166 16% 67% 375
482 2016 23,404,377 15% 160,567,816 9,360,964 49,133,886 18% 62% 358
482 Diferenta / Difference (%) 22% 0% 0% 14% 5%
483 GERSIM IMPEX SRL 2017 28,562,686 4% 801,660,728 32,701,169 60,603,403 47% 71% 22
483 2016 42,510,420 5% 855,919,777 34,298,759 32,317,690 89% 83% 20
483 Diferenta / Difference (%) -33% -6% -5% 88% 10%
484 GST SAFETY TEXTILES RO SRL 2017 28,528,710 39% 73,943,033 (586,929) 45,885,174 -1% 78% 537
484 2016 23,989,692 53% 45,146,882 1,888,324 46,472,103 2% 75% 403
484 Diferenta / Difference (%) 19% 64% -131% -1% 33%
485 SUINPROD SA 2017 28,513,649 45% 63,063,906 21,770,013 67,899,128 27% 47% 206
485 2016 12,590,737 22% 55,963,090 8,772,161 55,170,545 14% 43% 217
485 Diferenta / Difference (%) 126% 13% 148% 23% -5%
486 SUCEAVA SHOPPING CITY SRL 2017 28,499,566 123% 23,225,454 17,216,624 192,411,890 9% 51% NULL
486 2016 14,594,222 67% 21,941,877 4,946,534 (3,150,589) -144% 102% NULL
486 Diferenta / Difference (%) 95% 6% 248% -6207%
487 VANBET SRL 2017 28,450,755 15% 184,982,439 14,584,127 49,553,352 29% 69% 621
487 2016 21,806,197 14% 154,189,640 10,850,902 37,324,197 28% 65% 628
487 Diferenta / Difference (%) 30% 20% 34% 33% -1%
488 COGEME SET RO SRL 2017 28,439,175 22% 131,945,188 17,623,999 100,868,127 14% 26% 226
488 2016 29,288,754 23% 128,397,978 19,078,085 86,744,771 19% 28% 228
488 Diferenta / Difference (%) -3% 3% -8% 16% -1%
489 EMILIANA WEST ROM SRL 2017 28,426,911 45% 62,558,337 9,993,158 185,901,689 5% 49% 81
489 2016 20,919,978 48% 43,610,006 8,355,333 176,909,050 4% 50% 76
489 Diferenta / Difference (%) 36% 43% 20% 5% 7%
490 CONSTANTA SHOPPING CITY S.R.L. 2017 28,342,956 35% 82,008,535 (16,746,329) (84,650,244) 20% 130% 0
490 2016 (10,144,076) -18% 57,441,892 (40,589,594) (68,733,638) 59% 124% NULL
490 Diferenta / Difference (%) -379% 43% -59% 23%
491 ANDREAS STIHL MOTOUNELTE SRL 2017 28,308,734 17% 166,854,826 26,800,084 68,777,216 33% 21% 30
491 2016 25,742,457 18% 145,369,570 23,811,803 58,148,016 35% 22% 28
491 Diferenta / Difference (%) 10% 15% 13% 18% 7%
492 FARTUD SRL 2017 28,290,154 22% 127,075,273 16,639,031 29,764,867 47% 61% 328
492 2016 29,372,295 26% 113,156,299 18,479,184 46,904,787 34% 38% 275
492 Diferenta / Difference (%) -4% 12% -10% -37% 19%
493 PIPERA BUSINESS PARK SRL 2017 28,269,602 69% 41,039,730 7,374,741 86,251,704 9% 65% NULL
493 2016 27,428,462 69% 39,692,112 9,668,435 95,258,763 10% 65% 1
493 Diferenta / Difference (%) 3% 3% -24% -9%
494 NTN-SNR RULMENŢI SRL 2017 28,269,328 19% 145,486,808 3,178,614 118,590,431 3% 59% 1,098
494 2016 15,531,141 13% 115,419,511 (4,396,234) 115,411,817 -4% 52% 917
494 Diferenta / Difference (%) 82% 26% -172% 3% 20%
495 SKYTOWER BUILDING SRL 2017 28,214,303 68% 41,540,145 (7,394,235) 43,687,658 -17% 90% 0
495 2016 22,527,298 63% 35,516,182 (5,304,990) 51,081,892 -10% 89% NULL
495 Diferenta / Difference (%) 25% 17% 39% -14%
Page 34
Ordine dupa
EBITDA 2017Denumire companie AN EBITDA
Marja
EBITDA (%)Cifra de afaceri Rezultat Brut Capitaluri Proprii
Rentabilitatea
capitalului
propriu
Levier Financiar Nr. de angajati
Position by
EBITDA 2017Company Name year EBITDA
EBITDA
Margin (%)Net Turnover Profit/Loss Before Tax Shareholders Equity
Return on
EquityLeverage
Number of
Employees
496 COMPANIA DE NAVIGATIE FLUVIALA ROMANA NAVROM SA2017 28,182,692 13% 222,872,669 (3,157,185) 373,207,744 -1% 8% 598
496 2016 37,794,037 18% 207,261,219 6,595,651 318,286,199 2% 11% 587
496 Diferenta / Difference (%) -25% 8% -148% 17% 2%
497 INTER CARS ROMÂNIA SRL 2017 28,150,498 3% 846,868,815 24,238,212 29,067,626 71% 93% 385
497 2016 18,174,492 3% 690,763,714 19,523,760 12,729,371 87% 96% 124
497 Diferenta / Difference (%) 55% 23% 24% 128% 210%
498 LA LORRAINE SRL 2017 28,112,549 25% 112,567,241 10,906,367 5378934100.00% 20% 69% 137
498 2016 29,023,838 30% 95,431,747 16,886,374 4305115000.00% 39% 68% 129
498 Diferenta / Difference (%) -3% 18% -35% 25% 6%
499 TRANS EURO EXPRESS 94 SRL 2017 28,051,994 29% 96,713,082 12,335,346 31,184,577 34% 61% 301
499 2016 25,343,081 31% 82,011,293 12,684,504 20,542,188 52% 66% 280
499 Diferenta / Difference (%) 11% 18% -3% 52% 8%
500 ALBALACT SA 2017 27,857,480 5% 589,893,548 11,486,241 138,169,056 6% 47 638
500 2016 33,406,283 6% 527,920,248 17,188,497 120,486,489 14% 48 677
500 Diferenta / Difference (%) -17% 12% -33% 15% -6%