! ( ! ( ! ( ! ( ! ( ! ( ! ( ! ( ! ( ! ( Peninsula South Peninsula North Mainland South Dartmouth North Dartmouth South Dartmouth East Bedford Remainder of CMA Sackville Mainland North Vacancy Rate Vacancy Rate Vacancy Rate Vacancy Rate * CMHC collects data on the primary and secondary rental market annually, in the fall.These data refer to the primary rental market, which only includes rental units in privately- initiated apartment structures containing at least three rental units. The secondary rental market covers rental dwellings that were not originally purpose-built for the rental market, including rental condominiums.The primary vacancy rate and rent level is based on all surveyed structures, while the rent increase is based only on structures common to the survey sample in both the current and previous year. One bedroom Bachelor Two bedroom Three or more bedrooms Avg. Rent PRIMARY RENTAL MARKET (by bedroom type) Avg. Rent Avg. Rent Avg. Rent The overall vacancy rate * ... The average rent is * ... Below CMA Similar to CMA Above CMA Below CMA Similar to CMA Above CMA HOUSING MARKET INFORMATION RENTAL MARKET REPORT Date Released: CANADA MORTGAGE AND HOUSING CORPORATION Halifax CMA 2018 “Strengthening demand continues to outpace the growth in new supply causing the vacancy rate to trend downwards to 1.6%.” Katelyn MacLeod Senior Analyst, Economics 1.5 % 1.7 % 1.5 % 1.3 % $ 1,156 $ 1,355 $ 904 $ 812 DECREASED to 1.6 % $ 1,066 UP by 2.1%
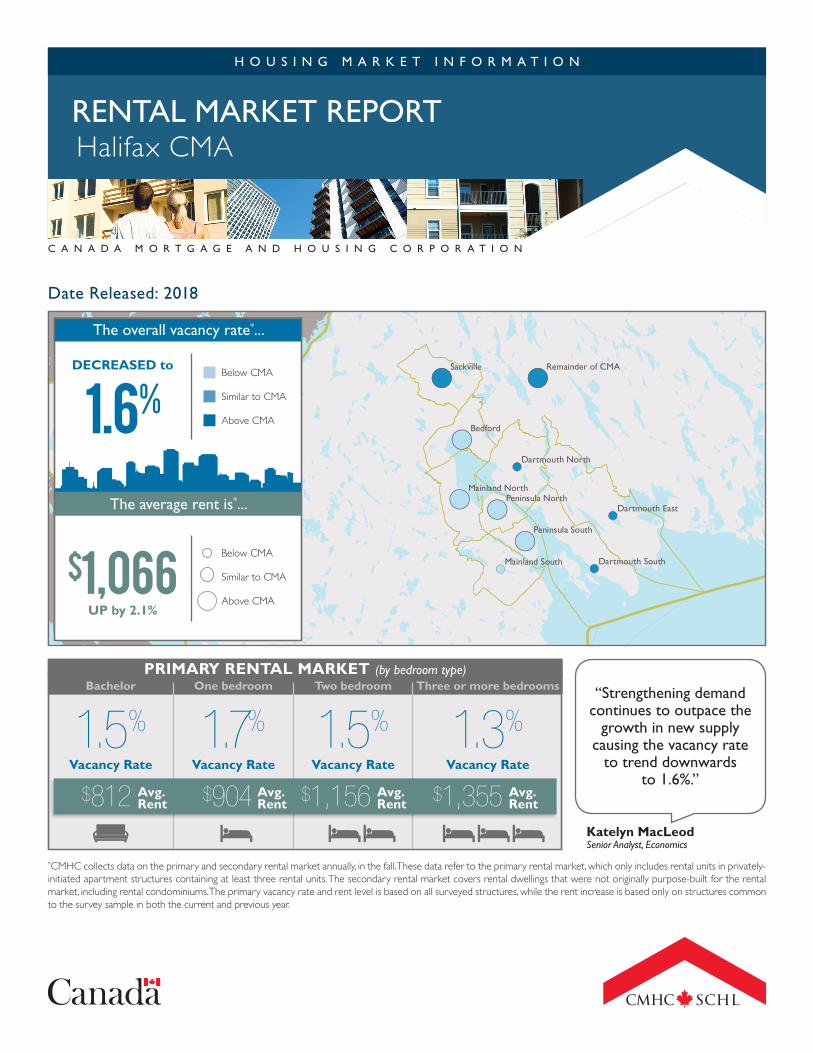
*CMHC collects data on the primary and secondary rental market annually, in the fall. These data refer to the primary rental market, which only includes rental units in privately-initiated apartment structures containing at least three rental units. The secondary rental market covers rental dwellings that were not originally purpose-built for the rental market, including rental condominiums. The primary vacancy rate and rent level is based on all surveyed structures, while the rent increase is based only on structures common to the survey sample in both the current and previous year.
One bedroomBachelor Two bedroom Three or more bedrooms
Avg.Rent
PRIMARY RENTAL MARKET (by bedroom type)
Avg.Rent
Avg.Rent
Avg.Rent
The overall vacancy rate*...
The average rent is*...
Below CMA
Similar to CMA
Above CMA
Below CMA
Similar to CMA
Above CMA
H O U S I N G M A R K E T I N F O R M A T I O N
RENTAL MARKET REPORT
Date Released:
C A N A D A M O R T G A G E A N D H O U S I N G C O R P O R A T I O N
Halifax CMA
2018
“Strengthening demand continues to outpace the
growth in new supply causing the vacancy rate
to trend downwards to 1.6%.”
Katelyn MacLeodSenior Analyst, Economics
1.5% 1.7% 1.5% 1.3%$1,156 $1,355$904$812
DECREASED to
1.6%
$1,066UP by 2.1%
Rental Market Report - Halifax CMA - Date Released - 2018
2
Key Findings �� The vacancy rate continued to
decline, driven by heightened demand in newer and more expensive units
�� New supply added to the universe expands as the number of rental units under construction reaches a historical high
�� Average rents increased across all bedroom types
Vacancy rate declines while new rental supply remains elevatedAccording to the results of Canada Mortgage and Housing Corporation’s Rental Market Survey conducted in October 2018, the overall vacancy rate in the Halifax CMA declined to 1.6% from 2.3% in October 2017.1 The survey zones within Halifax City, which represents 66% of the total rental universe recorded a drop in the vacancy rate, while the opposite trend was apparent in the zones of Dartmouth City.
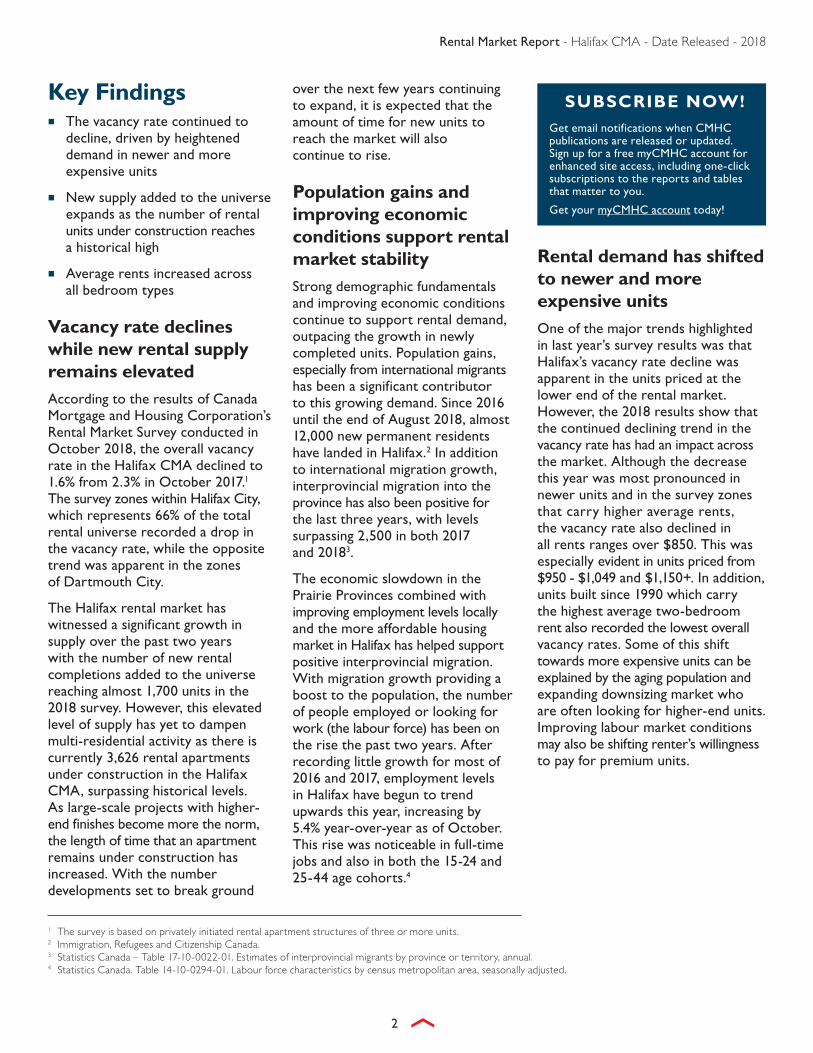
The Halifax rental market has witnessed a significant growth in supply over the past two years with the number of new rental completions added to the universe reaching almost 1,700 units in the 2018 survey. However, this elevated level of supply has yet to dampen multi-residential activity as there is currently 3,626 rental apartments under construction in the Halifax CMA, surpassing historical levels. As large-scale projects with higher-end finishes become more the norm, the length of time that an apartment remains under construction has increased. With the number developments set to break ground
over the next few years continuing to expand, it is expected that the amount of time for new units to reach the market will also continue to rise.
Population gains and improving economic conditions support rental market stability Strong demographic fundamentals and improving economic conditions continue to support rental demand, outpacing the growth in newly completed units. Population gains, especially from international migrants has been a significant contributor to this growing demand. Since 2016 until the end of August 2018, almost 12,000 new permanent residents have landed in Halifax.2 In addition to international migration growth, interprovincial migration into the province has also been positive for the last three years, with levels surpassing 2,500 in both 2017 and 20183.
The economic slowdown in the Prairie Provinces combined with improving employment levels locally and the more affordable housing market in Halifax has helped support positive interprovincial migration. With migration growth providing a boost to the population, the number of people employed or looking for work (the labour force) has been on the rise the past two years. After recording little growth for most of 2016 and 2017, employment levels in Halifax have begun to trend upwards this year, increasing by 5.4% year-over-year as of October. This rise was noticeable in full-time jobs and also in both the 15-24 and 25-44 age cohorts.4
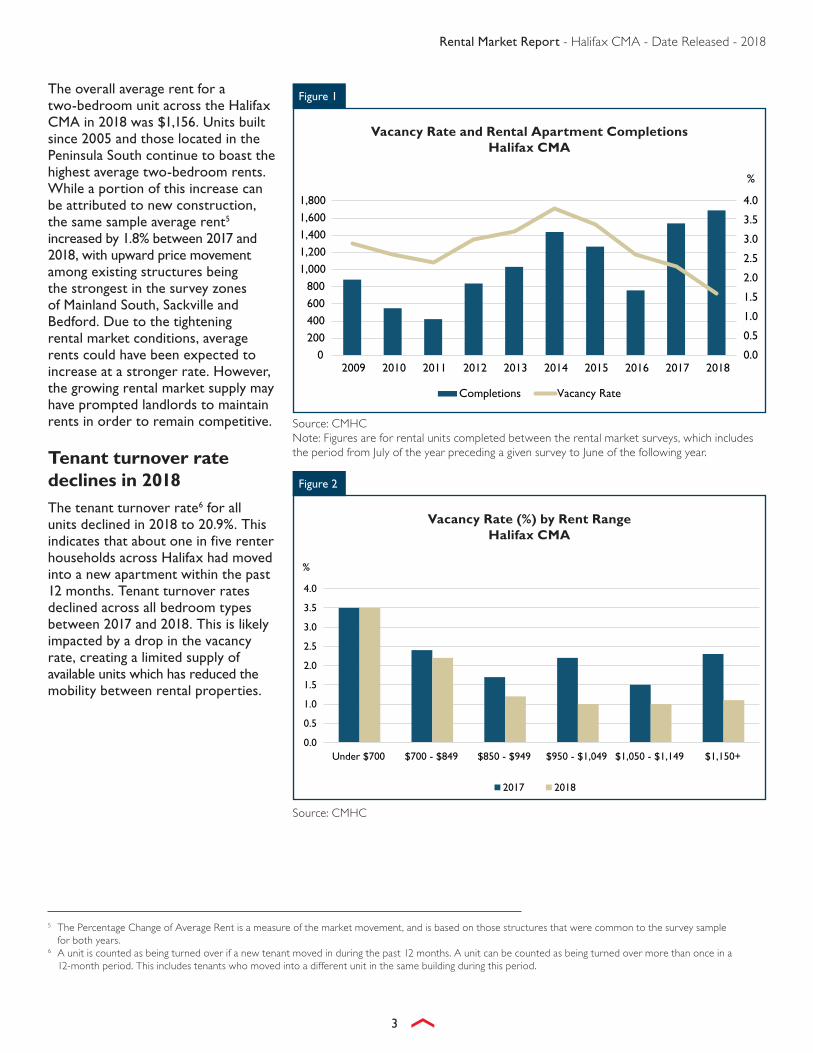
Rental demand has shifted to newer and more expensive units One of the major trends highlighted in last year’s survey results was that Halifax’s vacancy rate decline was apparent in the units priced at the lower end of the rental market. However, the 2018 results show that the continued declining trend in the vacancy rate has had an impact across the market. Although the decrease this year was most pronounced in newer units and in the survey zones that carry higher average rents, the vacancy rate also declined in all rents ranges over $850. This was especially evident in units priced from $950 - $1,049 and $1,150+. In addition, units built since 1990 which carry the highest average two-bedroom rent also recorded the lowest overall vacancy rates. Some of this shift towards more expensive units can be explained by the aging population and expanding downsizing market who are often looking for higher-end units. Improving labour market conditions may also be shifting renter’s willingness to pay for premium units.
1 The survey is based on privately initiated rental apartment structures of three or more units.2 Immigration, Refugees and Citizenship Canada. 3 Statistics Canada – Table 17-10-0022-01. Estimates of interprovincial migrants by province or territory, annual.4 Statistics Canada. Table 14-10-0294-01. Labour force characteristics by census metropolitan area, seasonally adjusted.
SUBSCRIBE NOW!Get email notifications when CMHC publications are released or updated. Sign up for a free myCMHC account for enhanced site access, including one-click subscriptions to the reports and tables that matter to you.
Rental Market Report - Halifax CMA - Date Released - 2018
3
The overall average rent for a two-bedroom unit across the Halifax CMA in 2018 was $1,156. Units built since 2005 and those located in the Peninsula South continue to boast the highest average two-bedroom rents. While a portion of this increase can be attributed to new construction, the same sample average rent5 increased by 1.8% between 2017 and 2018, with upward price movement among existing structures being the strongest in the survey zones of Mainland South, Sackville and Bedford. Due to the tightening rental market conditions, average rents could have been expected to increase at a stronger rate. However, the growing rental market supply may have prompted landlords to maintain rents in order to remain competitive.
Tenant turnover rate declines in 2018The tenant turnover rate6 for all units declined in 2018 to 20.9%. This indicates that about one in five renter households across Halifax had moved into a new apartment within the past 12 months. Tenant turnover rates declined across all bedroom types between 2017 and 2018. This is likely impacted by a drop in the vacancy rate, creating a limited supply of available units which has reduced the mobility between rental properties.
0.0
0.5
1.0
1.5
2.0
2.5
3.0
3.5
4.0
0200400600800
1,0001,2001,4001,6001,800
2009 2010 2011 2012 2013 2014 2015 2016 2017 2018
Completions Vacancy Rate
%
Source: CMHCNote: Figures are for rental units completed between the rental market surveys, which includes the period from July of the year preceding a given survey to June of the following year.
Figure 1
Vacancy Rate and Rental Apartment CompletionsHalifax CMA
5 The Percentage Change of Average Rent is a measure of the market movement, and is based on those structures that were common to the survey sample for both years.
6 A unit is counted as being turned over if a new tenant moved in during the past 12 months. A unit can be counted as being turned over more than once in a 12-month period. This includes tenants who moved into a different unit in the same building during this period.
Rental Market Report - Halifax CMA - Date Released - 2018
4
Halifax
01
02
03
04
05
06
07
08
09
10
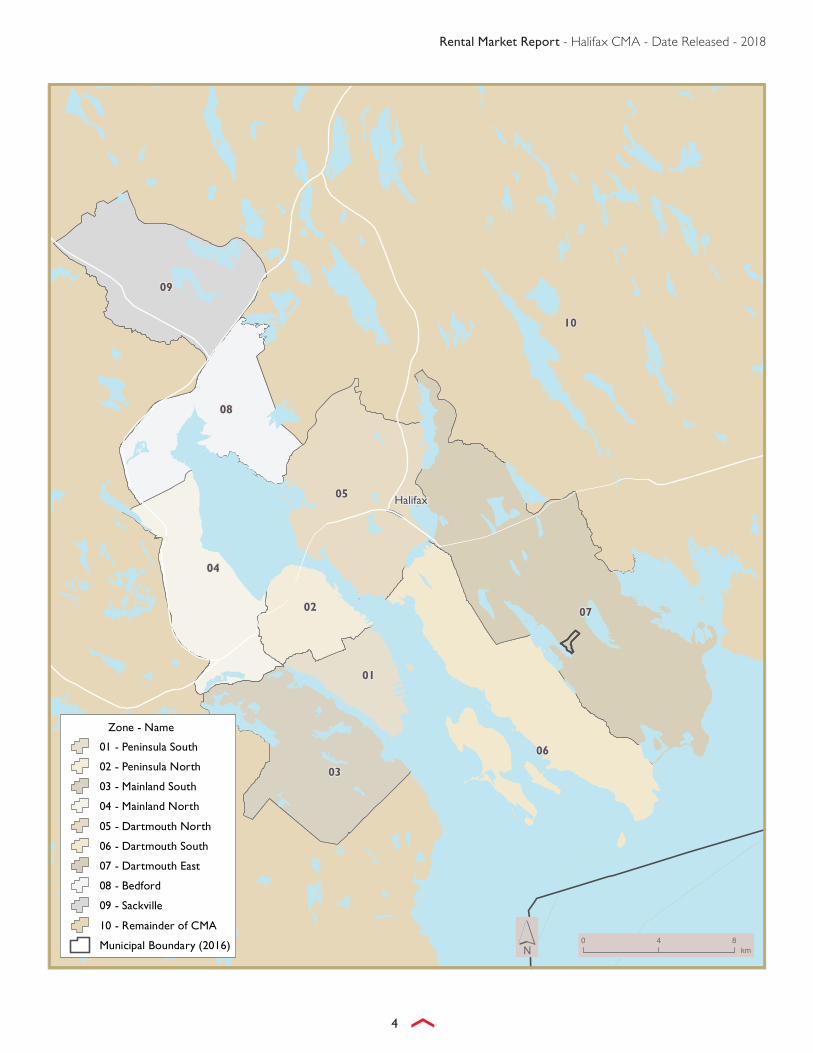
Zone - Name
01 - Peninsula South
02 - Peninsula North
03 - Mainland South
04 - Mainland North
05 - Dartmouth North
06 - Dartmouth South
07 - Dartmouth East
08 - Bedford
09 - Sackville
10 - Remainder of CMA
Municipal Boundary (2016) 0 4 8km´
Rental Market Report - Halifax CMA - Date Released - 2018
5
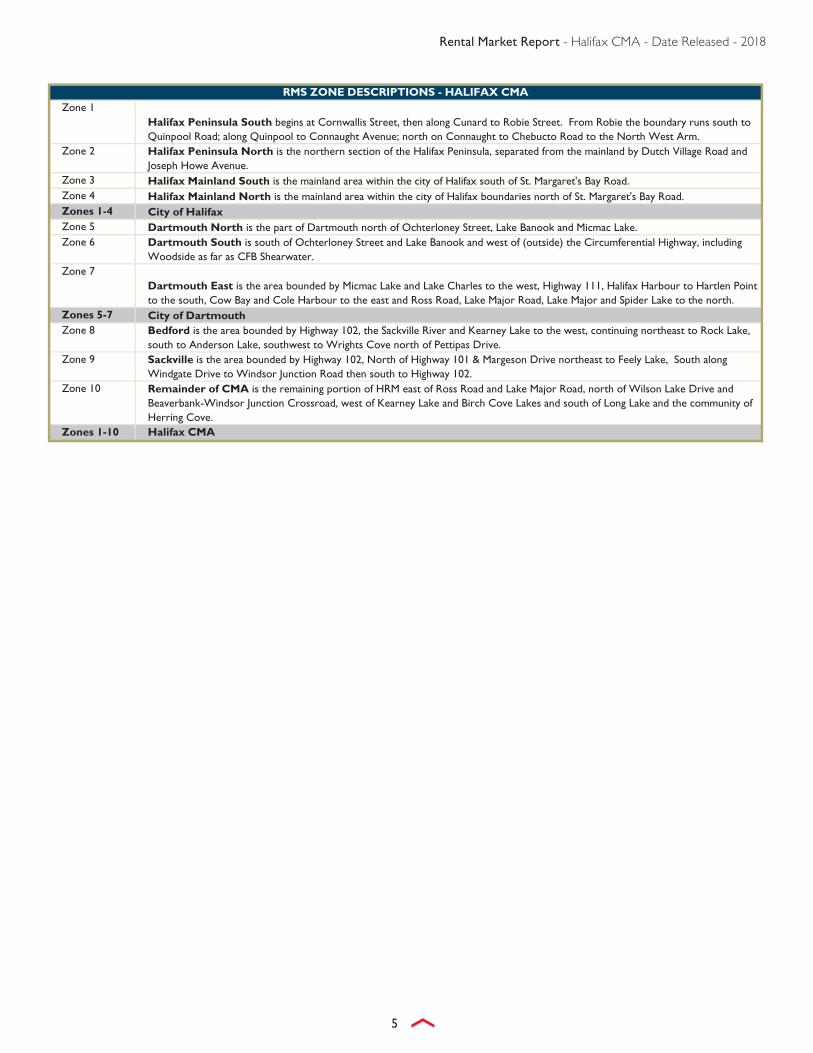
Zone 1Halifax Peninsula South begins at Cornwallis Street, then along Cunard to Robie Street. From Robie the boundary runs south to Quinpool Road; along Quinpool to Connaught Avenue; north on Connaught to Chebucto Road to the North West Arm.
Zone 2 Halifax Peninsula North is the northern section of the Halifax Peninsula, separated from the mainland by Dutch Village Road and Joseph Howe Avenue.
Zone 3 Halifax Mainland South is the mainland area within the city of Halifax south of St. Margaret's Bay Road.Zone 4 Halifax Mainland North is the mainland area within the city of Halifax boundaries north of St. Margaret's Bay Road.Zones 1-4 City of HalifaxZone 5 Dartmouth North is the part of Dartmouth north of Ochterloney Street, Lake Banook and Micmac Lake.Zone 6 Dartmouth South is south of Ochterloney Street and Lake Banook and west of (outside) the Circumferential Highway, including
Woodside as far as CFB Shearwater.Zone 7
Dartmouth East is the area bounded by Micmac Lake and Lake Charles to the west, Highway 111, Halifax Harbour to Hartlen Point to the south, Cow Bay and Cole Harbour to the east and Ross Road, Lake Major Road, Lake Major and Spider Lake to the north.
Zones 5-7 City of DartmouthZone 8 Bedford is the area bounded by Highway 102, the Sackville River and Kearney Lake to the west, continuing northeast to Rock Lake,
south to Anderson Lake, southwest to Wrights Cove north of Pettipas Drive.Zone 9 Sackville is the area bounded by Highway 102, North of Highway 101 & Margeson Drive northeast to Feely Lake, South along
Windgate Drive to Windsor Junction Road then south to Highway 102.Zone 10 Remainder of CMA is the remaining portion of HRM east of Ross Road and Lake Major Road, north of Wilson Lake Drive and
Beaverbank-Windsor Junction Crossroad, west of Kearney Lake and Birch Cove Lakes and south of Long Lake and the community of Herring Cove.
Zones 1-10 Halifax CMA
RMS ZONE DESCRIPTIONS - HALIFAX CMA
Rental Market Report - Halifax CMA - Date Released - 2018
6
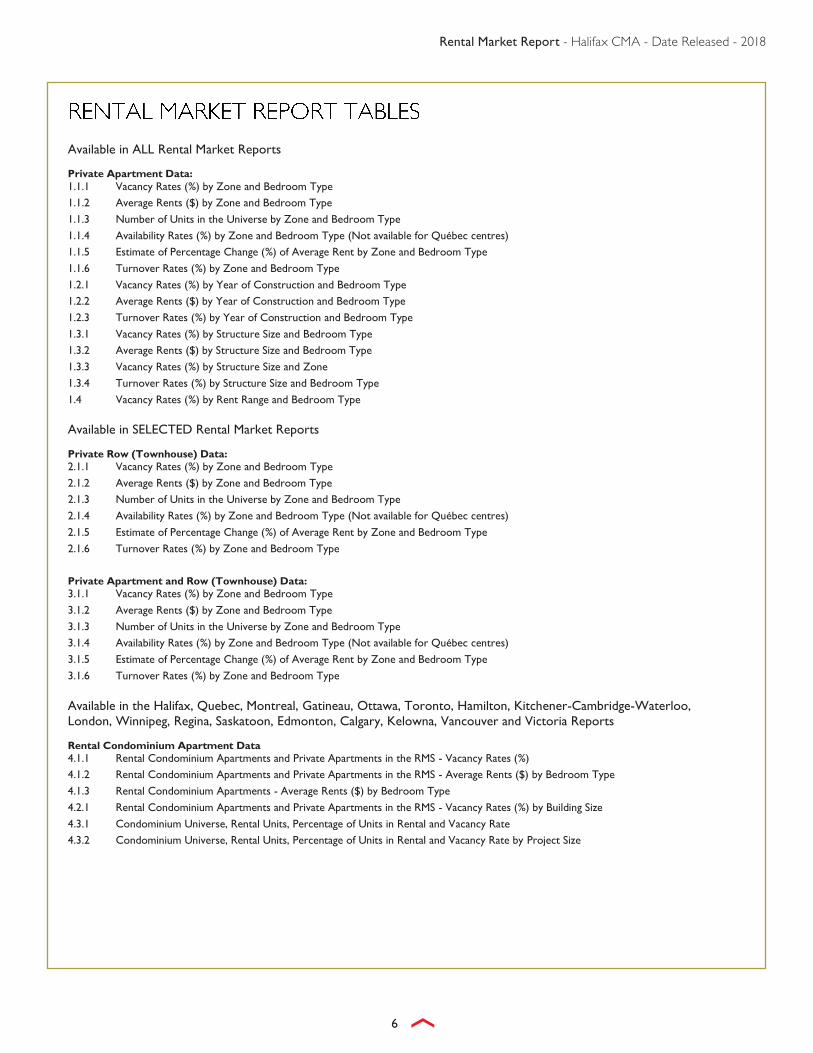
Available in ALL Rental Market Reports
Private Apartment Data: 1.1.1 Vacancy Rates (%) by Zone and Bedroom Type
1.1.2 Average Rents ($) by Zone and Bedroom Type
1.1.3 Number of Units in the Universe by Zone and Bedroom Type
1.1.4 Availability Rates (%) by Zone and Bedroom Type (Not available for Québec centres)
1.1.5 Estimate of Percentage Change (%) of Average Rent by Zone and Bedroom Type
1.1.6 Turnover Rates (%) by Zone and Bedroom Type
1.2.1 Vacancy Rates (%) by Year of Construction and Bedroom Type
1.2.2 Average Rents ($) by Year of Construction and Bedroom Type
1.2.3 Turnover Rates (%) by Year of Construction and Bedroom Type
1.3.1 Vacancy Rates (%) by Structure Size and Bedroom Type
1.3.2 Average Rents ($) by Structure Size and Bedroom Type
1.3.3 Vacancy Rates (%) by Structure Size and Zone
1.3.4 Turnover Rates (%) by Structure Size and Bedroom Type
1.4 Vacancy Rates (%) by Rent Range and Bedroom Type Available in SELECTED Rental Market Reports
Private Row (Townhouse) Data: 2.1.1 Vacancy Rates (%) by Zone and Bedroom Type
2.1.2 Average Rents ($) by Zone and Bedroom Type
2.1.3 Number of Units in the Universe by Zone and Bedroom Type
2.1.4 Availability Rates (%) by Zone and Bedroom Type (Not available for Québec centres)
2.1.5 Estimate of Percentage Change (%) of Average Rent by Zone and Bedroom Type
2.1.6 Turnover Rates (%) by Zone and Bedroom Type
Private Apartment and Row (Townhouse) Data: 3.1.1 Vacancy Rates (%) by Zone and Bedroom Type
3.1.2 Average Rents ($) by Zone and Bedroom Type
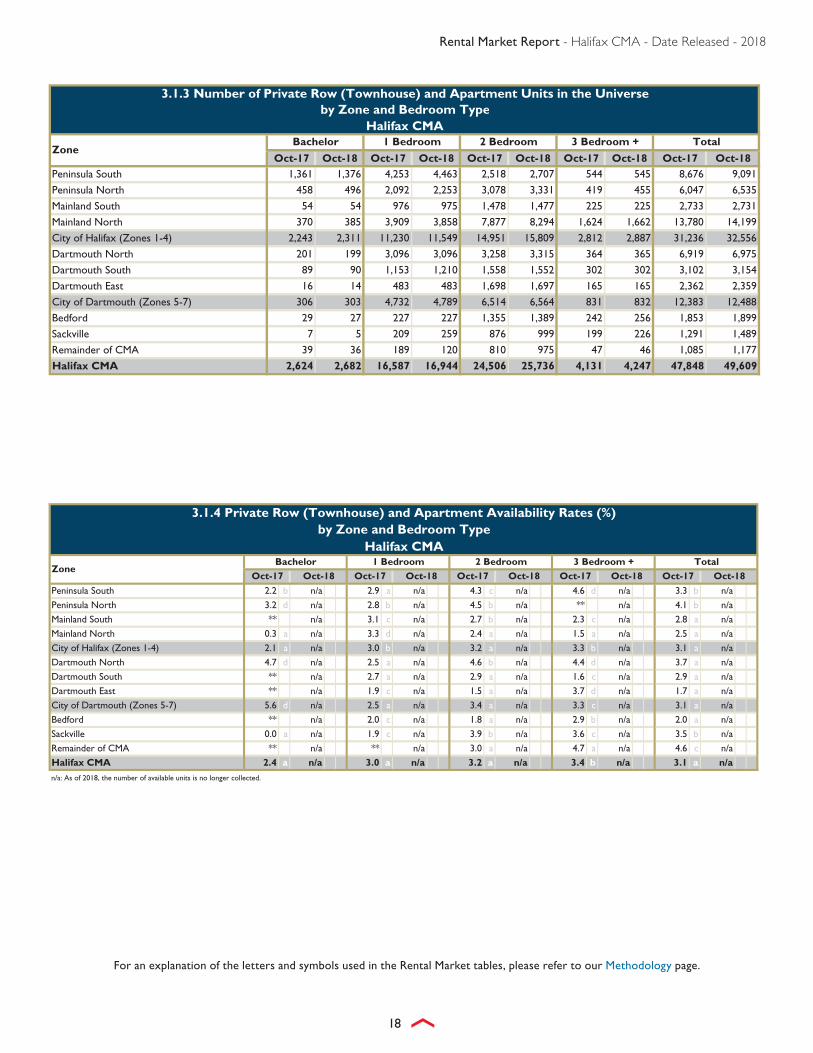
3.1.3 Number of Units in the Universe by Zone and Bedroom Type
3.1.4 Availability Rates (%) by Zone and Bedroom Type (Not available for Québec centres)
3.1.5 Estimate of Percentage Change (%) of Average Rent by Zone and Bedroom Type
3.1.6 Turnover Rates (%) by Zone and Bedroom Type Available in the Halifax, Quebec, Montreal, Gatineau, Ottawa, Toronto, Hamilton, Kitchener-Cambridge-Waterloo, London, Winnipeg, Regina, Saskatoon, Edmonton, Calgary, Kelowna, Vancouver and Victoria Reports
Rental Condominium Apartment Data 4.1.1 Rental Condominium Apartments and Private Apartments in the RMS - Vacancy Rates (%)
4.1.2 Rental Condominium Apartments and Private Apartments in the RMS - Average Rents ($) by Bedroom Type
4.1.3 Rental Condominium Apartments - Average Rents ($) by Bedroom Type
4.2.1 Rental Condominium Apartments and Private Apartments in the RMS - Vacancy Rates (%) by Building Size
4.3.1 Condominium Universe, Rental Units, Percentage of Units in Rental and Vacancy Rate
4.3.2 Condominium Universe, Rental Units, Percentage of Units in Rental and Vacancy Rate by Project Size
Rental Market Report - Halifax CMA - Date Released - 2018
7
For an explanation of the letters and symbols used in the Rental Market tables, please refer to our Methodology page.
Peninsula South 0.5 a 1.1 a ↑ 1.7 a 1.0 a ↓ 3.5 c 1.2 a ↓ 4.7 d 1.3 a ↓ 2.3 a 1.1 a ↓Peninsula North 1.6 c 0.3 b ↓ 1.5 c 0.7 a ↓ 3.3 b 1.2 a ↓ ** 2.9 c 2.9 b 1.1 a ↓Mainland South ** 0.0 c 2.4 b 1.1 a ↓ 2.1 b 1.4 a ↓ 2.8 c 1.0 a ↓ 2.3 a 1.2 a ↓Mainland North 0.0 c 1.3 a ↑ 2.7 c 1.1 a ↓ 1.8 a 1.0 a ↓ 1.1 a 0.5 a ↓ 1.9 a 1.0 a ↓City of Halifax (Zones 1-4) 0.7 a 1.0 a - 2.1 b 1.0 a ↓ 2.4 a 1.1 a ↓ 3.1 c 1.1 a ↓ 2.2 a 1.0 a ↓Dartmouth North 4.0 d 5.5 d - 1.8 a 4.1 c ↑ 3.5 b 3.0 c - 4.3 d 0.0 c ↓ 2.8 a 3.5 c -
Dartmouth South ** ** 1.9 a 2.3 a - 2.6 a 2.2 a - 1.6 c 2.6 b ↑ 2.4 a 2.5 a -
Dartmouth East ** 0.0 a 1.3 a 1.8 a - 0.8 a 1.5 a ↑ 4.1 d 4.7 b - 1.1 a 1.7 a ↑City of Dartmouth (Zones 5-7) 5.2 d ** 1.8 a 3.5 b ↑ 2.6 a 2.4 a - 3.3 c 1.9 b ↓ 2.4 a 2.9 a ↑Bedford ** ** 2.0 c 0.5 b ↓ 1.1 a 1.3 a - 2.2 b 0.4 a ↓ 1.3 a 1.1 a -
Sackville 0.0 a ** 1.9 c 0.8 a ↓ 3.0 b 2.2 b - 1.6 b 3.0 b ↑ 2.6 a 2.0 b -
Remainder of CMA ** ** ** 0.0 c 1.7 b 2.1 b - 4.8 a 4.8 d - 3.6 d 1.9 b ↓Halifax CMA 1.2 a 1.5 a - 2.1 a 1.7 a ↓ 2.4 a 1.5 a ↓ 3.0 b 1.3 a ↓ 2.3 a 1.6 a ↓
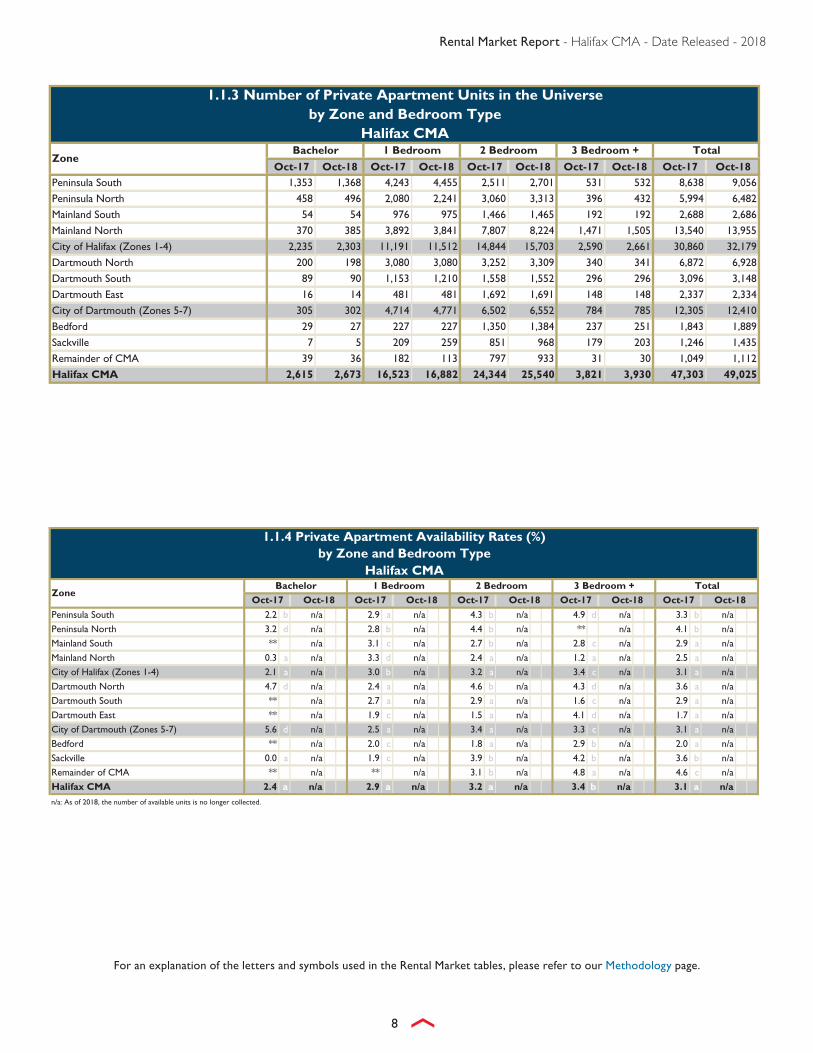
1.1.3 Number of Private Apartment Units in the Universe
ZoneBachelor 1 Bedroom 2 Bedroom 3 Bedroom +
1.1.4 Private Apartment Availability Rates (%)by Zone and Bedroom Type
Halifax CMA
Peninsula South 2.2 b n/a 2.9 a n/a 4.3 b n/a 4.9 d n/a 3.3 b n/a
Peninsula North 3.2 d n/a 2.8 b n/a 4.4 b n/a ** n/a 4.1 b n/a
Mainland South ** n/a 3.1 c n/a 2.7 b n/a 2.8 c n/a 2.9 a n/a
Mainland North 0.3 a n/a 3.3 d n/a 2.4 a n/a 1.2 a n/a 2.5 a n/a
City of Halifax (Zones 1-4) 2.1 a n/a 3.0 b n/a 3.2 a n/a 3.4 c n/a 3.1 a n/a
Dartmouth North 4.7 d n/a 2.4 a n/a 4.6 b n/a 4.3 d n/a 3.6 a n/a
Dartmouth South ** n/a 2.7 a n/a 2.9 a n/a 1.6 c n/a 2.9 a n/a
Dartmouth East ** n/a 1.9 c n/a 1.5 a n/a 4.1 d n/a 1.7 a n/a
City of Dartmouth (Zones 5-7) 5.6 d n/a 2.5 a n/a 3.4 a n/a 3.3 c n/a 3.1 a n/a
Bedford ** n/a 2.0 c n/a 1.8 a n/a 2.9 b n/a 2.0 a n/a
Sackville 0.0 a n/a 1.9 c n/a 3.9 b n/a 4.2 b n/a 3.6 b n/a
Remainder of CMA ** n/a ** n/a 3.1 b n/a 4.8 a n/a 4.6 c n/a
Halifax CMA 2.4 a n/a 2.9 a n/a 3.2 a n/a 3.4 b n/a 3.1 a n/a
n/a: As of 2018, the number of available units is no longer collected.
Oct-17 Oct-18Oct-17 Oct-18 Oct-17 Oct-183 Bedroom + Total
ZoneBachelor 1 Bedroom 2 Bedroom
Oct-17 Oct-18 Oct-17 Oct-18
Rental Market Report - Halifax CMA - Date Released - 2018
9
For an explanation of the letters and symbols used in the Rental Market tables, please refer to our Methodology page.
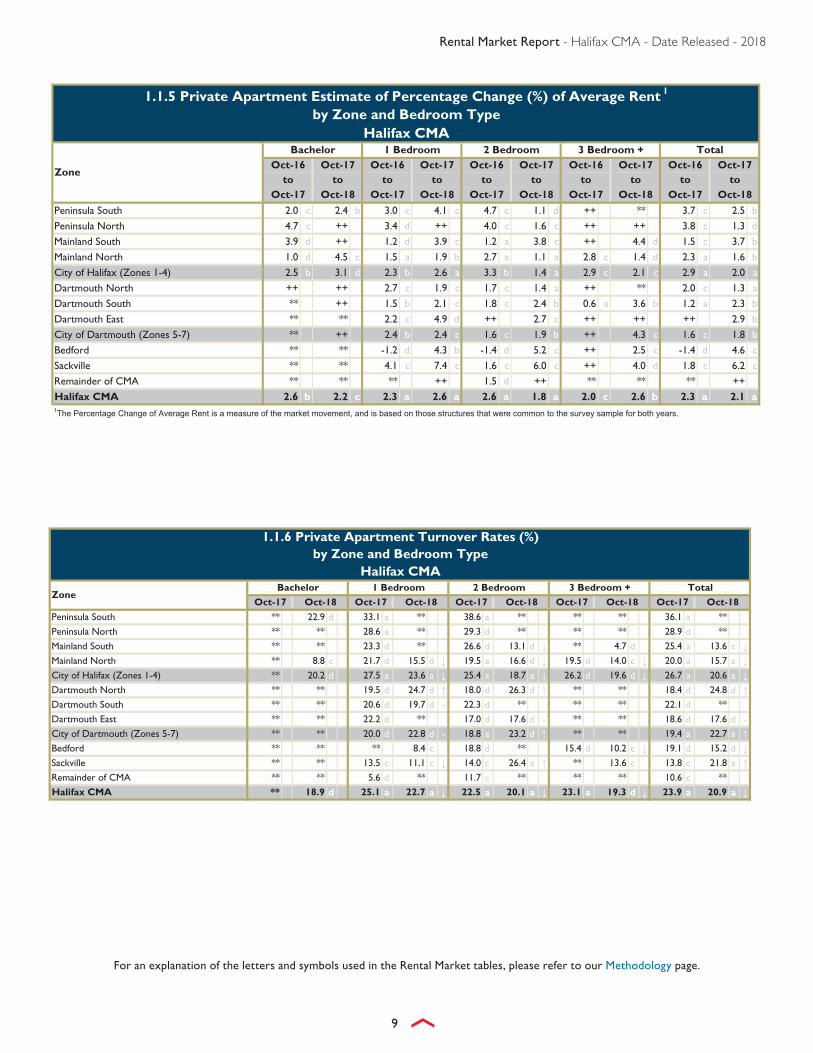
1.1.5 Private Apartment Estimate of Percentage Change (%) of Average Rent 1
by Zone and Bedroom TypeHalifax CMA
Peninsula South 2.0 c 2.4 b 3.0 c 4.1 c 4.7 c 1.1 d ++ ** 3.7 c 2.5 b
Peninsula North 4.7 c ++ 3.4 d ++ 4.0 c 1.6 c ++ ++ 3.8 c 1.3 d
Mainland South 3.9 d ++ 1.2 d 3.9 c 1.2 a 3.8 c ++ 4.4 d 1.5 c 3.7 b
Mainland North 1.0 d 4.5 c 1.5 a 1.9 b 2.7 a 1.1 a 2.8 c 1.4 d 2.3 a 1.6 b
City of Halifax (Zones 1-4) 2.5 b 3.1 d 2.3 b 2.6 a 3.3 b 1.4 a 2.9 c 2.1 c 2.9 a 2.0 a
Dartmouth North ++ ++ 2.7 c 1.9 c 1.7 c 1.4 a ++ ** 2.0 c 1.3 a
Dartmouth South ** ++ 1.5 b 2.1 c 1.8 c 2.4 b 0.6 a 3.6 b 1.2 a 2.3 b
Dartmouth East ** ** 2.2 c 4.9 d ++ 2.7 c ++ ++ ++ 2.9 b
City of Dartmouth (Zones 5-7) ** ++ 2.4 b 2.4 c 1.6 c 1.9 b ++ 4.3 c 1.6 c 1.8 b
Bedford ** ** -1.2 d 4.3 b -1.4 d 5.2 c ++ 2.5 c -1.4 d 4.6 c
Sackville ** ** 4.1 c 7.4 c 1.6 c 6.0 c ++ 4.0 d 1.8 c 6.2 c
Remainder of CMA ** ** ** ++ 1.5 d ++ ** ** ** ++
Halifax CMA 2.6 b 2.2 c 2.3 a 2.6 a 2.6 a 1.8 a 2.0 c 2.6 b 2.3 a 2.1 a1The Percentage Change of Average Rent is a measure of the market movement, and is based on those structures that were common to the survey sample for both years.
Oct-17 Oct-18
Oct-17
Oct-17 Oct-18 Oct-17
Oct-16
Oct-18
Oct-17to to
2 Bedroom
Zone
Bachelor 1 Bedroom
to to to toOct-16 Oct-17 Oct-16
3 Bedroom + TotalOct-16 Oct-17 Oct-16 Oct-17
Oct-17 Oct-18to to
Oct-17 Oct-18to to
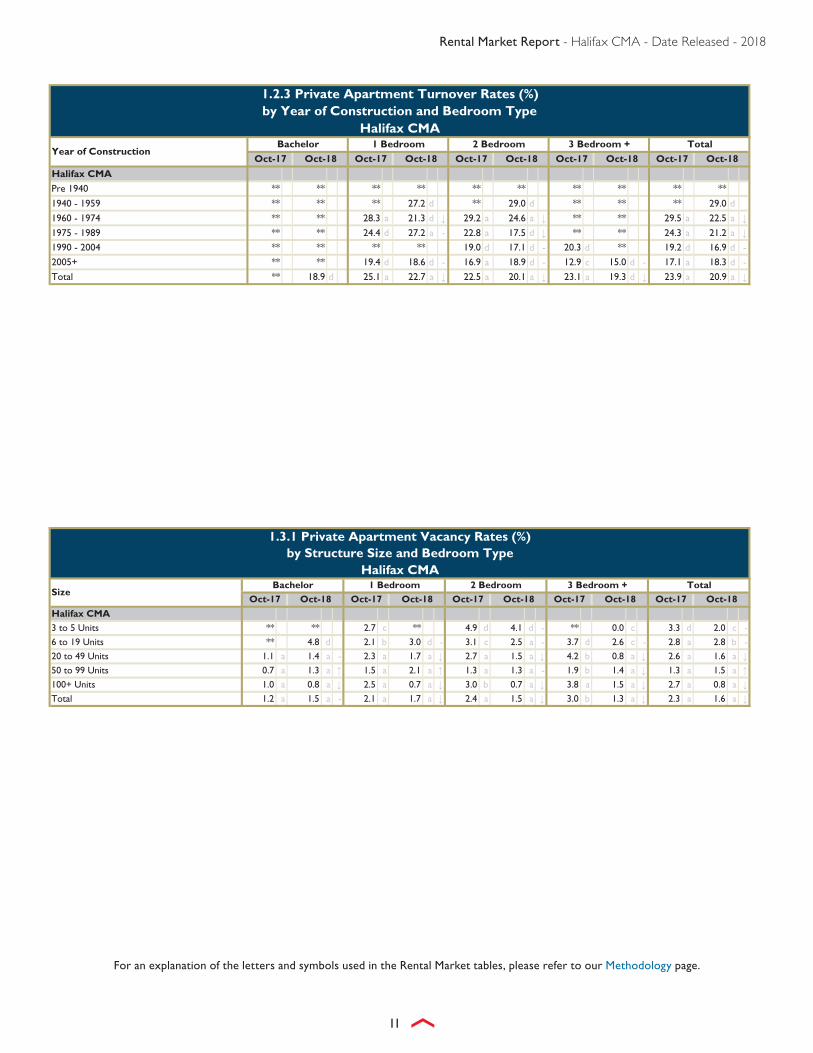
Peninsula South ** 22.9 d 33.1 a ** 38.6 a ** ** ** 36.1 a ** Peninsula North ** ** 28.6 a ** 29.3 d ** ** ** 28.9 d ** Mainland South ** ** 23.3 d ** 26.6 d 13.1 d ↓ ** 4.7 d 25.4 a 13.6 c ↓Mainland North ** 8.8 c 21.7 d 15.5 d ↓ 19.5 a 16.6 d ↓ 19.5 d 14.0 c ↓ 20.0 a 15.7 a ↓City of Halifax (Zones 1-4) ** 20.2 d 27.5 a 23.6 a ↓ 25.4 a 18.7 a ↓ 26.2 d 19.6 d ↓ 26.7 a 20.6 a ↓Dartmouth North ** ** 19.5 d 24.7 d ↑ 18.0 d 26.3 d ↑ ** ** 18.4 d 24.8 d ↑Dartmouth South ** ** 20.6 d 19.7 d - 22.3 d ** ** ** 22.1 d ** Dartmouth East ** ** 22.2 d ** 17.0 d 17.6 d - ** ** 18.6 d 17.6 d -City of Dartmouth (Zones 5-7) ** ** 20.0 d 22.8 d - 18.8 a 23.2 d ↑ ** ** 19.4 a 22.7 a ↑Bedford ** ** ** 8.4 c 18.8 d ** 15.4 d 10.2 c ↓ 19.1 d 15.2 d ↓Sackville ** ** 13.5 c 11.1 c ↓ 14.0 c 26.4 a ↑ ** 13.6 c 13.8 c 21.8 a ↑Remainder of CMA ** ** 5.6 d ** 11.7 c ** ** ** 10.6 c ** Halifax CMA ** 18.9 d 25.1 a 22.7 a ↓ 22.5 a 20.1 a ↓ 23.1 a 19.3 d ↓ 23.9 a 20.9 a ↓
1.1.6 Private Apartment Turnover Rates (%)by Zone and Bedroom Type
Halifax CMA
ZoneBachelor 1 Bedroom
Oct-18 Oct-17 Oct-18
Oct-18 Oct-17 Oct-18 Oct-17
Oct-18 Oct-172 Bedroom 3 Bedroom + Total
Oct-17
Rental Market Report - Halifax CMA - Date Released - 2018
10
For an explanation of the letters and symbols used in the Rental Market tables, please refer to our Methodology page.
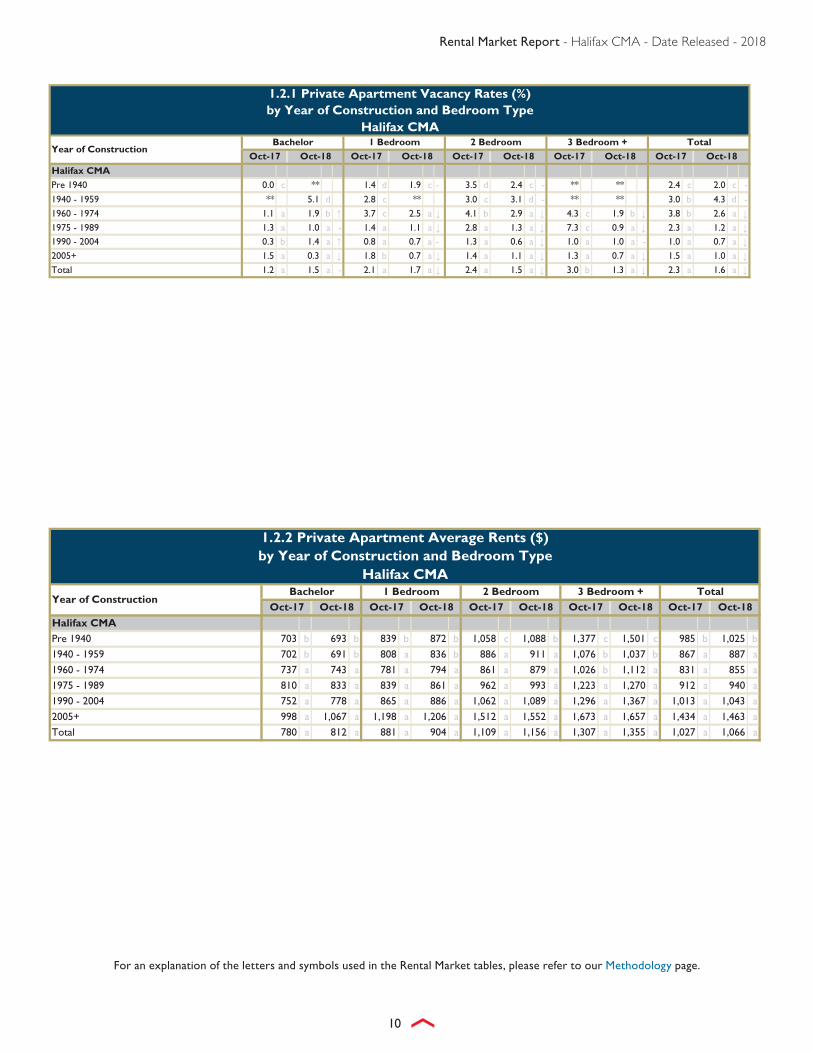
1.2.1 Private Apartment Vacancy Rates (%)by Year of Construction and Bedroom Type
Halifax CMA
Halifax CMAPre 1940 0.0 c ** 1.4 d 1.9 c - 3.5 d 2.4 c - ** ** 2.4 c 2.0 c -
1940 - 1959 ** 5.1 d 2.8 c ** 3.0 c 3.1 d - ** ** 3.0 b 4.3 d -
1960 - 1974 1.1 a 1.9 b ↑ 3.7 c 2.5 a ↓ 4.1 b 2.9 a ↓ 4.3 c 1.9 b ↓ 3.8 b 2.6 a ↓1975 - 1989 1.3 a 1.0 a - 1.4 a 1.1 a ↓ 2.8 a 1.3 a ↓ 7.3 c 0.9 a ↓ 2.3 a 1.2 a ↓1990 - 2004 0.3 b 1.4 a ↑ 0.8 a 0.7 a - 1.3 a 0.6 a ↓ 1.0 a 1.0 a - 1.0 a 0.7 a ↓2005+ 1.5 a 0.3 a ↓ 1.8 b 0.7 a ↓ 1.4 a 1.1 a ↓ 1.3 a 0.7 a ↓ 1.5 a 1.0 a ↓Total 1.2 a 1.5 a - 2.1 a 1.7 a ↓ 2.4 a 1.5 a ↓ 3.0 b 1.3 a ↓ 2.3 a 1.6 a ↓
Oct-17 Oct-18Oct-17 Oct-18 Oct-17 Oct-183 Bedroom + Total
Year of ConstructionBachelor 1 Bedroom 2 Bedroom
Oct-17 Oct-18 Oct-17 Oct-18
Halifax CMAPre 1940 703 b 693 b 839 b 872 b 1,058 c 1,088 b 1,377 c 1,501 c 985 b 1,025 b
1940 - 1959 702 b 691 b 808 a 836 b 886 a 911 a 1,076 b 1,037 b 867 a 887 a
1960 - 1974 737 a 743 a 781 a 794 a 861 a 879 a 1,026 b 1,112 a 831 a 855 a
1975 - 1989 810 a 833 a 839 a 861 a 962 a 993 a 1,223 a 1,270 a 912 a 940 a
1990 - 2004 752 a 778 a 865 a 886 a 1,062 a 1,089 a 1,296 a 1,367 a 1,013 a 1,043 a
2005+ 998 a 1,067 a 1,198 a 1,206 a 1,512 a 1,552 a 1,673 a 1,657 a 1,434 a 1,463 a
Total 780 a 812 a 881 a 904 a 1,109 a 1,156 a 1,307 a 1,355 a 1,027 a 1,066 a
1940 - 1959 ** ** ** 27.2 d ** 29.0 d ** ** ** 29.0 d
1960 - 1974 ** ** 28.3 a 21.3 d ↓ 29.2 a 24.6 a ↓ ** ** 29.5 a 22.5 a ↓1975 - 1989 ** ** 24.4 d 27.2 a - 22.8 a 17.5 d ↓ ** ** 24.3 a 21.2 a ↓1990 - 2004 ** ** ** ** 19.0 d 17.1 d - 20.3 d ** 19.2 d 16.9 d -2005+ ** ** 19.4 d 18.6 d - 16.9 a 18.9 d - 12.9 c 15.0 d - 17.1 a 18.3 d -Total ** 18.9 d 25.1 a 22.7 a ↓ 22.5 a 20.1 a ↓ 23.1 a 19.3 d ↓ 23.9 a 20.9 a ↓
1.3.1 Private Apartment Vacancy Rates (%)by Structure Size and Bedroom Type
Halifax CMA
Halifax CMA3 to 5 Units ** ** 2.7 c ** 4.9 d 4.1 d - ** 0.0 c 3.3 d 2.0 c -
6 to 19 Units ** 4.8 d 2.1 b 3.0 d - 3.1 c 2.5 a - 3.7 d 2.6 c - 2.8 a 2.8 b -
20 to 49 Units 1.1 a 1.4 a - 2.3 a 1.7 a ↓ 2.7 a 1.5 a ↓ 4.2 b 0.8 a ↓ 2.6 a 1.6 a ↓50 to 99 Units 0.7 a 1.3 a ↑ 1.5 a 2.1 a ↑ 1.3 a 1.3 a - 1.9 b 1.4 a ↓ 1.3 a 1.5 a ↑100+ Units 1.0 a 0.8 a ↓ 2.5 a 0.7 a ↓ 3.0 b 0.7 a ↓ 3.8 a 1.5 a ↓ 2.7 a 0.8 a ↓Total 1.2 a 1.5 a - 2.1 a 1.7 a ↓ 2.4 a 1.5 a ↓ 3.0 b 1.3 a ↓ 2.3 a 1.6 a ↓
Oct-17 Oct-18Oct-17 Oct-18 Oct-17 Oct-183 Bedroom + Total
SizeBachelor 1 Bedroom 2 Bedroom
Oct-17 Oct-18 Oct-17 Oct-18
Rental Market Report - Halifax CMA - Date Released - 2018
12
For an explanation of the letters and symbols used in the Rental Market tables, please refer to our Methodology page.
Halifax CMA3 to 5 Units 653 b ** 756 a 777 b 989 b 1,007 b 1,359 b 1,404 b 987 b 1,019 b
6 to 19 Units 668 a 685 a 725 a 729 a 847 a 888 a 991 a 1,068 a 809 a 837 a
20 to 49 Units 711 a 739 a 788 a 816 a 979 a 1,006 a 1,080 a 1,144 a 900 a 930 a
50 to 99 Units 755 a 772 a 931 a 939 a 1,215 a 1,273 a 1,385 a 1,420 a 1,123 a 1,166 a
100+ Units 877 a 915 a 997 a 1,046 a 1,256 a 1,292 a 1,520 a 1,541 a 1,141 a 1,184 a
Total 780 a 812 a 881 a 904 a 1,109 a 1,156 a 1,307 a 1,355 a 1,027 a 1,066 a
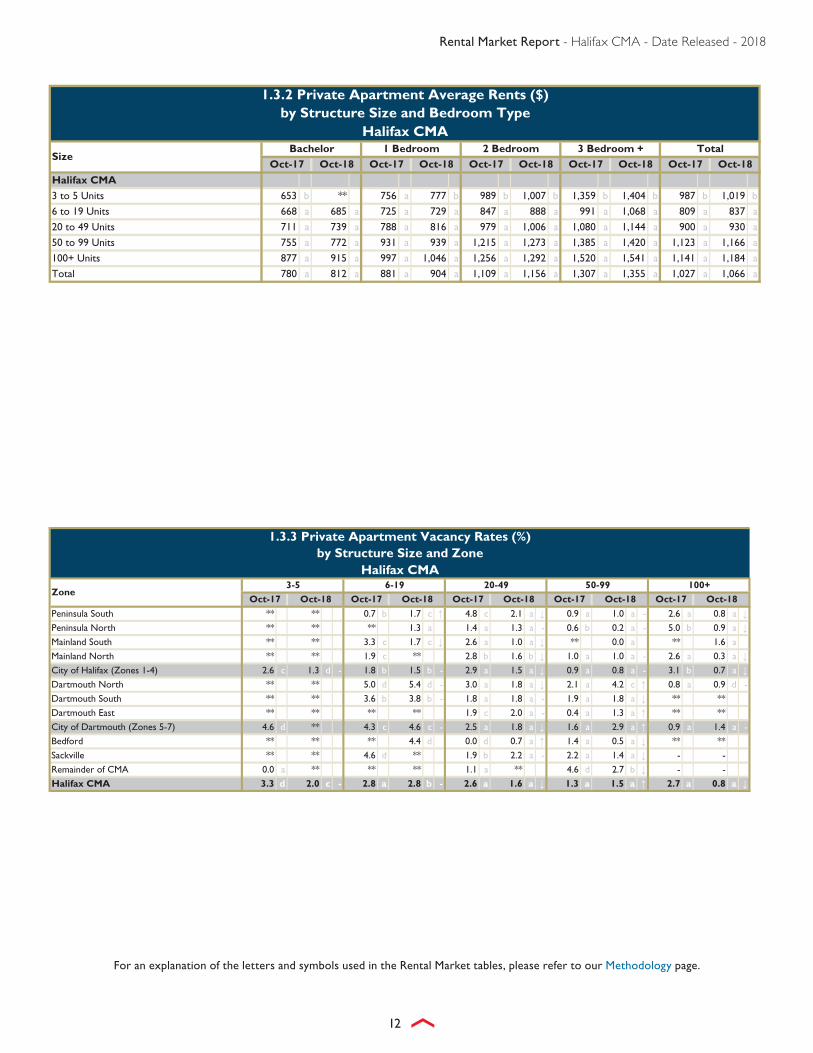
1.3.2 Private Apartment Average Rents ($)by Structure Size and Bedroom Type
Halifax CMA
SizeBachelor 1 Bedroom 2 Bedroom 3 Bedroom + Total
Oct-17
1.3.3 Private Apartment Vacancy Rates (%)by Structure Size and Zone
Halifax CMA
Peninsula South ** ** 0.7 b 1.7 c ↑ 4.8 c 2.1 a ↓ 0.9 a 1.0 a - 2.6 a 0.8 a ↓Peninsula North ** ** ** 1.3 a 1.4 a 1.3 a - 0.6 b 0.2 a - 5.0 b 0.9 a ↓Mainland South ** ** 3.3 c 1.7 c ↓ 2.6 a 1.0 a ↓ ** 0.0 a ** 1.6 a
Mainland North ** ** 1.9 c ** 2.8 b 1.6 b ↓ 1.0 a 1.0 a - 2.6 a 0.3 a ↓City of Halifax (Zones 1-4) 2.6 c 1.3 d - 1.8 b 1.5 b - 2.9 a 1.5 a ↓ 0.9 a 0.8 a - 3.1 b 0.7 a ↓Dartmouth North ** ** 5.0 d 5.4 d - 3.0 a 1.8 a ↓ 2.1 a 4.2 c ↑ 0.8 a 0.9 d -
Dartmouth South ** ** 3.6 b 3.8 b - 1.8 a 1.8 a - 1.9 a 1.8 a ↓ ** **
Dartmouth East ** ** ** ** 1.9 c 2.0 a - 0.4 a 1.3 a ↑ ** **
City of Dartmouth (Zones 5-7) 4.6 d ** 4.3 c 4.6 c - 2.5 a 1.8 a ↓ 1.6 a 2.9 a ↑ 0.9 a 1.4 a -
Bedford ** ** ** 4.4 d 0.0 d 0.7 a ↑ 1.4 a 0.5 a ↓ ** **
Sackville ** ** 4.6 d ** 1.9 b 2.2 a - 2.2 a 1.4 a ↓ - -
Remainder of CMA 0.0 a ** ** ** 1.1 a ** 4.6 d 2.7 b ↓ - -
Halifax CMA 3.3 d 2.0 c - 2.8 a 2.8 b - 2.6 a 1.6 a ↓ 1.3 a 1.5 a ↑ 2.7 a 0.8 a ↓
Rental Market Report - Halifax CMA - Date Released - 2018
13
For an explanation of the letters and symbols used in the Rental Market tables, please refer to our Methodology page.
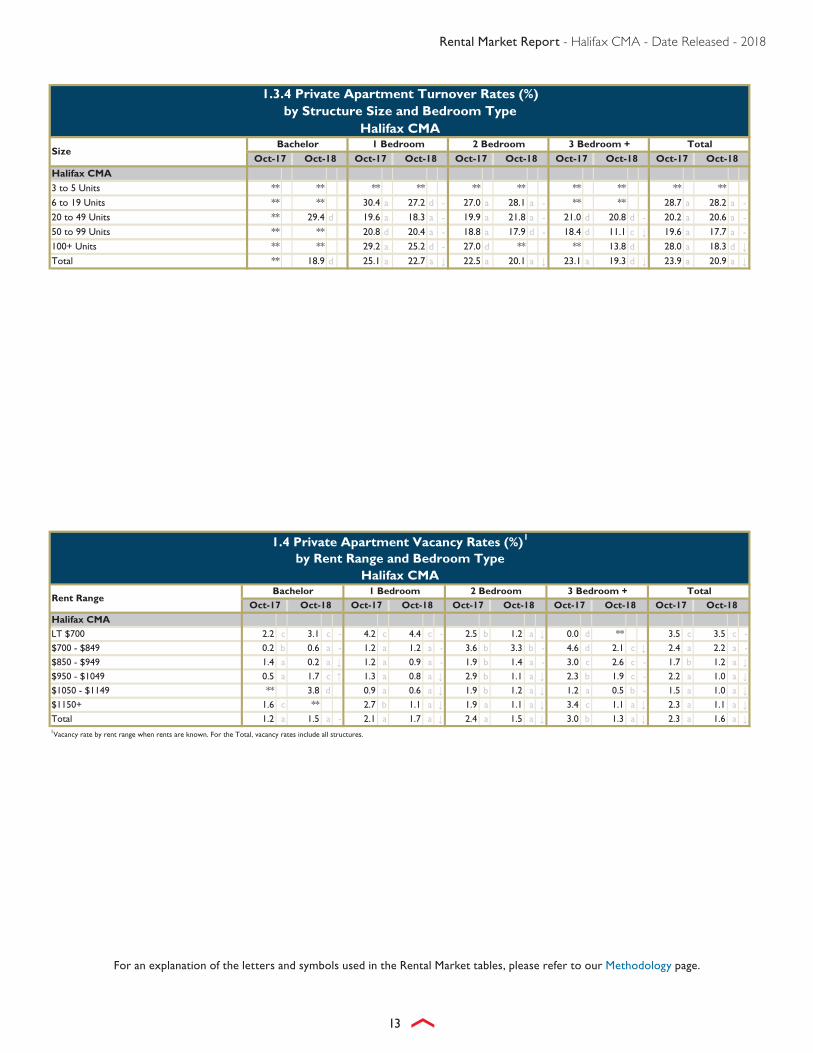
1.3.4 Private Apartment Turnover Rates (%)by Structure Size and Bedroom Type
Halifax CMA
Halifax CMA 3 to 5 Units ** ** ** ** ** ** ** ** ** ** 6 to 19 Units ** ** 30.4 a 27.2 d - 27.0 a 28.1 a - ** ** 28.7 a 28.2 a -20 to 49 Units ** 29.4 d 19.6 a 18.3 a - 19.9 a 21.8 a - 21.0 d 20.8 d - 20.2 a 20.6 a -50 to 99 Units ** ** 20.8 d 20.4 a - 18.8 a 17.9 d - 18.4 d 11.1 c ↓ 19.6 a 17.7 a -100+ Units ** ** 29.2 a 25.2 d - 27.0 d ** ** 13.8 d 28.0 a 18.3 d ↓Total ** 18.9 d 25.1 a 22.7 a ↓ 22.5 a 20.1 a ↓ 23.1 a 19.3 d ↓ 23.9 a 20.9 a ↓
Halifax CMALT $700 2.2 c 3.1 c - 4.2 c 4.4 c - 2.5 b 1.2 a ↓ 0.0 d ** 3.5 c 3.5 c -
$700 - $849 0.2 b 0.6 a - 1.2 a 1.2 a - 3.6 b 3.3 b - 4.6 d 2.1 c ↓ 2.4 a 2.2 a -
$850 - $949 1.4 a 0.2 a ↓ 1.2 a 0.9 a - 1.9 b 1.4 a - 3.0 c 2.6 c - 1.7 b 1.2 a ↓$950 - $1049 0.5 a 1.7 c ↑ 1.3 a 0.8 a ↓ 2.9 b 1.1 a ↓ 2.3 b 1.9 c - 2.2 a 1.0 a ↓$1050 - $1149 ** 3.8 d 0.9 a 0.6 a ↓ 1.9 b 1.2 a ↓ 1.2 a 0.5 b - 1.5 a 1.0 a ↓$1150+ 1.6 c ** 2.7 b 1.1 a ↓ 1.9 a 1.1 a ↓ 3.4 c 1.1 a ↓ 2.3 a 1.1 a ↓Total 1.2 a 1.5 a - 2.1 a 1.7 a ↓ 2.4 a 1.5 a ↓ 3.0 b 1.3 a ↓ 2.3 a 1.6 a ↓1Vacancy rate by rent range when rents are known. For the Total, vacancy rates include all structures.
Rental Market Report - Halifax CMA - Date Released - 2018
14
For an explanation of the letters and symbols used in the Rental Market tables, please refer to our Methodology page.
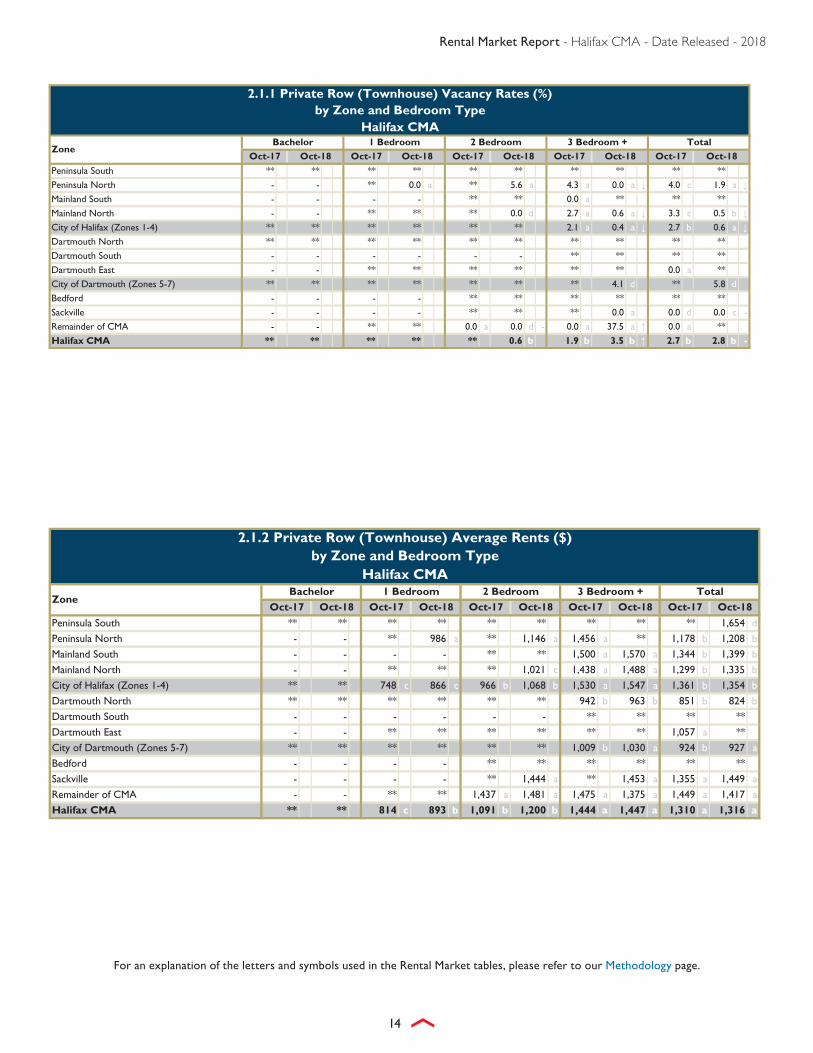
2.1.1 Private Row (Townhouse) Vacancy Rates (%)by Zone and Bedroom Type
Halifax CMA
Peninsula South ** ** ** ** ** ** ** ** ** **
Peninsula North - - ** 0.0 a ** 5.6 a 4.3 a 0.0 a ↓ 4.0 c 1.9 a ↓Mainland South - - - - ** ** 0.0 a ** ** **
Mainland North - - ** ** ** 0.0 d 2.7 a 0.6 a ↓ 3.3 c 0.5 b ↓City of Halifax (Zones 1-4) ** ** ** ** ** ** 2.1 a 0.4 a ↓ 2.7 b 0.6 a ↓Dartmouth North ** ** ** ** ** ** ** ** ** **
Dartmouth South - - - - - - ** ** ** **
Dartmouth East - - ** ** ** ** ** ** 0.0 a **
City of Dartmouth (Zones 5-7) ** ** ** ** ** ** ** 4.1 d ** 5.8 d
Bedford - - - - ** ** ** ** ** **
Sackville - - - - ** ** ** 0.0 a 0.0 d 0.0 c -
Remainder of CMA - - ** ** 0.0 a 0.0 d - 0.0 a 37.5 a ↑ 0.0 a **
Halifax CMA ** ** ** ** ** 0.6 b 1.9 b 3.5 b ↑ 2.7 b 2.8 b -
Oct-17 Oct-18Oct-17 Oct-18 Oct-17 Oct-183 Bedroom + Total
ZoneBachelor 1 Bedroom 2 Bedroom
Oct-17 Oct-18 Oct-17 Oct-18
Peninsula South ** ** ** ** ** ** ** ** ** 1,654 d
Peninsula North - - ** 986 a ** 1,146 a 1,456 a ** 1,178 b 1,208 b
Mainland South - - - - ** ** 1,500 a 1,570 a 1,344 b 1,399 b
Mainland North - - ** ** ** 1,021 c 1,438 a 1,488 a 1,299 b 1,335 b
City of Halifax (Zones 1-4) ** ** 748 c 866 c 966 b 1,068 b 1,530 a 1,547 a 1,361 b 1,354 b
Dartmouth North ** ** ** ** ** ** 942 b 963 b 851 b 824 b
Dartmouth South - - - - - - ** ** ** **
Dartmouth East - - ** ** ** ** ** ** 1,057 a **
City of Dartmouth (Zones 5-7) ** ** ** ** ** ** 1,009 b 1,030 a 924 b 927 a
Bedford - - - - ** ** ** ** ** **
Sackville - - - - ** 1,444 a ** 1,453 a 1,355 a 1,449 a
Remainder of CMA - - ** ** 1,437 a 1,481 a 1,475 a 1,375 a 1,449 a 1,417 a
Halifax CMA ** ** 814 c 893 b 1,091 b 1,200 b 1,444 a 1,447 a 1,310 a 1,316 a
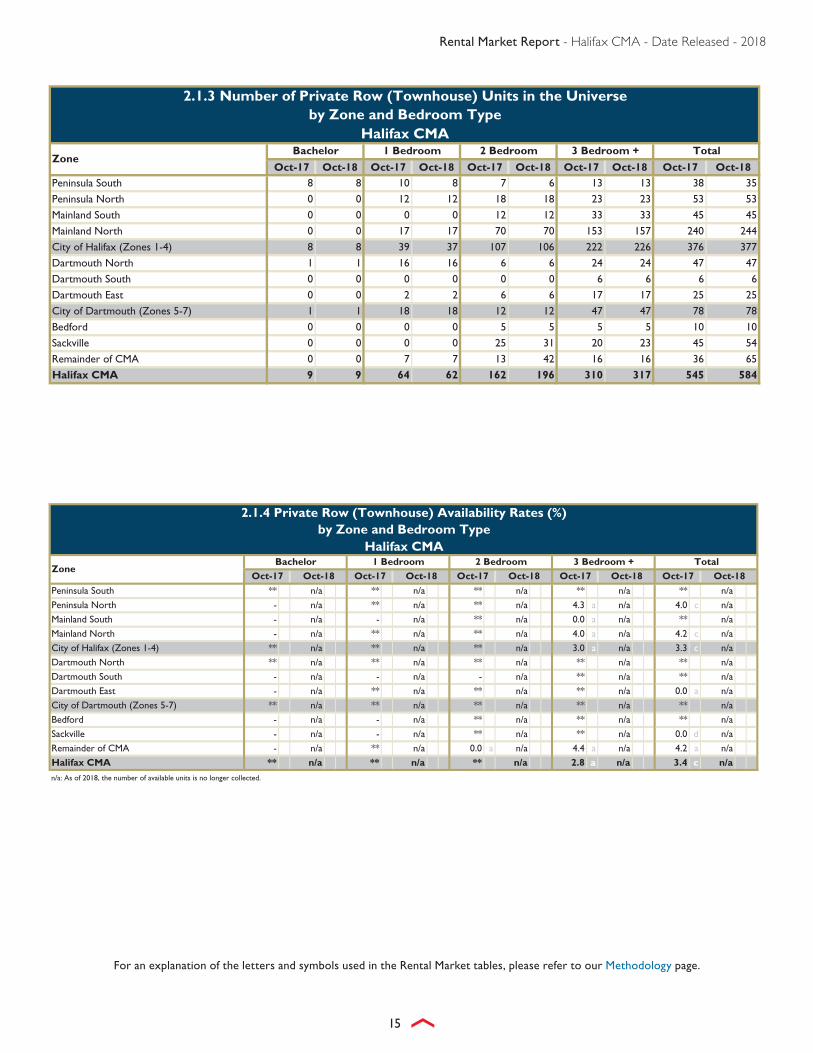
Dartmouth East - n/a ** n/a ** n/a ** n/a 0.0 a n/a
City of Dartmouth (Zones 5-7) ** n/a ** n/a ** n/a ** n/a ** n/a
Bedford - n/a - n/a ** n/a ** n/a ** n/a
Sackville - n/a - n/a ** n/a ** n/a 0.0 d n/a
Remainder of CMA - n/a ** n/a 0.0 a n/a 4.4 a n/a 4.2 a n/a
Halifax CMA ** n/a ** n/a ** n/a 2.8 a n/a 3.4 c n/a
n/a: As of 2018, the number of available units is no longer collected.
Oct-17 Oct-18Oct-17 Oct-18 Oct-17 Oct-183 Bedroom + Total
ZoneBachelor 1 Bedroom 2 Bedroom
Oct-17 Oct-18 Oct-17 Oct-18
Rental Market Report - Halifax CMA - Date Released - 2018
16
For an explanation of the letters and symbols used in the Rental Market tables, please refer to our Methodology page.
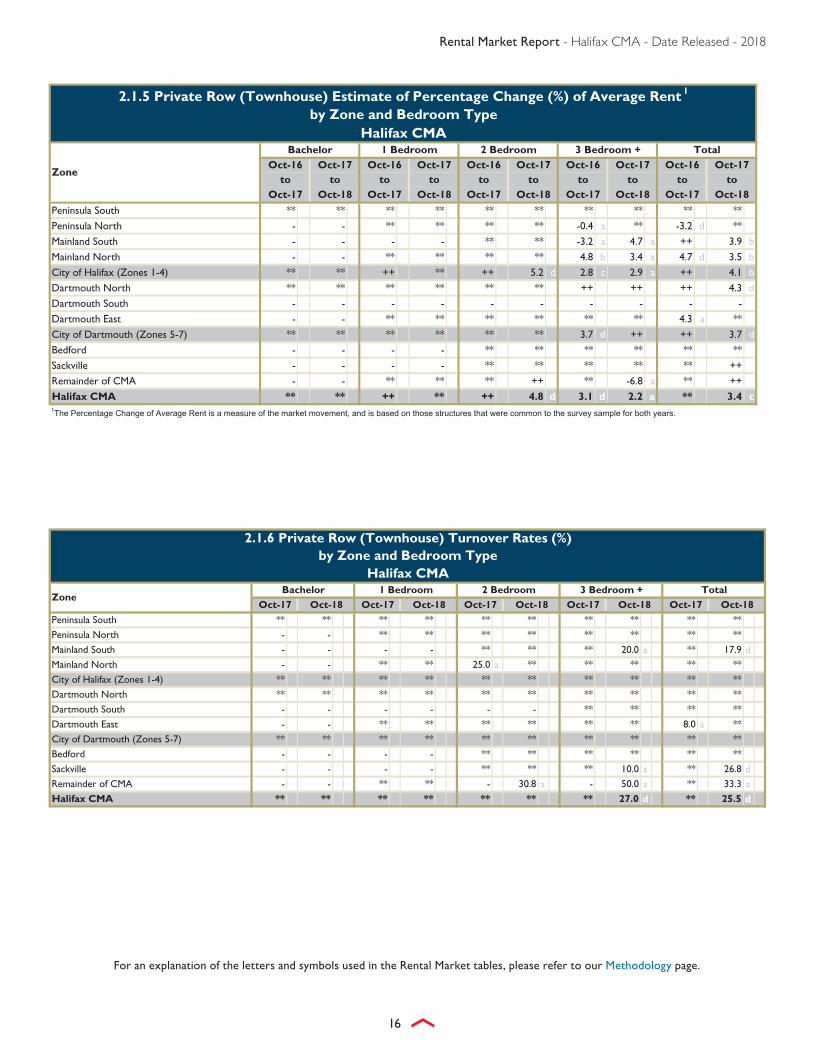
2.1.5 Private Row (Townhouse) Estimate of Percentage Change (%) of Average Rent 1
by Zone and Bedroom TypeHalifax CMA
Peninsula South ** ** ** ** ** ** ** ** ** **
Peninsula North - - ** ** ** ** -0.4 a ** -3.2 d **
Mainland South - - - - ** ** -3.2 a 4.7 a ++ 3.9 b
Mainland North - - ** ** ** ** 4.8 b 3.4 a 4.7 d 3.5 b
City of Halifax (Zones 1-4) ** ** ++ ** ++ 5.2 d 2.8 c 2.9 a ++ 4.1 b
Dartmouth North ** ** ** ** ** ** ++ ++ ++ 4.3 d
Dartmouth South - - - - - - - - - -
Dartmouth East - - ** ** ** ** ** ** 4.3 a **
City of Dartmouth (Zones 5-7) ** ** ** ** ** ** 3.7 d ++ ++ 3.7 d
Bedford - - - - ** ** ** ** ** **
Sackville - - - - ** ** ** ** ** ++
Remainder of CMA - - ** ** ** ++ ** -6.8 a ** ++
Halifax CMA ** ** ++ ** ++ 4.8 d 3.1 d 2.2 a ** 3.4 c1The Percentage Change of Average Rent is a measure of the market movement, and is based on those structures that were common to the survey sample for both years.
Oct-17 Oct-18
Oct-17
Oct-17 Oct-18 Oct-17
Oct-16
Oct-18
Oct-17to to
2 Bedroom
Zone
Bachelor 1 Bedroom
to to to toOct-16 Oct-17 Oct-16
3 Bedroom + TotalOct-16 Oct-17 Oct-16 Oct-17
Oct-17 Oct-18to to
Oct-17 Oct-18to to
Peninsula South ** ** ** ** ** ** ** ** ** ** Peninsula North - - ** ** ** ** ** ** ** ** Mainland South - - - - ** ** ** 20.0 a ** 17.9 d Mainland North - - ** ** 25.0 a ** ** ** ** ** City of Halifax (Zones 1-4) ** ** ** ** ** ** ** ** ** ** Dartmouth North ** ** ** ** ** ** ** ** ** ** Dartmouth South - - - - - - ** ** ** ** Dartmouth East - - ** ** ** ** ** ** 8.0 a ** City of Dartmouth (Zones 5-7) ** ** ** ** ** ** ** ** ** ** Bedford - - - - ** ** ** ** ** ** Sackville - - - - ** ** ** 10.0 a ** 26.8 d Remainder of CMA - - ** ** - 30.8 a - 50.0 a ** 33.3 a Halifax CMA ** ** ** ** ** ** ** 27.0 d ** 25.5 d
2.1.6 Private Row (Townhouse) Turnover Rates (%)by Zone and Bedroom Type
Halifax CMA
ZoneBachelor 1 Bedroom
Oct-18 Oct-17 Oct-18
Oct-18 Oct-17 Oct-18 Oct-17
Oct-18 Oct-172 Bedroom 3 Bedroom + Total
Oct-17
Rental Market Report - Halifax CMA - Date Released - 2018
17
For an explanation of the letters and symbols used in the Rental Market tables, please refer to our Methodology page.
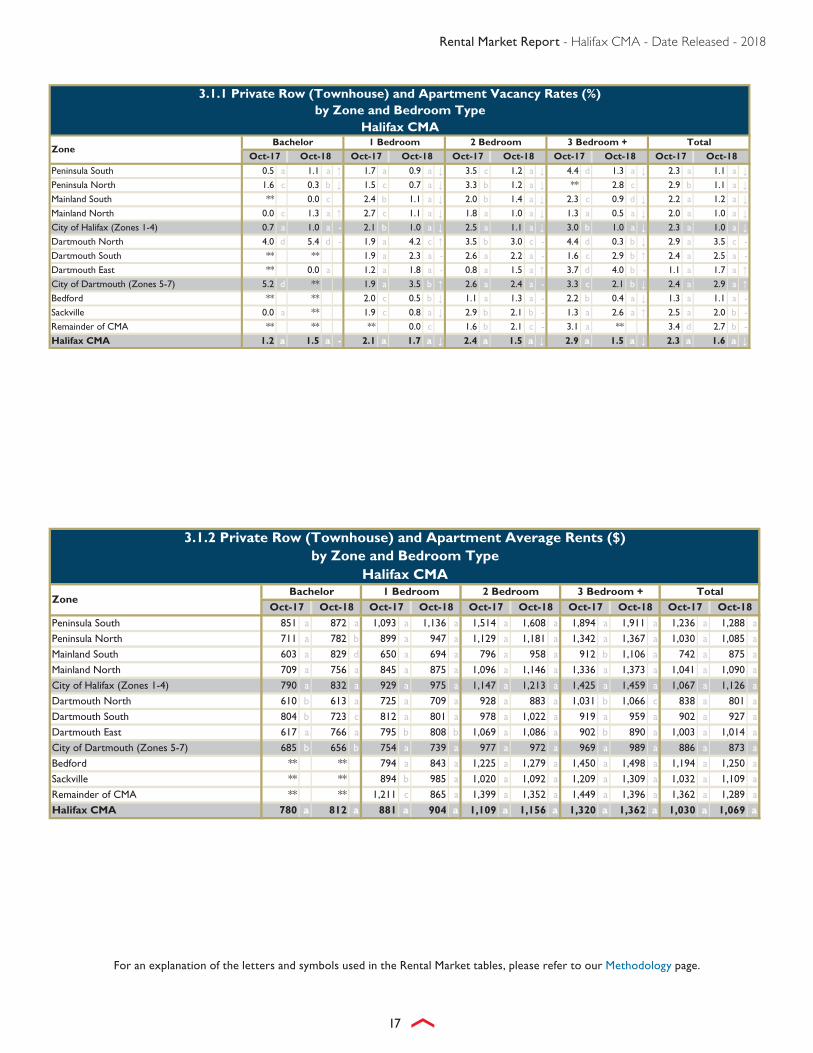
3.1.1 Private Row (Townhouse) and Apartment Vacancy Rates (%)by Zone and Bedroom Type
Halifax CMA
Peninsula South 0.5 a 1.1 a ↑ 1.7 a 0.9 a ↓ 3.5 c 1.2 a ↓ 4.4 d 1.3 a ↓ 2.3 a 1.1 a ↓Peninsula North 1.6 c 0.3 b ↓ 1.5 c 0.7 a ↓ 3.3 b 1.2 a ↓ ** 2.8 c 2.9 b 1.1 a ↓Mainland South ** 0.0 c 2.4 b 1.1 a ↓ 2.0 b 1.4 a ↓ 2.3 c 0.9 d ↓ 2.2 a 1.2 a ↓Mainland North 0.0 c 1.3 a ↑ 2.7 c 1.1 a ↓ 1.8 a 1.0 a ↓ 1.3 a 0.5 a ↓ 2.0 a 1.0 a ↓City of Halifax (Zones 1-4) 0.7 a 1.0 a - 2.1 b 1.0 a ↓ 2.5 a 1.1 a ↓ 3.0 b 1.0 a ↓ 2.3 a 1.0 a ↓Dartmouth North 4.0 d 5.4 d - 1.9 a 4.2 c ↑ 3.5 b 3.0 c - 4.4 d 0.3 b ↓ 2.9 a 3.5 c -
Dartmouth South ** ** 1.9 a 2.3 a - 2.6 a 2.2 a - 1.6 c 2.9 b ↑ 2.4 a 2.5 a -
Dartmouth East ** 0.0 a 1.2 a 1.8 a - 0.8 a 1.5 a ↑ 3.7 d 4.0 b - 1.1 a 1.7 a ↑City of Dartmouth (Zones 5-7) 5.2 d ** 1.9 a 3.5 b ↑ 2.6 a 2.4 a - 3.3 c 2.1 b ↓ 2.4 a 2.9 a ↑Bedford ** ** 2.0 c 0.5 b ↓ 1.1 a 1.3 a - 2.2 b 0.4 a ↓ 1.3 a 1.1 a -
Sackville 0.0 a ** 1.9 c 0.8 a ↓ 2.9 b 2.1 b - 1.3 a 2.6 a ↑ 2.5 a 2.0 b -
Remainder of CMA ** ** ** 0.0 c 1.6 b 2.1 c - 3.1 a ** 3.4 d 2.7 b -
Halifax CMA 1.2 a 1.5 a - 2.1 a 1.7 a ↓ 2.4 a 1.5 a ↓ 2.9 a 1.5 a ↓ 2.3 a 1.6 a ↓
Oct-17 Oct-18Oct-17 Oct-18 Oct-17 Oct-183 Bedroom + Total
ZoneBachelor 1 Bedroom 2 Bedroom
Oct-17 Oct-18 Oct-17 Oct-18
Peninsula South 851 a 872 a 1,093 a 1,136 a 1,514 a 1,608 a 1,894 a 1,911 a 1,236 a 1,288 a
Peninsula North 711 a 782 b 899 a 947 a 1,129 a 1,181 a 1,342 a 1,367 a 1,030 a 1,085 a
Mainland South 603 a 829 d 650 a 694 a 796 a 958 a 912 b 1,106 a 742 a 875 a
Mainland North 709 a 756 a 845 a 875 a 1,096 a 1,146 a 1,336 a 1,373 a 1,041 a 1,090 a
City of Halifax (Zones 1-4) 790 a 832 a 929 a 975 a 1,147 a 1,213 a 1,425 a 1,459 a 1,067 a 1,126 a
Dartmouth North 610 b 613 a 725 a 709 a 928 a 883 a 1,031 b 1,066 c 838 a 801 a
Dartmouth South 804 b 723 c 812 a 801 a 978 a 1,022 a 919 a 959 a 902 a 927 a
Dartmouth East 617 a 766 a 795 b 808 b 1,069 a 1,086 a 902 b 890 a 1,003 a 1,014 a
City of Dartmouth (Zones 5-7) 685 b 656 b 754 a 739 a 977 a 972 a 969 a 989 a 886 a 873 a
Bedford ** ** 794 a 843 a 1,225 a 1,279 a 1,450 a 1,498 a 1,194 a 1,250 a
Sackville ** ** 894 b 985 a 1,020 a 1,092 a 1,209 a 1,309 a 1,032 a 1,109 a
Remainder of CMA ** ** 1,211 c 865 a 1,399 a 1,352 a 1,449 a 1,396 a 1,362 a 1,289 a
Halifax CMA 780 a 812 a 881 a 904 a 1,109 a 1,156 a 1,320 a 1,362 a 1,030 a 1,069 a
3.1.4 Private Row (Townhouse) and Apartment Availability Rates (%)by Zone and Bedroom Type
Halifax CMA
Peninsula South 2.2 b n/a 2.9 a n/a 4.3 c n/a 4.6 d n/a 3.3 b n/a
Peninsula North 3.2 d n/a 2.8 b n/a 4.5 b n/a ** n/a 4.1 b n/a
Mainland South ** n/a 3.1 c n/a 2.7 b n/a 2.3 c n/a 2.8 a n/a
Mainland North 0.3 a n/a 3.3 d n/a 2.4 a n/a 1.5 a n/a 2.5 a n/a
City of Halifax (Zones 1-4) 2.1 a n/a 3.0 b n/a 3.2 a n/a 3.3 b n/a 3.1 a n/a
Dartmouth North 4.7 d n/a 2.5 a n/a 4.6 b n/a 4.4 d n/a 3.7 a n/a
Dartmouth South ** n/a 2.7 a n/a 2.9 a n/a 1.6 c n/a 2.9 a n/a
Dartmouth East ** n/a 1.9 c n/a 1.5 a n/a 3.7 d n/a 1.7 a n/a
City of Dartmouth (Zones 5-7) 5.6 d n/a 2.5 a n/a 3.4 a n/a 3.3 c n/a 3.1 a n/a
Bedford ** n/a 2.0 c n/a 1.8 a n/a 2.9 b n/a 2.0 a n/a
Sackville 0.0 a n/a 1.9 c n/a 3.9 b n/a 3.6 c n/a 3.5 b n/a
Remainder of CMA ** n/a ** n/a 3.0 a n/a 4.7 a n/a 4.6 c n/a
Halifax CMA 2.4 a n/a 3.0 a n/a 3.2 a n/a 3.4 b n/a 3.1 a n/a
n/a: As of 2018, the number of available units is no longer collected.
Oct-17 Oct-18Oct-17 Oct-18 Oct-17 Oct-183 Bedroom + Total
ZoneBachelor 1 Bedroom 2 Bedroom
Oct-17 Oct-18 Oct-17 Oct-18
Rental Market Report - Halifax CMA - Date Released - 2018
19
For an explanation of the letters and symbols used in the Rental Market tables, please refer to our Methodology page.
3.1.5 Private Row (Townhouse) and Apartment Estimate of Percentage Change (%) of Average Rent 1
by Zone and Bedroom TypeHalifax CMA
Peninsula South 2.0 c 2.4 b 3.0 c 4.1 c 4.7 c 1.1 d ++ ** 3.7 c 2.5 b
Peninsula North 4.7 c ++ 3.4 d ++ 3.9 c 1.7 c ++ ++ 3.8 c 1.4 a
Mainland South 3.9 d ++ 1.2 d 3.9 c 1.2 a 3.8 c ++ 4.4 d 1.5 a 3.7 b
Mainland North 1.0 d 4.5 c 1.5 a 1.9 b 2.7 a 1.1 a 2.9 b 1.5 d 2.3 a 1.6 b
City of Halifax (Zones 1-4) 2.5 b 3.1 d 2.3 b 2.6 a 3.3 b 1.5 a 2.9 c 2.1 c 2.9 a 2.0 a
Dartmouth North ++ ++ 2.7 c 1.9 c 1.7 c 1.4 a ++ ** 1.9 c 1.3 a
Dartmouth South ** ++ 1.5 b 2.1 c 1.8 c 2.4 b 0.6 a 3.6 b 1.2 a 2.3 b
Dartmouth East ** ** 2.2 c 4.9 d ++ 2.7 c ++ ++ ++ 2.9 b
City of Dartmouth (Zones 5-7) ** ++ 2.4 b 2.4 c 1.6 c 1.9 b ++ 4.2 c 1.6 c 1.8 b
Bedford ** ** -1.2 d 4.3 b -1.4 d 5.2 c ++ 2.5 c -1.4 d 4.6 c
Sackville ** ** 4.1 c 7.4 c 1.6 c 5.9 c ++ 3.9 d 1.8 c 6.1 c
Remainder of CMA ** ** 2.3 c ++ 1.5 d ++ ** 1.4 d ** ++
Halifax CMA 2.6 b 2.2 c 2.2 a 2.6 a 2.6 a 1.9 a 2.0 c 2.6 b 2.3 a 2.1 a1The Percentage Change of Average Rent is a measure of the market movement, and is based on those structures that were common to the survey sample for both years.
Oct-17 Oct-18
Oct-17
Oct-17 Oct-18 Oct-17
Oct-16
Oct-18
Oct-17to to
2 Bedroom
Zone
Bachelor 1 Bedroom
to to to toOct-16 Oct-17 Oct-16
3 Bedroom + TotalOct-16 Oct-17 Oct-16 Oct-17
Oct-17 Oct-18to to
Oct-17 Oct-18to to
Peninsula South ** 22.9 d 33.1 a ** 38.6 a ** ** ** 36.1 a ** Peninsula North ** ** 28.4 a ** 29.3 d ** ** ** 28.9 d ** Mainland South ** ** 23.3 d ** 26.8 d 13.1 d ↓ ** 6.7 c 25.4 a 13.7 c ↓Mainland North ** 8.8 c 21.7 d 15.5 d ↓ 19.5 a 16.7 a ↓ 18.3 d 14.1 c ↓ 19.8 a 15.7 a ↓City of Halifax (Zones 1-4) ** 20.2 d 27.4 a 23.6 a ↓ 25.5 a 18.7 a ↓ 25.0 d 19.8 d ↓ 26.6 a 20.6 a ↓Dartmouth North ** ** 19.6 d 24.8 d ↑ 18.1 d 26.2 d ↑ ** ** 18.5 d 24.8 d ↑Dartmouth South ** ** 20.6 d 19.7 d - 22.3 d ** ** ** 22.1 d ** Dartmouth East ** ** 22.0 d ** 16.9 d 17.6 d - ** ** 18.5 d 17.9 d -City of Dartmouth (Zones 5-7) ** ** 20.1 d 22.8 d - 18.8 a 23.2 d ↑ ** ** 19.4 a 22.8 a ↑Bedford ** ** ** 8.4 c 18.6 d ** 15.4 d 10.2 c ↓ 18.9 d 15.2 d ↓Sackville ** ** 13.5 c 11.1 c ↓ 13.8 c 26.9 a ↑ ** 13.2 a 13.8 c 22.0 a ↑Remainder of CMA ** ** 5.2 d ** 11.7 c ** ** ** 10.4 c ** Halifax CMA ** 18.9 d 25.1 a 22.7 a ↓ 22.5 a 20.2 a ↓ 22.4 a 19.8 a - 23.8 a 20.9 a ↓
3.1.6 Private Row (Townhouse) and Apartment Turnover Rates (%)by Zone and Bedroom Type
Halifax CMA
ZoneBachelor 1 Bedroom
Oct-18 Oct-17 Oct-18
Oct-18 Oct-17 Oct-18 Oct-17
Oct-18 Oct-172 Bedroom 3 Bedroom + Total
Oct-17
Rental Market Report - Halifax CMA - Date Released - 2018
20
For an explanation of the letters and symbols used in the Rental Market tables, please refer to our Methodology page.
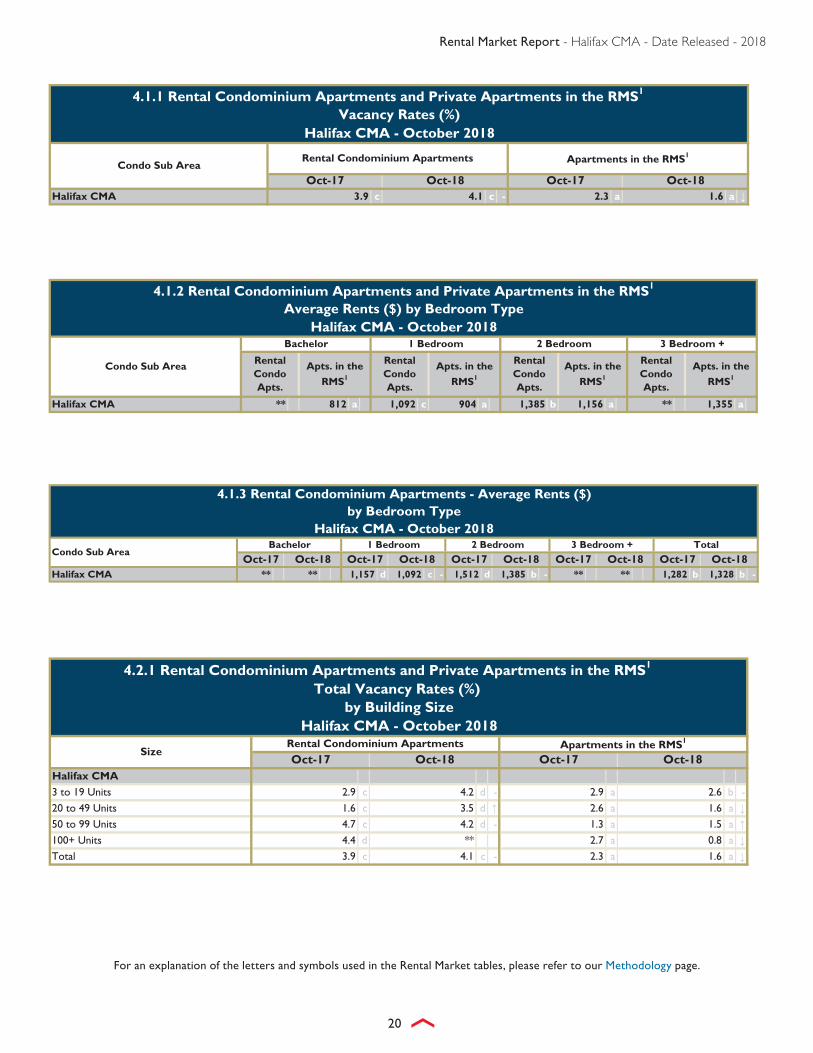
Halifax CMA 3.9 c 4.1 c - 2.3 a 1.6 a ↓
Rental Condominium Apartments Apartments in the RMS1
4.1.1 Rental Condominium Apartments and Private Apartments in the RMS1
Vacancy Rates (%)Halifax CMA - October 2018
Condo Sub AreaOct-17 Oct-18 Oct-17 Oct-18
Halifax CMA ** 812 a 1,092 c 904 a 1,385 b 1,156 a ** 1,355 a
4.1.2 Rental Condominium Apartments and Private Apartments in the RMS1
Average Rents ($) by Bedroom TypeHalifax CMA - October 2018
Condo Sub Area
Bachelor 1 Bedroom 2 Bedroom 3 Bedroom +
Apts. in the
RMS1
Apts. in the
RMS1
Rental Condo Apts.
Apts. in the
RMS1
Rental Condo Apts.
Rental Condo Apts.
Apts. in the
RMS1
Rental Condo Apts.
4.1.3 Rental Condominium Apartments - Average Rents ($)by Bedroom Type
Halifax CMA - October 2018
Halifax CMA ** ** 1,157 d 1,092 c - 1,512 d 1,385 b - ** ** 1,282 b 1,328 b -Oct-17 Oct-18
3 Bedroom + Total
Oct-17 Oct-18Condo Sub Area
Bachelor 1 Bedroom 2 Bedroom
Oct-17 Oct-18Oct-17 Oct-18 Oct-17 Oct-18
Halifax CMA3 to 19 Units 2.9 c 4.2 d - 2.9 a 2.6 b -
20 to 49 Units 1.6 c 3.5 d ↑ 2.6 a 1.6 a ↓50 to 99 Units 4.7 c 4.2 d - 1.3 a 1.5 a ↑100+ Units 4.4 d ** 2.7 a 0.8 a ↓Total 3.9 c 4.1 c - 2.3 a 1.6 a ↓
Oct-17 Oct-18
4.2.1 Rental Condominium Apartments and Private Apartments in the RMS1
by Building SizeTotal Vacancy Rates (%)
Halifax CMA - October 2018
Oct-17 Oct-18Size
Rental Condominium Apartments Apartments in the RMS1
Rental Market Report - Halifax CMA - Date Released - 2018
21
For an explanation of the letters and symbols used in the Rental Market tables, please refer to our Methodology page.
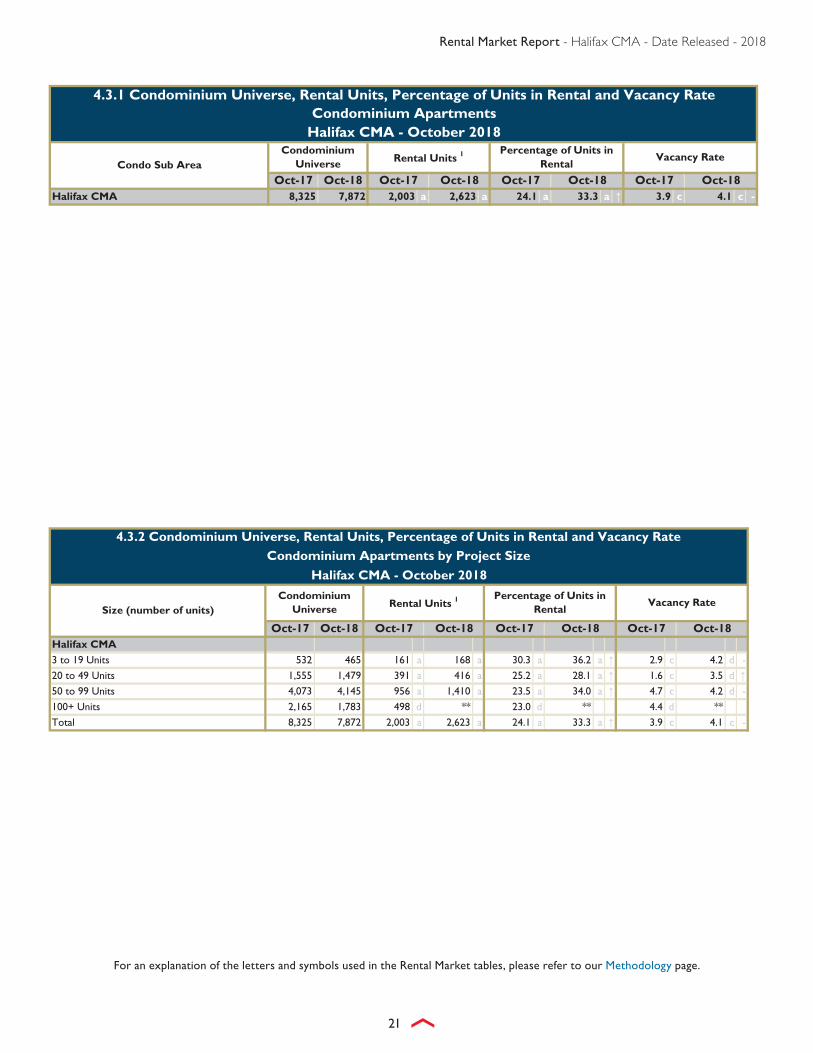
Oct-17 Oct-18Halifax CMA 8,325 7,872 2,003 a 2,623 a 24.1 a 33.3 a ↑ 3.9 c 4.1 c -
4.3.1 Condominium Universe, Rental Units, Percentage of Units in Rental and Vacancy RateCondominium Apartments
Halifax CMA - October 2018
Rental Units 1Percentage of Units in
RentalVacancy Rate
Condominium Universe
Oct-17 Oct-18Condo Sub Area
Oct-17 Oct-18 Oct-17 Oct-18
Oct-17 Oct-18Halifax CMA3 to 19 Units 532 465 161 a 168 a 30.3 a 36.2 a ↑ 2.9 c 4.2 d -
20 to 49 Units 1,555 1,479 391 a 416 a 25.2 a 28.1 a ↑ 1.6 c 3.5 d ↑50 to 99 Units 4,073 4,145 956 a 1,410 a 23.5 a 34.0 a ↑ 4.7 c 4.2 d -
100+ Units 2,165 1,783 498 d ** 23.0 d ** 4.4 d **
Total 8,325 7,872 2,003 a 2,623 a 24.1 a 33.3 a ↑ 3.9 c 4.1 c -
4.3.2 Condominium Universe, Rental Units, Percentage of Units in Rental and Vacancy RateCondominium Apartments by Project Size
Halifax CMA - October 2018
Rental Units 1Percentage of Units in
RentalVacancy Rate
Condominium Universe
Oct-17 Oct-18
Size (number of units)
Oct-17 Oct-18 Oct-17 Oct-18
Rental Market Report - Halifax CMA - Date Released - 2018
22
Rental Market Report - Halifax CMA - Date Released - 2018
23
Canada Mortgage and Housing Corporation (CMHC) conducts the Rental Market Survey (RMS) every year in October to estimate the relative strengths in the rental market. The survey is conducted on a sample basis in all urban areas with populations of 10,000 and more. The survey targets only privately initiated structures with at least three rental units, which have been on the market for at least three months. The survey collects market rent levels, availability (outside Quebec), turnover and vacancy unit data for all sampled structures.
The survey is conducted by a combination of telephone interviews and site visits, and information is obtained from the owner, manager, or building superintendent. The survey is conducted during the first two weeks of October, and the results reflect market conditions at that time.
CMHC is constantly reviewing the Universe of rental structures in the rental market Universe to ensure that it is as complete as possible. Every year, any newly completed rental structures with at least 3 rental units are added to the Universe. In addition to this, CMHC undertakes comprehensive reviews by comparing the Universe listing to other sources of data to ensure that the list of structures is as complete as possible.
CMHC’s Rental Market Survey provides a snapshot of vacancy, availability (outside Quebec), and turnover rates and average rents in both new and existing structures. There also exists a measure for the change in rent that is calculated based on existing structures only. The estimate is based on structures that were common to the survey sample for both the previous and the current Rental Market Surveys. The change in rent in existing structures is an estimate of the change in rent that the landlords charge and removes compositional effects on the rent level movement due to new buildings, conversions, and survey sample rotation. The estimate of percent change in rent is available in all Canada and Provincial Highlights publications, and also in the CMA reports. The rent levels in new and existing structures are also published. While the percent change in rents in existing structures published in the reports are statistically significant, changes in rents that one might calculate based on rent levels in new and existing structures may or may not be statistically significant.
Canada Mortgage and Housing Corporation (CMHC) conducts the Condominium Apartment Survey (CAS) in late summer and early fall to estimate the relative strengths in the condo apartment rental market The CAS collects the number of units being rented out and the vacancy and rent levels of these units in the following CMAs: Calgary, Edmonton, Gatineau, Halifax, Hamilton, Kelowna, Kitchener, London, Montréal, Ottawa, Québec, Regina, Saskatoon, Toronto, Vancouver, Victoria and Winnipeg. The CAS is conducted by telephone interviews and information is obtained from the property management company, condominium (strata) board, or building superintendent. If necessary, this data can be supplemented by site visits if no telephone contact is made.
CMHC publishes the number of units rented, vacancy rates and average rents from the Condominium Apartment Survey. A letter code representing the statistical reliability (i.e., the coefficient of variation (CV)) for each estimate is provided to indicate the data reliability.
L i n k f o r M e t h o d o l o g y p a g e s
Rental Market Report - Halifax CMA - Date Released - 2018
24
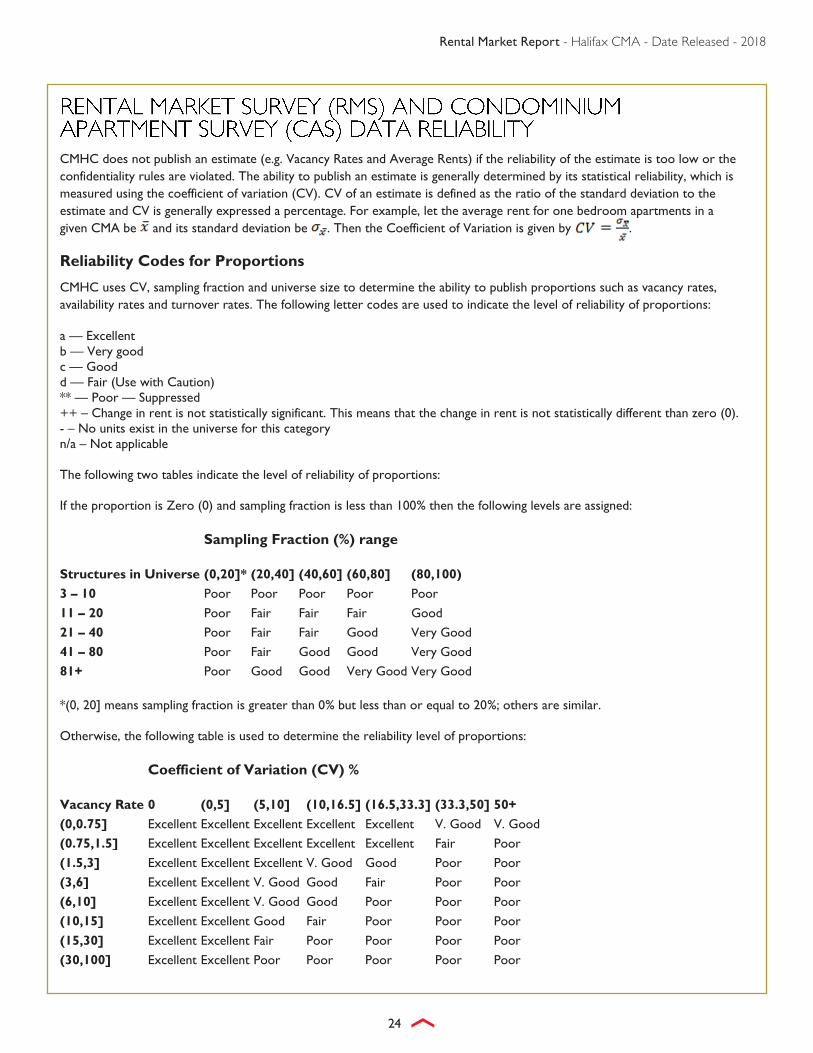
CMHC does not publish an estimate (e.g. Vacancy Rates and Average Rents) if the reliability of the estimate is too low or the confidentiality rules are violated. The ability to publish an estimate is generally determined by its statistical reliability, which is measured using the coefficient of variation (CV). CV of an estimate is defined as the ratio of the standard deviation to the estimate and CV is generally expressed a percentage. For example, let the average rent for one bedroom apartments in a given CMA be and its standard deviation be . Then the Coefficient of Variation is given by .
Reliability Codes for Proportions
CMHC uses CV, sampling fraction and universe size to determine the ability to publish proportions such as vacancy rates, availability rates and turnover rates. The following letter codes are used to indicate the level of reliability of proportions: a — Excellent b — Very good c — Good d — Fair (Use with Caution) ** — Poor — Suppressed ++ – Change in rent is not statistically significant. This means that the change in rent is not statistically different than zero (0). - – No units exist in the universe for this category n/a – Not applicable The following two tables indicate the level of reliability of proportions: If the proportion is Zero (0) and sampling fraction is less than 100% then the following levels are assigned:
Sampling Fraction (%) range
Structures in Universe (0,20]* (20,40] (40,60] (60,80] (80,100)
3 – 10 Poor Poor Poor Poor Poor
11 – 20 Poor Fair Fair Fair Good
21 – 40 Poor Fair Fair Good Very Good
41 – 80 Poor Fair Good Good Very Good
81+ Poor Good Good Very Good Very Good *(0, 20] means sampling fraction is greater than 0% but less than or equal to 20%; others are similar. Otherwise, the following table is used to determine the reliability level of proportions:
Rental Market Report - Halifax CMA - Date Released - 2018
25
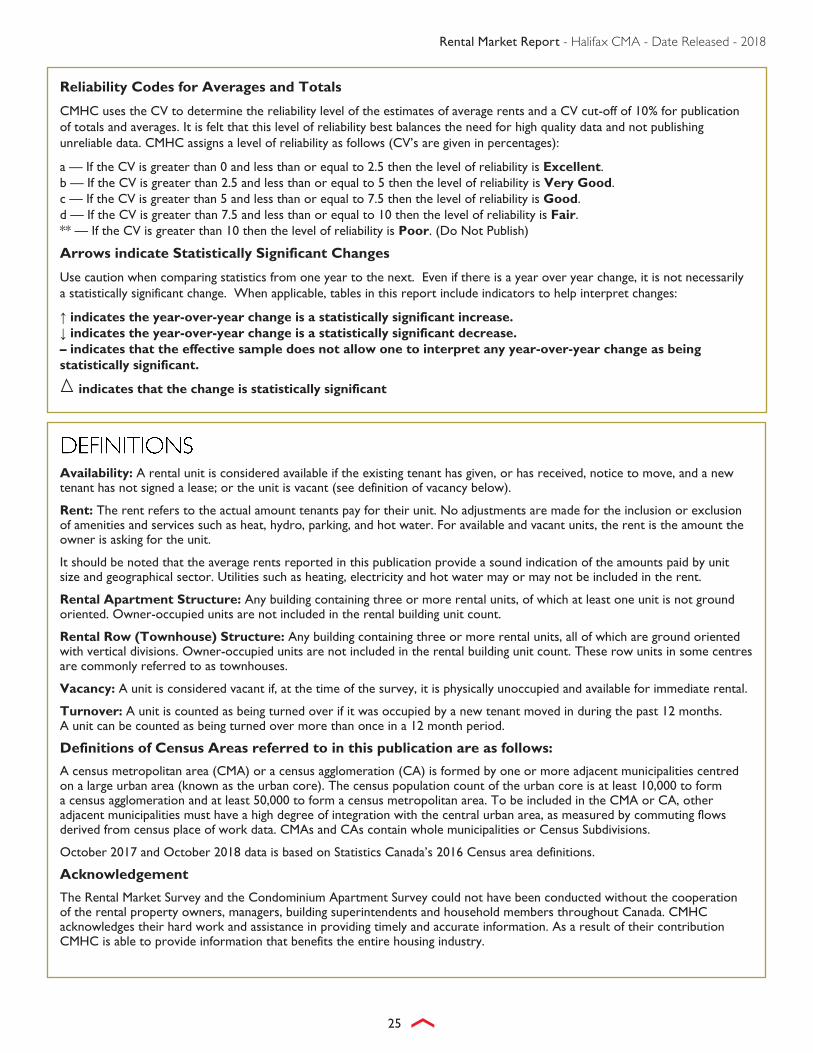
Reliability Codes for Averages and Totals
CMHC uses the CV to determine the reliability level of the estimates of average rents and a CV cut-off of 10% for publication of totals and averages. It is felt that this level of reliability best balances the need for high quality data and not publishing unreliable data. CMHC assigns a level of reliability as follows (CV’s are given in percentages):
a — If the CV is greater than 0 and less than or equal to 2.5 then the level of reliability is Excellent. b — If the CV is greater than 2.5 and less than or equal to 5 then the level of reliability is Very Good. c — If the CV is greater than 5 and less than or equal to 7.5 then the level of reliability is Good. d — If the CV is greater than 7.5 and less than or equal to 10 then the level of reliability is Fair. ** — If the CV is greater than 10 then the level of reliability is Poor. (Do Not Publish)
Arrows indicate Statistically Significant Changes
Use caution when comparing statistics from one year to the next. Even if there is a year over year change, it is not necessarily a statistically significant change. When applicable, tables in this report include indicators to help interpret changes:
↑ indicates the year-over-year change is a statistically significant increase. ↓ indicates the year-over-year change is a statistically significant decrease. – indicates that the effective sample does not allow one to interpret any year-over-year change as being statistically significant.
indicates that the change is statistically significant
Availability: A rental unit is considered available if the existing tenant has given, or has received, notice to move, and a new tenant has not signed a lease; or the unit is vacant (see definition of vacancy below).
Rent: The rent refers to the actual amount tenants pay for their unit. No adjustments are made for the inclusion or exclusion of amenities and services such as heat, hydro, parking, and hot water. For available and vacant units, the rent is the amount the owner is asking for the unit.
It should be noted that the average rents reported in this publication provide a sound indication of the amounts paid by unit size and geographical sector. Utilities such as heating, electricity and hot water may or may not be included in the rent.
Rental Apartment Structure: Any building containing three or more rental units, of which at least one unit is not ground oriented. Owner-occupied units are not included in the rental building unit count.
Rental Row (Townhouse) Structure: Any building containing three or more rental units, all of which are ground oriented with vertical divisions. Owner-occupied units are not included in the rental building unit count. These row units in some centres are commonly referred to as townhouses.
Vacancy: A unit is considered vacant if, at the time of the survey, it is physically unoccupied and available for immediate rental.
Turnover: A unit is counted as being turned over if it was occupied by a new tenant moved in during the past 12 months. A unit can be counted as being turned over more than once in a 12 month period.
Definitions of Census Areas referred to in this publication are as follows:
A census metropolitan area (CMA) or a census agglomeration (CA) is formed by one or more adjacent municipalities centred on a large urban area (known as the urban core). The census population count of the urban core is at least 10,000 to form a census agglomeration and at least 50,000 to form a census metropolitan area. To be included in the CMA or CA, other adjacent municipalities must have a high degree of integration with the central urban area, as measured by commuting flows derived from census place of work data. CMAs and CAs contain whole municipalities or Census Subdivisions.
October 2017 and October 2018 data is based on Statistics Canada’s 2016 Census area definitions.
Acknowledgement
The Rental Market Survey and the Condominium Apartment Survey could not have been conducted without the cooperation of the rental property owners, managers, building superintendents and household members throughout Canada. CMHC acknowledges their hard work and assistance in providing timely and accurate information. As a result of their contribution CMHC is able to provide information that benefits the entire housing industry.
Rental Market Report - Halifax CMA - Date Released - 2018
26
CMHC HELPS CANADIANS MEET THEIR HOUSING NEEDS.
Canada Mortgage and Housing Corporation (CMHC) has been helping Canadians meet their housing needs for more than 70 years. As Canada’s authority on housing, we contribute to the stability of the housing market and financial system, provide support for Canadians in housing need, and offer unbiased housing research and advice to Canadian governments, consumers and the housing industry. Prudent risk management, strong corporate governance and transparency are cornerstones of our operations.
For more information, visit our website at www.cmhc.ca or follow us on Twitter, LinkedIn, Facebook, Instagram and YouTube.
You can also reach us by phone at 1-800-668-2642 or by fax at 1-800-245-9274. Outside Canada call 613-748-2003 or fax to 613-748-2016.
Canada Mortgage and Housing Corporation supports the Government of Canada policy on access to information for people with disabilities. If you wish to obtain this publication in alternative formats, call 1-800-668-2642.
Any use of the publication’s content must include the source of the information, including statistical data, acknowledged as follows:
Source: CMHC (or “Adapted from CMHC,” if appropriate), name of product, year and date of publication issue.
Other than as outlined above, the content of the publication cannot be reproduced or transmitted to any person or, if acquired by an organization, to users outside the organization. Placing the publication, in whole or part, on a website accessible to the public or on any website accessible to persons not directly employed by the organization is not permitted. To use the content of this CMHC publication for any purpose other than the general reference purposes set out above or to request permission to reproduce large portions of, or the entire content of, this CMHC publication, please send a Copyright request to the Housing Knowledge Centre at [email protected]. Please provide the following information: Publication’s name, year and date of issue.
Without limiting the generality of the foregoing, no portion of the content may be translated from English or French into any other language without the prior written permission of Canada Mortgage and Housing Corporation.
The information, analyses and opinions contained in this publication are based on various sources believed to be reliable, but their accuracy cannot be guaranteed. The information, analyses and opinions shall not be taken as representations for which Canada Mortgage and Housing Corporation or any of its employees shall incur responsibility.
■■ Housing Information Monthly■■ Housing Market Assessment■■ Housing Market Insight■■ Housing Now Tables■■ Housing Market Outlook, Canada■■ Housing Market Outlook, Highlight Reports – Northern Housing■■ Housing Market Outlook, Canada and Major Centres■■ Preliminary Housing Starts Data■■ Rental Market Reports, Canada and Provincial Highlights ■■ Rental Market Reports, Major Centres■■ Seniors’ Housing Reports■■ Mortgage and Consumer Credit Trends Report
DATA TABLES AVAILABLE ONLINE■■ Funding and Securitization Data■■ Household Characteristics■■ Housing Market Data■■ Housing Market Indicators■■ Mortgage and Debt Data■■ Rental Market Data
PUBLICATIONS AND REPORTS AVAILABLE ONLINELocal, regional and national analysis and data on current market conditions and future trends.
HOUSING MARKET INFORMATION PORTALThe housing data you want, the way you want it.
■✔ Information in one central location
■✔ Desktop and mobile friendly
■✔ Neighbourhood-level data
cmhc.ca/hmiportal
SUBSCRIBE NOWGet email notifications when CMHC publications are released or updated. Sign up for a free myCMHC account for enhanced site access, including one-click subscriptions to the reports and tables that matter to you.
Get your myCMHC account today!
Get the market intelligence you need today!Find all the latest trends, research and insights at cmhc.ca/housingmarketinformation
Housing market intelligence you can count on
Housing ObserverFeaturing quick reads and videos on...
• Analysis and data • Timely insights• Updates to housing conditions, trends and much more!