Drivers of pension performance Simulating pension outcomes using penCalc Renuka Sane National Institute of Public Finance and Policy Presented at the IGIDR Household Finance Workshop, Mumbai 24 February, 2018 Renuka Sane National Institute of Public Finance and Policy Presented at the IGIDR Household Finance Workshop, Mumbai penCalc
Transcript
Drivers of pension performance
Simulating pension outcomes using penCalc
Renuka SaneNational Institute of Public Finance and Policy
Presented at the IGIDR Household Finance Workshop, Mumbai
24 February, 2018
Renuka Sane National Institute of Public Finance and Policy Presented at the IGIDR Household Finance Workshop, Mumbai
penCalc
Drivers of pension performance
Context
Modeling pension outcomes is a critical part of good policy design for apension system.
Historically, those running Defined Benefit funds have been significantusers of modeling
The shift to Defined Contribution pensions puts a much higher premiumon understanding the likely outcomes from a given path of contributionsand investments
Useful for members as well as policy makers
Renuka Sane National Institute of Public Finance and Policy Presented at the IGIDR Household Finance Workshop, Mumbai
penCalc
Drivers of pension performance
This paper
Sets out a new model for pension outcomes called penCalc
The use of the model is illustrated for India’s National Pension
Renuka Sane National Institute of Public Finance and Policy Presented at the IGIDR Household Finance Workshop, Mumbai
penCalc
Drivers of pension performance
penCalc
library in R
Calculates the expected monthly pension payments
The package may be installed as followsdevtools::install_github("renukasane/penCalc").
Renuka Sane National Institute of Public Finance and Policy Presented at the IGIDR Household Finance Workshop, Mumbai
penCalc
Drivers of pension performance
Structure of the talk
Drivers of pension performance
Overview of the model
Results
Renuka Sane National Institute of Public Finance and Policy Presented at the IGIDR Household Finance Workshop, Mumbai
penCalc
Overview of penCalc
Part I
Drivers of pension performance
Renuka Sane National Institute of Public Finance and Policy Presented at the IGIDR Household Finance Workshop, Mumbai
Renuka Sane National Institute of Public Finance and Policy Presented at the IGIDR Household Finance Workshop, Mumbai
penCalc
Overview of penCalc
Inflation
46
810
12
YoY
Cha
nge
(Per
cen
t)
1985 1991 1997 2004 2010 2017
Mar 2016; 5.65
We have had very high volatility in inflation
August 2016, the GOI backed the inflation strategy of the Reserve Bank ofIndia (RBI)
We expect that inflation will have a tight distribution around the mean of4%.
Renuka Sane National Institute of Public Finance and Policy Presented at the IGIDR Household Finance Workshop, Mumbai
penCalc
Overview of penCalc
Equity premium
Over the span of 36 years, equity has given returns of 16%.
The annualised standard deviation is 24.9%
Renuka Sane National Institute of Public Finance and Policy Presented at the IGIDR Household Finance Workshop, Mumbai
penCalc
Overview of penCalc
Bond returns
If we do assume a 4% inflation rate, government bonds at the short endshould be around 6%, and on the long end should be around 9%.
Assume that average nominal return for government bonds of 7%
Assume a 3% premium on corporate bonds. Hence, a nominal return of10%.
Renuka Sane National Institute of Public Finance and Policy Presented at the IGIDR Household Finance Workshop, Mumbai
penCalc
Overview of penCalc
Annuity prices
The prices for an annuity (Jeevan Akshay VI) which begins at age 60 and paysRs.1 for life works out to be
Rs.4087 for a nominal annuity
Rs.4440 for a nominal annuity with a provision of 50% of the annuitypayable to spouse (for life) on death of the annuitant.
Rs.5589 for an annuity with a provision of 100% of the annuity payable tospouse (for life) on death of annuitant, and return of purchase price on thedeath of last survivor
Renuka Sane National Institute of Public Finance and Policy Presented at the IGIDR Household Finance Workshop, Mumbai
penCalc
Results
Part II
Overview of penCalc
Renuka Sane National Institute of Public Finance and Policy Presented at the IGIDR Household Finance Workshop, Mumbai
penCalc
Results
Inputs
Age at entry, age at exit
WagesSingle number, and a growth rate in wagesVector of different values
Renuka Sane National Institute of Public Finance and Policy Presented at the IGIDR Household Finance Workshop, Mumbai
penCalc
Results
Inputs (contd)
ReturnsMean returns for the three asset classesStandard deviation of returns for the three asset classes
Fees and expensesMonthly fees (% AUM)Annual flat fee (Rs.)
AnnuitiesPercent to be annuitisedPrice of annuity
Renuka Sane National Institute of Public Finance and Policy Presented at the IGIDR Household Finance Workshop, Mumbai
penCalc
Results
Assumptions
AgeAge of entry 25Age of exit 60Wages and contributionsStarting wage Rs.25,000 (US$386) per month.Wage growth (nominal) 8% per anumContribution rate 20% of wageInflation (mean, sd) (4%, 0)Investment portfolio LifecyleReturns (nominal)GOI bonds (mean, sd) (7%, 0)Corporate bonds (mean, sd) (10%, 0)Equities (mean, sd) (16%, 25%)FeesAUM 0.01% per anumFlat fee Rs.100 (US$1.5) per anumAnnuitiesPercent to be annuitised 40%Annuity price (for Rs.1 per day nominal annuity) Rs.4,087 (US$63)
Renuka Sane National Institute of Public Finance and Policy Presented at the IGIDR Household Finance Workshop, Mumbai
penCalc
Results
Structure of the code
x <- pencalc(age=list(age.entry=25
,age.exit=60),
wage=list(25000
,0.08
,0.2
,initial.amount=0),
inflation=list(c(0.04,0)
,real=TRUE),
inv.weights=list("lc"),
returns=list(data.frame(mean=c(0.07, 0.10, 0.16),
sd=c(0, 0, 0.25)),
c(monthly.fees.expenses=0.01, 100)),
annuity=list(perc.annuitised=0.4,
value=4087))
Renuka Sane National Institute of Public Finance and Policy Presented at the IGIDR Household Finance Workshop, Mumbai
penCalc
Results
The working of the model
Starting wage and the yearly growth rate in wages are used to generate avector of wages for the years the subscriber is expected to be in the system
The wages are expected to stay the same in each month of the year.
The default number of years is 60-25+1, that is 36 years.
The contribution rate is then used on this vector of wages to arrive at therupee value of contributions
The mean and standard deviations of the underlying instruments (bondsand equity) are used to simulate returns on the investment each year as adraw from a normal distribution.
The returns are annualized figures, and are converted to monthly returns.
Renuka Sane National Institute of Public Finance and Policy Presented at the IGIDR Household Finance Workshop, Mumbai
penCalc
Results
The working of the model (contd)
The investment weights and returns are used to arrive at a portfolio return.
The monthly fees and expenses are deducted from the portfolio returns.
The contributions and returns are accumulated over each year in thesystem, and give us the total expected accumulation in the pensionaccount.
If the user has entered the “real” option, then the rate of inflation issubtracted from the wages, and returns assumptions.
This simulation is done 1,000 times, and thus generates a distribution ofthe expected accumulated amounts in the NPS account.
The amount to be annuitized is subtracted from this accumulation andused to arrive at the monthly expected pension using the annuity price.
Renuka Sane National Institute of Public Finance and Policy Presented at the IGIDR Household Finance Workshop, Mumbai
penCalc
Results
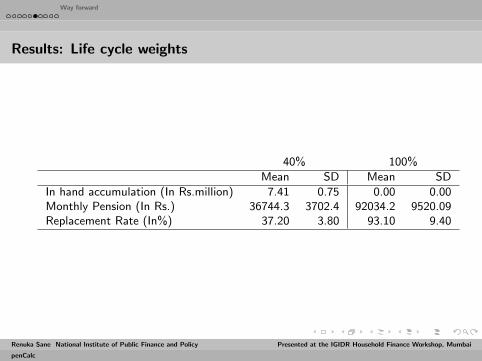
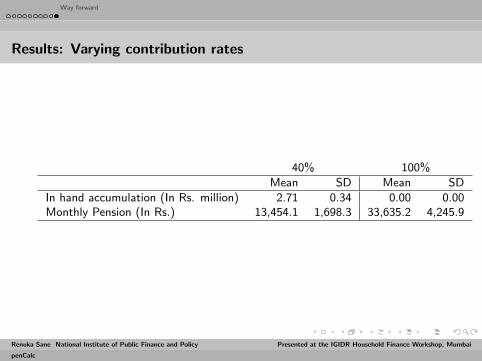
Outcomes
In hand accumulation
Monthly pension
Replacement rate
Renuka Sane National Institute of Public Finance and Policy Presented at the IGIDR Household Finance Workshop, Mumbai
penCalc
Way forward
Part III
Results
Renuka Sane National Institute of Public Finance and Policy Presented at the IGIDR Household Finance Workshop, Mumbai