44
Reorganisation of Stroke Services in Greater Manchester 2006-15 challenges and opportunities in providing a centralised service Professor Pippa Tyrrell
| Date post: | 26-Dec-2015 |
| Category: |
Documents |
| Upload: | ashlyn-simon |
| View: | 213 times |
| Download: | 1 times |

Reorganisation of Stroke Services in Greater Manchester 2006-15
challenges and opportunities in providing a centralised service
Professor Pippa Tyrrell

15 years of policy making…………
2000 2015SINAP and SSNAP Reports
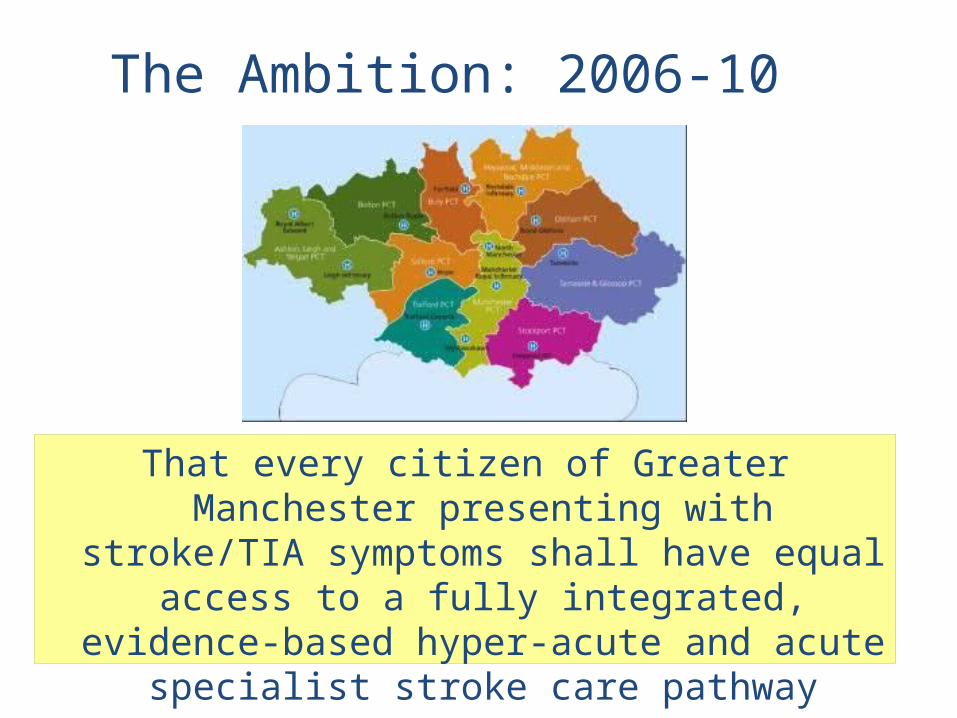
That every citizen of Greater Manchester presenting with stroke/TIA symptoms shall have equal access to a fully integrated, evidence-based hyper-acute and
acute specialist stroke care pathway
The Ambition: 2006-10

The Plan: 2010
Positive FAST test within 24 hours to stroke centre
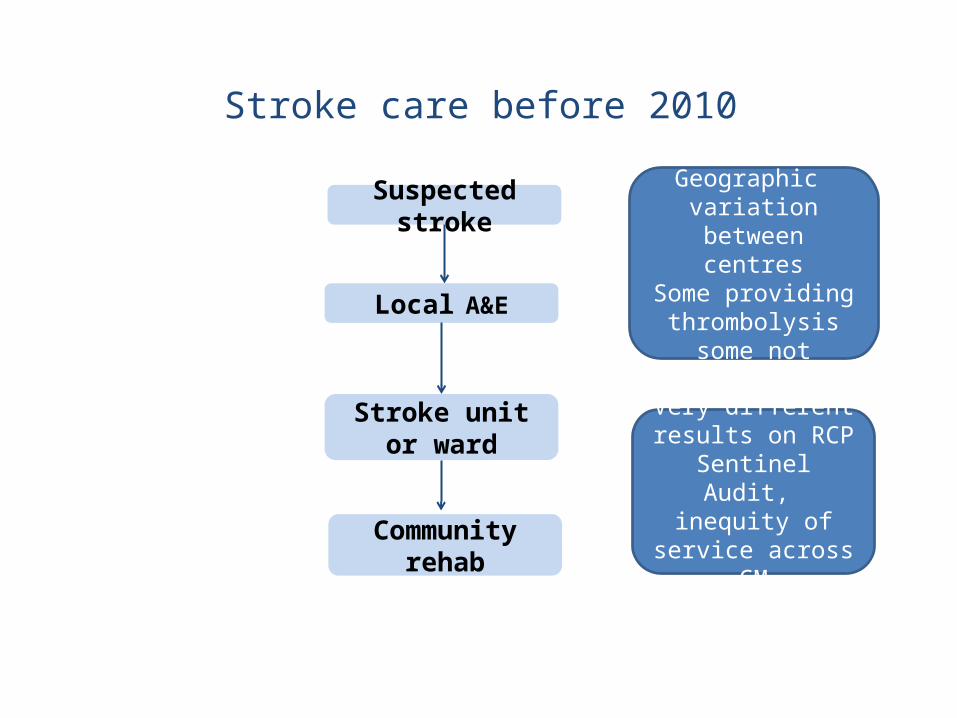
Stroke care before 2010
Suspected stroke
Local A&E
Stroke unit or ward
Communityrehab
Geographic variation between centresSome providing
thrombolysis some not
Very different results on RCP Sentinel
Audit, inequity of service across GM
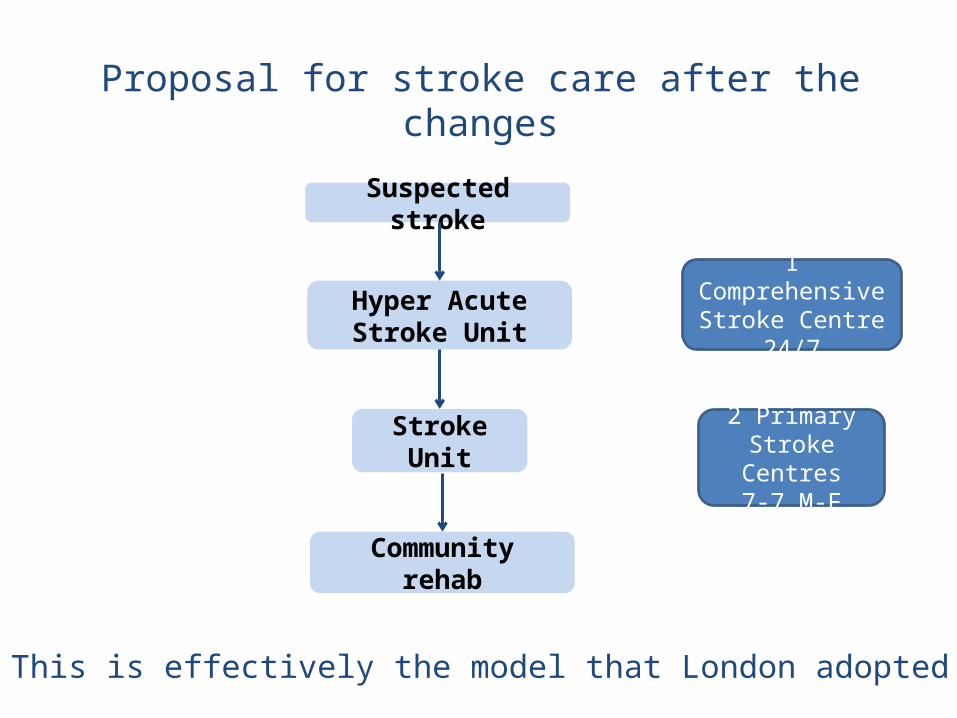
Proposal for stroke care after the changes
Suspected stroke
Hyper Acute Stroke Unit
Stroke Unit
Communityrehab
1 Comprehensive Stroke Centre
24/7
2 Primary Stroke Centres
7-7 M-F
This is effectively the model that London adopted
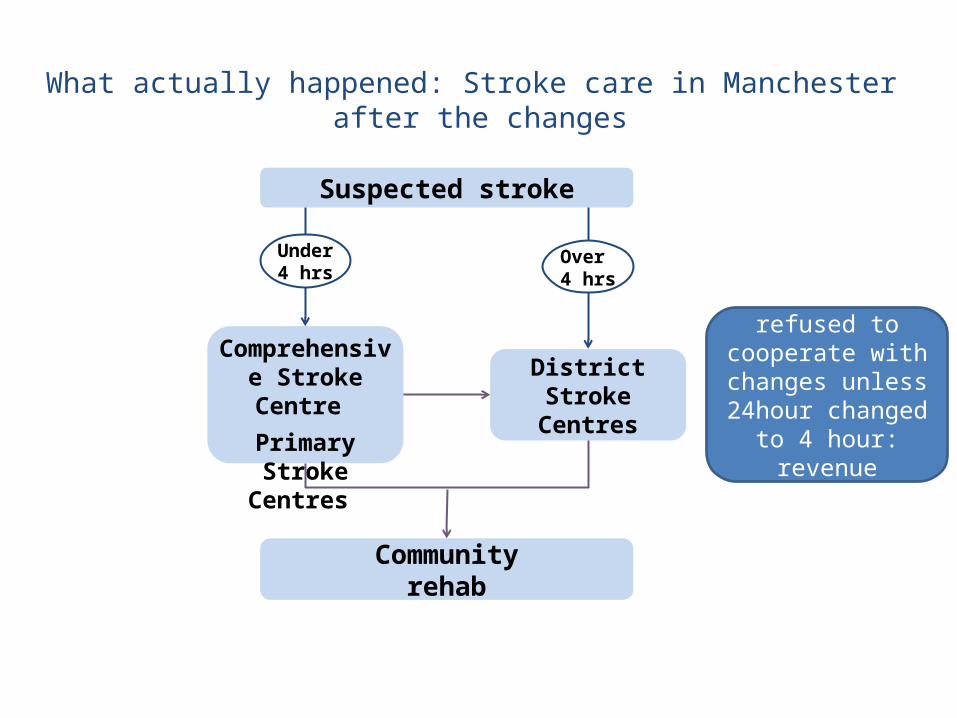
What actually happened: Stroke care in Manchester after the changes
Suspected stroke
Communityrehab
Under 4 hrs
Comprehensive Stroke Centre
Primary Stroke Centres
District Stroke Centres
Over 4 hrs
1 FT CE refused to cooperate with changes unless
24hour changed to 4 hour: revenue
concerns

What worked?
Detailed pathway mappingParamedic engagementClinician and PPI engagementAmbition to change and improveClear about “what”Not so clear about “how”

What was difficult?
• Calculating the numbers pre SINAP/SSNAP!
Positive FAST (or recent history of positive FAST)
Suspected TIA & stroke emergency pathway (Gr. Manchester)
GM Stroke Network, v4 Jan 2008
SYMPTOMS OF STROKE/TIASYMPTOMS OF STROKE/TIA
Self presentat DSC
(within 2-3 hours)
999999Includes Includes TIAsTIAs
PSC/CSC (on standby)
Courtesy Call and transfer to nearest open:
Risk factors assessed•Aspirin‘Basket of interventions’:•Carotid imaging within 24 hrs•CEA within 2 wks if appropriate•DWI if necessary w/in24 hrs•Echo.(if required at DSC as out-patients within 72 hours)
GP
Neurology resolved Residual deficit
CT SCAN immediately (Next slot)
Palliative care may be indicated
Immediate ABC assessment
Immediate ROSIER
•Check routine bloods (ie, clotting)
Swallow Assessment
INTRA-CEREBRAL HAEMORRHAGE
•Immediate Aspirin
•Immediate ‘basket’
Swallow Assessment
ISCHAEMIC STROKE
Not t-PA eligible
Acute Stroke Unit care (PSC/CSC)•Phone relevant bed manager•Book ambulance (as required)
Swallow Assessment
•Re-scan at 24 hours
•Aspirin at 24 hours
ISCHAEMIC STROKE
I.V. t-PA eligible (SITS/MOST protocol)
Refer to local DSC prior to discharge
TIA suspected Not TIA
‘ CA
LL
TO
DO
OR
CA
LL
TO
DO
OR
’’ TIM
E =
70
min
utes
max
T
IME
= 7
0 m
inut
es m
ax
DRAFT 6
Take advice immediately from CSC/PSC following
local assessment
In-hospital patients?
If not a stroke/TIA:•treat as appropriate•consider transferring
out immediately
Paramedics/Triage in A+E
Probable stroke/TIA
Urgent 999 transfer
Patient choice may influence
decisions
Provide Greater Manchester
Patient and Carer Stroke information
pack
Appointment in DSC at 1month
Transfer to DSC Discharge home
ASU care at DSC
If Malignant MCA infarction PSC/CSC joint MCA
Protocol Intra-arterial t-PA if required
(or more invasive treatment)
If BASILAR THROMBOSIS –
Follow CSC protocol
Discharge (usually within 24-36
hours – possibly earlier)
Healthy Lifestyle advice (and support measures, eg, to
help stop smoking)
NEUROSURGERYINDICATED?
Neurorehab
General supportive care
•Manage hypertension
YesNo
PSC/CSC Protocol
Needs immediate scan?(refer to NICE guidelines)
Yes No
Need scan within 24 hours
‘DO
OR
TO
NE
ED
LED
OO
R T
O N
EE
DLE
’’ TIM
E=
30 m
inu
tes
ide
ally
/T
IME
=30
min
ute
s id
eal
ly/
Bu
t 60
min
ute
s B
ut
60 m
inu
tes
max
imu
mm
axim
um
Commence tCommence t--PA PA infusioninfusion
Timings
GP
X
X
XX
X
X
Remain local
X
Assumption by ERG is that most of the 16 per day hospitalised stroke patients will survive to be
discharged to local acute stroke Unit care
Comprehensive Stroke Centre View (per day projections*)
Stroke and TIA projections for Comprehensive Stroke Centre by ERG per day (*based on assumption of 9000 per annum for
whole of Greater Manchester)Note, average only: there will be variations day to day
Version 1 15.03.2008
Further details, contact Roger Gamon – 07810 880 472
X X
X X X
X Pre SINAP/SSNAP data was inaccurate,
confusing and mostly wrong!
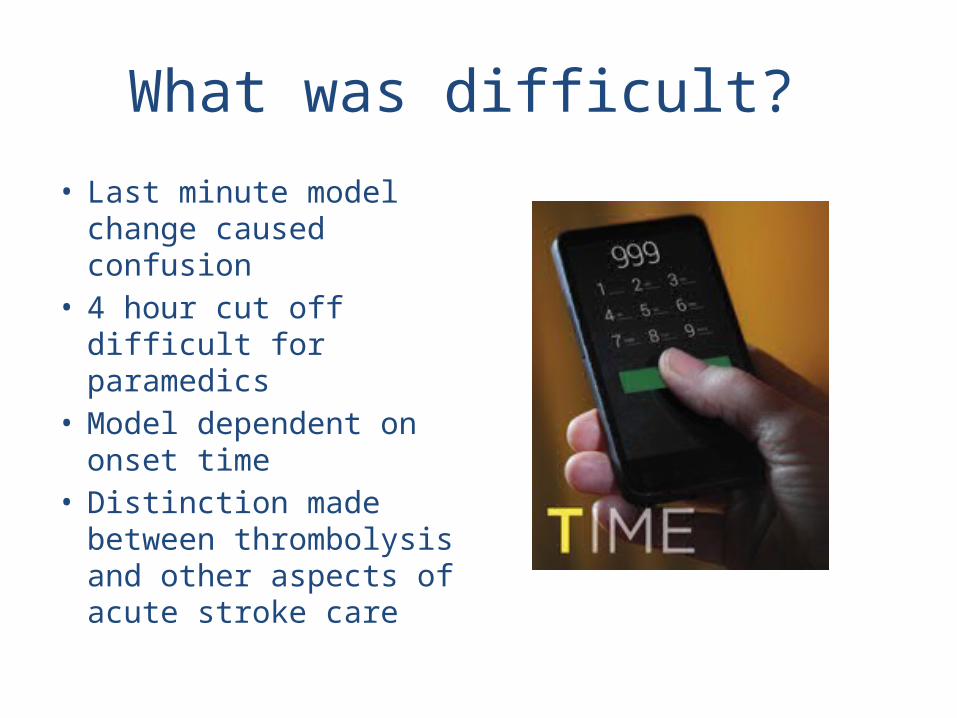
What was difficult?
• Last minute model change caused confusion
• 4 hour cut off difficult for paramedics
• Model dependent on onset time
• Distinction made between thrombolysis and other aspects of acute stroke care
Measuring Change
• SINAP started with full roll out of GM model in June 2011
• GM network fully supported SINAP/SSNAP participation across the city
• High quality data supporting changed model
• Provides prospective data from roll out but no retrospective data

AABCCBAABBA
A
AACBBBAABBA
A
BB:80-89%
C:70-79%
SSNAP score
Case ascertainment
Audit compliance
Combined Total KI Score
D1:Scanning
D2:Stroke Unit
D3:Thrombolysis
D4:Specialist Assessments
D5:Occupational Therapy
D6:Physiotherapy
D7:Speech and Language
D8:Multidisciplinary team working
D9:Standards by Discharge
D10:Discharge Process
Team centredPatient centredSource: SSNAP Oct-Dec 2014Team level results Team 267

How did we measure outcomes pre and post model change?
Innovations in major system reconfiguration in England: a study of the effectiveness, acceptability and processes of implementation of different models of stroke care
NIHR HS&DR collaborative study between UCL, University of Manchester, King’s Health and University of Cambridge to compare London and Manchester reorganisations with the rest of England: did the change work?

Study details
• Project funded 1st September 2011 – 31st March 2016
– Retrospective study of London and Manchester ‘A’– Contemporaneous study of Manchester ‘B’, and
planned/under discussion changes across East of England and Midlands
– Contemporaneous study of sustainability of London

What did we do?
• Compared what happened to stroke patients in London and Manchester…
• before and after reconfiguration…
• with the average for the rest of England
15

Research questions
1. What are the key processes and factors influencing the development and implementation of the reconfigurations?
2. To what extent have system changes delivered improvements in clinical processes and outcomes?
3. How do stakeholders (patients/carers, commissioners, staff delivering care) view the changes?
4. Have changes delivered value for money?
5. How is service reconfiguration influenced by the wider context of major structural change in the NHS?
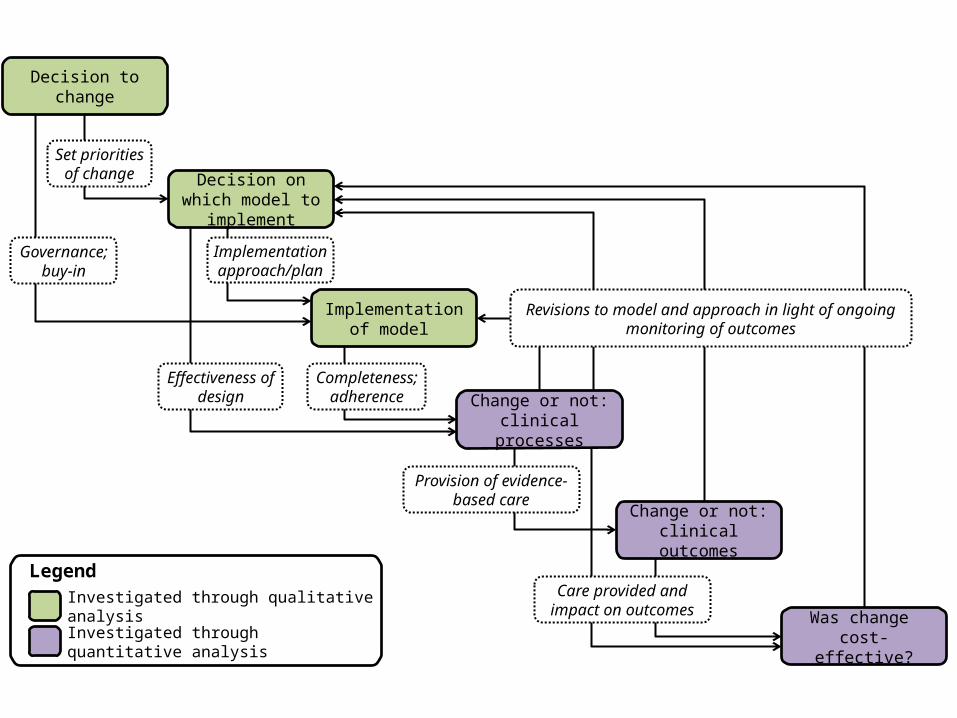
Decision on which model to implement
Implementation of model
Completeness; adherence
Governance; buy-in
Set priorities of change
Implementation approach/plan
Provision of evidence-based care
Investigated through qualitative analysis
Investigated through quantitative analysis
Legend
Effectiveness of design
Was change cost-effective?
Care provided and impact on outcomes
Change or not: clinical outcomes
Change or not: clinical processes
Revisions to model and approach in light of ongoing monitoring of outcomes
Decision to change

Decision on which model to implement
Implementation of model
Was change cost-effective?
Change or not: clinical outcomes
Change or not: clinical processes
Decision to change
Implementation and sustainability• Governance level: interviews,
observations, documentary analysis• Service-level: interviews with clinicians,
management, patients & carers[incl. with service ‘winners’ and ‘losers’]
What works at what cost?
Controlled before and after designControl = rest of England• Clin outcomes: HES/ONS data• Clin processes: National audit data
(Sentinel/SINAP/SSNAP)• Cost data

Findings: clinical outcomes
• Morris et al. Impact of centralising acute stroke services in English metropolitan areas on mortality and length of hospital stay: difference-in-differences analysis. BMJ 2014
• Controlled before and after analysis: Greater Manchester, London, Rest of England (control)
• Risk adjusted mortality and LoS reduced everywhere• LoS reduced significantly more in Greater Manchester and
London than in the rest of England• London mortality reduced significantly more in than in the
rest of England – but no equivalent effect in Greater Manchester
Progress: dissemination
Morris et al. Impact of centralising acute stroke services in English metropolitan areas on mortality and length of hospital stay: difference-in-differences analysis. BMJ 2014;349:g4757

Progress: dissemination
Morris et al. Impact of centralising acute stroke services in English metropolitan areas on mortality and length of hospital stay: difference-in-differences analysis. BMJ 2014;349:g4757

Progress: dissemination
Morris et al. Impact of centralising acute stroke services in English metropolitan areas on mortality and length of hospital stay: difference-in-differences analysis. BMJ 2014;349:g4757

Progress: dissemination
Morris et al. Impact of centralising acute stroke services in English metropolitan areas on mortality and length of hospital stay: difference-in-differences analysis. BMJ 2014;349:g4757

How did we do the research?
• We used HES data for stroke patients admitted between January 2008 and March 2012
• We looked at:– Mortality from any cause at any location at
3, 30 and 90 days– Length of hospital stay
24
Information from
• Hospital Episode Statistics database– Anonymous information
about every patient– Diagnosis, age, sex etc
• Information about deaths from Office for National Statistics
25
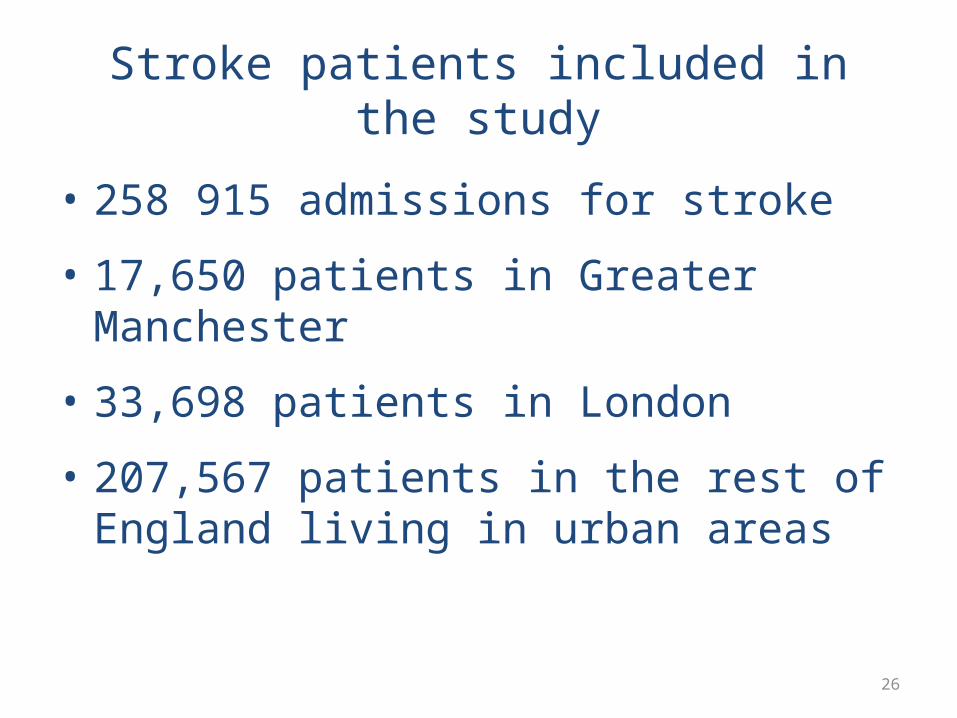
Stroke patients included in the study
• 258 915 admissions for stroke
• 17,650 patients in Greater Manchester
• 33,698 patients in London
• 207,567 patients in the rest of England living in urban areas
26
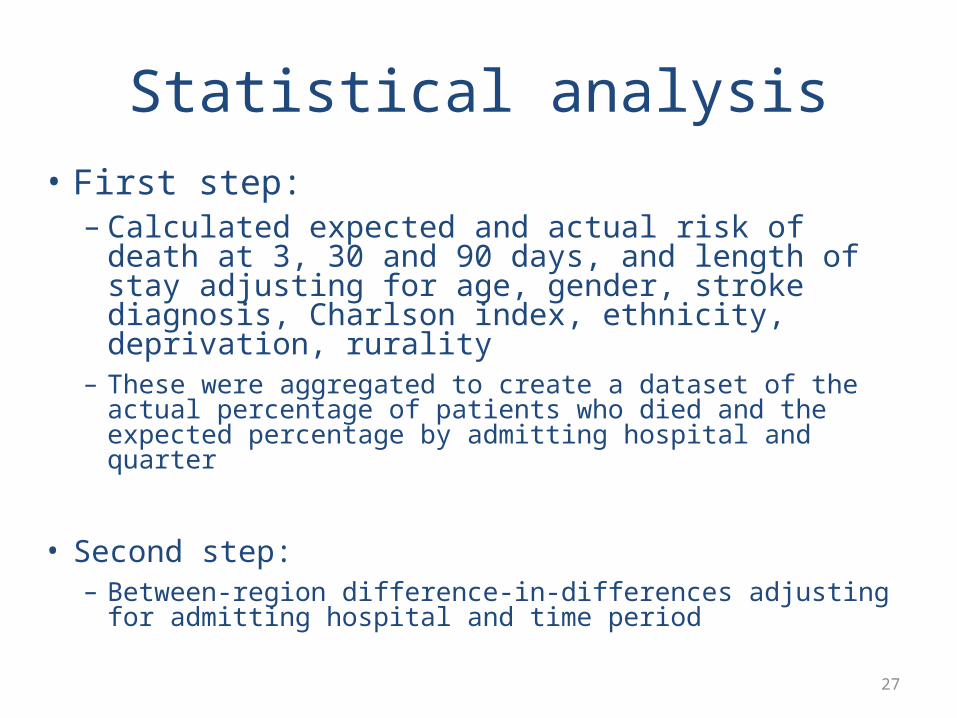
Statistical analysis• First step:
– Calculated expected and actual risk of death at 3, 30 and 90 days, and length of stay adjusting for age, gender, stroke diagnosis, Charlson index, ethnicity, deprivation, rurality
– These were aggregated to create a dataset of the actual percentage of patients who died and the expected percentage by admitting hospital and quarter
• Second step:– Between-region difference-in-differences adjusting for
admitting hospital and time period
27
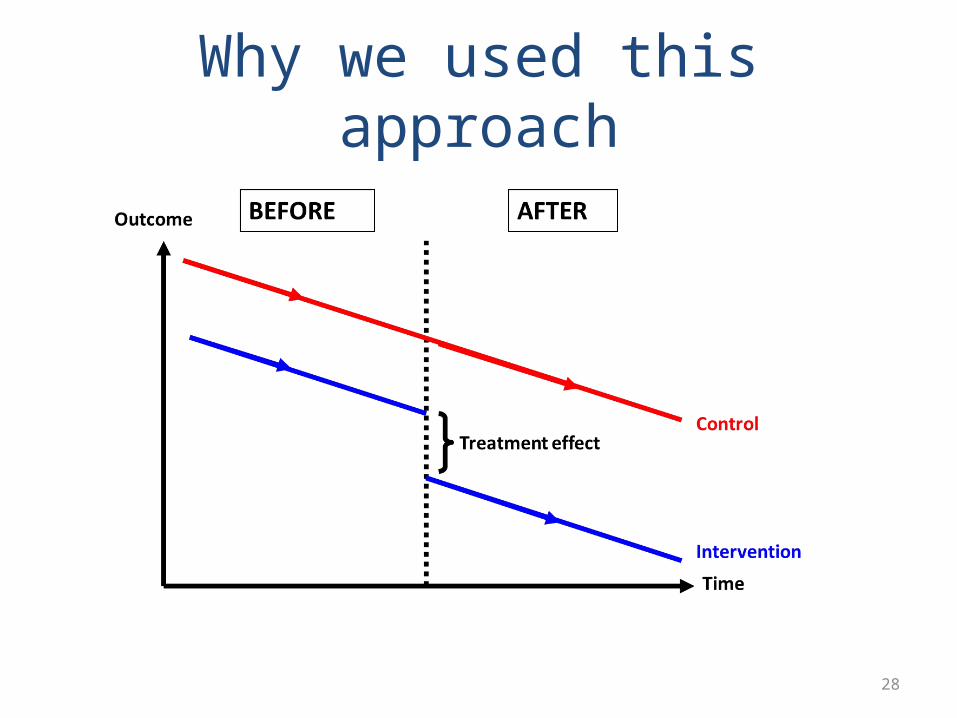
Why we used this approach
28

Mortality at 3 days
29

Mortality at 30 days
30
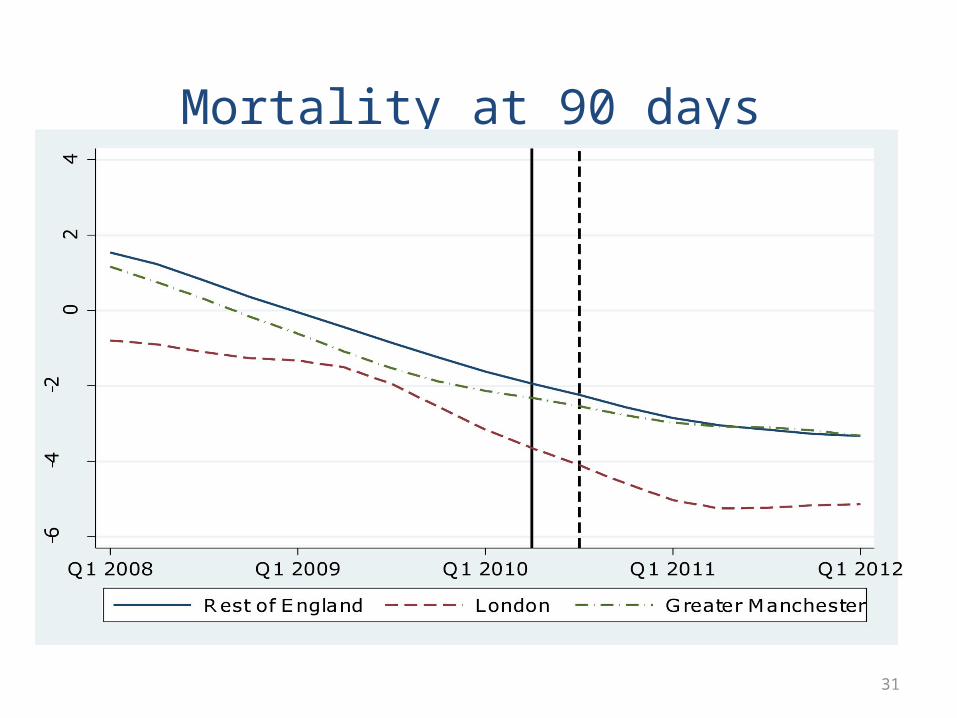
Mortality at 90 days
31

Length of stay
32

Main result: overall
• Risk-adjusted mortality and length of hospital stay fell in Greater Manchester, London and the rest of England during the study period
33
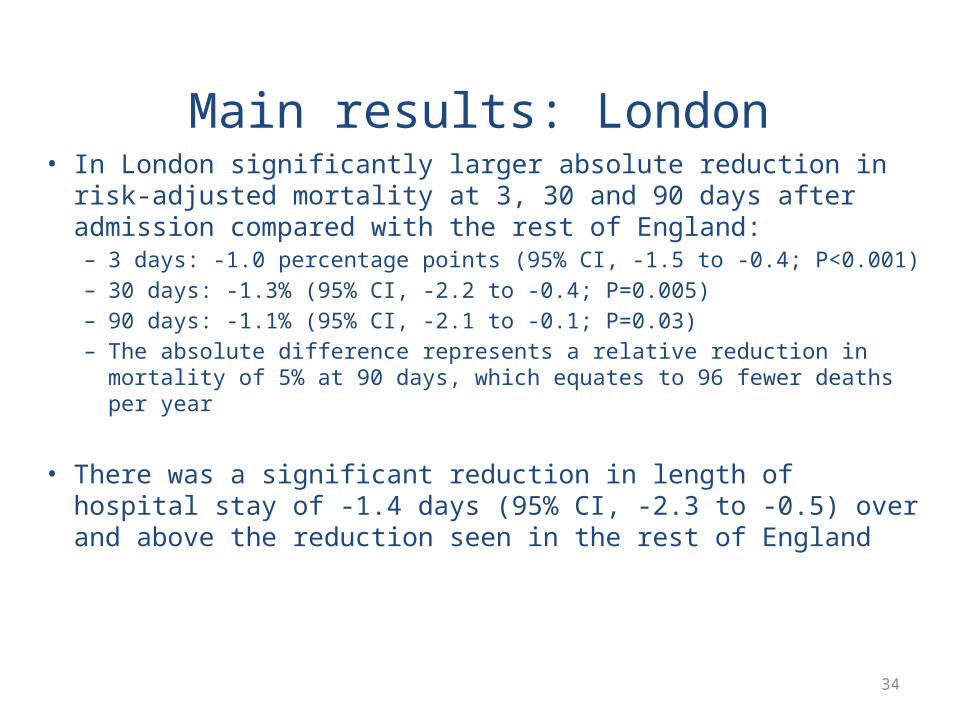
Main results: London• In London significantly larger absolute reduction in risk-adjusted
mortality at 3, 30 and 90 days after admission compared with the rest of England:– 3 days: -1.0 percentage points (95% CI, -1.5 to -0.4; P<0.001)– 30 days: -1.3% (95% CI, -2.2 to -0.4; P=0.005) – 90 days: -1.1% (95% CI, -2.1 to -0.1; P=0.03) – The absolute difference represents a relative reduction in mortality of 5%
at 90 days, which equates to 96 fewer deaths per year
• There was a significant reduction in length of hospital stay of -1.4 days (95% CI, -2.3 to -0.5) over and above the reduction seen in the rest of England
34

Main results: Greater Manchester• In Greater Manchester there was no impact on mortality
over and above the change seen in the rest of England
• There was a significant reduction in length of hospital stay by -2.0 days (95% CI, -2.8 to -1.2)
• We speculate reasons for the non-significant effect on mortality in Greater Manchester were that fewer people received HASU-based care
35
Headline Result
50 excess stroke deaths
a year in Manchester

Strengths of study
• Large national dataset
• Robust quasi-experimental design
37
Limitations
• No information on stroke severity
• Could not measure impact on quality of life, disability, neurological and functional impairment
• No information for pre-hospital period
• No information on cost-effectiveness
38

Conclusions
• Centralising stroke care so it is provided in specialist units in a reduced number of hospitals can improve quality of care for patients
• But important that all stroke patients are taken to specialist units – not just a selection
• These systems worked in urban areas but they might not work in rural areas where travel times would be too great
39
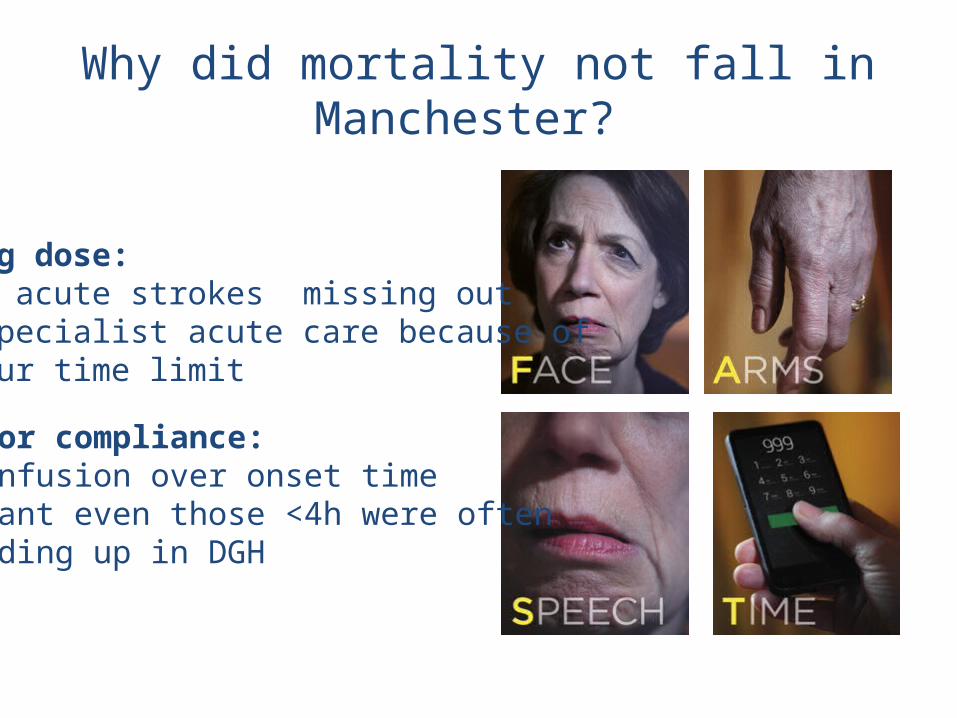
Why did mortality not fall in Manchester?
Wrong dose: Many acute strokes missing out on specialist acute care because of 4 hour time limit
Poor compliance:Confusion over onset timemeant even those <4h were oftenending up in DGH

How could we have done it better?
• Did we have the right people involved in the discussions?
• What’s the PPI role?
• Political will
• Can we learn from history?
• More than just physicians
• PPI needs to co-design not just agree proposals
• How do you get everyone on board in a “consensual” NHS?
• Need evidence to guide system change: learn from our mistakes!

What’s happening now?
• All change again in GM to London type model from 30 March 2015
• Taken 4 years to move from recognition of a problem to implementation
• Research findings and publicity pushed decision making

Centralised stroke services could save up to 50 patients per year under £2m NHS shake-up
Patient quote: “I think it’s fantastic that everyone in the area who has a stroke will now be able to go straight to a specialist centre”.
March 2015
Thanks to• Greater Manchester Stroke
Network• Salford Royal Foundation Trust• HS&DR study team at UCL,
King’s London, University of Manchester especially Naomi Fulop, Steve Morris and Angus Ramsay
• SSNAP Team at RCP• Patients, carers and staff who
have contributed to system change and its evaluation


![FAMILY HISTORY SOCIETY · 2/2/2015 · 30 Tyrrell Family History Society Management Committee 2015 Chairman: Mike Tyrrell [828] chairman@tyrrell-fhs.org 32 Wren Crescent, Addlestone,](https://static.documents.pub/doc/80x56/606bbf549248a35c2265948f/family-history-society-222015-30-tyrrell-family-history-society-management.jpg)


