Journal of Tropical Ecology http://journals.cambridge.org/TRO Additional services for Journal of Tropical Ecology: Email alerts: Click here Subscriptions: Click here Commercial reprints: Click here Terms of use : Click here Repeated disturbances and canopy disturbance regime in a tropical semi deciduous forest Renato A. Ferreira de Lima, Adriana M. Zanforlin Martini, Sérgius Gandolfi and Ricardo Ribeiro Rodrigues Journal of Tropical Ecology / Volume 24 / Issue 01 / January 2008, pp 85 93 DOI: 10.1017/S0266467407004658, Published online: 03 January 2008 Link to this article: http://journals.cambridge.org/abstract_S0266467407004658 How to cite this article: Renato A. Ferreira de Lima, Adriana M. Zanforlin Martini, Sérgius Gandolfi and Ricardo Ribeiro Rodrigues (2008). Repeated disturbances and canopy disturbance regime in a tropical semideciduous forest. Journal of Tropical Ecology, 24, pp 8593 doi:10.1017/S0266467407004658 Request Permissions : Click here Downloaded from http://journals.cambridge.org/TRO, IP address: 128.119.168.112 on 30 Apr 2013
Transcript
Journal of Tropical Ecologyhttp://journals.cambridge.org/TRO
Additional services for Journal of Tropical Ecology:
Email alerts: Click hereSubscriptions: Click hereCommercial reprints: Click hereTerms of use : Click here
Repeated disturbances and canopy disturbance regime in a tropical semideciduous forest
Renato A. Ferreira de Lima, Adriana M. Zanforlin Martini, Sérgius Gandolfi and Ricardo Ribeiro Rodrigues
Journal of Tropical Ecology / Volume 24 / Issue 01 / January 2008, pp 85 93DOI: 10.1017/S0266467407004658, Published online: 03 January 2008
Link to this article: http://journals.cambridge.org/abstract_S0266467407004658
How to cite this article:Renato A. Ferreira de Lima, Adriana M. Zanforlin Martini, Sérgius Gandolfi and Ricardo Ribeiro Rodrigues (2008). Repeated disturbances and canopy disturbance regime in a tropical semideciduous forest. Journal of Tropical Ecology, 24, pp 8593 doi:10.1017/S0266467407004658
Request Permissions : Click here
Downloaded from http://journals.cambridge.org/TRO, IP address: 128.119.168.112 on 30 Apr 2013
Repeated disturbances and canopy disturbance regime in a tropicalsemi-deciduous forest
Renato A. Ferreira de Lima∗1, Adriana M. Zanforlin Martini†, Sergius Gandolfi∗and Ricardo Ribeiro Rodrigues∗
∗ Laboratorio de Ecologia e Restauracao Florestal (LERF), Departamento de Ciencias Biologicas, ESALQ/USP. Av. Padua Dias, 11, Caixa Postal 9,CEP 13.418-900, Piracicaba, Sao Paulo, Brazil†Universidade Federal de Sao Paulo, Campus Diadema. Rua Prof. Artur Riedel, 275, Bairro Eldorado, CEP 09972-270. Diadema, SP, Brazil(Accepted 26 October 2007)
Abstract: The canopy disturbance regime and the influence of gap methods on the interpretation of forest structureand dynamics were evaluated in a tropical semi-deciduous forest in south-eastern Brazil. We encountered a gap densityof 11.2 gaps ha−1 and an average size which varied from 121 to 333 m2 depending on the gap delimitation methodconsidered (minimum gap size was 10 m2). Although average size was slightly higher, the median value obtained(78 m2) was comparable to other tropical forest sites and the gap size-class distribution found supported the patterndescribed for such forest sites. Among 297 gap makers, snapping and uprooting were the most common modes ofdisturbance. The number and basal area of gap makers were good predictors of gap size. Almost 25% of all gaps sufferedfrom repeated disturbance events that brought about larger gap sizes. Such processes, along with delimitation methods,strongly influenced the estimation of turnover rate and therefore the interpretation of forest dynamics. These resultsdemonstrated the importance of further studies on repeated disturbances, which is often neglected in forest studies.
Disturbances are common to most, if not all, mature forestcommunities and they represent a crucial component inthe maintenance of its pattern and processes (van derMaarel 1993). In tropical forests, disturbance activitiesare mainly represented by the death of part of a tree,of a whole tree or of several trees. Due to internal (e.g.diseases) and/or external causes (e.g. wind), trees mostlyfall by uprooting or stem breakage (Arriaga 2000, Runkle1982, van der Meer & Bongers 1996a). Yet, trees can stilldie standing and gradually decompose its crown. Branch-falls and inclined trees can also occur, though they arenot related to the death of an individual. Each one ofthese modes of disturbance has its own consequenceson light transmission, understorey vegetation and soildisturbance (Clark 1990). Openings in the canopy may beformed as a consequence of tree death and their influenceon forest structure and regeneration are broadly known
(Busing 2005, Denslow 1980, Hubbell & Foster 1986).However, not all events of tree mortality result in canopygaps (Poore 1968, van der Meer & Bongers 1996a).Lieberman et al. (1985) estimated that at least half of thedead trees bigger than 10 cm diameter at breast height(dbh) were not associated with canopy gaps.
The community pattern of tree mortality, knownas forest disturbance regime, is regarded as a gooddescriptor of forest structure and regeneration (Clark1990). Its description is usually done in two differentways. One is based on tree individual mortality andits consequences (Busing 2005, Lieberman et al. 1985)and the other comprises the description of the number,average size, frequency and spatial distribution of canopygaps (Brokaw 1982b, Grau 2002, Kapos et al. 1990).More complete studies involve the association of bothapproaches (van der Meer & Bongers 1996a) and therecording of gap expansion processes (Runkle 1990,Tanaka & Nakashizuka 1994). An alternative approachin describing the disturbance regime is estimating theforest turnover rate, defined as the mean time betweenthe formation of successive gaps on the same forest spot
86 RENATO A. FERREIRA DE LIMA ET AL.
(Poore 1968). The calculation is normally based either onthe rate of gap formation (Hartshorn 1978) or on the rateof tree mortality (Lieberman et al. 1985).
Although considered a good index in assessingforest dynamics (Denslow 1980), authors point outpractical limitations of turnover estimation related togap delimitation and measurement methods (Lima 2005,van der Meer et al. 1994), to the exception of repeateddisturbances events (Riera & Alexandre 1988) and tothe fact that many treefalls do not create canopy gaps(Lieberman et al. 1985, Martini et al. 2007). In tropicalsemi-deciduous forests, where seasonal fluctuations incanopy cover are inherent to forest functioning, theinfluence of gap processes on forest dynamics may be ofless importance (Denslow & Hartshorn 1994). Althoughseasonal fluctuations in canopy cover overshadow theinfluence of gap processes on forest dynamics, studiesemphasizing the subject are very scarce for this forestformation. In this paper we assess the canopy disturbanceregime in a tropical semi-deciduous forest in south-eastern Brazil. By means of an exhaustive recording ofcanopy gaps, we attempt to evaluate size, age and size-class frequencies of such openings and the gap makersrelated to them. More specifically, we addressed thefollowing questions: How do gap delimitation methodsand repeated disturbances influence the estimation ofcanopy turnover rate and other disturbance regimedescriptors? And what are the main factors controllinggap size?
SITE DESCRIPTION
This study was carried out in the Estacao Ecologica deCaetetus (EEC), a state forest reserve which belongs toGalia county (22◦41′S and 49◦10′W). It has a total areaof 2178 ha covered by an old-growth semi-deciduousseasonal forest, with a canopy height ranging from20 to 35 m. The terrain is flat, with elevation rangingfrom 550 to 650 m asl. The soil is red-yellow Acrisols(Ultisols) and red-yellow Ferrasols (Oxisols) but haplicGleysols (Entisols) can be found on the lowest points ofthe landscape. Average annual precipitation is around1400 mm and characterized by the occurrence of amarked dry season. The average annual temperatureis 21 ◦C. Near the centre of the reserve, a permanentplot of 10.24 ha was established in 2002 to study forestcomposition and dynamics. In the 2005 plot census, 12039 individuals > 5 cm dbh were sampled, belonging to148 species, 110 genera and 44 families. Plot basal areawas 36.8 m2 ha−1. The richest families were Myrtaceae,Euphorbiaceae, Fabaceae, Mimosaceae and Rutaceae,and the five most abundant species were Metrodorea nigra,Ocotea indecora, Trichilia clausenii, Aspidosperma polyneuronand Trichilia catigua.
METHODS
In 2005, 8.96 ha (280 × 320 m) of the permanent plotwas completely surveyed for canopy gaps during thedry season. The canopy gap definition used followedRunkle (1992) who defines a gap as formed by the death(absence from the canopy) of at least one-half of a tree.Additionally, we marked and measured canopy openings,defined here as openings in the canopy without pastor present evidence of the death of gap makers. Largegaps that exceeded the plot limits were not completelymeasured and only the area inside the plot was usedto estimate the total plot gap area. In contrast, smallergaps with some portions outside gap limits were measuredcompletely and used in the gap area analyses, as explainedbelow.
Once the canopy gap or opening were located, we usedtwo different methods to set its limits: Brokaw (1982a:the vertical projection of the ‘hole in the forest extendingthrough all levels down to an average height of twometers above ground’) and Runkle (1982: ‘the groundarea under a canopy opening extending to the bases ofcanopy trees surrounding the canopy opening’), referredfrom now on simply as Brokaw and Runkle methods,respectively. Thus, for each gap, we obtained the areadirectly above the canopy gap and the expanded gap area.Each method was applied by the same observer to avoidbias. We set 10 m2 as a minimum gap size and a minimumsize of 20 cm dbh to define the surrounding canopy trees.The size of each canopy gap was measured using themethod proposed by Lima (2005). Exceptions were madefor three large gaps that had part of their area outside thestudy plot. In these cases, we noted the tag number of allbordering canopy trees and size measurement by Runkle’smethod was made a posteriori based on their coordinates.Gap size inside the plot was then obtained by the area ofthe polygon, linking all bordering canopy trees sketchedusing a graphic editor program (Arc View GIS 3.3). Hence,Brokaw gap size was estimated based on the regressionequation obtained comparing both delimitation methods.
For each gap, we set an arbitrary centre insideBrokaw’s limits, from which all measures were takenusing a DME 201 (Haglof Sweden AB). Next, we madea complete survey for gap makers (i.e. all dead trees orbranch falls > 20 cm dbh) that were identified (wheneverpossible) and measured for dbh and mode of disturbance(uprooting, snapping, standing dead, fall of a stem frommulti-stemmed trees, branch fall, inclined tree and theassociation of two or more modes of disturbance, hereaftercalled ‘complex trees’). To define gap makers in this study,the distinction between initiator and domino trees werenot made due to difficulty of differentiating between themin the field, especially inside multiple-event gaps. We thenmade estimates of gap age, based on the presence/absenceof tree identification tags on gap maker(s). Since tags were
Disturbances in a tropical semi-deciduous forest 87
placed in 2002, we created two broad age classes: recentgaps (gaps newer than 3 y old) when the gap maker wastagged; and old gaps, when the gap maker not tagged andpresented more advanced stages of wood decay. Althougha 3-y-old gap may not be accurately defined as recent,the presence of tags assured an excellent time parameterbecause of the information it gave us for the period 2002–2005, aiding in the calculation of the disturbance andturnover rates.
Complex gaps, formed by distinct episodes of tree mor-tality, received a special approach as suggested by Runkle(1992). When the spatial distinction between tree-and/or branch-fall episodes was structurally unclear,total superposition of the two fall episodes was assumed.Accordingly, the gap was regarded as a single gap withtwo different age classes, one relative to the first fall episodeand one from the second. During analysis, when the ageclass was required these gaps were excluded, except for es-timations of turnover rate. Complex gaps with clear spatialdifferentiation between fall episodes were then subdividedinto two contiguous fractions (partial overlapping), eachone with its own age class and area. During the estimationof turnover rate, each fraction of these gaps was usedseparately. The limit between these contiguous gaps wasdetermined by considering the area of influence of eachepisode (with one or more gap makers), sapling heightand relative decay of surrounding debris.
Data analysis
Since gap size data did not follow a normal distribution,comparisons among delimitation methods, types of gaps(single and complex gaps) and age classes (old and recent)were made by the inspection of median confidenceintervals in notched box-plots. Non-overlappingconfidence intervals were considered as an indication ofdissimilar distributions (McGill et al. 1978). A regressionanalysis was carried out to investigate the relationshipbetween Brokaw and Runkle methods; a non-linear modelwas adopted because the inclusion of the quadratic termsignificantly improved the model fit (df = 91, F = 6.99,P = 0.009). A standard multiple regression was alsoapplied to evaluate the strength of number and size ofgap makers on the prediction of canopy gap size. In bothregression analyses, the three large canopy gaps notcompletely measured were not included. The evidenceof different size distribution of the gap makers amongthe different modes of disturbance was evaluated usingAnalysis of Variance (ANOVA). During some of theanalysis, such as regression and average comparison, anumber of gaps were excluded due to partial measurementof area and contours. Canopy openings were not includedin the gap size versus gap maker analysis either. Therefore,the number of gaps used varied between analyses.
We also made estimates on the gap disturbance rate(i.e. new gaps per hectare per year) to calculate thestand turnover rate, defined according to Poore (1968,p. 178). The mean disturbance rate was obtained bydividing the total gap area of recent gaps by the numberof years since tree mortality started being recorded in2002. The turnover rate was expressed indirectly as thenumber of years necessary to cover the entire plot areawith gaps and calculated following Hartshorn (1978).To assess the effect of including repeated disturbancesevents on turnover rate, we calculated the turnover rateby adding the area of recent gaps that partly or entirelycovered older gaps (complex gaps, as explained above).To compare average gap size and turnover rate to otherstudies, values were corrected in respect to the method ofsize measurement adopted, following the linear equationsprovided in Lima (2005).
RESULTS
Disturbance regime and turnover rate
We found a total of 100 canopy gaps totally orpartially inside the studied area (11.2 gaps ha−1). Amongthese, canopy openings were uncommon (0.8 gapsha−1), presented smaller values than single canopy gaps(inspection of notched box-plots, data not presented) andcontributed only 3.0% and 4.3% of Brokaw and Runkletotal gap area, respectively. As expected, Brokaw gapareas were significantly lower than Runkle’s (Figure 1a)and the quadratic regression applied revealed significantrelation between methods (Runkle size = 0.00046(Brokaw size2) + 1.94 Brokaw size + 100; r2 = 0.809;N = 93; P<0.001). But, there was considerable deviationon individual gap sizes. For example, for a Brokaw gapsize of 78 m2, a Runkle gap size of 249 m2 is expected.However, observed values varied from 158 to 448 m2.
Among all gaps, we encountered 21 complex gaps(2.4 gaps ha−1) with distinct episodes of complete orpartial gap overlap (Table 1). These gaps varied greatlyin size from 32 and 145 m2 to 507 and 1109 m2
(Brokaw and Runkle sizes, respectively). The biggest ofall gaps also corresponded to a complex gap (1004 and1619 m2, respectively) but since we did not measure itscomplete area (gap largely exceeded plot limits), it andtwo other partially measured gaps were not used duringanalysis. There was strong evidence of complex gaps beingbigger than single gaps for both delimitation methods(Figure 1b). Complex gaps corresponded to 21.0% of allcanopy gaps found in our study plot and contributed for4400 and 10 587 m2 (37.1 and 33.2%) of total Brokawand Runkle gap area.
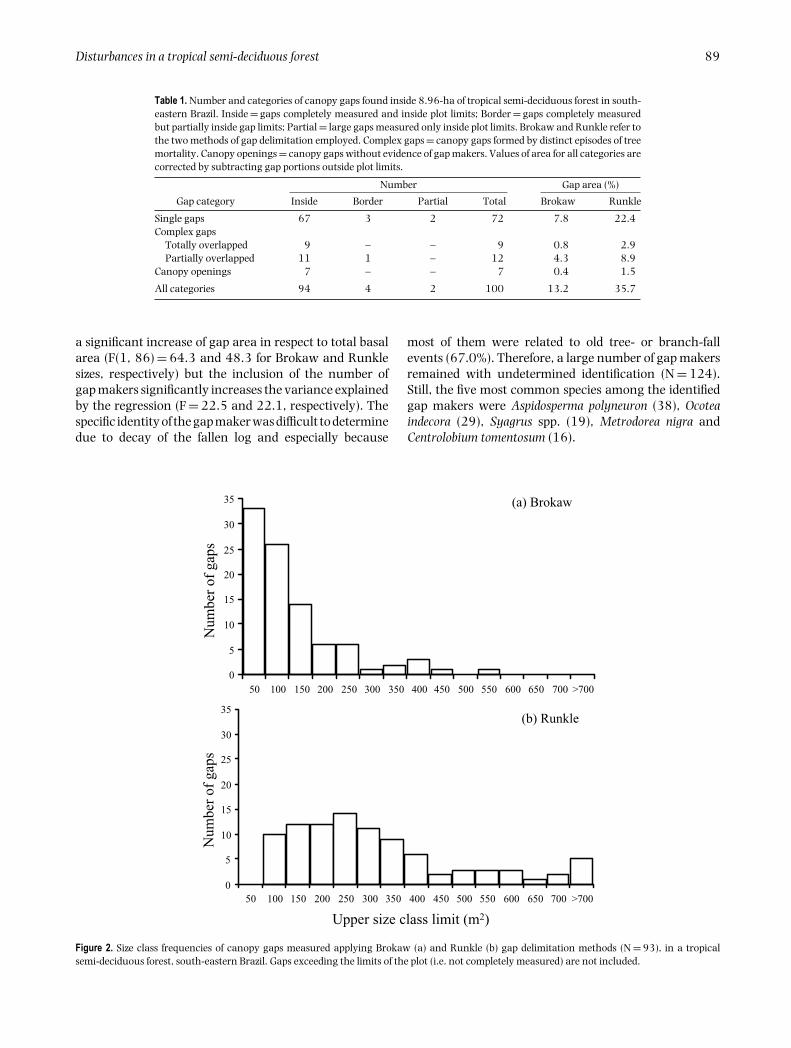
The size class frequencies (Figure 2) revealed that 77%of canopy gaps measured using the Brokaw method were
88 RENATO A. FERREIRA DE LIMA ET AL.
Figure 1. Size distribution of canopy gaps found in a tropical semi-deciduous forest, south-eastern Brazil. Size values measured accordingto two different delimitation methods and separated as follows: all gaps(a), old and recent gaps (b) and single and complex gaps (i.e. gapsformed by distinct episodes of tree mortality) (c). For all figures, the centre
smaller than 150 m2 and gaps bigger than 400 m2 wererare (3%). As expected, gaps smaller than 150 m2 hada disproportionate contribution of only 42% of total gaparea. Correspondingly, 71% of all the gaps were smallerthan 350 m2 but they accounted for no more than 45% ofthe total Runkle gap area. Moreover, there was evidenceof difference in Runkle gap area between age classes butthe same was not true for Brokaw method (Figure 1c).Thus, for Runkle method, older gaps were bigger thanrecent ones (complex gaps and canopy openings excludedfrom this analysis). The number and the proportionatecontribution of gaps in the old age class were respectivelyabout two and three times bigger than recent gaps, a resultpractically independent of the delimitation method.
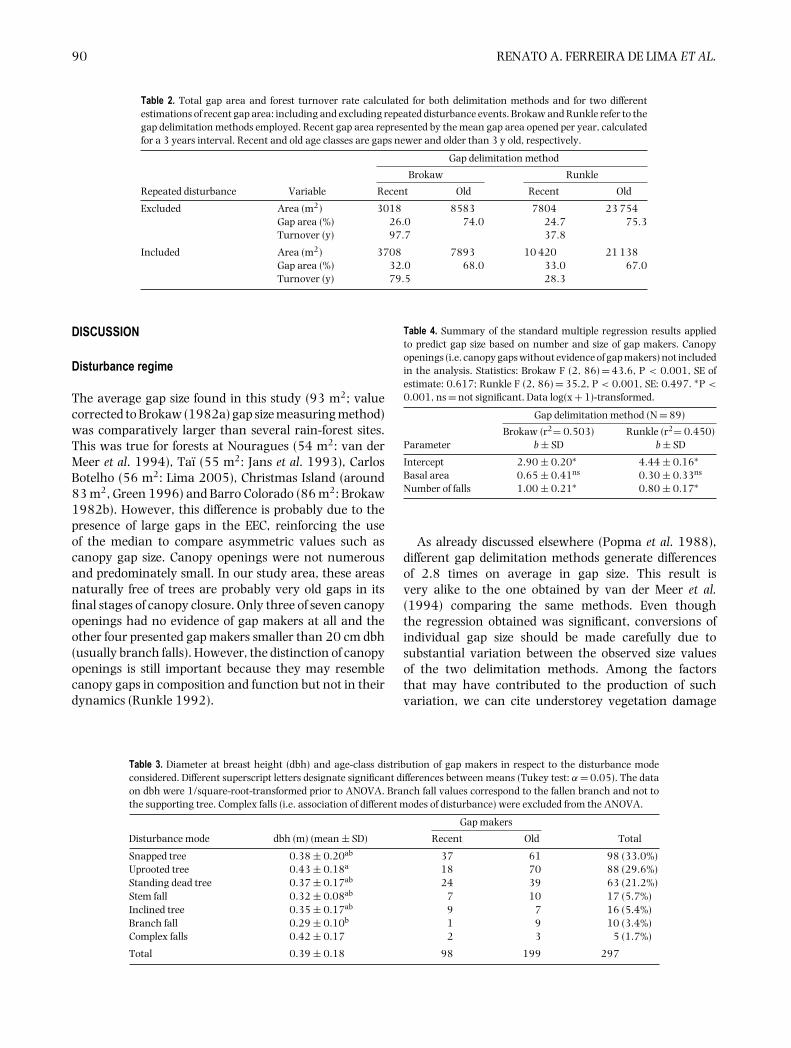
We further compared the number of gaps and thecontribution to total gap area as if we had notconsidered repeated disturbance events. Both variableshad considerable discrepancies related to the exclusionof repeated disturbances events. As a consequence ofdifferences in total area related to the inclusion ofoverlapping gap areas, the turnover rates were quitedifferent between the two situations (Table 2). The resultsbetween gap delimitation methods were different aswell. The mean annual rate of newly formed gaps (i.e.disturbance rate) calculated for the three years of recordswas 1.1 gaps ha−1.
Canopy gap makers
Related to 93 canopy gaps, we encountered 297 gapmakers representing a median and average (± SD) of2.0 and 3.2 ± 2.6, respectively. On account of somedifficulty in measuring the dbh of some of the old fallentrees, we measured 289 gap makers (Table 3) thatranged from 0.2 (lower limit previously defined) to 1.7 m.The basal area of gap makers per gap was 0.45 ±0.50 m2 (average ± SD, N = 93) and their total basalarea was roughly 4.6 m2 ha−1. Snapping, uprootingand standing dead were the most common mode ofdisturbance and together accounted for 83.8% (Table3). Uprooted trees were significantly larger in dbh thanbranch falls (ANOVA: N = 292, F = 3.20, P = 0.014).The multiple regression indicated that the number of gapmakers and the total basal area were good predictors ofgap size, for both methods (Table 4). The analysis showed
vertical line marks the sample median. Box edges represent the first andthird quartiles. Boxes are narrowed at the median and return to full widthat the lower and upper confidence interval. Whiskers show the rangeof values that fall within 1.5 times the length of the box. Outliers areplotted as empty circles. BROKAW (or BRK) = Brokaw gap size; RUNKLE(or RNK) = Runkle gap size; SING = Single gaps; CPX = Complex gaps;OLD = Single gaps formed before 2002; REC = Single gaps formedbetween 2002 and 2005.
Disturbances in a tropical semi-deciduous forest 89
Table 1. Number and categories of canopy gaps found inside 8.96-ha of tropical semi-deciduous forest in south-eastern Brazil. Inside = gaps completely measured and inside plot limits; Border = gaps completely measuredbut partially inside gap limits; Partial = large gaps measured only inside plot limits. Brokaw and Runkle refer tothe two methods of gap delimitation employed. Complex gaps = canopy gaps formed by distinct episodes of treemortality. Canopy openings = canopy gaps without evidence of gap makers. Values of area for all categories arecorrected by subtracting gap portions outside plot limits.
Number Gap area (%)
Gap category Inside Border Partial Total Brokaw Runkle
a significant increase of gap area in respect to total basalarea (F(1, 86) = 64.3 and 48.3 for Brokaw and Runklesizes, respectively) but the inclusion of the number ofgap makers significantly increases the variance explainedby the regression (F = 22.5 and 22.1, respectively). Thespecific identity of the gap maker was difficult to determinedue to decay of the fallen log and especially because
most of them were related to old tree- or branch-fallevents (67.0%). Therefore, a large number of gap makersremained with undetermined identification (N = 124).Still, the five most common species among the identifiedgap makers were Aspidosperma polyneuron (38), Ocoteaindecora (29), Syagrus spp. (19), Metrodorea nigra andCentrolobium tomentosum (16).
Figure 2. Size class frequencies of canopy gaps measured applying Brokaw (a) and Runkle (b) gap delimitation methods (N = 93), in a tropicalsemi-deciduous forest, south-eastern Brazil. Gaps exceeding the limits of the plot (i.e. not completely measured) are not included.
90 RENATO A. FERREIRA DE LIMA ET AL.
Table 2. Total gap area and forest turnover rate calculated for both delimitation methods and for two differentestimations of recent gap area: including and excluding repeated disturbance events. Brokaw and Runkle refer to thegap delimitation methods employed. Recent gap area represented by the mean gap area opened per year, calculatedfor a 3 years interval. Recent and old age classes are gaps newer and older than 3 y old, respectively.
Gap delimitation method
Brokaw Runkle
Repeated disturbance Variable Recent Old Recent Old
Excluded Area (m2) 3018 8583 7804 23 754Gap area (%) 26.0 74.0 24.7 75.3Turnover (y) 97.7 37.8
Included Area (m2) 3708 7893 10 420 21 138Gap area (%) 32.0 68.0 33.0 67.0Turnover (y) 79.5 28.3
DISCUSSION
Disturbance regime
The average gap size found in this study (93 m2; valuecorrected to Brokaw (1982a) gap size measuring method)was comparatively larger than several rain-forest sites.This was true for forests at Nouragues (54 m2: van derMeer et al. 1994), Taı (55 m2: Jans et al. 1993), CarlosBotelho (56 m2: Lima 2005), Christmas Island (around83 m2, Green 1996) and Barro Colorado (86 m2: Brokaw1982b). However, this difference is probably due to thepresence of large gaps in the EEC, reinforcing the useof the median to compare asymmetric values such ascanopy gap size. Canopy openings were not numerousand predominately small. In our study area, these areasnaturally free of trees are probably very old gaps in itsfinal stages of canopy closure. Only three of seven canopyopenings had no evidence of gap makers at all and theother four presented gap makers smaller than 20 cm dbh(usually branch falls). However, the distinction of canopyopenings is still important because they may resemblecanopy gaps in composition and function but not in theirdynamics (Runkle 1992).
Table 4. Summary of the standard multiple regression results appliedto predict gap size based on number and size of gap makers. Canopyopenings (i.e. canopy gaps without evidence of gap makers) not includedin the analysis. Statistics: Brokaw F (2, 86) = 43.6, P < 0.001, SE ofestimate: 0.617; Runkle F (2, 86) = 35.2, P < 0.001, SE: 0.497. ∗P <
0.001, ns = not significant. Data log(x + 1)-transformed.
Gap delimitation method (N = 89)
Brokaw (r2= 0.503) Runkle (r2= 0.450)Parameter b ± SD b ± SD
As already discussed elsewhere (Popma et al. 1988),different gap delimitation methods generate differencesof 2.8 times on average in gap size. This result isvery alike to the one obtained by van der Meer et al.(1994) comparing the same methods. Even thoughthe regression obtained was significant, conversions ofindividual gap size should be made carefully due tosubstantial variation between the observed size valuesof the two delimitation methods. Among the factorsthat may have contributed to the production of suchvariation, we can cite understorey vegetation damage
Table 3. Diameter at breast height (dbh) and age-class distribution of gap makers in respect to the disturbance modeconsidered. Different superscript letters designate significant differences between means (Tukey test: α = 0.05). The dataon dbh were 1/square-root-transformed prior to ANOVA. Branch fall values correspond to the fallen branch and not tothe supporting tree. Complex falls (i.e. association of different modes of disturbance) were excluded from the ANOVA.
Gap makers
Disturbance mode dbh (m) (mean ± SD) Recent Old Total
Snapped tree 0.38 ± 0.20ab 37 61 98 (33.0%)Uprooted tree 0.43 ± 0.18a 18 70 88 (29.6%)Standing dead tree 0.37 ± 0.17ab 24 39 63 (21.2%)Stem fall 0.32 ± 0.08ab 7 10 17 (5.7%)Inclined tree 0.35 ± 0.17ab 9 7 16 (5.4%)Branch fall 0.29 ± 0.10b 1 9 10 (3.4%)Complex falls 0.42 ± 0.17 2 3 5 (1.7%)
Total 0.39 ± 0.18 98 199 297
Disturbances in a tropical semi-deciduous forest 91
(e.g. number and height of surviving individuals), thepresence of inclined canopy trees bordering the gap andlateral extension of tree branches (creating asymmetricalcrowns around gaps).
Information on number and area of gaps formed bydistinct episodes of tree mortality are still scarce ingap literature, particularly for semi-deciduous forests.Nonetheless, several authors stated that trees around gapsare more susceptible to falling for different reasons (Grau2002, Hubbell & Foster 1986, Young & Hubbell 1991,but see Runkle 1990). Runkle (1990) found that morethan 60% of gaps suffered from repeated disturbancesand Riera & Alexandre (1988) found that 14% of totalgap area suffered from new treefalls. In our study site suchgaps represented approximately 25% of all gaps found andthey contributed up to one third of total gap area.
Although repeated gap disturbances are supposed tobe common (Lieberman et al. 1985, Poore 1968, van derMeer & Bongers 1996b, Yavitt et al. 1995), we do notknow to what extent researchers have not consideredcomplex gaps or if they simply did not notice theirexistence. As stated by Runkle (1992), most researchersprobably combined the sections of such gaps togetherinto a single entity. Other researchers have consciouslyexcluded complex gaps from their analysis according totheir needs (Hartshorn 1978, Runkle 1982, van der Meeret al. 1994). However, this sort of treefall gap certainlyinfluences gap regeneration in a different way (Tanaka& Nakashizuka 1994), especially in the time required forgap closure. Therefore, the exclusion of such gaps or themerger of their sectors into one bigger gap, will probablygenerate limitations of interpretation on gap disturbanceregime (Runkle 1992). Despite the practical difficultiesin the recognition of complex gap sectors, we stronglyrecommend their inclusion in future studies aiming todescribe the canopy disturbance regime.
The size class distribution was quite similar to manyother tropical and non-tropical forest sites (Abe et al.1995, Brokaw 1982b, Runkle 1990, van der Meer &Bongers 1996b), corroborating the pattern of canopy gapformation mainly with sizes smaller than 100 m2, mediangap size commonly within 50–80 m2 size class (but seeJans et al. 1993, Lertzman & Krebs 1991) and maximumgap size rarely more than 400 m2 (but see Sanford et al.1986). For instance, Green (1996) and Yavitt et al. (1995)found that 90% and 87% of all canopy gaps were smallerthan 120 and 125 m2, respectively. These results are quitesimilar to ours if we consider the differences associated tothe method of size measurement applied (Lima 2005). Inaddition, our and Lertzman & Krebs (1991) results formedian gap size (both around 78 m2) were comparativelygreater due to differences on gap size measurement aswell.
Although the decrease of gap size over time wasexpected due to lateral and vertical growth of trees, our
data showed that older gaps tended to be larger than morerecent ones for Runkle but not for Brokaw gap limits.One possible explanation would be the rate of repeateddisturbances found in our study area that graduallyincreases gap area (Hubbell & Foster 1986, Lawton& Putz 1988, Runkle 1990, Tanaka & Nakashizuka1994). Another may be related to the past activity ofa catastrophic disturbance agent that generated biggergaps during a specific period of time (Abe et al. 1995). Thedifference among methods occurred probably becauseBrokaw limits are more unstable over short periods of timethan the Runkle method, which requires a tree to reacha certain dbh (generally 20 cm) to have any change onits limits. Still with respect to gap age, it is difficult to stateif the proportion of gaps in the older age class is simplya result of natural accumulation of events or if gaps aresomehow failing to regenerate. Many old canopy gaps inthe study area were related to small height of internalvegetation and/or to a marked abundance of lianas andwoody bamboos (probably Merostachys sp.).
Turnover rate
Values of turnover rate for different forest sites varied(average 129 y: Bongers et al. 1988, Chandrashekara& Ramakrishnan 1994, Jans et al. 1993, van der Meeret al. 1994). The only result found for another seasonalforest (88 y: Brokaw 1982b) was quite close to the oneobserved here (98 y) suggesting that seasonal forests maybe more dynamic than rain forests. No results were foundfor nearby forests and as far as we know this is the firstrecord of turnover rate for Brazilian forests. However, gapdensity and the total per cent of gap area were markedlyhigh than all studies reviewed. These and other resultsdiscussed above suggest that a catastrophic disturbanceevent probably occurred in the EEC more than 5 y ago.As we do not have meteorological data previous to theplot establishment in 2002, we can only suppose whatpossibly happened. Rocha (2003) cited an episode ofstrong winds that occurred in 2002 at the EEC thatcould have promoted such intense disturbance episode.In addition, a massive invasion of lianas and bamboospecies that probably occurred after this major event mayhave held back gap regeneration and kept old gaps openfor longer periods of time.
Our results reinforced the limitations related to thecalculation and interpretation of the turnover rate(sensu Hartshorn 1978). The rate varied greatly betweendelimitation methods, stressing the importance of clearlyexpressing the gap methods employed (Clark 1990, Lima2005). The same is valid for the inclusion of repeateddisturbance events. Hartshorn (1978), for instance,decided not to include such events in his study. However,we found that turnover estimates were highly influenced
92 RENATO A. FERREIRA DE LIMA ET AL.
by the inclusion of repeated disturbance events. Otherimportant issues on the interpretation of the rate are thespatial heterogeneity of the disturbance regime (Arriaga2000, Kapos et al. 1990, Lima & Moura 2007, Poorteret al. 1994) and the limitation of rates based on one-time gap surveys (van der Meer et al. 1994). Moreover,increases of about 14% in canopy openness relatedto deciduous canopy trees are expected during thedry season (R.A.F. Lima & A.M.Z. Martini, unpubl.data), a phenomenon that may greatly influence speciesregeneration in our study site, as well as the biologicalmeaning of the estimated rate.
Canopy gap makers
The proportion of gap makers in each mode of disturbancewas quite similar to lowland and montane tropical forests(Arriaga 2000, Brokaw 1982b, Green 1996, Lima &Moura 2007, Martınez-Ramos et al. 1988, Putz et al.1983, van der Meer & Bongers 1996a), where snappedand uprooted trees are more common than branch-fallsand standing dead trees (but see Carey et al. 1994,Lieberman et al. 1985). This pattern is quite differentfrom the observed for some temperate forest sites wherestanding dead trees seem to be more frequent (Lertzman &Krebs 1991, Runkle 1982). We also found that uprootedtrees were significantly larger than those subject to othermodes of disturbance, as did Arriaga (2000), Martınez-Ramos et al. (1988) and Putz et al. (1983), though thereare authors that found the contrary to be true (Careyet al. 1994). For a more detailed assessment of diameterdistribution among the modes of disturbance in the EEC,see Martini et al. (2007).
We found no evidence that gap maker dbh was a betterpredictor of gap size in contrast to the suggestion found inthe gap literature (Brokaw 1982b, Denslow & Hartshorn1994, Hubbell & Foster 1986). As observed by van derMeer & Bongers (1996a), our results indicate that thenumber of gap makers has more to do with gap size.In addition, the mode of disturbance can also have animportant effect on gap size, as suggested by Lima &Moura (2007). For instance, Lertzman & Krebs (1991)found small average gap size (41 m2) and a big meannumber of gap makers (mean±SD: 5.7±3.8 m2) in a sub-alpine forest, probably as a result of the high proportion ofstanding dead trees (55%). Similarly, the mean gap areaof 55 m2 in the Ivory Coast (Jans et al. 1993) was probablydue to the proportion of gaps formed by branch-falls thatgenerally produce smaller gaps.
ACKNOWLEDGEMENTS
We thank FAPESP and the project ‘Diversidade, dinamicae conservacao em Florestas do Estado de Sao Paulo:
40,96 ha de parcelas permanentes’ (Process no.99/09635-0) within the BIOTA/FAPESP (www.biota.org.br). RAFL and AMZM were supported by CNPq(no. 132.938/2005-7) and FAPESP (no. 04/09554-0).We also thank P.I.K.L. Prado for his help with analysis, theEEC staff (Instituto Florestal - SP), F. Vitti and T. Amorimfor their field support and two anonymous reviewers forvaluable comments.
LITERATURE CITED
ABE, S., MASAKI, T. & NAKASHIZUKA, T. 1995. Factors influencing
sapling composition in canopy gaps of a temperate deciduous forest.
Vegetatio 120:21–31.
ARRIAGA, L. 2000. Types and causes of tree mortality in a tropical
montane cloud forest of Tamaulipas, Mexico. Journal of Tropical
Ecology 16:623–636.
BONGERS, F., POPMA, J., CASTILLO, J. M. & CARABIAS, J. 1988.
Structure and floristic composition of the lowland rain forest of Los
Tuxtlas, Mexico. Vegetatio 74:55–80.
BROKAW, N. V. L. 1982a. The definition of treefall gap and its effect on
measures of forest dynamics. Biotropica 14:158–160.
BROKAW, N. V. L. 1982b. Treefalls: frequency, timing, and
consequences. Pp. 101–108 in Leigh, E. G., Rand, A. S. &
Windsor, D. M. (eds.). The ecology of a tropical forest: seasonal rhythms
and long-term changes. Smithsonian Institution Press, Washington,
DC.
BUSING, R. T. 2005. Tree mortality, canopy turnover, and woody
detritus in old cove forests of the Southern Appalachians. Ecology
86:73–84.
CAREY, E. V., BROWN, S., GILLESPIE, A. J. R. & LUGO, A. E. 1994.
Tree mortality in mature lowland tropical moist and tropical lower
montane moist forests of Venezuela. Biotropica 26:255–265.
CHANDRASHEKARA, U. M. & RAMAKRISHNAN, P. S. 1994.
Vegetation and gap dynamics of a tropical wet evergreen forest in the
Western Ghats of Kerala, India. Journal of Tropical Ecology 10:337–
354.
CLARK, D. B. 1990. The role of disturbance in the regeneration of
neotropical moist forests. Pp. 291–315 in Bawa, K. S. & Hadley,
M. (eds.). Reproductive ecology of tropical forest plants. UNESCO, Paris.
DENSLOW, J. S. 1980. Gap partitioning among tropical rainforest trees.
Biotropica 12:47–55.
DENSLOW, J. S. & HARTSHORN, G. S. 1994. Tree-fall gap environments
and forest dynamic processes. Pp. 120–127 in McDade, L. A., Bawa,
K. S., Hespenheide, H. A. & Hartshorn, G. S. (eds.). La Selva: ecology
and natural history of a neotropical rain forest. The University of Chicago
Press, Chicago, USA.
GRAU, H. R. 2002. Scale-dependent relationships between treefalls and
species richness in a Neotropical montane forest. Ecology 83:2591–
2601.
GREEN, P. T. 1996. Canopy gaps in rain forest on Christmas Island,
Indian Ocean: size distribution and methods of measurement. Journal
of Tropical Ecology 12:427–434.
Disturbances in a tropical semi-deciduous forest 93
HARTSHORN, G. S. 1978. Tree falls and tropical forest dynamics.
Pp. 617–638 in Tomlinson, P. B. & Zimmermann, M. H. (eds.).
Tropical trees as living systems. Cambridge University Press, New York.
HUBBELL, S. P. & FOSTER, R. B. 1986. Canopy gaps and the dynamics of
a neotropical forest. Pp. 77–96 in Crawley, M. J. (ed.). Plant ecology.
Blackwell Scientific Publications, Oxford.
JANS, L., POORTER, L., VAN ROMPAEY, R. S. A. R. & BONGERS, F.
1993. Gaps and forest zones in tropical moist forest in Ivory Coast.
Biotropica 25:258–269.
KAPOS, V., PALLANT, E., BIEN, A. & FRESKOS, S. 1990. Gap frequencies
in lowland rain forest sites on contrasting soils in Amazonian
Ecuador. Biotropica 22:218–225.
LAWTON, R. O. & PUTZ, F. E. 1988. Natural disturbance and gap-
phase regeneration in a wind-exposed tropical cloud forest. Ecology
69:764–777.
LERTZMAN, K. P. & KREBS, C. J. 1991. Gap-phase structure of a
subalpine old-growth forest. Canadian Journal of Forest Research
21:1730–1741.
LIEBERMAN, D., LIEBERMAN, M., PERALTA, R. & HARTSHORN, G. S.
1985. Mortality patterns and stand turnover rates in a wet tropical
forest in Costa Rica. Journal of Ecology 73:915–924.
LIMA, R. A. F. 2005. Gap size measurement: the proposal of a new field
method. Forest Ecology and Management 214:413–419.
LIMA, R. A. F. & MOURA, L. C. 2007. Gap disturbance regime and
composition in the Atlantic montane rain forest: the influence of
topography. Plant Ecology (in press).
MARTINEZ-RAMOS, M., ALVAREZ-BUYLLA, E., SARUKHAN, J. &
PINERO, D. 1988. Treefall age determination and gap dynamics in a
tropical forest. Journal of Ecology 76:700–716.
MARTINI, A. M. Z., LIMA, R. A. F., FRANCO, G. A. D. C. & RODRIGUES,
R. R. 2007. The need for full inventories of tree modes of disturbance
to improve forest dynamics comprehension: an example from a semi-
deciduous forest in Brazil. Forest Ecology and Management (in press).
McGILL, R., TUKEY, J. W. & LARSEN, W. A. 1978. Variations of box
plots. The American Statistician 32:12–16.
POORE, M. D. E. 1968. Studies in the Malaysian rain forest: I. The forest
on Triassic sediments in Jengka Forest Reserve. Journal of Ecology
56:143–196.
POORTER, L., JANS, L., BONGERS, F. & VAN ROMPAEY, R. S. A. R.
1994. Spatial distribution of gaps along three catenas in the moist
forest of Tai National Park, Ivory Coast. Journal of Tropical Ecology
10:385–398.
POPMA, J., BONGERS, F., MARTINEZ-RAMOS, M. & VENEKLAAS, E.
1988. Pioneer species distribution in treefall gaps in neotropical rain
forest: a gap definition and its consequences. Journal of Tropical Ecology
4:77–88.
PUTZ, F. E., COLEY, P. D., LU, K., MONTALVO, A. & AIELLO, A.
1983. Uprooting and snapping of trees: structural determinants
and ecological consequences. Canadian Journal of Forest Research
13:1011–1020.
RIERA, B. & ALEXANDRE, D. Y. 1988. Surface des chablis et temps
de renouvellement en foret dense tropicale. Acta Oecologica 9:211–
220.
ROCHA, F. T. 2003. Levantamento florestal na Estacao Ecologica
dos Caetetus como subsıdio para laudos de desapropriacao ambiental.
M.Sc. dissertation, Escola Superior de Agricultura Luiz de Queiroz,
Piracicaba. 155 pp.
RUNKLE, J. R. 1982. Patterns of disturbance in some old-growth mesic
forests of Eastern North America. Ecology 63:1533–1546.
RUNKLE, J. R. 1990. Gap dynamics in an Ohio Acer-Fagus forest and
speculations on the geography of disturbance. Canadian Journal of
Forest Research 20:632–641.
RUNKLE, J. R. 1992. Guidelines and sample protocol for sampling forest
gaps. Forest Service (PNW-GTR-283), Portland. 44 pp.
SANFORD, R. L., BRAKER, H. E. & HARTSHORN, G. S. 1986. Canopy
openings in a primary neotropical lowland forest. Journal of Tropical
Ecology 2:277–282.
TANAKA, H. & NAKASHIZUKA, T. 1994. Fifteen years of canopy
dynamics analyzed by aerial photographs in a temperate deciduous
forest, Japan. Ecology 78:612–620.
VAN DER MAAREL, E. 1993. Some remarks on disturbance and its
relations to diversity and stability. Journal of Vegetation Science 4:733–
736.
VAN DER MEER, P. J. & BONGERS, F. 1996a. Patterns of tree-fall and
branch-fall in a tropical rain forest in French Guiana. Journal of
Ecology 84:19–29.
VAN DER MEER, P. J. & BONGERS, F. 1996b. Formation and closure of
canopy gaps in the rain forest at Nouragues, French Guiana. Vegetatio
126:167–179.
VAN DER MEER, P. J., BONGERS, F., CHATROU, L. & RIERA, B. 1994.
Defining canopy gaps in a tropical rain-forest – effects on gap size and
turnover time. Acta Oecologica 15:701–714.
YAVITT, J. B., BATTLES, J. J., LANG, G. E. & KNIGHT, D. H. 1995.
The canopy gap regime in a secondary neotropical forest in Panama.
Journal of Tropical Ecology 11:391–402.
YOUNG, T. P. & HUBBELL, S. P. 1991. Crown asymmetry, treefalls, and
repeat disturbance of broad-leaved forest gaps. Ecology 72:1464–