72 TRANSPORTATION RESEARCH RECORD 1278 Repeated Load Model for Subgrade Soils: Model Development LUTFI RAAD AND BASSAM A. ZEID A load deformation model for subgrnde oil. is developed, wh re total cumulative axial strain a.re correlated with a1 plied tresses and number of load repetition . The model is ba ed on the re ults of repeated load tests for a compacted silty cl;:iy . The concept f a constant failure strnin independe nt of load histo ry is presented and used in the propo ed model. Results of stat ic 1riaxial te ts, low cyclic test , and repeated load tests are used to verify that th e failure strain for given compaction condilinn and confining pressure i. essentially ind pendent of st res hi tory. Good agree - ment i btained between predicted strains and cxperim ntal val- ues from repeated load te ts. Model prediction are within ± 10 p rce nt of experimental results. Modern techniques for pavement de. ign and analysis utilize limiLing response criteria to control cracking and rutting in pavement structures. The behavior of the subgrade, in this case could be of major signifi 11ncc t the overall perfo1111arn.:e of th pavement. The re ilient: behavior of ubgradc soils has been defined in term f repeated ·tres ·e and recoverable or elastic strains. Those relations have been incorporated into multilayer analyses for the purpose of predicting th e resilient re pollSe of pavements under repeate d traffic loads (J -3). Limiting value in the critical re ponse parameter. are pro- po' ecl by many rational des ign methods a a mean of achiev- ing satisfactory pavement performance. In the ca ·e of subgrade oils, such criteria are prese nt ed in terms of strains, nornrnl ·tres· · and devia tor stresses on top of the subgrade layer. Tho e criteria have been determined in rwo different ways: Cir t, through the use of structural models to pave- ment of known performance (4 - 7) and, second, thrnugh laboratory testing of spec im en under repeated tre. appli- cations (8 - 10) . Other permanent deformati n model , u b a tho e proposed by Barksdale (J 1) , Knutson et al. (12) , and Moni mith et al. (13), could be used to estimate the magnitude of subgrade strain t r a different number of load applications. me limitation of those criteria and p .rm anent deformation models are summarized: 1. Subgrade normal strain criteria are derived through back- calculation procedures by using multil:iyer elastic analysis of pavements with known performance and, therefore , ignore the stress-dependent behavior of the pavement materials. Moreover, those criteria are uitable for similar pavement conditions and are not applicable, in general, to conditions of different pavement loading, materials, geometry, and environment. L. Rantl. Tn sc it'utc of Northern Engi neering, University of Alaska, Fairbitnk , Alaska l)l)77 .. l:l . A. Zeitl, Dar Al-Hantlassah (Shair and Partners) Beirut, Lebanon . 2. Subgrade normal stress or strain criteria derived from laboratory tests do not explicitly account for the influence of changes in subgrade soil type, density, moisture content, and stress state on the accumulation of plastic strains under field- ! ading conditions. Those criteria, expre ·sed in terms of lim- iting str ss s or trains are based on applicable permanent strain level in lab ratory sp cimcns and do not provid¢ tht: mechanism for predicting permanent strai ns in the subgrade. 3. Although available permanent train model can be used to estimate the permanent deformations in the subgrade , the models do not provide an as· s ment of subgrade failure in terms of increased rate of plastic strain accumulation. Those failure conditions need to be incorporated in advanced anal- yses of pavements for the purpose of improving pavement response and performance predictions (2 ,14). The development of improved stress-strain models should describe the load-deformation and strength behavior of com- pacted fine-grained subgrade soils under repeated loads. Those would be considered in lieu of reported findings that suggest that failure train is generally independent of loading rate or type but depend m;:iinly on the initial co.nditions of the pec- imen (i.e. initial stress . tare, den ity, and moi ·ture c nr ent). Experim ntal work conducted by Vaid and ampanella (15) on undisturh d Haney day indicates that for gi en testing conditions, irrespective of the creep stress level, rupture occurs approximately at the ame magnitude f axial strain and that this is equal to the failure strain in conventional constant strain rate undrained shear te ting. imilar observation were reported by Mitchell (16) on the failure train of differ nt types of undi turbed clays under creep loading. More recently data provided by An al and Erken (17) on the behavior of one- dimensionally con olidated Ka linite clay under cyclic simple shear testing show that the cyclic shear strain amplitude cor- respondLng to the cyclic yield su·e ngLh remains e entially on- tant for different numbers of tress cycles. Zeid (18) inve ·- ligated the behavi. or of a compacted silty clay under different forms of loading that included static test , creep test and repea ted load tests. Results illustrate that the failure strain for a given confining pre·sure dry density, and compaction moisture coment remains essentially constant, independent of the type of the test perfonned . Results of static triaxial tests, slow cyclic load tests, and repeated load tests for a compacted silty clay are presented here to illustrate the co.ncept of a constant failure strain, inde- pendent of stress history. This concept is used in the devel- opment of a load-deformation model for subgrade ·oils, where t Lal strains are correlated with repeated stresses and number of load repetitions. Strain predictions, using the proposed
Transcript
72 TRANSPORTATION RESEARCH RECORD 1278
Repeated Load Model for Subgrade Soils: Model Development
LUTFI RAAD AND BASSAM A. ZEID
A load deformation model for subgrnde oil. is developed, wh re total cumulative axial strain a.re correlated with a1 plied tresses and number of load repetition . The model is ba ed on the re ults of repeated load tests for a compacted silty cl;:iy. The concept f a constant failure strnin independent of load histo ry is presented and used in the propo ed model. Results of static 1riaxial te ts, low cyclic test , and repeated load tests are used to verify that
the failure strain for given compaction condilinn and confining pressure i. essentially ind pendent of st res hi tory. Good agreement i btained between predicted strains and cxperim ntal values from repeated load te ts. Model prediction are within ± 10 p rcent of experimental results.
Modern techniques for pavement de. ign and analysis utilize limiLing response criteria to control cracking and rutting in pavement structures. The behavior of the subgrade, in this case could be of major signifi 11ncc t the overall perfo1111arn.:e of th pavement. The re ilient: behavior of ubgradc soils has been defined in term f repeated ·tres ·e and recoverable or elastic strains. Those relations have been incorporated into multilayer analyses for the purpose of predicting the resilient re pollSe of pavements under repeated traffic loads (J -3). Limiting value in the critical re ponse parameter. are propo ' ecl by many rational design methods a a mean of achieving satisfactory pavement performance. In the ca ·e of subgrade oils, such criteria are presented in terms of strains, nornrnl ·tres · · and devia tor stresses on top of the subgrade layer. Tho e criteria have been determined in rwo different ways: Cir t , through the use of structural models to analy~e pavement of known performance (4 - 7) and, second , thrnugh laboratory testing of specimen under repeated tre. applications (8- 10). Other permanent deformati n model , u b a tho e proposed by Barksdale (J 1) , Knutson et al. (12) , and Moni mith et al. (13), could be used to estimate the magnitude of subgrade strain t r a different number of load applications.
me limitation of those criteria and p .rm anent deformation models are summarized:
1. Subgrade normal strain criteria are derived through backcalculation procedures by using multil:iyer elastic analysis of pavements with known performance and, therefore , ignore the stress-dependent behavior of the pavement materials. Moreover, those criteria are uitable for similar pavement conditions and are not applicable, in general, to conditions of different pavement loading, materials , geometry, and environment.
L. Rantl. Tnsc it'utc of Northern Engi neering, University of Alaska, Fairbitnk , Alaska l)l)77 . . l:l. A. Zeitl, Dar Al-Hantlassah (Shair and Partners) Beirut, Lebanon.
2. Subgrade normal stress or strain criteria derived from laboratory tests do not explicitly account for the influence of changes in subgrade soil type, density, moisture content, and stress state on the accumulation of plastic strains under field! ading conditions . Those criteria, expre ·sed in terms of limiting str ss s or trains are based on applicable permanent strain level in lab ratory sp cimcns and do not provid¢ tht: mechanism for predicting permanent strai ns in the subgrade.
3. Although available permanent train model can be used to estimate the permanent deformations in the subgrade, the models do not provide an as· s ment of subgrade fai lure in terms of increased rate of plastic strain accumulation . Those failure conditions need to be incorporated in advanced analyses of pavements for the purpose of improving pavement response and performance predictions (2 ,14).
The development of improved stress-strain models should describe the load-deformation and strength behavior of compacted fine-grained subgrade soils under repeated loads. Those would be considered in lieu of reported findings that suggest that failure train is generally independent of loading rate or type but depend m;:iinly on the initial co.nditions of the pecimen (i.e. initial stress . tare , den ity , and moi ·ture c nre nt). Experim ntal work conducted by Vaid and ampanella (15) on undisturh d Haney day indicates that for gi en testing conditions, irrespective of the creep stress level , rupture occurs approximately at the ame magnitude f axial strain and that this is equal to the failure strain in conventional constant strain rate undrained shear te ting. imilar observation were reported by Mitchell (16) on the failure train of differ nt types of undi turbed clays under creep loading. More recently data provided by An al and Erken (17) on the behavior of onedimensionally con olidated Ka linite clay under cyclic simple shear testing show that the cyclic shear strain amplitude correspondLng to the cyclic yield su·engLh remains e entially on-tant for different numbers of tress cycles. Zeid (18) inve ·
ligated the behavi.or of a compacted silty clay under different forms of loading that included static test , creep test and repeated load tests. Results illustrate that the failure strain for a given confin ing pre ·sure dry density, and compaction moisture coment remains essentially constant, independent of the type of the test perfonned.
Results of static triaxial tests, slow cyclic load tests, and repeated load tests for a compacted silty clay are presented here to illustrate the co.ncept of a constant failure strain, independent of stress history. This concept is used in the development of a load-deformation model for subgrade ·oils, where t Lal strains are correlated with repeated stresses and number of load repetitions. Strain predictions, using the proposed
Raad and Zeid
model, are compared with experimental results from repeated load tests.
EXPERIMENTAL WORK
Testing Procedure
Strain-controlled static triaxial tests, stress-controlled slow cyclic · load tests , and stress-controlled repeated (transient) load tests were conducted on a compacted silty clay in the undrained mode. The identification properties of the soil used are summarized in Table 1. The soil was compacted in a California bearing ratio (CBR) mold according to the modified AASHTO method (ASTM D1557-66T). Specimens were then extruded by using thin wall brass tube samplers and trimmed to 1.5-in diameter and 3.0-in height. Each specimen was placed between a cap and a base, encased in two rubber membranes, and cured in a water bath until ready for testing.
Two series of static triaxial tests were performed on specimens, which were cured for 24 hr and had dry densities and compaction moisture contents covering the range defined by modified AASHTO compaction. In the first series , the specimens were subjected to a confining pressure of 14.5 psi and then were loaded to failure at strain rates equal to 0.084 percent/min, 0.50 percent/min, and 1.96 percent/min. In the second series, the specimens were tested at a strain rate of 0.50 percent/min at confining pressures of zero, 14.5 psi, 29 psi, and 58 psi.
Cyclic load tests and repeated load tests were conducted on specimens cured for 2 weeks. Those specimens had a dry density of 129.5 lb/ft3 and compaction moisture content corresponding to optimum ± 1.5 percent . The maximum dry density and optimum moisture content given by modified AASHTO compaction were 131.5 lb/ft3 and 8.5 percent. The allowable range of variation for dry density and compaction moisture content for the tested specimens was ± 0.6 lb/ft3 and ± 0.25 percent, respectively.
A confining pressure of 14.5 psi was used for the cyclic load tests. The specimens were then subjected to cyclic deviator stresses that had essentially a rectangular shape and a duration of 0.50 min at a frequency of 1 cpm. The specimen was immediately loaded to failure at a constant rate of strain following the applications of a specific number of load cycles. The strain rates used were 0.084 percent/min and 1.96 percent/min. The cyclic stresses corresponded to 50 percent and 80 percent of the strength associated with the applied strain rate at the end of the cyclic period. The number of stress cycles of each stress level applied were 10, 50, 100, and 150.
TABLE 1 IDENTIFICATION PROPERTIES OF SIL TY CLAY USED
Parameter
Liquid limit Plasticity index Specific gravity Percent finer than 0.074 mm Clay fraction (percent less than 0.002 mm) Unified Classification AASHTO Classification
Value
28 11 2.708
80 18 CL A-6(7)
73
In the repeated load tests, specimens were tested in the unconfined state and at a confining pressure equal to 14.5 psi . Pneumatically controlled deviator stress pulses having an approximate triangular shape and average duration of 0.2 sec were applied at a frequency of 40 cpm. Stress levels of 0.70, 0.80, 0.90, and 0.95 were used. The stress level is defined in this case as the ratio of repeated deviator stress to the strength obtained from a standard triaxial test at a strain rate of 0.5 percent per minute. For a given repeated stress level, the axial strains were monitored with number of load repetitions. A summary of testing conditions and strength properties of the silty clay used in this study is presented in Tables 2 and 3, respectively.
Results
Results of triaxial tests presented in Figures 1 and 2 indicate that the failure strain E1, defined as the axial strain at peak
TABLE 2 TESTING CONDITIONS FOR THE SILTY COMPACTED CLAY
Test Type Confining Pressure
(psi) .. " Controlled Static Trhxlal Test
.. Series I 14.5
- Series 2 0,14.5,29,58
Stress 14.5 Controlled Cycl tc Test
Repeated Load 0 , 14.5 Test
Stress Level
0 . 50, 0 . 80
0.70,0.80, 0.90,0 . 95
Stra\n Rate
(t per m1n)
0.084,0.50, 1.96
0 . 50
0.084,1.96,
Frequency Duration and Shape (sec)
1 cpr. 30 (rectanguhr)
40 cpm (triangular)
0. 20
Numbe r of
Cyc l es
10,50, 100, 150
In the strain-controlled stat1c tr1ax1a1 tests, the dry density and compaction moisture content of specimens covered the range defined by mod1f1ed AASHTO compaction. Specimens were cured for 24 hours prior to testing .
In the cyclic and repeated load tests, specimens were compacted to a dry density of 129.5 lb/cu ft and moisture content of 7 .0 percent and 10 percent . Specimens were cured for two weeks prior to testing.
The maximum dry density and optimum moisture content associated with modified AASHTO compaction were 131.5 lb/cu ft and B.5 percent respectively.
TABLE 3 SHEAR STRENGTH CHARACTERISTICS OF THE SILTY CLAY
Shear strength properties were determined using strain-controlled undrained triaxial tests with rate of applied strain equal to 0.50 percent per minute.
Udf is equal to the difference of major principal stress a1 and minor principal stress a3 at failure.
74
180
160
~ 140 "iii s '£ 120
en en 100 w a: ~ en 80 a: 0 ~ 60 > w 0
40
20
0
0"3 = 14.5 psi
A : Ea • 1.96%per min
m - 5.99 %
yd - 126.2 lb/cu ft
B : Ea = 0.5% per min
m = 5.90%
yd = 125.5 lb/cu ft
C : Ea = 0.084 % per min
m = 5.84 %
yd = 1262 blcu ft
2.0 4.0 6.0 8.0 10.0 12.0 14.0
AXIAL STRAIN (Ea(%} )
200
180
160
~ 140 "iii s 'O"O 120
en en 100 w a: ~ en 80 a: 0 ~ 60 > w 0
40
20
0
TRANSPORTATION R ESEARCH RECORD 1278
0"3 - 14.5 psi
A : Ea = 1.96% per min
m = 7.68 %
yd = 130.4 lb/cu ft
B : Ea = 0.5% per min
m = 7.97 %
yd - 130.0 lblcu ft
C : Ea - 0.084 % per min
m = 7.98 %
yd = 130.5 lb/cu ft
2.0 4.0 6.0 8.0 10.0 12.0 14.0
AXIAL STRAIN (Ea(%})
FIGURE 1 Stress-strain behavior for specimens compacted dry of optimum.
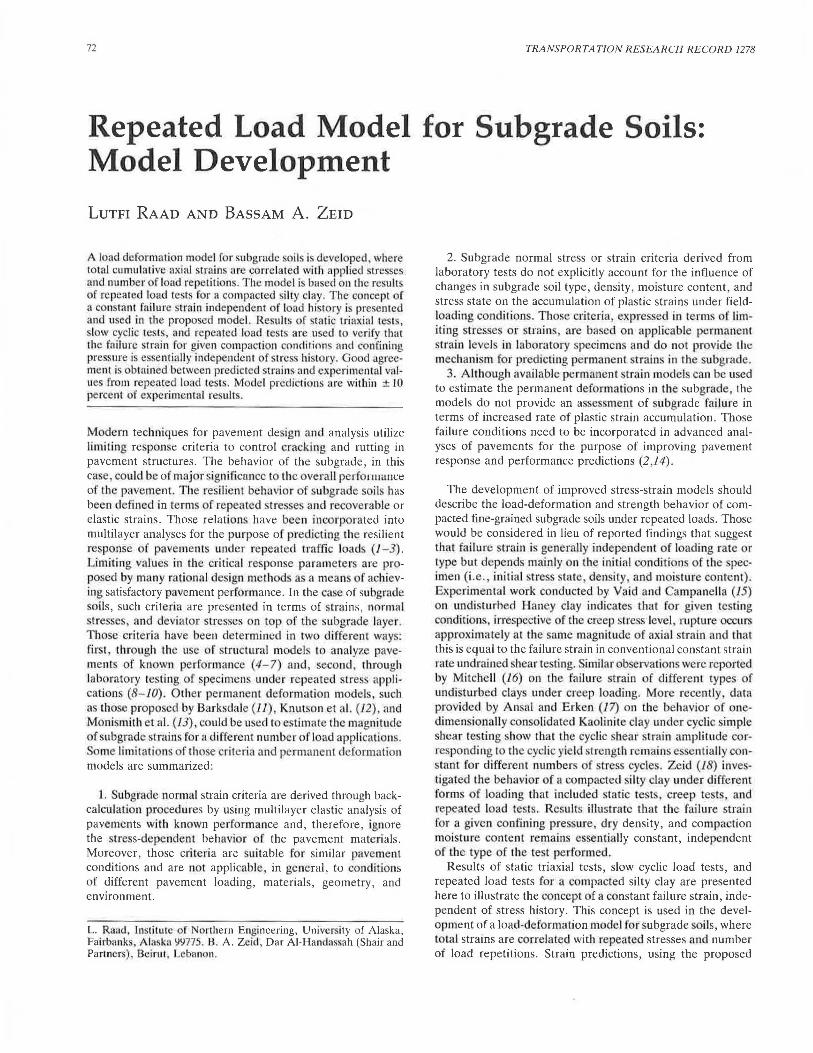
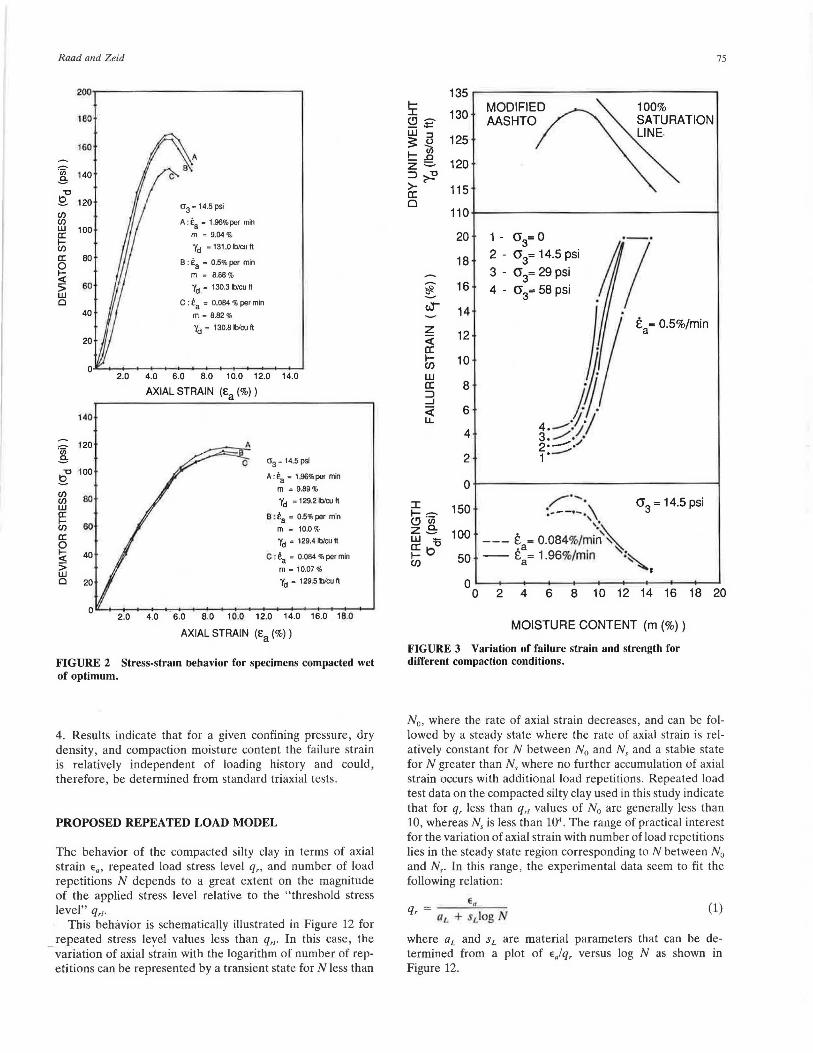
deviator stress, seems to be relatively independent of applied strain rate dE)dt for a given confining pressure u 3 , dry density -yd, and compaction moisture content m. Although the influence of strain rate on the strength can be significant, the variation of the strain at failure remains small. For example, the strength of specimens with average dry density of 130 lb/ft3 and compaction moisture content of 7.88 percent exhibits a strength increase from 145 psi when subjected to a strain rate of 0.084 percent/min to 188 psi when the strain rate is 1.96 percent/min. The failure strain, however, remains in the range of 3.0 percent to 3.4 percent (Figure 1) . The influence of confining pressure, compaction moisture content, and dry density on the failure strain is shown in Figure 3. An increase in confining pressure and compaction moisture content will result in higher failure strain values.
Similar observations are made in the case of the slow cyclic load tests, where cyclic deviator stress applications seem to have little effect on the failure strains as shown in Figures 4-7. The strength increases as the number of stress applications increases up to 50 cycles and then decreases with further increase in the number of cycles. The increase in strength is more significant for dry of optimum compaction conditions and lower cyclic stresses. Although the strength is influenced by cyclic stress history, the strain at failure remains virtually unaffected. In this case, the failure strain varies in the range of 2.8 percent to 3.2 percent for specimens compacted dry of optimum and 8.8 percent to 9.2 percent for specimens compacted wet of optimum .
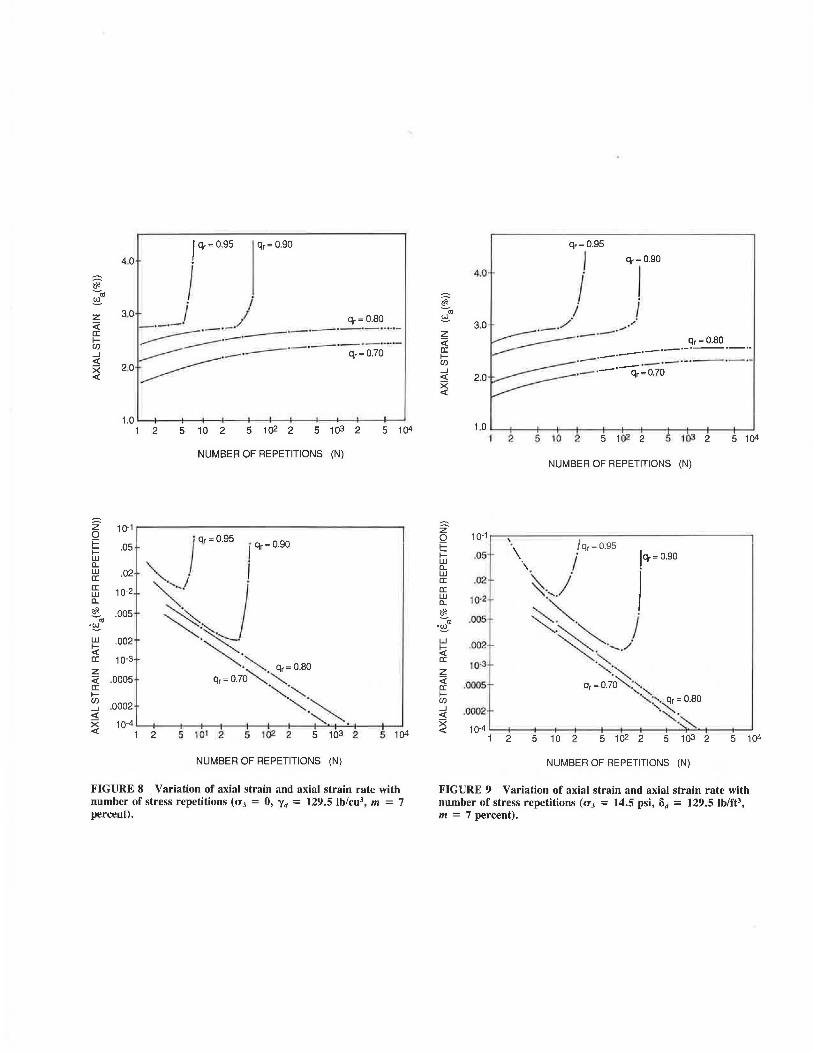
Results of repeated load tests presented in Figures 8-11 illustrate the variation of total accumulated axial strain Ea, defined as the sum of resilient strain and permanent strain, with the number of repetitions N of a given stress level q,. The variation of the rate of accumulation of axial strain dEaldN with the number of repetitions is also shown. The results indicate the existence of a "threshold stress level" below which the accumulation of axial strain will eventually cease and lead to a stable response and above which progressive accumulation of axial strains occurs and causes unstable response and ultimately failure . The " threshold stress level" for the repeated load tests performed lies between 0.80 and 0.90. Similar findings for a "threshold stress level" have been reported by other investigators (19 ,20). For repeated stresses larger than the "threshold value," the rate of axial strain dE) dN decreases initially to a minimum value with the number of repetitions, after which it starts to increase. This flexure indicates a condition of incipient failure. This condition is conceived as a possible definition of failure under repeated loading, and the corresponding strains will be defined as failure strains. For example, failure strain values, obtained for a confining pressure of 14.5 psi, lie between 2.8 percent and 3.0 percent for specimens compacted dry of optimum and between 8.9 percent and 9.2 percent for specimens compacted wet of optimum. This agrees well with the failure strains obtained from cyclic load tests reported previously.
A summary of failure strain values for all the testing and compaction conditions used in this study is presented in Table
Raad and Zeid
200
180
160
"iii 140 .e, "C
~ 120 CJ) CJ) w 100 a: I-CJ)
a: 80
~ > 60 w 0
40
20
0 2.0
1~0
"iii 120
.e, "C 100 ~ CJ)
80 CJ) w a: I- 60 CJ)
a:
~ 40
> w 0 20
0"3 = 14.5 psi
A : ta = 1.96%per min
m = 9.04%
yd - 131 .0lblcuft
8 : ta = 0.5% per min
m = 8.68%
yd = 130.3 lblcu It
C : ta = 0.084 % per min
m = 8.82 %
yd - 130.8 blcu ft
4.0 6.0 8.0 10.0 12.0 14.0
AXIAL STRAIN (Ea (%) )
0"3 -14.5 psi
A:Ea - 1.96%per min
m = 9.89%
yd - 129.2 lblcu It
B : ta = 0.5% per min
m - 10.0%
yd - 129.4 lb/cu ft
C t ta - 0.084 % per min
m - 10.07%
yd - 129.5 blcu ft
12.0 14.0 16.0 18.0
AXIAL STRAIN (Ea (%) )
FIGURE 2 Strcss-stram behavior for specimens compacted wet of optimum.
4. Results indicate that for a given confining pressure, dry density, and compaction moisture content the failure strain is relatively independent of loading history and could, therefore, be determined from standard triaxial tests .
PROPOSED REPEATED LOAD MODEL
The behavior of the compacted silty clay in terms of axial strain e0 , repeated load stress level q,, and number of load repetitions N depends to a great extent on the magnitude of the applied stress level relative to the "threshold stress level" qr1.
This behavior is schematically illustrated in Figure 12 for repeated stress level values less than q,1• In this case, the
- variation of axial s'train with the logarithm of number of repetitions can be represented by a transient state for N less than
~ w z < a: I-(/)
w a: :::J ...J
< LL
I I-= (.!) en z~ w -a: "C I- ~ (/)
125
120
115
110
20
18
16
14
12
10
8
6
4
2
150
100
MODIFIED AASHTO
1 • 0"3=0 2 - 0"3= 14.5 psi
3 - a3= 29 psi
4 · a3= 58 psi
/'-., a3 =14.5 psi :,--•-·\~
. I . ' --- e = 0.084% min 50 -- E:= 1.96%/min ~:,
I
75
0'---+~--~-+-~t---+~-+-~+-~>---+~~
0 2 4 6 8 10 12 14 16 18 20
MOISTURE CONTENT (m {%))
FIGURE 3 Variation of failure strain and strength for different compaction conditions.
Na, where the rate of axial strain decreases, and can be followed by a steady state where the rate of axial strain is relatively constant for N between N0 and Ns and a stable state for N greater than Ns where no further accumulation of axial strain occurs with additional load repetitions. Repeated load test data on the compacted silty clay used in this study indicate that for q, less than qr1 values of Na are generally less than 10, whereas Ns is less than 104 • The range of practical interest for the variation of axial strain with number of load repetitions lies in the steady state region corresponding to N between N0
and Ns. In this range, the experimental data seem to fit the following relation:
q, = (I ,_ + st.log N (1)
where aL and st. are material parameters that can be determined from a plot of e.fq, versus log N as shown in Figure 12.
200 ~·ooom 200 ~·oo[JJ] '8 50 '8 50
180 0 180 o O.S 1.0 Ui 2.0 0.5 1.0 1.5 2.0 t (min) 1 (min)
160 160 ~
'iii 140 ..e,
'iii ..e, 140
'O oQ Q 120 120 en en en en w 100 w
100 a: a: f- f-en en a: 80 a 3 = 14.5 psi a: 80 a 3 = 14.5 psi 0 0 f- Ea = 0.084 % per min f- Ea = 1.96 % per min <( <(
> 60 A: N=10 > A: N=10 w w 0 0
B : N=50 B : N=50 40
C: N=100 40
C : N=100
20 D: N=150 20
D: N=150
E: N=O E : N=O
0 2.0 4.0 6.0 2.0 4.0 6.0
AXIAL STRAIN (Ea(%}) AXIAL STRAIN (Ea(%})
FIGURE 4 Load deformation behavior under 50 percent cyclic stress level ('Yd = 129.5 Ib/ft3, m = 7 percent).
200 200
1""6J]] 180 i .. bJJJ 180 iS' 100 -100 ~
0 0 0.5 1.0 1.5 2.0 0,5 1.0 1.5 2.0
160 t (min) 160 1 (min)
A ~ ~
"iii 140 "iii 140 ..e, ..e, 'O 'O
Q 120 Q 120 en en en en w 100 w 100 a: a: f- f-en
<T3 = 14.5 psi en cr3 - 14.5 psi a: 80 a: 80
~ Ea = 0.084 % per min 0 Ea = 1.96 % per min ~
> 60 A: N=10 > 60 A : N=10 UJ w 0 B; N=50 0 B: N=50
40 40 C; N=100 C: N=100
20 D; N-150 20 D : N=150
E: N=O E : N=O
0 0 2.0 4.0 6.0 2.0 4.0 6.0
AXIAL STRAIN (Ea(%} ) AXIAL STRAIN (Ea (%) )
FIGURE 5 Load deformation behavior under 80 percent cyclic stress level (yd = 129.5 Ib/ft3, m = 7 percent).
140 100~ ~ 58_5 - 50
120 to-0
·o; 0 0.5 1-0 1.5 2.0 2.5 .e, t (min)
"O 100 12. cr3 - 14.5 psi
(/) Ea - 0.084 % per min (/) 80 w a: A: N-10 I-
60 (/) B : N=50 a: 0 C : N- 100 I- 40 <(
> D: N- 150 w Cl 20 E : N=O
0 2.0 4.0 6.o 0.0 1 a.a 12.0 14.0 16.o 10.a 20.0
AXIAL STRAIN (Ea(%))
140
~1
115 n rl B :c 'iii ~E
0 o.s 1.0 1.5 2.0 2_
.e, ~A t (min)
"O ' 0 12. Cl3 - 14.5 psi (/)
80 E8
• 1.96 % per min (/) w a: A: N-10 I-en 60 a: B: N-50
0 C: N-100 !;{ 40
> D: N-1 50 w Cl 20 E: N-0
a 2_0 4.0 6.a 8.a 1a.a 12.0 14.a 16.a 18.0 2a.a
AXIAL STRAIN (Ea(%) )
FIGURE 6 Load deformation behavior under SO percent cyclic stress level ('Yd = 129.S lb/ft3, m = 10 percent).
140
120 ·o; .e, ~ 100
(/) (/) 8 w a: I-(/)
a: ~ <(
> w Cl 20
a
140
'iii 12-.9: ~ 100
(/) (/) w
~ a:
~ > w Cl
60
60
0
~1
116
D d 0 0.5 1.0 1.5 2.0 2.5
t (min)
cr3 = 14.5 psi
Ea • 0-084 % per min
A: N=10
B: N=50
C: N=IOO
D : N-150
E: N=O
2_a 4.o 6.a 0.a 1 a.a 12.0 14.a 16.o 10.a 2a.a
AXIAL STRAIN (Ea(%))
D
A B
~'1:1 D d 0 0.5 1.0 1.5 2.0 2.5
1 (min)
Cl3 -14.5 psi
Ea = 1.96 % per min
A: N-10
B: N=50
C: N=100
D: N=150
E: N=O
AXIAL STRAIN (ea(%) )
FIGURE 7 Load deformation behavior under 80 percent cyclic stress level ('Yd = 129.S lb/ft3 , m = 10 percent).
z < a: ten ....I <(
~
z 0 i= i= w a.. w a: a: w a.. e~ ~ .. ·~ w ~ a: z < a: I-en ....I <(
FIGURE 11 Variation of axial strain and axial strain rate with number of stress repetitions (a3 = 14.5 psi, 'Yd = 129.5 lb/ft3 ,
m = 10 percent).
TABLE 4 VARIATION OF FAILURE STRAIN DETERMINED FROM TRIAXIAL, CYCLIC, AND REPEATED LOAD TESTS
Compaction Properties
1d = 129.5 lb/cu ft m = 7 %
1d = 129.5 lb/cu ft m • 10 %
Failure Strain, Ef(%)
a3 • 14.5 psi
2.70 - 2.90 2.80 - 3.20
5.90 - 6.20 8.80 - 9.40
80
No Ns Log (N)
Log (N)
FIGURE 12 Schematic illustration of repeated load model for low stresses.
Repeated applications of stress level with a magnitude exceeding the "threshold value" lead initially to a transient variation of axial strain for N less than N0 , followed for larger N values by a steady state and then a tertiary state where the rate of axial strain will increase, leading eventually to failure when N reaches NJ. Values of N 0 were estimated to be generally less than 5. In the range where N is between N0 and NJ, the repeated load data for axial strain, repeated stress level, and number of repetitions can be represented by the following relation:
(2)
TRANSPORTATION RESEARCH RECORD 1278
where
b11 = B" + S,, log N (3)
and a., B 11 , and s. are material parameters. Equation 2 indicates that the variation of q, and Ea for a
given N is hyperbolic. For a given N, a11 and b,, can be determined from a plot of E./q, versus E., as is indicated in Figure 13 . Repeated load test data for the compacted silty clay were analyzed to determine material parameters in Equations 2 and 3. In this case, the variation of ah for different values of N was found relatively insignificant, and the average ah for
No Nt Log (N)
~--bh ' ___ J For a
1 given N
Ea FIGURE 13 Schematic illustration of repeated load model for high stresses.
Raad and Zeid
at least three selected values of N covering the range between N0 and N1 was determined . The corresponding values of b" were then used to find B11 and S11 in Equation 3.
The axial strain Ea in Equations 1 and 2 is expressed in percent, and the corresponding material parameters are summarized in Table 5 for all testing conditions. Predictions using the proposed model are compared with experimental results in Figures 14 and 15. Model predictions of axial strains are within ± 10 percent of experimental values.
SUMMARY AND CONCLUSIONS
A load-deformation model for subgrade soils is developed, where total cumulative axial strains are correlated with applied stresses and number of load repetitions and is based on the results of repeated load tests conducted on a compacted silty clay. The concept of a constant failure strain independent of load history was used in the proposed model. Results of static triaxial tests, slow cyclic tests, and repeated load tests for the compacted silty clay were used to verify that the strain at failure for given compaction conditions and confining pressure is essentially independent of stress history. Good agreement was obtained between predicted strain values by using the proposed model and experimental values from repeated load tests . Model predictions were within ± 10 percent of experimental results.
ACKNOWLEDGMENTS
The experimental investigation presented in this paper was conducted at the American University of Beirut. Most of the analyses were performed at the University of Alaska, Fairbanks. The help provided by the Civil Engineering Department at both universities is greatly appreciated.
FIGURE 15 Verification of model predictions for specimens compacted wet of optimum ("/d = 129.5 lb/ft3, m = 10 percent).
REFERENCES
1. S. F. Brown and J. W. Pappin. Analysis of Pavements with Granular Basis. In Transportation Research Record 810, TRB, National Research Council, Washington, D.C., 1981, pp. 17-23.
2. L. Raad and J. L. Figueroa. Load Response of Transportation Support Systems. Journal of the Transportation Engineering Division, ASCE, Vol. 106, No. TEl, 1980, pp. 111-128.
3. C. L. Monismith, H. B. Seed, F. G. Mitry, and C. K. Chan. Prediction of Pavement Deflections from Laboratory Repeated Load Tests. Proc., Second International Conference on the Structural Design of Asphalt Pavements, 1968, pp. 109 410.
4. Shell Pavement Design Manual: Asphalt Pavements and Overlays
TRANSPORTATION RESEARCH RECORD 1278
for Road Traffic. Shell International Petroleum Company Limitt:t.l, Lum.Ion, England, 1978.
5. M. I. Darter and A. J. Devos. Structural Analysis of Asphaltic Cold Mixtures Used in Pavement Bases. Project IHR-505, Research Report 505-4. University of Illinois, Engineering Experiment Station, Aug. 1977.
6. Y. T. Chou, R. L. Hutchinson, and H. H. Ulery, Jr. A Design Method for Flexible Airfield Pavements. In Transportation Research Record 521, TRB, National Research Council, Washington, D.C., 1974.
7. M. W. Witczak. Design of Full Depth Asphalt Airfield Pavements. Proc., Third International Conference on the Structural Design of Asphalt Pavements, London, England, 1972, pp. 550-567.
8. J. Poulsen and R. N. Stubstad. Laboratory Testing of Intact Cohesive Subgrades: Results and Implications Relative lo Structural Pavement Design and Distress Models. Interim Report 76. National Danish Road Laboratory, November 1977.
9. W. A. Barker and W. N. Brabston . Development of a Structural Design Procedure for Flexible Airport Pavements. Technical Report S-75-17 Soils and Pavements Laboratory, U.S. Army Corps of Engineers Waterways Experiment Station, Vicksburg, Miss., Sept. 1975.
10. K. R. Peattie. A Fundamental Approach to the Design of Flexible Pavements. Proc., International Conference on the Structural Design of Asphalt Pavements, Ann Arbor, Mich., 1962, pp. 403-4 11.
11 . R. D. Barksdale. Repeated Load Testing Evaluation of Base Course Materials. GHD Research Project 7002, Final Report. FHWA, U.S. Department of Transportation, 1972.
12. R. M. Knutson, M. R. Thompson, T. Mullin, and S. D. Tayabji. Materials Evaluation Study. Report FRA-OR and D-77-02. Ballast and Foundation Research Program, Federal Railroad Administration, Washington, D.C., 1977.
13. C. L. Monismith, K. lnkabi, C. R. Freeme, and D. B. McLean. A Subsystem to Predict Rutting in Asphalt Concrete Pavement Structures. Proc. , Fourth International Conference on the Struc-111ral Design of Asphalt Pavement, Ann Arbor, Mich., 1977, pp. 529- 539.
14. L. Road , D. Weichert, and A. Haidar. Shakedown and Fatigue of Pavements with Granular Bases. In Tran ·pormtion Re.~eorch Record 1227, TRB, National Research Council , Washington, D.C., 1989.
15. Y. P. Vaid and R. G. Campanella. Time-Dependent Behavior of Undisturbed loy. Journal of the Geotechnical Engineering Division , A E, Vol. 123, 1977, pp. 693-709.
16. J. K. Mitchell. Fundamentals of Soil Behavior. John Wiley and Sons, Inc., New York, 1976.
17. A. Ansal and A. Erken. Undrained Behavior of Clay Under Cyclic Shear Stress. Journal of Geotechnical Engineering, ASCE, Vol. 115, No . 7, 1989, pp. 968-983.
18. B. A . Zcid . Load-Defor1111ltio11 Behavior of a Compacted Silty Clay Under D1ffere11t Forms of Loadi11g. M.E. thesis. American University of Beirut, Beirut, Lebanon, 1988.
19. J. G. Larew and G . A. Leonards. A Strength Criterion for Repeated Loads. In Highway Research Record 41, HRB, National Research Council, Washington, D.C., 1962, pp. 529-556.
20. S. F. Brown, A. F. K. Lashine, and A. F. L. Hyde. Repeated Load Triaxial Testing of Silty Clay. Geotechnique, Vol. 25, No. 1, 1975, pp. 95-114.
Publication of this paper sponsored by Committee un Sui/ urtd Rurk Properties.