REPOR T RESUMES ED 017 912 46 AL 001 113 SOME SIMPLE RULES FOR SELF-ADAPTIVE MECHANICAL RECOGNITION OF VOWELS. BY- HEMDAL, JOHN MICHIGAN UNIV., ANN ARBORICTR.FOR RES.LANO.AND BEN REPORT NUMBER BR- 6-1764 PUB DATE 67 CONTRACT OEC -3 -6- 0617$4 -0506 EDRS PRICE NF-$0.23 HC -$1.16 27P. DESCRIPTORS- *VOWELS, *LANGUAGE RESEARCH, *PERCEPTION TESTS, *ACOUSTICS, PHONETICS, RECOGNITION, *ANALYSIS OF VARIANCE, PHONETIC ANALYSIS, THE VALUE OF THE ACOUSTIC PARAMETERS OF A PHONETIC EVENT VARY FROM SPEAKER TO SPEAKER AND, TO SOME EXTENT, FROM DAY TO DAY. THE ABSENCE OF STABLE INVARIANTS IN SPEECH PRODUCTION IMPLIES THAT A COMPUTER MUST BE SELF-ADAPTIVE IN ORDER TO RECOGNIZE THE PHONETIC EVENTS OF DIFFERENT SPEECH PRODUCTIONS. SELF-ADAPTATION, HOWEVER, REQUIRES THAT PHONEME SEPARATION AND CLASSIFICATION BE ACCOMPLISHED BY THE USE OF SIMPLE BOUNDARIES AND SIMPLE CHANGES IN THESE BOUNDARIES, WHILE MAINTAINING THE REQUISITE ACCURACY. THIS EXPERIMENT PRESENTS DATA THAT INDICATE THAT VOWELS MAY BE CLASSIFIED BY USING SIMPLE BOUNDARIES IN THE F1-F2 PLANE IF SUFFICIENT CONTROL OVER THE SPEECH PRODUCTION HAS BEEN EXERCISED. FORMANT LOCATIONS OF 176 PRODUCTIONS OF EIGHT VOWELS FOR NINE SPEAKERS ARE PRESENTED IN WHICH IT IS SHOWN THAT SUITABLE ACCURACY OF CLASSIFICATION IS OBTAINED BY A BOUNDARY OF CONSTANT Fl AND A BOUNDARY OF CONSTANT F2. THE SUGGESTION IS MADE THAT THESE BOUNDARIES, WHILE BASED ON VOWEL PRODUCTION, MAY BE OF SIGNIFICANCE IN VOWEL PERCEPTION. THIS PAPER IS PUBLISHED IN "STUDIES IN LANGUAGE AND LANGUAGE BEHAVIOR, PROGRESS REPORT IV," BY THE CENTER FOR RESEARCH ON LANGUAGE AND LANGUAGE BEHAVIOR, UNIVERSITY OF MICHIGAN, 220 EAST HURON STREET, ANN ARBOR, MICHIGAN 46108. (AUTHOS/AMM)
Transcript
REPOR T RESUMESED 017 912 46 AL 001 113SOME SIMPLE RULES FOR SELF-ADAPTIVE MECHANICAL RECOGNITION OFVOWELS.
BY- HEMDAL, JOHNMICHIGAN UNIV., ANN ARBORICTR.FOR RES.LANO.AND BENREPORT NUMBER BR- 6-1764 PUB DATE 67
THE VALUE OF THE ACOUSTIC PARAMETERS OF A PHONETIC EVENTVARY FROM SPEAKER TO SPEAKER AND, TO SOME EXTENT, FROM DAY TODAY. THE ABSENCE OF STABLE INVARIANTS IN SPEECH PRODUCTIONIMPLIES THAT A COMPUTER MUST BE SELF-ADAPTIVE IN ORDER TORECOGNIZE THE PHONETIC EVENTS OF DIFFERENT SPEECHPRODUCTIONS. SELF-ADAPTATION, HOWEVER, REQUIRES THAT PHONEMESEPARATION AND CLASSIFICATION BE ACCOMPLISHED BY THE USE OFSIMPLE BOUNDARIES AND SIMPLE CHANGES IN THESE BOUNDARIES,WHILE MAINTAINING THE REQUISITE ACCURACY. THIS EXPERIMENTPRESENTS DATA THAT INDICATE THAT VOWELS MAY BE CLASSIFIED BYUSING SIMPLE BOUNDARIES IN THE F1-F2 PLANE IF SUFFICIENTCONTROL OVER THE SPEECH PRODUCTION HAS BEEN EXERCISED.FORMANT LOCATIONS OF 176 PRODUCTIONS OF EIGHT VOWELS FOR NINESPEAKERS ARE PRESENTED IN WHICH IT IS SHOWN THAT SUITABLEACCURACY OF CLASSIFICATION IS OBTAINED BY A BOUNDARY OFCONSTANT Fl AND A BOUNDARY OF CONSTANT F2. THE SUGGESTION ISMADE THAT THESE BOUNDARIES, WHILE BASED ON VOWEL PRODUCTION,MAY BE OF SIGNIFICANCE IN VOWEL PERCEPTION. THIS PAPER ISPUBLISHED IN "STUDIES IN LANGUAGE AND LANGUAGE BEHAVIOR,PROGRESS REPORT IV," BY THE CENTER FOR RESEARCH ON LANGUAGEAND LANGUAGE BEHAVIOR, UNIVERSITY OF MICHIGAN, 220 EAST HURONSTREET, ANN ARBOR, MICHIGAN 46108. (AUTHOS/AMM)
r-4
C7+
Irm.4 The value of the acoustic parameters of a phonetic event vary0 from speaker to speaker and, to some extent, from day to day. The
0 absence of stable invariants in speech production implies that a
LU computer must be self-adaptive intorder to recognize the phonetic
events of different speech productions. Self-adaptation, however,
requires that phoneme separation and classification be accomplished
by the use of simple boundaries and simple changes in these bound-
aries, while maintaining the requisite accuracy. This experiment
presents data that indicate that vowels may be classified by using
simple boundaries in the Fl-F2 plane if sufficient control over the
speech production has been exercised. Formant locations of 176 pro-ductions of eight vowels for nine speakers are presented in which it
is shown that suitable accuracy of classification is obtained by a
boundary of constant Fl and a boundary of constant F2. The sugges-
tion is made that these boundaries, while based on vowel production,
may be of significance in vowel perception.
THIS DOCUMENT HAS DEEM REPRODUCED EXACTLY AS RECEIVED FROM THE fis. DEPARTMENT OF HEALTH, EDUCATION & WELFARE
OFFICE OF EDUCATION
PERSON OR ORGAIDZATION ORMOND IT. POINTS OF VIEW OR OPINIONS
STATED 1OT NECESSARILY REPRESENT OFFICIAL OFFICE COI
Some Simple Rules for Self-Adaptive
Mechanical Recognition of Vowels.'
John Hemdal
Center for Research on Language and Language Behavior
Ag---.4e-eogy
The historical approach to the recognition of speech by computer has been
to determine and measure the invariant ptoperties of speech which reside in
the acoustical signal. Unfortunately, about the only invariability in speech
is its variability. The listener is apparently not disturbed by this variation,
but a digital computer must operate with discrete and precise information.
In order to determine this precise information it seems possible that an exam-
ination of the sources of parameter variability will reveal mechanical pro-
cedures for accounting for the variability, i.e., it should provide clues to
various normalization procedures. The object of a mechanical speech recog-
nizer is to present a written equivalent of a speech input. Furthermore, the
computer output is to approximate as closely as possible the transcribing
behavior of at least one listener. The recognizer should attain this close
approximation in the face of the same variability that confronts the listener.
A classic representation of the first and second formant variability for
the vowels of English is given by 76 speakers in the Peterson-Barney (1952)
study.
Insert Fig. 1 about here
180
Hemdal 2
Figure 1 presents formant frequency location as a function of vowel label
for ten vowels pronounces by 76 speakers in a /h - d/ environment. The first
observation to be made concerning these data is the considerable vowel overlap.
That is, there are vowels which have the same or nearly the same first and
second formants, but which have different labels. These vowels are recognized
by a listener as distinct (at least under certain conditions), which indicates
that the vowels are not completely characterised by absolute physical properties.
A second observation shows that, although the overlap would produce some
errors, a reasonable recognition accuracy can be attained by using complicated
boundaries, such as the oval contours shown in Fig. 1. This cannot be an
acceptable solution to the problem of mechanical recognition, however, since
each vowel was produced in the same consonantal environment. Any change in
this context tends to increase the variability and decrease the accuracy.
Even more important is the failure of this boundary set as a simulation of
human vowel perception. It is easy to see that the accuracy of recognition
based on boundaries such as these would vary greatly from speaker to speaker
to a degree not present among human listeners.
One of the first steps in an investigation, of mechanical recognition is
the determination of the sources of variability and their relative importrnce
in scattering the data. Two sources of parameter scatter have been mentioned,
inter-speaker differences and phonetic environment. The relative effect of
the sources of variability may be measured by the degree of parameter overlap,
i.e., the ratio of different phonetic items with similar physical properties
to the separable items.
In order t" illustrate how this ratio is used to compare inter-speaker
variability with contextual effects, we can examine the scatter of vowel data
of 76 speakers for the /h d/ context and compare it with the scatter of
data of one speaker in all possible CV and VC contexts.
Insert Fig. 2 about here
The contours enclosing vowel production areas of a single speaker are
generally smaller, and the formant overlap is less. This fact suggests that
differences between speakers are greater than differences in phonetic contexts.
181
Hemdal 3
Any extension of the speech data samples, say, to longer words or continuous
speech, would increase the variability, as is show: by Fig. 3, taken from a
study by Shearme and Holmes.
Insert Fig. 3 about here
The overlap portrayed here is extreme. Note particularly the vowels /i/
and /I/. A computer cannot separate these two vowels on the basis of Fl and F2
alone. This fact would be discouraging for a program iu mechanical recognition,
except that the cause of ta overlap and parameter shift is not shown. In
other words, the control expressed in this experiment was not sufficient to
determine the conditions of the vowel space. Not only is the direction and degree
of parameter shift important, but also the stability and reproducibility of the
shift and the factors responsible for the shift. This program in mechanical rec-
ognition is an attempt to design experiments in which only one possible cause
of variation at a time can operate. The source of variation then becomes the in-
dependent variable, and the distribution and shift of the vowel parameters are
the dependent variables. It is hoped that the resulting parameter shift from each
cause is a stable shift and that each source of variability is independent. Thus,
if a given consonantal environment tends to lower the second formant of speaker
A in a CVC .monosyllable, then the same environment should tend to lower F2 for
the continuous speech of speaker B. The feasibility and economy of a mechanical
speech recognizer depend on the consistency of this effect.
This program, then, is a series of experiments in speech production in
which only one source of parameter variation, the independent variable, is
allowed to change,if at all possible. Note that not all of the sources of produc-
tion variability are known. The factors that do contribute to a variation of
parameters that are known include: the speaker: the speaker's sex, physical
condition, age, articulatory configuration; the time of day; the instructions
given the speaker; the list of material (whether it is to be read, repeated
or memorized and so forth, or whether it is continuous speech or isolated,;words);
the acoustic conditions at recording; the equipment used; the method of measuring
acoustic parameters; and many others.
182
Hemdal 4
The first step is to see if these sources of variability can be held con-
stant. Every one of the above factors was held constant, except the: the
speaker attempted to duplicate his production on three different days.
The first two were a week apart, and the last, two days apart, Thus, the
same speaker on three different occasions was given the same instructions to
repeat the same CVC word list in the same room, on the same recorder, and so
on. The data were processed for all three readings at the same time and the
measurement of parameters was carried out by digital computation. This is
perhaps the maximum control that can be exercised on speech production short
of achieving reinforcement control, and it is not yet apparent that that much
control is desirable in a speech recognition program.
Insert Fig. 4 about here
Figure 4 shows the third trial of speaker DVY. Note the position of the
contour enclosing most of the vowel /U/. It is adjacent to and nestled between
/A/ and /a/.
Insert Fig. 5 about here
Figure 5 shows the same speaker's vowel production the following week.
/U/ and /0/ are more widely separated. In addition, the contour enclosing
the vowel /I/ is larger.
Insert Fig. 6 about here
Figure 6 shows the same speaker two days later. If Fig. 5 and Fig. 6
were superimposed, the differences would be much clearer. For the most part,
the vowel areas are the same. There are some problems, however. When both
sets of data are taken together, there is a large degree of variation and over-
lap between the vowels /A/ and /e/. These vowels did not overlap on individual
days. Optimal recognition of this speaker's vowels depends, then, upon shifting
the boundaries slightly from day to day. In addition, the day -to -day change in
the distribution of the production parameters may be greater for more complex
stimuli. So far, these data indicate that given a single set of conditions of
vowel production, including the requirement that the production of the speech
does not spread out over a long time, the overlap and variability are small
183
r""-.
H 1
5
enough that the computer optimally recognizes the vowels. Every separate pro-
duction of the vowels may, however, require a new set of decision boundaries.
In the recognition of continuous speech it may not be possible to find stable
boundaries, even in the same speech production.
Any change in the factors of speech (mentioned earlier), which in turn
i4plies a different production, requires a change in the decision boundaries.
The problem of mechanical speech recognition is to find a means of determining
proper boundaries automatically, that is, on the basis of the properties of
each separate speech production. Complex boundaries (complex in terms of the
physical variables) can be programmed into the computer, but the need to
shift the boundaries for each separate production almost demands that the de-
cision boundaries be very simple. Some perceptual studies also indicate that
very complex decisions by listeners are not made. The future possibilities of
mechanical recognition depend upon finding simple boundaries which can be eas-
ily shifted and yet which yield adequate results.
Speech communication takes place between at least two persons, implying
that perception, as well ms production, is important to the process. Thus,
recognition boundaries must be related to the perceptual referents of at
least one listener. This point is fully appreciated and no attempt is made to
slight its importance. However, to paraphrase Jakobson, a person speaks in
order to be heard, in order to be understood. Therefore, some initial decisions
can be formed on the basis of the distributions of the parameters of production.
Nevertheless, the only criterion of success of a mechanical recognizer is that
it approximates the recognition behavior of at least one listener, and any
mechanical scheme must be evaluated in these terms.
With this description of the problem we may now look at some more for-
mant positions of CVC monosyllables.
Insert Fig. 7 about here
Figure 7 is a plot of Fl and F2 for 84 words produced by speaker
JRP at one sitting. These 64 words are so generated that all possible CV and
VC combinations are present. The various ovals surrounding production values
of Fl and F2 are drawn to include nearly all voicings of the same vowel and yet
remain non-overlapping. These ovals are complex, but ideal or optimum as far as
accuracy is concerned. They provide for the lowest error-rate, but they are
184
Hemdal6
probably not realistically related to perception and they are not simple enough
to avoid very complicated programming changes when production conditions change.
Jakobson, Fant and Halle (1952), suggest what to look for when examining the
distribution of speech parameters. For example, in the discussion of the dis-
tinctive feature compact/diffuse, they say: "In the case of vowels this fea-
ture manifests itself primarily by the potation of the first formant: when
the latter is higher (i.e., closer to the third and higher formants), the
phoneme is more compact." Now, since this is a binary feature, the statement
seems to imply that, were Fl alone plotted, there would be a bimodal distrib-
ution in production and if Fl alone were varied, there should be a binary char-
acteristic in the perceptual behavior. In fact, many critics of the distinc-
tive feature theory insist that such a bimodal distribution is a necessity of
the theory. However, Jakobson and Halle go on to say: "The opposition compact
vs. diffuse in the vowel pattern is the sole feature capable of presenting a
middle term in addition to the two polar terms. On the perceptual level, exper-
iments that obtained such middle terms through the mixture of a compact with
the corresponding diffuse vowel seem to confirm the peculiar structure of this
vocalic feature . . . ."
In later discussions Halle prefers two binary decisions to a single ter-
tiary feature, and talks of vowels which are noncompact and nondiffuse. This
distinction between tertiary and binary is merely academic unless it makes a
testable difference at some level. Furthermore, Jakobson and Halle refer only
to the vowels in [bat], [bet], [bot], [but], [boot], and [bit], not including
the vowels [bought] and [beet]. Later, Halle (1957) and Jakobson and Halle
(1961) included the feature tense vs. lax and these two vowels.
At this point their system has eight vowels divided into four tense vowels:
four lax, four acute, four grave, four diffuse, and four compact.
In addition, Halle also considers the vowels /e/ and /0/, for which he
develops the distinction noncompact-nondiffuse, although upsetting the symmetry
and efficiency of the feature system just a bit.
185
Hemdal 7
Most of the data included in this study came from speakers with a midwest
dialect; it was noted from the data that the vowels /e/ and /o/ are physically
more like simple diphthongs. It is interesting to contemplate the effect of
describing these two sounds in the system as diphthongs characterized by a
transformation from a compact to a diffuse vowel. In anticipation of the value
of this viewpoint, the vowel Fl-F2 plane has been plotted without including /e/
or /o/. This change in concept eliminates the need for a noncompact-nondiffuse
distinction and reduces the number of features to three, the least number re-
quired for eight vowels.
It is not certain that the distribution of the production parameters in a
binary fashion is necessary for the validity of the feature theory. However,
it is a fact that the monosyllable data do suggest a two-valued distribution
alon7 the first formant. If it is possible to describe /e/ and /o/ by their
transition of the first formant, then we should achieve a bimodal distribution
along Fl for the remaining eight vowels.
Figure 7 shows that it is possible to perform a Halle-type bisection,
dividing the diffuse vowels from the compact vowels on the right according to
the value of the first formant. The vertical dotted line represents a line of
constant Fl. If this is chosen as a boundary for the, compact/diffuse decision,
there will occur three compact errors for an accuracy of about 96 percent. If we
move this boundary to the right 25 cps, we will have three diffuse errors and the
same accuracy. This boundary satisfies the requirements of simplicity and ease
of change by computer. It is also accurate enough for computer recognition, and
this accuracy may improve, pending the results of the listening tests.
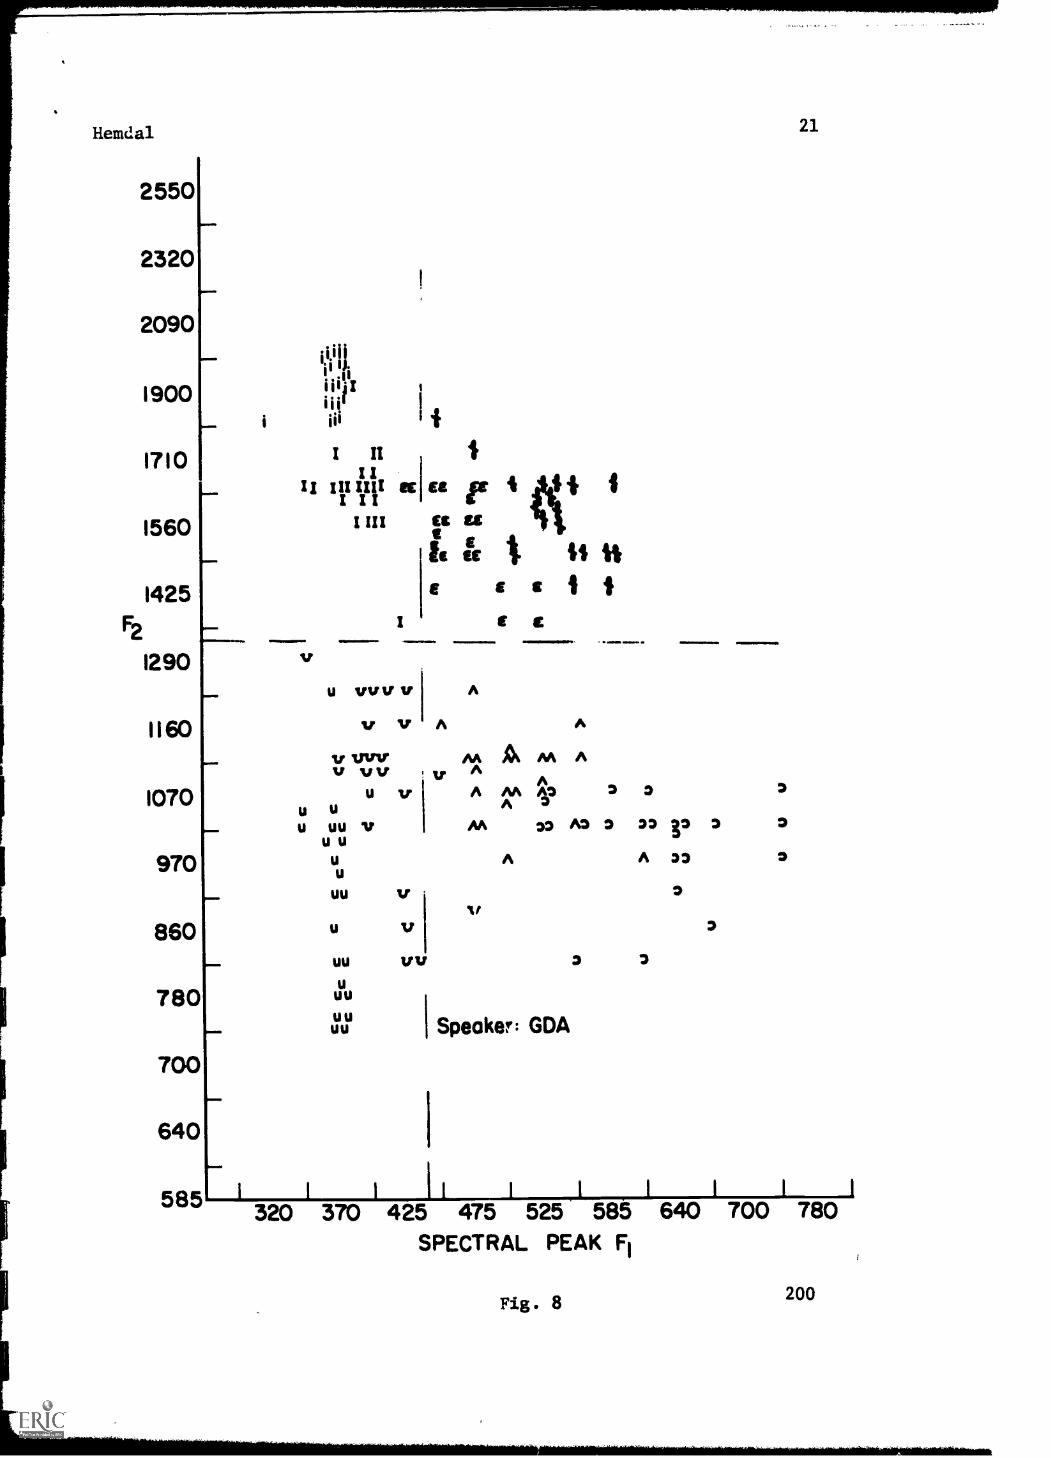
Insert Fig. 8 about here
Figure 8 shows the Fl-F2 vowel distribution for speaker GDA. Again a line
of constant Fl provides an accurate division of compact vs. diffuse vowels.
There are four errors, and the accuracy of the decision is greater than 95 per
cent. The frequency of the boundary is approximately 435 cps, down from the
value of 475 cps for speaker JRP in Fig. 9.
Insert Fig. 9 about here
Speaker GWH. One diffuse error at a boundary of 510 cps or one compact
error at a boundary of 540 cps are found.
186
8
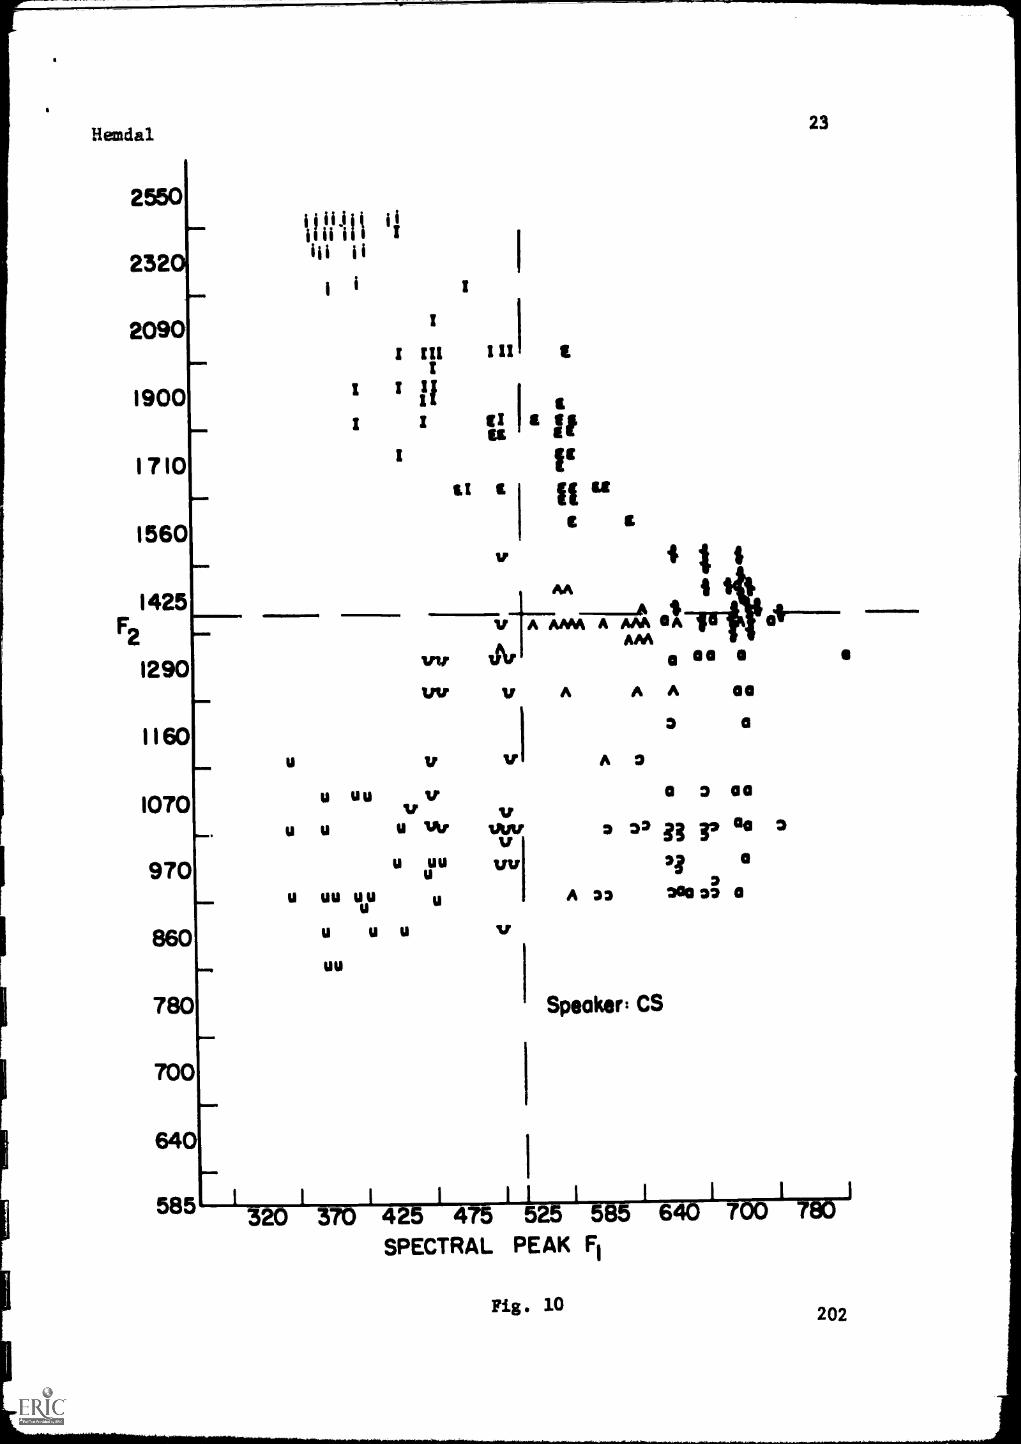
Insert Fig. 10 about here
Speaker CS. Two compact errors at a boundary of 510 cps are observed.
Insert Fig. 11 about here
Speaker JLK. Two compact and three diffuse errors at a boundary of 485
cps, for an accuracy of about 94 per cent, are obtained.
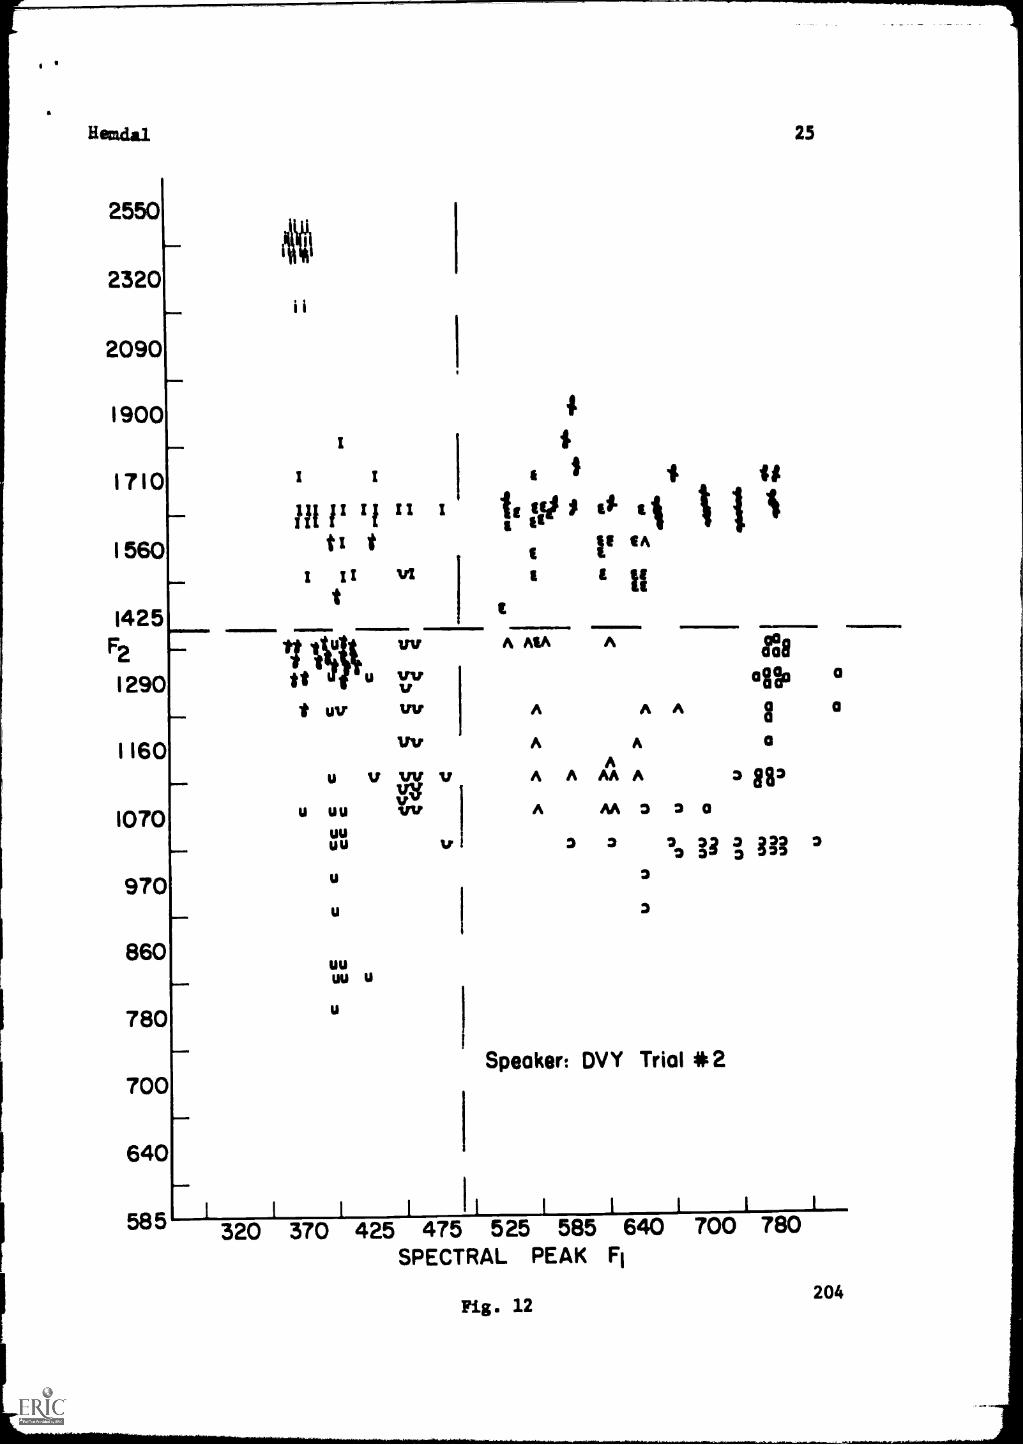
Insert Fig. 12 about here
Speaker DVY Trial No. 2. No errors for a boundary from 500 to 550 cps are
found.
The accuracies obtained by a decision boundary set at a conatant first for-
mant are excellent. An earlier study (Hughes & Hemdal, 1965) also has shown
that perhaps as many as 50 per cent of the computer errors were also production
erro,i. That is, listener tests indicated that nearly half of the vowels in
error were identified differently than the speaker intended. Of course, much
of the parameter measurement was performed automatically by a computer, and
this may be another source of error.
Fant (1960), in a study of the F-patterns of compound tube resonators and
horns, calculated the hypothetical formant frequencies of an open tube of
length 17.6 cm., approximately equal to the average length of the male vocal
tract. This tube, with an average speaker's cross-sectional area, produces
a first formant of 500 cps which Fant refers to as the neutral reference. It
may be interesting to speculate on a possible connection between this reference
and the clustering of the compact/diffuse boundary around 500 cps.
The only change in the conditions of production were the speaker and the
time of production. A good case is made for using a line of constant Fl for
the compact/diffuse boundary in a computer recognition program, at least for
monosyllables. But the frequency value of this line changes from speaker to
speaker. Is it constant for a given speaker, i.e., is this boundary one of
the invariants of speech production? To answer the question, an examination
was made of the productions of speaker JFH in 1964 and in 1966, and the pro-
duction of speaker DVY in 1966, a week apart and two days apart. In this latter
set of three repetitions, all possible control on the conditions of production
was maintained, except the separate occurrences.
187
Hewdal9
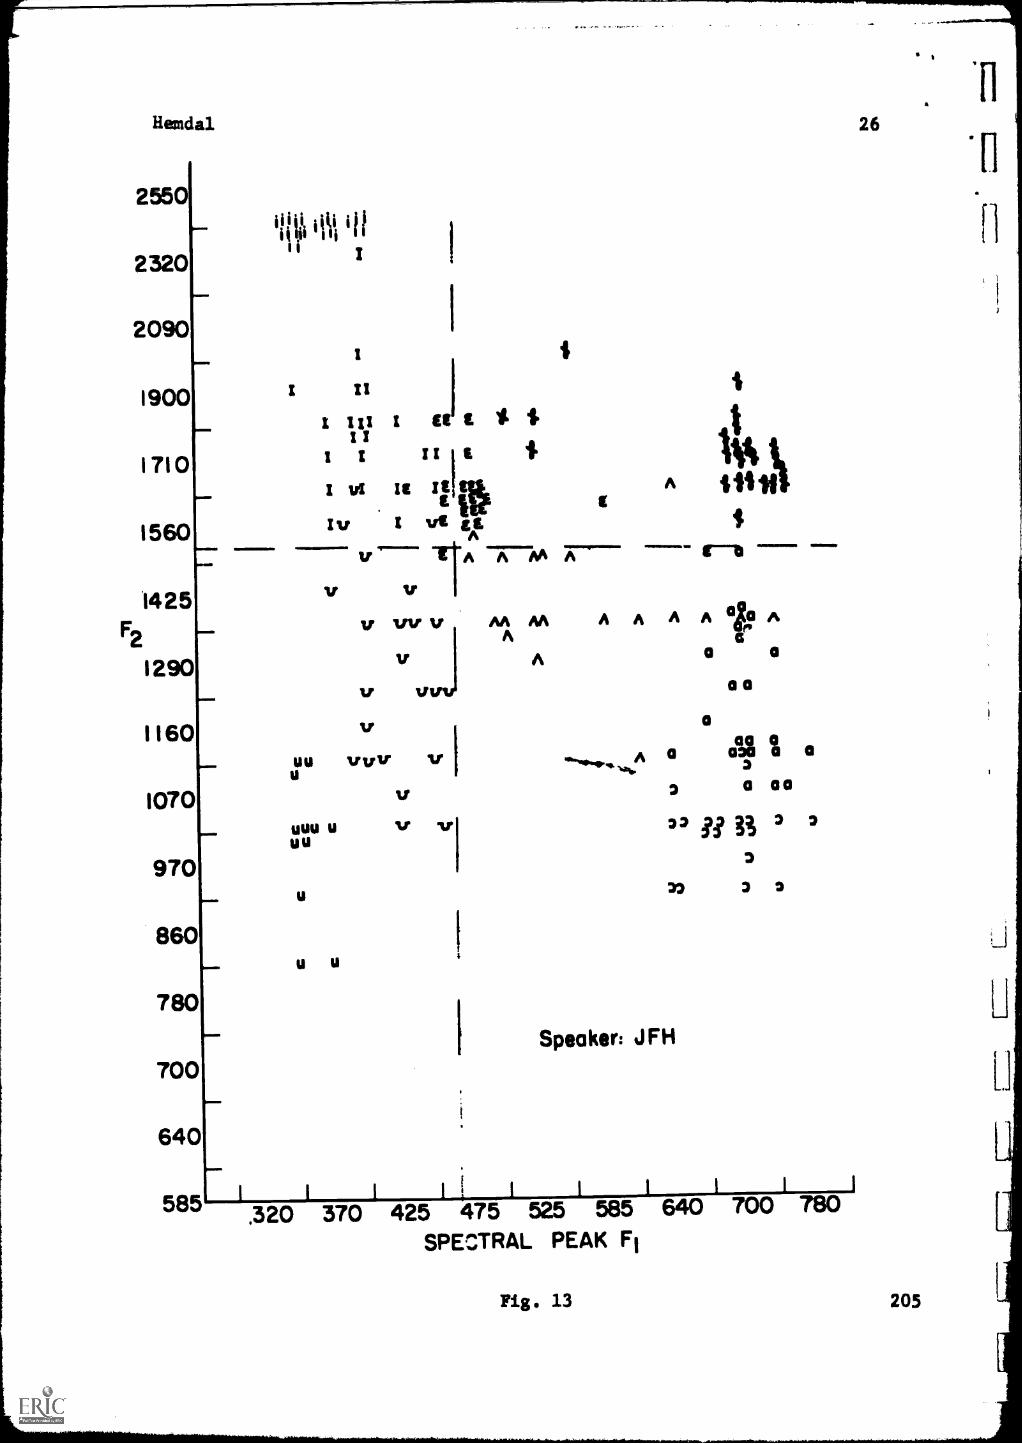
Insert Fig. 13 about here
Figure 13 presents the 1966 data of speaker JFH. There are six compact
errors resulting from a boundary placement at 465 cps, or eight diffuse errors
at 450 cps.
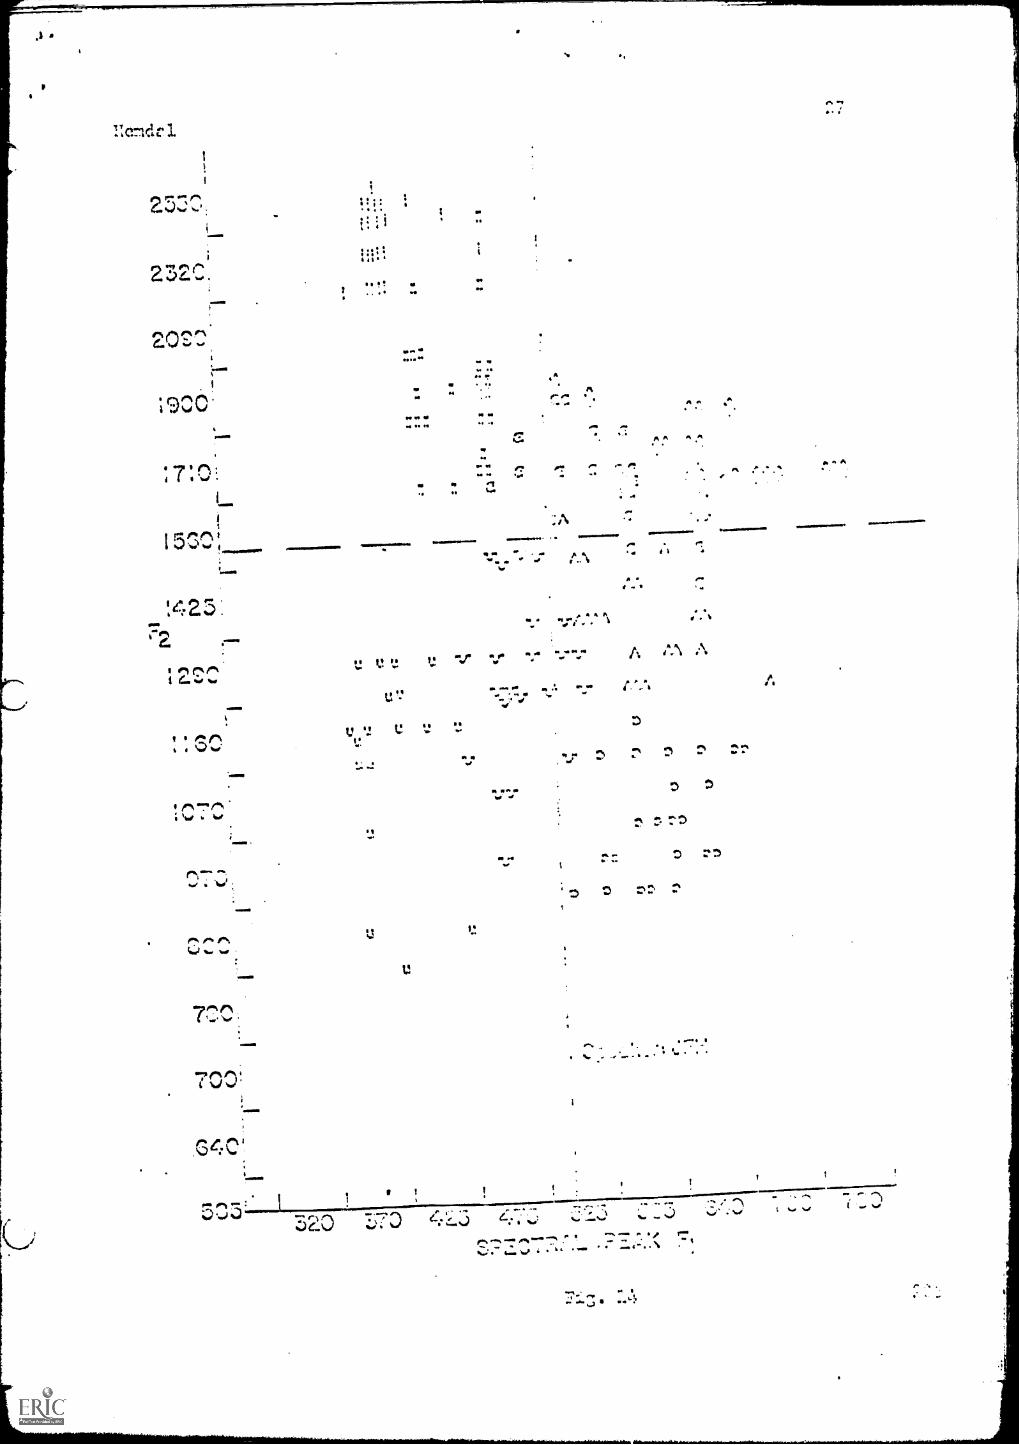
Insert Fig. 14 about here
Figure 14 presents the 1964 data of the same speaker. There are five
diffuse and three compact errors at a boundary of 510 cps, a difference of
around 5U cps in the distribution of the separation of vowels along Fl.
This is a significant change in the frequency of the boundary, since error
rates increase rapidly for small changes in this value. These data were taken
two year, apart, so it is necessary to determine if this is a long "...erm shift
in values and whether such changes occur on a day to day basis. For this
answer we go to the three repetitions of speaker DVY, Trials No. 3, No. 4, and
No. 5 in Figs. 4, 5, and 6.
Figure 4 shows tl-,e greatest error rate. The minimum error is about 15 per
cent, primarily because of proximity- of /U/ to /0/. The best boundary does
appear to be around 520 cps.
Figure 5 yields five errors at 540 cps for an accuracy of 94 per cent.
Figure 6 shows three errors when the boundary is set again at 520 cps.
Although the error rates vary considerably, the location of the compact/diffuse
boundary does not. If a frequency of 520 cps is chosen and all three trials
lumped, the overall accuracy is greater than 90 per cent.
For mechanical recognition the most useful boundaries between vowel groups
are those that are simply expressed in terms of the physical variable of measure-
ment primarily because,as mentioned earlier,these boundaries have to be shifted
automatically for each new speaker. Both the shift and the information about the
speaker which is needed for the shift should be easily obtainable. Thus, a com-
pact/diffuse boundary of a line of constant Fl is particularly attractive and the
accuracy is very good. This tempts one to speculate on the significance of the
bimodal cluster of data and to inquire into a possible relation to vowel percep-
tion. Future studies with synthetic vowels will be conducted in an effort to
determine if a relation exists between this production boundary and perceptual
boundaries.
188
Hemdal 10
This result also prompts one to ask whether there are other similar pro-
duction distributions that will allow simple boundaries for other features.
Consider the feature acute vs. grave. Jakobson and Halle consider F2
to be the primary determiner of acute vs. grave, and they suggest as a mea-
sure for this fraturo the rntto of the difference between Fl and F2 to the
difference of F2 and F3. The ratio corresponds to a boundary sloping up from
left to right.
A straight line of gentle slope in this region will divide the acute from
the grave vowels in Fig. 7 with an accuracy of 98 per cent. The left-most
vowel above this boundary is an /40 which is differentiated from all other
vowels in having a relatively low third formant. This vowel need not be in-
cluded in the grave/acute boundary discussion. Therefore, a boundary of a
line of constant F2 may be used as the grave/acute boundary with no increase
in error. Again it is necessary to see if the boundary is applicable across
a speaker population. Returning to previous figures, the following grave/
acute boundaries and accuracies are obtained:
In Fig. 8 (Speaker GDA) Constant F2=1325 cps, yields no errors.
In Fig. 9 (Speaker GWH) F2=1530 cps, three errors, 96 per cent accurate.
In Fig. 10 (Speaker CS) F2=1400 cps, ten errors, 88 per cent accurate.
In Fig. 11 (Speaker JLK) F2=1400 cps, one error, 99 per cent accurate.
In Fig. 12 (Speaker DVY No. 2) F2=1390 cps, three errors,96 per cent accurate.
In Fig. 13 (Speaker JFH 1966) F2=1525 cps, seven errors, 91 per cent accurate.
In Fig. 14 (Speaker JFH 1964) F2=1525, four errors, 95 per cent accurate.
The conclusion again may be stated that it is possible to satisfy the re-
quirements of simplicity and maintain sufficiently high accuracy. It is also
interesting to note that the grave/acute boundary is very close to 1500 cps,
the second formant calculated by Fant for the neutral reference vowel based on
average vocal tract dimensions. Perhaps the measurement of an individual's
neutral vowel is related to the location of this boundary junction.
In this study it has been shown that parameter variability in vowel pro-
duction can be controlled. It has also suggested several methods of describ-
ing the characteristics of production. We do not know yet whether these simple
boundaries have any relationship to vowel perception. Experiments conducted
189
Li
Hemdal
with synthetic vowels should give us this information. If we consider that the
first and second formants are perceptual continua, then the two simple boundaries
imply that the listener attends to these continua independently and need only
make a binary decision on them.
It should be emphasized that these boundaries constitute only a model of
recognition of vowels in carefully pronounced nonsense syllables. They are
parameters of production under these conditions and not of perception. In
addition, they may not be extendable to the production of actual words or con-
tinuous speech; however, it will be a part of our methodology to attempt to
relate each separate source of parameter variability to these simple boundaries.
Hemdal 12
References
Fant, Gunnar. Acoustic theory of speech production. The Hague: Mouton, 1960.
Pp. 72-73.
Halle, M. In defense of the number two. Studies presented to Joshua Whatough
on his sixtieth birthday. The Hague: Mouton, 1957. Pp. 65-72.
Hughes, G. W., & Hemdal, J. F. Speech analysis. Purdue Res. Found. Tech. Rep.
TR- EE65 -9, 1965.
Jakobson, R., Fent, G., & Halle, M. Preliminaries to speech analysis: The
distinctive features and their correlates. M.I.T. Acoustics Lab. Tech.
Rep., 1961, No. 13.
Jakobson, R., & Halle, M. Tenseness and laxness. In D. Abercrombie, D. E. Fry,
P. A. D. McCarthy, N. C. Scott, & J. L. M. Trim (Eds.) In honour of Daniel
Jones: Papers contributed on the occasion of his eightieth birthday.
Longman's Green & Co., 1962. Pp. 550-555.
Peterson, G. E., & Barney, H. L. Control methods used in a study of the vowels.
J. acoust. Soc. Amer., 1952, 84, 175-184.
Footnote
1This report was presented in another form as an address at the Conference
on Language and Language Behavior, CRLLB, University of Michigan, Ann Arbor,
October, 1966.
Hemda113
Figure Captions
Fig. 1. Distribution of vowel production values on Fl-F2 plane for 76
speakers (from Peterson & Barney study).
Fig. 2. Distribution of vowel production values on Fl-F2 plane for
speaker DVY, Trial No. 1.
Fig. 3. Distribution of vowel production values on Fl-F2 plane for
continuous speech of one speaker (from Shearme & Holmes study).
Fig. 4. Distribution of vowel values on Fl-F2 plane for speaker DVY,
Trial No. 3.
Fig. 5. Distribution of vowel production values on Fl-F2 plane for
speaker DVY, Trial No. 4.
Fig. 6. Distribution of vowel production values on Fl-F2 plane for
speaker DVY, Trial No. 5.
Fig. 7. Distribution of vowel production values on Fl-F2 plane for
speaker JRP.
Fig. 8. Distribution of vowel production values on Fl-F2 plane for
speaker GDA.
Fig. 9. Distribution of vowel production values on Fl-F2 plane for
speaker GWH.
Fig. 10. Distribution of vowel production values on Fl-F2 plane for
speaker CS.
Fig. 11. Distribution of vowel production values on Fl-F2 plane for
speaker JLK.
Fig. 12. Distribution of vowel production values on Fl-F2 plane for
speaker DVY, Trial No. 2.
Fig. 13. Distribution of vowel production values on Fl-F2 plane for
speaker JFH, 1966.
Fig. 14. Distribution of vowel production values on Fl-F2 plane for