56
ANNUAL REPORT 2016

ANNUALREPORT
2016

2
DEAR SHAREHOLDERS,
ANY Security Printing Company PLC has closed a fruitful and successful year. I hope that figures speak for themselves and demonstrate that efforts made last year were rational and useful. The Company pays out a decent dividend again and ANY’s share price changed to the pleasure of many of us last year. Those who bought shares when the Corporation entered the stock exchange have already had a full return on their investment through the dividends paid. The share price has doubled and therefore this share is one of the best performing securities in Budapest Stock Exchange.Consequently, the investors positively evaluated the performance in the past decade. The revenues and EBITDA have doubled and our export revenue is now about fourteen times higher than in 2005. Our personnel’s performance is praised by these results. Naturally, the Hungarian market is the most important for us, but we also want to be more considerably present in the international market. The export rate is 40% at present. Our objective is to ensure that half of our products will be supplied to our foreign clients in the coming years, with increasing sales revenues. In addition to Europe, Africa is the continent where ANY’s name has a good reputation in many countries, they trust in us and like our products.The competitive strategy, innovative approach of our colleagues and modern company culture can be a pledge of successes in the next decade. The history of the Printing Company began 165 years ago, the first stamps printed in Hungary were produced here and one of the most state-of-the-art electronic ID cards in the European Union was also born here last year. We summarized the story of a century and a half in a book that you can download from this page. Just click here.The annual report is always a snapshot. Based on the few lines above (or even more efficiently from the book), you may also perceive the progress all the way up to the end of 2016, and hopefully you will be pleased with it in 2017 as well.
28th April, 2017
Dr. Ákos ErdősChairman of the Board of Directors
CHAIRMAN’S
LETTER

ANY Security Printing Company Group consists of ten companies. There are 3 sites in Hungary, 2 in Romania and one each in Slovakia and Moldova. This group of companies is a security and business form producing company with one of the highest revenue. The Company’s shares have been listed on the Budapest Stock Exchange in the premium category since 2005. Its financial situation is characterised by stable and efficient operation. Its development is supported by its innovative products and its organic growth in the Central and Eastern European and African regions.ANY Security Printing Company’s strategy is focused on secure person and product identification and payment-related products. The Company’s activities are characterised by references such as the production of Hungarian electronic ID documents and the personalisation of biometric passports.
Strategic productsSECURITY FORMS
Our company personalises Hungarian biometric passports and numerous other documents. Its manufacturing technology makes it possible to produce several billion tax stamps and excise stamps and luncheon vouchers. Its Document Security Laboratory offers a number of custom-developed products from document printers and security inks to paper additives and special verification devices.
ID AND BANK CARDS
Our Company has experience in the production of more than 500 million cards for the Hungarian and international market including documents, bank and commercial cards. In addition to contact and contactless card documents – the new Hungarian eID card –, MasterCard and Visa chip cards, it offers a full range of card solutions with its self-developed loyalty system.
BUSINESS FORMS
Our Company produces pre-printed forms for business purposes, invoices, notification letters – from printing through personalisation and enveloping to mailing. Its production technology is characterised by special products such as gaming tickets, election forms and various documents of values – from meal vouchers to stamps.
5
200
5
200
6
200
7
200
8
200
9 2010
2011
2012
2013
2014
2015 20
16
HUFbillion
10 HUFbillion
15 HUFbillion
20
25 HUFbillion
HUFbillion
Total net sales
Export sales
LEADINGSECURITY PRINTING
COMPANYIN CENTRAL ANDEASTERN EUROPE

4
RECORDBREAKING EXPORTSALES, OUTSTANDING
P R O F I TIN 2016
Sales revenue of ANY Group amounted to HUF 24.9 billion in 2016 increased by 17%, HUF 3.5 billion, compared to previous year. Export sales revenue was HUF 9.2 billion with an increase of 11%, which is 37% export ratio compared to total ANY Group sales. Net profit was HUF 1,202 million, of which HUF 126 million originates from a one-off item in other income accounted for the purchase of ANY Ingatlanhasznosító Kft.
HUF
24.9BILLION
HUF
9.2BILLION
HUF
3.0BILLION
HUF
1.2BILLION
TOTAL NET SALES
EXPORT SALES
EBITDA
NET PROFIT
17%
11%
31%
29%
SECURITYPRODUCTS,SOLUTIONS
27%
CARD PRODUCTION,PERSONALISATION
24%
FORM PRODUCTION,PERSONALISATION,DATA PROCESSING
43%
TRADITIONALPRINTING
4%OTHERS
2%
SALES RATIO BY PRODUCT SEGMENTS

5
MANAGEMENT
Board of DirectorsDr. Ákos Erdős chairmanGábor Zsámboki vice-chairmanTamás Erdős
György Gyergyák Péter Kadocsa Erwin Fidelis Reisch
Supervisory BoardDr. Tamás Sárközy chairmanDr. Istvánné Gömöri vice-chairmanFerenc Berkesi
Dr. Imre Repa Dr. János Stumpf Dr. Erzsébet Novotny
ManagementGábor Zsámboki chief executive officerLászló Balla deputy chief executive officerFerenc Berkesi chief security officerTamás Karakó chief financial officerGábor Péter chief information officerDr. Lajos Székelyhídi chief research and development officerZoltán Tóth chief technical and production officerPatrícia Antal-Császár human resources directorAndrás Huszár logistics directorDr. Mihály Iszály director
Kristóf Kalauz plant director, Security Printing Product CentreRóbert Keczeli international tender directorAttila Kis-Fleischmann marketing directorEmil Knieszner information security directorBalázs Pfalzgráf controlling directorNikoletta Sajó export directorGergő Szántay development directorNorbert Szász director of IT development and operationsDr. Ádám Szobota administration and coordination director

6
SUMMARY
� Net sales of ANY PLC for 2016 amounted to HUF 24.9 billion which is higher by HUF 3.5 billion (17%) than in the previous year. Changes in case of strategic product segments were as follows: sales of security products, solutions exceeded to HUF 6.7 billion, which is by HUF 0.5 billion (9%) higher than the figure in the basis period; sales of card production, personalisation exceeded to HUF 5.9 billion, which shows an increase by HUF 1.8 billion (42%) compared to the similar period of the last year, whilst sales of segment of form production, personalisation, data processing were HUF 10.7 billion, which shows an increase of HUF 1.5 billion (16%) compared to year 2015. Ratio of strategic products segments in total net sales was 94% in the basis period.
� Export sales of the Company amounted to HUF 9.2 billion, showing a 11% growth until 31st December, 2016, which represents a 37% export sales ratio.
� Consolidated net income after interest income, taxation, non-controlling interest and negative goodwill accounted as a revenue is HUF 1,202 million, which shows an increase of HUF 270 million (29%) compared to the previous year’s same period.
� Negative goodwill was accounted for due to the purchase of ANY Ingatlanhasznosító Kft. quota therefore HUF 126 million one-off item is in the line of other revenues. The reason for one-off item is that the purchase price of the Company’s quota owning the real estates was lower than the market price of the related real estates at the date of property acquisition and therefore, one-off other revenue was accounted for in accordance with IFRS rules.
� Adjusted consolidated EBITDA is HUF 2,851 million, an increase of HUF 574 million (25%) compared to 2015 base period due to the sales increase in the strategic segments.
� Adjusted consolidated operating income is HUF 1,843 million, which is HUF 477 million (35%) higher than the profit for the base period.
� After the elimination of the one-off item mentioned above, consolidated net profit is HUF 1,076 million, which means an increase by HUF 144 million (15%) compared to 2015.

7
MAIN FINANCIAL
DATA AND INDICATORS(IFRS CONSOLIDATED)
Sales of product groupsThe breakdown of net sales by category is presented in the table below:
Sales categoriesFY 2015
in HUF millions (A)
FY 2016 in HUF millions
(B)
Change in HUF millions
(B–A)
Change %
(B/A–1)
Security products and solutions 6,139 6,680 541 8.81%
Card production and personalization 4,186 5,937 1,751 41.83%
Form production and personalization, data processing 9,205 10,715 1,510 16.40%
Traditional printing products 1,106 1,143 37 3.35%
Other 730 436 (294) –40.27%
Total net sales 21,366 24,911 3,545 16.59%
ANY PLC had consolidated net sales of HUF 24,911 million in 2016, which is HUF 3,545 million (17%) higher than the sales for the base period.
Name FY 2015, in HUF millions
FY 2016, in HUF millions
Financial situation
Non-current assets 4,182 7,620
Total assets 11,421 15,374
Shareholder’s equity 6,892 7,374
Main categories of results
Net sales 21,366 24,911
EBITDA 2,277 2,977
Profit after tax 1,266 1,585
Main indicators
Return on sales (ROS) % 4.4% 4.8%
Return on equity (ROE) % 13.5% 16.3%
Earning per share (EPS) HUF 65 84

8
Sales of security products and solutions came to HUF 6,680 million in 2016 which means an increase of HUF 541 million (9%) compared to the base period due to the higher sales of document security products.
The Company’s revenues from card production and personalisation totalled HUF 5,937 million in the period of reference, a HUF 1,751 million (42%) increase compared to year 2015. The growth of the segment was caused mainly by the higher volume of card document production and personalisation.
The Company’s revenues from form production, personalisation and data processing came to HUF 10,715 million in 2016, a HUF 1,510 million (16%) higher than the sales for the base period. The change is due to the sales revenue of the referendum and the growing sales export of form production and personalisation and the expansion of connected logistic services.
Sales of traditional printing products amounted to HUF 1,143 million in the period of reference, which means a HUF 37 million (3%) increase compared to the previous year’s similar period.
Other sales totalled HUF 436 million in 2016, which is a decrease of HUF 294 million (40%). This segment mainly comprises revenues from the sale of commercial materials and goods.
Export sales by categories:
Sales categoriesFY 2015
in HUF millions (A)
FY 2016 in HUF millions
(B)
Change in HUF millions
(B–A)
Change %
(B/A–1)
Security products and solutions 598 471 (127) –21.24%
Card production and personalization 296 318 22 7.43%
Form production and personalization, data processing 7,074 8,101 1,027 14.52%
Traditional printing products 5 10 5 100.00%
Other 375 328 (47) –12.53%
Total export sales 8,348 9,228 880 10.54%
Export % 39.07% 37.04%
Export sales amounted to HUF 9,228 million at the end of 2016, which is a 11% increase compared to a year earlier, representing a 37% export sales ratio.
There was a significant growth (15%) in the field of form production, personalisation and connected logistic services, at the end of the period was HUF 8,101 million, increased by HUF 1,027 million.

9
Financial analysisThe table below presents the calculation of operating income according to the so-called “total cost accounting” method:
Description2015 Q1–Q4
in HUF millions(A)
2016 Q1–Q4in HUF millions
(B)
2016 Q1–Q4in HUF millions,
adjusted * (C)
Changein HUF millions
(C–A)
Change%
(C/A–1)
Net sales 21,366 24,911 24,911 3,545 16.59%
Capitalized value of assets produced
286 258 258 (28) –9.79%
Material expenses 14,345 16,145 16,145 1,800 12.55%
Personnel expenses 4,770 5,601 5,601 831 17.42%
Depreciation 911 1,008 1,008 97 10.65%
Other expenses 260 446 572 312 120.00%
Operating income 1,366 1,969 1,843 477 34.92%
Net profit 932 1,202 1,076 144 15.45%
EBITDA 2,277 2,977 2,851 574 25.21%
EBITDA margin (%) 10.66% 11.95% 11.44%
* Due to the acquisition of ANY Ingatlanhasznosító Kft., negative goodwill accounted as other revenue in accordance with IFRS.
10
PROFITABILITY OF ANY GROUP IN THE YEARS 2015 AND 2016
0.5 HUFbillion
1 HUFbillion
1.5 HUFbillion
2 HUFbillion
2.5 HUFbillion
3 HUFbillion
3.5 HUFbillion
5
0 0
HUFbillion
10 HUFbillion
15 HUFbillion
20 HUFbillion
25 HUFbillion
30 HUFbillion
EBITDA (in HUF thousands)
Pro�t after tax (in HUF thousands)
Net sales (in HUF thousands)
2,276,694
1,266,496
21,366,017
2,977,055
1,585,089
24,911,120
2015
2016
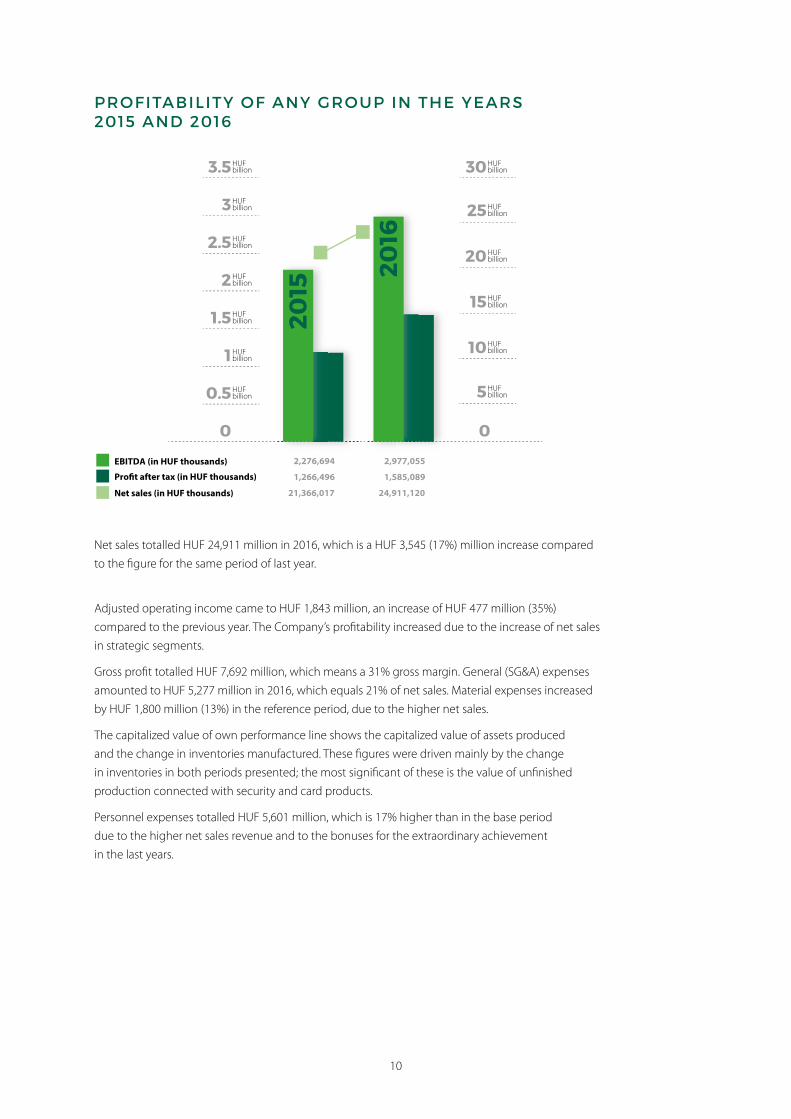
Net sales totalled HUF 24,911 million in 2016, which is a HUF 3,545 (17%) million increase compared to the figure for the same period of last year.
Adjusted operating income came to HUF 1,843 million, an increase of HUF 477 million (35%) compared to the previous year. The Company’s profitability increased due to the increase of net sales in strategic segments.
Gross profit totalled HUF 7,692 million, which means a 31% gross margin. General (SG&A) expenses amounted to HUF 5,277 million in 2016, which equals 21% of net sales. Material expenses increased by HUF 1,800 million (13%) in the reference period, due to the higher net sales.
The capitalized value of own performance line shows the capitalized value of assets produced and the change in inventories manufactured. These figures were driven mainly by the change in inventories in both periods presented; the most significant of these is the value of unfinished production connected with security and card products.
Personnel expenses totalled HUF 5,601 million, which is 17% higher than in the base period due to the higher net sales revenue and to the bonuses for the extraordinary achievement in the last years.

11
Adjusted EBITDA amounted to HUF 2,851 million due to the change in operating income and depreciation, which represents an increase of HUF 574 million (25%). Therefore, the EBITDA margin amounts to 11.4%.
Net interest income amounted to –103 million HUF in 2016, which contains interests paid for the long term loan connected to real-estates purchase, for the short term loan connected to working capital and for the leases connected to capital expenditures.
Net income – after financial operations, taxation and minority interest – came to HUF 1,076 million in 2016, an increase of 15% compared to the similar period of the previous year.
FINANCIAL SITUATION OF ANY GROUP IN THE YEARS 2015 AND 2016
Non-current assets (in HUF thousands)
Total assets (in HUF thousands)
Equity (in HUF thousands)
2015
2016
2 HUFbillion
4 HUFbillion
6 HUFbillion
8 HUFbillion
10 HUFbillion
12 HUFbillion
14 HUFbillion
16 HUFbillion
18 HUFbillion
0
4,181,809
11,420,772
6,892,074
7,619,795
15,373,582
7,374,445
The Company had total assets of HUF 15,374 million on 31st December, 2016, which increased significantly by HUF 3,953 million compared to the previous year-end.
Receivables amounted to HUF 3,445 million which represents a HUF 453 million (15%) increase compared to the 2015 year-end figure due to sales increased.
Cash and bank totalled HUF 865 million which represents a HUF 51 million increase compared to the 2015 year-end figure.
Inventories totalled HUF 2,144 million, which is a HUF 115 million (6%) increase compared to the 31st December, 2015 figure.
12
Other current assets and prepayments amounted to HUF 1,299 million, which is a HUF 104 million decrease, compared to the prior year-end figure.
The balance of property, plant and equipment at the end of December, 2016 was HUF 7,230 million, an increase of 92% compared to the end of 2015, due to acquisition of the real estate company ANY Ingatlanhasznosító Kft. quota and purchase of production machineries.
Goodwill amounted to HUF 335 million that is the same amount as at the end of previous year.
Accounts payable totalled HUF 2,467 million, HUF 411 million (14%) lower compared to the end of December, 2015. The reasons of the change were the decreasing supplier balance and creditor invoices arriving after the balance sheet preparation date which were posted as other liabilities.
Other payables and accruals amounted to HUF 1,659 million, which is an increase by HUF 609 million, due to mainly late creditor invoices mentioned previously.
Lease liability relating to the purchase of fixed assets HUF 779 million, from which HUF 515 million long-term part, HUF 264 million short-term liability. Due to the technological improvements lease liability increased by HUF 466 million.
Long-term loan amount HUF 1,827 million, from which HUF 1,630 million long-term part, HUF 197 million short-term liability relating to the purchase of the Company’s quota owning the real estates.
The Company’s operation was financed by short term loans which reached HUF 1,036 million on 31st December, 2016.
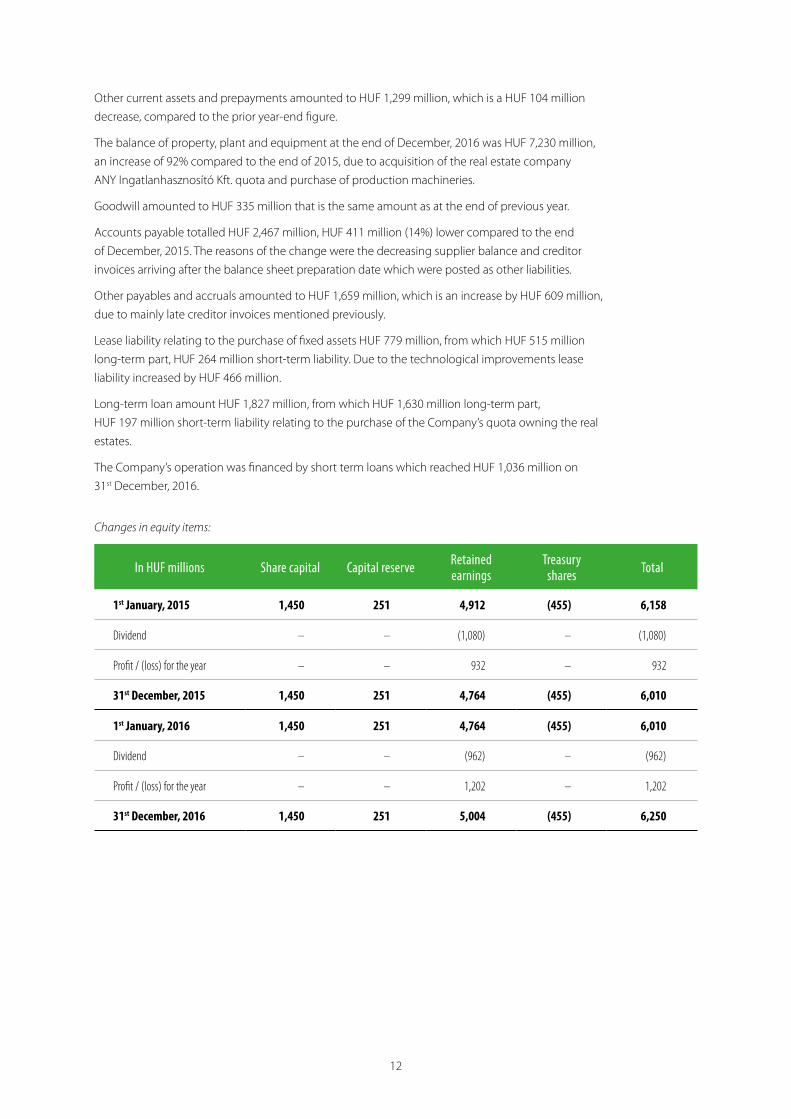
Changes in equity items:
In HUF millions Share capital Capital reserve Retained earnings
Treasury shares Total
1st January, 2015 1,450 251 4,912 (455) 6,158
Dividend – – (1,080) – (1,080)
Profit / (loss) for the year – – 932 – 932
31st December, 2015 1,450 251 4,764 (455) 6,010
1st January, 2016 1,450 251 4,764 (455) 6,010
Dividend – – (962) – (962)
Profit / (loss) for the year – – 1,202 – 1,202
31st December, 2016 1,450 251 5,004 (455) 6,250

13
MAIN INDICATORS OF ANY GROUP IN THE YEARS 2015 AND 2016
2015 20
162.0%
4.0%
6.0%
8.0%
10.0%
12.0%
14.0%
0.0%
55
60
65
70
75
80
85
50
45
40
Return on sales (ROS)
EBITDA margin
Earning per share (EPS)
4.4%
10.7%
65
4.8%
12.0%
84
Higher profitability of ANY Security Printing Company Group in 2016 is mainly the result of the strategic product segments. EBITDA margin amounted to 12% while return on sales was 4.8%. Earnings per share are HUF 84.
The Board of Directors has examined the operation of the Company’s internal controls and concluded that it was effective. It has not found any event when there was a deviation from internal controls.

14

15

16

17
• Obtain an understanding of intemal control relevant to the audit in order to design auditprocedures that are appropriate in the circumstances, but not for the purpose of expressing anopinion on the effectiveness of the Company's intemal control.
• Evaluate the appropriateness of accounting policies used and the reasonableness of accountingestimates and related disclosures made by management.
• Conclude on the appropriateness of management's use of the going concem hasis of accountingand, based on the audit evidence obtained, whether a material uncertainty. exists related to eventsor conditions that may cast significant doubt on the Company's ability to continue as a goingconcem. If we conclude that a material uncertainty exists, we are required to draw attention in theauditor's report to the related disclosures in the financial statements or, if such disclosures areinadequate, to modify the opinion. Our conclusions are based on the audit evidence obtained upto the date of our auditor's report. However, future events or conditions may cause the Companyto cease to continue as a going concem.
• Evaluate the overall presentation, structure and content of the financial statements, including thedisclosures, and whether the financial statements represent the underlying transactions and eventsin a manner that achieves fair presentation.
We communicate with those charged with govemance regarding, among other matters, the planned scope and timing of the audit and significant audit findings, including any significant deficiencies in the Company's intemal control that we identify during the audit.
We also provide those charged with govemance with a statement that we have complied with relevant ethical requirements regarding independence, and to communicate with them all relationships and other matters that may reasonably be thought to bear on our independence, and where applicable, related safeguards.
From the matters communicated with those charged with govemance, we determine those matters that were of most significance in the audit of the financial statements of the current period and are therefore the key audit matters. We describe these matters in our auditor's report unless law or regulation precludes public disclosure about the matter or when, in extremely rare circumstances, we determine that a matter should not be communicated in our report because the adverse consequences of doing so would reasonably be expected to outweigh the public interest benefits of such communication.
The engagement partners on the audit resulting in this independent auditor' s report are the signatories of the report.
Budapest, March 6, 2017
The original Hungarian version has been signed.
Tamás Horváth on behalf of Deloitte Auditing and Consulting Ltd. and as a statutory registered auditor
Deloitte Auditing and Consulting Ltd. 1068 Budapest, Dózsa György út 84/C. Registration number: 000083
Registration number of statutory registered auditor: 003449
4

18
Consolidated Statement of Financial PositionAS AT 31 ST DECEMBER, 2016 AND 31 ST DECEMBER, 2015
In HUF thousands Notes 31st December, 2016 31st December, 2015
Current assets:
Cash and bank 3 865,496 814,876
Accounts receivables 4 3,445,270 2,992,385
Inventories 5 2,143,714 2,028,222Other current assets and prepayments (without current tax receivable)
6 1,121,160 1,168,025
Current tax receivables 6 178,147 235,455
Total current assets 7,753,787 7,238,963
Non-current assets:
Property, plant and equipment 7 7,229,706 3,757,640
Goodwill 8 335,009 335,009
Intangibles 9 50,066 80,434
Other assets 5,014 8,726
Total non-current assets 7,619,795 4,181,809
Total assets 15,373,582 11,420,772
Current liabilities:
Trade accounts payables 2,467,331 2,878,441
Short term part of lease liabilities 22 264,267 105,631
Other payables and accruals (without current tax liabilities) 10 965,991 709,122
Current tax liabilities 10 692,962 340,519
Short term loans 11 1,035,947 83
Total current liabilities 5,426,498 4,033,796
Long term liabilities:
Deferred tax liability 18 302,121 243,289
Long term part of lease liabilities 22 515,231 207,850
Long term loans 11 1,632,839 –
Other long term liabilities 122,448 43,763
Total long term liabilities 2,572,639 494,902
Shareholders’ equity:
Share capital 12 1,449,876 1,449,876
Capital reserve 14 250,686 250,686
Retained earnings 14 5,004,574 4,763,751
Treasury shares 13 (455,048) (455,048)
Total owners’ equity 6,250,088 6,009,265
Non controlling interest 14 1,124,357 882,809
Total shareholders’ equity 7,374,445 6,892,074
Total liabilities and shareholders’ equity 15,373,582 11,420,772

19
Consolidated Statement of Comprehensive IncomeAS AT 31 ST DECEMBER, 2016 AND 31 ST DECEMBER, 2015
In HUF thousands Notes FY 2016 FY 2015
Net sales 15 24,911,120 21,366,017
Cost of sales 17 (17,219,214) (15,135,453)
Gross profit 7,691,906 6,230,564
Selling general and administration 17 (5,276,526) (4,604,737)
Gain on sale of fixed assets 8,087 18,829
Foreign currency (loss) / gain 10,700 (10,508)
Other expense, net 16 (464,805) (268,576)
Operating income 1,969,362 1,365,572
Interest income 15,862 12,232
Interest expense (118,862) (23,075)
Profit before tax and non-controlling interest 1,866,362 1,354,729
Deferred tax income / (expense) 18 (58,058) 4,846
Income tax expense 18 (212,832) (141,174)
Profit after tax 1,595,472 1,218,401
Other comprehensive income for the year 19 (10,383) 48,095
Total comprehensive income for the year 1,585,089 1,266,496
Profit attributable to :
Shareholders of the Company 1,202,475 931,702
Non-controlling interests 382,614 334,794
Earnings per share (EPS):
Basic (HUF per share) 20 84 65
Fully diluted (HUF per share) 20 84 65
Dividend per share paid (DPS) 67 75

20
Consolidated Statement of Changes in Shareholders’ EquityAS AT 31 ST DECEMBER, 2016 AND 31 ST DECEMBER, 2015
In HUF thousands Issued Capital
Capital Reserve
Retained Earnings
Treasury Shares
Non-controlling Interest Total
1st January, 2015 1,449,876 250,686 4,912,058 (455,048) 680,527 6,838,099
Dividend paid (after FY 2014) – – (1,080,009) – – (1,080,009)
Dividend paid to minority shareholders (after FY 2014 income)
– – – – (128,087) (128,087)
FX difference to dividend paid to minority shareholders
– – – – 791 791
FX difference to equity to non-controlling interests
– – – – (5,216) (5,216)
Total comprehensive income attributable to non-controlling interests
– – – – 334,794 334,794
Total comprehensive income attributable to owners of the Company
– – 931,702 – – 931,702
31st December, 2015 1,449,876 250,686 4,763,751 (455,048) 882,809 6,892,074
Dividend paid (after FY 2015) – – (961,652) – – (961,652)
Dividend paid to minority shareholders (after FY 2015 income)
– – – – (127,374) (127,374)
FX difference to dividend paid to minority shareholders
– – – – (546) (546)
FX difference to equity to non-controlling interests
– – – – (13,146) (13,146)
Total comprehensive income attributable to non-controlling interests
– – – – 382,614 382,614
Total comprehensive income attributable to owners of the Company
– – 1,202,475 – – 1,202,475
31st December, 2016 1,449,876 250,686 5,004,574 (455,048) 1,124,357 7,374,445

21
Consolidated Statement of Cash flowAS AT 31 ST DECEMBER, 2016 AND 31 ST DECEMBER, 2015
In HUF thousands Notes FY 2016 FY 2015
Cash flows from operating activities:Profit before tax and non-controlling interest 1,866,362 1,354,729
of which foreign currency (loss) / gain 10,700 (10,508)
IFRS effect of negatives goodwill (126,104) –
Depreciation cost of fixed assets 7 977,325 891,629
Amortization cost of intangibles 9 30,368 19,493
Foreign exchange differences on the line of the other comprehensive income (9,609) 1,192
Changes in provisions 75,539 (2,838)
Gain on sale of property, plant and equipment (8,087) (18,829)
Interest expense 118,862 23,075
Interest income (15,862) (12,232)
Operating cash flow before working capital changes 2,908,794 2,256,219Changes in accounts receivable and other current assets 4, 6 (239,764) (700,995)
Changes in inventories 5 (219,747) (462,397)
Changes in accounts payables and accruals 10 198,955 496,091
Cash provided by operations 2,648,238 1,588,918Interest income (119,617) (22,320)
Interest expense 14,792 3,795
Taxes paid, net 18 (267,038) (119,785)Net cash provided by operating activities 2,276,375 1,450,608Cash flows from investing activities:
Purchase of property, plant and equipment (4,429,207) (1,319,673)
Proceeds on sale of property, plant and equipment 89,053 32,990
Development costs 9 – (59,317)Net cash flow used in investing activities (4,340,154) (1,346,000)Cash flows from financing activities:
Non-controlling interest changes (141,066) (132,512)
of which dividend paid to minority shareholders (127,374) (128,087)
of which FX diff. to dividend of minority shareholders (546) 791
of which FX diff. to equity of non-controlling interests (13,146) (5,216)
Changes in short term loans 11 1,035,864 (45,370)
Purchase of treasury shares 13 – –
Changes in loans to employees 3,712 4,960
Changes in long term debt 11 1,711,524 –
Changes of capital lease obligations 22 466,017 311,464
Dividend paid (961,652) (1,080,009)Net cash flow used in financing activities 2,114,399 (941,467)Changes in cash and cash equivalents 50,620 (836,859)Cash and cash equivalents at beginning of period 814,876 1,651,735Cash and cash equivalents at end of the period 3 865,496 814,876

22
SUPPLEMENTARY
NOTES TO THE CONSOLIDATED
FINANCIALSTATEMENTS31ST DECEMBER, 2016
1. General
ANY Security Printing Company Public Limited Company by Shares (ANY PLC or the Company) is a limited liability company incorporated under the laws of the Republic of Hungary. The Company operated as a State enterprise until 1992 when it was transformed into a limited liability company (Rt.). The Company’s registered office is located at Halom u. 5, Budapest, District 10.
As of 31st December, 2016 – based on the Company’s share book – the following owners have more than 5% voting right or the following groups of investors own the Company:
Investor Voting right (%) Ownership (%)
Owners above 5% share:
EG CAPITAL LLC (*) 11.98% 11.62%
DIGITAL FOREST LLC (**) 6.97% 6.76%
AEGON ALFA SZÁRMAZTATOTT ALAP 7.43% 7.20%
Owners below 5% share:
Domestic Institutional Investors 26.92% 26.11%
Foreign Institutional Investors 20.42% 19.79%
Foreign Individual Investors 0.32% 0.32%
Domestic Individual Investors 22.37% 21.69%
Management, employees 3.17% 3.07%
Treasury shares 0.00% 3.03%
Other 0.42% 0.41%
(*) The Chairman of the Board of Directors of ANY Security Printing Company PLC as owner of EG Capital LLC has a further indirect ownership through Fortunarum Kft.(**) Based on the AGM of 31st March, 2014 the Tamás Erdős has been elected as a member of the Board of Directors of ANY Security Printing Company PLC has indirect ownership.

23
ANY PLC produces security products and solutions (tax stamps. stickers with security elements), plastic and paper cards (document cards, bank and telephone cards, as well as commercial cards), personalized business and administration forms, as well as conventional printing products.
The consolidated subsidiaries of the Company at 31st December, 2016 are as follows:
Name of the Company Location of registry and operations Equity Share of
ownership Voting right 1 Classification 2
Gyomai Kner Nyomda Zrt. Hungary HUF 200,000,000 98.98% 98.98% L
Specimen Zrt. (****) Hungary HUF 100,000,000 100.00% 100.00% L
ANYpay Fizetési Megoldások Zrt. (*****) Hungary HUF 50,000,000 100.00% 100.00% L
Techno-Progress Kft. Hungary HUF 5,000,000 100.00% 100.00% L
ANY Ingatlanhasznosító Kft. (*******) Hungary HUF 3,000,000 100.00% 100.00% L
Zipper Services S.R.L. (******) Romania RON 476,200 50.00% 50.00% L (*)
Tipo Direct Serv S.R.L. (***)Moldavian Democratic
Republic30,308 MDL 50.00% 50.00% L
Zipper Data S.R.L. (**) Romania 1,584,110 RON 50.00% 50.00% L (*)
Direct Services O.O.D. Bulgaria BGN 570,000 50.00% 50.00% L (*)
Slovak Direct S.R.O. Slovakia SKK 1,927,000 100.00% 100.00% L
1 Voting rights that entitle the holder to participate in decision making at the general meeting of the company included in consolidation.2 Fully controlled subsidiaries (L); Joint ventures (K); Associated undertakings (T).(*) Classification as subsidiary is the result of the co-operational agreement signed by the co-owner of the Company.(**) Zipper Data SRL is the member of consolidation circle since 1st February, 2011. The name of the company changed from GPV Mail Services SRL to Zipper Data SRL in October, 2011.(***) 100 per cent subsidiary of Zipper Services SRL, it has been consolidated since 1st January, 2011.(****) Specimen Zrt. has been 100% owned subsidiary of ANY Security Printing Company PLC since 1st June, 2013.(*****) 100 per cent subsidiary of Specimen Zrt., it has been consolidated since 21st November, 2013.(******) The name of the company changed from Tipo Direct SRL to Zipper Services SRL in 17th June, 2014.(*******) ANY Ingatlanhasznosító Kft. has been 100% owned subsidiary of ANY Security Printing Company PLC since 3rd March, 2016.
Romanian Zipper Data S.R.L. was merged into also Romanian Zipper Services S.R.L. on 31st December, 2016.

24
2. Significant accounting policies
BASIS OF PREPARATION
The accounting records of ANY Security Printing PLC and the Hungarian subsidiaries are compiled according to accounting principles generally accepted in Hungary (“HAS”), while accounting records of foreign subsidiaries are compiled according to accounting principles generally accepted in their own countries, though in order for preparing the consolidated financial statements consolidation packages are compiled according to HAS. These supplementary consolidated financial statements have been compiled primarily for the requirements of relevant sections of Hungarian Act on Accounting to companies listed on the Stock Exchange, and therefore contain reclassifications and alterations in order to they comply with the International Financial Reporting Standards (“IFRS”).
The consolidated financial statements have been prepared in accordance with International Financial Reporting Standards as adopted by the European Union (the “EU”). IFRS as adopted by the EU do not currently differ from IFRS as issued by the International Accounting Standards Board (IASB), except for portfolio hedge accounting under IAS 39 which has not been approved by the EU. The Company does not have any transactions which would qualify as a portfolio hedge.
The reporting currency of the Group is the Hungarian Forint (“HUF”).
The consolidated financial statements have been prepared on the historical cost basis except for certain properties and financial instruments that are measured at revalued amounts or fair values, as explained in the accounting policies below. Historical cost is generally based on the fair value of the consideration given in exchange for assets. The principal accounting policies are set out below.
Financial Statements are prepared based on the assumption of going concern of the activity of the Group in the foreseeable future.
BASIS OF CONSOLIDATION
The consolidated financial statements include the financial statements of ANY PLC and its subsidiaries after elimination of all intercompany transactions and balances, including unrealized intercompany profits. Subsidiaries are those companies in which the Group, directly or indirectly, has an interest of more than one half of the voting rights or otherwise has power to exercise control over the operations.
On acquisition, the assets and liabilities of a subsidiary are measured in the consolidated statements at their fair values at the date of acquisition. The interest of minority shareholders is stated at the minority’s proportion of the fair values of the assets and liabilities recognized. Goodwill arising on consolidation represents the excess of the cost of acquisition over the Group’s interest in the fair value of the identifiable net assets of a subsidiary, associate or jointly controlled entity at the date of acquisition. Goodwill is included as intangible in the balance sheet, to which impairment loss is calculated, if necessary. For the purpose of impairment test, the value of goodwill is allocated to those Cash Generating Units (hereinafter: CGU) of the Group that probably will have positive effects from the synergies. Those CGU-s, to which goodwill is allocated are subject to goodwill impairment test annually or more often if circumstances indicate any loss in the value of the Unit. If the book value of the goodwill is higher than the fair value of the CGU, impairment loss is accounted on the

25
goodwill. The impairment loss decreases mainly the value of the goodwill allocated on the CGU, then the remaining amount decreases the net book value of the CGU’s other assets, in proportion of the book value of the assets. The goodwill impairment loss once accounted cannot be reversed in the future. On disposal of a subsidiary, associate or jointly controlled entity, the attributable amount of goodwill is included in the determination of the profit or loss on disposal. The goodwill impairment calculation is based upon companies’ budgets containing more financial years. Present value of net sales and earnings before interest, tax and depreciation are calculated to the date of year end, using the companies’ expected net sales and earnings before interest, tax and depreciation ratio as a discount factor. Thus enterprise values are calculated by using the enterprise value based on the market share price effective on the date of preparing the financial statements and net sales ratio and by using the enterprise value based on the market share price effective on the date of preparing the financial statements and earnings before interest, tax and depreciation ratio of ANY Security Printing Company PLC as a listed company operating in the same sector, which are assessed by the Group in proportion of the ownership regarding the proportional equity and accounted goodwill of the given subsidiary.
The results of subsidiaries acquired or disposed during the year are included in the consolidated income statement from the effective date of acquisition or up to the effective date of disposal, as appropriate.
The transactions between the associated enterprises, including unrealized gains and losses as well as realized intra-group gains, were eliminated during consolidation.
The equity and net income attributable to minority interests are shown as separate items in the consolidated financial statements.
CASH AND CASH EQUIVALENTS
Cash and cash equivalents include cash at bank in hand, balances of bank accounts and short-term deposits with an original maturity of three months or less.
STATEMENT OF CASH FLOWS
For the cash flow statement the Cash and cash equivalents include cash and the value of bank deposits, as well as other short term (a term of three months or less at the time of their purchase) liquid investments, which may be immediately exchanged for the amount indicated on them, and their conversion does not come with the risk of a change in their value. Statement of cash flow is prepared based upon the indirect cash flow method.
INVENTORY
Inventory is stated at the lower of cost or net realizable value after making loss-in-value for any obsolete or slow moving items. Cost is determined at standard cost adjusted to actual purchase price at period end. For purchased inventories cost comprises purchase price, possible additional customs, delivery costs, non-refundable taxes and any other costs related to acquiring the inventory. For finished goods and work in progress, cost comprises direct materials, direct labour and an appropriate allocation of manufacturing fixed and variable overheads.

26
PROPERTY, PLANT AND EQUIPMENT
Property, plant and equipment are stated at cost less accumulated depreciation. Freehold land is not depreciated. Depreciation is provided using the straight-line method at rates calculated to write off the cost of the asset over its expected economic useful life. The rates used are as follows:
� Buildings 2% to 3%
� Leasehold improvements 6%
� Machinery and equipment 14.5 to 33%
At each balance sheet date, the Group reviews the carrying amount of its tangible and intangible assets to determine whether there is any indication in accordance with internal or external information that those assets have suffered an impairment loss. If any such indication exists, the recoverable amount of the asset is estimated in order to determine the amount of such an impairment loss (if any). If the recoverable amount of an asset is estimated to be less than its carrying amount, the carrying amount of the asset is reduced to its recoverable amount. Impairment loss is recognized as an expense immediately.
An item of property, plant and equipment is derecognised upon disposal or when no future economic benefits are expected to arise from the continued use of the asset. Any gain or loss arising on the disposal or retirement of an item of PPE is determined as the difference between the sales proceeds and the carrying amount of the asset and is recognised in profit or loss.
Assets held under finance leases are depreciated over their expected useful lives on the same basis as owned assets.
INTANGIBLE ASSETS (EXCEPT FOR GOODWILL)
Intangible assets with finite useful lives that are acquired separately are carried at cost less accumulated amortisation and accumulated impairment losses. Amortisation is recognised on a straight-line basis over their estimated useful lives. The estimated useful life and amortisation method are reviewed at the end of each reporting period, with the effect of any changes in estimate being accounted for on a prospective basis. Intangible assets with infinite useful lives that are acquired separately are carried at cost less accumulated impairment losses. Amortization is provided at rates between 16.7% and 33% per year.
An item of intangible asset is derecognised upon disposal or when no future economic benefits are expected to arise from the continued use of the asset. Any gain or loss arising on the disposal or retirement of an item of intangible asset is determined as the difference between the sales proceeds and the carrying amount of the asset and is recognised in profit or loss.
GOODWILL
Goodwill should be recognised in a business combination as the difference between consideration transferred for expected future economic benefits and the fair value of net assets, if consideration transferred is higher. When book value of goodwill is constantly and significantly higher than fair value due changes in circumstances of expected future economic benefits, goodwill impairment has to be accounted. Impairment calculations are made yearly by the Company.

27
FINANCIAL INSTRUMENTS
All financial assets are recognised and derecognised on trade date where the purchase or sale of a financial asset is under a contract whose terms require delivery of the financial asset within the timeframe established by the market concerned, and are initially measured at fair value, plus transaction costs, except for those financial assets classified as at fair value through profit or loss, which are initially measured at fair value.
Financial assets are classified into the following specified categories: financial assets ‘at fair value through profit or loss’ (FVTPL), ‘held-to-maturity’ investments, ‘available-for-sale’ (AFS) financial assets and ‘loans and receivables’. The classification depends on the nature and purpose of the financial assets and is determined at the time of initial recognition.
Fair value of financial instruments
The fair values of financial instruments, consisting of cash, receivables, payables, and obligations under debt instruments, are approximated to their carrying values. The fair values of the Group’s existing investments are not readily determinable as the underlying shares are not frequently traded in a well-established and organized market.
Impairment of financial assets
Financial assets, other than those at FVTPL, are assessed for indicators of impairment at the end of each reporting period. Financial assets are impaired where there is objective evidence that, as a result of one or more events that occurred after the initial recognition of the financial asset, the estimated future cash flows of the investment have been affected.
For listed and unlisted equity investments classified as AFS, a significant or prolonged decline in the fair value of the security below its cost is considered to be objective evidence of impairment.
For all other financial assets, including redeemable notes classified as AFS and finance lease receivables, objective evidence of impairment could include:
� significant financial difficulty of the issuer or counterparty; or
� default or delinquency in interest or principal payments; or
� it becoming probable that the borrower will enter bankruptcy or financial re-organisation.
For certain categories of financial asset, such as trade receivables, assets that are assessed not to be impaired individually are, in addition, assessed for impairment on a collective basis. Objective evidence of impairment for a portfolio of receivables could include the Group’s past experience of collecting payments, an increase in the number of delayed payments in the portfolio past the average credit period of 60 days, as well as observable changes in national or local economic conditions that correlate with default on receivables.
For financial assets carried at amortised cost, the amount of the impairment is the difference between the asset’s carrying amount and the present value of estimated future cash flows, discounted at the financial asset’s original effective interest rate.
The carrying amount of the financial asset is reduced by the impairment loss directly for all financial assets with the exception of trade receivables, where the carrying amount is reduced through the use of an allowance account. When a trade receivable is considered uncollectible, it is written off against the allowance account. Subsequent recoveries of amounts previously written off are credited against the allowance account. Changes in the carrying amount of the allowance account are recognised in profit or loss.

28
When an AFS financial asset is considered to be impaired, cumulative gains or losses previously recognised in other comprehensive income are reclassified to profit or loss in the period.
With the exception of AFS equity instruments, if, in a subsequent period, the amount of the impairment loss decreases and the decrease can be related objectively to an event occurring after the impairment was recognised, the previously recognised impairment loss is reversed through profit or loss to the extent that the carrying amount of the investment at the date the impairment is reversed does not exceed what the amortised cost would have been had the impairment not been recognised.
In respect of AFS equity securities, impairment losses previously recognised in profit or loss are not reversed through profit or loss. Any increase in fair value subsequent to an impairment loss is recognised in other comprehensive income.
Derecognition of financial assets
The Group derecognises a financial asset only when the contractual rights to the cash flows from the asset expire, or when it transfers the financial asset and substantially all the risks and rewards of ownership of the asset to another entity. If the Group neither transfers nor retains substantially all the risks and rewards of ownership and continues to control the transferred asset, the Group recognises its retained interest in the asset and an associated liability for amounts it may have to pay. If the Group retains substantially all the risks and rewards of ownership of a transferred financial asset, the Group continues to recognise the financial asset and also recognises a collateralised borrowing for the proceeds received.
INVESTMENTS
The Group shows in the investments the amount of parent company’s investments in their subsidiaries which has been eliminated in the process of capital consolidation. Other investments different from previous ones are carried at cost, less provision for any permanent diminution in value.
TAXATION
The amount of company tax is based on the taxation obligation defined according to the law on corporate income tax and dividend taxes, which is modified by the deferred tax.
Deferred taxes are calculated using the balance sheet liability method. Deferred taxes reflect the net tax effects of temporary differences between the carrying amounts of assets and liabilities for financial reporting purposes and the amounts used for income tax purposes. Deferred tax assets and liabilities are measured using the tax rates expected to apply to taxable income in the years in which those temporary differences are expected to be realized or settled. The measurement of deferred tax liabilities and deferred tax assets reflects the tax consequences that would follow from the manner in which the Group expects, at the balance sheet date, to realize or settle the carrying amount of its assets and liabilities.
Deferred tax assets are recognized only if it is probable that sufficient taxable profits will be available against which the deferred tax assets can be utilized. At each balance sheet date, the Group re-assesses unrecognized deferred tax assets and the carrying amount of deferred tax assets. The Group recognizes a previously unrecognized deferred tax asset to the extent that it has become probable that future taxable profit will allow the deferred tax asset to be recovered. The Group conversely reduces the carrying amount of a deferred tax asset to the extent that it is no longer

29
probable that sufficient taxable profit will be available to allow the benefit of part or that entire deferred tax asset to be utilized.
TREASURY SHARES
Shares repurchased are included in shareholders’ equity. Premiums and discounts arising on sale of treasury shares, and differences on repurchase, are credited or debited to retained earnings.
REVENUE RECOGNITION
Revenue is recognized at the time goods are dispatched and services rendered by the Group, as this is the point at which the significant risks and rewards of ownership of the goods and services are transferred to the customer.
Revenue is measured at the fair value of the consideration received or receivable. Revenue is reduced for estimated customer returns, rebates and other similar allowances.
Revenue is separated into five different product segment by the Group. The management considers these product segments strategically important. These segments are monitored and these are the basis of evaluating the performance. However, classification of turnover by product segments do not mean that these products can be produced in a clearly separable way in terms of assets and liabilities. According to this preparation of segment reporting under IFRS 8 is not possible.
DIVIDEND AND INTEREST REVENUE
Dividend revenue from investments is recognised when the shareholder’s right to receive payment has been established (provided that it is probable that the economic benefits will flow to the Group and the amount of revenue can be measured reliably). (Dividend realized within the Group will be eliminated during consolidation.)
Interest revenue is recognised when it is probable that the economic benefits will flow to the Group and the amount of revenue can be measured reliably. Interest revenue is accrued on a time basis, by reference to the principal outstanding and at the effective interest rate applicable, which is the rate that exactly discounts estimated future cash receipts through the expected life of the financial asset to that asset’s net carrying amount on initial recognition.
LEASING
Leases are classified as finance leases whenever the terms of the lease transfer substantially all the risks and rewards of ownership to the lessee.
THE GROUP AS LESSEE
Assets held under finance leases are initially recognised as assets of the Group (with similar rights and liabilities as the assets owned by the Group) at their fair value at the inception of the lease, and they are amortised during their economic useful life. The present value of the minimum lease payment is lower than their fair value they are recognized at that.

30
The principal is accounted as decrease of liability from the lease contract, while interest is accounted as an expense, so that the lease liability decreases at a constant rate during the term of the lease contract.
Operating lease payments are recognised as an expense on a straight-line basis over the lease term. In case when operative lease contract is cancelled before the contractual term is over, all the amounts paid to the lessor as a charge for cancelling the contract are recognised as an expense in the relevant period. Fixed assets mean the cover in Group’s leasing transactions.
PROVISIONS
The Group is involved in a low number of ongoing legal disputes. Based upon historical experience and expert reports, the Group assesses the developments in these cases, and the likelihood and the amount of potential financial losses which are appropriately provided for. The Group recognises provision in case when:
� an entity has a present obligation (legal or constructive) as a result of a past event;
� it is probable that an outflow of resources embodying economic benefits will be required to settle the obligation; and
� a reliable estimate can be made of the amount of the obligation.
CONTINGENT LIABILITIES ACQUIRED IN A BUSINESS COMBINATION
Contingent liabilities acquired in a business combination are initially measured at fair value at the acquisition date. At the end of subsequent reporting periods, such contingent liabilities are measured at the higher of the amount that would be recognised in accordance with IAS 37 Provisions, Contingent Liabilities and Contingent Assets and the amount initially recognised less cumulative amortisation recognised in accordance with IAS 18 Revenue.
GOVERNMENT GRANTS
The Group applies for government grants in order to purchase assets or to finance R+D activities. In both cases government grants are accounted and accrued as other revenue, then accrued revenue is reversed in proportion of the accounted depreciation of the asset purchased or of the R+D capitalised.

31
EARNINGS PER SHARE
Basic earnings per share data is calculated based on the weighted average number of shares outstanding during the period excluding treasury held by the Company and employee shares. Fully diluted earnings per share is calculated based on the weighted average number of shares outstanding as calculated for basic earnings per share and as adjusted for giving effect to the assumed issuance of all potentially dilutive securities. Net income is adjusted in the fully diluted earnings per share calculation for any income or expense associated with the potentially dilutive securities.
FOREIGN CURRENCIES
In preparing the financial statements of the individual entities, transactions in currencies other than the entity’s functional currency (foreign currencies) are recorded at the rates of exchange prevailing at the dates of the transactions. At each balance sheet date, monetary items denominated in foreign currencies are retranslated at the rates prevailing at the balance sheet date. Exchange differences are recognised in profit or loss in the period in which they arise.
For the purpose of presenting consolidated financial statements, the assets and liabilities of the Group’s foreign operations are expressed in Currency Units using exchange rates prevailing at the balance sheet date. Income and expense items are translated at the average exchange rates for the period. From the foreign subsidiaries of the Group TipoDirect S.R.L. and Zipper Data S.R.L. keep their books in Romanian Lei, Tipo Direct SERV S.R.L. in Moldavian Lei, Direct Services O.O.D. in Bulgarian Leva, while Slovak Direct S.R.O. keeps its books in EURO. The balances of foreign currency assets and liabilities of the foreign subsidiaries of the Group are retranslated at the relevant MNB (National Bank of Hungary) foreign exchange rate in the consolidated financial statements in the parent company’s functional currency (HUF). The details of the conversion have been presented in table 26 Risk Management.

32
INITIAL APPLICATION OF NEW AMENDMENTS TO THE EXISTING STANDARDS AND INTERPRETATION EFFECTIVE FOR THE CURRENT REPORTING PERIOD
The following amendments to the existing standards and new interpretation issued by the International Accounting Standards Board (IASB) and adopted by the EU are effective for the current reporting period:
� Amendments to IFRS 10 “Consolidated Financial Statements”, IFRS 12 “Disclosure of Interests in Other Entities” and IAS 28 “Investments in Associates and Joint Ventures” – Investment Entities: Applying the Consolidation Exception – adopted by the EU on 22nd September, 2016 (effective for annual periods beginning on or after 1st January, 2016).
On 18th December, 2014 the International Accounting Standards Board issued amendments to International Financial Reporting Standard (IFRS) 10 Consolidated Financial Statements, International Financial Reporting Standard (IFRS) 12 and International Accounting Standard (IAS) 28 Investments in Associates and Joint Ventures. The amendments introduce clarifications to the requirements when accounting for investment entities.
The adoption of the above presented Amendments had no significant impact on the financial statements.
� Amendments to IFRS 11 “Joint Arrangements” – Accounting for Acquisitions of Interests in Joint Operations – adopted by the EU on 24th November, 2015 (effective for annual periods beginning on or after 1st January, 2016).
The amendments add new guidance on how to account for the acquisition of an interest in a joint operation that constitutes a business. The amendments specify the appropriate accounting treatment for such acquisitions.
The adoption of the above presented Amendment had no significant impact on the financial statements.
� Amendments to IAS 1 “Presentation of Financial Statements” – Disclosure Initiative – adopted by the EU on 18th December, 2015 (effective for annual periods beginning on or after 1st January, 2016).
The amendments aim to improve the effectiveness of disclosure and to encourage companies to apply professional judgement in determining what information to disclose in their financial statements when applying IAS 1.
The adoption of the above presented Amendment had no significant impact on the financial statements.
� Amendments to IAS 16 “Property, Plant and Equipment” and IAS 38 “Intangible Assets” – Clarification of Acceptable Methods of Depreciation and Amortisation – adopted by the EU on 2nd December, 2015 (effective for annual periods beginning on or after 1st January, 2016).
The IASB has clarified that the use of revenue-based methods to calculate the depreciation of an asset is not appropriate because revenue generated by an activity that includes the use of an asset generally reflects factors other than the consumption of the economic benefits embodied in the asset. The IASB also clarified that revenue is generally presumed to be an inappropriate basis for measuring the consumption of the economic benefits embodied in an intangible asset. This presumption, however, can be rebutted in certain limited circumstances.
The adoption of the above presented Amendments had no significant impact on the financial statements.

33
� Amendments to IAS 16 “Property, Plant and Equipment” and IAS 41 “Agriculture” – Agriculture: Bearer Plants – adopted by the EU on 23rd November, 2015 (effective for annual periods beginning on or after 1st January, 2016).
The Amendments change the financial reporting for bearer plants. The IASB decided that bearer plants should be accounted for in the same way as property, plant and equipment in IAS 16 Property, Plant and Equipment, because their operation is similar to that of manufacturing. Consequently, the amendments include them within the scope of IAS 16, instead of IAS 41. The produce growing on bearer plants will remain within the scope of IAS 41.
The adoption of the above presented Amendments had no significant impact on the financial statements.
� Amendments to IAS 19 “Employee Benefits” – Defined Benefit Plans: Employee Contributions – adopted by the EU on 17th December, 2014 (effective for annual periods beginning on or after 1st February, 2015).
The amendments aim to simplify and clarify the accounting for employee or third party contributions linked to defined benefit plans.
The adoption of the above presented Amendments would have no impact on the financial statements.
� Amendments to IAS 27 “Separate Financial Statements” – Equity Method in Separate Financial Statements – adopted by the EU on 18th December, 2015 (effective for annual periods beginning on or after 1st January, 2016).
The amendments allows entities to use the equity method to account for investments in subsidiaries, joint ventures and associates in their separate financial statements.
The adoption of the above presented Amendment had no significant impact on the financial statements.
� Amendments to various standards “Improvements to IFRSs (cycle 2010–2012)” resulting from the annual improvement project of IFRS (IFRS 2, IFRS 3, IFRS 8, IFRS 13, IAS 16, IAS 24 and IAS 38) primarily with a view to removing inconsistencies and clarifying wording – adopted by the EU on 17th December, 2014 (amendments are to be applied for annual periods beginning on or after 1st February, 2015).
� Amendments to various standards “Improvements to IFRSs (cycle 2012–2014)” resulting from the annual improvement project of IFRS (IFRS 5, IFRS 7, IAS 19 and IAS 34) primarily with a view to removing inconsistencies and clarifying wording – adopted by the EU on 15th December, 2015 (amendments are to be applied for annual periods beginning on or after 1st January, 2016).
The adoption of these amendments to the existing standards and interpretation has not led to any material changes in the Group’s financial statements.

34
AMENDMENTS TO THE EXISTING STANDARDS ISSUED BY IASB AND ADOPTED BY THE EU BUT NOT YET EFFECTIVE
At the date of authorisation of these financial statements the following amendments to the existing standards issued by IASB and adopted by the EU were in issue but not yet effective:
� IFRS 9 “Financial Instruments” (effective for annual periods beginning on or after 1st January, 2018).
On 24th July, 2014 the International Accounting Standards Board issued IFRS 9 Financial instruments, as a replacement of IAS 39 Financial instruments: Recognition and Measurement. The Standard includes requirements for recognition and measurement, impairment, derecognition and general hedge accounting. The version of IFRS 9 issued in 2014 supersedes all previous versions. IFRS 9 does not replace the requirements for portfolio fair value hedge accounting for interest rate risk (often referred to as the ‘macro hedge accounting’ requirements) since this phase of the project was separated from the IFRS 9 project due to the longer term nature of the macro hedging project.
The application of IFRS 9 might have significant impact on the group financial statement, the Group will analyse the impact after the adoption of the standard by EU.
� IFRS 15 “Revenue from Contracts with Customers” and further amendments (effective for annual periods beginning on or after 1st January, 2018).
IFRS 15 sets out the requirements for recognizing revenue that apply to all contracts with customers (except for contracts that are within the scope of the Standards on leases, insurance contracts and financial instruments). IFRS 15 replaces the previous revenue Standards: IAS 18 Revenue and IAS 11 Construction Contracts, and the related Interpretations on revenue recognition.
The adoption of the above presented new Standard would have no significant impact on the financial statements.
NEW STANDARDS AND AMENDMENTS TO THE EXISTING STANDARDS ISSUED BY IASB BUT NOT YET ADOPTED BY THE EU
At present, IFRS as adopted by the EU do not significantly differ from regulations adopted by the International Accounting Standards Board (IASB) except from the following new standards and amendments to the existing standards, which were not endorsed for use in EU as at [date of publication of financial statements] (the effective dates stated below is for IFRS in full):
� IFRS 14 “Regulatory Deferral Accounts” (effective for annual periods beginning on or after 1st January, 2016) – the European Commission has decided not to launch the endorsement process of this interim standard and to wait for the final standard.
On 30th January, 2014 the International Accounting Standards Board issued IFRS 14 Regulatory Deferral Accounts, with the objective to specify the financial reporting requirements for “regulatory deferral account balances” that arise when an entity provides goods or services to customers at a price or rate that is subject to rate regulation. IFRS 14 is designed as a limited scope Standard to provide an interim, short-term solution for rateregulated entities that have not yet adopted International Financial Reporting Standards (IFRS).

35
The adoption of the above presented new Standard would have no impact on the financial statements.
� IFRS 16 “Leases” (effective for annual periods beginning on or after 1st January, 2019).
The International Accounting Standards Board (IASB) issued IFRS 16 Leases in January, 2016. IFRS 16 sets out the principles for the recognition, measurement, presentation and disclosure of leases for both parties to a contract, i.e. the customer (‘lessee’) and the supplier (‘lessor’).
At its October, 2015, the IASB decided to require an entity to apply the new Leases Standard for annual periods beginning on or after 1st January, 2019 and to permit early application if the entity also applies IFRS 15 Revenue from Contracts with Customers at or before the date of early application.
The aim of the standard is to ensure that assets and liabilities arising under leases are recognised in the statement of the financial position.
IFRS 16 replaces the previous leases Standard, IAS 17 Leases, and related Interpretations (IFRIC 4).
The adoption of the above presented new Standard would have no impact on the financial statements
� Amendments to IFRS 2 “Share-based payment” – Classification and Measurement of Share-based Payment Transactions (issued on 20th June, 2016, effective for annual periods beginning on or after 1st January, 2018).
The amendments provide requirements on the accounting for: (a) the effects of vesting and non-vesting conditions on the measurement of cash-settled share-based payments; (b) share-based payment transactions with a net settlement feature for withholding tax obligations; and (c) a modification to the terms and conditions of a share-based payment that changes the classification of the transaction from cash-settled to equity-settled.
The adoption of the above presented Amendment would have no significant impact on the financial statements.
� Amendments to IFRS 4 “Insurance contracts” – Applying IFRS 9 Financial Instruments with IFRS 4 Insurance Contracts (issued on 12th September, 2016, effective for annual periods beginning on or after 1st January, 2018).
The amendments provide two options for entities that issue insurance contracts within the scope of IFRS 4:
y an option that permits entities to reclassify, from profit or loss to other comprehensive income, some of the income or expenses arising from designated financial assets (the “overlay approach”);
y an optional temporary exemption from applying IFRS 9 for entities whose predominant activity is issuing contracts within the scope of IFRS 4 (the “deferral approach”).
The application of both approaches is optional and an entity is permitted to stop applying them before the new insurance contracts standard is applied.
The adoption of the above presented Amendment would have no significant impact on the financial statements.
� Amendments to IFRS 10 “Consolidated Financial Statements” and IAS 28 “Investments in Associates and Joint Ventures” – Sale or Contribution of Assets between an Investor and its Associate or Joint Venture and further amendments (effective date was deferred indefinitely until the research project on the equity method has been concluded).

36
The amendments address an acknowledged inconsistency between the requirements in IFRS 10 and those in IAS 28 (2011), in dealing with the sale or contribution of assets between an investor and its associate or joint venture. The main consequence of the amendments is that a full gain or loss is recognized when a transaction involves a business. A partial gain or loss is recognized when a transaction involves assets that do not constitute a business.
The adoption of the above presented Amendments would have no significant impact on the financial statements.
� Amendments to IFRS 15 “Revenue from Contracts with Customers” – Clarifications to IFRS 15 Revenue from Contracts with Customers (effective for annual periods beginning on or after 1st January, 2018).
The objective of this project is to clarify the guidance in IFRS 15 in respect of issues arising from the discussions of the Transition Resource Group for Revenue Recognition (TRG).
The discussions of the TRG highlighted potential diversity in stakeholders’ understanding of some topics in IFRS 15.
Those topics have been referred to the IASB for further consideration. The Board discussed the specific issues arising from the TRG discussions on those topics, and the IASB issued amendments in order to clarify the requirements in IFRS 15.
The adoption of the above presented Amendment would have no significant impact on the financial statements.
� Amendments to IAS 7 “Statement of Cash Flows” – Disclosure Initiative (effective for annual periods beginning on or after 1st January, 2017).
Disclosure Initiative issued by IASB on 29th January, 2016. The amendments are intended to clarify IAS 7 to improve information provided to users of financial statements about an entity’s financing activities. The amendments require an entity to provide disclosures that enable users of financial statements to evaluate changes in liabilities arising from financing activities, including both changes arising from cash flows and non-cash changes.
The adoption of the above presented Amendments would have no significant impact on the financial statements.
� Amendments to IAS 12 “Income Taxes” – Recognition of Deferred Tax Assets for Unrealised Losses (effective for annual periods beginning on or after 1st January, 2017).
The International Accounting Standards Board (the Board) issued amendments to IAS 12 Income Taxes at 19th January, 2016. The amendments, Recognition of Deferred Tax Assets for Unrealised Losses (Amendments to IAS 12), clarify how to account for deferred tax assets related to debt instruments measured at fair value.
IAS 12 provides requirements on the recognition and measurement of current or deferred tax liabilities or assets. The amendments issued clarify the requirements on recognition of deferred tax assets for unrealised losses to address diversity in practice.
Entities are required to apply the amendments for annual periods beginning on or after 1st January, 2017. Earlier application is permitted.
The amendments to the Standard follow on from a recommendation by the International Financial Reporting Interpretations Committee.
The adoption of the above presented Amendments would have no significant impact on the financial statements.

37
� Amendments to IAS 40 “Investment property” – Transfers of Investment Property (issued on 8th December, 2016, effective for annual periods beginning on or after 1st January, 2018).
The IASB amended the standard to reinforce the principle for transfers into, or out of, investment property in IAS 40 to specify that such a transfer should only be made when there has been a change in use of the property.
The adoption of the above presented Amendment would have no significant impact on the financial statements.
� Amendments to various standards “Improvements to IFRSs (cycle 2014–2016)” resulting from the annual improvement project of IFRS (IFRS 1, IFRS 12 and IAS 28) primarily with a view to removing inconsistencies and clarifying wording (amendments to IFRS 12 are to be applied for annual periods beginning on or after 1st January, 2017 and amendments to IFRS 1 and IAS 28 are to be applied for annual periods beginning on or after 1st January, 2018).
� IFRIC Interpretation 22 “Foreign Currency Transactions and Advance Consideration (issued on 8th December, 2016, effective for annual periods beginning on or after 1st January, 2018). The interpretation clarifies the accounting for transactions that include the receipt or payment of advance consideration in a foreign currency.
The adoption of the above presented Interpretation would have no significant impact on the financial statements.
The Group anticipates that the adoption of these standards, amendments to the existing standards and interpretations will have no material impact on the financial statements of the Group in the period of initial application.
Hedge accounting for a portfolio of financial assets and liabilities, whose principles have not been adopted by the EU remains unregulated.
According to the Group`s estimates, application of hedge accounting for the portfolio of financial assets or liabilities pursuant to IAS 39: “Financial Instruments: Recognition and Measurement”, would not significantly impact the financial statements, if applied as at the end of the reporting period.

38
CRITICAL ACCOUNTING JUDGEMENTS AND ESTIMATES BY APPLYING THE ACCOUNTING POLICY
The process of preparing financial statements in accordance with International Financial Reporting Standards requires the use of estimates and assumptions regarding the carrying amounts of assets and liabilities presented in the consolidated financial statements and the Notes.
CRITICAL ASSUMPTIONS BY APPLYING THE ACCOUNTING POLICY
The Management of the Group had certain assumptions when applying the accounting policy, that can influence the carrying amounts of assets and liabilities presented in the consolidated financial statements (apart from the impact of the estimates, presented at the next point). These assumptions are presented in details in the Notes, but the most important ones are the following:
� The temporary differences calculated with deferred tax liabilities will reverse in the foreseeable future, and the corporate tax rate is 9%, which is effective from 1st January, 2017.
� The outcome of certain contingent liabilities.
� Zipper Services S.R.L., Zipper Data S.R.L. and Direct Services O.O.D. are subsidiaries of the Group although the Group only owns a 50% ownership interest in these companies. Based on the contractual arrangements between the Group and other investors, the Group has the power to appoint and remove the majority of the board of management of these companies that has the power to direct the relevant activities of these companies. Therefore, the management of the Company concluded that the Group has the practical ability to direct the relevant activities of these companies unilaterally and hence the Group has control over these companies.
UNCERTAINTIES IN THE ESTIMATES
The process of preparing consolidated financial statements in accordance with International Financial Reporting Standards requires the use of estimates and assumptions regarding the carrying amounts of assets and liabilities presented in the consolidated financial statements and the Notes. These estimates are based on the best knowledge of the Management, in spite of this actual results may differ from estimated amounts. These estimates are presented in details in the Notes, but the most important ones are the following:
� Determining the fair value of Financial Instruments
� Determining the economic useful life of fixed assets
� Calculating the impairment loss on fixed assets and goodwill
� Calculating provisions

39
3. Cash and bankIn HUF thousands 31st December, 2016 31st December, 2015
Cash and cash equivalents 865,496 814,876
Total cash and cash equivalents 865,496 814,876
4. Accounts receivablesIn HUF thousands 31st December, 2016 31st December, 2015
Trade receivables 3,458,599 3,034,430
Allowance for doubtful debts (13,329) (42,045)
Total 3,445,270 2,992,385
The carrying value of trade receivables is fair value. Balance of trade debtors is HUF 3,445 million, which is HUF 453 million (15%) higher than at the end of 2015.
Movement of the allowance in doubtful debts is broken down below:
In HUF thousands 31st December, 2016 31st December, 2015
Balance at the beginning of the year 42,045 61,978
Impairment losses recognised on receivables 5,996 3,154
Impairment losses reversed (968) (6,839)
Derecognition of receivables as uncollectable debt (33,744) (16,248)
Balance at the end of the year 13,329 42,045
5. InventoriesIn HUF thousands 31st December, 2016 31st December, 2015
Raw materials 1,310,396 1,221,262
Work in progress 623,156 518,542
Finished goods 436,517 411,344
Goods 41,933 41,107
Cumulated loss in value for inventories (268,288) (164,033)
Total 2,143,714 2,028,222
The total amount of inventories is HUF 2,144 million, which increased by HUF 115 million (6%) compared to 31st December, 2015. The amount of raw materials and consumables increased by HUF 89 million (7%) compared to the prior period, caused by the higher raw material needs of security products. HUF 105 million (20%) increase was in the amount of work-in-progress due to the ongoing production of security products.

40
6. Other current assets and prepayments
In HUF thousands 31st December, 2016 31st December, 2015
VAT receivable 85,905 177,847
Corporate income tax receivable 70,634 16,428
Other taxes receivable 21,608 41,180
Total current tax receivables 178,147 235,455
Prepayments 582,283 561,713
Of which: revenue recognized but not invoiced 428,806 377,663
Of which: prepaid interest 28,631 27,561
Of which: rental fee of softwares 31,189 23,644
Guarantee receivables 371,434 328,298
Paid VAT of lease fee – 107,276
Advances paid 10,094 58,612
Of which: advances paid for PP&E 7,591 49,344
Of which: other advances paid 2,503 9,268
Employee loans 32,635 49,991
Other receivables 124,714 62,135
Total other current assets and prepayments 1,121,160 1,168,025
Total other current assets, prepayments and tax receivables 1,299,307 1,403,480
Year-end balance of current tax receivables is HUF 57 million lower than in previous period which caused by the HUF 92 million decrease of VAT receivables, HUF 55 million increase of corporate income tax receivables and the HUF 19 million decrease of other tax receivables.
The significant increase in the amount of prepayments is caused by not invoiced items until preparation of balance sheet at the Romanian subsidiaries. Interest in employees loans are the same for each employee, Hungarian prime rate + 5%.

41
7. Property, Plant and Equipment
In HUF thousands Land and buildings
Machinery and
equipment
Property rights
Vehicles and other
equipments
Capital projects Total
Cost:
1st January, 2015 696,933 10,429,507 10,767 1,569,549 85,562 12,792,318
Capitalization 34,681 1,097,657 – 98,602 (1,230,940) –
Additions – – – – 1,425,057 1,425,057
Disposals and transfers (1,960) (384,639) – (18,404) – (405,003)
31st December, 2015 729,654 11,142,525 10,767 1,649,747 279,679 13,812,372
1st January, 2016 729,654 11,142,525 10,767 1,649,747 279,679 13,812,372
Capitalization 216,872 1,811,731 – 281,600 (2,310,203) –
Additions 3,636,653 – – – 2,075,580 5,712,233
Disposals and transfers (78) (366,998) – (13,180) – (380,256)
31st December, 2016 4,583,101 12,587,258 10,767 1,918,167 45,056 19,144,349
Accumulated depreciation:
1st January, 2015 237,914 8,018,496 10,767 1,198,179 – 9,465,356
Charge for year 34,588 728,689 – 128,352 – 891,629
Disposals (1,508) (282,532) – (18,213) – (302,253)
31st December, 2015 270,994 8,464,653 10,767 1,308,318 – 10,054,732
1st January, 2016 270,994 8,464,653 10,767 1,308,318 – 10,054,732
Charge for year 99,705 758,228 – 119,392 – 977,325
Additions 969,723 – – – – 969,723
Disposals (5,133) (76,072) – (5,932) – (87,137)
31st December, 2016 1,335,289 9,146,809 10,767 1,421,778 – 11,914,643
Net book value:
1st January, 2015 459,019 2,411,011 – 371,370 85,562 3,326,962
31st December, 2015 458,660 2,677,872 – 341,429 279,679 3,757,640
31st December, 2016 3,247,812 3,440,449 – 496,389 45,056 7,229,706
Fair value of the PP&E exceeds book value, therefore no impairment loss was calculated. Real estates owned by ANY Ingatlanhasznosító Kft. are on the line Additions. UniCredit Bank Zrt. has EUR 6.500.000 mortgage right on the real estates, covering the risk of the loan of ANY Ingatlanhasznosító Kft.
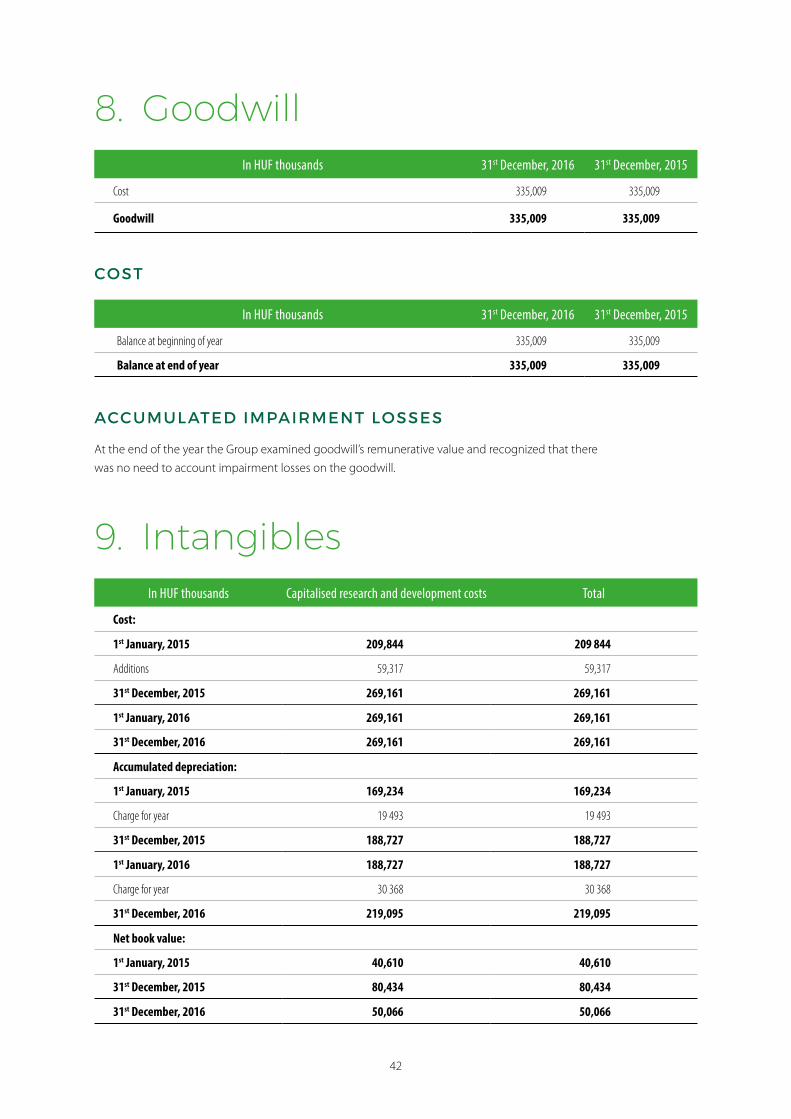
42
8. GoodwillIn HUF thousands 31st December, 2016 31st December, 2015
Cost 335,009 335,009
Goodwill 335,009 335,009
COST
In HUF thousands 31st December, 2016 31st December, 2015
Balance at beginning of year 335,009 335,009
Balance at end of year 335,009 335,009
ACCUMULATED IMPAIRMENT LOSSES
At the end of the year the Group examined goodwill’s remunerative value and recognized that there was no need to account impairment losses on the goodwill.
9. IntangiblesIn HUF thousands Capitalised research and development costs Total
Cost:
1st January, 2015 209,844 209 844
Additions 59,317 59,317
31st December, 2015 269,161 269,161
1st January, 2016 269,161 269,161
31st December, 2016 269,161 269,161
Accumulated depreciation:
1st January, 2015 169,234 169,234
Charge for year 19 493 19 493
31st December, 2015 188,727 188,727
1st January, 2016 188,727 188,727
Charge for year 30 368 30 368
31st December, 2016 219,095 219,095
Net book value:
1st January, 2015 40,610 40,610
31st December, 2015 80,434 80,434
31st December, 2016 50,066 50,066

43
10. Other payables and accruals
In HUF thousands 31st December, 2016
31st December, 2015
VAT 363,866 197,203
Personal income tax 68,852 64,487
Other taxes 260,244 78,829
Total current tax liabilities 692,962 340,519
Accrued management bonuses 360,527 258,365
Other accruals 256,825 170,409
Of which: grant of PP&E purchase – 52,845
Of which: accrued creditors 113,921 29,628
Social security 30,733 123,941
Salaries and wages 185,898 108,560
Advance payments from customers 24,440 37,358
Other short term liabilities 107,568 10,489
Other payables and accruals 965,991 709,122
Total current tax liabilities, other payables and accruals 1,658,953 1,049,641
Total current tax liabilities, other payables and accruals amounts to HUF 1,659 million, which increased by HUF 609 million (58%) compared to 31st December, 2015, due to the higher balance of the current tax liabilities and accruals, liabilities connected to salaries and wages.

44
11. Short term and long term loansIn HUF thousands 31st December, 2016 31st December, 2015
Bank overdraft of the Parent Company 835,529 –
Total overdrafts 835,529 –
Short term part of long term loan of subsidiaries 197,563 –
Other short term loans of subsidiaries 2,855 83
Total short term loans and overdrafts 1,035,947 83
Long term loan of subsidiary 1,632,839 –
Total investment loans and borrowings 1,632,839 –
Total loans and borrowings 2,668,786 83
The carrying value of loans and overdrafts is fair value. The balance of the Parent Company’s bank overdraft at the end of 2016 is HUF 836 million. Amount of the long term loan taken during the purchase of ANY Ingatlanhasznosító Kft., that owns the real-estates was HUF 2,025 million, while HUF 1,827 million was the year-end balance, of which HUF 1,630 million was long term part and HUF 197 million was short term part.
Intercompany loans and their conditions at the balance sheet date were the following:
� ANY PLC – Direct Services O.O.D.: EUR 30,710, interest rate is based on 3 months EURIBOR,
� ANY PLC – ANY Ingatlanhasznosító Kft.: 80,000,000 HUF interest rate is based on 1 month BUBOR.
� Specimen Zrt. – ANY PLC: HUF 73,000,000 HUF, interest rate is based on 1 month BUBOR,
� Specimen Zrt. – ANYpay Fizetési Megoldások Zrt.: HUF 12,500,000 interest rate is based on 1 month BUBOR,
� Zipper Services S.R.L. – Tipo Direct Serv S.R.L.: EUR 50,000, interest rate is based on 3 months EURIBOR.
12. Share capitalShare capital (at par value, in HUF thousands) authorized, issued and outstanding at year-end:
In HUF thousands 31st December, 2016 31st December, 2015
Issued Treasury Issued Treasury
Registered shares 1,449,876 43,987 1,449,876 43,987
Total 1,449,876 43,987 1,449,876 43,987
The number of shares issued by the Company is 14,794,650 of which par value is HUF 98 per share.

45
13. Treasury sharesNumber of treasury shares held by the Company on 31st December, 2016 is 448,842 which were purchased at an average price of HUF 1,014 per share.
14. Capital reserve, retained earnings, non‑controlling interestRetained earnings available for distribution are based on the unconsolidated financial statements of the Company prepared in accordance with Hungarian accounting law as opposed to these accounts prepared under IFRS. On 31st December, 2016 the financial statements of ANY PLC not consolidated, prepared in accordance with Hungarian accounting standards indicated total retained earnings of HUF 2,044,747 thousands.
Non-controlling interest is a part of the Shareholders’ equity, which belongs to the owners of the subsidiaries other than the parent Company in the proportion of their ownership.
15. Net salesSales segments (in HUF thousands) 2016 2015
Security products and solutions 6,679,876 6,138,709
Card production and personalization 5,937,030 4,186,098
Form production and personalization. data processing 10,715,223 9,205,214
Traditional printing products 1,142,871 1,106,365
Other 436,120 729,631
Total net sales 24,911,120 21,366,017

46
Total revenue in 2016 by countries:
Revenue by Countries (in HUF thousands) 2016 2015
Hungary 15,682,752 13,016,875
Romania 7,207,817 6,130,642
Bulgaria 1,278,301 1,240,047
Czech Republic 223,747 153,693
Slovakia 212,805 223,833
Africa 109,387 396,906
Moldavia 46,399 44,038
Albania 41,415 83,857
Germany 38,164 18,918
Iceland 18,481 17,679
Saint Vincent and Grenadine islands 14,104 –
Cyprus 10,021 5,425
Austria 8,032 762
Italy 5,881 8,694
Switzerland 2,935 2,033
Poland 2,778 4,138
The Netherlands 2,294 1,554
United Kingdom 2,218 13,547
Finland 320 1,983
Other 3,269 1,393
Total net sales 24,911,120 21,366,017

47
16. Other expenses, netOther incomes and expenses (in HUF thousands) 2016 2015
Derecognition of provision 137,555 237
IFRS effect from ownership purchase of ANY Ingatlanhasznosító Kft. 126,104 –
Allowances received 7,957 31,125
Reversed loss in value for trade receivables 4,070 6,839
Reversed loss in value for inventories – 97,414
Other items 57,100 32,442
Total other incomes 332,786 168,057
Loss in value for inventories 240,122 119,768
Building tax, land tax and local income tax 221,378 163,144
Provision raised 216,971 –
Fines, penalties 64,489 60,733
Loss in value for trade receivables 1,849 3,154
Other items 52,782 89,834
Total other expenses 797,591 436,633
Total (464,805) (268,576)
The customers’ and inventories’ impairment haven’t been occurred in one company so the presentation of current years’ impairment and impairment reversal on a net basis is not possible.
17. Cost of sales and selling general and administration costsBreakdown of cost of sales and selling general and administration cost is the following:
In HUF thousands 2016 2015
Material type expenditures 16,145,257 14,345,229
Personal type expenditures 5,601,147 4,770,317
Depreciation and amortization 1,007,693 911,122
Changes in inventory and own performance (258,357) (286,478)
Total cost and expenditures 22,495,740 19,740,190
Cost of sales 17,219,214 15,135,453
Selling general and administration 5,276,526 4,604,737
Total direct and indirect cost of sales 22,495,740 19,740,190
The average number of employees of the Group during the year was 842 (2015: 805).

48
18. TaxationIn HUF thousands 31st December, 2016 31st December, 2015
Current year corporate income tax 212,832 141,174
Deferred tax (income) / expense 58,058 (4,846)
Total tax expense 270,890 136,301
Based on the decision of the Hungarian Parliament, 9% corporate tax rate has to be applied for the Hungarian companies from the calendar year of 2017. In case of the domestic subsidiaries we applied the new 9% corporate tax rate when calculating deferred tax. The tax liability of the foreign companies of the Group is taken into consideration with the effective tax legislation of their country of incorporation.
Under the tax legislation the Company is allowed to establish a tax-deductible development reserve. Assets acquired using this reserve then do not qualify for tax depreciation up to the value of the reserve. Therefore this is effectively a form of accelerated depreciation. Development reserves have been established based on the Company’s current year and previous years pre-tax profit and a deferred tax liability has been recognized on the deferred tax effect of the accounting and tax depreciation difference of assets not connected to development reserve. The Company decreased its deferred tax liabilities by the valuation difference for treasury shares based on the Hungarian Accounting Standards.
Tax losses can be carried forward up to the next years offset future taxable profits (until its 50%). Deferred tax assets relating to tax losses are netted off against deferred tax liabilities. The company raised deferred tax asset on write-off for bad debts in 2016.
ANY PLC and its subsidiaries are subject to periodic audits by the Hungarian Tax Authority (NAV). Since the application of tax laws and regulations may be susceptible to varying interpretations, amounts reported in the financial statements could be changed at a later date upon final determination by the tax authorities. In 2015 the Parent Company was subject to a comprehensive audit by NAV (National Tax and Customs Administration) for the years 2010, 2011 and 2012 to all kind of taxes. No material misstatement was explored by the Tax Authority.
In HUF thousands 31st December, 2016 31st December, 2015
Opening deferred tax liability 247,448 301,423
Deferred tax liability due to development reserve (774) (46,904)
Deferred tax on accounting and tax depreciation difference of assets not connected to development reserve
88,838 481
Deferred tax arising from treasury shares valuation 277 (7,862)
Deferred tax on residual value of financial lease assets 155 310
Closing deferred tax liability 335,944 247,448
Opening deferred tax assets 4,159 6,385
Deferred tax asset on write-off for bad debts (3,005) (2,226)
Deferred tax asset on deferred yearly losses 32,669 –
Closing deferred tax assets 33,823 4,159
Opening deferred tax liability net 243,289 295,038
Closing deferred tax liability net 302,121 243,289

49
The effective income tax rate defers from the statutory income tax rate due to the following items:
In HUF thousands 31st December, 2016
31st December, 2015
Profit before tax and non-controlling interest 1,866,362 1,354,729
Tax at statutory rate of 10% (*) 186,636 135,473
Other permanent differences (net) 26,196 5,701
Corporate income tax expense 212,832 141,174
(*) The foreign tax rules were not considered in this calculation. The differences from that method can be find in row of Other permanent differences (net). In this calculation 10% tax rate valid in 2015 has been applied.
19. Other comprehensive income for the year
Other comprehensive income for the year (in HUF thousands) 31st December, 2016
31st December, 2015
Deferred tax recognized on equity instruments (774) 46,903
Revaluation effect of P&L items in other currency than HUF based on IAS 21 (9,609) 1,192
Total other comprehensive income for the year (10,383) 48,095
20. Earnings per shareWeighted average shares outstanding, net income used in the calculation of earnings per share and calculated earning per share details are set out below: (number of weighted average shares and net income is the same both at ‘Basic’ and ‘Fully diluted’ EPS calculation):
In HUF thousands 31st December, 2016
31st December, 2015
Weighted average shares outstanding for 14,345,808 14,345,808
Net income used in the calculation 1,202,475 931,702
Basic and diluted earnings per share:
Basic (HUF per share) 84 65
Fully diluted (HUF per share) 84 65

50
21. Contingent liabilitiesThe Company has arranged bank guarantees. The guarantees largely relate to commitments under Government and corporate tenders. Guarantees are provided up to a maximum limit of HUF 750 million.
The Company reclassified HUF 659 million to the restricted reserves in 2012, in 2013, in 2014, in 2015 and in 2016 to finance future capital expenditures, which has not been utilised yet. Corporate tax base was decreased by this amount in line with the relevant Hungarian regulations under the condition, that this amount will be spent for capital expenditures in the following six years, otherwise the deducted corporate tax has to be repaid to the Hungarian Tax Authority grossed up with its fines and interests.
22. Short term and long term part of lease liabilitiesShort term and long term financial lease principal liabilities belong to parent company and foreign subsidiary lease contracts for machineries, of which short term part is HUF 264,267 thousands and long term part is HUF 515,231 thousands, due in the next years.
Financial lease liabilities (in HUF thousands) 31st December, 2016 31st December, 2015
Short term part 264,267 105,631
Long term part 515,231 207,850
Total 779,498 313,481
The book value of the leased assets is fair value. Fixed assets are the cover in Group’s leasing transactions.

51
23. Remuneration of the members of the Supervisory Board and the Board of DirectorsHUF 9,912 thousands remuneration was paid to the Supervisory Board, while HUF 5,440 thousands to the Board of Directors in 2016.
The following table presents the beginning and the end of the assignment of the members of the Board of Directors, the members of the Supervisory Board and the senior officers. The number of shares hold in ANY Security Printing Company PLC is also presented as at 31st December, 2016.
Type 1 Name Position Assignment started
Assignment ends
Treasury stock owned (no.)
BD Dr. Ákos Erdős 2 Chairman of Board of Directors 1993 (*) 31st May, 2019 2,195,253
BD Gábor Zsámboki Deputy Chairman of Board of Directors (**) 11th August, 2005 (*) 31st May, 2019 143,923
BD György Gyergyák Member of Board of Directors 1994 (*) 31st May, 2019 200,000
BD Péter Kadocsa Member of Board of Directors 30th April, 2010 (*) 31st May, 2019 –
BD Tamás Erdős 3 Member of Board of Directors 31st May, 2014 31st May, 2019 1,000,001
BD Erwin Fidelis Reisch Member of Board of Directors 31st May, 2014 31st May, 2019 –
SB Dr. Tamás Sárközy Chairman of Supervisory Board 30th March, 2007 (*) 31st May, 2019 –
SB Dr. Istvánné Gömöri 4 Deputy Chairman of Supervisory Board 11th August, 2005 (*) 31st May, 2019 536,703
SB Ferenc Berkesi Member of Supervisory Board 11th August, 2005 (*) 31st May, 2019 –
SB Dr. Erzsébet Novotny Member of Supervisory Board 30th April, 2010 (*) 31st May, 2019 5,320
SB Dr. Imre Repa Member of Supervisory Board 30th March, 2007 (*) 31st May, 2019 –
SB Dr. János Stumpf Member of Supervisory Board 19th April, 2011 (*) 31st May, 2019 –
SP Gábor Zsámboki Chief Executive Officer 1st May, 2008 indefinite (***)
SP László Balla Deputy Chief Executive Officer 1st May, 2008 indefinite 30,190
SP Ferenc Berkesi Chief Security Officer 2001. indefinite (***)
SP Gábor Péter Chief Information Officer 1st Dec, 2009 indefinite 16,194
SP Dr. Lajos Székelyhídi Chief Research and Development Officer 1999. indefinite 6,900
SP Zoltán Tóth Chief Technical and Production Officer 1st July, 2008 indefinite –
Number of shares hold, TOTAL 4,134,484
1 Employee in a strategic position (SP), Board of Directors member (BD), Supervisory Board member (SB).2 Dr. Ákos Erdős controls ANY shares indirectly through EG Capital LLC and Fortunarum Kft.3 Tamás Erdős controls ANY shares indirectly through Digital Forest LLC.4 Dr. Istvanné Gömöri controls ANY shares indirectly through BELU S.A.R.L.(*) Re-elected by the Annual General Meeting held on 31st March, 2014.(**) Gábor Zsámboki has been the Deputy Chairman of the Board of Directors since 11th August, 2014.(***) Number of shares shown at membership of board.

52
24. Risk management
FOREIGN CURRENCY RISK
Among foreign currency transactions of the Group EURO based transactions are the most important ones. Foreign currency liabilities mainly occur from raw material purchases, which are hedged by the receivables from the export sales in foreign currency as a natural hedge. The balance of foreign currency receivables and liabilities are almost the same within the Group, therefore the foreign currency risk of the Group is not significant.
ANY Group Currency 31st December, 2016 31st December, 2015
Foreign currency receivables EUR 860,464 473,046
USD – 1,679
GBP – 561
BGN 1,292,170 1,462,833
RON 31,364,708 23,967,533
MDL 837,012 240,724
DKK – 45,095
SEK – 18,669
Total (in HUF thousands) 2,633,913 2,047,392
Foreign currency cash EUR 298,788 559,442
USD 4,579 1,679
GBP 828 561
BGN 1,454,527 1,185,065
RON 6,201,369 4,546,075
MDL 1,114,804 1,081,626
Total (in HUF thousands) 767,026 696,074
Foreign currency liabilities EUR 1,339,712 1,231,478
CHF 7,126 –
BGN 871,238 1,081,232
RON 20,275,485 16,808,387
MDL 540,848 189,521
Total (in HUF thousands) 1,953,369 1,727,474
Impact of a possible 10% foreign exchange rate decrease in each foreign currency (in HUF thousands):
Impact on foreign currency assets 340,094 274,347
Impact on foreign currency liabilities (195,337) (172,747)
Total impact of possible foreign exchange rate change 144,757 101,600

53
The fair value of the financial instruments approximates the book value. The Group holds no financial assets held to maturity or available for sale.
From the foreign subsidiaries and joint ventures of the Group Zipper Services S.R.L. and Zipper Data S.R.L. keep their books in Romanian Lei, TipoDirect SERV S.R.L. in Moldavian Lei, Direct Services O.O.D. in Bulgarian Leva, while Slovak Direct S.R.O. keeps its books in EURO. The balances of foreign currency assets and liabilities of the foreign subsidiaries of the Group are retranslated at the relevant national bank foreign exchange rates in the consolidated financial statements. In line with the regulation of IFRS the items of Statement of Financial Position were calculated at year end rate while items of Total Comprehensive Income were calculated at yearly average rate. The difference resulted from using different rates is disclosed in line of other comprehensive income.
INTEREST RATE RISK
Due to the moderate level of debts in the Group potential interest rate changes would not influence significantly the amount of interests to be paid by the Group. Based on the balance of Credits of the Group, a potential interest rate increase of 100 basis points relevant to our credits would increase our interest expenses by approximately HUF 26,688 thousands in the year 2016. (This was HUF 2,079 thousands in the year 2015.)
LIQUIDITY RISK
The Group manages liquidity risk by maintaining adequate reserves, banking facilities and reserve borrowing facilities, by continuously monitoring forecasts and actual cash flows and by matching the maturity profiles of financial assets and liabilities.
Liquidity risk of the Group, due to the high balance of net working capital, is low. The maturity of trade payables, lease liabilities and credits is shown in the next table:
ANY Group, FY 2016 (in HUF thousands) In 1 month 1–3 months 3 months–
1 year 1–5 years Over 5 years Total
Trade payables 2,347,515 84,165 33,006 2,645 – 2,467,331
Lease liabilities 59,506 127,939 76,822 515,231 – 779,498
Credits – 51,510 984,437 1,632,839 – 2,668,786
Other liabilities and accruals (without taxes)
497,953 89,036 379,002 – – 965,991
Current tax liabilities 637,274 9,809 45,879 – – 692,962
Total 3,542,248 362,459 1,519,146 2,150,715 – 7,574,568
ANY Group, FY 2015 (in HUF thousands) In 1 month 1–3 months 3 months–
1 year 1–5 years Over 5 years Total
Trade payables 2,525,076 353,366 – – – 2,878,441
Lease liabilities 8,786 17,570 79,275 207,850 – 313,481
Credits – 4 79 – – 83
Other liabilities and accruals (without taxes)
450,835 251,883 6,404 – – 709,122
Current tax liabilities 257,694 8,551 74,274 – – 340,519
Total 3,242,391 631,374 160,032 207,850 – 4,241,647

54
CREDIT RISK
Credit risk refers to the risk that counterparty will default on its contractual obligations resulting financial loss to the Group. The Group has adopted a policy of only dealing with creditworthy counterparties, and obtaining sufficient collateral, where appropriate, as a means of mitigating the risk of financial loss from defaults. Trade receivables consist of a large number of costumers, spread across diverse industries and geographical areas. Ongoing credit evaluation is performed on the financial condition of accounts receivable.
The financial discipline of the debtors of the Group is really good, which is also represented by the low portion of cumulated provision on trade receivables compared to the gross amount of trade receivables: 1.36%. (This was 1.39% in 2015.)
25. Significant events after the reporting periodThe Consolidated Financial Statements were accepted by the Board of Directors of ANY Nyrt. on 6th March, 2017.
Budapest, 6th March, 2017
Gábor Zsámboki
Chief Executive Officer

55
Statement of ResponsibilityThe 2015 Annual Report of ANY Security Printing Company PLC contains true data and statements and does not conceal any fact that might have significance for the evaluation of the Company’s position.
Gábor Zsámboki
Chief Executive Officer
April, 2017
ANY Security Printing Company PLC

HUNGARY
ANY Security Printing Company PLC
1102 Budapest, Halom u. 5.
Phone: +36 1 431 1200
Fax: +36 1 431 1220
E-mail: [email protected]
www.any.hu
Gyomai Kner Nyomda Zrt.
5500 Gyomaendrőd, Kossuth Lajos u. 10–12.
Phone: +36 66 887 400
E-mail: [email protected]
www.gyomaikner.hu
Specimen Zrt.
1102 Budapest, Halom u. 5.
Phone: +36 1 434 4720
E-mail: [email protected]
www.specimen.hu
ANYpay Fizetési Megoldások Zrt.
1102 Budapest, Halom u. 5.
Phone: +36 1 431 1222
Techno-Progress Kft.
1102 Budapest, Halom u. 5.
Phone: +36 1 431 1222
ANY Ingatlanhasznosító Kft.
1102 Budapest, Halom u. 5.
Phone: +36 1 431 1222
A N YS E C U R I T YP R I N T I N GC O M P A N YG R O U P
BULGARIA
DIRECT SERVICES O.O.D.
Sofia 1839, Kremikovtsi,
272 Botevgradsko Shose Blvd.
Phone: +35 92 960 9737
E-mail: [email protected]
www.directservices.bg
ROMANIA
Zipper Services S.R.L.
Cluj-Napoca 400632, str. Fabricii nr. 93–103.
Phone: +40 364 101 102
E-mail: [email protected]
www.tipodirect.ro
SLOVAKIA
Slovak Direct S.R.O.Nové Záhrady I/11, 821 05 Bratislava
Phone: +42 1 4823 5382
E-mail: [email protected]
www.slovakdirect.sk
MOLDOVA
Tipo Direct Serv S.R.L.Chişinău 2001, str. Tighina 49/3, ap. 41C
Phone: +373 (22) 888-285
E-mail: [email protected]
www.tipodirect.md


