52
ITBC “The Next Phase” Tourism Performance Audit Report 2012‐2017 March 2018 PREPARED BY: O’Neil Marketing & Consulting www.designingnations.com Beverley O’Neil | Dr. Peter Williams

ITBC “The Next Phase” Tourism Performance Audit Report 2012‐2017 March 2018
PREPARED BY:
O’Neil Marketing & Consulting www.designingnations.com Beverley O’Neil | Dr. Peter Williams

About the Indigenous Tourism Association of British Columbia (ITBC)
ITBC is a non‐profit, stakeholder‐based organization that is committed to growing and promoting a
sustainable, culturally rich Indigenous tourism industry. A sustainable Indigenous tourism sector with diverse
products in communities in every region of the province is recognized as one of the major focuses for
achieving the visions and goals of Indigenous tourism in BC. Through training, information resources,
networking opportunities and co‐operative marketing programs, ITBC is a one‐stop resource for Indigenous
entrepreneurs and communities in British Columbia who are operating or looking to start a tourism business.
ITBC works closely with tourism, business, education and government organizations to help BC’s Indigenous
tourism businesses offer quality experiences and actively promotes these experiences to visitors and residents.
Audit Consultants – O’Neil and Williams
O’Neil Marketing & Consulting / Beverley O'Neil and Dr. Peter Williams have collaborated for more than 20
years on strategic planning, research, studies and programs on Indigenous tourism in British Columbia and
Canada‐wide. Under the leadership of O’Neil, they worked together with other team members on researching
and creating the landmark BC Aboriginal Cultural Tourism Blueprint Strategy in 2005. This is the fourth audit
study completed by O’Neil and Williams of the progress of Indigenous tourism in BC and ITBC actions and
results. More info: www.designingnations.com
ITBC “The Next Phase” Strategy Performance Audit 2012‐2017
Pag
e ii
ITBC “The Next Phase” Strategy Performance Audit 2012‐2017
Table of Contents
RESULTS SNAPSHOT .......................................................................................................................................... IV
SUMMARY ......................................................................................................................................................... VI
1 THE CHANGING ECONOMIC AND TOURISM LANDSCAPE .............................................................................. 1
1.1 TIER 1: Awareness Building ..................................................................................................................... 1
Tourism Awareness Activities 2
Stakeholder Members 2
Market‐Ready Indigenous Tourism Businesses 4
1.2 TIER 2: Product Development and Capacity Building ............................................................................. 5
Capacity Building 5
Past and Future Use 5
Industry Relations 6
Outreach Activities 7
Partnerships 8
Travel Trade Relations 9
Stakeholder Relations 10
Strategic Planning and Development 10
1.3 TIER 3: Marketing .................................................................................................................................. 11
Website and Other Social Media 12
Indigenous Tourism Operator Marketing Program 14
Advertising 15
Media Relations 15
Print and Collateral Materials 15
Fam Tours 16
2 ECONOMIC PERFORMANCE ......................................................................................................................... 18
2.1 Indigenous Tourism Market Performance 2013‐2016 ......................................................................... 18
2.2 Indigenous Tourism Economic Contributions ....................................................................................... 20
2.3 Future Growth ....................................................................................................................................... 22
APPENDIX 1: SUMMARY OF REPORT PERFORMANCE INDICATORS ................................................................ 24
APPENDIX 2: INDIGENOUS TOURISM OPERATOR BUSINESS PERFORMANCE AND CHARACTERISTICS ......... 26
APPENDIX 3: INDIGENOUS TOURISM MARKET AWARENESS GAP .................................................................. 32
APPENDIX 4: BC REGIONAL INDIGENOUS TOURISM OPERATORS .................................................................. 34
APPENDIX 5: REPORT REFERENCES ................................................................................................................. 41

ITBC “The Next Phase” Strategy Performance Audit 2012‐2017
Pag
e iii
List of Figures
Figure 1: Distribution of All Indigenous Tourism Businesses by Region and Year ............................................ 3
Figure 2: Indigenous Tourism Business by Type ................................................................................................ 4
Figure 3: Partner by Tourism Region 2017 ........................................................................................................ 8
Figure 4: ITBC Annual Budget 2013‐2017 ....................................................................................................... 11
List of Tables
Table 1: ITBC Paid Stakeholder Membership 2017 ........................................................................................... 2
Table 2: Change in All Operating Tourism Businesses ...................................................................................... 3
Table 3: All Indigenous Tourism Businesses by Region and Year ...................................................................... 4
Table 4: Use of ITBC Awareness Capacity Building Programs ........................................................................... 6
Table 5: Intent of Partnerships .......................................................................................................................... 7
Table 6: Outreach Activity by Tourism Region .................................................................................................. 8
Table 7: Travel Trade Events Attendance .......................................................................................................... 9
Table 8: ITBC Website – Consumer and Corporate ......................................................................................... 12
Table 9: Social Media – Facebook and Twitter 2014/15 to 2016/17 .............................................................. 14
Table 10: Guide Distribution by Sector ............................................................................................................ 15
Table 11: Guide Distribution by Market .......................................................................................................... 16
Table 12: Fam Trips 2014/15 to 2016/17 ........................................................................................................ 17
Table 13: Weighted Indigenous Tourism Incidence Rates by Market Region 2016* ..................................... 19
Table 14: Estimated Indigenous Tourism Arrivals (000s) 2013‐2016 ............................................................. 20
Table 15: Estimated Indigenous Tourism Market Share 2016 ........................................................................ 20
Table 16: Indigenous Tourism Operator Perceptions of Economic Growth ................................................... 21
Table 17: Economic Impact of Indigenous Tourism in BC 2014‐2017 ............................................................ 22
Table 18: Anticipated Business Employment Complement – Next 5 Years .................................................... 23
Table 19: Indigenous Tourism Arrival Estimates 2013‐2017........................................................................... 25
Table 20: Distribution of Reported Business Locations by Tourist Region 2016 ............................................ 27
Table 21: Distribution of Tourism Operating Sectors ...................................................................................... 27
Table 22: Age of Indigenous Tourism Businesses ............................................................................................ 27
Table 23: Awareness and Use of Indigenous Tourism Capacity Development Programs .............................. 29
Table 24: Awareness and Use of Indigenous Tourism Marketing Programs .................................................. 30
Table 25: Indigenous Tourism Operators Business Performance ................................................................... 30
Table 26: ITBC Role in Stimulating Indigenous Employment .......................................................................... 31
Table 27: Indigenous Tourism Operators Anticipated Employment in Five Years ......................................... 31
Table 28: Support Interest of Indigenous Tourism Operators ........................................................................ 31
Table 29: Visitor Market Awareness of Indigenous Tourism .......................................................................... 32
Table 30: Anticipated Most Frequent Indigenous Cultural Tourism Experiences (Next Two Years) .............. 33

ITBC “The Next Phase” Strategy Performance Audit 2012‐2017
RESULTS SNAPSHOT
In 2016‐17, an estimated 401 Indigenous tourism related businesses operated in BC. Located across the province, the largest shares of them were engaged in retail (34%), outdoor adventure (19%), and accommodation (12%) operations.
In 2016, these businesses contributed to the visitor experiences of an
estimated 3.6 million overnight travellers in BC. About two‐thirds of these
travellers were Canadian residents. The remaining visitors (34%) were
from foreign countries. On average, about 1 in 3 Asia Pacific, 1 in 4
European, and 1 in 5 American overnight visitors experienced
aspects of Indigenous cultural tourism during their stays in the
province. Preliminary 2017 visitor arrival data suggested that
tourism traffic increased over reported 2016 level, furthering
Indigenous tourism businesses.
Collectively in 2016, these businesses generated an estimated
$705 million in direct gross domestic output to meet consumer
demand for their products and services. They also created about
7,400 direct full‐time jobs for Indigenous people and other BC
residents through their activities.
Based on 2015 international visitor
expenditure estimates, approximately
41% of the direct, indirect and induced impacts created by Indigenous
tourism businesses in BC are likely attributable to servicing
international visitors.
The top five markets for Indigenous tourism in Canada are: Canada,
China, Germany, United Kingdom, and United States. Over the next
two years, Indigenous tourism providers can expect to welcome
roughly 7.2 million visitors from these countries.
Attraction13%
Accommodations17%
Outdoor Adventure
19%Food and Beverage
5%
Festivals and Events8%
Retail36%
Transportation2%
401 Indigenous Tourism Businesses
$705 million
Direct Gross Domestic Output
7,400 Director full‐time jobs

ITBC “The Next Phase” Strategy Performance Audit 2012‐2017
Pag
e v
The number of market‐ready Indigenous tourism businesses in BC continues to increase. In 2017, there was 90
market‐ready Indigenous tourism businesses promoted through ITBC marketing programs.
Surveyed Indigenous tourism operators in 2017, were optimistic
about prospects for their businesses over the next five years. About
75% of them anticipated increasing their staff complements during
that period.
Almost all (98%) of the surveyed businesses indicated that their
operations would benefit from development and marketing
initiatives that increased global awareness of Indigenous tourism in
BC. They (89%) also felt that stronger partnerships with the travel
trade would significantly benefit their operations.
90
Market‐Ready Indigenous Tourism Businesses
ITBC “The Next Phase” Strategy Performance Audit 2012‐2017
SUMMARY
Following the development and implementation of the pioneering 2006‐2012 Blueprint Strategy, ITBC developed The Next Phase (2012‐2017) Five Year Strategy for Aboriginal Cultural Tourism in British Columbia.
The Next Phase was designed to build on the success of the original Aboriginal Cultural Tourism Blueprint
Strategy and adopted its goal to continue to expand the Indigenous cultural tourism industry in British
Columbia. The new Strategy also intended to emphasize the coordination of capacity building and product
development and strengthen ITBC’s marketing initiatives over the fiscal years 2012‐2017 in ways that would
increase visitor volume, employment and revenue, as well as tax revenue generation. Buoyed by previous
achievements during the Blueprint’s implementation period, The Next Phase’s goals ambitiously included
increasing Indigenous cultural tourism growth by 10% annually. This growth was premised on the successful
deployment of several sub‐strategies related to increasing product market readiness, partnerships, target
market engagement, on‐line marketing and regional Indigenous tourism development.
This report gives insights into the performance of Indigenous tourism in British Columbia during the fiscal
periods 2013 through 20171. It highlights those ITBC actions supporting the sector’s development while
providing perspectives on Indigenous tourism growth prospects as expressed by current operators, travel
trade representatives and broader tourism industry partners.
When reviewing Indigenous tourism’s performance, it is important to recognize that when implementation of
The Next Phase began, BC’s tourism industry was thriving and the Indigenous tourism sector benefited from
and capitalized on this ‘high tide’ of tourism demand. There was also financial support for ITBC in the earlier
part of the Strategy’s implementation. Indigenous tourism development over this time was a ‘good news story’
not only for Indigenous stakeholders in BC, but also other Indigenous tourism initiatives throughout Canada
1 As this report spans over five fiscal periods (April 1 to March 31) beginning April 1, 2012 to March 31, 2017, data was not available for all indicators and activities for each fiscal.
ITBC “The Next Phase” Strategy Performance Audit 2012‐2017
Pag
e vii
including the creation of the Aboriginal Tourism Association of Canada (ATAC, now called the Indigenous
Tourism Association of Canada, ITAC). While difficult to separate the influence of ITBC’s contributions from
greater market and economic forces, it is fair to say that ITBC continued to lay important groundwork for
future Indigenous tourism growth opportunities in Indigenous tourism in British Columbia, nationally and
abroad.
Activities, Outreach and Partnerships
Numerous Next Phase programs were implemented by ITBC from 2012 to 2017 fiscal years. However, as with
the Aboriginal Cultural Tourism Blueprint Strategy, the relative focus and emphasis of these programs changed
as ITBC’s awareness and capacity to address key ‘on the ground’ issues grew, and as funding agencies focus
and priorities changed.
The following sections highlight initiatives that were particularly influential in shaping Indigenous tourism’s
performance during this period. For continuity purposes, the activities and outcomes reported are categorized
utilizing the Blueprint Strategy strategic frame of reference: Tier 1 Awareness Building, Tier 2 Product
Development and Capacity Building, and Tier 3 Marketing.
TIER 1: Awareness Building
ITBC’s awareness building activities continued to grow community and market interest and engagement in
Indigenous tourism development opportunities during the 2012‐2017 period.
From a community perspective, ITBC ramped up its activities related to First Nation participation in community
planning business startups, cultural inclusion, as well as Indigenous people sharing cultures through tourism.
Under its auspices, six regional Indigenous cultural tourism strategies were developed in concert with local
First Nation communities and their partners. Collectively these activities heightened awareness of tourism
opportunities for business development and partnerships across the province.
From an international travel market perspective, interest in Indigenous tourism in general remained stable in
Canada’s key markets. Consumer interest in such experiences in destination selection decisions was
particularly evident (+74%) in China, India, Germany, and South Korea.
TIER 2: Product Development and Capacity Building
ITBC expanded its portfolio of human resource and product development capacity building programs during
the Audit period. Several of these programs focused on helping Indigenous operators and their communities
strengthen the human resource and business skill bases needed to develop, market and manage market‐ready
products and services. From 2014 to 2017, ITBC delivered 9 programs of which 8 were FirstHost front line
customer service training. Most of these sessions were delivered outside the Vancouver region.
Additionally, ITBC provided advice and support for the development of 6 region‐wide strategic plans for
Indigenous tourism development. These involved extensive consultations with regional and local Indigenous
stakeholders (e.g., community, business, tourism organizations). Collectively, the strategies included
components related to community tourism development, business planning and human resource capacity
building, and marketing.
ITBC “The Next Phase” Strategy Performance Audit 2012‐2017
Pag
e viii
Considerable opportunity remains to increase the uptake of these programs. Only two of ITBC’s 12 available
human and product development capacity building programs were used by Indigenous tourism operators
during the review period. (ITBC, March 2017).
Significantly more of the operators expressed interest in using some of these programs in the future. Those
most likely to be used focused on: Cultural Interpretation Training (47%); and Building Community Support for
Indigenous Cultural Tourism (46%). One of the more notable barriers to past use of most of these programs
was simply operator limited awareness of their existence.
ITBC continued to nurture partnerships with influential travel trade, regional destination marketing
organizations, as well as provincial and national tourism agencies. This led to ITBC’s involvement and
Indigenous tourism’s integration into several key tourism industry development strategies and marketing
programs in BC and Canada. For example, 28 travel trade events that resulted in over 1000 engagements with
tourism and travel trade. Contact with journalists revealed interest in key destinations of Canada, United
States, United Kingdom and China.
TIER 3: Marketing
ITBC modified its marketing activities as the influence of social media on travel and tourism travel behavior
became more apparent. Most specifically, it increased its investment in online and social media presence.
Consequently, ITBC’s Consumer website experienced a growth in unique visits from 2014/15 to 2016/17 of
nearly 30%, however, the Corporate site unique visits declined by about 25%. The web bounce rate for
Consumer and Corporate groups was average or below average, with average pages visited per session around
2.4 and 2.8 respectively. In both groups, the primary country of origin for its visitors was Canada (80‐90%),
while its international visitors were mostly from the United States. Overseas visitors were less than 1% each
for the other top eight countries.
As Facebook and Twitter’s importance as communication channels grew in popularity amongst ITBC’s
stakeholders, so did the followers of ITBC’s Consumer and Corporate groups. During the review period, its
Facebook presence generated over 25,000 followers, Twitter had over 6,000 Consumer and nearly 2,000
Corporate followers. While the number of followers grew in both groups and medias, impressions2 declined
over the period for all (Sprout Social Reporting 2016).
Overall, incidence of Indigenous tourism operator use of ITBC’s marketing programs was greater than its other
programs. Operators were most likely to use ITBC’s on‐line marketing applications (49%), Fam Tour
programming assistance (38%), and Stakeholder Sessions (36%).
Interest in future use of ITBC’s marketing programs was also relatively strong. At least 40% of the operators
expressed their intent to use these programs in the future. Support was greatest for future use of its On‐line
marketing (63%), Media Relations (59%), and Aboriginal Travel Service (57%) programs.
2 Potential reach measures how many unique Twitter accounts your tweets could have reached. A potential impression means a tweet has been delivered to a Twitter account's timeline. Twitter impressions are described as the delivery of a post or tweet to an account’s Twitter stream. The stream is composed of several tweets from various sources.

ITBC “The Next Phase” Strategy Performance Audit 2012‐2017
Pag
e ix
Awareness of ITBC’s marketing programs tended to be higher than that related to its broader capacity building
programs. All programs had at least 50% of the operators expressing awareness of each of these alternatives.
ITBC’s working relationships with travel trade representatives remained strong during the review period. For
the most part, travel trade stakeholders felt that ITBC and its stakeholders had collectively contributed to
making BC a more attractive travel option for their clients and partners. However, they also expressed an
underlying feeling that more proactive and timely efforts were needed by ITBC to support its travel trade
partners in their activities, and that the Indigenous tourism product needed to change to meet the nature of
their markets.
Markets, Volume and Revenue
Interest in pursuing Indigenous cultural tourism experiences while travelling remained stable in Canada and
BC’s key long‐haul travel markets, during the review period. Such interest was particularly evident (>74%) in
China, India. Germany and South Korea, and substantial (+40%) in several other markets. However, awareness
of Canada’s Indigenous tourism opportunities in these markets was limited (<25%).
US travellers represent the largest share (68%) of international travellers to Indigenous cultural tourism sites.
About 16% of BC’s short haul travellers from Washington, Oregon and California had experienced Indigenous
cultural tourism in BC during the 2012‐2014 period. In addition, specific sub‐segments of this market
expressed an even greater affinity for including such experiences in their travel plans in BC. Those experience
segments included Authentic Experiencers (25%), Cultural Explorers (18%) or Gentler Explorers (17%). They
were most apt to visit Vancouver Island (42%), Okanagan (39%), Vancouver (36%), and Kootenays (20%)
regions.
Based on overall BC overnight visitor flows and estimated Indigenous tourism incidence levels, about 2.9
million tourists experienced some form of Indigenous tourism (e.g., attractions, products, services, events,
etc.) as part of their provincial trips in 2013. While only informal estimates exist, approximation suggest that
3.6 million overnight travellers experienced Indigenous tourism in 2016. This represented a 27% increase over
2013 levels. Preliminary figures suggest that further increases above 2016 levels occurred in 2017.
Indigenous Tourism Business Performance
Growing demand for Indigenous tourism accelerated the emergence and/or expansion of Indigenous tourism
businesses between 2012 and 2017. During this period, the number of these businesses identified as operating
in BC rose from about 204 to 401 in 2017. This represented an expansion of about 97% over the 2012 level.
Much of the increase is attributed to the identification of more businesses in the retail sector (namely gas
stations) that serve local and tourist markets.
Significant shares of BC’s Indigenous tourism operators reported in a 2017 survey that during the 2014‐2016
period their businesses had increased ‘somewhat or a lot’ in terms of sales revenues (82%), marketing
effectiveness (63%), market competitiveness (61%), number of employees (49%), and days of operation (43%).
They highlighted possibilities to increase market awareness, customer service quality and travel trade
partnerships. These priorities reflect areas of future potential and importance identified in an operator survey
conducted in 2011. (ITBC Business Survey 2011)

ITBC “The Next Phase” Strategy Performance Audit 2012‐2017
Pag
e x
Indigenous Tourism Economic Performance
The 401 Indigenous tourism businesses identified as operating in British Columbia during 2017 generated a
range of economic benefits for Indigenous people as well as other BC residents. Estimates of these
contributions include generating about:
7,428 full‐time equivalent jobs, of which an estimated 48% were filled by Indigenous people;
$705 million in direct gross domestic output (GDP);
$381 million in direct value‐added;
$244 million in direct wages and salaries; and
$20 million in taxes for federal, provincial and municipal governments.
A 2017 Indigenous tourism operator survey indicated that over the preceding three years, significant
proportions of them had increased ‘somewhat’ or ‘a lot’ in terms of sales revenue (82%), market
competitiveness (61%), number of employees (49%), and days of operation (43%).
These same operators felt that while opportunities for greater support existed, ITBC had played a key role in
nurturing greater employment opportunities in Indigenous tourism. They also highlighted future opportunities
for ITBC to help increase market awareness, customer service quality and travel trade partnerships. These
priorities were evident in similar operator survey data collected in 2011.
Stakeholder’s Perceived Effect of ITBC on Indigenous Tourism Industry Performance
In 2017, Indigenous tourism operators and other partners suggested that while opportunities for greater
support exist, ITBC played a key role in nurturing greater employment opportunities in Indigenous tourism
over the past five years. They also highlighted the future role ITBC could play in: growing greater awareness in
key markets and with strategic partners; and, supporting further staff professionalism, as well as identifying
prospects for future tour development over the next five years.
They expressed confidence that their businesses would continue to capitalize on opportunities to build their
businesses in the next five years.

ITBC “The Next Phase” Strategy Performance Audit 2012‐2017
This report highlights strategic actions taken and performance outcomes associated with the implementation of ITBC’s The Next Phase Strategy 2012‐2017, and suggests prospects for the future.
The findings are based on a review of ITBC reports and records concerning the organization’s activities during
this period, data gathering of ITBC activities, interviews with industry leaders, as well as broader economic and
tourism industry performance estimates extrapolated from other related government and industry reports.
1 THE CHANGING ECONOMIC AND TOURISM LANDSCAPE
Regional tourism performance is greatly influenced by local, as well as external economic conditions. Tourist
expenditures are discretionary.
During periods of economic expansion, spending on tourism goods and services tends to increase; however,
tourist spending retracts quickly when the economy is not performing well. Commencing in 2012, a collective
rebound to a far‐reaching global economic downturn coupled with shifts in currency exchange rates triggered
a kick start to growth in BC’s tourism markets.
Fortunately, the depth of BC’s economic retreat was softened by increased construction, service and
consumer expenditures related to preparations for and delivery of the 2010 Winter Olympic and Paralympic
Games. While BC’s overall international overnight visits slowly rebounded during 2012‐2015, domestic
markets picked up some of the slack and grew throughout this period. In 2015 and well into 2017, the
emergence of what was largely a currency driven ‘perfect storm’ of forces commenced an impressive spurt in
both international and domestic visitor arrivals. Building on a combination of previous investments in capacity
building and marketing, ITBC used this relatively stable foundation for future growth to help grow Indigenous
tourism especially in the last two years of the Next Phase Strategy.
1.1 TIER 1: Awareness Building
Interest in tourism development by First Nations, Indigenous and Métis people in British Columbia has
increased since ITBC’s implementation of the Aboriginal Cultural Tourism Blueprint Strategy around 2005. This
is at least partially attributable to ITBC’s on‐going refinements to how it supports and engages Indigenous
peoples in tourism initiatives, the growing number of partnerships it has nurtured, the availability of a
ITBC “The Next Phase” Strategy Performance Audit 2012‐2017
Pag
e 2
relatively stable stream of implementation resources, and the many successes it achieved through the
implementation of its Blueprint Strategy. Collectively, these factors enhanced ITBC reputation amongst
Indigenous tourism stakeholders as the ‘go to’ agency for tourism development, within BC, Canada and
internationally.
Tourism Awareness Activities
For the past decade, ITBC has actively promoted tourism as an economic and cultural means of increasing
Indigenous people’s involvement in tourism for improved quality of life, cultural preservation, employment
creation, and community development. Its activities in this respect have reached out to First Nation
communities and organizations, Indigenous and Métis organizations, as well as youth and community groups.
Since 2012, its awareness building initiatives have included: outreach activities such as hosting stakeholder
sessions, participating in forums and industry committees, delivering presentations and training.
Stakeholder Members
Since 2012, ITBC has continued to develop and maintain its relationship with Indigenous tourism operators
throughout British Columbia through paid member‐based and marketing programs. ITBC currently offers two
stakeholder membership type programs – Stakeholder/Marketing which is open to self‐declared market‐ready
Indigenous‐owned tourism businesses, and Associate which is open to anyone (Indigenous, non‐ Indigenous,
business or individual). ITBC’s marketing programs promote all market‐ready Indigenous tourism operators
regardless of their membership status with the organization. ITBC also maintains a list of 37
Entertainers/Artisans which it includes in many programs and cultural activities.
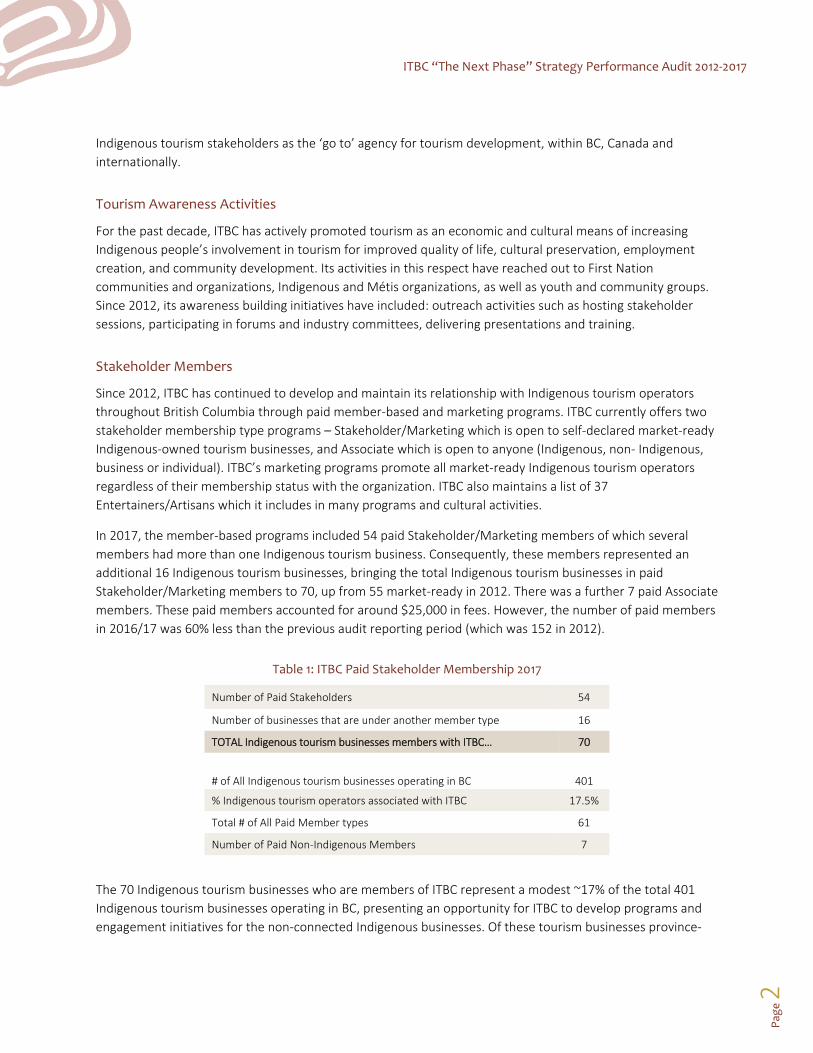
In 2017, the member‐based programs included 54 paid Stakeholder/Marketing members of which several
members had more than one Indigenous tourism business. Consequently, these members represented an
additional 16 Indigenous tourism businesses, bringing the total Indigenous tourism businesses in paid
Stakeholder/Marketing members to 70, up from 55 market‐ready in 2012. There was a further 7 paid Associate
members. These paid members accounted for around $25,000 in fees. However, the number of paid members
in 2016/17 was 60% less than the previous audit reporting period (which was 152 in 2012).
Table 1: ITBC Paid Stakeholder Membership 2017
Number of Paid Stakeholders 54
Number of businesses that are under another member type 16
TOTAL Indigenous tourism businesses members with ITBC… 70
# of All Indigenous tourism businesses operating in BC 401
% Indigenous tourism operators associated with ITBC 17.5%
Total # of All Paid Member types 61
Number of Paid Non‐Indigenous Members 7
The 70 Indigenous tourism businesses who are members of ITBC represent a modest ~17% of the total 401
Indigenous tourism businesses operating in BC, presenting an opportunity for ITBC to develop programs and
engagement initiatives for the non‐connected Indigenous businesses. Of these tourism businesses province‐

ITBC “The Next Phase” Strategy Performance Audit 2012‐2017
Pag
e 3
wide, the majority are in the Vancouver Island region (89), with second most in Vancouver Coast & Mountains
tourism (79) area.
Figure 1: Distribution of All Indigenous Tourism Businesses by Region and Year
An increasing number of Indigenous tourism businesses started or maintained operations since 2014, with 15
closing operations, resulting in a net change of 50% or 134 increase (Table 2). Northern BC had the greatest
change in the number of businesses since the previous reporting period of 2014. This is due greatly to the 39
retail/gas stations identified in the region, which likely have been operating for some time.
Table 2: Change in All Operating Tourism Businesses
Change in Businesses since last Fiscal 2017 2014 2013 2011 2003
New Indigenous businesses 149 61 8 86
Continued operating 252 206 204 146
Current Indigenous businesses operating 401 267 212 232 181
Operated last fiscal 267 212 232 181
No longer operating 15 6 28 35
Net Gain (‐Loss) since last fiscal… 134 55 ‐20 51 181
% Change 50% 26% ‐9% 28%
Of these 401 businesses, which represent an increase of 100 businesses over the 2015 numbers, 86 of these
are attributed to gas stations/retail and the balance were other tourism businesses.3 All regions had notable
increases in the number of Indigenous tourism businesses operating in their area, other than Kootenay Rockies
which had nominal change over the review periods (Figure 1, Table 3).
3 As the majority of new gas stations are located in Northern BC, they first serve the local market; consequently, while they are a component of the tourism industry, their economic impact on the tourism industry is calculated differently than that of other tourism related businesses.
Vancouver Coast andMountains
Vancouver Island Cariboo ChilcotinCoast
Thompson Okanagan Kootenay Rockies Northern BritishColumbia
2003 2011 2013 2014 2017

ITBC “The Next Phase” Strategy Performance Audit 2012‐2017
Pag
e 4
Table 3: All Indigenous Tourism Businesses by Region and Year
Tourism Region 2017 2014 2013 2011 2003 Change since
2003
Vancouver Coast and Mountains
79 17% 60 20% 48 20% 54 22% 42 20% 37 88%
Vancouver Island 89 20% 76 25% 62 26% 72 29% 55 26% 34 62%
Cariboo Chilcotin Coast
40 9% 25 8% 21 9% 25 10% 14 7% 26 186%
Thompson Okanagan 72 16% 43 14% 31 13% 33 13% 24 11% 48 200%
Kootenay Rockies 16 4% 14 5% 12 5% 12 5% 15 7% 1 7%
Northern British Columbia
105 23% 49 16% 38 16% 36 14% 31 14% 74 239%
TOTAL… 401 100% 267 100% 212 100% 232 100% 181 100% 220 122%
All regions had notable increases in the number of Indigenous tourism businesses operating in their area,
other than Kootenay Rockies which had nominal change over the review periods (Figure 1, Table 3). In 2017, of
all the Indigenous tourism businesses in BC, 36% of them were Retail (145) (most were gas stations), 19% were
Outdoor Adventure (77) and 17% Accommodations (70), and 13% Attractions (50) (Figure 2).
Figure 2: Indigenous Tourism Business by Type
Market‐Ready Indigenous Tourism Businesses
The strength of Indigenous tourism is measured by the number of Indigenous tourism market‐ready
businesses. Market‐readiness is a set of criteria established by the tourism industry that assesses the business’
operating policies and practices, reviewing such elements as pricing policies and industry commissions,
insurance and licensing, and years in operation. ITBC’s Indigenous Cultural Tourism Accreditation program was
initially used to evaluate Indigenous tourism businesses who voluntarily applied for market‐ready assessment;
in addition to requiring a majority level of Indigenous ownership and control, the program also required the
Indigenous business prove industry defined market‐readiness, and it had sufficient Indigenous cultural content
Attraction13%
Accommodations17%
Outdoor Adventure19%
Food and Beverage5%
Festivals and Events8%
Retail36%
Transportation2%
ITBC “The Next Phase” Strategy Performance Audit 2012‐2017
Pag
e 5
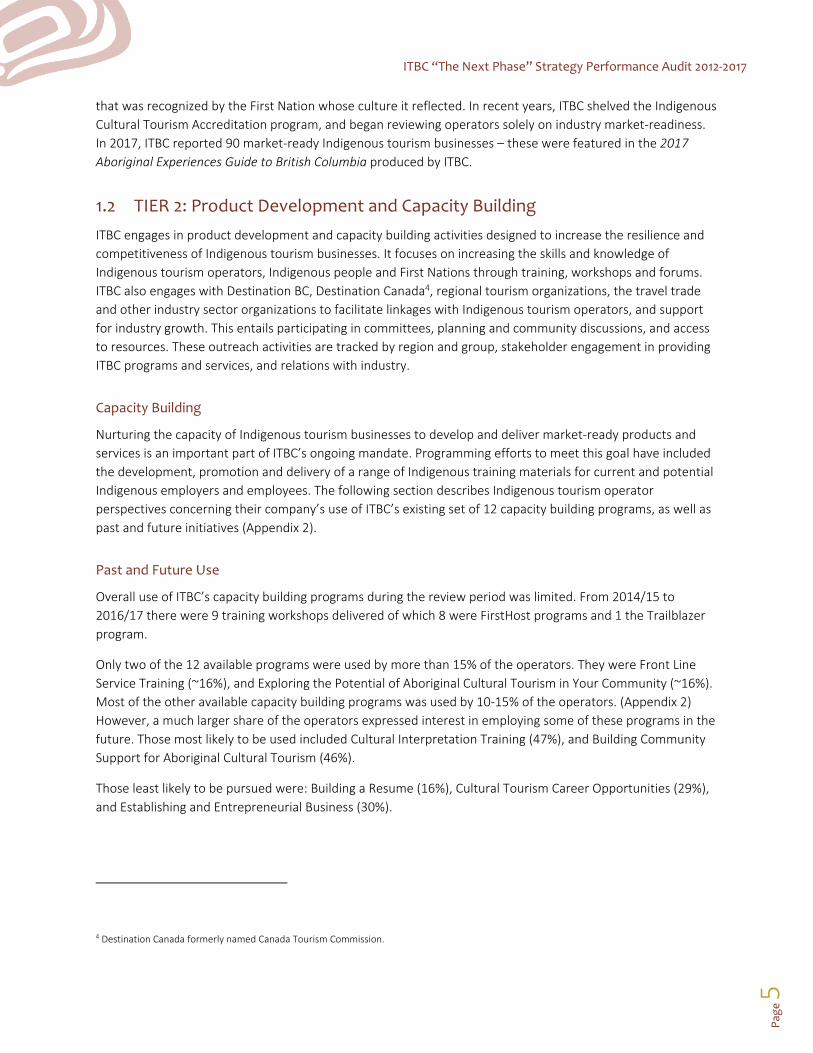
that was recognized by the First Nation whose culture it reflected. In recent years, ITBC shelved the Indigenous
Cultural Tourism Accreditation program, and began reviewing operators solely on industry market‐readiness.
In 2017, ITBC reported 90 market‐ready Indigenous tourism businesses – these were featured in the 2017
Aboriginal Experiences Guide to British Columbia produced by ITBC.
1.2 TIER 2: Product Development and Capacity Building
ITBC engages in product development and capacity building activities designed to increase the resilience and
competitiveness of Indigenous tourism businesses. It focuses on increasing the skills and knowledge of
Indigenous tourism operators, Indigenous people and First Nations through training, workshops and forums.
ITBC also engages with Destination BC, Destination Canada4, regional tourism organizations, the travel trade
and other industry sector organizations to facilitate linkages with Indigenous tourism operators, and support
for industry growth. This entails participating in committees, planning and community discussions, and access
to resources. These outreach activities are tracked by region and group, stakeholder engagement in providing
ITBC programs and services, and relations with industry.
Capacity Building
Nurturing the capacity of Indigenous tourism businesses to develop and deliver market‐ready products and
services is an important part of ITBC’s ongoing mandate. Programming efforts to meet this goal have included
the development, promotion and delivery of a range of Indigenous training materials for current and potential
Indigenous employers and employees. The following section describes Indigenous tourism operator
perspectives concerning their company’s use of ITBC’s existing set of 12 capacity building programs, as well as
past and future initiatives (Appendix 2).
Past and Future Use
Overall use of ITBC’s capacity building programs during the review period was limited. From 2014/15 to
2016/17 there were 9 training workshops delivered of which 8 were FirstHost programs and 1 the Trailblazer
program.
Only two of the 12 available programs were used by more than 15% of the operators. They were Front Line
Service Training (~16%), and Exploring the Potential of Aboriginal Cultural Tourism in Your Community (~16%).
Most of the other available capacity building programs was used by 10‐15% of the operators. (Appendix 2)
However, a much larger share of the operators expressed interest in employing some of these programs in the
future. Those most likely to be used included Cultural Interpretation Training (47%), and Building Community
Support for Aboriginal Cultural Tourism (46%).
Those least likely to be pursued were: Building a Resume (16%), Cultural Tourism Career Opportunities (29%),
and Establishing and Entrepreneurial Business (30%).
4 Destination Canada formerly named Canada Tourism Commission.
ITBC “The Next Phase” Strategy Performance Audit 2012‐2017
Pag
e 6
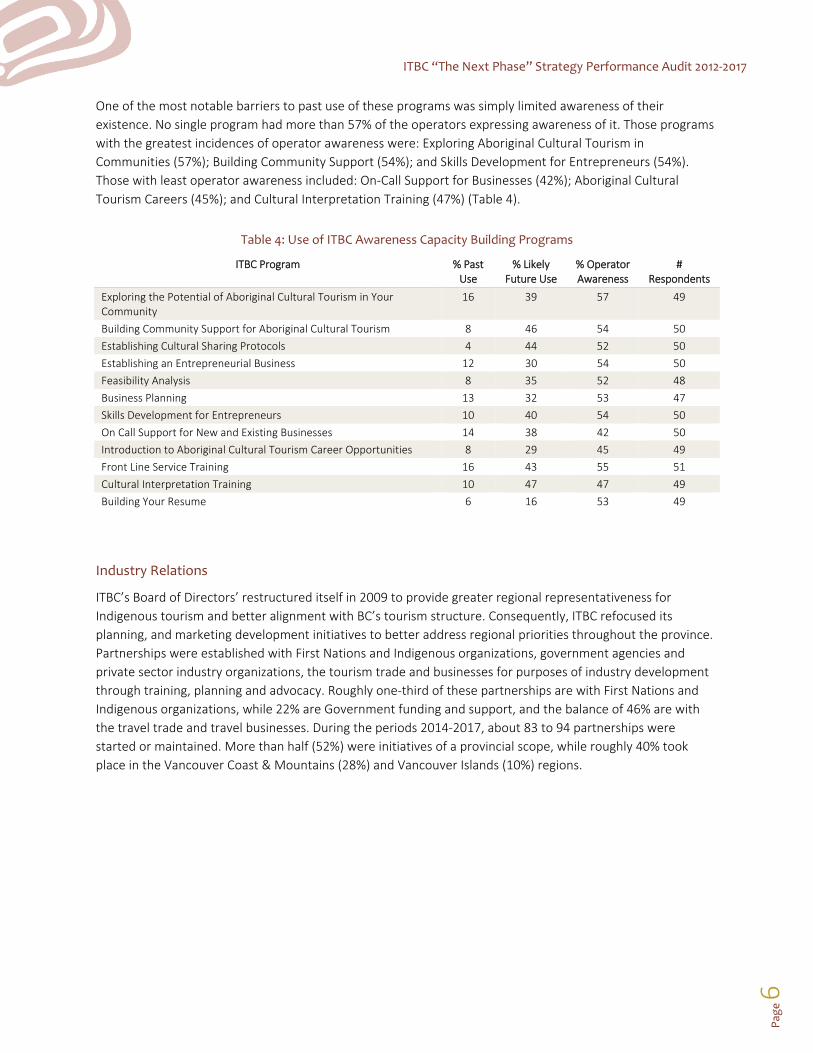
One of the most notable barriers to past use of these programs was simply limited awareness of their
existence. No single program had more than 57% of the operators expressing awareness of it. Those programs
with the greatest incidences of operator awareness were: Exploring Aboriginal Cultural Tourism in
Communities (57%); Building Community Support (54%); and Skills Development for Entrepreneurs (54%).
Those with least operator awareness included: On‐Call Support for Businesses (42%); Aboriginal Cultural
Tourism Careers (45%); and Cultural Interpretation Training (47%) (Table 4).
Table 4: Use of ITBC Awareness Capacity Building Programs
ITBC Program % Past Use
% Likely Future Use
% Operator Awareness
# Respondents
Exploring the Potential of Aboriginal Cultural Tourism in Your Community
16 39 57 49
Building Community Support for Aboriginal Cultural Tourism 8 46 54 50
Establishing Cultural Sharing Protocols 4 44 52 50
Establishing an Entrepreneurial Business 12 30 54 50
Feasibility Analysis 8 35 52 48
Business Planning 13 32 53 47
Skills Development for Entrepreneurs 10 40 54 50
On Call Support for New and Existing Businesses 14 38 42 50
Introduction to Aboriginal Cultural Tourism Career Opportunities 8 29 45 49
Front Line Service Training 16 43 55 51
Cultural Interpretation Training 10 47 47 49
Building Your Resume 6 16 53 49
Industry Relations
ITBC’s Board of Directors’ restructured itself in 2009 to provide greater regional representativeness for
Indigenous tourism and better alignment with BC’s tourism structure. Consequently, ITBC refocused its
planning, and marketing development initiatives to better address regional priorities throughout the province.
Partnerships were established with First Nations and Indigenous organizations, government agencies and
private sector industry organizations, the tourism trade and businesses for purposes of industry development
through training, planning and advocacy. Roughly one‐third of these partnerships are with First Nations and
Indigenous organizations, while 22% are Government funding and support, and the balance of 46% are with
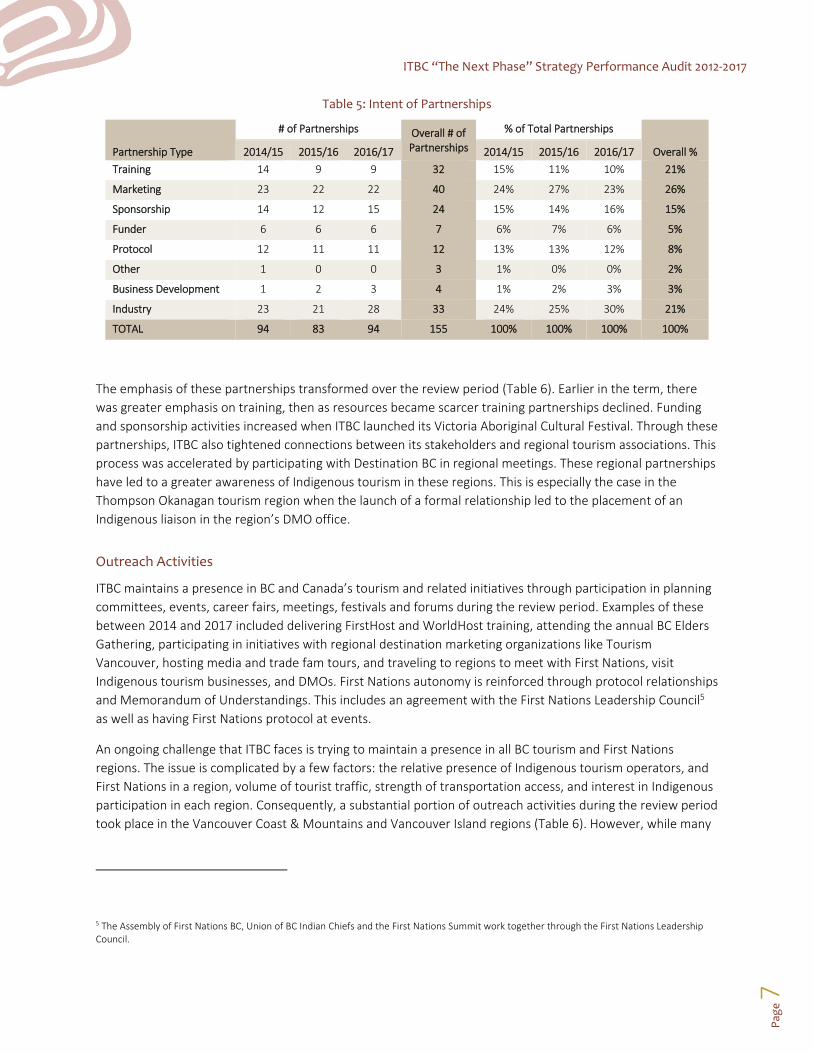
the travel trade and travel businesses. During the periods 2014‐2017, about 83 to 94 partnerships were
started or maintained. More than half (52%) were initiatives of a provincial scope, while roughly 40% took
place in the Vancouver Coast & Mountains (28%) and Vancouver Islands (10%) regions.
ITBC “The Next Phase” Strategy Performance Audit 2012‐2017
Pag
e 7
Table 5: Intent of Partnerships
Partnership Type
# of Partnerships Overall # of Partnerships
% of Total Partnerships
Overall % 2014/15 2015/16 2016/17 2014/15 2015/16 2016/17
Training 14 9 9 32 15% 11% 10% 21%
Marketing 23 22 22 40 24% 27% 23% 26%
Sponsorship 14 12 15 24 15% 14% 16% 15%
Funder 6 6 6 7 6% 7% 6% 5%
Protocol 12 11 11 12 13% 13% 12% 8%
Other 1 0 0 3 1% 0% 0% 2%
Business Development 1 2 3 4 1% 2% 3% 3%
Industry 23 21 28 33 24% 25% 30% 21%
TOTAL 94 83 94 155 100% 100% 100% 100%
The emphasis of these partnerships transformed over the review period (Table 6). Earlier in the term, there
was greater emphasis on training, then as resources became scarcer training partnerships declined. Funding
and sponsorship activities increased when ITBC launched its Victoria Aboriginal Cultural Festival. Through these
partnerships, ITBC also tightened connections between its stakeholders and regional tourism associations. This
process was accelerated by participating with Destination BC in regional meetings. These regional partnerships
have led to a greater awareness of Indigenous tourism in these regions. This is especially the case in the
Thompson Okanagan tourism region when the launch of a formal relationship led to the placement of an
Indigenous liaison in the region’s DMO office.
Outreach Activities
ITBC maintains a presence in BC and Canada’s tourism and related initiatives through participation in planning
committees, events, career fairs, meetings, festivals and forums during the review period. Examples of these
between 2014 and 2017 included delivering FirstHost and WorldHost training, attending the annual BC Elders
Gathering, participating in initiatives with regional destination marketing organizations like Tourism
Vancouver, hosting media and trade fam tours, and traveling to regions to meet with First Nations, visit
Indigenous tourism businesses, and DMOs. First Nations autonomy is reinforced through protocol relationships
and Memorandum of Understandings. This includes an agreement with the First Nations Leadership Council5
as well as having First Nations protocol at events.
An ongoing challenge that ITBC faces is trying to maintain a presence in all BC tourism and First Nations
regions. The issue is complicated by a few factors: the relative presence of Indigenous tourism operators, and
First Nations in a region, volume of tourist traffic, strength of transportation access, and interest in Indigenous
participation in each region. Consequently, a substantial portion of outreach activities during the review period
took place in the Vancouver Coast & Mountains and Vancouver Island regions (Table 6). However, while many
5 The Assembly of First Nations BC, Union of BC Indian Chiefs and the First Nations Summit work together through the First Nations Leadership Council.

ITBC “The Next Phase” Strategy Performance Audit 2012‐2017
Pag
e 8
of the outreach activities take place in the Vancouver and Victoria regions, many of them are provincial in
scope, thereby promoting the profile of Indigenous tourism in all regions.
Table 6: Outreach Activity by Tourism Region
Fiscal Year
# Outreach Activities
VCM Vancouver Coast &
Mountains
VI Vancouver Island
TO Thompson Okanagan
NBC Northern
BC
KR Kootenay Rockies
CCC Cariboo Chilcotin Coast
BC / Provincial Scope Other
2014/15 108 23% 14% 5% 12% 2% 5% 24% 15%
2015/16 119 25% 14% 4% 11% 2% 3% 33% 8%
2016/17 162 25% 11% 6% 9% 2% 2% 38% 7%
TOTAL 389 24% 13% 5% 10% 2% 3% 33% 10%
Partnerships
ITBC’s partnerships are primarily designed to enhance the product development and marketing capacities of
Indigenous tourism operators, First Nations and Indigenous people. These partnerships have evolved over time
with nearly 20% of them being over six to ten years old. Since 2014, relationships have been fostered through
ITBC’s Aboriginal Travel Services business that indirectly helps to increase awareness of and provide
connections with ITBC. There was a slight decline in partnership activity in 2015/16, this may be due in part to
the absence of a CEO and less financial and staffing resources for program and operations within ITBC.
Figure 3: Partner by Tourism Region 2017
Despite this situation, overall these partnerships are perceived to have contributed to: a greater awareness of
Indigenous tourism; increased inclusion of Indigenous tourism experiences in travel trade packages, stronger
regional and provincial coordination and inclusion in planning, as well as expanded Indigenous tourism
capacity building programs for existing and emerging Indigenous business operators and their employees. In
addition, partnerships with BC’s secondary and college/university institutions have played fundamental roles in
Vcr Coast & Mtns58%
Vcr Island20%
Thompson Ok4%
Northern BC12%
Kootenay Rockies1%
Cariboo Chilcotin Coast5%

ITBC “The Next Phase” Strategy Performance Audit 2012‐2017
Pag
e 9
increasing Indigenous participation in, and especially youth awareness of tourism career opportunities and
employment activities.
ITBC’s focus on regions launched in 2016, a pilot initiative and partnership with Thompson Okanagan Tourism
Association (TOTA) to strengthen and profile Indigenous tourism within that region. Central to this activity was
the placement of an Indigenous Tourism Specialist by ITBC in the TOTA office, and the development of an
Indigenous tourism strategy. This strategy was integrated into the TOTA tourism strategy, and influenced by
four roundtables attended by 128 participants, and the four Advisory Committees of 30 representatives
resulting from the roundtables. These roundtables and corresponding committees reflect the First Nations
that the TOTA region operates within. Since the launch of this partnership, TOTA has profiled First Nation
experiences in their consumer‐based website Route 97 (https://route97.net/things‐to‐do/first‐nations‐
experiences/), included First Nations content in their adventure guides in the region, visited and catalogued
Indigenous tourism ventures in the region of which 15 were confirmed as market‐ready.
Travel Trade Relations
ITBC recognizes the importance of preparing Indigenous tourism operators to work with the travel trade and
fostering those relationships. ITBC does this through participation at trade events which allows them to focus
on fostering relationships with the travel industry travel agents and other intermediaries, media and journalists
within Canada, and other key international destinations (United States, United Kingdom, Germany), as well as
emerging countries (China, Korea). During the study review period, ITBC attended 28 events, and engaged in
over 1000 meetings with travel trade, buyers, media representatives, and journalists in Canada, UK, United
States, and China (Table 7). These sessions generated ongoing and growing interest in Indigenous tourism
experiences in every provincial tourism region of BC.
Table 7: Travel Trade Events Attendance
Trade, Buyers Media, Journalists
Events Meetings Events Meetings
2013/14 3 100 1 35
2014/15 8 230 4 123
2015/16 5 275 2 70
2016/17 3 145 2 70
TOTAL 19 750 9 298
These meetings revealed that travel trade representatives were interested in carrying Indigenous cultural
tourism experiences in their portfolios. Their consumers were seeking opportunities for these specialized
experiences. Attendance at these and other travel trade events (such as receptions, conferences, committees
and meetings) also revealed ongoing and growing interest in Indigenous tourism. However, as priorities for the
use of resources shifted during the period 2016/17, ITBC’s ability to respond to travel trade inquiries, continue
to engage with them, market and promote Indigenous tourism operators, and provide product development
support to these operators was virtually stalled.
Overall, the industry’s awareness of Indigenous tourism operators and the ITBC organization itself has
transformed from general awareness to understanding of product offerings and their readiness. While there is
enthusiasm for Indigenous experiences, the travel trade is dissuaded from including them in their product
offerings – product pricing is too high, location of the experience is outside of their service region, the
ITBC “The Next Phase” Strategy Performance Audit 2012‐2017
Pag
e 10
experience sought is inflexible in its group size, fixed times, and the duration too long to fit in a package.
Further, the cultural programming may not be engaging or interactive enough for their consumer, with
language services on site being limited to English. An example of leading Indigenous cultural tourism
experiences cited was those offered by the New Zealand Maori.
Stakeholder Relations
As part of its on‐going stakeholder relations efforts, ITBC conducts annual Stakeholder Forums attracting
around 60 stakeholders (excluding ITBC) to each. Between 2014 and 2017, three annual forums were held
annually. Attendance typically included a mix of Indigenous tourism business operators, Indigenous economic
development officers, and destination marketing representatives, as well as industry and government
agencies. The gatherings were designed to keep ITBC constituents aware of its initiatives supporting
Indigenous tourism development. The forums also provided a venue for workshops, presentations and
discussion concerning emerging stakeholder issues shaping the growth of Indigenous tourism in this province.
These forums were held in conjunction with ITBC’s Annual General Meeting at which both events featured
annual progress reports.
ITBC also focused its efforts on regional development through ongoing engagements and special projects with
Destination BC, and intensifying its activities with the tourism regions.
In 2016/17, ITBC partnered with Destination BC in the Destination Development program. The program
involved developing long‐term strategic directions for 20 different planning areas discussion groups whose
ideas would be synthesized into six regional strategies, and ultimately the provincial plan for 2018.
Strategic Planning and Development
ITBC also engaged in a growing number of outreach initiatives supporting strategic planning and partnerships
related to Indigenous tourism development was instrumental in embedding Indigenous tourism in Canada’s
strategic tourism development and marketing programs (Destination Canada 2015, and BC Government 2015).
This led to the inclusion of BC‐based Indigenous tourism imagery and experiences in Destination BC’s planning
and promotional tools, as well as regional tourism organization literature and online marketing tools.
At a more regional level, ITBC played an integral role in helping shape emerging and potentially extensive
Indigenous tourism development initiatives in the Cariboo Chilcotin Coast which included the Coastal First
Nations / Great Bear Rainforest, and Thompson Okanagan regions. These planning programs were informed by
approaches to community engagement, product development (authenticity), market readiness, human
capacity building, and marketing, advocated by and nurtured by ITBC.
The Cariboo Chilcotin Coast Region Indigenous tourism strategy included representatives from 28 First
Nations communities. ITBC also participated in the Regional Sustainable Aboriginal Tourism
Implementation Framework Priority Opportunity Study which engaged seven First Nations.
The Thompson Okanagan Tourism Association partnered with ITBC to place an Indigenous Tourism
Specialist directly in the Thompson Okanagan offices in Kelowna to develop the region’s Indigenous
Tourism Strategy and assist with its implementation, as well as to raise the profile of Indigenous
tourism in the region.
Both projects are helping consolidate growing Indigenous community awareness of, and interest in, the use of
cultural tourism as an economic and socio‐cultural development agent in traditional First Nations’ territories.
ITBC “The Next Phase” Strategy Performance Audit 2012‐2017
Pag
e 11
Additionally, outreach initiatives by ITBC have led to an increased willingness from long‐standing BC regional
and municipal destination organizations to partner with Indigenous tourism operators.
1.3 TIER 3: Marketing
ITBC’s evolution is especially evident in the transformation of its marketing programs. In the early years,
marketing activities focused on establishing connections and building awareness with the travel trade. Typical
activities involved the creation of ‘lure’ advertisements in tourism and industry publications promoting
Indigenous tourism. Other activities included general media relations, producing print materials including a
provincial catalogue of Indigenous products, organizing fam tours, and attending industry and consumer
shows. From 2014 to 2017, marketing spending went to support continued improvements and maintenance of
online assets, events and activities that promoted Indigenous tourism by attending marketplaces and events,
direct communication with the travel trade and media, and preparation of marketing tools (e.g., digital press
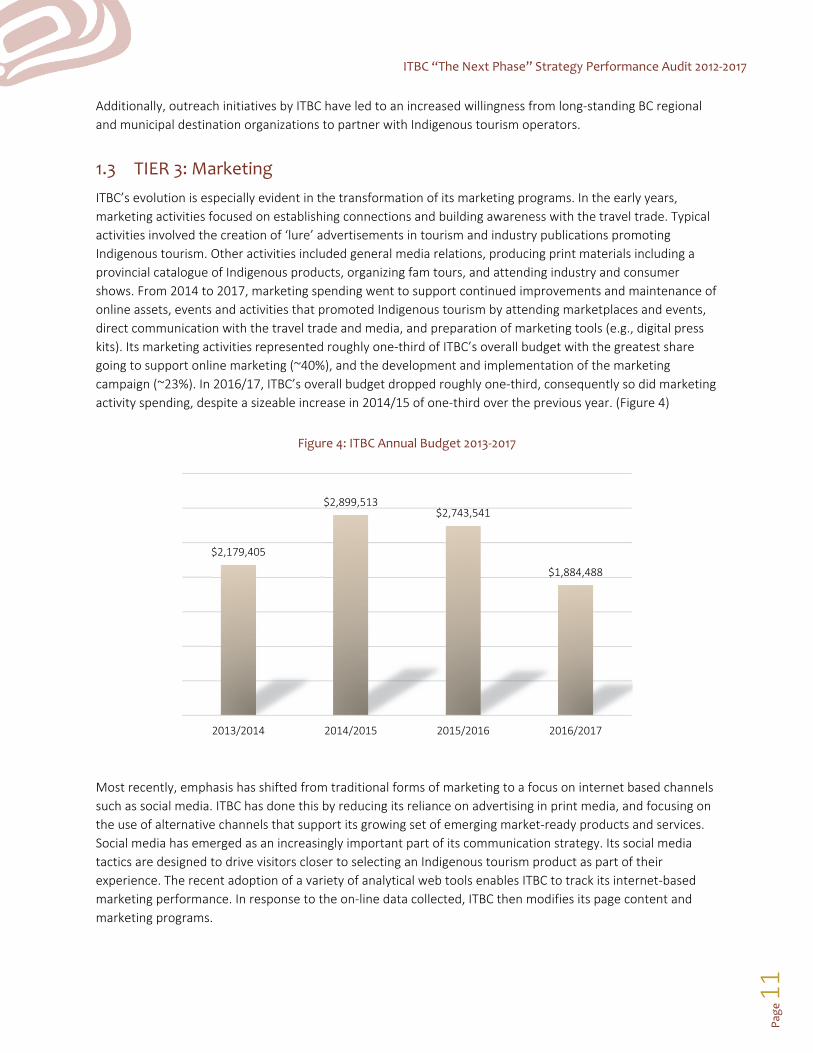
kits). Its marketing activities represented roughly one‐third of ITBC’s overall budget with the greatest share
going to support online marketing (~40%), and the development and implementation of the marketing
campaign (~23%). In 2016/17, ITBC’s overall budget dropped roughly one‐third, consequently so did marketing
activity spending, despite a sizeable increase in 2014/15 of one‐third over the previous year. (Figure 4)
Figure 4: ITBC Annual Budget 2013‐2017
Most recently, emphasis has shifted from traditional forms of marketing to a focus on internet based channels
such as social media. ITBC has done this by reducing its reliance on advertising in print media, and focusing on
the use of alternative channels that support its growing set of emerging market‐ready products and services.
Social media has emerged as an increasingly important part of its communication strategy. Its social media
tactics are designed to drive visitors closer to selecting an Indigenous tourism product as part of their
experience. The recent adoption of a variety of analytical web tools enables ITBC to track its internet‐based
marketing performance. In response to the on‐line data collected, ITBC then modifies its page content and
marketing programs.
$2,179,405
$2,899,513 $2,743,541
$1,884,488
2013/2014 2014/2015 2015/2016 2016/2017

ITBC “The Next Phase” Strategy Performance Audit 2012‐2017
Pag
e 12
Website and Other Social Media
With these relatively recent adaptations to significant increases in interaction with potential travelers has
occurred. Overall, website traffic generated approximated 104,800 consumer visitors in 2014/15. This
increased about 30% in 2016/17 to over 135,700. However, the number of visitors to the Corporate site
declined by ~25% during the same review period.
Typically, consumers spent 1:40‐1:55 minutes on the ITBC website, while Corporate site visitors stayed longer
for an average 2:15 minutes in 2014/15. However, Corporate use declined to 1:54 minutes in 2016/17.
Corporate visitors were less likely to ‘bounce’6 from the website than those visiting the Consumer website. The
largest share of users was from Canada (~78‐83%) and the United States (~7.5‐14%). Smaller proportions came
from the UK, Germany and Australia (~1% each). (Table 8) (Google Analytics 2014/15, 2015/16, 2016/17).
Table 8: ITBC Website – Consumer and Corporate
CONSUMER CORPORATE
2014/15 2015/16 2016/17 2014/15 2015/16 2016/17
Website Unique Visits 104,807 121,138 135,711 12,626 12,791 9,522
Website Page Views 327,502 375,592 424,354 53,203 51,965 39,210
Pages per Session 2.44 2.41 2.54 2.83 2.75 2.80
Bounce Rate 64.8% 63.9% 15.7% 56.3% 57.8% 14.8%
New Visitor 77.0% 76.9% 80.5% 64.1% 66.1% 66.0%
Returning Visitor 23.0% 23.1% 19.6% 35.9% 33.9% 34.0%
COUNTRY*
Canada 81.07% 83.07% 78.18% 85.67% 87.54% 88.50%
United States 7.46% 8.58% 13.93% 4.26% 3.90% 4.03%
United Kingdom 1.46% 1.28% 1.44% 0.79% 0.72% 0.81%
Germany 1.15% 1.02% 0.86% 0.65% 0.50% 0.70%
France 0.42% 0.37% 0.30% n/a 0.47% 0.20%
Australia 0.97% 0.77% 0.83% 1.27% 1.27% 0.90%
China 0.35% n/a 0.28% 0.28% n/a n/a
*Select Countries based on Top 10 Country Visitors
ITBC’s Facebook and Twitter presence also contributed to greater awareness of Indigenous tourism in BC and
throughout the review period.
Its Facebook followers grew from 18,271 in 2014/15 to 25,199 in 2016/17, an average of 17‐18% growth each
year. This generated over 7.3 million page impressions in 2014/15 from about 3.5 million users. However, use
6 Bounce Rate is an internet term that represents the percentage of visitors who enter the web site and then leave (‘bounce’) rather than continuing to view other pages within the same site. An excellent bounce rate is considered 26‐40%, average 41‐55%, higher than average 56‐70%, with anything above 70% considered a failure (except for blogs, news, events, etc.). SOURCE: www.gorocketfuel.com/the‐rocket.../whats‐the‐average‐bounce‐rate‐in‐google‐analytics/
ITBC “The Next Phase” Strategy Performance Audit 2012‐2017
Pag
e 13
declined by more than half in 2016/17 to 3.2 million page impressions, and the number of users dropped by
about one‐third to 2.2 million people. Facebook impressions7 were highest in summer months in 2014/15 and
2016/17 with the greatest increase occurring in June. However, females consistently represented nearly 70%
of the viewing audience. In particular, women between the ages of 35‐44 appeared to be the leading force
amongst ITBC Facebook fans (Table 9).
ITBC’s Twitter initiatives were more active than Facebook during the review period. Twitter Consumer
followers increased by ~62% (2,300) over the three years from around 3,700 in 2014/15 to 6,000 in 2016/17.
Also, during this same period:
Indigenous tourism twitters were mentioned over 1,000 times each year;
The number of tweets sent grew 290% from 522 to about 2,000;
Retweets grew by 398% (from 921 to 4,585); and
The number of Likes experienced the highest growth at 2845% (from 271 to 7,980).
Twitter Consumer followers were relatively equally represented ~50% during the 2014‐16 period. Most active
followers were men or women aged 35‐44 years. However, Corporate Twitter followers were predominantly
male (~55%) and largely between 35‐44 years old. Still, over the period the number of mentions (~‐66%),
tweets sent (~‐55%), and retweets (~‐24%) all declined. (Table 9) (Google Analytics 2014‐2017)
7 Impressions on Facebook refers to the number of times a post from your page is displayed, whether the post is clicked or not. People may see multiple impressions of the same post. For example, someone might see a page update in the News Feed once, and then a second time if a friend shares it.

ITBC “The Next Phase” Strategy Performance Audit 2012‐2017
Pag
e 14
Table 9: Social Media – Facebook and Twitter 2014/15 to 2016/17
2014/15 2015/16 2016/17 % Change 2014‐2016
% Change 2015‐2017
FACEBOOK (Consumer)
Followers 18,271 21,407 25,199 17% 18%
Impressions 7,272,180 3,196,114 3,208,062 ‐56% 0%
Users Reached 3,454,772 2,139,898 2,162,173 ‐38% 1%
Engagements 74,439 80,519 64,402 8% ‐20%
Consumer
Followers: Consumer 3,728 4,948 6,038 33% 22%
Tweets Sent 522 798 2,037 53% 155%
Mentions Received 1,142 1,145 1,087 0% ‐5%
Retweets 921 1,942 4,585 111% 136%
Likes 271 1,915 7,980 607% 317%
Impressions: per follower 390.0 135.2 242.8 ‐65% 80%
Impressions: per Tweet 2,785.5 838.3 719.6 ‐70% ‐14%
Corporate
Followers: Corporate 1,523 1,820 1,989 20% 9%
Tweets Sent 223 233 100 4% ‐57%
Mentions Received 201 122 68 ‐39% ‐44%
Retweets 166 238 126 43% ‐47%
Likes ‐ 143 160 100% 12%
Impressions: per follower 266.7 69.5 28.2 ‐74% ‐59%
Impressions: per Tweet 1,821.2 542.7 560.4 ‐70% 3%
Indigenous Tourism Operator Marketing Program
During 2014‐2017, use of ITBC marketing programs was much greater than that for general human resource
and product development capacity building initiatives. Highest use incidences were linked to ITBC’s online
marketing (49%), Fam Tour (38%), and Stakeholder Sessions (36%). In contrast, the least use was tied to
available Cultural Interpretation and Front Line Customer Service (6%) and Cultural Authenticity (10%)
programs (Appendix 2).
Interest in future use of ITBC’s programs was much stronger. At least 40% of the operators reported intent to
use these programs in the future. Support was greatest for initiatives associated with On‐line marketing (63%);
Media Relations (59%); and Indigenous Travel Service (57%) programming. (Appendix 2).
Awareness of ITBC’s marketing programs tended to be higher than that related to its broader capacity building
programs. All programs had at least 50% of the operators expressing awareness of them. Awareness was
highest with respect to ITBC’s on‐line and social media (80%), stakeholder session (68%), and Fam tour (65%)
activities. In contrast, it was lowest with respect to ITBC’s Aboriginal Cultural Authenticity (57%); Cultural
Interpretation and Customer Service Training (57%); and Aboriginal Arts (54%) programs. (Appendix 2).

ITBC “The Next Phase” Strategy Performance Audit 2012‐2017
Pag
e 15
Advertising
Advertising continues to be a component of ITBC’s marketing efforts, despite the increasing shift towards
other platforms like Facebook, Twitter, Pinterest, LinkedIn, and YouTube. ITBC continued to advertise in
Destination BC and regional publications. These advertisements were designed to drive viewers to online
resources, and ultimately to include Indigenous tourism experience in their plans. During the review period,
ITBC also placed advertisements in National Geographic and Forbes Asia. In more print‐based communications,
ITBC continued to maintain advertisement placements in regional tourism catalogues and magazines.
Media Relations
Ongoing engagement with the media earned coverage in 2015/16 in 319 publications resulting in 528 stories (print and online). This exposure was in New York Times, Huffington Post, Bloomberg, Reuters, Lonely Planet, Examiner, Forbes, Just Lux, Toronto Star, and Globe and Mail, in addition to news networks of CBC, CTV National, and Global. This coverage led to a total circulation of 220.6 million impressions, and an earned ad value of $1.086 million. (SOURCE: Aboriginal Tourism Association of BC Annual Media Coverage Report, April 1, 2015 to March 31, 2016) Data was not collected for the other periods in this review.
Print and Collateral Materials
ITBC continued to print collateral materials for distributed through Destination BC’s distribution network which
included BC’s visitor information centre (VIC) network and key visitor entrance gateways, like BC Ferries and
Vancouver Airport, and other inquiries (generated through its website and other marketing activities). In
2014/15, regional rack cards replaced this singular province‐wide publication. In 2015 and 2016, ITBC
produced from 22,000 guides that contained a regional map of market‐ready Indigenous tourism experiences
for distribution through the VIC network. In 2017, ITBC opted to not publish the catalogue so it could revamp
and update the literature. Over 95% of the guides are distributed directly to DBC’s visitor centres, and
consequently nearly all throughout BC (Table 10, Table 11). Over this two‐year period, the number of guides
distributed has declined from ~76% to 61%. During this same period, DBC began overhauling its Visitor
Information Centre program shifting it from a provincially operated centres to contributing to locally managed
visitor information programs, and commenced closing its major visitor information centres. ITBC also
distributed these guides while it attended travel trade marketplaces and events.
Table 10: Guide Distribution by Sector
Guide 2015 # Dist’d
% 2016 # Dist’d
% Diff %
Visitor Centres 16,320 97.86% 13,310 99.07% ‐3,010 ‐18.44%
General (Misc/one time shipments) 179 1.07% 74 0.55% ‐105 ‐58.66%
Tour Operators (World Wide) 50 0.30% ‐‐ ‐50 ‐100.00%
Educational Institutions 46 0.28% ‐‐ ‐46 ‐100.00%
Chambers of Commerce/Info Centres outside BC 30 0.18% ‐‐ ‐30 ‐100.00%
Conventions 25 0.15% ‐‐ ‐25 ‐100.00%
Automobile Associations 20 0.12% ‐‐ ‐20 ‐100.00%
Travel Agents 6 0.04% 1 0.01% ‐5 ‐83.33%
Provincial Government 1 0.01% ‐‐ ‐1 ‐100.00%
Tourism BC Office (all) ‐‐ 50 0.37% 50 100.00%
TOTAL… 16,677 100.00% 13,435 100.00% ‐3,242 ‐19.44%
ITBC “The Next Phase” Strategy Performance Audit 2012‐2017
Pag
e 16
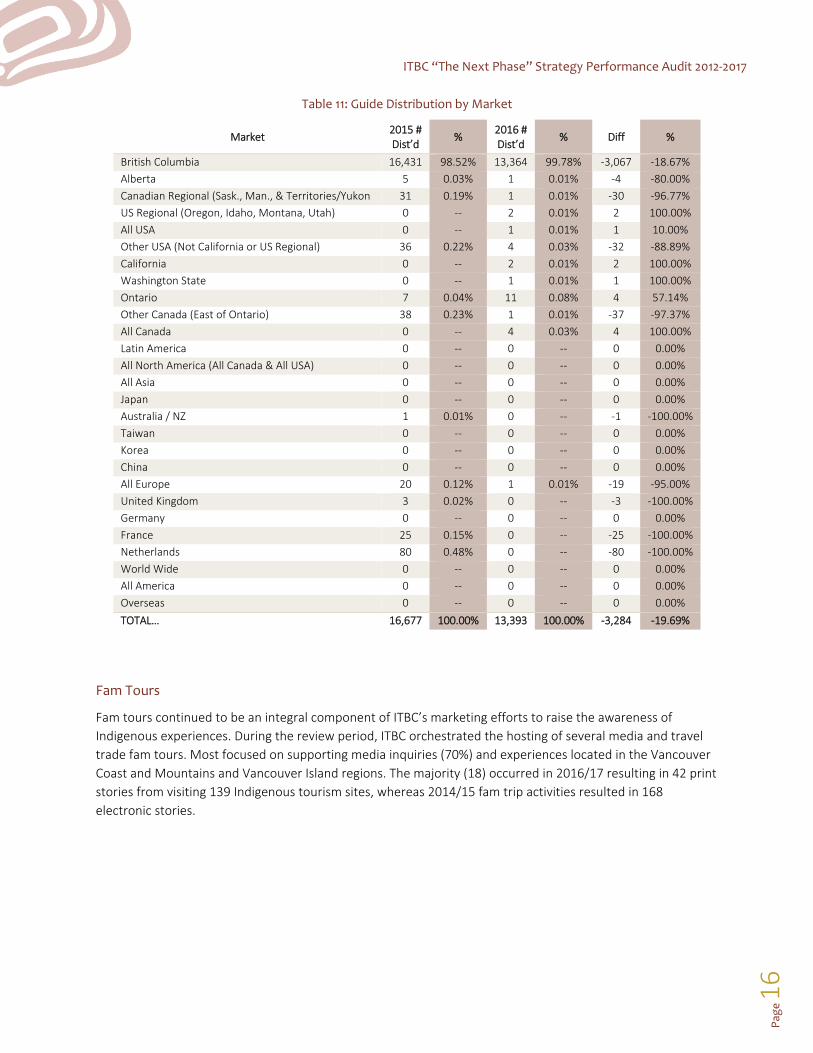
Table 11: Guide Distribution by Market
Market 2015 # Dist’d
% 2016 # Dist’d
% Diff %
British Columbia 16,431 98.52% 13,364 99.78% ‐3,067 ‐18.67%
Alberta 5 0.03% 1 0.01% ‐4 ‐80.00%
Canadian Regional (Sask., Man., & Territories/Yukon 31 0.19% 1 0.01% ‐30 ‐96.77%
US Regional (Oregon, Idaho, Montana, Utah) 0 ‐‐ 2 0.01% 2 100.00%
All USA 0 ‐‐ 1 0.01% 1 10.00%
Other USA (Not California or US Regional) 36 0.22% 4 0.03% ‐32 ‐88.89%
California 0 ‐‐ 2 0.01% 2 100.00%
Washington State 0 ‐‐ 1 0.01% 1 100.00%
Ontario 7 0.04% 11 0.08% 4 57.14%
Other Canada (East of Ontario) 38 0.23% 1 0.01% ‐37 ‐97.37%
All Canada 0 ‐‐ 4 0.03% 4 100.00%
Latin America 0 ‐‐ 0 ‐‐ 0 0.00%
All North America (All Canada & All USA) 0 ‐‐ 0 ‐‐ 0 0.00%
All Asia 0 ‐‐ 0 ‐‐ 0 0.00%
Japan 0 ‐‐ 0 ‐‐ 0 0.00%
Australia / NZ 1 0.01% 0 ‐‐ ‐1 ‐100.00%
Taiwan 0 ‐‐ 0 ‐‐ 0 0.00%
Korea 0 ‐‐ 0 ‐‐ 0 0.00%
China 0 ‐‐ 0 ‐‐ 0 0.00%
All Europe 20 0.12% 1 0.01% ‐19 ‐95.00%
United Kingdom 3 0.02% 0 ‐‐ ‐3 ‐100.00%
Germany 0 ‐‐ 0 ‐‐ 0 0.00%
France 25 0.15% 0 ‐‐ ‐25 ‐100.00%
Netherlands 80 0.48% 0 ‐‐ ‐80 ‐100.00%
World Wide 0 ‐‐ 0 ‐‐ 0 0.00%
All America 0 ‐‐ 0 ‐‐ 0 0.00%
Overseas 0 ‐‐ 0 ‐‐ 0 0.00%
TOTAL… 16,677 100.00% 13,393 100.00% ‐3,284 ‐19.69%
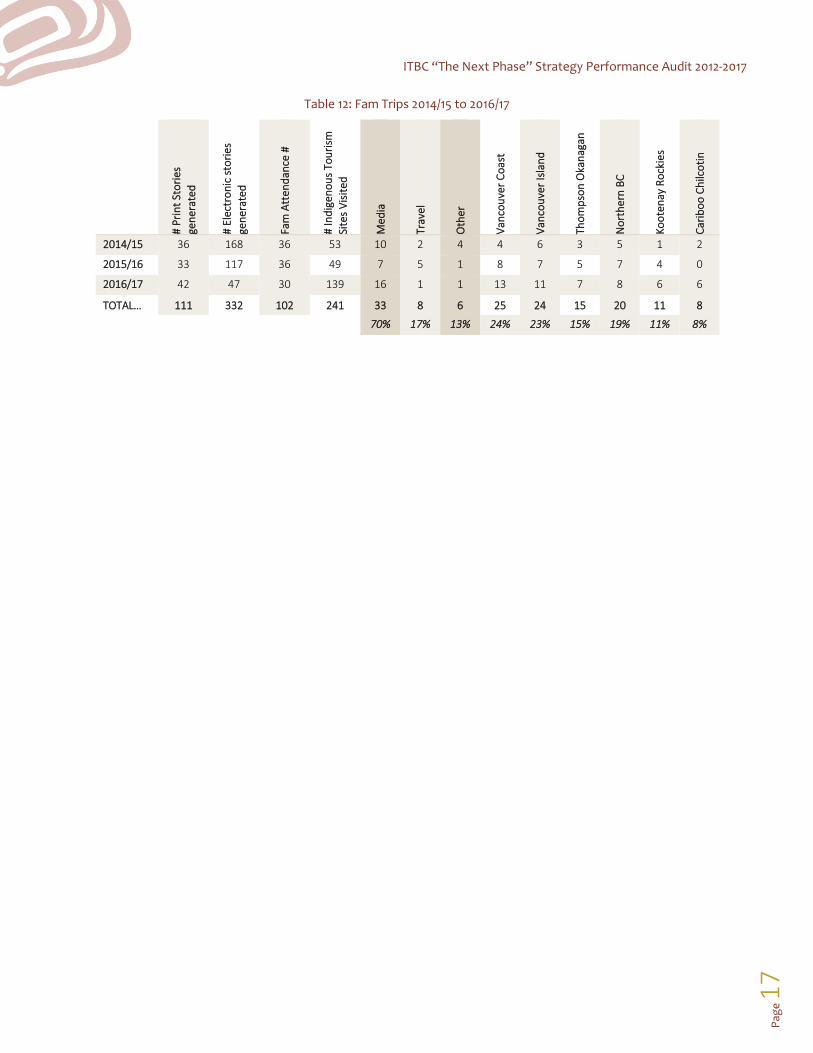
Fam Tours
Fam tours continued to be an integral component of ITBC’s marketing efforts to raise the awareness of
Indigenous experiences. During the review period, ITBC orchestrated the hosting of several media and travel
trade fam tours. Most focused on supporting media inquiries (70%) and experiences located in the Vancouver
Coast and Mountains and Vancouver Island regions. The majority (18) occurred in 2016/17 resulting in 42 print
stories from visiting 139 Indigenous tourism sites, whereas 2014/15 fam trip activities resulted in 168
electronic stories.
ITBC “The Next Phase” Strategy Performance Audit 2012‐2017
Pag
e 17
Table 12: Fam Trips 2014/15 to 2016/17
# Print Stories
generated
# Electronic stories
generated
Fam Atten
dan
ce #
# Indigen
ous To
urism
Sites Visited
Med
ia
Travel
Other
Van
couver Coast
Van
couver Island
Thompson Okanagan
Northern BC
Kootenay Rockies
Cariboo Chilcotin
2014/15 36 168 36 53 10 2 4 4 6 3 5 1 2
2015/16 33 117 36 49 7 5 1 8 7 5 7 4 0
2016/17 42 47 30 139 16 1 1 13 11 7 8 6 6
TOTAL… 111 332 102 241 33 8 6 25 24 15 20 11 8 70% 17% 13% 24% 23% 15% 19% 11% 8%
ITBC “The Next Phase” Strategy Performance Audit 2012‐2017
Pag
e 18
2 ECONOMIC PERFORMANCE
Indigenous cultural tourism is a strategically significant sector of BC’s tourism economy. Its development and
prosperity are important for not only Indigenous tourism operators and their communities, but also the
competitiveness BC’s broader tourism industry. It is a rapidly growing value‐added ingredient that enhances
this region’s overall attractiveness as a world‐class tourism destination. A critical sign of its importance is its
increasing incorporation into the policy, planning and marketing strategies of not only Indigenous
organizations, but also federal, provincial, regional and municipal DMOs especially in BC and increasingly
across Canada.
The following macro indicators of Indigenous cultural tourism performance between 2012 and 2017 are based
on data gathered from reviews and extrapolations of information reported in Federal and British Columbia
tourism reports, as well interviews conducted by the Audit Team. As such, the findings are shaped by the
amount and quality of the data available. Appendix 1 summarizes the approaches used to develop the
performance measures reported.
2.1 Indigenous Tourism Market Performance 2013‐2016
Indigenous tourism arrival estimates are based on the sector’s share of reported international and domestic
travellers visiting BC. The proportion of those visitors participating in Indigenous tourism is referred to as the
incidence level. Relatively current data (2014‐2016) suggest that Indigenous incidence levels in BC’s key travel
markets vary dramatically between countries. They range from as high as 46% for Mexico and India, to about
33% for German visitors, to approximately 9‐13% for domestic travellers from various regions of Canada. While
current information concerning specific incidence rates for Indigenous travellers in BC is sparse, it is
reasonable to assume that they approximate or exceed levels reported for Canada’s travel markets in general.
This is because of the relative prominence and accessibility of Indigenous tourism opportunities in BC
compared to many other regions of Canada. Table 13 provides a summary of weighted regional Indigenous
incidence rates associated with BC’s travel markets.

ITBC “The Next Phase” Strategy Performance Audit 2012‐2017
Pag
e 19
Table 13: Weighted Indigenous Tourism Incidence Rates by Market Region 2016*
Travel Market Regions Weighted Incidence Levels ‐2016^ (%)
Domestic 13
US 17
Asia Pacific 34
Europe 30
Other International 38
*Estimates derived from Destination Canada Global Tourism Watch Summary Market Report 2014‐2016 as well as Destination BC Short Haul Market Reports 2012‐2015.
International arrival statistics are based reported custom entries into BC. However, as such they fail to account
for international arrivals coming to BC from other Canadian entry points, or BC entries just passing through to
other Canadian destinations, nor same‐day visitors. Notwithstanding these issues, these data are considered
relatively reliable indicators of visitor demand for Canada’s Indigenous products and services. In this Audit
report, they provide the base visitor traffic volumes upon which Indigenous market shares are estimated.
Comparative Indigenous tourism arrival estimates are estimated for the period 2013‐2017. However, pre‐2013
estimates are not provided due to shifts in tallying procedures employed by Destination BC, which make valid
comparisons unreliable. As well, only approximations of domestic Indigenous travel arrivals are reported for
2016 and 2017, as domestic traffic data were not available at the time of this report’s preparation (November
25, 2017). Estimates of domestic arrivals for 2016 are based on the average ratio of international to domestic
arrivals existing from 2013‐2015. In line with Destination Canada and Destination BC summary reporting
procedures, data are summarized on a calendar year basis.
About 2.9 million overnight visitors experienced Indigenous tourism in BC in 2013. Approximately two‐thirds
(67%) of these visitors were domestic visitors. The largest share (49%) of international visitors came from the
United States (Table 14). By the end of 2016, total Indigenous tourism arrivals had risen to about 3.6 million
visitors. This represented an increase of about 27% over 2013 levels. Largest increases in market size were
associated with the Asia Pacific (+58%) and US markets (+32%) during this time (Table 14, Table 15). Again,
domestic travellers provided the greatest portion (67%) of these travellers, and US visitor comprised the
largest international share (17%) in 2016 (Table 14, Table 15).
Preliminary estimations suggest that overnight visitors experiencing Indigenous cultural tourism continued to
increase in 2017. Year to date arrivals data through August 2017 suggest that Indigenous visits were slightly
above those for the same period in 2016 (Appendix 1).

ITBC “The Next Phase” Strategy Performance Audit 2012‐2017
Pag
e 20
Table 14: Estimated Indigenous Tourism Arrivals (000s) 2013‐2016
Market BC* Arrivals (000s) 2013*
Indigenous Arrivals (000s)
2013***
BC Arrivals (000s) 2016*
Indigenous Arrivals (000s)
2016*
Indigenous Overnight Arrivals % Change
2013‐2016
US 2,741 466 3,621 616 32
Asia Pacific 760 258.4 1,201 408 58
Europe 573 171.9 536 160.8 ‐6
Other International 138 52.44 175 66.5 27
Total International 4,350 949 5,533 1,251 32
Domestic 14,683 1,909 18,204 2,366 24
Total BC Arrivals 19,033 2,858 23,737 3,618 27
*Customized Domestic and International data (2014 to 2015) provided by Destination BC, 2017. **2016 International estimates based on Destination BC data. Estimated domestic arrival data for 2066 based on average
ratio of domestic to international arrival data 2013‐2015. ***Based on Indigenous incidence rates of: US (17%); Asia Pacific (34%) and Europe 30%); Other international (38%), and
domestic (13%).
Table 15: Estimated Indigenous Tourism Market Share 2016
Market Market Share 2016 (%)
US 17
Asia Pacific 11
Europe 4
Other International 2
Total International 34
Domestic 66
Total BC Arrivals 100
2.2 Indigenous Tourism Economic Contributions
Prior to this Audit report, the most recent estimates of Indigenous cultural tourism economic impact in BC
were published by the Aboriginal Tourism Association of Canada8 (ATAC) in 2015, and were informed by data
collected for the period 2010‐2014. A combination of existing Statistics Canada, BC Stats and BC Tourism data
as well as other primary Indigenous stakeholder tourism information collected in 2014 helped calibrate the
standard provincial input‐output modeling procedures and performance indicators employed. Little change
has occurred in either the modeling procedures or performance indicators employed at that time.
Consequently, this Audit report extrapolates directly from the 2014 base estimates to approximate Indigenous
economic impacts for the calendar year end 20169.
Based on survey data collected from Indigenous tourism operators in a 2017 (Table 16) it is reasonable to
assume that the sector’s economic performance has grown since 2014. For instance, almost all (98%) of the
8 ATAC changed its name to the Indigenous Tourism Association of Canada ITAC.
9 Economic data is collected and reported for monthly and/or calendar years, while most of ITBC’s data is based on fiscal year ends from April 1 to March 31.

ITBC “The Next Phase” Strategy Performance Audit 2012‐2017
Pag
e 21
reporting Indigenous tourism operators participating in a 2017 on‐line business survey indicated that their
tourism operations had either remained the same or grown over the past three years. More than half of the
operators reported that these enterprises had increased somewhat or a lot with respect to marketing
effectiveness (63%), market competitiveness (61%), annual days of operation (43%), and number of people
employed (49%) (Table 16). In addition, 2016 estimates suggest that Indigenous tourism arrivals (+27%) and
existing Indigenous businesses providing goods and services directly to tourists (+33%) confirm that significant
growth occurred since 2014. A reasonable approximation suggests that this overall growth is in the 30% range.
Table 16: Indigenous Tourism Operator Perceptions of Economic Growth
Performance Indicator Stayed the Same
(%) Increased
Somewhat (%) Increased A Lot
(%)
Number of annual days of operation 55 27 16
Total number of people you employ 45 33 16
Market competitiveness of your tourism business
35 45 16
Effectiveness of your marketing programs 25 49 14
SOURCE: Indigenous Tourism Operator Survey 2017, Appendix 2
Table 17 details this increase in terms of standardized provincial economic performance indicators. The table
estimates direct, as well as more pervasive ‘direct, indirect and induced’ economic contributions created by
Indigenous tourism for 2016. Direct impact measures the primary industrial output (e.g., goods and services)
and labour force used by Indigenous tourism businesses to meet existing tourism demand. Indirect impact
measures the intermediate industrial output (e.g., goods and services) and labour force employed by other
economic sectors to help meet the supply needs of Indigenous tourism operators servicing market demand.
Induced impacts estimate the extent of output and employment created over all sectors of the economy as a
result direct and indirect household income changes brought on Indigenous tourism business activity.
Indicators of Indigenous tourism’s economic performance include Jobs, Gross 0utput, Value‐added, Wages and
Salaries, and Tax Revenues. A summary interpretation of each of the economic performance indicators and
estimates of economic impact is provided in Table 17 and in the following remarks of this section.
Businesses: About 401 Indigenous cultural tourism businesses operated in BC in 2017. This represented a 33%
increase over establishments identified as being in operation in 2014.
Jobs: Jobs are reported as full‐time equivalent (FTE) positions. Existing businesses generated about
5,585 full time equivalent jobs in 2014. Indigenous personnel filled about 48% of those positions in
2016. The number of direct full‐time equivalent positions was 7,428. Overall, about 11,000 FTEs of
direct, indirect and induced employment existed in 2017.
Gross Output: refers to the total value of production used by Indigenous tourism businesses to meet
existing consumer market demand. In 2017, direct Indigenous output approximated $705 million.
Overall direct, indirect and induced output approximated $1.3 billion.
Value Added: refers to the amount of Gross Domestic Product realized by Indigenous tourism business
activity. In 2017, direct ‘value added’ approximated $381 million. Overall, direct, indirect and induced
value added approximated $970 million.
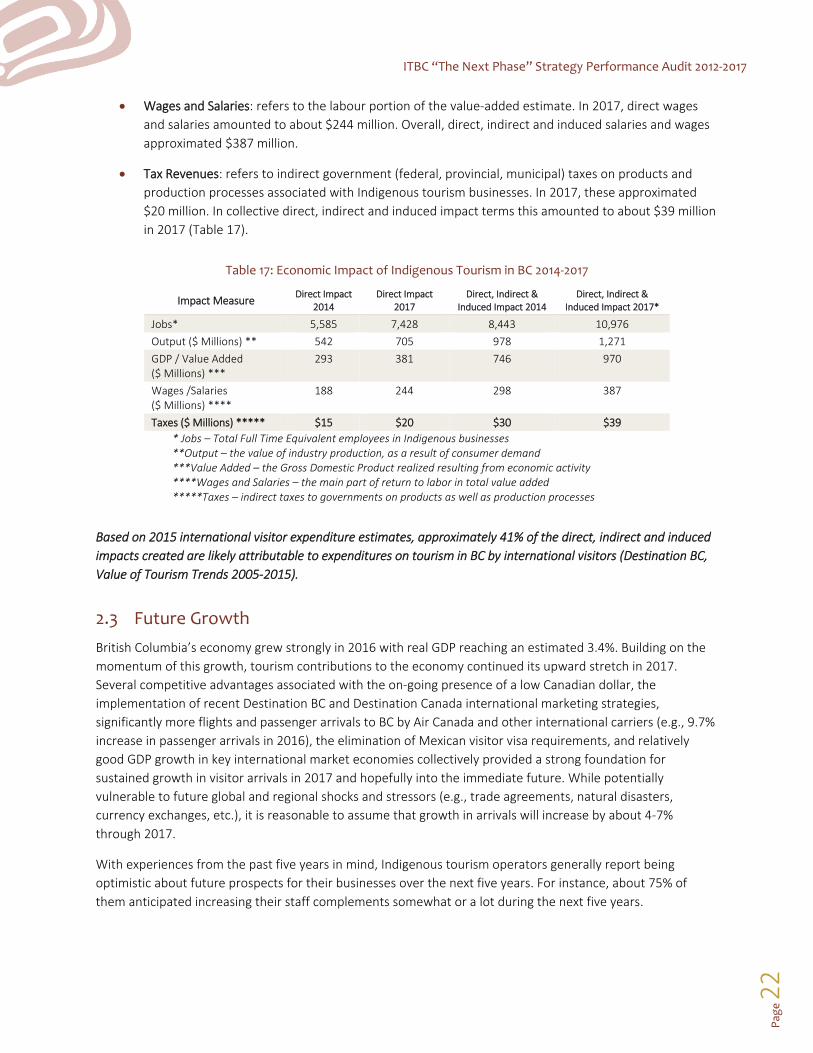
ITBC “The Next Phase” Strategy Performance Audit 2012‐2017
Pag
e 22
Wages and Salaries: refers to the labour portion of the value‐added estimate. In 2017, direct wages
and salaries amounted to about $244 million. Overall, direct, indirect and induced salaries and wages
approximated $387 million.
Tax Revenues: refers to indirect government (federal, provincial, municipal) taxes on products and
production processes associated with Indigenous tourism businesses. In 2017, these approximated
$20 million. In collective direct, indirect and induced impact terms this amounted to about $39 million
in 2017 (Table 17).
Table 17: Economic Impact of Indigenous Tourism in BC 2014‐2017
Impact Measure Direct Impact
2014 Direct Impact
2017 Direct, Indirect &
Induced Impact 2014 Direct, Indirect &
Induced Impact 2017*
Jobs* 5,585 7,428 8,443 10,976
Output ($ Millions) ** 542 705 978 1,271
GDP / Value Added ($ Millions) ***
293 381 746 970
Wages /Salaries ($ Millions) ****
188 244 298 387
Taxes ($ Millions) ***** $15 $20 $30 $39
* Jobs – Total Full Time Equivalent employees in Indigenous businesses **Output – the value of industry production, as a result of consumer demand ***Value Added – the Gross Domestic Product realized resulting from economic activity ****Wages and Salaries – the main part of return to labor in total value added *****Taxes – indirect taxes to governments on products as well as production processes
Based on 2015 international visitor expenditure estimates, approximately 41% of the direct, indirect and induced
impacts created are likely attributable to expenditures on tourism in BC by international visitors (Destination BC,
Value of Tourism Trends 2005‐2015).
2.3 Future Growth
British Columbia’s economy grew strongly in 2016 with real GDP reaching an estimated 3.4%. Building on the
momentum of this growth, tourism contributions to the economy continued its upward stretch in 2017.
Several competitive advantages associated with the on‐going presence of a low Canadian dollar, the
implementation of recent Destination BC and Destination Canada international marketing strategies,
significantly more flights and passenger arrivals to BC by Air Canada and other international carriers (e.g., 9.7%
increase in passenger arrivals in 2016), the elimination of Mexican visitor visa requirements, and relatively
good GDP growth in key international market economies collectively provided a strong foundation for
sustained growth in visitor arrivals in 2017 and hopefully into the immediate future. While potentially
vulnerable to future global and regional shocks and stressors (e.g., trade agreements, natural disasters,
currency exchanges, etc.), it is reasonable to assume that growth in arrivals will increase by about 4‐7%
through 2017.
With experiences from the past five years in mind, Indigenous tourism operators generally report being
optimistic about future prospects for their businesses over the next five years. For instance, about 75% of
them anticipated increasing their staff complements somewhat or a lot during the next five years.
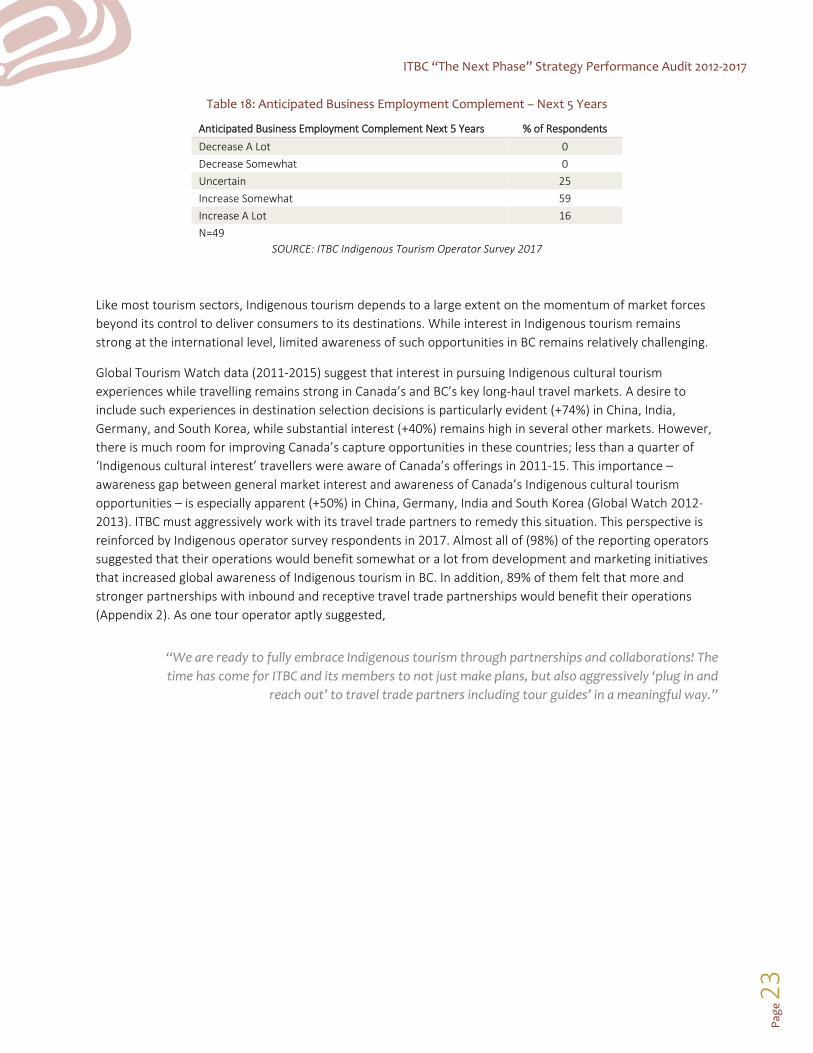
ITBC “The Next Phase” Strategy Performance Audit 2012‐2017
Pag
e 23
Table 18: Anticipated Business Employment Complement – Next 5 Years
Anticipated Business Employment Complement Next 5 Years % of Respondents
Decrease A Lot 0
Decrease Somewhat 0
Uncertain 25
Increase Somewhat 59
Increase A Lot 16
N=49
SOURCE: ITBC Indigenous Tourism Operator Survey 2017
Like most tourism sectors, Indigenous tourism depends to a large extent on the momentum of market forces
beyond its control to deliver consumers to its destinations. While interest in Indigenous tourism remains
strong at the international level, limited awareness of such opportunities in BC remains relatively challenging.
Global Tourism Watch data (2011‐2015) suggest that interest in pursuing Indigenous cultural tourism
experiences while travelling remains strong in Canada’s and BC’s key long‐haul travel markets. A desire to
include such experiences in destination selection decisions is particularly evident (+74%) in China, India,
Germany, and South Korea, while substantial interest (+40%) remains high in several other markets. However,
there is much room for improving Canada’s capture opportunities in these countries; less than a quarter of
‘Indigenous cultural interest’ travellers were aware of Canada’s offerings in 2011‐15. This importance –
awareness gap between general market interest and awareness of Canada’s Indigenous cultural tourism
opportunities – is especially apparent (+50%) in China, Germany, India and South Korea (Global Watch 2012‐
2013). ITBC must aggressively work with its travel trade partners to remedy this situation. This perspective is
reinforced by Indigenous operator survey respondents in 2017. Almost all of (98%) of the reporting operators
suggested that their operations would benefit somewhat or a lot from development and marketing initiatives
that increased global awareness of Indigenous tourism in BC. In addition, 89% of them felt that more and
stronger partnerships with inbound and receptive travel trade partnerships would benefit their operations
(Appendix 2). As one tour operator aptly suggested,
“We are ready to fully embrace Indigenous tourism through partnerships and collaborations! The
time has come for ITBC and its members to not just make plans, but also aggressively ‘plug in and
reach out’ to travel trade partners including tour guides’ in a meaningful way.”
ITBC “The Next Phase” Strategy Performance Audit 2012‐2017
Pag
e 24
APPENDIX 1: Summary of Report Performance Indicators
The following are the definitions, and the methods for calculating the estimates and forecasts and corresponding sources provided throughout this report.
INCIDENCE LEVELS
% share of travellers and/or their travel party visiting a First Nation attraction or event while on their BC trip.
SOURCES: Destination Canada, Global Tourism Watch Survey 2012‐2015. Destination BC, Domestic Travel
Estimates 2013‐2015. Destination BC Short Haul Study, 2014; Aboriginal Experience Secondary
Research Review, Destination BC 2017). Global Tourism Watch, 2012.
CALCULATION: Market specific incidence rates.
ASSUMPTION: Incidence rates identified are representative of general patterns of behavior in not only for
Canada, but also BC.
INDIGENOUS TOURIST VISITS
# of overnight travellers visiting Indigenous attractions / events as part of their BC trip.
SOURCES: Destination BC overall visitor estimates, 2011‐2016, and BC Stats, Destination Canada
International arrival data, 2015‐17.
CALCULATION: Overall Overnight Tourism Visit estimates (000’s) X estimated weighted average Indigenous
incidence rates by domestic, US, and international regions.
ASSUMPTIONS: Incidence rates are reasonable estimates of 2013‐2017 Performance.

ITBC “The Next Phase” Strategy Performance Audit 2012‐2017
Pag
e 25
Table 19: Indigenous Tourism Arrival Estimates 2013‐2017
Market
BC Over‐night Arrivals (000s) 2013
Indigenous Arrivals (000s) 2013
BC Over‐night Arrivals (000s) 2014
Indigenous Arrivals (000s) 2014
BC Over‐night Arrivals (000s) 2015
Indigenous Arrivals (000s) 2015
BC Over‐night Arrivals (000s) 2016
Indigenous Arrivals (000s)
2016
BC Over‐night Arrivals (000s) YTD
August 2017
YTD Indigenous Arrivals (000s) August
2017
US 2,741 466 2,840 483 3,091 525 3,621 616 2,663 453
Asia Pacific 760 258.4 851 289.34 816 277.44 1,201 408 ‐‐ ‐‐
Europe 573 171.9 580 174 609 182.7 536 160.8 ‐‐ ‐‐
Other International
138 52.44 119 45.22 113 42.94 175 66.5 1455 494.7
Total International
4,350 949 4,390 991 4,629 1,029 5,533 1,251 4,118 947
Domestic 14,683 1,909 14,223 1,849 15,067 1,959 18,204 2,366 13,548 1,761
Overall 19,033 2,858 18,613 2,840 19,696 2,987 23,737 3,618 17,666 2,709
TOURISM BUSINESSES
Operating Indigenous cultural tourism attractions, events, food and beverage, accommodation, tour
operations, and other related establishments.
SOURCES: ITBC Business Survey, 2012 and 2017, Website searches, ITBC directories.
ASSUMPTIONS: The 2014‐2017 ITBC Business Operator Surveys captured data from a representative cross
section of operating businesses.
INDIGENOUS TOURISM ECONOMIC IMPACT MEASURES: All economic estimates are based on data analyzed
and reported in National Aboriginal Secondary Research Review: Economic Impact of Aboriginal
Tourism in Canada, Aboriginal Tourism Association of Canada, 2015.
MULTIPLIER EFFECTS
“When a tourist spends on a tourism commodity, that amount of expenditure creates a direct requirement for
the production of the tourism commodity. The impact does not end there though. The increased production of
this commodity leads to increased production of all the intermediate goods that are used to make this tourism
commodity, and the increased production of intermediate goods will in turn generate more demand for other
goods and services that are used to produce these intermediate goods. As such, an initial demand for a
commodity creates a chain effect down the production process.” This economic model concept and other
related economic impact indicator interpretations are incorporated into the Aboriginal Tourism Association of
Canada, commissioned report: National Aboriginal Tourism Research Report: Economic Impact of Aboriginal
Tourism in Canada, 2015.
ITBC “The Next Phase” Strategy Performance Audit 2012‐2017
Pag
e 26
APPENDIX 2: Indigenous Tourism Operator Business Performance and Characteristics
The following section offers insights into the performance characteristics and perceived prospects for Indigenous tourism operations as reported by a self‐selected sample of 61 operators responding to an on‐line survey conducted in February and March 2017.
Respondents included those from ITBC member and non‐member businesses that were at least 51% owned by
Indigenous or Métis stakeholders. Of these businesses, about 87% were fully owned by these operators.
Overall, these operations comprised about 17.5% of the estimated 401 Indigenous tourism businesses existing
in British Columbia during 2017. While the responses are only truly representative of those companies
participating in the survey, the reporting businesses are from a sufficiently broad range of business types and
geographic jurisdictions to likely approximate the character of many other Indigenous tourism enterprises
across the province. Nonetheless, caution should be used in extending the representativeness of the
responses beyond the immediate sample of respondents.
Operating Characteristics
While some of these businesses (~13%) operated in more than one part of the province, the largest share of
these ventures was situated in either the Vancouver Coast Mountains (~26%) or Vancouver Island (25%)
tourist regions. Reporting interior businesses were largely in the Cariboo Chilcotin Coast (~15%), Thompson
Okanagan (~15%), or Northern BC tourism regions of the province. Only 4% of the reported businesses were
situated in the Kootenays Rockies jurisdiction. This differs from the overall number / percentage of businesses
where 26% of businesses are located in Northern BC. The businesses that responded to the survey were nearly
the same number of the paid ITBC stakeholders in that tourism region.
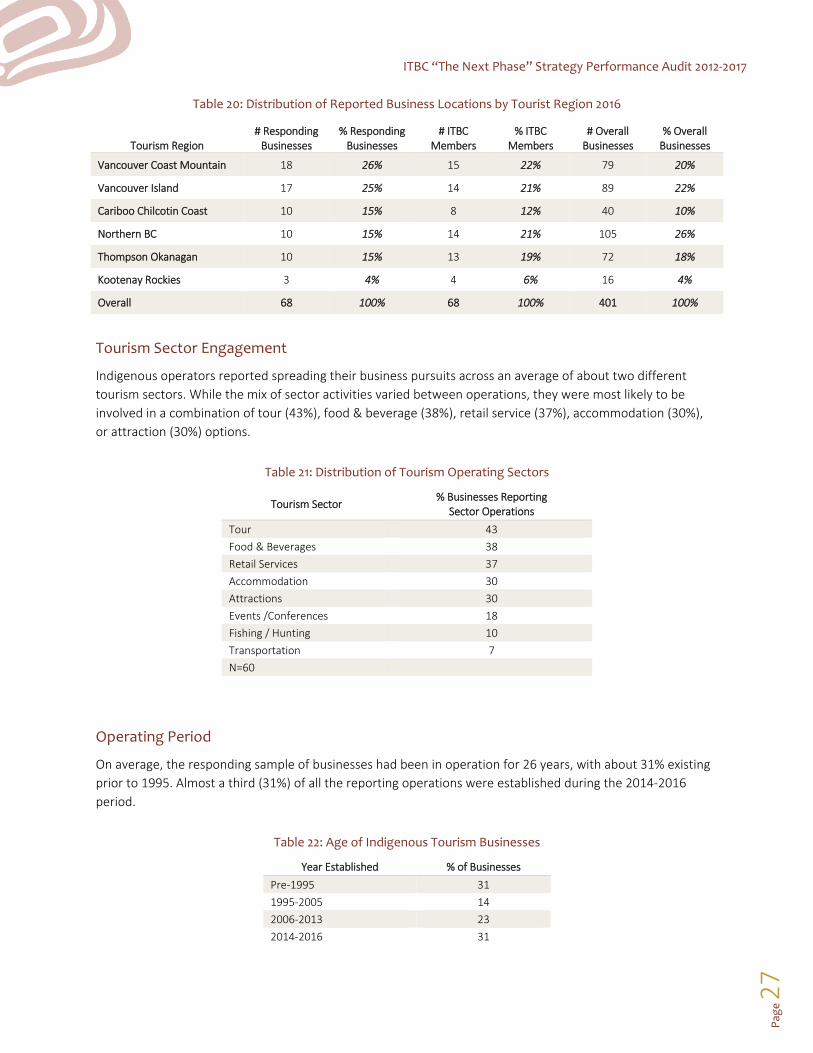
ITBC “The Next Phase” Strategy Performance Audit 2012‐2017
Pag
e 27
Table 20: Distribution of Reported Business Locations by Tourist Region 2016
Tourism Region # Responding Businesses
% Responding Businesses
# ITBC Members
% ITBC Members
# Overall Businesses
% Overall Businesses
Vancouver Coast Mountain 18 26% 15 22% 79 20%
Vancouver Island 17 25% 14 21% 89 22%
Cariboo Chilcotin Coast 10 15% 8 12% 40 10%
Northern BC 10 15% 14 21% 105 26%
Thompson Okanagan 10 15% 13 19% 72 18%
Kootenay Rockies 3 4% 4 6% 16 4%
Overall 68 100% 68 100% 401 100%
Tourism Sector Engagement
Indigenous operators reported spreading their business pursuits across an average of about two different
tourism sectors. While the mix of sector activities varied between operations, they were most likely to be
involved in a combination of tour (43%), food & beverage (38%), retail service (37%), accommodation (30%),
or attraction (30%) options.
Table 21: Distribution of Tourism Operating Sectors
Tourism Sector % Businesses Reporting
Sector Operations
Tour 43
Food & Beverages 38
Retail Services 37
Accommodation 30
Attractions 30
Events /Conferences 18
Fishing / Hunting 10
Transportation 7
N=60
Operating Period
On average, the responding sample of businesses had been in operation for 26 years, with about 31% existing
prior to 1995. Almost a third (31%) of all the reporting operations were established during the 2014‐2016
period.
Table 22: Age of Indigenous Tourism Businesses
Year Established % of Businesses
Pre‐1995 31
1995‐2005 14
2006‐2013 23
2014‐2016 31

ITBC “The Next Phase” Strategy Performance Audit 2012‐2017
Pag
e 28
Overall, about 66% of the businesses operated year‐round. Amongst the remaining enterprises, few (<10%)
were open for business during the winter season extending from November to March winter season.
Capacity Building Programs
Nurturing the capacity of Indigenous tourism businesses to develop and deliver market‐ready products and
services has been an important part of ITBC’s ongoing mandate. Programming efforts to meet this goal have
included the development, promotion and delivery of a range of Indigenous training materials for current and
potential Indigenous employers and employees. The following section explores Indigenous tourism operator
perspectives concerning their company’s use of ITBC’s existing set of 12 capacity building programs.
Past and future use of the capacity building programs was limited in the review period. Only 2 of the 12
available programs examined had been previously used by more than 15% of the operators. They were: Front
Line Service Training (~16%); and Exploring the Potential of Aboriginal Cultural Tourism in Your Community
(~16%). Most of the other available capacity building programs had between 10‐15% incidence levels amongst
these respondents.
In contrast to actual use levels, a much larger share of the operators expressed interest in employing some of
these programs in the future. Those most likely to be used included: Cultural Interpretation Training (47%);
and Building Community Support for Aboriginal Cultural Tourism (46%).
Those least likely to be pursued were: Building A Resume (16%); Cultural Tourism Career Opportunities (29%);
and Establishing and Entrepreneurial Business (30%).
One of the most notable barriers to past use of these programs was simply limited awareness of their
existence. No single program had more than 57% of the operators expressing awareness of its existence.
Those programs with the greatest incidences of operator awareness were: Exploring Aboriginal Cultural
Tourism in Communities (57%); Building Community Support (54%); and Skills Development for Entrepreneurs
(54%). Those with least operator awareness included: On‐Call Support for Businesses (42%); Aboriginal Cultural
Tourism Careers (45%); and Cultural Interpretation Training (47%).

ITBC “The Next Phase” Strategy Performance Audit 2012‐2017
Pag
e 29
Table 23: Awareness and Use of Indigenous Tourism Capacity Development Programs
Community and Business Startup Capacity Development
% Past Use
% Likely Future Use
% Operator Awareness
# Respondents
Exploring the Potential of Aboriginal Cultural Tourism in Your Community
16 39 57 49
Building Community Support for Aboriginal Cultural Tourism
8 46 54 50
Establishing Cultural Sharing Protocols 4 44 52 50
Establishing an Entrepreneurial Business 12 30 54 50
Feasibility Analysis 8 35 52 48
Business Planning 13 32 53 47
Skills Development for Entrepreneurs 10 40 54 50
On Call Support for New and Existing Businesses 14 38 42 50
Introduction to Aboriginal Cultural Tourism Career Opportunities
8 29 45 49
Front Line Service Training 16 43 55 51
Cultural Interpretation Training 10 47 47 49
Building Your Resume 6 16 53 49
Marketing Program Use
Past use of ITBC marketing programs was much greater than that for general human resource and product
development capacity building initiatives. Highest use incidences of use were linked to ITBC’s online marketing
(49%), Fam Tour (38%), and Stakeholder Sessions (36%). In contrast, the least past use was tied to available
Cultural Interpretation and Front Line Customer Service (6%) and Cultural Authenticity (10%) programs.
Interest in future use of ITBC’s programs was relatively strong. At least 40% of the operators reported an
intent to use these programs in the future. Support was greatest for initiatives associated with On‐line
marketing (63%); Media Relations (59%); .and Aboriginal Travel Service (57%) programming.
Awareness of ITBC’s marketing programs tended to be higher than that related to its broader capacity building
programs. All programs had at least 50% of the operators expressing awareness of them. Awareness was
highest with respect to ITBC’s On‐line and social media (80%), stakeholder session (68%), and Fam tour (65%)
activities. In contrast, it was lowest with respect to ITBC’s Aboriginal Cultural Authenticity (57%); Cultural
Interpretation and Customer Service Training (57%); as well as Aboriginal Arts (54%) programs.
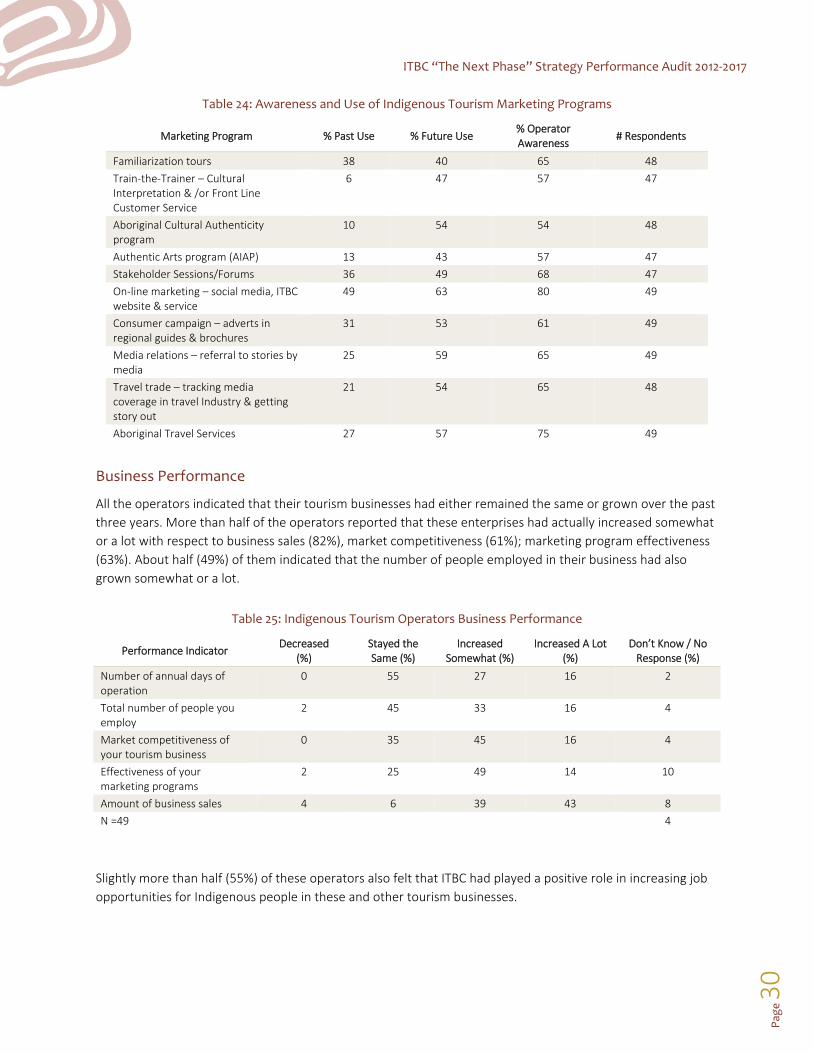
ITBC “The Next Phase” Strategy Performance Audit 2012‐2017
Pag
e 30
Table 24: Awareness and Use of Indigenous Tourism Marketing Programs
Marketing Program % Past Use % Future Use % Operator Awareness
# Respondents
Familiarization tours 38 40 65 48
Train‐the‐Trainer – Cultural Interpretation & /or Front Line Customer Service
6 47 57 47
Aboriginal Cultural Authenticity program
10 54 54 48
Authentic Arts program (AIAP) 13 43 57 47
Stakeholder Sessions/Forums 36 49 68 47
On‐line marketing – social media, ITBC website & service
49 63 80 49
Consumer campaign – adverts in regional guides & brochures
31 53 61 49
Media relations – referral to stories by media
25 59 65 49
Travel trade – tracking media coverage in travel Industry & getting story out
21 54 65 48
Aboriginal Travel Services 27 57 75 49
Business Performance
All the operators indicated that their tourism businesses had either remained the same or grown over the past
three years. More than half of the operators reported that these enterprises had actually increased somewhat
or a lot with respect to business sales (82%), market competitiveness (61%); marketing program effectiveness
(63%). About half (49%) of them indicated that the number of people employed in their business had also
grown somewhat or a lot.
Table 25: Indigenous Tourism Operators Business Performance
Performance Indicator Decreased
(%) Stayed the Same (%)
Increased Somewhat (%)
Increased A Lot (%)
Don’t Know / No Response (%)
Number of annual days of operation
0 55 27 16 2
Total number of people you employ
2 45 33 16 4
Market competitiveness of your tourism business
0 35 45 16 4
Effectiveness of your marketing programs
2 25 49 14 10
Amount of business sales 4 6 39 43 8
N =49 4
Slightly more than half (55%) of these operators also felt that ITBC had played a positive role in increasing job
opportunities for Indigenous people in these and other tourism businesses.

ITBC “The Next Phase” Strategy Performance Audit 2012‐2017
Pag
e 31
Table 26: ITBC Role in Stimulating Indigenous Employment
ITBC Role in Indigenous Employment Stimulation
% of Respondents
Not helped at all 6
Not sure 39
Helped a little 33
Helped a lot 23
N+49
Anticipated Business Prospects Next Five Years
Indigenous tourism operators were generally optimistic about future prospects for their businesses. For
instance, about 75% of them anticipated increasing their staff complements somewhat or a lot during the next
five years.
Table 27: Indigenous Tourism Operators Anticipated Employment in Five Years
Anticipated Business Employment Complement Next 5 Years
% of Respondents
Decrease A Lot 0
Decrease Somewhat 0
Uncertain 25
Increase Somewhat 59
Increase A Lot 16
N=49
They also felt that their operations would benefit somewhat or a lot from development and marketing
initiatives that increased: global awareness of Indigenous tourism in BC (98%); the customer service capacity of
their operations (89%); inbound and receptive travel trade partnerships (89%).
Table 28: Support Interest of Indigenous Tourism Operators
Activity No Benefit At All (%)
Benefits Increase Somewhat (%)
Benefits Increase A Lot (%)
Increased global market awareness of Indigenous tourism in BC
2 49 49
Increased tourism and customer service training for Indigenous employees
10 59 31
Increased partnerships with receptive and inbound travel trade
10 41 49
N=49

ITBC “The Next Phase” Strategy Performance Audit 2012‐2017
Pag
e 32
APPENDIX 3: Indigenous Tourism Market Awareness Gap
Available data in Global Tourism Watch 2013 suggests that interest in pursuing Indigenous cultural tourism
experiences while travelling remains strong in Canada’ s and BC’s key long‐haul travel markets. A desire to
include such experiences in destination selection decisions is particularly evident (+74%) in China, India,
Germany, and South Korea, and substantial (+40%) in several other markets. However, there is much room for
improving Canada’s capture opportunities in these countries. Less than a quarter of these ‘Indigenous cultural
interest’ travellers were aware of Canada’s offerings. This important awareness gap between general market
interest and awareness of Canada’s Indigenous cultural tourism opportunities was especially apparent (50+) in
China, Germany, India and South Korea.
Table 29: Visitor Market Awareness of Indigenous Tourism
Visitor Market
Importance of Indigenous Cultural Opportunities in Destination
Selection (always / often)
(%)
Awareness of Canadian Indigenous Cultural Tourism
(%)
Importance – Canadian Indigenous Cultural Tourism
Awareness Gap (%)
Top Long Haul
China 78 17 ‐61
Germany 75 17 ‐58
United Kingdom 56 11 ‐45
Australia 47 22 ‐25
Japan 41 18 ‐23
Top North American
United States 60 15 ‐45
Canada 49 58 +9
Mexico 71 27 ‐44
Other Emerging
India 76 22 ‐54
South Korea 74 22 ‐52
Source: Global Watch 2012‐2013
From a BC tourism perspective, participation in Indigenous cultural experiences is distributed across the
province. (Short Haul Consumer Research 2014), Overall about 16% of short haul travellers had experienced
Indigenous cultural tourism sites during trips to BC during the preceding two years. Greatest incidence was

ITBC “The Next Phase” Strategy Performance Audit 2012‐2017
Pag
e 33
associated with trips to the Vancouver Island (42%), Okanagan (39%), Vancouver (36%), and Kootenays (20%)
regions (DBC 2014a).
From an overall travel preference perspective, collectively short and long‐haul Indigenous cultural tourists
tended to be either Authentic Experiencers (25%), Cultural Explorers (18%) or Gentler Explorers (17%). While
similarly inclined in many respects, short haul travellers were more apt to be Cultural Explorers (23%), while
their long‐haul counterparts were decidedly more Authentic Experiencers (28%).
Table 30: Anticipated Most Frequent Indigenous Cultural Tourism Experiences (Next Two Years)
Traveller Type Cultural Explorers
%
Authentic Experiencers
% Gentle Explorers
%
Short Haul 23 20 18
Long Haul 16 28 17
Overall 18 25 17
SOURCE: DBC North American Brand Discovery Research (2014)

ITBC “The Next Phase” Strategy Performance Audit 2012‐2017
Pag
e 34
APPENDIX 4: BC Regional Indigenous Tourism Operators
The following illustrates the status of Indigenous tourism businesses within each BC tourism region.

ITBC “The Next Phase” Strategy Performance Audit 2012‐2017
Pag
e 35
Northern BC Change in Businesses since last Fiscal 2017 2014 2013 2011 2003
Current Indigenous businesses operating 105 49 38 36 31
New Indigenous businesses 58 11 2 10
Continued operating 47 38 36 26
No longer operating 2 0 0 5
Net Gain (‐Loss) since last fiscal … 56 11 2 5
% Change over previous period 114% 29% 6% 16%
**ONLY includes Indigenous owned businesses whose primary business type is tourism
Attraction10% Accommodations
12%
Outdoor Adventure17%
Food and Beverage1%
Festivals and Events8%
Retail50%
Transportation2%
Total Indigenous Operators by Type 2017

ITBC “The Next Phase” Strategy Performance Audit 2012‐2017
Pag
e 36
Caribou Chilcotin Coast Change in Businesses since last Fiscal 2017 2014 2013 2011 2003
Current Indigenous businesses operating 40 25 21 25 14
New Indigenous businesses 16 6 1 12
Continued operating 24 19 20 13
No longer operating 1 2 5 1
Net Gain (‐Loss) since last fiscal… 15 4 ‐4 11
% Change over previous period 60% 19% ‐16% 79%
**ONLY includes Indigenous owned businesses whose primary business type is tourism
Attraction10%
Accommodations22%
Outdoor Adventure22%
Food and Beverage0%
Festivals and Events3%
Retail43%
Transportation0%
Total Indigenous Operators by Type 2017

ITBC “The Next Phase” Strategy Performance Audit 2012‐2017
Pag
e 37
Vancouver Island Change in Businesses since last Fiscal 2017 2014 2013 2011 2003
Current Indigenous businesses operating 89 76 62 72 55
New Indigenous businesses 17 16 2 24
Continued operating 72 60 60 48
No longer operating 4 2 12 7
Net Gain (‐Loss) since last fiscal… 13 14 ‐10 17
% Change over previous period 17% 23% ‐14% 31%
**ONLY includes Indigenous owned businesses whose primary business type is tourism
Attraction10%
Accommodations28%
Outdoor Adventure28%
Food and Beverage5%
Festivals and Events2%
Retail22%
Transportation5%
Total Indigenous Operators by Type 2017
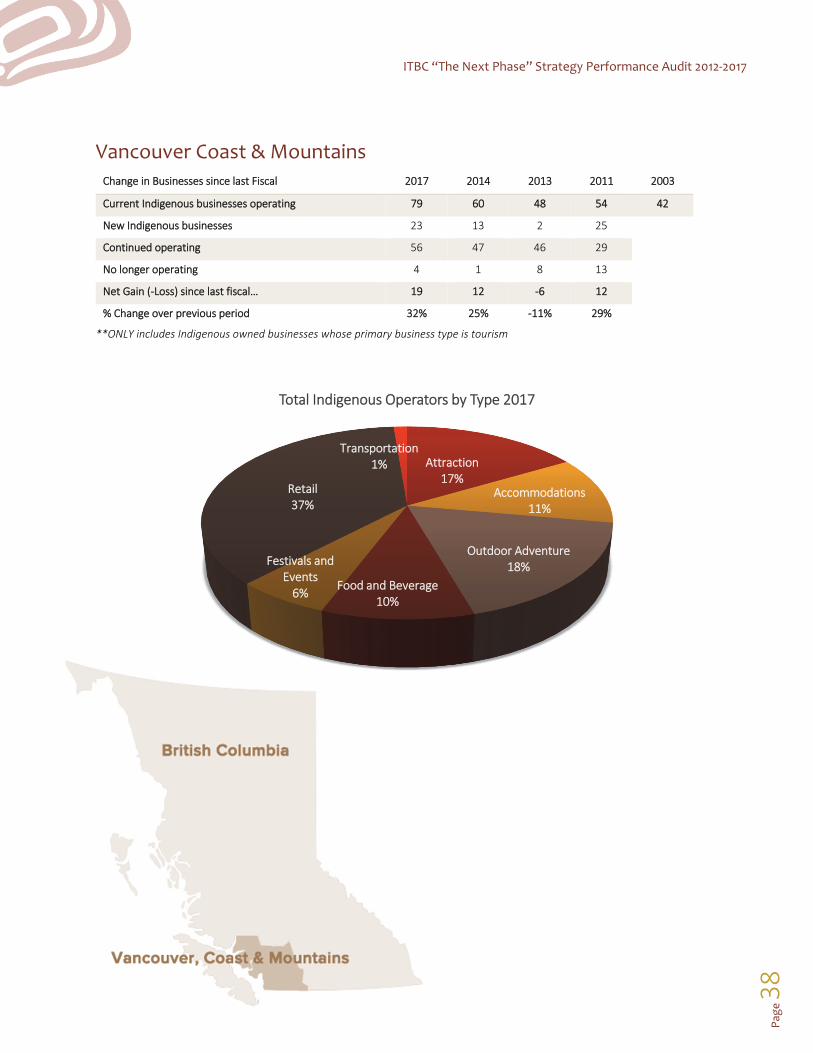
ITBC “The Next Phase” Strategy Performance Audit 2012‐2017
Pag
e 38
Vancouver Coast & Mountains Change in Businesses since last Fiscal 2017 2014 2013 2011 2003
Current Indigenous businesses operating 79 60 48 54 42
New Indigenous businesses 23 13 2 25
Continued operating 56 47 46 29
No longer operating 4 1 8 13
Net Gain (‐Loss) since last fiscal… 19 12 ‐6 12
% Change over previous period 32% 25% ‐11% 29%
**ONLY includes Indigenous owned businesses whose primary business type is tourism
Attraction17%
Accommodations11%
Outdoor Adventure18%
Food and Beverage10%
Festivals and Events6%
Retail37%
Transportation1%
Total Indigenous Operators by Type 2017

ITBC “The Next Phase” Strategy Performance Audit 2012‐2017
Pag
e 39
Thompson Okanagan Change in Businesses since last Fiscal 2017 2014 2013 2011 2003
Current Indigenous businesses operating 72 43 31 33 24
New Indigenous businesses 33 13 1 12
Continued operating 39 30 30 21
No longer operating 4 1 3 3
Net Gain (‐Loss) since last fiscal… 29 12 ‐2 9
% Change over previous period 67% 39% ‐6% 38%
**ONLY includes Indigenous owned businesses whose primary business type is tourism
Attraction17%
Accommodations11%
Outdoor Adventure8%
Food and Beverage10%
Festivals and Events18%
Retail36%
Transportation0%
Total Indigenous Operators by Type 2017

ITBC “The Next Phase” Strategy Performance Audit 2012‐2017
Pag
e 40
Kootenay Rockies Change in Businesses since last Fiscal 2017 2014 2013 2011 2003
Current Indigenous businesses operating 16 14 12 12 15
New Indigenous businesses 2 2 0 3
Continued operating 14 12 12 9
No longer operating 0 0 0 6
Net Gain (‐Loss) since last fiscal… 2 2 0 ‐3
% Change over previous period 14% 17% 0% ‐20%
**ONLY includes Indigenous owned businesses whose primary business type is tourism
Attraction7%
Accommodations38%
Outdoor Adventure31%
Food and Beverage6%
Festivals and Events6%
Retail6%
Transportation6%
Total Indigenous Operators by Type 2017

ITBC “The Next Phase” Strategy Performance Audit 2012‐2017
Pag
e 41
APPENDIX 5: Report References
ATAC Aboriginal Tourism Association of Canada (2015). National Aboriginal Tourism Research Project:
Economic Impact of Aboriginal Tourism in Canada.
ATBC Aboriginal Tourism Association of BC (2017). Aboriginal Business Operator Survey 2017.
ATBC Aboriginal Tourism Association of BC (2012). The Next Phase: A Five Year Strategy for Aboriginal Cultural
Strategy in British Columbia. Vancouver: Aboriginal Tourism BC.
BC Government (2015). Gaining the Edge: British Columbia’s Tourism Strategy. BC Ministry of Jobs, Tourism
and Skills Training.
Conference Board of Canada (2016). BC Economy still an economic growth leader in 2017 …” News Release,
December 8, 2016.
Conference Board of Canada (2016). Outbound Canada: Market Performance and Intensions.
Canada Vancouver Airport Authority (2017). Annual & Sustainability Report.
Central 1 Credit Union (2017). BC economy to grow more slowly over next two years. May.
Destination Analysts (2017). The State of the American Traveler Study. Winter 2017, Volume 25.
DBC Destination BC (2014). The Value of Tourism 2002‐2012.
DBC Destination BC (2017). Aboriginal Experience Secondary Research Review.
DBC Destination BC (2014). North American Brand Discovery Research.
DBC Destination BC (2014). Short Haul Consumer Research.
DBC Destination BC (2017). Special arrival data cuts.
Destination Canada (2015). Global Tourism Watch: 2015 Canada Summary Report.
Destination Canada (2016). Seizing the Winning Conditions for Canada. 2016/2020. Corporate Plan Summary.
Pylas, P. (2017), “Eurozone Outpaces US in Q1,” Vancouver Sun, May 4, p. C2.
TIABC – Tourism Industry Association of BC (2017). Tourism by the Numbers.


