65
Adoption of Light-Emitting Diodes in Common Lighting Applications Prepared for the U.S. Department of Energy Solid-State Lighting Program July 2015 Prepared by Navigant
Adoption of Light-Emitting Diodes in Common Lighting ApplicationsPrepared for the U.S. Department of Energy Solid-State Lighting Program
July 2015
Prepared by Navigant

This page intentionally left blank

i | P a g e
Disclaimer
This report was prepared as an account of work sponsored by an agency of the United States Government. Neither the United States Government, nor any agency thereof, nor any of their employees, nor any of their contractors, subcontractors, or their employees, makes any warranty, express or implied, or assumes any legal liability or responsibility for the accuracy, completeness, or usefulness of any information, apparatus, product, or process disclosed, or represents that its use would not infringe privately owned rights. Reference herein to any specific commercial product, process, or service by trade name, trademark, manufacturer, or otherwise, does not necessarily constitute or imply its endorsement, recommendation, or favoring by the United States Government or any agency, contractor, or subcontractor thereof. The views and opinions of authors expressed herein do not necessarily state or reflect those of the United States Government or any agency thereof.
Authors:
Mary Yamada Kelsey Stober Navigant Navigant
ii | P a g e
Acknowledgements
The authors would like to acknowledge the guidance and input provided during the preparation of this report. Dr. James R. Brodrick of the U.S. Department of Energy (DOE), Building Technologies Program offered day-to-day oversight of this assignment, helping to shape the approach, execution, and documentation. The authors are also grateful to ENERGY STAR, ICF International, and the following list of experts for their contributions, guidance, and review, which proved invaluable in preparing the estimates contained in this report.
Susan Callahan OSRAM SYLVANIA Dan Chwastyk Solar Electric Power Association Kevin Coleman Philips Lighting Electronics Keith Cook Philips Lighting Electronics Joey Corona Home Depot Jeff Epstein Home Depot Kelly Gordon Pacific Northwest National Laboratory Becky Rainer Eaton-Cooper Lighting Mark Hand Acuity Brands Lighting Tommy Harris Acuity Brands Lighting Joe Howley GE Lighting Eric Haugaard Cree Marc Ledbetter Pacific Northwest National Laboratory Mark Lien OSRAM SYLVANIA Dan Mellinger Efficiency Vermont Michael Myer Pacific Northwest National Laboratory Tess Perrin Pacific Northwest National Laboratory Jason Tuenge Pacific Northwest National Laboratory
iii | P a g e
Comments
DOE is interested in feedback or comments on the materials presented in this document. Please write to James Brodrick, Lighting Program Manager: James R. Brodrick, Ph.D. Lighting Program Manager EE-2J U.S. Department of Energy 1000 Independence Avenue SW Washington, D.C. 20585-0121-0121
iv | P a g e
List of Acronyms and Abbreviations
BR Bulged Reflector cd Candela CFL Compact Fluorescent Lamp CRI Color Rendering Index DOE U.S. Department of Energy EISA 2007 Energy Independence and Security Act of 2007 ER Elliptical Reflector HID High-Intensity Discharge HPS High-Pressure Sodium IR Infrared klm Kilo-lumen LED Light-Emitting Diode lm lumens MH Metal Halide MR Multifaceted Reflector MV Mercury Vapor NEMA National Electrical Manufacturers Association PAR Parabolic Aluminized Reflector POS Point of Sale quad Quadrillion British Thermal Unit R Reflector SSL Solid-State Lighting tBtu Trillion British Thermal Unit TCO Total Cost of Ownership TWh Terawatt-Hour W Watt
v | P a g e
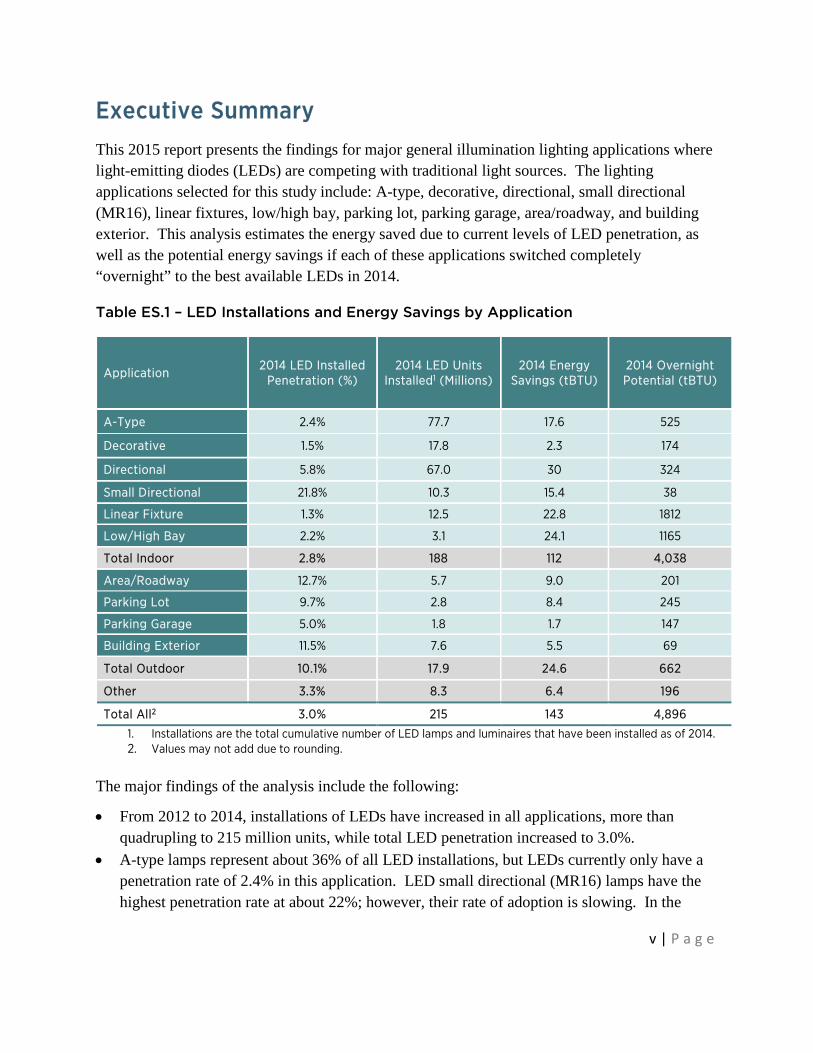
Executive Summary This 2015 report presents the findings for major general illumination lighting applications where light-emitting diodes (LEDs) are competing with traditional light sources. The lighting applications selected for this study include: A-type, decorative, directional, small directional (MR16), linear fixtures, low/high bay, parking lot, parking garage, area/roadway, and building exterior. This analysis estimates the energy saved due to current levels of LED penetration, as well as the potential energy savings if each of these applications switched completely “overnight” to the best available LEDs in 2014.
Table ES.1 – LED Installations and Energy Savings by Application
Application 2014 LED Installed
Penetration (%) 2014 LED Units
Installed1 (Millions) 2014 Energy
Savings (tBTU) 2014 Overnight Potential (tBTU)
A-Type 2.4% 77.7 17.6 525
Decorative 1.5% 17.8 2.3 174
Directional 5.8% 67.0 30 324
Small Directional 21.8% 10.3 15.4 38
Linear Fixture 1.3% 12.5 22.8 1812
Low/High Bay 2.2% 3.1 24.1 1165
Total Indoor 2.8% 188 112 4,038
Area/Roadway 12.7% 5.7 9.0 201
Parking Lot 9.7% 2.8 8.4 245
Parking Garage 5.0% 1.8 1.7 147
Building Exterior 11.5% 7.6 5.5 69
Total Outdoor 10.1% 17.9 24.6 662
Other 3.3% 8.3 6.4 196
Total All2 3.0% 215 143 4,896
1. Installations are the total cumulative number of LED lamps and luminaires that have been installed as of 2014. 2. Values may not add due to rounding.
The major findings of the analysis include the following:
• From 2012 to 2014, installations of LEDs have increased in all applications, more than quadrupling to 215 million units, while total LED penetration increased to 3.0%.
• A-type lamps represent about 36% of all LED installations, but LEDs currently only have a penetration rate of 2.4% in this application. LED small directional (MR16) lamps have the highest penetration rate at about 22%; however, their rate of adoption is slowing. In the

vi | P a g e
outdoor sector, area/roadway has the highest penetration of LED lighting at nearly 13% in 2014.
• In 2014, when comparing indoor versus outdoor applications, LEDs have a higher penetration in outdoor applications, at 10.1%, compared to indoor applications where LEDs have a total penetration of 2.8%.
• Annual source energy savings from LEDs in 2014 was approximately 143 trillion British thermal units (tBtu), which is equivalent to an annual energy cost savings of about $1.4 billion.
• Annual source energy savings could approach 4,896 tBtu, about 5.0 quadrillion Btu (quads), if all applications switched “overnight” to the best-available LEDs in 2014. Energy savings of this size would result in an annual energy cost savings of about $49 billion.
Figure ES.1 – Comparison of 2014 and Potential Source Energy Savings from LEDs

i | P a g e
Table of Contents 1. Introduction ............................................................................................................................................................... 1
2. Methodology ............................................................................................................................................................ 4
3. Results ........................................................................................................................................................................ 8
3.1. A-Type ................................................................................................................................................... 14
3.1.1. A-Type LED Penetration ............................................................................................................ 15
3.1.2. A-Type LED Energy Savings .................................................................................................... 16
3.2. Decorative .............................................................................................................................................17
3.2.1. Decorative LED Penetration ..................................................................................................... 18
3.2.2. Decorative LED Energy Savings.............................................................................................. 19
3.3. Directional ........................................................................................................................................... 20
3.3.1. Directional LED Penetration ..................................................................................................... 21
3.3.2. Directional LED Energy Savings ..............................................................................................23
3.4. Small Directional ............................................................................................................................... 24
3.4.1. Small Directional LED Penetration .........................................................................................25
3.4.2. Small Directional LED Energy Savings ................................................................................. 26
3.5. Linear Fixtures .................................................................................................................................... 27
3.5.1. Linear Fixture LED Penetration ............................................................................................... 27
3.5.2. Linear Fixture LED Energy Savings ....................................................................................... 29
3.6. Low/High Bay .................................................................................................................................... 30
3.6.1. Low/High Bay LED Penetration ............................................................................................. 30
3.6.2. Low/High Bay LED Energy Savings ....................................................................................... 31
3.7. Area/Roadway ....................................................................................................................................32
3.7.1. Area/Roadway LED Penetration .............................................................................................33
3.7.2. Area/Roadway LED Energy Savings .................................................................................... 34
3.8. Parking Lot .......................................................................................................................................... 34
3.8.1. Parking Lot LED Penetration ....................................................................................................35
3.8.2. Parking Lot LED Energy Savings ........................................................................................... 36
3.9. Parking Garage ................................................................................................................................... 37
3.9.1. Parking Garage LED Penetration ........................................................................................... 38

ii | P a g e
3.9.2. Parking Garage LED Energy Savings .................................................................................... 39
3.10. Building Exterior ............................................................................................................................... 39
3.10.1. Building Exterior LED Penetration ........................................................................................ 40
3.10.2. Building Exterior LED Energy Savings .................................................................................. 41
Appendix A. Legislation Affecting the Lighting Market ............................................................................ 43
Appendix B. Changes Affecting the LED Energy Savings Estimate ..................................................... 45
Appendix C. Wattage Assumptions ................................................................................................................. 47
Appendix D. Operating Hour Assumptions ................................................................................................... 49

iii | P a g e
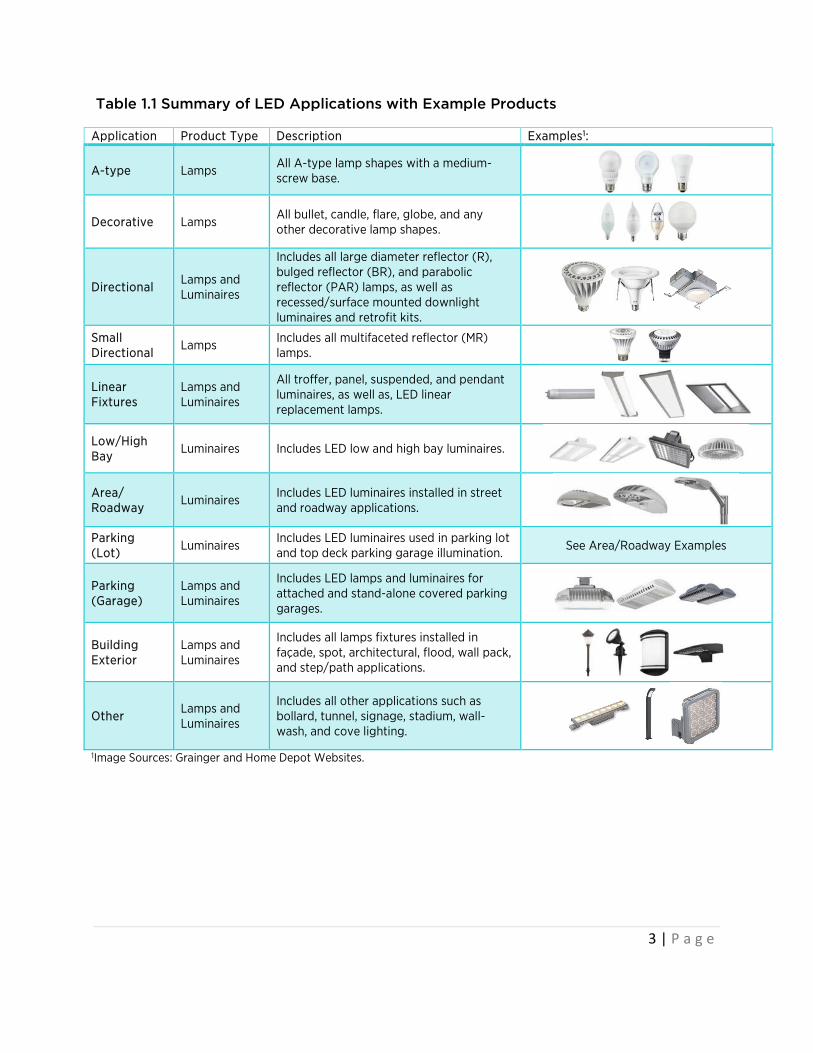
List of Tables Table 1.1 Summary of LED Applications with Example Products ..................................................................... 3
Table 2.1 Average and Most Efficacious Products from LED Lighting Facts ............................................... 7
Table 3.1 A-type LED Energy Savings Summary ..................................................................................................17
Table 3.2 Decorative LED Energy Savings Summary ........................................................................................ 19
Table 3.3 Directional LED Energy Savings Summary ........................................................................................23
Table 3.4 Small Directional LED Energy Savings Summary ........................................................................... 26
Table 3.5 Linear Fixture LED Energy Savings Summary ................................................................................. 30
Table 3.6 Low/High Bay LED Energy Savings Summary .................................................................................32
Table 3.7 Area/Roadway LED Energy Savings Summary ............................................................................... 34
Table 3.8 Parking Lot LED Energy Savings Summary ....................................................................................... 37
Table 3.9 Parking Garage LED Energy Savings Summary .............................................................................. 39
Table 3.10 Building Exterior LED Energy Savings Summary .......................................................................... 42

iv | P a g e
List of Figures Figure 2.1 2014 LED Adoption Estimation Methodology .................................................................................... 4
Figure 2.2 2014 LED Energy Savings Methodology ............................................................................................. 6
Figure 3.1 Total 2014 LED Unit Installations by Application .............................................................................. 8
Figure 3.2 2014 Penetration Rates of LED Lighting Applications ................................................................... 9
Figure 3.3 Comparison of 2014 and Potential Source Energy Savings from LEDs ................................... 11
Figure 3.4 Total U.S. Lighting Installations and LED Energy Savings .......................................................... 13
Figure 3.5 Installed Base and Price Estimates for A-type LEDs ..................................................................... 15
Figure 3.6 Evolution of A-type Installed Base ..................................................................................................... 16
Figure 3.7 Installed Base and Price Estimates for Decorative LEDs ............................................................. 18
Figure 3.8 Evolution of Decorative Installed Base .............................................................................................. 19
Figure 3.9 Installed Base and Price Estimates for Directional LEDs ............................................................. 22
Figure 3.10 Evolution of Directional Installed Base ............................................................................................23
Figure 3.11 Evolution of Small Directional Installed Base..................................................................................25
Figure 3.12 Installed Base and Price Estimates for Small Directional LEDs ............................................... 26
Figure 3.13 Installed Base and Price Estimates for Linear Fixture LEDs23 .................................................. 28
Figure 3.14 Evolution of Linear Fixture Installed Base ..................................................................................... 29
Figure 3.15 Installed Base and Price Estimates for Low/High Bay LEDs ..................................................... 31
Figure 3.16 Evolution of Low/High Bay Installed Base ..................................................................................... 31
Figure 3.17 Evolution of Area/Roadway Installed Base ....................................................................................33
Figure 3.18 Installed Base and Price Estimates for Area/Roadway LEDs .................................................. 34
Figure 3.19 Installed Base and Price Estimates for Parking Lot LEDs ......................................................... 36
Figure 3.20 Evolution of Parking Lot Installed Base ......................................................................................... 36

v | P a g e
Figure 3.21 Installed Base and Price Estimates for Parking Garage LEDs ................................................. 38
Figure 3.22 Evolution of Parking Garage Installed Base.................................................................................. 39
Figure 3.23 Installed Base and Price Estimates for Building Exterior LEDs ............................................... 41
Figure 3.24 Evolution of Building Exterior Installed Base ................................................................................ 41

This page intentionally left blank
1 | P a g e
1. Introduction Light-emitting diodes (LEDs), a type of solid-state lighting (SSL), are revolutionizing the lighting market. LEDs have surpassed many conventional lighting technologies in terms of energy efficiency, lifetime, versatility, and color quality, and due to their increasing cost competitiveness LEDs are beginning to successfully compete in a variety of lighting applications. The Department of Energy’s (DOE) 2014 study, Energy Savings Forecast of Solid-State Lighting in General Illumination Applications, (hereafter referred to as the DOE SSL Forecast) forecasts that LED lighting will represent 84% of all lighting sales by 2030, resulting in an annual primary energy savings of 3.0 quadrillion British thermal units (quads).1
Since 2003, the DOE SSL Program has evaluated the United States (U.S.) lighting market to report on lighting applications where LEDs are having the greatest energy savings impact. The 2015 Estimated Adoption of LEDs in Common Lighting Applications report provides an update to the 2013 analysis2 and represents the fifth iteration of this analysis (titled the Energy Savings Estimates of LEDs in Niche Lighting Applications prior to 20133). The 2015 report investigates the current adoption and resulting energy savings of LEDs in 10 common white-light applications, shown in Table 1.1. The 10 lighting applications selected for this study include: A-type, decorative, directional, small directional (MR16), linear fixtures, low/high bay, parking lot, parking garage, area/roadway, and building exterior. An “other” applications category was included to accommodate lighting products that account for less common LED products and those that occupy unknown applications. The penetration and energy savings resulting from these other applications are included in the overall analysis, but they are not discussed in the report.
For each of the 10 applications, this report addresses the following four questions: • In the year 2014, how much energy was consumed by lighting technologies? • What is the 2014 estimated penetration of LED technology? • What are the actual energy savings resulting from the 2014 level of LED penetration? • What would the theoretical energy savings be from 100% LED penetration?
Since the designs of LED lighting products vary significantly, products installed in each of the analyzed applications are classified as LED lamp replacements or luminaires. In some 1 U.S. DOE SSL Program, Energy Savings Forecast of Solid-State Lighting in General Illumination Applications, Prepared by Navigant Consulting, August 2014. http://apps1.eere.energy.gov/buildings/publications/pdfs/ssl/energysavingsforecast14.pdf 2 The 2013 report is available at: http://apps1.eere.energy.gov/buildings/publications/pdfs/ssl/led-adoption-report_2013.pdf 3 Past versions of this report have included analyses of colored-light, as well as consumer electronics applications. However, colored-light and consumer electronics LEDs have matured, reaching market saturation in many applications, and are no longer analyzed in this study. The energy savings of LEDs in colored-light applications are analyzed in the 2003 and 2008 editions and consumer electronics are analyzed in the 2011 edition.
2 | P a g e
applications both LED lamps and luminaires are competing for market share, while in some there is only one product type. Typically LED lamps are designed to be direct replacements for existing incandescent and halogen lamps, while LED luminaires represent a holistic change-out of the existing lamp and fixture system. Table 1.1 indicates which LED product types (lamps and/or luminaires) are analyzed within each of the applications, provides a description, and includes example LED product images.
3 | P a g e
Table 1.1 Summary of LED Applications with Example Products
Application Product Type Description Examples1:
A-type Lamps All A-type lamp shapes with a medium-screw base.
Decorative Lamps All bullet, candle, flare, globe, and any other decorative lamp shapes.
Directional Lamps and Luminaires
Includes all large diameter reflector (R), bulged reflector (BR), and parabolic reflector (PAR) lamps, as well as recessed/surface mounted downlight luminaires and retrofit kits.
Small Directional
Lamps Includes all multifaceted reflector (MR) lamps.
Linear Fixtures
Lamps and Luminaires
All troffer, panel, suspended, and pendant luminaires, as well as, LED linear replacement lamps.
Low/High Bay
Luminaires Includes LED low and high bay luminaires.
Area/ Roadway
Luminaires Includes LED luminaires installed in street and roadway applications.
Parking (Lot) Luminaires
Includes LED luminaires used in parking lot and top deck parking garage illumination. See Area/Roadway Examples
Parking (Garage)
Lamps and Luminaires
Includes LED lamps and luminaires for attached and stand-alone covered parking garages.
Building Exterior
Lamps and Luminaires
Includes all lamps fixtures installed in façade, spot, architectural, flood, wall pack, and step/path applications.
Other Lamps and Luminaires
Includes all other applications such as bollard, tunnel, signage, stadium, wall-wash, and cove lighting.
1Image Sources: Grainger and Home Depot Websites.

4 | P a g e
2. Methodology Three major inputs are needed to develop a 2014 energy savings estimate for LED lamps and luminaires in the U.S:
1) The market adoption of LED lamps and luminaires 2) The installed stock of traditional lamps and luminaires 3) The typical performance and usage characteristics of all lamps and luminaires
The 2014 lighting inventory is calculated from the U.S. DOE lighting market model1, which utilizes assumptions of projected efficacy, retail price, and operating life to predict trends in lighting technology use. The 2014 projection includes estimates for the installed base of LED lighting as well as conventional lighting technologies, such as incandescent, fluorescent, and high intensity discharge (HID). The LED projection outputs from the model are then updated and calibrated using LED sales and financial reports provided by manufacturers, retailers, industry experts, and utilities, in addition to the shipment data from retailer point-of-sale (POS) data4 and ENERGY STAR. In an effort to align estimates of current and projected LED adoption as well as energy savings, the 10 applications analyzed in this study align with those in the DOE SSL Forecast report published in August 2014.1 As depicted in Figure 2.1, this coordination between reports enables the estimates published in this 2015 LED adoption study to easily serve as inputs to the U.S. DOE lighting market model and to drive a systematic and simplified process aiding users of both analyses.
Figure 2.1 2014 LED Adoption Estimation Methodology
In addition to updating the methodology for estimating LED adoption, improvements have also been made to the energy savings calculations. The LED energy savings in each lighting application analyzed is highly dependent on what conventional technologies are being replaced
4 CREED, National Point of Sale (POS) Report, April 2014. http://www.creedlighttracker.com/
Energy Star Lighting POS Data
Utilities
Retailers Industry Experts Manufacturers
Data Collection & Stakeholder Interviews
Updated 2014 LED Adoption and Total Lighting Inventory
U.S. DOE Lighting Market Model – 2014 Lighting Inventory

5 | P a g e
by LED lamps and luminaires. Previous iterations of this LED adoption study assumed that in each application LED lamps and luminaires would replace the worst-performing product in terms of efficacy. However, as LED lighting becomes more and more prevalent in the U.S. this assumption has become increasingly inaccurate. For example, a recent National Electrical Manufacturers Association (NEMA) lamp indices article reports that CFL shipments registered a 13.1% decline in the first three quarters of 2014, while LED A-type lamps continue to grow showing gains of 53.8%.5 This evidence suggests a preference for LEDs over CFLs. This point was reinforced by manufacturers and retailers, who indicated during interviews that LED sales are increasing at the expense of efficient lighting products such as CFLs, T8 fluorescent lamps, metal halide, and high pressure sodium fixtures. However, absent LEDs it is likely these incumbent energy efficient products would continue to gain market share.
To more accurately estimate the energy savings from LED lighting, the calculation uses the “no-LED scenario” outputs from the U.S. DOE lighting market model as a baseline. In the no-LED scenario, LED products are assumed to have never entered the general illumination market, but all other market conditions, such as energy conservation standards for conventional technologies, are unchanged. For example, the no-LED scenario considers energy conservation standards such as the Energy Independence and Security Act of 2007 (EISA 2007). EISA 2007 prescribes maximum wattage standards for medium screw base general service incandescent lamps that took effect between 2012 and 2014, effectively phasing out the traditional incandescent lamp.6 Absent of LED technology, EISA 2007 still results in lower annual energy consumption as more efficient halogen lamps and CFLs replace incandescent options. Therefore, taking the difference in energy consumption of the 2014 no-LED scenario and the updated 2014 lighting inventory best represents the resulting energy savings impact of LED adoption.
5 NEMA, Lamp Indices: Compact Fluorescent Lamp Shipments Continue to Lag, January 20th, 2015. http://www.nema.org/news/Pages/Compact-Fluorescent-Lamp-Shipments-Continue-to-Lag.aspx 6 See Appendix A for discussion of lighting efficiency standards.
Due to these updates in the calculation method, the 2014 LED energy saving estimates provided in this report represent a significant improvement compared to those provided in previous iterations. Changes to the energy savings calculation are provided in Appendix B.
6 | P a g e
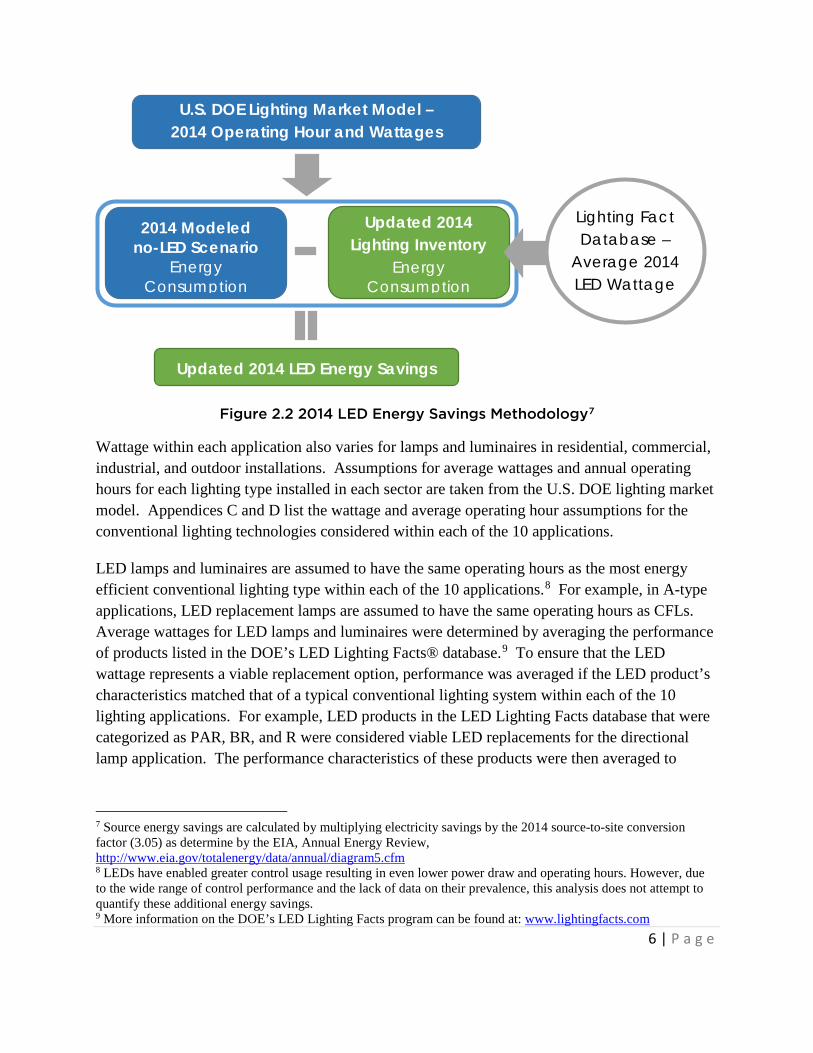
Figure 2.2 2014 LED Energy Savings Methodology7
Wattage within each application also varies for lamps and luminaires in residential, commercial, industrial, and outdoor installations. Assumptions for average wattages and annual operating hours for each lighting type installed in each sector are taken from the U.S. DOE lighting market model. Appendices C and D list the wattage and average operating hour assumptions for the conventional lighting technologies considered within each of the 10 applications.
LED lamps and luminaires are assumed to have the same operating hours as the most energy efficient conventional lighting type within each of the 10 applications.8 For example, in A-type applications, LED replacement lamps are assumed to have the same operating hours as CFLs. Average wattages for LED lamps and luminaires were determined by averaging the performance of products listed in the DOE’s LED Lighting Facts® database.9 To ensure that the LED wattage represents a viable replacement option, performance was averaged if the LED product’s characteristics matched that of a typical conventional lighting system within each of the 10 lighting applications. For example, LED products in the LED Lighting Facts database that were categorized as PAR, BR, and R were considered viable LED replacements for the directional lamp application. The performance characteristics of these products were then averaged to
7 Source energy savings are calculated by multiplying electricity savings by the 2014 source-to-site conversion factor (3.05) as determine by the EIA, Annual Energy Review, http://www.eia.gov/totalenergy/data/annual/diagram5.cfm 8 LEDs have enabled greater control usage resulting in even lower power draw and operating hours. However, due to the wide range of control performance and the lack of data on their prevalence, this analysis does not attempt to quantify these additional energy savings. 9 More information on the DOE’s LED Lighting Facts program can be found at: www.lightingfacts.com
Updated 2014 LED Energy Savings
U.S. DOE Lighting Market Model – 2014 Operating Hour and Wattages
2014 Modeled no-LED Scenario
Energy Consumption
Updated 2014 Lighting Inventory
Energy Consumption
Lighting Fact Database –
Average 2014 LED Wattage

7 | P a g e
determine the typical performance of an LED directional replacement lamp.
The energy consumption and savings estimate results are highly sensitive to the state of LED technology. While future advances in LED technology will increase potential energy savings compared to the results in this report, the methodology and the energy savings potential analysis only considers currently available LED technology. To determine the potential energy savings for each application, it is assumed that the entire lighting stock is converted instantaneously to the most efficacious 2014 LED product that meets the replacement description.10
Table 2.1 highlights the viable LED lamps and luminaires product types as well as the average and most efficacious LED product for each application.
Table 2.1 Average and Most Efficacious Products from LED Lighting Facts11
Application LED Replacement Description LED Efficacy (lm/W)
Average Best
A-type A-type replacement lamps 72 107
Decorative B, BA, C, CA, F, and G replacement lamps 66 90
Directional
Lamp PAR, BR, and R lamps 63 111
Luminaire Retrofit and recessed/surface-mounted downlight luminaires 63 124
Small Directional MR16 lamps 58 95
Linear Fixtures
Lamp Linear tube replacements 108 148
Luminaire Panels and recessed/surface-mounted troffer luminaires 93 139
Low/High Bay High and low bay luminaires 97 141
Area/Roadway Outdoor area/roadway/decorative luminaires 87 137
Parking Lot Outdoor area/roadway luminaires 87 137
Parking Garage
Lamp Linear T8 tube replacements 108 158
Luminaire Integrated parking garage luminaires 86 150
Building Exterior Spot and flood lights, architectural, wall pack, bollard, and step/path luminaires 77 132
10 The theoretical potential savings are based on complete market transformation, which is highly unlikely. Market changes may increase or decrease the potential energy consumption and savings of LEDs according to the overall size of the application. 11 LED efficacy values based on the DOE’s LED Lighting Facts database query from May 2015. Only products added to the database prior to January 1, 2015 were included in order to best represent products available in 2014.
8 | P a g e
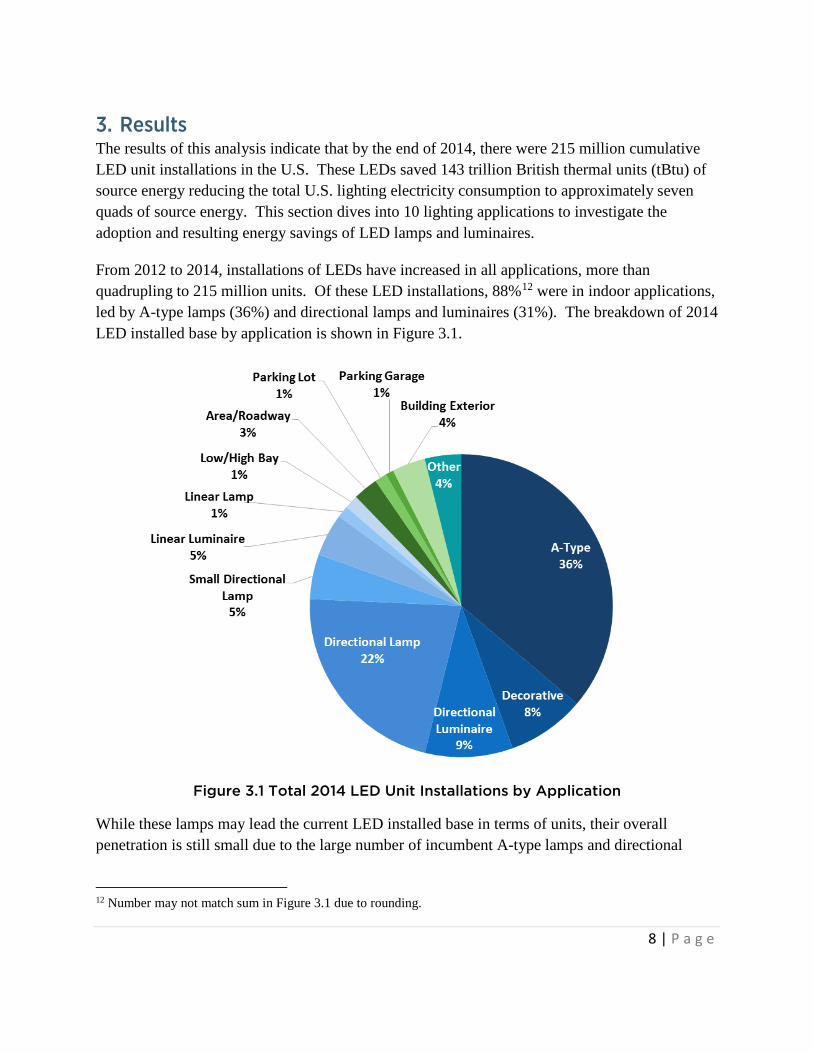
3. Results The results of this analysis indicate that by the end of 2014, there were 215 million cumulative LED unit installations in the U.S. These LEDs saved 143 trillion British thermal units (tBtu) of source energy reducing the total U.S. lighting electricity consumption to approximately seven quads of source energy. This section dives into 10 lighting applications to investigate the adoption and resulting energy savings of LED lamps and luminaires.
From 2012 to 2014, installations of LEDs have increased in all applications, more than quadrupling to 215 million units. Of these LED installations, 88%12 were in indoor applications, led by A-type lamps (36%) and directional lamps and luminaires (31%). The breakdown of 2014 LED installed base by application is shown in Figure 3.1.
Figure 3.1 Total 2014 LED Unit Installations by Application
While these lamps may lead the current LED installed base in terms of units, their overall penetration is still small due to the large number of incumbent A-type lamps and directional
12 Number may not match sum in Figure 3.1 due to rounding.
9 | P a g e
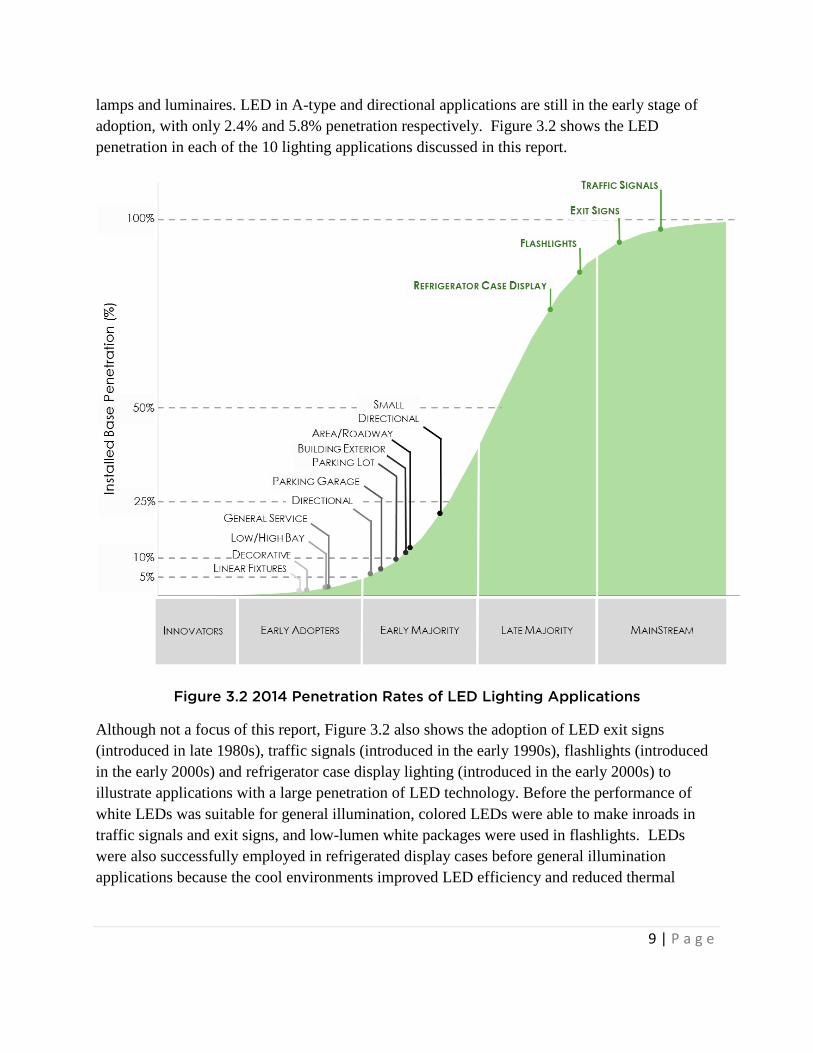
lamps and luminaires. LED in A-type and directional applications are still in the early stage of adoption, with only 2.4% and 5.8% penetration respectively. Figure 3.2 shows the LED penetration in each of the 10 lighting applications discussed in this report.
Figure 3.2 2014 Penetration Rates of LED Lighting Applications
Although not a focus of this report, Figure 3.2 also shows the adoption of LED exit signs (introduced in late 1980s), traffic signals (introduced in the early 1990s), flashlights (introduced in the early 2000s) and refrigerator case display lighting (introduced in the early 2000s) to illustrate applications with a large penetration of LED technology. Before the performance of white LEDs was suitable for general illumination, colored LEDs were able to make inroads in traffic signals and exit signs, and low-lumen white packages were used in flashlights. LEDs were also successfully employed in refrigerated display cases before general illumination applications because the cool environments improved LED efficiency and reduced thermal
10 | P a g e
handling problems that plagued other lamps and luminaires.13
While LEDs make up the majority of lighting in these four types of installations, the adoption of LEDs in general illumination applications is just beginning. LEDs in small directional applications, mainly MR16 lamps, had early success, and while sales have begun to slow, they still continue to have the highest penetration of any application, growing from 10% in 2012 to 22% in 2014. LEDs have had the least success penetrating the linear fixture market due to comparable performance from linear fluorescent lamps at a much lower cost. However, LED linear lamps and luminaires have continued to improve, with the best products offering energy savings over the best linear fluorescent products.
As the installation of LED lamps and luminaires continues to grow in general lighting applications, so do the energy savings. Annual source energy savings from LEDs in 2014 have nearly doubled since 2012 to 143 tBtu, which is equivalent to an annual energy cost savings of about $1.4 billion.
13 U.S. DOE SSL Program, Using LEDs to their Best Advantage. Prepared by PNNL, January 2012. http://apps1.eere.energy.gov/buildings/publications/pdfs/ssl/led_advantage.pdf
11 | P a g e
Figure 3.3 Comparison of 2014 and Potential Source Energy Savings from LEDs
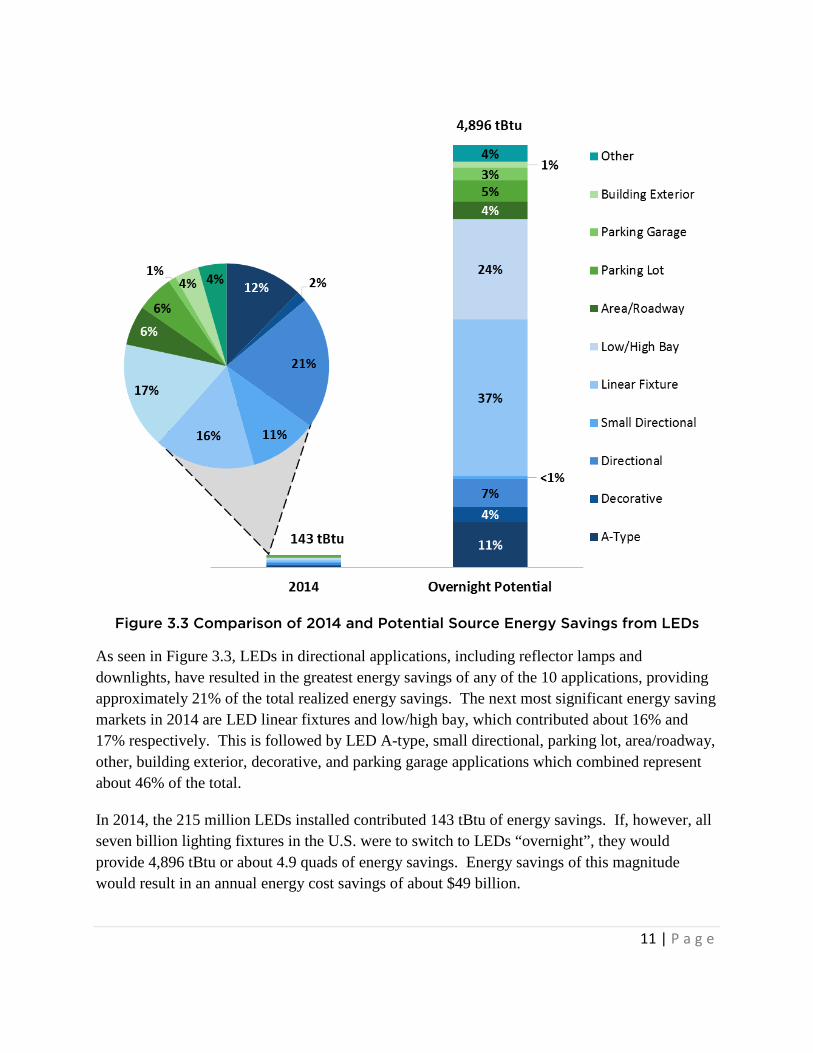
As seen in Figure 3.3, LEDs in directional applications, including reflector lamps and downlights, have resulted in the greatest energy savings of any of the 10 applications, providing approximately 21% of the total realized energy savings. The next most significant energy saving markets in 2014 are LED linear fixtures and low/high bay, which contributed about 16% and 17% respectively. This is followed by LED A-type, small directional, parking lot, area/roadway, other, building exterior, decorative, and parking garage applications which combined represent about 46% of the total.
In 2014, the 215 million LEDs installed contributed 143 tBtu of energy savings. If, however, all seven billion lighting fixtures in the U.S. were to switch to LEDs “overnight”, they would provide 4,896 tBtu or about 4.9 quads of energy savings. Energy savings of this magnitude would result in an annual energy cost savings of about $49 billion.

12 | P a g e
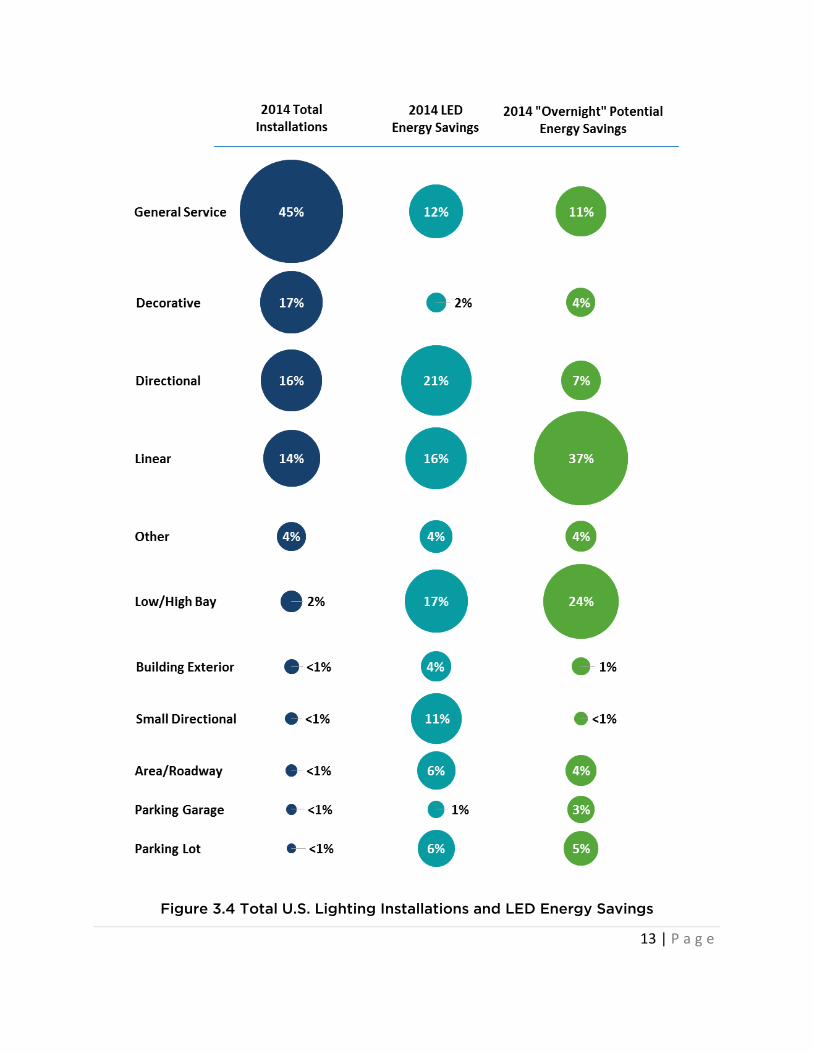
While these current and potential energy savings are significant, the extent of energy savings depends not only on efficiency, but also the number of installations and the hours each installation is operated. For example, in 2014, 45% of U.S. lighting installations were A-type lamps with over three billion units in use. However, the majority of A-type lamps are used in the residential sector and operate an average of less than two hours per day. Meanwhile, only 140 million low/high bay fixtures were installed in the U.S. in 2014, but they operate for an average of about 12 hours per day in the commercial and industrial sectors. Therefore, as shown in Figure 3.4, low/high bay fixtures contribute more than A-type lamps (about 17% and 12% respectively) to the 2014 energy savings despite the huge disparity in number of installations.
Linear fixture applications also represent a significant portion of the 2014 energy savings at 16%, and contribute the majority (37%) to the 2014 “overnight” energy savings potential. However, in the future this could be much larger. In 2014, the best available LED linear fixture lamp and luminaire products boasted efficacies of 148 lm/W and 139 lm/W, respectively, while the U.S. DOE SSL Program anticipates that troffer luminaires will reach 200 lm/W by 2020.17 If expected LED efficacy increases are realized, linear fixture applications will represent an even greater opportunity for potential LED energy savings.
In 2014, if all 7 billion light fixtures in the U.S. switched to the best available LEDs “overnight”
they would provide…
4,896 tBtu Energy Savings
$49 Billion (U.S.) Electricity Costs
13 | P a g e
Figure 3.4 Total U.S. Lighting Installations and LED Energy Savings

14 | P a g e
3.1. A-Type
This section addresses the potential for LED replacements in the A-type lamp market, which includes standard incandescent A-type lamps, incandescent halogen, CFLs, and LED replacement lamps. A-type lamps are considered the classic type of light bulb that has been used for general purpose lighting for over 100 years. These lamps have a medium screw base and typically have a pear-like shape. CFLs with a spiral/twister or mini-spiral/twister shape are also included in this section. EISA 200714 set maximum wattage standards, which cannot be met by most common incandescent lamps. As a result, consumers must look to halogen lamps, CFLs, or LEDs to replace their traditional incandescent lamps.15
The LED A-type market represents one of the greatest opportunities for the LED lighting industry in terms of number of available sockets and energy savings. LED A-type lamps became broadly available to residential consumers starting in late 2009 when Home Depot began offering a select number of LED lamp products. Now, nearly six years later, Home Depot offers 220 LED A-type lamp options in-stores and on-line.16
However, LEDs still face a variety of barriers to reach significant penetration, most notably their high initial cost. The price of LED A-type lamps has decreased significantly in recent years, reaching a typical price of $13/klm by the end of 2014, a 50% reduction from $27/klm. When specifically looking at A-type 60W replacements, LEDs offered at big box retailers are even cheaper at prices close to $11/klm, which is on par with the first cost of dimmable CFL replacements ($10/klm), but still about five times that of halogen ($2/klm) and non-dimmable CFL replacements ($2.50/klm).17 However, prices for LED A-type lamps can range from $5/klm to $200/klm, with variation based on product quality and features such as high efficacy, high color rendering, dimmability, and color tuning.
LED A-type lamps have also improved significantly in terms of their performance. In the LED Lighting Facts database, LED A-type lamps have an average efficacy of 72 lm/W and reach as high as 107 lm/W.18 With rated lifetimes exceeding 25,000 hours, they offer both energy savings and lamp lifetimes beyond that of CFLs (70 lm/W, 12,000 hours).
As LED A-type lamp technology has improved more state, local, and utility energy efficiency
14 More information on EISA 2007 can be found at: http://www1.eere.energy.gov/buildings/appliance_standards/commercial/pdfs/eisa_2007.pdf 15Interviews with retailers revealed that some A-type incandescent lamps remained in the supply chain during 2014 and are therefore being sold. 16 Home Depot LED A-type lamp product offerings as of May 6, 2015. www.homedepot.com 17 U.S. DOE SSL Program, Solid-State Lighting R&D Plan, May 2015. http://www.energy.gov/sites/prod/files/2015/06/f22/ssl_rd-plan_may2015_0.pdf 18 LED Lighting Facts database as of May 6, 2015. http://www.lightingfacts.com/products
15 | P a g e
programs are offering various incentives to reduce the high initial cost to consumers. In North America, there are currently 159 utilities and energy efficiency organizations with established rebates, incentives, and other promotions for the purchase of LED A-type lamps to help ensure they get into the hands of consumers. In total, the number of U.S. states with utilities and energy efficiency organizations offering LED lamp retrofit and new construction rebates has increased from 27 states in 2012 to 48 states in 2014.19
3.1.1. A-Type LED Penetration
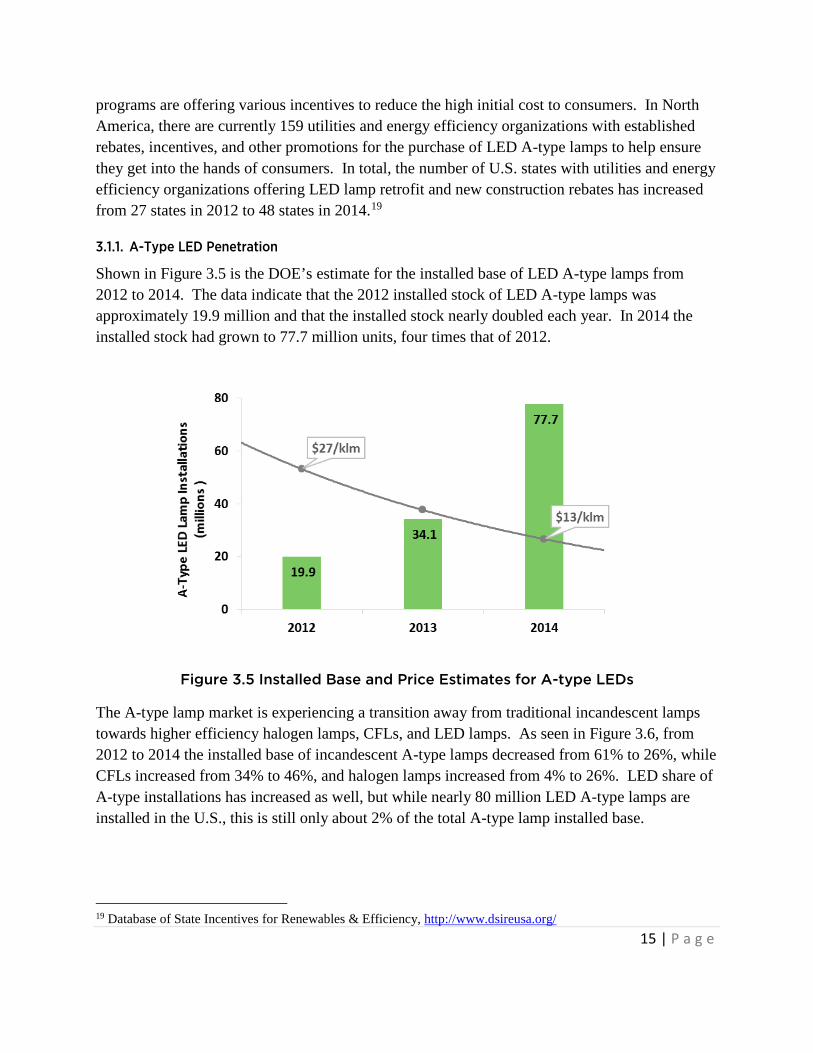
Shown in Figure 3.5 is the DOE’s estimate for the installed base of LED A-type lamps from 2012 to 2014. The data indicate that the 2012 installed stock of LED A-type lamps was approximately 19.9 million and that the installed stock nearly doubled each year. In 2014 the installed stock had grown to 77.7 million units, four times that of 2012.
Figure 3.5 Installed Base and Price Estimates for A-type LEDs
The A-type lamp market is experiencing a transition away from traditional incandescent lamps towards higher efficiency halogen lamps, CFLs, and LED lamps. As seen in Figure 3.6, from 2012 to 2014 the installed base of incandescent A-type lamps decreased from 61% to 26%, while CFLs increased from 34% to 46%, and halogen lamps increased from 4% to 26%. LED share of A-type installations has increased as well, but while nearly 80 million LED A-type lamps are installed in the U.S., this is still only about 2% of the total A-type lamp installed base.
19 Database of State Incentives for Renewables & Efficiency, http://www.dsireusa.org/

16 | P a g e
Figure 3.6 Evolution of A-type Installed Base
3.1.2. A-Type LED Energy Savings
The total energy consumption of A-type lamps has decreased by roughly 10% to 756 tBtu since 2012. This decrease in energy use is largely due to the implementation of the EISA 2007 standards (see Appendix A), which contributed to the reduction of incandescent lamps in favor of more efficient options (including LEDs).
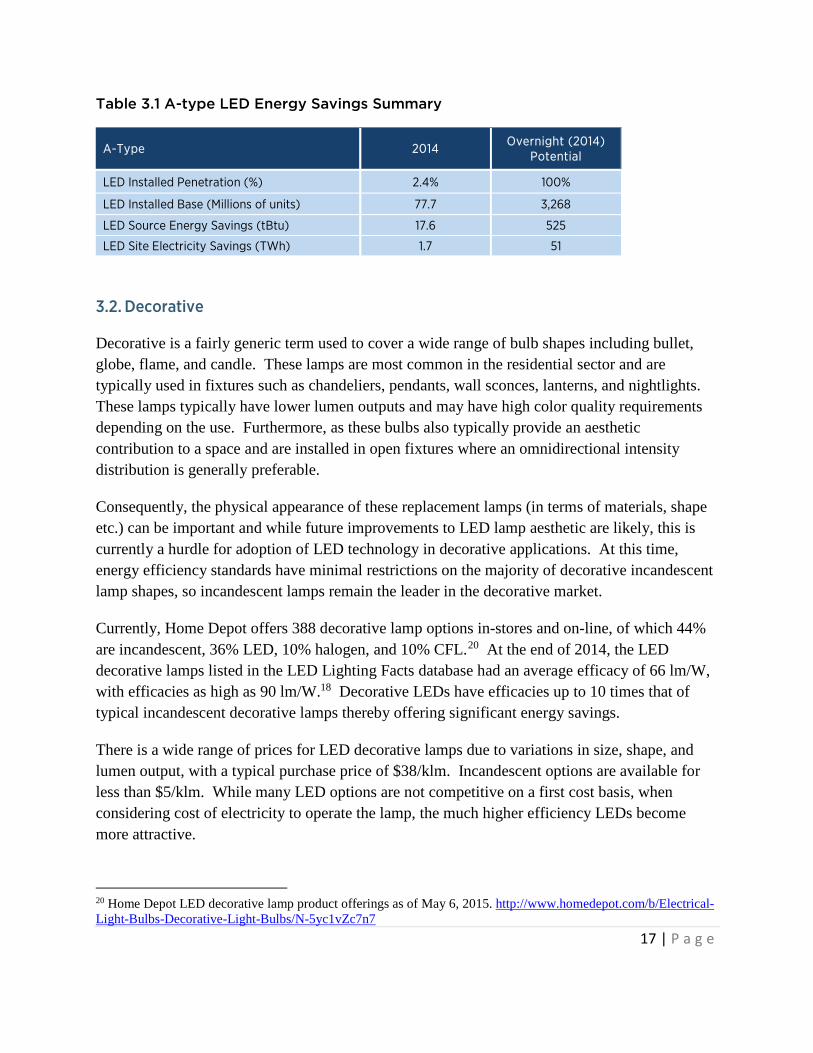
The 2014 estimated energy savings from LED A-type lamps is highly dependent on the percentage installed in commercial versus residential buildings due to the large difference in average operating hours (see Appendix D), as well as the lamp type that the LED is assumed to replace. It is estimated that the LED A-type lamps installed in 2014 saved about 17.6 tBtu. Table 3.1 depicts the total energy savings due to LED A-type lamps to date and the potential energy savings if the entire nationwide installed base was converted instantaneously to LED replacement lamps.
In 2014, there were approximately 3.27 billion A-type lamps installed in the U.S., 77.7 million of which were LEDs. If all 3.27 billion lamps were to switch to LEDs “overnight,” it would save 51 TWh of site electricity, or about 525 tBtus of source energy. This equates to an annual energy cost savings of $5.3 billion.
17 | P a g e
Table 3.1 A-type LED Energy Savings Summary
A-Type 2014 Overnight (2014) Potential
LED Installed Penetration (%) 2.4% 100%
LED Installed Base (Millions of units) 77.7 3,268
LED Source Energy Savings (tBtu) 17.6 525
LED Site Electricity Savings (TWh) 1.7 51
3.2. Decorative
Decorative is a fairly generic term used to cover a wide range of bulb shapes including bullet, globe, flame, and candle. These lamps are most common in the residential sector and are typically used in fixtures such as chandeliers, pendants, wall sconces, lanterns, and nightlights. These lamps typically have lower lumen outputs and may have high color quality requirements depending on the use. Furthermore, as these bulbs also typically provide an aesthetic contribution to a space and are installed in open fixtures where an omnidirectional intensity distribution is generally preferable.
Consequently, the physical appearance of these replacement lamps (in terms of materials, shape etc.) can be important and while future improvements to LED lamp aesthetic are likely, this is currently a hurdle for adoption of LED technology in decorative applications. At this time, energy efficiency standards have minimal restrictions on the majority of decorative incandescent lamp shapes, so incandescent lamps remain the leader in the decorative market.
Currently, Home Depot offers 388 decorative lamp options in-stores and on-line, of which 44% are incandescent, 36% LED, 10% halogen, and 10% CFL.20 At the end of 2014, the LED decorative lamps listed in the LED Lighting Facts database had an average efficacy of 66 lm/W, with efficacies as high as 90 lm/W.18 Decorative LEDs have efficacies up to 10 times that of typical incandescent decorative lamps thereby offering significant energy savings.
There is a wide range of prices for LED decorative lamps due to variations in size, shape, and lumen output, with a typical purchase price of $38/klm. Incandescent options are available for less than $5/klm. While many LED options are not competitive on a first cost basis, when considering cost of electricity to operate the lamp, the much higher efficiency LEDs become more attractive.
20 Home Depot LED decorative lamp product offerings as of May 6, 2015. http://www.homedepot.com/b/Electrical-Light-Bulbs-Decorative-Light-Bulbs/N-5yc1vZc7n7

18 | P a g e
3.2.1. Decorative LED Penetration
The DOE’s estimate for the installed base of LED decorative lamps from 2012 to 2014 is shown in Figure 3.7. The data indicates that the 2012 installed stock was approximately 4.7 million lamps and tripled to 17.8 million units by the end of 2014.
Figure 3.7 Installed Base and Price Estimates for Decorative LEDs
In 2014 there were 1.2 billion decorative lamps installed within the U.S., and like the A-type lamp market, the decorative lamp market is experiencing a transition away from traditional incandescent lamps towards higher efficiency halogen lamps, CFLs, and LED lamps. However, the design constraints of CFL lamps make them ill-suited for small decorative shapes, and the recent uptake of LEDs is cutting into CFL market share.
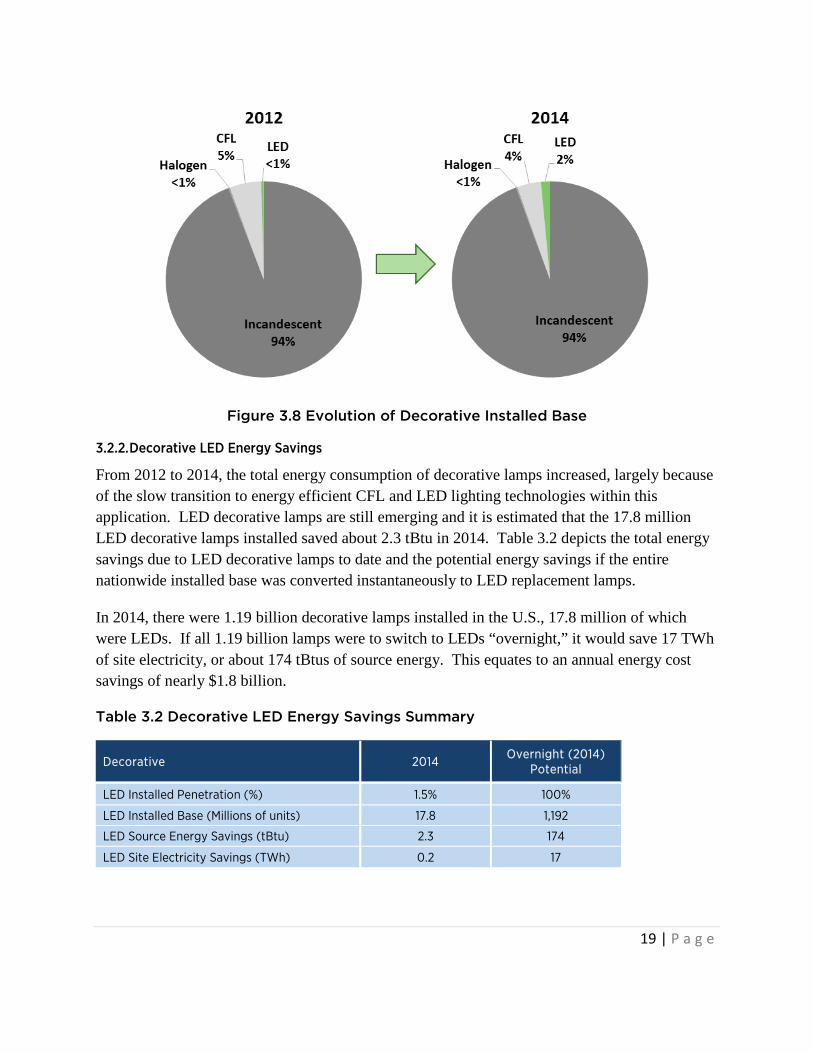
As seen in Figure 3.8, from 2012 to 2014 the installed base of incandescent decorative lamps maintained 94% of the installed base, while CFLs decreased from 5% to 4%. While nearly 18 million LED decorative lamps are installed in the U.S., this is only about 2% of the total decorative lamp installed base.
19 | P a g e
Figure 3.8 Evolution of Decorative Installed Base
3.2.2. Decorative LED Energy Savings
From 2012 to 2014, the total energy consumption of decorative lamps increased, largely because of the slow transition to energy efficient CFL and LED lighting technologies within this application. LED decorative lamps are still emerging and it is estimated that the 17.8 million LED decorative lamps installed saved about 2.3 tBtu in 2014. Table 3.2 depicts the total energy savings due to LED decorative lamps to date and the potential energy savings if the entire nationwide installed base was converted instantaneously to LED replacement lamps.
In 2014, there were 1.19 billion decorative lamps installed in the U.S., 17.8 million of which were LEDs. If all 1.19 billion lamps were to switch to LEDs “overnight,” it would save 17 TWh of site electricity, or about 174 tBtus of source energy. This equates to an annual energy cost savings of nearly $1.8 billion.
Table 3.2 Decorative LED Energy Savings Summary
Decorative 2014 Overnight (2014)
Potential
LED Installed Penetration (%) 1.5% 100%
LED Installed Base (Millions of units) 17.8 1,192
LED Source Energy Savings (tBtu) 2.3 174
LED Site Electricity Savings (TWh) 0.2 17
20 | P a g e
3.3. Directional
Directional fixtures are commonly used for accent, track, pendant, recessed, and architectural lighting in spaces including households, retail displays, restaurants, museums, and office buildings. Directional lamps are predominately reflector type and include incandescent, halogen, CFL, and LED reflector (R), bulged reflector (BR), and parabolic aluminized reflector (PAR) shaped lamps. Multifaceted reflector (MR) such as MR16 lamps are also considered directional lamps; however, because MR lamps have a significantly smaller form-factor and lower light output they are generally used in different applications compared to PAR, BR, and R lamps. As such, small directional lamps are evaluated separately in Section 3.4 of this report.
This section considers large LED directional lamps and integrated LED luminaires that replace incandescent, halogen, and CFL reflector lamps (e.g., PAR, BR, and R lamps) installed in accent, track, and downlight fixtures. Although originally intended for directional lighting applications, downlights have become commonly used for ambient lighting in both residential and commercial buildings.21 These fixtures can be recessed or surface mounted and have become popular because they are inexpensive and can provide inconspicuous ambient lighting. Despite their increasing use for ambient lighting applications, downlighting is included within directional applications for ease of reporting.
The DOE has regulated the energy efficiency level of many directional lamps since 1992,22 and the reflector lamp market is currently undergoing significant changes due to the recent enactment of energy conservation standards. These standards promote the adoption of higher efficiency reflector lamp products including halogen infrared (IR) lamps, CFLs, and LED replacement lamps. Halogen IR lamps are more expensive than standard halogen lamps on the market today (gas mixtures and IR capsules largely contribute to increased cost), which increases the competitiveness of CFLs and LEDs in directional lamp applications. Adapting fluorescent technology for directional lamp applications presents several problems, however. Reflector CFL products are typically bulky and emit light from a larger area compared to an incandescent reflector, making it difficult to create an effective directional lighting source. LED replacements for reflector lamps, on the other hand, have distinct advantages due to the directionality of emitted light and the small form factor.
21 U.S. DOE SSL Program, “Demonstration Assessment of Light-Emitting Diode (LED) Residential Downlights and Undercabinet Lights”, Prepared by PNNL, October 2008. http://apps1.eere.energy.gov/buildings/publications/pdfs/ssl/gateway_eugene.pdf 22 U.S. DOE EERE, “Appliance & Equipment Standards – Incandescent Reflector Lamps”, Accessed May 20, 2015. http://www1.eere.energy.gov/buildings/appliance_standards/product.aspx/productid/58

21 | P a g e
LED Directional Luminaires
LED directional luminaires were some of the earliest applications for SSL in general illumination, particularly LED downlights. The release of the Cree LED LR6 recessed downlight in 2007 marked the beginning of viable LED downlight luminaire products. In addition to its superior efficacy of 54 lm/W, its high lumen output and quality of light made it the first adequate downlight substitute for incandescent and CFL reflector lamps.
This first downlight, the Cree LED LR6, had a price of $200/klm in 2007, but the price has decreased significantly in the recent years enabling this product to reach prices as low as $25/klm. By the end of 2014, typical residential 6-inch downlights reached $30/klm17, but larger integrated commercial type products are closer to $60/klm. CFL pin-based lamps are about $8/klm. LED downlight efficacy has also continued to improve. By the end of 2014, products listed in the LED Lighting Facts database had an average efficacy of 63 lm/W, with the best efficacies reaching 124 lm/W.18
LED Directional Lamps
The LED Lighting Facts database indicates that the efficacy of LED directional replacement lamps from 2014 reached 111 lm/W with the average of 63 lm/W.18 This is significantly greater than the incandescent or halogen lamps they replace that typically have an efficacy of about 10 lm/W to 15 lm/W. The efficacy of these LED lamps has also surpassed that of CFL reflectors that have efficacies that vary from 35 lm/W to 45 lm/W.
LEDs’ biggest barrier to adoption continues to be price. However, prices have been decreasing, and by the end of 2014, the typical purchase price of an LED directional lamp was $21/klm. This remains more expensive than CFL and halogen reflector lamps which have prices between $5/klm and $10/klm, but due to significant energy savings and longer life, LEDs can be competitive when comparing the total cost of ownership of the different lamps.
3.3.1. Directional LED Penetration
Shown in Figure 3.9 is the DOE’s estimate for the installed base of both LED lamps and luminaires in directional applications from 2012 to 2014. The 2012 installed stock was approximately 11.4 million lamps and 5.5 million luminaires. In 2014, the installed stock had grown to 46.9 million lamps and 20.1 million luminaires.

22 | P a g e
Figure 3.9 Installed Base and Price Estimates for Directional LEDs
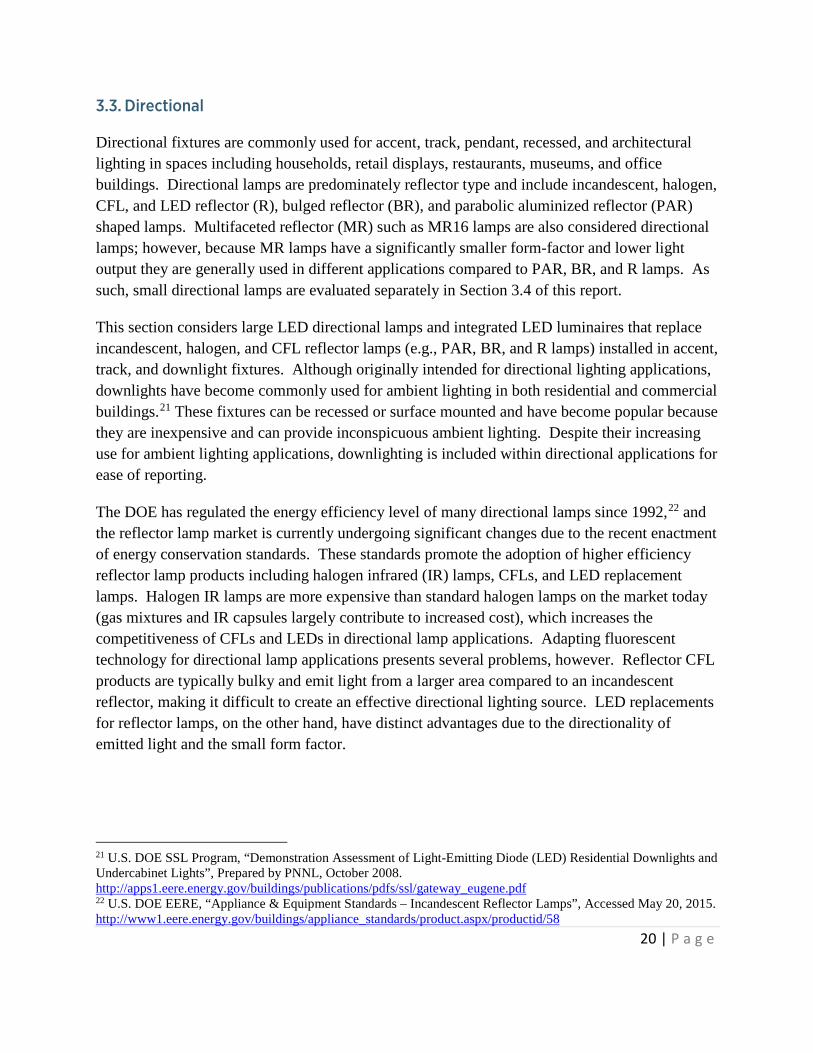
Similar to A-type lamp applications, directional fixtures are also experiencing a transition away from traditional incandescent lamps towards higher efficiency halogen lamps, CFLs, and LEDs (either replacement lamps or integrated luminaires). As seen in Figure 3.10, from 2012 to 2014 the installed base of incandescent lamps decreased from 57% to 54%, while halogen remained steady at 13%. Figure 3.10 also indicates that the installed base of reflector CFLs has decreased between 2012 and 2014, and similar to incandescent reflector lamps, are losing market share to LEDs. LEDs have made good progress in directional installations, with LED replacement lamps and integrated luminaires making up 4% and 2% of the total directional installed base in 2014, respectively.
23 | P a g e
Figure 3.10 Evolution of Directional Installed Base
3.3.2. Directional LED Energy Savings
From 2012 to 2014, the total energy consumption of directional installations has decreased from 467 tBtu to 455 tBtu. These savings can largely be attributed to the quick uptake of LEDs. It is estimated that the 67 million LED directional installations in 2014 saved about 30 tBtu. Table 3.3 depicts the total energy savings due to directional LEDs and the potential energy savings if the entire nationwide installed base was converted instantaneously to LED lamp and luminaire replacements.
In 2014, there were roughly 1.15 billion directional installations in the U.S., 67 million of which were LED. If all 1.15 billion were to switch to LEDs “overnight”, it would save 31 TWh of site electricity, or about 324 tBtus of source energy. This equates to an annual energy cost savings of nearly $3.1 billion.
Table 3.3 Directional LED Energy Savings Summary
Directional 2014 Overnight (2014) Potential
LED Installed Penetration (%) 5.8% 100%
LED Installed Base (Millions of units)
Luminaires 20.1 1,148
Lamps 46.9
LED Source Energy Savings (tBtu) 30.0 324
LED Site Electricity Savings (TWh) 2.9 31

24 | P a g e
3.4. Small Directional
Similar to the directional lamps (PAR, BR, and R) discussed in the previous section, small directional applications, largely comprised of MR16 lamps, are primarily halogen incandescent light sources. However, MR16 lamps are unique among directional lamps because they are often operated at low voltage and their design is constrained by a small form-factor.23 These lamps are widely used for accent, task, and display lighting in museums, art galleries, retail stores, residential settings, and entertainment venues. Although MR16 lamps are used in similar spaces to the directional applications discussed in Section 3.3, MR16 lamps are particularly optimal for jewelry and other display applications due to their high color rendering index (CRI) values and tightly-controlled, high-intensity beams.
The small form-factor, required dimmability, and optical control of MR16 lamps cannot be duplicated with CFL technology, but can be met by LEDs. In addition, the efficiencies of LEDs greatly outpace that of the incumbent technology. Traditional halogen MR16 lamps are only capable of efficacies between 10 lm/W and 25 lm/W, while the average of MR16 products reported in LED Lighting Facts is 58 lm/W with some reaching 95 lm/W.18
For MR16 lamps, beam angle and center beam intensity are typically the most important performance attributes. Center beam intensity values for halogen MR16 lamps range from 230 to 16,000 candelas and are affected by both the lamp wattage (as it relates to light output) and the beam angle of the lamp. Depending on the application, a narrow beam (nominal 10 or 12 degree) with a high center beam intensity may be needed, or a wider beam (nominal 25 to 40 degree) with lower center beam intensity may be appropriate. These metrics still are not mandatory reporting items; however, increasingly, manufacturers are providing this data to end-users. The number of LED MR16 lamps that report beam angle and center beam intensity in the LED Lighting Facts product database has increased from fewer than 20% of the 436 listed product in 2012 to just under 40% of the 503 listed in May 2015. Of those, the current average beam angle reported is 33 degrees and center beam intensity is 1350 candelas.
Another barrier to adoption, as with most LED lighting products, is still the price. Prices have continued to decline, with the typical purchase price of LED MR16s reaching $40/klm in 2014. While still more expensive than halogen reflectors (at about $11/klm), because LEDs offer significant energy savings over halogen MR16 lamps, they are competitive on a total cost of ownership basis. LED replacements have been commercially successful within this application, and their market presence continues to grow.
23 Most MR16 lamps are operated using voltages lower than 120 volts, typically 12 volts; however, GU10 options at 120 volts are also available.
25 | P a g e
3.4.1. Small Directional LED Penetration
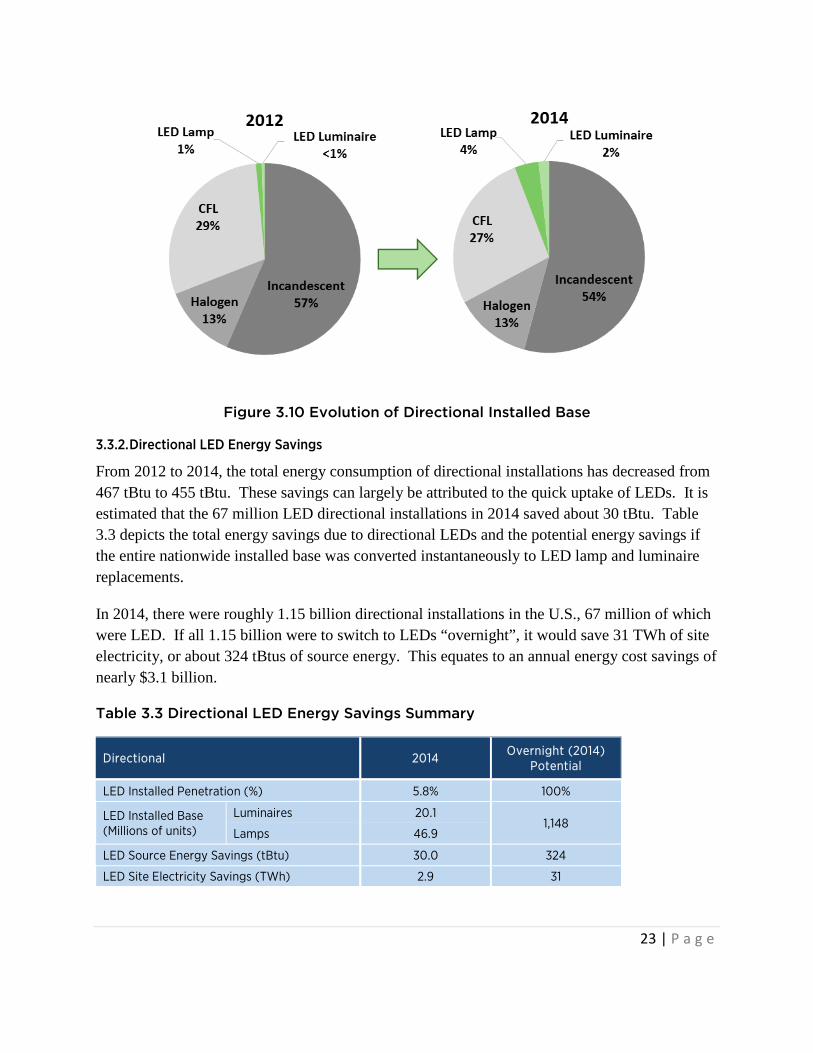
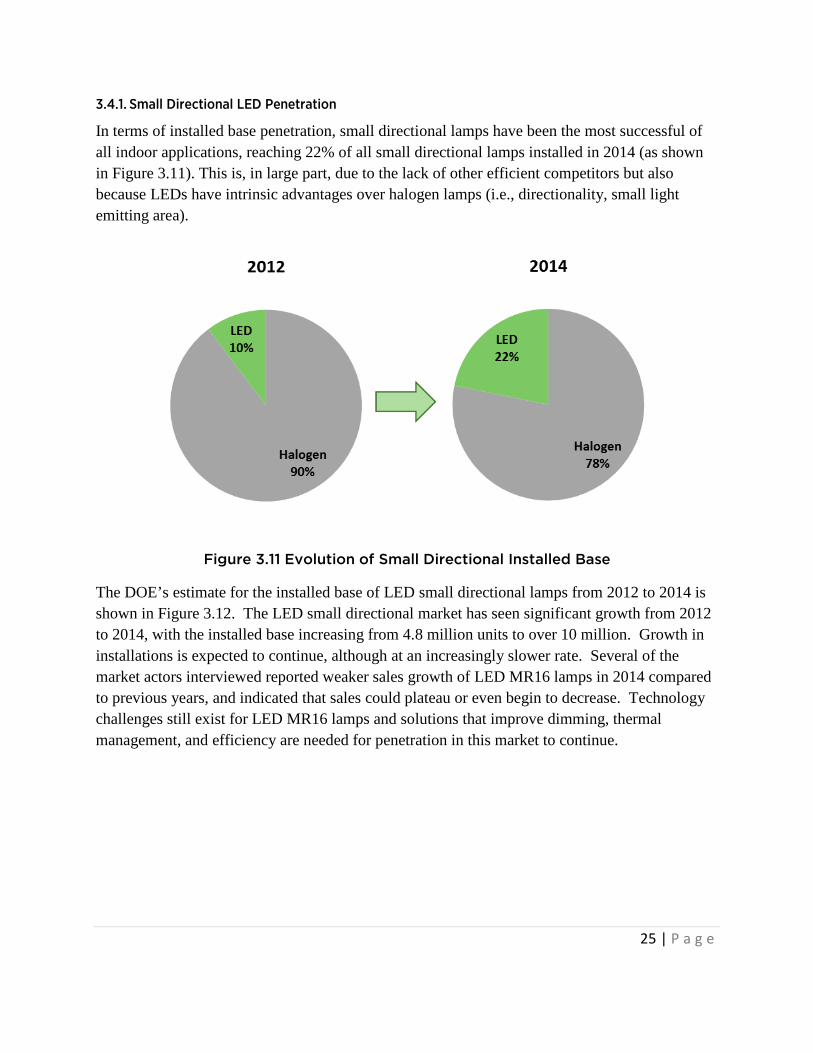
In terms of installed base penetration, small directional lamps have been the most successful of all indoor applications, reaching 22% of all small directional lamps installed in 2014 (as shown in Figure 3.11). This is, in large part, due to the lack of other efficient competitors but also because LEDs have intrinsic advantages over halogen lamps (i.e., directionality, small light emitting area).
Figure 3.11 Evolution of Small Directional Installed Base
The DOE’s estimate for the installed base of LED small directional lamps from 2012 to 2014 is shown in Figure 3.12. The LED small directional market has seen significant growth from 2012 to 2014, with the installed base increasing from 4.8 million units to over 10 million. Growth in installations is expected to continue, although at an increasingly slower rate. Several of the market actors interviewed reported weaker sales growth of LED MR16 lamps in 2014 compared to previous years, and indicated that sales could plateau or even begin to decrease. Technology challenges still exist for LED MR16 lamps and solutions that improve dimming, thermal management, and efficiency are needed for penetration in this market to continue.

26 | P a g e
Figure 3.12 Installed Base and Price Estimates for Small Directional LEDs
3.4.2. Small Directional LED Energy Savings
The total energy consumption of small directional lamps in 2014 was approximately 44 tBtu. It is estimated that the 10.3 million LED small directional lamps installed in 2014 saved about 15.4 tBtu. Table 3.4 depicts the total energy savings due to LED small directional lamps and the potential energy savings if the entire nationwide installed base was converted instantaneously to LED replacements.
In 2014, there were 47 million small directional lamps installed in the U.S., 10.3 million of which were LEDs. If all 47 million lamps were to switch to LEDs “overnight”, it would save 3.6 TWh of site electricity, or about 38 tBtus of source energy. This equates to an annual energy cost savings of about $380 million.
Table 3.4 Small Directional LED Energy Savings Summary
Small Directional 2014 Overnight (2014) Potential
LED Installed Penetration (%) 22% 100%
LED Installed Base (Millions of units) 10.3 47
LED Source Energy Savings (tBtu) 15.4 38
LED Site Electricity Savings (TWh) 1.5 3.6

27 | P a g e
3.5. Linear Fixtures
This section covers LED replacement of linear fixtures including all troffer, panel, suspended, and pendant luminaires, as well as LED linear replacement lamps that can be used in existing linear fixtures. However, linear fixture systems used in low/high bay and parking garage applications are covered separately in sections 3.6 and 3.9, respectively.
Linear fluorescent systems (with T5, T8, and T12 lamps) are widely utilized for commercial and industrial establishments because they offer a low-cost, highly efficient and long-lifetime light source. As a result, these fluorescent systems represent nearly half of all lighting service (in lumen-hours) in the U.S. Because of the significant lighting service required by these applications, the penetration of LED lighting has the potential to greatly reduce total energy consumption. However, modern linear fluorescent lamp and ballast systems remain tough competitors in terms of efficacy, as well as initial and lifecycle costs, with efficacies as high as 108 lm/W and prices as low as $4/klm.17
LED Linear Luminaires
Fully integrated LED luminaires can replace recessed troffers, surface-mounted fixtures, suspended fixtures, and other direct-lighting fixtures that customarily house a linear fluorescent or U-shaped fluorescent lamp(s) and ballast system. The typical price of an LED linear fixture at the conclusion of 2014 was $53/klm, over 10 times greater than the price of linear fluorescent lamp and ballast systems. The average efficacy for LED troffers listed in LED Lighting Facts is 93 lm/W, less than that of the best linear fluorescent systems. However, by the end of 2014, there were products with efficacies as high as 139 lm/W, and in early 2015, there were products with efficacies over 150 lm/W. 18
LED Linear Lamps
Although cheaper than LED linear fixtures, LED linear replacement “tube” lamps are still more expensive than incumbent fluorescent systems. The typical price of a LED linear replacement lamp at the conclusion of 2014 was $17/klm, nearly ten times the price of linear fluorescent lamps. LED linear lamps listed in the LED Lighting Facts database have an average reported lamp efficacy of 108 lm/W, on par the best linear fluorescent systems. Additionally, LED Lighting Facts reported linear lamp products with efficacies as high as 148 lm/W by the end of 2014 and exceeding 150 lm/W within the first few months of 2015, indicating potential for even more energy savings over linear fluorescent systems.18
3.5.1. Linear Fixture LED Penetration
Shown in Figure 3.13 is the DOE’s estimate for the installed base of both LED linear lamps and luminaires from 2012 to 2014. The 2012 installed stock was approximately 700,000 LED linear

28 | P a g e
luminaires and 400,000 LED replacement lamp systems.24 In 2014, the installed stock had grown to 9.8 million LED luminaires (over ten times that of 2012) and 2.7 million LED lamp systems (nearly seven times that of 2012).
Figure 3.13 Installed Base and Price Estimates for Linear Fixture LEDs24
As shown in Figure 3.14, these numbers still make up only 1% of the linear installed base in 2014. This is unsurprising because linear fluorescent fixtures are tough competitors, making this one of the most difficult applications to penetrate, and the one with the smallest percentage of installed LEDs as of 2014.
24 Installed LED linear replacement lamps represents the number of fixtures utilizing LED linear replacement lamps, roughly 2 lamps per system.
29 | P a g e
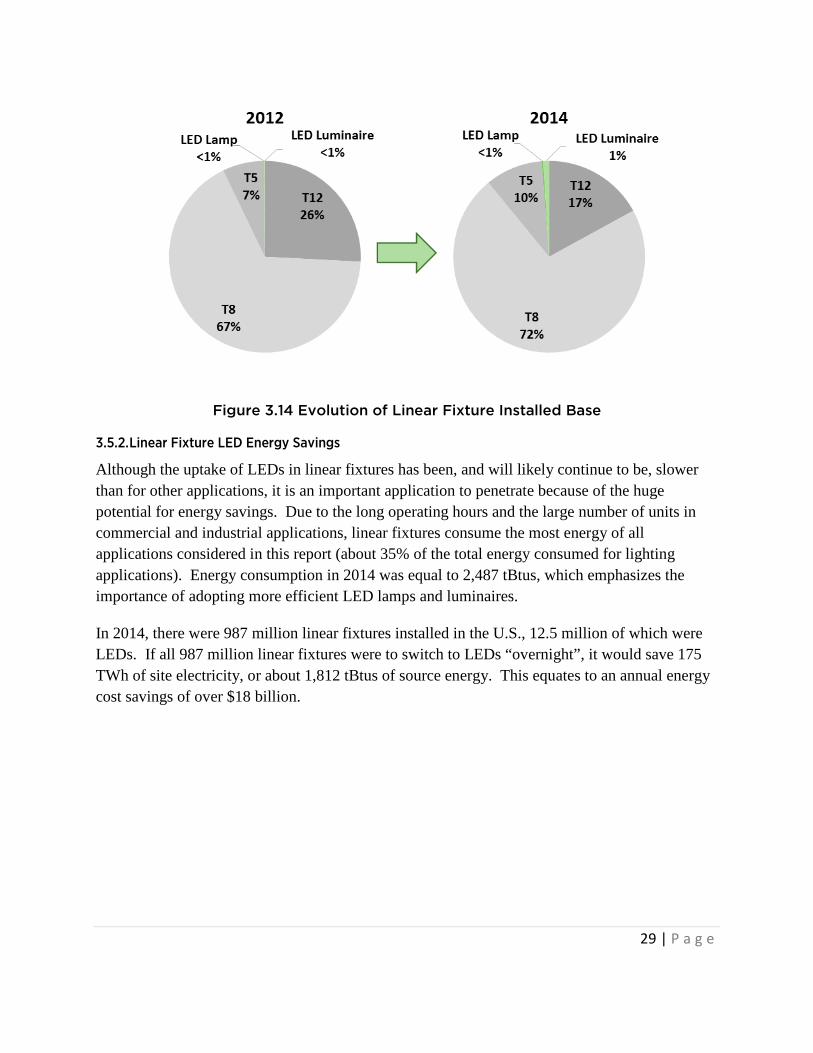
Figure 3.14 Evolution of Linear Fixture Installed Base
3.5.2. Linear Fixture LED Energy Savings
Although the uptake of LEDs in linear fixtures has been, and will likely continue to be, slower than for other applications, it is an important application to penetrate because of the huge potential for energy savings. Due to the long operating hours and the large number of units in commercial and industrial applications, linear fixtures consume the most energy of all applications considered in this report (about 35% of the total energy consumed for lighting applications). Energy consumption in 2014 was equal to 2,487 tBtus, which emphasizes the importance of adopting more efficient LED lamps and luminaires.
In 2014, there were 987 million linear fixtures installed in the U.S., 12.5 million of which were LEDs. If all 987 million linear fixtures were to switch to LEDs “overnight”, it would save 175 TWh of site electricity, or about 1,812 tBtus of source energy. This equates to an annual energy cost savings of over $18 billion.

30 | P a g e
Table 3.5 Linear Fixture LED Energy Savings Summary
Linear Fixture 2014 Overnight (2014)
Potential
LED Installed Penetration (%) 1.3% 100%
LED Installed Base (Millions of units)
Luminaires 9.8 987
Lamps1 2.7
LED Source Energy Savings (tBtu) 22.8 1,812
LED Site Electricity Savings (TWh) 2.2 175
1. Represents the number of fixtures utilizing LED linear replacement lamps, roughly 2 lamps per system.
3.6. Low/High Bay
Low/high bay fixtures are commonly used in both commercial and industrial applications to illuminate large open indoor spaces in big-box retail stores, warehouses, and manufacturing facilities. Typically low bay fixtures are used for ceiling heights of 20 feet or less, while high bay is used for heights of greater than 20 feet. Because of the large areas and lofted ceilings, these spaces require high lumen-output luminaires, with low bay options offering between 5,000 and 15,000 lumens per fixture and high bay providing 15,000 to as much as 100,000 lumens per fixture. This market was historically dominated by HID lamps, although fluorescent lamps, particularly high output T5 lamps, have become a major player due to their superior lumen maintenance and enhanced control options.
Only in the past few years have technological and cost improvements allowed LEDs to penetrate the market in significant quantities. Early generation low and high bay LED luminaires lacked the lumen output to compete in this market. By 2013, the LED Lighting Facts database had 269 listed low and high bay luminaire products. Currently, there are 1,415 listed high bay luminaire products, 55% of which emit over 15,000 lumens and 14% of which emit more than 25,000 lumens. Of the 482 low bay luminaires listed in the LED Lighting Facts database, the average output was just under 8,000 lumens.
The typical price of an LED low/high bay fixture at the conclusion of 2014 was $47/klm. The low/high bay luminaires listed in LED Lighting Facts had an average efficacy of 97 lm/W and maximum efficacies as high as 141 lm/W.18
3.6.1. Low/High Bay LED Penetration
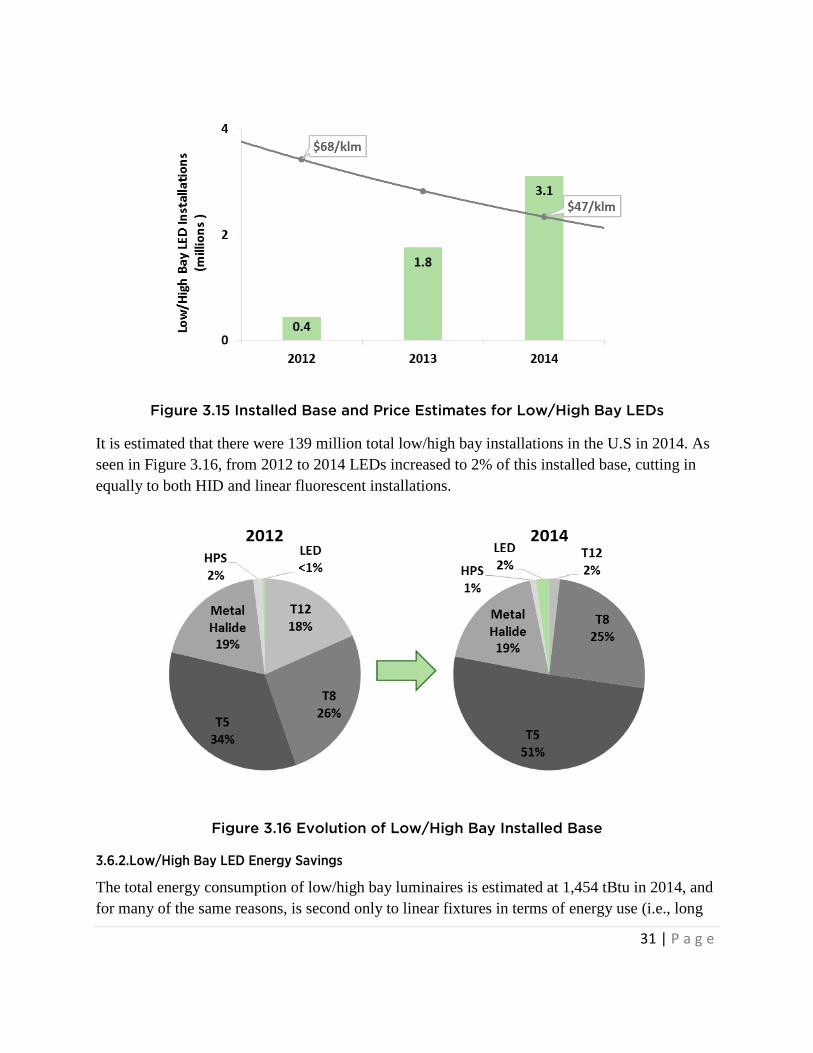
DOE’s estimate for the installed base of LED low/high bay luminaires from 2012 to 2014 is shown in Figure 3.15. The data indicates that the 2012 installed stock was about 400,000, and continued increasing to 3.1 million units in 2014.
31 | P a g e
Figure 3.15 Installed Base and Price Estimates for Low/High Bay LEDs
It is estimated that there were 139 million total low/high bay installations in the U.S in 2014. As seen in Figure 3.16, from 2012 to 2014 LEDs increased to 2% of this installed base, cutting in equally to both HID and linear fluorescent installations.
Figure 3.16 Evolution of Low/High Bay Installed Base
3.6.2. Low/High Bay LED Energy Savings
The total energy consumption of low/high bay luminaires is estimated at 1,454 tBtu in 2014, and for many of the same reasons, is second only to linear fixtures in terms of energy use (i.e., long

32 | P a g e
operating hours, large number of fixtures). Table 3.6 depicts the total energy savings from LED low/high bay luminaires to date and the potential energy savings if the entire nationwide installed base was converted instantaneously to LED low/high bay luminaires.
In 2014, there were 139 million low/high bay fixtures installed in the U.S., 3.1 million of which were LED. If all 139 million fixtures were to switch to LEDs “overnight”, it would save 112 TWh of site electricity, or about 1,165 tBtus of source energy. This equates to an annual energy cost savings of nearly $12 billion.
Table 3.6 Low/High Bay LED Energy Savings Summary
Low/High Bay 2014 Overnight (2014) Potential
LED Installed Penetration (%) 2.2% 100%
LED Installed Base (Millions of units) 3.1 139
LED Source Energy Savings (tBtu) 24.1 1,165
LED Site Electricity Savings (TWh) 2.3 112
3.7. Area/Roadway
Area and roadway luminaires serve to illuminate streets and roadways to improve visibility for drivers as well as to illuminate outdoor pedestrian walkways. To date, this application is dominated by HID light sources such as high pressure sodium (HPS), metal halide (MH), and mercury vapor (MV) lamps because they offer relatively high efficacy, operate effectively over a wide temperature range, and produce high lumen outputs which enable them to be mounted on widely spaced poles.
LEDs are particularly advantageous in area and roadway lighting applications because they are excellent directional light sources, are durable, and exhibit long lifetimes. LED area and roadway luminaires also significantly decrease the amount of light pollution compared to incumbent HID fixtures, because their improved optical distribution substantially reduces the amount of light wasted upward into the atmosphere. Because of these advantages, many local jurisdictions have initiated projects to completely transition their area/roadway lighting to LEDs. For example, the City of Los Angeles has completed a citywide street lighting replacement program and has installed over 150,000 LED streetlights, reducing energy usage by 63%, and saving $8 million in annual energy costs.25
25 City of Los Angeles Department of Public Works Bureau of Street Lighting: http://bsl.lacity.org/downloads/led/LED_Energy_Savings_010215.pdf

33 | P a g e
Although still more expensive than incumbent competitors HPS, MH, and MV at $1.2/klm, $2.1/klm, and $2.0/klm, respectively, the typical price of area and roadway luminaires have nearly halved from 2010 to 2014, reaching about $58/klm or about $300/fixture.17
The average efficacy of area and roadway luminaires in the LED Lighting Facts database is 87 lm/W, with efficacies reaching as high as 137 lm/W.18 With the best equivalent HID lamp and ballast systems topping out at about 130 lm/W, LEDs are a persuasive option due to the potential for energy savings. Additionally, LED area and roadway luminaires have typical rated lifetimes exceeding 50,000 hours, more than three times that of many HID systems. This is particularly attractive when considering the long operating hours along with the difficulty and expense of required maintenance.
3.7.1. Area/Roadway LED Penetration
LEDs saw early success in area and roadway applications, in large part due to LED retrofit projects funded by local jurisdictions. As shown in Figure 3.17, in 2012, LEDs already held an impressive 3% of the area and roadway installed base. They have continued to replace HID installations, making up an estimated 13% of the installed base by the end of 2014.
Figure 3.17 Evolution of Area/Roadway Installed Base
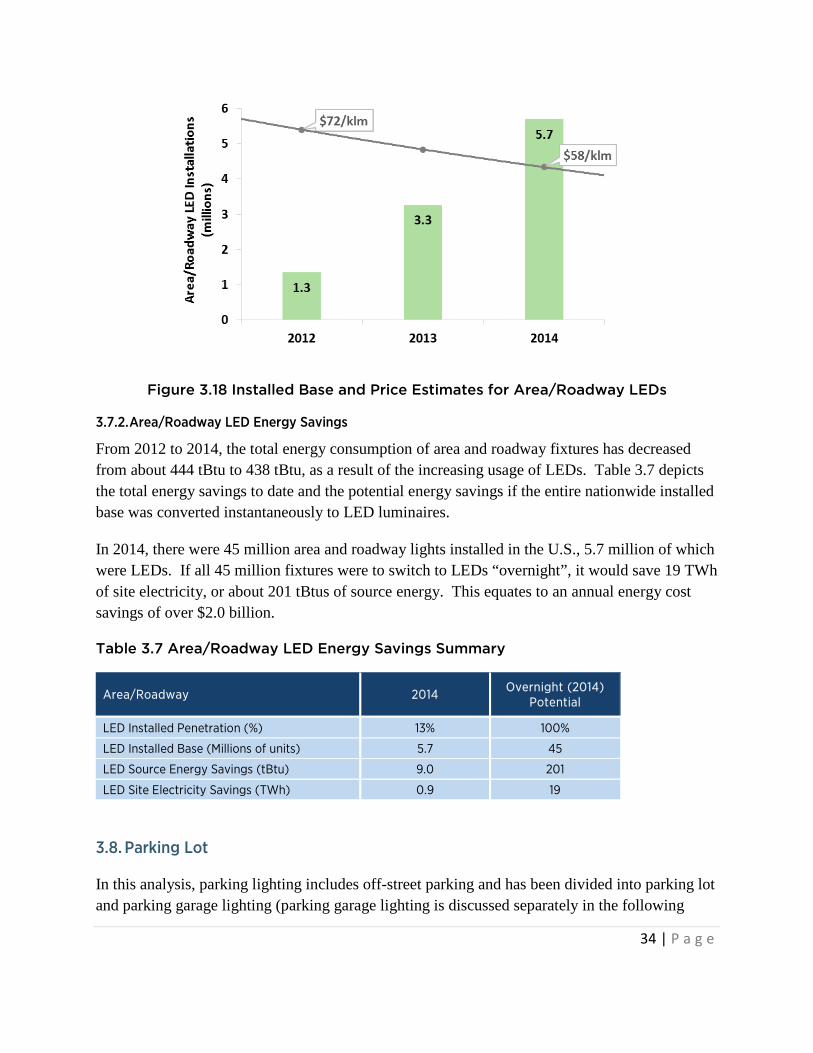
Figure 3.18 shows the DOE’s estimate for the installed base of LED area and roadway luminaires from 2012 to 2014. In 2012, there were 1.3 million LED area and roadway installations, which increased more than four times to 5.7 million LED luminaires installed by the end of 2014.
34 | P a g e
Figure 3.18 Installed Base and Price Estimates for Area/Roadway LEDs
3.7.2. Area/Roadway LED Energy Savings
From 2012 to 2014, the total energy consumption of area and roadway fixtures has decreased from about 444 tBtu to 438 tBtu, as a result of the increasing usage of LEDs. Table 3.7 depicts the total energy savings to date and the potential energy savings if the entire nationwide installed base was converted instantaneously to LED luminaires.
In 2014, there were 45 million area and roadway lights installed in the U.S., 5.7 million of which were LEDs. If all 45 million fixtures were to switch to LEDs “overnight”, it would save 19 TWh of site electricity, or about 201 tBtus of source energy. This equates to an annual energy cost savings of over $2.0 billion.
Table 3.7 Area/Roadway LED Energy Savings Summary
Area/Roadway 2014 Overnight (2014) Potential
LED Installed Penetration (%) 13% 100%
LED Installed Base (Millions of units) 5.7 45
LED Source Energy Savings (tBtu) 9.0 201
LED Site Electricity Savings (TWh) 0.9 19
3.8. Parking Lot
In this analysis, parking lighting includes off-street parking and has been divided into parking lot and parking garage lighting (parking garage lighting is discussed separately in the following

35 | P a g e
Section 3.9). Public safety concerns demand that luminaires used in both open air parking lots and garages produce high quality light with a low probability of failure. Given these operating conditions, the type of lighting used for parking lots closely mimics the technologies used for area and roadway lighting (discussed in Section 3.7).
Despite the similarities, penetration of LEDs in parking lot lighting lags behind that of area and roadway lighting most likely because LED streetlighting adoption has come from local municipalities embarking on city-wide LED upgrades, while the majority of parking lot lighting is curated by private businesses. However, LEDs offer distinct advantages in parking lot applications and in particular can significantly improve light utilization. For example, in a recent retrofit project LED parking lot fixtures demonstrated an 85% reduction in energy usage compared with HID fixtures due to improved efficiency and reduced lumen output due to improved distribution control.26 The retrofit project also illuminated significantly more of the parking lot area, which is particularly advantageous for both driver and pedestrian safety.27
3.8.1. Parking Lot LED Penetration
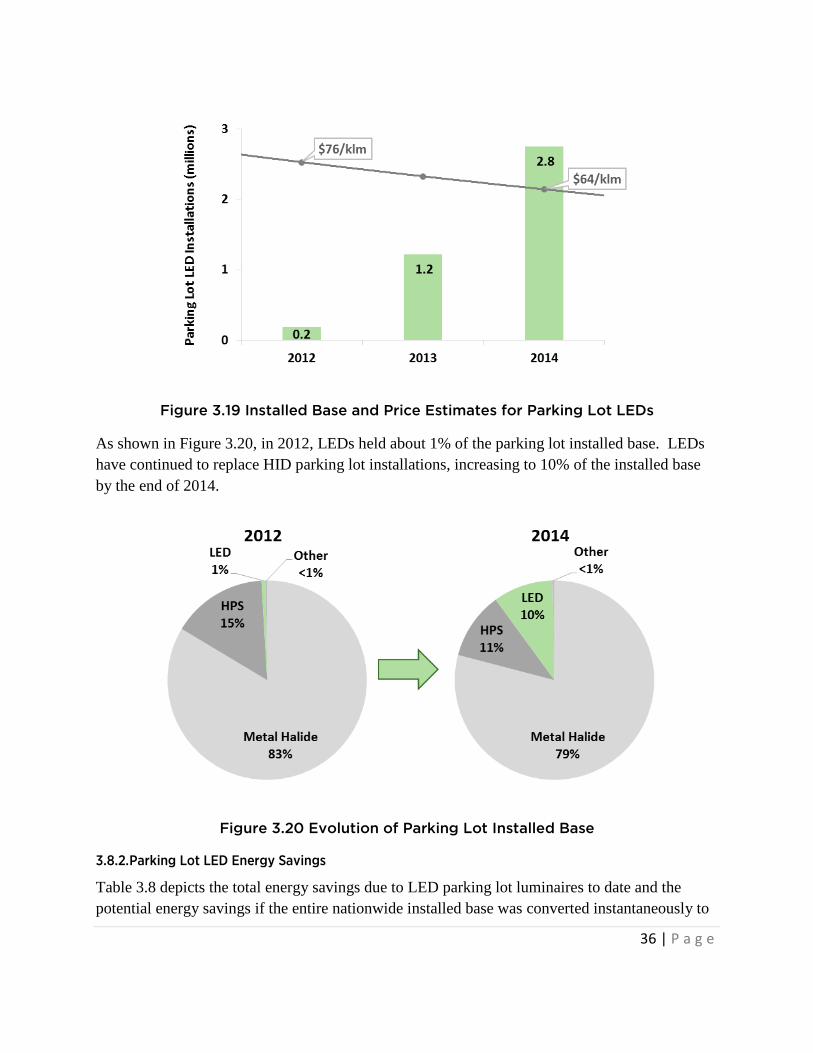
Figure 3.19 shows the DOE’s estimate for the installed base of LED parking lot luminaires from 2012 to 2014. In 2012, there were about 200,000 LED parking lot installations, but this number has more than doubled each year, reaching nearly 2.8 million by the end of 2014.
26 These energy savings benefits are also due to improved uniformity ratios and minimum illuminance criterion for parking lot applications in IES RP-20-14 – Lighting for Parking Facilities. 27 U.S. DOE Federal Energy Management Program, LED Parking Lighting in Federal Facilities, October 2014. http://energy.gov/sites/prod/files/2014/12/f19/mcb_quantico_2014.pdf
36 | P a g e
Figure 3.19 Installed Base and Price Estimates for Parking Lot LEDs
As shown in Figure 3.20, in 2012, LEDs held about 1% of the parking lot installed base. LEDs have continued to replace HID parking lot installations, increasing to 10% of the installed base by the end of 2014.
Figure 3.20 Evolution of Parking Lot Installed Base
3.8.2. Parking Lot LED Energy Savings
Table 3.8 depicts the total energy savings due to LED parking lot luminaires to date and the potential energy savings if the entire nationwide installed base was converted instantaneously to
37 | P a g e
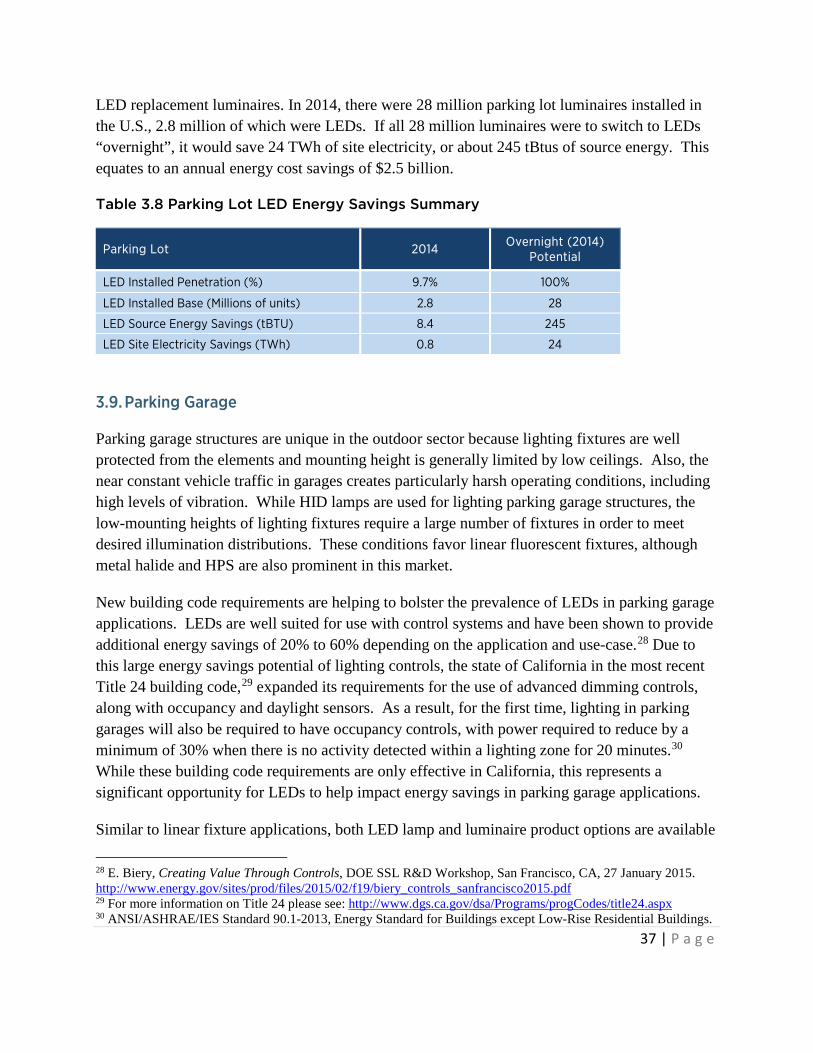
LED replacement luminaires. In 2014, there were 28 million parking lot luminaires installed in the U.S., 2.8 million of which were LEDs. If all 28 million luminaires were to switch to LEDs “overnight”, it would save 24 TWh of site electricity, or about 245 tBtus of source energy. This equates to an annual energy cost savings of $2.5 billion.
Table 3.8 Parking Lot LED Energy Savings Summary
Parking Lot 2014 Overnight (2014) Potential
LED Installed Penetration (%) 9.7% 100%
LED Installed Base (Millions of units) 2.8 28
LED Source Energy Savings (tBTU) 8.4 245
LED Site Electricity Savings (TWh) 0.8 24
3.9. Parking Garage
Parking garage structures are unique in the outdoor sector because lighting fixtures are well protected from the elements and mounting height is generally limited by low ceilings. Also, the near constant vehicle traffic in garages creates particularly harsh operating conditions, including high levels of vibration. While HID lamps are used for lighting parking garage structures, the low-mounting heights of lighting fixtures require a large number of fixtures in order to meet desired illumination distributions. These conditions favor linear fluorescent fixtures, although metal halide and HPS are also prominent in this market.
New building code requirements are helping to bolster the prevalence of LEDs in parking garage applications. LEDs are well suited for use with control systems and have been shown to provide additional energy savings of 20% to 60% depending on the application and use-case.28 Due to this large energy savings potential of lighting controls, the state of California in the most recent Title 24 building code,29 expanded its requirements for the use of advanced dimming controls, along with occupancy and daylight sensors. As a result, for the first time, lighting in parking garages will also be required to have occupancy controls, with power required to reduce by a minimum of 30% when there is no activity detected within a lighting zone for 20 minutes.30 While these building code requirements are only effective in California, this represents a significant opportunity for LEDs to help impact energy savings in parking garage applications.
Similar to linear fixture applications, both LED lamp and luminaire product options are available
28 E. Biery, Creating Value Through Controls, DOE SSL R&D Workshop, San Francisco, CA, 27 January 2015. http://www.energy.gov/sites/prod/files/2015/02/f19/biery_controls_sanfrancisco2015.pdf 29 For more information on Title 24 please see: http://www.dgs.ca.gov/dsa/Programs/progCodes/title24.aspx 30 ANSI/ASHRAE/IES Standard 90.1-2013, Energy Standard for Buildings except Low-Rise Residential Buildings.

38 | P a g e
for parking garage applications. By the end of 2014 lamp products listed in the LED Lighting Facts database had an average reported lamp efficacy of 108 lm/W and efficacies as high as 148 lm/W, while luminaires had an average efficacy of 85 lm/W with a maximum of 150 lm/W.18 With the best HID and LFL lamp and ballast systems topping out at 130 lm/W and 108 lm/W, respectively, LEDs offer the potential for additional energy savings.17 However, at $17/klm for lamp options and over $100/klm for luminaires, LED parking garage products are still more expensive than LFL and HID options, $2/klm and $13/klm respectively. Therefore, price remains a barrier.
3.9.1. Parking Garage LED Penetration
Figure 3.21 shows the DOE’s estimate for the installed base of LED parking garage lamps and luminaires from 2012 to 2014. In 2012, there were only about 400,000 LED parking garage installations, but this number has nearly doubled each year, reaching close to 1.8 million by the end of 2014. The majority of installations have been LED luminaires, and they are growing at a faster rate than LED lamps. In 2012, 83% of LED parking garage installations were luminaires, compared to 87% in 2014.
Figure 3.21 Installed Base and Price Estimates for Parking Garage LEDs
While 1.8 million installations may seem small compared to the other applications discussed in this report, it corresponds to a respectable 5% of the total installed base, as shown in Figure 3.22. In 2012, LEDs held only about 1% of the parking garage installed base.

39 | P a g e
Figure 3.22 Evolution of Parking Garage Installed Base
3.9.2. Parking Garage LED Energy Savings
Table 3.9 depicts the total energy savings due to LED parking garage installations to date and the potential energy savings if the entire nationwide installed base was converted instantaneously to LED. In 2014, there were 37 million parking garage installations in the U.S., 1.8 million of which were LEDs. If all 37 million installations were to switch to LEDs “overnight”, it would save 14 TWh of site electricity, or about 147 tBtus of source energy. This equates to an annual energy cost savings of $1.5 billion.
Table 3.9 Parking Garage LED Energy Savings Summary
Parking Garage 2014 Overnight (2014) Potential
LED Installed Penetration (%) 5.0% 100%
LED Installed Base (Millions of units)
Luminaires 1.6 37
Lamps1 0.2
LED Source Energy Savings (tBtu) 1.7 147
LED Site Electricity Savings (TWh) 0.2 14
1. Represents the number of fixtures utilizing LED linear replacement lamps, roughly 2 lamps per system.
3.10. Building Exterior
Building exterior lighting is designed to illuminate walkways, steps, driveways, porches, decks, building architecture, or landscape areas, and it can be used to provide security outside of

40 | P a g e
residential, commercial, and industrial buildings. Wall packs and floodlights are a common choice for these applications, with CFL, metal halide and high pressure sodium technologies historically being the most commonly used, especially where a high lumen output is required.
LEDs have influenced virtually every aspect of building exterior lighting as qualities such as instant-on, white-color, low maintenance, and good performance have made them increasingly viable options. The ability of LED products to offer low-profile lighting has also made installation easier in areas with tight clearance and offers building managers and specifiers more effective options for lighting narrow areas, such as under benches or accent planters. These small form-factors and the ability to precisely place light sources can result in less light pollution in building exterior applications. LED products may also offer better wall-washing or wall-grazing options for building façades through color tunability and better controllability, thus making them a top choice over incumbent sources.
Building exterior LED lighting includes both lamp and luminaire products; however, reporting in this section has been combined due to the lack of available data on each separately. The listed building exterior LED products in the LED Lighting Facts database offer efficacies that rival the best incumbent HID and linear fluorescent sources. Overall, LEDs had an average of 77 lm/W with and efficacies as high as 132 lm/W.18 However, despite these performance and energy advantages, the tallest hurdle facing the LEDs in building exterior applications is price. At typically greater than $100/klm, LED building exterior lights are still more expensive than all incumbent technology options.
3.10.1. Building Exterior LED Penetration
Figure 3.23 shows the DOE’s estimate for the installed base of LED building exterior lighting products from 2012 to 2014. In 2012, there were about 2.7 million LED building exterior installations, but this number is growing, reaching 7.6 million by the end of 2014.

41 | P a g e
Figure 3.23 Installed Base and Price Estimates for Building Exterior LEDs
As shown in Figure 3.24, in 2012, LEDs held 4% of the building exterior installed base. By the end of 2014, the percentage of building exterior installations that were LED had grown to 11%.
Figure 3.24 Evolution of Building Exterior Installed Base
3.10.2. Building Exterior LED Energy Savings
Table 3.10 depicts the total energy savings due to LED installations to date and the potential energy savings if the entire nationwide installed base of building exterior lights were converted instantaneously to LED sources. In 2014, there were 66 million building exterior installations in
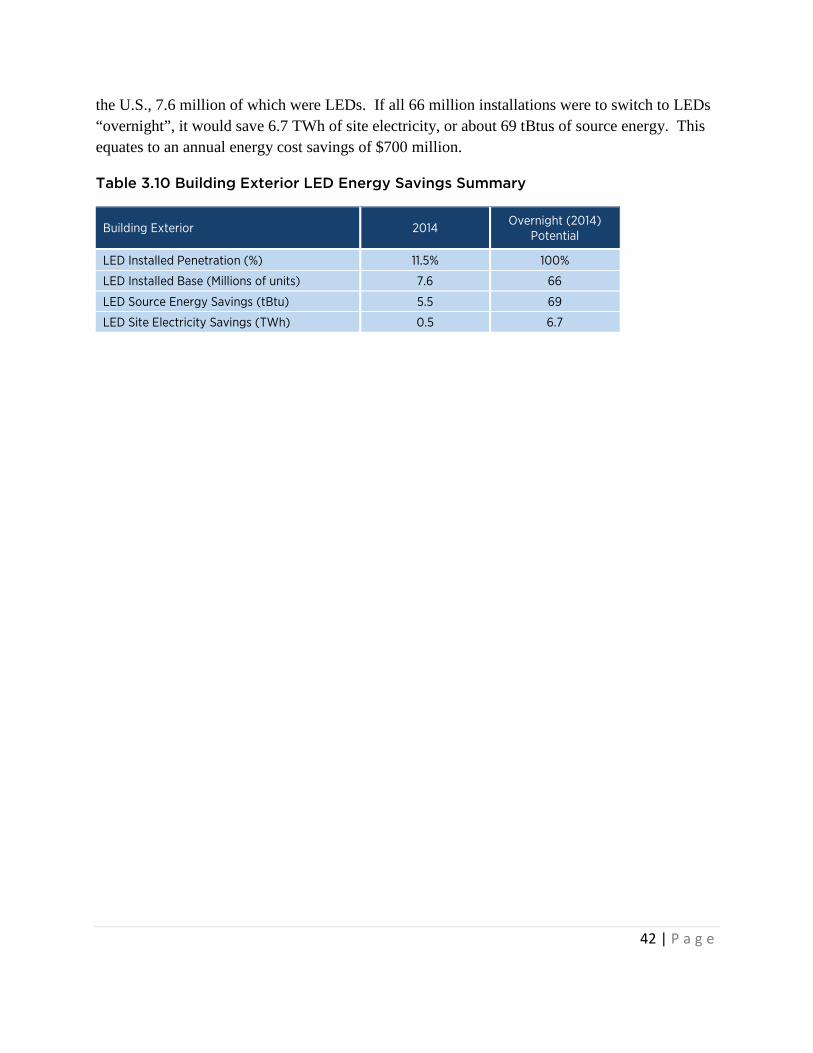
42 | P a g e
the U.S., 7.6 million of which were LEDs. If all 66 million installations were to switch to LEDs “overnight”, it would save 6.7 TWh of site electricity, or about 69 tBtus of source energy. This equates to an annual energy cost savings of $700 million.
Table 3.10 Building Exterior LED Energy Savings Summary
Building Exterior 2014 Overnight (2014) Potential
LED Installed Penetration (%) 11.5% 100%
LED Installed Base (Millions of units) 7.6 66
LED Source Energy Savings (tBtu) 5.5 69
LED Site Electricity Savings (TWh) 0.5 6.7

43 | P a g e
Appendix A. Legislation Affecting the Lighting Market
The Energy Independence and Security Act of 2007 (EISA 2007) established energy conservation standards for general service and modified spectrum incandescent lamps for rated lumen ranges, maximum rated wattage, and minimum rate lifetime, effective January 1, 2014. In effect, these standards establish minimum wattage requirements for general service lamps. For example:
- A lamp with the equivalent lumen output of a traditional 100 W lamp (1490-2600 lumens) must only draw 72 W;
- A lamp with the equivalent lumen output of a traditional 75 W lamp (1050-1489 lumens) must only draw 53 W;
- A lamp with the equivalent lumen output of a traditional 60 W lamp (750-1049 lumens) must only draw 43 W;
- A lamp with the equivalent lumen output of a traditional 40 W lamp (310-749 lumens) must only draw 29 W.
These efficiency requirements were phased into the market between 2012 and 2014 and require the efficacy of all general service incandescent lamps be 45 lm/W or greater starting in 2020. EISA 2007 also mandates energy savings standards for incandescent reflector lamps. The 2009 Final Rule for incandescent reflector lamps applies to lamps manufactured on or after July 14, 2012 and prescribed minimum efficacy standards for products in the 40-205 Watt range, determined by lamp spectrum, lamp diameter, and rated voltage. These standards promote the adoption of higher efficiency reflector lamp products including halogen infrared (IR) lamps, CFLs, and LED replacement lamps. Halogen IR lamps are more expensive than standard halogen lamps on the market today (gas mixtures and IR capsules largely contribute to increased cost), which increases the competitiveness of CFLs and LEDs in directional lamp applications.
DOE has also established energy conservation standards for general service fluorescent lamps (GSFLs). In a 2009 Final Rule, energy efficiency requirements were set that affect 4-foot and 8-foot T5,31 T8,32 and T12 linear fluorescent lamps and 2-foot U-Shaped fluorescent lamps manufactured on or after July 14, 2012. The 2009 Final Rule has helped propel the transition to higher efficiency fluorescent lamps. In addition, on January 1, 2015 DOE published corrections and updates to this standard and added additional coverage for GSFLs.
31 T5 fluorescent lamps are not produced in 8-foot lengths. 32 On April 16, 2012 the Office of Hearings and Appeals (OHA) issued a decision granting relief from the 2009 Final Rule for 700 series T8 fluorescent lamps, http://energy.gov/oha/downloads/exc-12-0001-exc-12-0002-exc-12-0003-matter-philips-lighting-company. This exception is not expected to have an impact on the transition from T12 to T8 GSFLs.

44 | P a g e
In addition to lamps, the DOE has also set standards for mercury vapor and fluorescent ballast. The Energy Policy Act of 2005 (EPAct 2005) banned the manufacture and importation of mercury vapor lamp ballasts (except specialty application mercury vapor lamp ballasts) after January 1, 2008. These ballasts are no longer available for purchase in the United States. The latest standard for fluorescent ballasts applies to those manufactured on or after November 14, 2014. These prescribe minimum ballast efficiency standards effectively shift the fluorescent market from T12 magnetic ballasts to T8 and T5 electronic ballast systems.
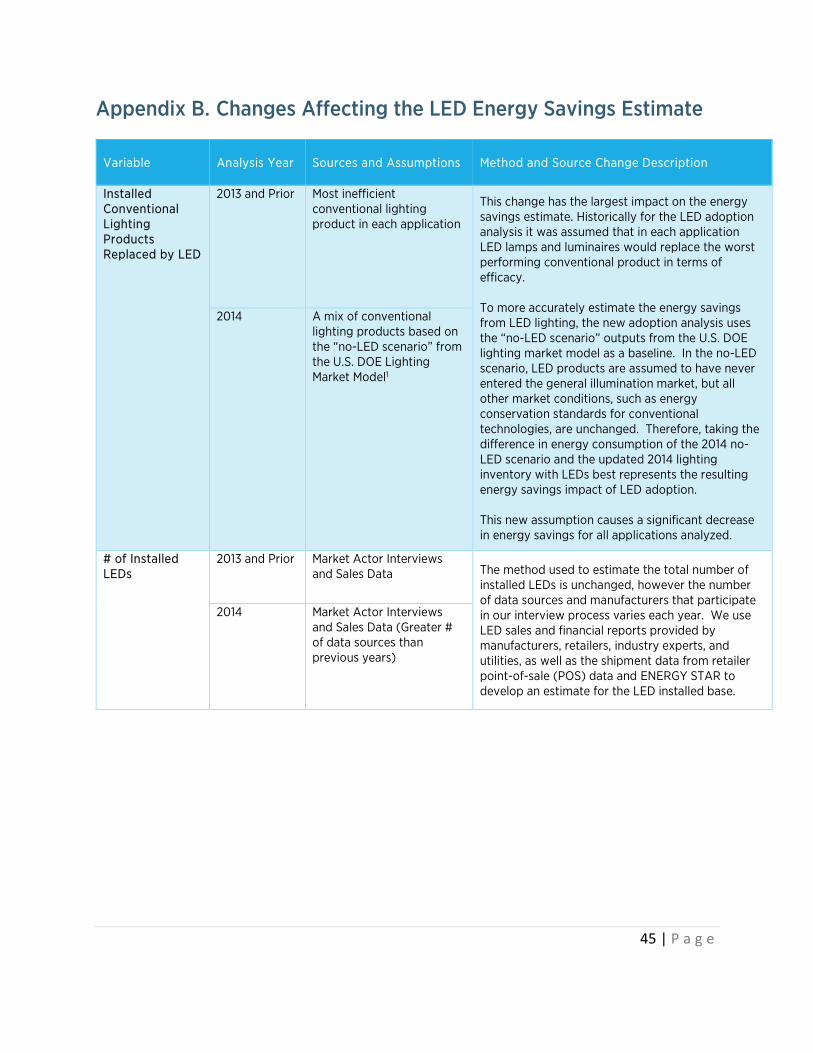
45 | P a g e
Appendix B. Changes Affecting the LED Energy Savings Estimate
Variable Analysis Year Sources and Assumptions Method and Source Change Description
Installed Conventional Lighting Products Replaced by LED
2013 and Prior Most inefficient conventional lighting product in each application
This change has the largest impact on the energy savings estimate. Historically for the LED adoption analysis it was assumed that in each application LED lamps and luminaires would replace the worst performing conventional product in terms of efficacy. To more accurately estimate the energy savings from LED lighting, the new adoption analysis uses the “no-LED scenario” outputs from the U.S. DOE lighting market model as a baseline. In the no-LED scenario, LED products are assumed to have never entered the general illumination market, but all other market conditions, such as energy conservation standards for conventional technologies, are unchanged. Therefore, taking the difference in energy consumption of the 2014 no-LED scenario and the updated 2014 lighting inventory with LEDs best represents the resulting energy savings impact of LED adoption. This new assumption causes a significant decrease in energy savings for all applications analyzed.
2014 A mix of conventional lighting products based on the “no-LED scenario” from the U.S. DOE Lighting Market Model1
# of Installed LEDs
2013 and Prior Market Actor Interviews and Sales Data The method used to estimate the total number of
installed LEDs is unchanged, however the number of data sources and manufacturers that participate in our interview process varies each year. We use LED sales and financial reports provided by manufacturers, retailers, industry experts, and utilities, as well as the shipment data from retailer point-of-sale (POS) data and ENERGY STAR to develop an estimate for the LED installed base.
2014 Market Actor Interviews and Sales Data (Greater # of data sources than previous years)

46 | P a g e
Operating Hours 2013 and Prior U.S. 2010 Lighting Market Characterization33
Operating hour estimates for LEDs and conventional lighting largely come from estimates provided in the U.S. 2010 Lighting Market Characterization. However, for the 2014 analysis, we updated the operating hour assumptions for the residential sector to reflect the results in the U.S. DOE’s Residential Lighting End Use Study. This analysis showed that residential operating hours are lower for some technologies compared to those presented in the 2010 LMC, decreasing from roughly 1.8 hr/day to 1.2 hr/day for incandescent and 1.9 hr/day to 1.5 hr/day for halogen. Using this new data source causes a decrease in energy savings compared to the method used for previous year estimates.
2014 U.S. 2010 Lighting Market Characterization33 + U.S. DOE Residential Lighting End Use Study34
Conventional Lighting Wattage
2013 and Prior U.S. 2010 Lighting Market Characterization33 For 2013 and prior, conventional wattage estimates
come from the U.S. 2010 Lighting Market Characterization. However, for the 2014 analysis, we used the U.S. DOE Lighting Market Model outputs for conventional wattage assumptions. The model starts from the 2010 estimates published in the LMC and projects year-over-year increase in efficiency of: 0.5% for halogen, CFL, metal halide and HPS, 0.2% for T8, T5, mercury vapor, and LPS, and 0.0% for incandescent and T12. This new assumption causes a decrease in energy savings compared to the method used for previous year estimates.
2014 U.S. 2010 Lighting Market Characterization33 + U.S. DOE Lighting Market Model1
LED Lighting Wattage
All Years DOE LED Lighting Facts The method used to estimate the wattage of installed LEDs is unchanged. Average wattages for LED lamps and luminaires were determined by averaging the performance of products listed in the LED Lighting Facts database. To ensure that the LED wattage represents a viable replacement option, performance was averaged if the LED product’s characteristics matched that of a typical conventional lighting system.
33 U.S. DOE SSL Program, 2010 U.S. Lighting Market Characterization, Prepared by Navigant, January 2012. http://apps1.eere.energy.gov/buildings/publications/pdfs/ssl/2010-lmc-final-jan-2012.pdf 34 U.S. DOE SSL Program, Residential Lighting End-Use Consumption Study, Prepared by PNNL, December 2012. http://apps1.eere.energy.gov/buildings/publications/pdfs/ssl/2012_residential-lighting-study.pdf
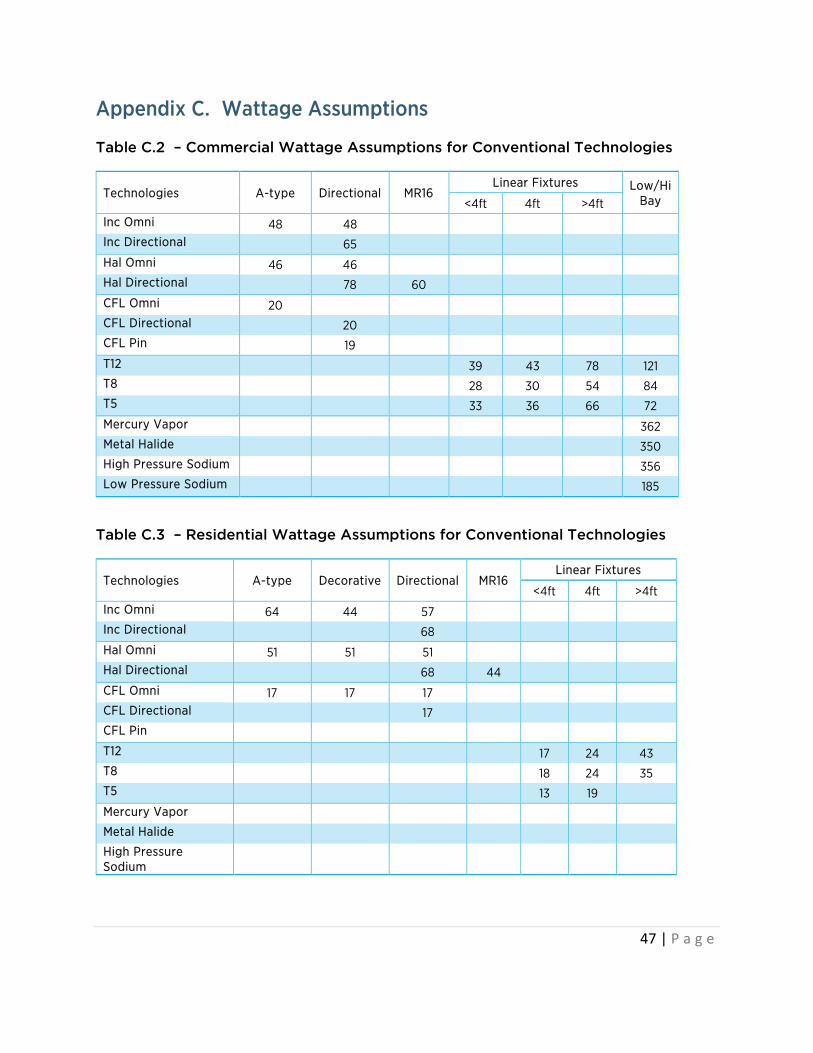
47 | P a g e
Appendix C. Wattage Assumptions
Table C.2 – Commercial Wattage Assumptions for Conventional Technologies
Technologies A-type Directional MR16 Linear Fixtures Low/Hi
Bay <4ft 4ft >4ft Inc Omni 48 48 Inc Directional 65 Hal Omni 46 46 Hal Directional 78 60 CFL Omni 20 CFL Directional 20 CFL Pin 19 T12 39 43 78 121 T8 28 30 54 84 T5 33 36 66 72 Mercury Vapor 362 Metal Halide 350 High Pressure Sodium 356 Low Pressure Sodium 185
Table C.3 – Residential Wattage Assumptions for Conventional Technologies
Technologies A-type Decorative Directional MR16 Linear Fixtures
<4ft 4ft >4ft Inc Omni 64 44 57 Inc Directional 68 Hal Omni 51 51 51 Hal Directional 68 44 CFL Omni 17 17 17 CFL Directional 17 CFL Pin T12 17 24 43 T8 18 24 35 T5 13 19 Mercury Vapor Metal Halide High Pressure Sodium
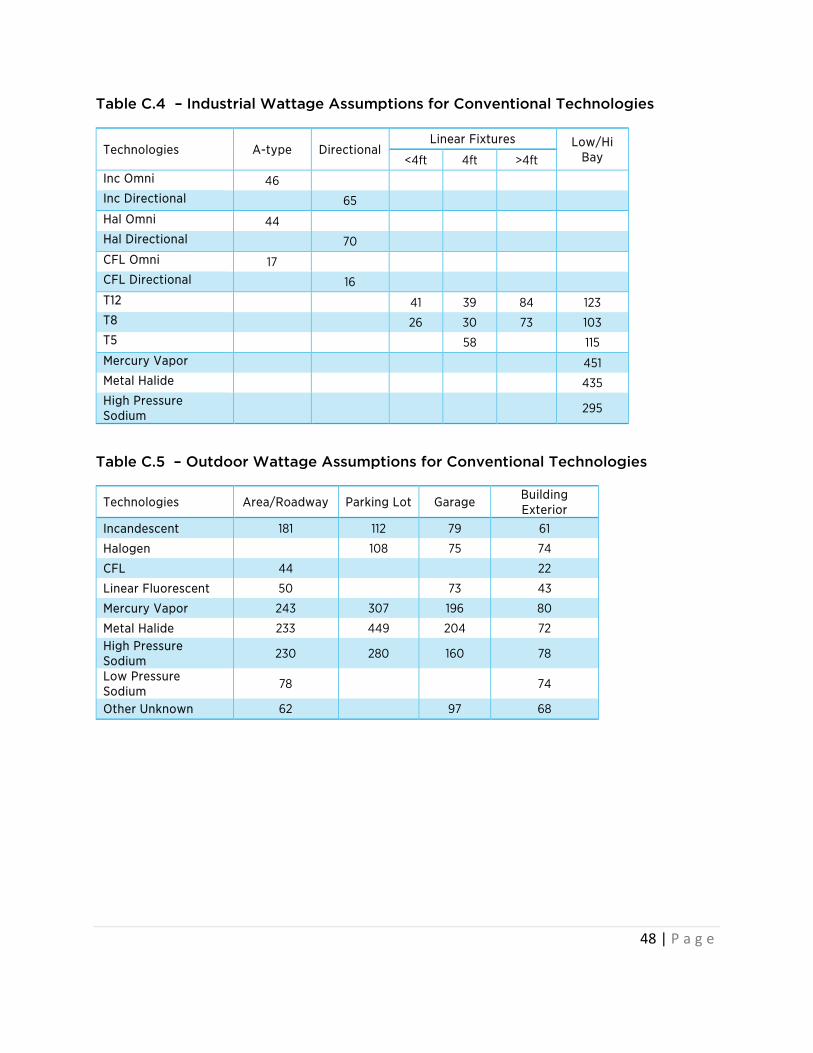
48 | P a g e
Table C.4 – Industrial Wattage Assumptions for Conventional Technologies
Technologies A-type Directional Linear Fixtures Low/Hi
Bay <4ft 4ft >4ft Inc Omni 46 Inc Directional 65 Hal Omni 44 Hal Directional 70 CFL Omni 17 CFL Directional 16 T12 41 39 84 123 T8 26 30 73 103 T5 58 115 Mercury Vapor 451 Metal Halide 435 High Pressure Sodium 295
Table C.5 – Outdoor Wattage Assumptions for Conventional Technologies
Technologies Area/Roadway Parking Lot Garage Building Exterior
Incandescent 181 112 79 61
Halogen 108 75 74
CFL 44 22
Linear Fluorescent 50 73 43
Mercury Vapor 243 307 196 80
Metal Halide 233 449 204 72 High Pressure Sodium 230 280 160 78
Low Pressure Sodium 78 74
Other Unknown 62 97 68

49 | P a g e
Appendix D. Operating Hour Assumptions
Table D.6 – Commercial Operating Hour (hours/day) for Conventional Technologies
Technologies A-type Directional MR16 Linear Fixtures Low/Hi
Bay <4ft 4ft >4ft Inc Omni 10.5 10 Inc Directional 12.1 Hal Omni 12.1 12.4 Hal Directional 12.6 CFL Omni 10.7 10 CFL Directional 10 CFL Pin 10.4
T12 11.1 11.1 11.1 11.1 T8 11.1 11.1 11 11.1 T5 11.7 11.7 11.7 11.7 Mercury Vapor 11.1 Metal Halide 11.1 High Pressure Sodium 11 Low Pressure Sodium 11.2
Table C.7 – Residential Operating Hour (hours/day) for Conventional Technologies
Technologies A-type Decorative Directional MR16 Linear Fixtures
<4ft 4ft >4ft Inc Omni 1.2 1.2 1.2 Inc Directional 1.2 Hal Omni 1.5 1.5 1.5 Hal Directional 1.5 1.5 CFL Omni 1.9 1.9 1.9 CFL Directional 1.9 CFL Pin T12 1.5 1.5 1.5 T8 1.5 1.5 1.5 T5 1.5 1.5 Mercury Vapor Metal Halide High Pressure Sodium

50 | P a g e
Table D.8 – Industrial Operating Hour (hours/day) for Conventional Technologies
Technologies A-type Directional Linear Fixtures Low/Hi
Bay <4ft 4ft >4ft
Inc Omni 12.7 Inc Directional 11.9 Hal Omni 11.7 Hal Directional 11.7 CFL Omni 13 CFL Directional 13 T12 12.5 12.4 12.5 12.4 T8 12.6 12.6 12.6 12.6 T5 12.6 12.6 Mercury Vapor 16.5 Metal Halide 16.5 High Pressure Sodium 17.9
Table D.9 – Outdoor Operating Hour (hours/day) for Conventional Technologies
Technologies Area/Roadway Parking Lot Garage Building Exterior
Incandescent 12 12 15.9 8.4
Halogen 12 17.9 8.2
CFL 12 9
Linear Fluorescent 12 18 8.7
Mercury Vapor 12 12 13.5 8.9
Metal Halide 12 12 15 8.8 High Pressure Sodium 12 12 16 8.9
Low Pressure Sodium 12 9.1
Other 12 13.1 8.9

DOE/EE-1236 • July 2015
For more information, visit: ssl.energy.gov


