CENSUS OF PAKISTAN, 1951 VOLUME 1 PAKISTAN REPORT & TABLES BY E. H. SLADE ) Fellow of the Royal Statistical fellow of the Association of Incorporated Statisticians (london), Cem;us Commissioner, Pakistan. by the Manager of Government of Paki'Stan. Karachi Price Rs. 6/-
Transcript
CENSUS OF PAKISTAN, 1951
VOLUME 1
PAKISTAN
REPORT & TABLES
BY
~ E. H. SLADE ) Fellow of the Royal Statistical Soci~ty,
fellow of the Association of Incorporated Statisticians (london),
Cem;us Commissioner, Pakistan.
Publi,h~d by the Manager of rubl~atitms, Government of Paki'Stan. Karachi
Price Rs. 6/-
FIRST CENSUS OF PAKISTAN. 19S1-CENSUS PUBLICATIONS
Bulletins
No. I-Provisional Tables of Population.
No.2-Population according to Religion.
No, 3-Urban and Rural Population and Area.
No.4-Population according to Economic Categories.
Village Lists
The Village list shows the name of every Village in Pakistan in its place in the administrative organisations of Tehslfs, Halquas. Talukas. Tapas, Subdivision's Thanas etc. The names are given in English and in the appropriate vernacular script. and against each is shown the area, population as enumerated in :;he Ce~sus, the num~r of houses, and local details such as the existence of Railway Stations, Post Offices, Schools. Hos'pitals etc. The Village list is Issued in separate booklets for each District or group of Districts.
Census Report Printed
Vol. I-General Report and Tables for Pakistan. shOWing Provincial Totals.
Vol. 2-Baluchistan and States Union Report and Tables,
Vol. 3-East Bengal and Report Tables.
Vol. 4-N.W.F.P. and Frontier Regions Report and Tables.
Vol. 5-Punjab and Bahawalpur State Report. Tables.
Vol. 6-Sind and Khairpur State Report and Tables.
Vol. 8-East Pakistan Tables of Economic Characteristics.
Census Report in Course of Preparation.
Vol. 7-West Pakistan Tables of Economic Characteristics.
PART I-CONTENTS OF CHAPTERS
CHAPTER No. AND TITI E ,
INTRODUCTION 0.1 Introduction-~.2 Urgency-0.3 Comparability-O.4 Accuracy 0.5 Scope-0.6 Census Organisation-O.7 House Listing-O.8-O.8 Enumeration Documents-0.9 Time of Entlmeration-O-IO Instruction of Enumeration-O.lI Enumeration-0.12 Publicity-O.13 Self-Enumeration forms-O.14 Questions and their interpretation-O.15 The Frontier Regions 0.16 Abstraction -0.17 Local Data-O.18 Hand Sorting-O.19 Machin6 Sorting-O.20 Compilation-O.21 Analysis and Comparisons -0.22 Acknowledgements.
PAGE
I. GEOGRAPHY & HISTORY 20 1.1 Pakistan-1.2 Administrative Areas-1.3 Historical background-1.4 Pre-Muslim Period-l.S The coming of the Muslims-l.6 British Rule-I.7 The Idea of Pakistan-l.8 Pakistan-l.9 Boundaries-l.10 Refugees and Evacuees.
2. POPULA 1'ION .. 2.1 Growth of the Population-2.2-Decade 1941-1951 2.3 Comparative growth in East and West Pakistan-2.4 Punjab-2.5 Sind-2.6 N.W.F.P.-2.7 Baluchistan-2.S Federal Capital Area-2.9 The Muhajirs-2.10 General distribution and Density pattern of population-2.11 Over all density. -2.12 Density pattern-2.13 Density in relation to rivers and eanals-2.14 Population density in relation to cultivation-2.15 Rural and urban distribution-2.16 Cities-2.t7 Rural and Urban differentials -2.18 Place of Birth -2.19 Non-Pakistanis.
3. AGE, SEX AND MARITAL STATUS 47 3.1 Collection of the data-3.2 Classification 3.3 Accuracy of the Age data-3.4 Population in broad age-groups -3.5 Age distnbution in religious groups-3.6 Age structure in Towns-3.7 Orphans-3.S Centenarians -3.') Enumeration of females-3.10 Excess of Males-3.11 Sex Ratios in town and country -3.12 Sex Ratios in AgeGroups-3.13 Marital Status-3.14 Widowed and Divorce--3.15 Fertility-3.16 Need for further research.
4. LANGUAGE, LITERACY AND EDUCATION .. 66 4.1 Collection of the data-4.2 Abstraction-4.3 Mother Tongues-4.4 Multilingualism-4.5 Language of Literacy-4.6 Urdu-4.7 Bengali- 4.8 Punjabi-4.9 Sindhi-4.10 Pushtu-4.11 English-4.12 Ability to read the Holy Quran-4.13 Literacy-4.14 Students-4.15 Education-4.l6 Educational Levels
5. FEDERAL CAPITAL AREA KARACHI 5.1 The Federal Capital Area-S.2 Brief Historical note-5.3 Growth of Population-5.4 Census Organization-5.S Accuracy of the data-S.6 Composition of the population-S.7 Sex, Age and Marital Status-5.S Language and Literacy in the Federal Capital Area-5.9 Economic Activities
6. ECONOMIC ACTIVITIES .. 6.1 The conception of Occupation, Economic Groups and Industrial Status-6.2 Co~ction of the data·-6.3 Classification- 6.4 Classification by machine sorting-6.5 Population in economic categories-6.6 Geographical DistributIOn of the Labour Force-6.7 Changes in the Economic Distribution of the Labour Force-6.8 Industrial Status- -6.9 Agriculture and Pasture-6.10 Fishery- 6.11 Distribution of Occupations in Economic Groups-6.l2 Unskilled Labour-6.l3 Distribution of main Occupational classes-6.14 Education in the Labour Force-6.l5 Unemployed persons-6.16 Further research
98
( ii)
PART I-LIST OF STATEMENTS
PAGE No.
2-A-Percentage increase in population by decades, for India and Pakistan, 1901-1951
2-B-Percentage increase in population by main religious groups for East Bengal, by decades, 1921-51 ..
2-C-Percentage distribution of the population as between East and West Pakistan, 1901-1951
2-D-Percentage distribution of the population by religious groups for East Bengal
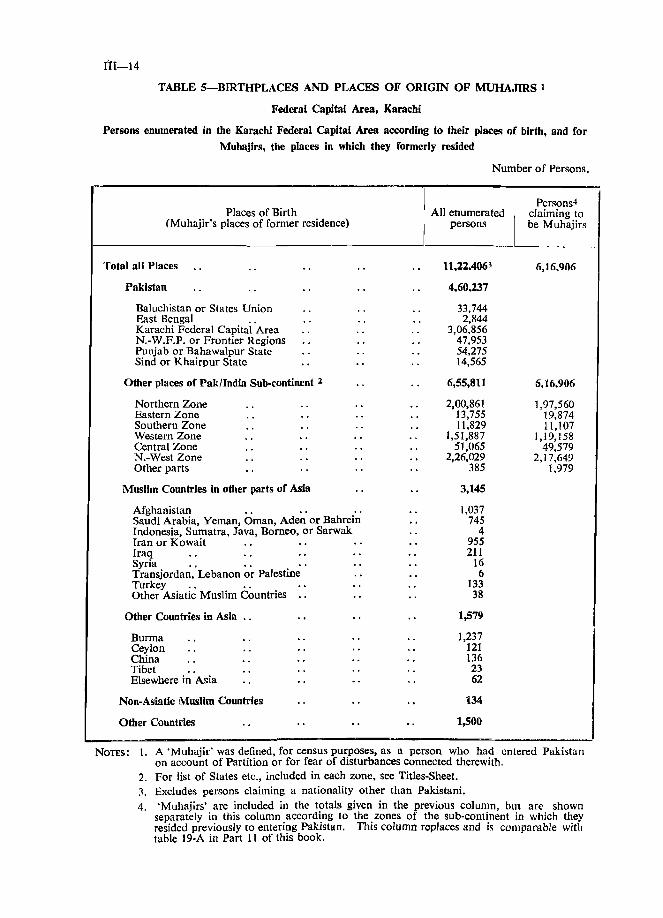
2-E-Muhajirs-Origins
2-F-Proportion of Muhajirs in Population
2-G-Population, Land Area and Average density of the ten most populous countries
2-H-Districts with higher than average population density, showing percentage of (a) total land area and (b) total Population, 1951.
2-I-Density in relation to Cultivation
2-J-Percentages rural and Urban, 1901-51
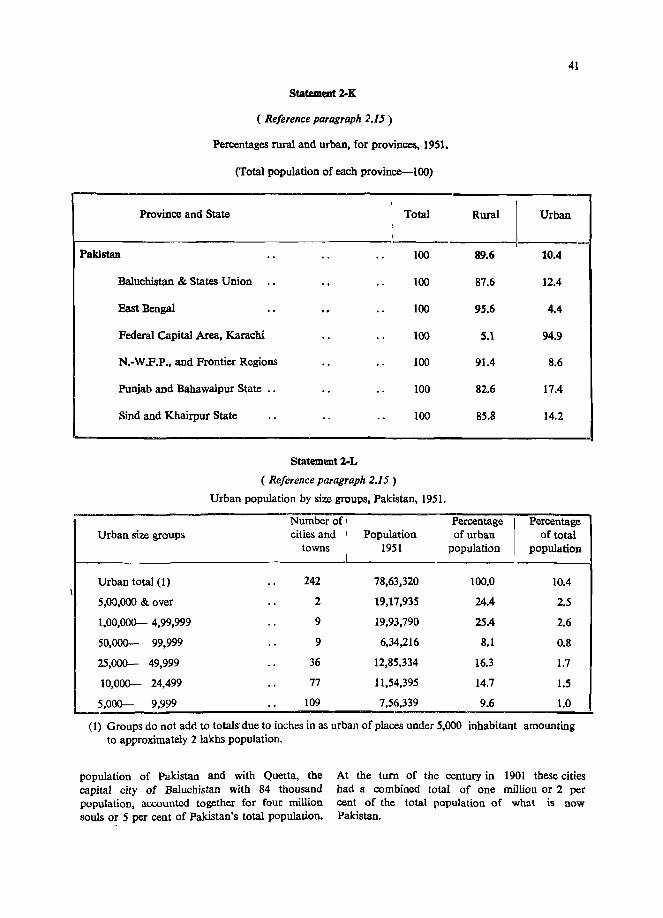
2-K-Percentages rural and urban, for provinces, 1951
2-L-Urban population by size groups, !akistan, 1951
2-M-Cities ranked in order of population, 1901-1951
2-N-Pakistanis born outside province of enumeration
3-A-Percentage age structures
3-B-Age structure in Towns-1951
3-C-Fatherless Children (under 12 years of age)
3-D-Centenarians
3-E-Sex Ratios, 1901-1951
3-F-Rural/Urban Sex Ratios for Provinces. L941~1951 .,
3-G-Sex Ratios in Cities 1941-1951 ;' . I
3-H-Sex Ratio in Towns, 1951
3-I-Sex Ratios by Age 1951
3-J-Changes in Sex Ratio of Muslims br Age
3-K-(l) Marital Status-1951
3-K-(2) Marital Status-1941
4-A-Persons speaking main LangJ.lages \ ..
4-B-Percentage distribut~on of Languages commonly SPd~en
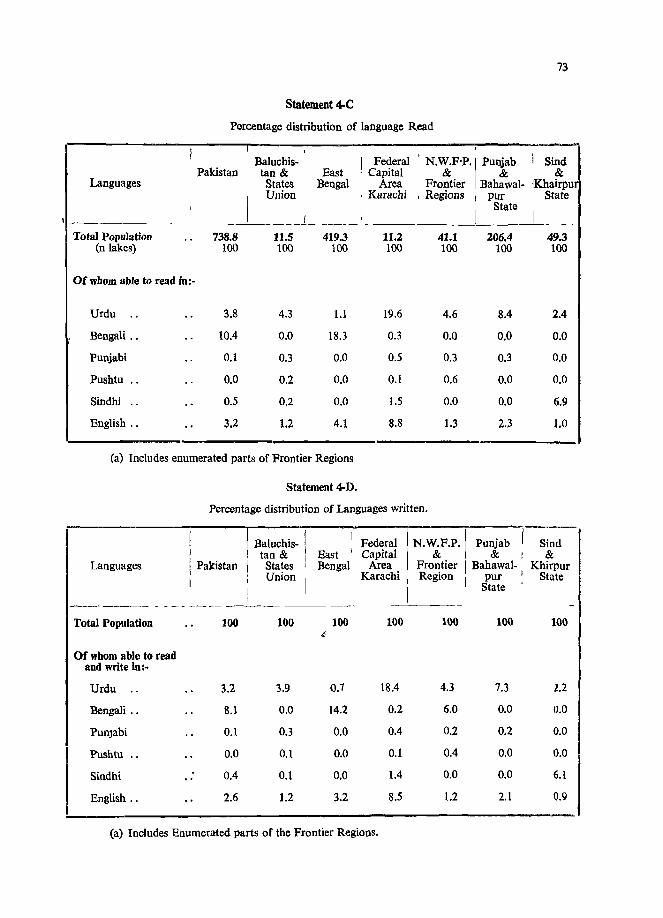
4-C-Percentage distribution of Languages Read
4-D-Percentage distribution of Languages written
•• 1
25
26
27
27
31
31
33
37
39
40
41
41
44
45'
50
S3
53
54'
55
S7
S8
58
59
60
62
63
71
71
73
73
( iii) I
PART I-LIST OF STATEMENTS-(contd) Page No.
4.E-MusIims able to read fr4m the Holy Quran in Arabic 76
4.F-Progress in Literacy. 77
4.G-Literate persons per cept of'population . . 78
4.H-Students in officially R,6:0gnized ~chools 79
4II-Percentage of Educated Mu~lims a~d 10 or over 80
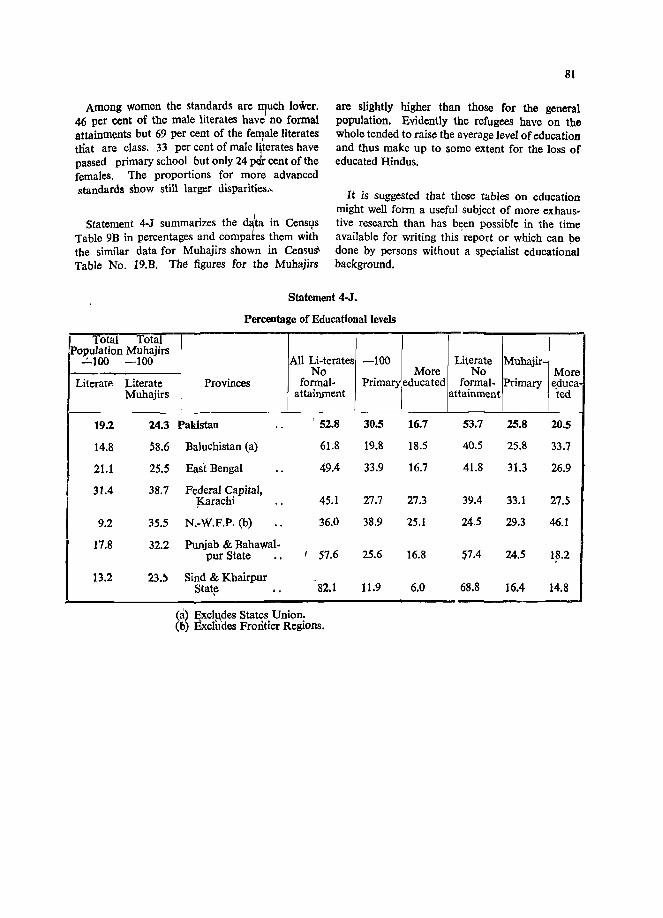
4.J-Pcrcentage of Educational bevels 81
5.A-Growth of Karachi City and Port 83
5.B-Change in Religious Composition 1941-51 84
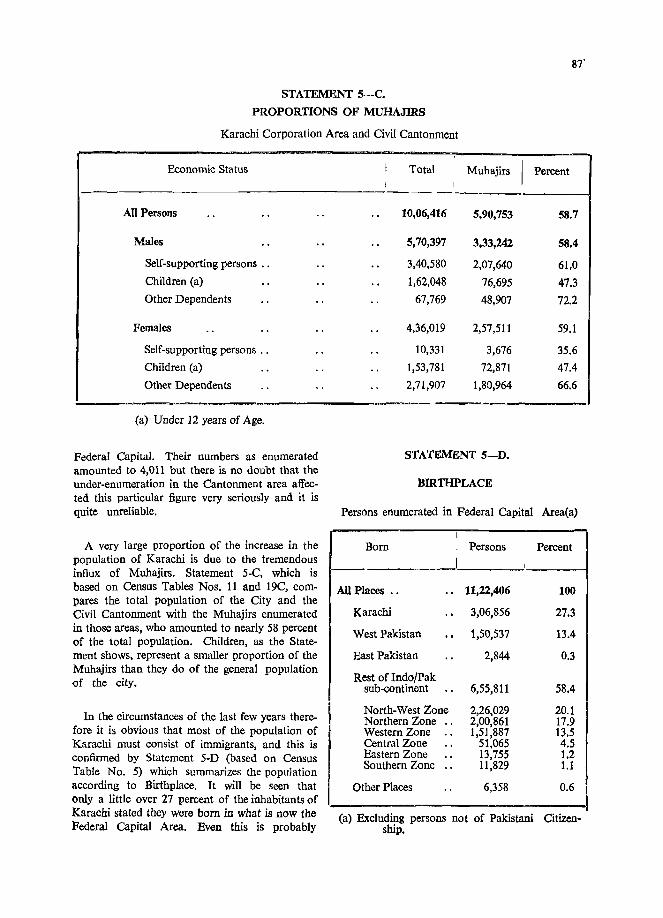
5.C-Proportions of Muhajirs 87
5.D-Birth-place 87
5.E-Sex Ratio 1931-1951 88
5.F-Age Percentage & Sex Ratios, 1951. (All-Religions, Other Religions) 90
S.G-Marital Status-1951 91
5.H-Languages 92
5.I-Languages of Literacy 93
S.J-Scholars enrolled in reconized schools February-I 95 I 93
5.K-Educational Levels 94
S.L-Economic Categories 95
5.M-List of Factories in the Federal Area registered under Section 2-J of the Factories Act for the year 1950 96
5.N-Important occupational Groups 97
6.A-Proportions of Economic Categories-1n Total Population 102
6.B-proportions of Economic Categories among MUhajirs 103
6.C-Urban and Rural Proportions of Economic categories 105
6.D-Economic Categories as proportions of the Urban and Rural Totals 106
6.E-Geographical Distribution of Workers in important divisions 106
6.F-Percentage distribution of the Labour Force 1931-1951 107
6.G-Industrial Status-Percentages 109
6.H-Land Workers 110
6.I-Percentage distribution of main occupational Classes I J J
/
(iv)
LIST OF MAPS AND CHARTS
0.1 Enumeration Organization. 0.2 Facsimile of Census Poster 0.3 Post Enumeration Organization 0.4 Census Refinery
1.1 Pakistan in South Asia 1.2 Topographical features of West Pakistan 1.2 Topographical fatures of East Pakistan 2.1 Growth of population
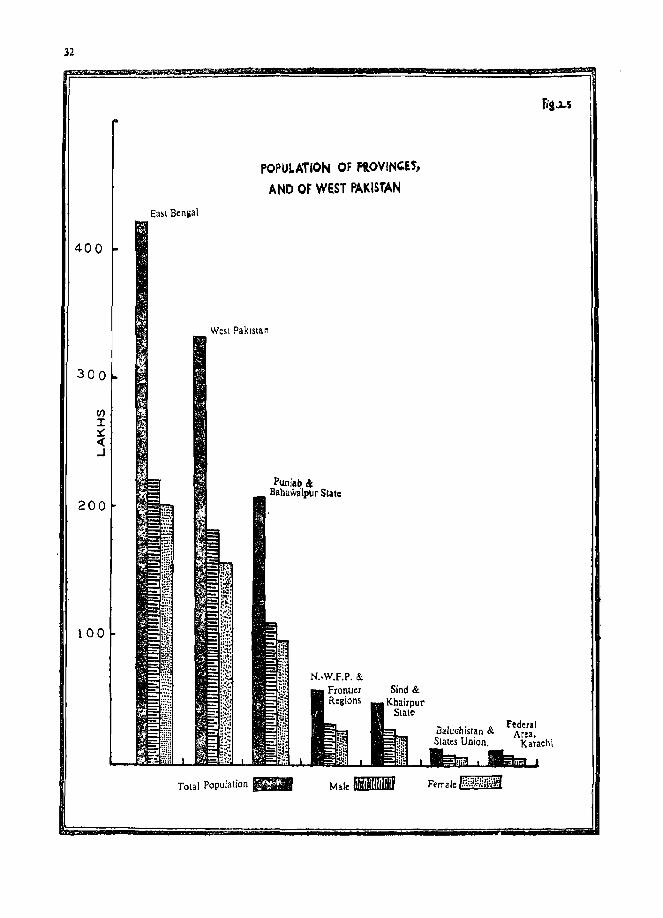
2.2 Average anual rate of growth for East and West Pakistan 2.3 Percentage distribution of the population by provinces 2.4 Main steams of Muhajirs .. 2.5 Population of Provinces & of West Pakistan
2.6 Economic distribution of total population 2.7 Density-persons 'per square mile 2.8 Average number of person per square mile, East & West Pakistan 2.9 Land, Areas & Population Densities, East & West Pakistan ..
5 9
12 14-15
20 22 23 27
28 '"'8
9 2
~ )
5 7
2.10 Relationship of population density to rivers & irrigation system-West Pakistan 38 2.11 Cities & Towns of West Pakistan 42 2.11 Cities & Towns of East Pakistan 43 3.1 Age & Sex Pyramids 51
3.2 3.3 5.1 6.1 6.2
Percentage distribution in Age groups, 1951 Percentage of Muslims & Sex Ratio East Benga11901-51 Birth place of inhabitants of Karachi Federal Capital Area Distribution of Labour Force in West Pakistan Distribution of Labour Force in East Pakistan ,
52 55 89
104 105
(v)
LIST OF TABLES
Table No.
1. POPULATION .. I Geographical division by Provinces and States-Area in sq. miles-Density per sq. mile-l.{rban population by sex-Rural population by sex
I-A. CITIES OF PAKISTAN
List of provincial capitals and Cities of 1,00,000 and over in-habitents-Arae in sq. mile-Population ~y sex & Density
2. TOWNs AND CITIES
Sections I: Urban .localities grouped by provinces in population classes 1,00,000 and over in habitants, 25,000 to 1,00,000 10,000 to 25,000 & 5,000 to 10,000 by reIigion-Muhajirs Section 2: List of town with population of 1,00,000 and over-ReligionMuhajirs Section 3: List of town falling in population group 25,000 to 1,00,000 by Religion-Muhajirs.
3. VARIATION
Geographical division by provinces and States-Population 1901,1911,1921, 1931,1941,1951-Decennial charges in actual numbers and as percentages of previous census populatlon
4. AGE AND MARITAL STATUS
Geographical division by Provinces-Broad age groups-M~in religionsSex-marital status
4-A. ORPHANS
Geographical division by Provinces and States-Children under 12 years whose father had died-main religions-Sex Section 2: Orphans-by age groups-Religions.
5. BIRTHPLACE ..
Persons enumerated in each Province Persons born in Province of enumerationin other Provinces or states of Pakistan-in Zones elsewhere in sub-continentin other countries
6. RELIGION
Geographical division by Provinces and States: Muslim; Caste Hindus; Scheduled Castes. By Provinces Minor religion groups
PAGB
1-1
1-4
2-1
3-1
4-1
-4-18
5-1
6-1
( vi)
LIST OF TABLES-(contd)
7. MOTHER TONGUE
Geographical division by Provinces and States-Languages in main families and branches
7-A, SPEECH
Geographical division by Provinces and States-Persons commonly speaking the nine principal languages- -percentage of population.
8. LITERACY
Geographical division by Provinces and States-Persons over 12 years who can read-Children who can read-Percentage-Main religion-Sex
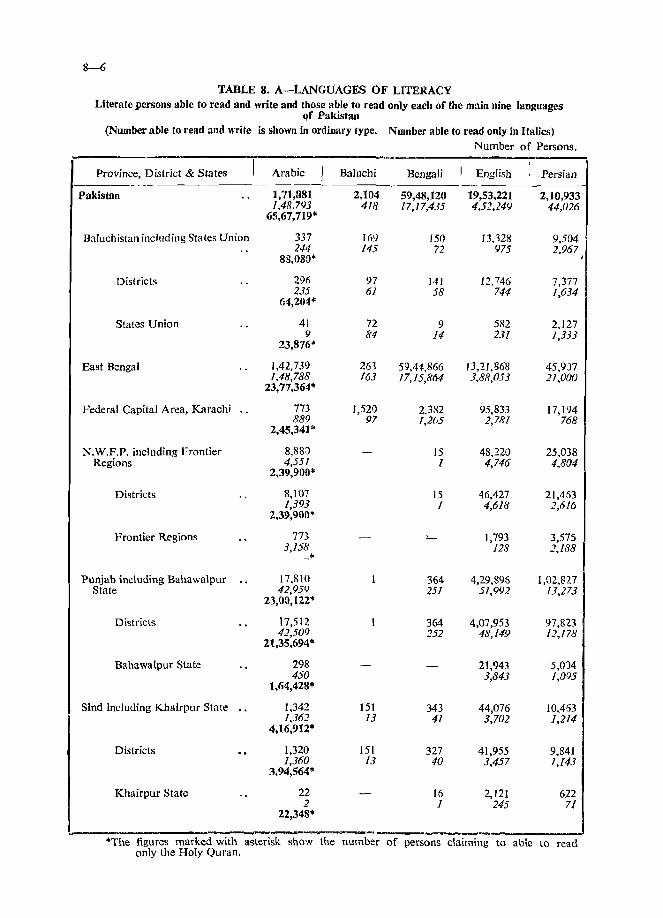
8-A. LANGUAGES OF LITERACY
Geographical division by Provinces and States-Persons able. to read only, and Persons able to read and write in the nine principle languages-Persons able to read Holy Quran in Arabic.
9. PUPILS AND STUDENTS ..
Geographical division by Provinces and States-Persons attending school or college by:-Educational age groups-Main religious groups-Percentage of total population in age group-sex .
• 9-A. YEARS OF EDUCATIO~
Geographical division by Provinces and States-Persons who have had:-Nil years of education, under 3 years, 5 to 6 years, 7 to 10 years, over 10 yearsAll religions, Main religions, Educational age groups-Sex.
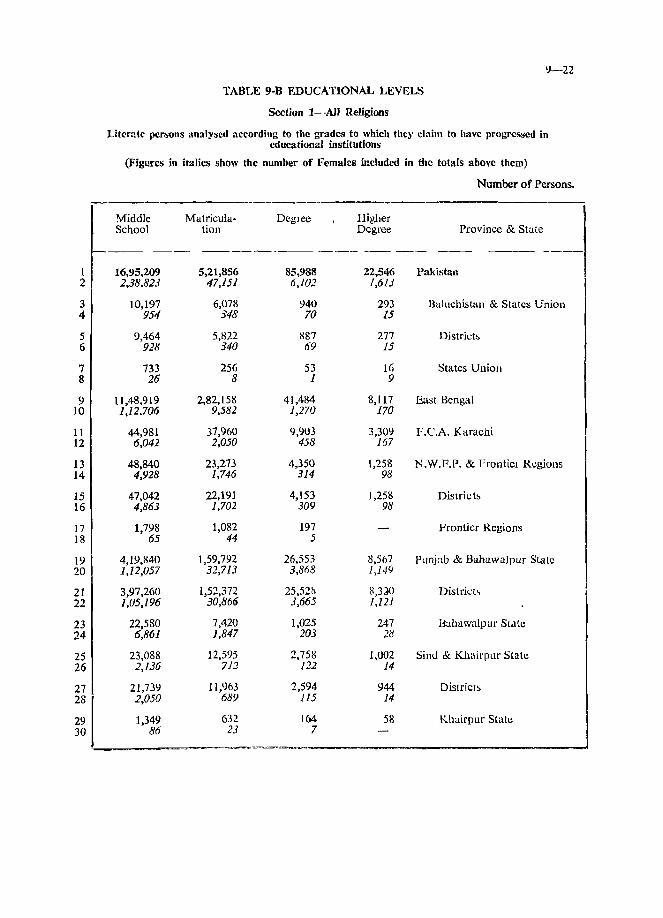
9-B. EDUCATIONAL LEVELS
Geographical division by Provinces and States-Literate persons who have passed:- -Primary school, Middle School, Matriculation, degree, higher degree -those who have no formal attainment All religions and by Main religions.
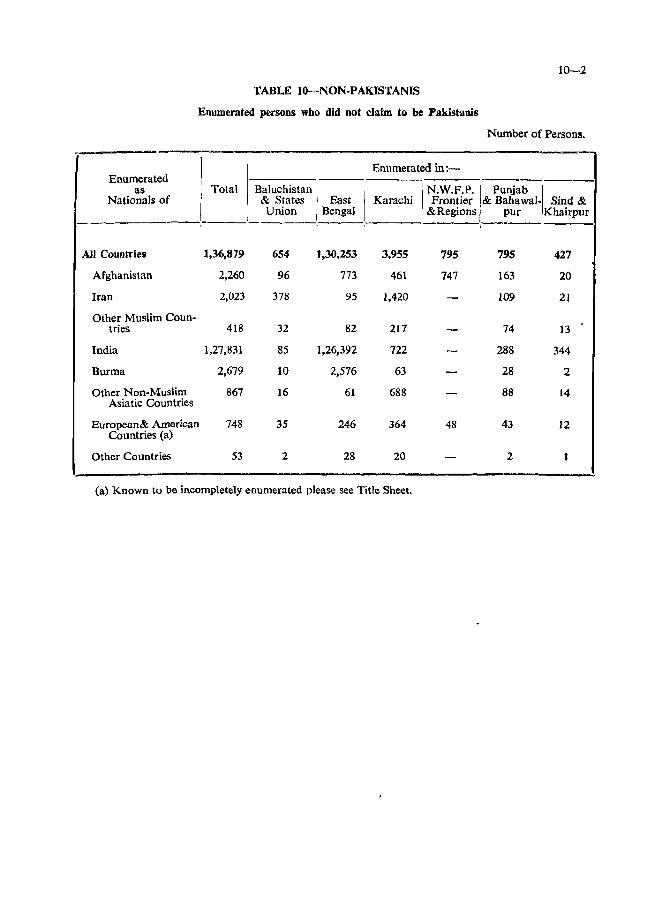
10. NON-PAKISTA~S
Non-Pakistanis by Countries of Nationality.
lO-A. AFGHAN POWINDAHS
Geographical division by Provinces and States-Persons under 12 yearsPersons 12 years and over by Occupations-TribeS-Sex.
lO-B. PAKISTANIS ABROAD
Geographical division by Provinces--Country of so joum-Field of Activity ..
7-1
7-5
8-1
5-8
9-1
9- -6
9-20
10-1
10-3
10-9
(vii)
LIST OF TABLES-( comd)
11 LABOUR FORCE
Geographical division by Provinces and States-Self-supporting persons: Agricultural Labour Force, Non-Agricultural Labour Force, Persons Not in Civilian Labour Force-Dependents:
II-A. OCCUPATIONS OF NON-AGRICULTURAL LABOUR FORCE
Occupational groups-Industrial Status - -Age groups-Education-Sex.
11-B. 1 OCCUPATIONS OF THE AGRICULTU:RAL LABOUR FORCE
Geographical division by Provinces and States-Cultivators-Herdsmen, etc. Other agriculturists-Sex
11-1
11-1
11-10
ll-B. 2 SUBSIDIARY OCCUPATION OF AGRICULTURAL LABOUR FORCE .. 11-13
12. ECONOMIC GROUPS AND INDUSTRIAL STATUS OF NON-AGRICUL· TURAL LABOUR FORCE 12-1
Economic groups,- Industrial Status---Sex.
13. ECONOMIC GROUPS AND OCCUPATIONS OF CIVILIAN LABOUR FORCE 13-1
Economic groups, Occupations -Sex.
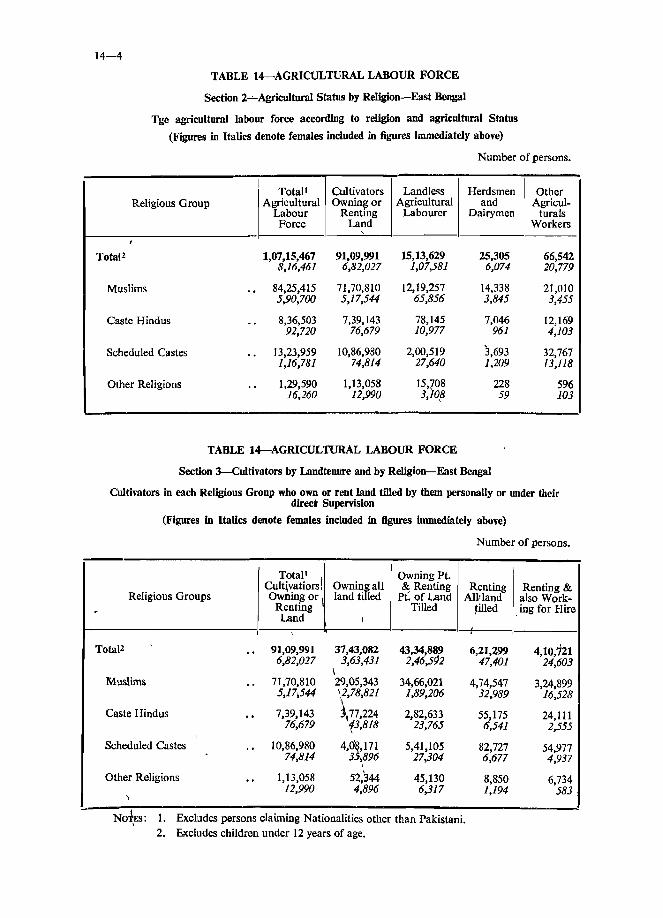
14. AGRICULTURAL LABOUR FORCE AND CULTIVATOR'S BY LAND TENURE STATUS 14-1
Geographical division by Provinces and States-Cultivators by Land Tenure Status-Herdsmen and Dairymen, other Agricultural workers-Sex.
15. LANDOWNERS .•
Geographical division by Provinces and States -Persons owing land-broad categories of economic activities.
19-A MUHAJIRS' ORIGIN
Geographical division by place of enumeration (provinces and States)-Previous residence of Muhajirs by Zones-Sex.
19-B. EDUCATIONAL LEVELS OF MUHAnRS
Geographical division by Provinces and States-Literates who passed: Primary School, Middle School Matriculation, degree, higher degree-those with no formal attainment-Sex.
19--C. MUHAJIRS IN THE LABOUR FORCE
Geographical division by Provinces and States-Self-supporting persons; Agricultural Labour Force, Non-Agricultural Labour Force-Muhajirs-Not in Civilian Labour Force--Dependents:---Sex.
19-D. ECONOMIC GROUPS AND OCCUPATIONS OF MUHAJIRS
Geographical division by Provinces States-Labour Force by economic groups, Occupation-Sex.
15--1
19-1
19-4
19-6
19-10
NOTE: The contents and titles of the Tables for Karachi printed in Part III of thi' II "nnTt "T" the s~me llS rlet~ilerl in th" "hnvp. H~t
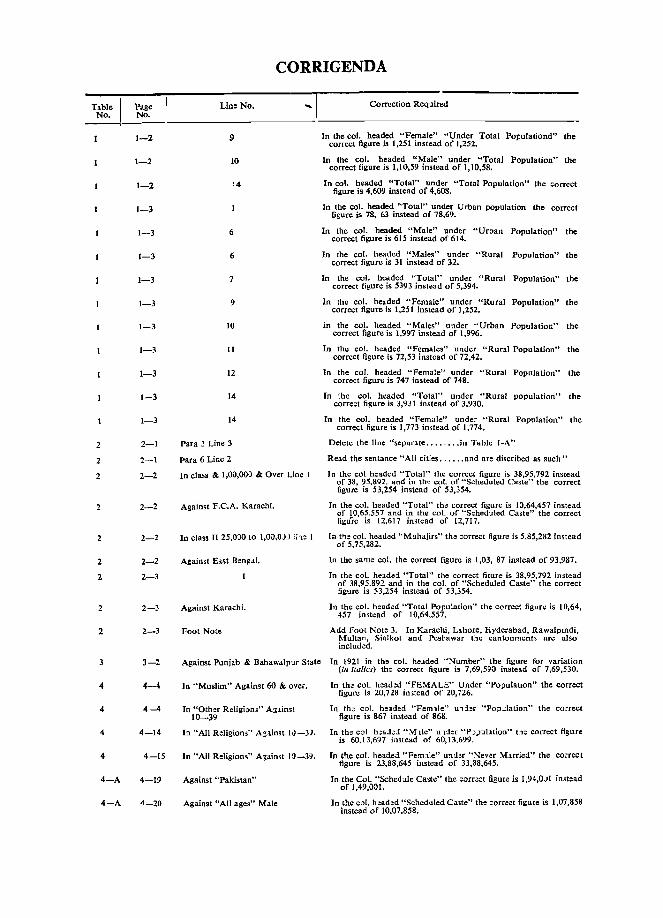
Please see the Corrigenda for Parts II & III a~ the
0.1 This volume brings together the figures given in the Census reports ~f each of the Provinces of Pakistan and provides an over-all review of there results of the First Census of Pakistan taken' in February 1951. The book consists of three parts:-
Part I. explains the organisation and methods used in the collection and compilation of the data and provides certain comparisons with the past figures. A proper understanding of the Census results calls for some knowledge of the historical and geographical back-ground of the country but this volume does not attempt to do more than, touch upon these subjects. It is not only difficult but unwise to make generalizations in these matters applicable to the whole of Pakistan, Provinces differ from each other in many respects. Such information will be found in each of the Provincial Reports therefore, together with a considerable amount of the local detail required to appreciate the differences between the provinces and between the various parts of each province.
Part II. contains the statistical census tables applicable to the whole of Pakistan and giving total figures for each Province. For details of smaller geographical areas reference should be made to the Provincial volumes.
Part ill. contains the census tables for the Federal Capital Area of Karachi.
It is proposed to issue latter two further volumes one for East &ngal and ope for West Pakistan in which certain of the Economic tables will be presented in greater geographical detail.
O.2--Urgency. Underlying all the work and effort by which these figures have been produced was the overwhelming need for the rapid supply of information regarding the new nation. But
this sense of urgency has had to contend with the great difficulty of organizing the enumeration and the subsequent abstraction of the results at a time when the administrative structure of the Government was itself in the formative stages. Most strenuous efforts by devoted officers, how· ever, met the demand for data despite the slender resources, and the more essential figures were made available by the issue of four Interim bulletins, the first of which gave the provisional result of the Census within six weeks of the Enumeration. In addition a series of District Village Lists has been published by the Census organization giving the name, location, area, population and many local details of every village in Paksitan with the exception of parts of the Frontier Regions.
O.3--Comparability. The lack of statistical data regarding Pakistan, and especially for the Provinces of East Bengal and Punjab which have been divided at Paltition, made it imperative to adhere to the traditional Census date, in February 1951 despite the undesirability of organizing such an operation without long preparation. Existing information had been rendered absolete by the two-way flow or migration resulting from Partition. In addition, the figures for the 1941 Census naturally did not apply to the new areas in the divided districts. Moreover, they had not been tabulated in full owing to the War, and their accuracy had been prejudiced by the efforts of the different communities to inflate their figures for political purposes. This applies particularly to the towns in the Punjab and to East Bengal. The figures for 1931 Census were more accurate but were badly out of date. These considerations were not only reasons for a speedy census but should be borne in mind when making eomparisions of 1951 data with previous i\gures and in particular with such 1941 figures as are available, which should be used with great caution.
2 INTRODUCTION
O.4-Accuracy.-As regards the accuracy of the Census, the Provincial Superintendents of Census all feel that the figures of the 1951 Census are reasonably accurate as regards the total population of the various areas. This opinion is fortified by the fact that the preliminary house listing enquiry, conducted three or four months before the Census itself, gives figures very close indeed to those which were attained by the final Enumeration.
There is reason to believe that the traditional tendency for women to be omitted in some places still persists, but the under-enumeration in this respect seems to be getting less. The troubles which had caused difficulties such as the attempted boycott of the 1931 Census and the deliberate inflation in 1941 did not arise in the new conditions in Pakistan. There was in fact a helpful attitude on the part of the public in many places due largely to the publicity given to the Census by the press and by Radio Pakistan. Many enumerators treated their work as a patriotic duty and the public often accepted the Census in the same spirit.
I must admit however, that the work met with a certain amount of apathy and frustration in the organizational stages in many of the large towns and there is in my mind a grave doubt as to whether such cities as Dacca, Lahore, Rawalpindi, Multan and especially Karachi were 100 per cent enumerated. But in the country districts which amount to over 80 per cent of West Pakistan and 95 per cent of East Bengal, the work was satisfactory. In West Pakistan, it chiefly fell on the .ever-faithful Patwaris and the other Officials of the Revenues staff. These.. men knew their areas and people intimately and there is no doubt that the work of enumeration in their rural areas was done with their usual efficiency. In East Bengal the Revenue system is different. Here the members and staft's of the Unions Boards provided many enumerators where almost as well acquanited with the places and people as the Patwaris were in West Pakistan. These were reinforced by a large number of volunteer workers from among the educated members of the population who also knew their local areas from life-long experience:
Accuracy in a Census, however is a relative matter and the same standard of accuracy ob-
viously cannot apply to all the detailed statistics. One must allow for doubts and uncertainties in the minds of the public and this is particularly true in the case of literate persons in regard to age and the exact description of occupations etc. The sorting and tabulation work, which was largely done by the traditional hand methods, was most carefully checked, but here again the possibility of mis-classification cannot be entirely ruled out. TheSe considerations have led to a departure from previous policy in the matter of presenting the Age data. In 1931 the age figures suffered from the usual trouble but the 5-year Age-groups were adjusted arithmetically in order to smooth out the worst inequalities. In 1951 this was considered undesirable: the enumerators themselves had recorded most of the ages to the nearest 5 years, but an analysis disclosed that even then there was obvious heaping in ccrtain groups. Had the data been presented in this report in full detail, there would have been very grave danger in figures being used hurriedly to draw conclusions of administrative importance without giving due age figures are there-fore presented only in broad groups which appear to be reasonably reliable. The full tabulation in 5-years groups has been preserved and copies can be made available to students and statisticians on application to the Government of Pakistan but should only be used under expert advice and with caution.
O.5-Scope. The scope of the 1951 Census of Pakistan covered more or less the same ground as previous Censuses of India except that the detailed analysis by Castes and Race ceased to be necessary and tribes were not recorded except in special areas. The enquiries regarding language, literacy, education and economic activities were carried into greater detail. A translation of the ~numerators questionnaire and instruction~~heet is\ inserted in the back-cover of this volume togethet with a copy of the Enumeration Slip on which the answers were recorded.' Some of t he enquiries included in the questiopnaire have proved uhsuccessful and in particular the data on Unemployment and Fortility. But these innovations were worth making and will probably result, provided the questions are re-designed in the light of our present experience, in the production of ~ore reliable data on these subjects at the next Census. In this Census no question was asked regarding physical or mental handicaps
\
INTRODUCTION 3
as experience had shown the practical impossibility of applying definitions regarding the degree of infirmity. An enquiry into cattle resources and land utilization was originally suggested for inclusion in the population Census. There is a great deal to be said for co1lecting such information -while the enumerators are recording the other data of the rural population but, in view of the short time for organization an4 the complex nature of such an enquiry, wpich would necess ate far more elaborate ipstruction of enumeitators, nothing of this kind c:mJd be done in 1951. An enquiry into Cottage Industries was, however, included as a part of the house-listing survey. It was not completed fully everywhere but the results may be useful as far as they go.
All these gentlemen were senior and experienced administrative officers with an intimate knowledge of the areas in which they were to take the Census, except Mr. Jard who was a new comer to Karachi but had had some experience of Census work For the others the appointment was their first entry into this field of activity.
The organisation of the actual enumeration is a very large undertaking and in this case owing to the late start the work had to be forced through in a dangerously short time. Within a fortnight of the arrival of the Census Commissioner in the country a conference of the Provincial Superintendents of Census and the Census Commissioner was held to co-ordinate the division of the country into Census areas and the recruitment and instruction of the very large body of Census officers O.6-Census Organization. The Census work
was organised almost entirely on a Provincial basis and the first step was the appointment of the Provincial Superintendents of Census. The following appointments were made:-
t required to carry out the work. The arrangements made are summarized in Part I of the Code of
! Census Procedure.
(a) East Bengal
(b) Punjab and Bahawalpur State
(c) Sind and Khairpur State
(d) N. W.F.P. and Frontier Regions.
(e) Baluchistan and States Union.
(f) Karachi Federal Area.
Mr. Hamid Hasan Nomani, M.A. Provincial Civil Service (East Bengal).
Mr. Mian Hasan Mahmood, M.A. (Oxon), Barat-Law, Civil Service of Pakistan.
Mr. Muhammad Hashim H.R. Abbasi-Who organized and conducted the enumeration but owing to ill-health had to relinquish the Census duties at that point and was succeeded by Mr. Gul Hasan M.I. Abbasi, who conducted the abstraction and tabulation and wrote the Provincial Census Report. Both these gentlemen were from the Provincial Civil Service (Sind).
Khan Abdul Latif Khan-who made the preliminary arrangements for the enumeration but died suddenly in September 1950. His work was taken over by Shaikh Abdul Hamid. Both these gentlemen were of the Provincial Civil Service (N.W.F.P.).
Mr. Agha Mir Yaqub Shah, Provincial Civil Service (Baluchistan).
Mr. Ali Mohammad Jafri-Who was appointed as Chief Census Officer on 29th August 1950 and conducted the preliminary arrangements and enumeration and supervised a part of the sorting work.
4 INTRODUCTION
Each administrative district, or in some cases a part of a large district, was designated as a Census District for which a senior permanent official, generally the District Magistrate, was made responsible under the Census Act for the conduct of the Enumeration. Each Census district was divided into a number of Charges each under a permanent Civil or Municipal official as Charge Superintendent. Every large municipality was treated as a separate Charge. The Charges were divided into circles each under a Supervisor, and the Circles into the blocks which were to be the responsibility of the individual' enumerators. Blocks generally corresponded in the country to a village or a part of one. A summary of the enumeration organization is shown in Chart No. 0.1.
Following tradition the size of the block was limited to 150 households. It transpired later from the house listing that this figures resulted i n some of the blocks containing more persons than were likely to be efficiently enumerated by one man. Where necessary therefore blocks were subdivided, or Assistant Enumerators iappointed, in order to give each Enumerator the Iresponsibility for a maximum of about 500 persons.
The sub-divisions of the country and the recruitment of staff was the responsibility of the District Census Officers. Despite many difficulties the organization was reported as complete in September 1950 when House-listing was due to commence. In some of the large towns, however, great difficulties were experienced and the organization was not really finalized until very nearly the eve of the Enumeration period.
0.7 House Listing. As soon as the Censu's Officers have been appointed a series of instructional meetings was conducted by the District Census Officers, Charge Superintendents and Circle Supervisors in which they explained the, arrangements for House-Listing. In this opera..' tion every enumerator '~ade a thorough recOI~naisance of his block and prepared a list of all the dwelling places in it, painting a number, corresponding with the list, on every bulldillg capable of being used for dwelling purposes. Circle Supervisors checked that the blocks as listed covered the whole of their allotted areas without over-lapping or gaps. This house-list included a record of the number of normal residents in each
household and thus provided not only a basis for the enumeration but also an independent check on its completeness. During the houselisting enumerators were also required to fill up the Cottage Industry Returns by obtaining particulars of the house-holds in which any home manufacturing work was carried on. HouseListing was completed in most Districts by midDecember, but the disastrous floods in the Punjab during September delayed the house-listing of that province very considerably. However it was mostly done during December and fully completed in all areas by the middle of January.
O.8-Enumeration Documents: Enumeration slips and the questionnaire had been drafted during the first Conference in Karachi in June. The drafts were thoroughly discussed by an Inter-departmental Committee and a tentative set of outline Enumeration Instructions and Slips were sent to all districts for test in selected villages and urban areas. The experiences ertcountered in this test and suggestions by the Inter-departmental Committees were discussed at a second Conference of Provincial Superintendents of Census in Karachi in Septetnber as a result of which the instructions were expanded and the slip took its final form.
Supplies of the Enumeration slips printed either in Urdu, Bengali or Sindhi as was appropriate to the Province, together with a few in English, were distributed during December accompanied by the Enumerators Instructional Leaflets which every census taker was required to study and which were printed in the same languages.
~he slips were designed to serve both as an original record of enumeration and also as a sorting medium, avoiding the necessity for slipcopying. Many of the answers were p~-coded so that t~ enumerators only had to indicate by a ring or 'a tick mark which of the posfoible classes the respondent fell into. The slip rdicated by single w.,rds the subject of each questIon, but was not itsel~ the Questionnaire, which was set out in the InstrUction leaflet issued to each Enumerator who was 'required to learn it by heart.
0-9-Tim~ of Enumeration. It has been decided at the First Gonference that the de-jure system of enumeration introduced in the Census of 1941 would be co'ntinued; population thus being
arid 54 cp~ Sub di"'l Offi« .. CHAII~f. SUPERINTINDENTS
$$ (Illeu SUPIRVISORS
$$ (NUMERATORS
POPULATION - M'LLIONS
42·' 20·7 4'9 5'7 ,·2
ARlA _-SQ MILE·S
'~4,501 79,716 56,447 39-25 9 I 34;,OOZ
5
Fig. 0.1
STAFF
Oflitc.rs 5
Othc.r, 12 i5
Ogice ... 9
Oth~ri 90
69
oeo. . ...... 142
Ch S"'pl$ 1,710
TOTII.l '.90 .BM
,.,
BI2
counted on the basis, of normal residence and enumeration being spread over a period of 20 days from the 9th of february until dawn on the 1st of March 1951. In Baluchistan and sparsely populated parts of Sind enumeration was authorised to begin as soon as possible after the 1st of January 1951. In certain inaccessible parts of the North West Frontier enumeration was ordered to begin in November and to be completed before the winter snows set in.
O.10-Instruction of Enumeration. The detailed' arrangements for enumeration settled at the second conference and in subsequent meetings of the inter-Departmental Committee were set out in Part II of the Code of Census Procedure ample supplies of which were supplied to each District Census Officer during November/December for issue to all Supervisors and other Census Officers who could understand English.
6 INTRODUCTION
Code of Procedure Part II formed the basis of the instruction given at the special training classes for the enumerators which were held throughout the country in January 1951. At these classes, by means of large wall diagrams of the Census slips, every enumerator learnt exactly how to ask the question and record the answers. Practice slip were provided and every enumerator carried out a number of test practice enumerations in the presence of his Supervisor. The local set of past events for use in estimating ages was discussed in these classes and the method of describing occupations and industries was explained. The classification codes of occupa· tions and Economic Groups which had been drawn up in Karachi were printed and circulated to all District Census Officers and Charge Superintendents in time to be used for reference in the instructional meetings.
I visited very many of the training classes myself and examined the men regarding their instruction. For the most part they had grasped the ideas very well and even the difficult questions on. occupation and industries were apparently understood. When we came however to examine the actual enumeration records it was obvious that many enumerators had not troubled to practice all they should have been taught. I hope in training enumerators for the next census even more emphasis will be placed on the correct recording of age and economic activities.
A definite instruction was given that no person who had failed to attend a class of instruction should be allowed to act as an Enumerator. I believe this was carried out but in some of the large cities where the enumeration staff was recruited late and hurridly I fear that some of the men received rather perfunctory training. It is useless to lay the blame for this defect on the ,hortness of time; instruction is obviously best given just before the enumeration period so that the men do not forget what they have learnt. A point to be remembered next time is that the courses of instruction for the enumerators must everywhere be well organized on an official basis and include even more practical work.
O.l1-Enumeration: In the event the enumeration arrangements can be said on the whole to have worked well. In no areas of the country
did enumeration appear to have failed, although there was great difficulty in part of Karachi Cantonment but even there it was to a large extent rendered at the last minute. Every Supervisor carried out a constant inspection of the work of his enumerators and Progress reports were made every fourth day.
A final check of his block was made by every enumerator on census night, before dawn on 1 March 1951, and all homeless persons, travellers, etc., were questioned and enumerated unless they had already been dealt with. Immediately the enumerator was sure he had completed his work he was required to sign a formal certificate that he had taken the census in the whole of his block and to hand over his slips to his supervisor. The slips were handed in to Supervisors promptly after the first of March and then delivered by Charge Superintendents and District Census Officers to the Sorting Centres, with checks at every stage on the count of slips. The total figures of each enumerator's report were reported rapidly through Supervisors and Charge Superintendents to District Census Officers who telegraphed them to the Provincial Superintendent of Census and to the Census Office in Karachi. From these preliminary reports Bulletin No. I was compiled and issued in April 1951. "The figure in the preliminary report differed from the final count by only about 0.2 per cent.
The subsequent sorting has naturally brought to light some cases of inadequate work by enumerators, particularly in the description of economic groups and occupations and an obvious failure in some places to include Europeans probably due to a misunderstanding. But considerink the speed with which the work was organised,' and the fact that enumerators worked without payment, the completness and quaIity of their effortS was as good as could be expected.
, I
0.12 Publ1city: Special attention was given to the formation of an instructed public opinion regatding the census. A simple explanation of the census in the form of a pamphlet entitled "The Census-How and Why'?" was distributed widely and in particular to journalists and all information services. The press in all the cities co-operated whole heartedly and published notes and articles which 'explained the reasons for taking a census and the value of the work. Radio
lNTRODUcrION 7
CENSUS 1951
Household Listing.
The Census Officers of your area will shortly begin the preparation of house listing. This list will be prepared for all the provinces and states and will contain fairly reliable data regarding the number of houses, number of rooms in every house and the number of persons residing therein, a~ also the number of pacca houses. The list shall also indicate the degree of COngestion in various areas, enabling an examination of the house building programme with a view to remove the acute shortage of houses. Besides, such information is also being furnished which Shall be conducive to the development of Cottage industry.
This great task of Census for its successful completion requires the cooperation and help of every Pakistani. This is the first phase of Census, and is a prelude to the full fledged enquiry about every individuaJ, scheduled for February 19.51.
IssuED BY THE GOVERNMENT OF PAKISTAN
8 TNTRODUCTlON
THE FIRST CENSUS OF PAKISTAN.
February 1951.
will require the foIJowing information of every person.
Mother tongue: Languages spoken, read and describe the business in which they work). written;
How employed in January 1951, and if un-Education; religion; employed, the occupation in which seeking work
and how long without work; Whether a Muhajir, and if so from whence;
Agricultural status-whether landowner, Whether self-supporting, or partly so, or seek- renter, etc;
ing work;
Occupation and the kind of business in which it is followed;
(Employers are requested to give to their employees a written note showing how to
About married women-how long married, total number of children born, and births and deaths of children under one year of age.
Census information is strictly confidential, Personal particulars will lIot be disclosed.
PAKISTAN ZINDABAD ISSUED HY THE GOVERNMENT OF PAKISTAN.
THE FIRST CENSUS OF PAKISTAN
February 1951
will be taken within definite period till 28th February 1951.
The recording of the settled population will begin in most places on the 9th February and the census will be completed on 28 February.
THE NATION expects every Pakistani to help by seeing that he and all his household are included properly and each not more than once.
ALL PERSONS wiII be enumerated at their regular lodging J?laces unless they wiII be a hsent for the Whole period from the 9th to the 28th February 1951. In that case they will be included in the census wher-ever they are found.
designed to show the facts upon which national development must be based. Every citizen will benefit by a successful and reliable census. We must not leave ourselves in the dark; light must be thrown on our problems; the direction of national local affairs urgently needs the census information.
CENSUS INFORMATION IS STRICTLY CONFIDENTIAL It wiII not be used for any purpose except the compilation of statistics. Individual particulars will be not be disclosed '0 anyone.
Age and whether married: Birthplace and THE CENSUS QUESTIONS have been nationality:
Pakistan mllst know its people and their strength.
PAKISTAN ZINDABAD ISSUED BY THE GOVERNMENT OF PAKISTAN
I,"7JWDUCTION
10 INTRODUCTION
Pakistan co-operated most effectively; brodcasts by the Census Commissioner and the Provincial Superintendents were repeated in all the vema· culars. These not only helped to form a favourable public opinion and remove suspicions of the purpose of the census, but also provided an opportunity of co-ordinating the instruction of enumerators. Two sets of vernaculars Posters were exhibited in every village and town, the first explained the houselisting and the second series in January 1951 summarized the enumeration questions and their reasons. An illustration of the Urdu Posters, with an English translation, is given in Figure 0.2. These publicity schemes were reinforced by many public meetings held by census officers at which questions were answered. In Karachi the Municipal Corporation made good use of their loud-speakers vans which were "manned" by a team of silver-tongued lady census workers. In future I suggest that more. use should be made of lady helpers. This would not only help to fill the dearth of enumerators in big cities, but will also make the census more complete.
It is too much to hope for that a census will ever be a subject of popular enthusiasm, but in places, due to these measures there was a definite spirit of public co-operation; enumerators were often received in a friendly manner and heads of households reported if they had been missed out. This was particularly the case in Karachi and did much to overcome the special difficulties of hasty organisation in that congested and rapidly increasing city.
O.l3-Self-Enumeration Forms: In Karachi, to meet the need for dealing urgently with households who reported towards the end of the enumeration period that they had been missed by the enumerators., a self-enumeration form wis devised so that literate persons could quickly give the details required to be entered on their slips. The arrangep1ent worked very well and might be adopted on a wider scale in future censuses.
O.l4-Questions and their interpretation: The census questions from which the data in most of the Tables were obtained are discussed in the appropriate places in the Chapters of this report. Tables 1, lA, and 3 deal with the total numbers of normal residents. They are, so to speak the
quantitative side of the census, and except for sex are not based' on what was written on the slip but on the existence of a slip. The remaining tables are the qualitative side of the census, dealing with the different kinds of people and their characteristics. As has already been stated the same standards of accuracy cannot be applied to these two kinds of data.
The Tables are based on the conception of normal residence, in that persons were included in the count of the households of which they formed part provided they. were expected to be present with the household at some time during the enumeration period. Otherwise they are included in the population in the place at which they were present. If, however, the head of the household reported a person who, while normally a resident member of the household, was temporarily out of Pakistan and would therefore escape enumeration, the person was included in the count of the household and a slip was made out.
As a matter of definition attention is particularly drawn to the classification of the working population as shown in Table 11 and the tables which follow it dealing with Occupations and Economic Activities. The Agricultural and NonAgricultural portions of the Labour Force are presented on somewhat different conceptions. All persons whose usual main occupation was reported as the cultivation of the soil are included in the Agricultural Labour Force whatever may have been their occupation in the month preceding the census. Only thus could the data regarding land tenure status have been obtained on any basis likely to be complete. In addition to the cultivators reported in that way, the Agricultural La~our Force includes all othed person who sta~d that ~uring the month preceping the census the)l had bee'} mainly engaged in work of an agri~ultural nature. The non-agricultural portion of t11,e Labour Force is based on the usual definition qf that term, i.e. upon the actual occupations of peI;sons during a speci$~ period, which, in this case was the month preceding the census, viz., JanuaI1\ 1951. As exI5lained above, however, persons who are normally cultivators will have been ~xcl\ded from this class even if, in January 1951, they were follov'ing a non-agricultural occupatio~
INTRODUCTION 11
O.15---The Frontier Regions: In the Frontier Regions which lie beyond the settled districts of the North-West Frontier Province it is not possible to conduct a census by the same system as was used throughout the rest of Pftkistan. In 1931 and previous censuses nothing more than a rough estimate of the population of these areas was attempted. In 1941 several parts of these
,Regions saw the introduction of enumeration using a simplified "tribal" slip. In 1&51 we were able to extend both the area covered \,y simplified enumeration and the amount of data included on the slip. On the p,opulation of the Frontier Regions 8,87,226 persons were enumerated and 17,55,000 were included in the census totals on the basis of estimates made by the Political Agents with the assistance of tribal elders and village headmen.
O.l6-Abstraction: The work of abstracting the statistical data from the millions of slips has been a tremendous under taking which strained our resources in all directions. Traditional hand sorting methods were used for most of the work and the original enumeration slips were found quite suitable for this purpose. For the work of sorting the data on the occupations and economic activities of the Non-Agricultural Labour Force, and for the complete sarting of the data for Karachi, use was made of Powers-Samas punched card machinery.
The first step in the sorting work was a careful scrutiny of every slip. A certain number, varying with the efficiency and intelligence of the enumerator, but rarely amounting to a significant proportion of the slips in a block, needed correction, or the supply of missing data, to make them sort This it was generally possible to do on commonsense lines in the light of the other data on the slips or on slips of other members of the same househOld. I suspect, however, that it was at this stage that some sorting centres introduced what finally appeared as the worst inconsistency in the age structure, namely the inflation of the 10-11 age group. Children below 12 years of age were all to be treated as Dependents, according to the enumeration instructions, and I fear that some unwise scrutineers may have given that age to any slip in which the questions on economic activities were missing or defective. It is only a suspicion, but it would account for the impossibly large contingent of that age which showed up in the
final tabulation of the work of certain, but not all, sorting centres, and I mention it here as a guide to statisticians in the interpretation of the results and as a warning for the future.
The next step was the checking of the count of each block and the preliminary "block sort" which separated the sexes and the Muhajirs, after which the slips were dealt with circle-wise and the Religious groups were set up. In Baluchistan and the Frontier Regions of the N.W.F. there was a special sort by Tribes.
The results of sorting were recorded on sorters' tickets which were verified by supervisors and inspectors and reconciled with the system of check figures which ensured, in total, the correctness of every count. The classification was also tested by the inspectors. These can be no complete or arithmetical proof of the correctness of classification in hand sorting, but as far as possible the work was kept under examination and every effort was made to ensure reliability.
The slips of the Non-Agricultural Labour Force were segregated at an appropriate point in the hand sorting procedure and passed to a team of coders who marked each slip with the numbers allotted for occupation and Economic Group in the Classification Codes. This work proved to be most difficult, requiring a high level of knowledge and intelligence to interpret the enumerators' records, often very sketchy and indefinite, into the classes of the codes. The slips were then sent to the machine sorting centres where. the coding was scrutinized before the slips were passed to the card punching section. Complaints have been made to me of the arduous and concentrated labour which this coding involved and the suggestion seems to be that it would have been simpler to sort the economic data by hand. The answer is of course that if the coding presented such problems, and needed careful thought and checking, to attempt direct classification by hand-sorting would have led to such inaccuracy as to be quite worthless.
The results of hand and machine sorting were passed to Provincial compilation offices, where the totals which appear in the Tables were assembled on working-sheets by teams of compilers with the help of adding and calculating machines.
12
J HAND
SO~TING CENT~ES
DAce"
INTRODUCTION
Fig. 0,3
POST - ENUMERATION ORGANISATION (REFERElica ,P"RA 5'04 - PAGE 50.-l
OFFICE OF THE ~ PAKIST"" CENSUS 1--------1 COMPILING
COMMISSIONER OFFICE
I . r A.
~~----~------r-----r-----~--~ I •....... .,.. ...... J .... l' .... )10-..... ···l····~ .. · .-... ,"0>-'-'" ··T·····-········~ PROVINCIAL SUPERINiENDENTS OF CENSUS
EAST 8EN<I"'-
J : OMPlLflIG
OFl'ICE DACC"-
I"':""'I~'~ • r ,....... ........ ......., PUNJ'(S SIND BALUCI+ FEDERAL
& I'<~ & h .ISTAN fo~ N W f P ~'":,:::!''' CAPITAL iBAW.WA1.PU5 i KHAIRPUR i: KARACHI
: .; ~ r-H ..... " .... ND--,: HAHD HAND: HAND 1
SORllNG 1 SQ~T\NG i SOI:rnN6 i SORTING f, CENi~ES : CENTRES : eENT~S : CENTRES
. I: I· I : L"-HORE: I' ~ t
~ I' I • R~WALPINDI I I I ALSO SORTj..:"~.f-.:I-'-';-,,..p:""f' __ "f'"''''''t I MA.C1-IINE
FLOW OF SORTERS TICKE'TS. -+-fLOWOF SLIPS Of N ~Lf & C.lT\ES.
fLOW Of DRI\FT TASLES. -~---+-
...·········oei· .. ··
The organisation of the post-enumeration census offices and the flow of work and data between them is shown in Chart No. 0.3
counting of slips in the Block sort and the infor· mation in the Household lists, the village list for every district was compiledr while the rest of the hand sorting was in progress. This list show the O.17-Local Data: Based on the check of the
INTRODUCTION 13
village areas in their administrative order in each tehsil, Taluka, Sub-division, etc., with the names written in Roman and vernacular script and giving the areas, population, and local detail such as the existence of railway, postal, educational and medical facilities. The local detail was supplied through the District officers. These lists will not only be of considerable administrative use but should be of great assistance in future statistical surveys and the organisation of the next census.
In East Bengal the village list were supplemented for representational purposes by a series of District pamphlets giving an analysis of the population of every Union Board area according to relighus communities. These pamphlets were prepared by the census organisation and published by the Provincial Government.
In a similar manner the Provincial authorities in Baluchistan have published the data on the tribal organisation which was specially prepared for them by the census organisation.
0.18 Hand Sorting. The Hand Sorting operation was carried out in nine centres as follows:-
Province. Centre Total personnel.
EAST BENGAL Dacca 130
Comilla 130
Rajshahi 129
Barisal 128
PUNJAB & Lahore 195 \BAHAWALPUR STATE
Rawalpindi 118
SIND & Hyderabad 63 KHAIRPUR STATE
BALUCHISTAN & Quetta 33 STATES UNION
FRONTIER REGIONS (a) Peshawar 33
The recruitment and training of the large temporary staffs presented considerable problems. In all the provinces, owing to the departure of many Hindu, clerks, good clerical workers were at a premium and few persons of suitable ability were willing to take up this arduous temporary work. All the sorting centres met with great difficulty in keeping their teams upto strength
in the face of constant desertions and resignations. Every man so lost imvolved a serious loss of time in obtaining and training a replacement, and reasonable standards of skill and accuracy were only achieved after long and careful instruction and supervlslon. A "bonus---on-output" scheme helped to add interest and speed to the work but increased the vigilance required to secure honest classification. I feel the greatest credit is due to the officers and supervisors who controlled the Sorting Centres but it is of course impossible in the circumstances to claim complete accuracy.
The sorting work was organised in phases. The first step was to arrange the slips in batches by sex, religion and geographical regions, Muhajirs being kept separate. A general idea of the sorting procedure is given in Chart No. 004 in the form of an analogy to a refining process. Copies of this chart were exhibited in all Sorting Centres and enabled the whole staff to see at a gJance the complete scheme of work, which was explained in detail in Part III of the Code of Census Procedure.
Phase I of the Hand Sorting procedure dealt with the slips Circle-wise and sorted them for language, birth place and religion and completed all sorting of the slips of Children under 12 years old. Phase 2 handled the slips of literate persons only. All the slips went through phase 3 which analysed them by main economic categories and segragated those of the Non-Agricultural Labour Force. Phase 4 included the sort for Age of Persons over 12 and phase 5 sorted the slips of married women for fertility data. In phase 4 and 5 permission was given in places where the sex and religion batch for the broad age group 25-54 was very large (i.e. over 50,000) for it to be sorted into 5 year groups from a random sample of slips. This system is reported to have been used in a few districts of the Punjab only. The size of the sample varied with the population, but was never less than 20 per cent or 50 thousand slips.
Slips of the Non-Agricultural Labour Force left the hand-sorting centre after Phase 3 and the rest of the work on them was done by punchedcard Mmachinery.
0.19 Machine Sorting: Machine sorting centres equipped with Power-Samas punched-card
14
1
INTRODUCTION
----
PHASE FERTILlfy
PHASE l-A BLOCK SORT
" rXAMS PASSED
UNCUAIIU RUD
~ U,NGIIAIIU .... 1Tf£N ,~
INTRODUCTION 15
CENSUS REFINERY AN AN'LnGY R£RRES£N1'ING THE nnw of iLiPS
THROUGH HAlOIl SORTiNg Cf"Taa
CREF1!:~"l4CE PARA 5-:1.1 0) - PAU '",.)
PIfASE: 1-C CHILDREN SoRT
16 INTRODUCTION
machines were set up in Karachi and Dacca. The Karachi centre handled the complete sorting job for the Federal Capital Area and also, for persons in the non-Agricultural Labour Force of West Pakistan, sorted the data for Phases 4 and 5, as well as Occupations, Economic Activities, Industrial Status, etc. The Dacca Centre handled the same duties for East Bengal and for certain also carried out Phases 4 and 5 for the whole population of 12 years of age and over. In addition, this Centre sorted the Cottage Industries Returns for all provinces.
The operation of the punching, verifying and sorting machines was completely strange to all hands. The work started with revision of the Coding -itself a big under taking, which however proved to be well worthwhile from the point of view of accuracy. The punching of cards was not completed until the end of September, 1952, speed being at first very slow but it gradually increased until, at the end of the job, many men were giving about the same output as is expected in Western countries.
Machine sorting was a complicated procedure requiring skill, concentration and a high degree of intelligence. The results of the sorting operation were shown on counters on the machines and were recorded on special, forms the data on which were posted to Compilation Working Sheets. A full explanation of the operation is given in Part III of the Code of Census Procedure and the whole machine sorting programme in set out in detail in an Annex.ure thereto containing working instructions, diagrams and the forms for the special machine sorters' tickets.
I must say that the operating staff of the Machine Centres proved very adaptable and in the end became quite expert at this new work. Punching was checked by repetition and verified by a special machine, but the accuracy of coding and sorting depended upon the vigilance of the supervisors and their knowledge of the classifications and procedures. In Karachi Centre there seem to have been lapses in this respect. This first attempt to modernise the abstraction stage of the Census is, however, an essential innovation and should lead to better results in the future. There was of course a feeling that methods of great precision were being used to deal with information which itself was often extremely indefinite, but the machine
system, with its preliminary coding, does tend to make the best of the descriptions given by the enumerator and at any rate certainly prevents the multiplication of errors.
0.20 Compilation: The results of the Hand and Machine sorting operations were transferred to compilation working-sheets by special teams of compilers in each Provincial office and in Karachi Machine Centre. The orders laid down that every figure on a compilation sheet should be checked by a second compiler and each sheet tested and verified by the Chief Compiler or an officer. This work was well and carefully done for the most part and the working-sheets should prove a fruitful mine of subsidiary information. The Karachi Machine Centre worked under very difficult conditions and 1 suspect from the working-sheets that towards the end of the operation compilation work was in some cases scamped. It has, however, been corrected as far as possible.
0.21 Analysis and Comparisons: The information in the census tables has been analysed to some extent in the Provincial Reports (volumes 2 to 6 inclusive). In this volume an attempt has been made in the Chapters of Part I to provide a basis of general comparison with the past and to focus attention upon the salient features of the present population of the Provinces.
In this we have had valuable assistance from Mr. Douglus L. Ralston of the Dominion Bureaus of Statistics of Canada, who came to Pakistan under the Technical Assistance scheme of the United Nations. He was hoping to have enriched this report with a study of the demographic data, but this project had unfortunately to be laid aside owing, in the first place to the Age data being found in sufficiently reliable in detail to serve as a basis for technical study, and also due to a deeply regretted collapse in Mr. Ralston's health. In the short time in which he was in Pakistan he devoted hinlself without remission to an intensive study of the data of this and past censuses. it is due to his expert advice that the Age Tables have been curtailed and confined to the broad groups whi~h may be regarded as reliable, but his researches were wide-spread and the unfinished notes which he left have been of much usefulness in the evaluation of accuracy (many of the cautions in the reports and in the title sheets of Tables against undue reliance on figures which
INTRODUCTION 17
seem doubtful are due to his investigations) and in preparing, much of the descriptive and comparative matter which appears in this volume. While taking full responsibility for all I have written in this reports I gratefully acknowledge his assistance and advice.
A census report must always be produced with all possible speed. It is inevitable that the abstraction work takes much time, but once it is done the results should be made available with the minimum of delay, and cannot be withheld while research and analysis, which should be thoughtful and fairly leisurely processes, distil the data. The figures are wanted urgently for daily reference and that is true particularly in this new state of Pakistan. Therefore, while I have made a few obvious comparisons and explanations to facilitate understanding of the census figures, I plead that this report shall not be the final study of the census, but together with the mass of Census documents, working sheets and unpublished tables should be used as a basis for continued research and the issue of supplementary studies.
0.22 Acknowledgements: I take this opportunity of putting on record my appreciation and gratitude for the devoted manner in which the Census staff in all places and in all grades discharged this strange and onerous duty. There were very few indeed who failed to reach high standards of integrity and honest hard work. The Census staff contained no member who could claim any technical statistical training and very few of them had had any Census experience. It is indeed a matter for some wonder that they have succeeded in producing so much information capable of being classed as fairly reliable. I have already mentioned the names of the Provincial Superintendents of Census and to all of them I feel Pakistan is much indebited. They were all devoted and hard-working officers who bore their heavy loads of unfamiliar and responsible work with cheerful keenness and administrative ability. I am deeply grateful for their unflagging support in this complicated and wearisome work, which has told on the health of all of us, and above all, for their never-failing kindness and personal friendship.
Each of these gentlemen was served by a fairly large staff, the efficiency of whose work depended
to a great extent on the Deputy Superintendents of Census. Mr. Nomani's deputy in East Bengal was Mr. Abul Khair Ahmed Khan who in the end when all other officers had played their parts and retired from the stage, saw the East Bengal reports and tables into final production. The Machine Sorting Centre at Dacca was ably managed by Mr. Bahauddin Ahmed, who became expert in this work and whose ability will, I hope, be used again. In East Bengal it was necessary to place the compilation work under a special officer, and Mr. Muhammad Badiul Alam, discharged this duty with gleat care and success. All these gentlemen are members of the Provincial Civil Service of East Bengal.
The Deputy Superintendents of Census of West Pakistan had wider individual responsibilities in their smaller fields. Shaikh Muhammad Sharif organized and controlled the very large Hand Sorting Centre at Lahore and then successfully managed the whole compilation work for the Punjab and Bahawalpur State. For the last months of the preenumeration period Agha Ahmad Raza Khan ably assisted in the instructional and inspection work in the districts. In Sind Mr. Mahboob Ali Khoja took charge of the Hand Sorting Centre at Hyderabad and of the compilation work of which he made a very good job. These were all officers of their provincial Civil Services.
Baluchistan made perhaps the heaviest demands on its Deputy Superintendent of Census who on account of the vast distances, was appointed at the very beginning of the Census work to organize and inspect the instruction of enumerators. Mr. Ghulam Hussain's vast bulk and cheerful countenance appeared with abounding energy at every level in every State and district in Baluchistan, prior to enumeration, and afterwards he saw the sorting and compilation work through most efficiently successful conclusion. In Peshwar the sorting of the tribal slips and all the compilation work of the NWFP and Frontier Regions was under the capable control of Mr. Yusuf Ali.
Mr. Ali Muhammad Jafri in Karachi had no Deputy, but the post was created when he left the Census organization and Mr. Akbar Kabir, an officer on the East Bengal Provincial Civil Service, who had successfully managed the Hand Sorting Centre at Comilla, was brought over to
18 INTRODUCTION
take charge of the Machine Centre in Karachi. This was a heart-breaking job, carried out in an unsuitable hut in an out of the way locality, and it was very hard to get and keep an efficient staff. Nevertheless, he mastered the system and drove the job through to completion less although the difficulties, which would have broken a less cheerful spirit, rendered the results somewhat reliable than in Bengal.
As regards my own staff, I never expect to be more loyally served. The Government certainly did its best for me. In the first place I must thank the two gentlemen who served as officers on Special Duty in the Ministry of the Interior (Census Branch) Mr. Mizanur Rahman, M.A., Provincial Civil Service (E. Bengal) and his successor Mr. Abdur Rashid, C.S.P. These experienced secretariat officials removed from me the worst nightmares of administration and also made most valuable contributions in the organization of the Census work. Both these officers hailed from East Bengal and well understood the special problems of that province. Mr. Mizanur Rahman brought experience of Hand-Sorting work in the 1931 Census and Mr. Abdur Rashid came straight from a U.N. Fellowship in the U.S.A. where he had received most valuable instruction in Census work, I can only hope that the next Census Commissioner is equally fortunate.
Mr. N. Shamsi has been the officer incharge of the administrative statistical work of my office throughout the whole operation and in my long service I have never had a more loyal or more effective helper. He had been instructed iQ Census work at the U.N. Seminar held in Delhi and Calcutta in 1949/50. His friendly relations with all officers with whom he had to deal, and his habit of going to see people, instead, of merely vll"iting, facilitated all our activities. Besides handling the constant executive problems of the office he proved a most capable supervisor of the printing work.
A great burden of work and over-work fell on my faithful Personal Assistant, Qazi Mubarak Hasan whose cheerful smile often dispelled the inevitable discouragements of my job. He rose to every emergency and without his willing cooperation the voluminous codes and this report could never have been issued. I must also mention, gratefully team of computing and compling
Assistants which worked under the investigator, Mr. Ghulam Mustafa, and became expert in the detection of errors and defects.
Much valuable advice and help was accorded by the expert officers of the Central Statistical Office and especially by the Statistical Advisers from the U.S.A., Mr. A. Aidenoff and Mr. Thoma5 F. Corcoran. I regret that the rapidity of work, which was forced on me by the late start, often presented me with a dilemm a in giving full effect to their suggestions, but I am very sensible or the value of their criticisms by which I avoided many pit-falls and had we had more time, might have been saved from more. I also acknowledge thankfully the help given by the Survey of Pakistan, which never failed to respond promptly to our numerous appeals for information, and we are also grateful for similar assistance given by the Director of Land Records in East Bengal.
The Chief credit for conducting a reasonably successful enumeration, however, must go to the District Census Officers, and their Charge Superintendents and Supervisors, nearly aU of whom threw themselves with a certain amount of enthusiasm into an awkward job which had to be accepted as an unpaid addition to the duties of busy officials. Wherever I went in my numerous tours of inspection I was impressed by their wholehearted cooperation and their desire to make a good job of the work, I have already mentioned the ready and effective contribution made by the Patwaris and other Revenue Officials in West Pakistan and also by the members of the Union Boards of East Bengal. Without their efforts as Enumerators and Supervisors the work could never have been done at all. The thanks of the country have already been expressed to them and to the numerous private citizens who volunteered to act as enumerators. None of these gentlemen received any reward except the satisfaction of giving an important service to their country. The qUe,'ltion of payment of enumerators is one that is raised at every Census, but having seen the many high-class men who did the work on this occasion I am inclined to think that the type of person which is necessary is more likely to be secured on an honourary basis than if the post of enumerator were to carry a small stipend-in view of the numbers required any payment could only be so insignificant as to be practically an insult.
INTRODUCTION 19
The whole Census organization finally depended upon the cooperation of the public and I must express my admiration for the helpful manner in which the enumerators were generally received. The Census was obviously accepted by many persons as an opportunity of showing their patriotic love for their new country. The Census Act provided penalties for obstruction to enumerators or Jor failures to respond, but no serious instances of such conduct were reported and in fact they would obviously have been completely
opposed to public opmlOn. For myself, I am deeply grateful for the patience and kindness which have been extended to me everywhere both in Karachi and in my numerous tours of instruction and inspection.
E. H. SLADE. Fellow of the Royal Statisticai Society,
Fellow of the Association of Incorporated Statisticians (London)
Census Commissioner, Pakistan.
20
$$00 .. '.... J + ' .. '"
+" (>
~
6, FP.ONT'~P.. REGION'S
7. PUNJAB
I. B"'H"'W"'l~UR ~T"'TI
10 KH"I~PUJ\ STATE
"
I " 0 I "
18HARAl')
PAKISTAN 1M
SOtJTN ASIA
MAP I-I
MeA ENUMfMTED IN FIR5T~ CENSUS O' PAKISTAN ~
a A '( o ,
IIfJlO"l
CHAPTER I
PAKISTAN AND ITS PEOPLE
1.1 Pakistan: Geographically, Pakistan con-sists of two widely separated wings, as shown in Map No. 1.1 which indicates its position in South Asia and the location of its Provinces and States.
The greater part of the population is concentrated in the relatively small area of East Pakistan, in the delta formed by the Ganges and Brahamputra rivers, which js one of the most densely populated parts of the world. It is intersected by a net-work of water-ways and is conspicuous for its high rainfall. The soil formed by the alluvial deposits of the rivers and watered lavishly by their inundations and by the heaavy rainfall, is extremely fertile. East Pakistan consists of the single province of East Bengal.
The western wing of Pakistan comprises the provinces of the Punjab. Sind, Baluchistan and the North-West Frontier Province, the States of Bahawalpur and Khairpur, the Baluchistan States Union and the Frontier Regions and States of the North-West. The Federal Capital, which is a centrally administered area, is located at Karachi on the borders of Sind and Baluchistan States Union.
Map No. 1.2 shows the chief topographical features of East and West Pakistan. In the case of East Pakistan, these consist chiefly of the delta with its many rivers, but western Pakistan has two distinct geographical regions. There are the mountain ranges running down its western borders and extending from the Himalayas to the sea, and there is the basin of the Indus, which stretches out in wide plains from the foot of the mountains in the north. The mountainous area iucludes the North-West Frontier and Baluchlstan and contains much desolate, waterless and sparsely populated country. The Punjab -the land of the Five Rivers-is a rich agricultura I province. The lower reaches of the Indus run through Sind, where irrigation is steadily
spreading its benefits into the once barren loil. However, the eastern portion of Sind and much of Baluchistan still consist of wide stretches of sandy desert.
Much geographical information is given in the Provincial Census Reports and the reader is referred to them for details of the topography, resources and organisation of the Provinces and States.
1.2 Administrative Areas: Pakistan consists of:
(a) The five provinces, viz. East Bengal, Punjab, N.W.F.P., Sind and Baluchistan.
(b) The Federal Capital Area of Karachi.
lc) The States which have acceded to Pakistan viz. Bahawalpur State, Khairpur State, the States (Kalal, Kharan. Mekran and LasBela) of the Baluchistan States Union, and the States in the Frontier Regions (Dir, Swat and Chitral).
(d) The Tribal Areas of the Frontier Regions.
The locations of these areas are shown in Map No. 1.1 and in more detail in Map No. 2.8 which also shows the districts into which each province is sub-divided. In East Bengal and the Punjab, the districts are grouped in Divisions and some of the Provincial Census tables are on a Divisional basis.
Within the Districts the administrative subareas are called Sub-Divisions in East Bengal, Talukas in Sind and Tehsils in all other Provinces. Maps showing the locations of these smaller Areas and the tables showing census figures for them will be found in the Provincial Census Reports.
REFERENCE _) PAKISTAN BOUNDARY -)
PROVINCIAL BOUNDARY....,I
CAPITAL CITIES
OTHER CITIES
RIVERS
MOUNTAINS
MARSHES
•• AM.
\ ,
• • 11: #,./..) (pt.'<;
MAP No. 1.2
WEST PAKISTAN
100 MIL"
...
o
-
\
MAP No. 1.2
EAST BENGAL
In East Bengal the Sub-Divisions are often as populous as Districts are in West Pakistan, and except in Sylhet and the Chittagong Hill Tracts, they are divided into Police areas, known as "Thanas" (police Stations).
1.3 Historical background: Although a Census Report is not intended to be a detailed history of the country, it is useful in considering the results of the Census of population to have in mind the sequence of events .which lies behind the present composition of the people. Each of the Provincial Superintendents has written in his own report a short statement in some detail of the background of the people of his census area. For purposes of this general report, however, the s!JJi.ent features of the history of Pakistan may briefly summed up in the following 'paragraphs.
1.4 Pre-Muslim Period: As early as 3,000 B.C. and probably before that, a highly developed civillz!ttion, of which remains have been found at Mohenjo-Daro in Sind and Harappa in the Punjab, existed in what is now West Pakistan. A great historic city has been excavated at Moh~njo-Daro and evidence has been discovered of an advanced Chalcohlithic culture extending from Harappa along the Indus basin. This civilization appears ,to have been over-whelmed by tribal inroads followed by AryaI} penetration from the North-West somewhere about 2,000 B.C. The Aryans were chiefly agriculturists but they brought with them the rudiments of a technical civilization. The Brahamanic and Buddhist writings indicate a steady advancement of crafts and commerce and speak of the founda-
tion of many towns, some of which were in existence at the time of Alexander's invasion in 326 B.C. Under Hindu and Buddhist dynasties, the Aryan settlements of the Ganges and Indus Valleys made progress but the increase in the population· cannot have been rapid. The Aryans inrush was followed in the next few centuries by the influence of the Sakas, the Kushanas and the White Huns from Central Asia.
1.5 The coming of the Muslims: The first arrival of the Muslims into what is now Pakistan dates from the conquest of Sind in 712 A.D. by Muhammad bin Qasim, an Arab general who penetrated up the Indus valley as far as Multan. Towards the end of the tenth century the intrusion began of the Muslim conquerors into India through the north western passes. In 986-7 A.D. Subuktagin, the Turkish Sultan of a Muslim principality with its headquarters in Ghazni moved down through the Khyber Pass, crossed the Indus and overthrew the Rajput ruler of Lahore. Mahmood Ghazni, his son, made a series of inroads into India between 997 A.D. and 1030 A.D. and exercised more or less continuous control over the northern Punjab. Thereafter, wave upon wave of Muslim invaders occupied northern India in tum-the Turks, the Afghans, the Mongols (who were, however, non-Muslims) and finally the MoghulS under Babar who laid the foundations of the great Moghal Empire. Babar was the first of a line of Moghal Emperors whose rule descended from father to son, through Humayun, Akbar, Jehangir, Shahjehan and Aurangzeb, until the eighteenth century. Their administration, when it reached its highest watermark, covered practically the whole of what is now India, Pakistan and Afghanistan. After the Moghal Emperors had assimilated the Bengal sultanates, Muslims infiltrated in all parts of that country and especially the area which is now East Bengal.
In literature, art and architecture, the Moghul period was an age of enlightenment and great progress. It was a period of Muslim renaissance, there was during this period much fruitful development of those tendencies and traditions that had their beginnings in the Turko-Afghan period. The art and architecture of the Moghul period, especially as they blossomed forth after the accession of Akbar in 1556 present a happy
24
mingling of the past and contemporary traditions and ideals.
1.6 British Rule: It was in Bengal that the battle of Plassey in 1757 enabled the East India Company to establish its ascendency and facilitated the advent of the British rule in India which finally extended over the whole sub-continent. Under the Company's regime the Muslims, specially in Bengal, suffered a great decline in their position in administrative services as well as in trade and commerce over which activities the Hindus established a virtual monopoly. With the transfer of Indian administration in 1858 to the Crown from the East India Company, direct control by Biritish administrators was established in those parts of India which were not ruled by their hereditary Princes in treaty with the British Government. With this new regime the Muslims on the whole found themselves able to co-operate with comparatively greater r~adiness, and made rapid progress in industry and trade and, with the spread of education, many of them reached high administrative positions.
1.7 The Idea of Pakistan: Muslim nationalism, as distinct from the Hindu nationalist movement, found its first expression in 19;)6 when the AIlIndia Muslim League was formed. In 1930 Dr. Muhammad Iqbal, poet and philosopher, propounded the idea of a separate homeland for Muslims in India. This demand gained ground steadily and, in 1940, the All-India Muslim
League, under the presidentship of Quaid-e-Azam Muhammad Ali Jinnah, the founder and architect of Pakistan, adopted the demand as its firm political goal.
1.8 Pakistan: On the 3rd June 1947, the British Government announced its decision to transfer power to Indian hands, and, at the same timt(, conceded the Muslim demand for Pakistan. The new sovereign State of Pakistan came into being on the 14th August, 1947.
1.9 Boundaries: The boundaries of the new State involved the partition of the Punjab and also of Bengal, and. the inclusion in Pakistan of the Sylhet district of Assam. Explanations of the changes in area, in so far as they affect the Census figures, are given in the appropriate Provincial reports.
1.10 Refugees and Evacuees: As an aftermath of partition a terrible campaign of massacre and pillage drove vast numbers of Muslims living in India, and especially in the eastern Punjab, to seek refuge in Pakistan, resulting inevitably in a similar exodus of Sikhs and Hindus from Pakistan to India. This trem~ndous movement of population has involved several million people of both sides and created appalling ftardship as well as great administrative and economic problems. The Muslim refugees who enter~ Pakistan, known as "Muhajirs", are the subjeCt of frequent references in the Census report and tables.
CHAPTER 2
POPULATION ~ROWTH AND DISTRIBUTION.
REFP:RENCE TO STATISTICS Table 1 urban and Rutal Population and Area.
I-A Population of urban Areas. 2 Cities and Towns. 3 Variations. 1901-1951 5 Birthplace.
10 Non Pakistanis. 19A Mubajirs by places of origin.
Statement 2-A
25
2.1 Growth of the Population.-The population of the area which now forms Pakistan has seen a steady rise during the last 50 years. The 1951 Census of Pakistan shows an increase over the Census of 1901 for the same areas of approximately 66.7 per cent or an average of 1.03 per cent per annum. The rate of increase has been greater during the last 20 years and the average rate per annum since 1931 is 1.25 per cent. If this rate were to continue steadily the population would reach 90 millions by 1965 and amount to 100 millions by about 1971. This rate of growth is about double the rate at which the population of the United Kingdom has been increasing during the same period.
Percentage increase in population by decade1. for India and Pakistan, 1901-51.
The increase in popu~ation in what is now Pakistan, bas been due to several causes in addition to the natural increase by the excess of births ~ver deaths. In particular there has been consideratle immigration due to the great irrigation schemes which have been introduced during the last 50 years in the Punjab and Sind.
A comparison of the rate of growth during the past 5 decades involves the consideration of the data given in the pas~ Censuses of India. In Statement 2-A the increases shown at each Census
( Reference paragraph 2.1 )
Decade Pakistan India I India &
Pakistan
1901-11 .. 11.9 5.7 6.7
1911-21 .. 6.7 0.4 0.9
1921-31 .. S.S 11.0 10.6
1931-41 .. IS.S 13.5 15.0
1941-51 .. 7.9 14.1 12.9
is analyzed according to the geographical areas which now form Pakistan and India respectively. Compared with Pakistan's increase of 67 per cent ill the last 50 years, India has shown an increase in the same period of about 50 per cent.
Note: 1 this chapter is based very largely on the discussions I had with Mr. Douglas. L. Ralston, who came to assist me under the United Nations Technical Assistance Scheme is the research and analytical ",ork of the census. I have made much use of his notes and drafts, and am deeply grateful for his help, but he had to return to Canada before this report was written and I take the responsibility for the whole chapter and for the accuracy and validity of the data given and the conclusions drawn.
E. H. Slade.
16.
The figures in the Statement for the period 1901 to 1921 are much higher for Pakistan than for India. Actually, according to the calculations, the 1911-1921 decade saw a net reduction in the population of India ascribed to the disastrous influenza epidemic of 1918. The population of the Pakistan areas was greatly affected bv the same cause but nevertheless made a considerable gain during the decade.
It is difficult to explain the figures for the decade 1931-41 which are very high for both Pakistan and India, but it is relevant that the census figures may have been somewhat under-stated in 1931 and overstated in 1941. There was an attempted boycott of the Census in 1931 as part of the policy of Non-Cooperation with the British Government. However, the Census authorities reported that on the whole this movement either failed or proper compensations were made for it and in fact in some provinces there were reports of an attempt to inflate the figures for political purposes. On the whole the 1931 Census is regarded as fairly accurate. The more probable cause for the high rate of increase shown between 1931 and 1941 is the inflation of the latter census. In East Bengal and the Punjab, and specially in the regions which are now in Pakistan, political tension was acute at the time of the 1941 Census and both Muslim and Hindu communities\ endeavoured to cause an artificial increase in their reported strength. The exact extent of this inflation cannot be assessed. The Census authorities did their best to defeat the efforts of over·zealous partisans and to remove any remaining effects from the published results. In many places in this Census Report, however, it will be apparent that the figures of the 1941 Census for East Bengal are out of line both with previous trends and with the results of the 1951 census and should be treated with caution. Nevertheless whatever may be the situation as regards accuracy of the reports, tlle fact remains that in the Punjab and Sind dl,lring the 1931-1941 period the wave of immigration continued into the newly irrigated areas which- are now in Pakistan, and much of the large incrt:ase shown must be trea!ed as true.
2.2. Decade 1941-1951.-Coming to the decade ending with the 1951 census, it is obvious that these years of war, partition and fa)nme were less favourable to population growth in Pakistan. In India these factors did not apply so intensely and may have been outweighed in the much
\ ,
larger total population. Since the population of West Pakistan increased by about 19.4 per cent in the decade, however, it is in East Bengal that the reason must be found for the low increase of 8 per cent shown by Pakistan as a whole.
The difference between the 1941 census figure for what is now East Bengal and the 1951 census in that Province is only an increase of one tenth of one per cent. The Muslims in East Bengal have been increasing many decades past at a much higher rate than the Hindus. The migrations which reached such proportions after partition may well have had their beginnings much earlier. Statement 2-B shows the comparative rates of growth of the two main communities since 1921. Inflation of 1941 would tend to exaggerate the increases in the 1931-41 decade and the decline of the Hindus in the 1941-5-l.; while minimising the Muslim increase in the latter decade.
Statement loB.
Percentage increases in population by main religious groups for East Bengal, by decades,
1921·51. (Reference paragraph 2.1)
Decade I Total I Muslims Hindus
192i-31 7.0 9.9 S.4
1931-41 17.9 18.8 11.3
1941-51 0.1 9.0 -22,
The low figure of overall increase in the reported population of Pakistan during the last decade may 'theretpre be attributed mainly to the conditi,pns in. East Bengal including the doubtfulness of the 1941 census there. There is nothing to indicate that the 1951 census was not reasonably complete, on at least as much so as is usu~ in this part of the \VorId. Statements of all the Provin· cial Census 'Superintendents are unanimous in this view and it is their belief that the absence of communal tension provided a basis for a more rational census than the previous one.
2.3. Compar~ive growth in East and West Pakistan.-The chart in Figure 2.1 shows the rise in popula\ion of J;>akistan and its two wings since 1901. East Pakistan has a density of poputlation of 7.77 persons per square mile which is seven times'that of the average density
f!'IG. 21
GROWTH OF POPULATION
laO
700
lOa
.00
III 1: lC « 400
..J
10.
root--------___ --!
l'Or Iii' 19Z1 1931 1941 1951
CENSUS YEARS
of West Pakistan. It can be imagined therefore that the pressure on agricultural resources has been great and that this is a vital factor in the rate of population growth in East Bengal. What can happen when crops are poor was demonstrated in the most severe manner by the famine of 1943. It is to be expected therefore that the population of East Bengal will have grown at a slower pace than that of the provinces of West Pakistan with their greater land po,entials, important industrial developments and steadily growing irrigation facilities. Statement 2-C shows that since 1901 the proportion which the population of "What is now East Pakistan bears to population of what is now West Pakistan has steadily dropped. .
The composition of the population of East Bengal has also been changing steadily and statement 2-D indicates that the Muslims have formed an increasing proportion in each succeeding Census. The drop in the Hindu population is particularly sharp in the 1951 Census owing to the exodus of Hindus to which reference has been made above.
While therefore the densely populated province of East Bengal has increased its population from
27
Statement 2-C.
( Reference paragraph 2.3 )
Percentage distribution of the population as between East and West Pakistan, 1901·51.
Year Total East West Bengal Pakistan
1,901 " 100 63.6 36.4
1911 " 100 61.9 38.1
1921 .. 100 61.2 38.8
1931 " 100 60.2 39.8
1941 " 100 59.8 40.2
1951 .. 100 55.5 44.5
289 lakhs in 1901 to 421 lakhs in 1951-a rise of 45.7% equal to an average rate of 0.75 per cent per annum-the population of West Pakistan. with its vide spaces and developing industries, has risen far more rapidly. From 166 lakhs in 1901 it has reached 338 lakhs in 1951-a rise of 103.6% equal to an average rate of 1.45 per cent per annum. That average conceals however the
Statement 2-D.
( Reference paragraph 2.3 )
Percentage distribution of the population by
religious groups for East Bengal.
Year I Muslims \ Hindus Othtfs
1901 66.1 33.0 0.9
1911 67.2 31.5 1.3
1921 68.1 30.6 1.3
1931 69.5 29.4 1.2
1941 70.3 28.0 1.8
1951 76.9 22.0 1.1
28
acceleration which has occurred since the irrigation works began in the Punjab and Sind and the average rate of increase in West Pakistan since 1931 works out at 1.82 per cent per annum. The difference in the annual rates of growth is brought out very clearly in the chart at Fig. 2.2. It also illustrates the higher rate of growth which has been observed since 1931.
-,-------~
AVERAGE ANNvA~ RATE OF GROWTH
FQR
EI'.ST I'.NO 'liES, 1'1'.\<'\~i"N
1901-,1 ANO 1931_51
.·s I·' ~ ..
WUT~ 'Io"t$TAN
CJ - 1901-#1
The chart at Fig. 2.3 contrasts the percentage distribution of the population by provinces during the last 5 decades. The falling proportion of the total population of the area which now form East Bengal is noticeable, as is the increasing proportions formed by the Punjab and by the other provinces of West Pakistan. The respective provincial reports discuss the growth of population in their provinces and in the various districts. Only a brief outline of the more salient features of the Provincial patterns in West Pakistan is attempted here in order to show the various influences which contributed to the general trend disclosed in Census Table No.3. Movements of population between various regions of the sub-continent are an important element in the growth of the provincial populations of West Pakistan during the last half of the century and this point is discussed in the following paragraphs.
'0'51 It,., lfl.ll
t~2'
Ul "" , .. , a: < w >- '." ... ,
IIll Ul I'IiIll
:::l ItO
Ul '10' :I!! lit U It!!'1 ft.,
".JI ,.,, '.0 ' .. ,
"10. z ... !
PERCENTAGE DISTRIBUTION OF THE POPULATION BY PROVICES
1901-195' I H.W.F.P. & I t:ZJ ~ . ~ . fR,OH11L"R REO,O"'
2.4. Punjab.-The fastest growing region of Pakistan has been the fertile areas in the Punjab province and Bahawalpur State. Rapid growth commenced in the 1921-31 decade with the extension of the irrigation on a large scale in the Punjab and the construction of the Sutlej Valley Project in Bahawalpur State. Migration from many other regions was an important element in this growth. Over the 50 years period from 1901 to 1951 the rate of growth averaged 1.4 per cent per annum. But this rate rose to two percent per annum during the final twenty years, the largest element in the growth of the last decade being of course the movement of refugees into tne Punjab following partition. The rate therefore for the last decade is 110t likely to persist, but it seems evident that the population of the Punjab will continue to show a steady growth.
2.5. Sind.-With the exception of 1911-21 decade, in v:.hich the influenza epidemic of 1918-19 caused heavy mortality in Sind, this province has shown a fairly steady rate of growth during the last 50 years. After the loss of 9 per, cent in population of 1911-21 Sind recorded a great increase in the following decade when it gained 18 per cent. This steep rise is believed to have been mainly due to the influx of labour employed in the construction of the Sukkur barrage most of the people having come from outside the Province. In the 1931 decade, Sind increased its population by 14 per cent anti in 1941·51 by 12 per cent. The irrigation projects can be expected to cause growth of this order to be maintained and probably in the coming decade.
MA\N SiRE AMS OF MUHAJIRS (FIGURES 1M THOUSANOS) MAPN-p' 2·4
FROM ~ORTf{£RN
ZOtH:
fROM HORlHWE.SiERM
20HE
FROM WESTERN
1.01ti..
fROM SOUTHERN
ZONE
FROM CENTRAl..
ZOHE.
fROe.t EASTERN
lOME
2'6. N.W.F.P.-The N.W.F.P. proper I.e. excluding the Frontier Regions, has grown at a rate which coincides fairly closely with the pattern of iOcrease throughout the rest of West Pakistan. As in other provinces the period of least growth was the 1911-21 decade which, in the NWFP, was a time of successive poor harvests and epidemics of Malaria and Influenza. Also during this period there was a trend of emigration of agriculturists towards Afghanistan, many of whom returned in great poverty. The greatest growth is shown in the 1931-41 decade· when the Census figures show an increase of 25 per cent. The Census Superintendent of N-WFP reports that some of this high figure may be due to inflated returns in the 1941 Census when "the PI()vincia~ legislature had Iecently been constituted on communal basis and with a view to secure maximum political advantages, members of each community reported exaggerated figures for their families."
The Frontier Regions which comprise territories equal to about four-fifths of the size of the province itself, has in all Censuses been included in the population figures mainly by estimation. The conditions of life and the nature of the country make it impossible to carry out a normal enumeration. The degree of accuracy for some of the earlier Censuses is rather doubtful as they produced wide fluctuations in the population, such as a 74 percent rise in the disturbed 1911-21 decade and a 20 per cent drop in the following decade. At the 1951 Census the 'full enumeration of the Frontier regions was extended and covered about a third of the total population of 26 lakhs in the Frontier regions. The estimates of the remain" ing two-thirds were made by the local Political Officers who checked the ,figures by enquiries from tribal chiefs and village headmen. It is hoped that on this occasion the estimates will prove rather more reliable. At any rate the more recent estimates show a more uniform rate of growth; between 1931 and 1941 the population is shown as increasing by 5 per cent and in 1941-51 by 11 percent. •
2'7. Baluchistan.-The Province of Baluchistan together the Baluchistan States Union represents less than two percent of the population of Pakistan and the States acco,unt for approximately about half of the figure. The growth of Baluchistan population conformed with the general pattern from 1901 to 1931 but after that
it showed a surpnsmg reversal of the general trend. Between 1931-41 the Census shows an increase of only 8 percent compared with 20 percent for the rest of West Pakistan. In the last decade 1941-51 the population has increased by 24 percent compared with the average increase of West Pakistan of 19 percent. Devastation and loss of life in the earthquack of 1935 no doubt had its effect in the lower birthrate for 1931-41 decade. But the Provincial Superintendent of Census for 1951 is inclined to suspect that a certain amount of reluctance to report full numbers in 1941. He claims that in 1951 a far better coverage was achieved than had been possible in previous Censuses. The high rate of growth shown for the last decade therefore may not all be strictly applicable to that period.
2'8. Federal Capital Area.-From a population of 1.4 lakhs in 1901 the Federal Capital Area rose to over 4.4 lakhs in 1941, but has increased tremendously since it became the national Capital . The enumerators reported over 11 lakhs of population in 1951, and even this is believed to be a slight under-statement. The population of Karachi no\',{ consists of refugees to the extent of more than 50 percent and the rehabilitation of this element, their welfare and housing, will have a most important bearing on the future rate of growth. The city however is developing very rapidly and although it cannot expect to continue to increase at the rate of the past decade there would appear to be very prospect of l\I continuing rise in population.
2'9. The Mubajirs.-Census table No. 19A shows the number of refugees from India and contiguous Lands shown in the enumeration repoqs of the Provinces. Similar tables in the Provincial Census Reports give the figures by Distr~cts and Towns of enumeration. Map
'No. 2\4 show~ the general direction of the streams of the:movement of these people while the figures
'are summarized in statement 2.B.! In general it will be seen that the Punjab, which has found houses for 53 lakhs of Muhajirs out of the all Pakisucl total of 72 lakhs has received them mostly from the contiguous areas of North West India and Kashmir, while persons from West Indi~ and Rajasthan have come to Sind and Karachi: The sources of the Muhajirs enumerated in the la\ter city are shown in Map No. 5.1. The number '.of Muhajirs enumerated in urban areas is shown in Census table No.2, which
STATEMENT 2-E
( Reference paragraph 2.9 )
MUHAJIRS.-ORIGINS.
31
Thousands.
,Total Muhajirs
Chief Zone of previous residence Province where Enumerated 1 I
Sind & Khairpur State .. 5,50.3 3,70.9 21.0 1,16.9 32.1 4.3
(a) Persons claiming to be Muhajirs-many ilnigrants did not make that claim, particularly those who were returning to their province of birth, or whose move was not connected with partition.
STATEMENT 2-F.
(Reference paragraph 2.9)
Proportion of M~jirs in Population
I. Population l;~ Percentage
Province and State of (1000)s 000)8 Muhajirs
Pakistan .. 7,38,80 72,26 9.8
Baluchistan and States Union .. 11,54 28 2.4 Districts .. 6,02 28 4.7 , States Union 5,51 \ .. - -
East Bengal .. 4,19,32 6,99 1.7
Federal Capital Area Karachi .. 11,22 6,17 55.0
N.W.F.P. .. 32,22 51 1.6
Punjab and Bahawalpur State .. 2,06,36 52,81 25.6 Districts .. 1,88,14 49,08 26.1 Bahawalpur State .. 18,22 3,72 20.4
Sind and Khairpur State .. 49,25 5,50 11.2 Districts .. 46,65 5,40 11.7 Khairpur State .. 3;19 10 3.1
Males per 1,000 Femrues
Total I Muhajirs
1,127 1,187
1,215 1,800 1,239 1,300 1,139 -1,097 1,205
1,342 1,320
1,117 1,429
1,152 1,167 1,149 1,164 1,189 1,207
1,220 1,165 1,218 1,169 1.246 1,133
32
400
300
r/) I x: 4: ...J
200
10.0
East Bengal
POPUI.ATION OF PllOVIN'E~1
AND OF WEST PAKISTAN
West PaJ(lStan
Puniab .\ Bahawalpur State
N.·W.F.P. & Frontler Regions
Sind & Khairpur
State
Total population ..
indicates that, in all, 28 lakhs out of the 72 lakhs of Muhajirs were found in towns, i.e. 39 % of them. The proportion of Muhajirs in the total population is shown in statement 2.F.
2'10. General distribution and Density of Population.-The distribution of the population of Pakistan is shown in Census taIJ]e No. 1. It gives the figures of total population, by sexes, of the Provinces and States together witil the area in square miles and the number of persons per square mile. Out of the total population of 758 lakhs nearly 421 lakhs i.e. about 55 percent are in East Pakistan. The charts in Fig. No. 2.5 shows graphically the relative sizes of the population of the different parts of Pakistan. From this chart the vide differences between the provinces of Pakistan are easily apparent.
2'11. Over-all density.-Among the countries of the world Pakistan stands seventh in size of the population. Based on the total land area amounts to 365 thousand square miles and the average
33
population density works out to 208 persons per square mile. Pakistan has the;:efore the fifth highest density among the ten most populous countries of th:: world, the data for which are listed in statement 2-0. The figure of over-all density of population can, however, be somewhat misleading and in the case of Pakistan it hides the differences in widely varying provinces. The figures need to be applied on a regional basis in order to take into account the differences in conditions and land uses. East Bengal contains the majority of the population and has a very high rate of density. West Pakistan contains more land and considerably fewer people. A further outstanding point is the fact that despite the high pressure upon the land in East Pakistan industrial activities are less highly developed. These facts and contrasts are manifest in Chart No. 2.6 which illustrates by means of a small maps drawn to the same scale, the relative areas of the two wings of Pakistan, and shows against each by means of a circular chart the size and composition of the population.
Statement loG
( Reference paragraph 2.11 )
Population, land area and average density of the ten most-populous countries.
Country ,
Date of Census
China .. .. .. (3) India .. .. . . 1951 U.S.S.R. .. .. .. (4) U.S.A. .. .. .. 1950 Japan .. .. .. 1950 Indonesia .. .. .. (5) Pakistan .. .. .. 1951 Germany .. .. .. (6) Brazil .. .. .. 1950 United Kingdom .. .. 1951
(1) Source-Population and Vital Statistics Report (U.N.) Series A, Volume V, No.1, January, 1953.
(2) Source-Except for Pakistan, U.N. Demographic Year Book, 1952 (Areas in Sq. Kilometers converted to sq. miles)
34 Fig. 2-6 ECONOMIC DISTRIBUTION OF TOTAL POPULATION.
West Pakistan. Total Population 3.37,03.000
Total Male. Female:
100 30.7 20.1 10.6 6.9
68.4 3S.8 32.6
53.9 29.7 19.4 10.3 0.9
23.3 18.6 4.7
46.1 1.0 0.7 0.3
45.1 17.2 27.9
Ch ilian Labour Force
POPULATION Civilian Labour Force
Agricultural Non-Agricultural ..
Self Supporting persons not in Civilian Labour Force
Dependents Children under 12 years Persons aged 12 years and over
I ] 1\\\\\\\1} PZZI]
Self Supporting Person. Not in Civilian lahour Force
'(wi .... tmmm1 Dependent Males
East Bengal.
ThtalPopulation 4,19,32;000 Total Male. Female.
100 30.7 25.6
5.1 0.3
69.0 36.3 32.7
52.3 28.3 23.6 4.7 0.2
23.8 18.7 5.1
Dependent Females
47.7 2.4 2.0 0.4 0.1
45.2 17.6 27.6
Females in Civilian Labour Foru
Estimated Population 01 FronUer Regions
FIG. 2.7
DENSlTY
ElL!! i: 8e.gat 777
PERSONS PER SQ. MILE
PUY>j'b 25'
NWFP 1;0
Shul '7
Baluehr. &.8
The area of each square is proportion~te to the number of persons per square mile
Oltic:e 01 the C,n~US: Commi6;cn.er. Ksraohi
The Chart in Fig. No.2. 7 illustrates the difference in density of the population of the five provinces. The areas of the squares in this chart arc in proportion to the density, and onc can see what vast empty areas there would be, for instance in Baluthistan, of the few people there were crowded together as they are in East Bengal. But these average figures again obscure significant local variations as can be observed from Map No. 2.8 which shows the average densities in each districts of East and West Pakistan of even greater interest are the figures shown in Table 1 of each of the Provincial Census Report which provide a more detailed classification of the density of population according to Sub-divisions, Tehsils and Talukas.
2-12. Density pattern.- The foregoing considerations demonstrate that the bulk of Pakistan's population is concentrated in a relatively small portion of the total land area. Taking only the districts with a higher density than the national average (i.e. those having more than 200 persons per square mile) all the districts of East Bengal with the exception of' Chittagong Hill Tracts will be included in this group, whereas in West Pakistan such a group would only include the
Federal Capital Area, the 12 central and eastern districts of the Punjab and three districts of NWFP namely, Hazara, Mardan and Peshawar. Although varying considerably from each other the map shows that these districts represent a solid block of high density areas in the northeastern section of West Pakistan, approaching in one or two districts, the density rates of some of the districts of East Bengal.
These 31 districts of East Bengal and the nearly easterly portion of West Pakistan together comprise nearly 80 percent of the total population vide Statement 2.H. Adding the Federal Capital Area to this group the figure will be raised to over 81 percent. Since 16 out of the 17 districts of East Bengal are high density areas, percentages for the whole province are not greatly different than those shown in the statement. Actually East Bengal comprises 14.8 percent of Pakistan's total land area 55.5 perce~ of her total population. On the other hand, West Pakistan includes 85.2 percent of the land area and only 45.5 percent of the population. This leads by far the larger portion of Western Pakistan with lower than average densities, see the Chart in Fig. No. 2.9 Almost half of West Pakistan is represented by
35
> .... '1
Do ... I'J1
"' li i!)
g n
tsj
'Z:
!e tJI""O ld» !il~ ..,,_ ~ ~-i "0> ~Z til .g
;>;: ~ :s:
;eo <..., .....
til ;.. ~ ::t:~~
;:;:: ~ .... c::
~
V1
8 s .•. .... g i
"1
~ qo'
~ r- Oo I'll '0 tTl "i g Cl
~ N 00 '" '" ... "' N :; r r en tTl 0 0 0 0 '" 0 -!' S 8 <? <;:> 0 ? r 0 r .!.. :s: -t ~ ~ .I> tv ~ '" ~ ~ '" '" '" '" ....
'" '" '" '" '" '" '" .0-rA '"
~ DI~li~~:i::: DO
37
Statement 2-H
(Re/erenceparagraph 2.12)
Districts with higher than average population density, showing percentage of (a) total land area and (b) total population, 1951.
Item
Number of districts .. .. Percentage of total land area of Pakistan ..
Percentage of total population of Pakistan
the large areas of Baluchistan province and States Union with an average density of 9 persons per square mile and in fact largely consisting of desert.
2'13. Density in relation to rivers and canals.The population of West Pakistan is primarily agricultural and the influence of its extremely dry climate on the distribution of its people is
I \ Districts with population density
I of over 200 persons per sq.
, mile.
I \ I Pakistan East West
I Bengal Pakistan , --.. 31 16 15
.. 25.4 13.5 11.9
.. 79.5 55.1 24.4
clearly evident from the map in Fig. 2.10. Dependent to such a marked extant upon irrigation schemes to render the land capable of cultivation, the population flow has naturally been towards those areas able to fulfil this urgent need for water. Thus it is that more than half of West Pakistan'S population, as noted earlier, is concentrated in the 15 districts of the fertile Punjab region through which the waters of four rivers are spread in an extensive canal system. This map also indicates a second group of districts, not so densely populated as the fore-going group but not as sparsely populated as the districts to the West. The second group of districts runs from the north to the south of West Pakistan following the basin of the Indus and includes districts with average densities between 100 and 200 persons per square mile. It may be expected that with a further development of irrigation project in the lower Indus basin, population densities in the districts in this group which lie in Sind will tend t:, approach more closely to those of the Punjab.
2'14. Population density in relation to cultivation.-Of considerable significance in view of Pakistan's agricultural economy is the relationship between the population dependent upon agriculture and the amount of land under cultivation. For purposes of comparison, the rural population roughly represents the persons depending upon cultivation although in fact there is always a proportion of cultivators living in the small towns, and therefore the agricultural
38
RELATIONSHIP OF POPULATION DENSITY
TO RIVERS AND IRRIGATION SYSTEMS
WEST PAKISTAN, 1951 I£lASEO ON AVERAGE DISTRICT DENSITIES PER SQ, MIl-E)
\
\ I
MAP 2-10
'9 Statement 2-1
( Reference parl2{Jraph 2.14 )
Density in relation to Cultivation
. Average population density '1 Agricultural density
Province Cultivated Rural popula-Total land area Population land area (1) tion per sq.
(ijoo sq: mi.) (per sq. mi.) (000 sq. mi.) mi. of culti-\ vated land area
I ,-
I Baluchistan (3) .. .. 54.5 11 1.8 277
East Bengal .. .. 54.5 777(2) 34.5 1,1666
N.W.F.P. (3) .. .. 13.6 240 4.4 624
Punjab (3) .. .. 62.2 302 30.4 507
Sind (3) .. .. 50.4 91 16.8 234
(1) Includes net area sown aM fallow land. Latest year figures available as follows: Punjab, 1950-51; East Bengal and N-W.F.P., 1949-50; Baluchistan, 1947-4tl~ Sind, 1945-46 (Source; Ministry of Agriculture)
(2) The density 777 is calculoted excluding large river areas amounting 360 sq. miles.
(3) Excluding States, Districts only.
densities shown in Statement 2.1 are possibly slightly understated. However, the pressure on Pakistan's cultivated land can be easily seen from this statement. The figures relate to provincial areas only, excluding States as the data regarding land under cultivation in the latter are net always available. Although the data does not all relate to the same year, it provides a general picture of the relative crowding of the rural population in relation to cultivated land. East Bengal's rural density of over 1100 persons per square mile of cultivated area is most indicative of the conditions which prevail amongst the almost wholly agricultutal population of this province. Sind has the least agricultural density of 234 persons per square mile and in view of the important irrigation projects under way seems to be the roost promising area for supporting additional agricultural population. In the Punjab there would appear to be a danger of the onset of severe land crowding, and the consequent lowering of living standards, sucll as have occurred in East Bengal. The final solution of this problem of ever increasing densities in the richer
agricultural areas will no doubt require longterm planning of an well-balanced economy with an increased industrialization to provide additional means of livelihood.
2'15. Rura\ and urban distribution.-Based on the definition of an urban area used in the 1~51 Census, about 10 per cent of the total population of Pakistan, can be classed as urban dwellers. In 1901 the proportion in the areas which are now Pakistan was only 5 per cent.
As in previous Censuses of India, a city or town is regarded as an urban area if it has a minimum of 5,000 inhabitants, and, in accordance with the recommendations in the Census Report for 1941, this minimum has been more strictly enforced on this occasion. All Incorporated Municipalities and the towns managed by Notified Area Committees have however still been treated as urban for Census proposes even if they have fewer than 5,000 in habitants. The method of setting a population level to distinguish rural from urban areas is a somewhat arbitrary
40
Statement J...J
(Reference Paragarph 2.15)
Percentages rural and urban, 1901-51.
Percentage distribution Percentage increase by decades rural and urban
Year Total Rural
1901 100.0 94.9
1911 100.0 95.1
1921 100.0 94.6
1931 100.0 93.5
1941 100.0 92.1
1951 100.0 89.6
basis of separation.' However, the definition follows the widely used practice of defining this concept in terms of "size of agglomeration". Despite any disadvantages it may have, it provides a useful, if imperfect, yardstick for the measurement of the numbers and characteristics of the two population groups. In fact it coincides largely with reality since in Pakistan most of the people who live in towns of less than 5,000 inhabitants are generally engaged in agricultural pursuits, and there is little of the urban way of life such as is found in the large centres.
Since the early years of this century the population living in urban centres although relatively small in numbers has been increasing at a faster rate than that of the rural localities. Hence the urban segment of the population of Pakistan is an increasing proportion of the total population in each Census since 1911, as is shown in Statement 2.J Except for the most recent decade, however, the rate of urbanization has not been large. The more marked gain of the urban element over the rural in the 1941-51 decade is largely due to the refugee movements. Many urban areas gained in population through the influx of refugees despite the fact that the departing Hindus mostly came from the towns. However, in East Bengal where the
Urban !
Rural Urban
5.1
4.9 +8.8 +8.5
5.4 +6.2 +16.1
6.5 +7.5 +32.1
7.9 +17.0 +44.1
10.4 +5.0 +41.9
small (5 %) urban population increased by 33 per cent the huge rural population declined by one per cent below the 1941 figure. Some of the reasons behind these changes are discussed in the Provincial Report for East Bengal.
The relative size of the urban element in the population varies considerably between provinces. The Federal Capital Area is naturally almost entirely urban, but there is a striking difference between the town population of the Punjab which amounts to over 17 % of the total population of the province and that of East Pakistan which is only 4.4 %, vide Statement 2.K.
An analysis of urban areas by size is given in Census table No. 2 and the classification is summarized in Statement 2.L. Pakistan in 1951 census contained 242 cities and towns of Over 5,000 inhabitants. Almost half of
\these were in the 5000-10,000 class and nearly one third of them in the 10,000-25,000 class. The maps in Figures 2.11 shows the distribution of the towns of 10,000 and more inhabitants.
2·16. Cities.-Two cities, Karachi and Lahore, had over 5 lakhs of population and nine others were over the one lakh mark. These eleven cities comprised one half of the total urban
41
Statement looK
( Reference paragraph 2.15)
Percentages rural and urban, for provinces, 1951.
(Total population of each province-tOO)
Province and State Total Rural Urban
Pakistan 100 89.6 10.4
Baluchistan & States Union 100 87.6 12.4
East Bengal 100 95.6 4.4
Federal Capital Area. Karachi 100 5.1 94.9
N.-W.F.P., and Frontier Regions 100 91.4 8.6
Punjab and Bahawalpur State .. 100 82.6 17.4
Sind and Kbairpur State 100 85.8 14.2
Statement l-L
( Reference paragraph 2.15 )
Urban population by size groups, Pakistan, 1951.
Number ofl Percentage Percentage Urban size groups cities and I Population of urban of total
towns 1951 population population
Urban total (1) 242 78,63,320 100.0 10.4
5,00,000 & over 2 19,17,935 24.4 2.5
1,00,000- 4,99,999 9 19,93,790 25.4 2.6
50,000- 99,999 9 6,34,216 8.1 0.8
25,000- 49,999 36 12,85,334 16.3 1.7
10,000- 24,499 77 11,54,395 14.7 1.5
5,000- 9,999 109 7,56,339 9.6 1.0
(1) Groups do not add to totals' due to inches in as urban of places under 5,000 inhabitant amounting to approximately 2 lakhs population.
population of Pakistan and with Quetta, the capital city of Baluchistan with 84 thousand population, accounted together for four million souls or 5 per cent of Pakistan's total population.
At the turn of the century in 1901 these cities had a combined total of one million or 2 per cent of the total population of what is now Pakistan.
42
Fig. 211
Cities and Towns Population.
1,00,000 and over 50,000 and over 25,000 and over 10,000 and over
CITIES & TOWNS OF WEST PAKISTAN
.' ........
:I •••• . ' ....... IS /--:
:. : . . .:. :
." . .// ....
" ..... "
PUHAWER
KEY TO DISTRICTS AND STATES.
BALUCHISTAN PUNJAB.
1. Quetta-Pishln 2. Laralai 3. Cbagai 4. Sibi S. Zhao
Until recently Lahore was the largest city, in this area but l{:arachi with over half a miJlion refugees has now become by far the largest city in Pakistan with Lahore in the second place. Statement 2.M shows the changes in relative size of the 12 cities since·1901 Census.
1.17. Rural and urban differentials.-The contrast between town and country dwellers can be studied from the,1951 Census results in regard to many variables such as Sex, religion and certain economic I characteristics. For further examination of these subjects reference should be made to the other chapters of this report and to the Provincial Reports. In general the male excess, over females is more marked in the urban areas\ Another fact to be born in mind
Numerical rank at each Censu~
1901 1911 ~~! 1941 ~
3 3 2 2 2
2
2 2 3 3 3 3
4 4 4 4 4 4
8 8 8 8 9 s
6 7 6 7 s 6
7 5 7 6 7 7
12 12 12 12' 11' 8
9 9 9 9 9
S 6 S S 6 10
10 11 11 11 10 11
11 10 10 10 12 12
lis that the occupations adopted by. caste Hindus have always led to a tendency for them to pongregate in the towns. Als4) Muhajirs have ~ended to settle in urban areas '0 a greater extent than in the country districts.: The movement of 1fugees therefore has had a !p'eater effect on the , ban areas.
1.18. Place of Birth.-Census table No. 5 analyses the population enumerated in each pro'Xince according to the Birthplaces reported. In the Px;ovincial Reports this information is given \ in detail for each districts and certain inlportant towns. It is not necessarily true that the statistics of birthplaces indicate the extent of migratidn but in a general sense they can be taken as giving an indication} of its trends and extent. Statement 2.N summarizes the Birthplace statisti~
45
Statement2-N
( Reference paragraph 2.18 )
Pakistanis bom outside province of enumeration. Thousands.
I Enumerated in:-Places in' which bom outside Province of East N.W.F.P. Punjab & Sind & Ba1·"'"1 enumeration Pakistan & Stales Bengal Karachi & Frontier Bhawalpur Khairpur
Vnion', Region State States
- I 78.3 Total for all places 80,71.0 8~66.5 8,15.6 1,40.3 54,89.3 6,80.4 outside Province of enumeration.
Total for all parts of 4,65.1 38.1 9.3 1,53.4 71.9 86.2 1,05.6 Pakistan outside pro-'vince of enumeration.
Baluchistan & States 81.9 - 0.07 33.7 2.2 4.6 41.2 Union
Sind & Khairpur State 25.2 2.3 0.2 14.6 1.0 7.3 -Other parts of Pak/ 75,55.2 28.8 8,48.5 6,55.8 57.6 53,93.3 5,71.1 Indo Sub-continent
r
~where 50.7 11.4 8.6 6.4 10.9 9.8 3.8
Baluchistan & States Union N.W.F.P. Frontier Regions Punjab & Bahawalpur State Sin~ & Khairpur State
given in Census Table No. 5 by picking out the persons who are reported as having been born outside the grovince in which they were enumerated. It is natural in the circumstances obtaining in Pakistan at the Census time that the largest figures in the state~ent relate to the persons who reported themselves to have been born in India and other parts of the Indo-Pakistan sub-continent. The figures for this category exceed the number of persons (shown in Statement 2.E) was claimed to be Muhajirs-another indication that Birthplace and Migration statistics are not necessarily the
same. As regards the persons who have been enumerated in one province of Pakistan but were reported as born in another, a figure which may perhaps indicate the extent of internal migration within what is now Pakistan, it will be seen that the largest elements are an inter-change of nearly 70 thousand persons in both direction between North-West Frontier and the Punjab. The figures for persons born in the Punjab and enumerated in other provinces are generally the highest in the statement, which would seem to indicate a tendency for the Punjabi to emigrate. A good
46
deal of this may possibly be connected with their service in the Armed Forces and other Government organizations. It must be remembered, however, that next to Bengal, the Punjab and Bahawalpur contain a much larger population than the other provinces and on a proportional basis these figures would not look so large. Next to NWFP the largest number of persons born in the Punjab and enumerated elsewhere are found in the province of Sind which has also received a substantial contigent from Baluchistan.
2.19. Non-Pakistanis.-The figures for Birthplace do not include persons who claimed a nationality other than Pakistani. In West Pakistan the largest proportion of these consists of Mghan Powindahs-seasonal nomads who
come across the border during the winter chiefly in search of fodder and remunerative labour. These are analyzed in Census table No. 10-A which gives an indication of the composition of these contingents and the occupations which they follow. The next largest number of nonPakistanis enumerated in the Census were the 1.26 lakhs of persons in East Bengal who claimed Indian Nationality. Table 10 gives an analysis of the foreigners enumerated in the Census other than Mghan Powindahs. Frankly, I am not satisfied that these figures are complete. They are probably fairly near the truth for persons of Asiatic origin but I an inclined to think that many Europeans and Americans were missed out of enumeration altogether and the figures for them should not be regarded as having any reliability.
CHAPTER 3
AGE, SEX & MARITAL STATUS.
(See foot note).
"
JFERENCE TO STATISTICS
Table Age, Sex ~nd Marital Status showing broad age groups.
Table 4A-Orphans, showing Fatherless children by sex and religion.
Table 19A-Muhajirs, showing sex.
3.1 Collection of the data.-The data on Age, Sex and Marital Status was recorded on the enumeration slips from the responses given to Census questions Nos. 1 and 2. Question No. 1 asked the person's name, relationship to the head of household, and sex. The name and relationship were not required for tabulation but as a check and guarantee of good faith. The sex was recorded by placing a ring round one of the two symbols-M or F-printed in the corner of the slip.
Question 2 was in three parts; the first asked "Age in years?" The enumeration slip contained two spaces headed respectively "Years" and "Months". The enumerators instructional leaflet explained that the "Months" place was to be used for infants under one year, whose age was to be recorded in months. All older persons' ages were to be recorded in complete years at the last birthday. For respondents who did not know their ages in years, the enumerators were instructed to estimate it in single years upto 25 and to the nearest 5 years above that date. A list of well known local happenings was ordered to be agreed in discussion at the local enumerators'· classes and to be used in estimating the age of any person who might say that they did not know how
old they were. The second part of Question 2 applied only to children reported as under 12 years of age who were to be asked "Is Father living?". If the answer was "No", the enumerator was required to put a ring round the age figure; otherwise to place a tick-mark against it. The third part of Question 2 applied to all persons and asked whether they were "Married?, Single?, Widowed?, Divorced 7". Symbols were provided on the slip for these four classes and the enumerator was instructed that in every case one of these symbols must be ringed round. In the enumerators' leaflet it was explained that "Single" meant "a person who has never been married at aU". All other persons must either be "married (M) or the husband/wife must have died f.W'J, or else the marriage must have been legally dissolved (D)".
Only in an insignificant number of slips was any of the above information omitted. The question of Age, however, presented all the usual difficulties and is discussed separately. Marital status and sex were easily recorded and very few of the slips appeared to be defective in these respects. Whether all females were reported is also discussed in a subsequent paragraph.
Nete:-l. As was the case in Chapter 2, much of what I have written in Chapter 3 also reflects the influence of Mr. Doslas L Ralston's short period of research and advice, and his notes on the sex·ratios have been drawn upon extensively. But while gratefully acknowledging his guidance and help, I take the full responsibility for the data and explanations here presented.
B. H. Siado. 47
48
3.2 Classification:-The first step was a careful scrutiny of all slips in order to remedy any obvious mistakes or omissions. This was done before the slips were separated from the pads so that all the slips of a household were available for reference in the case of errors or contradictions. The scrutineers were ordered to be on their guard against any tendency to alter data merely because it looked improbable. From an examination of slips at various sorting centres a list of instructions was drawn up for the guidance of scrutineers.With regard to Questions 1 and 2, it was suggested that if sex or marital status were omitted it was to be supplied with reference to the name, relationship to the head of the household, and the answers given to the questions on occupation and fertility. If age was omitted a reasonable figure was to be inserted in the light of relstionship to the head of the household, marital status, education and duration of marriage. If the tick mark against children, indicating that the father was living was omitted, it was to be supplied unless the household did not contain a father and another child in the same household had been marked as an orphan. There were practically no cases where sex, age or marital status was omitted and very few cases where the information about orphans had to be supplied.
The slips then passed through the Hand Sortini Procedure. The first step was to separate the sexes. At an early stage the slips of all children under 12 were segregated. It had been agreed that these would all be treated as "Dependents" and the sorting procedure for them was simple and included all the few census characteristics applicable to children, thus eliminating these slips from all further work. I have wondered since whether the fact that a lot of time and trouble was saved by this procedure led to doubtful slips being wrongly placed in the "under 12" category. This might account for the very large numbers shown in the children's age groups by certain sorting centres.
The slips of persons aged 12 and over continued through the full sorting procedure and were classified for Age towards the end of the operation. Slips of persons in the Non-Agricultural Labour Force, however, were eliminated before the Age sort and passed to Machine Centres, the programme in which included sorting for Age and Marital Status. The data for the Age table therefore comes from three different parts of the
sorting procedure. First, there are the children, whose figures were obtained quickly. Then the rest of tha dependents and agricultural workers, whose figures were obtained at the conclusion of the Hand Sorting. Lastly, the figures for the Non-Agricultural workers come from the punched card machines. This procedure simplified the work of the sorters and cut down costs, but I would not recommend its repetition. It would have been better had we obtained the whole of the age data at a very early stage, when there would have been time to check and investigate anomalies.
In the Hand Sorting of the age data the slips were classed in the following groups:-
Children's slips Other slips
under 1 year 12- -14, 25-29, 45-49,
1-4 15- --16 30-34 50-54
5-9 17-19 35-39 55-59
10--11 20-24 40--44 60-69
70 and over.
The sorters' tickets give the figures for all the above classes but the sub-division of the 15-19 age-group into 15-16 and 17-19, which was originally intended for use in the educational tables, was dropped at the compilation stage on account of the obvious heaping of ages at 15 and 20. With this exception, the age tables were compiled from the sorters' tickets in the above groups, For those parts of the population for which Machine Sorting was used the sorters' tickets showed both the individual years of age and the above grouping (omitting the division of the 15-19 group). It is apparent from the records of the Machine sort by single years that even in Karachi,. where the standard of literacy is high and age reporting seems fairly reasonable, over half the slips showed an age figure ending in 5 or O.
3.3 Accuracy of the Age data:-The inaccuracy of the age returns has been discussed at length in many past Census reports of India. The basic difficulty is that most of the people have no clear ideas at all about their ages and enumerators are faced in nearly every case with the necessity of making a rough guess from the appearance of the
persons. It can be imagined how unreliable the information becomes when it is a matter, as it is regarding most women and many other members of a family, of making an estimate by cross-examining the head of the family without seeing the persons at all. A learned judge recounted to me in instance where an intelligent middle-aged man who was in his court as a witness gave his age as 8, and on being told "No, you must be older than that", he amended his guess to 10! This is perhaps a far-fetched case, true though it be, but it gives an indication of the difficulty of obtaining data which can be safely presented as statistics.
Dr. H.T. Sorley, I.C.S., who wrote the Provincial Census Report for the 1931 Census of the Bombay Presidency says "the crude inaccuracy of the age figures was very clearly brought out by Mr. Jacob in Delhi Census Reports for 1921 .. the figures for the Bombay Presidency in the present Census show the same absurdity." He stated that "10-year age groups might be considered fairly reliable, except at the beginning and end of the scale; that is to say the number of childern below 10 is probably far from the truth, and the number of persons over 60 is probably very inaccurate(1)". The most reliable grouping in his opinion would have been in three groups 0-20, 20-50 and 50 and over. Sir Ambrose Dundas, I.C.S., who wrote the 1931 Provincial Report for the North-West Frontier Province, states "in practice the ignorance of the mass of the population of anything approaching .... their correct age is so complete that the instructions given can make little difference .... In addition to deliberate mis-statements, misstatement from ignorance is almost universal. ... Figures for certain broader groupings such as under 15, under 10, over 53, between 14 and 43, which referred to periods of life not too difficult to estimate may be taken as sufficiently accurate to warrant the drawing of conclusions(2)."
In 1931 the system of sorting was arranged in such a way as to facilitate a method of arithmetical smoothing which was applied to the published data. On this occasion, since the enumerators had already been instructed to estimate the age to the nearest 5 years, such artificial adjustment was considered inadvisable, particularly as it was intended to cross-tabulate a certain amount of other data by age, for which work arithmetical adjustment is impossible.
(1) Census of India 1931, Vol. VIII. Page 81
49
It was also hoped th at, with the increase in literac} and the replacement of public apathy by a spirit of national enthusiasm, the record might probably be found to have been improved. In fact to some small extent such hopes were proved not to be entirely baseless as is evident from the somewl;)at better figures obtained in Baluchistan and Sind, and in the Federal Capital Area.
The 1951 data on age was thoroughly examined after tabulation and it became obvious that the 5-year grouping was in some places, particularly in East Bengal, Punjab and "!\I-W.F.P., completely unrealistic. It was felt that if the data was published in this form, the hurried use of the published figures for administrative purposes might lead to dangerous mistake and the drawing of erroneous conclusions. It was therefore decided that in the main volumes of the Census reports the age tables would show only such groupings as would be considered to be fairly reliable. In the three provinces mentioned above, the only groupings which appeared to be reasonably consistent were the four broad classes 0-9, 10-39, 40-59 and 60 and over. These age groups appear in the Provincial Reports of East Bengal, Punjab and N-W.F.P. and the tables in this Pakistan Volume therefore are prepared on that basis. In Baluchistan the data looks sufficiently consistent to be published in 10-year age-groupsupto age 60, and the same is true of Sind except that 10-19 and 20-29 age groups have had to be amalgamated owing to "heaping" in the former group. In the Karachi Federal Area only it has been found possible to give figures in 5 year age-grouping. The tables in the Provincial volumes are therefore on these differing basis.
The original compilation in smaller age groups has, however, been preserved for the use of students and statisticians, and copies can be had by experts on application to the Government of Pakistan but the data in them must be treated with great caution.
3.4 Population in broad age-groups: -The Census table No. 4 shows the population of Provinces in each of the four broad age-groups and analyses them by sex and by marital status. In the Provincial reports this table gives the same information in respect of smaller geographical areas and in some provinces it has been possible to present the information in smaller age groups.
(2) Census of India 1931, Vol. XV. Page 64
so
A summary of the age struct1,lfe is given in Statement 3-A which shows the percentage of each sex, falling in each of the age groups. The statcmont has been arranged in order to facilitate comparison of the Muslim figures for each Province and also with those for the other communities, as well as with similar percentages from the 1931 Census. Comparative information is provided in this statement for the Caste Hindu and Scheduled Castes communities in Bengal and Sind. In other Provinces these communities are small. For comparison with the Muslim figures for the Federal Capital, however, the statement shows the classification which was
sorted as "Other Religions" in Karachi and which represents 20,400 Christians, 5,000 Parsees and 1,200 persons of unclassified religions.
Statement 3-A contains much information of general interest and a study of the figures discloses many interesting points. On the whole possibly the chief general feature is the larger proportion of persons over 60 years of age compared with the same group in 1931. In every province and in every community this tendency is apparent and would seem to indicate an improvement in health and longevity.
STATEMENT 3-A
PERCENTAGE AGE STRUCTURES
Total all Males, or all Femalcs= 100
1951 1931
Population Sex 0-9 I 10-39 I 40-59 I 60 &. 0-9/ 10-39 )
40-59
I 60&.
Over Over
Pakistan .. M 27.30 52.35 15.24 5.11 29.50 52.58 14.08 3.83 F 29.53 52.11 13.50 4.80 30.95 53.41 12.23 3.42
East Bengal-Muslims .. M 29.0 51.24 15.36 4.4 31.4 52.4 13.0 3.1 F 31.47 51.78 12.93 3.82 32.0 54.7 10.7 2.6
East Bengal Caste Hindus M 25.62 51.49 17.02 5.87 27.32 52.92 15.72 4.04 F 27.73 51.33 15.43 5.50 27.9 54.2 13.9 4.0
East Bengal Sch. Castcs M 26.47 51.50 16.58 5.45 F 28.35 51.32 14.93 5.41 (d)
Punjab(a)-Muslims .. M 25.08 54.48 14.5'>' 5.85 29.27 51.29 14.35 S.09 F 26.45 53.93 13.66 5.95 31.61 50.50 13.37 4.51
(a) Including Punjab-Bahawalpur State, Baluchistan-statcs Union, S~-Khairpur State
(b) Federal Capital Area "
(e) The 1931 percentages for East B~at and Punjab are for those districts 01; the un-divided provinces of Bengd and Punjab which are now entirely or nialnly in PakiStan. ,
d) Data not available.
20
.... G. I.!
AGE & SEX PYRAMIDS r ' HORILONTAL SCALE REPRESENT PERCENTAGE OF TOTAL POPULATION
E"~T f>EN6Al PIJN)A& £: ~'WA1 PUR Sl41 f.
60 fI OVER
MALE: 5Z·3
F(MALE MALE ~
20
-;;:;::T '\ 40 - 59
10 0 10 PERCENT
~:W .r.p. (DISTRICTS)
10 0 10 PERc;EKT
KA.RACIU
10 0 '0 ,PERCENT
10 - '9
0-9
zo 20 10 0' 10 20 PERCENT
SIMDffkHAIRP\JR STAn
6,0 U?VER 606'OVE.lt
20
50· 59 ~ FEMALE
40-'59' '5-0 +S·o
40-49
30-39
10-39 10 -29
0-9 0-9
zo 10 0 10 20 PlRCE,.T
&.\lUCHISTAM eSTATES UNIO"
60 ff d"tR
40 - 49
50 - ~9
20 - 29
10 - 19
0-9
20
MALE. ~
20 '10 0 10 PERCENT
20
51
Thr ougbout, slightly more than half' the pOpula· tion is represented by the age-group 10-39, but it is noticeable tliat ui East Bengal this percentage bas dropped significantly since 1931 and it is the prop ortion of the older groups that has risen in consequence. In Sind the same change is apparent,;but in the Punjab, and to a lesser extent in N-W.F.P., the 10-39 group has increased its proportion and it is, the childfen's group which has dropped. In Karachi the 10-39 group is very large 01\ tjle male side, a' feature 'which is common in most cities and is no doubt the effect of the inwat migration Of men, o! ,workin& age.
A comparison of t!Jb figure~ for tbe two :Sexes shows a general tendency for 'the older age-groups tq contain a noticeably smaller proportion of the total population of females than they do ~f the Ojales. This seems'f(:{~dicate a higJreI; mortality among women of child-bearing ages, and lias its bearing on the excess of males in the total population. A corollary of this is the larger proportiop generally shown for girls than for boys in the Children's age-group. Cbarts in Figures 3-1 and 3-2 iIlustra,te the Age Structure in 1951.
FI1:;;: 3.2
!>ERCENTAGE DISTRIr!UTION IN GROUP~. 1951,
eA$T 8ENGAL
.u.ilACHI
j
No Vi ~ ~.
PU"2AB
a.l.HAWAlPUR
SIND &
KHAlRPUIl
?ERCEN.T i OF TOThL POPULATION
o
I
mWj@'D co -., 10 -$' 4"" <r, GO ltovl,
3.5 Age distribution in reHgfous grollps:-The non-M1,1S1im communities are of relatively small
size except in East Bengal and Sind and Statement 3-A therefore shows figures for Caste Hindus and Scheduled Castes for those Provinces only.
In East Bengal larger proportions of both men and women are found ill age-groups over 40 among the Caste Hindus than among the Muslims Figures for persons in the iO-39 group are IlO~ seriously different for the two communities and'it is the Children'S proportion which is less in the case ot' Hindus. The Provincial Superintendent 0;'" CepSU& feels that this is partly due to the departure of H~du families, but that it is also partly connected With the better financial position of many Caste Hindus which leads to improve medical attention and therefore longer life. The figures for the Scheduled Castes follow the same tendency to sqzhe extent; their pattern lies between that of the Caste Hindus and Musli,ms.
Separate figures [Of <?aste Hindus and Schedul. ed Castes are not easily calculable from the 1931 Census and the E~t Bengal figures shown' in Statement 3-A are for these two communities combined. It will be noticed that these combined figures co~pared :with the Musliln figures for the same Census show somewhat larger prbportions in tl)e :1-0-59 age-groups in the same way as in 19~1 and ,there is the same tendency foy the Children's age-group to be smaller.
. \ Th~ age structure in Karachi for Christians ~d
Parsees. incluges considerably more persons oyer 4Q than ampng the Muslims. They f represents 22.6 per cent of thy males among the Christians and Parsecs and dnly 17.7 per cent oC the males \among the Muslims. Similar figUres for females ~re 20 per cent for the Cnristians and Parsecs. and ,6.7 per cent fot the Muslims.
3.Ci Age structure in Towns.""':" The age data 1taving been sorted for each District as a whole, the Census tables do not show separately the age structure of the urban population. In the sorting procedure, however, four to'Yns of Bast Bengal-Dacca, Narayanganj, Chittagong and Barisal-were sorted for age on the punched card m~c~es, a~d ,so, we~e Hyde~~bad' «ity ,and Karachi ill West Pakistan. From 1the machine reco~ds bT tnese places it has th'i/refore 'beCn posSIble to extract the data given in Statement 3-B and thus obtain ah idea of the
r
dilreren& between the age structure of these urban areas
'Snd tHe ovef-iur pattern of the general popula-I ton, at shown in the right hand column of the Statement.
The female side of the population in these towns does not seem to differ very greatly from the general female pattern, but the male side shaWl very'large proportions. in the age group 10-39. This' is no doubt a result of the gravitation of working men to the towns, leaving their families in their villageS, which has already been noticed in the case of Karachi. '
3.7 Orphans:-A spocia1 request was made. in the planning stage of the Census that data should be collected regarding the number of fathel:lesl children. It was decided to include in this group all children reported as "Under 12 years" of age whose fathers were not living at the time of· the Census. The results are shown in Census table No. 4-A and are summarized in the form 'of percentages in Statement 3-C. It transpired in
STATEMENT 3-C FATHERLESS CHILDREN
Total children reported as under 12 years = 100
East Bengal Per cent 9.18
Punjab and Bahawalpur .. 2.69
Sind and Kbairpur .. 6.21
N.W.F.P. (Districts) .. 5.97
Baluchistan and States Union 7.69
Karachi .. 3.06
STATEMENT 3-8
Age Groups
,- -. ,.
A1l Ages
, ,0-9
1<>--;39
40-59
60 & Over
AGE STRUCTURE IN TOWN8-1951.
URBAN I &.,"-' (.)~ Hyderabad (b) \ Karachi (C)
Towns City
---I F I-Y° I F. , : M. M. M.
~'-:---
100 100 100 100
16.6 30.3 25.3 27.6 23.9 30.6
6,5.7 53.7 54.8 54.8 58.5 52.7
14.3 11.6 14.8 12.9 13.8 12.1
3.4 4.4 5 4.7 3.9 4.6
(a) Combined figures of Dacca, Narayanganj, Chittagong and Barisa!. (b) Excluding Military Cantonment. (c) Federal Capital Area. (d) Whole of Pakistan includins Rural and Urban Areas,
All Pakistan (d) Average
M. J F,
100 100
27.3 29.5 I
52.4 52.2
15.2 13.5
5.11 . 4.8
54
the tabulating Stage that the Age group "Under 12" tended to show inflated figures particularly for the sub-group 10-11 and possibly the figures for fatherless children of these ages may also suffer from the same defect. It is, however, more probable that the children marked as "Orphans" were fairly accurately reported as regards Age. While their percentages, therefore, may perhaps be rather on the low side due to any over-statement there may be in the age-group as a whole, the difference is not likely to be large.
Fatherless children are reported in higher proportions from East Bengal than from any other Province. The low proportion shown for \ the Punjab in Statement 3-C may be due to some extent to the suspected over-statement of the size of the total 0-11 age-group in that Province, but also it may be supposed that where there is a large immigrant element in the population, that element is unlikely to contain the usual proportions of orphans, since generally it is the father who brings the immigrant family. Such an assumption would also explain the low proportion of orphans shown in Karachi.
3.8 Centenarians:- -People who reported their age as being 100 years or over are included in the Age tables as part of the oldest age-group but as a matter of interest they were separately sorted in some Provinces and Statement 3-D shows the results. There is the usual tendency, however,
for these old people to exaggerate their age, which in most cases they do not actually know, and the figures cannot be treated as having much reliability. They may, however, be useful as an indictltion of the approximate upper limits of the oldest age-group.
3.9 Enumeration of fe.maIes :~An excess of ~ales over fetnales has been a featux:e of all the Censuses of the Indian sub-continent. The results of the 1951 Census of Pakistan are no exception to this and 113 males have been reported for every 100 females. This disparity between the se"tes !las given, rise to much ,speculation and enquiry in the past and has undoubtedly many causes.
The main quest,ion has always been the doubt as to whether females have been fully enumerated. All the Provincial Superintendents of the 1951 Census have considered this point and there is a general concensus of opinion that, while underenumeration of females is undoubtedly a danger which has not been entirely overcome, it cannot have taken place on such a scale as to account for the whole difference between the sexes.
The Provincial Superintendent of Baluchistan feels that he cannot dismiss the possibility of failures to report young and marriageable girls and women in the early ages of married life in view of the bridal customs which he mentions and
STATEMENT 3-D
-
CENTENATJANS (a)
Persons reported as aged 100 years or more
. I
Percent of
I population
Number aged 60 years & Province and State
I over (b)
I Males Females Males I Females , --- -- - --
East Bengal .. .. .. ., '8249 6086 0.81 0.73
Sind & Khairpur .. .. . . .' '662 514 0.41 0.42
Baluchistan & States Union .. .. ., 275 174 0.88 0.82
(a) Figures for Punjab and N.W.F.P. Provinces and for Federal Capital Area Karachi are not available
(b) Total Males and total Females in age group 60 and over-l 00 % respectively.
which include the payment of a substantial "bride-price" as part of the marriage contract. It is natural that where this is the custom there would be a desire to avoid pUblicity during financial negotiations between families.(l)
But such considerations are not widespread. The protective tradition which results in the "Purdah" system of keeping all females from infancy to old age concealed from male persons outside the prohibited degree of consanguinity, is more general and naturally results in an attitude of secrecy regarding them. However, this practice is confined to certain grades of society and localities and the number of females who observe strict Purdah is in fact quite limited. (2) The Provincial Census Seperintendent for East Bengal also mentions the difficulty of full enumeration of women and girls in view of the Purdah system, but he feels that the heads of families should have had no real motive for omitting to report females. Special enquiries were made on this point by the Provincial and District census stat! during the enumeration itself and no definite case of under- enumeration of females was brought to light_(3)
However, this tendency on the part of Muslims to be reticent regarding their women folk and therefore to omit to report them to the enumerator, cannot be left out of account. It is noticeable that there is excess of males in other Muslim countries, notably in Jordan with 1154 per thousand females, Algeria with 1018, Turkey with 1011. An interesting comparison in this r,egard is the proportion of Muslims in East Bengal at each Census since 1901 shown in Statement 3-4 of East Bengal Census Report Page 33, and the ratio of the sexes for the same years in Statement 3-E. These figures are shown in graphical form on the Chart in Fig. 3.3, where parallel riSing trends in the proportion of Muslim to the total population and in the excess of males over females can be noted. It is noteworthy that the increase in the sex ratio during the 1941-51 period was accentuated, but did not rise as sharply as the Muslim proportion of the total population.
A significant reversal of this parallel rise noted for East Bengal is the fact that while sex ratios also advanced with increasing proportions of Muslims in West Pakistan from 1901 until 1931, since then the sex ratio has dropped at both censuses, even though Muslims continued to increase relatively to the total population. Particularly was this so in the 1941-51 period, when the proportion of Muslims rose from 70
(1) See Provincial Census Report for Baluchiston 1951, Vol. 2, Paras. 5.41 and 6.2. (2) See Provinciol Census Report for Sind 1951, Vol. 6 Para. 8.2. (3) See Provincial Census Roport for East Bengal 1951, Vol, 3. Para. 6.9.
I
56
per cent of West Pakistan's population in 1941 to 97 per cent in 1951, through the exchange of refugees. Yet in this latter decade the sex ratio declined from 119 to 116. A part of this drop in the sex ratio can no doubt be attributed to smaller troop concentrations in West Paklstan in 1951 than during the war period. Lacking any evidence to the contrary, however, it seems reasonable to assume that females in West Pakistan have been more fully reported in the last two censuses, and that the tendency toward non-reporting of women in West Pakistan may be diminishing. It is notable that there is now less disparity between the lower sex ratio for East Bengal and the higher one for West Pakistan that any previous decade.
The persistence of this disproportion in all censuses and in all localities suggests that the excess is indeed a reality. On the whole it would appear therefore that there is a tendency to underenumerate females, but it does not account for the whole disparity and is probably less in this 1951 Census than it has been before. One may use the sex ratio figures as a safe basis for the comparison with the past, when the same tendencies were undoubtedly present and perhaps on a higher scale, and one must look to other reasons for the main cause of the disparity.
3.10 Excess of Males:-As pointed out above the excess of males over females is characteristic. Apart from the question of under-enumeration of women which has been discussed in the previous paragraph, a number of factors probably contribute to the disparity. Immigration on a scale which has produced a similar excess of males in some other countries during the earlystages of their development cannot be the underlying factor, although it undoubtedly contributes to regional variations. One cause of the lack of balance between the sexes might be that more male births than female are occurring over the years. This is difficult to confirm in the absence of complete and reltable information on births classified as to sex. Although birth registration figures of the sub-continent in past years have generally shown an excess of male births, it is believed that the proportion of female births which were not registered may have been somewhat higher than for male births, the births of daughters being more likely to be ignored in this respect. It is of interest that in the 1951 Census of Pakistan
(I) Census of India, 1931, Vol. XVII, Page 16.
male infants reported under one year of age numbered 104 for every 100 females of the same age.
The marital status statistics of this Census show that, as in the past, men tend to marry at a much later age in life than females. While part of this may be due to the marriage customs of the country, it may also be caused in part by a shortage of single females of marriageable ages. Mortality of females during the child-bearing ages of life contribute to this shortage through the remarriage of widowers. Whether the custom of Purdah has any harmful effect on the mortality rates of women can only be suspected. Also, as noted later, the sex ratio seems to rise in periods of epidemic and famine, which would indicate that females are harder hit by such adversities.
The sex ratio has shown a steady increse in the excess of males at every Census since 1901. Statement 3-E indicates that it is the figures for East Bengal which produced the rise in the overall average. In West Pakistan, with minor variations, there was a rising trend until 1931 but since then the excess of males has grown less. One fact which stands out in the ratios for several of the Provinces is that during decades of epidemics or famine the proportion of males to females at the next Census has shown a decided increase.
The first instance of this may be cited in 1901-11 period, in which the sharpest rise for West Pakistan of any decade was due principally to an increase in the proportion of males to females in the Punjab Province from 116 to 122. The Census Seperintendent of undivided Punjab at the 1931 Census reported that "An epidemic of plague of great virulence coupled with fever of a specially fatal type contributed to the death rate .• The loss of female lives was appalling and the female population for the Province was considerably in defect at the Census of 1911(1)." In the 1911-21 period, marked by the influenza empidemic of 1918, the two Provinces of Pakistan with the lowest growth rate of the decade, (Baluchistan and Sind), both of which suffered heavy losses in the epidemic, had the highest increases in sex ratios for the lO-year period. Since these are small provinces, they did not cause a substantial rise in the ratios for West Pakistan in 1921. A notable exception to the increases in the sex ratios for all Provinces in this decade was the
Punjab. Although the increase in population of the Punjab was the highest of any Province by almost 8 per cent between 1911 and 1921. it also suffered from the epidemic, though it would seem to a lesser relative extent, and the sex ratio declined slightly from 122 to 120. Further evidence. however, of the possibility that such catastrophes may have a more marked effect on th~ female population is provided by the East '~engal ratios for 1941-51. In this period. marked by the widespread Bengal famine of 1943-44, the sex ratio advanced from 107 to 110, the largest rise in the 50-year period for the Province.
At this point it is speculation. of course, to say that if these correlations to exist, what is true of severe setbacks may apply in lesser degree to adverse economic conditions generally, and that possibly East Bengal's gradual but continuous rise in the excess of males over females reflects to some extent the ever-increaseasing pressure on its land resources and the accompanying decline in living standards.
Whatever the influence of the foregoing as a contributing factor to the excess of males, the main cause of the variations in the sex ratios between East and West Pakistan seems to lie in a
57
different direction. The f'lct that the Provinces of West Pakistan have sh)wn greater excc~ses of males over fem.iles lhan East Bengal can probably be attributed in part to larger migrations of males from other parts of India to new lands opened up to agriculture. It is doubtful, however, if differences in the excess of males arising from such movements could have accounted for more than a small part of the variations in the sex ratios between the two regions. By far the most influential cause might well have been the greater tendencies of the more predominately Muslim population of West Pakistan to fail to report their womenfold (see the previous paragraph).
It has been mentioned in the previous paragraph that there is now less difference between rates for East Bengal and West Pakistan. It may be reasonable to expect a gradualleveUing in the sex ratios of East Bengal and a further decline in the Western Provinces. The ratios in the future may be even more closely corresponding than at present.
3.11 Sex Ratios in town and country:-Rural and urban differentials in the sex ratio of Pakistan are extremely marked. As is shown in Statement 3-F the large rural population at the 1951 Census
STATEMENT 3-F
RURAL/URBAN SEX RATIOS FOR PROVINCES, 1941 AND 1951.
Males per 100 Females
1951 1941 Provinces ------ ---_- -- _- --- -- -
I I I Total Rural Urban Total Rural Urban I ,
- ----I
I Pakistan .. .. .. 112.8 110.7 133.4 112.0 I 109.7 I 143.8
Baluchistan & States Union .. 121.3 116.3 i 168.5 113.0 I 119.5 256.3 ,
1 Sind & Khairpur .. 122.1 121.8 123.7 121.0 121.1 I 120.5 .. ,
58
consisted of 111 males for every 100 females, as compared with 133 in the case of the much smaller urban segment, which as noted earlier, represented only one-tenth of Pakistan's population. The reasons for this difference arc not hard to find. The migration of men from the rural areas in search of employment, particularly to the most populous cities, which often necessitated leaving their families in the villages from which they had come, is a well-known feature of Pakistan's economic life.
The differences in the rural-urban sex ratios are especially large in the Provinces of East Bengal, Baluchistan and N-W.F.P. While the variation between the rural and urban ratio for East Bengal typifies what might almost be termed a forced movement of the male population toward the cities, the sex ratios of the small urban populations of Baluchistan and N-W.F.P. are influenced as well by the large male concentrations in the military cantonments at Quetta in Baluchistan, and at Peshawar, Abbottabad, Kohat and other areas in ;-..r-W.F.P. This same factor applies to the urban sex-ratio of the Punjab as evidenced by the high proportion of males for Rawalpindi, Lahore and Sialkot Cantonments, although their effect is not so great because of the larger urban populatiJn of this province. The pronounced drop in the urban sex ratios since 1941 in these provinces is probably due primarily to the reduced numbers of troops now stationed in these areas. Statement 3-G gives the Comparative figuers for the sex ratio in main cities of Pakistan.
Since the larger cities offer greater employment opportunities, a higher ratio of males to females would be expected in them as a result. The number of males per 100 females for the various urban size-groups as shown in Statemet 3-H indicates that this is true, except, strangely enough, in the case of the largest group of cities of 5,00,000 inhabitants and over, which comprises Karachi and Lahore only, with sex ratios of 134.6 and 129 respectively. The answer to this apparent paradOXIcal situation is to be found in the groups of cities in the two next lower size-ranges-the classes of "1,00,000 and over" and "50,000 and over". Dacca and Chittagong are the only two cities of isolated East Bengal in the former range. Men from all over the heavily-populated rural areas of this Province come to these two cities in search of employment and their ratios of 165 and 182 males per 100 females, respectively, bear testimony to
(b) Under 100,000 inhabitant, but classed as a "City" became it is the capital of the Province of Baluchistan.
this fact. The cities of Rawalpindi and Peshawar in West Pakistan are also in the 1,00,OO\) and over SIze range, but their high sex ratios of 155 and 145 are caused more by the military units stationed in their cantonments, than by over-crowded rural conditions as in the case of East Bengal.
STATEMENT 3-H
SEX RATlO IN TOW.1llS, 1951.
Urban size groups
5,00,000 and over 1,00,000- 4,99,999
50,000- 99,999 25,000- 49,999 5,000- 24,999
Males per 100 females
132.5 143.7 143.3 13D.4 123.6
These four cities represent well over one-half of the population of the urban centres in this size group, and the factors causing their high sex ratios are sufficient to raise this group above the levels of Karachi and Lahore. It is of interest that the sex ratios of Rawalpindi and Peshawar excluding the cantonments, would be 133 and 126 respectively-lower than those of the two largest cities.
In the size range between 50,000 and 1,00,000 there is the important town of Barisal in East Bengal for which rice and jute from areas East of the Brahamputra River are transhipped to the ports. It is a fast-growing municipality, and results of male in-migration, similar to those in Dacca and Chittagong, would be largely responsible for its very high sex ratio of 237 males per
S9
100 females. In West Pakistan, the city of Quetta is the other urban centre which raises the 50,000-100,000 group to high sex-ratio levels. Here again the proportion of 91 males to 100 females is mainly due to the military personnel in the contonment. The exclusion of this cantonment lowers the sex-ratio of Quetta city to 144 males per 100 females. This is higher than some of the larger cities of West Pakistan, but is probably due to the fact that Quetta is more isolated from other large centres, and may therefore tend to attract migrants from a very wide area, while distance and poor communications discourage them from bringing their families.
3.12 Sex Ratios in Age-Groups:-The sex-ratios vary sharply between the four age groups. Statement 3-1 gives the figures for Muslims in
STATEMENT 3-1
SEX RATIOS BY AGE 1951
Males per 100 Females
Age Groups Province (inclnding states) and Religion
each Province and for the minor communities in East Bengal, Sind and Karachi. In all Provinces and all communities the excess of males is small among children, varying between 101 and 108 boys per 100 girls. From thence the general pattern is a sharp rise to age 59 and a reduction in the old people's group. The exceptions to this pattern are very high figures for the 60 and over group in Baluchistan and the relatively low one for the 40-59 group for Scheduled Castes in Sind. The obvious conclusion is that as age advances the women die off much earlier than the men, although, once past child-bearing they have better chances of survival. Thus the age analysis bears out the suggestions in paragraph 3.10 regarding the higher mortality of women.
In comparing the figures for the Provinces one finds that the disparity between the boys and girls in the 0-9 age-group is much smaller in East Bengal, for all communities, than in West Pakistan. It is the high figures for the 40-59 groups which bring the East Bengal average up to 110 males per 100 females. In West Pakistan, Baluchistan and Sind have very high figures of males excess in all age groups. Punjab and N-W.F.P. have a smaller excess in the 40-59
group than East Bengal. There would not appear to be quite the same heavy female mortality. It is in the "under 40's" that their higher excess of males is chiefly found.
A point to be borne in mind in considering the sex ratio figures for the Punjab is the fact that about 25 per cent of the population there were reported as Muhajirs, who have a slightly larger excess of males than the average for the Province, and also have a smaller proportion of childrenvide the statements Nos.6-A and 6-B. in Chapter6.
Statement 3-J shows the changes in the sexratio of Muslims shown in the last 3 Censuses. In East Bengal the disparity in the children has been growing less while all older age-groups show it increasing. In Punjab, which is taken as representing the Muslims of West Pakistan, the children have a constant excess of males, i.e., 109 per 100 females, but the disparity in the other age-groups is steadily reduCing.
Incidentally in calculating the figures for the Punjab for 1941 and 1931 it has been assumed that, as far as the Muslims are concerned, percentages of the population in that community in
STATEMENT 3--J
CHANGES IN SEX RATIO OF MUSLIMS BY AGE.
East Bengal Punjab (a)
Age Groups I --1- - - I _----1 __________ ---Ir--1-95-1-.;1 __ 1_94_1_I_l_93_1 __ r-_1_95_1_1-__ 1_94,_I __ !1931
I 109 I 107 115 I 117 I 119
I 104 104 109 II 109 II 109
107 j 104 116 117 121
I 128 124 \ 122 ' 128
123 114 160 136
109
All Ages 110
0--9 102
10--39
40--59 131
127 124 60 & Over
129
• Note (a) These figure do not include Bahawalpur State, and for 1941 and 1931 they are
however in the Muslim population of the un-divided Punjab province as it then existed.
undivided Punjab are fairly comparable with 1951 percentages for Muslims in the Punjab province.
3.13 Marital Status.--Census Table No. 4 shows the number of persons Married, Single (i.e., never married), Widowed, and Divorced in each of the four broad age groups. This information is condensed in the form of percentages for ease of comparison in Statement 3. K.l.
The higher age of marriage among men than among women is noticeable. In West Pakistan only 44 per cent of the men in the 10-39 age group are shown as having been married against 55 per cent at the women. In East Bengal the contrast is even more striking--47 per cent of the men and 74 per cent of the women aged 10-39 have been married.
The figures for Caste Hindus in East Bengal indicate a higher age of marriage than the Muslim community there. Among the Scheduled Caste communities the figures approach more nearly, although they are still less than, those of the Muslims. The figures for the Scheduled Caste community in Sind are much the same as those for them in East Bengal on the male side, but the women of this community marry later in Sind, which is surprising seeing that the shortage of women is more acute in Sind.
The statement also shows the pattern for the "other religions" group in the Punjab and in Karachi, in both of which this group is chiefly composed of Christians, but includes the Parsees to Karachi. In these communities the proportion of the 10-39 age group which has been married is distinctly lower, especially on the female side.
Throughout the whole statement the proportion of people aged 40 and over who have not been married is smaIl, although it is larger in West Pakistan than in East Bengal. The exception is the Christian and Parsee communities in Karachi, among whom bachelors are fairly frequent and spinsters not rare.
Comparing these figures with similar data from the 1941 Census shown in Statement 3-K.2 it will be seen that in every case the proportion of
persons in the 10-39 age-group who have married was then higher than it is in People of both sexes and communities marrying at older ages.
61
been 1951.
are
This is particularly true of child marriages. In East Bengal in 1931, nearly four per cent of the girls under 10 years old and one-and-a-half per cent of the boys had been married. In West Pakistan in 1931 the children under 10 who had been married amounted to about two in a thousand. In 1951 even this small amount of child marriage in West Pakistan has practically disappeared, while in East B:ngal it is now negligible and the highest proportion, which is found among is SCheduled Caste girls, is only one per cent of the 0-9 age group.
In East Bengal the number of married women exceed the number of married men. The Provincial Superintendent of Census points out that under Muslim law a man may have more than one wife and many in fact do. This is, however, by no means a widespread custom and he is inclined to think that the disparity is contributed to by widows in some cases reporting themselves as Married and by the non-enumeration of absentee husbands.
In West Pakistan, however, there are more married men than married women and this is true of every province. Polygamy in West Pakistan is therefore probably very rare, as has been pointed out by the Provincial Superintendents. They feel that the disparity between Married men and Married women in the provinces of West Pakistan may be connected with immigration, which view appears to be supported by the larger excess of males among the Muhajirs than among the population in general. The Provincial Superintendents also think that some widowed men may have classed themselves as Married. These opinions, however, do not seem to account for the whole amount of the difference and the real reasons for this disparity seem rather obscure. It may well be that it is associated with the under-enumeration of women that has always been suspected in the Censuses in these Provinces.
3.14 Widowed and Divorce:-As will be seen from Census table No.4, widowed persons are numerous in the older age-groups but divorced
'{\
S'tATE~'-3K-l
MARITAL STATUS-1951.
Total of each Age and Sex Group=lOO.
;: .. -
Males Females
"0 I "0 "0 '1:i
., "0 "0 I "0 • ·S Province Religion and Age "0 ., ·S ., "01 .... 1l .!l ~
persons are very few. All the Superintendents of Census explain that, despite the theoretical case of divorce under Shariat (Muslim Law), public opinion is very much against it in practice and to be divorced is often regarded as rather scandalous. Not only are there in fact very few divorced persons but also in a public census some of these few may not have reported themselves as such.
&3
In Statement 3-K the figures for Marital Status are presented in the form of percentages of each Age and Sex group and are rearranged to show the incidence of marriage. The percentages for persons widowed and divorced have been expressed in one figure but in view of the above remarks regarding the smallness of the divorced element, the percentage would be very little different if the divorces were excluded and it
STATEMENT 3-K. 2
MARITAL STATUS-1941.
Province Religion and Age
Total of each Age and Sex Group = 100.
Males
"0 •
'~ ] ~~CS I~ ~
-- -- - ------'----'-
West Pakistan Muslims
0-9 0.14 0.02 0.16 99.84 0.20
10-39 46.78 3.24 50.02 49.98 69.51
40-59 79.93 15.15 95.08 4.92 65.78
60 & Over .. 67.46 29.33 96.79 3,21 32.37
East Benga I Muslims
0-9 0.55 0.97 1.52 98.48 2.79
10-39 53.80 2.92 56.72 43.28 77.01
,40-59 92.54 6.73 99.28 0.72 44.58
60 & Over .. 82.15 17.07 99.22 0.78 13.01
East Bengal Caste Hindus
0-9 0.47 1.11 1.58 98.42 2.53
10-39 50.30 3.55 53.85 46.15 70.33
40-59 84.38 13.33 97.72 2.28 37.63
60 & Over .• 68.88 29.77 98.65 1.35 10.44
Females
0.01 0.21 99.79
3.90 73.41 26.58
32.83 98.61 1.39
66.18 98.55 1.45
1.08 3.87 96.13
7.83 84.84 15.16
54.77 99.35 0.65
85.99 99.01 0.99
1.21 3.74 96.26
14.12 84.45 15.55
61.46 99.09 0.91
88.91 99.36 0.64
can be treated as chiefly indicating the incidence of widow-hood.
The chief features of the figures in this column of Statement 3-K. 1 is the wide difference between the percentages of male and female widowed or divorced persons. This difference is found both in East and West Pakistan and among all communities, and is no doubt largely due to the fact that female widows do not usually re-marry. In fact among the Hindus their re-marriage is prohibited by their religion. The difference, however, is also partly due to the higher age of marriage among men which would, if other influence did not affect it, naturally lead to the earlier demise of husbands.
This difference between tho sexes is more marked in East Bengal than in West Pakistan. Taking the age group 60 and over as an example, and examining the Muslim figures, in West Pakistan nearly 32 per cent of the males in this age-group are widowed while in the females the percentage is about 46. In East Bengal, however, the comparable figures are 19 per cent for males and nearly 79 per cent for females, and the figures for Hindus and Scheduled Castes are of much the same order. It would appear that re-marriage may be more common in West Pakistan and the greater shortage of females there may have some bearing on this.
Comparable figures in the 1941 Census are shown in Statement 3-K.2 which indicates that the incidence of widow-hood among females was then greater, and particularly so in West Pakistan. The figures for male widow-hood, however, among Muslims both in East and West Pakistan are higher in 1951 Census than they were in 1941.
The reasons for these various differences and changes in the incidence of widow-hood are obscure and, together with the whole question of the age structure of the population, might well form a subject for research which would probably be best based not only upon the Census figures but on careful inter-censal field enquiries. The result of such a study might produce useful conclusions in welfare, sociological and medical fields.
3.15 Fertility:-Census Table No. 4 indicates that among Muslims in East Bengalthereareabout
115 Children under 10 years of age per 100 "ever married" women under 60 years of age. A similar figure for the Punjab is 132 and for Sind 123. These ratios appear to indicate a progressive population but the age groups are really too wide to justify any detailed conclusions on this subject. It is noticeable, however, that among Caste Hindus a similar ratio for East Bengal is 106 and in Sind 119 which would confirm the opinion expressed in previous Census reports that the Muslims in these areas are developing at a more rapid rate than the other communities.
3.16 Need for further research:-The data on Age and Sex are basic elements in the analysis of the human resources of the country and of estimates regarding the trend of development of the population. Based on this Census it was hoped that a certain amount of demographic research would have been possible and that this report would have included the first-fruits of such work. Mr. Douglas L. Ralston came to Pakistan with this end in view. He found that the difficulties regarding age gave little basis for serious research, and as he had most unfortunately to cut short his stay for reasons of health. he was unable to complete his investigations. It is to be hoped, however, that this will be a subject in which researches may be pursued during the period before the next Census.
In order to facilitate research work on this important subject I would make four recommendations: First, that as soon as possible there should be careful field enquiries, either on a scientific sampling basis or in carefnlly selected areas, into the actual age and sex distribution of the population with a view to providing better data at an early date. Until this is done there may be little scope for analytical demographic study. Secondly, it is urged that questions of age and sex should receive special attention in the next decennial census and particularly that preparatory q>ntrols should be operated' for the previous year in a properly selected series of sample localities, with a view to recording the births and deaths during that year and enquiring carefully into the ages of the members of each household. When the Census is taken, the respondents, in those areas at least, may then be able to give a properll considered, and if possible authenticated, reply to the age question. 'Thirdly, the suggestion is made, with a view to remedying the almost
universal ignorance regarding age, that the year of the HiJri in which they were born should be learnt by children as part of theirfirst early religious instructions in the home or mosque and be firmly implanted in each little one's mind. r suggest using th~ Hifrl year for Muslims because I feel that if this suggestion is to be given wide and practical effect, the information must be a step in Islamic instruction in which it would be a
natural link with the life of the Holy Prophet. Although the difference between the length of the Hijri year and the ofli:ial year might throw the ages out slightly there would be nothing approaching the choatic answers caused by the present ignorance. The fourth suggestion r have already mentioned, namely that the sorting of the ago data should be done early and checked before the sorting centres are closed.
CHAPTER-4.
LANGUAGE, LITERACY AND EDUCATION
Table 7- Mother Tongues: showing for each language and important dialect used in Pakistan, the number of persons who have spoken it from infancy.
Table 7-A Speech: showing the number of persons who commonly use each of the 9 main languages of Pakistan.
Table 8- Literacy: showing the numbers of persons who can, and who cannot, read.
Table 8-A Languages of Literacy: showing the number of persons who can read and write, and read only, each of the 9 main languages of Pakistan.
Table 9- Pupil and Students: showing the persons who were attending full-time education at the time of the Census.
Table 9-A Years of Education: showing the number of persons who have received or are receiving formal education and analysing them by length of time so spent.
Table 9-B Educational Levels: showing the mumber of persons who have attained certain definite standards of education.
Table 19·C Educational Levels of Muhajirs: showing the same information as in table 9-B but in respect of Muhajirs only.
4.1 Collection of the data:-The information recorded in the above tables was obtained in reply to Census questions as follows:-
Question 6. asked each respondent what was his Mother-tongue. Ten columns were provided on the Enumeration slip. Nine of them were headed with the 9 main languages of Pakistan, the tenth column was left blank so that the enumerator might write the name of any other language. He was required to place a tick-mark under the language claimed by the respondent as his Mother-tongue. Mother-tongue was defined as the language "spoken from the cradle" or chiefly used in the home.
Question 7. asked th~ r.!sp.mdent to state "Any other language you commonly speak?" Further spaces were provided under the sam::: 9 columns and the enum!rator placed ticks in one or more of them in accordance with the respondent's claims. It was explained in the Enumera-
66
tor's instructions that the respondent should not claim to speak languages in which he could not easily converse and if the enumerator could test him he should do so.
Question 8. asked "Can you read? Write? A further set of spaces was provide:! under the same language columns, and if the respondent replied "No" to the question a cross was put over aU of them, if the answere was "Yes", he was asked "In what Languages?" and the enumerator placed the letter "P" for reading or OIL" for writing each of the languages claimed. (These letters are the initials of the verbs "to read" and "to write" in all the vernacular languages). If a respondent claimed to read Arabic but only in the Holy Quran the letter "Q" was placed under that language. The enumerators' instructions stated that "ability to read means that the person could be able to read clear print while ability to write means that he could write a simple letter" Persons claiming to read the language in which the enumerator's leatlet was priJ.ted were to b~ asked to read some simple part of it.
Qaesti()n to-A. asked "Are you regularly attending school or college?". A symbol was provided to be rinzed round if the answer was "Yes". The enum.::rators' instructions stated that a perSJn was to be recorded as regularly attending school or college regardless of any temp::>rary break such as illlless or holidays.
Question 10-B. asked "For how many years have you attended school or college?". A space was provided he.lded with the words "Years" and the enJmerators were required to write the number. The enJmcrators' instructions stated that this question applied to those persons who had left school or college as well as to those still attending. T.'le figure was to be the nearest whole number of years; as a result persons who had attended school for less than six months were marked "0" and are not included in these statistics.
Question 10-C. asked "How for your education has progressed 7". Five symbols were provided on the enumerators' slip meaning respectIveJy cJmpleted primary school-passed middle school examinationpassed matriculation (Entrance) examinationobtained University Degree-obtained Higher (Post Graduate) Degree. The enumerator was required to place a ring round the highest of these levels reported by the respondent. The instructions explained the exact meaning of the various standards as follows: "Completed primary school" meant that the persons had reached the top primary standard; "passed Middle School Examination" included Middle English and Middle Varnacular school, Junior Madrassah,
\ etc; "Matriculation" meant the last High School or Madrassah examination prior to joining college or university. "Umversity Degree" meant the first Degree, such as B.A., B. Sc., M.B.B.S, awarded by a recognized university (The Intermediate examination was not to be counted as a Degree); "Higher (post Graduate) Degree" meant M.A., M.Sc, M.D., etc.
Questions were raised in the instructional classes for Enumerators as to what action to be taken in respect of persons who claimed to hold diplomas in oriental classics and languages such as Maulvi Fazil, Munshi Fazil and Adib Fazil. An eleventhhour attempt was made to show such qualifications separately, but in the short time left for enumeration it was found impossible to circulate the necessary instructions efficiently and as a result
67
the persons reporting these diplomas have been included in whichever of the categories printed on the slip was appropriate.
4.2 Abstraction:-In the scrutiny stage it was found that the enumerators had very little difficulty with these questions. The system of language columns and tick-marks and the scheme of symbols apparently with success. The Procedure code gave guidance for remedying such defects as were discovered. Where the Mother tongue was omitted, the slip was to be given the -arne marking as the other slips of the household, or failing that the common Mother-tongue of the district. If the Mother-tongue was also claimed as th~ additional language spoken, the latter tickmark was to be deleted.
Sorting for Mother-tongues was done as the part of the first phase of the Hand sorting operation, and included all the tongues written in the last column of the 3lip without any attempt to confine the analysis to the 9 main languages, A "Miscellaneous" category was allowed but it was to contain only languages not indigenous or in common use in the Indo-Pakistan sub-continent; even these were to be counted separately if the sorting process disclosed the existence in a district of a significant number of people claiming an unusual Mother-tongue. Sorting for languages spoken in addition to the Mother-tongue was done for each language separately but was confined to the nine languages printed on the slip, plus Gujrati in the Federal Capital Area.
The languages read and written were sorted in a similar manner, separating for each language the slips which were marked with a "P" from those marked "L". The persons who could read the Holy Quran were sorted as part of the classification of Arabic. It is suggested that in future this sort should be proceded by a special one to determine the number of persons who can read and write, those who can read but not write, those who can only read the Holy Quran. This was not done on the present occasion as it would have taken a lot of time and it was expected that the figures for "read only" and "read the Holy Quran only" would be very small. However, in some places they turn out to be quite significant And it is a pity that they were not specially sorted.
The sort for "educational levels" was also a part of the Hand sorting operation and was quite
68
simple. The system of precoding by placing rings round symbols worked very well. The sort for persons now at school' and 'time spent at school' was done in phase 4 after the first part of the age sort. It was therefore done by Hand for majority of the population but as part of the Machine sort for the Non-Agricultural Labour Force and for certain cities.
4.3 Mother-tongues.-One of the great problems of Pakistan is that there is no one language which can be said to b~ common to the whole population and no fewer than 32 distinct languages (or groups of languages) are reported in Census Table No.7 as Mother-tongues of citizens of Pakistan. In addition there are many dialects which are often not capable of being understood by persons who speak the main language to which the dialect belongs.
However, many of the languages and dialects are spoken by relatively small numbers of persons. 95 per cent of the inhabitants of Pakistan have claimed one or other of the following 5 chief languages as their Mother-tongue, namely Bengali, Punjabi, Pushtu, Sindhi and Urdu. 98 percent of the inhabitants of East Bengal have Bengali as their Mother-tongue and they represent 55 percent of the total population of Pakistan. Punjabi is the Mother-tongue of 28 percent of the total inhabitants of Pakistan, Sindhi 5.3 per cent, Pushtu 6/j and Urdu 3.3 percent. Outside Bengal persons who claim Bengali as their Mother-tongue are extremely few but the other four languages are found to a greater or less extent as Mother-tongues in all the provinces of Western Pakistan.
The mother-tongues of the other 5 percent of the population are often of importance within their province. For instance, Baluchi is the mother-tongue of 34 percent of the people of Baluchistan, and is spoken there by more persons than speak any other language. It is also widely spoken in Sind. Gujrati is the mother-tongue of 11 percent of the inhabitants of Karachi. Khowar and Kohistani are the mother-tongues of substantial minorities in the Malakand Agency of the North-West Frontier Regions. Assam-Burman tongues are found in the Chittagong Hill Tracts. Sylhet and Mymensingh Districts of East Bengal and Santhali and Khasi in the Dinajpur, Rajshahi and Rangpur Districts of the same province. Considerable numbers of people in the Tharparkar
District of Sind reported their mother-tongues as Gujrati or as the Marwari dialect of Ra;asthani. The distribution of these minor but extremely interesting languages is discussed in the reports of the Provincial Superintendents of Census to which the reader is referred for further details including the district-wise analysis of the localities in which the various tongues were reported.
Census Table No. 7 shows the numbers of persons claiming as their Mother-tongue each of the languages of Pakistan. For purpose of tabulation. the various languages have been classified in a simple list. For the convenience of students. and for comparison with past statistics. the list is arranged in sections which correspond roughly with the philological divisions of Sir George Grierson's "Linguistic Survey of India", but in Census Table No. 7 the divisions are arranged in alphabetical order and the same principle is applied in listing branches and languages.
The table therefore shows the languages in the following manner:
(a) Austric (Pro-Dravidian) Languages.-Of these the only tongues occurring in Pakistan are Santhali and Khasi spoken in the hills bordering on the north of East Bengal.
(b) The Dravidian Family of Languages.containing Brahui (spoken in parts of Baluchistan) certain tribal tongues of East Bengal, and the languages of Southern India.
(c) The Indo-European family of Languages.(Aryan sub-family).
(i) The Dardic Branch.-of languages spoken in Kashmir and the north of West Pakistan.
(ii) European Branch.-of which the only language of importance occuring in Pakistan is English.
(iii) The Indo-Aryan Branch.-Divided into the inner sub-branch which includes Urdu (Hindustani). Punjabi and Rajasthani; and the outer sub-branch, the north-west
part of which contains Sindhi; the southern part contains Marathi and the eastern part contains Bengali, Assamese and Oriya.
(iv) The Iranian Branch.-which includes Persian, Baluchi and Pushtu.
(d) Central Asian tongues.-The tongues of a few communities on the extreme northern borders.
(e) The Tibeto-Chinese families of Languages.Tongues of the Assam-Burman branch of which occur in the eastern portions of East Bengal.
(f) Other Languages.-unclassified.
All these philological groups contain in fact many more languages than are shown in Census table No.7 which is confined to those claimed on a significant scale as Mother-tongues by citizens in Pakistan. The title-sheet of Census Table gives a list of the actual tongues and dialects reported on the Enumeration slips showing which of them have been included under each main heading in the table. Where these dialects have been considered of sufficient importance by the Provincial Superintendent of Census they have been counted separately and the figures are given in footnotes to the table.
In subsequent paragraphs, of this chapter the statistics obtained in the Census regarding some of the chief languages are discussed,but the following brief notes are given regarding the nature and lopalities of the various languages and the methods used in classifying the data.
Urdu is a language of comparatively recent growth which came into use as the lingua franca developed by the Moghul soldiery in contact with the Hindu inhabitants. The word "Urdu" (derived from the same root as the English "horde") means "camp" and Urdu was originally the language of the army camps. In time it spread widely as the general second tongue throughout India (Hindustan). The Linguistic Survey of India classes Urdu and Western Hindu as "the two literary forms of Hindustani". Urdu is written in Persian style script and Hindi in a form of the Sanskrit script. Persons claiming
Hindustani as their mother-tongue have been counted under Urdu if they areMuslims and under Hindi if they are Hindus. Bihari has been dealt with similarly it is classed in the Linguistic Survey of India, along with Bengali, Assamese and Oriya, in the Eastern part of the "Outer Group". In practice however it dppears that persons io Pakistan who claim Bihari as their Mothertongue have a speech which is similar to Hindustani and, if literate, write it in Urdu script if they are Muslims and in Nagari (Sanskrit style) characters if Hindus. (It may be added that the number of persons in what is now Pakistan, who are shown in the 1931 Census as having Bihari as their Mother-tongue was less than a thousand.)
The dialects which have been included in the figures for Punjabi are Derawali, Jafirki, Khetrani, Dogra, Pohari. Lahanda, Multani and Bahawalpuri Philologists group together Hindki, Lahanda or Western PUlljabi dialects as alternative names and include them in the North-Western group of the Outer sub-branch. In this Census it has not been possible to make any distinction between the Eastern and Western Punjabi. Pahari is strictly sepeaking a separate group of the 'Inner sub-branch" of Indo-Aryan languages. But the few persons in Pakistan who claim to speak a Pahari dialect mostly use a tongue akin to Urdu or Hindi.
The figures for Rajasthani include the following dialects and associated tongues; Maiwati, Marwari, Jaipuri, Ajmeri, Bikaneri, Rajputani, etc. and the Bhili speeches. GJjrati (including Kathiwari) is separately tabulated in this census. The 1931 Census of India puts Rajshthani along with Western Hindi, Gujrati, Bhili and Punjabi in the Central group of the "Inner Sub-Branch" of the Aryan sub-family.
The figures for Sindhi include Jattki, Seraiki and Lassi as dialects. In the Linguistic Survey of India, Sindhi is grouped with Lahanda or Punjabi forming the North-Western group of the "Outer Sub-Branch". Thakri has been classed as a dialect of Marathi.
Bengali is the chief language, as far as Pakistan is concerned, of the Eastern portion of the "outer sub-branch" of the Indo-Aryan languages. It is spoken throughout Bengal by all communities., although there are certain number of specific local mother-tongues. The Chittagonian, Sylhetta
70
Chakma and Hajong dialects of Bengal have been included in the figures for Bengah.
The Dardic Branch includes Kashmiri, with which in this census Shina, the other language of Kashmir, has been grouped; Kohistani. with Gujrati, Ajari, Torwati, Kalarni as its dialects; Khowar. with dialects Chitrali Arandri, Dandarik. Dameli, Jadri, Biyar, Maiolo, Gididi, Kashkari; and the tongues of the Kafir Tribes. Kalash of the Black Kafirs and Bashgali of the Red Kafirs.
The languages of the Iranian Branch spoken in Pakistan are Pushtu, Baluchi and Persian. The dialects included with Pushtu are Pathani, Afghani and Kabuli. It has been suggested that the two last and also Kandhari and Yusufzi, if claimed in Pakistan, should be classified with Persian, but the grouping suggested by the Government of N.W.F.P. has been retained in the Table. The dialects included in Baluchi are Makrani, and Makrani-Kechi and those included in Persian are Dehwani, Yorgha, Badakshani and Lorichini. Lorichini, which is spoken by a very small community, was included in the 1931 Census as unclassified, but it appears to be a low form of Persian.
The omnibus classification "Central Asian Tongues" has been used to tabulate the tongue of certain small groups of tribes and states in the extreme North of West Pakistan i.e. Wakik, Qazik, Turkey, Kirghiz and Hunzik. No attempt has been made to group them Philologically. Most of the people who report these tongueslin the census of Pakistan will in fact be migrants from beyond the Pakistan border.
The Dravidian tongues include Brahui, which is a "remnant of what was one of the great Western Dravidian block of India" which now survives chiefly as the main mother-tongue of Kalat State in Baluchistan. The South-Indian Languages were rarely reported and only 37 persons claimed Draon and Maltho which were classed as tribal Dravidian tongues of East Bengal.
Santhali and Khasi, the only survivals of the Austric tongues which existed before the Dravidians came (3,500 B.C.) are chiefly found in Sylhet.
The Assam Burman Languages form a branch of the Tibeto-Chinese speech-family, and include
Burmese and Arakanese which are both in the Burmese Group. The dialects of Maghi and Marang have been included in the figures for Arakanese. Other Tibeto-Chinese tongues include Manipuri (or Meithei) and Lushai of the Kuki-Chin Group and Garo and Tripuri of the Bara or Bodo Group. Marang, classified as a dialect of Arkanese, is also closely akin to Tripuri.
4.4 Multi-lingualism. -In the circumstances described above, it stands to reason that the people of Pakistan, to communicate with one another on a wider basis than their immedIate locality and community must learn additional languages. Census Table No. 7A shows the extent to which this has in fact happened. This Table is derived from the Census question which enquired what languages were spoken III addition to the respondents' mother-tongue. Statement 4-A summarizes the results of this enquiry.
It is perhaps doubtful whether the languages spoken in addition to a person's mother-tongue were fully reported in all cases. The Provincial Superintendent of Census of East Bengal mentions that at the time of the Census there was a great deal of agitation a foot in connection with the State language question and that possibly the Census record of the number of persons in East Bengal who can speak Urdu is an understand statement. There may be a similar tendencies in other places. The number of Urdu speakers in the Punjab for mstance seems very low when it is considered that, at least in the towns, most persons whose Mother-tongue is Punjabi can speak and understand Urdu. The figures in Table 7-A may therefore err on the low side and this would also apply to the data derived from them and show in Statements 4-A and 4-B. Low figures for subsidiary languages were, however, also shown in the 1931 Census. In Bengal, of the persons whose mother-tongue was Bengali were only 0.2 per cent then claimed to speak Urdu. The figure in the 1951 Census is about 1 per cent. Similarly, in the Plmjab in 1931, of the persons in Lahore, Rawalpindi and Multan Divisions who claimed Western Punjabi (then classified as Lahanda) as their Mother-tongue only 2.3 percent claimed also to speak Hindustani, which for this purpose may be considered equivalent to Urdu. In 1951 Census the comparable figure is about 15 percent.
The tendency not to report additional languages
seems therefore to be deep-seated and long standing. Perhaps we are a little nearer the truth in 1951 Census but there is every indication that under reporting of acquired languages still persists.
Taking the figures as reported, however, Statement 4-A gives an indication of the extent to which citizens of Pakistan have learned each other's languages. It can be seen that about
Statement 4-A.
Persons Speaking Main Languages
Total As As additional Languages Speakers Mother language
(lakhs) tongue (Iakhs) Lakhs Ratio (a)
Urdu 54.2 24.6 29.6 4.0
Bengali 412.9 411.7 1.2 0.3
Punjabi 214.7 208.4 6.3 1.1
Pushtu (b) 53.5 50.0 3.5 0.5
Sindhi 43.6 39.9 3.7 0.5
English 13.8 0.1 13.7 1.8
(a) Total number of persons in all Pakistan to whom the particular language is NOT their Mother Tongue-tOO.
(b) Total estimated population of the Frontier Regions of N.-W.F.P. (1755 thousand) is considered to be having pushtu as their mother tongue.
Languages
Total Population (in lakhs)
Speakers of:-
Urdu (c)
Benga1i
Punjabi
Pushtu
Sindhl
Baluchi
English
I Pakistan
756.4 100
7.2
54.6
28.4
7.1
5.8
1.4
1.8
Statement 4-B.
Percentage distribution of Languages commonly spoken (a)
West Pakistan
337.1 100
14.7
63.7
15.9
12.9
3.2
2.5
East Bengal
419.3 100
1.1
98.0
1.3
I Baluchistan I
& , State
I Union
11.5 100
7.3
7.3
25.0
20.0
41.0
1.1
Karachi
11.2 100
68.0
0.5
9.5
3.7
17.0
9.2
8'7
I I N.W.F.P.I
58.7 100
3.4
23.0
84.3
0.5
Punjab &
Bahawalpur
206.4 100
16.0
96.0
0.3
0.1
3.0
I ~ind : Khairpur
49.3 100
14.0
3.S
0.4
80.0
10.0
1.5
Noles: (a) Includes persons speaking each language as tbeir Mother Tongue. and also those who speak it as an additional language.
(b) Includes tbe enumerated and estimated parts of tbe Frontier Regions.
(c) Includes a small number of persons who reported tbeir Motber Tongue as Hindi.
(d) Sindhi as spoken in Baluchistan is mostly in its LASSI and JATTKI fonn..
72
4 percent of the people to whom Urdu is not their Mother-tongue have claimed to be able to speak it. Looked at in this way, therefore, Urdu is the language which is most commonly learnt and the next is English, which is the mother-tongue of very few people indeed, but which can be spoken by nearly 2 percent of the population. Bengali as may be expected is at the bottom of the list in such a classification since very few people outside Bengal learn to speak that language.
Statement 4-B is not based on Mother-tongues but on languages commonly spoken and it therefore includes both the people to whom each language is the mother-tongue and the persons to whom it is an acquired language. The statement shows, as one would expect, that most provinces have their own major language understood by nearly everybody. In East Bengal that language is Bengali, in the Punjab it is punjabi. in Sind it is Sindhi, and in N-W.F.P. it is generally Pushtu but in Hazara and Dera Ismail Khan districts most people speak Punjabi.
In Baluchistan, however, the language pattern is complicated. _Brahui, an ancient tongue of Dravidian origin, is the chief language of Kalat State although many people there speak nothing but either Baluchi or the Jhattki form of Sindhi. Lassi, another form of Sindhi, is the chief language of Lasbella state, but Baluchi is also widely spoken there and it is the chief language of Kharan and Makran States and of Sibi district. Pushtu, Punjabi and Sindhi are widely spoken in different parts of the Baluchistan districts. Urdu is spoken very iittle in Baluchistan except in Quetta city.
The columns in Statement 4-B therefore illdicate, high figures for the languages mentioned above. But an interesting point of the statement is the indication it gives of the provinces in which certain languages are spoken by very few people. While Bengali is hardly spoken at all ill West Palcistan, Urdu, as we have seen, is little spoken in East Bengal. It is spoken, however, by a large proportion of the population of Karachi and is obviously the language with which one can go farthest in Pakistan as a whole. All other languages, except English, would fail one entirely in at least one province. A few English speaking persons can be found everywhere and according to the enumeration reports English is slightly more useful than Urdu in East Bengal but the
figures for Urdu as an acquired language are very doubtful and are not borne out by my own personal experience. As Census Commissioner I have visited many districts and I found everywhere, even in East Bengal, that many people who did not know English, managed to get along with my rather poor Urdu. I feel that it must be much more widely used than the reports indicate.
4.5 Languages of Literacy.-In this census a separate count has been made of the persons who can read and write, and of those who can read ooly, in each of the nine main languages of Pakistan. Persons classed as able to read are supposed to be able to read clear print, such as a newspaper, and this data is therefore some measure of the extent to which the Press, and printed matter generally, can reach the public and in what languages.
Table g'A in Part II of this volume shows the above information for each Province and the similar table in the Provincial volumes of the Census Report give the data for each district and for each of the more important towns. This census Table also shows the number of persons who are fully literate and can read and write, in each of the selccted languages. It is noticeable that there is a afairly large number of persons who claimed to be able to read but not to write. The figure for both forms of literacy are summaized in Statements Nos. 4-C and 4-D. Except in Bengal, and Sind, Urdu is by far the most widely read and written language, and the next is English. In East Bengal the two main languages of literacy are Bengali and English, and in Sind they are Silldhi and Urdu with English a bad third.
It appears from these data that a newspaper printed in Bengali can be read by about 18 per cent of the population of East Bengal while in Urdu it could be read by about 7 percent of the population of West Pakistan. A paper in English could be read by 3 per cent of the total population of Pakistan, including 4 per cent of the pepple in East Bengal and 2 per cent of those in West Pakistan.
4.6 Urdu.-Although as yet Urdu is reported as the Mother-tongue by only a small proportion of the people of Pakistan, amounting to 2S lakhs nearly all of whom are in West Pakistan, it is reported to be spoken as an additional languaae
73
Statement 4-C
Percentage distribution of language Read
Pakistan Baluchis
tan & States Union
I Federal East ,Capital
N.W.F·P. &
Frontier
Punjab &
Bahawalpur
State
I Sind &
'Khairpur State
Languages
Total PopUlation (n lakes)
Of whom able to read in:-
Urdu
Bengali ..
Punjabi
Pushtu ..
Sindhi .. English ..
Bengal I Area ; Karachi
_______ 1 ____ _
738.8 100
3.8
10.4
0.1
0.0
0.5
3.2
11.5 100
4.3
0.0
0.3
0.2
0.2
1.2
419.3 100
1.1
18.3
0.0
0.0
0.0
4.1
11.2 100
19.6
0.3
0.5
0.1
1.5
8.8
(a) Includes enumerated parts of Frontier Regions
Statement 4-D.
, Regions
41.1 100
4.6
0.0
0.3
0.6
0.0
1.3
206.4 100
8.4
0.0
0.3
0.0
0.0
2.3
49.3 100
2.4
0.0
0.0
0.0
6.9
1.0
Percentage distribution of Languages written.
I Baluchis-I Federal I N.W.F.P.! Punjab I Sind I East I Capital I & & I & i Palcistan
tan & I Languages I States I Bengal Area Frontier I Bahawal- Khirpur
: Union I Karachi Region I pur ' State State
I ------ - ------
Total Population 100 100 100 100 100 100 100 .:
Of whom able to read and write In:-
Urdu 3.2 3.9 0.7 18.4 4.3 7.3 l.2
Bengali .. 8.1 0.0 14.2 0.2 6.0 0.0 n.o
PUllJabi 0.1 0.3 0.0 0.4 0.2 0.2 0.0
Pushtu 0.0 0.1 0.0 0.1 0.4 0.0 0.0
Sindhi 0.4 0.1 0.0 1.4 0.0 0.0 6.1
English .. 2.6 1.2 3.2 8.5 1.2 2.1 0.9
(a) Includes Enumerated parts of the Frontier Regions.
74
by another 30 lakhs, and is in fact used by many more who did not report it in the Census. The right hand colum of the following statement shows the percentages of persons who speak urdu as an additional language.
seem that the only persons who were recorded by the enumerators as speaking Urdu were those who claimed to be able to read it. These amounted to about one percent of the population and most of them could also write in Urdu.
PERSONS SPEAKERS URDU
Mother Tongue I I Persons , \ Speaking
Total (in lakhs) Urdu Urdu as I Speakers Additional Province Population Ratio (a)
(in lakhs) Urdu Other (in lakes) I language J (in lakhs)
Baluchistan 11.5 0.2 11.3 0.8 0.6 5.3
East Bengal 419.3 2.7 416.6 4.6 1.9 O.S
Karachi 11.2 5.7 5.5 7.6 1.9 34.S
N.-W.F.P. 41.1 0.5 40.6 2.0 1.5 3.7
Punjab 206.4 10.7 195.7 32.3 21.6 11.0
Sind 49.3 4.8 44.5 6.8 2.0 4.5
Total 738.8 24.6 714 .. 2 54.2 29.5 4.1
(al Percent of persons who do not claim under to be their Mother Tongue
Urdu is the normal medium of instruction in primary and middle schools in West Pakistan, except where instruction is given in Sindhi, Pushtu or English and even there Urdu is taught as the second language. In West Pakistan therefore as a general rule most people who can write at all, write Urdu.
The exception is Sind where the chief language of literacy is Sindhi; but even here literacy in Urdu is growing. In the matter of speech there are 11 Sindhi-speaking people for every two who speak Urdu but in the matter of literacy the proportion is smaller and there are only 5 persons who write Sindhi for every two who write Urdu.
A factor which has contributed to the size of the Urdu speaking population is the influx of Muhajirs, a large number of whom are from the Central and Northern zones of India where Hindustani (which for Muslims can be regarded as equivalent to Urdu) is the main spoken language.
As already pointed out, however, Urdu is little used in East Bengal, although the Census figures are perhaps unreliable in this respect as it would
Once Urdu is learnt as an additional language by more people than learn any other language, and as it is a medium of instruction or is taught as a second language very widely, the use of Urdu can be expected to spread as education and literacy extend.
4.7 Bengali:-In Bengal the almost universal
language is Bengali which is spoken by 413 lakhs
of persons, amounting to 98 per cent of the
population, and it is written by 14 per cent of the
people of that Province. This language is thus
seen to be used by more persons than any other
language in Pakistan. 56 per cent of all Pakistanis
speak it and 8 per cent write it, which is more than
twice as many as write in any other language.
Its use, however, is confined to this one Province
snd Statement 4-A indicates that very few people
to whom it is not their mother tongue learn to
apeak Bengali.
4.8 Punjabi:-After Bengali the language
reported as spoken by the largest number of Pakistanis is Punjabi. In one of other of its forms, for it has many diale;;ts, it is the mothertongue of 195 lakhs of persons enumerated in the Punjab and Bahawalpur State out of their total population of 206 lakhs. Punjabi is also the chief mother tongue in 2 districts of the North 'fest Frontier Province-Hazara and Dera Ismail Khan--and is spoken by a larg~ number Of persons in other parts of ~-W.F.P. Sind, Baluchistan and Karachi. Altogether Punjabi is spoken by 215 lakhs of persons; its use is, however, almost entirely confined to Western Pakistan. Punjabi, moreover, is not normally a written language. It can, be written in cither the script used for Urdu or in the Gurmukhi script used by Sikhs, but Punjabi-speaking persons who learn to read and write generally do so in U rda.
4.9 Sindhi:-Sindhi is the chief language of the Province of Sind. It is the mother tongue of 40 lakhs of Pakistanis of whom 36 lakhs are found in Sind, which is 74 per cent of the population of that Province. A further 1.9 lakhs of persons enumerated in Baluchistan stated Sindhi as their mother tongue and 1.6 lakhs of the inhabitants of the Federal Capital Area.
These figures include nearly 80,000 persons in Baluchistan mostly in Kalat State, to whom the Jattki (form of Sindhi) is their mother tongue, and the figures also include more than 60,000 persons in Lasbela State whose mother tongue is the Lassi (form of Sindhi). A dialect known as Seraiki is largely spoken in Tharparkar and Nawabshah Distncts of Sind and is also found in Larkana. Dadu and Sukkur Districts.
In the 1931 Census Sindhi was reported as the mother tongue of 80 'per cent of the population of Sind: the reduction in this proportion is largely due to the influx of agriculturists from the Punjab and of Urdu-speaking Muhajirs from India, as well as the departure of many Sindhi-speaking Hindus.
As a written language Sindhi uses a script which is slightly different from that used for Urdu. It is the chief language of literacy in Sind where it is written by 3 lakhs of persons and can be read by 3.4lakhs. It was found necessary in the Cen3us to print the enumeration documents for Sind in Sindhi; an enquiry established that Urdu slips would not only be unpopular but impractical.
75
4.10 Pushtu.-As a mother tongue Pushtu is found in all areas of Western Pakistan. It is the chief language of North-West Frontier Province and the second most widely used language in Baluchistan. In all it is spoken by 46 lakhs of persons. This figure inclJdes both the enumerated and the estimated population of the North West Frontier Regions. ~o enquiry was possible regarding mother-tongues in the non-enumerated parts of the Frontier Regions but they Cdll be assumed for all practical purposes to have Pushtu as their universal mother tongue. This language, therefore, is the mother tongue of 15 per cent of the population of West Pakistan. But, like Bengali, its use is mJre or less confined to certain g'.lographical areas, although some 3.5 lakhs of persons to whom it is not their mother tongue claimed to be able to speak. it,
Like Punjabi, Pushtu is not normally a written language and Pushtu speaking persons who learn to read and write. generally, do so in Urdu. There is, however, a recent tendency for Pushto to be used as a m:!dium of education and some newspapers in Frontier Province are including items of news and articles in Pushtu. It may possibly. therefore, become more wide-spread as a language of literacy in the future. In the present Census some 15 thousand persons in settled districts of N-W.F.P. claimed to read and write Pushtu as against 168 thousand and 46 thousand who claimed to read and write Urdu and English respectively.
4.11 English: -As a mother-tongue English is claim~d by very few p~rsons indeed in Pakistan. Census Table No.7, like most of the Census table, does not indude foreigners residing in Pakistan and therefore the figures in that Table for persons who claimed English as their Mother-tongue only apply to people who reported their nationality as Pakistani. The total number of them is about 12 thousand of whom nearly 8 thousand are found in Karachi. They represent the AngloPakistani and domiciled European communities and some of the persons of Goanese descent.
English IS, however, very widely spoken and i, an important language of literacy. It is in fact the language of well educated men and women throughout Pakistan, the language of business, and at present the language of the Government English is taught as a subject in all Middle SC:1oo1s. In High Schools and Universities it is largely the
76
medium of instruction. As a result of this position as a language of study, the Census figures show that English, although claimed as a spoken language by only about 14 lakhs of persons, is written by nearly 20 lakhs and can be read by over 24 lakhs of people. It is noticeabO that in East Bengal, Baluchistan and N-WFP, the number of people who can write English is greater than those who can speak it while in the Punjab, Sind and Karach~ the number of persons who speak English exceed the number who can write it. In these parts English would appear to be in wider current use.
As Statement 4-B shows, nearly 2 per cent of the population of Pakistan have claimed English as an additional spoken language and in Statement 4-A it comes second only to Urdu as a language which is learnt by persons to whom it is not the mother-tongue. As far as numbers go more persons who use English are found in East Pakistan, but this is chiefly due to the larger size of its total population. Expressed in percentages the English speakers are 1.3 percent
of the population of East Bengal whereas they amount to 3 percent of the population of the Punjab.
4.12 Ability to read the- Holy Quran :-A feature of this first census of Pakistan is the provision on the census questionnaire of an enquiry on the subject of ability to read the Holy Quran. This was part of the series of questions on languages. Persons who stated that they could read Arabic were recorded by a special symbol if their ability to read that language was confined to reading from the Holy Quran. The number of persons so recorded, as well as the numbers able to read Arabic generally, is shown in Census table No. 8A and the data has been summarized in Statement 4-E. In this statement the persons who claimed to be able to read Arabic generally or from the Holy Quran have been related to the Muslim population. The percentage of Muslims thus shown as able to read their sacred scriptures is highest in Karachi and next highest in the Punjab. There would appear to be a correlation between the ability to read the Arabic of the
Statement 4-E.
Muslims able to read from the Holy Quran in Arabic
I I
Person claiming to read Total Holy Quran
Provinces Muslims ,
(Lakhs) Lakhs
! Percentage
(a) ,
Pakistan .. .. . . .. 623.2 65.7 10.5
Baluchistan & States Union .. · . .. 11.4 0.9 7.9
East Bengal .. .. · . .. 322.3 32.8 10.2
Federal Capital Area, Karachi · . .. 10.8 2.5 23.1
N.W.F.P. (b) .. .. .. . . 32.2 2.4 7.5
Punjab & Bahawalpur State .. .. .. 202.0 23.0 11.4
Sind & KhairpuriState .. .. . . 44.6 4.2 9.4
(a) Total Muslims = 100 (b) Excludes Frontier Regions.
Holy Quran and ability to read Urdu or Sindhi which have somewhat similar scripts. The claim of 10 per cent of the Muslims in East Bengal therefore to be able to read the Holy Quran in Arabic rather tempts one to doubt the report that only one per cent of them can, read Urdu.
The percentages in Statement 4-E for Muslims able to read the Holy Quran are not high and are I ' In fact less than the General Literacy percentages shown in Census Table No.8, but it appears from a study of Literacy in the various languages shown in Table SA. that some persons who can read the Holy Quran in Arabic cannot read anything else. It is probable that some of them do not really read the scriptures, but recite them by heart.
4.13 Literacy:-Census Tables No. S shows the numbers of persons who reported that they were able to read clear print and who are therefore classed as being literate. As mentioned above a certain number of persons classed as literate ~ay not be able to read other than from the Holy Quran.
77
This definition of literacy differs from that used in previous censuses when people were classed as literate if they could read and write a simple letter in any language. Information in similar basis has also been collected in the 1951 census but has been sorted according to the language which the respondents claimed to be able to write. Comparison with the past figures for literacy is therefore made in Statement 4-F on the basis of the figures for 1951 for ability to write the chief language of literacy in each Province as against the figures for 1931 for general ability to read and write. The 1931 percentages for Punjab and East Bengal relate to the Muslim population of the whole of the undivided provinces -there is no reliable basis for calculating the 1931 literacy percentages of the present areas of those provinces, but the overall figures for Muslims when expressed as percentages should be fairly comparable.
The figures for the census of 1931 shown in Statement 4-F are therefore those for Muslims only and the 1951 figure for East Bengal is also given
Statement 4-F.
Progress in Literacy
1931 1951
Province I Per-ce-n-t-ag-e-(b-)- -,-Chief Language I Perce~~~ge (~) I literate of Literacy able to write
1---------------- ------------,--- _-----------Baluchistan & States UI bn 1.6 Urdu 3.9
East Bengal 5.7(d) Bengali 13.4(c)
Federal Capital Area, Karachi (e) Urdu 18.4
N.W.F.P. Districts 2.2 Urdu 5.2
Punjab & Bahawalpur State 2.8(d) Urdu 7.3
Sind & Khairpur State .. 2.0 Sindhi 6.1
(a) Persons able to read and write in the chief language of literacy. Except for East Bengal, Total Population = 100
(b) Muslims able to read and write in any language. Total Muslims ~ 100. (c) Total Muslims =100. (d) This percentage for 1931 applies to the Muslims in the whole undivided Province. (e) 1931 figures for Karachi City not available. The percentage for Karachi District was 3.8.
78
for Muslims only. In other Provinces the 1951 figures are for the whole population but in view of the small size of the non-muslim communities they may be regarded as comparable to the 1931 figure for Muslims. This method of comparison has been chosen because the 1931 overall literacy percentages would include a large number of Caste Hindus who were mostly literate and many of whom have now left Pakistan.
This comparison shows a general rise in Muslim literacy during the last 20 years in all the provinces which now form Pakistan. The progress is of course greater in fact than would appear from these percentages, since the 1951 figures take account only of literacy in particular languages. The comparable data for 1941 is not available and it is therefore not possible to see how much of the progress is applicable to the last decade.
The Provincial Superintendents of Census have shown in their reports that since Partition great efforts have been made to combat illiteracy and educational facilities have greatly increased in recent years.
The literacy percentages on the 1951 basis of ability to read are summarized in Statement 4-G. The Federal Capital Area has the highest percentage, but this should be compared with other urban areas rather than with Provincial averages, and Karachi with 31.6 per cent is then seen to be below the general level ofliteracy in cities: Lahore has 36.3 per cent and Dacca 51 per cent. Among the Provinces, East Bengal with 21 p~r cent has the best literacy figures. The overall average in West Pakistan is about 16%, the Provincial figures varying between 18% in the Punjab and 9% in the NWFP.
Statement 4-G.
Literate persons per cent of Population.
Literates percent of:- I Literates aged '-.------.------ 12 years & Over
Provinces
Pakistan
Baluchistan & States Union
East Bengal
Federal Capital Area, Karachi
N.W.F.P.
Punjab & Bahawalpur State
Sind & Khairpur State
Total Population
18.9
10.3
21.1
31.4
9.2
17.8
13.~
Population aged 5 years and Over (b)
22.0
12.0
24.7
36.7
10.8
20.5
15.4
, as percentage of
I Population
aged 12 years and over (c)
23.2
14.3
26.4
30.5
10.3
21.6
15.0
(a) This is based on the detailed age tabulation and awing to "heaping" at age 5 is probably a slight under statement of the literacy percentage for persons actually of that age or more.
(b) The "Under 12" age group is belived to have been over-stated and thereFore these pescental6S may be.a.little too high.
These percentages, however are based on the whole population including the young cMdren below school-going age. For comparison purposes therefore the literacy data is also summarized in statement 4-G in two other methods: the centre column shows the literate persons, ah of whom can be assumed to be at least 5 years of age, as a percentage of the total population over'that age; the right-hand column deals with the population of 12 years of age and over only, ~nd expresses the literate part of that population as a percentage of the whole.
Census Table No. 8 gives separate figures for die literacy of males and females. In every case the figures for females are much smaller than those for males-25 per cent of the male population of Pakistan is able to read but only 11.4 per ceIit of females.
iilstitutions since tlie Census figures are based entirely upon the reports made by households and include students attending numerious unrecognized educational enterprises. Probably they exclude students who had ceased regular attendance but were still on the school registers. The following figures supplied by the Education Division of the Government of Pakistan are therefore given regarding the number of scholars attending primary schools on the 1st of January 1952.
STATEMENT 4-H.
Students in officially recognized primary
School on 1st January 1952.
Province & State Boys Girls Total
I (1000's) (1000's) (looo's) 4.14 Students:-Census Table No.9 shows the number of persons who reported themselves as regularly attending school or college at the time of the Census and indicates the percentage they Pakistan 29,03" 2,99 32,02 represent of the total population. The table shows separate figures for persons younger and Baluchistan 14 3 17 older than their 10th birthday.
The percentages for children under 10 years should be viewed in the light of the fact that very few children go to schopl before they are 5 and the percentages of the 5-9 age-group which is at sch~ol is probably about double the figure shown in the table for the 0-9 gtoup. Even then the figures are hot \a,tge irlti there are considerable differences between the pro~inces. In Ea~t, :eeI)g!l1 22 percent of the boys under 10 are at school and 12 percent of the girls. The comparable figure for the Punjab is 18 and 10 percents. In Sind, Baluchistan and N.W.F.P. provinces proportions are much lower. In the Federal Capital Area, Karacifi, comparable figures are 17 percent boys and 12 percent girls. However, in Karachi a more detailed calculation is possible owing to the more accurate reporting of age and it is seen that larger figures for students are found in the 10-11 agegroup, namely 47 percent of boys and 32 percent of girls. Naturally the figures are lower again in the 12-19 age group.
These figures given in Table 9 in respect of pupils artd Students can not .agree with the official records for Government-sponsored educational
4.15 Education.-The total number of persons who have received full-time education, or were receiving it at the time of the Census is shown in Census Table No. 9A. The figures are given for the total populaJion, and for all relIgi6ns sepflrately and are analysed into groups according to the
80
time spent in education, separating the children from the rest of the population. Persons were not included in the Table unless they have been to school for at least 6 months. These figures have been collected for the first time and should prove a useful basis of comparison with futurll Censuses.
Statement No. 4-1 summarizes these figures on duration of education in respect of Muslims in each province. In this Statement the percentage of the population represented by all persons who have had at least 6 months schooling is everywhere much larger than the percentage representina those who have had 5 years or more at school. The percentages in the statement apply only to persons aged 10 years or over and would appear to indicate that quite an appreciable proportion of them were either still undergoing the primary course at the time" of the Census or had left school without finishing that course, (it being assumed to require about 5 years). The figures for Karachi stand out above the others in statement 4-1 probably on accoun~ of its special position as the Capital City but also because it is a? almost entirely urban area, and, as the literacy percentages in Census Table No. 8 show, educated persons
are found in greater numbers in the towns. Of the provinces, East Bengal has the highest fiaures for educated Muslims with the Punjab closely second. Baluchistan is the lowest. It is noticeable that very much lower percentage are everywhere shown for females but the difference between the male and female proportions is not as great in the Punjab as in other places.
4.16 Educational levels.-The numbers of persons who have attained various standards of education are shown in Census Table No. 9B. The literate persons, i.e. those able to read, amount to 140 lakhs in the whole of Pakistan and of these about 74lakhs, or 53 per cent, have no formal educational standing, not having passed primary school or any more advanced standard. Of the remainin& 47 per cent of the literate persons, 30.5" percent have passed primary school, 12.2 per cent have passed middle school, nearly 3.75 per cent have passed the Matriculation examination and the remaining .8 per cent have a University Degree. The foregoing percenta~es apply 'to the whole enumerated population or Pakistan, exluding the estimated areas of the Frontier Regions for which no such data is available, but where in fact education is very slight.
Statement 4-{.
Percentage of edogtted Muslims Aged 10 or Over
(Total Muslims aged 10 or oyer of the sex = 100 percent)
~ Muslims at or who have Muslims who have had
been to"School 5 years of more at Provinces School
Males /' Fem~les Males I Females I ,
PaJd~ .. 21.4 s.6 11.5 3.7 \ I
Baluchistan & I States Union
\
8.0 1.5\ 5.3 I 0.8
East Bengal .. 25.7 8.4 \ 13.1 3.0 \
Federal Capital Area, . \
Karachi .. 36.0 17.1 \ 23.S 7.3
N.W.F.P District 13.7 2.2 \ 9.1 1.2
Punjab & Bahawal- \
pur State .. / 17.8 11.0 \ 10.1 5.7 \
Sind & Khairpur \ State .. 14.2' 2.6 6.8 0.8
\
81
Among women the standards are much lower. 46 per cent of the male literates have! no formal attainments but 69 per cent of the fenple literates tnat are class. 33 per cent of male l,terates have passed primary school but only 24 p~ cent of the females. The proportions for more advanced standards show still larger disparities.,
are slightly higher than those for the general population. Evidently the refugees have on the whole tended to raise the average level of education and thus make up to some extent for the loss of educated Hindus.
Statement 4-J summarizes the d~ta in CensJ!s Table 9B in percentages and compates them with the similar data for Muhajirs shown in Census\ Table No. 19.B. The figures fOf the Muhajirs
It is suggested that these tables on education might well form a useful subject of more exhaustive research than has been possible in the time available for writing this'report or which can be done by persons without a specialist education'at background.
Statement 4-J.
Percentage of Educational levels
Total Total Population Muhajirs
All Li-terates -100 Literate Muhajir-":"'100 -100 No More No' More
(Ii) Excl!-\des States Union. (1) &cludes Frontier Regions.
CHAPTER 5
KARACHI
S.l The Federal Capital Area:-The area assigned to the Capital of Pakistan is not dealt with in the Provincial volum~s of the Census Report; this chapter of the Pakistan Report therefore provides the sam~ kind of explanatory and analytical comm~nts on the Census statistics of Karachi as is given for other parts of Pakistan in the reports of the Provincial Superintendents of Census.
The Pakistan (Establishment of the Federal Capital) Order issued by the Governor-General on the 23rd of July 1948 demarcated the area of the Capital of the Federation from the province of Sind and form~d it into a centrally administered unit to be called "KARACHI". The area comprised Karachi city and cantonments, the Islands in the harbour of Karachi and 54 of the "Dehs" (the small rural administrative areas) which had previously formed part of the Karachi district of the province of Sind.
The effect of the creation of the Federal Capital Area therefore was to divide the old Karachi district into two parts as follows:--
5.2 Brief Historical note.-Karachi has grown to its present position as the Capital city of one of the largest nations of the world within a comparatively short time. When the British under Sir Charles Napier annexed Sind 1843 they found here "only a fishing village, with a small fort and
a ditch called 'Kalachi-jo-Kun' with two gates one called the Kharadar (the salt Witter gate) facing the sea and the other called Mithadar (the sweet water gate) facing the Lyari river"! The population was then about 14,000 persons. The remparts have now gone but the nam~s still exist as quarters of the city. The house where the Quaid-i-Azam (Mr. Muhammad Ali Jinnah, the founder of Pakistan) was born in Kharadar.
Since those early days Karachi has made constant progress both as a port and as a commercial centre serving the rich hinterland of Sind and the Punjab and even beyond into Afghanistan. The agricultural development of Sind and the Punjab, due to the success of the irrigation schemes, is chiefly responsible for the great growth of trade and the rise in importance of Karachi port and city.
The Municipality was constituted in 1852 to replace the Board of Conservancy which had existed since 1846. The membership of the Municipal Commission was expanded at various tim::s until it was replaced by a separate Act for
Census of 1951
KARACHI FEDERAL CAPITAL AREA
(a) Karachi Municipal Corporation. (b) Karachi Civil Cantonment. (c) Other Cantonments. (d) Rest of Karachi Taluka (54 Dehs)
TATTA DISTRICT (SIND)
Tatta Taluka (96 Dehs) of which 37 from old Karachi Taluka (N.B. Some Dehs have been revised) \
Six other Talukas.
the Municipal Government of the City in 1933. The accounts for the Municipality's first year of existence showed an income ofRs. 13,514/-. This had risen to 10 times the amount by 1914; by 1939 it was Rs. 40,10,250/-; in 1946/7 the year before partition, the city's income was Rs. 76,45,150/-
Note ;-1. This quotation and much of the information in this paragraph is from "Introduction to Karachi" by Dr. Maneck B. Pithawala, D. Sc., F.G.S.
82
and in 1949-50 it hat! nseli to RS. 95;65;1'001-Karachi Chamber of Commerce was founded in 1860. In 1878 the Railway from Karachi had been pushed forward as far as Khanpur.
t
The Karachi Port Trust which replaced the previous Harbour Board was constituted by an Act of the Bombay Lagislature in 1886 and had constructed 13 berths for ocean-going ships by 1910. Between 1914 and 1918 the port showed a great increase in activity due to its use for military purposes. After the War the trade of the port continued to increase and, realizing the importance
of tne citY as a collurterdial centre on the cotrlpletft5ii of the Lloyed Barrage at Sukkltr ih 1932, many business men from the West of India took up their permanent residence in Karachi. During the second World War 1939-45 Karachi became of great strategic value and a main centre of naval operations. The port was called upon to handle an enormously increased volume of imports including vast quantities of military stores. Now it has 21 berths for ocean-going vessels, 18 sets of moorings, and wharfage facilities for some 5 million tons per annum. A dry dock is under construction. In Statement 5-A. the rise in the
(a) Popuiation figures are for the Municipal corporaiion Area. (b) Data not available. (c) The pori tmffic figures for other retent years are:
Vessels No Regd. Year Entered tons
i (1000's) ----
1'946/47 816 2,293
1947/48 1,041 3,499
1948/49 985 3,076
1949/50 1,160 3,681
(d) The source of the Port Traffic data is Port Trust.
I Tons I (1000's)
~~ (b) (b)
570 800 914 1,800 906 2,226 912 2,278 775 2,084
1,179 4,053
Tonnage' handled (1000's) !
2,739
2,184
2,543
2,841
Karachi
Tonnage handled (1000's)
I
(b) (b) (b) (b)
1,131 1,626 2,176 3,473(c)
trade of the port is sh9wn in its relation to the ~owth of population in the city.
The geographical situation of Karachi has located it in a central position from the point of view of world-wide air transport, for which it supplies excellent facilities. The great Karachi Airport at Drigh Road, which possesses the finest radar-aided landing-grounds between Singapore and Suez, is used by almost all the world famous airlines and handles a monthly average of about one thousand aircraft movements.
With the great advantages offered to both sea and air transport, with the trade of fertile and prosperous lands passing through it, and with its status as the Capital city of a great nation, the future continued growth of Karachi in population
trade and prestige can safely be expected.
5.3 Growth of Population.-Statement 5-A shows the progressive rise in the population of Karachi city including its Cantonments since the Census of 1881. The rise during the last decade is phenomenal and is particularly impressive when one realises that previous to partition the majority of the population of the city consisted of Hindus, Sikhs, etc. as shown in Statement 5-B, most of whom have migrated to India. This serious loss of population was however, far more than replaced by the vast stream of incoming Muslims who in the 1951 Census have classed themselves as Muhajirs (Refugees from India).
This tremendous and rapid development-it nearly all occurred since 1947-is not only due
STATEMENT 5-6
Total
Community
Muslims
Caste Hindu
Scheduled Castes
Christian
Parsi
CHANGE IN REUGIOUS COMPOSITION
Karachi Corporation Area and Civil Cantonments
Persons I (1000's)
1941
365,3
153.3
173.9
11.9
1O.0(b)
3.7
Percent
100
42.0
47.6
3.3
2.7
1.0
1951
Persons I POOO's) (a)1 Percent --_--_.
1,006.4 100
967.5 96.1
4.4 0.4
11.8 1'2
16.7 1.7
5.0 0.5
Jain 3.2 09} Sikhs 4.8 1.3 1.0 0.1
Others 4.6 1.2
(a) Pakistanis only. (b) Indian Christians
to the unique status Karachi has acquired as the capital city of the new State but also to its position as the great port of West Pakistan and the Principal centre of commerce. Karachi now is in the same rank as far as numbers of inhabitents are concerned as Athens, Birmingham, Glasgow, Milan, Melbourne and Montreal. Muhajirs from India now account for more than half the total population of the Federal Capital Area but its growth is not alone due to their arrival. Government servants, business men and skilled workers from all parts of Pakistan have been drawn to the Capital.
5.4 Census Organization.-To conduct the Census operation in the Federal Capital Area the office of the Chief Census Officer Karachi was created with similar duties and responsibilities to those of the Provincial Superintendents of Census. Mr. A.M. Jafri took over the duties of this post on the 29th of August 1950. A certain amount of preparatory work had been done by Mr. Muhammad Hashim Abbasi who was Provincial Superintendent of Census for the Province of Sind, but the many problems which the Census faced on account of the huge and continuing stream of new arrivals mostly living in overcrowded and often temporary housing conditions, presented Mr. Jafri with a series of organizational problems all of which had to be tlolved within the short space of five months. The responsibility of the Municipa.lity had not been made clear and little work had been one. Mr. R.A.F. Howroyd, the Municipal Commissioner, gave the necessary priority to the Census work however, and appointed Mr. M. Sharif, Assistant Engineer (Roads) of the Karachi Municipal Corporation to deal with Census matters within the municipal limits.
The Federal Capital Area was organized into two Census districts. One comprised the Taluka and the Cantonments and was divided into 17 Census Charges, one of which contained the whole Civil Cantonment. The other district comprised the Municipality, Port Trust, Railway and Customs Areas and the Mauripur Salt Area and was split eventually into 44 charges.'
The recruitment of Charges Superintendents was a matter which gave great anxiety and in fact the last of them was not appointed until January 1951. In the meantime Mr. A.M. Jafd -had done a great deal of work in all the charge
areas. He, and the Charge Superintendents as they were secured, cr~ted 324 Circles and 2,202 blocks each with the necessary Circle Supervisors and Block Enumerators.
The required House-listing operation which should have begun in September 1950 prove an almost an impossible task in the conditions prevailing in the City and Civil cantonment. This work was taken over by the Municipality and eventually the house-nwnbering was done as far as was possible in the circumstances but no complete house-list was forthcoming. In the end every enumerator was however provided with a list of the numbered houses in his block and was made responsible for enumerating any intervening houses that might be discovered. The numbering and listing of the temporary huts in refugee camps and colonies presented the greatest difficulty and special concentrated efforts had to be made. This part of the work received much attention and was probably better done than in some less difficult parts of the city.
Much energy and drive were evinced during December and January and eventually the Federal Capital Area succeeded in creating a Census organization and in carrying out the planned instruction of enumerators in time for the official opening of the enumeration period. But it was a dreadful scramble and success was largely due to the energetic support given to Mr. lafri by Mr. Sharif in the Municipal area and to the personal interest taken by the Karachi Administrator, Syed Hashim Raza, and the Municipal Commissioner, Mr. R.A.F. Howroyd. A great deal of public interest was aroused by the very helpful attitude of the press and Radio Pakistan, and the use of the Municipal loudspeaker vans. In the event, enumeration was smoothly and efficiently carried out in the Municipal Corporation area and in the Taluka, but the work in the Civil Cantonment proved difficult and the enumeration there was only completed by great efforts by the Cantonment Executive Officer with the assistance of a number of self-sacrificing enumerators from the Municipal Area who came over to work in the Civil Cantonment after the completion of their regular blocks.
Arrangements were made for the whole of the sorting operation for the Federal Area to be carried out by Powers-Samas Punched card machinery and th!s system proved its worth and
suitability for deliIing ~Ith th~ data for this densfly p~pulateci area. It necessitated the pnncning of the whole bf the data tin special cards, an operation which ocCupied very nearly a year. In the meantime the preliminary figures which were urgently requirea were obtained by Hand sorting in respect of sex, religion, Muhajirs and children.
5.5 Accuracy of the data.-In view of the difficulties of the Enumeration I would hesitate to claim great accuracy for the 1951 Census of Karachi. Owing to the incompleteness of the house-hold lists we calliiot use them, as was intended, as a check on the completeness of the final enumeration. The Enumeration was however, kept under constant inspection during the whole period both by the Charge Superintendents and the Chief Census Officer and also by the Municipal authorities and the office of the Census Commissioner. Public interest in the Census was considerable and arrangements were made through announcements in the press and radio for reports to be made regarding any house'holds which had not been enumerated. These reports were most helpful, they were immediately investigated and enabled the Census officers to discover the areas in which the work was meeting with difficulty. Reports from all Supervisors and the inspecting staff, including those of independent journalists who were invited to take part in the tours of the inspection, show that in tlie Municipal Corporation Area the work was donp fairly thoroughly, and so was it as far as I could see in the refugee colonies encampments. In the Civil Cantonment from whence numerous reports were received of pockets of un-enumeratoo buildings, it transpired that a number of students who had vo'iunteered as Enumerators found that the Census coincided with their examinations and either failed to turn out or scamped tIieir work. Enumerators w.ere switched from other area and all the blocks in wh~ch there was any report of failure were checked.
,My own personal opinion, ~or which ~owever l,haye no statistical bl\~is, is that Karachi a~ a whole was about 90 to 9S percent enumerated i.e. some 85,000 persons may have been omlttedthe bulk of them probably in the Civil Cantonment area, I realize that tl,lis is a serious admission l?ll.t it is wise to face. W~!!t are p~obabl~ th~ r~F,ts. All the big cities, of Pakistan had serious dilllcUlties in organizing the enumeration but I thl.nk
Karaclii had by rat the IHtrttest tMk as thl: housihg conditions throughout the \'(Thole Peder!!l Capital were in a chaotic state at the time of the Census.
The above deals with the quantitative side of the Enumeration. Quality was perhaps better than in many other towns of Pakistan. The training of Enumerators had been dealt with thoroughly and energetically by most of the Charge Superintendents within a few days of the Enumeration period which was probably an advantage. A fair part of the Karachi population is sufficiently well educated and literate to be able to answer the Census questions clearly. On the whole the recording was good although the 'Occupation' questions and particularly that on 'Employment' proved difficult in the Clse of Muhajirs many of whom relied up an casual work. The fact that the Age table stands up to investigation much better in the Federal Capital Area than in other parts bf Pakistan is itself an indication that the quality of the enumeration was not toa bad.
5.6 Composition of the population.-The rapid increase in the number of inhabitants of Karachi city is shown by the figures in Statement 5-A. That statement relates the increases in population with the increases in trade and brings out clearly the big jumps in the size of the city which occurred during each of the two World Wars. The greatest increase, however is shown, in the last decade and is not only due to the increases in the commercial importance of the city but to an even greater degree to its status as the Federal Capital of Pakistan.
Comparing the figures for the communal composition of the popuiation of Karachi as shown jn the 1941 Census and in the Census of 1951, Statement :SoB clearly indicates the great upheaval which has occurred. In 1941 the Muslim community represented only 42 per cent of the population of the Corporation and Civil ¢antonment Areas. The 1951 Census shows the Muslim community at more than 96 percent of the popuiation of the same areas. The Caste Hindus, Sikhs, lains, etc., nave practically disappeared. The small communities of Parsecs, ChristIans and Scheduled-Castes have increas~d their numbers but they form a much sma11er p~oPoFti9l} or' the ~o>~~l Popul~ti~n .• ~he ,fl?ures ~!yen, in Stat~me~t 5-l} ~nd in most of t~e <.?en~~s tables exclude the foreigners resident in the
STATEMENT 5-C.
PROPORTIONS OF MUHAJIRS
Karachi Corporation Area and Civil Cantonment
Economic Status
All Persons
Males
Self-supporting persons ..
Children (a)
Other Dependents
Females
Self-supporting persons ..
Children (a)
Other Dependents
(a) Under 12 years of Age.
Total Muhajirs
-----10,06,416 5,90,753
5,70,397 3,33,242
3,40,580 2,07,640
1,62,048 76,695
67,769 48,907
4,36,019 2,57,511
10,331 3,676
1,53,781 72,871
2,71,907 1,80,964
STATEMENT 5-D.
BIRTHPLACE
I
Federal Capital. Their numbers as enumerated amounted to 4,011 but there is no doubt that the under-enumeration in the Cantonment area affected this particular figure very seriously and it is quite unreliable. Persons enumerated in Federal Capital
A very large proportion of the increase in the population of Karachi is due to the tremendous influx of Muhajirs. Statement 5-C, which is based on Census Tables Nos. 11 and 19C, compares the total population of the City and the Civil Cantonment with the Muhajirs enumerated in those areas, who amounted to nearly 58 percent of the total population. Children, as the Statement shows, represent a smaller proportion of the Muhajirs than they do of the general population of the city.
In the circumstances of the last few years therefore it is obvious that most of the popUlation of Karachi must consist of immigrants, and this is confirmed by Statement 5-D (based on Census Table No. 5) which summarizes the population according to Birthplace. It will be seen that only a little over 27 percent of the inhabitants of Karachi stated they were born in what is now the Federal Capital Area. Even this is probably
Born , Persons
All Places .. 11,22,406
Karachi 3,06,856
West Pakistan 1,50,537
East Pakistan 2,844
Rest of Indo/Pak sub-continent 6,55,811
North-West Zone 2,26,029 Northern Zone 2,00,861 Western Zone 1,51,887 Central Zone 51,065 Eastern Zone 13,755 Southern Zone 11,829
Other Places 6,358
(a) Excluding persons not of Pakistani ship.
87"
Percent
58.7
58.4
61.0
47.3
72.2
59.1
35.6
47.4
66.6
Area(a)
Percent
100
27.3
13.4
0.3
58.4
20.1 17.9 13.5 4.5 1.2 1.1
0.6
Citizen-
88
an overstatement since persons born anywhere in the old undivided Karachi District have probably given 'Karachi' as their birthplace. aver 58 percent of the population of the Federal Capital Area gave a birthplace somewhere in the Indo-/ Pakistan sub-continent beyond the Census limits of Pakistan. It is interesting to note that these include a large number of persons (about 40,000) who did not claim to be Muhajirs. (Incidentally, in comparing Statement SoC with Statement 5-D it should be noted that the latter applies to the whole Federal Capital Area.)
Another point which is brought out by Statement 5-D is the large number of persons (nearly 1,50,500) enumerated in the Federal Capital Area who were born in other partsof West Pakistan. They amount altogether to over 13 percent of the population of the Federal Area, but it is noticeable how few of the inhabitants of Karachi stated that they were born in East Pakistan. The figures in Statement 5-D are illustrated graphically in the map at Fig. 5. 1. As regards the "zones" of the sub-continent it should be noted that they contain some disputed areas, namely Jammu and Kashmir in the North-West zone, Junagadh and Manavadar in the Western zone and Hyderabad State in the Central zone.
5.7 Sex, Age and Marital Stafus:-(a) The preponderance of males which is shown all over Pakistan is accentuated in the cities, and Karachi
is no exception. For comparison the sex ratios of the capital cities are set out below:_
Municipality and Males per thousand Cantonment females
Karachi 1345
Lahore (Punjab) 1290
Dacca (East Bengal) 1650
Hyderabad (Sind) 1212
Peshawar (NWFP) 1436
Quetta (Baluchistan) 1906
The average for Pakistan as a whole including both Urban and Rural areas is 1,128, and for West Pakistan 1,164, males per thousand females. Statement S-E, which compares the sex ratios for past censuses, indicates a fall in the excess of males in most parts of the Federal Capital Area. The Muhajirs seem to have brought a slightly larger proportion of women with them and helped to reduce the sex ratio, except in the Taluka where they have had the opposite effect. The high sex ratio in the military cantonments in 1941 is a reflection of the large numbers of troops then quartered in the area, most of whom were at war establishmeJlt and had no families with them.
STATEMENT 5-E.
S~X RATIO
Male per 100 Females
Federal Capital Area 1931 1941 1951 I Muhajir's
1951
Federal Capital Area, Karachi 141 133 134 132
Karachi Municipal Corporation 141 128 131 130
Civil Cantonment 146 127 129 128
Other Cantonments 339 473 253 200
Rest of Karachi Taluka 116 115 119 180
MAP 1'10.5.1
flGUSSMOW TII~SAlIosor
ptRSONS
ItIRTHPLACE OF THE INH"SITANTS
OF
89
KARACHI FEDERAL CAPITAL AREA
(b) As regards Age, we appear to have rather more reliable information regarding the Federal Capital Area than for other parts of Pakistan. There is some heaping at the tens, especially at 50, but it was felt possible to allow the age- groups to be published in full, vide Census Table No.4. The data.is S);lOwn diagrammatically in Fig. 3.1 (Chapter 3) and a summary giving the figures in percentages by sex for 10 year Age-groups is shown in statement 5-F. The "All-religion" section of this statement can be regarded as applying chiefly to the Muslim community which represents 96 percent of the population. The figure in the age-groups from 20 to 39 are very big, especially on the male side and account for much of the disproportion of the sexes. No doubt
many of the immigrants are in these age-groups. A feature of the age structure is the disparity of the sexes in the figures fot the younger age-groups; 53.7 percent of the females are under 20, but only 44 percent of the males.
For comparison the second part of Statement 5-F gives the figures applicable to the "Other religion" class, which consists of less than 27,000 pers::ms of whom over 20,000 are Christians and about 5,000 are Parsees. These are perhaps rather small numbers from which to draw conclusions, but they represent on the whole a section of Karachi society which has not been so seriously affecte,d by the mov~ments of population and their age-pat_tern is more regular, yet even in these communities the age-group 20-29 is large on the male side, and although the excess of males is less than among the Muslims it is quite a large and the disproportion of the sexes is shown to exist eved among the children under 10 in fact it is quite well marked in the age-group 0-4 years.
A comparison of the figures for Muhajirs given in Table 19-C shows that this element of the Karachi population includes a smaller proportion of children under 12 years of age than is shown Dy the Federal Capital Area as a whole. The 'figures fot that age group (0-12) are 25 % for Muhajirs against 31 % for the total population.
(c) Marital status dafa for the Federal Capi Area. are also shown in Census table No.4 and are summarized in Statement 5-G. The difference between the mare and female pattern is striking. In the age groups over 20 years about 78 per cent of the Muslim women have been married, but for men that is not the case until the groups over the age of 25 years. As is usual. widows form a much bigger element among the older women than widowers do amongst older men. The figures for marriage and for widowhood are both much lower among the Christian and Parsee communities who also show substantial percentages of persons remaining unmarried.
There are no comparable figures for age or marital status available from past Censuses as Karachi was tabulated as a complete District, in which the city was a very small proportion. However, the size and composition of the population of the Federal Area has seen such a complete change that comparison would perhaps be fmitless.
5.8 Language and Literacy in the Federal Capital Area ;--(a) Urdu has been reported as the Mothertongue of 50 percent of inhabitants of Karachi Federal Area. Sindhi is claimed by 14 per cent,
which would include most of the population of the rural Taluka. There is also quite a large number of people in Karachi, 11.4 percent of the total population, who claim Gujrati as their
92
Mother-tongue. These would mostly belong to the business community and especially the Parsees. The detailed statistics on Mother Tongues are shown in Census Table No.7 and are summarized in Statement 5-H.
There is a considerable amount of multilingualism in Karachi. Urdu is understood by nearly 68 percent of the population i.e. by some 18 percent more than the numbers of persons who claim it as their Mother-tongue. 8 per cent of the population, apart from foreigners, claim English as an additional tongue which they commonly speak. A large proportion of the persons to whom Sindhi, Punjabi and Baluchi and possibly Gujrati are mother-tongue would appear to be unable to speak Urdu. No doubt this element is largely represented by women and children, the labouring classes amI fisherfolk.
(b) Statement S-H also shows the numbers of persons who claim to be able to read and write the various languages. A certain number of persons can read without being able to write. These are shown separately in Census table No. 8-A which also indicates the numbu of persons who can read the Holy Quran. The Figures for literacy in Census Table 8 include all
persons who Can read. In table 8-A however we have the numbers of persons able to read, or to read and write, the various main languages of Pakistan and this indicates that a certain number of persons claimed "literacy" on the sole, ground of being able to read the Holy Quran. In Karachi, however, these will not be a large number as most of the persons who can read the Holy Quran can read either Urdu or Sindhi.
The total number of literate Pakistanis in the Federal Capital according to Table 8 is about 3,53,000. Using the figures in Table 8-A these can be estimated to comprise the persons who can read and write Urdu (nearly 2,07,00a) and about two-thirds of the persons who can read and write Sindhi or Gujrati (including among others the whole of Parsi community) as it is likely that the other third of them can also read and write Urdu. The persons who gave their Mother tongues as Bengali or English amounting together to some 11,OaO thus giving an estimated number of people able to read and write of about 2t lakhs. Thts is about 23 percent of the total population of the Federal Capital Area and 26 percent of the population over 5 years of Age. The other 100,000 persons classed as "literate" would apre:lr to be able to read only, and they probably include a large proportion of females.
STATEMENT 5-H.
LANGUAGES
Karachi, Federal Capital Area
I
Languages
: Speaking as Able to Able to 1 ___ Mothe~_on_g_u_e___ Understand Write
Sta1e;ne~i 5-I s~mmarisfs fl~ nfiffi6ers 6f p~~lfns able to read and write ana tor comparative purposes shows the percentage they bear to the tdt~l b~pulation over school age (5 years).
StAi1:MENT 5-1.
LANGUAGES OF LITERACY
Persons able to read and Write
Languages Number
Urdu 2,06,827
Sindhi 15,236
English 95,833
Gujrati 31,302
, Percent of population 5 Years &
Over
21.5
1.6
10.0
3.3
(q) Tabl~ 9 shows the number of pupils and students who were reported in the Census by their ho.usehoids as normally attending school or C91~ge. Ihe t~bl~ ,~,~~~s t~~ percentages of such persons in each age and sex group of each
comlhunity !ilia it ihdic<1t6S that 41 percent bf Muslims ·ooys and 32 percent of Muslim gitls aged 10-11 are receiving some kind of regular education. The figures for the Caste Hindus are much higher and for Scheduled- Castes they are lower, but the Christians and Parsees show rather better percentages. These figures include children attending many unrecognized and privately organized educational enterprises and are much less than the figures given for attendance at educational establishments recognized by the Government educational authorities whose figures are shown in Statement 5-J.
(d) As regards the total amount of full time spent in education and the levels of attainment, reference shou~d be made to Census tables Nos. 9-A and 9-B. Census Table 9-A shows the number of persons who have received or are receiving education. The figures for the schoolgoing ages in Table 9-A are rather fewer than the number of those ages at school according to Table 9 since Table 9-A exclude persons with less than six months schooling. The Total number of person~ in the Federal Capital Area who claimed to have been to school or college for more ~han 6 montl).s is nearly 277,000 i.e. 28.8 percent of the total population of 5 years of age and over.
STATEMENT 5-.1.
SCHOLARS ENROLLED ~ RECOCNIzkn SCHOOLS FEBRUARY 1951
Karachi Federal Capital Area
NOTE: The pppular demand for eg.u,cation has caused many schools to spring up which claim to give some kind of teaching; but which are not officially recognized
'. Recognized Primary Schools
Recognized Secondary Schools
Total Primary & Secondary School students
Total Students Male & Female
All religions
__ '1 ~ ... l
44,318
19,621
63,939
94
Statement 5-K (based on Census Table No. 9B,) shows the various educational levels reported by persons claiming to be literate. Of them 14.5 percent were shown as having been educated upto Matriculation standard or higher and a further 40.4 percent of the literates were reported as having passed primary or middle school but not attained Matriculation standard and the rest 45 % have no formal educational attainments. Table 19.B gives the comparable figures for Muhajir element in the population, and among them the figures are higher, 15.3 percent of literate Muhajirs claimed to have passed Matriculation and a further 45.3 percent have passed a primary or middle but not matriculated, and the rest have not claimed any formal attainments. The influx of Muhajirs therefore would appear to have raised the average level of education in Karachi by on appreciable amount.
5.9 Economic Activities. -The Census figures regarding the Economic activities of the Federal Capital Area are set out in the following tables which appear in Part III of this volume:-
Table 11 Labour Force: An analysis of the whole population according to main Economic categories. Table 19-B gives the same data for Muhajirs separately.
Table II-A Occupations of the Non-Agricultural Labour Force.
12 Economic groups and Industrial status.
13 Economic groups and O.:cupations. Table 19-C gives the same information for Muhajirs separately.
14 The Agricultural Labour Force.
15 Land-owners.
(a) That data for Karachi was collected by the standard procedure used throughout the whole of Pakistan and the definitions and census methods applicable to the Economic characteristics are those explained in Chapter 6. On the whole the enumerators in Karachi presented the economic information with more definiteness than in most other areas, but nevertheless the coding of occupations and Economic groups presented difficult problems of classification especially in the case of unskilled and casual labour, and a great many borderline cases had to be interpreted liberally on commonsense lines or, if that were impossible, put in the 'Unclassified' categories. The difficulty of allocating workers to economic groups was much greater than that of determining
STATEMENT 5--K.
EDUCATIONAL LEVELS
Karachi, Federal Capital Area
Number of Persons I Percent Educational Level
\ Male I Female I Male Female
Total Literates (a) .. .. .. 2,22,815 1,29,959 100 100
Without formal educational attainments .. 85,674 73,389 38.5 56.5
Passed Primary School .. .. 49,705 47,853 22.3 36.8
Passed Middle School .. .. 38,939 6,042 17.5 4.6
Matriculated .. .. .. 35,910 2,050 16.1 1.6
Obtained Degree .. .. . . 12,587 625 5.6 0.5
(a) These represent % of all Male and Female persons of 5 years age and over.
their occupations. All these tables should, on account of these uncertainties, be regarded as reflecting a general picture rather than as being accurate in detail.
(b) Tables 11 for the Total Population, and Table 19-C for the Muhajirs, show the population of the Federal Capital Area in broad economic categories. The figures in Table 19-C for the Muhajirs are of course included in those given in Table 11 for the total population. Statem~nt 5-L presents the data in these tables in the form of percentages of the whole population of the Federal Capital Area. The agricultural element of the population is very small indeed and is naturally mostly found in the rural portion of the area i.e. Karachi Taluka. The number of female earners in the Labour Force is extremely small but this is general throughout Pakistan.
(c) In Table 13 all the Civilan Labour Force is analysed in the various main classes of economic activity and cross-tabulated by types of occupations. A large number of persons had to be placed in the 'Unclassified' category and it will be noticed that this consists almost entirely of unskilled labourers and persons claiming occupations which were described as "service". In fact the 'Unclassified' class probably represents the casual workers who were not able to give any clear indication of their actual employment during January 1951. The existence of this large class of 'Unclassified' workers should, however, be borne in mind in considering the other figures.
The economic divisions with larger numbers of workers are;-
Trade and Commerce 89,000 workers
Domestic and Personal ser-vice, which include the Hotel and catering industry 47,000
Governmental and Municipal Administrative workers, including Police, Fire, etc. Services 66,000
Manufacturing Industries 54,000
"
..
.. The figures for Governmental, etc, service
were not intended to include persons engaged in the Railway, Port, Posts & Telegraphs, Education or Medical Services all of which are tabulated separately, but it is probable that a certain number of persons employed by the Government in these speCialized activities, particularly persons in junior grades, "may have given their Economic group as Governmental service.
As regards the manufacturing industries, a list of the establishments registered under the Factories Act in the year previous to the Census is given in Statement 5-M.
The numbers shown as engaged in building, construction and utilities-which latter includes
STATEMENT 5-L.
ECONOMIC CATEGORIES
Karachi, Federal Capital Area
All Persons I Muhajirs Economic Categories I ---
Total I
Male Female I Total Male I Female I ---,
Population .. 100 57.3 42.7 100 56.8 43.2
Civilian Labour Force .. 33.7 32.8 1.0 35.6 35.0 0.6
Self-supporting persons not in civilian Labour Force .. 1.4 1.4 0.0 0.9 0.9 0.0
Dependents .. 64.8 23.1 41.7 63.5 21.0 42.5
Children Under 12 Years .. 31.3 16.1 15.2 25.1 12.9 12.2 Persons aged 12 years & Over .. 33.5 7.0 26.5 38.5 8.1 30.4
96
quota of the "Unskilled Labourers" and the supply of water, electricity, etc., would have been much greater had they contained their true "service Workers" who for want of information have had to be left unclassified.
(d) Table 12 analyses the Non-Agricultural portion of the Civilian Labour Force in respect of the status of persons within the industries i.e. as employers, employees and as independent workers. Very few persons reported themselves
STATEMENT S.M.
List of Factories in the Federal Capital Area registered under Section 2-J of the
Factories Act for the year 1950.
Type of establishment Number of I Type of establishment Number of or product establishments or product establishments
Wheat flourmiIIs .. ., 10 Aircraft servicing .. .. 3 Biscuit etc. bakeries ., 4 Tinned container factories .. 6 Bone crushing Mills .. ., 3 Salt works ., ., 4 I Electric lamp factory .. 1 Ice Factories .. .' 3 Leather boot and shoe Vegetable oil and Soap mills ., 20 manufacturing .. .. 2 Tobacco Processing ., 14 Rubber goods manufacturing .. 1
Cotton spinning and weaving ., 3 Reinforced concrete pine Wool weaving .. ., 1 making .. . . 4 Lace making ., ., 1 Brick and tile manufacturing .. 4 Hosiery and Knitted goods Coat briquetting .. .. 1
manufacturing .. ., 3 T:read-ball making .. 1 Saw-milling .. . . 3 Cotton ginning and pressing ., 3 I Wood-wrking and furniture Silk weaving and printing .. 2 manufacturing .. . . 4
Industrial chemicals ., J Printing and book binding .. 24 Carbonic and Acetyline gas .. Printing block making .. 2
works ., ., 2 Phamaceutical products ., 1 ,
Total Manufacturing and Aluminium etc. sheet metal ! repairing establishments
works ., ., 3 (including food processing). .. 176 Item smelting and repolling
works ., .. 7 General engineering works;
machinery, automobile and Electric generating and cycle repair shops; General transforming .. .. S metal works .. .. 36 Petrol and Kerosine storage .. 5
Water supply and drainage .. 6 Ship repairing .. .. 6 Railway workshops .. 2 Total "Utilities" installations .. 16
" V~
(Source: Office of the Labour Commissioner, Federal Capital Area, Karachi.)
as "Unpaid Family Helpers" although many persons listed as 'Dependents' in Table 11 undoubtedly assist in the occupations of other members of their families especially in the unskilled classes.
It will be noticed that employees form by far the largest group in the Federal Capital Area but that "Independent workers" are very numerousnearly 81 thousand about a quarter of the total workers in the Non-Agricultural field. This proportion is however, much less than is generally found in the rest of the country, due no doubt to industry, commerce and service work all being far more organized in the Federal Capital than elsewhere, thus making the number of persons operating one man enterprises or doing casual work on a temporary basis (which is what is often meant by the term 'Independent worker') smaller in proportion. Nearly all the females are employees and a little over i of them are in domestic and personal service.
(e) Table ll-A classified Non-Agricultural Labour Force according to Occupations. The more important figures are summarized in Statement 5-N. The upper part of the table !l-A includes nearly all the educated persons the descriptions of whose occupations were fairly clear, but the categories towards the bottom of the table are not as reliable since the information given by the respondents was in many cases indefinite.
97
The table gives an analysis by Age and also by education. These are innovations in the Census which were made possible by the introduction of machine sorting. The figures for Age-groups throw light on the rate at which new recruits are coming into the professional and skilled occupations, but in drawing any such deductions from this first census on these lines it should be remembered that the Labour Force in Karachi has been very largely built up by recent immigrants and it would be unwise to assume that there is yet a coherent Age pattern in the occupational structure.
The figures for education show the clear division that exist between the professional classes and the rest of the working population. The number of matriculates in the classes below serial No. 16 in Table Il-A is very small. Primary and higher education appears to have been received by about half the sales workers; most of the other half are probably hawkers and small peddlers. Only about one in three of the skilled manufacturing workers appear to have passed primary school or higher; the figures for education are better among domestic and other service workers.
The 'Unclassified' category in Tables 12 & 13 contains 7,760 persons who reported themselves as 'Unemployed seeking work'. This figure is, however, regarded as unrealistic; there was great reluctance to admit unemployment and in any event, by definition, the figures for the unemployed only include persons who did no work whatever during the whole of the month of January 1951.
STATEMENT 5-N.
IMPORTANT OCCUPATIONAL GROUPS
Class of Worke!
Total Non-Agricultural Labour Force
Professional & Technical Administrative & Office Sales Workers & Shopkeepers Transport Manufacturing Domestic Servants
Karachi, Federal Capital Area
Other Service Worker including Police etc Un8killed Labourers
Table ll-Labour Force.-showing the whole population according to economic categories.
Table ll-A. Occupations.-showing the non-agricultural portion of the Civilian Labour Force by occupational groups cross-tabulated with Industrial status, Age and Education.
For East BengaI.-A separate section of this table analyses the occupational groups according to main religious groups.
Table ll-B. Occupations of Agricultural Labour Force:
Section t.-analyses the Agricultural portion of the Labour Force by their main occupations; and
Section 2.-gives details of subsidiary occupations reported by agriculturists.
Table 12. Economic groups.-showing the main economic divisions analyzed by Industrial status of the workers.
Table 13. Economic groups and occupations.-showing the workers engaged in each economic division and their main occupational groups.
Table 14. The Agricultural Labour Force.-showing Land Tenure status of cultivators.
Table 15. Land owners.-showing their economic activities.
Table 19-C. Muhajirs in the Labour Force.-showing the same data as table 11 but for Muhajirs only.
Table 19-D. Muhajirs' economic groups and occupations.--showing the same data as table 13, but in respect of Muhajirs only.
6.1. The conception of Occupation, Economic Group and Industrial Status :--In previous Censuses of India, the Economic activities of the working population were dealt with it one table which analyzed "Earners" according to "Means of livelihood". The classification was largely based upon the Industry, Service or other economic activity from which persons derived their income or means of sustenance, although to some extent the classes were sub-divided according to the kind of work which the persons performed. In this first Census of Pakistan the recommendations of the United Nations have been taken into account as far as possible and we have classified the work-
98
ing members of the population according to the three conceptions of Occupation, Industry and Status.
The "occupation" of any person is the kind of work performed. The nature of the business or service in which the work is done is treated separately under the classification of "industry". A clerk, for example, may be employed in a Government office, a mercantile office, a Bank, a retail shop, or in any of- the different branches of the country's economy, but his occupation is still that of a clerk. In view of the rather narrow 'meaning which the word "Industry"
has acquired in this country, however, the classification system uses the word "Economic Group"; associated groups being built up into "Economic Divisions" such as Agriculture, Manufacturing, Domestic service, etc. "Industrial Status" of a person denotes his relationship to other workers in the same organization according to whether he is an Employer, one of the Employees or a man working alone on his own account. A further status classification kno\\n as "Unpaid Family Help" is used to describe persons who contribute to their support by assisting in the work of the family without receiving independent renumeration in cash or kind. This class in previous Censuses was known as "Working Dependents" .
Occupations were classified according to the detailed list given in the Pakistan Classification Code of Occupations which was circulated among the Supervisory Census staff shortly before Enumeration and was used for the instructional classes of Enumerators. The idea of the Economic Groups was explained in the Enumerators' Leaflet which listed the main divisions and gave an indication of the kind of description which was required to enable the records to be classified in accordance with the Standard Industrial Classification Code. Both the occupation and industries Codes were based on the skeleton lists issued by the United Nations but they were amplified so as to conform to the conditions in this country.
6.2 Collection of the data.-The data presented in the series of tables on Economic activities was obtained in answer to the following Census questions:
(a) All persons aged 12 years or over were asked in Question 11 "Are you usually selfsupporting or partly self-supporting or are you seeking work". If the answers to all the three parts of this question were "No", the respondent was classed as "Dependent", and the subsequent questions were omitted.
(b) Persons who answered "Yes" to anyone of the three parts of the above question, were asked in Question II·A "What is your usual main occupation (kind of work)". A symbol was provided to be ringed round whenever the person claimed to be a "cultivator" which was defined as a person who himself tilled the soil or who employed others to do so under his direct personal
99
supervision. In the case of Muhajirs, this question was used to record their main occupation before coming to Pakistan.
(c) Question ll-B asked "Have you any subsidiary means of livelihood, if so, what?". The answer was written in words. As a result of experience in the test enumeration it was arranged that after the qCJestion on subsidiary means of livelihood the enquiry should be made' "Do you receive rent in cash or kind for land which you own, but which is tilled by others?" and a special symbol was provided along with those applicable to Question 14 to be ringed round if the answer was "Yes".
(d) Question 12 asked "What was your actual occupation in January 1951 ?" Persons who replied that they were unemployed throughout that month were asked: "Were you seeking employment and in what occupation 7". The respondent's own words were used to record the kind of work which he claimed to have been doing or seeking in the month previous to the Census.
(e) Question 13 asked: "In what kind of industry, business or service did you work in January?". The answer was required to indicate the Economic Group in which the respondent had exercised the occupation which he reported in answer to question 12. The Enumerators' Instructions gave examples.
(f) Question 14 was addressed only to people who claimed to be cultivators in reply to Question ll-A. They were asked: "Do you own all or part of the land you tiIl? Do you pay rent in cash or kind for land you till? Do you work as a labourer for another person who tills land?". Symbols were provided on the Enumeration Slip to be ringed round in respect of each element of this question to which the respondent answered 'Yes'. In many cases, the respondents answered 'Yes' to more than one part of the question; for example, some cultivators claimed to own part and rent part of the land they tilled.
(g) Question 15 was addressed to all persons who reported an occupation other than cultivation. These were asked: "In your main occupation do you employ others? Or are you an employee? Or are you an independent worker? Or 'an unpaid family helper?". Four symbols were provided on the form, one of which
100
had to be ringed round. Enumerators' Instructions made it clear that employers would not be classed as such merely: by virtue of their employing domestic servants but only if they employed others in their professional business. An independent worker was defined as a person who is his own master in his trade or business but employs no paid help. An un'paid family helper was defined as a member of the family who assisted in the business or trade of the other members but received no separate payment in cash or kind. Persons were only classed as such if they claimed to be self-supporting or partly so in answer to question 11.
6.3 Classification.-The original enumeration slips were sorted by hand in accordance with the Ilbove responses as follows:-
(a) The first step was to separate the slips into three main categories:-
(1) Dependents, (2) Cultivators, and (3) Self-supporting persons other than culti
vators.
Persons who had replied 'No' to all the three parts of question II, i.e., those who were neither self-supporting, partly so nor seeking work, had been marked with a large cross over the whole space occupied by questions 11-15 and were placed in the "Dependents" category. All persons whose slips were marked in question ll-A as being "tillers of the soil" were placed in the 'cultivators' category. All others formed the third class.
(b) The two latter classes were then sorted separately. Cultivators were divided according to land tenure status and non-cultivators s,orted into four categories: first, those who had an agricultural occupation such as Herdsmen, Dairy farmers, etc., and were therefore part of the Agricultural Labour Force; secondly members of the Defence Forces; thirdly persons of no Economic activity whose slips indicated that they were retired persons, students, hospital patients, prisoners, beggars, etc. who had no occupation in January 1951; and fourthly, the remaining slips were classed as belonging to the Non-Agricultural Labour Force. It should be remembered that this sorting of, non-cultivators was confined to slips of persons who had reported that they were
wholly or partly self-supporting or were seeking wOj;k. Persons who reported that in January 1951 they had followed any occupation which ~nabled them to be classed in the Labour Force were classed as such and were not included in the third category as 'Economically Inactive'.
(c) The slips for persons in the Agricultural Labour Force other than cultivators were then sorted by hand according to their actual detailed occupations, and subsidiary occupations. The slips of persons classed as "Economically Inactive" were also sorted by hand into various categories.
(d) The slips of persons in the Non-Agricultural Labour Force were scrutinized in detail, marked with code numbers for Industry, Occupation, Status, Education, etc., and they were then transferred to the machine sorting centres for processing by punched-card methods.
6.4 Classification by machine sorting.-The chief object in introducing punched-card machinery into the abstraction stage of the Census work was to analyse the Non-Agricultural Labour Force into 1ts various occupational and economic groups and to cross-classify these by other characteristics. Such cross tabulations and detailed sub-division would have been almost impossible to do at all, or at least with any accuracy, by hand. The accuracy of punched-card sorting is almost perfect from the mechanical point of view, but cannot in fact be any greater than the accuracy of the information given by the public and recorded by the enumerators.
In Machine-sorting, however, the classification of this information is done by tr,anslating it into terms of numerical codes for punching on the cards. Coding can therefore be consideresl carefully and checked, but it proved to be a mo~t difficult operation. Some enumerators, despite the full instructions given both in writing and in training classes, did not in fact make a proper record of the exact occupations and many failed to comprehend the idea of "Industry", Business or Service". On the whole the reporting of occupations was better than the description of the economic groups (Industries). But both were frequently covered by indefinite words sqch as "Naukri" (Service), "Mazdoor" (Labourer). or "Mulazmat" (employment).
Every effort \V~ made_ by th~ coders to inferpret the returns intelligently anq bring them intQ the appropriate classes in the light of ~ll the information on the slip. The coding work was done in the first place in the Provincial offices. The Manual of Census Procedure Part ur 90ntained instructions i;:l considerable detail as to how the work was to be done and explained lJ1e use of the various codes which covered occupations, economic groups, locations, etc. The manual included a list of typical instances of inadequate responses and indicated code numbers that could be considered appropriate. The list was not exhaustive but together with the general instructions it enabled the staff to understand the work. A conference of Deputy Superintendents of €ensus and their Chief Compilers was held in Karachi and another in Dacca at which the whole work of coding was thoroughly explained, discussed and practised.
When the slips, with the code numbers marked on them in the special places provided, were received in the Machine Centres, they were carefully scrutinized before punching. Much of the coding was reasonably good but there were indications that some coders had scamped their work or had not thoroughly understood it. Such slips were carefully examined by the trained men of the central compiling offices and obvious cases of mis-classification corrected.
Accuracy in the punching operation was capable of more exact control, the data on every slip being generally punched twice, and this was done invariably for the first three months. A second operator carried .out the check punching independently and special machines detected cards on whiCh the two sets of punching were not identi~al. It took much time to establish a high standard of accuracy, but in the latter half of the punching operation it was found possible to reduce the percentage of check-punching and verification for operators whose errors in the previous week proved to be very few. Full <:hecking and verifying procedure continued till thy end on work of all operators who did not achieve the requisite standard, and even for those who had few errors or none at least 10 per cent ()f the work was checked every week.
The machine sorting programme included 1;),
<:omplete system of checks which ensured the <:om~leteness and accuracy of the registered mechanical counting. The procedure required
tOI
intelligent operatQl'S to deal with its compJications but it was followed through under constant supendsion and all readings were required to be verified. The fact that all the operativ.es were temporary hands and cleating with work which was entirely new to them led to delays and difficulties but the work was apparently completed sucxssfully. The compilation of the machine records into the final tables proved to be an immense task most of which fell naturally to be done at the end of the sanctioned period and had to be completed in a short time. Inconsistencies mostJy due to poor coding came to light and had to be resolved on commonsense lines but the cross-tabulation system itself provided certain internal checks which in many cases gave a basis for adjustment.
On the whole the results of the machine tabulation would appear to give a fair general pictl,Jre of the composition of the working popUlation but in detail there are evidences of incorrect classification. The professions and skilled occupations are probably reliable although one must allow for their including difficult borderline cases, but the data for unskilled workers and persons in casual jobs are more doubtful. Speaking generally, the data on occupations are better than the figures for economic groups.
The above may appear somewhat pessimistic but there is no doubt that the time had come when machine sorting had to be introduced into Census work in Pakistan. All the classification difficulties that were met with in machine sorting would have inevitably occurred in hand sorting also, but the possibilities of detection would have been less. A start has been made in introducing modern methods, a good deal of new and detailed information of fair reliability has thereby been obtained, and the ground has been prepared for better results in the future.
6.5 Population in economic categories.-The results of the first Hand-sorting into broad categories is summarized in Census Tijble No. 11 in which the whole population is classified into persons in the Agricultqral and Non-agricultural portions of the Civilian ~bour Force, those not in the Civilian Labour Force, and pependents. The proportions of the total population of each part of Pakistan falling into these various categories are shown in Section 2 of Table 11 in the form of percentages and these are
102
summarized in statement 6-A, which compares the percentage distribution of the economic categories for West Pakistan and East Bengal.
The explanation of the sorting procedure in paragraph 6.3 will have made it clear, that the figures given for the Agricultural Labour Force represent all persons whose usual main occupation was cultivation, plus aU other persons who in January 1951 were engaged in one of the Economic groups classed as Agricultural in the Industrial Classification Code. It was in order to link the reports regarding cultivators to their standing as regards Land-tenure, that their slips were thus classified according to their usual main occupation. All the other Self-supporting persons were classified according to their current activity, with a view to adopting the Labour Force conception of the working population. The NonAgricultural Labour Force, as listed in Table 11, represents therefore all economically active persons who were engaged in January 1951 in work other than Agricultural activities or in the Defence Services.
The accuracy of this classification into broad economic categories is probably fairly reliable
except in the following respects. In the first place very few women reported themselves as being engaged in the work of their families as unpaid help. In fact however, it is known that many women, especially those whose families are engaged in agricultural activities, make a valuable contribution to the work of their households apart from their actual house-wifely tasks. Their classification of dependents must not therefore be taken too strictly. Secondly, all children under 12 years of age were classed as "Dependents". Reporting of age is one of the weak points of the Census owing to the general uncertainly on this matter in the minds of the public, and the age-group 10-11 appears to be over stated, especially in the lower Punjab and in East Bengal. The probability is therefore that a proportion of the persons included in Table 11 as "Dependents" by virtue of their being reported as under 12 years of age may in fact be older. The figures for towns appear to be less inconsistent but caution should be exercised in drawing conclusions regarding the rural areas of East Bengal, Bahawalpur State, and Lahore and Multan division of the Punjab, This point is referred to in the title-sheet of the table.
STATEMENT 6--A
Proportions of Economic Categories in Total Population (Total.Population=l00)
West Pakistan East:Bengal Economic Categories
Male I Female I I Total Total Male Female
Population .. 100 53.9 46.1 100 52.3 47.7
Civilian Labour Force 30.7 29.7 1.0 30.7 28.3 2.4
Agricultural 20.1 19.4 0.7 25.6 23.6 2.0
Non-Agricultural 10.6 10.3 0.3 5.1 4.7 0.4
Self Supporting persons not in Civilian Labour Force 0.9 0.9 0.3 0.2 0.1
Dependents 68.4 23.3 45.1 69.0 23.8 45.2
Children under 12 years 35.8 18.6 17.2 36.3 18.7 17.6
Persons aged 12 years and over 32.6 4.7 27.9 32.7 5.1 27.6
The title-sheet of the table also states the definitions of the various categories and these should be borne in mind carefully when interpreting these statistics.
The figures in Table 11 indicate that in Pakistan as a whole there are approximately 2.2 dependents for every-self-supporting person, but this figure is orle that is particularly affected by the abovementioned doubtfulness of the 10-11 age group. Making a reasonable allowance for this the number of dependents per self-supporting person would be about 2.1. The ratio does not vary seriously between provinces.
The data in Statement 6-A has already been discussed in Chapter 2 in which Fig. No. 2.6 gives a striking illustration of the contrasts between the small size of East Bengal and the vast areas of West Pakistan and also between the two populations, the figures for which are slightly larger in the smaller Eastern wing than they are in the spacious West. The chart in Fig. 2.6 shows the composition of the population according to economic categories and illustrates the percentages shown in Statement 6-A. The outstanding fact is the larger proportion of the Agriciltural Labour Force in East Bengal, where
103
25.6 percent of the population is represented by agriculturists and only 5 % by the rest of the Labour Force. The comparable figures for West Pakistan are 20 percent agricultural and as much as 10.6 percent Non-Agricultural. The female figures are small in both cases although in East Bengal the proportion of the population represented by working women is more than double that of West Pakistan.
Table 19-C gives the same data as Table 11 but in respect of the persons who reported themselves as Muhajirs. These are of course included in Table 11 as part of the population but the differences in their proportions in the economic categories are interesting. These are summarized in Statement 6-B. In West Pakistan the Muhajirs have a smaller proportion of dependents and a larger proportion of workers than the average of the whole population and more than the usual proportion of the workers are engaged in the Non-Agricultural activities. In East Bengal the proportion of the dependents is much the same among Muhajirs as among the rest of the popUlation but there again the proportion of Muhajir workers engaged in Non-Agricultural activities is much above the average.
STATEMENT 6-B
Proportions of Economic Categories among Muhajirs (Total Muhajirs=100)
West Pakistan East Bengal r Economic Categories ----, Total Male Female I Total ; Male I Female
Population 100 54.2 45.8 -:--' 54.6 45.4 I Civilian Labour Force 33.7 33.0 0.7 30.1 29.2 0.9 I
Self Supporting persons not in Civilian Labour Force 0.9 0.9 0.5 0.4 0.1
Dependents 65.4 20.3 45.1 69.4 25.0 44.4
Children under 12 years of age 29.0 15.2 13.8 32.2 16.7 15.5
Persons Aged 12 years and over 36.4 5.1 31.3 37.2 8.3 28.9
104
DISTRIBUTION OF LABOUR FORCE IN WEST PAKISTAN FIa, 6-1
Each dot represents 50,000 persoos
Agricultural Labour Force.
Non-Agricultural Lobour Force •
.-..... e,
"
" "
,
.... ' . -; ....
• ! .
.. ,' .... " ..
. . '.~
100 miles
o
6.6 Geographical Distribution of the Labour Force.-The strength of the Agricultural and Non-Agricultural portions of the Labour Force in each District is illustrated by the maps in Fig. 6.1 for West Pakistan and 6.2 for East Bengal. In these maps a hollow circle represents 50,000 members of the Agricultural Labour Force and a black dot indicates the same number of persons in the Non-Agricultural Labour Force. As will be expected, the more densely populated districts of the country show high~r concentrations of Non-Agricultural workers. This is of course associated with the fact that the NonAgricultural activities are carried on more frequently in towns. Statement 6-C shows the distribution of the total populations of West Pakistan and East Bengal classified according to Economic categories in urban and rural areas. In West Pakistan 40 percent of the Non-Agricultural Labour Force is found in the urban areas, which contain in all 18 per cent of the total population. In East Bengal although the towns contain only 4.3 percent of the population 25 per cent of the Non-Agricultural Labour Force is found in them. The same figures are re-arranged in Statement 6-D showing the percentage distribution of the economic categories in the urban and rural areas respectively. This brings out even more clearly that in East Bengal the Labour Force represents a higher proportion of the urban inhabitants, and the Dependents a much smaller element, than in West Pakistan.
105
Fig. 6-2
DISTRIBUTION OF LABOUR FORCE
IN EAST BENGAL
100 miles
. i
STATEMENT 6-C
Urban and Rural Proportions of Economic Categories
West Pakistan I East Bengal Economic Categories
I I Total I Urban Rural I Total Urban r Rural
Population .. .. \00 18.2 81.8 100 4.3 95.7
Civil Labour Force .. .. 30.7 5.6 25.1 30.7 1.6 29.1
Agricultural .. .. 20.1 1.2 18.9 25.6 0.3 25.3
Non-Agricultural " .. 10.6 4.4 6.2 5.1 1.3 3.8
Self Supporting persons Not in Civilian Labour Force .. 0.9 0.5 0.4 0.3 0.04 0.26
Dependents .. .. 68.4 12.1 56.~ 69.0 2.7 66.3
Children under 12 years of Age .. 35.8 5.9 29.9 36.3 1.3 35.0
Persons Aged 12 years and Over .. 32.6 6.2 26.4 32.7 1.4 31.3
106
STATEMENT 6-D
Economic Categories as Proportions of the Urban and Rural Totals
West Pakistan El Economic Categories
Urban Rural Urb.
Population " 100 100 10
Civil Labour Force 30.6 30.7 37.
Agricultural 6.3 23.1 6.
Non-Agricultural 24.3 7.6 30.
Self Supporting persons not in Civilian Labour Force 2.8 0.5 [1.
Dependents 66.6 68.8 61. 1lI. ...
Children under 12 years 32.7 [36.9 {30.
Persons Aged 12 years and over 33.9 ~. ;
31.9 31.
Statement 6-E shows the total strength of the Labour Force engaged in the main economic divisions in each province. Except for the Federal Capital Area of Karachi, which is not
comparable with the provinces sir almost entirely of the Capital City, urban-type distribution of the L the figures in the Statement show the
STATEMENT 6-E
Geographical Distribution of workers in important Divisions. f}
I Province of West Pakisu
Economic Divisions Total East Total Baluchis- , Karachi N.W.F. I~~ , Pakistan Bengal West tan P. (a) Pakistan & wal. , States
Union
Total Civilian Labour Force 223.9 128.9 95 3.5 3.8 9.7
Agriculture & Fasture 169 106 63 2.6 O.OS 6.6
Forestry .2 0.1 .1 0.0 0.0 0.0
Fishery) 2.1 1.9 .2- 0.04 0.04 0.0
Mining .1 0.02 .09 0.04 0.0 0.01
Manufacturer Building & Utilities 16.2 6.4 9.8 0.4 0.7 0.6
Trade 11.5 S.O 6.S 0.2 0.9 0.4
Transport 3.0 2.0 1.1 O.OS 0.2 0.09
Public Service (b) 6.0 2.7 3.3 0.1 0.7 0.3
Personal Service 6.6 2.0 4.6 0.09 O.S 0.4
Other Activities (c) 9.3 1.6 7.6 0.06 0.7 1.3
(a) Excludes Frontier Regions.
(b) Includes Education, Medical and Post 8< Telegraph Workers as well aa other Government and Muni,
(c) Includes RelIgion, Information, Laws Science, Art, and Forestry Workers.
preponderance of agricultural workers in the economy of Pakistan. 169lakhs out of the total Civilian Labour Force of 224 lakhs in the whole of Pakistan excluding Frontier Regions of N.W.F.P. is engaged in agriculture and pasture. 107 lakhs of these agricultural worker are in East Bengal and nearly 62 lakhs in West Pakistan. The Manufacturing, Building and "Utilities" (Supply of water, electricity, etc.) division has the next largest figures everywhere except in Karachi and Sind. The number of persons employed in Manufacture, etc., is, however, much greater in West Paki.stan than in East Pakistan. The chief concentration is in the Punjab where twice as many persons are employed in Manufacture ctc. as are engaged in Trade. In the Federal Capital area and in Sind there is a definite
107
concentration of workers in trade and commerce while the manufacturing industries afford relatively less employment.
The chief point to be noted from Statement 6-E would, however, appear to be the paucity of labour devoted to manufacturing industries in East Bengal compared with the very large agricultural labour force which, as we have seen already, tends to out-strip its resources in cultivated land. There would appear to be a grave need to divert farm workers there to industrial production.
6.7 Changes in the Economic Distribution of the Labour Force.-Statcment 6-F shows the percentage of the civilian Labour Force engaged
STATEMENT 6-F
Percentage Dstribution of the Labour Force 1931-1951.
East Bengal I West Pakistan Economic Divisions I
1951 1931 I 1951 1931 --'-- --~
Total Civilian Labour Force Lakhs 129 78 95 71
(a) Percent 100 100 100 100
Agriculture (b) 82.6 77.8 66 59.7
Fishery 1.5 1.0 .2 0.3
Mining & Quarying 0.0 .1 0.0
Industry (c) 6.6 7.6 11.5 21.8
! Trade & Commerce 3.9 6.1 6.8 7.5
Public Administration Professions and Arts (d) 2.0 2.6 3.5 4.4
Domestic & Personal Service 1.5 3.5 4.9 3.0
Unclassified 0.8 2.2 7.7 3.6
Notes (a) The 1931 figures for "Lakhs" are the approximate totals of Earners and Working Dependdents, less the Army and economically inactive persons. The figures for Punjab and East Bengal are included on an estimated basis to allow for Partition. The 1951 figures are from Table 12.
(b) Includes cultivation, Pasture and Forestry.
(c) Includes Manufacturing, Building and construction, Utilities (Electricity, Water supply, etc.) Transport (including Railways) and Post and Telecommunications Services.
(d) Includes Education, Medical, Police and Governmental & Municipal services, Religion, Law, Letters and other Professions and Arts.
108
iIJ .each of the main ecoJlOIll(C. divisioqs..\It "§a~ lnd West Pakistan a~p.. comp~~ theQl "Yith figures from the 1931 CeJ;l~us. This comparisC;m is not an easy matter as the classification in the two Censuses is not on quite the same lines but the figures in the statement have been brought on to a fairly comparable basis. There has been an increase in the Labour Force over the last 20 years in both East and West Pakistan but the rise is greatest in the former, and represents a much larger increase than the general growth of the population.
This would seem to indicate that a larger proportion of the population has come into the self-supporting category. In both East and West Pakistan the proportion of the Labour Force employed in agriculture has risen and judging by the changes in the proportion of the Labour Force employed in Non-AgricuJtural activities it would appear that practically the whole of the increase in the Labour Force has gone into agriculture. The proportion represented by the fishing industry in East Bengal has risen from 1 percent to 1.5 percent of the total Labour Force there, but all the other Nonagricultural segments of the economy in both wings of Pakistan provide work for sma\le.t; proportions of the Labour Force than in 1931.
Contrary to expectation this is also true of manufacture and industry generally. Expressed as a proportion of the total Labour Force the workers employed in this s~tor of the economy represent a smaller element in 1951 than they did in 1931. The shortage of the in'dustrial pJ:?portion is partjcularly striking in West Paltdstan. The difference there, however, may be partly due to the increase in the "unclassified" category. In 1951 this category, which includes nearly all the unskilled labourers, is more than twice as large a propo~tion of the total Labour Force than it was in 1931 Census. This may be caused by c,hangea in the, c!~sslfi'f1!.tion po!icll ,b1!.t it ~.l probable that .the same difficulties of classification exi~feJ R~ ,b~th. O~~ipnS a?fi t1i£t .itt: djff~re~ce really repr~sent~ ~ detini~Y,l.r~e. jii \y~~t ~akistall in the proportion of unskilled Labourers and other persons whom it was impossible to allocate to a definite economic division.
6.8 Ind~sirl~i St~~~:-n~t~ ~n inJustii~1 status Ifa~ tf~I1 c6t1ecte'd r'at the fltst titne a'itii is given both in table II-A, which analyses o&ii~a-
t,i~\1 by' statu~ .. and ~ tjotble 12 which analyses fhe economic activities in the same way.
Industrial status is a conception which in Pakistan r~lIy applies to the Non-Agrictiliur~l workers only and all the figures regarding this characteristic are based on that element of the Labour Force. The status of agricultural workers h,as be_en considered separately as a matter relating to their form of land tenure.
As already explained, industrial status refers to the position which the individual worker holds within the industry, business or service in which he works, i.e. the position of an employer, an employee, or a man working on his own without paid help. The persons who help in the support of their household but who receive no independent pay are classed, as regards industrial status, as unpaid family helpers.
Statement 6-G summarizes the total of each class of worker for each province. It will be seen that employers form a very small proportion of the total labour force. Thcy vary between 0.17 percent in the North-West Frontier Province districts to 1.69 percent in East Bengal. In view of the smaller relative size of the total nonAgricultural Labour Force in East Bengal and the fact tHat the employees form a smaller proportion than they do in West PakIstan, this q9mP,llJ;a~ively large proportion of employers would appear to indicate that businesses and industrial concerns generally arc on the average mu<;h smaller in their individual size in East Bengal and tii~t c6n~erris employing a large number of workers are not found frequently.
The class of unpaid family ~elp~r is". also extremely small although the figure for East. Bengal is again the highest i.e. 4 percent of the NonAgricultural Labour Force. The statistics regarding this element of .the working (9.rc~ are l?~o~!l~lr.2.f less, r~liab.l}i!y than.~he othe!",cate&ories of iodustrial status because they depend in the g}]~ pl~.~e oh a s;qpceQtion 0'1" ~~i~k "partly self~uppd'ffin!!" "{~icji, is und~l}.btect:ly a difficult question for uneduc~ted people .to answer. In futu,}~ ~nslwes it \TIi&hi ~e < ~qvi~able to have a clearer definition of this category.
109
STATEMENT 6-G
(Industrial Status Percentages)
Total Non-Agricultural Civilian Labour Force = 100
Province
PakistaJl
East Bengal
West Pakistan ..
Baluchistan
Karachi
N.W.F.P. Districts
Punjab & Bahawalpur
Sind & Khairpur
who claim to operate as "Independent- Workers". Nearly two workers out of every three come into that category except in Baluchistan and Karachi areas account for every small numbers of the labour force. The fact that such large proportions of the workers are dependent on casual employment is a very serious matter, both for them and for the country. It means that in times of depression in business and industry large numbers of men are very vulnerable and immediately feel hardship and distress. It is particularly important therefore to note that in East Bengal 77.7 percent of the skilled craftsmen operating in industry are independent workers and 75.7 percent of the unskilled labourers are in the same position, while in the Punjab the proportions are 81.5 of the skilled and 88.1 percent of the unskilled respectively.
In Sind there is much smaller number of workers in the Non-Agricultural sector than in the foregoing provinces, but it will be noticed that the percentage of employers is higher and also the percentage of employees. The same is true in Baluchistan to an even greater extent although the figures involved are very small and the percentages might be easily changed by fortuitous conditions. In Karachi as one would expect in view of its position as a large port, a great centre
Employers I Employees I Indepen- Unpaid
I dent Family Workers Helpers
.88 34.83 62.54 1.75
1.69 30.58 63.66 4.08
0.34 37.62 61.80 0.23
0.75 64.97 33.55 0.73
0.29 77.99 21.62 0.10
0.17 28.47 70.99 0.37
0.33 29.17 7Q.37 0.13
0.49 43.76 55.20 0.56
of Government and growing industrial area, labour is much more highly organized and the employees represent nearly 4j5th of the labour force and only a little over one-fifth of the workers reported themselves as independent.
This conception of "independent worker" is closely related to the mental conception of respondent who gave as their occupations "Mazdoor", "Mulazmat" or, "Naukri", all of which were favourite descriptions meaning respectively labour, employment or service. It is quite obvious that these simple folk realize very strongly the difference in the status of "Mazdoor" (Labourer) compared with the more envied position of the person engaged in "Naukri" or "Mulazmat" (Service or Employment) who can relay on a regular wage.
6.9 Agriculture and Pasture.-Pakistan is predominantly an agricultural country and the agricultural section of the Labour Force of the country as a whole amounts to three quarters of the total Labour Force. Census Table No. ll-C analyses the agriculturists according to their detailed occupations, but in all provinces almost all the agricultural workers are reported as cultivators, i.e. as actual tillers of the soil.
110
The standard of living of the people of Pakistan as a whole is therefore very largely dependent upon the productivity of the land.
Statement No. 2-1 in chapter 2 shows the relationship which exists between the cultivated land and the density of the rural population. These comparisons are even more striking in Statement 6-H where the number of cultivators is compared with the number of acres of cultivated land in each province.
The size of the average holding in West Pakistan is obviously directly related to the extent of irrigation. In the area in which water is scarce, the population which the land can support is naturally smaller and the average area cultivated per cultivator is proportionately greater.
In East Bengal these considerations of irrigation do not apply and the densely packed population of cultivators have each desperately few acres of land from which to wring a livelihood. The average amount of land per cultivator in East Bengal is 2.0 acres as against an average of 5.4 acres in Western Pakistan. This average figure, however, conceals wide differences between the provinces. Punjab has an average of 5.7 acres per cultivator while Baluchistan has only 5.0 The average figure for Sind is 5.2 but in this province there is a big difference between the Indus valley and the desert portions of the province.
The land tenure status of cultivators is shown in Table 14. It shows the number of persons owning all or part of the land they till and also those who rent their land or work as agricultural labourers. It is noticeable that cultivation throughout Pakistan is largely carried out by peasant proprietors. Statement No. 6-H shows that the persons owning all or part of their land form the major proportion of the cultivators and this is overwhelmingly so in East Bengal. This system if !lnking cultivation with proprietorship, coupled with the traditional system of inheritance under Shariat Law, tends to keep the land in the family and the peasant on the land, but has resulted over the years in the sub-division of agricultural land iuto extremely small holdings as demonstrated by the averages in the last column of statement 6-H. It will be noticed that Sind is by way of bemg au exception to this general tendency. In that Province the bulk of the cultivators rent the land they till and the people who own land which they till themselves are relatively few.
An analysis of land-owners according to their economic activities is given in Census Table No. 15. This Table contains all the persons who reported themselves as cultivators and claimed to own all or part of the land they tilled, and it also contains the persons who reported that they received rent in cash or kind for land they owned which was tilled by others. It is noticeable from the table that the first category namely cultivating land-owners accounts for the vast majority. The
STATEMENT 6-H
LAND WORKERS
Total Percentage CultivatedL and Land
Provinces Workers Land I Landless ~ Total (1) Per (OOO's) Owners Tenants Labourers (1000 I Und % % % Acres) Worker
(Acres) ----
Pakistan 1,65,08 69.0 21.0 10.0 53,314 3.2
East Bengal 1,06,24 76.0 9.7 14.2 21,317 2.0 West Pakistan (2) .. 58,81 56.3 41.4 2.3 32,007 5.4
Baluchistan & States Union 2,29 66.1 21.5 12.4 1,144 5.0 N.-W.F.P. Districts 6,40 66.8 27.8 5.4 2,840 4.4 Punjab & Bahawalpur State 38,65 63.8 35.1 1.1 22,066 5.7 Sind & Khairpur State 11,48 23.5 73.8 2.7 5,957 5.2
(l)-Source:-For Provinces of East Bengal, Punjab & Sind their respective provincial Census Report of 1951-Census & for the figures of Baluchistan & N.W.F.P. the source is Munistry of Agriculture & the data for these two provinces respectively refers to the years 1947-48 & 1949-50.
(2)-Excluding Karachi.
non-cultivating land-owners are a relatively small element of the population and amount on the average to less than two percent of the landowners. The table shows that most of the persons in this 2 percent are, however, fulfilling important economic functions in the country. This is to be expected since they are able to afford education and also probably provide the chief source of investment in the private sector of the economy. The table shows that they form a substantial element in the defence services amounting to some 26 thousand persons and that manufacturing, trade, commerce, Government service, and the professions are reported as their economic groups by no fewer than 130 thousand landowners. Those who did not claim to be following an active occupation amounted, in the whole of Pakistan, to only 55,000 persons which is less than one-half of one percent of the total number of landowners and represents an extremely small minority of the self-supporting persons. It is noticeable that almost half of these inactive landowners (24,600) are found in Sind in which Province, as has been noticed above, cultivation is largely carried out by tenant farmers.
The agriculturists who did not claim to be cultivators are nearly all engaged in pastoral activities and are included in the occupational class "Herdsmen and Animal breeders". This class represents a very small fraction of the agricultural labour force in East Bengal and only about 3 percent in the Punjab and Sind but in Baluchistan this class amounts to nearly 12 per cent of the Agriculturists. In N-W.F.P. the figure for Herdsmen is very small, probably because persons engaged in pastoral activities do so mainly as an adjunct to cultivation. The rest of the Agricultural Labour Force follow a number of minor occupations connected with husbandry. They include the tea plantation labourers in East Bengal and a number of orchard and nursary men, malis (gradeners), poultry keepers, beekeepers, etc., in many provinces. These figures for minor agricultural workers are probably rather unreliable since the occupations to which they refer are largely followed by cultivators as an adjunct to their normal farm work and are not regarded as a main. or even a subsidiary. occupation.
A great many agriculturists, however, follow subsidiary occupations of a non-agricultural kind and often of a seasonal nature. This Census
111
asked a question on this subject and results are tabulated in Section 2 of Table lI-C. The largest number cf agriculturists who claim subsidiary occupations reported themselves as being, in addition to agriculturists, shop-keepers or general labourers. Quite a considerable number, however, reported manufacturing crafts as subsidiary work, chiefly in the form of weaving and spinning. It is probable that the subsidiary occupations reported by many cultivators are in fact their main occupations, but, as they own a little land, they have for reasons of prestige given cultivation as their usual main occupation.
6.10 Fishery.-Despite the fact that both the East and West Pakistan are maritime countries with considerable sea-coast and that both of them have large rivers well stocked with fish, the fislling industry cannot be said to be highly developed. The total number of persons engaged in it is 2,08,000 of which 1,89,000 are in East Bengal and 19,000 in West PakIstan, amounting to about 9 per cent and about 0.06 per cent respectively of the non-agricultural labour force in the two wings.
'The non-maritime provinces report very small numbers of persons engaged in river fishing as will be seen from Census table No. ll-A although the Provincial Superintendent of Census, Sind, in his report mentions that fish is an important item in the diet of the people of that province.
As will be seen, however, from the figures in the tables it is in East Bengal that the fishing industry engages a significant proportion of the working population and in that province it is undoubtedly a major factor in meeting the food requirements of the people. The next largest proportion of fisher folk is found in Mekran Swte which has an extensive coast-line on the Arabian Sea. There is, however, no indication in the Census reports of any organized industry for curing, canning or otherwise preserving fish products or for effecting any more than a purely local distribution. Census tables indicate that this is a field in which development might well be considered.
6.11 Distribution of occupations in Economic groups.-One of the objectives of the system used in this Census was the attempt to provide a cross-
112
tabulation of occupations with economic activities and thereby to disclose in some ,detail the distribution pattern of the 'labour force. Table 13 summarizes the results of this endeavour, but this first attempt cannot be claimed to provide really exhaustive information, chiefly owing to the lack of understanding by both the public and the enumerators of the importance of gathering clear information on both occupation and economic activities. In many cases these were properly recorded and the deployment of the more educated part of the labour force is probably fairly realistically portrayed in this table, but the very large element represented by unskilled labour has had to be left in the "Unclassified" category whereas the object of the enquiry was to show the distribution of such workers among the economic divisions. In East Bengal, classification appears to have been rather more successful and the distribution of unskilled labour generally follows a clearer pattern than in the tables for West Pakistan.
However, Table 13 succeeds in indicating in most provinces the size of the technical and directing staff, and the number of workers employed in offices, compared with the numbers of skilled operatives. The table should be studied carefully and reference should be made to the composition of the groups of occupations. These are shown in more detail in Table ll-A and listed completely in the numerical "Code of Occupations", copies of which are obtainable from the Government of Pakistan.
6.12 Unskilled \abour.-A feature of Table ll-A is the large number of persons in all the provinces who have been reported in the category of "Unskilled labourers". They amount to 12 lakhs of persons equal to 22.4 per cent of the non-agricultural labour force and together with the totals of landless agricultural labourers this class of workers represents 12.9 per cent of the whole labour force of Pakistan excluding Frontier Regions of N.W.F.P.
For the most part the Census information did not permit classification of this labour according to the economic activity in which It was engaged. This defect in definition of the true employment of the unskilled labour force is no doubt connected with the fact that on the whole they are uneducated and are unable to describe the work which they were doing in the month
preceding the Census. Until it is possible to obtain more definite information on this subject,
. the figures for the economic activitles shown in Tables 12 and 13 are in some respects unrealistic, since nearly all sections of the economy of the
" country employ in addition to the persons shown against them in those tables a large number of unskilled labourers which has had to be included in the unclassified category.
Table ll-A shows that 77.9 per cent of the unskilled labourers have reported their industrial status as being that of independent workers. In other words they rely on casual jobs and have no regular employer. Hence they are wage earns and should have more appropriately been classed with employees. The proportion of female workers in the unskilled labour class is 5.7 per cent which is higher than among the skilled workers outside the textile occupations. This would seem to indicate that the men engaged in general casual labour are more often assisted by their women folk than is the case with men following most of the skilled occupations.
6.13 Distribution of main occupational classes.The figures in Table ll-A have been summarised for comparison in the form of percentages in Statement 6-1. The technical, professional, and administrative workers form about the same proportion of the total Labour Force in all the provinces varying between a little over 9 per cent in the North-West Frontier Districts up to over 15 per cent. in East Bengal. In Karachi, however, as is natural in view of its governmental, commercial and industrial importance, this element represents a much larger segment and accounts for 22 per cent of the total workers.
Sales workers also form a high percentage of the population in Karachi but not as high as in Sind and East Bengal. [n the latter province nearly a quarter of the Labour Force reported occupations in this group. This may be due to more careful description of the occupations since it is coupled with a low figure for unskilled labourers.
Skilled craftsmen also form a larger section of the non-Agricultural workers in East Bengal than in West Pakistan but it must be remembered that the whole Non-Agricultural Labour Force represents a smaller proportion of the total number
113
STATEMENT 6-1
Percentage Distribution of main Occupational Oasses.
Total Non-Agricultural Civilian Labour Force = 100
I Technical I Sales Skilled Unskilled Service Others Forestry Pro- I Workers ' Craftmen Labou- Workers &
fessional ; I rers Fishery Provinces I Adminis- I
I I trative i & , !
Oerical I I Workers
----I
Pakistan 13.43 18.72 27.92 22.40 13.54 .05 3.93
East Bengal 15.18 23.14 28.09 14.17 10.31 .10 9.00
West Pakistan 12.28 15.83 27.80 27.78 15.65 .02 .62
Baluchistan & States Union 12.73 15.91 24.09 24.52 18.98 .02 3.76
Sind & Khairpur 12.89 21.74 21.54 28.41 13.06 .08 2.27
1. Forestry and Fishery were classed in A.L.F.
of workers in that province than it does in West Pakistan.
Textile workers as a general rule, account for much larger numbers of craftsmen than any other group of skilled occupations. They amount to 41.4 per cent of the skilled manufacturing workers in East Bengal, 37.1 per cent in the Punjab, and 24.8 per cent in the rest of West Pakistan. The Cottage Industries Enquiry also show a great preponderance of textile enterprises and so does Table ll-C.2 which records the subsidiary occupations reported by agricultural workers. It is noticeable that most textile workers report their industrial status as "Independent workers" thus indicating that the textile industry is largely organized on a family basis. Industrialization in the form of textile mills does not appear to account for more than about one-third of the textile workers in East Bengal and one-fifth of those in the Punjab. This is a point which it might be worth while to examine with care to
ensure that the handworking element is guided into suitable products so that the development of textile mills does not create serious unemployment problems among the workers in textile handicrafts.
Workers in wood, cane, etc. form the next largest groups in East Bengal but in the Punjab they are not as large as the leather workers. The third largest group throughout All-Pakistan is represented by metal working trades.
The number of females reported in the manufacturing occupations is surprisingly low but a majority of those who have reported themselves are textile workers and in East Bengal another large contingent of them claimed to be wood workers which in the case of females WOuld mean cane workers and basket makers.
6.14 Education in the Labour Force.-A further innovation in the Census of 1951 is an attempt
114
to classify the working people according to their degree of education. This classification has been made only in respect of the non-Agricultural workers, but a comparison of the education figures for the non-Agricultural labour force in Table ll-A with those given for the total population in Table 9-B shows, as would be expected, that educated persons tend to gravitate away from agriculture. This is true not only of the persons who have attained sufficient educational qualifications to enter professions, offices, etc., but also applies to primary education.
Even so, the numbers of persons who have received a full primary education is very small in all occupations outside the professional and administrative fields. In East Bengal only 41.8 per cent of the sales-workers and shopkeepers have primary education or better, and 25.8 per cent of the skilled labourers. Similar figures for the Punjab are 47.9 and 19.4 per cent. One would expect a low proportion among the salesworkers since they include a large number of hawkers and pedlars who are likely to be little better educated than the landworkers, but the shortage of even primary education among skilled labourers in industry is a serious matter. Their skill is of course largely a matter of practice and experience in their particular trade but the advance of Pakistan's industrial development will undoubtedly require a higher standard of education among skilled operatives specially in such trades as metal workers, printers and electrIcians. In fact to take advantage of modern practice in their trades matriculation standard would appear to be a minimum goal.
In Table ll-A the educated professions and trades are at the top of the list the lower half of which contains for the most part occupations which require less educated persons. A corollary of this is that the occupations stated in the lower half of this table are less accurately reported than those in the upper half, except possibly in such .::ategories as railway-workers, police, etc. The ligures probably give a reasonable general picture but should not be relied upon in great detail.
It is noticeable that the unskilled labourers are practically without education at all; that is probably why they are unable to describe their occupation or economic group.
6.15 Unemployed persons.-An attempt was made in the enumeration to collect information
regarding unemployed persons as residual data arising from question 12. This asked "What was your actual occupation in the month of January 1951"1 Persons who replied that they were not working throughout the whole of January 1951 were asked "Were you seeking employment"? In what occupation? How many months had you been unemployed and seeking work at the end of January?"
These enquiries were, however, unsuccessful. Only 1,31,484 agriculturists and other workers in the whole of Pakistan reported themselves as having been unemployed throughout the whole month of January, 1951. These figures are obviously far too small and do not represent reality: to use them even as a standard of measurement will lead to quite wrong conclusions.
The reasons tor the unreality of these responses, apart from the fact that they exclude all persons who did any work whatever during the whole month of January 1951, are firstly, that many enumerators appear to have failed altogether to record the answers to the question of unemployment. Secondly, cultivators do not regard themselves as unemployed if their families own land and they are maintained by the general activities of the household. Among cultivators, therefore, only landless labourers are therefore likely to report themselves as unemployed. Thirdly. among non-agriculturists there was evidence of considerable reluctance to admit unemployment and in the case of independent workers on their own account, a category which represents a considerable proportion of skilled and unskilled labour, the whole conception of unemployment is indefinite. Moreover, persons s~eking work in Industry, business or service regard themselves, not as unemployed but as still engaged in the general work of their family particularly if the family owns or rents land. Lastly, the Census questions on unemployment were rather complicated and were probably properly handled by only the more intelligent and better trained enumerators. In view of these considerations the unemployment data has not been tabulated in detail, and such persons as were reported to be unemployed have been included in the unclassified category, but valuable experience has been gained. Now that the difficulties in the conception of unemployment have been located it should be possible to design a clear definition for the next Census.
6.16 Further research.-The Census tables in this volume cover a good deal of new ground and involve new conceptions. It is hoped that they will form "bench-marks" from which current statistics may be measured. The economic situation in Pakistan is changing very rapidly, however, and the census data on the distribution of man-power will no doubt in many ways be outqf-date by the time this report is issued. Revision of the information by intercensal field enquiries might well prove of great value therefore, and it is strongly recommended that surveys in this field should be carried out more frequently than once every 10 years. It is intended to amplify some of the tables in this volume dealing with economic characteristics and in particular Tables ll-A and 12, by issuing figures for each district in a separate volume. These detailed tables will,
115
it is hoped, enable locally collected current statistics to be related to the Census figures. An important point is, therefore, to arrange that as far as possible the same basic ideas and classifications are used in current statistics as have been adopted for the census. With this aim in view, the census classifications were fully discussed by inter-departmental committees in Karachi before they were adopted as a basis of Census enumeration and classification. They will undoubtedly need improvement in the light of changing circumstances and in view of the experience gained in the census. But the conceptions we have used are well-tried ideas based on world-wide practice and the recommendations of United Nations. They should, therefore, prove capable of adjustment to meet the changing needs of Pakistan from time to time.
TAJln No.
1 I-A 2 3 4 4-A
5 6 7 7-A 8 8-A
9 9-A. 9-B 10 10-A 10-B
11 ll-A Il-A It-B.l ll-B.2 12
13
14 15 19-A t9;B 19-C 19-D
PART II LIST OF TABLES
Population Cities of Pakistan Towns and Cities Variation Age and Marital Status Orphans
Birthplace Religions Mother Tounge Speech Literacy Language of Literacy
Pupils & Students Years of Education Educational Levels Non-Pakistanis Afghan Powindah~ . Pakistanis Abroa<r-. :
Labour Force
SUBll!CT
Occupations Non-Agricultural Labour Force Sec. 2-0ccupation of Civilian Labour Force-East Bengal Occupations of Agricultural Labour Force Subsidiary OCCllpations of Agricultural Labour Force Economic Group & Industrial of Non-Agricultural Civilian Labour Force
Economic Group & Occupations of Civilian Labour Force
Agricultural Labour Force & Cultivatiors Land Tenure Land Owners Muhajir's Origion Muhajir's Educational Levels Muhajirs in the Labour Force Economic Group & Occupation of Muha,iirs
PAOB No.
1-1 1-4 2-1 3-1 4-1
4-18
5-1 ~1
7-1 7-5 8-1 8:""5
9-1 9-6
9-20 10-1 10-3 10-9
11-1 11-7
11-9 A '11-10
11-13 12-1
13-1
14-1 15-1 19-1 19-4 19-6
19-10
TABLE l-ROPULATION
This Table presents an analysis of the distribution of population in urban and rural areas, area in square miles artd persons per square mile. The total, urban and rural population have also been shown by sex. Non-Pakistanis are included in this Table. Urban area consists of continuously built up localities with a population of 5,000 or over and all municipalitieslirrespective of population.
2. Complete lists of urban areas have been given in respective provincial reports. Table I-A, lists all the cities with a population of 100,000 and over.
3. The figures for area have been obtained from the Surveyor General of Pakistan except for East Bengal where ;lrea figures (exclusive of large water areas) have been obtained from the Director of Land Records East Bengal. The Area of Sind and Khairpur State wa,~ 54,186 Square Miles according to the last Census Report, now it is 56, 447 Square Miles. This change is due to the separation of Karachi Fedcral Capital Area from, and addition of Rana Area to the Province of Sind.
4. Changes since the last Census have also occured in the Partition affected provinces or East Bengal and the Punjab. Out of 77,442 square miles of undivided Bengal, an area of 49,259 square miles ",as included in the East Bengal, to which was added 4,882 square miles from the Sylhet District of Assam. Similarly out of a total area of 99,089 square miles of undivided Punjab 62,245 square miles are included in this Province. This is in addition to the area of Bahawatpur State. More details of these changes are given in the respective Provincial Reports.
5. The Census taken in the Frontier Regions of North West Frontier is comprised partly of Estimated figures. Out of 26,47,158 only 8,87,226 were enumerated while 17,59,932 were estimated. Further details are given i,n Volume 4 of the Report for NWFP.
6. This Table has been discmsed in Chapter 2 of the Report.
1-1
1-2
Provinces and States
TABLE 1-POPULATION
I Area Z
Sq. Mile I I
Number of Persons.
Total Population (1000's 3 I Persons ------------. per
This Table gives the list of cities with area in square miles, total population by sex and approximate number of persons per square mile. Cities 'are defined as urban areas with a population of 1,00,000 or over. Quetta, although not fulfilling this requisite, is treated as a city being the capital of the Province of Baluchistan.
2. Table I-A in provincial report' ~ives by districts a complete list of areas classed as Urban.
3. Persons claiming nationalities other ,than Pakistani are included in this Table.
4. This Table is discussed in Chapter~2 of Part I of the Report.
I
I-S
TABLE l-A-CrrffiS OF PAKISTAN
J
Capitals of Provinces and other Cities of 1,00,000 and over inhabitants
'Province / I Approxi- Population (1000's) Persons Name of matel
NOTES: 1. The area figures refer to the official Municipal limits, plus cantonments, etc. and may include considerable non-built-up,.areas.
2.
3.
4.
5.
Includes Municipality ~nd Civil Cantonment.
Includes Cantonment
Includes Narayanganj Municipality and environs.
Includes environs of Chittagong.
~-l
TABLE 2-TOWNS AND CITIES
In this Table Cities and Towns are listed in order of size of population and are grouped in four classes I'iz:-
Class I -1,00,000 or over inhabitants.
" II -25,000 and under 1,00,000.
" III -10,000 and under 25,000.
" IV -5,000 and under 10,000.
These classes correspond with the classes recommended by the PopUlation Commission of United Nations, but differ from the classes used in previous censuses of India. In Pakistan, there are eleven cities in Class I, and 41 towns in class II. Similar particulars of which have been given separately. Detailed lists of towns in the other twa classes are given in. the respective provincial reports.
2. For Census purposes a town is defined as an urban area consisting of a continuous collection of houses inhabited by not less than 5,000 persons.
3. The population figures of cantonments have been amalgamated in this table with those of the cities and towns adjacent to which they are situated. Separate figures for cantonments have been shown in Table I-A.
4. The population figures include persons of Pakistani citizenship only and do not therefore agree with the numbers shown in Table I-A. They agree, howev.er, with Table 6.
5. Figures for Muslims shown in this Table include the number of Muhajirs which are also shown separately in the last 'column.
6. All cities and towns listed in Class I and Class II have municipalities except some which have cantonment boards in addition and are as such. Nowshera Kalan in NWFP has a Notified Area Committee and Parhatipur in East Bengal has Union Board. The source of the information regarding the form of local-self government authorized for each city and town is the appropriate department of the Province or State.
7. This Table has been discussed in Chapter 2 of Part I of the Census Report.
2-2
TABLE 2-TOWNS AND CmES
Section 1- Urban Areas by order of size of Population
Number of Persons.
Religions ------I,
Provinces Total! Other Muhajirs Muslim 2 I Caste Scheduled
State 17,43,817 16,94,707 395 2,034 46,681 7,87,316 Sind & Khairpur State 2,41,801 2,34,597 2,501 4,360 343 1,59,805
Class Il-25,000 and Under 1,00,000
Total 18,74,501 16,64,069 1,37,354 52,329 20,749 5,75,282 Baluchistan & States Union 83,892 79,784 144 560 3,404 18,912 East Bengal 6,44,237 4,62,375 1,29,712 46,497 5,653 93,987 Federal Capital Area.
Karachi North-West Frontier
Province 2,54,174 2,51,502 84 1,153 1,435 18,655 Punjab & BahawaJpur
6,51,418 State 6,61,977 22 495 JO,042 3,27,692 Sind & Khairpur State 2,30,221 2,18,990 7,392 3,624 215 1,16,036
Class ill-IO,OOO and under 25,000
Total 11,14,443 9,75,289 93,933 34,335 10,886 3,85,655 Baluchistan & States Union 11,836 11,104 567 82 83 2,451 East Bengal 3,25,403 2,09,741 83,641 30,442 1,579 25,203 Federal Capital Area,
Karachi North-West Frontier
Province 22,337 22,337 Punjab & Bahawalpur
794 State 6,12,561 6,02,636 48 9,083 2,98,551 Sind & Khairpur State 1,42,306 1,29,471 9,677 3,017 141 59,450
Class IV-5,000 and under 10,000
Total 7,01,667 6,35,983 39,634 16,586 9,464 1,87,805 Baluchistan & States Union 19,080 18,642 197 58 183 736 East Bengal 1,30,004 84,339 Federal Capital Area,
Karachi
31,004 12,785 1,876 10,837
North-West Frontier Province 70,931 70,467 116 348 4,159
Punjab & Bahawalpur State 4,08,551 4,01,270 52 177 7,052 1,58,272
Sind & Khairpur State 73,101 61,265 8,381 3,450 5 13,801
NOTES:-I. Excluding persons claiming Nationalities other than Pakistani.
2. Includes figures for Muhajirs which are also shown separately in the lqst column.
2-3
TABLE 2-TOW"lS AND CITIES
Section 2-Class J Towns with population 1,00,000 and over
Number of Persons
I Religions Province Total 1 ------------------1 in which I Population, M slims 2 <?aste Scheduled Other I Muhajirs
NOTE:-l. Excluding persons claiming :-.lationalities other than Pakistani. 2. Includes figures for Muhajirs which are also shown separately in the last column.
TABLE 3-VARIATION
This Table shows the changes since 1901 by Provinces and States in the population of the area that now forms Pakistan. It shows 3 figures, two of these one be10w the other, represent first, the total population in the census year, and second shows the decennial variation of population in total number and the third in the next columns shows the increase or decrease expressed as a percentage of the population at the previous censuses.
2. The figures for the years 1901~ -1941 shown in this Table are taken from the Census Reports of the past decade but in view of the partition of the IndoPakistan sub:continent adjustments in population corresponding to the changes in the areas of East Bengal, Punjab, Sind and Karachi have been made. These changes are given in detail in the respective Provincial Reports and are summarised in the title sheets of Table 1.
3. This Table is discussed in the Chapter 2 of the Report.
3-1
3-2
TABLE 3-VARIATIQN
Decinial Changes in Population since-1901
Number of Persons.
I Total populationl and variation2 in Number and percent '/
NOTE: 1. Adjusted to apply to present boundaries wherevet; necessary \
2. Yariations are shown in Italics (-) minus sigq denotes Imcrease.
decrease: no sign denotes
3. \n 1901, the Frontier Regions of N.W.F,P were not covered by the Census 1901. totals nd 1911 variation for Pakistan exclude the population of these region.
I
TABLE 3-VARIATION
Decinlal Changes in Population since-1901
I {
3-3
Number of Persons.
Total populationl and variatiou2 in Number and percent
18.2 14.3 12.4 Khairpur State 2,27,183' v 3,05,787 _, 3,19,543
34,052 78,604 13,756 17.6 34.6 4.5
TABLE 4-AGE AND MARITAL STATUS
This Table shows the distribution of population of each sex according to broad age-groups and marital status. It is repeated for each main religious group.
2. The data about age and marital status have been collected from the answers to question No. 2 of the enumeration slip which provided two columns headed 'Years' and 'Months' for age and one more column with letters "M", "S", "W" and "D" for the marital status. The age of infants under one year was to be recorded in the column headed 'Months' and of all others in completed years in the column headed 'Years'. The whole information about marital status is strictly in accordance with the replies given by the respondents to the simple question whether he/she was single, married, widowed or divorced; the information about age has been partly supplied by the respondents who know their age and has partly been recorded by the emunerators after reminding the respondents about the dates of importants events of the locality and calculating their age according to the statements made by them.
3. Analysis has indicated that the reporting is not sufficiently accurate to justify the presentation of the data in small age-groups and the broad categories shown in this Table appear to b<l the smallest which can be regarded as reasonably reliable. In provinces of Sind and Baluchistan the data is reasonably reliable even in ten year age groups and hence the provincial reports for these provinces give the data in these age groups. In Karachi the data is reliable in five year age groups, which is given in part III of this volume.
4. Besides, the age-grouping shown in this table differs from that shown in the past Census Tables in as much as that the number of year at the end of each group has not been repeated at the b<!ginning of the next group.
5. Since the Table excludes non-Pakistanis, its figures may not tally with those in Table 1.
6. The question of accuracy and the analysis of the data is discussed in Chapter 2 of the Report.
4---1
4-2
TABI4E 4--AGE AND MARITAL STATUS PAKISTAN
Total popul:ttion according to Broad age groups and Marital Status
60 & Over 2,61,093 1,48,974 1,12,119 1,05,528 35,764 10
Caste Hindus
Total 1,41,387 78,996 62,391 30,471 27,999 11
0-9 38,823 20,076 18,747 31 63 12
10-39 70,165 40,105 30,060 17,759 21,470 13
40-59 23,466 13,862 9,604 9,797 5,713 14
60 & Over 8,933 4,953 3,980 2,884 753 15
Sched,uled Castes
Total 3,23,120 1,73,596 1,49,524 65,210 64,251 16
0-9 1,08,245 55,014 53,231 58 116 17
10-39 1,60.}93 88,474 71,719 40,523 5(),478 18
40-59 40,807 22,389 18,418 19,124 11,953 19
60 & Over 13,875 7,719 6,156 5,505 1,704 20
Other Religions
Total 2,884 1,560 1,324 534 577 21
0-9 919 494 425 22
10-39 1,483 808 675 337 401 23
40-59 367 197 170 158 139 24
60 & Over 115 61 54 39 37 25
TABLE 4-AGE AND MARITAL STATUS Sind including Kbairpur State
4-17
Total Population according to Broad Age Groups and Marital Status
Number of Persons.
Never Married I Widowed /' Divorced Age Groups -----<----- ------1 (in years)
Male I_ Female __ M_a_le __ I_ Female __ M_a_le __ I __ Fe_m_a_l_e _' __ -__ -1
1 14,86,741
2 7,34,579
3 7,19,725
4 26,466
5 5,971
6 13,41,181
7 6,59,084
8 6,52,434
9 24,230
10 5,433
11
12
13
14
15
16
17
18
19
20
21
22
23
24
25
43,131
20,045
21,284
1,452
350
1,01,473
54,956
45,558
774
185
956
494
449
10
3
9,55,599
6,83,852
2,67,824
2,657
1,266
8,57,918
6,11,629
2,42,505
2,549
1,235
25,787
18,684
7,047
38
18
71,200
53,114
18,011
64
11
694
425
261
6
2
All Religions
1,35,019
14
40,573
52,774
41,658
1,22,707
14
37,134
47,658
37,901
5,379
1,053
2,608
1,718
6,867
2,365
2,481
2,021
66
21
27
18
2,08,564
51
36,859
88,981
82,673
Muslims
1,85,920
50
32,148
78,712
75,010
Caste Hindus
8,580
1,523
3,849
3,208
Scheduled Castes
14,011
1
3,175
6,395
4,440
Otber Religions
53
13
25
15
1,471
916
433
122
1,406
878
416
112
15
9
5
I
46
28
10
8
4
1
2
I
1,719
1,165
442
112
1,632
1,090
432
110
25
20
4
1
62
55
6
I
Total
0-9
10-39
40-59
60 & Over
Total
0--9
10-39
40--59
60 & Over
Total
0-9
10-39
40-59
60 & Over
Total
0--9
10-39
40-59
60 & Over
Total
0--9
10-39
40-59
60 & O'-er
4-18
TABLE 4-A-ORPHANS
This table gives information by religion, sex and Age about the children under 12 years of age whose father were reported to have died before February 1951.
This table is in two sections:-
Section 1 shows the number of orphans by Provinces and States and by religion.
Section 2 gives the same information by Age and sex seperately.
The information regarding orphans was collected while recording age data in reply to Census question 2. For children reported to be under 12 years the respondent was asked to state if the child's father was living.
The original slips were sorted in accordance with the marks so put on them and counted to produce the statistics shown in this table.
This Table has been discussed in chapter 3 of the Report.
4-19
TABLE ~ORPHANS.
Section I-Orphans by Religion and Sex.
Children under 11 years of age whose father. had died.
(Figures in italics denote the number of females included in the fiGures immediately ahove them).
Number of persons.
I Muslims Caste Scheduled
Province &. State Total1 -- --- -~ ~ --- Hindu~ Caste Others Total Muhajirs i Other
NOTE 1, Exeludes children clainling nationalities. other tnan Paki~tani.
TABLE 5-BffiTHPLACE
This Table shows the popUlation (excluding non-Pakistanis) analysed according to Birthplace and place of enumeration. The Table is divided into 2 sections, i.e:
Section 1; Total population of Pakistan according to place of birth.
Section 2: Persons born in Indo-Pak. sub-continent beyond the areas in which the First Census of Pakistan was conducted.
2. Along the stub the names of places of birth are arranged in broad geographical divisions, within each of which the different districts, Provinces and countries are listed in alphabetical order.
3. The data regarding birthplace were obtained in reply to Census Question No.3 which required a respondent to state his place of birth. If the person was born in the district of emumeration a tick was put in space No.3 on the emnumeration sluip; if born elsewhere in Pakistan or India, the name of the district of birth, and if born outside India and Pakistan, the name of the country was to be written in that space.
4. The original slips were sorted by hand in accordance with the replies noted on them and were counted to produce the statistics shown in this Table.
5. The various provinces and States of the sub-continent beyond the areas in which the First Census of Pakistan was cond ucted have been grouped for the purpose of section 2 in "Zones" as under:-
ZONES PROVINCES/STATES A~D AGE::-OClES
NORTH Uttar Pradesh (U.P. and States).
EAST Assam and States, Bihar and States, Orissa and States, West Bengal and States, and Nepal and Sikkim.
SOUTH Coorg, Madras and States, Mysore and Andeman and Nicobar Islands.
WEST Bombay and States, Baroda State, West Indian States and Agencies, Portuguese India. (This zone includes the States of Junagadll and M:l!lawadlu*)
CENTRAL Madhya Pradesh (C.P), Madhya Bharat (Central India States and Agencies), Bhopal State, and Hyderabad State. *
NORTH-WEST Punjab (I), Patiala and East Punjab States' Union, Ajmer, Delhi, Rajputana States and Agen;:ies, Jammu and Kashmir State.*
OTHER PARTS French India, Bhutan and any otller Indian State.
* Accession disputed.
6. Muhajirs are included in the figures appearing in this Table, but the numbers of Muhajirs amanating from each zone are also given separately in Table 19.
7. This Table has been discussed in Chapter 2 of the Census Report (Part I)
5-1
5-2
TABLE S-BmTH PLACE Section I-The total population of Pakistan according to province or country of Birth.
Total All Places
Pakistan
Place of birth
Baluchistan & States Union East Bengal Federal Capital, Area Karachi
N.W.F.P. & Frontier Regions 2 Punjab & Bahawalpur State Sind & Khairpur State
Other places of Pak/India sub-continent
Other Part of Asia
Muslim Countries
Afghanistan Arabia 3 Indonesia 4 Iran' Iraq
Syria Trans Jordan, Lebnan & Palistian Turkey Other Yfuslim Countries
Other Countries in Asia
Burma Ceylon China Tibet Other countries
Non-Asiatic Countries
Muslims Countries Other Countries
----- -
Number of Persons.
Place of enumeration - - --- ---------
Baluchis-tan & East
Pakistan 1 States Bengal , Union
----.__)---- -7,29,93,118
6,53,87,182
11,57,771 4,10,71,827
3,19,040
32,23,R61 1,53,44,535
42,7\),14&
75,55,191
46,701
34,811
28,212 1,025
171 4,529
343
26 3
232 265
11,890
10,282 lXR 663
91 666
4,044
163 3,881
11,54,167
11,13,963
10,75,83R 469 127
12,398 22,680
2,251
28,810
11,309
11,210
9,323 26
1 1,820
16
10
14
99
47 14
3 35
85
85
4,19,32.329
4,10,75,18l
67· 4,IO,n5,863
",58.
1,768 6,954
171
8,48,539
8,199
286
82 65 25 93 15
1 5
7,913
7,815 2
32 10 54
410
5 405
Notes: 1. Excludes persons claiming nationalities other than Pakistani. 2. Including States, Agencies and Tribal Areas. 3. Includes Saudi Arabia, Yeman, Oman, Aden and Bahrein. 4. Includes Sumatra, Java. Bemee and Sarawak. 5. Includes Kawait,
TABLE 5-BIRTH PLACE Section I-The total population of Pakistan according to province or country of Birth.
Number of Persons.
Place of enumeration
Place of birth Federal Punjab & Sind & Capital N.W.F.P. Bahawalpur Khairpur Area
, Karachi
Total All Places 1],22,406 32,22,172 2,06,36,702 49,25,342
Syria 16 Trans Jordan, Lebnan & Palistian 6 1 t Turkey 133 27 46 11 Other Muslim Countries 38 217 :i
Other Countries in Asia 1,579 421 1,853 25
Burma 1,237 133 1,033 I 7 Cevlon 121 2 48 I China 136 118 374 Tibet 23 2 21 Other countries 62 166 377
Non-Asiatic Countries 1,634 305 1,582 28
Muslims Countries 134 24 Other Countries 1,500 305 1,558 28
NOTES: ]. Excludes persons claiming nationalities other than Pakistani. 2. Including States, Agencies and Tribal Areas. 3. Includes Saudi Arabia, Yeman, Oman, Aden and Bahrein. 4. Includes Sumatra, Java, Bernee and Sarawak. 5. Includes Kawait.
5--4
TABLE 5-BIRTH PLACE
Section-2 Persons born in Indo/Pakistan sub-continent beyond the areas in which the First Census
of Pakistan was conducted
Number of Persons.
ZoneJ in which Born Place of ------~----------- ---,
Enumeration Total 1 North East South West Central, North Other I West Places I ---------1
2. Excluding persons in Frontier Regions (See both sheet)
3. For Provinces & States comprising Zones, See title sheet.
TABLE 6.-RELIGIONS.
This Table analyses the distribution of the population according to religions. The information in regard to religion was obtained in reply to Census Question No.5 for which 8 symbols were provided on the census slip, one of which had to be ringed round by the enumerator according to the reply of the respondent. The symbols were-(l) Muslim, (2) Caste Hindu, (3) Scheduled Castes, (4) Budhist. (5) Christian, (6) Parsi, (7) Tribal Religion and (8) Other Religion or no religion. The 8th symbol was ringed also for persons who did not report their religion. The original slips were sorted according to the marks placed round the above suymbols and were counted to produce the statistics shown in this Table.
2. It will be seen that no attempt has been made to obtain data regarding sects or sub-divisions of the main religious communities or to record the separate castes of Caste Hindus and members of the Scheduled Castes.
3. The Table is in two sections:
Section 1 gives totals of main religious groups, viz., Muslims. Caste Hindus, and Scheduled Castes, and the total of smaller religious groups for each district and municipality;
One Section which gives the number of persons in each Province in each of the smaller religious groups. The column headed "Others" includes persons who claimed to adhere to a religion not specified in the enumeration slip, or who have no religion or who refused to report their religion.
4. The population analysed in this Table excludes persons who claimed a nationality other than Pakistani.
5. This Table has been discussed in Chapter 2 of the Report.
6--1
6-2
TABLE 6.-RELIGJON
Section I.-Main Religious Groups
Thousand persons.
Caste Scheduled, Provinces and States I Total l Muslim I Hindu Caste 1 Christian Others
Federal Capital Area, Karachi 11,23 10,78 5 13 21 6
N.W.F.P. and Frontier Regions 58,65 58,58 2 4
Districts 32,23 32,17 2 4
Frontier Regions 26,42 26,41
Punjab and Bahawalpur State'. : 2,06,37 2,02,01 3 30 4,03
Districts 1,88,15 1,83,93 2 19 4,01
Bahawalpur State 18,22 18,08 11 2
Sind and KhairpuI State 49,25 44,58 1,41 3,23 2
Districts 46,06 41,49 1,34 3,20 2
Khairpur State 3,19 3,09 7 3
I.-Excluding 207 thousand persons claiming Nationalities other than Pakistani.
2.-The numbers represent the following proportions of the total population:-
Area Muslim Caste Hindu Scheduled Christian Others Caste
0/ 0, 0/ ?{. % /0 '0
(i) (ii) (iii) (iv) (v) (VI)
----_ -----Pakistan 85.9 5.7 7.2 0.7 0.5
West Pakistan 97.1 0.5 1.1 1.3
East Pakistan 76.8 10 12 0.3 0.9
Section 2-Analysis of smaller religious Groups
Provinces and State
Pakistan
Baluchistan and States Union
Districts States Union
East Bengal
Federal Capital Area, Karachi
N.W.F.P. and Frontier Regions
Districts Frontier Regions
Punjab and BahawaJpur State
Districts Bahawalpur State
Sind and Khairpur State
Districts Khairpur State
Buddhist
3,19,630
3,18,951
9
9
670
670
Parsi
5.356
115
5,018
195
195
28
28
6-3
Number of Persons.
Tribal
30.278
30,278
Others
11.792
80
80
10,236
1,214
215
15 200
35
35
12
12
7-1
TABLE 7-MOTHER TONGUE.
The information regarding Mother Tongue was obtained in reply to Census Question No.6. "What is your Mother Tongue?" 'Mother Tongue' was defined as the language spoken from the craddle and Enumerators were instructed that in the case of very young children who had not learned to speak and of deaf-anddumb persons, it should be the language spoken by their parents. Where the mothers' language was different from the father's, the Mother Tongue was taken to be the language mostly used in the home.
2. The nine main languages of Pakistan printed on the Census Slip were Arabic, Urdu, Persian, Bengali, Pashto, Punjabi, English, Sindhi and Baluchi. The enumerator had to indicate Mother Tongue by ticking against one of them accordingly to the reply. There was a tenth blank column for the purpose of recording Mother Tongues other than those printed. The original slips were sorted in accordance with the marks put on them and were counted to produce the statistics shown in this Table.
3. The list of language has been arranged according to philological families. The Indo-European family, to which many of the languages of Pakistan belong, is sub-divided to show separately the particular branches which contain the chief mother tongues of Pakistani citizens. Within each family or branch of the Indo-European family the different languages are listed in alphabetical order. The classification of Mother Tongues are detailed in the schedule given on the next page.
4. The list of languages includes, in addition to the printed nine languages, most of the other languages which were entered into the 10th blank column. These languages are given separate lines in the table.
5. This Table gives an analysis of the total population of the Province, excluding foreigners.
6. The Table has been discussed in Chapter 4 of Part I of the Census Report.
7-2
CLASSIFICATION OF MOTHER TONGUES
MAIN HEADS
(a) Austric Family
1. SANTHALI & KHASI
(b) Dravidian Family
2. BPAHUI 3. SOUTH INDIAN LANGUAGES 4. TRIBAL DRAVIDIAN TONGUES
(c) Indo-European Family
Dardic Branch 5. KAFIR TONGUES 6. KASHMIR I 7. KHOWAR
B. KOHISTANI 9. SHINA
European Branch 10. ENGLISH·
Indo-Aryan Brancb 11. ASSAMESE 12. BENGALI· 13. GUJARATI 14. HINDI
------------- ----"'Languages for which a special column was provided on the Enumeration Slip.
7-3
TABLE 7-MOTHER TONGUES
Number of Persons.
Baluchistan &
PakistanI' States Union
Federal Capital
I I 1 N.W.F.P. including Punjab & Sind &
Languages I East Bengal I Area I Karachi Frontier i Bahawalpur 1 Khairpur Regions State State
--~------- ------ ------I
Total 7,56,35,496 11,54.167 4,19,32,329 11,22,406 58,64,550 2,06.36,702 49,25,342
Austric Family
Santhali & Khasi
Dravidian F'amily
1,11,294 1,11.283
Brahui 2,18,556 1,95,745 South Indian
Languages 5,724 59 2,896
37 Tribal Dra-
vidian Tongues 94
Indo-European Family
Dardic Branch
Kafir Tongues Kashmiri Khowar Kohistani Shina
l?uropean Branch
English
2,943 2,551
94,599 66,804
100
1,2359
Indo-Aryan Branch
Assamese Bengali Gujrati Hindi Marathi Oriya
873 4,11,67,474
2,28,492 1,24,923
1,007 16,609
349
7
350 2.412
R70 566 4,11,60,310 234 2,836 42 1,23,356 18 216
16,592
11
351
2,609
57
41 761
12 131
7,983
3
3,199 1,27,555
644 773
17
2,902
94,587 65,647
125
900
345
90
1,441
1,019 100
1,050
2,208 208
13
22,460
70
439
291 97,659
523
(I) Excluding persons claiming nationalities other than Pakistani but including 4,700 Non-Pakistanis who ~re Afghan Powindahs in Kharram and whose mother tongue is Pushtu.
(2) Sindhi includes the dealects Jattki (78,20) and Lassi (6,681).
7--4
TABLE 7-MOTHER TO~GUES
Number of Persons
Baluch- Federal N.W.F,P· I istan & Capital including Punjab & Sind & Languages PakIstan States East Bengal Area rrontier IBahawalpur Khairpur
Arakanese 73,849 73,848 1 Burmese 39,657 39,510 III 36 Other Assam-
Burman Tongues 1,11,860 1,11,820 6 34
Various Central Asian
Tribal Tongues ofN-W. 347 101 102 37 107
Unclassified
Other Langua-ges 15,241 56 2,951 10,444 1,388 218 184
Notes: (3) Includes 96 persons who reported Multani is their Mother Tongue.
(4) Includes 919 persons who reported Kattewadi as their Mother Tongue.
(5) Includes 5 persons who reported Lassi and 2 persons who reported Jattki as tceir Mother Tongue.
(6) Estimated population of Frontier Regions (17,55,152) is assumed to have reported PUSHTU as their Mother Tongue.
TABLE 7-A-SPEECH
This table shows the number of persons who commonly speak each of the main languages of Pakistan. Nine languages were selected for the purpose of this enquiry and these were printed on the Enumeration Slip. Tick marks were placed under each language by the Enumerator according to the replies he received to Census question No.7. This question followed the question on Mother-tongue and asked the respondent to report "Any other language you commonly speak".
2. Many respondents claimed to speak more than One language in addition to their Mother-tongue. Therefore no 'Total' column is provided in this table since the total number of speakers exceeds the total population. many persons appearing more than once in the figures.
3. The figures under each language include those who speak the language as their Mother-tongue plus those who speak it as an additional language. The standard of multi-lingualism in each language can therefore be assessed by comparing the figures in this table with those in Table 7 Mother-tongues.
4. This table is in two sections: Section 1 gives the number of speakers of each language and section 2 expresses the figures as percentages of the total population. The total population figure used for this calculation excludes NonPakistanis but the difference which that causes in the percentages is negligible.
5. Certain miner languages or dialects, having been reported as Mothertongues, are included in this table under the main languages in which they were classified in Table 7 i.e.
(a) Punjabi includes Khetrani. Jafirki and Derawali. (b) Persian includes Dehwari. (c) Sindhi includes Jattki. Sindhi and Lassi.
6. This table has been discussed in chapter 4 of the Report.
7-6
TABLE 7-A-SPEECII
Section- I-Numbers
Number! of persons who commonly spcnk the nine main languages of Pakistan
(includes both the persons who claimed the languages as their mother tongue (See Table 7) and those
reported it as additional language commonly spoken by them)
Number of Persons.
Province and State Arabic Baluchi Bengali English _-1_- ____________
Pakistan 65,043 10,75,999 4.12,91.989 13.77,567
Baluchistan & States Union 30 4,71,848 689 12,lJ41
Districts 19 1,64,576 675 1 1,80~ States Union 11 :'.07,272 14 1,137
East Bengal 41.218 429 4,12,80,220 5,50,206
Federal Capital Area, Karachi 2,371 1,03,182 5,070 97,506
N.W.F.P. & Frontier Regions 6,276 309 1, 118 30,904
District 623 309 1,118 29,823 Frontier Regions 2 3,653 1,081
Punjab and Bahawalpur State 12,809 4,749 3,968 6,11,921
District 12,738 4,719 3,902 5,6\),419 Bahawalpur State 71 30 66 51,502
1. Exduding persons chiming Nationalities other than Pakistani, but includes Afghan Powindahs in Frontier Regions.
TABLE 8-LITERACY
This Table shows the size of the literate population (excluding persons claiming nationalities other than Pakistani). Literacy was defined in this census as the ability to read any language in clear print. Those ab1e only to read the Holy Quran are literate. This definition differs from that used in the past censuses and care should be taken in making comparisions.
2. This Table is divided in three Sections:-
Section 1. Total number of literates and percentage Section 2. Literates by main Religions. Section 3. Percentages by main Religions.
Distribution is given by provinces and states. In provincial reports this tables shows the distribution by districts and cities.
3. Details of the literate population by the languages which they are able to read (or read and write) are given in table SA. Levels of education attained are shown in Table 9-B. The same information has separately been tabulated for Muhajirs in Table 19-B.
4. This Table has been discussed in Chapter 4 of the Report.
8-1
8-2
TABLE 8-LITERACY
Section-I-Number of literates by sex and their percentages
Number of Persons.
"'t:l CiO ,'-.0 0·- ~ 0, c ~~g
Population I iterate persons 2 I ~~.,g QJ~ ~ 0. 0."
Province and State l~ B-3 1 ~o
~ce~
I I~O g. .sooo '"1 ~ .-~Q
--- ,- .-l Q •
Male Female Male Female ; Male Female --_- ---- - ------~~ -_-
This Tables shows the number of persons (excluding those claiming nationalities other than Pakistani) who are literate in any of the nine principal languages of Pakistan.
2. The numb~r of persons who are able to read and write each language, and those able to read only, are shown separately, In the column for Arabic is shown the number of persons who claimed ability to read in that language the Holy Quran only.
3. Persons literate in more than one language have been counted under each such language and for this reason figures in this Table do not agree with these in Table 8.
4. The data for this table were collected in response to Census Question No.8, which asked: "Can you read? write?" If yes, .. in what languages?" under the particular language 'P' was to be written for ability only to read, 'L' for read and write and 'Q' under Arabic for ability to read the Holy Quran only.
5. Ability to read meant that a person claimed to read clear print, and ability to write meant that a person claimed to be able to write a simple letter. The original slips were sorted in accordance with the records made on them and were counted to produce the statistics shown in this table.
6, This Table has been discussed in Chapter 4 of the Report.
8-5
8-6
TABLE 8. A-LANGUAGES OF LITERACY Literate persons able to read and write and those able to read only each of the main nine languages
of Pakistan (Number able to read and write is shown in ordinary type. Number able to read only in Italics)
Number of Persons.
Province, District & States Arabic Baluchi Bengali English , Persian
1. This table shows, for each province and state, the number of persons in two broad age-groups, wbo reported themselves in census, as regularly attending school or college. The analysis is by main religious groups and sex. The percentage which each figure in the table bears to the corresponding total population of its age, sex and religious group has been shown in italics below the respective figures.
2. Similar tables regarding school and college population were not produced in previous censuses of Indo-Pakistan sub-continent.
3. The data for the number of people still undergoing education was obtai,ned in reply the first part of census Questi on No. 10 which enquired whether the person was regularly attending school or college. The enumerators' leaflet explained that a person should be treated as regularly attending school or college regardless of any temporary break in attendance such as sickness or holidays.
4. Since this census information is based on verbal statements by individuals or heads of families it is unlikely that it will agree either in general or in particular with the official records based on registers kept by heads of schools and colleges. The number of persons attending primary school on January 1951 according to the records of the Ministry of Education was 32,12,O()() as detailed by provinces and states in statement 4.H of Part I.
5. This TaWe is discussed in Chapter 4 of Pt. I of the Census Report.
9-1
9-2
TABLE g-PUPn..s AND STUDENTS
Persons in Broad Age group who, at the time of Census were attending school or college
(Figures in italics denote percentage of the population in the age, sex and Religions groups)
Number of Persons.
I
All Religions Age Groups
Total I Male I (in years) Female
J
All Pakistan
Total .. " .. 42,64,186 31,00,515 11,63,671 5.8 7.9 3.4
1. This table shows how many persons out of the total population (excluding non-Pakistanis) have received formal schooling and analyses them according to Religious Groups and sex and also according to the years spent in full time education. The data is divided into two age groups; under 10 years and 10 years and over.
2. Separate sections have been given for Pakistan as a whole and for Provinces and States. In provincial volumes the analysis is gi\'en for districts and cities.
3. The information for this Table was obtained from Census Question No. IOCb) which asked: "For how many years have you attended school or college T' The numbers include persons who are still undergoing education, for instance, children at school or college, who may have already received full time education for some years. The enumerator was instructed that this question was applied to those who had left school or college as well as to those still attending. He was also instructed that the reply should be recorded to the nearest whole number of years. The data so recorded were sor.ted mostly by hand using the original enumeration slips, but the slips for certain categories of persons were coded and sorted by punched card machines.
4. In some of the provinces the number of children in the lower age group who are shown as having received full time education is smaller than the number in that age group shown in Table 9 as currently attending school. This difference is due to children who have been at school for considerably less than one year having the answer "yes" recorded to question lO(a) "Are you regularly attending school or college", but having the answer "None" given against question 10Cb) in respect of the nearest whole number of years at school. The drive for literacy and primary education will have increased the number of such pupils and hence the difference in the figures.
5. The number of females included in each figure is shown in italics below it. In ~WFP the number of females in the higher age group, however, turned out to be inconsistent with the literacy figures, porbably due to mistakes in sorting, and it has therefore been adjusted and may be regarded only as an estimate.
6. This Table is discussed in Chapter 4 of the Report.
9-7 TAllLE 9-A-YEARS OF EDUCATIO~
All Pakistan
Persons in each educational age group who have received or are receiving full time Education (Figures in italics denot;: the number of females included in the total above)
Number of Persons
Years in full time education Age Group Total l Received
Person in each educaional age group who have received or are receiving full time Education (Figures in italics denote the number of females included in the total above)
Number of Persons.
Years in full time education Total Received
,
Age Group Population Schooling 1 4 5 --6 7-10 Over 10
Persons in each educational age group who have received or are receiving full time Education (Figures in italics denote the number of females included in the total above)
Persons in each educational age group who have received or are receiving full time Education (Figures in italics denote the number of females included in the total above)
Number of Persons.
Years in full time education Age Group Total Received
Persons in each educational age group who have received or are receiving full time Education (Figures in italics denote the number of females included in the tolal above)
Number of Persons
I I I Years in full time education
Age Group Total I Received --------------------Population I Schooling
Persons in each educational age group who have received or are receiving full time Education (Figures in italics denote the number of females included in the total above)
9-13
Number of Persons
I Years in full time education Age Group Total Received - ,
Under 10 1,06,833 4,607 3,862 745 51,921 1,571 1,379 192
10 & Over 2,96,023 28,721 11,373 9,133 5,484 2.731 1,33,810 8,461 3, II 2,425 1,897 1,022
9-15
TABLE 9-A-YEARS OF EDUCATION
Punjab
Persons in each educational age group who have received or are receiving full time Education (Figures in italics denote the number of females included in the total above)
Number of Persons.
I I Years in full time education Age Group Total I Received
This table analyses literate persons as shown in Table 8, according to the educational grades claimed by them. The population analysed in this table is that of all literate persons excluding those who claimed nationality other than Pakistani.
2. The analysis is made for the Provinces and States. The Provincial Tables give details for each district as a whole, showing separately the figures for cities and cantonments.
3. The figures shown in ordinary type are the totals of both sexes; separate figures for females are shown in italics below each.
4. 'MUHAJIRS' are included in the figures of this Table and are also shown separately in Table 19-B.
5. The information on grades of education was obtained in reply to the third part of Census Question 10, for which 5 symbols were provided on the census slip. The symbols were -'P' (those completed primary schooling), 'M' (those passed Middle Examination), 'E' (those passed Entrance/Matriculation Examination), 'D' (those obtained University first degree), and 'H' (those who obtained Higher/Post-Graduate Degree). Whichever of these symbols was applicable, was ringed round by the enumerator according to the respondent's reply. The original slips were sorted in accordance with the marks placed round the highest grade symbol and were counted to produce the statistics shown in this Table.
6. The total number of literate persons was derived from the replies to Question 8: "Can you read 'I write?" The slips of persons who claimed to be able to read (whether or not they were also able to write) were counted to obtain the literacy data. They include persons whose only claim to literacy is their statement that they can read the Holy Quran in Arabic.
7. Persons who claim to be able to read but who made no claim to have passed a Primary or any higher educational grade, are classed as having 'no formal attainments' .
8. This Table is dillcussed in Chapter 4 of the Report.
9-20
9-21
TABLE g.B EDUCATIONAL LEVELS
Section I-AU Religions
Literate persons analysed according to the grades to which they claim to have progressed in educational institutions
(Figures in italics sbow the number of Females included in the totals above them)
Number of Persons.
Total t Without 2 ! Primary Province and State Literates Formal School
Sind & Khairpur State 5,098 4,575 409 24 566 536 29 25
Districts 5,043 4,527 403 26 564 534 29 27
Khairpur State 55 48 6 28 2 2 29
NOTES: 1. Excluding persons claiming Nationalities other than Pakistani 2. Literate persons who did not claim one of the grades mentioned in this table
are classed as having no formal attainments
9-28
TABLE 9-B-EDUCATIONAL LEVELS
Section 4-Scheduled Castes
Literate persons analysed according to the grades to which they claim to have progressed in
educational institutions
(Figures in italics show the number of Females included in the totals above them)
Number of Persons.
Middle , Matricula- Higher School tion Degree Degree Province & State
NorE:»: 1. Excluding persons claiming Natlonalities other than Pakistani. 2. Literate persons who did not claim one of the grades mentioned in this table
are classed as having no formal attainments. 3. Almost all are christians.
9-30
TABLE 9.B--EDUCATIONAL LEVELS
Section 5---0ther Religions
Literate persons analysed according to the grades to which they claim to have progressed in
educational institution
(Figures in italics show the number of Females included in the totals above the m)
Number of Persons.
Middle Matricula- Higher School tion Degree Degree Province & State
This table gives details of those persons who reported themselves as nonPakistanis, apart from Afghan Powindahs (members of the seasonal and nomadic parties). This information was given in reply to Census Question No.4 which asked" Are you a Pakistani; if not, what is your Nationality"?
2. Information regarding Afghan Powindahs enumerated in Pakistan is tabulated in table No. 10-A.
3. The persons included in this Table are excluded from all other Census tables with the exception of:-
Table 1 and i-A: Population and Area. Table 3: Variations in last 50 years.
4. The figures in this table for nationals of Afghanistan include all persons who claimed that nationality but who did not report themselves as " Powindahs". The enumeration records of other Non-Pakistanis were poor and are perhaps incomplete. The reports received ~re probably correctly classified as "European and American countries".
5. This table has been discussetl in chapter 2 of the Report.
10-2
TABLE lO-NON-PAKISTANIS
Enumerated persons who did not claim to be 'Pakistanis
Number of Persons.
I Enumerated in:-Enumerated
as
I Total Baluchistan I N.W.F.P. j Punjab
Nationals of & States I East I Karachi Frontier & Baha wal- Sind & Union I~~gal &Regions I pur Khairpur I I ,--
Ail Countries 1,36,879 654 1,30,253 3,955 795 795 427
Afghanistan 2,260 96 773 461 747 163 20
Iran 2,023 378 95 1,420 - 109 21
Other Muslim Coun-tries 418 32 82 217 - 74 13
India 1,27,831 85 1,26,392 722 - 288 344
Burma 2,679 10 2,576 63 - 28 2
Other Non-Muslim 867 16 61 688 - 88 14 Asiatic Countries
European& American Countries (a)
748 35 246 364 48 43 12
Other Countries 53 2 28 20 - 2 1
(a) Known to be incompletely enumerated please see Title Sheet.
TABLE lO-A-AFGHAN POWINDAHS.
Powindahs are Afghan nationals who come over to Pakistan every year to pass the winter. This Table presents an analysis of the total population of Afghan Powindahs in by sex, age and occupations. It is in two sections:-
Section 1: It shows sex breakdown in age-groups of 'under 12 years' and '12 years and over'; and
Section 2: It shows a further analysis of '12 years and over' into sex and occupations.
2. The information tabulated in this Table was obtained from replies to the third and fourth parts of Census Question No.4 on Nationality, which asked: "If an Afghan, are you a Powindah 1 If so, where is your party settled this winter 1" Enumerators were instructed, in case a respondent did not know whether he was a Powindah or not, to treat, as Powindahs all such Afghans as had been staying temporarily in Pakistan for the preceding winter. The symbol 'PA' was ringed on the slip in such casess, which were sorted to produce the required statistics.
3. This Table has been discussed in Chapter 2 of the Report.
10-3
10--4
TABLE IO-A-AFGHAN POWINDAHS
Section I-Afghan Powindabs under 12 years, and 12 years and Over
Number of Persons.
Pakistan
Province and State of Enumeration
Baluchistan including States Union
Districts States Union
East Bengal
Federal Capital Area, Karachi
N.W.F.P & Frontier Regions
Punjab & Bahawalpur State
Districts Bahawalpur State
Sind & Khairpur State
Districts
Khairpur State
Persons ----------------
Total
69,790
19,215
18,819 396
28
56
34,560
13,643
13,083 560
2,288
2,156
132
Under 12
Years
23,613
7,689
7,549 140
11,643
4,095
4,061 34
186
184
2
12 Years and Over
46,177
11,526
11,270 256
28
56
22,917
9,548
9,022 526
2,102
1,972
130
2
3 4
5
6
7
8
9 10
11
12
13
10-5
TABLE 10-A-AFGHAN POWINDAHS
Section I-Afghan Powindhas under 12 years, and 12 years and over
Number of Persons.
Male Female Province and State
I Under 12 Years Under 112 Years' of Enumeration Total
Section 2-Afghan Powindabs under 12 years and over, by Occupation and Sex (P=Persons M=Male F=Female)
I 1 I 'I Federal I I Punjab Sind Pakis- Balu- East Capital N.W. and and
Occupation I tan chistan I' Bengal Area F.P. Baha- Khair-
I Karachi I walpur pur
_____ 1___ 1 ______ 1 State __ State
Total
Herdsmen & Dairymen
Wood Cutters
Charcoal Burners
Agricultural Labour
Fruit Merchant
Cloth Sellers
Money Lending
Hide Sellers
Miscellaneous Unspecified retail Trade
Mullahs
Religious Students
Physicians & Herbsellers
Midwife
Drumbeater
P 46,177 11,526 28 56 22,917 9,548 2,102 M 26,709 6,438 27 56 12,287 5,915 1,986 F 19,468 5,088 1 10,630 3,633 116
P M F
P M F
P M F
P M F
.. P M F
P M F
.• P M F
., P M F
6,133 5,815
318
142 139
3
7 5 2
224 204 20
I I
5 5
15 15
1 I
P 7,724 M 7,292 F 432
P M F
P M F
.. P M F
p M F
•• P M F
145 145
79 79
19 19
1 1
3,269 3,254
15
15 15
759 755
4
37 37
1 1
5 5
12 12
8 8
1 1
4 4
7 7
2,645 2,368
277
65 63 2
209 190
19
3 3
1 1
3,794 3,567
227
100 100
56 56
4 4
II7 91 26
18 17
1
7 5 2
11 10 1
2,782 2,583
199
6 6
23 23
6 6
1 1
102 102
44 44
4 4
377 375
2
2 2
10-7
TABLE 10-A-AFGHAN POWINDAHS-(Contd)
Section 2-Afghan Powindahs under 12 years alld over, by Occupation and Sex (P =Persons M Male=F =Female)
Number of persons.
I
; Punjab I i Sind Federal
Occupation I Pakis- I Balu- I East Capital I N.W. and I and I tan I chistan Bengal Area F.P. I Baha- Khair-
I iKaraChi I walpur I pur State State
Singers p 7 M 7 7 F
Motor Drivers P 6 1 5 M 6 1 5 F
Camelmen p 141 96 11 34 M 140 95 11 34 F 1 1
Donkeymen p 57 25 32 M 57 25 32 F
Goldsmiths p 10 3 5 2 M 10 3 5 2 F
Blacksmiths p 4 2 2 M 4 2 2 F
Weavers P 31 3 28 M 30 3 27 F 1 1
Tailors p 29 23 4 M 29 23 4 F
Dyers .. P M F
Shoemakers p 33 2 10 21 M 32 2 10 20 F 1 1
Masons P 20 6 14 M 20 6 14 F
Bricklayers p 56 27 29 M 56 27 29 F
Carpenters p 9 9 M 9 9 F
Watchmakers p 3 3 M 3 3 F
TABLE IO-B-PAKISTANIS ABROAD
This Table shows the persons who were claimed as citizens and normal residents of Pakistan in the Census, but who were at that time away out of Pakistan. Reports of such persons were made through the High Commissioners, Ambassadors, Consulates etc. of Pakistan and they were also made by the heads of the households in Pakistan from which the persons were absent. In the sorting stage any duplications involved in this double reporting were eliminated.
2. The figures cannot be regarded as complete since Pakistanis abroad who had no household at Home would be missed unless they were known to the Pakistan Diplomatic Mission in the country of sojourn. Moreover, it is unlikely that the heads of households remembered to report all absent members.
3. This Table was prepared centrally in Karachi by punched-card machine methods using the self-enumeration reports received through the Ministry of Foreign Affairs and Commonwealth Relations together with copies made in hand sorting centre of the enumeration slips of persons reported as absent abroad. The original enumeration slips were included in the normal hand sorting, and were applicable in the machine sorting also, and therefore, these absent persons are included in all census tables as part of the population of their normal place of residence in Pakistan.
10--9
10-10
TABLE 10-B PAKISTANIS ABROAD
Pakistanis reported by their households, or by Embassies and High Commissioners abroad, as being away out of Pakistan at the time of Census
(Figures in Italics are Females included in the figures immediately above them)
Countries of Sojourn ----' Place of i---MUShffiS Countries Enumeration Total Non-Muslims Countrie. Asia Field of Activity --------
Afghanis- ' I tan Iran Others Burma Ceylon India U.S.S.R. Other --------- ----,-------_ ------------Section I-Place of enumeration
27 9 1 8 7 15 9 Aged 12 Years &: 28 8 1 8 6 15 fI Over
29 6 4 18 II 20 4 7 Aged Under 12 30 5 2 13 6 11 1 4 Year,Dependents
11-1
TABLE ll-LABOUR -FORCE.
1. This table classifies the total population, excluding Non-Pakistanis into broad categories of Economic Status.
2. All persons aged 12 years and over were asked "Are you usually selfsupporting or partly self supporting or are you seeking work?" Person who answered "Yes" to any part of this question, were then asked to state their Occupation and the Economic Group in which they were engaged in the previous month. From their answers they have been c1as~ed as belonging to the Agricultural or Non-Agricultural Labour Force or as not being in the Civilian Labour
'
Force. Persons who answered "No" to all three parts of thc main question were classed as Dependents as were all children under 12 years of age.
3. The Agricultural Labour rorce includes all persons who reported their usual main occupation as "cultivators" or who stated that in January 1951 they were engaged or seeking work in cultIVation, stockraising, hunting and game propagation, or some other occupation acssociated with the agricultural industry but not generally those engaged in forestry or t~,hing. It should be noted that the Census definition of a cultivator was a "Til1~r of the Soil" which term meant a persons who himself works on the land or who employes Olhers to do so under
• his direct personal supervision.
4. The :Non-Agricultural Civilian Labour Force includes all self-supporting persons who during January 1951 were engaged in Public Services (except the Armed Forces), personal services trade, commerce, transportation or any industry other than agriculture, but including forestry and fishery. It also includes persons seeking work in any non-Agricultural occupation.
5. Persons not in the Civilian Labour Force include the members of the Defence Services and also the several classes of self-supporting persons who are regarded as economically inactive. The latter consist of two main categories, first those persons of private means who have not indicated that they follow any of the professions or occupations which would class them in the labour force. This group includes retired persons and pensioners, students (if they have stated that they are self-supporting or partly so) and those landowners who have not claimed to be cultivators or to be engaged in service: or industry, Secondly, the economically inactive category includes the inmates of hospitals, asylums and jails, if they have not stated in occupation which enables them to be classed in the Labour Force, and what may be called "Social Parasites" namely persons who have described themselves as beggars, vargrants, prostitutes, etc.
6. Dependants mclude all children under 12 years of age and all other persons who did not claim to be self-supporting, partly so, or seeking work. The female element of this group therefore contains the large number of women engaged in house-hold duties, but it does not contain those who described themseh es as helpers in the trade, profession, or other gainful work of the family or household. Similarly, this group includes all students, old people invalids, etc., living with or supported by their families or friends if such persons have not claimed to be wholy or partly supporting themselves by some definite occupation, not to be seeking to do so.
7. It is believed that the number of Male children reported as under 12years of age is somewhat inflated and this may have increased the figures for male dependants at the expense of the Labour Force. The data should therefore be used with reasonable caution. The probable effect, if expressed as a percentage of the male Labour Force IS not likely to exceed 3 per cent.
8. Muhajirs are included in the figures appearing in this table, but are also given separately in Table 19-C.
9. This Table has been d;scusscd in Chapler 6 of Part T.
11-2
TABLE ll-LABOUR FORCE
Section I-The total population according to Economic Status
Province & State
Pakistan 1
Baluchistan & States Union
Districts States Union
East Bengal
Federal Capital Area, Karachi
N.W.F.P. & Frontier Regions 1
Districts Frontier Regions 1
Punjab & Bahawalpur State
Districts Bahawalpur State
Sind & Khairpur State
Districts Khairpur State
Number of Persons.
Self-supporting
Total Civilian Labour Forc~-I- Not iJ;- - j ---------- Civilian Dependent
NOTE: 1. Excluding the estimated population of Frontier Regions. The total population of Frontier Regions excluding Non-Pakistanis is 26,42 thousands, out of which OOly 8.87,2.l6 have been enumerated and the rest estimated. Details for Labour Force are given for the enumerated pO,Julatinn ollh.
11--3
TABLE 11- -LABOUR FORCE
Section I-The total population according to Economic Status
14 45.1 0.6 0.2 44.3 Districts IS 44.5 44.4 Khairpur State
'-
TABLE ll-A -OCCUPATIONS OF NON-AGRICULTURAL LABOUR FORCE.
This Table shows the composition by detailed occupations and certain occupational sub-groups of the sections of the Civilian Labour Force classed as Non-Agricultural Labour in Table 11. All non-Pakistani citizens and children under 12 years of age are excluded.
2. Persons following each occupation are further analysed by sex, industrial status, age-groups and educational levels. The age-groups chosen are related to the different phases of a persons' working life. Figures are given for each district and state.
3. The information regarding occupations is based upon the replies obtained to Census Question "No. 12 whi<..:h asked: "What was your actual main occupation in January, 1951? If you were unemployed throughout January 1951, were you seeking employment, and if so, in what occupation". The enumerator was instructed to write a brief description of the occupation indicating what kind of worker the respondent was or what kind of work he diJ 01' sought. The respondents were instructed to distinguish clearly between the idea of 'occupation' which meant the kind of work done and the idea of 'Economic Group', which meant the kind of service in which the occupation is followed.
4. The descriptions se recorded were coded in accordance withthe "Classification Code of occupations of the Civilian Labour Force" issued as an Annexure to Part II of the Code of Census Procedure. Slips which were endorsed as "Mazdoor (Labourer)" or "Mulazimat/Naukri (Service)" were counted under 'Unskilled labourers' unless the enumeration slip contained some more information on other questions which enabled the respondent to be more accurately classified.
5. Information regarding Industrial Status was obtained in answer to Census Question No. 14 which asked: "In your main occupation, do you employ others'? Or are you an employee'? Or are you an independent workers Or an Unpaid family help'?" Symbols for each of these categones were provided on the slips and the enumerators placed a ring round the appropriate symbol. The enumerators were instructed not to class a person as Employer merely by virtue of his employing domestic servants but only if he employed others in his profession or business. An independent workers was defined as a person who is his own master in his trade or business but employes no paid help. An unpaid family help was defind as a person who claimed to be self-supporting or partly so by virtue of assistance rendered directly in the operation of a trade or business of another member of the family, but who received no separate payment in cash or kind. Unemployed persons are included in this table under the "Occupations" in which they were seeking work.
6. In East Bengal table ll-B industrial status of some of the persons shown against Governmental etc. under sub-group Administrative (officers) was shown to be employers and Independent workers. This is an obvious mistake and has been corrected in this table by inclusion of all these persons under "Employees".
7. The data regarding age and Educational Status were obtained from replies to Census Questions No.2 and 10, a description of each of which appears in the title-sheets of the tables in the Age and Literacy series respectively.
8. For every person in the Non-Agricultural Labour Force, the data on the enumeration slip were transferred to punched cards and sorted by machines.
9. An analysis of the information on occupation contained in this table is given in fuller details in Census volume No.7.
10. The Table has been discussed in Chapter 6 of the Report.
11-7
11--8
TABLE ll-A-OCCUPATION OF THE NON-AGRlCUL'rtJRAL LAIIOUR FORCE
Self-supporting persons' engaged in activities other than Cultivation and Animal Husbandry, according to their Occupation in January, 1951.
Number of Persons_
Persons 2 Industrial Status
Males Females -----------------------
Occupational Groups ~ ~
I
----:-- ----------,---NOD Agricultural Labour Force 54,89,857 52,14,3422,75,51547,004 18,41,307 32,52,28573,746 93171,375 1,80,89522,314
3. Forestry workers and Fishermen in N. W.F.P. are classed under Agncultura ILabour Force and are hence excluded fr¢.m this Table in respect of that Province.
4. In Federal Capital Area, Karachi the figures for Pollee Fire etc. are included in "Other Servke \Vorkers' and hence the figures against Police Fire etc. are exclusive of those in Karachi. '
5. ~~:-:tO~~o'!J!~~e~2-14 years in N.W.F.P. were included in 15 -19 years as they together form one group 12-19 years in
2
4
6
7
8
9
10
11
12
13
14
15
16
17
18
19
20
21
22
23 24 25
26
27 28 29 30 31 32
33 34 35 36 37 38
39
40
41
42
43
44
11-9
TABLE ll-A OCCUPATION OF THE J:'/ON-AGRICULTURAL LABOUR FORCE
Self-supporting persons engaged in activities other than Cultivation and Animal Husbandry, according to tbeir Occupation in January 1951.
Number of Persons.
Educational Level 1-------- ---
Age Groups -- -- - ----------Male Female Both Sexes
--,---- -----------------~ .; ~ b C i>l, () 0 I 0
1 0 J "I 1 :1 0' ~ S"i g :g I '~ I t1. '" J. '" "d """ _, "d "'" I 'J:: I ,~ 1'::<1 ~ N :::: ~ M C"( :::: II:I~ 0 ~ I ~;.. J; - ---- ----- '-_-- --------- -------·I;--I;f---1,87,006 5,71,965 6,93,035 32,17,2905,44,99610,217 26,765 31,8701,73,30833,355 39,26,7667,30,6294,84,707 2,83,900 6~s1',
Other service workers 59,712 25,123 1,330 18,299 714 46
Police, Fire etc. services 37,130 29,788 3,384 47
Unclassified 2,200 1,464 122 391 47 48
Note: I-Occupational distribution by main religions has been shown only for East Bengal, as the;', figures of religious groupS otber than Musilm are small in other provinces.
- (Continuea on back page)
11-9 B
TABLE lI-A OCCUPATIONS OF CIVILIAN LABOUR FORCE
Section 2-East l3engl\l-(Colltd.}
Persons in the Civilian Labour Force by religion and according to their occupation in January, 1951.
Scheduled Castes Other Religions
Males Females Males Females Occnpational Groups
15,28,554 1,65,348 1,30,458 20,907 Total Civilian Labour Foree
2 12,07,178 1,16,781 1.13,330 16.260 Agricultural Labour Force
3 12,04,694 1,15,572 1,13.161 16.201 Cultivators etc. 4 2.484 1,209 169 59 Herdsmen and Diarymen
S 3,21,376 48,567 17.128 4,647 NDn-Agricultural Labour Force
6 10.863 976 1,430 371 Professional and Technical
7 59 69 Engineers 8< Architects etc. 8 48 10 Transport Managers. Pilost etc. 9 2.3$3 188 460 202 Professors and Teachers
10 1,703 30 318 36 Religious workers 11 2.721 430 29 Physician & Surgeons 12 881 588 56 103 NUrses ell; Other Health Workers 13 15 6 Artists, Writers & Entertainers 14 129 19 ]udgcsf Lawer etc. 15 4 Chemists & Metallurgists 16 2.950 1iO 62 Other Profession
17 10,660 111 2,434 64 Administrative
18 383 5 95 6 Business Executive 19 97 54 Governmental etc. officers 20 10.180 106 2,285 58 Office workers
21 38,913 13,241 2,921 253 Sales workers and Shopkeepers
22 5,7J2 11 77 93 Forestry workers
23 I,J5,768 7,299 2,081 175 Fishermen
24 54 29 Mine & Quarry workers
25 10,027 78 561 2 Transport Operatives
26 4,154 235 Road 27 583 34 99 Railway 28 5,272 44 227 Sea & River 29 IS Air
TABLE 11-B-SECTION 1: OCCUPATlONS OF THE AGRICULTURAL LABOCR FORCE
1. This Table divides the Agricultural Labour Force as shown in Table 11, into cultivators, Animal Husbandmen, and other Agriculturi;t.
2. The data for cultivators has been further analysed by land tenure in table No. 14.
3. The number of cultivators was obtained by Census Question ll-A which asked "what is usually your m:.in occupation (kind of work)? If the resPQndents claimed to be a "Tiller of the Suil" the enumerator put a ring round the symbol printed on the slip. The total of all such slips has been included in the figure for Cullhators.
4. The numbers of Animal Husbandmen and other agriculturists were obtained by Census Question No. 13 which asked "in what kind iof IndLlstry business or service did you work in January (1951)"? Enumerators were instructed to write out the respondents' answer. A summarized list of the groups into which economic activities were to be split was printed on the instruction sheet provided (in this own language) to every enumerator. The first items in this list were "AGRICULTURE split into cultivation, stock raising Forestry, etc". The slips of persons who had not declared themselves to be "Tiller of the soil" in Question ItA were placed in the Agricultural or Non-Agricultural Sections of the Labour Force according to the answers given to Question 13. Forestry and Fishery were included in the Non-Agricultural industries.
5. The occupations of the persons in the Agricultural Labour Force, other than "Tillers of the soil" were elicited by Census Question No. 12 which asked "what was your actual main occupation in January (1951)" The answers were coded in accordance with the "Classification Code of Occupations for the Civilian Labour Force" (Census 51 publication No. 11-A) any slip coded for sub·group 4.1 (Cultivators and Agricultural land workers) were added to the total of Cultivators given by the answers to Question ll-A. Slips coded in sub-group 4.4 (Dairy Farmers and Workers in Animal Husbandry) were counted to give the total of that column in this Table. All other slips of the Agricultural Labour Force except Forestery and Fishery workers coded in Sub-group 4 are included in the heading "Other and Unclassified". Through some mistake of sorting Forestry and Fishery workers in NWFP have been classed as Agricultural and are hence included in this table.
6. Slips of Cultivators who reported in answer to Question 12 that they were unemployed throughout January 1951 account for the last column in this table. Very few cultivators would have done no work at all during a period as long as a whole month. Moreover cultivators generally regard themselves as employed for throughout the year, and therefore the figures are unrealistically low as a report on unemployment.
7. Section 2 of this Table shows the subsidiary occupations followed by some members of the Agricultural Labour Force.
8. This Table has been discussed in Chapter-6 of the Report.
11-10
11-11
TABLE 11. B-OCCUPATIONS OF AGRICULTURAL LABOUR FORCE
Section 1-Persons1 engaged in Agricultural activities occording to their main occupation in Jannary 1951.
(Figures in italics denote Females included in the figures immediately above them)
Number of Persons.
Total 2 I Cultivators Herdsmen Orchard Province & State ,AgriCUitUreal/ and Agri- and and
! Labour cultural Animal I Nursary I Force Labourers Breeders
NOTES: 1. Excluding persons claiming Nationalities other than Pakistanis. 2. See Table 11. 3. Including Dairy Formers. 4. Excluding Frontier Regions 5. Including 716 Forestry workers and 375 Fishermen.
11-12
TABLE tJ·B-OCCUPATIONS OF AGRICULTURAL LABOUR FORCE
Section I-Persons engaged in Agricultural activities according to their main occupation in January 1951.
(Figures in italics denote Females included in the figures immediately above them)
Mails
1 20.798 2 1,031
3 4
5 6
7 8
9 10
11 12
13 14
1,661 390
628 20
15 17,688 16 611
17 15,938 18 611
19 20
21 22
23 24
25 26
1,750
821 10
821 10
Tea Plantation
LabourrefS
Diary Formers
and
I Poultery Workers ___ I
60,173 19,514
60,173 19,514
21,917 1,807
5,354 808
473
15.725 992
15,475 990
250 2
365 7
365 7
Number of Persons.
I ' I Silk I Other
Hunters Bee 'Worm and : Un-
I and Keepers II Workers I UncI as i- : employed
Trappers fled I ' ,-------;--------'-
108
lQ8
108
5,702 510
638 431
5,064 79
5,064 79
40 13
33 13
7
7
2,175 12
912 4
389
523 4
110 8
1.153(5)
1,31,484 12,145
20
20
71,153 7,365
5,416 433
26,663 3,998
25,739 3,998
924
28,232 448
25,135 447
3,097 1
TABLE ll-B-Section 2-SUBSIDIARY OCCUPATIONS OF AGRICULTURAL LABOUR FORCE.
Of the 1,69,02,827 persons forming the Agricultural Labour Force of Pakistan 16,96,754 were recorded as following subsidiary occupations of a nonagricultural nature. This Table shows numbers engaged in such occupation in each Province which were collected from answers in response to the second part of the Census Question No. 11, which asked:
"Have you any subsidiary means of livelihood: if so, what"?
2. This table has been discussed in Chapter 6 of the Report.
11-13
11- 14
TABLE ll-B-NO~-AGRJCULTURAL OCC{;PATIONS OF THE AGRICULTURAL
LABOUR FORCE
Section 2-Subsidiary Occupations
~umber of Persons.
Baluchistan, GROUP Class of Occupation Pakistan 1 and I East
I States Bengal 2
I I Union
---~----_ -- - _1 _____
TOTAL
SCIENCE & ART
CLERICAL & OFFICE
TRADE & COM-
MERCE
I PRIMARY PRO-DUCTION
TRANS-PORT
MANU-FACTURE
& CRAFTS
NOTES:
16,96,754 10,749 14,21,356
School teachers & Private tutors 47,815 45 47,667 2 Imams, Moazzins & Religious Workers 21,034 635 15,012 3 Hakim, Apothecaries, Mid-wives & other 2<},872 34 27,062 4
1. Excludes Federal Capital Area, Karachi, for which figures are not available. 2. Numbers of Pemales in the Agricultural Labour Force pursuing non-agricultural
subsidiary occupations are nearly negligible in all provinces except East Bengal figures for which are abvailable in the Provincial Report for that Province.'
3. Excludes figures for Frontier Regions.
11-15
TABLE -H-B-NON-AGRICULTURAL OCCUPATIONS OF THE AGRICULTURAL LABOUR FORCE
Section 2-Subsidiary Occupations
Number of Persons.
North-WesP PUqjab &: Sind & ' Class of Occupation Frontier I Bahawal- Khairpur GROUP
Province pur State State , ------1-
27,530 2,01,205 35,914 Total
2 17 86 SCIFNC~ School teachers & Private tutors 3 1,568 3,796 23 & Imams, Moazzins & Religious Workers 4 87 2,591 98 ART Hakim. Apothecaries, Mid-wives & other
health workers
5 17 Lawyers & Legal Assistants 6 13 Musicians & entertainers 7 Workers in Science & Arts lI.e.c.
TABLE 12--ECONOMIC GROUPS AND INDUSTRIAL STATUS OF NON-AGRICULTURAL CIVILIAN LABOUR FORCE.
This Table analyses the Non-Agricultural Section of Civilian Labour Force as shown in Table 11. It gives figures by sex of persons engaged in each Economic Division-and cross-classified them according to Industrial Status. As in the case of other Labour Force Tables the figures in this Table exclude Non-Pakistanis and children under 12 years of age.
2. The totals in this Table, agree with those shown in Table ll-A which analysis the same population according to Occupations.
3. The information regarding Economic Groups was obtained in response to Census Question No. 13 which asked, "In what kind of Industry, business or service did you work in January 1951"1 Th~ information reported was coded according to the Standard Industrial Classification Code (Pakistan) issued as Aooendix 'F' to the Code of Census Procedure Part II. This Code had been used as a basis for instruction of enumerators who were to explain to respondents that thev should report the industry etc., in which they had been engaged at any time or mainly during the whole month of January, 1951.
4. If a person did not work during that month, he was asked whether he had been seeking employment and if so, he was classed as 'Unemployed'. But the response to this question was not complete and therefore separate figures have not been given for the unemployed.
5. Data regarding Industrml Status were obtained in reply to Census Question No. 15 (see Title-Sheet of Table II-A). The Industrial Status of some of the persons shown against Economie Group "GOVERNMENTAL, MUNICIPAL ETC. SERVICES" is given to be employers and independent workers in table 12 in the Provincial Volume for East Bengal, and has obviously been shown in this All Pakistan Table as well. This is either due to mistake of classification in Economic Group or in Industrial Status or both. As the total number of employees etc. is to cross tally with that in Table "Occupation o~ NonAgricultural Labour Force" this 'lias b*,n left as it is in this table.
6. The data on'the enumiration s4Ps of the Non-Agricultural Labour Force were coded numerically and ~orted by,puncht1l card machines in Karachi and Dacca.
7. The Census question regarding\the economic group in which persons were engaged appears to have been poorly j.mderstood in many cases by respondents and also by enumerators. The classificat~n in accordance with the official code was therefore difficult. In these circumstances, many minor inconsistencies were detected during the compilation of the tabl~. These have been rectified as far as possible with reference to the occupatioual types shown in Table ll-A. The resulting data cannot therefore be regarded as being accurate in detail but it is believed to give a reasonably reliable view 6f the over-all distribution of the Labour Force. The rectification of mistakes meptioned above could not however be carried out in respect of the table 12 for East Bengal printed in volume 3 and the data for that province included in this table.
,
I
TABLE 12-ECONOMIC GROUPS AND INDUSTRIAL STATUS OF THE
NON-AGRICULTURAL CIVILIAN LABOUR FORCE
12-2
Self-supporting persons aged 12 years and over according to the main Economic Division in which
they were working a~d their industrial status (class of worker) in January 1951.
(Figures in italics denote the number of Females included in the figures immediately above them)
Number of Persons.
Industrial Status Total
Main Economic Divisions workers
I EmPlo,,,,! Em~:'" i Indepen- Unpaid dent Family
Workers Helpers i---~
Total all Divisions .. 54,89,857 47,935 19,12,682 34,33,180 96,060 2,75,515 931 71,375 1,80,895 22,314
Religion, Art, Public Infor- 73,284 281 13,281 59,024 698 mation & etc. 2,046 7 505 1,501 33
Other and Unclassified .. 8,42,037 2,394 1,95,233 6,37,886 6,524 including unemployed 39,218 45 6,372 32,361 440
1. Excludes (a) Defence Service (b) Economically inactive persons.
13-1
TABLE 13-ECONOMIC GROUPS AND OCCUPATIONS OF' CIVILIAN LABOUR FORCE.
1. This table cross-classifies the persons engaged in different Economic Activities with the broad classification of their occupations. The Population analysed is the whole of the Civilian Labour Force as shown in table 11.
2. The classification into Economic Division is based on the Standard Industrial Classification, i.e., the classification according to the main industries and services, issued as an appendix to the Census Code of procedure, as already stated in the title sheet of table 12.
3. The occupational classification is a simplified re-arrangement of the main Groups of Occupational classification as shown in table ll-A, Agricultural and Fishery workers have been placed in the same column but are naturally in separate Economic Divisions. The group 'Administrative' has been split into two broad classes instead of three by combining the Business and Governmental Executives while showing the clerical workers seprarately. The skilled operatives in this table include 'Mine and Quarry workers, Transport Operatives, Manufacturing workers, and Food Drink and Tobacco Processing 'workers.'
4. The sources of information for this table is the same as described for table II, ll-A and 12, so far as they concern the Industry and Occupations.
5. Females are included in each class, but are shown separately in the figures in italics immediately below.
6. The Census question regarding the economic group in which persons were engaged appears to have been poorly understood in many cases by respondents and also by enumerators. The classification in accordance with the official code was therefore difficult. In t~ese circumstances, many minor inconsistencies were detected during the' compilation of the table. These have been rectified as far as possible with" reference to the occupational types shown in Table ll-A. The resulting data cannot therefor~ be regarded as being accurate in detail but it is believed to give a reasonably reliable view of the over-all distributiqn of the Labour Force. The rectification of mistakes mentioned above could' not however be carried out in respect of the table 13 East Bengal printed in volume 3 and the data for that province included in this table.
7. A fuller discussion of the whole table is given in chapter 6 of the report Part I.
13-2
TABLE 13-ECONOMIC GROUPS AND OCCUPATIONS OF CIVILIAN LABOUR FORCE
Sell-supporting persons aged 12 years and Qver according tQ the main Economic Division and tbe main types of Occupations in
which engaged in January 1951
(Figures in italics denote the number of Females included in the figures immediately ahove them)
Types of Occupations ---
Main Economic Technical Adminis- I I I --1-Division Total and trative
I Clerical Sales AgriCUI-j Skilled I Un- I Service
This Table shows by provinces, states, and by sex the Agricultural Labour Force according to occupation and also divides the cultivators according to their agricultural status. The total number of persons dealt with in this Table is the same as in the box-head of ALF in Table 11. In provincial reports for West Pakistan provinces, this table gives details by districts and by sub-divisions in East Bengal. In East Bengal report this table also gives the breakdown by main religions, which has been reporoduced for the whole of the prOVInce of East Bengal in SC<:tion 2 of this table.
2. The information about the agricultural status of the cultivators was obtained by providing question 14 headed "C", "A" and "B". The Enumerators had instructions to ask the question and record answers of the respondents who had Shown their occupation to be tillers.
Do you own all or any of the land you till '!
Do you pay rent in kind or cash for any of the land you till?
Do you work as labourer for another Person who ttlls land?
If 'Yes', ring "C"
If 'Yes', ring "A"
If 'Yes', ring "Bn
3. The persons "A" shown owning part and renting part land tilled are those who had cloth "C" ringed and the persons shown renting and also working for hire had both "A" and "B" ringed.
4. A 'Cultivator' (Tiller of the Soil) was defined in the Enumerators' Instruction as a person who himself works on the land or who employs other to do so under his direct personal supervision.
S. Persons engaged in 'Forestry and 'Fishery' arc classed in the NonAgricultural Labour Force and are shown in Tables ll-A and 12 except in N.W,F.P., where the occupations are included in the other Agricultural workers columns.
6. This Table excludes persons of a nationality other than Pakistani and also all children under 12 years of age.
7. This Table has been discussed in Chapter-6 of Part I of the Census RepOrt.
14 1
14-2
TABLE 14--AGRICULTURAL LABOUR FORCE AND CULTIVATORS LAND TENURE
Section l-The Agricultural Labour Force! according to their Status and Cultivators by land tenure
(FiguTes in italics denote Females included in figures immediately aoove them)
Other Religions .. 1,13,058 52,344 45,130 12,990 4,896 6,317
;
NO*ES: 1. Excludes persons claiming Nationalities other than Pakistani. 2. Excludes children under 12 years of age.
~iIled
. 6,21,299
47,401
4,74,547 32,989
55,175 6,541
82,727 6,677
8,850 1,194
Renting & also Work-ing for Hire
4,10:121 24,603
3,24,899 16,528
24,111 2,555
54,977 4,937
6,734 583
TABLE IS-LANDOWNERS
1. In this table the persons over 12 years of age who reported themselves as owners of land have been classified according to broad categories of economic activities.
2. The information in this table was obtained from the following Census Questions:
(a) Question 11 asked "what is usually your main occupation"? If the person was a 'tiller of the soil', the enumerator put a ring round the appropriate symbol and the person was asked Question 14.
(b) All persons 12 years old and over who reported that they were selfsupporting or partly so were asked the Special Question: "Do you receive rent in cash or kind for the land you own but which is tilled by others?" If the answer were 'YES', the enumerator put a ring round the appropriate symbol.
(c) Question 13: asked "In what kind of industry or service did you work in January?" The answers to this question were used to classify landowners into Agriculturists, persons in Non-Agricultural activities and members of the Defence services. Those who answered 'NONE' to this question, and who had not reported in answer to Question 12 that they were seeking employment have been classified as "Economically Inactive".
(d) Question 14: asked all persons who claimed to be cultivators (see Q.11 above) whether they owned land and if their reply was 'YES' they have been included in the total of this table. The above question were addressed to all persons aged 12 years and over who claimed to be fully or partly self-supporting or claimed to be seeking work.
3. Due to incomplete classification at the sorting stage, the detailed data for East Bengal and Baluchistan is not available in this table according to the full scheme of the classes.
4. This table discussed in Chapter 6 of Part I of the Census Report.
15-1
15-2
TABLE IS.-LANDOWNERS
Economic Activities of persons owning Land
Number of Persons.
Pakistan East i Federal
Main Economic Group in which working
I
Baluchistan ' & States Union , Bengal I
Capital Area
, Karachi ----
Total Landowners 1,16,48,846 1,76,117 81,50,196 2,129
Agricultural Activities anG Fishery 1,14,37,826 1,66,066 80,87,137 45 2
Industry, Commerce, Professions & Services of which:-
Industry
Trade & Commerce
Transport, Shipping etc.
Government Service
Other Services & Professions
Economically inactive
2
3
4
5
6
7
8
9
10
T~LE 19-A MUHAJIRS' ORIGIN.
This Table is similar to Table 5 section 2 but is confined to an analysis of the population of Muhajirs only and shows from which zone~ of the sub-continent, outside the areas in which the First Census of Pakistan was conducted, the Muhajirs came. In comparing this table with Table 5 it should be remembered that these zones of origin of Muhajirs frequently differ from the places of their birth.
2. For Census purposes a Muhajir was defined as a person who had entered Pakistan as a result of Partition or for fear of disturbances connected therewith.
3. The information contained in this table was obtained from the replies to Census Question No. '} of the enumeration slip requiring the respondents to state whether they claimed to be Muhajirs, and, if so, to state the Province or State from which they .;ame.
4. The various Provinces and States of the sub-continent beyond the areas in which the First Census of Pakistan was conducted, have been grouped for the purposes of this Table in "Zones" as follows :--
ZONES PROYINCES(STATES AND AGENCIES.
NORTH Uttar Pradesh (U.P. and States)
EAST Assam and States, Bihar and States, Orissa and States, West Bengal and States, Nepal and Sikkim.
SOUTH Coorg, Madras and States, Mysore and Andeman and Nicobar.
WEST Bombay and States, Baroda State, West Indian States and Agencies and Portuguese India. (This zone includes the States of Junagadh and Manavadar*)
CENTRAL Madhya Pradesh (C.P.) Madhya Bharat (Central India States and Agencies). Bhopal State, and Hyderabad State*.
NORTH-WEST Punjab (I), Patiala and East Punjab States' Union, Ajmer, Delhi and Rajputana States and Agencies. Jammu & Kashmir State*.
OTHER PARTS French India, Bhutan and any other Indian State.
* Accession disputed.
5. This Table has been discussed in Chapter 2 of (he Census Report (part I).
19-1
19-2
TABLE 19-A-MUHAJIRS ORIGIN
Persons enumerated in Pakistan who reported them self as Muhajirs,l according to their previous
places of residence.
Number of Persons.
Zone of origin
Place of Enumeration --1-----
Total
1------ ----------,----- --' North _1 __ ~:__1 South
Pakistan
Baluchistan & States Union
Districts States Union
East Bengal
Federal Capital Area, Karachi
N.-W.F.P. & Frontier Regions
Districts Frontier Regions
Punjab & Bahawalpur State
Districts Bahawalpur State
Sind & Khairpur State
Districts Khairpur State
72,26,584 4,64,218
27,988 6,331
27,610 6,204 378 127
6,99,079 20,773
6,16,906 1,97,560
51,126 17,114
51,126 17,114
52,81,194 1.05,541
49,08,328 1,00,724 3,72,866 4,817
5,50,291 1,16,899
5,40,278 1,12,299 10,013 4,600
7,01,317
276
276
6,70,735
19,874
546
546
5,566
5,238 328
4,320
4,248 72
18,010
297 2
285 3 12 4
982 5
11,107 6
57 7
57 8 9
822 10
789 11 33 12
4,745 13
4,743 14 2 15
NOTES: 1. Muhajirs are defined as persdns who entered Pakistan on account of partition or for fear of disturbances connected therewith.
19-3
TABLE 19-A-MUHAJIRS ORIGIN
Persons enumerated in Pakistan who reported themself as Muhajirs, according to their previous
places of residence.
Number of persons.
Zone of origin I ------, North Other
I Place of Enumeration
West Central West Places
1,60,374 95,181 57,85,096 2,388 Pakistan
2 1,538 3,011 16,501 34 Baluchistan & States Union
3 1,519 2,986 16,306 34 Districts 4 19 25 195 States Union
5 1,855 2,697 2,009 28 East Bengal
6 1,19,158 49,579 2,17,649 1,979 Federal Capital Area, Karachi
7 355 1,673 31,375 6 N.-W.F.P. & Frontier Regions
8 355 1,673 31,375 6 Districts 9 Frontier Regions
10 5,404 17,175 51,46,686 Punjab & Bahawalpur State
13 32,064 21,046 3,70,876 341 Sind & Khairpur State
14 31,988 20,799 3,65,860 341 Districts IS 76 . 247 5,016 Khairpur State
19-4
TABLE 19·B-MUHAJIRS· EDUCATIONAL LEVELS.
This Table is a separate analysis of the literate MUHAJIRS included in Table 9-B and follows the same pattern. The data for this Table also were collected in like manner.
2. A MUHAJIR was defined as a person who moved into Pakistan as a result of Partition or for fear of disturbances connected therewith, no matter from where, when or for how long a stay.
3. This Table is discussed in Chapter 4 of the Report.
19-5
TABLE 19-B-EDUCATIONAL LEVELS OF MLHAnRS
Literate Muhairs analysed according to the grades to which they claim to have progressed in
educational institutions
(Figures in Italics show the number of Females included in the total above them)
Number of Persons.
Without I
Province and State Total Formal I Primary Middle Matri- Degree Higher Literates I attain- School School culation Degree
NOTE: 1. Literate persons who did not claim one of the grades mentioned in this table are classed as having no formal attainments.
19 -6
TABLE 19-C-MUHAJIRS LABOUR FORCE
This Table show the total Muhajir population according to economic status. Muhajirs have been treated as part of the normal population and included in the figures for Table 11. This is a separate Table showing the numbers of Muhajirs in each category of Table 11.
2. Labour Force, Agricultural and Non-Agricultural, dependents and other terms have the same sense as explained in the title sheet of Table 11 and the same methods were used in collecting the information.
J. This Table has been discussed in Chapter 6 of the Report.
19-7
TABLE 19-C-MUHAJmS IN THE LABOUR FORCE
The total Muhajir population according to Economic Status
Province & State
--
PaJdstan
Baluchistan & States Union
Districts States Union
East Bengal
Federal Capital Area, Karachi
North-West Frontier Province2 ••
Punjab & Bahawalpur State
Districts Bahawalpur State
Sind & Khairpur State
Districts Khairpur State
Self-supporting
Civilian Labour Force ratal 1
Agricul-tural
AIl Persons
72,26,584 13,01,324
27,988 1,251
27,610 1,241 378 10
6,99,079 1,09,386
6,16,906 1,790
51,126 7,838
52,81,194 11,22,782
49,08,328 10,42,301 3,72,866 80,481
5,50,291 58,277
5,40,278 57,215 10,013 1,062
Non Agricul
tural
11,08,998
8,943
8,797 146
1,00,918
2,17,733
7,693
6,43,591
5,92,622 50,969
1,30,120
1,28,279 1,841
Number of Persons.
Nat in3 Dependents Civilian Labour Force
64,915 47,51,347
3,010 14,784
3,005 14,567 5 217
3,266 4,85,509
5,369 3,92,014
4,360 31,235
45,438 34,69,383
43,218 32,30,187 2,220 2,39,196
3,472 3,58,422
3,259 3,51,525 213 6,897
NOTES: J. Excludes pl?rsons who reported their Nationality other than Pakistani. 2. Includes only the settled districts in respect of N.-W.F.P. 3. Includes Defence Services
19-8
TABLE 19-C ·MUHAJJRS IN THE LABOUR FORCE
The total Muhajir population according to Economic Status
Number of persons.
Self-supporting I ----
j\j"t in --1 Dependents Province &. State Total Civilian Labour For~..: -_--_ ---- ClVIli.m
Non- L"JOl.r Agricultuml Agricultural FOlce '
-- - -- -____ 1 ___ -
Male
Pakistan 31),21,678 12,66,410 10,94,1~9 o3,8SS 14,97,21 t
This Table is exactly the same as Table 13 but is confined to the analysis of Muhajirs population only.
2. The persons dealt with in this Table are also included in Table 13.
3. Accuracy of classification of occupation according to the Economic groups has been discussed in the title sheet of 13 and the same apply equally to this table also.
4. This table has been discussed in chapter 6 of the report.
19-11
TABLE 19·D-ECONOMIC GROUPS AND OCCUPATIONS OF MUHAJIRS
AIl·Pakistan
Self.suppor(ine Muhaiirs' aged 12 years and over according to the main Economic Division. and tbe main type. of
Occupation in which engaged in January 1951
«Figures in Italics del/ote the number of Females included in the figures total above them)
Number of person •.
Types of Occupation --------------------------------
Main Economic Total '";j~ J, ~ tid r! ~ ~ ~C • '2b v~ Division Workers u~"; -.-I ~;;':a -; ~ Q III 0 :;j- t,) u "0 e til I _ ~ (J U :; 'S 0 Q ,S';j 'C oe-=< I ~~ .~ e~.!a4 ~ 0 ~:;::I '>~ oS .gil:; ~ ~ e:8 ~ 50 S I ~~ bi,Sji; S :>!O"'::' ~2 :;~ 0 ~o"Ij i <-o"Ij 0 ~ I I < o"Ij~ til ;:>,:3 til
2. Economic group & occupational classification is not available for 47,137 Muhajirs classed as N.A.L.P. in Table 19.C F.e.A. Karachi and therefore the figures does not tally with the coresponding figures III Table 19·C.
3. Includes forestry workers in respect of Punjab.
TABLBNo.
1 3 4 4-A 5
6 7 7-A 8 8-A
9 9-A 9-B 100A 11 ll-A
12 13 14 IS
I9-B I9-C 19-D
PART m
FEDERAL CAPITAL AREA, KARACHI
List of Tables
Explanatory Notes .. Population Variations Age & Marital Status Orphans
SUBJECT
Birth place & place of origion of Muhajir's
Religion Mother Tongue Speech Literacy Languages of Literacy
Pupils and Students .. Years of Education Educational Levels Afghan Powindahs Labour Force Occupations of Non-Agrioultural Labour Force
Economic Groups & Industrial Status of Non-Agricultural Labour Force Economic Groups and Occupation of Civilian Labour Force Agricultural Labour Force and Cultivators Land Tenure LandOwners
Educational levels of Muhajir's Muhajir's in Labour Force Economic Groups and Occupations of Muhajir's
PAGE No.
III-I IU-3 Ill-S 1II- 6 1II-12 IU-14
III-IS 1lI-16 III-I 7 Ill-I 8 III-20
I11-22 1II-24 1II-26 III-27 1II-28 1II-29
1II-31 111-32 1I1-33 III-33
1II-34 111-3S 1II-36
lH-l
PART III-FEDERAL CAPITAL AREA KARACHI.
EXPLANATORY NOTES
Brief explanatory notes regarding various statistical tables that follow are given below:-
Table I-Population.-This Table presents an analysis by localities the distribution of popUlation and persons p~r sq. mile, The population has also been shown by sex. Non-Pakistanies are included in this Table.
Table 3-Variation.-This Table shows decennial changes in population since 1901. The population analysed is the total population including persons claiming nationalities other than Pakistani.
Table 4-Age and Marital Status. -This Table analyses the total population (Excluding non-
Pakistani) by basic age-groups, mam religions, sex and marital status.
Table 4-A-Orphans.-This Table gives information by religion, sex and age about the children under 12 years of age whose fathers were reported to have died before February 1951.
Table 5-Birthplace.-This Table shows the population (excluding Non-Pakistanies) analysed according to Birth place and placc of Enumeration.
The various Provinces and States of the subcontinent beyond the areas in which first Census of Pakistan was conducted have been grouped for the purpose of this Table in Zones as under.
Zones State/Province. and Agoncieo.
Uttor Pradesh tU.P. and States). North East Assam and Assam States; Bihar and Bihar States; Onssa and State; W~st Bengal and State and Nepal
and Sikkim. South West
Coorg, Madras and State.; Mysco and Andeman and Nico-Islands. Bombay and States; Baroda State; West Indian States and Agencies; Portugese India. (This zone includes the States of Junagadh and Manavadar·)·
Central Madhya Pradesh (C.P.); Madhya Bharat (Central India States and Agencies); Bhopal State; and Hyderabad State".
North-West Punjab (I) and Patlala. and East Punjab S'tates' Union; Ajmer; Dehli; and Rajputana States and Agencies; Jammu and Kashmir·,
Other Parts Flench India; Bhutan and any other Indian State.
• Accession disputed
Table 6-Religion.-This Table analyses by localities the distribution of population according to main religions.
Table 7-Mother Tongue.-'Mother Tongue' was defined as "The language spoken from the cradle". Enumerators were instructed that in the case of very young children and of deaf and dumb persons, it should be the language spoken by their parents.
Table 7-A -8peech.-This Table shows the number of persons who commonly speak each of the main languages of Pakistan: Many respondents claimed to speak more than one language in addition to their mother-tongue. Therefore no "Total" column is provided in this table since the total number of speakers exceeds the total population, many persons appearing
more than once in the figures.
Table 8-Literacy. ~ This Table shows the size of the literate population (excluding persons claiming nationalities other than Pakistani) and their percentage to the total population.
Table 8-A-Languages of Literacy.-This Table shows the number of persons (excluding those claiming nationalities other than Pakistani) in each district who are litcrate in any of the nine principal languages of Pakistan. In the column for Arabic is shown the number of persons who claimed ability to read in that language the Holy Quran only.
Table 9-~Pupils and Students.-This Table shows for each locality the number of persons who reported themselves in the Census, as regularly attending school or college.
Table 9-A-Years of Education.-This Table shows how many persons out of the total population (excludij,g Non-Pakistanis) have received or are receiving formal schooling and analysis them according to sex and also according to number of years spent in full time education.
Table 9-S-Educational levels.-This Table analyses literate persons according to the educational grades claimed by them as shown in Table 8. The population analysed in this Table is that of all literate persons excluding those who claimed nationalities other than Pakistani.
Table lO-A-Afghan'; Powlndahs.-This Table presents an analysis of Afghan Powindahs by occupations.
Table ll-Labour Force.-This Table classifies the tota\ population excluding Non-Pakistani into broaq categories of Economic Status. Dependents include all children under 12 years of age and all other persons who did not claim to be self-supporting partly so, or seeking work.
Table l1-A-Occupations of Non-Agricultural Labour Force.-This Table shows the composition by detailed occupations and certain occupational sub-groups of the sections of the Civilian Labour Force classed as Non-Agricultural Labour in Table 11. All non-Pakistani citizens and children under 12 years of age are excluded.
Table lZ-Economic Groups and Industrial Status of Non-Agricultural Civilian Labour Force. This Table analyses the Non-Agricultural section of Civilian Labour Force as shown in Table 11. It gives figures by sex of persons engaged in each Economic Division and cross-classifies them according to Industrial Status. The figures in this Table exclude Non-Pakistanis and children under 12 years. The totals in this Table, including the figures for unemployed, agree with those shown in the analysis in Table ll-A of the same population according to occupations.
Table 13--Economic Groups and occupations of Civilian Labour Force.-This Table crossclassifies the persons engaged in different Economic Activities with the broad classification of their occupations. The population analysed is the whole of the Civilian Labour Force as shown in Table 11.
1II-2
Table 14-Agricultural Labour Force.-The Agricultural Labour Force, shown in Table I I is further analysed in this Table by different categories of Agriculturists and by land tenure classes of cultivators. A cultivator (tiller of soil) was defined in the enumerators' instructions as a person who himself works on the land or he employes other to do so under his direct personal supervision. This Table also excludes persons having a Nationality other than Pakistani and also children under 12 years of age.
Table 15-Landowners.-This Table deals with persons who reported that they owned land, and analyses them in broad categories according to their economic activities.
Table 19-B-Muhajirs Educational Levels.This Table is a separate analysis of the literate Muhajirs included in Table 9-B and follows the same pattern. A 'Muhajir' was defined as a person who moved into Pakistan as a result of Partition or for fear of disturbances connected therewith.
Table 19-C-Muhajirs Labour Force.-This Table shows the total Muhajir population according to economic status. Muhajirs have been treated as part of the normal population and included in the figures for Table 11.
Table 19-D-Economic Groups and occupations of Mubajirs in Civilian Labollr .Force.This Table is exatly the same as Table 13 but is confined to the analysis of Muhajir population only. The persons dealt with in this Table are also included in Table 13.
NOTE:-l. Tables I-A, 2 and Il-B are un-necessary for Federal Capital Area, Karachi and for this reason they have been dropped.
2. Figures of Table 10 for Federal Capital Area, Karachi have been considered un-reliable and for this reason this Table has also been dropped.
3. For Federal Capital Area, Karachi figures of Table 19-A have been amalgumated with Table 5.
III-3
TABLE I-POPULATION
Federal Capital Area Karachi
Distribution of urban and rural population by sex and person per sq. mile.
Number of Persons.
I Area Total Popu\ationl Persons Locality Sq. Mile
i
per Total Males I Females Sq. Mile
Federal Capital Area, Karachi 2 812 11,26,417 6,46,001 4,80,416 1,387
Municipal Corporation 32 9,05.781 5,13,764 3,92,017 28,306 2
Cantonment Area (Civil) 4 1,03,657 58,471 45,186 25.914 3
Other Cantonments 194 59,021 42,289 16,732 304 4
Rest of Karachi Taluka 583 57,958 31,477 26,481 99 5
NOTE:-l. Includes persons claiming nationality other than Pakistani.
2. The Federal Capital area is all classed as urban except "rest of Karachi Taluka," which is classed as rural.
IlI-4
TABU 1-POPULATION
Federal Capital Area Karachi
Distribution of urban and rural population by sex and persons per sq. mUe.
Section I-Children under 12 years of age whose fathers had died.!
Number of Persons.
I Muslims I Caste Schedule I
Other Locality I Total ,---- Hindu Castes : Religions
Orphans: Total Muhajirs Others I I __
Ail Persons
Federal Capital Area 10,749 10,289 5,233 5,056 24 153 283 Karachi
Municipal Corporation 9,628 9,229 4,719 4,510 17 131 251
Civil Cantonment 340 310 119 191 7 16 7
Other Cantonments 225 197 127 70 4 24
Rest of Karachi Taluka 556 553 268 285 2 1
Male
Federal Capital Area .. 5,430 5,192 2,545 2,647 21 77 140 Karachi
Municipal Corporation 4,981 4,776 2,361 2,415 14 64 127
Civil Cantonment 229 207 69 138 7 11 4
Other Cantonments 102 92 71 21 2 8
Rest of Karachi Taluka 118 117 44 73
Female
Federal Capital Arca .. 5,319 5,097 2,688 2,409 3 76 143 Karachi
Municipal Corporation 4,647 4,453 2,358 2,095 3 67 124
Civil Cantonment 111 103 50 53 5 3
Other Cantonments 123 105 56 49 2 16
Rest of Karachi Taluka 438 436 224 212 2
NOTE:-l. Excludes children claiming Nationality other than Pakistani.
UI-I3
TABLE 4~A-ORPHANS
Federal Capital Area, Karachi
Section 2-Children under 12 years of age whose fathers had died. l
Number of Persons.
I ' I I Total I Muslims I
Locality , Orphans I--- - . ---I Caste I Schedule I Other 1-________ :I _____ T~_ta_l 1_ M_l_lh_aJ_·jr_s _l_O_th_e_rs _,_H_i_nd~_C_a_st_es _!Relig~ons
All Ages and Sex
All Ages
Under 1 year
1-4
5-9
10-11
All Ages
Under 1 year
1-4
5-9
10-11
10,749
5,430
217
1,861
2,118
1,234
5,319
274
1,591
2,322
1,132
10,289
5,192
199
1,800
2,020
1,173
5,097
259
1,526
2,212
1,100
5,233
Male
2,539
71
954
918
596
Female
2,694
106
867
1,116
605
5,056
2,653
128
846
1,102
577
2,403
153
659
1,096
495
24
16
7
8
8
7
1
NOTE: -1. Excludes children claiming nationality other than Pakistani.
153
82
4
14
42
22
71
5
17
35
14
283
140
14
46
49
31
143
10
48
68
17
l1I-14
TABLE 5-0ffiTHPLACES AND PLACES OF ORIGIN OF MUHA.TIRS 1
Federal Capital Area, Karachi
Persons enumerated in the Karachi Federal Capital Area according to their places of birth, and for
Muhajirs, the places in which they formerly resided
Number of Persons.
Places of Birth (Muhajir's places of former residence)
Total all Places
Pakistan
Baluchistan or States Union East Bengal .. Karachi Federal Capital Area N.-W.F.P. or Frontier Regions Punjab or Bahawalpur State Sind or Khairpur State
Other places of Pak/India Sub-continent 2
Northern Zone Eastern Zone Southern Zone Western Zone Central Zone ~.-West Zone Other parts
Muslim Countries in other parts of Asia
Afghanistan . . . . . . Saudi Arabia, Yeman, Oman, Aden or Bahrein Indonesia, Sumatra, Java, Borneo, or Sarwak Jran or Kowait Iraq Syria " .. .. Transjordan, Lebanon or Palestine Turkey .. Other Asiatic Muslim Countries
Other Countries in Asia
Burma Ceylon China Tibet Elsewhere in Asia
Non-Asiatic Muslim Countries
Other Countries
I All enumerated persons
11,22,4063
4,60,237
33,744 2.844
3,06,856 47,953 54,275 14,565
6,55,811
2,00,861 13,755 11,829
1,51,887 51,065
2,26,029 385
3,145
1,037 745
4 955 211
16 6
133 38
1,579
1,237 121 136 23 62
134
1,500
Persons4
claiming to be Muhajirs
6,16,906
6,16,906
1,97,560 19,874 11,107
J,19,158 49,579
2,17,649 1,979
NOTES: 1. A 'Muhajir' was defined, for census purposes, as a person who had entered Pakistan on account of Partition or for fear of disturbances connected therewith.
2. For list of States etc., included in each zone, see Titles-Sheet. J. Excludes persons claiming a nationality other than Pakistani. 4. 'Muhajirs' are included in the totals given in the previous column, but are shown
separately in this column according to the zones of the sub-continent in which they resided previously to entering Pakistan. This column replaces and is comparable with table 19-A in Part II of this book.
I1I-lS TABLE 6---RELIGION
Federal Capital Area, Karachi
Number of Persons.
Locality Total l Muslim Caste I Scheduled I Christian I Parsi Others Hindu 1_ Caste: J ___
Federal Capital Area, 11,22,406 10,77,694 4,641 13,412 20,427 5,018 1,214 Karachi
1. Excludes 4,011 persons claiming Nationality other than Pakistani.
III-16
TABLE 7-MOTHER TONGUES
Federal Capital Area, Karachi Number of Persons.
Languages Number of Persons
Total l
Austric Family
Santhali and Khasi
Dravidian Family
Brahui South Indian Languages Tribal Dravidian Tongues
Indo-European Family
Dardic Branch
Kafir Tongues Kashmiri Khowar
Kohistani
European Branch
English
lndo-Arvan Branch Assamese Bengali Gujrati Hindi Marathi Oriya Punjabi2
Rajastha1ll' Sindhi4
Urdu
Iranian Branch
Baluchi Persian Pushtu
Semitic Family
Arabic
Tibeto-Chinese Family
Arakanese Burmese Other Assam-Burman Tongues
Various Central ASIan
Tribal Tongues of N.W.
Unclassified
Other Languages
11,22,406
11
351 2,609
57
41 761 12
131
7,983
3 3,199
1,27,555 644 773
17 99,535 6,696
1,57,466 5,65,816
97,509 2,481
37,284
808
1 III
6
102
10,444
NOTes: I. Excludes persons claiming nationality other than Pakistani. 2. Includes 96 persons who reported Multani as their mother tongue. 3. Includes 919 persons who reported Kattewadi as their mother tongue. 4. Includes 5 persons who reported Lari and 2 persons who reported Jattki as their
mother tongue.
1II- -17
TABLE 7-A-SPEECH
Federal Capital Area, Karachi
Include!> both the persons who claim each language as their Mother Tongue (See Table 7) and thOlie who reported it as, another language commonly spoken by them.
Arabic
Baluchi
Bengali
English
Persian
Punjabi
Pushtu
Sindhi
Urdu
I
Language
Number of Persons.
Persons commonly speaking nine main languages of Pakistan --_-- --------
Numbers1 Percentagcs2
2,371 .2
1,03,182 9.2
5,070 .5
97,506 8.7
22,391 2.0
1,07,043 9.5
41,343 3.7
1,86,723 16.6
7,61,353 67.8
NOTE:- 1. Excludes persons claiming nationality other than Pakistani.
2. Total Population=100%
III--18
TABLE 8-LITERACY
Federal Capital Area, Karachi
Section I-Religion
Figures inItalics show the numbers of Females who are included in the total above them)
Number of Persons
I Literate persons
I Population 1
Muslims I I -----
Federal Area Caste I Scheduled Other I Total Hindus Castes I Religions
, I Federal Capital Area, 11,22,406 3,52,774 3,40,019 1,573 1,036 10,146
Leather Workers Paper Mill Workers Printing Trade Operatives Building Trade Operatives Electrical Workers Other Skilled production
Workers
Food, Drink Tobacco processing workers
Unskilled Labourers
Domestic Servants
Other Service Workers and Police, Fire and Services
Unclassified
3,73,796 3,63,209 10,587 1,041 281,483
10,449
1,119 36
2,995 918
1,427 1,123
294
498 112
1,927
75,330
7,209 1,344
66,777
70,831
1,929
4,000
252
16,185
13,808 1,301
866 210
58,032
17,298 14,054 7,412
102
475 579
4,919 1,041 1,624 7,102 2,033 1,393
6,141
70,596
30,366
29,410
275
8,999
1,119 36
2,167 899
1,283 789
289
497 112
1,808
74,038
7,169 1,332
65,537
70,216
1,929
3,963
244
16,168
13,801 1,300
865 202
57,456
17,278 13,599 7,398
102
470 575
4,891 1,038 1,623 7,062 2,030 1,390
6,097
68,992
26,166
28,666
275
1,450 100 7,392
986 29
7 2
828 20 1,834 730 780 691
19 2 144 46 334 5
5 4 240
378
119 11 82
1,642
1,292 686 69,842
4,284 1,332
64,226
40 686 12
1,240
615 98 38,284
37
8
17
7 I I 8
576
20 455
14
5 4
28 3 1
40 3 3
44
1,604
4,200
744
2
9
1
1,803
3,109
233
32 13,133
16 10,966 9 1,270 5 708 2 189
50 43,520
6 13,337 5 9,978 5 5,065
,3
6 12 1
10
7
97
298 483
4,030 769
1,507 4,886 1,885 1,185
4,738
16 50,625
3 25,563
37 23,017
224
Note: 1, Persons under 12 years of age are excluded.
80,310
1,498
126 5
313 158 457
93
45
116 30
155
3,507
2,197
1,310
31,668
124
841
10
2,985
2,800 21
152 10
13,809
3,900 3,592 2,320
5
171 91
852 268 109
2,163 143 195
1,348
18,343
598
5,533
48
375
9
9
3
2
166
4
20
19
77
35 24 8
6 1 I 1 1
4
2
79
3
31 10,038 515
8 1,378
2 S08 I 14 2 123 2 316
116
4 1,268
64
18 4
19 16
5
2
20
4 31 5 12
1,225 15
10 500 103
2
3S
8
15
6 I 1 7
523
16 411
13
4 3
27 3 1
39 3 3
41
1,564
2
53
4 44
1
3
40
5 4,074 121
2 632 109
3
2
3 4
5 6 7 8
9
10 11 12
13
14 15 16
17
18
19
20
21
22 23 24 25
26
27 28 29 30
31 32
33 34 35 36 37 38
39
40
41
42
43
2
3 4 5 6 7 8 9 o ,I '2
3
4 S 6
,7 18
19
20
21
22 23 24 25
26
27 28 29 30 31 32
33 34 35 36 37 38
39
40
41
42
43
IH-30
TABLE U-A-OCCUPATION OF THE NON-AGRICULTURAL LABOUR FORCE
Federal Capital Arell, Karllchi
Self-supportin: persons engal:ed in aetivities other than Cultivation and Anlmal Husbandry, according to their Occupation in JPDuary 1951
Number of Persons,
Age Groups ; Educational Level I
Moles 1 Females I Both Sel(es r----r-,--,-.. --,---:--I-.. -I----:-;;-----I--I-----
.. '" "" '" !I <» <» 1 '<t I v ~ ;e~ i:' ~ " " - - " or, 0 - ,- I N I '" I 0 I ~~ e 1 '1J ';:: ~ r\ ~! ~ I J o'Ij I ~ l I J ~ I o'Ij .9 ~ I ';:: ~ I i I ~ - I ~ n N VI 1- 1- N IN, ..., I Voj p,
TABU:-13 ECONOMIC GROUPS AND OCCUPATIONS OF CIVILIAN LABOUR FORCE
Federal Capital Area, Karachi
Sell-supporting persons aged 12 years and over according to the main Economic Division and the main types of Occupations in which engaged in January 1951.
(Figures in italics denote tbe number of Females included in the figures immediately above them.)
Number of Pehons.
f\lain '&onOml\! Oivblon
Total All Division
Cultivation
Animal Husbandry
Other Agnouiture
Fore!!ttry
Flsherv
I\linrng
Manufactuflng
Building~ Cono,t ru...:tLoo & ElectricIty. Water Ua, eto.
Municipal Corporation .. 2,20,010 4 3,207 4 62,206 1,54,589
Cantonment Area (Civil) ., 37,501 - 458 3 10,665 26,375
Other Cantonments " 7,316 - 7 73 1,853 5,383
Rest of Karachi Taluka .. 1,510 37 67 2 382 1,022
NOTES:- (I) Excludes persons who reported Nationality other than Pakistani.
(2) Includes Defence Services, and also self supporting persons, not economically active, such as retired persons, student institutional inmates, etc.
nt-36
TABLE 19-D-ECONOMIC AND OCCUPA'ttON OF MUHAJIRS
Federal Capital Area. Karachi
Self-supporting Mubaiirs 1 aged 12 years and over according to the main Economic Division and tbe main types of occupations in whicb engaged in JanulU'Y 1951
(FigtJres in Italics denote tbe number of Female. included in the figure. immediately above tbem)
Number of Persons.
Type of Occupations
Main Economic Division Total I old] Ie] 1\ a(l~ 1--,,- ~ ~ ~ 1--,,-1 -g ~ --.,----
Muhajirs ta.2 I~~~ C;O l}tl titt '2.=: ae' 8t ~ Workers 'a~ :!3~~1 ,~~ .r~ I '3~~ I Ee ~g 1 H oS -",'" a'~" il8 I ",0 u,~g "'... 'A L:_0 0 g£ ~ ~ i \ UlE ~ '5,11<.,. '" go,;5.:3 "'~
2. The Economic Group and occupational classification is nol available for 47,137 Muhajirs out of 2,19,733 classed as the Non-Agricultural Labour Force in Table 19-C.
2
3
P"K 4
6
B
1 N.me
M 5 W
c A
E
~-lW''-j c»", I /~~,",.c..~:"''''~<.L:..::~~A ___ _ L- '--
eifel!!:
B
C"" .... 51-No.9 (8.g''''')
CENSUS OF PAKISTAN 1951.
INSTRUCTIONS FOR ENUMERATORS.
1. Remember what you heard at the class of instruction.
2. Read the notes on the back of this paper carefully and be ready to explain them to respondents who have any difficulty in choosing their answers. .
1. Fill in the Location Code at the foot of each shp at home before you start enumeration. .
6. Do not write in the shaded spaces on the shp:these are use in the Census Office.
5. Write clearly in INk. Make symbols definite and firm.
QUESTIONS HOW TO WRITE ANSWERS ----
PRELIMINARY QUESTIONS
House Number Write in box. Have you been enume- If not ask question 'a'.
rated already? If yes carry out enumeration
in full. If not ask question 'b'.
a. Is this your present REGULAR residence or lodging place?
b. Will you be BACK If no, or doubtful, carry out in your normal resi- enumeration. dence before 28 February?
If yes, do not make out a slip but carefully warn the person that it is his/her duty to see that a slip is made out at his/her normal residence.
1. NAME? Write it out. if a tribesman, put name of
tribe or tribal section in brackets after the name.
RELATION to Head Write under KIN of Household? I--Head.2-Wife
- • 3-Son or Daughter 4- -Father or Mother 5- -Other relations X-No relation
SEX? In bottom comer Ring round M for Male: F for Female-
2. AGE in years? Write number of years com pleted on 28 February 1951
for infants under 1 year Wr!te in box, age in months. for children up.der 12 If No put Ring round age fig-
year5 Is FATHER ure. Living? If Yes put v' after age figure.
MARRIED? Ring round M SINGLE? (i.e. never
married) WIDOWED? DIVORCED?
S :: :: w
D
3. Were you BORN in If 'yes' put V this DISTRICT?
If not WHERE? Other places in Pakistan or Bharat write name of DISTRICT
Elsewhere write name of COUNTRY only.
2
QUESTIONS HOW TO WRITE ANSWERS
4. Are you a PAKIS- If 'yes' Ring PAK TANl? for Pakistanis on visits out
of Pakistan, write country being visited, e.g. 'IN U.K.
If not: What is your Write it out NATiONALITY?
If an Afghan: Are you If yes put "PA" aPOWINDAH?
If so: Where is your Write place in respondent's party settled this words. winter?
5. RELIGION?
For Hindus: Are you a Caste Hindu or do you belong to Scheduled Caste?
Ring round the appropriate Number. (Note that number 7 applies in Chittagong Hill Tracts only).
6. MOTHER TONG UE? Put v' underlanguage spoken from the cradle.
-------------------------------7. AllY ather language Put V under languages you commonly spoken SPEAK? .
8. Can you READ? If 'No' put big X over all WRITE? spaces on this line.
IN what languages? If 'Yes' put under language P for Reads L for Reads and writes.
Under Arabic Q for Reads Holy Quran only
9. Are you a MUHA- If 'No' put X JIR?
If yes: From which PROVINCE or STATE?
10. EDUCATION
Write it out, but if the place is seen to be the same as the person's birth place it may be indicated by puting figure 3.
(a) Are you regularly If yes ring round S. attending School or College?
(b) For how mallY years have you attended School or College?
(c) How far has your education pro-gressed?
Write figures under years. If respondent has never attended School put X under Years.
Completed Primary School: Ring round P Passed Middle School Exam: " " M Passed Matriculation (Entrance) Exam:" .. E Obtained University Degree: " " D Obtained Higher (Post-Graduate)
Degr.ee " " H
3
QUESTIONS HOW TO WRITE ANSWERS
FOR PERSONS UN- Draw big X through spaces DER 12 YEARS l1A to 16. OF AGE THIS COMPLETES THE QUESTION
EUMINA TING QUESTION:-
Are you usually selfsupporting or partly self-supporting or are you seeking work?
l1A. What is USUALLY your main OCCUPATlON (Kind of work)? (For Muhajirs: What WAS your main occupa-
tion) ?
If No' put)a big X over the whole space from 11 A to 15. This then completes the questions except for women to whom 16 applies
If 'Yes' ask all the questions.
If a 'Tiller of the Soil' Ring T. Otherwise, wire it out. If no work IS (or was) ususually done put X.
lIB. Have you any Write it out. SUBSIDIAR Y means of livelihood, if so what'!
SPECIAL QUESTION:
Do you receive rent in If 'yes' Ring Z in space 14. cash or kind for land you own bllt which is tilled by the others.
12. What was your ac- If same as llA putv tual main occupation If, not, write it out. in JANUARY 1951?
If unemployed throu- If unemployed, put X and ghout January 1951. ask question A.
A. Were you SEEKING employment?
B. In what occupation?
C. How many months had you been unemployed and seeking work at the end of January?
13. ECONOMIC GROUP
If 'No' put another X: if 'Yes' ask question Band C
If same as ItA put Vafter the X otherwise write it out after the X.
Put number of months after the above.
Example: 'XV3' means the person was unemployed throughout January, was seeking work in his usual main occupation and had been unemployed since November 1950 i.e. for the 3 months ending January 31, 1951.
In what kind of Write it out. industry, husiness or ser-vice did you work in January?
14. AGRICCLTURAL For persons marked T in STATUS question llA.
Do you own all or any If 'yes' Ring C of the land you till?
4
QUESTIONS HOW TO WRITE ANSWERS
Do you pay rent in cash or kind for any of the land YOll till?
If 'yes' Ring A
Do you work as a labourer for another person who tills land?
15. INDUSTRIAL STATUS
In your main occupa-tion.
" B
For persons NOT marked T in question ItA.
Do you employ others ? if 'yes' Ring EO Or are you an employee?" " " E Or are you an independ-
ent worker? Or an unpaid family
help?
16. For WOMEN who are or ha\e been MARRIED
a. During her whole life
" " " I " " " F
How many years has Write under WED total num-she been married al- ber of yeaTS. together?
How many children have Write under CH'RN total been born alive to her number of children. altogether?
b. During the last 12 months -
Hall' many children have Write under BORN, number been born alive to of children born during the her? year ended 28 February
1951.
Are they all living?
What was the age in months of any of them who died?
ABSENTEES:
If 'yes' put V und<;;r LIVED for each Child stilI living.
Write under LIVED number of month during which the child lived.
If more than one child is given under BORN, show them separately under LIVED thus:
v - V 6 means that out of three Children born in this year two are now living and one died at 6 months
Are any persons who If 'yes' ask question A and B usually live in your household ABSENT?
B. Will the person be If 'yes' to both qut:Stions ask
A. Did the person leave} before 7 February ?
away until after 28 question C. February?
C. Is the person staying If 'yes' no further action INSIDE Pakistan? needed.
If ''Ko' to either A, B or C make out a slip for the absent person on replies given by a responsible member of the household who should sign the slip.
Table No.
2
2
2
2
2
2
2
2
2
4
" 4
4
4-A
4-A
Page No.
1-2
1-2
1-2
1-3
1-3
1-3
1-3
1-3
1-3
1-3
1-3
1-3
1-3
2-1
2-1
2-2
2-2
2-2
2-2
2-3
2-3
2-3
3-2
4-4
4-4
4-14
4-15
4-19
4-20
CORRIGENDA
Line No.
9
10
14
6
6
7
9
10
11
12
14
14
Para 3 Line 3
Para 6 Line 2
.. I
In class &: 1,00,000 &; Over Line 1
Against F.C.A. Karaclli.
In cIa .. II 25,0~ to I,OJ,O)) Ib, I
Against East Beng~l.
Against Karachi.
Foot Note
Correction Required
----------------------------------In the col. headed "Female" "Under Total Populationd" tbe
correct figure is 1,251 instead of 1,252.
In the col. beaded "Male" under "Total Population" the correct figure is 1,10,59 instead of 1,10,58.
In col. headed "Total" under "Total Population" the correct figure is 4,609 instead of 4,608.
In the col. headed "Total" under Urban population the correct figure is 78, 63 instead of 78,69.
In the col. headed "Male" under "Urban Population" the correct figure is 615 instead of 614.
In the col. headed "Male."," under "Rural Population" the correct figure is 31 instead of 32.
In the col. headed "Total" under "Rural Population" the correct figure is 5393 instead of 5,394.
In the col. headed "Female" under "Rural Population" the correct figure is 1,251 instead of 1,252.
[n the col. headed "Males" under "Urban Population" the correct figure is 1,997 instead of 1,996.
In the col. headed "Females" under "'Rural Population" the correct figure is 72,53 instead of 72,42.
In the col. headed "Female" under "Rural Population" the correct figure is 747 instead of 748.
In the col. headed "Total" under "Rural population" the correct figure is 3,931 instead of 3,930.
In the col. headed "Female" under URural Population" the correct figure is 1,773 instead of 1,774.
Delete the line ·'separate ....... .in Table I-A"
Read the sentance "All cities .. ... . and are discribed as such"
In the col headed "Total" the correct figure is 38,95,792 instead of 38. 95,892. and in the coL of uScheduled Caste" the correct figure is 53,254 instead of 53,354.
In the col. headed UTotal" the correct figure is 10,64,457 instead of 10,65,557 and in the col. of "Scheduled Caste" the correct figure is 12.617 instead of 12,717.
In tn: col. headed "Mahajirs" th.: correct figure is 5,85,282 instead of 5,75,282.
In the same col. the correct figure is 1,03, 87 instead of 93,987.
In the col. headed. "Total" the corre;:t fiture is 38,95.792 instead of 38.95.892 and in the col. of "Scheduled Caste" the correct figure is 53,254 in.,tead of 53,354.
In the col. headed "Total Population" the correct figure is 10,64, 457 in,tead of 10.64.557.
Add Foot Note 3. In Karachi, Lahore, Hyderabad, Rawa1pmdi, Multan, Sialkot and Peshawar the cantonments are also includod.
Against Punjab &: Bahawalpur State In 1921 in the col. headed "Number" the figure for variation (in italics) the correct figure is 7,69,590 instead of 7,69,530.
In "Muslim" Against 60 & over.
In "Other Religion.;" Against 10-39
In "All Religions" Aglimt IJ-H.
In "All Religions" A~ainst 1~-3~.
Against "Pakistan"
Against "All agc3" Male
In tho col. head"" "FEMALE" Under "Populatton" the correct figure is 20,728 imtead of 20,726.
In th:. col. head;!d "Femlle" u1:br "Pop.llation" the correct figure i, 867 in3tead of 868.
In the col h;ajed "Mdc" u d.er "P.J;J-:ltatioa" the correct figure is 60,13,697 instead of 60,13,699.
In the coL headed "Femlte" under "Nevl!r Muried" the correct figure is 23,88,645 instead of 33,88,645.
In the Col. "Schedule Ca,te" the carroet figure is 1,94,OJI instead of 1,49,O(}I.
In the c,l. head,d "Sched~led Caste" the correct figure is 1,07.858 instead of 10.07.858.
In the col. heajed "East" the correct figure is 6,183 instead of 6,189.
Write 1 under "Buddhist" 11< 79 under "Parsi" and delete 80 under UOthers".
Write 1 under "Buddhist" & 79 under "Pars," and delete 80 under "Others".
In the col. beaded "Total t iterate" the correct figure is 88,55,579 instead of 2,88,579 and tho figure for female as 22,60,233 instead of 2,60,233.
In the col. ht:aded "Male" under hScbcduJed Castes" the correct figure is 1,91,063 instead of 1,91,263.
Against "East Bengal" "10 & Over" In the col. headed "Female" under "Caste Hindus" the correct figure is 60,804 instead of 60,846.
In Ilahawalpur Stale Agains! "'fotal",
Against Punjab & Ilahawalpur State "0-9",
Again.t All Religious "Under 10".
Against Caste Hindus "Total"
Against Schedule Caste "Total"
Against All Religions "T"tal".
Against MU&lim "Under 10"
Muslim Against "Total"
Against Other Religions "10 &. Over" ..
Against Muslim "10 &. Over",
Against Q!ste Hindus.
A&ainst Scheduled Cast. "Tot.I".
. . -8
Against "Pakistan".
Against "Sind 11< Khairpur State".
4
1
41
16
18
30 !Ill
24
16
Govt. MuniClpal etc., Service •.
In the "Religions" females the correct of figure is 36,826 instead of 36,836 and 10 the col ... Muslun" females the correct figure is
36,792 insteau of 30,792.
In the col. headed '~Cate Hindus" under "Totaf' the percentage is 7.5 instead of 7.3.
In the col. heaJed "Received Schooling" the correct figure is 15,48,2.08 instead of 15,48,202..
In the col. beaded "5 -6" the correct figure is 3,33,313 instead of 5,33,313.
In tbe COl. headed "Total Population" the correct figure of female is 2,04,265 instead of 24,04,265.
In the col. headed "Received Schooling" the correct figure is 16,43,362 instead of 13,43,362.
In the col. headed "Total Population" the correct figure is 2,88,054 instead of 2,89,054,
In the cot headed "Received SChooling" the correct figure is. 2,14,695 instead of 2,14,895.
In the col. beaded "1·4" the correct figure Is 3,117 instead of 3,11.
In the COl. headed "5-6" the correct figure is 18,696 instead of 19.696.
In the col. headed "Received Schooling" the correct figure is 14.468 instead of 14,438.
In the col. headed "1·4" the correct figure i. 2,988 instead of 2,983.
In the col. headed "Middle School" the correct figure i. 16,95,865 instead of 16,95.209 •
In the col, headed "Higher Degree" delet 9.
In the col. headed "Total" the correct figure is 7.38.80,344 instead of 1,30.80,344.
In the col. headed "Not in Civilian Labour Force" the correct figure is 348 instead of 34.
In the col. headed "Independent Workers "male the COtTC:<:t figure is 162 instead of ]02 and in "Unpaid Family help" ntaI .. the correct figure is 5 instead of 3.
In the col. headed "rotal" the figure is 40,819 instead 0[40,897.9
In the col. headed "Independent" the correct figure i. 12,44 inst~d of 12,419.
In the col. headed "Below Primary" the correct figure is 53,758 instead of 33,135.
In the col. headed "Below Pnmary" the correct figure is 11.6363 instead of 11,638.
In the col. headed "M.tddle School" the correct figure i. 17 instead 131.
In the col. headed "Orchard &. Nurses" write 5 instead of-.
In the col. beaded "Sind & Khatrpur" the correct figure is 69 instead of 79.
In the col. headed "Total" the correct figure tS 4,50,009 instead of 4,50,000.
Table No.
13
14
14
14
15
.9-8
19-C
19-C
Page No.
13-2
14-1
14-:
14-2
15-3
19-5
19-8
19-8
Chapter Para 6.10 6 page 111
Line No.
Other & Unclassified.
8
3 para line I & 2.
16
Box head K-W.F.P
Against Sind & Khairpur State
2
10
9
Chapter page 114 2nd para of right hand col. 6
S:Orrection Required
In the col. headed "Agncultural & Fishery" the Correct figure is 897 instead of 890.
Write after Section 2" & 3".
Delete hA" in the first line & write both lQstead of cloth in the second.
In the col. headed "OWIng .11 land tilled" the correct figure is 59,863 instead of 58,863.
Write "(::'<ote I)" in the box head.
In the col headc:d "without formal attainments" the correct figure is 41,288 instead of 41,188.
In the col. headed "Dependents" the figure is 4,777 instead of 4,837.
In the col. headed "Non-Agricultural" the correct figure is 50,969 instedd 30,969.
Wnte 0.6 instead of 0 06
Insert 34,914 between "and" and "other Workers" the whole sentence will be read as follows: "only 1,31,484 Agricultural and 34914 other Worker; in whole of Pakistan---- - --January, 1951.
PART m FEDERAL CAPITAL AREA KARACHI
5 m-14 StUb.
8 IU-19 Against Cantonment Civil.
It- A 1lI -21 10
II-A m-29 21
13 IlI-32 Agricultural & Fishery workers.
\9-D 1II- 36 "Total All Division"
Write "and" instead of "ort' in Pakistan Provinces.
In Sj~8 ~~i~~e~15~.~~other Religions" the correct percentage is
In the col. headed "Pushtu" the correct figure is 3 instead of S.
In the col. headed "Independent" male the correct figure is 2983 instead of 2,985. •
In the col. headed HAgricultural &. FisheryH the correct figure is 110 instead of 100.
In the col. headed "Other" the correct figure is 73 instead of 37.
Db,OOCCi' .In. "re- Ten Million t D,OO,t1Q(1 - I en Lal: h - Que ~
1.h1,OCo ·Q-docI .. kh-lOCThollsWl'
Printed at the Civil & Military Press, Karachi-1O-8-55-3,OOO
LIST OF AGENTS IN PAKISTAN AND ABROAD FROM WHOM GOVER.."iMENT OF PAKISTAN PUBLlCATIONS ARE AVAILABLE.
--:0:--
I-INLAND
I. Provincial Government Book Depots:North West Frontier Provmc8
Manager, Government PrintIng and StationelY, N.W.F.P., Peshawar
Sind:-
Superintendent, Sind GO\ernment Bool.. Depot and Records Office, Karachi, Sadar.
Punjab.-
Superintendent, Government Printing Punjab, Lahore.
&st Bengal:-
Deputy Controller, Stationery. form. and Publicattons, Government of Pakistan Press Building, TeJgaon, Dacca.
1. Private Book-s.n ... :-
KC11'achi:-
Messrs Pioneer Paper and Stationery House, I, Avan Lodge, Opp. Dow Medical College, Bunder Road, Karachi.
Messrs Aero Stores, 170, Napier Road. Karachi. Messrs Ferozsons, Bunder Road. KarachI. Messrs Kitabistan, Ltd., 18, Hotel Metropole, Victoria Road,
Karachi. Messrs Windsor Book Stall, Elphrnstone Street, Karachi. Messrs Burhani Paper Mart, Campbell Street, P.O. Box.
No. 26, Karachi.
Messrs Pakistan Law House, Opp. Small Cause, Court, Wadhomal Odharam Road, Karach •.
Messrs The Bookland, Bunder Road, Karachi. Messrs Grenich Agencies, 510, Elphinstone Street, Karachi. Messrs Firdous Stationers, Opp. New Mamon Mosque,
Bunder Road, 85, Liaqat Market, Karachi. Messrs Pakistan Co-operative Book Society, Electric House,
University Street, Karachi. Mr. B.A. Chishti, Stationers, Shop No. 40. Opp Mumcipal
Tower, Ali Dina Mohammad Ali Road, P.O. Box No. 293 Karachi.
Sind:-
Messrs Educational Book Depot, Stahoners and Book-sellers, School Road, Hyderabad, Sind.
Messrs Gu1 Book Depot, Neemjee Slope, Sukkur Messrs The New Allies Stores, Jail Road, Noar Tower,
Hyderabad, Sind. Messrs Ameer Brothers, Hirabad, Hyderahad (Sind).
Pu1!iab:-
Messrs DantSbrnand & Co., Karldtana Bazar, Lyallpur. Messrs Ferozons, The Mall, Lahore. Messrs The Punjab Religious Book Society, 4.narkali, Lahore. Messrs Nawa~i.Waqt. Publications. Ltd., Lahore. Messrs Manzoor & Co. (Pakistan), Ltd., 6, The Mall, Lahore. Messrs A.M. John & Co., Kutehery Road, P.B. No. 297,
Lahore.
Messrs The Publishers United Ltd, 176, Anarkali, Lahore. Messrs International Agency, Gujar Basti, Lyallpur. Messrs Mirza Book Agency, 20 Mayo Road, Lahore. Messrs All Palcistan Legal Decision, 35, Nabha Road, Lahore. Messrs Shah &. Sons, Book-sellers & Publishers, Sialkot-Ctty.
Mr. K.A Baker, Prop. Baker Electnc Press, Publishers and Law Book-Sellers, Baker Lodge, Sialkot Cantt.
Messrs The Editor, Punjab Marketing Weekly, Mumtaz House, Khawia Dil Mohd. Road, Lahore.
Messrs Premier Book House, 4/5 Katchery Road Near Anarkali, Lahore.
Messfs The London Book Co., Rawalpindi. Messrs Malik & Sons, Commercial Bldg. Railway ltd. Sialkot
City.
Ba/uchistan:-
Messrs Aligarh Hook Stall, Mission R0ad, Quetta.
North West Frontier Pro.mee:-
Messrs Perolon., 35, The Mall, Peshawar.
&st Bengal:-
Messrs The Paktstan Co-operative Book Socioty, Ltd .. Chittagong.
Messrs Kohinoor Library, Ander-kill., Chittagong. Messrs The Pakistan Co-operative Book Soci~ty, Ltd., Pioneer
Bank Building, Silhet. Messrs Sikandari News Agency, Office of the Fashion Houae,
Raja G.C. Road, Sylhet, E.P. Messrs Hurhani Paper Mart, 11 BangIa Bazar, Dacca. B.P. Mr. Qazi Khurshed Mustafa, 23, Rajani Chaudhry Road,
Gandana Dacca, E.P. Messrs Abdul Qadir & Brothers, Old Jessor Road, Khulna,
E.P. Messrs The Roushan Book Stall, Thana Road, Bogra, E.P. Messrs Dacca Law Report, Manager, Santi Nagar, Ramna,
Dacca. Dacca Chamber of Commerce, 107, Kaliprashanna Ghosh
Street, Dacca.
n.-FOREIGN
The Ambassador of Pakistan Kabul, C/o. Post Master, Peshawar.
The High Commissioner for Pakistan m Australia, Dalton House, 115, Pitt Street.. Sydney, Australia.
The Ambassador of Pakistan, Rander House, Phayree Street, Rangoon Burmah.
The High Commissioner for Pakistan, 499, Wilbord Street, Ottawa, Canada.
The Embassy of Pakistan, Pakistan House, II, Sharia Hotel Laban, Garden City, Cairo, Egypt.
The High Commissioner for Pakistan, 8, B, Harding. Avenue, New Delhi.
The Embassy of Pakistan 15, Dialan Tanku Umar, Diakarta, The Embassy of Pakistan, Khiaban Takhte Jamshed Kashi
No. 276, Tehran, Iran. The Embassy of Pakistan, Wazirya Baghdad, Iraq. The Legation of Pakistan, Jedda, Saudi Arabia. The Minister of Pakistan Abu Roumanch, Domascus. The Ambassador of Pakistan, 41/Karanfil Sokaka, Yanishelllr
Ankara, Turkey. The High Commissioner for Pakistan 34/36, Lowndes Square,
London, S.W.!. The Ambassador of Pakistan, 220 I R Street, North-West
Washington D.C., U.S.A. The Embassy of Pakistan, 17, Sadovekudrinskava Street,
Moscow, U.S.S.R. The Ambassador of Pakistan, 18, Rue Loard Byron, Paris
France. The Embassy of Pakistan, PHen 1813, No.3. The Hague,
Netherlands The Ministel of PaklStan, IS, Via Guisenpe, Man(!i1i, Rome,