20
Report Date : 2007.04.30
| Date post: | 26-Dec-2015 |
| Category: |
Documents |
| Upload: | cornelius-floyd |
| View: | 214 times |
| Download: | 0 times |

Report Date: 2007.04.30

2
Safe Harbor Notice
The forward-looking statements in this press release
reflect the current belief of Optimax Technology
Corporation as of the date of this press release,
although we make no guarantees as to our future
results or the events set forth herein, except as
required by law, Optimax Technology Corporation
undertakes no obligation to update these forecasts
and forward-looking statements.

3
Agenda
1. 2006 Finance Results
2. 2007Q1 Finance Results
3. Capacity & Capex Plans
4. LCD Market Trend

4
2006 Income Statement – QoQ Comparison
Unit: NT$ Million (Except Per Share Data)
QoQChange %
Net Sales 6,425 100.0% 5,139 100.0% 4,439 100.0% 5,324 100.0% 19.9%
Cost of Goods Sold (5,300) (82.5%) (4,388) (85.4%) (4,324) (97.4%) (5,362) (100.7%) 24.0%
Gross Profit 1,125 17.5% 751 14.6% 115 2.6% (38) (0.7%) (133.0%)
Operating Expenses (409) (6.4%) (464) (9.0%) (434) (9.8%) (465) (8.7%) 7.1%
Operating Income (Loss) 716 11.1% 287 5.6% (319) (7.2%) (503) (9.4%) 57.7%
Net Non-operating (Expense) (200) (3.1%) (635) (12.4%) 179 4.0% (894) (16.8%) (599.4%)
Income (Loss) before Tax 516 8.0% (348) (6.8%) (140) (3.2%) (1,397) (26.2%) 897.9%
Income Tax Benefit (Expense) (57) (0.9%) 78 1.5% 2 0.0% (57) (1.1%) (2950.0%)
Cumulative effect on change
in acounting principle 12 0.2% - - - - - - 0.0%
Net Income (Loss) 471 7.3% (270) (5.3%) (138) (3.1%) (1,454) (27.3%) 953.6%
Basic EPS (NT$)(a) 0.95 (0.55) (0.27) (2.91) 977.8%
Depreciation & Amortization 384 6.0% 403 7.8% 414 9.3% 421 7.9% 1.7%
EBITDA (Operating Income + D&A)
1,100 17.1% 690 13.4% 95 2.1% (82) -1.5% (186.3%)
(a) Basic EPS of Q1'06~Q4'06 were calculated based on total weighted average outstanding shares of 494 million, 497 million, 499 million, and 501 million
Q1'06 Q2'06 Q3'06 Q4'06

5
2006 Income Statement – YoY Comparison
Unit: NT$ Million (Except Per Share Data)
YoYChange %
Net Sales 21,762 100.0% 21,327 100.0% (2.0%)
Cost of Goods Sold (17,951) (82.5%) (19,374) (90.8%) 7.9%
Gross Profit (Loss) 3,811 17.5% 1,953 9.2% (48.8%)
Operating Expenses (1,931) (8.9%) (1,772) (8.3%) (8.2%)
Operating Income (Loss) 1,880 8.6% 181 0.8% (90.4%)
Net Non-operating Income (Exp.) (3,970) (18.2%) (1,550) (7.3%) (61.0%)
Income (Loss) before Tax (2,090) (9.6%) (1,369) (6.4%) (34.5%)
Income Tax Benefit (Expense) 229 1.0% (34) (0.2%) (114.8%)
Cumulative effect on change
in acounting principle - - 12 0.1% 100.0%
Net Income (Loss) (1,861) (8.6%) (1,391) (6.5%) (25.3%)
Basic EPS (NT$)(a) (3.98) (2.78) (30.2%)
Depreciation & Amortization 1,114 5.1% 1,622 7.6% 45.6%
EBITDA (Operating Income + D&A)
2,994 13.8% 1,803 8.5% (39.8%)
(a) Basic EPS of FY05 and FY06 were calculated based on total weighted average outstanding shares of 468 million.
and 501 million
2005 2006

6
2006 Balance Sheet Highlights
Unit : NT$ Million
2005 Q1'06 Q2'06 Q3'06 Q4'06YoY
Change %
Cash 2,275 2,554 1,744 1,659 2,121 (6.8%)
Inventory 5,947 6,224 5,999 5,872 5,787 (2.7%)
Short Term Debt(a) 2,895 3,142 3,230 3,465 3,581 23.7%
Long Term Debt 10,082 10,604 9,971 9,347 10,092 0.1%
Equity 11,239 11,748 11,661 11,573 10,126 (9.9%)
Total Assets 28,778 29,343 27,646 27,311 28,214 (2.0%)
Inventory Turnover (Days)(b) 121 107 125 124 98
Total Liability to Total Assets 61% 60% 58% 58% 64%
Debt to Equity 115% 117% 113% 111% 135%
Net Debt to Equity 95% 95% 98% 96% 114%
(a) Short term debt refersto all interest bearing debt maturing within one year
Q4'06 Short term debt were included 3,538 million borrowings maturing within one year and 43 million converted bond
(b) Annualized, calculated by dividing the inventory into the cost of goods sold during such period, then multiplying by 365 days

7
2006 Cash Flow Highlights
Unit: NT$ Million
2005 Q1'06 Q2'06 Q3'06 Q4'06 2006QoQ
Change %
From Operating 1,234 55 (326) 675 (46) 358 106.8%
Net Profit (Loss) (1,861) 471 (270) (138) (1,454) (1,391) (953.6%)
Depreciation & Amortization 1,114 384 403 414 421 1,622 (1.7%)
From Investment (4,691) (580) (122) (416) (361) (1,479) 13.2%
Capital Expenditure (4,458) (391) (147) (377) (368) (1,283) 2.4%
From Financing 3,674 804 (362) (344) 869 967 352.6%
Repayment of Long Term Debt (4,176) (3,202) (1,277) (3,202) (1,377) (9,058) 57.0%
Long Term Debt 8,200 3,950 700 2,800 1,900 9,350 32.1%
Short Term Debt (1,526) 52 201 53 344 650 549.1%
Free Cash Flow (3,457) (525) (448) 259 (407) (1,121)

8
Agenda
1. 2006 Finance Results
2. 2007 Q1 Finance Results
3. Capacity & Capex Plans
4. LCD Market Trend

9
2007 Income Statement – QoQ Comparison
QoQChange %
Net Sales 4,455 100.0% 5,324 100.0% (16.3%) 6,425 100.0%
Cost of Goods Sold (4,526) (101.6%) (5,362) (100.7%) (15.6%) (5,300) (82.5%)
Gross Profit(Loss) (71) (1.6%) (38) (0.7%) 86.8% 1,125 17.5%
Operating Expenses (299) (6.7%) (465) (8.7%) (35.7%) (409) (6.4%)
Operating Income (Loss) (370) (8.3%) (503) (9.4%) (26.4%) 716 11.1%
Net Non-operating Income (Exp.) (107) (2.4%) (894) (16.8%) (88.0%) (200) (3.1%)
Income (Loss) before Tax (477) (10.7%) (1,397) (26.2%) (65.9%) 516 8.0%
Income Tax Benefit (Expense) 27 0.6% (57) (1.1%) (147.4%) (57) (0.9%)
Cumulative effect on change
in acounting principle - - - - 0.0% 12 0.2%
Net Income (Loss) (450) (10.1%) (1,454) (27.3%) (69.1%) 471 7.3%
Basic EPS (NT$)(a) (0.89) (2.91) (69.4%) 0.95
Depreciation & Amortization 410 9.2% 421 7.9% (2.6%) 384 6.0%
EBITDA (Operating Income + D&A)
40 0.9% (82) -1.5% (148.8%) 1,100 17.1%
(a) Basic EPS of Q1'06、Q4'06、Q1'07 were calculated based on total weighted average outstanding shares of 494 million,
501 million, and 506 million
Q1'07 Q4'06
Unit: NT$ Million (Except Per Share Data)
Q1'06

10
2007 Balance Sheet Highlights
Q1'07 Q4'06QoQ
Change %Q1'06
Cash 2,066 2,121 (2.6%) 2,554
Inventory 4,735 5,787 (18.2%) 6,224
Short Term Debt(a) 3,831 3,581 7.0% 3,142
Long Term Debt 9,914 10,092 (1.8%) 10,604
Equity 9,696 10,126 (4.2%) 11,748
Total Assets 26,378 28,214 (6.5%) 29,343
Inventory Turnover (Days)(b) 95 98 107
Total Liability to Total Assets 63% 64% 60%
Debt to Equity 142% 135% 115%
Net Debt to Equity 120% 114% 95%
(b) Annualized, calculated by dividing the average inventory into the cost of goods sold during such period, then
multiplying by 365 days.
(a) Including below items: (1) NT$2,864M current payable of L/T debt. (2) NT$31M CB. (3) NT$936M S/T debt
Unit : NT$ Million

11
2007 Cash Flow Highlights
Q1'07 Q4'06QoQ
Change %Q1'06
From Operating 240 (46) 621.7% 55
Net Profit (Loss) (450) (1,454) 69.1% 471
Depreciation & Amortization 410 421 (2.6%) 384
From Investment (380) (361) (5.3%) (580)
Capital Expenditure (309) (368) 16.0% (391)
From Financing 84 869 90.3% 804
Repayment of Long Term Debt (3,203) (1,377) (132.6%) (3,202)
Long Term Debt 3,000 1,900 (57.9%) 3,950
Short Term Debt 286 344 (16.9%) 52
Free Cash Flow (140) (407) (525)
Unit: NT$ Million

12
Optimax Monthly Sales Revenue
Unit : Mil. NT$
1,454
1,321
1,680
0
200
400
600
800
1,000
1,200
1,400
1,600
1,800
2,000
2,200
2,400
1 2 3 4 5 6 7 8 9 10 11 12
2007
2006
2005
2004
2003
2002
2001
2000
13
Agenda
1. 2006 Finance Results
2. 2007 Q1 Finance Results
3. Capacity & Capex Plans
4. LCD Market Trend

14
Optimax’s Capacity
Start Completion
#1 1998/7 1999/3 1999/5 300 K M2/month 1080mm For TN/STN
#2 2001/5 420 K M2/month 1330mm For TFT
#3 2002/3 420 K M2/month 1330mm For TFT
#4 2003/5 2003/11 2003/12 580K M2/month 1330mm For TFT
#5- -
2004/7 640K M2/month 1470mm For TFT
#6- -
2004/11 640K M2/month 1470mm For TFT
Tainan #8 2005/12 640K M2/month 1470mm For TFT
Tainan #9 2007/Q2 1280K M2/month 1470mm For TFT
MassProduction
Capacity Film Width Application
2004/7 2005/3
Construction
Line
2000/7 2001/3
Place
Ping Chen,Taoyuan
15
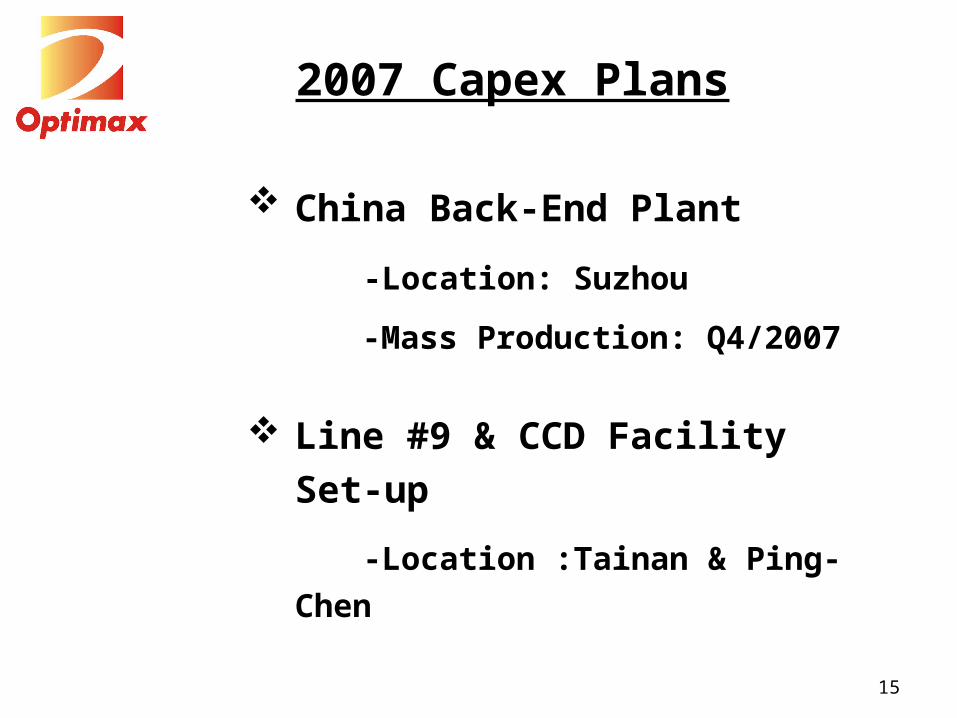
2007 Capex Plans
China Back-End Plant
-Location: Suzhou
-Mass Production: Q4/2007
Line #9 & CCD Facility Set-up
-Location :Tainan & Ping-Chen

16
Agenda
1. 2006 Finance Results
2. 2007 Q1 Finance Results
3. Capacity & Capex Plans
4. LCD Market Trend
17
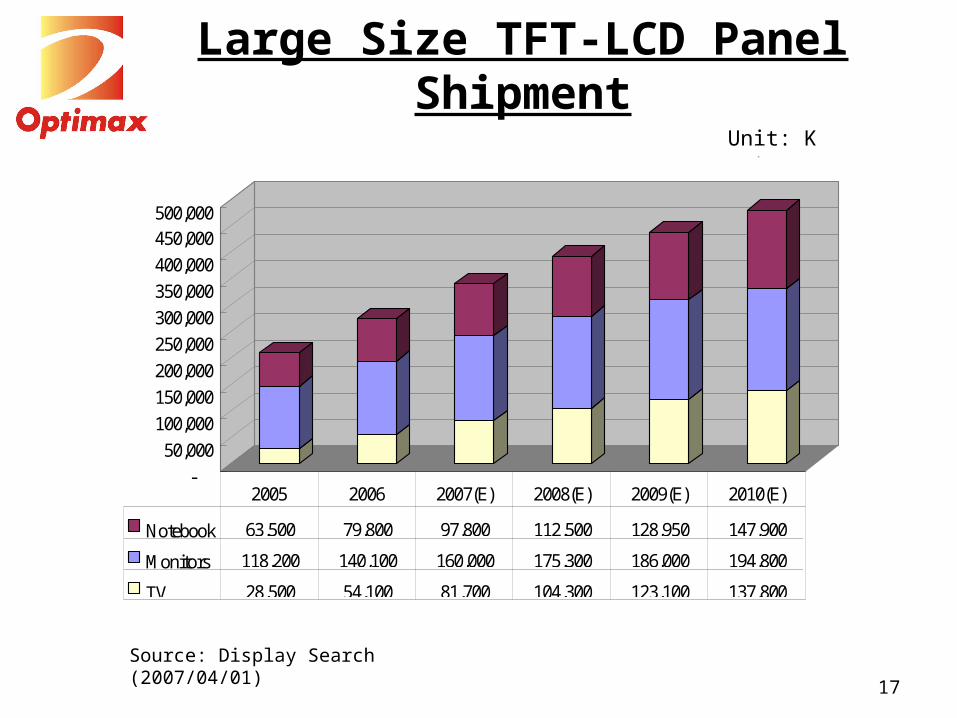
Large Size TFT-LCD Panel Shipment
Unit: K sets
Source: Display Search (2007/04/01)
-50,000
100,000150,000200,000250,000300,000350,000400,000450,000500,000
Notebook 63,500 79,800 97,800 112,500 128,950 147,900
Monitors 118,200 140,100 160,000 175,300 186,000 194,800
TV 28,500 54,100 81,700 104,300 123,100 137,800
2005 2006 2007(E) 2008(E) 2009(E) 2010(E)

18
LCD Market Trend
• LCD-TV Remain as the Driving Force
• Profitless Leads to Capex Cuts
• 1H07 at Bottom, 2H07 Rebound
• Price Decline may End in Q207

19
LCD Market Trend vs. Optimax Strategy
LCD Market• LCD-TV Remain as the
Driving Force
• Profitless Leads to Capex Cuts
• 1H07 at Bottom, 2H07 Rebound
• Price Decline may End in Q207
Optimax• LCD-TV & Large Size
Monitor as main product mix
• Capacity Enhanced by Production Efficiency
• Margin Oriented by Products / Clients / Areas
• Reasonable Price Raise
For further information, please visit our website at :
www.optimax.com.tw
Contact Investor Relations at :
Phone: +886 (3) 460-6677 Ext. 1366
Email: [email protected]


