143


Report Documentation Page Form ApprovedOMB No. 0704-0188
Public reporting burden for the collection of information is estimated to average 1 hour per response, including the time for reviewing instructions, searching existing data sources, gathering andmaintaining the data needed, and completing and reviewing the collection of information. Send comments regarding this burden estimate or any other aspect of this collection of information,including suggestions for reducing this burden, to Washington Headquarters Services, Directorate for Information Operations and Reports, 1215 Jefferson Davis Highway, Suite 1204, ArlingtonVA 22202-4302. Respondents should be aware that notwithstanding any other provision of law, no person shall be subject to a penalty for failing to comply with a collection of information if itdoes not display a currently valid OMB control number.
1. REPORT DATE 2002
2. REPORT TYPE N/A
3. DATES COVERED -
4. TITLE AND SUBTITLE Water-Quality Monitoring of Sweetwater and Loveland Reservoirs, SanDiego County, California-Phase One Results, 1998-1999
5a. CONTRACT NUMBER
5b. GRANT NUMBER
5c. PROGRAM ELEMENT NUMBER
6. AUTHOR(S) 5d. PROJECT NUMBER
5e. TASK NUMBER
5f. WORK UNIT NUMBER
7. PERFORMING ORGANIZATION NAME(S) AND ADDRESS(ES) U.S. Department of the Interior U.S. Geological Survey 1849 C. Street,NW Washington, DC 20240
8. PERFORMING ORGANIZATIONREPORT NUMBER
9. SPONSORING/MONITORING AGENCY NAME(S) AND ADDRESS(ES) 10. SPONSOR/MONITOR’S ACRONYM(S)
11. SPONSOR/MONITOR’S REPORT NUMBER(S)
12. DISTRIBUTION/AVAILABILITY STATEMENT Approved for public release, distribution unlimited
13. SUPPLEMENTARY NOTES The original document contains color images.
14. ABSTRACT
15. SUBJECT TERMS
16. SECURITY CLASSIFICATION OF: 17. LIMITATION OF ABSTRACT
SAR
18. NUMBEROF PAGES
142
19a. NAME OFRESPONSIBLE PERSON
a. REPORT unclassified
b. ABSTRACT unclassified
c. THIS PAGE unclassified
Standard Form 298 (Rev. 8-98) Prescribed by ANSI Std Z39-18

U.S. GEOLOGICAL SURVEY
Open-File Report
W
ater-Quality Monitoring of Sweetwater and Loveland Reservoirs, San Diego County, California—Phase One Results, 1998–1999
By
Michael S. Majewski
1
, Jagdeep S. Sidhu
2
,
and
Gregory O. Mendez
1
Sacramento, California
2002
02-186
5008
-20
Prepared in cooperation with the
SWEETW
A
TER AUTHORITY
1
U.S. Geological Survey
, Placer Hall, 6000 J Street, Sacramento, California 95819-6129
2
California State University Sacramento Foundation, 6000 J Street, Sacramento, California 95819-6129
U.S. DEP
ARTMENT OF THE INTERIOR
GALE A. NORTON, Secretary
U.S. GEOLOGICAL SURVEY
Charles G. Groat, Director
The use of f
irm, trade, and brand names in this report is for identif
ication purposes only and does
not constitute endorsement by the U.S. Geological Survey
.
For additional information write to:
Copies of this report can be purchased
U.S. Geological Survey
Branch of Information Services
Box 25286
Denver
, CO 80225-0286
from:
U.S. Geological Survey
W
ater Resources
Placer Hall, Suite 2012
6000 J Street
Sacramento, California 95819-6129

CONTENTS
Abstract ................................................................................................................................................................................. 1Introduction .......................................................................................................................................................................... 1Study Design ........................................................................................................................................................................ 3Site Selection and Sampling Strategy ................................................................................................................................... 5
Water Sampling .......................................................................................................................................................... 5Air Sampling .............................................................................................................................................................. 6Bed Sediment Sampling ............................................................................................................................................. 7
Sediment Core Sampling .................................................................................................................................. 7Surficial Bed Sediment Sampling .................................................................................................................... 7
Analytical Methods .............................................................................................................................................................. 7Water .......................................................................................................................................................................... 7Air ............................................................................................................................................................................... 8Sediment ..................................................................................................................................................................... 8
Quality Control ..................................................................................................................................................................... 8Sampling ..................................................................................................................................................................... 8Analytical ................................................................................................................................................................... 9
References Cited ................................................................................................................................................................... 9
FIGURES
1–3. Maps showing:1. Sweetwater and Loveland Reservoirs and surrounding watershed, San Diego County, California . . . . . . . . . . . 22. The most probable alignment of State Route 125 and Sweetwater Reservoir sampling sites, San Diego
County, California . . . . . . . . . . . . . . . . . . . . . . . . . . . . . . . . . . . . . . . . . . . . . . . . . . . . . . . . . . . . . . . . . . . . . . . . . 43. Loveland Reservoir sampling sites, San Diego County, California . . . . . . . . . . . . . . . . . . . . . . . . . . . . . . . . . . . 5
TABLES
1. Site identification numbers, site numbers, and corresponding site names, Sweetwater and Loveland Reservoirs, San Diego County, California . . . . . . . . . . . . . . . . . . . . . . . . . . . . . . . . . . . . . . . . . . . . . . . . . . . . . . . . 6
2. Water-quality depth-profile data for dissolved oxygen, pH, specific conductance, and temperature for the Sweetwater and Loveland Reservoirs sampling sites, San Diego County, California, . . . . . . . . . . . . . . . . . . . 11
3. Analytical results for volatile organic compound concentrations in water samples, Sweetwater and Loveland Reservoirs, San Diego County, California . . . . . . . . . . . . . . . . . . . . . . . . . . . . . . . . . . . . . . . . . . . . . . . . 27
4. Analytical results for pesticide concentrations in water samples, Sweetwater and Loveland Reservoirs, San Diego County, California . . . . . . . . . . . . . . . . . . . . . . . . . . . . . . . . . . . . . . . . . . . . . . . . . . . . . . . . . . . . . . . . . . 61
5A. Analytical results for chlorofluorocarbons and other compounds with low breakthrough volumes for the Sweetwater Reservoir air sampling site, San Diego County, California . . . . . . . . . . . . . . . . . . . . . . . . . . . . . . . . . . 82
5B. Analytical results for the remaining volatile organic compound analytes for the Sweetwater Reservoir air sampling site, San Diego County, California . . . . . . . . . . . . . . . . . . . . . . . . . . . . . . . . . . . . . . . . . . . . . . . . . . . 83
6. Analytical results for pesticide concentrations from the Sweetwater Reservoir air sampling site, San Diego County, California . . . . . . . . . . . . . . . . . . . . . . . . . . . . . . . . . . . . . . . . . . . . . . . . . . . . . . . . . . . . . . . . . . . . . . . . . . 90
Contents III

7. Analytical results for polynuclear aromatic hydrocarbon compound concentrations in core segments and reservoir and urban runoff diversion system pond surficial bed sediment samples, Sweetwater Reservoir, San Diego County, California . . . . . . . . . . . . . . . . . . . . . . . . . . . . . . . . . . . . . . . . . . . . . . . . . . . . . . . . . 96
8. Analytical results for organochlorine insecticide concentrations in selected core segments and reservoir and urban runoff diversion system ponds surficial bed sediment samples, Sweetwater and Loveland Reservoirs, San Diego County, California . . . . . . . . . . . . . . . . . . . . . . . . . . . . . . . . . . . . . . . . . . . . . 107
9. Analytical results for major and trace element concentrations in bed sediment core, Sweetwater Reservoir, San Diego County, California . . . . . . . . . . . . . . . . . . . . . . . . . . . . . . . . . . . . . . . . . . . . . . . . . . . . . . . . . . . . . . . . . . 109
10. Results of cesium 137 age determinations and estimated dates for bed sediment core segments, Sweetwater Reservoir, San Diego County, California . . . . . . . . . . . . . . . . . . . . . . . . . . . . . . . . . . . . . . . . . . . . . . . 111
11. Visual descriptive comments of core contents, color, and texture for the Sweetwater Reservoir sampling sites, San Diego County, California . . . . . . . . . . . . . . . . . . . . . . . . . . . . . . . . . . . . . . . . . . . . . . . . . . . . . . . . . . . . . 112
12. Quality assurance analytical results for volatile organic compound concentrations in water samples, Sweetwater and Loveland Reservoirs, San Diego County, California . . . . . . . . . . . . . . . . . . . . . . . . . . . . . . . . . . . 113
13. Quality assurance analytical results for pesticide concentrations in water samples, Sweetwater and Loveland Reservoirs, San Diego County, California . . . . . . . . . . . . . . . . . . . . . . . . . . . . . . . . . . . . . . . . . . . . . . . . . 120
14. Quality assurance analytical results for polynuclear aromatic hydrocarbon compound concentrations in core segments and urban runoff diversion system pond surficial bed sediment samples, Sweetwater Reservoir, San Diego County, California . . . . . . . . . . . . . . . . . . . . . . . . . . . . . . . . . . . . . . . . . . . . . . . 124
15. Quality assurance analytical results for organochlorine insecticide concentrations in select core segments and in reservoir and urban runoff diversion system ponds surficial bed sediment samples from the Sweetwater Reservoir, San Diego County, California . . . . . . . . . . . . . . . . . . . . . . . . . . . . . . . . . . . . . . . . . . . . . . . 134
IV Contents

CONVERSION FACTORS, VERTICAL DATUM, ABBREVIATIONS, AND ACRONYMS
Temperature in degrees Celsius (°C) may be converted to degrees Fahrenheit (°F) as follows:
°F = (1.8)°C + 32
Sea level: In this report “sea level” refers to the National Geodetic Vertical Datum of 1929 (NGVD of 1929)—a geodetic datum derived from a general adjustment of the first-order level nets of both the United States and Canada, formerly called Sea Level Datum of 1929.
Abbreviations and Acronyms
acre-ft, acre-footAuthority, Sweetwater AuthorityGC/MS, gas chromatography/mass spectrometryGFF, glass fiber filterg/m3, gram per cubic meterL, literL/min, liter per minuteLLR, Loveland ReservoirMCL, maximum contaminant levelMDL, method detection limitmg, milligrammi, milemm, millimeterNAWQA, National Water-Quality Assessment (Program)NWQL, National Water Quality LaboratoryOC, organochlorinePAH, polynuclear aromatic hydrocarbonPCB, polychlorinated biphenylPUF, polyurethane foamSOC, semivolatile organic chemicalSR, State RouteSWR, Sweetwater ReservoirUSGS, U.S. Geological SurveyURDS, urban runoff diversion systemVOC, volatile organic compound
Multiply By To obtain
centimeter (cm) 0.3937 inch
meter (m) 3.281 foot
kilometer (km) 0.6214 mile
square kilometer (km2) .3861 square mile
Contents V

THIS PAGE INTENTIONALLY LEFT BLANK

Water-Quality Monitoring of Sweetwater and Loveland Reservoirs, San Diego County, California—Phase One Results, 1998–1999
by Michael S. Majewski, Jagdeep S. Sidhu, and Gregory O. Mendez
ABSTRACT
In 1998, the U.S. Geological Survey began a study to assess the overall health of the watershed feeding the Sweetwater Reservoir in southern San Diego County, California. The study focussed on monitoring for organic chemical contamination and the effects of construction and operation of State Route 125 on water quality. Three environ-mental compartments (air, water, and bed sedi-ments) are being sampled regularly for chemical contaminants, including volatile organic com-pounds, polynuclear aromatic hydrocarbons, polychlorinated biphenyls, pesticides, and major and trace elements. The study is divided into two phases. Phase I sampling is designed to establish baseline conditions for target compounds in terms of detection frequency and concentration in air, water, and bed sediments. Phase II sampling will continue at the established monitoring sites during and after construction of State Route 125 to assess chemical impact on water quality in the reservoir resulting from land-use changes and development in the watershed. This report describes the study design, the sampling and analytical methods, and presents the data results for the first year of the study, September 1998 to September 1999.
INTRODUCTION
The Sweetwater Authority (hereinafter referred to as the Authority), under the guidance of its Board of Directors, operates a public drinking water supply system for over 175,000 residential and commercial customers in Chula Vista, National City, and Bonita, California. The Sweetwater Reservoir (SWR) (fig. 1),
which has a storage capacity of 28,079 acre-ft (acre-foot) of water, is located about 15 km (kilometer) southeast of San Diego, California. The Authority also stores water at Loveland Reservoir (LLR), which has a storage capacity of 25,387 acre-ft and is located about 30 km east of SWR near Alpine, California. In addition to the two reservoirs, the Authority operates two deep wells in National City, California, and treats brackish ground water at the Lower Sweetwater River Basin Demineralization Facility in Chula Vista. Seventy percent of the water the Authority provides comes from local supplies that include the Sweetwater River, the Sweetwater alluvium, and the San Diego Groundwater Formation. The remaining water is imported from sources such as the Colorado River and the Sacramento/San Joaquin River systems through major aqueducts. Both local reservoir and imported waters are treated at the Robert A. Perdue treatment plant located at the SWR.
Currently, the SWR has no recreational acti-vities. At LLR, only shore fishing is allowed in a restricted area at the east end of the reservoir. The Authority maintains one motorized boat at each reservoir for routine water sampling and regular shore patrols.
The Sweetwater River watershed covers 466 km2 (square kilometer). Although much of the land is undeveloped, the area includes the Sycuan and Viejas Indian Reservations (both have gaming facilities), a part of the Cleveland National Forest, agricultural land, rural residential acreage, urban and suburban resi-dential development, mining and industrial land use, commercial recreation, and commercial business development. The watershed currently includes three 18-hole golf courses; a fourth is being planned in conjunction with a new residential community. The Authority is very concerned about the impact that increasing growth and development in the Sweetwater
Introduction 1

01
23
4 Ki
lom
eter
s
01
23
4 M
iles
Swee
twat
er
Res
ervo
ir
Lov
elan
dR
eser
voir
Alp
ine
Bon
ita
Chul
a Vi
sta
Swee
twat
erR
ive
r
S17
54
S17
125
125
94
94
805
8
8
8
67
116�
45�
32�
45�
32�
37�
30�
117�
Stu
dy a
rea
San
Die
go
Los
Ang
eles
Nat
iona
lCi
ty
San
Fran
cisc
o
Figu
re 1
.
Swee
twat
er a
nd L
ovel
and
Rese
rvoi
rs a
nd s
urro
undi
ng w
ater
shed
, San
Die
go C
ount
y, C
alifo
rnia
.
2 Water-Quality Monitoring, Sweetwater and Loveland Reservoirs, San Diego County, Calif.—Phase One Results, 1998–1999

River watershed will have on the quality of the drinking water supply and has initiated a variety of efforts to protect the watershed, including source assessments, watershed stakeholders outreach to identify issues, total organic carbon assessments, and the construction and operation of an urban runoff diversion system (URDS). These programs help the Authority evaluate the overall environmental health of the watershed by monitoring changes that can degrade the quality of the water supply and necessitate addi-tional water treatment as the population increases and land use intensifies. The consequence of local inputs of anthropogenic compounds, such as organic chemicals and pesticides, on the watershed and reservoir water quality is largely unknown.
In addition to the increasing urbanization pressures within the watershed, another Authority concern, and the primary reason for this study, is the construction and operation of State Route (SR) 125. In 1984, the San Diego Association of Governments added SR-125 to the Regional Transportation Plan as part of San Diego’s future highway system. The SR-125 project consists of approximately 18 km [11 mi (mile)] of roadway construction in one of three possible alignment configurations that extend from SR-54 (northern terminus) to Interstate 905 (southern terminus) (fig. 2). The project plans call for the initial construction of a four-lane highway that will be expanded to eight lanes (California Department of Transportation, 2001). More than 200,000 vehicles per day, including a high percentage (more than 10 percent) of heavy diesel trucks from both the United States and Mexico, are expected to travel SR-125. The alignment will be elevated about 30 m (meter) at its highest point, and the most likely construction scenario will bring SR-125 within 150 m of the reservoir at its nearest point. Because the SWR is downwind of all proposed alignments, the Authority became concerned that toxic vehicle emissions, as well as paved road dusts, might enter the reservoir by atmospheric deposition in concentrations that could affect public health and impact the cost of treating the drinking water supply.
In 1996 the Authority commissioned a study (Ogden Environmental and Energy Services, 1997) to model the atmospheric depositional loading to SWR of a variety of toxic compounds from vehicular fuel combustion emissions and any attendant health risks associated with the three SR-125 alignment scenarios. The predicted concentrations of select contaminants
were compared with the standards set by the California Safe Drinking Water Act (California Environmental Protection Agency, 1986) and to California and federal maximum contaminant levels (MCL). The results showed that drinking water guidance levels for one or more contaminants would be exceeded in all three alternative freeway construction options. Both the Authority and the U.S. Environmental Protection Agency Region IX concluded that the findings in Ogden report (Ogden Environmental and Energy Services, 1997) warranted the implementation of a monitoring program to measure the impact that atmospheric deposition of vehicular emissions from the operation of SR-125 may have on the quality of the drinking water stored in the SWR.
The Authority is assessing all factors that can affect water quality in the reservoir, as well as main-taining the highest environmental quality in the entire watershed. Responding to these concerns, the Authority initiated a monitoring study in cooperation with the U.S. Geological Survey (USGS).
This report assesses the chemical impact on water quality in the reservoir resulting from land use changes and development in the watershed. The scope of the study is to compare the analytical results of samples from three environmental media—air, water, and bed sediment—and determine whether any measured changes in reservoir water quality are the result of atmospheric deposition of organic chemicals and metals originating from the construction and operation of SR-125. Where applicable, the measured concentrations of select organic chemicals will be used as inputs to a mathematical model to assess future trends and impacts on the reservoir water quality.
STUDY DESIGN
The study design consists of two phases and includes sampling air, water, and bed sediments in each of them. Each of the environmental compartments in the Sweetwater watershed is being sampled and analyzed for those compounds expected to accumulate.
• Air—volatile organic compounds (VOC), polynuclear aromatic hydrocarbons (PAH), and pesticides.
• Water—VOCs and pesticides. • Bed sediments—PAHs, total polychlorinated
biphenyls (PCB), pesticides, and• Major and trace elements.
Study Design 3

117º
117º
57'
30"
32º
42'
30"
32º
41'
15"
1
2
435
A
B
C1 C2
D1 D
2
7
6
8
9
10
1 N
ear
Pum
p To
wer
2 N
ear V
ista
del
Lag
o3
Cent
er o
f Min
imum
Poo
l4
Nea
r Rec
reat
ion
Site
5 M
inim
um P
ool B
ound
ary
East
6 Ea
st E
nd R
eser
voir
Fill
Boun
dary
7 N
ear G
um T
ree
Cove
Pon
d
01
Kilo
met
er
01
Mile
0.5
0.5
Urb
an R
unof
f Div
ersi
on S
yste
m
Wat
er s
ampl
e an
d su
rfic
ial b
ed s
edim
ent
Swee
twat
er R
eser
voir
8 Pe
rdue
Tre
atm
ent P
lant
Fin
ishe
d W
ater
9 Pe
rdue
Tre
atm
ent P
lant
Raw
Impo
rted
Wat
er10
Sw
eetw
ater
Riv
er a
t Low
Flo
w D
iver
sion
Wat
er s
ampl
e
Air s
ampl
ing
site
Sedi
men
t cor
e sa
mpl
ing
site
EXPL
ANAT
ION
Swee
twat
er R
eser
voir
Rese
rvoi
r min
imum
poo
l
bou
ndar
yPr
opos
ed S
R-12
5
Alig
nmen
tRo
ads
Rive
r or p
ipel
ine
Swee
twat
er R
iver
Low
Flo
w D
iver
sion
To S
R-90
5
125
S17
S17
S17
54
Figu
re 2
.
The
mos
t pro
babl
e al
ignm
ent o
f Sta
te R
oute
125
and
Sw
eetw
ater
Res
ervo
ir sa
mpl
ing
site
s, S
an D
iego
Cou
nty,
Cal
iforn
ia.
4 Water-Quality Monitoring, Sweetwater and Loveland Reservoirs, San Diego County, Calif.—Phase One Results, 1998–1999

To the extent possible, the sampling and anal-ytical methods of the USGS National Water-Quality Assessment (NAWQA) Program are being used and the results entered into the USGS National Water Information System database.
During phase I, the water sampling sites were established at both SWR and LLR, the air sampling station was established at SWR, and regularly sched-uled air and water sampling began. A one-time coring of the SWR bed sediments also was done along with an initial sampling of the surficial bed sediments at each of the reservoir water sampling sites and URDS ponds. The major objective of phase I is to determine the occurrence and concentration of select organic and inorganic contaminants in each of the three environ-mental media and to establish baseline conditions for the target analytes before construction of SR-125 begins.
Phase II sampling will begin with the construc-tion of SR-125. Air, water, and surficial bed sediment monitoring will continue at the established sites during and after the construction of SR-125. A second air sampling station may be installed to monitor airborne anthropogenic compounds originating from areas upwind of the SR-125 alignment. The analytical results from the phase II monitoring will be compared with those from phase I to assess the impact of SR-125 on water quality in SWR. Phase II monitoring also will assess the continuing inputs of anthropogenic organic compounds resulting from the land-use practices in the watershed.
A computer modeling program (LakeVOC) will be used to estimate the air–water partitioning behavior for select VOCs detected in the air and water at SWR. The model is not restricted to estimating VOC parti-tioning behavior. It also can be used to estimate the partitioning behavior of semivolatile organic chemicals (SOC) such as PAHs and pesticides.
SITE SELECTION AND SAMPLING STRATEGY
Water Sampling
Seven water-sampling sites have been estab-lished in SWR (fig. 2) and two in LLR (fig. 3). All the sites within SWR, with the exception of site 6, are within the reservoir’s minimum fill boundary to ensure that water will be available for sampling throughout the
Figure 3. Loveland Reservoir sampling sites, San Diego County, California.
year. Site 6 is located at the eastern end of the reservoir in very shallow water. As the reservoir water level falls, the water depth at this site decreases and sometimes the bed sediments are completely exposed. When this happens, the sampling site is moved to a location where the water depth is at least 1 m deep. The water sampling sites at LLR are located near the discharge point at the dam and near the Sweetwater River inflow at the east end of the reservoir. Sampling sites at both SWR and LLR are all marked with stationery buoys anchored to the bottom.
Three additional water-sampling sites (fig. 2) have been established outside the reservoir boundaries. The first site monitors the quality of the ‘finished’ water as it leaves the treatment plant for distribution to customers. The second site monitors the quality of the imported water before it enters the treatment plant. The third site, the Sweetwater River at the Low-Flow Diversion, monitors the quality of the watershed drainage water entering SWR. In most cases, imported water is pumped directly into the treatment plant; however, imported water is occasionally pumped directly into SWR to augment the local supply. When imported water is pumped directly into the reservoir, it significantly increases the water level, and volume increases on the order of tens of thousands of acre-feet. Imported water is never used to maintain the minimum pool level. All the sampling site names and identification numbers are given in table 1.
Baseline water sampling at both SWR and LLR began in September 1998 and continued at 2-month intervals through September 1999. This bimonthly sampling allowed monitoring of various operational
Loveland Reservoir east end near source inlet
Loveland Reservoir near dam
32º46'52"
32º47'30"
116º47'30"
116º45'
0 1 KILOMETER
0 1 MILE .5
.5
Proposed SR-125 AlignmentRoadsRiver or pipeline
Site Selection and Sampling Strategy 5

Table 1.
S
ite identification numbers, site numbers, and corresponding site names, Sweetwater and Loveland Reservoirs, San Diego County,
modes of the reservoirs, such as recharge or drawdown events that significantly changed the water level in reservoirs. Before any reservoir water is sampled, depth profiles of temperature, pH, dissolved oxygen, and specific conductance are measured at 1 m intervals from the surface to the bottom at each sampling location (table 2, at back of report). At LLR, the depth profile measurements below 10 m are taken every 2 m because LLR is much deeper than SWR. If the temperature depth profile shows the presence of a thermocline, two sets of water samples are collected at the site—one at midepilimnion and one at midhypolimnion. If no thermocline is evident, only one sample set is collected at a point midway between the water surface and the reservoir bottom.
Water samples for both pesticide and VOC analyses are collected using a 1.2 L (liter) Teflon Kemmerer sampler (Wildco, Saginaw, Mich.). Procedures for collecting and processing water samples for dissolved pesticide and VOC determinations are based on protocols used by the NAWQA Program (Shelton, 1994, 1997). Samples from the Low-Flow Diversion Dam are grab samples collected by submerging the sample bottle, removing the cap, filling the bottle, and recapping the bottle while still submerged. The finished and imported water samples are collected from spigots located at the distribution points. The water lines are flushed for 5 minutes before the sample bottles are filled.
Air Sampling
Air sampling at site 1 (fig. 2) began operation in March 1999. The site is wired for AC power (120 volts), equipped with telephone modem access, and secured from the general public by a 2-m-high chain-link fence. The data collected at this station is establishing the occurrence, temporal patterns, and ambient levels of selected airborne organic compounds (VOCs, PAHs, and pesticides). This site was installed downwind of the proposed SR-125 routes and upwind of SWR (fig. 2) along a transect of the predominant wind direction. The site includes a fully instrumented meteorological station that records hourly averages of wind speed and direction, ambient air temperature and relative humidity at two heights, rainfall, barometric pressure, and atmospheric stability. The general considerations for establishing this air sampling station followed the guidelines outlined by the National Atmospheric Deposition Program (Bigelow, 1984).
The first VOC air sample was collected on March 23, 1999. The sampling methods are described in detail by Pankow and others (1998) and will only be briefly discussed. Ambient, gas phase atmospheric VOC concentrations are monitored using two programmable low-volume air sampling pumps (224-PCXR8, SKC Inc., Eight Four, Pa.). One sampling pump pulls about 1.5 L of air through a glass cartridge containing 50 mg (milligram) of Carbotrap B in series with 280 mg of
1Quality control identification number.2Air sampling date located on figure 2.
Site identification number Site number Site name
324130117002501 1 Sweetwater Reservoir near pump tower
324139117000801 2 Sweetwater Reservoir near Vista del Lago station
324131117000101 3 Sweetwater Reservoir center of minimum pool
324126116595701 4 Sweetwater Reservoir near recreation area
324137116592401 5 Sweetwater Reservoir minimum pool boundary East
324209116585001 6 Sweetwater Reservoir east end reservoir fill boundary
324147116593501 7 Sweetwater Reservoir near Gum Tree Cove Pond
324703116473101* Loveland Reservoir near dam
324737116453501* Loveland Reservoir east end near source inlet
324311116565901 10 Sweetwater River at low flow diversion at Sweetwater Reservoir
324132117002701 8 Perdue Treatment Plant—finished water at Sweetwater Reservoir
324137117002901 9 Perdue Treatment Plant—imported raw water at Sweetwater Reservoir188888801 QC/QA site for Sacramento Project Office, California
2324141117001601 Sweetwater Reservoir air sampling site
California
[See figure 2 for site locations. QA, quality assurance; QC, quality control. *, Loveland Reservoir sites on figure 3]
6 Water-Quality Monitoring, Sweetwater and Loveland Reservoirs, San Diego County, Calif.—Phase One Results, 1998–1999

Carboxen 1000 (Supelco Inc., Bellefonte, Pa.). This sample is analyzed for chlorofluorocarbons and other compounds with low breakthrough volumes. The second pump pulls about 5 L of air through a glass cartridge containing 180 mg of Carbotrap B in series with 70 mg of Carboxen 1000 (Supelco Inc., Belle-fonte, Pa.). This sample is analyzed for the remaining VOC analytes. Each sample is a 24-hour composite collected every 12th day. The timing of the VOC sample collection is coordinated with the California Air Resources Board Air Toxics Program.
The first PAH, total PCB, and pesticide air sample was collected during the week of May 11, 1999. Both the gas and particle phases are monitored using a high-volume air sampler that pulls air through a 90-mm (millimeter)-diameter glass fiber filter (GFF), which collects the particle phase samples, and a pri-mary and a secondary [4.45 cm (centimeter) diameter � 7.62 cm each; average density = 0.043 g/m-3 (gram per cubic meter)] polyurethane foam (PUF) plugs, which collects the gas phase samples. Both the GFF and PUFs are contained in Teflon cartridges. The flow rates are maintained at approximately 100 L/min (liter per minute) using a high-volume vacuum pump (Graseby-GMW, Village of Cleves, Ohio). Each sample is a 24-hour/7-day weekly composite taken every third week. Air samples at LLR are not collected because its foothill location (30 km east of SWR) is considered sufficiently downwind of SR-125 to be minimally impacted by any airborne contaminants originating from it.
Bed Sediment Sampling
Sediment sampling included a one-time coring of SWR bed sediments and an annual sampling of the surficial bed sediments at each water sampling site at both SWR and LLR. The bed sediment sampling and coring was in collaboration with the research group of Dr. Peter Van Metre, USGS, Austin, Tex., and Dr. Edward Callender, USGS, Reston, Va. Sediment core samples, when analyzed for specific organic chemicals and trace elements, can assist in documenting the history of land use and water-quality trends in a study area (Van Metre and Callender, 1997).
Sediment Core Sampling
Bed sediment core samples were collected using a Benthos gravity piston corer fitted with a plastic barrel (Van Metre and Callender, 1997). Two sediment cores (about 188 cm length � 6.5 cm diameter) were collected from the lower part of SWR in the paleo-channel of the Sweetwater River on September 24, 1998. The sampling site was located sufficiently far from past aeration activities near the Sweetwater Dam so the core would reflect the undisturbed, natural sedimentation rate of the reservoir. One core was subsampled at 4-cm intervals for chemical analysis. The second core was split lengthwise and inspected for color, texture, odor, the presence of organic detritus and benthic invertebrates, and prereservoir land-surface identification.
Surficial Bed Sediment Sampling
Surficial bed sediment samples were collected using a 15 � 15 � 15 cm Ekman grab sampler (Wildco, Saginaw, Mich.) at the seven established water sam-pling sites in SWR on September 9 1998, and at both LLR water sampling sites on September 10, 1999. Each of the four URDS ponds adjacent to SWR (fig. 2) also was sampled on November 5, 1998. The top 1 cm from each of these samples was subsampled for analysis.
ANALYTICAL METHODS
Water
Each water sample was analyzed at the USGS National Water Quality Laboratory (NWQL). Analyses for 87 VOCs used capillary-column gas chromatography/mass spectrometry (GC/MS) with full-scan ion monitoring, described by Connor and others (1998). The results for the VOC water analyses are given in table 3 (at back of report). The pesticide analyses used the method described by Zaugg and others (1995) and analyzes for 43 pesticides and 4 pesticide transformation products. This method uses capillary-column GC/MS with selected-scan ion monitoring. The results for the pesticide water analyses are given in table 4 (at back of report).
Analytical Methods 7

Air
The air sampling methods for VOCs, PAHs, and pesticides used in this monitoring program have no published USGS protocols and, as such, are considered experimental. The air sampling techniques, however, are based on established methods that have been successfully used by other research groups. They have also been used in several USGS studies that investi-gated occurrence and distribution of VOCs (Baehr and others, 1999a,b; Bender and others, 2000) and pesti-cides (Majewski and others, 1998; Foreman and others, 2000) in the atmosphere.
The low-volume VOC air sampling and anal-ytical methods were developed by the research group of Dr. James Pankow at Oregon Graduate Institute, Beaverton, Oregon (Pankow and others, 1998) in conjunction with the USGS. Air VOC analyses were done by Dr. Pankow’s research group. The VOC air samples were analyzed by adsorption/thermal desorption GC/MS. The method included 87 VOCs that ranged in volatility from CFC-12 to 1,2,3-trichlorobenzene. Method detection limits (MDL) for the analytes ranged from 0.02 to 0.06 parts per billion by volume. The results for the VOC air analyses are given in tables 5A and 5B (at back of report).
The high-volume PAH and pesticide air samples are analyzed using a modified version of established NWQL analytical methods. The analytical method for the PAHs in the gas and particle phases, which deter-mines 32 PAH compounds and related isomers, was developed for this study by the NWQL Methods Development Group (Foreman and others, 1995). The pesticide method is based on the method used to analyze the water samples (Zaugg and others, 1995) and includes the same compounds, but omits desethyl atrazine, and adds desisopropylatrazine. The sampling and analytical methods for both the PAH and pesticide air samples have been used in several specialized studies undertaken by the USGS (Foreman and others, 1997, 2000; Majewski and others, 1998) and are similar to established procedures currently used by the NAWQA Program. PAH air analyses are not included in this report because they have not been completed. Analytical results for pesticides in air are given in table 6 (at back of report).
Sediment
The surficial bed sediment and core samples were all analyzed for the organic constituents at the NWQL using the same custom method. This modified USGS method (Furlong and others, 1996) analyzes for 22 parent PAHs, 10 specific alkyl-PAH isomers, homologous series of 25 alkyl-PAH isomers, total PCBs, and 16 organochlorine (OC) insecticides. Every other sediment core segment to a depth of 72 cm was analyzed; thereafter, every third segment was analyzed. The results for the PAH core, surficial bed sediment, and URDS sample analyses are given in table 7 (at back of report); OC results for the same samples are given in table 8 (at back of report). Major and trace elements analyses for each surficial bed sediment and core sample were done by Dr. E. Callender (USGS National Research Program) using methods described in Lichte and others (1987) and Briggs (1990). Every other sediment core segment to a depth of 188 cm was analyzed, and the results are given in table 9 (at back of report). The cesium-137 age determinations are given in table 10 (at back of report). Table 11 (at back of report) contains the description of the visual analysis of the core content, color, and texture.
QUALITY CONTROL
Sampling
Three types of water sampling quality control were used in this study: blanks, spikes, and replicates. Blanks and spikes estimate result bias, and replicates estimate result variability. Equipment blanks demon-strate that the equipment cleaning procedures, sample collection procedures, and the sample processing equipment are not contaminating environmental samples. Equipment blanks are collected annually by processing USGS laboratory certified water, known to be free of the analytes of interest, through all of the cleaned sampling and processing equipment.
Field blanks are collected to demonstrate that the sampling equipment is adequately cleaned between environmental sampling sites. The field blank is collected at an environmental sampling location by processing USGS laboratory certified water, known to be free of the analytes of interest, through all field cleaned sampling equipment. A spike is an
8 Water-Quality Monitoring, Sweetwater and Loveland Reservoirs, San Diego County, Calif.—Phase One Results, 1998–1999

environmental sample that is fortified with a known concentration of selected analytes. Spiked samples are used to measure bias in analyte degradation, analyte recovery, or to test the effects of various sampling matrices on the analyses of specific constituent groups. Replicate samples are collected and processed iden-tically to the environmental sample and used to meas-ure the variability during sample processing and analysis (Mueller and others, 1997). At least one quality-control sample is collected during every sampling campaign. The type of quality-control sample collected and the sampling location are chosen randomly. The blank, spike, and replicate quality-control data for the VOCs and pesticides in the water samples are included in tables 12 and 13 (at back of report), respectively, and for the PAHs and OCs in the surficial bed sediment samples in tables 14 and 15 (at back of report), respectively.
Analytical
Quality of analytical results is monitored by adding surrogate compounds to each sample before it is processed for analysis. These surrogate compounds are added at the NWQL to monitor sample preparation and analysis. For water samples, 1,2-dichloroethane-d10, toluene-d8, and 1,4-bromofluorobenzene are added to each VOC sample, and diazinon-d6 and alpha-HCH-d6 are added to each pesticide sample. The results, in percentage recovery, for each water analysis are given in tables 3 and 4, respectively.
The air samples use a slightly different method for assessing the analytical method efficiency. Each VOC air sample collected has an associated travel blank, travel spike, and lab blank analyzed along with it (Wentai Luo, Oregon Graduate Institute, unpub. data, 1999). Each SOC air sample is comprised of a GFF and a PUF extract, and these extracts are analyzed at the NWQL for two different classes of compounds. A mixture of five surrogate compounds was added to each sample prior to extraction. For PAH analysis, nitrobenzene-d5, 2-fluorobiphenyl, and terphenyl-d14 are the surrogates; for pesticide analysis, diazinon-d10 and alpha-HCH-d6 are the surrogates. The surrogate results, in percentage recovery, for the pesticide air sample analysis are given in table 6.
The quality of the bed sediment analyses was monitored using blank and spiked sample analyses, and by adding a mixture of five surrogate compounds to
each sample prior to extraction. The compounds nitrobenzene-d5, 2-fluorobiphenyl, and terphenyl-d14 were the surrogates monitored during the PAH analyses; nonachloro-biphenyl and alpha-HCH-d6 were the surrogates monitored during the OC analyses. The results, in percentage recovery, for the PAH surrogates are given in table 7, and the OC pesticide surrogate results, in percentage recovery, are given in table 8.
REFERENCES CITED
Baehr, A.L., Kauffman, L.J., Charles, E.G., Baker, R.J., Stackelberg, P.E., Ayers, M.A., and Zapecza, O.S., 1999a, Sampling throughout the hydrologic cycle to characterize sources of volatile organic compounds in ground water, in Morganwalp, D.W., and Buxton, H.T., eds., Subsurface contamination from point sources, v. 3 of U.S. Geological Survey Toxic Substances Hydrology Program—Proceedings of the technical meeting, Charleston, South Carolina, March 8–12, 1999: U.S. Geological Survey Water-Resources Investigations Report 99-4018C, p. 21–36.
Baehr, A.L., Stackelberg, P.E., and Baker, R.J., 1999b, Evaluation of the atmosphere as a source of volatile organic compounds in shallow groundwater: Water Resources Research, v. 35, no. 1, p. 127–136.
Bender, D.A., Zogorski, J.S., Luo, Wentai., Pankow, J.F., Majewski, M.S., and Baker, R.J., 2000, Atmospheric-water interaction of chloroform, toluene, and MTBE in small perennial urban streams, in proceedings of the 93rd Annual Air and Waste Management Association Conference, Salt Lake City, UT.
Bigelow, D.S., 1984, Instruction manual: NADP/NTN Site Selection and Installation: Fort Collins, Colo., Colorado State University, Natural Resource Ecology Laboratory, variously paged [available from NADP Program Office, Illinois State Water Survey, 2204 Griffith Drive, Champaign IL 61820-7495].
Briggs, P., 1990, Elemental analysis of geological material by inductively coupled plasma-atomic emission spectrometry, in Arbogast, B.F., ed., Quality assurance manual for the branch of geochemistry: U.S. Geological Survey Open-File Report 90-668, 184 p.
California Environmental Protection Agency, 1986, California Safe Drinking Water and Toxic Enforcement Act of 1986 (Proposition 65): Health and Safety Code, division 20, chap. 6.6, sect. 25249.5 through 25249.13.
California Department of Transportation, 2001, State Route 125 (From SR-905 to State Route 54): District 11 Fact Sheet, accessed December 14, 2001, at URL <http://www.dot.ca.gov/dist11/facts/125toll.htm>.
References Cited 9

Connor, B.F., Rose, D.L., Noriega, M.C., Murtagh, L.K., and Abney, S.R., 1998, Methods of analysis by the U.S. Geological Survey National Water Quality Laboratory—Determination of 86 volatile organic compounds in water by gas chromatography/mass spectrometry, including detections less than reporting limits: U.S. Geological Survey Open-File Report 97-829, 78 p.
Foreman, W.T., Connor, B.F., Furlong, E.T., Vaught, D.G., and Merten, L.M., 1995, Methods of analysis by the U.S. Geological Survey National Water Quality Laboratory—Determination of organochlorine pesticides and polychlorinated biphenyls in bottom sediment by dual capillary-column gas chromatography with electron-capture detection: Open-File Report 95-0140, 78 p.
Foreman, W.T., Goolsby, D.A., Majewski, M.S., Wiebe, F.W., and Battaglin, W.A., 1997, Acetochlor and other herbicides in air and rain in the Midwestern United States [abs.], in Bridging the global environment: Technology, communication, and education: Society of Environmental Toxicology and Chemistry Annual Meeting, 18th, San Francisco, Calif., November 16–20, 1997, Abstract Book, no. 229, p. 45.
Foreman, W.T., Majewski, M.S., Goolsby, D.A., Wiebe, F.W., and Coupe, R.H., 2000, Pesticides in the atmosphere of the Mississippi River Valley, Part II—Air: Science of the Total Environment, v. 248, no. 2–3, p. 213–226.
Furlong, E. T., Vaught, D. G., Merten, L. M., Foreman, W. T., and Gates, P. M., 1996, Methods of analysis by the U.S. Geological Survey National Water Quality Laboratory—Determination of semivolatile organic compounds in bottom sediment by solvent extraction, gel permeation chromatographic fractionation, and capillary-column gas chromatography/mass spectrometry: Open-File Report 95-0719, 67 p.
Lichte, F.E., Golightly, D.W., and Lamothe, O.J., 1987, Inductively coupled plasma-atomic emission spectrometry, in Baedecker, P.A., ed., Methods for geochemical analysis: U.S. Geological Survey Bulletin 1770, p. B1-B10.
Majewski, M.S., Foreman, W.T., Goolsby, D.A., and Nakagaki, Naomi, 1998, Airborne pesticide residues along the Mississippi River: Environmental Science and Technology, v. 32, no. 23, p. 3689–3698.
Mueller, D.K., Martin, J.D., and Lopes, T.J., 1997, Quality-control design for surface-water sampling in the National Water-Quality Assessment Program: U.S. Geological Survey Open-File Report 97-223, 17 p.
Ogden Environmental and Energy Services, 1997, SR-125 South route alternatives: Potential air emissions impact on Sweetwater Reservoir: San Diego, Calif. [available from Sweetwater Authority, 505 Garrett Avenue, Chula Vista, CA 92912].
Pankow, J.F., Luo, Wentai, Isabelle, L.M., Bender, D.A., and Baker, R.J., 1998, Determination of a wide range of volatile organic compounds in ambient air using multisorbent adsorption/thermal desorption and gas chromatography/mass spectrometry: Analytical Chemistry, v. 70, no. 24. p. 5213–5221.
Shelton, L.R., 1994, Field guide for collecting and processing stream-water samples for the National Water-Quality Assessment Program: U.S. Geological Survey Open-File Report 94-455, 42 p.
———1997, Field guide for collecting samples for analysis of volatile organic compounds in stream water for the National Water-Quality Assessment Program: U.S. Geological Survey Open-File Report 97-401, 14 p.
Van Metre, P.C., and Callender, Edward, 1997, Water-quality trends in White Rock Creek Basin from 1912–1994 identified using sediment cores from White Rock Lake reservoir, Dallas, Texas: Journal of Paleolimnology, v. 17, p. 239.
Zaugg, S.D., Sandstrom, M.W., Smith, S.G., and Fehlberg, K.M., 1995, Methods of analysis by the U.S. Geological Survey National Water Quality Laboratory—Determination of pesticides in water by C-18 solid-phase extraction and capillary-column gas chromatography/mass spectrometry with selected-ion monitoring: U.S. Geological Survey Open-File Report 95-181, 49 p.
10 Water-Quality Monitoring, Sweetwater and Loveland Reservoirs, San Diego County, Calif.—Phase One Results, 1998–1999

Table 2. Water-quality depth-profile data for dissolved oxygen, pH, specific conductance, and temperature for the Sweetwater and Loveland Reservoirs sampling sites, San Diego County, California
Date TimeSampling depth
(m)
Oxygen,dissolved
(mg/L)
pH, waterwhole field
(standard units)
Specificconductance
(µµµµS/cm)
Watertemperature
(°°°°C)
(PCODE: 00098) (PCODE: 000300) (PCODE: 000400) (PCODE: 00095) (PCODE: 00010)
Sweetwater Reservoir near pump tower:September 9, 1998 1525 1.0 6.9 8.3 783 26.8
1526 2.0 7.0 8.4 783 26.61527 3.0 6.3 8.3 785 26.41528 4.0 4.5 8.0 783 26.01529 5.0 0.8 7.6 772 25.31530 6.0 0.2 7.5 749 23.11531 7.0 0.1 7.4 746 22.51532 8.0 0.1 7.3 738 21.51533 9.0 0.1 7.3 741 20.61534 10.0 0.1 7.3 749 19.21535 11.0 0.1 7.3 763 18.01536 12.0 0.1 7.3 770 17.71537 13.0 0.1 7.2 775 17.61538 14.0 0.1 7.2 776 17.51539 15.0 0.1 7.2 778 17.51540 16.0 0.1 7.2 1,040 17.5
November 3,1998 1318 0.1 6.1 — 794 19.61319 1.0 6.4 — 804 19.41320 2.0 6.2 — 808 19.31321 3.0 6.1 — 808 19.21322 4.0 5.9 — 808 19.21323 5.0 5.9 — 809 19.21324 6.0 5.9 — 810 19.21325 7.0 5.9 — 810 19.11326 8.0 5.8 — 810 19.11327 9.0 5.8 — 806 19.11328 10.0 5.8 — 805 19.11329 11.0 5.8 — 805 19.11330 12.0 5.7 — 806 19.11331 13.0 5.7 — 805 19.11332 14.0 5.7 — 805 19.11333 15.0 5.7 — 805 19.1
January 6, 1999 1000 0.1 8.7 7.8 847 12.11001 1.0 8.6 7.9 848 12.01002 2.0 8.6 7.9 849 12.01003 3.0 8.6 7.9 850 12.01004 4.0 8.6 7.9 851 11.91005 5.0 8.6 7.9 851 11.91006 6.0 8.6 7.9 851 11.91007 7.0 8.5 7.9 852 11.91008 8.0 8.6 7.9 852 11.91009 9.0 8.5 7.9 852 11.91010 10.0 8.4 7.9 853 11.91011 11.0 8.3 7.9 854 11.91012 12.0 7.8 7.9 854 11.91013 13.0 7.8 7.9 855 11.91014 13.6 7.4 7.9 860 11.9
[Time is denoted in 24-hour scale. PCODE, parameter code; m, meter; mg/L, milligram per liter; µS/cm, microsiemen per centimeter; °C, degree Celsius; —, no data]
Table 2 11

Table 2. Water-quality depth-profile data for dissolved oxygen, pH, specific conductance, and temperature for the Sweetwater and
March 1, 1999 1000 0.1 11.5 8.9 773 16.11001 1.0 12.1 8.8 758 15.31002 2.0 12.2 8.7 760 15.11003 3.0 12.1 8.7 760 14.91004 4.0 8.5 8.2 759 13.61005 5.0 7.3 8.1 757 13.31006 6.0 6.4 8.0 755 13.11007 7.0 5.8 7.8 752 12.81008 8.0 5.6 7.8 752 12.81009 9.0 5.8 7.9 751 12.71010 10.0 5.8 7.8 749 12.61011 11.0 5.2 7.8 749 12.51012 12.0 4.8 7.7 749 12.41013 14.0 4.7 7.7 749 12.41014 15.0 3.9 7.7 750 12.41015 16.0 3.8 7.7 750 12.41016 16.5 0.4 8.2 963 12.6
May 3, 1999 1055 0.1 9.1 8.3 795 17.31056 1.0 9.1 8.5 797 17.21057 2.0 9.1 8.3 797 17.21058 3.0 9.0 8.3 797 17.21059 4.0 9.0 8.3 797 17.2
July 12, 1999 1055 0.1 7.9 8.3 874 26.31056 1.0 7.9 8.4 874 26.21057 2.0 7.9 8.3 873 25.71058 3.0 7.8 8.3 873 25.61059 4.0 7.7 8.3 872 25.4
September 20, 1999 1120 0.1 5.9 8.0 864 23.31121 1.0 5.7 8.0 882 22.91122 2.0 5.6 8.0 892 22.71123 3.0 5.4 8.0 894 22.51124 4.0 5.4 8.1 907 22.41125 5.0 5.2 8.0 910 22.41126 6.0 5.2 8.0 917 22.41127 7.0 5.1 8.0 921 22.41128 8.0 2.0 7.6 889 20.71129 9.0 1.1 7.5 860 19.21130 10.0 0.6 7.4 855 18.21131 11.0 0.4 7.3 858 17.2
Sweetwater Reservoir near Vista del Lago station:September 10, 1998 0835 1.0 6.5 8.5 783 26.4
0836 2.0 6.5 8.5 784 26.40837 3.0 6.5 8.5 784 26.40838 4.0 6.5 8.5 783 26.40839 5.0 6.4 8.5 781 26.40840 6.0 2.3 8.0 771 25.50841 7.0 0.3 7.6 741 22.20842 8.0 0.2 7.5 739 20.50843 9.0 0.2 7.4 742 19.9
Date TimeSampling depth
(m)
Oxygen,dissolved
(mg/L)
pH, waterwhole field
(standard units)
Specificconductance
(µµµµS/cm)
Watertemperature
(°°°°C)
(PCODE: 00098) (PCODE: 000300) (PCODE: 000400) (PCODE: 00095) (PCODE: 00010)
Loveland Reservoirs sampling sites, San Diego County, California—Continued
12 Table 2

Table 2. Water-quality depth-profile data for dissolved oxygen, pH, specific conductance, and temperature for the Sweetwater and
0844 10.0 0.2 7.4 745 19.40846 11.0 0.2 7.4 751 18.6
November 3, 1998 1131 1.0 5.8 — 788 19.51132 2.0 5.8 — 790 19.41133 3.0 5.7 — 791 19.31134 4.0 5.5 — 794 19.31135 5.0 5.5 — 793 19.31136 6.0 5.5 — 794 19.31137 7.0 5.4 — 795 19.31138 8.0 5.4 — 795 19.21139 9.0 5.4 — 796 19.21140 10.0 5.4 — 796 19.2
January 6, 1999 1055 0.1 8.8 8.2 852 12.41056 1.0 8.6 8.2 850 12.01057 2.0 8.3 8.1 851 11.91058 3.0 8.0 8.1 852 11.91059 4.0 8.2 8.1 852 11.91100 5.0 8.4 8.2 852 11.91101 6.0 8.4 8.2 853 11.91102 7.0 8.4 8.2 852 11.91103 8.0 8.3 8.1 853 11.91104 9.0 8.5 8.2 853 11.9
March 1, 1999 1059 0.1 11.8 8.8 753 16.81101 1.0 12.0 8.8 753 15.61102 2.0 11.9 8.9 771 15.31103 3.0 11.9 8.8 770 15.31104 4.0 11.9 8.8 769 15.31105 5.0 11.1 8.7 766 14.71106 6.0 7.5 8.2 756 13.71107 7.0 6.5 8.1 757 13.31108 8.0 5.3 8.0 753 12.91109 9.0 5.0 7.9 752 12.81110 10.0 5.1 7.9 752 12.71111 11.0 4.6 7.9 749 12.61112 12.0 4.3 7.8 749 12.5
May 3, 1999 1144 0.1 9.2 8.4 795 17.41145 1.0 9.3 8.4 795 17.41146 2.0 9.3 8.4 795 17.41147 3.0 9.3 8.4 796 17.41148 4.0 9.2 8.3 796 17.21149 5.0 9.0 8.3 796 17.11151 6.0 8.7 8.3 795 17.11152 7.0 5.2 7.8 781 16.21153 8.0 2.9 7.6 771 15.31154 9.0 1.9 7.6 769 15.21155 10.0 1.4 7.5 768 15.01156 11.0 0.8 7.5 767 14.81157 11.1 0.8 7.5 767 14.8
Date TimeSampling depth
(m)
Oxygen,dissolved
(mg/L)
pH, waterwhole field
(standard units)
Specificconductance
(µµµµS/cm)
Watertemperature
(°°°°C)
(PCODE: 00098) (PCODE: 000300) (PCODE: 000400) (PCODE: 00095) (PCODE: 00010)
Loveland Reservoirs sampling sites, San Diego County, California—Continued
Table 2 13

Table 2. Water-quality depth-profile data for dissolved oxygen, pH, specific conductance, and temperature for the Sweetwater and
July 12, 1999 1145 0.1 7.7 8.5 873 26.61146 1.0 7.8 8.5 875 26.51147 2.0 7.8 8.5 876 26.21148 3.0 7.7 8.5 876 25.91149 4.0 6.0 8.0 835 24.51150 5.0 2.0 7.9 842 22.51151 6.0 0.7 7.8 829 21.51152 7.0 0.3 7.8 830 21.11153 8.0 0.2 7.8 796 19.61154 9.0 0.2 7.9 797 17.31155 10.0 0.2 7.9 794 16.6
Sweetwater Reservoir center of minimum pool:September 9, 1998 1616 1.0 7.3 8.5 782 27.0
1617 2.0 7.4 8.5 782 26.91618 3.0 7.4 8.5 783 26.81619 4.0 6.3 8.4 782 26.31620 5.0 1.2 7.7 766 25.21621 6.0 0.7 7.6 753 24.31622 7.0 0.4 7.5 747 22.91623 8.0 0.3 7.5 740 21.61624 9.0 0.2 7.4 745 20.01625 10.0 0.2 7.3 749 19.01626 11.0 0.2 7.3 756 18.31627 12.0 0.2 7.3 764 17.91628 13.0 0.2 7.3 768 17.71629 14.0 0.2 7.3 770 17.71631 15.0 0.1 7.3 769 17.71632 16.0 0.1 7.3 777 17.51633 17.0 0.1 7.1 810 17.5
November 3, 1998 1355 0.1 6.4 — 787 20.71356 1.0 6.0 — 786 19.61357 2.0 5.8 — 787 19.31358 3.0 5.8 — 788 19.21359 4.0 5.7 — 789 19.21400 5.0 5.7 — 790 19.21401 6.0 5.6 — 790 19.21402 7.0 5.6 — 791 19.21403 8.0 5.5 — 792 19.21404 9.0 5.5 — 793 19.21405 10.0 5.5 — 793 19.11406 11.0 5.5 — 793 19.11407 12.0 5.5 — 794 19.11408 13.0 5.5 — 794 19.11409 14.0 5.6 — 794 19.11410 15.0 5.5 — 795 19.1
January 6, 1999 1122 0.1 8.8 8.2 854 12.71123 1.0 8.8 8.2 851 12.11124 2.0 8.6 8.1 852 12.01125 3.0 8.4 8.2 853 12.01126 4.0 8.3 8.1 853 12.0
Date TimeSampling depth
(m)
Oxygen,dissolved
(mg/L)
pH, waterwhole field
(standard units)
Specificconductance
(µµµµS/cm)
Watertemperature
(°°°°C)
(PCODE: 00098) (PCODE: 000300) (PCODE: 000400) (PCODE: 00095) (PCODE: 00010)
Loveland Reservoirs sampling sites, San Diego County, California—Continued
14 Table 2

Table 2. Water-quality depth-profile data for dissolved oxygen, pH, specific conductance, and temperature for the Sweetwater and
1127 5.0 8.3 8.1 853 12.01128 6.0 8.2 8.1 853 12.01129 7.0 8.2 8.1 854 12.01130 8.0 7.9 8.1 855 11.91131 9.0 7.7 8.1 855 11.91132 10.0 7.7 8.1 855 11.91133 11.0 7.6 8.1 856 11.91134 12.0 7.6 8.1 856 11.91135 13.0 7.5 8.1 857 11.91136 14.0 6.5 7.9 864 11.9
March 1, 1999 1113 0.1 11.9 8.8 776 16.71114 1.0 11.9 8.8 775 16.71115 2.0 12.0 8.8 770 15.81116 3.0 11.9 8.8 768 15.21117 4.0 11.8 8.8 768 15.21118 5.0 11.9 8.7 767 15.11119 6.0 11.2 8.7 760 14.81120 7.0 7.4 8.2 758 13.51121 8.0 6.7 8.1 757 13.31122 9.0 6.1 8.0 750 12.91123 10.0 5.6 8.0 752 12.81124 11.0 5.0 7.9 748 12.71125 12.0 5.3 7.9 750 12.61126 13.0 5.4 7.9 749 12.51127 14.0 5.4 7.9 748 12.51128 15.0 5.3 7.9 748 12.41129 16.0 5.2 7.8 749 12.41130 17.0 3.5 7.8 749 12.4
May 3, 1999 1220 0.1 9.2 8.4 794 17.31221 1.0 9.3 8.4 795 17.31222 2.0 9.4 8.3 795 17.31223 3.0 9.4 8.3 795 17.21224 4.0 9.3 8.3 795 17.21225 5.0 9.3 8.3 795 17.21226 6.0 8.3 8.2 793 17.01227 7.0 3.6 7.6 771 15.41228 8.0 2.9 7.6 771 15.31229 9.0 2.2 7.6 770 15.11230 10.0 2.1 7.5 769 15.01231 11.0 2.0 7.5 768 15.01232 12.0 1.5 7.5 767 14.91233 13.0 0.4 7.5 765 14.71234 14.0 0.3 7.5 766 14.71235 15.0 0.2 7.5 767 14.71237 16.0 0.2 7.5 767 14.61238 16.5 0.2 7.5 773 14.6
July 12, 1999 1220 0.1 7.5 8.5 874 26.31221 0.1 7.6 8.5 875 26.21222 1.0 7.7 8.6 875 26.2
Date TimeSampling depth
(m)
Oxygen,dissolved
(mg/L)
pH, waterwhole field
(standard units)
Specificconductance
(µµµµS/cm)
Watertemperature
(°°°°C)
(PCODE: 00098) (PCODE: 000300) (PCODE: 000400) (PCODE: 00095) (PCODE: 00010)
Loveland Reservoirs sampling sites, San Diego County, California—Continued
Table 2 15
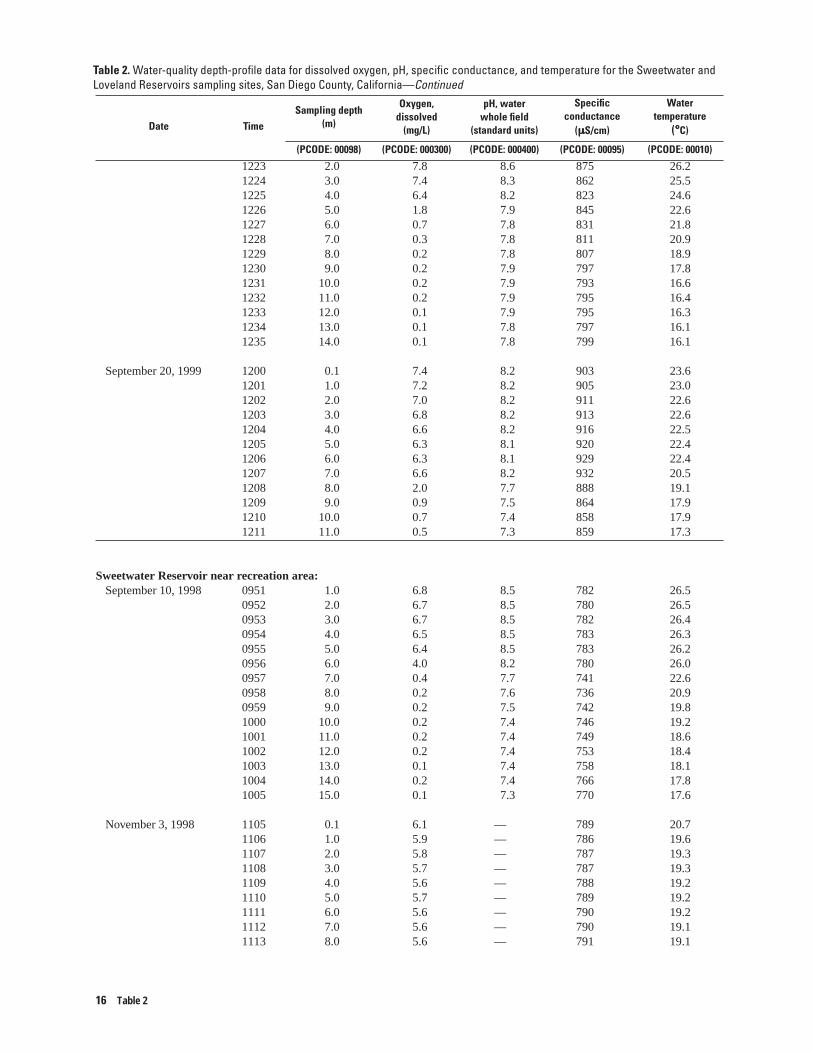
Table 2. Water-quality depth-profile data for dissolved oxygen, pH, specific conductance, and temperature for the Sweetwater and
1223 2.0 7.8 8.6 875 26.21224 3.0 7.4 8.3 862 25.51225 4.0 6.4 8.2 823 24.61226 5.0 1.8 7.9 845 22.61227 6.0 0.7 7.8 831 21.81228 7.0 0.3 7.8 811 20.91229 8.0 0.2 7.8 807 18.91230 9.0 0.2 7.9 797 17.81231 10.0 0.2 7.9 793 16.61232 11.0 0.2 7.9 795 16.41233 12.0 0.1 7.9 795 16.31234 13.0 0.1 7.8 797 16.11235 14.0 0.1 7.8 799 16.1
September 20, 1999 1200 0.1 7.4 8.2 903 23.61201 1.0 7.2 8.2 905 23.01202 2.0 7.0 8.2 911 22.61203 3.0 6.8 8.2 913 22.61204 4.0 6.6 8.2 916 22.51205 5.0 6.3 8.1 920 22.41206 6.0 6.3 8.1 929 22.41207 7.0 6.6 8.2 932 20.51208 8.0 2.0 7.7 888 19.11209 9.0 0.9 7.5 864 17.91210 10.0 0.7 7.4 858 17.91211 11.0 0.5 7.3 859 17.3
Sweetwater Reservoir near recreation area:September 10, 1998 0951 1.0 6.8 8.5 782 26.5
0952 2.0 6.7 8.5 780 26.50953 3.0 6.7 8.5 782 26.40954 4.0 6.5 8.5 783 26.30955 5.0 6.4 8.5 783 26.20956 6.0 4.0 8.2 780 26.00957 7.0 0.4 7.7 741 22.60958 8.0 0.2 7.6 736 20.90959 9.0 0.2 7.5 742 19.81000 10.0 0.2 7.4 746 19.21001 11.0 0.2 7.4 749 18.61002 12.0 0.2 7.4 753 18.41003 13.0 0.1 7.4 758 18.11004 14.0 0.2 7.4 766 17.81005 15.0 0.1 7.3 770 17.6
November 3, 1998 1105 0.1 6.1 — 789 20.71106 1.0 5.9 — 786 19.61107 2.0 5.8 — 787 19.31108 3.0 5.7 — 787 19.31109 4.0 5.6 — 788 19.21110 5.0 5.7 — 789 19.21111 6.0 5.6 — 790 19.21112 7.0 5.6 — 790 19.11113 8.0 5.6 — 791 19.1
Date TimeSampling depth
(m)
Oxygen,dissolved
(mg/L)
pH, waterwhole field
(standard units)
Specificconductance
(µµµµS/cm)
Watertemperature
(°°°°C)
(PCODE: 00098) (PCODE: 000300) (PCODE: 000400) (PCODE: 00095) (PCODE: 00010)
Loveland Reservoirs sampling sites, San Diego County, California—Continued
16 Table 2

Table 2. Water-quality depth-profile data for dissolved oxygen, pH, specific conductance, and temperature for the Sweetwater and
1114 9.0 5.6 — 791 19.11115 10.0 5.6 — 792 19.11116 11.0 5.6 — 792 19.11117 12.0 5.6 — 792 19.11118 13.0 5.5 — 792 19.11119 14.0 5.4 — 793 19.1
January 6, 1999 1150 0.1 8.7 8.2 854 13.11151 1.0 8.5 8.2 852 12.11152 2.0 8.4 8.1 852 12.01153 3.0 8.3 8.1 839 12.01154 4.0 8.3 8.1 853 12.01155 5.0 8.2 8.1 853 12.01156 6.0 8.1 8.1 854 12.01157 7.0 8.0 8.1 854 12.01158 8.0 7.9 8.1 855 11.91159 9.0 7.8 8.1 855 11.9
March 1, 1999 1200 0.1 11.5 8.9 775 16.11201 1.0 11.6 8.4 769 15.91202 2.0 11.6 8.9 766 15.31203 3.0 11.6 8.9 763 15.11204 4.0 11.7 8.8 765 15.01205 5.0 10.3 8.7 762 14.41206 6.0 6.6 8.2 758 13.41207 7.0 6.3 8.1 758 13.31208 8.0 5.9 8.1 754 12.91209 9.0 5.4 8.0 751 12.71210 10.0 5.3 8.0 750 12.51211 11.0 5.2 8.0 749 12.51212 12.0 5.4 8.0 748 12.41213 13.0 4.7 7.9 749 12.41214 14.0 4.4 7.9 749 12.41215 15.0 3.8 7.8 749 12.41216 16.0 3.7 7.9 750 12.4
May 3, 1999 1300 0.1 8.9 8.3 793 17.21301 1.0 9.0 8.3 794 17.21302 2.0 9.1 8.3 795 17.21303 3.0 9.1 8.3 795 17.21304 4.0 9.0 8.3 795 17.21305 5.0 8.9 8.3 795 17.11306 6.0 8.7 8.0 778 16.31307 7.0 4.9 7.8 774 16.11308 8.0 3.0 7.6 771 15.21309 9.0 2.4 7.5 769 15.21311 10.0 1.8 7.5 768 15.01312 11.0 1.1 7.5 766 14.81313 12.0 0.4 7.4 766 14.71314 13.0 0.2 7.5 767 14.61315 14.0 0.2 7.5 767 14.61316 15.0 0.2 7.4 769 14.6
Date TimeSampling depth
(m)
Oxygen,dissolved
(mg/L)
pH, waterwhole field
(standard units)
Specificconductance
(µµµµS/cm)
Watertemperature
(°°°°C)
(PCODE: 00098) (PCODE: 000300) (PCODE: 000400) (PCODE: 00095) (PCODE: 00010)
Loveland Reservoirs sampling sites, San Diego County, California—Continued
Table 2 17

Table 2. Water-quality depth-profile data for dissolved oxygen, pH, specific conductance, and temperature for the Sweetwater and
July 12, 1999 1300 0.1 7.1 8.4 874 26.41301 1.0 7.3 8.5 874 26.31302 2.0 7.4 8.5 875 26.21303 3.0 7.2 8.4 869 25.61304 4.0 7.2 8.4 872 25.31305 5.0 1.6 7.8 822 22.51306 6.0 0.7 7.7 829 21.51307 7.0 0.3 7.7 826 20.91308 8.0 0.2 7.7 799 18.61309 9.0 0.2 7.8 801 17.81310 10.0 0.1 7.8 795 16.61311 11.0 0.1 7.8 795 16.41312 12.0 0.1 7.8 797 16.41313 13.0 0.1 7.6 798 16.1
Sweetwater Reservoir minimum pool boundary East:September 10, 1998 1220 1.0 7.4 8.5 779 27.8
1221 2.0 7.0 8.4 781 27.21222 3.0 6.7 8.4 781 27.01223 4.0 6.9 8.4 780 26.61224 5.0 6.2 8.3 781 26.21225 6.0 0.4 7.7 760 25.11226 7.0 0.3 7.6 746 23.41227 8.0 0.2 7.5 737 21.11228 9.0 0.2 7.4 741 19.81229 10.0 0.2 7.4 749 18.71230 11.0 0.2 7.3 753 18.41231 12.0 0.2 7.3 758 18.11232 13.0 0.2 7.3 768 17.7
November 3, 1998 1202 0.1 5.8 — 788 20.21203 1.0 5.7 — 789 20.21204 2.0 5.5 — 788 19.71205 3.0 5.4 — 789 19.41206 4.0 5.4 — 790 19.41207 5.0 5.4 — 790 19.31208 6.0 5.4 — 791 19.31209 7.0 5.4 — 791 19.31210 8.0 5.4 — 792 19.31211 9.0 5.3 — 793 19.31212 10.0 5.1 — 793 19.21213 11.0 5.1 — 793 19.21214 12.0 5.1 — 793 19.2
January 6, 1999 1325 0.1 10.5 8.4 853 13.51326 1.0 9.7 8.2 852 12.31327 2.0 9.2 8.2 852 12.21328 3.0 8.9 8.3 852 12.11329 4.0 8.8 8.2 853 12.11330 5.0 8.6 8.2 855 12.11331 6.0 8.1 8.1 858 12.01332 7.0 7.9 8.1 858 12.01333 8.0 7.8 8.1 858 11.9
Date TimeSampling depth
(m)
Oxygen,dissolved
(mg/L)
pH, waterwhole field
(standard units)
Specificconductance
(µµµµS/cm)
Watertemperature
(°°°°C)
(PCODE: 00098) (PCODE: 000300) (PCODE: 000400) (PCODE: 00095) (PCODE: 00010)
Loveland Reservoirs sampling sites, San Diego County, California—Continued
18 Table 2

Table 2. Water-quality depth-profile data for dissolved oxygen, pH, specific conductance, and temperature for the Sweetwater and
1334 9.0 7.7 8.1 860 11.91335 10.0 7.5 8.1 862 11.91336 11.0 6.4 8.1 873 11.9
March 2, 1999 1325 0.1 11.6 8.8 751 15.61326 1.0 11.9 8.8 764 15.61327 2.0 11.9 8.8 764 15.51328 3.0 11.8 8.9 758 15.31329 4.0 11.3 8.8 758 14.81330 5.0 8.4 8.4 757 14.01331 6.0 6.8 8.2 754 13.51332 7.0 6.0 8.1 755 13.21333 8.0 6.0 8.1 750 13.21334 9.0 5.6 8.0 750 12.81335 10.0 5.5 8.0 749 12.81336 11.0 5.2 8.0 749 12.71337 12.0 4.6 7.9 747 12.51338 13.0 4.5 7.9 747 12.51339 13.5 4.2 8.1 747 12.5
May 3, 1999 1335 0.1 9.2 8.3 800 17.91336 1.0 9.3 8.3 800 17.91337 2.0 9.4 8.3 800 17.91338 3.0 9.4 8.3 800 17.91339 4.0 9.4 8.3 799 17.91340 5.0 9.3 8.3 799 17.81341 6.0 9.2 8.2 798 17.81342 7.0 8.0 8.1 796 17.21343 8.0 7.0 8.0 790 16.81344 9.0 4.8 7.6 775 16.11345 10.0 3.6 7.6 776 15.81346 11.0 3.3 7.6 777 15.71347 12.0 2.7 7.5 772 15.61348 13.0 1.1 7.4 770 15.1
July 12, 1999 1335 0.1 7.3 8.6 880 27.11336 1.0 7.4 8.6 879 27.11337 2.0 7.5 8.7 878 27.11338 3.0 7.5 8.7 878 27.11339 4.0 7.4 8.6 864 26.71340 5.0 7.2 8.6 873 25.11341 6.0 6.0 8.1 850 24.41342 7.0 3.3 8.0 808 22.81343 8.0 1.5 7.9 823 20.61344 9.0 1.0 7.9 805 18.51345 10.0 0.8 7.9 797 17.41346 11.0 0.7 7.9 794 17.21347 11.2 0.4 7.9 796 16.6
Sweetwater Reservoir east end reservoir fill boundary:September 10, 1998 1300 1.0 7.5 8.6 786 27.8
1301 2.0 7.2 8.6 786 27.61302 3.0 6.3 8.4 788 27.2
Date TimeSampling depth
(m)
Oxygen,dissolved
(mg/L)
pH, waterwhole field
(standard units)
Specificconductance
(µµµµS/cm)
Watertemperature
(°°°°C)
(PCODE: 00098) (PCODE: 000300) (PCODE: 000400) (PCODE: 00095) (PCODE: 00010)
Loveland Reservoirs sampling sites, San Diego County, California—Continued
Table 2 19

Table 2. Water-quality depth-profile data for dissolved oxygen, pH, specific conductance, and temperature for the Sweetwater and
1303 4.0 3.8 8.2 776 26.31304 5.0 0.3 7.8 762 25.2
November 3, 1998 1333 0.1 5.5 — 789 20.11334 1.0 5.5 — 791 20.11335 2.0 5.5 — 792 20.01336 3.0 5.5 — 797 19.7
January 6, 1999 1352 0.1 10.6 8.4 853 13.81353 1.0 8.6 8.2 853 12.11354 2.0 8.3 8.1 857 12.01355 2.3 8.2 8.2 857 12.0
March 1, 1999 1233 0.1 12.0 9.2 774 16.91234 1.0 12.1 8.9 769 16.61235 2.0 12.5 8.9 770 15.81236 3.0 11.4 8.7 760 14.81237 4.0 10.1 8.7 760 14.31238 5.0 8.0 8.4 759 14.01239 5.7 12.1 8.9 769 16.9
May 3, 1999 1430 0.1 9.2 8.4 812 18.61431 1.0 9.3 8.4 816 18.61432 2.0 9.4 8.3 816 18.61433 3.0 9.3 8.3 815 18.61434 4.0 9.4 8.4 815 18.61435 4.7 9.3 8.3 812 18.6
July 12, 1999 1430 0.1 7.4 8.4 892 28.21431 1.0 7.6 8.4 898 28.11432 2.0 7.4 8.4 890 27.9
September 20, 1999 1240 0.1 8.4 8.3 910 24.21241 0.5 8.3 8.3 913 24.2
Sweetwater Reservoir near Gum Tree Cove Pond:September 10, 1998 0910 1.0 6.3 8.5 785 26.8
0911 2.0 6.3 8.5 784 26.80912 3.0 6.3 8.5 784 26.80913 4.0 6.3 8.5 784 26.90914 5.0 5.6 8.4 781 26.60915 6.0 0.2 7.7 758 24.60916 7.0 0.2 7.6 743 22.80917 8.0 0.5 7.5 738 21.10918 9.0 0.2 7.4 743 19.80919 10.0 0.2 7.4 750 19.00920 11.0 0.2 7.4 756 18.30921 12.0 0.2 7.4 766 17.90922 13.0 0.2 7.3 769 17.7
November 3, 1998 1423 0.1 5.9 — 787 20.11424 1.0 5.8 — 789 20.01425 2.0 5.6 — 788 19.8
Date TimeSampling depth
(m)
Oxygen,dissolved
(mg/L)
pH, waterwhole field
(standard units)
Specificconductance
(µµµµS/cm)
Watertemperature
(°°°°C)
(PCODE: 00098) (PCODE: 000300) (PCODE: 000400) (PCODE: 00095) (PCODE: 00010)
Loveland Reservoirs sampling sites, San Diego County, California—Continued
20 Table 2

Table 2. Water-quality depth-profile data for dissolved oxygen, pH, specific conductance, and temperature for the Sweetwater and
1426 3.0 5.4 — 790 19.21427 4.0 5.3 — 790 19.41428 5.0 5.2 — 792 19.41429 6.0 5.1 — 792 19.41430 7.0 5.1 — 793 19.41431 8.0 5.1 — 794 19.31432 9.0 5.1 — 795 19.31433 10.0 4.9 — 795 19.21434 11.0 5.0 — 796 19.11435 12.0 5.0 — 796 19.1
January 6, 1999 1414 0.1 11.8 8.5 858 13.71415 1.0 9.2 8.3 855 12.31416 2.0 8.9 8.2 856 12.21417 3.0 8.8 8.3 856 12.21418 4.0 8.8 8.2 856 12.21419 5.0 8.7 8.1 857 12.11420 6.0 8.5 8.2 859 12.11421 7.0 8.4 8.2 1,120 12.01422 8.0 8.5 8.2 1,150 12.01423 9.0 8.4 8.1 1,160 11.71424 10.0 8.4 8.1 1,180 11.71425 10.1 8.3 8.2 1,190 11.7
March 1, 1999 1300 0.1 12.2 8.9 774 16.81301 1.0 12.5 8.9 772 16.61302 2.0 13.0 9.1 775 15.81303 3.0 12.0 8.8 771 15.41304 4.0 11.4 8.8 773 15.21305 5.0 9.8 8.7 768 14.71306 6.0 8.0 8.3 761 13.81307 7.0 5.8 8.1 757 13.21308 8.0 5.0 8.0 754 12.91309 9.0 4.7 8.0 753 12.71311 10.0 4.6 7.9 752 12.71312 11.0 4.3 7.9 751 12.61313 12.0 4.0 7.9 751 12.51314 13.0 3.8 7.9 751 12.51315 13.3 2.5 7.9 751 12.5
May 3, 1999 1445 0.1 9.1 8.4 798 17.81446 1.0 9.2 8.3 799 17.81447 2.0 9.3 8.3 799 17.81448 3.0 9.3 8.3 799 17.81449 4.0 9.3 8.3 799 17.81450 5.0 9.0 8.3 799 17.71451 6.0 8.1 8.1 795 17.11452 7.0 6.7 8.0 789 16.71453 8.0 5.0 7.8 782 16.21454 9.0 4.4 7.7 781 16.11455 10.0 3.5 7.6 778 15.81456 11.0 1.6 7.6 772 15.3
Date TimeSampling depth
(m)
Oxygen,dissolved
(mg/L)
pH, waterwhole field
(standard units)
Specificconductance
(µµµµS/cm)
Watertemperature
(°°°°C)
(PCODE: 00098) (PCODE: 000300) (PCODE: 000400) (PCODE: 00095) (PCODE: 00010)
Loveland Reservoirs sampling sites, San Diego County, California—Continued
Table 2 21

Table 2. Water-quality depth-profile data for dissolved oxygen, pH, specific conductance, and temperature for the Sweetwater and
July 12, 1999 1455 0.1 7.5 8.5 878 27.11456 1.0 7.6 8.5 878 27.11457 2.0 7.7 8.5 872 27.01458 3.0 7.6 8.5 868 26.21459 4.0 6.6 8.3 871 24.9
Loveland Reservoir near dam:September 10, 1998 1540 1.0 7.8 8.7 409 27.0
1541 2.0 7.8 8.7 409 26.31542 4.0 7.8 8.7 409 26.11543 6.0 1.8 7.9 367 23.21544 8.0 0.5 7.7 334 17.01545 10.0 0.4 7.7 322 14.31546 12.0 0.2 7.6 325 12.71547 14.0 0.3 7.5 331 12.01548 16.0 0.3 7.5 343 12.11549 18.0 0.3 7.5 343 11.61550 20.0 0.3 7.5 339 11.51551 22.0 0.5 7.5 342 11.41552 24.0 0.7 7.5 341 11.41553 26.0 0.6 7.4 341 11.31554 28.0 0.7 7.4 340 11.31555 30.0 0.6 7.4 341 11.31556 32.0 0.6 7.4 341 11.31557 34.0 0.5 7.4 340 11.31558 36.0 0.5 7.4 340 11.31559 38.0 0.7 7.4 342 11.31600 40.0 0.8 7.4 344 11.31601 42.0 0.4 7.4 348 11.31602 44.0 0.2 7.3 382 11.31603 46.0 0.2 7.3 400 11.41604 48.0 0.2 7.3 405 11.41605 50.0 0.1 7.3 409 11.4
November 4, 1998 0825 0.1 7.9 — 390 17.60826 1.0 8.0 — 389 17.50827 2.0 8.0 — 388 17.30828 3.0 7.9 — 387 17.20829 4.0 7.8 — 388 17.20830 5.0 7.8 — 387 17.20831 6.0 7.8 — 388 17.20832 7.0 7.8 — 387 17.20833 8.0 7.7 — 388 17.10834 9.0 7.7 — 386 17.10835 10.0 7.7 — 386 17.10836 11.0 3.3 — 341 15.90837 12.0 1.3 — 304 13.20838 13.0 0.7 — 304 12.30839 14.0 0.4 — 306 12.00840 16.0 0.3 — 315 11.70841 18.0 0.2 — 316 11.50842 20.0 0.2 — 315 11.40843 22.0 0.2 — 314 11.40844 24.0 0.2 — 313 11.3
Date TimeSampling depth
(m)
Oxygen,dissolved
(mg/L)
pH, waterwhole field
(standard units)
Specificconductance
(µµµµS/cm)
Watertemperature
(°°°°C)
(PCODE: 00098) (PCODE: 000300) (PCODE: 000400) (PCODE: 00095) (PCODE: 00010)
Loveland Reservoirs sampling sites, San Diego County, California—Continued
22 Table 2

Table 2. Water-quality depth-profile data for dissolved oxygen, pH, specific conductance, and temperature for the Sweetwater and
0845 26.0 0.1 — 315 11.30846 28.0 0.1 — 314 11.30847 30.0 0.1 — 313 11.30848 32.0 0.1 — 313 11.30849 34.0 0.1 — 313 11.30850 36.0 0.1 — 313 11.30851 38.0 0.1 — 314 11.20852 40.0 0.1 — 315 11.20853 42.0 0.1 — 333 11.30854 44.0 0.1 — 353 11.4
January 7, 1999 1000 0.1 6.2 7.9 390 17.61001 1.0 6.0 8.0 389 17.51002 2.0 6.0 8.0 388 17.31003 3.0 6.0 7.9 387 17.21004 4.0 5.9 7.8 388 17.21005 5.0 5.9 7.8 388 17.21006 6.0 5.9 7.8 387 17.21007 7.0 5.9 7.8 388 17.21008 8.0 5.9 7.5 372 11.11009 9.0 5.9 7.5 373 11.11011 10.0 5.9 7.5 373 11.11012 12.0 5.9 7.5 375 11.11013 14.0 5.9 7.5 370 11.1
March 2, 1999 1000 0.1 11.7 9.1 400 15.21001 1.0 11.8 9.2 403 14.11002 2.0 12.0 9.3 403 13.91003 3.0 11.9 9.1 403 13.81004 4.0 11.8 9.1 403 13.71005 5.0 11.6 9.0 399 13.41006 6.0 10.3 8.6 394 12.51007 7.0 8.3 8.2 393 11.71008 8.0 7.5 8.2 393 11.41009 9.0 7.3 8.1 393 11.11010 10.0 7.2 8.1 392 11.01011 12.0 7.2 8.1 392 10.91012 14.0 7.0 8.0 392 10.91013 16.0 7.1 8.0 391 10.91014 18.0 7.1 7.9 391 10.81015 20.0 7.1 7.9 391 10.81016 22.0 7.0 7.9 391 10.81017 24.0 7.1 7.9 390 10.81018 26.0 7.1 7.9 390 10.81019 28.0 6.8 7.9 393 10.81020 30.0 6.6 7.9 394 10.81021 32.0 6.5 7.9 397 10.81022 34.0 6.1 7.8 397 10.81023 36.0 5.9 7.8 408 10.81024 38.0 5.7 7.9 400 10.81025 38.5 5.7 7.9 491 10.8
May 4, 1999 1010 0.1 9.1 8.2 418 15.91011 1.0 9.0 8.3 420 15.9
Date TimeSampling depth
(m)
Oxygen,dissolved
(mg/L)
pH, waterwhole field
(standard units)
Specificconductance
(µµµµS/cm)
Watertemperature
(°°°°C)
(PCODE: 00098) (PCODE: 000300) (PCODE: 000400) (PCODE: 00095) (PCODE: 00010)
Loveland Reservoirs sampling sites, San Diego County, California—Continued
Table 2 23

Table 2. Water-quality depth-profile data for dissolved oxygen, pH, specific conductance, and temperature for the Sweetwater and
1012 2.0 8.8 8.2 420 15.91013 3.0 8.9 8.2 420 15.91014 4.0 8.8 8.3 420 15.81015 5.0 7.9 8.2 420 15.81016 6.0 8.7 8.3 420 15.71017 7.0 8.6 8.2 406 15.71018 8.0 6.6 7.6 408 14.61019 9.0 5.6 7.6 404 13.81020 10.0 5.2 7.5 403 13.31021 12.0 3.7 7.4 389 12.11022 14.0 2.6 7.3 387 11.61023 16.0 2.3 7.3 387 11.41024 18.0 2.1 7.3 387 11.31025 20.0 2.2 7.2 387 11.31026 22.0 2.1 7.2 387 11.31027 24.0 2.2 7.2 387 11.21028 26.0 2.1 7.2 386 11.21029 28.0 2.1 7.2 386 11.21030 30.0 2.1 7.2 386 11.21031 32.0 2.2 7.2 385 11.21032 34.0 2.0 7.2 385 11.21033 36.0 2.0 7.2 385 11.21034 38.0 2.0 7.2 385 11.21035 39.1 0.1 7.5 390 11.1
July 13, 1999 1010 0.1 8.0 8.8 462 26.61011 1.0 8.2 8.8 462 26.41012 2.0 8.2 8.9 462 26.41013 3.0 8.2 8.9 462 26.01014 4.0 8.1 8.8 460 26.01015 5.0 7.8 8.7 436 25.21016 6.0 3.0 7.8 441 21.01017 7.0 0.4 7.7 427 17.61018 8.0 0.1 7.8 420 16.41019 9.0 0.1 7.8 414 15.21021 10.0 0.1 7.8 411 14.51022 12.0 0.1 7.8 395 13.51023 14.0 0.1 7.6 395 12.21024 16.0 0.1 7.6 391 11.71025 18.0 0.1 7.5 391 11.51026 20.0 0.1 7.5 391 11.41027 22.0 0.1 7.4 391 11.41028 24.0 0.1 7.4 390 11.41029 26.0 0.1 7.4 390 11.41031 28.0 0.1 7.3 390 11.41032 30.0 0.1 7.3 391 11.41033 32.0 0.1 7.3 391 11.31034 34.0 0.1 7.3 391 11.31035 36.0 0.1 7.3 495 11.41036 37.8 0.1 7.2 385 11.2
September 21, 1999 0940 0.1 8.2 8.4 483 22.80941 1.0 8.3 8.4 486 23.00942 2.0 8.2 8.4 488 22.9
Date TimeSampling depth
(m)
Oxygen,dissolved
(mg/L)
pH, waterwhole field
(standard units)
Specificconductance
(µµµµS/cm)
Watertemperature
(°°°°C)
(PCODE: 00098) (PCODE: 000300) (PCODE: 000400) (PCODE: 00095) (PCODE: 00010)
Loveland Reservoirs sampling sites, San Diego County, California—Continued
24 Table 2

Table 2. Water-quality depth-profile data for dissolved oxygen, pH, specific conductance, and temperature for the Sweetwater and
0943 3.0 8.1 8.4 490 22.90944 4.0 8.2 8.4 491 22.90945 5.0 8.2 8.4 492 22.90946 6.0 8.2 8.4 493 22.80947 7.0 8.1 8.4 494 22.80948 8.0 7.9 8.4 495 22.70949 9.0 1.2 7.7 460 18.70950 10.0 0.7 7.5 488 15.80951 12.0 0.3 7.4 436 13.20952 14.0 0.2 7.3 430 12.30953 16.0 0.2 7.2 427 11.80954 18.0 0.2 7.2 427 11.60955 20.0 0.1 7.2 428 11.60956 22.0 0.2 7.2 429 11.50957 24.0 0.1 7.1 429 11.50958 26.0 0.1 7.1 429 11.50959 28.0 0.1 7.1 429 11.51000 30.0 0.1 7.1 429 11.51001 32.0 0.1 7.1 429 11.51002 34.0 0.1 7.1 429 11.51003 36.0 0.1 7.1 429 11.41004 38.0 0.1 7.0 452 11.5
Loveland Reservoir east end near source inlet:September 10, 1998 1630 1.0 7.2 8.6 415 27.5
1631 2.0 7.0 8.6 417 27.41632 3.0 7.0 8.6 417 27.41633 4.0 6.9 8.6 418 27.31634 5.0 6.6 8.5 422 27.01635 6.0 1.8 7.9 434 25.21636 7.0 0.6 7.7 400 23.31637 8.0 0.2 7.6 347 18.11638 9.0 0.2 7.5 338 14.91639 10.0 0.2 7.5 341 13.81640 11.0 0.2 7.5 343 12.61641 12.0 0.2 7.5 339 12.21642 13.0 0.2 7.5 338 12.01643 14.0 0.2 7.5 339 11.81644 15.0 0.2 7.5 340 11.71645 16.0 0.1 7.5 342 11.61646 17.0 0.1 7.4 343 11.51647 18.0 0.1 7.4 344 11.5
November 4, 1998 0930 0.1 7.6 — 390 18.00931 1.0 7.5 — 391 18.00932 2.0 7.4 — 391 17.90933 3.0 7.2 — 394 17.80934 4.0 7.0 — 396 17.60935 5.0 6.6 — 396 17.60936 6.0 6.6 — 393 17.50937 7.0 6.6 — 392 17.50938 8.0 6.4 — 393 17.50939 9.0 5.5 — 384 17.3
Date TimeSampling depth
(m)
Oxygen,dissolved
(mg/L)
pH, waterwhole field
(standard units)
Specificconductance
(µµµµS/cm)
Watertemperature
(°°°°C)
(PCODE: 00098) (PCODE: 000300) (PCODE: 000400) (PCODE: 00095) (PCODE: 00010)
Loveland Reservoirs sampling sites, San Diego County, California—Continued
Table 2 25

Table 2. Water-quality depth-profile data for dissolved oxygen, pH, specific conductance, and temperature for the Sweetwater and
0940 10.0 4.7 — 372 16.90941 11.0 2.2 — 355 15.80942 12.0 1.0 — 329 14.20943 13.0 0.6 — 324 13.00944 14.0 0.5 — 320 12.50945 15.0 0.4 — 319 12.20946 16.0 0.4 — 319 11.90947 18.0 0.3 — 318 11.6
March 2, 1999 1140 0.1 11.5 8.7 417 15.51141 1.0 11.6 8.8 416 15.31142 2.0 11.6 8.8 414 14.21143 3.0 11.0 8.7 416 13.81144 4.0 10.3 8.5 421 13.61145 5.0 9.9 8.5 422 13.51146 6.0 9.0 8.3 424 13.11147 7.0 7.8 8.1 411 12.71148 8.0 6.6 8.0 413 12.21149 9.0 6.3 7.9 410 12.01150 9.7 5.7 7.9 410 11.9
May 4, 1999 1110 0.1 9.1 8.4 434 17.51111 1.0 9.1 8.5 434 17.51112 2.0 9.0 8.4 434 17.41113 3.0 8.9 8.4 435 17.31114 4.0 8.8 8.4 431 17.21115 5.0 8.1 8.3 430 16.61116 6.0 6.2 7.8 422 15.81117 7.0 5.1 7.7 421 15.01118 8.0 4.4 7.6 420 14.41119 9.0 3.8 7.6 413 13.91121 10.0 3.4 7.5 411 13.61122 10.4 3.1 7.5 410 13.5
July 13, 1999 1110 0.1 7.3 9.0 469 27.61111 1.0 7.6 9.0 468 27.61112 2.0 7.7 9.0 464 27.61113 3.0 7.7 9.0 467 27.01114 4.0 7.4 8.9 462 25.51115 5.0 6.4 8.6 456 24.71116 6.0 4.8 8.6 459 23.81117 7.0 2.1 8.0 428 21.81118 8.0 0.4 8.0 431 18.41119 9.0 0.2 8.0 420 15.81120 10.0 0.2 8.0 414 14.41121 10.4 0.1 8.1 416 14.1
Date TimeSampling depth
(m)
Oxygen,dissolved
(mg/L)
pH, waterwhole field
(standard units)
Specificconductance
(µµµµS/cm)
Watertemperature
(°°°°C)
(PCODE: 00098) (PCODE: 000300) (PCODE: 000400) (PCODE: 00095) (PCODE: 00010)
Loveland Reservoirs sampling sites, San Diego County, California—Continued
26 Table 2

27 Table 3
Table 3. Analytical results for volatile organic compound concentrations (VOCs) in water samples, Sweetwater and Loveland Reservoirs, San Diego County, California
[See table 1 for site identification number. Time is denoted in 24-hour scale. An “E” indicates that the value has been estimated because of interference or is below method reporting limits. The number given below each compound is its parameter code (PCODE). Calif., California; SWR, Sweetwater Reservoir; NA, not analyzed; %, percentage recovery; <, compound was not detected at a concentration above the reporting level; µg/L, microgram per liter]

Table 3. Analytical results for VOCs in the water samples, SWR and Loveland Reservoirs, San Diego County, Calif.—Continued
Ace
tate
, vin
yl
Acro
lein
tota
l
1,1,
1-Tr
ichl
oroe
than
e
1,1,
2-Tr
ichl
oroe
than
e
1,1-
Dic
hlor
oeth
ane
1,1-
Dic
hlor
oeth
ylen
e
1,1-
Dic
hlor
opro
pene
1,2,
3-Tr
ichl
orop
ropa
ne
1,2-
Dib
rom
oeth
ane
PCODE 77057 34210 34506 34511 34496 34501 77168 77443 77651Site name Date Time (µµµµg/L) (µµµµg/L) (µµµµg/L) (µµµµg/L) (µµµµg/L) (µµµµg/L) (µµµµg/L) (µµµµg/L) (µµµµg/L)
SWR near pump tower 9-Sep-1998 1550 NA NA <0.128 <0.256 <0.264 <0.176 <0.104 <0.640 <0.144SWR near pump tower 9-Sep-1998 1600 NA NA <0.064 <0.128 <0.132 <0.088 <0.052 <0.320 <0.072SWR near pump tower 3-Nov-1998 1030 NA NA <0.064 <0.128 <0.132 <0.088 <0.052 <0.320 <0.072SWR near pump tower 3-Nov-1998 1040 NA NA <0.064 <0.128 <0.132 <0.088 <0.052 <0.320 <0.072SWR near pump tower 6-Jan-1999 930 NA NA <0.064 <0.128 <0.132 <0.088 <0.052 <0.320 <0.072SWR near pump tower 1-Mar-1999 1030 NA NA <0.032 <0.064 <0.066 <0.044 <0.026 <0.160 <0.036SWR near pump tower 1-Mar-1999 1045 NA NA <0.032 <0.064 <0.066 <0.044 <0.026 <0.160 <0.036SWR near pump tower 3-May-1999 1115 NA NA <0.032 <0.064 <0.066 <0.044 <0.026 <0.160 <0.036SWR near pump tower 3-May-1999 1130 NA NA <0.032 <0.064 <0.066 <0.044 <0.026 <0.160 <0.036SWR near pump tower 12-Jul-1999 1120 NA NA <0.032 <0.064 <0.066 <0.044 <0.026 <0.160 <0.036SWR near pump tower 12-Jul-1999 1130 NA NA <0.032 <0.064 <0.066 <0.044 <0.026 <0.160 <0.036SWR near pump tower 20-Sep-1999 1140 NA NA <0.032 <0.060 <0.066 <0.040 <0.026 <0.160 <0.036SWR near pump tower 20-Sep-1999 1150 NA NA <0.032 <0.060 <0.066 <0.040 <0.026 <0.160 <0.036SWR near Vista del Lago station 10-Sep-1998 845 NA NA <0.064 <0.128 <0.132 <0.088 <0.052 <0.320 <0.072SWR near Vista del Lago station 10-Sep-1998 900 NA NA <0.064 <0.128 <0.132 <0.088 <0.052 <0.320 <0.072SWR near Vista del Lago station 3-Nov-1998 1110 NA NA <0.032 <0.064 <0.066 <0.044 <0.026 <0.160 <0.036SWR near Vista del Lago station 6-Jan-1999 1000 NA NA <0.064 <0.128 <0.132 <0.088 <0.052 <0.320 <0.072SWR near Vista del Lago station 1-Mar-1999 1100 NA NA <0.032 <0.064 <0.066 <0.044 <0.026 <0.160 <0.036SWR near Vista del Lago station 3-May-1999 1150 NA NA <0.032 <0.064 <0.066 <0.044 <0.026 <0.160 <0.036SWR near Vista del Lago station 3-May-1999 1200 NA NA <0.032 <0.064 <0.066 <0.044 <0.026 <0.160 <0.036SWR near Vista del Lago station 12-Jul-1999 1210 NA NA <0.032 <0.064 <0.066 <0.044 <0.026 <0.160 <0.036SWR near Vista del Lago station 12-Jul-1999 1220 NA NA <0.032 <0.064 <0.066 <0.044 <0.026 <0.160 <0.036SWR center of minimum pool 9-Sep-1998 1630 NA NA <0.128 <0.256 <0.264 <0.176 <0.104 <0.640 <0.144SWR center of minimum pool 9-Sep-1998 1640 NA NA <0.064 <0.128 <0.132 <0.088 <0.052 <0.320 <0.072SWR center of minimum pool 3-Nov-1998 1140 NA NA <0.064 <0.128 <0.132 <0.088 <0.052 <0.320 <0.072SWR center of minimum pool 3-Nov-1998 1150 NA NA <0.064 <0.128 <0.132 <0.088 <0.052 <0.320 <0.072SWR center of minimum pool 6-Jan-1999 1030 NA NA <0.064 <0.128 <0.132 <0.088 <0.052 <0.320 <0.072SWR center of minimum pool 1-Mar-1999 1130 NA NA <0.032 <0.064 <0.066 <0.044 <0.026 <0.160 <0.036SWR center of minimum pool 3-May-1999 1235 NA NA <0.032 <0.064 <0.066 <0.044 <0.026 <0.160 <0.036SWR center of minimum pool 3-May-1999 1240 NA NA <0.032 <0.064 <0.066 <0.044 <0.026 <0.160 <0.036SWR center of minimum pool 12-Jul-1999 1240 NA NA <0.032 <0.064 <0.066 <0.044 <0.026 <0.160 <0.036SWR center of minimum pool 12-Jul-1999 1250 NA NA <0.032 <0.064 <0.066 <0.044 <0.026 <0.160 <0.036SWR center of minimum pool 20-Sep-1999 1220 NA NA <0.032 <0.060 <0.066 <0.040 <0.026 <0.160 <0.036SWR center of minimum pool 20-Sep-1999 1230 NA NA <0.032 <0.060 <0.066 <0.040 <0.026 <0.160 <0.036SWR near recreation area 10-Sep-1998 1010 NA NA <0.064 <0.128 <0.132 <0.088 <0.052 <0.320 <0.072
28 Table 3

Table 3. Analytical results for VOCs in the water samples, SWR and Loveland Reservoirs, San Diego County, Calif.—Continued
Ace
tate
, vin
yl
Acro
lein
tota
l
1,1,
1-Tr
ichl
oroe
than
e
1,1,
2-Tr
ichl
oroe
than
e
1,1-
Dic
hlor
oeth
ane
1,1-
Dic
hlor
oeth
ylen
e
1,1-
Dic
hlor
opro
pene
1,2,
3-Tr
ichl
orop
ropa
ne
1,2-
Dib
rom
oeth
ane
PCODE 77057 34210 34506 34511 34496 34501 77168 77443 77651Site name Date Time (µµµµg/L) (µµµµg/L) (µµµµg/L) (µµµµg/L) (µµµµg/L) (µµµµg/L) (µµµµg/L) (µµµµg/L) (µµµµg/L)
SWR near recreation area 10-Sep-1998 1020 NA NA <0.064 <0.128 <0.132 <0.088 <0.052 <0.320 <0.072SWR near recreation area 3-Nov-1998 1205 NA NA <0.064 <0.128 <0.132 <0.088 <0.052 <0.320 <0.072SWR near recreation area 3-Nov-1998 1215 NA NA <0.064 <0.128 <0.132 <0.088 <0.052 <0.320 <0.072SWR near recreation area 6-Jan-1999 1100 NA NA <0.064 <0.128 <0.132 <0.088 <0.052 <0.320 <0.072SWR near recreation area 1-Mar-1999 1220 NA NA <0.032 <0.064 <0.066 <0.044 <0.026 <0.160 <0.036SWR near recreation area 3-May-1999 1310 NA NA <0.032 <0.064 <0.066 <0.044 <0.026 <0.160 <0.036SWR near recreation area 3-May-1999 1320 NA NA <0.032 <0.064 <0.066 <0.044 <0.026 <0.160 <0.036SWR near recreation area 12-Jul-1999 1320 NA NA <0.032 <0.064 <0.066 <0.044 <0.026 <0.160 <0.036SWR near recreation area 12-Jul-1999 1330 NA NA <0.032 <0.064 <0.066 <0.044 <0.026 <0.160 <0.036SWR minimum pool boundary east 10-Sep-1998 1240 NA NA <0.128 <0.256 <0.264 <0.176 <0.104 <0.640 <0.144SWR minimum pool boundary east 10-Sep-1998 1250 NA NA <0.064 <0.128 <0.132 <0.088 <0.052 <0.320 <0.072SWR minimum pool boundary east 3-Nov-1998 1340 NA NA <0.032 <0.064 <0.066 <0.044 <0.026 <0.160 <0.036SWR minimum pool boundary east 6-Jan-1999 1130 NA NA <0.064 <0.128 <0.132 <0.088 <0.052 <0.320 <0.072SWR minimum pool boundary east 2-Mar-1999 840 NA NA <0.032 <0.064 <0.066 <0.044 <0.026 <0.160 <0.036SWR minimum pool boundary east 3-May-1999 1350 NA NA <0.032 <0.064 <0.066 <0.044 <0.026 <0.160 <0.036SWR minimum pool boundary east 3-May-1999 1400 NA NA <0.032 <0.064 <0.066 <0.044 <0.026 <0.160 <0.036SWR minimum pool boundary east 12-Jul-1999 1420 NA NA <0.032 <0.064 <0.066 <0.044 <0.026 <0.160 <0.036SWR east end reservoir fill boundary 10-Sep-1998 1310 NA NA <0.032 <0.064 <0.066 <0.044 <0.026 <0.162 <0.036SWR east end reservoir fill boundary 3-Nov-1998 1400 NA NA <0.032 <0.064 <0.066 <0.044 <0.026 <0.160 <0.036SWR east end reservoir fill boundary 6-Jan-1999 1150 NA NA <0.064 <0.128 <0.132 <0.088 <0.052 <0.320 <0.072SWR east end reservoir fill boundary 1-Mar-1999 1240 NA NA <0.032 <0.064 <0.066 <0.044 <0.026 <0.160 <0.036SWR east end reservoir fill boundary 3-May-1999 1440 NA NA <0.032 <0.064 <0.066 <0.044 <0.026 <0.160 <0.036SWR east end reservoir fill boundary 12-Jul-1999 1440 NA NA <0.032 <0.064 <0.066 <0.044 <0.026 <0.160 <0.036SWR east end reservoir fill boundary 20-Sep-1999 1250 NA NA <0.032 <0.060 <0.066 <0.040 <0.026 <0.160 <0.036SWR near Gum Tree Cove Pond 10-Sep-1998 930 NA NA <0.064 <0.128 <0.132 <0.088 <0.052 <0.320 <0.072SWR near Gum Tree Cove Pond 10-Sep-1998 940 NA NA <0.064 <0.128 <0.132 <0.088 <0.052 <0.320 <0.072SWR near Gum Tree Cove Pond 3-Nov-1998 1430 NA NA <0.032 <0.064 <0.066 <0.044 <0.026 <0.160 <0.036SWR near Gum Tree Cove Pond 6-Jan-1999 1220 NA NA <0.064 <0.128 <0.132 <0.088 <0.052 <0.320 <0.072SWR near Gum Tree Cove Pond 1-Mar-1999 1310 NA NA <0.032 <0.064 <0.066 <0.044 <0.026 <0.160 <0.036SWR near Gum Tree Cove Pond 3-May-1999 1510 NA NA <0.032 <0.064 <0.066 <0.044 <0.026 <0.160 <0.036SWR near Gum Tree Cove Pond 12-Jul-1999 1500 NA NA <0.032 <0.064 <0.066 <0.044 <0.026 <0.160 <0.036Loveland Reservoir near dam site 1 10-Sep-1998 1610 NA NA <0.032 <0.064 <0.066 <0.044 <0.026 <0.162 <0.036Loveland Reservoir near dam site 1 10-Sep-1998 1620 NA NA <0.032 <0.064 <0.066 <0.044 <0.026 <0.162 <0.036Loveland Reservoir near dam site 1 4-Nov-1998 1030 NA NA <0.032 <0.064 <0.066 <0.044 <0.026 <0.160 <0.036Loveland Reservoir near dam site 1 4-Nov-1998 1040 NA NA <0.032 <0.064 <0.066 <0.044 <0.026 <0.160 <0.036Loveland Reservoir near dam site 1 7-Jan-1999 1010 NA NA <0.064 <0.128 <0.132 <0.088 <0.052 <0.320 <0.072Loveland Reservoir near dam site 1 2-Mar-1999 1150 NA NA <0.032 <0.064 <0.066 <0.044 <0.026 <0.160 <0.036
29 Table 3

Table 3. Analytical results for VOCs in the water samples, SWR and Loveland Reservoirs, San Diego County, Calif.—Continued
Ace
tate
, vin
yl
Acro
lein
tota
l
1,1,
1-Tr
ichl
oroe
than
e
1,1,
2-Tr
ichl
oroe
than
e
1,1-
Dic
hlor
oeth
ane
1,1-
Dic
hlor
oeth
ylen
e
1,1-
Dic
hlor
opro
pene
1,2,
3-Tr
ichl
orop
ropa
ne
1,2-
Dib
rom
oeth
ane
PCODE 77057 34210 34506 34511 34496 34501 77168 77443 77651Site name Date Time (µµµµg/L) (µµµµg/L) (µµµµg/L) (µµµµg/L) (µµµµg/L) (µµµµg/L) (µµµµg/L) (µµµµg/L) (µµµµg/L)
Loveland Reservoir near dam site 1 4-May-1999 1040 NA NA <0.032 <0.064 <0.066 <0.044 <0.026 <0.160 <0.036Loveland Reservoir near dam site 1 4-May-1999 1050 NA NA <0.032 <0.064 <0.066 <0.044 <0.026 <0.160 <0.036Loveland Reservoir near dam site 1 13-Jul-1999 1020 NA NA <0.032 <0.064 <0.066 <0.044 <0.026 <0.160 <0.036Loveland Reservoir near dam site 1 13-Jul-1999 1030 NA NA <0.032 <0.064 <0.066 <0.044 <0.026 <0.160 <0.036Loveland Reservoir near dam site 1 21-Sep-1999 1000 NA NA <0.032 <0.060 <0.066 <0.040 <0.026 <0.160 <0.036Loveland Reservoir near dam site 1 21-Sep-1999 1020 NA NA <0.032 <0.060 <0.066 <0.040 <0.026 <0.160 <0.036Loveland Reservoir east end near source inlet site 2 10-Sep-1998 1650 NA NA <0.032 <0.064 <0.066 <0.044 <0.026 <0.162 <0.036Loveland Reservoir east end near source inlet site 2 10-Sep-1998 1700 NA NA <0.032 <0.064 <0.066 <0.044 <0.026 <0.162 <0.036Loveland Reservoir east end near source inlet site 2 4-Nov-1998 1155 NA NA <0.064 <0.128 <0.132 <0.088 <0.052 <0.320 <0.072Loveland Reservoir east end near source inlet site 2 4-Nov-1998 1205 NA NA <0.032 <0.064 <0.066 <0.044 <0.026 <0.160 <0.036Loveland Reservoir east end near source inlet site 2 7-Jan-1999 1035 NA NA <0.032 <0.064 <0.066 <0.044 <0.026 <0.160 <0.036Loveland Reservoir east end near source inlet site 2 2-Mar-1999 1220 NA NA <0.032 <0.064 <0.066 <0.044 <0.026 <0.160 <0.036Loveland Reservoir east end near source inlet site 2 4-May-1999 1120 NA NA <0.032 <0.064 <0.066 <0.044 <0.026 <0.160 <0.036Loveland Reservoir east end near source inlet site 2 4-May-1999 1130 NA NA <0.032 <0.064 <0.066 <0.044 <0.026 <0.160 <0.036Loveland Reservoir east end near source inlet site 2 13-Jul-1999 1100 NA NA <0.032 <0.064 <0.066 <0.044 <0.026 <0.160 <0.036Sweetwater River at low flow barrier at SWR 6-Jan-1999 1515 NA NA <0.064 <0.128 <0.132 <0.088 <0.052 <0.320 <0.072Sweetwater River at low flow barrier at SWR 7-Jan-1999 1420 NA NA <0.064 <0.128 <0.132 <0.088 <0.052 <0.320 <0.072Sweetwater River at low flow barrier at SWR 2-Mar-1999 1540 NA NA <0.032 <0.064 <0.066 <0.044 <0.026 <0.160 <0.036Sweetwater River at low flow barrier at SWR 3-May-1999 1645 NA NA <0.032 <0.064 <0.066 <0.044 <0.026 <0.160 <0.036Sweetwater River at low flow barrier at SWR 12-Jul-1999 1620 NA NA <0.064 <0.128 <0.132 <0.088 <0.052 <0.320 <0.072Sweetwater River at low flow barrier at SWR 20-Sep-1999 1630 NA NA <0.032 <0.060 <0.066 <0.040 <0.026 <0.160 <0.036Perdue Treatment Plant—finished water at SWR 7-Jan-1999 1350 NA NA <0.064 <0.128 <0.132 <0.088 <0.052 <0.320 <0.072Perdue Treatment Plant—finished water at SWR 2-Mar-1999 1630 NA NA <0.032 <0.064 <0.066 <0.044 <0.026 <0.160 <0.036Perdue Treatment Plant—finished water at SWR 3-May-1999 1607 NA NA <0.032 <0.064 <0.066 <0.044 <0.026 <0.160 <0.036Perdue Treatment Plant—finished water at SWR 12-Jul-1999 1700 NA NA <0.032 <0.064 <0.066 <0.044 <0.026 <0.160 <0.036Perdue Treatment Plant—finished water at SWR 20-Sep-1999 1430 NA NA E0.028 0.060 <0.066 <0.040 <0.026 <0.160 <0.036Perdue Treatment Plant—imported raw water at SWR 20-Sep-1999 1500 NA NA E0.033 0.060 <0.066 <0.040 <0.026 <0.160 <0.036
30 Table 3

Table 3. Analytical results for VOCs in the water samples, SWR and Loveland Reservoirs, San Diego County, Calif.—Continued
PCODESite name Date Time
SWR near pump tower 9-Sep-1998 1550SWR near pump tower 9-Sep-1998 1600SWR near pump tower 3-Nov-1998 1030SWR near pump tower 3-Nov-1998 1040SWR near pump tower 6-Jan-1999 930SWR near pump tower 1-Mar-1999 1030SWR near pump tower 1-Mar-1999 1045SWR near pump tower 3-May-1999 1115SWR near pump tower 3-May-1999 1130SWR near pump tower 12-Jul-1999 1120SWR near pump tower 12-Jul-1999 1130SWR near pump tower 20-Sep-1999 1140SWR near pump tower 20-Sep-1999 1150SWR near Vista del Lago station 10-Sep-1998 845SWR near Vista del Lago station 10-Sep-1998 900SWR near Vista del Lago station 3-Nov-1998 1110SWR near Vista del Lago station 6-Jan-1999 1000SWR near Vista del Lago station 1-Mar-1999 1100SWR near Vista del Lago station 3-May-1999 1150SWR near Vista del Lago station 3-May-1999 1200SWR near Vista del Lago station 12-Jul-1999 1210SWR near Vista del Lago station 12-Jul-1999 1220SWR center of minimum pool 9-Sep-1998 1630SWR center of minimum pool 9-Sep-1998 1640SWR center of minimum pool 3-Nov-1998 1140SWR center of minimum pool 3-Nov-1998 1150SWR center of minimum pool 6-Jan-1999 1030SWR center of minimum pool 1-Mar-1999 1130SWR center of minimum pool 3-May-1999 1235SWR center of minimum pool 3-May-1999 1240SWR center of minimum pool 12-Jul-1999 1240SWR center of minimum pool 12-Jul-1999 1250SWR center of minimum pool 20-Sep-1999 1220SWR center of minimum pool 20-Sep-1999 1230SWR near recreation area 10-Sep-1998 1010
1,2-
Dic
hlor
oeth
ane
1,2-
Dic
hlor
opro
pane
trans
-1,2
-Dic
hlor
oeth
ylen
e
2,2-
Dic
hlor
opro
pane
trans
-1,4
-Dic
hlor
o-2-
bute
ne
2-H
exan
one
Acet
one
Acry
loni
trile
32103 34541 34546 77170 73547 77103 81552 34215(µµµµg/L) (µµµµg/L) (µµµµg/L) (µµµµg/L) (µµµµg/L) (µµµµg/L) (µµµµg/L) (µµµµg/L)
<0.520 <0.272 <0.128 <0.312 <2.800 <2.800 <20.000 <4.800<0.260 <0.136 <0.064 <0.156 <1.400 <1.400 <10.000 <2.400<0.260 <0.136 <0.064 <0.156 <1.400 <1.400 <10.000 <2.400<0.260 <0.136 <0.064 <0.156 <1.400 <1.400 <10.000 <2.400<0.260 <0.136 <0.064 <0.156 <1.400 <1.400 <10.000 <2.400<0.130 <0.068 <0.032 <0.078 <0.700 <0.700 <5.000 <1.200<0.130 <0.068 <0.032 <0.078 <0.700 <0.700 <5.000 <1.200<0.130 <0.068 <0.032 <0.078 <0.700 <0.700 <5.000 <1.200<0.130 <0.068 <0.032 <0.078 <0.700 <0.700 <5.000 <1.200<0.130 <0.068 <0.032 <0.078 <0.700 <0.700 <5.000 <1.200<0.130 <0.068 <0.032 <0.078 <0.700 <0.700 <5.000 <1.200<0.130 <0.068 <0.032 <0.050 <0.700 <0.700 E1.780 <1.200<0.130 <0.068 <0.032 <0.050 <0.700 <0.700 <7.000 <1.200<0.260 <0.136 <0.064 <0.156 <1.400 <1.400 <10.000 <2.400<0.260 <0.136 <0.064 <0.156 <1.400 <1.400 <10.000 <2.400<0.130 <0.068 <0.032 <0.078 <0.700 <0.700 <5.000 <1.200<0.260 <0.136 <0.064 <0.156 <1.400 <1.400 <10.000 <2.400<0.130 <0.068 <0.032 <0.078 <0.700 <0.700 <5.000 <1.200<0.130 <0.068 <0.032 <0.078 <0.700 <0.700 <5.000 <1.200<0.130 <0.068 <0.032 <0.078 <0.700 <0.700 E1.199 <1.200<0.130 <0.068 <0.032 <0.078 <0.700 <0.700 <5.000 <1.200<0.130 <0.068 <0.032 <0.078 <0.700 <0.700 <5.000 <1.200<0.520 <0.272 <0.128 <0.312 <2.800 <2.800 <20.000 <4.800<0.260 <0.136 <0.064 <0.156 <1.400 <1.400 <10.000 <2.400<0.260 <0.136 <0.064 <0.156 <1.400 <1.400 <10.000 <2.400<0.260 <0.136 <0.064 <0.156 <1.400 <1.400 <10.000 <2.400<0.260 <0.136 <0.064 <0.156 <1.400 <1.400 <10.000 <2.400<0.130 <0.068 <0.032 <0.078 <0.700 <0.700 <5.000 <1.200<0.130 <0.068 <0.032 <0.078 <0.700 <0.700 <5.000 <1.200<0.130 <0.068 <0.032 <0.078 <0.700 <0.700 <5.000 <1.200<0.130 <0.068 <0.032 <0.078 <0.700 <0.700 <5.000 <1.200<0.130 <0.068 <0.032 <0.078 <0.700 <0.700 <5.000 <1.200<0.130 <0.068 <0.032 <0.050 <0.700 <0.700 E2.212 <1.200<0.130 <0.068 <0.032 <0.050 <0.700 <0.700 <7.000 <1.200<0.260 <0.136 <0.064 <0.156 <1.400 <1.400 <10.000 <2.400
31 Table 3

Table 3. Analytical results for VOCs in the water samples, SWR and Loveland Reservoirs, San Diego County, Calif.—Continued
PCODESite name Date Time
S 9 S 1998 1550SWR near recreation area 10-Sep-1998 1020SWR near recreation area 3-Nov-1998 1205SWR near recreation area 3-Nov-1998 1215SWR near recreation area 6-Jan-1999 1100SWR near recreation area 1-Mar-1999 1220SWR near recreation area 3-May-1999 1310SWR near recreation area 3-May-1999 1320SWR near recreation area 12-Jul-1999 1320SWR near recreation area 12-Jul-1999 1330SWR minimum pool boundary east 10-Sep-1998 1240SWR minimum pool boundary east 10-Sep-1998 1250SWR minimum pool boundary east 3-Nov-1998 1340SWR minimum pool boundary east 6-Jan-1999 1130SWR minimum pool boundary east 2-Mar-1999 840SWR minimum pool boundary east 3-May-1999 1350SWR minimum pool boundary east 3-May-1999 1400SWR minimum pool boundary east 12-Jul-1999 1420SWR east end reservoir fill boundary 10-Sep-1998 1310SWR east end reservoir fill boundary 3-Nov-1998 1400SWR east end reservoir fill boundary 6-Jan-1999 1150SWR east end reservoir fill boundary 1-Mar-1999 1240SWR east end reservoir fill boundary 3-May-1999 1440SWR east end reservoir fill boundary 12-Jul-1999 1440SWR east end reservoir fill boundary 20-Sep-1999 1250SWR near Gum Tree Cove Pond 10-Sep-1998 930SWR near Gum Tree Cove Pond 10-Sep-1998 940SWR near Gum Tree Cove Pond 3-Nov-1998 1430SWR near Gum Tree Cove Pond 6-Jan-1999 1220SWR near Gum Tree Cove Pond 1-Mar-1999 1310SWR near Gum Tree Cove Pond 3-May-1999 1510SWR near Gum Tree Cove Pond 12-Jul-1999 1500Loveland Reservoir near dam site 1 10-Sep-1998 1610Loveland Reservoir near dam site 1 10-Sep-1998 1620Loveland Reservoir near dam site 1 4-Nov-1998 1030Loveland Reservoir near dam site 1 4-Nov-1998 1040Loveland Reservoir near dam site 1 7-Jan-1999 1010Loveland Reservoir near dam site 1 2-Mar-1999 1150
1,2-
Dic
hlor
oeth
ane
1,2-
Dic
hlor
opro
pane
trans
-1,2
-Dic
hlor
oeth
ylen
e
2,2-
Dic
hlor
opro
pane
trans
-1,4
-Dic
hlor
o-2-
bute
ne
2-H
exan
one
Acet
one
Acry
loni
trile
32103 34541 34546 77170 73547 77103 81552 34215(µµµµg/L) (µµµµg/L) (µµµµg/L) (µµµµg/L) (µµµµg/L) (µµµµg/L) (µµµµg/L) (µµµµg/L)
<0.260 <0.136 <0.064 <0.156 <1.400 <1.400 <10.000 <2.400<0.260 <0.136 <0.064 <0.156 <1.400 <1.400 <10.000 <2.400<0.260 <0.136 <0.064 <0.156 <1.400 <1.400 <10.000 <2.400<0.260 <0.136 <0.064 <0.156 <1.400 <1.400 <10.000 <2.400<0.130 <0.068 <0.032 <0.078 <0.700 <0.700 <5.000 <1.200<0.130 <0.068 <0.032 <0.078 <0.700 <0.700 <5.000 <1.200<0.130 <0.068 <0.032 <0.078 <0.700 <0.700 <5.000 <1.200<0.130 <0.068 <0.032 <0.078 <0.700 <0.700 <5.000 <1.200<0.130 <0.068 <0.032 <0.078 <0.700 <0.700 <5.000 <1.200<0.520 <0.272 <0.128 <0.312 <2.800 <2.800 <20.000 <4.800<0.260 <0.136 <0.064 <0.156 <1.400 <1.400 <10.000 <2.400<0.130 <0.068 <0.032 <0.078 <0.700 <0.700 <5.000 <1.200<0.260 <0.136 <0.064 <0.156 <1.400 <1.400 <10.000 <2.400<0.130 <0.068 <0.032 <0.078 <0.700 <0.700 <5.000 <1.200<0.130 <0.068 <0.032 <0.078 <0.700 <0.700 <5.000 <1.200<0.130 <0.068 <0.032 <0.078 <0.700 <0.700 <5.000 <1.200<0.130 <0.068 <0.032 <0.078 <0.700 <0.700 <5.000 <1.200<0.134 <0.068 <0.032 <0.078 <0.692 <0.746 <4.904 <1.226<0.130 <0.068 <0.032 <0.078 <0.700 <0.700 <5.000 <1.200<0.260 <0.136 <0.064 <0.156 <1.400 <1.400 <10.000 <2.400<0.130 <0.068 <0.032 <0.078 <0.700 <0.700 <5.000 <1.200<0.130 <0.068 <0.032 <0.078 <0.700 <0.700 <5.000 <1.200<0.130 <0.068 <0.032 <0.078 <0.700 <0.700 <5.000 <1.200<0.130 <0.068 <0.032 <0.050 <0.700 <0.700 <7.000 <1.200<0.260 <0.136 <0.064 <0.156 <1.400 <1.400 <10.000 <2.400<0.260 <0.136 <0.064 <0.156 <1.400 <1.400 <10.000 <2.400<0.130 <0.068 <0.032 <0.078 <0.700 <0.700 <5.000 <1.200<0.260 <0.136 <0.064 <0.156 <1.400 <1.400 <10.000 <2.400<0.130 <0.068 <0.032 <0.078 <0.700 <0.700 <5.000 <1.200<0.130 <0.068 <0.032 <0.078 <0.700 <0.700 <5.000 <1.200<0.130 <0.068 <0.032 <0.078 <0.700 <0.700 <5.000 <1.200<0.134 <0.068 <0.032 <0.078 <0.692 <0.746 <4.904 <1.226<0.134 <0.068 <0.032 <0.078 <0.692 <0.746 <4.904 <1.226<0.130 <0.068 <0.032 <0.078 <0.700 <0.700 <5.000 <1.200<0.130 <0.068 <0.032 <0.078 <0.700 <0.700 <5.000 <1.200<0.260 <0.136 <0.064 <0.156 <1.400 <1.400 <10.000 <2.400<0.130 <0.068 <0.032 <0.078 <0.700 <0.700 <5.000 <1.200
32 Table 3

Table 3. Analytical results for VOCs in the water samples, SWR and Loveland Reservoirs, San Diego County, Calif.—Continued
PCODESite name Date Time
S 9 S 1998 1550Loveland Reservoir near dam site 1 4-May-1999 1040Loveland Reservoir near dam site 1 4-May-1999 1050Loveland Reservoir near dam site 1 13-Jul-1999 1020Loveland Reservoir near dam site 1 13-Jul-1999 1030Loveland Reservoir near dam site 1 21-Sep-1999 1000Loveland Reservoir near dam site 1 21-Sep-1999 1020Loveland Reservoir east end near source inlet site 2 10-Sep-1998 1650Loveland Reservoir east end near source inlet site 2 10-Sep-1998 1700Loveland Reservoir east end near source inlet site 2 4-Nov-1998 1155Loveland Reservoir east end near source inlet site 2 4-Nov-1998 1205Loveland Reservoir east end near source inlet site 2 7-Jan-1999 1035Loveland Reservoir east end near source inlet site 2 2-Mar-1999 1220Loveland Reservoir east end near source inlet site 2 4-May-1999 1120Loveland Reservoir east end near source inlet site 2 4-May-1999 1130Loveland Reservoir east end near source inlet site 2 13-Jul-1999 1100Sweetwater River at low flow barrier at SWR 6-Jan-1999 1515Sweetwater River at low flow barrier at SWR 7-Jan-1999 1420Sweetwater River at low flow barrier at SWR 2-Mar-1999 1540Sweetwater River at low flow barrier at SWR 3-May-1999 1645Sweetwater River at low flow barrier at SWR 12-Jul-1999 1620Sweetwater River at low flow barrier at SWR 20-Sep-1999 1630Perdue Treatment Plant—finished water at SWR 7-Jan-1999 1350Perdue Treatment Plant—finished water at SWR 2-Mar-1999 1630Perdue Treatment Plant—finished water at SWR 3-May-1999 1607Perdue Treatment Plant—finished water at SWR 12-Jul-1999 1700Perdue Treatment Plant—finished water at SWR 20-Sep-1999 1430Perdue Treatment Plant—imported raw water at SWR 20-Sep-1999 1500
1,2-
Dic
hlor
oeth
ane
1,2-
Dic
hlor
opro
pane
trans
-1,2
-Dic
hlor
oeth
ylen
e
2,2-
Dic
hlor
opro
pane
trans
-1,4
-Dic
hlor
o-2-
bute
ne
2-H
exan
one
Acet
one
Acry
loni
trile
32103 34541 34546 77170 73547 77103 81552 34215(µµµµg/L) (µµµµg/L) (µµµµg/L) (µµµµg/L) (µµµµg/L) (µµµµg/L) (µµµµg/L) (µµµµg/L)
<0.130 <0.068 <0.032 <0.078 <0.700 <0.700 <5.000 <1.200<0.130 <0.068 <0.032 <0.078 <0.700 <0.700 <5.000 <1.200<0.130 <0.068 <0.032 <0.078 <0.700 <0.700 <5.000 <1.200<0.130 <0.068 <0.032 <0.078 <0.700 <0.700 <5.000 <1.200<0.130 <0.068 <0.032 <0.050 <0.700 <0.700 <7.000 <1.200<0.130 <0.068 <0.032 <0.050 <0.700 <0.700 <7.000 <1.200<0.134 <0.068 <0.032 <0.078 <0.692 <0.746 <4.904 <1.226<0.134 <0.068 <0.032 <0.078 <0.692 <0.746 <4.904 <1.226<0.260 <0.136 <0.064 <0.156 <1.400 <1.400 <10.000 <2.400<0.130 <0.068 <0.032 <0.078 <0.700 <0.700 <5.000 <1.200<0.130 <0.068 <0.032 <0.078 <0.700 <0.700 <5.000 <1.200<0.130 <0.068 <0.032 <0.078 <0.700 <0.700 <5.000 <1.200<0.130 <0.068 <0.032 <0.078 <0.700 <0.700 <5.000 <1.200<0.130 <0.068 <0.032 <0.078 <0.700 <0.700 E0.990 <1.200<0.130 <0.068 <0.032 <0.078 <0.700 <0.700 <1.000 <1.200<0.260 <0.136 <0.064 <0.156 <1.400 <1.400 <10.000 <2.400<0.260 <0.136 <0.064 <0.156 <1.400 <1.400 <10.000 <2.400<0.130 <0.068 <0.032 <0.078 <0.700 <0.700 <5.000 <1.200<0.130 <0.068 <0.032 <0.078 <0.700 <0.700 <5.000 <1.200<0.260 <0.136 <0.064 <0.156 <1.400 <1.400 <10.000 <2.400<0.130 <0.068 <0.032 <0.050 <0.700 <0.700 <7.000 <1.200<0.260 <0.136 <0.064 <0.156 <1.400 <1.400 <10.000 <2.400<0.130 <0.068 <0.032 <0.078 <0.700 <0.700 E3.987 <1.200<0.130 <0.068 <0.032 <0.078 <0.700 <0.700 E4.564 <1.200<0.130 <0.068 <0.032 <0.078 <0.700 <0.700 <5.000 <1.200<0.130 <0.068 <0.032 <0.050 <0.700 <0.700 E6.319 <1.200<0.130 <0.068 <0.032 <0.050 <0.700 <0.700 <7.000 <1.200
33 Table 3

Table 3. Analytical results for VOCs in the water samples, SWR and Loveland Reservoirs, San Diego County, Calif.—Continued
PCODESite name Date Time
SWR near pump tower 9-Sep-1998 1550SWR near pump tower 9-Sep-1998 1600SWR near pump tower 3-Nov-1998 1030SWR near pump tower 3-Nov-1998 1040SWR near pump tower 6-Jan-1999 930SWR near pump tower 1-Mar-1999 1030SWR near pump tower 1-Mar-1999 1045SWR near pump tower 3-May-1999 1115SWR near pump tower 3-May-1999 1130SWR near pump tower 12-Jul-1999 1120SWR near pump tower 12-Jul-1999 1130SWR near pump tower 20-Sep-1999 1140SWR near pump tower 20-Sep-1999 1150SWR near Vista del Lago station 10-Sep-1998 845SWR near Vista del Lago station 10-Sep-1998 900SWR near Vista del Lago station 3-Nov-1998 1110SWR near Vista del Lago station 6-Jan-1999 1000SWR near Vista del Lago station 1-Mar-1999 1100SWR near Vista del Lago station 3-May-1999 1150SWR near Vista del Lago station 3-May-1999 1200SWR near Vista del Lago station 12-Jul-1999 1210SWR near Vista del Lago station 12-Jul-1999 1220SWR center of minimum pool 9-Sep-1998 1630SWR center of minimum pool 9-Sep-1998 1640SWR center of minimum pool 3-Nov-1998 1140SWR center of minimum pool 3-Nov-1998 1150SWR center of minimum pool 6-Jan-1999 1030SWR center of minimum pool 1-Mar-1999 1130SWR center of minimum pool 3-May-1999 1235SWR center of minimum pool 3-May-1999 1240SWR center of minimum pool 12-Jul-1999 1240SWR center of minimum pool 12-Jul-1999 1250SWR center of minimum pool 20-Sep-1999 1220SWR center of minimum pool 20-Sep-1999 1230SWR near recreation area 10-Sep-1998 1010
1,2,
3-Tr
ichl
orob
enze
ne
1,2,
3-Tr
imet
hylb
enze
ne
1,2,
4-Tr
ichl
orob
enze
ne
1,2,
4-Tr
imet
hylb
enze
ne
1,3,
5-Tr
imet
hylb
enze
ne
1,3-
Dic
hlor
oben
zene
1,4-
Dic
hlor
oben
zene
Isop
ropy
lben
zene
77613 77221 34551 77222 77226 34566 34571 77223(µµµµg/L) (µµµµg/L) (µµµµg/L) (µµµµg/L) (µµµµg/L) (µµµµg/L) (µµµµg/L) (µµµµg/L)
<1.080 <0.480 <0.760 0.224 <0.176 <0.216 <0.20 <0.128<0.540 <0.240 <0.380 <0.112 <0.088 <0.108 <0.10 <0.064<0.540 <0.240 <0.380 <0.112 <0.088 <0.108 <0.10 <0.064<0.540 <0.240 <0.380 <0.112 <0.088 <0.108 <0.10 <0.064<0.540 <0.240 <0.380 <0.112 <0.088 <0.108 <0.10 <0.064<0.270 <0.120 <0.190 <0.056 <0.044 <0.054 <0.05 <0.032<0.270 <0.120 <0.190 <0.056 <0.044 <0.054 <0.05 <0.032<0.270 <0.120 <0.190 <0.056 <0.044 <0.054 <0.05 <0.032<0.270 <0.120 <0.190 <0.056 <0.044 <0.054 <0.05 <0.032<0.270 <0.120 <0.190 <0.056 <0.044 <0.054 <0.05 <0.032<0.270 <0.120 <0.190 <0.056 <0.044 <0.054 <0.05 <0.032<0.270 <0.120 <0.190 <0.056 <0.044 <0.054 <0.05 <0.032<0.270 <0.120 <0.190 <0.056 <0.044 <0.054 <0.05 <0.032<0.540 <0.240 <0.380 <0.112 <0.088 <0.108 <0.10 <0.064<0.540 <0.240 <0.380 <0.112 <0.088 <0.108 <0.10 <0.064<0.270 <0.120 <0.190 <0.056 <0.044 <0.054 <0.05 <0.032<0.540 <0.240 <0.380 <0.112 <0.088 <0.108 <0.10 <0.064<0.270 <0.120 <0.190 <0.056 <0.044 <0.054 <0.05 <0.032<0.270 <0.120 <0.190 <0.056 <0.044 <0.054 <0.05 <0.032<0.270 <0.120 <0.190 <0.056 <0.044 <0.054 <0.05 <0.032<0.270 <0.120 <0.190 <0.056 <0.044 <0.054 <0.05 <0.032<0.270 <0.120 <0.190 E0.027 E0.010 <0.054 <0.05 <0.032<1.080 <0.480 <0.760 <0.224 <0.176 <0.216 <0.20 <0.128<0.540 <0.240 <0.380 <0.112 <0.088 <0.108 <0.10 <0.064<0.540 <0.240 <0.380 <0.112 <0.088 <0.108 <0.10 <0.064<0.540 <0.240 <0.380 <0.112 <0.088 <0.108 <0.10 <0.064<0.540 <0.240 <0.380 <0.112 <0.088 <0.108 <0.10 <0.064<0.270 <0.120 <0.190 <0.056 <0.044 <0.054 <0.05 <0.032<0.270 <0.120 <0.190 <0.056 <0.044 <0.054 <0.05 <0.032<0.270 <0.120 <0.190 <0.056 <0.044 <0.054 <0.05 <0.032<0.270 <0.120 <0.190 <0.056 <0.044 <0.054 <0.05 <0.032<0.270 <0.120 <0.190 <0.056 <0.044 <0.054 <0.05 <0.032<0.270 <0.120 <0.190 <0.056 <0.044 <0.054 <0.05 <0.032<0.270 <0.120 <0.190 <0.056 <0.044 <0.054 <0.05 <0.032<0.540 <0.240 <0.380 <0.112 <0.088 <0.108 <0.10 <0.064
34 Table 3

Table 3. Analytical results for VOCs in the water samples, SWR and Loveland Reservoirs, San Diego County, Calif.—Continued
PCODESite name Date Time
S 9 S 1998 1550SWR near recreation area 10-Sep-1998 1020SWR near recreation area 3-Nov-1998 1205SWR near recreation area 3-Nov-1998 1215SWR near recreation area 6-Jan-1999 1100SWR near recreation area 1-Mar-1999 1220SWR near recreation area 3-May-1999 1310SWR near recreation area 3-May-1999 1320SWR near recreation area 12-Jul-1999 1320SWR near recreation area 12-Jul-1999 1330SWR minimum pool boundary east 10-Sep-1998 1240SWR minimum pool boundary east 10-Sep-1998 1250SWR minimum pool boundary east 3-Nov-1998 1340SWR minimum pool boundary east 6-Jan-1999 1130SWR minimum pool boundary east 2-Mar-1999 840SWR minimum pool boundary east 3-May-1999 1350SWR minimum pool boundary east 3-May-1999 1400SWR minimum pool boundary east 12-Jul-1999 1420SWR east end reservoir fill boundary 10-Sep-1998 1310SWR east end reservoir fill boundary 3-Nov-1998 1400SWR east end reservoir fill boundary 6-Jan-1999 1150SWR east end reservoir fill boundary 1-Mar-1999 1240SWR east end reservoir fill boundary 3-May-1999 1440SWR east end reservoir fill boundary 12-Jul-1999 1440SWR east end reservoir fill boundary 20-Sep-1999 1250SWR near Gum Tree Cove Pond 10-Sep-1998 930SWR near Gum Tree Cove Pond 10-Sep-1998 940SWR near Gum Tree Cove Pond 3-Nov-1998 1430SWR near Gum Tree Cove Pond 6-Jan-1999 1220SWR near Gum Tree Cove Pond 1-Mar-1999 1310SWR near Gum Tree Cove Pond 3-May-1999 1510SWR near Gum Tree Cove Pond 12-Jul-1999 1500Loveland Reservoir near dam site 1 10-Sep-1998 1610Loveland Reservoir near dam site 1 10-Sep-1998 1620Loveland Reservoir near dam site 1 4-Nov-1998 1030Loveland Reservoir near dam site 1 4-Nov-1998 1040Loveland Reservoir near dam site 1 7-Jan-1999 1010Loveland Reservoir near dam site 1 2-Mar-1999 1150
1,2,
3-Tr
ichl
orob
enze
ne
1,2,
3-Tr
imet
hylb
enze
ne
1,2,
4-Tr
ichl
orob
enze
ne
1,2,
4-Tr
imet
hylb
enze
ne
1,3,
5-Tr
imet
hylb
enze
ne
1,3-
Dic
hlor
oben
zene
1,4-
Dic
hlor
oben
zene
Isop
ropy
lben
zene
77613 77221 34551 77222 77226 34566 34571 77223(µµµµg/L) (µµµµg/L) (µµµµg/L) (µµµµg/L) (µµµµg/L) (µµµµg/L) (µµµµg/L) (µµµµg/L)
<0.540 <0.240 <0.380 <0.112 <0.088 <0.108 <0.10 <0.064<0.540 <0.240 <0.380 <0.112 <0.088 <0.108 <0.10 <0.064<0.540 <0.240 <0.380 <0.112 <0.088 <0.108 <0.10 <0.064<0.540 <0.240 <0.380 <0.112 <0.088 <0.108 <0.10 <0.064<0.270 <0.120 <0.190 <0.056 <0.044 <0.054 <0.05 <0.032<0.270 <0.120 <0.190 <0.056 <0.044 <0.054 <0.05 <0.032<0.270 <0.120 <0.190 <0.056 <0.044 <0.054 <0.05 <0.032<0.270 <0.120 <0.190 <0.056 <0.044 <0.054 <0.05 <0.032<0.270 <0.120 <0.190 <0.056 <0.044 <0.054 <0.05 <0.032<1.080 <0.480 <0.760 <0.224 <0.176 <0.216 <0.20 <0.128<0.540 <0.240 <0.380 <0.112 <0.088 <0.108 <0.10 <0.064<0.270 <0.120 <0.190 <0.056 <0.044 <0.054 <0.05 <0.032<0.540 <0.240 <0.380 <0.112 <0.088 <0.108 <0.10 <0.064<0.270 <0.120 <0.190 <0.056 <0.044 <0.054 <0.05 <0.032<0.270 <0.120 <0.190 <0.056 <0.044 <0.054 <0.05 <0.032<0.270 <0.120 <0.190 <0.056 <0.044 <0.054 <0.05 <0.032<0.270 <0.120 <0.190 <0.056 <0.044 <0.054 <0.05 <0.032<0.266 <0.124 <0.188 <0.056 <0.044 <0.054 <0.05 <0.032<0.270 <0.120 <0.190 <0.056 <0.044 <0.054 <0.05 <0.032<0.540 <0.240 <0.380 <0.112 <0.088 <0.108 <0.10 <0.064<0.270 <0.120 <0.190 <0.056 <0.044 <0.054 <0.05 <0.032<0.270 <0.120 <0.190 <0.056 <0.044 <0.054 <0.05 <0.032<0.270 <0.120 <0.190 <0.056 <0.044 <0.054 <0.05 <0.032<0.270 0.025 <0.190 E0.089 E0.025 <0.054 <0.05 <0.032<0.540 <0.240 <0.380 <0.112 <0.088 <0.108 <0.10 <0.064<0.540 <0.240 <0.380 <0.112 <0.088 <0.108 <0.10 <0.064<0.270 <0.120 <0.190 <0.056 <0.044 <0.054 <0.05 <0.032<0.540 <0.240 <0.380 <0.112 <0.088 <0.108 <0.10 <0.064<0.270 <0.120 <0.190 <0.056 <0.044 <0.054 <0.05 <0.032<0.270 <0.120 <0.190 <0.056 <0.044 <0.054 <0.05 <0.032<0.270 <0.120 <0.190 <0.056 <0.044 <0.054 <0.05 <0.032<0.266 <0.124 <0.188 <0.056 <0.044 <0.054 <0.05 <0.032<0.266 <0.124 <0.188 <0.056 <0.044 <0.054 <0.05 <0.032<0.270 <0.120 <0.190 <0.056 <0.044 <0.054 <0.05 <0.032<0.270 <0.120 <0.190 <0.056 <0.044 <0.054 <0.05 <0.032<0.540 <0.240 <0.380 <0.112 <0.088 <0.108 <0.10 <0.064<0.270 <0.120 <0.190 <0.056 <0.044 <0.054 <0.05 <0.032
35 Table 3

Table 3. Analytical results for VOCs in the water samples, SWR and Loveland Reservoirs, San Diego County, Calif.—Continued
PCODESite name Date Time
S 9 S 1998 1550Loveland Reservoir near dam site 1 4-May-1999 1040Loveland Reservoir near dam site 1 4-May-1999 1050Loveland Reservoir near dam site 1 13-Jul-1999 1020Loveland Reservoir near dam site 1 13-Jul-1999 1030Loveland Reservoir near dam site 1 21-Sep-1999 1000Loveland Reservoir near dam site 1 21-Sep-1999 1020Loveland Reservoir east end near source inlet site 2 10-Sep-1998 1650Loveland Reservoir east end near source inlet site 2 10-Sep-1998 1700Loveland Reservoir east end near source inlet site 2 4-Nov-1998 1155Loveland Reservoir east end near source inlet site 2 4-Nov-1998 1205Loveland Reservoir east end near source inlet site 2 7-Jan-1999 1035Loveland Reservoir east end near source inlet site 2 2-Mar-1999 1220Loveland Reservoir east end near source inlet site 2 4-May-1999 1120Loveland Reservoir east end near source inlet site 2 4-May-1999 1130Loveland Reservoir east end near source inlet site 2 13-Jul-1999 1100Sweetwater River at low flow barrier at SWR 6-Jan-1999 1515Sweetwater River at low flow barrier at SWR 7-Jan-1999 1420Sweetwater River at low flow barrier at SWR 2-Mar-1999 1540Sweetwater River at low flow barrier at SWR 3-May-1999 1645Sweetwater River at low flow barrier at SWR 12-Jul-1999 1620Sweetwater River at low flow barrier at SWR 20-Sep-1999 1630Perdue Treatment Plant—finished water at SWR 7-Jan-1999 1350Perdue Treatment Plant—finished water at SWR 2-Mar-1999 1630Perdue Treatment Plant—finished water at SWR 3-May-1999 1607Perdue Treatment Plant—finished water at SWR 12-Jul-1999 1700Perdue Treatment Plant—finished water at SWR 20-Sep-1999 1430Perdue Treatment Plant—imported raw water at SWR 20-Sep-1999 1500
1,2,
3-Tr
ichl
orob
enze
ne
1,2,
3-Tr
imet
hylb
enze
ne
1,2,
4-Tr
ichl
orob
enze
ne
1,2,
4-Tr
imet
hylb
enze
ne
1,3,
5-Tr
imet
hylb
enze
ne
1,3-
Dic
hlor
oben
zene
1,4-
Dic
hlor
oben
zene
Isop
ropy
lben
zene
77613 77221 34551 77222 77226 34566 34571 77223(µµµµg/L) (µµµµg/L) (µµµµg/L) (µµµµg/L) (µµµµg/L) (µµµµg/L) (µµµµg/L) (µµµµg/L)
<0.270 <0.120 <0.190 <0.056 <0.044 <0.054 <0.05 <0.032<0.270 <0.120 <0.190 <0.056 <0.044 <0.054 <0.05 <0.032<0.270 <0.120 <0.190 <0.056 <0.044 <0.054 <0.05 <0.032<0.270 <0.120 <0.190 <0.056 <0.044 <0.054 <0.05 <0.032<0.270 <0.120 <0.190 <0.056 <0.044 <0.054 <0.05 <0.032<0.270 <0.120 <0.190 <0.056 <0.044 <0.054 <0.05 <0.032<0.266 <0.124 <0.188 <0.056 <0.044 <0.054 <0.05 <0.032<0.266 <0.124 <0.188 E0.010 <0.044 <0.054 <0.05 <0.032<0.540 <0.240 <0.380 <0.112 <0.088 <0.108 <0.10 <0.064<0.270 <0.120 <0.190 <0.056 <0.044 <0.054 <0.05 <0.032<0.270 <0.120 <0.190 <0.056 <0.044 <0.054 <0.05 <0.032<0.270 <0.120 <0.190 <0.056 <0.044 <0.054 <0.05 <0.032<0.270 <0.120 <0.190 <0.056 <0.044 <0.054 <0.05 <0.032<0.270 <0.120 <0.190 <0.056 <0.044 <0.054 <0.05 <0.032<0.270 <0.120 <0.190 <0.056 <0.044 <0.054 <0.05 <0.032<0.540 <0.240 <0.380 <0.112 <0.088 <0.108 <0.10 <0.064<0.540 <0.240 <0.380 <0.112 <0.088 <0.108 <0.10 <0.064<0.270 <0.120 <0.190 <0.056 <0.044 <0.054 <0.05 <0.032<0.270 <0.120 <0.190 <0.056 <0.044 <0.054 <0.05 <0.032<0.540 <0.240 <0.380 <0.112 <0.088 <0.108 <0.10 <0.064<0.270 <0.120 <0.190 <0.056 <0.044 <0.054 <0.05 <0.032<0.540 <0.240 <0.380 <0.112 <0.088 <0.108 <0.10 <0.064<0.270 <0.120 <0.190 <0.056 <0.044 <0.054 <0.05 <0.032<0.270 <0.120 <0.190 <0.056 <0.044 <0.054 <0.05 <0.032<0.270 <0.120 <0.190 <0.056 <0.044 <0.054 <0.05 <0.032<0.270 <0.120 <0.190 <0.056 <0.044 <0.054 <0.05 <0.032<0.270 <0.120 <0.190 <0.056 <0.044 <0.054 <0.05 <0.032
36 Table 3

Table 3. Analytical results for VOCs in the water samples, SWR and Loveland Reservoirs, San Diego County, Calif.—Continued
PCODESite name Date Time
SWR near pump tower 9-Sep-1998 1550SWR near pump tower 9-Sep-1998 1600SWR near pump tower 3-Nov-1998 1030SWR near pump tower 3-Nov-1998 1040SWR near pump tower 6-Jan-1999 930SWR near pump tower 1-Mar-1999 1030SWR near pump tower 1-Mar-1999 1045SWR near pump tower 3-May-1999 1115SWR near pump tower 3-May-1999 1130SWR near pump tower 12-Jul-1999 1120SWR near pump tower 12-Jul-1999 1130SWR near pump tower 20-Sep-1999 1140SWR near pump tower 20-Sep-1999 1150SWR near Vista del Lago station 10-Sep-1998 845SWR near Vista del Lago station 10-Sep-1998 900SWR near Vista del Lago station 3-Nov-1998 1110SWR near Vista del Lago station 6-Jan-1999 1000SWR near Vista del Lago station 1-Mar-1999 1100SWR near Vista del Lago station 3-May-1999 1150SWR near Vista del Lago station 3-May-1999 1200SWR near Vista del Lago station 12-Jul-1999 1210SWR near Vista del Lago station 12-Jul-1999 1220SWR center of minimum pool 9-Sep-1998 1630SWR center of minimum pool 9-Sep-1998 1640SWR center of minimum pool 3-Nov-1998 1140SWR center of minimum pool 3-Nov-1998 1150SWR center of minimum pool 6-Jan-1999 1030SWR center of minimum pool 1-Mar-1999 1130SWR center of minimum pool 3-May-1999 1235SWR center of minimum pool 3-May-1999 1240SWR center of minimum pool 12-Jul-1999 1240SWR center of minimum pool 12-Jul-1999 1250SWR center of minimum pool 20-Sep-1999 1220SWR center of minimum pool 20-Sep-1999 1230SWR near recreation area 10-Sep-1998 1010
But
ylbe
nzen
e
N-P
ropy
lben
zene
1,2-
Dic
hlor
oben
zene
sec-
But
ylbe
nzen
e
tert-
But
ylbe
nzen
e
Ben
zene
Bro
mob
enze
ne
Bro
moe
then
e
77342 77224 34536 77350 77353 34030 81555 50002(µµµµg/L) (µµµµg/L) (µµµµg/L) (µµµµg/L) (µµµµg/L) (µµµµg/L) (µµµµg/L) (µµµµg/L)
<0.760 <0.168 <0.192 <0.192 <0.400 <0.400 <0.144 <0.4<0.380 <0.084 <0.096 <0.096 <0.200 <0.200 <0.072 <0.2<0.380 <0.084 <0.096 <0.096 <0.200 <0.200 <0.072 <0.2<0.380 <0.084 <0.096 <0.096 <0.200 <0.200 <0.072 <0.2<0.380 <0.084 <0.096 <0.096 <0.200 <0.200 <0.072 <0.2<0.190 <0.042 <0.048 <0.048 <0.100 <0.100 <0.036 <0.1<0.190 <0.042 <0.048 <0.048 <0.100 E0.010 <0.036 <0.1<0.190 <0.042 <0.048 <0.048 <0.100 <0.100 <0.036 <0.1<0.190 <0.042 <0.048 <0.048 <0.100 <0.100 <0.036 <0.1<0.190 <0.042 <0.048 <0.048 <0.100 E0.007 <0.036 <0.1<0.190 <0.042 <0.048 <0.048 <0.100 <0.100 <0.036 <0.1<0.190 <0.042 <0.048 <0.032 <0.060 <0.035 <0.036 <0.1<0.190 <0.042 <0.048 <0.032 <0.060 <0.035 <0.036 <0.1<0.380 <0.084 <0.096 <0.096 <0.200 <0.200 <0.072 <0.2<0.380 <0.084 <0.096 <0.096 <0.200 <0.200 <0.072 <0.2<0.190 <0.042 <0.048 <0.048 <0.100 <0.100 <0.036 <0.1<0.380 <0.084 <0.096 <0.096 <0.200 <0.200 <0.072 <0.2<0.190 <0.042 <0.048 <0.048 <0.100 E0.010 <0.036 <0.1<0.190 <0.042 <0.048 <0.048 <0.100 <0.100 <0.036 <0.1<0.190 <0.042 <0.048 <0.048 <0.100 <0.100 <0.036 <0.1<0.190 <0.042 <0.048 <0.048 <0.100 <0.100 <0.036 <0.1<0.190 <0.042 <0.048 <0.048 <0.100 E0.015 <0.036 <0.1<0.760 <0.168 <0.192 <0.192 <0.400 <0.400 <0.144 <0.4<0.380 <0.084 <0.096 <0.096 <0.200 <0.200 <0.072 <0.2<0.380 <0.084 <0.096 <0.096 <0.200 <0.200 <0.072 <0.2<0.380 <0.084 <0.096 <0.096 <0.200 <0.200 <0.072 <0.2<0.380 <0.084 <0.096 <0.096 <0.200 <0.200 <0.072 <0.2<0.190 <0.042 <0.048 <0.048 <0.100 E0.007 <0.036 <0.1<0.190 <0.042 <0.048 <0.048 <0.100 <0.100 <0.036 <0.1<0.190 <0.042 <0.048 <0.048 <0.100 <0.100 <0.036 <0.1<0.190 <0.042 <0.048 <0.048 <0.100 <0.100 <0.036 <0.1<0.190 <0.042 <0.048 <0.048 <0.100 <0.100 <0.036 <0.1<0.190 <0.042 <0.048 <0.032 <0.060 <0.035 <0.036 <0.1<0.190 <0.042 <0.048 <0.032 <0.060 <0.035 <0.036 <0.1<0.380 <0.084 <0.096 <0.096 <0.200 <0.200 <0.072 <0.2
37 Table 3

Table 3. Analytical results for VOCs in the water samples, SWR and Loveland Reservoirs, San Diego County, Calif.—Continued
PCODESite name Date Time
S 9 S 1998 1550SWR near recreation area 10-Sep-1998 1020SWR near recreation area 3-Nov-1998 1205SWR near recreation area 3-Nov-1998 1215SWR near recreation area 6-Jan-1999 1100SWR near recreation area 1-Mar-1999 1220SWR near recreation area 3-May-1999 1310SWR near recreation area 3-May-1999 1320SWR near recreation area 12-Jul-1999 1320SWR near recreation area 12-Jul-1999 1330SWR minimum pool boundary east 10-Sep-1998 1240SWR minimum pool boundary east 10-Sep-1998 1250SWR minimum pool boundary east 3-Nov-1998 1340SWR minimum pool boundary east 6-Jan-1999 1130SWR minimum pool boundary east 2-Mar-1999 840SWR minimum pool boundary east 3-May-1999 1350SWR minimum pool boundary east 3-May-1999 1400SWR minimum pool boundary east 12-Jul-1999 1420SWR east end reservoir fill boundary 10-Sep-1998 1310SWR east end reservoir fill boundary 3-Nov-1998 1400SWR east end reservoir fill boundary 6-Jan-1999 1150SWR east end reservoir fill boundary 1-Mar-1999 1240SWR east end reservoir fill boundary 3-May-1999 1440SWR east end reservoir fill boundary 12-Jul-1999 1440SWR east end reservoir fill boundary 20-Sep-1999 1250SWR near Gum Tree Cove Pond 10-Sep-1998 930SWR near Gum Tree Cove Pond 10-Sep-1998 940SWR near Gum Tree Cove Pond 3-Nov-1998 1430SWR near Gum Tree Cove Pond 6-Jan-1999 1220SWR near Gum Tree Cove Pond 1-Mar-1999 1310SWR near Gum Tree Cove Pond 3-May-1999 1510SWR near Gum Tree Cove Pond 12-Jul-1999 1500Loveland Reservoir near dam site 1 10-Sep-1998 1610Loveland Reservoir near dam site 1 10-Sep-1998 1620Loveland Reservoir near dam site 1 4-Nov-1998 1030Loveland Reservoir near dam site 1 4-Nov-1998 1040Loveland Reservoir near dam site 1 7-Jan-1999 1010Loveland Reservoir near dam site 1 2-Mar-1999 1150
But
ylbe
nzen
e
N-P
ropy
lben
zene
1,2-
Dic
hlor
oben
zene
sec-
But
ylbe
nzen
e
tert-
But
ylbe
nzen
e
Ben
zene
Bro
mob
enze
ne
Bro
moe
then
e
77342 77224 34536 77350 77353 34030 81555 50002(µµµµg/L) (µµµµg/L) (µµµµg/L) (µµµµg/L) (µµµµg/L) (µµµµg/L) (µµµµg/L) (µµµµg/L)
<0.380 <0.084 <0.096 <0.096 <0.200 <0.200 <0.072 <0.2<0.380 <0.084 <0.096 <0.096 <0.200 <0.200 <0.072 <0.2<0.380 <0.084 <0.096 <0.096 <0.200 <0.200 <0.072 <0.2<0.380 <0.084 <0.096 <0.096 <0.200 <0.200 <0.072 <0.2<0.190 <0.042 <0.048 <0.048 <0.100 <0.100 <0.036 <0.1<0.190 <0.042 <0.048 <0.048 <0.100 <0.100 <0.036 <0.1<0.190 <0.042 <0.048 <0.048 <0.100 <0.100 <0.036 <0.1<0.190 <0.042 <0.048 <0.048 <0.100 <0.100 <0.036 <0.1<0.190 <0.042 <0.048 <0.048 <0.100 <0.100 <0.036 <0.1<0.760 <0.168 <0.192 <0.192 <0.400 <0.400 <0.144 <0.4<0.380 <0.084 <0.096 <0.096 <0.200 <0.200 <0.072 <0.2<0.190 <0.042 <0.048 <0.048 <0.100 <0.100 <0.036 <0.1<0.380 <0.084 <0.096 <0.096 <0.200 <0.200 <0.072 <0.2<0.190 <0.042 <0.048 <0.048 <0.100 <0.100 <0.036 <0.1<0.190 <0.042 <0.048 <0.048 <0.100 <0.100 <0.036 <0.1<0.190 <0.042 <0.048 <0.048 <0.100 <0.100 <0.036 <0.1<0.190 <0.042 <0.048 <0.048 <0.100 E0.007 <0.036 <0.1<0.186 <0.168 <0.048 <0.048 <0.096 <0.100 <0.036 <0.1<0.190 <0.042 <0.048 <0.048 <0.100 <0.100 <0.036 <0.1<0.380 <0.084 <0.096 <0.096 <0.200 <0.200 <0.072 <0.2<0.190 <0.042 <0.048 <0.048 <0.100 E0.008 <0.036 <0.1<0.190 <0.042 <0.048 <0.048 <0.100 <0.100 <0.036 <0.1<0.190 <0.042 <0.048 <0.048 <0.100 <0.100 <0.036 <0.1<0.190 E0.010 <0.048 <0.032 <0.060 E0.041 <0.036 <0.1<0.380 <0.084 <0.096 <0.096 <0.200 <0.200 <0.072 <0.2<0.380 <0.084 <0.096 <0.096 <0.200 <0.200 <0.072 <0.2<0.190 <0.042 <0.048 <0.048 <0.100 <0.100 <0.036 <0.1<0.380 <0.084 <0.096 <0.096 <0.200 <0.200 <0.072 <0.2<0.190 <0.042 <0.048 <0.048 <0.100 <0.100 <0.036 <0.1<0.190 <0.042 <0.048 <0.048 <0.100 <0.100 <0.036 <0.1<0.190 <0.042 <0.048 <0.048 <0.100 <0.100 <0.036 <0.1<0.186 <0.042 <0.048 <0.048 <0.096 <0.100 <0.036 <0.1<0.186 <0.042 <0.048 <0.048 <0.096 <0.100 <0.036 <0.1<0.190 <0.042 <0.048 <0.048 <0.100 <0.100 <0.036 <0.1<0.190 <0.042 <0.048 <0.048 <0.100 <0.100 <0.036 <0.1<0.380 <0.084 <0.096 <0.096 <0.200 <0.200 <0.072 <0.2<0.190 <0.042 <0.048 <0.048 <0.100 <0.100 <0.036 <0.1
38 Table 3

Table 3. Analytical results for VOCs in the water samples, SWR and Loveland Reservoirs, San Diego County, Calif.—Continued
PCODESite name Date Time
S 9 S 1998 1550Loveland Reservoir near dam site 1 4-May-1999 1040Loveland Reservoir near dam site 1 4-May-1999 1050Loveland Reservoir near dam site 1 13-Jul-1999 1020Loveland Reservoir near dam site 1 13-Jul-1999 1030Loveland Reservoir near dam site 1 21-Sep-1999 1000Loveland Reservoir near dam site 1 21-Sep-1999 1020Loveland Reservoir east end near source inlet site 2 10-Sep-1998 1650Loveland Reservoir east end near source inlet site 2 10-Sep-1998 1700Loveland Reservoir east end near source inlet site 2 4-Nov-1998 1155Loveland Reservoir east end near source inlet site 2 4-Nov-1998 1205Loveland Reservoir east end near source inlet site 2 7-Jan-1999 1035Loveland Reservoir east end near source inlet site 2 2-Mar-1999 1220Loveland Reservoir east end near source inlet site 2 4-May-1999 1120Loveland Reservoir east end near source inlet site 2 4-May-1999 1130Loveland Reservoir east end near source inlet site 2 13-Jul-1999 1100Sweetwater River at low flow barrier at SWR 6-Jan-1999 1515Sweetwater River at low flow barrier at SWR 7-Jan-1999 1420Sweetwater River at low flow barrier at SWR 2-Mar-1999 1540Sweetwater River at low flow barrier at SWR 3-May-1999 1645Sweetwater River at low flow barrier at SWR 12-Jul-1999 1620Sweetwater River at low flow barrier at SWR 20-Sep-1999 1630Perdue Treatment Plant—finished water at SWR 7-Jan-1999 1350Perdue Treatment Plant—finished water at SWR 2-Mar-1999 1630Perdue Treatment Plant—finished water at SWR 3-May-1999 1607Perdue Treatment Plant—finished water at SWR 12-Jul-1999 1700Perdue Treatment Plant—finished water at SWR 20-Sep-1999 1430Perdue Treatment Plant—imported raw water at SWR 20-Sep-1999 1500
But
ylbe
nzen
e
N-P
ropy
lben
zene
1,2-
Dic
hlor
oben
zene
sec-
But
ylbe
nzen
e
tert-
But
ylbe
nzen
e
Ben
zene
Bro
mob
enze
ne
Bro
moe
then
e
77342 77224 34536 77350 77353 34030 81555 50002(µµµµg/L) (µµµµg/L) (µµµµg/L) (µµµµg/L) (µµµµg/L) (µµµµg/L) (µµµµg/L) (µµµµg/L)
<0.190 <0.042 <0.048 <0.048 <0.100 <0.100 <0.036 <0.1<0.190 <0.042 <0.048 <0.048 <0.100 <0.100 <0.036 <0.1<0.190 <0.042 <0.048 <0.048 <0.100 E0.008 <0.036 <0.1<0.190 <0.042 <0.048 <0.048 <0.100 0E.011 <0.036 <0.1<0.190 <0.042 <0.048 <0.032 <0.060 E0.011 <0.036 <0.1<0.190 <0.042 <0.048 <0.032 <0.060 <0.035 <0.036 <0.1<0.186 <0.042 <0.048 <0.048 <0.096 <0.100 <0.036 <0.1<0.186 <0.042 <0.048 <0.048 <0.096 <0.100 <0.036 <0.1<0.380 <0.084 <0.096 <0.096 <0.200 <0.200 <0.072 <0.2<0.190 <0.042 <0.048 <0.048 <0.100 <0.100 <0.036 <0.1<0.190 <0.042 <0.048 <0.048 <0.100 <0.100 <0.036 <0.1<0.190 <0.042 <0.048 <0.048 <0.100 E0.010 <0.036 <0.1<0.190 <0.042 <0.048 <0.048 <0.100 <0.100 <0.036 <0.1<0.190 <0.042 <0.048 <0.048 <0.100 <0.100 <0.036 <0.1<0.190 <0.042 <0.048 <0.048 <0.100 <0.100 <0.036 <0.1<0.380 <0.084 <0.096 <0.096 <0.200 <0.200 <0.072 <0.2<0.380 <0.084 <0.096 <0.096 <0.200 E0.020 <0.072 <0.2<0.190 <0.042 <0.048 <0.048 <0.100 E0.012 <0.036 <0.1<0.190 <0.042 <0.048 <0.048 <0.100 <0.100 <0.036 <0.1<0.380 <0.084 <0.096 <0.096 <0.200 <0.200 <0.072 <0.2<0.190 <0.042 <0.048 <0.032 <0.060 <0.035 <0.036 <0.1<0.380 <0.084 <0.096 <0.096 <0.200 <0.200 <0.072 <0.2<0.190 <0.042 <0.048 <0.048 <0.100 E0.011 <0.036 <0.1<0.190 <0.042 <0.048 <0.048 <0.100 <0.100 <0.036 <0.1<0.190 <0.042 <0.048 <0.048 <0.100 <0.100 <0.036 <0.1<0.190 <0.042 <0.048 <0.032 <0.060 E0.012 <0.036 <0.1<0.190 <0.042 <0.048 <0.032 <0.060 0.035 <0.036 <0.1
39 Table 3

Table 3. Analytical results for VOCs in the water samples, SWR and Loveland Reservoirs, San Diego County, Calif.—Continued
PCODESite name Date Time
SWR near pump tower 9-Sep-1998 1550SWR near pump tower 9-Sep-1998 1600SWR near pump tower 3-Nov-1998 1030SWR near pump tower 3-Nov-1998 1040SWR near pump tower 6-Jan-1999 930SWR near pump tower 1-Mar-1999 1030SWR near pump tower 1-Mar-1999 1045SWR near pump tower 3-May-1999 1115SWR near pump tower 3-May-1999 1130SWR near pump tower 12-Jul-1999 1120SWR near pump tower 12-Jul-1999 1130SWR near pump tower 20-Sep-1999 1140SWR near pump tower 20-Sep-1999 1150SWR near Vista del Lago station 10-Sep-1998 845SWR near Vista del Lago station 10-Sep-1998 900SWR near Vista del Lago station 3-Nov-1998 1110SWR near Vista del Lago station 6-Jan-1999 1000SWR near Vista del Lago station 1-Mar-1999 1100SWR near Vista del Lago station 3-May-1999 1150SWR near Vista del Lago station 3-May-1999 1200SWR near Vista del Lago station 12-Jul-1999 1210SWR near Vista del Lago station 12-Jul-1999 1220SWR center of minimum pool 9-Sep-1998 1630SWR center of minimum pool 9-Sep-1998 1640SWR center of minimum pool 3-Nov-1998 1140SWR center of minimum pool 3-Nov-1998 1150SWR center of minimum pool 6-Jan-1999 1030SWR center of minimum pool 1-Mar-1999 1130SWR center of minimum pool 3-May-1999 1235SWR center of minimum pool 3-May-1999 1240SWR center of minimum pool 12-Jul-1999 1240SWR center of minimum pool 12-Jul-1999 1250SWR center of minimum pool 20-Sep-1999 1220SWR center of minimum pool 20-Sep-1999 1230SWR near recreation area 10-Sep-1998 1010
Bro
mof
orm
Carb
on d
isul
fide
Tetra
chlo
rom
etha
ne
Chlo
robe
nzen
e
Dib
rom
ochl
orom
etha
ne
Chlo
roet
hane
Chlo
rofo
rm
cis-
1,2-
Dic
hlor
oeth
ylen
e
32104 77041 32102 34301 32105 34311 32106 77093(µµµµg/L) (µµµµg/L) (µµµµg/L) (µµµµg/L) (µµµµg/L) (µµµµg/L) (µµµµg/L) (µµµµg/L)
<0.400 <1.48 <0.352 <0.112 <0.720 <0.48 E0.099 <0.1520.231 <0.74 <0.176 <0.056 1.410 <0.24 1.540 <0.076
<0.200 <0.74 <0.176 <0.056 0.557 <0.24 0.669 <0.076<0.200 <0.74 <0.176 <0.056 0.171 <0.24 0.252 <0.076E0.220 <0.74 <0.176 <0.056 1.403 <0.24 0.964 <0.076<0.100 <0.37 <0.088 <0.028 0.171 <0.12 0.391 <0.038<0.100 E0.37 <0.088 <0.028 0.073 <0.12 0.120 <0.038<0.100 <0.37 <0.088 <0.028 0.215 <0.12 0.321 <0.038E0.080 <0.37 <0.088 <0.028 0.449 <0.12 0.324 <0.038<0.100 E0.03 <0.088 <0.028 <0.180 <0.12 E0.071 <0.0380E.044 <0.37 <0.088 <0.028 0.142 <0.12 0.102 <0.038<0.060 E0.08 <0.060 <0.028 <0.180 <0.12 0.116 <0.038<0.060 <0.07 <0.060 <0.028 0.118 <0.12 0.176 <0.038<0.200 E0.04 <0.176 <0.056 <0.360 <0.24 <0.104 <0.076<0.200 <0.74 <0.176 <0.056 0.088 <0.24 E0.140 <0.076<0.100 <0.37 <0.088 <0.028 0.066 <0.12 0.136 <0.038<0.200 <0.74 <0.176 <0.056 0.110 <0.24 E0.130 <0.076<0.100 <0.37 <0.088 <0.028 0.129 <0.12 0.211 <0.038<0.100 <0.37 <0.088 <0.028 0.145 <0.12 0.245 <0.038<0.100 <0.37 <0.088 <0.028 0.083 <0.12 E0.086 <0.038E0.043 <0.37 <0.088 <0.028 0.202 <0.12 0.316 <0.038<0.100 <0.37 <0.088 <0.028 0.123 <0.12 E0.086 <0.038<0.400 <1.48 <0.352 <0.112 0.720 <0.48 <0.208 <0.152<0.200 <0.74 <0.176 <0.056 <0.360 <0.24 0.270 <0.076<0.200 <0.74 <0.176 <0.056 <0.360 <0.24 E0.150 <0.076<0.200 <0.74 <0.176 <0.056 <0.360 <0.24 E0.130 <0.076<0.200 <0.74 <0.176 <0.056 0.110 <0.24 E0.140 <0.076<0.100 <0.37 <0.088 <0.028 0.093 <0.12 0.167 <0.038<0.100 <0.37 <0.088 <0.028 0.107 <0.12 0.196 <0.038<0.100 <0.37 <0.088 <0.028 0.091 <0.12 E0.092 <0.038<0.100 E0.04 <0.088 <0.028 <0.180 <0.12 E0.017 <0.038E0.069 <0.37 <0.088 <0.028 0.334 <0.12 0.332 <0.038<0.060 E0.07 <0.060 <0.028 <0.180 <0.12 0.118 <0.038<0.060 <0.07 <0.060 <0.028 <0.180 <0.12 E0.095 <0.038<0.200 E0.05 <0.176 <0.056 <0.360 <0.24 <0.104 <0.076
40 Table 3

Table 3. Analytical results for VOCs in the water samples, SWR and Loveland Reservoirs, San Diego County, Calif.—Continued
PCODESite name Date Time
S 9 S 1998 1550SWR near recreation area 10-Sep-1998 1020SWR near recreation area 3-Nov-1998 1205SWR near recreation area 3-Nov-1998 1215SWR near recreation area 6-Jan-1999 1100SWR near recreation area 1-Mar-1999 1220SWR near recreation area 3-May-1999 1310SWR near recreation area 3-May-1999 1320SWR near recreation area 12-Jul-1999 1320SWR near recreation area 12-Jul-1999 1330SWR minimum pool boundary east 10-Sep-1998 1240SWR minimum pool boundary east 10-Sep-1998 1250SWR minimum pool boundary east 3-Nov-1998 1340SWR minimum pool boundary east 6-Jan-1999 1130SWR minimum pool boundary east 2-Mar-1999 840SWR minimum pool boundary east 3-May-1999 1350SWR minimum pool boundary east 3-May-1999 1400SWR minimum pool boundary east 12-Jul-1999 1420SWR east end reservoir fill boundary 10-Sep-1998 1310SWR east end reservoir fill boundary 3-Nov-1998 1400SWR east end reservoir fill boundary 6-Jan-1999 1150SWR east end reservoir fill boundary 1-Mar-1999 1240SWR east end reservoir fill boundary 3-May-1999 1440SWR east end reservoir fill boundary 12-Jul-1999 1440SWR east end reservoir fill boundary 20-Sep-1999 1250SWR near Gum Tree Cove Pond 10-Sep-1998 930SWR near Gum Tree Cove Pond 10-Sep-1998 940SWR near Gum Tree Cove Pond 3-Nov-1998 1430SWR near Gum Tree Cove Pond 6-Jan-1999 1220SWR near Gum Tree Cove Pond 1-Mar-1999 1310SWR near Gum Tree Cove Pond 3-May-1999 1510SWR near Gum Tree Cove Pond 12-Jul-1999 1500Loveland Reservoir near dam site 1 10-Sep-1998 1610Loveland Reservoir near dam site 1 10-Sep-1998 1620Loveland Reservoir near dam site 1 4-Nov-1998 1030Loveland Reservoir near dam site 1 4-Nov-1998 1040Loveland Reservoir near dam site 1 7-Jan-1999 1010Loveland Reservoir near dam site 1 2-Mar-1999 1150
Bro
mof
orm
Carb
on d
isul
fide
Tetra
chlo
rom
etha
ne
Chlo
robe
nzen
e
Dib
rom
ochl
orom
etha
ne
Chlo
roet
hane
Chlo
rofo
rm
cis-
1,2-
Dic
hlor
oeth
ylen
e
32104 77041 32102 34301 32105 34311 32106 77093(µµµµg/L) (µµµµg/L) (µµµµg/L) (µµµµg/L) (µµµµg/L) (µµµµg/L) (µµµµg/L) (µµµµg/L)
<0.200 <0.74 <0.176 <0.056 0.130 <0.24 0.215 <0.076<0.200 <0.74 <0.176 <0.056 <0.360 <0.24 E0.140 <0.076<0.200 <0.74 <0.176 <0.056 <0.360 <0.24 E0.140 <0.076<0.200 <0.74 <0.176 <0.056 0.097 <0.24 E0.120 <0.076<0.100 <0.37 <0.088 <0.028 0.107 <0.12 0.180 <0.038<0.100 <0.37 <0.088 <0.028 0.095 <0.12 0.212 <0.038<0.100 <0.37 <0.088 <0.028 0.120 <0.12 0.124 <0.038<0.100 E0.03 <0.088 <0.028 <0.180 <0.12 E0.018 <0.038E0.051 <0.37 <0.088 <0.028 0.199 <0.12 0.141 <0.038<0.400 E0.06 <0.352 <0.112 <0.720 <0.48 <0.208 <0.152<0.200 <0.74 <0.176 <0.056 0.140 <0.24 0.274 <0.076<0.100 <0.37 <0.088 <0.028 0.079 <0.12 0.156 <0.038<0.200 <0.74 <0.176 <0.056 0.088 <0.24 E0.100 <0.076<0.100 <0.37 <0.088 <0.028 0.096 <0.12 0.164 <0.038<0.100 <0.37 <0.088 <0.028 0.144 <0.12 0.207 <0.038<0.100 <0.37 <0.088 <0.028 0.073 <0.12 E0.078 <0.038E0.047 <0.37 <0.088 <0.028 0.213 <0.12 0.271 <0.038<0.104 <0.37 <0.088 <0.028 <0.182 <0.12 E0.087 <0.038<0.100 <0.37 <0.088 <0.028 0.063 <0.12 0.114 <0.038<0.200 <0.74 <0.176 <0.056 <0.360 <0.24 E0.110 <0.076<0.100 <0.37 <0.088 <0.028 0.069 <0.12 0.112 <0.038<0.100 <0.37 <0.088 <0.028 0.030 <0.12 E0.037 <0.038<0.100 E0.01 <0.088 <0.028 0.038 <0.12 E0.027 <0.038<0.060 <0.07 <0.060 <0.028 <0.180 <0.12 E0.067 <0.038<0.200 E0.06 <0.176 <0.056 <0.360 <0.24 <0.104 <0.076<0.200 <0.74 <0.176 <0.056 <0.360 <0.24 E0.130 <0.076<0.100 <0.37 <0.088 <0.028 0.076 <0.12 0.142 <0.038<0.200 <0.74 <0.176 <0.056 0.083 <0.24 E0.100 <0.076<0.100 <0.37 <0.088 <0.028 0.095 <0.12 0.161 <0.038<0.100 <0.37 <0.088 <0.028 0.086 <0.12 E0.091 <0.0380.101 <0.37 <0.088 <0.028 0.418 <0.12 0.280 <0.038
<0.104 <0.37 <0.088 <0.028 <0.182 <0.12 E0.015 <0.038<0.104 <0.37 <0.088 <0.028 <0.182 <0.12 E0.030 <0.038<0.100 <0.37 <0.088 <0.028 <0.180 <0.12 E0.019 <0.038<0.100 <0.37 <0.088 <0.028 <0.180 <0.12 <0.052 <0.038<0.200 <0.74 <0.176 <0.056 <0.360 <0.24 E0.020 <0.076<0.100 <0.37 <0.088 <0.028 <0.180 <0.12 <0.052 <0.038
41 Table 3

Table 3. Analytical results for VOCs in the water samples, SWR and Loveland Reservoirs, San Diego County, Calif.—Continued
PCODESite name Date Time
S 9 S 1998 1550Loveland Reservoir near dam site 1 4-May-1999 1040Loveland Reservoir near dam site 1 4-May-1999 1050Loveland Reservoir near dam site 1 13-Jul-1999 1020Loveland Reservoir near dam site 1 13-Jul-1999 1030Loveland Reservoir near dam site 1 21-Sep-1999 1000Loveland Reservoir near dam site 1 21-Sep-1999 1020Loveland Reservoir east end near source inlet site 2 10-Sep-1998 1650Loveland Reservoir east end near source inlet site 2 10-Sep-1998 1700Loveland Reservoir east end near source inlet site 2 4-Nov-1998 1155Loveland Reservoir east end near source inlet site 2 4-Nov-1998 1205Loveland Reservoir east end near source inlet site 2 7-Jan-1999 1035Loveland Reservoir east end near source inlet site 2 2-Mar-1999 1220Loveland Reservoir east end near source inlet site 2 4-May-1999 1120Loveland Reservoir east end near source inlet site 2 4-May-1999 1130Loveland Reservoir east end near source inlet site 2 13-Jul-1999 1100Sweetwater River at low flow barrier at SWR 6-Jan-1999 1515Sweetwater River at low flow barrier at SWR 7-Jan-1999 1420Sweetwater River at low flow barrier at SWR 2-Mar-1999 1540Sweetwater River at low flow barrier at SWR 3-May-1999 1645Sweetwater River at low flow barrier at SWR 12-Jul-1999 1620Sweetwater River at low flow barrier at SWR 20-Sep-1999 1630Perdue Treatment Plant—finished water at SWR 7-Jan-1999 1350Perdue Treatment Plant—finished water at SWR 2-Mar-1999 1630Perdue Treatment Plant—finished water at SWR 3-May-1999 1607Perdue Treatment Plant—finished water at SWR 12-Jul-1999 1700Perdue Treatment Plant—finished water at SWR 20-Sep-1999 1430Perdue Treatment Plant—imported raw water at SWR 20-Sep-1999 1500
Bro
mof
orm
Carb
on d
isul
fide
Tetra
chlo
rom
etha
ne
Chlo
robe
nzen
e
Dib
rom
ochl
orom
etha
ne
Chlo
roet
hane
Chlo
rofo
rm
cis-
1,2-
Dic
hlor
oeth
ylen
e
32104 77041 32102 34301 32105 34311 32106 77093(µµµµg/L) (µµµµg/L) (µµµµg/L) (µµµµg/L) (µµµµg/L) (µµµµg/L) (µµµµg/L) (µµµµg/L)
<0.100 <0.37 <0.088 <0.028 <0.180 <0.12 <0.052 <0.038<0.100 <0.37 <0.088 <0.028 <0.180 <0.12 <0.052 <0.038<0.100 <0.37 <0.088 <0.028 <0.180 <0.12 <0.052 <0.038<0.100 <0.37 <0.088 <0.028 <0.180 <0.12 E0.015 <0.038<0.060 <0.07 <0.060 <0.028 <0.180 <0.12 <0.052 <0.038<0.060 <0.07 <0.060 <0.028 <0.180 <0.12 E0.017 <0.038<0.104 <0.37 <0.088 <0.028 <0.182 <0.12 E0.015 <0.038<0.104 <0.37 <0.088 <0.028 <0.182 <0.12 E0.024 <0.038<0.200 <0.74 <0.176 <0.056 <0.360 <0.24 <0.104 <0.076<0.100 <0.37 <0.088 <0.028 <0.180 <0.12 <0.052 <0.038<0.100 <0.37 <0.088 <0.028 <0.180 <0.12 <0.052 <0.038<0.100 <0.37 <0.088 <0.028 <0.180 <0.12 <0.052 <0.038<0.100 <0.37 <0.088 <0.028 <0.180 <0.12 <0.052 <0.038<0.100 <0.37 <0.088 <0.028 <0.180 <0.12 <0.052 <0.038<0.100 <0.37 <0.088 <0.028 <0.180 <0.12 E0.011 <0.038<0.200 <0.74 <0.176 <0.056 <0.360 <0.24 <0.104 <0.076<0.200 <0.74 <0.176 <0.056 <0.360 <0.24 <0.104 <0.076<0.100 <0.37 <0.088 <0.028 <0.180 <0.12 <0.052 E0.014<0.100 <0.37 <0.088 <0.028 <0.180 <0.12 <0.052 E0.023<0.200 E0.05 <0.176 <0.056 <0.360 <0.24 E0.028 E0.029<0.060 <0.07 <0.060 <0.028 <0.180 <0.12 <0.052 E0.0214.114 <0.74 E0.035 <0.056 24.410 <0.24 13.220 <0.0763.162 <0.37 E0.063 <0.028 24.800 E0.03 17.380 <0.0386.085 <0.37 E0.043 <0.028 28.890 E0.05 12.840 <0.038
11.240 E0.02 E0.038 <0.028 44.900 <0.12 16.980 <0.0380.243 <0.37 <0.060 <0.028 2.278 <0.12 6.168 <0.038
<0.060 <0.37 <0.060 <0.028 <0.244 <0.12 0.669 <0.038
42 Table 3

Table 3. Analytical results for VOCs in the water samples, SWR and Loveland Reservoirs, San Diego County, Calif.—Continued
PCODESite name Date Time
SWR near pump tower 9-Sep-1998 1550SWR near pump tower 9-Sep-1998 1600SWR near pump tower 3-Nov-1998 1030SWR near pump tower 3-Nov-1998 1040SWR near pump tower 6-Jan-1999 930SWR near pump tower 1-Mar-1999 1030SWR near pump tower 1-Mar-1999 1045SWR near pump tower 3-May-1999 1115SWR near pump tower 3-May-1999 1130SWR near pump tower 12-Jul-1999 1120SWR near pump tower 12-Jul-1999 1130SWR near pump tower 20-Sep-1999 1140SWR near pump tower 20-Sep-1999 1150SWR near Vista del Lago station 10-Sep-1998 845SWR near Vista del Lago station 10-Sep-1998 900SWR near Vista del Lago station 3-Nov-1998 1110SWR near Vista del Lago station 6-Jan-1999 1000SWR near Vista del Lago station 1-Mar-1999 1100SWR near Vista del Lago station 3-May-1999 1150SWR near Vista del Lago station 3-May-1999 1200SWR near Vista del Lago station 12-Jul-1999 1210SWR near Vista del Lago station 12-Jul-1999 1220SWR center of minimum pool 9-Sep-1998 1630SWR center of minimum pool 9-Sep-1998 1640SWR center of minimum pool 3-Nov-1998 1140SWR center of minimum pool 3-Nov-1998 1150SWR center of minimum pool 6-Jan-1999 1030SWR center of minimum pool 1-Mar-1999 1130SWR center of minimum pool 3-May-1999 1235SWR center of minimum pool 3-May-1999 1240SWR center of minimum pool 12-Jul-1999 1240SWR center of minimum pool 12-Jul-1999 1250SWR center of minimum pool 20-Sep-1999 1220SWR center of minimum pool 20-Sep-1999 1230SWR near recreation area 10-Sep-1998 1010
cis-
1,3-
Dic
hlor
opro
pene
1,2-
Dib
rom
o-3-
chlo
ropr
opan
e
Dib
rom
omet
hane
Bro
mod
ichl
orom
etha
ne
Dich
loro
diflu
orom
etha
ne
Diis
opro
pyl e
ther
1,1,
1,2-
Tetr
achl
oroe
than
e
1,1,
2,2,
-Tet
rach
loro
etha
ne
34704 82625 30217 32101 34668 81577 77562 34516(µµµµg/L) (µµµµg/L) (µµµµg/L) (µµµµg/L) (µµµµg/L) (µµµµg/L) (µµµµg/L) (µµµµg/L)
<0.360 <0.840 <0.20 E0.065 <0.560 <0.392 <0.176 <0.520<0.180 <0.420 E0.04 1.760 <0.280 <0.196 <0.088 <0.260<0.180 <0.420 <0.10 0.858 <0.280 <0.196 <0.088 <0.260<0.180 <0.420 <0.10 0.261 <0.280 <0.196 <0.088 <0.260<0.180 <0.420 <0.10 1.660 <0.280 <0.196 <0.088 <0.260<0.090 <0.210 <0.05 0.301 <0.140 <0.098 <0.044 <0.130<0.090 <0.210 <0.05 0.130 <0.140 <0.098 <0.044 <0.130<0.090 <0.210 <0.05 0.254 <0.140 <0.098 <0.044 <0.130<0.090 <0.210 <0.05 0.503 <0.140 <0.098 <0.044 <0.130<0.090 <0.210 <0.05 <0.048 <0.140 <0.098 <0.044 <0.130<0.090 <0.210 <0.05 0.140 <0.140 <0.098 <0.044 <0.130<0.090 <0.210 <0.05 E0.037 <0.270 <0.100 <0.030 <0.090<0.090 <0.210 <0.05 0.129 <0.270 <0.100 <0.030 <0.090<0.180 <0.420 <0.10 <0.196 <0.280 <0.196 <0.088 <0.260<0.180 <0.420 <0.10 E0.110 <0.280 <0.196 <0.088 <0.260<0.090 <0.210 <0.05 0.102 <0.140 <0.098 <0.044 <0.130<0.180 <0.420 <0.10 E0.130 <0.280 <0.196 <0.088 <0.260<0.090 <0.210 <0.05 0.224 <0.140 <0.098 <0.044 <0.130<0.090 <0.210 <0.05 0.186 <0.140 <0.098 <0.044 <0.130<0.090 <0.210 <0.05 E0.099 <0.140 <0.098 <0.044 <0.130<0.090 <0.210 <0.05 0.216 <0.140 <0.098 <0.044 <0.130<0.090 <0.210 <0.05 0.114 <0.140 <0.098 <0.044 <0.130<0.360 <0.840 <0.20 <0.192 <0.560 <0.392 <0.176 <0.520<0.180 <0.420 <0.10 <0.096 <0.280 <0.196 <0.088 <0.260<0.180 <0.420 <0.10 E0.110 <0.280 <0.196 <0.088 <0.260<0.180 <0.420 <0.10 E0.110 <0.280 <0.196 <0.088 <0.260<0.180 <0.420 <0.10 E0.140 <0.280 <0.196 <0.088 <0.260<0.090 <0.210 <0.05 0.155 <0.140 <0.098 <0.044 <0.130<0.090 <0.210 <0.05 0.142 <0.140 <0.098 <0.044 <0.130<0.090 <0.210 <0.05 0.108 <0.140 <0.098 <0.044 <0.130<0.090 <0.210 <0.05 <0.048 <0.140 <0.098 <0.044 <0.130<0.090 <0.210 <0.05 0.329 <0.140 <0.098 <0.044 <0.130<0.090 <0.210 <0.05 <0.048 <0.270 <0.100 <0.030 <0.090<0.090 <0.210 <0.05 E0.052 <0.270 <0.100 <0.030 <0.090<0.180 <0.420 <0.10 0.096 <0.280 <0.196 <0.088 <0.260
43 Table 3

Table 3. Analytical results for VOCs in the water samples, SWR and Loveland Reservoirs, San Diego County, Calif.—Continued
PCODESite name Date Time
S 9 S 1998 1550SWR near recreation area 10-Sep-1998 1020SWR near recreation area 3-Nov-1998 1205SWR near recreation area 3-Nov-1998 1215SWR near recreation area 6-Jan-1999 1100SWR near recreation area 1-Mar-1999 1220SWR near recreation area 3-May-1999 1310SWR near recreation area 3-May-1999 1320SWR near recreation area 12-Jul-1999 1320SWR near recreation area 12-Jul-1999 1330SWR minimum pool boundary east 10-Sep-1998 1240SWR minimum pool boundary east 10-Sep-1998 1250SWR minimum pool boundary east 3-Nov-1998 1340SWR minimum pool boundary east 6-Jan-1999 1130SWR minimum pool boundary east 2-Mar-1999 840SWR minimum pool boundary east 3-May-1999 1350SWR minimum pool boundary east 3-May-1999 1400SWR minimum pool boundary east 12-Jul-1999 1420SWR east end reservoir fill boundary 10-Sep-1998 1310SWR east end reservoir fill boundary 3-Nov-1998 1400SWR east end reservoir fill boundary 6-Jan-1999 1150SWR east end reservoir fill boundary 1-Mar-1999 1240SWR east end reservoir fill boundary 3-May-1999 1440SWR east end reservoir fill boundary 12-Jul-1999 1440SWR east end reservoir fill boundary 20-Sep-1999 1250SWR near Gum Tree Cove Pond 10-Sep-1998 930SWR near Gum Tree Cove Pond 10-Sep-1998 940SWR near Gum Tree Cove Pond 3-Nov-1998 1430SWR near Gum Tree Cove Pond 6-Jan-1999 1220SWR near Gum Tree Cove Pond 1-Mar-1999 1310SWR near Gum Tree Cove Pond 3-May-1999 1510SWR near Gum Tree Cove Pond 12-Jul-1999 1500Loveland Reservoir near dam site 1 10-Sep-1998 1610Loveland Reservoir near dam site 1 10-Sep-1998 1620Loveland Reservoir near dam site 1 4-Nov-1998 1030Loveland Reservoir near dam site 1 4-Nov-1998 1040Loveland Reservoir near dam site 1 7-Jan-1999 1010Loveland Reservoir near dam site 1 2-Mar-1999 1150
cis-
1,3-
Dic
hlor
opro
pene
1,2-
Dib
rom
o-3-
chlo
ropr
opan
e
Dib
rom
omet
hane
Bro
mod
ichl
orom
etha
ne
Dich
loro
diflu
orom
etha
ne
Diis
opro
pyl e
ther
1,1,
1,2-
Tetr
achl
oroe
than
e
1,1,
2,2,
-Tet
rach
loro
etha
ne
34704 82625 30217 32101 34668 81577 77562 34516(µµµµg/L) (µµµµg/L) (µµµµg/L) (µµµµg/L) (µµµµg/L) (µµµµg/L) (µµµµg/L) (µµµµg/L)
<0.180 <0.420 <0.10 E0.160 <0.280 <0.196 <0.088 <0.260<0.180 <0.420 <0.10 E0.110 <0.280 <0.196 <0.088 <0.260<0.180 <0.420 <0.10 E0.110 <0.280 <0.196 <0.088 <0.260<0.180 <0.420 <0.10 E0.120 <0.280 <0.196 <0.088 <0.260<0.090 <0.210 <0.05 0.180 <0.140 <0.098 <0.044 <0.130<0.090 <0.210 <0.05 0.130 <0.140 <0.098 <0.044 <0.130<0.090 <0.210 <0.05 0.145 <0.140 <0.098 <0.044 <0.130<0.090 <0.210 <0.05 <0.048 <0.140 <0.098 <0.044 <0.130<0.090 <0.210 <0.05 0.186 <0.140 <0.098 <0.044 <0.130<0.360 <0.840 <0.20 <0.192 <0.560 <0.392 <0.176 <0.520<0.180 <0.420 <0.10 E0.150 <0.280 <0.196 <0.088 <0.260<0.090 <0.210 <0.05 0.125 <0.140 <0.098 <0.044 <0.130<0.180 <0.420 <0.10 E0.110 <0.280 <0.196 <0.088 <0.260<0.090 <0.210 <0.05 0.165 <0.140 <0.098 <0.044 <0.130<0.090 <0.210 <0.05 0.191 <0.140 <0.098 <0.044 <0.130<0.090 <0.210 <0.05 E0.082 <0.140 <0.098 <0.044 <0.130<0.090 <0.210 <0.05 0.216 <0.140 <0.098 <0.044 <0.130<0.092 <0.214 <0.05 E0.055 <0.138 <0.098 <0.044 <0.132<0.090 <0.210 <0.05 E0.083 <0.140 <0.098 <0.044 <0.130<0.180 <0.420 <0.10 E0.100 <0.280 <0.196 <0.088 <0.260<0.090 <0.210 <0.05 0.109 <0.140 <0.098 <0.044 <0.130<0.090 <0.210 <0.05 E0.038 <0.140 <0.098 <0.044 <0.130<0.090 <0.210 <0.05 E0.031 <0.140 <0.098 <0.044 <0.130<0.090 <0.210 <0.05 E0.038 <0.270 <0.100 <0.030 <0.090<0.180 <0.420 <0.10 <0.096 <0.280 <0.196 <0.088 <0.260<0.180 <0.420 <0.10 E0.088 <0.280 <0.196 <0.088 <0.260<0.090 <0.210 <0.05 0.110 <0.140 <0.098 <0.044 <0.130<0.180 <0.420 <0.10 E0.100 <0.280 <0.196 <0.088 <0.260<0.090 <0.210 <0.05 0.161 <0.140 <0.098 <0.044 <0.130<0.090 <0.210 <0.05 E0.098 <0.140 <0.098 <0.044 <0.130<0.090 <0.210 <0.05 0.407 <0.140 <0.098 <0.044 <0.130<0.092 <0.214 <0.05 <0.048 <0.138 <0.098 <0.044 <0.132<0.092 <0.214 <0.05 <0.048 <0.138 <0.098 <0.044 <0.132<0.090 <0.210 <0.05 <0.048 <0.140 <0.098 <0.044 <0.130<0.090 <0.210 <0.05 <0.048 <0.140 <0.098 <0.044 <0.130<0.180 <0.420 <0.10 <0.096 <0.280 <0.196 <0.088 <0.260<0.090 <0.210 <0.05 <0.048 <0.140 <0.098 <0.044 <0.130
44 Table 3

Table 3. Analytical results for VOCs in the water samples, SWR and Loveland Reservoirs, San Diego County, Calif.—Continued
PCODESite name Date Time
S 9 S 1998 1550Loveland Reservoir near dam site 1 4-May-1999 1040Loveland Reservoir near dam site 1 4-May-1999 1050Loveland Reservoir near dam site 1 13-Jul-1999 1020Loveland Reservoir near dam site 1 13-Jul-1999 1030Loveland Reservoir near dam site 1 21-Sep-1999 1000Loveland Reservoir near dam site 1 21-Sep-1999 1020Loveland Reservoir east end near source inlet site 2 10-Sep-1998 1650Loveland Reservoir east end near source inlet site 2 10-Sep-1998 1700Loveland Reservoir east end near source inlet site 2 4-Nov-1998 1155Loveland Reservoir east end near source inlet site 2 4-Nov-1998 1205Loveland Reservoir east end near source inlet site 2 7-Jan-1999 1035Loveland Reservoir east end near source inlet site 2 2-Mar-1999 1220Loveland Reservoir east end near source inlet site 2 4-May-1999 1120Loveland Reservoir east end near source inlet site 2 4-May-1999 1130Loveland Reservoir east end near source inlet site 2 13-Jul-1999 1100Sweetwater River at low flow barrier at SWR 6-Jan-1999 1515Sweetwater River at low flow barrier at SWR 7-Jan-1999 1420Sweetwater River at low flow barrier at SWR 2-Mar-1999 1540Sweetwater River at low flow barrier at SWR 3-May-1999 1645Sweetwater River at low flow barrier at SWR 12-Jul-1999 1620Sweetwater River at low flow barrier at SWR 20-Sep-1999 1630Perdue Treatment Plant—finished water at SWR 7-Jan-1999 1350Perdue Treatment Plant—finished water at SWR 2-Mar-1999 1630Perdue Treatment Plant—finished water at SWR 3-May-1999 1607Perdue Treatment Plant—finished water at SWR 12-Jul-1999 1700Perdue Treatment Plant—finished water at SWR 20-Sep-1999 1430Perdue Treatment Plant—imported raw water at SWR 20-Sep-1999 1500
cis-
1,3-
Dic
hlor
opro
pene
1,2-
Dib
rom
o-3-
chlo
ropr
opan
e
Dib
rom
omet
hane
Bro
mod
ichl
orom
etha
ne
Dich
loro
diflu
orom
etha
ne
Diis
opro
pyl e
ther
1,1,
1,2-
Tetr
achl
oroe
than
e
1,1,
2,2,
-Tet
rach
loro
etha
ne
34704 82625 30217 32101 34668 81577 77562 34516(µµµµg/L) (µµµµg/L) (µµµµg/L) (µµµµg/L) (µµµµg/L) (µµµµg/L) (µµµµg/L) (µµµµg/L)
<0.090 <0.210 <0.05 <0.048 <0.140 <0.098 <0.044 <0.130<0.090 <0.210 <0.05 <0.048 <0.140 <0.098 <0.044 <0.130<0.090 <0.210 <0.05 <0.048 <0.140 <0.098 <0.044 <0.130<0.090 <0.210 <0.05 <0.048 <0.140 <0.098 <0.044 <0.130<0.090 <0.210 <0.05 <0.048 <0.270 <0.100 <0.030 <0.090<0.090 <0.210 <0.05 <0.048 <0.270 <0.100 <0.030 <0.090<0.092 <0.214 <0.05 <0.048 <0.138 <0.098 <0.044 <0.132<0.092 <0.214 <0.05 <0.048 <0.138 <0.098 <0.044 <0.132<0.180 <0.420 <0.10 <0.096 <0.280 <0.196 <0.088 <0.260<0.090 <0.210 <0.05 <0.048 <0.140 <0.098 <0.044 <0.130<0.090 <0.210 <0.05 <0.048 <0.140 <0.098 <0.044 <0.130<0.090 <0.210 <0.05 <0.048 <0.140 <0.098 <0.044 <0.130<0.090 <0.210 <0.05 <0.048 <0.140 <0.098 <0.044 <0.130<0.090 <0.210 <0.05 <0.048 <0.140 <0.098 <0.044 <0.130<0.090 <0.210 <0.05 <0.048 <0.140 <0.098 <0.044 <0.130<0.180 <0.420 <0.10 <0.096 <0.280 <0.196 <0.088 <0.260<0.180 <0.420 <0.10 <0.096 <0.280 <0.196 <0.088 <0.260<0.090 <0.210 <0.05 <0.048 <0.026 <0.098 <0.044 <0.130<0.090 <0.210 <0.05 <0.048 <0.140 <0.098 <0.044 <0.130<0.180 <0.420 <0.10 <0.096 <0.280 <0.196 <0.088 <0.260<0.090 <0.210 <0.05 <0.048 E0.065 <0.100 <0.030 <0.090<0.180 <0.420 <0.10 26.590 <0.280 <0.196 <0.088 <0.260<0.090 <0.210 <0.05 32.130 <0.140 <0.098 <0.044 <0.130<0.090 <0.210 <0.05 26.780 <0.140 <0.098 <0.044 <0.130<0.090 <0.210 <0.05 36.860 <0.140 <0.098 <0.044 <0.130<0.090 <0.210 <0.05 4.380 <0.270 <0.100 <0.030 <0.090<0.090 <0.210 <0.05 0.355 <0.270 <0.100 <0.030 <0.090
45 Table 3

Table 3. Analytical results for VOCs in the water samples, SWR and Loveland Reservoirs, San Diego County, Calif.—Continued
PCODESite name Date Time
SWR near pump tower 9-Sep-1998 1550SWR near pump tower 9-Sep-1998 1600SWR near pump tower 3-Nov-1998 1030SWR near pump tower 3-Nov-1998 1040SWR near pump tower 6-Jan-1999 930SWR near pump tower 1-Mar-1999 1030SWR near pump tower 1-Mar-1999 1045SWR near pump tower 3-May-1999 1115SWR near pump tower 3-May-1999 1130SWR near pump tower 12-Jul-1999 1120SWR near pump tower 12-Jul-1999 1130SWR near pump tower 20-Sep-1999 1140SWR near pump tower 20-Sep-1999 1150SWR near Vista del Lago station 10-Sep-1998 845SWR near Vista del Lago station 10-Sep-1998 900SWR near Vista del Lago station 3-Nov-1998 1110SWR near Vista del Lago station 6-Jan-1999 1000SWR near Vista del Lago station 1-Mar-1999 1100SWR near Vista del Lago station 3-May-1999 1150SWR near Vista del Lago station 3-May-1999 1200SWR near Vista del Lago station 12-Jul-1999 1210SWR near Vista del Lago station 12-Jul-1999 1220SWR center of minimum pool 9-Sep-1998 1630SWR center of minimum pool 9-Sep-1998 1640SWR center of minimum pool 3-Nov-1998 1140SWR center of minimum pool 3-Nov-1998 1150SWR center of minimum pool 6-Jan-1999 1030SWR center of minimum pool 1-Mar-1999 1130SWR center of minimum pool 3-May-1999 1235SWR center of minimum pool 3-May-1999 1240SWR center of minimum pool 12-Jul-1999 1240SWR center of minimum pool 12-Jul-1999 1250SWR center of minimum pool 20-Sep-1999 1220SWR center of minimum pool 20-Sep-1999 1230SWR near recreation area 10-Sep-1998 1010
Hexa
chlo
roet
hane
Die
thyl
eth
er
Ethy
l ter
t-b
utyl
eth
er
tert-
Pent
yl m
ethy
l eth
er
Ethy
lben
zene
1,1,
2-Tr
ichl
orot
riflu
oroe
than
e
Tetra
hydr
ofur
an
Hexa
chlo
robu
tadi
ene
34396 81576 50004 50005 34371 77652 81607 39702(µµµµg/L) (µµµµg/L) (µµµµg/L) (µµµµg/L) (µµµµg/L) (µµµµg/L) (µµµµg/L) (µµµµg/L)
<1.440 <0.68 <0.216 <0.440 <0.12 <0.128 <36.00 <0.560<0.720 <0.34 <0.108 <0.220 <0.06 <0.064 <18.00 <0.280<0.720 <0.34 <0.108 <0.220 <0.06 <0.064 <18.00 <0.280<0.720 <0.34 <0.108 <0.220 <0.06 <0.064 <18.00 <0.280<0.720 <0.34 <0.108 <0.220 <0.06 <0.064 <18.00 <0.280<0.360 <0.17 <0.054 <0.110 <0.03 <0.032 <9.00 <0.140<0.360 <0.17 <0.054 <0.110 <0.03 <0.032 <9.00 <0.140<0.360 <0.17 <0.054 <0.110 <0.03 <0.032 <9.00 <0.140<0.360 <0.17 <0.054 <0.110 <0.03 <0.032 <9.00 <0.140<0.360 <0.17 <0.054 <0.110 <0.03 <0.032 <9.00 <0.140<0.360 <0.17 <0.054 <0.110 <0.03 <0.032 <9.00 <0.140<0.190 <0.17 <0.054 <0.110 E0.01 <0.060 <2.20 <0.140<0.190 <0.17 <0.054 <0.110 <0.03 <0.060 <2.20 <0.140<0.720 <0.34 <0.108 <0.220 <0.06 <0.064 <18.00 <0.280<0.720 <0.34 <0.108 <0.220 <0.06 <0.064 <18.00 <0.280<0.360 <0.17 <0.054 <0.110 <0.03 <0.032 <9.00 <0.140<0.720 <0.34 <0.108 <0.220 0.06 <0.064 <18.00 <0.280<0.360 <0.17 <0.054 <0.110 <0.03 <0.032 <9.00 <0.140<0.360 <0.17 <0.054 <0.110 <0.03 <0.032 <9.00 <0.140<0.360 <0.17 <0.054 <0.110 <0.03 <0.032 <9.00 <0.140<0.360 <0.17 <0.054 <0.110 <0.03 <0.032 <9.00 <0.140<0.360 <0.17 <0.054 <0.110 E0.02 <0.032 <9.00 <0.140<1.440 <0.68 <0.216 <0.440 <0.12 <0.128 <36.00 <0.560<0.720 <0.34 <0.108 <0.220 <0.06 <0.064 <18.00 <0.280<0.720 <0.34 <0.108 <0.220 <0.06 <0.064 <18.00 <0.280<0.720 <0.34 <0.108 <0.220 <0.06 <0.064 <18.00 <0.280<0.720 <0.34 <0.108 <0.220 <0.06 <0.064 <18.00 <0.280<0.360 <0.17 <0.054 <0.110 <0.03 <0.032 <9.00 <0.140<0.360 <0.17 <0.054 <0.110 <0.03 <0.032 <9.00 <0.140<0.360 <0.17 <0.054 <0.110 <0.03 <0.032 <9.00 <0.140<0.360 <0.17 <0.054 <0.110 <0.03 <0.032 <9.00 <0.140<0.360 <0.17 <0.054 <0.110 <0.03 <0.032 <9.00 <0.140<0.190 <0.17 <0.054 <0.110 <0.03 <0.060 <2.20 <0.140<0.190 <0.17 <0.054 <0.110 <0.03 <0.060 <2.20 <0.140<0.720 <0.34 <0.108 <0.220 <0.06 <0.064 <18.00 <0.280
46 Table 3
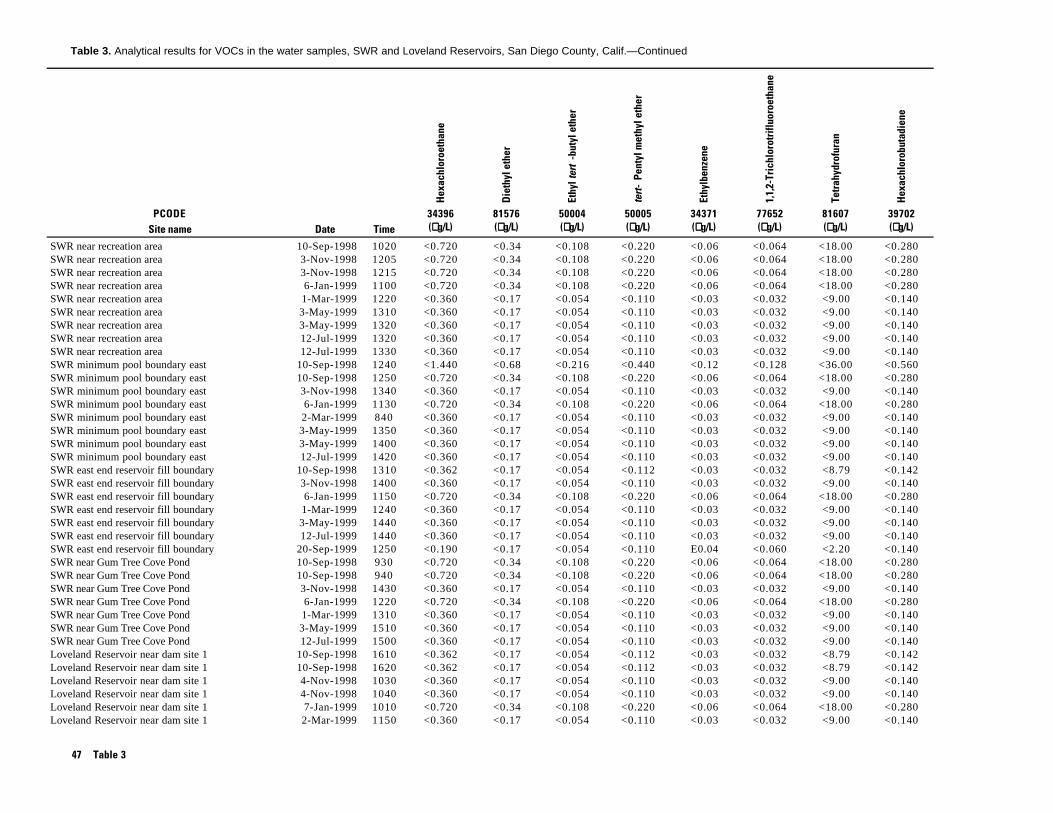
Table 3. Analytical results for VOCs in the water samples, SWR and Loveland Reservoirs, San Diego County, Calif.—Continued
PCODESite name Date Time
S 9 S 1998 1550SWR near recreation area 10-Sep-1998 1020SWR near recreation area 3-Nov-1998 1205SWR near recreation area 3-Nov-1998 1215SWR near recreation area 6-Jan-1999 1100SWR near recreation area 1-Mar-1999 1220SWR near recreation area 3-May-1999 1310SWR near recreation area 3-May-1999 1320SWR near recreation area 12-Jul-1999 1320SWR near recreation area 12-Jul-1999 1330SWR minimum pool boundary east 10-Sep-1998 1240SWR minimum pool boundary east 10-Sep-1998 1250SWR minimum pool boundary east 3-Nov-1998 1340SWR minimum pool boundary east 6-Jan-1999 1130SWR minimum pool boundary east 2-Mar-1999 840SWR minimum pool boundary east 3-May-1999 1350SWR minimum pool boundary east 3-May-1999 1400SWR minimum pool boundary east 12-Jul-1999 1420SWR east end reservoir fill boundary 10-Sep-1998 1310SWR east end reservoir fill boundary 3-Nov-1998 1400SWR east end reservoir fill boundary 6-Jan-1999 1150SWR east end reservoir fill boundary 1-Mar-1999 1240SWR east end reservoir fill boundary 3-May-1999 1440SWR east end reservoir fill boundary 12-Jul-1999 1440SWR east end reservoir fill boundary 20-Sep-1999 1250SWR near Gum Tree Cove Pond 10-Sep-1998 930SWR near Gum Tree Cove Pond 10-Sep-1998 940SWR near Gum Tree Cove Pond 3-Nov-1998 1430SWR near Gum Tree Cove Pond 6-Jan-1999 1220SWR near Gum Tree Cove Pond 1-Mar-1999 1310SWR near Gum Tree Cove Pond 3-May-1999 1510SWR near Gum Tree Cove Pond 12-Jul-1999 1500Loveland Reservoir near dam site 1 10-Sep-1998 1610Loveland Reservoir near dam site 1 10-Sep-1998 1620Loveland Reservoir near dam site 1 4-Nov-1998 1030Loveland Reservoir near dam site 1 4-Nov-1998 1040Loveland Reservoir near dam site 1 7-Jan-1999 1010Loveland Reservoir near dam site 1 2-Mar-1999 1150
Hexa
chlo
roet
hane
Die
thyl
eth
er
Ethy
l ter
t-b
utyl
eth
er
tert-
Pent
yl m
ethy
l eth
er
Ethy
lben
zene
1,1,
2-Tr
ichl
orot
riflu
oroe
than
e
Tetra
hydr
ofur
an
Hexa
chlo
robu
tadi
ene
34396 81576 50004 50005 34371 77652 81607 39702(µµµµg/L) (µµµµg/L) (µµµµg/L) (µµµµg/L) (µµµµg/L) (µµµµg/L) (µµµµg/L) (µµµµg/L)
<0.720 <0.34 <0.108 <0.220 <0.06 <0.064 <18.00 <0.280<0.720 <0.34 <0.108 <0.220 <0.06 <0.064 <18.00 <0.280<0.720 <0.34 <0.108 <0.220 <0.06 <0.064 <18.00 <0.280<0.720 <0.34 <0.108 <0.220 <0.06 <0.064 <18.00 <0.280<0.360 <0.17 <0.054 <0.110 <0.03 <0.032 <9.00 <0.140<0.360 <0.17 <0.054 <0.110 <0.03 <0.032 <9.00 <0.140<0.360 <0.17 <0.054 <0.110 <0.03 <0.032 <9.00 <0.140<0.360 <0.17 <0.054 <0.110 <0.03 <0.032 <9.00 <0.140<0.360 <0.17 <0.054 <0.110 <0.03 <0.032 <9.00 <0.140<1.440 <0.68 <0.216 <0.440 <0.12 <0.128 <36.00 <0.560<0.720 <0.34 <0.108 <0.220 <0.06 <0.064 <18.00 <0.280<0.360 <0.17 <0.054 <0.110 <0.03 <0.032 <9.00 <0.140<0.720 <0.34 <0.108 <0.220 <0.06 <0.064 <18.00 <0.280<0.360 <0.17 <0.054 <0.110 <0.03 <0.032 <9.00 <0.140<0.360 <0.17 <0.054 <0.110 <0.03 <0.032 <9.00 <0.140<0.360 <0.17 <0.054 <0.110 <0.03 <0.032 <9.00 <0.140<0.360 <0.17 <0.054 <0.110 <0.03 <0.032 <9.00 <0.140<0.362 <0.17 <0.054 <0.112 <0.03 <0.032 <8.79 <0.142<0.360 <0.17 <0.054 <0.110 <0.03 <0.032 <9.00 <0.140<0.720 <0.34 <0.108 <0.220 <0.06 <0.064 <18.00 <0.280<0.360 <0.17 <0.054 <0.110 <0.03 <0.032 <9.00 <0.140<0.360 <0.17 <0.054 <0.110 <0.03 <0.032 <9.00 <0.140<0.360 <0.17 <0.054 <0.110 <0.03 <0.032 <9.00 <0.140<0.190 <0.17 <0.054 <0.110 E0.04 <0.060 <2.20 <0.140<0.720 <0.34 <0.108 <0.220 <0.06 <0.064 <18.00 <0.280<0.720 <0.34 <0.108 <0.220 <0.06 <0.064 <18.00 <0.280<0.360 <0.17 <0.054 <0.110 <0.03 <0.032 <9.00 <0.140<0.720 <0.34 <0.108 <0.220 <0.06 <0.064 <18.00 <0.280<0.360 <0.17 <0.054 <0.110 <0.03 <0.032 <9.00 <0.140<0.360 <0.17 <0.054 <0.110 <0.03 <0.032 <9.00 <0.140<0.360 <0.17 <0.054 <0.110 <0.03 <0.032 <9.00 <0.140<0.362 <0.17 <0.054 <0.112 <0.03 <0.032 <8.79 <0.142<0.362 <0.17 <0.054 <0.112 <0.03 <0.032 <8.79 <0.142<0.360 <0.17 <0.054 <0.110 <0.03 <0.032 <9.00 <0.140<0.360 <0.17 <0.054 <0.110 <0.03 <0.032 <9.00 <0.140<0.720 <0.34 <0.108 <0.220 <0.06 <0.064 <18.00 <0.280<0.360 <0.17 <0.054 <0.110 <0.03 <0.032 <9.00 <0.140
47 Table 3

Table 3. Analytical results for VOCs in the water samples, SWR and Loveland Reservoirs, San Diego County, Calif.—Continued
PCODESite name Date Time
S 9 S 1998 1550Loveland Reservoir near dam site 1 4-May-1999 1040Loveland Reservoir near dam site 1 4-May-1999 1050Loveland Reservoir near dam site 1 13-Jul-1999 1020Loveland Reservoir near dam site 1 13-Jul-1999 1030Loveland Reservoir near dam site 1 21-Sep-1999 1000Loveland Reservoir near dam site 1 21-Sep-1999 1020Loveland Reservoir east end near source inlet site 2 10-Sep-1998 1650Loveland Reservoir east end near source inlet site 2 10-Sep-1998 1700Loveland Reservoir east end near source inlet site 2 4-Nov-1998 1155Loveland Reservoir east end near source inlet site 2 4-Nov-1998 1205Loveland Reservoir east end near source inlet site 2 7-Jan-1999 1035Loveland Reservoir east end near source inlet site 2 2-Mar-1999 1220Loveland Reservoir east end near source inlet site 2 4-May-1999 1120Loveland Reservoir east end near source inlet site 2 4-May-1999 1130Loveland Reservoir east end near source inlet site 2 13-Jul-1999 1100Sweetwater River at low flow barrier at SWR 6-Jan-1999 1515Sweetwater River at low flow barrier at SWR 7-Jan-1999 1420Sweetwater River at low flow barrier at SWR 2-Mar-1999 1540Sweetwater River at low flow barrier at SWR 3-May-1999 1645Sweetwater River at low flow barrier at SWR 12-Jul-1999 1620Sweetwater River at low flow barrier at SWR 20-Sep-1999 1630Perdue Treatment Plant—finished water at SWR 7-Jan-1999 1350Perdue Treatment Plant—finished water at SWR 2-Mar-1999 1630Perdue Treatment Plant—finished water at SWR 3-May-1999 1607Perdue Treatment Plant—finished water at SWR 12-Jul-1999 1700Perdue Treatment Plant—finished water at SWR 20-Sep-1999 1430Perdue Treatment Plant—imported raw water at SWR 20-Sep-1999 1500
Hexa
chlo
roet
hane
Die
thyl
eth
er
Ethy
l ter
t-b
utyl
eth
er
tert-
Pent
yl m
ethy
l eth
er
Ethy
lben
zene
1,1,
2-Tr
ichl
orot
riflu
oroe
than
e
Tetra
hydr
ofur
an
Hexa
chlo
robu
tadi
ene
34396 81576 50004 50005 34371 77652 81607 39702(µµµµg/L) (µµµµg/L) (µµµµg/L) (µµµµg/L) (µµµµg/L) (µµµµg/L) (µµµµg/L) (µµµµg/L)
<0.360 <0.17 <0.054 <0.110 <0.03 <0.032 <9.00 <0.140<0.360 <0.17 <0.054 <0.110 <0.03 <0.032 <9.00 <0.140<0.360 <0.17 <0.054 <0.110 <0.03 <0.032 <9.00 <0.140<0.360 <0.17 <0.054 <0.110 E0.01 <0.032 <9.00 <0.140<0.190 <0.17 <0.054 <0.110 <0.03 <0.060 <2.20 <0.140<0.190 <0.17 <0.054 <0.110 <0.03 <0.060 <2.20 <0.140<0.362 <0.17 <0.054 <0.112 <0.03 <0.032 <8.79 <0.142<0.362 <0.17 <0.054 <0.112 <0.03 <0.032 <8.79 <0.142<0.720 <0.34 <0.108 <0.220 <0.06 <0.064 <18.00 <0.280<0.360 <0.17 <0.054 <0.110 <0.03 <0.032 <9.00 <0.140<0.360 <0.17 <0.054 <0.110 <0.03 <0.032 <9.00 <0.140<0.360 <0.17 <0.054 <0.110 <0.03 <0.032 <9.00 <0.140<0.360 <0.17 <0.054 <0.110 <0.03 <0.032 <9.00 <0.140<0.360 <0.17 <0.054 <0.110 <0.03 <0.032 <9.00 <0.140<0.360 <0.17 <0.054 <0.110 <0.03 <0.032 <9.00 <0.140<0.720 <0.34 <0.108 <0.220 <0.06 <0.064 <18.00 <0.280<0.720 <0.34 <0.108 <0.220 <0.06 <0.064 <18.00 <0.280<0.360 <0.17 <0.054 <0.110 <0.03 <0.032 <9.00 <0.140<0.360 <0.17 <0.054 <0.110 <0.03 <0.032 <9.00 <0.140<0.720 <0.34 <0.108 <0.220 <0.06 <0.064 <18.00 <0.280<0.190 <0.17 <0.054 <0.110 <0.03 <0.060 <2.20 <0.140<0.720 <0.34 <0.108 <0.220 <0.06 <0.064 <18.00 <0.280E0.006 <0.17 <0.054 <0.110 <0.03 <0.032 <9.00 <0.140<0.360 <0.17 <0.054 <0.110 <0.03 <0.032 <9.00 <0.140<0.360 <0.17 <0.054 <0.110 <0.03 <0.032 <9.00 <0.140<0.190 <0.17 <0.054 <0.110 <0.03 <0.060 <2.20 <0.140<0.190 <0.17 <0.054 <0.110 <0.03 <0.060 <2.20 <0.140
48 Table 3

Table 3. Analytical results for VOCs in the water samples, SWR and Loveland Reservoirs, San Diego County, Calif.—Continued
PCODESite name Date Time
SWR near pump tower 9-Sep-1998 1550SWR near pump tower 9-Sep-1998 1600SWR near pump tower 3-Nov-1998 1030SWR near pump tower 3-Nov-1998 1040SWR near pump tower 6-Jan-1999 930SWR near pump tower 1-Mar-1999 1030SWR near pump tower 1-Mar-1999 1045SWR near pump tower 3-May-1999 1115SWR near pump tower 3-May-1999 1130SWR near pump tower 12-Jul-1999 1120SWR near pump tower 12-Jul-1999 1130SWR near pump tower 20-Sep-1999 1140SWR near pump tower 20-Sep-1999 1150SWR near Vista del Lago station 10-Sep-1998 845SWR near Vista del Lago station 10-Sep-1998 900SWR near Vista del Lago station 3-Nov-1998 1110SWR near Vista del Lago station 6-Jan-1999 1000SWR near Vista del Lago station 1-Mar-1999 1100SWR near Vista del Lago station 3-May-1999 1150SWR near Vista del Lago station 3-May-1999 1200SWR near Vista del Lago station 12-Jul-1999 1210SWR near Vista del Lago station 12-Jul-1999 1220SWR center of minimum pool 9-Sep-1998 1630SWR center of minimum pool 9-Sep-1998 1640SWR center of minimum pool 3-Nov-1998 1140SWR center of minimum pool 3-Nov-1998 1150SWR center of minimum pool 6-Jan-1999 1030SWR center of minimum pool 1-Mar-1999 1130SWR center of minimum pool 3-May-1999 1235SWR center of minimum pool 3-May-1999 1240SWR center of minimum pool 12-Jul-1999 1240SWR center of minimum pool 12-Jul-1999 1250SWR center of minimum pool 20-Sep-1999 1220SWR center of minimum pool 20-Sep-1999 1230SWR near recreation area 10-Sep-1998 1010
1,2,
3,5-
Tetr
amet
hylb
enze
ne
Ethy
l met
hacr
ylat
e
Met
hyl m
etha
cryl
ate
Ethy
l acr
ylon
itrile
Bro
moc
hlor
omet
hane
Met
hyl a
cryl
ate
Met
hyl i
odid
e
tert-
But
yl m
ethy
l eth
er
50000 73570 81597 81593 77297 49991 77424 78032(µµµµg/L) (µµµµg/L) (µµµµg/L) (µµµµg/L) (µµµµg/L) (µµµµg/L) (µµµµg/L) (µµµµg/L)
<0.80 <1.120 <1.40 <2.28 <0.176 <5.600 <0.840 <0.680<0.40 <0.560 <0.70 <1.14 E0.160 <2.800 <0.420 <0.340<0.40 <0.560 <0.70 <1.14 <0.088 <2.800 <0.420 <0.340<0.40 <0.560 <0.70 <1.14 <0.088 <2.800 <0.420 <0.340<0.40 <0.560 <0.70 <1.14 <0.088 <2.800 <0.420 E0.250<0.20 <0.280 <0.35 <0.57 E0.013 <1.400 <0.210 0.209<0.20 <0.280 <0.35 <0.57 <0.044 <1.400 <0.210 0.253<0.20 <0.280 <0.35 <0.57 <0.044 <1.400 <0.210 E0.112<0.20 <0.280 <0.35 <0.57 <0.044 <1.400 <0.210 E0.053<0.20 <0.280 <0.35 <0.57 E0.012 <1.400 <0.210 E0.100<0.20 <0.280 <0.35 <0.57 <0.044 <1.400 <0.210 E0.107<0.20 <0.180 <0.35 <0.60 <0.044 <1.400 <0.120 E0.107<0.20 <0.180 <0.35 <0.60 <0.044 <1.400 <0.120 E0.110<0.40 <0.560 <0.70 <1.14 <0.088 <2.800 <0.420 <0.340<0.40 <0.560 <0.70 <1.14 <0.088 <2.800 <0.420 <0.340<0.20 <0.280 <0.35 <0.57 <0.044 <1.400 <0.210 E0.110<0.40 <0.560 <0.70 <1.14 <0.088 <2.800 <0.420 E0.230<0.20 <0.280 <0.35 <0.57 <0.044 <1.400 <0.210 0.225<0.20 <0.280 <0.35 <0.57 <0.044 <1.400 <0.210 E0.105<0.20 <0.280 <0.35 <0.57 <0.044 <1.400 <0.210 E0.063<0.20 <0.280 <0.35 <0.57 E0.049 <1.400 <0.210 E0.077<0.20 <0.280 <0.35 <0.57 <0.044 <1.400 <0.210 0.277<0.80 <1.120 <1.40 <2.28 <0.176 <5.600 <0.840 <0.680<0.40 <0.560 <0.70 <1.14 E0.092 <2.800 <0.420 <0.340<0.40 <0.560 <0.70 <1.14 <0.088 <2.800 <0.420 <0.340<0.40 <0.560 <0.70 <1.14 <0.088 <2.800 <0.420 <0.340<0.40 <0.560 <0.70 <1.14 <0.088 <2.800 <0.420 E0.230<0.20 <0.280 <0.35 <0.57 <0.044 <1.400 <0.210 0.212<0.20 <0.280 <0.35 <0.57 <0.044 <1.400 <0.210 <0.170<0.20 <0.280 <0.35 <0.57 <0.044 <1.400 <0.210 E0.074<0.20 <0.280 <0.35 <0.57 <0.044 <1.400 <0.210 E0.098<0.20 <0.280 <0.35 <0.57 E0.029 <1.400 <0.210 E0.080<0.20 <0.180 <0.35 <0.60 <0.044 <1.400 <0.120 E0.080<0.20 <0.180 <0.35 <0.60 <0.044 <1.400 <0.120 E0.101<0.40 <0.560 <0.70 <1.14 <0.088 <2.800 <0.420 <0.340
49 Table 3

Table 3. Analytical results for VOCs in the water samples, SWR and Loveland Reservoirs, San Diego County, Calif.—Continued
PCODESite name Date Time
S 9 S 1998 1550SWR near recreation area 10-Sep-1998 1020SWR near recreation area 3-Nov-1998 1205SWR near recreation area 3-Nov-1998 1215SWR near recreation area 6-Jan-1999 1100SWR near recreation area 1-Mar-1999 1220SWR near recreation area 3-May-1999 1310SWR near recreation area 3-May-1999 1320SWR near recreation area 12-Jul-1999 1320SWR near recreation area 12-Jul-1999 1330SWR minimum pool boundary east 10-Sep-1998 1240SWR minimum pool boundary east 10-Sep-1998 1250SWR minimum pool boundary east 3-Nov-1998 1340SWR minimum pool boundary east 6-Jan-1999 1130SWR minimum pool boundary east 2-Mar-1999 840SWR minimum pool boundary east 3-May-1999 1350SWR minimum pool boundary east 3-May-1999 1400SWR minimum pool boundary east 12-Jul-1999 1420SWR east end reservoir fill boundary 10-Sep-1998 1310SWR east end reservoir fill boundary 3-Nov-1998 1400SWR east end reservoir fill boundary 6-Jan-1999 1150SWR east end reservoir fill boundary 1-Mar-1999 1240SWR east end reservoir fill boundary 3-May-1999 1440SWR east end reservoir fill boundary 12-Jul-1999 1440SWR east end reservoir fill boundary 20-Sep-1999 1250SWR near Gum Tree Cove Pond 10-Sep-1998 930SWR near Gum Tree Cove Pond 10-Sep-1998 940SWR near Gum Tree Cove Pond 3-Nov-1998 1430SWR near Gum Tree Cove Pond 6-Jan-1999 1220SWR near Gum Tree Cove Pond 1-Mar-1999 1310SWR near Gum Tree Cove Pond 3-May-1999 1510SWR near Gum Tree Cove Pond 12-Jul-1999 1500Loveland Reservoir near dam site 1 10-Sep-1998 1610Loveland Reservoir near dam site 1 10-Sep-1998 1620Loveland Reservoir near dam site 1 4-Nov-1998 1030Loveland Reservoir near dam site 1 4-Nov-1998 1040Loveland Reservoir near dam site 1 7-Jan-1999 1010Loveland Reservoir near dam site 1 2-Mar-1999 1150
1,2,
3,5-
Tetr
amet
hylb
enze
ne
Ethy
l met
hacr
ylat
e
Met
hyl m
etha
cryl
ate
Ethy
l acr
ylon
itrile
Bro
moc
hlor
omet
hane
Met
hyl a
cryl
ate
Met
hyl i
odid
e
tert-
But
yl m
ethy
l eth
er
50000 73570 81597 81593 77297 49991 77424 78032(µµµµg/L) (µµµµg/L) (µµµµg/L) (µµµµg/L) (µµµµg/L) (µµµµg/L) (µµµµg/L) (µµµµg/L)
<0.40 <0.560 <0.70 <1.14 E0.020 <2.800 <0.420 <0.340<0.40 <0.560 <0.70 <1.14 <0.088 <2.800 <0.420 <0.340<0.40 <0.560 <0.70 <1.14 <0.088 <2.800 <0.420 <0.340<0.40 <0.560 <0.70 <1.14 <0.088 <2.800 <0.420 E0.220<0.20 <0.280 <0.35 <0.57 <0.044 <1.400 <0.210 0.217<0.20 <0.280 <0.35 <0.57 <0.044 <1.400 <0.210 E0.108<0.20 <0.280 <0.35 <0.57 <0.044 <1.400 <0.210 <0.170<0.20 <0.280 <0.35 <0.57 <0.044 <1.400 <0.210 E0.098<0.20 <0.280 <0.35 <0.57 <0.044 <1.400 <0.210 E0.085<0.80 <1.120 <1.40 <2.28 <0.176 <5.600 <0.840 <0.680<0.40 <0.560 <0.70 <1.14 E0.044 <2.800 <0.420 0.340<0.20 <0.280 <0.35 <0.57 <0.044 <1.400 <0.210 E0.120<0.40 <0.560 <0.70 <1.14 <0.088 <2.800 <0.420 E0.250<0.20 <0.280 <0.35 <0.57 <0.044 <1.400 <0.210 0.213<0.20 <0.280 <0.35 <0.57 <0.044 <1.400 <0.210 E0.092<0.20 <0.280 <0.35 <0.57 <0.044 <1.400 <0.210 E0.066<0.20 <0.280 <0.35 <0.57 E0.034 <1.400 <0.210 E0.078<0.24 <0.278 <0.35 <0.57 <0.044 <1.357 <0.208 <0.166<0.20 <0.280 <0.35 <0.57 <0.044 <1.400 <0.210 <0.170<0.40 <0.560 <0.70 <1.14 <0.088 <2.800 <0.420 E0.310<0.20 <0.280 <0.35 <0.57 <0.044 <1.400 <0.210 0.219<0.20 <0.280 <0.35 <0.57 <0.044 <1.400 <0.210 E0.050<0.20 <0.280 <0.35 <0.57 <0.044 <1.400 <0.210 E0.100E0.02 <0.180 <0.35 <0.60 <0.044 <1.400 <0.120 0.897<0.40 <0.560 <0.70 <1.14 <0.088 <2.800 <0.420 <0.340<0.40 <0.560 <0.70 <1.14 <0.088 <2.800 <0.420 <0.340<0.20 <0.280 <0.35 <0.57 <0.044 <1.400 <0.210 E0.110<0.40 <0.560 <0.70 <1.14 <0.088 <2.800 <0.420 E0.250<0.20 <0.280 <0.35 <0.57 <0.044 <1.400 <0.210 0.222<0.20 <0.280 <0.35 <0.57 <0.044 <1.400 <0.210 <0.170<0.20 <0.280 <0.35 <0.57 E0.011 <1.400 <0.210 E0.082<0.24 <0.278 <0.35 <0.57 <0.044 <1.357 <0.208 <0.166<0.24 <0.278 <0.35 <0.57 <0.044 <1.357 <0.208 0.114<0.20 <0.280 <0.35 <0.57 <0.044 <1.400 <0.208 <0.170<0.20 <0.280 <0.35 <0.57 <0.044 <1.400 <0.210 E0.120<0.40 <0.560 <0.70 <1.14 <0.088 <2.800 <0.420 <0.340<0.20 <0.280 <0.35 <0.57 <0.044 <1.400 <0.210 E0.096
50 Table 3

Table 3. Analytical results for VOCs in the water samples, SWR and Loveland Reservoirs, San Diego County, Calif.—Continued
PCODESite name Date Time
S 9 S 1998 1550Loveland Reservoir near dam site 1 4-May-1999 1040Loveland Reservoir near dam site 1 4-May-1999 1050Loveland Reservoir near dam site 1 13-Jul-1999 1020Loveland Reservoir near dam site 1 13-Jul-1999 1030Loveland Reservoir near dam site 1 21-Sep-1999 1000Loveland Reservoir near dam site 1 21-Sep-1999 1020Loveland Reservoir east end near source inlet site 2 10-Sep-1998 1650Loveland Reservoir east end near source inlet site 2 10-Sep-1998 1700Loveland Reservoir east end near source inlet site 2 4-Nov-1998 1155Loveland Reservoir east end near source inlet site 2 4-Nov-1998 1205Loveland Reservoir east end near source inlet site 2 7-Jan-1999 1035Loveland Reservoir east end near source inlet site 2 2-Mar-1999 1220Loveland Reservoir east end near source inlet site 2 4-May-1999 1120Loveland Reservoir east end near source inlet site 2 4-May-1999 1130Loveland Reservoir east end near source inlet site 2 13-Jul-1999 1100Sweetwater River at low flow barrier at SWR 6-Jan-1999 1515Sweetwater River at low flow barrier at SWR 7-Jan-1999 1420Sweetwater River at low flow barrier at SWR 2-Mar-1999 1540Sweetwater River at low flow barrier at SWR 3-May-1999 1645Sweetwater River at low flow barrier at SWR 12-Jul-1999 1620Sweetwater River at low flow barrier at SWR 20-Sep-1999 1630Perdue Treatment Plant—finished water at SWR 7-Jan-1999 1350Perdue Treatment Plant—finished water at SWR 2-Mar-1999 1630Perdue Treatment Plant—finished water at SWR 3-May-1999 1607Perdue Treatment Plant—finished water at SWR 12-Jul-1999 1700Perdue Treatment Plant—finished water at SWR 20-Sep-1999 1430Perdue Treatment Plant—imported raw water at SWR 20-Sep-1999 1500
1,2,
3,5-
Tetr
amet
hylb
enze
ne
Ethy
l met
hacr
ylat
e
Met
hyl m
etha
cryl
ate
Ethy
l acr
ylon
itrile
Bro
moc
hlor
omet
hane
Met
hyl a
cryl
ate
Met
hyl i
odid
e
tert-
But
yl m
ethy
l eth
er
50000 73570 81597 81593 77297 49991 77424 78032(µµµµg/L) (µµµµg/L) (µµµµg/L) (µµµµg/L) (µµµµg/L) (µµµµg/L) (µµµµg/L) (µµµµg/L)
<0.20 <0.280 <0.35 <0.57 <0.044 <1.400 <0.210 <0.170<0.20 <0.280 <0.35 <0.57 <0.044 <1.400 <0.210 E0.115<0.20 <0.280 <0.35 <0.57 <0.044 <1.400 <0.210 E0.043<0.20 <0.280 <0.35 <0.57 <0.044 <1.400 <0.210 0.226<0.20 <0.180 <0.35 <0.60 <0.044 <1.400 <0.120 E0.045<0.20 <0.180 <0.35 <0.60 <0.044 <1.400 <0.120 0.181<0.24 <0.278 <0.35 <0.57 <0.044 <1.357 <0.208 <0.166<0.24 <0.278 <0.35 <0.57 <0.044 <1.357 <0.208 0.145<0.40 <0.560 <0.70 <1.14 <0.088 <2.800 <0.420 <0.340<0.20 <0.280 <0.35 <0.57 <0.044 <1.400 <0.210 <0.170<0.20 <0.280 <0.35 <0.57 <0.044 <1.400 <0.210 <0.170<0.20 <0.280 <0.35 <0.57 <0.044 <1.400 <0.210 E0.166<0.20 <0.280 <0.35 <0.57 <0.044 <1.400 <0.210 E0.100<0.20 <0.280 <0.35 <0.57 <0.044 <1.400 <0.210 0.180<0.20 <0.280 <0.35 <0.57 <0.044 <1.400 <0.210 0.194<0.40 <0.560 <0.70 <1.14 <0.088 <2.800 <0.420 E0.360<0.40 <0.560 <0.70 <1.14 <0.088 <2.800 <0.420 E0.360<0.20 <0.280 <0.35 <0.57 <0.044 <1.400 <0.210 0.315<0.20 <0.280 <0.35 <0.57 <0.044 <1.400 <0.210 E0.056<0.40 <0.560 <0.70 <1.14 <0.088 <2.800 <0.420 E0.155<0.20 <0.180 <0.35 <0.60 <0.044 <1.400 <0.120 E0.146<0.40 <0.560 <0.70 <1.14 <0.088 <2.800 <0.420 E0.240<0.20 <0.280 <0.35 <0.57 <0.044 <1.400 <0.210 E0.166<0.20 <0.280 <0.35 <0.57 <0.044 <1.400 <0.210 E0.048<0.20 <0.280 <0.35 <0.57 <0.044 <1.400 <0.210 E0.073<0.20 <0.180 <0.35 <0.60 <0.044 <1.400 <0.120 0.724<0.20 <0.180 <0.35 <0.60 <0.044 <1.400 <0.120 1.132
51 Table 3

Table 3. Analytical results for VOCs in the water samples, SWR and Loveland Reservoirs, San Diego County, Calif.—Continued
PCODESite name Date Time
SWR near pump tower 9-Sep-1998 1550SWR near pump tower 9-Sep-1998 1600SWR near pump tower 3-Nov-1998 1030SWR near pump tower 3-Nov-1998 1040SWR near pump tower 6-Jan-1999 930SWR near pump tower 1-Mar-1999 1030SWR near pump tower 1-Mar-1999 1045SWR near pump tower 3-May-1999 1115SWR near pump tower 3-May-1999 1130SWR near pump tower 12-Jul-1999 1120SWR near pump tower 12-Jul-1999 1130SWR near pump tower 20-Sep-1999 1140SWR near pump tower 20-Sep-1999 1150SWR near Vista del Lago station 10-Sep-1998 845SWR near Vista del Lago station 10-Sep-1998 900SWR near Vista del Lago station 3-Nov-1998 1110SWR near Vista del Lago station 6-Jan-1999 1000SWR near Vista del Lago station 1-Mar-1999 1100SWR near Vista del Lago station 3-May-1999 1150SWR near Vista del Lago station 3-May-1999 1200SWR near Vista del Lago station 12-Jul-1999 1210SWR near Vista del Lago station 12-Jul-1999 1220SWR center of minimum pool 9-Sep-1998 1630SWR center of minimum pool 9-Sep-1998 1640SWR center of minimum pool 3-Nov-1998 1140SWR center of minimum pool 3-Nov-1998 1150SWR center of minimum pool 6-Jan-1999 1030SWR center of minimum pool 1-Mar-1999 1130SWR center of minimum pool 3-May-1999 1235SWR center of minimum pool 3-May-1999 1240SWR center of minimum pool 12-Jul-1999 1240SWR center of minimum pool 12-Jul-1999 1250SWR center of minimum pool 20-Sep-1999 1220SWR center of minimum pool 20-Sep-1999 1230SWR near recreation area 10-Sep-1998 1010
Bro
mom
etha
ne
Chlo
rom
etha
ne
Dic
hlor
omet
hane
2-B
utan
one
4-M
ethy
l-2-
pent
anon
e
m-
and
p-Xy
lene
Nap
htha
lene
2-Ch
loro
tolu
ene
34413 34418 34423 81595 78133 85795 34696 77275(µµµµg/L) (µµµµg/L) (µµµµg/L) (µµµµg/L) (µµµµg/L) (µµµµg/L) (µµµµg/L) (µµµµg/L)
<0.600 <1.000 <1.520 <6.40 <1.480 <0.240 <1.00 <0.168<0.300 <0.500 <0.760 <3.20 <0.740 <0.120 <0.50 <0.084<0.300 <0.500 <0.760 <3.20 <0.740 <0.120 <0.50 <0.084<0.300 <0.500 <0.760 <3.20 <0.740 <0.120 <0.50 <0.084<0.300 <0.500 <0.760 <3.20 <0.740 <0.120 <0.50 <0.084<0.150 <0.250 <0.380 <1.60 <0.370 <0.060 <0.25 <0.042<0.150 <0.250 <0.380 <1.60 <0.370 E0.015 <0.25 <0.042<0.150 E0.051 <0.380 <1.60 <0.370 <0.060 <0.25 <0.042<0.150 <0.250 <0.380 <1.60 <0.370 <0.060 <0.25 <0.042<0.150 E0.028 E0.035 <1.60 <0.370 <0.060 <0.25 <0.042<0.150 <0.250 <0.380 <1.60 <0.370 E0.014 <0.25 <0.042<0.260 <0.500 E0.018 <1.60 <0.370 <0.060 <0.25 <0.042<0.260 <0.500 <0.380 <1.60 <0.370 <0.060 <0.25 <0.042<0.300 <0.500 <0.760 <3.20 <0.740 <0.120 <0.50 <0.084<0.300 <0.500 <0.760 <3.20 <0.740 <0.120 <0.50 <0.084<0.150 <0.250 <0.380 <1.60 <0.370 <0.060 <0.25 <0.042<0.300 <0.500 <0.760 <3.20 <0.740 <0.120 <0.50 <0.084<0.150 <0.250 <0.380 <1.60 <0.370 <0.060 <0.25 <0.042<0.150 E0.045 E0.015 <1.60 <0.370 <0.060 <0.25 <0.042<0.150 <0.250 <0.380 <1.60 <0.370 <0.060 <0.25 <0.042<0.150 <0.250 E0.052 <1.60 <0.370 <0.060 <0.25 <0.042<0.150 <0.250 <0.380 <1.60 <0.370 E0.074 <0.25 <0.042<0.600 <1.000 <1.520 <6.40 <1.480 <0.240 <1.00 <0.168<0.300 <0.500 <0.760 <3.20 <0.740 <0.120 <0.50 <0.084<0.300 <0.500 <0.760 <3.20 <0.740 <0.120 <0.50 <0.084<0.300 <0.500 <0.760 <3.20 <0.740 <0.120 <0.50 <0.084<0.300 <0.500 <0.760 <3.20 <0.740 <0.120 <0.50 <0.084<0.150 <0.250 <0.380 <1.60 <0.370 <0.060 <0.25 <0.042<0.150 <0.250 <0.380 <1.60 <0.370 <0.060 <0.25 <0.042<0.150 E0.054 <0.380 <1.60 <0.370 <0.060 <0.25 <0.042<0.150 <0.250 <0.380 <1.60 <0.370 <0.060 <0.25 <0.042<0.150 E0.038 E0.037 <1.60 <0.370 <0.060 <0.25 <0.042<0.260 <0.500 E0.027 <1.60 <0.370 <0.060 <0.25 <0.042<0.260 <0.500 <0.380 <1.60 <0.370 <0.060 <0.25 <0.042<0.300 <0.500 <0.760 <3.20 <0.740 <0.120 <0.50 <0.084
52 Table 3

Table 3. Analytical results for VOCs in the water samples, SWR and Loveland Reservoirs, San Diego County, Calif.—Continued
PCODESite name Date Time
S 9 S 1998 1550SWR near recreation area 10-Sep-1998 1020SWR near recreation area 3-Nov-1998 1205SWR near recreation area 3-Nov-1998 1215SWR near recreation area 6-Jan-1999 1100SWR near recreation area 1-Mar-1999 1220SWR near recreation area 3-May-1999 1310SWR near recreation area 3-May-1999 1320SWR near recreation area 12-Jul-1999 1320SWR near recreation area 12-Jul-1999 1330SWR minimum pool boundary east 10-Sep-1998 1240SWR minimum pool boundary east 10-Sep-1998 1250SWR minimum pool boundary east 3-Nov-1998 1340SWR minimum pool boundary east 6-Jan-1999 1130SWR minimum pool boundary east 2-Mar-1999 840SWR minimum pool boundary east 3-May-1999 1350SWR minimum pool boundary east 3-May-1999 1400SWR minimum pool boundary east 12-Jul-1999 1420SWR east end reservoir fill boundary 10-Sep-1998 1310SWR east end reservoir fill boundary 3-Nov-1998 1400SWR east end reservoir fill boundary 6-Jan-1999 1150SWR east end reservoir fill boundary 1-Mar-1999 1240SWR east end reservoir fill boundary 3-May-1999 1440SWR east end reservoir fill boundary 12-Jul-1999 1440SWR east end reservoir fill boundary 20-Sep-1999 1250SWR near Gum Tree Cove Pond 10-Sep-1998 930SWR near Gum Tree Cove Pond 10-Sep-1998 940SWR near Gum Tree Cove Pond 3-Nov-1998 1430SWR near Gum Tree Cove Pond 6-Jan-1999 1220SWR near Gum Tree Cove Pond 1-Mar-1999 1310SWR near Gum Tree Cove Pond 3-May-1999 1510SWR near Gum Tree Cove Pond 12-Jul-1999 1500Loveland Reservoir near dam site 1 10-Sep-1998 1610Loveland Reservoir near dam site 1 10-Sep-1998 1620Loveland Reservoir near dam site 1 4-Nov-1998 1030Loveland Reservoir near dam site 1 4-Nov-1998 1040Loveland Reservoir near dam site 1 7-Jan-1999 1010Loveland Reservoir near dam site 1 2-Mar-1999 1150
Bro
mom
etha
ne
Chlo
rom
etha
ne
Dic
hlor
omet
hane
2-B
utan
one
4-M
ethy
l-2-
pent
anon
e
m-
and
p-Xy
lene
Nap
htha
lene
2-Ch
loro
tolu
ene
34413 34418 34423 81595 78133 85795 34696 77275(µµµµg/L) (µµµµg/L) (µµµµg/L) (µµµµg/L) (µµµµg/L) (µµµµg/L) (µµµµg/L) (µµµµg/L)
<0.300 <0.500 <0.760 <3.20 <0.740 <0.120 <0.50 <0.084<0.300 <0.500 <0.760 <3.20 <0.740 <0.120 <0.50 <0.084<0.300 <0.500 <0.760 <3.20 <0.740 <0.120 <0.50 <0.084<0.300 <0.500 <0.760 <3.20 <0.740 <0.120 <0.50 <0.084<0.150 <0.250 <0.380 <1.60 <0.370 <0.060 <0.25 <0.042<0.150 <0.250 <0.380 <1.60 <0.370 <0.060 <0.25 <0.042<0.150 <0.250 <0.380 <1.60 <0.370 <0.060 <0.25 <0.042<0.150 <0.250 <0.380 <1.60 <0.370 <0.060 <0.25 <0.042<0.150 <0.250 <0.380 <1.60 <0.370 E0.008 <0.25 <0.042<0.600 <1.000 <1.520 <6.40 <1.480 <0.240 <1.00 <0.168<0.300 <0.500 <0.760 <3.20 <0.740 <0.120 <0.50 <0.084<0.150 <0.250 <0.380 <1.60 <0.370 <0.060 <0.25 <0.042<0.300 <0.500 <0.760 <3.20 <0.740 <0.120 <0.50 <0.084<0.150 <0.250 <0.380 <1.60 <0.370 <0.060 <0.25 <0.042<0.150 <0.250 <0.380 <1.60 <0.370 <0.060 <0.25 <0.042<0.150 E0.053 <0.380 <1.60 <0.370 <0.060 <0.25 <0.042<0.150 <0.250 E0.049 <1.60 <0.370 <0.060 <0.25 <0.042<0.148 <0.254 <0.382 <1.65 <0.374 <0.064 <0.25 <0.042<0.150 <0.250 <0.380 <1.60 <0.370 <0.060 <0.25 <0.042<0.300 <0.500 <0.760 <3.20 <0.740 <0.120 <0.50 <0.084<0.150 <0.250 <0.380 <1.60 <0.370 <0.060 <0.25 <0.042<0.150 <0.250 <0.380 <1.60 <0.370 <0.060 <0.25 <0.042<0.150 <0.250 <0.380 <1.60 <0.370 E0.014 <0.25 <0.042<0.260 <0.500 <0.380 <1.60 <0.370 E0.160 <0.25 <0.042<0.300 <0.500 <0.760 <3.20 <0.740 <0.120 <0.50 <0.084<0.300 <0.500 <0.760 <3.20 <0.740 <0.120 <0.50 <0.084<0.150 <0.250 <0.380 <1.60 <0.370 <0.060 <0.25 <0.042<0.300 <0.500 <0.760 <3.20 <0.740 <0.120 <0.50 <0.084<0.150 <0.250 <0.380 <1.60 <0.370 <0.060 <0.25 <0.042<0.150 E0.068 <0.380 <1.60 <0.370 <0.060 <0.25 <0.042<0.150 E0.033 E0.014 <1.60 <0.370 <0.060 <0.25 <0.042<0.148 <0.254 <0.382 <1.65 <0.374 <0.064 <0.25 <0.042<0.148 <0.254 <0.382 <1.65 <0.374 <0.064 <0.25 <0.042<0.150 <0.250 <0.380 <1.60 <0.370 <0.060 <0.25 <0.042<0.150 <0.250 <0.380 <1.60 <0.370 <0.060 <0.25 <0.042<0.300 <0.500 <0.760 <3.20 <0.740 <0.120 <0.50 <0.084<0.150 <0.250 <0.380 <1.60 <0.370 <0.060 <0.25 <0.042
53 Table 3

Table 3. Analytical results for VOCs in the water samples, SWR and Loveland Reservoirs, San Diego County, Calif.—Continued
PCODESite name Date Time
S 9 S 1998 1550Loveland Reservoir near dam site 1 4-May-1999 1040Loveland Reservoir near dam site 1 4-May-1999 1050Loveland Reservoir near dam site 1 13-Jul-1999 1020Loveland Reservoir near dam site 1 13-Jul-1999 1030Loveland Reservoir near dam site 1 21-Sep-1999 1000Loveland Reservoir near dam site 1 21-Sep-1999 1020Loveland Reservoir east end near source inlet site 2 10-Sep-1998 1650Loveland Reservoir east end near source inlet site 2 10-Sep-1998 1700Loveland Reservoir east end near source inlet site 2 4-Nov-1998 1155Loveland Reservoir east end near source inlet site 2 4-Nov-1998 1205Loveland Reservoir east end near source inlet site 2 7-Jan-1999 1035Loveland Reservoir east end near source inlet site 2 2-Mar-1999 1220Loveland Reservoir east end near source inlet site 2 4-May-1999 1120Loveland Reservoir east end near source inlet site 2 4-May-1999 1130Loveland Reservoir east end near source inlet site 2 13-Jul-1999 1100Sweetwater River at low flow barrier at SWR 6-Jan-1999 1515Sweetwater River at low flow barrier at SWR 7-Jan-1999 1420Sweetwater River at low flow barrier at SWR 2-Mar-1999 1540Sweetwater River at low flow barrier at SWR 3-May-1999 1645Sweetwater River at low flow barrier at SWR 12-Jul-1999 1620Sweetwater River at low flow barrier at SWR 20-Sep-1999 1630Perdue Treatment Plant—finished water at SWR 7-Jan-1999 1350Perdue Treatment Plant—finished water at SWR 2-Mar-1999 1630Perdue Treatment Plant—finished water at SWR 3-May-1999 1607Perdue Treatment Plant—finished water at SWR 12-Jul-1999 1700Perdue Treatment Plant—finished water at SWR 20-Sep-1999 1430Perdue Treatment Plant—imported raw water at SWR 20-Sep-1999 1500
Bro
mom
etha
ne
Chlo
rom
etha
ne
Dic
hlor
omet
hane
2-B
utan
one
4-M
ethy
l-2-
pent
anon
e
m-
and
p-Xy
lene
Nap
htha
lene
2-Ch
loro
tolu
ene
34413 34418 34423 81595 78133 85795 34696 77275(µµµµg/L) (µµµµg/L) (µµµµg/L) (µµµµg/L) (µµµµg/L) (µµµµg/L) (µµµµg/L) (µµµµg/L)
<0.150 <0.250 <0.380 <1.60 <0.370 <0.060 <0.25 <0.042<0.150 <0.250 <0.380 <1.60 <0.370 <0.060 <0.25 <0.042<0.150 E0.029 <0.380 <1.60 <0.370 <0.060 <0.25 <0.042<0.150 <0.250 <0.380 <1.60 <0.370 E0.040 <0.25 <0.042<0.260 <0.500 <0.380 <1.60 <0.370 <0.060 <0.25 <0.042<0.260 <0.500 <0.380 <1.60 <0.370 <0.060 <0.25 <0.042<0.148 <0.254 <0.382 <1.65 <0.374 <0.064 <0.25 <0.042<0.148 <0.254 <0.382 <1.65 <0.374 E0.029 <0.25 <0.042<0.300 <0.500 <0.760 <3.20 <0.740 <0.120 <0.50 <0.084<0.150 <0.250 <0.380 <1.60 <0.370 E0.012 <0.25 <0.042<0.150 <0.250 <0.380 <1.60 <0.370 <0.060 <0.25 <0.042<0.150 <0.250 <0.380 <1.60 <0.370 E0.018 <0.25 <0.042<0.150 E0.038 <0.380 <1.60 <0.370 <0.060 <0.25 <0.042<0.150 <0.250 <0.380 <1.60 <0.370 <0.060 <0.25 <0.042<0.150 E0.036 <0.380 <1.60 <0.370 E0.016 <0.25 <0.042<0.300 <0.500 E0.061 <3.20 <0.740 <0.120 <0.50 <0.084<0.300 <0.500 <0.760 <3.20 <0.740 <0.120 <0.50 <0.084<0.150 E0.012 <0.380 <1.60 <0.370 <0.060 <0.25 <0.042<0.150 E0.071 <0.380 <1.60 <0.370 <0.060 <0.25 <0.042<0.300 <0.500 <0.760 <3.20 <0.740 <0.120 <0.50 <0.084<0.260 <0.500 <0.380 <1.60 <0.370 <0.060 <0.25 <0.042<0.300 <0.500 <0.760 <3.20 <0.740 <0.120 <0.50 <0.084<0.150 E0.064 <0.380 <1.60 E0.522 <0.060 <0.25 <0.042<0.150 E0.167 E0.053 <1.60 <0.370 <0.060 <0.25 <0.042<0.150 E0.259 E0.055 <1.60 <0.370 <0.060 <0.25 <0.042<0.260 E0.130 E0.039 <1.60 <0.370 <0.060 <0.25 <0.042<0.260 <0.500 <0.380 <1.60 <0.370 <0.060 <0.25 <0.042
54 Table 3

Table 3. Analytical results for VOCs in the water samples, SWR and Loveland Reservoirs, San Diego County, Calif.—Continued
PCODESite name Date Time
SWR near pump tower 9-Sep-1998 1550SWR near pump tower 9-Sep-1998 1600SWR near pump tower 3-Nov-1998 1030SWR near pump tower 3-Nov-1998 1040SWR near pump tower 6-Jan-1999 930SWR near pump tower 1-Mar-1999 1030SWR near pump tower 1-Mar-1999 1045SWR near pump tower 3-May-1999 1115SWR near pump tower 3-May-1999 1130SWR near pump tower 12-Jul-1999 1120SWR near pump tower 12-Jul-1999 1130SWR near pump tower 20-Sep-1999 1140SWR near pump tower 20-Sep-1999 1150SWR near Vista del Lago station 10-Sep-1998 845SWR near Vista del Lago station 10-Sep-1998 900SWR near Vista del Lago station 3-Nov-1998 1110SWR near Vista del Lago station 6-Jan-1999 1000SWR near Vista del Lago station 1-Mar-1999 1100SWR near Vista del Lago station 3-May-1999 1150SWR near Vista del Lago station 3-May-1999 1200SWR near Vista del Lago station 12-Jul-1999 1210SWR near Vista del Lago station 12-Jul-1999 1220SWR center of minimum pool 9-Sep-1998 1630SWR center of minimum pool 9-Sep-1998 1640SWR center of minimum pool 3-Nov-1998 1140SWR center of minimum pool 3-Nov-1998 1150SWR center of minimum pool 6-Jan-1999 1030SWR center of minimum pool 1-Mar-1999 1130SWR center of minimum pool 3-May-1999 1235SWR center of minimum pool 3-May-1999 1240SWR center of minimum pool 12-Jul-1999 1240SWR center of minimum pool 12-Jul-1999 1250SWR center of minimum pool 20-Sep-1999 1220SWR center of minimum pool 20-Sep-1999 1230SWR near recreation area 10-Sep-1998 1010
o-Xy
lene
4-Is
opro
pyl-
1-m
ethy
lben
zene
1,2,
3,4-
Tetr
amet
hylb
enze
ne
1,3-
Dic
hlor
opro
pane
3-Ch
loro
prop
ene
Styr
ene
Tetra
chlo
roet
hyle
ne
o-Et
hyl t
olue
ne
77135 77356 49999 77173 78109 77128 34475 77220(µµµµg/L) (µµµµg/L) (µµµµg/L) (µµµµg/L) (µµµµg/L) (µµµµg/L) (µµµµg/L) (µµµµg/L)
<0.240 <0.44 <0.92 <0.480 <0.800 <0.168 <0.400 <0.40<0.120 <0.22 <0.46 <0.240 <0.400 <0.084 <0.200 <0.20<0.120 <0.22 <0.46 <0.240 <0.400 <0.084 <0.200 <0.20<0.120 <0.22 <0.46 <0.240 <0.400 <0.084 <0.200 <0.20<0.120 <0.22 <0.46 <0.240 <0.400 <0.084 <0.200 <0.20<0.060 <0.11 <0.23 <0.120 <0.200 <0.042 <0.100 <0.10<0.060 <0.11 <0.23 <0.120 <0.200 <0.042 <0.100 <0.10<0.060 <0.11 <0.23 <0.120 <0.200 <0.042 <0.100 <0.10<0.060 <0.11 <0.23 <0.120 <0.200 <0.042 <0.100 <0.10<0.060 <0.11 <0.23 <0.120 <0.200 0.009 <0.100 <0.10<0.060 <0.11 <0.23 <0.120 <0.200 <0.042 <0.100 <0.10<0.038 <0.07 <0.23 <0.120 <0.200 0.005 <0.100 <0.06<0.038 <0.07 <0.23 <0.120 <0.200 <0.042 <0.100 <0.06<0.120 <0.22 <0.46 <0.240 <0.400 <0.084 <0.200 <0.20<0.120 <0.22 <0.46 <0.240 <0.400 <0.084 <0.200 <0.20<0.060 <0.11 <0.23 <0.120 <0.200 <0.042 <0.100 <0.10<0.120 <0.22 <0.46 <0.240 <0.400 <0.042 <0.200 <0.20<0.060 <0.11 <0.23 <0.120 <0.200 <0.042 <0.100 <0.10<0.060 <0.11 <0.23 <0.120 <0.200 <0.042 <0.100 <0.10<0.060 <0.11 <0.23 <0.120 <0.200 <0.042 <0.100 <0.10<0.060 <0.11 <0.23 <0.120 <0.200 <0.042 <0.100 <0.10E0.032 <0.11 <0.23 <0.120 <0.200 0.007 <0.100 <0.10<0.240 <0.44 <0.92 <0.480 <0.800 <0.168 <0.400 <0.40<0.120 <0.22 <0.46 <0.240 <0.400 <0.084 <0.200 <0.20<0.120 <0.22 <0.46 <0.240 <0.400 <0.084 <0.200 <0.20<0.120 <0.22 <0.46 <0.240 <0.400 <0.084 <0.200 <0.20<0.120 <0.22 <0.46 <0.240 <0.400 <0.084 <0.200 <0.20<0.060 <0.11 <0.23 <0.120 <0.200 <0.042 <0.100 <0.10<0.060 <0.11 <0.23 <0.120 <0.200 <0.042 <0.100 <0.10<0.060 <0.11 <0.23 <0.120 <0.200 <0.042 <0.100 <0.10<0.060 <0.11 <0.23 <0.120 <0.200 <0.042 <0.100 <0.10<0.060 <0.11 <0.23 <0.120 <0.200 0.008 <0.100 <0.10<0.038 <0.07 <0.23 <0.120 <0.200 <0.042 <0.100 <0.06<0.038 <0.07 <0.23 <0.120 <0.200 <0.042 <0.100 <0.06<0.120 <0.22 <0.46 <0.240 <0.400 <0.084 <0.200 <0.20
55 Table 3

Table 3. Analytical results for VOCs in the water samples, SWR and Loveland Reservoirs, San Diego County, Calif.—Continued
PCODESite name Date Time
S 9 S 1998 1550SWR near recreation area 10-Sep-1998 1020SWR near recreation area 3-Nov-1998 1205SWR near recreation area 3-Nov-1998 1215SWR near recreation area 6-Jan-1999 1100SWR near recreation area 1-Mar-1999 1220SWR near recreation area 3-May-1999 1310SWR near recreation area 3-May-1999 1320SWR near recreation area 12-Jul-1999 1320SWR near recreation area 12-Jul-1999 1330SWR minimum pool boundary east 10-Sep-1998 1240SWR minimum pool boundary east 10-Sep-1998 1250SWR minimum pool boundary east 3-Nov-1998 1340SWR minimum pool boundary east 6-Jan-1999 1130SWR minimum pool boundary east 2-Mar-1999 840SWR minimum pool boundary east 3-May-1999 1350SWR minimum pool boundary east 3-May-1999 1400SWR minimum pool boundary east 12-Jul-1999 1420SWR east end reservoir fill boundary 10-Sep-1998 1310SWR east end reservoir fill boundary 3-Nov-1998 1400SWR east end reservoir fill boundary 6-Jan-1999 1150SWR east end reservoir fill boundary 1-Mar-1999 1240SWR east end reservoir fill boundary 3-May-1999 1440SWR east end reservoir fill boundary 12-Jul-1999 1440SWR east end reservoir fill boundary 20-Sep-1999 1250SWR near Gum Tree Cove Pond 10-Sep-1998 930SWR near Gum Tree Cove Pond 10-Sep-1998 940SWR near Gum Tree Cove Pond 3-Nov-1998 1430SWR near Gum Tree Cove Pond 6-Jan-1999 1220SWR near Gum Tree Cove Pond 1-Mar-1999 1310SWR near Gum Tree Cove Pond 3-May-1999 1510SWR near Gum Tree Cove Pond 12-Jul-1999 1500Loveland Reservoir near dam site 1 10-Sep-1998 1610Loveland Reservoir near dam site 1 10-Sep-1998 1620Loveland Reservoir near dam site 1 4-Nov-1998 1030Loveland Reservoir near dam site 1 4-Nov-1998 1040Loveland Reservoir near dam site 1 7-Jan-1999 1010Loveland Reservoir near dam site 1 2-Mar-1999 1150
o-Xy
lene
4-Is
opro
pyl-
1-m
ethy
lben
zene
1,2,
3,4-
Tetr
amet
hylb
enze
ne
1,3-
Dic
hlor
opro
pane
3-Ch
loro
prop
ene
Styr
ene
Tetra
chlo
roet
hyle
ne
o-Et
hyl t
olue
ne
77135 77356 49999 77173 78109 77128 34475 77220(µµµµg/L) (µµµµg/L) (µµµµg/L) (µµµµg/L) (µµµµg/L) (µµµµg/L) (µµµµg/L) (µµµµg/L)
<0.120 <0.22 <0.46 <0.240 <0.400 <0.084 <0.200 <0.20<0.120 <0.22 <0.46 <0.240 <0.400 <0.084 <0.200 <0.20<0.120 <0.22 <0.46 <0.240 <0.400 <0.084 <0.200 <0.20<0.120 <0.22 <0.46 <0.240 <0.400 <0.084 <0.200 <0.20<0.060 <0.11 <0.23 <0.120 <0.200 <0.042 <0.100 <0.10<0.060 <0.11 <0.23 <0.120 <0.200 <0.042 <0.100 <0.10<0.060 <0.11 <0.23 <0.120 <0.200 <0.042 <0.100 <0.10<0.060 <0.11 <0.23 <0.120 <0.200 <0.042 <0.100 <0.10<0.060 <0.11 <0.23 <0.120 <0.200 <0.042 <0.100 <0.10<0.240 <0.44 <0.92 <0.480 <0.800 <0.168 <0.400 <0.40<0.120 <0.22 <0.46 <0.240 <0.400 <0.084 <0.200 <0.20<0.060 <0.11 <0.23 <0.120 <0.200 <0.042 <0.100 <0.10<0.120 <0.22 <0.46 <0.240 <0.400 <0.084 <0.200 <0.20<0.060 <0.11 <0.23 <0.120 <0.200 <0.042 <0.100 <0.10<0.060 <0.11 <0.23 <0.120 <0.200 <0.042 <0.100 <0.10<0.060 <0.11 <0.23 <0.120 <0.200 <0.042 <0.100 <0.10<0.060 <0.11 <0.23 <0.120 <0.200 <0.042 <0.100 <0.10<0.064 <0.11 <0.23 <0.116 <0.196 <0.042 <0.102 <0.10<0.060 <0.11 <0.23 <0.120 <0.200 <0.042 <0.100 <0.10<0.120 <0.22 <0.46 <0.240 <0.400 <0.084 <0.200 <0.20<0.060 <0.11 <0.23 <0.120 <0.200 <0.042 <0.100 <0.10<0.060 <0.11 <0.23 <0.120 <0.200 <0.042 <0.100 <0.10<0.060 <0.11 <0.23 <0.120 <0.200 <0.042 <0.100 <0.10E0.079 <0.07 <0.23 <0.120 <0.200 0.009 <0.100 0.02<0.120 <0.22 <0.46 <0.240 <0.400 <0.084 <0.200 <0.20<0.120 <0.22 <0.46 <0.240 <0.400 <0.084 <0.200 <0.20<0.060 <0.11 <0.23 <0.120 <0.200 <0.042 <0.100 <0.10<0.120 <0.22 <0.46 <0.240 <0.400 <0.084 <0.200 <0.20<0.060 <0.11 <0.23 <0.120 <0.200 <0.042 <0.100 <0.10<0.060 <0.11 <0.23 <0.120 <0.200 <0.042 <0.100 <0.10<0.060 <0.11 <0.23 <0.120 <0.200 <0.042 <0.100 <0.10<0.064 <0.11 <0.23 <0.116 <0.196 <0.042 <0.102 <0.10<0.064 <0.11 <0.23 <0.116 <0.196 <0.042 <0.102 <0.10<0.060 <0.11 <0.23 <0.120 <0.200 <0.042 <0.100 <0.10<0.060 <0.11 <0.23 <0.120 <0.200 <0.042 <0.100 <0.10<0.120 <0.22 <0.46 <0.240 <0.400 <0.084 <0.200 <0.20<0.060 <0.11 <0.23 <0.120 <0.200 <0.042 <0.100 <0.10
56 Table 3

Table 3. Analytical results for VOCs in the water samples, SWR and Loveland Reservoirs, San Diego County, Calif.—Continued
PCODESite name Date Time
S 9 S 1998 1550Loveland Reservoir near dam site 1 4-May-1999 1040Loveland Reservoir near dam site 1 4-May-1999 1050Loveland Reservoir near dam site 1 13-Jul-1999 1020Loveland Reservoir near dam site 1 13-Jul-1999 1030Loveland Reservoir near dam site 1 21-Sep-1999 1000Loveland Reservoir near dam site 1 21-Sep-1999 1020Loveland Reservoir east end near source inlet site 2 10-Sep-1998 1650Loveland Reservoir east end near source inlet site 2 10-Sep-1998 1700Loveland Reservoir east end near source inlet site 2 4-Nov-1998 1155Loveland Reservoir east end near source inlet site 2 4-Nov-1998 1205Loveland Reservoir east end near source inlet site 2 7-Jan-1999 1035Loveland Reservoir east end near source inlet site 2 2-Mar-1999 1220Loveland Reservoir east end near source inlet site 2 4-May-1999 1120Loveland Reservoir east end near source inlet site 2 4-May-1999 1130Loveland Reservoir east end near source inlet site 2 13-Jul-1999 1100Sweetwater River at low flow barrier at SWR 6-Jan-1999 1515Sweetwater River at low flow barrier at SWR 7-Jan-1999 1420Sweetwater River at low flow barrier at SWR 2-Mar-1999 1540Sweetwater River at low flow barrier at SWR 3-May-1999 1645Sweetwater River at low flow barrier at SWR 12-Jul-1999 1620Sweetwater River at low flow barrier at SWR 20-Sep-1999 1630Perdue Treatment Plant—finished water at SWR 7-Jan-1999 1350Perdue Treatment Plant—finished water at SWR 2-Mar-1999 1630Perdue Treatment Plant—finished water at SWR 3-May-1999 1607Perdue Treatment Plant—finished water at SWR 12-Jul-1999 1700Perdue Treatment Plant—finished water at SWR 20-Sep-1999 1430Perdue Treatment Plant—imported raw water at SWR 20-Sep-1999 1500
o-Xy
lene
4-Is
opro
pyl-
1-m
ethy
lben
zene
1,2,
3,4-
Tetr
amet
hylb
enze
ne
1,3-
Dic
hlor
opro
pane
3-Ch
loro
prop
ene
Styr
ene
Tetra
chlo
roet
hyle
ne
o-Et
hyl t
olue
ne
77135 77356 49999 77173 78109 77128 34475 77220(µµµµg/L) (µµµµg/L) (µµµµg/L) (µµµµg/L) (µµµµg/L) (µµµµg/L) (µµµµg/L) (µµµµg/L)
<0.060 <0.11 <0.23 <0.120 <0.200 <0.042 <0.100 <0.10<0.060 <0.11 <0.23 <0.120 <0.200 <0.042 <0.100 <0.10<0.060 <0.11 <0.23 <0.120 <0.200 <0.042 <0.100 <0.10E0.017 <0.11 <0.23 <0.120 <0.200 <0.042 <0.100 <0.10<0.038 <0.07 <0.23 <0.120 <0.200 <0.042 <0.100 <0.06<0.038 <0.07 <0.23 <0.120 <0.200 <0.042 <0.100 <0.06<0.064 <0.11 <0.23 <0.116 <0.196 <0.042 <0.102 <0.10<0.064 <0.11 <0.23 <0.116 <0.196 <0.042 <0.102 <0.10<0.120 <0.22 <0.46 <0.240 <0.400 <0.084 <0.200 <0.20<0.060 <0.11 <0.23 <0.120 <0.200 <0.042 <0.100 <0.10<0.060 <0.11 <0.23 <0.120 <0.200 <0.042 <0.100 <0.10E0.010 <0.11 <0.23 <0.120 <0.200 <0.042 <0.100 <0.10<0.060 <0.11 <0.23 <0.120 <0.200 <0.042 <0.100 <0.10<0.060 <0.11 <0.23 <0.120 <0.200 <0.042 <0.100 <0.10E0.011 <0.11 <0.23 <0.120 <0.200 <0.042 <0.100 <0.10<0.120 <0.22 <0.46 <0.240 <0.400 E0.050 <0.200 <0.20<0.120 <0.22 <0.46 <0.240 <0.400 E0.096 <0.200 <0.20<0.060 <0.11 <0.23 <0.120 <0.200 <0.042 E0.006 <0.10<0.060 <0.11 <0.23 <0.120 <0.200 E0.013 <0.100 <0.10<0.120 <0.22 <0.46 <0.240 <0.400 E0.028 <0.200 <0.20<0.038 <0.07 <0.23 <0.120 <0.200 <0.042 <0.100 <0.06<0.120 <0.22 0.46 <0.240 <0.400 <0.084 <0.200 <0.20<0.060 <0.11 <0.23 <0.120 <0.200 <0.042 <0.100 <0.10<0.060 <0.11 <0.23 <0.120 <0.200 <0.042 <0.100 <0.10<0.060 <0.11 <0.23 <0.120 <0.200 <0.042 <0.100 <0.10<0.038 <0.07 <0.23 <0.120 <0.200 <0.042 <0.100 <0.06<0.038 <0.07 <0.23 <0.120 <0.200 <0.042 <0.100 <0.06
57 Table 3

Table 3. Analytical results for VOCs in the water samples, SWR and Loveland Reservoirs, San Diego County, Calif.—Continued
PCODESite name Date Time
SWR near pump tower 9-Sep-1998 1550SWR near pump tower 9-Sep-1998 1600SWR near pump tower 3-Nov-1998 1030SWR near pump tower 3-Nov-1998 1040SWR near pump tower 6-Jan-1999 930SWR near pump tower 1-Mar-1999 1030SWR near pump tower 1-Mar-1999 1045SWR near pump tower 3-May-1999 1115SWR near pump tower 3-May-1999 1130SWR near pump tower 12-Jul-1999 1120SWR near pump tower 12-Jul-1999 1130SWR near pump tower 20-Sep-1999 1140SWR near pump tower 20-Sep-1999 1150SWR near Vista del Lago station 10-Sep-1998 845SWR near Vista del Lago station 10-Sep-1998 900SWR near Vista del Lago station 3-Nov-1998 1110SWR near Vista del Lago station 6-Jan-1999 1000SWR near Vista del Lago station 1-Mar-1999 1100SWR near Vista del Lago station 3-May-1999 1150SWR near Vista del Lago station 3-May-1999 1200SWR near Vista del Lago station 12-Jul-1999 1210SWR near Vista del Lago station 12-Jul-1999 1220SWR center of minimum pool 9-Sep-1998 1630SWR center of minimum pool 9-Sep-1998 1640SWR center of minimum pool 3-Nov-1998 1140SWR center of minimum pool 3-Nov-1998 1150SWR center of minimum pool 6-Jan-1999 1030SWR center of minimum pool 1-Mar-1999 1130SWR center of minimum pool 3-May-1999 1235SWR center of minimum pool 3-May-1999 1240SWR center of minimum pool 12-Jul-1999 1240SWR center of minimum pool 12-Jul-1999 1250SWR center of minimum pool 20-Sep-1999 1220SWR center of minimum pool 20-Sep-1999 1230SWR near recreation area 10-Sep-1998 1010
4-Ch
loro
tolu
ene
Tolu
ene
trans
-1,
3-D
ichl
orop
rope
ne
Tric
hlor
oeth
ylen
e
Viny
l chl
orid
e
1,4-
Bro
mof
luor
oben
zene
(s
urro
gate
)
1,2-
Dic
hlor
oeth
ane-
d4
(sur
roga
te)
Tolu
ene-
d8 (
surr
ogat
e)
77277 34010 34699 34488 39175 99834 99832 99833(µµµµg/L) (µµµµg/L) (µg/L) (µµµµg/L) (µµµµg/L) (%) (%) (%)
<0.224 <0.200 <0.520 <0.360 <0.440 100 96 100<0.112 <0.100 <0.260 <0.180 <0.220 98 96 100<0.112 E0.060 <0.260 <0.180 <0.220 84 121 96<0.112 <0.100 <0.260 <0.180 <0.220 83 117 97<0.112 E0.033 <0.260 <0.180 <0.220 90 92 98<0.056 <0.050 <0.130 <0.090 <0.110 87 106 93<0.056 E0.020 <0.130 <0.090 <0.110 89 109 93<0.056 E0.014 <0.130 <0.090 <0.110 96 107 100<0.056 <0.050 <0.130 <0.090 <0.110 72 98 89<0.056 E0.019 <0.130 <0.090 <0.110 93 104 99<0.056 E0.026 <0.130 <0.090 <0.110 94 104 1010.060 E0.073 <0.090 <0.090 <0.110 99 100 990.060 E0.076 <0.090 <0.090 <0.110 102 119 107
<0.112 <0.100 <0.260 <0.180 <0.220 100 96 100<0.112 <0.100 <0.260 <0.180 <0.220 101 95 101<0.056 <0.050 <0.130 <0.090 <0.110 108 127 104<0.112 <0.100 <0.260 <0.180 <0.220 91 95 98<0.056 <0.050 <0.130 <0.090 <0.110 88 105 93<0.056 <0.050 <0.130 <0.090 <0.110 94 108 101<0.056 <0.050 <0.130 <0.090 <0.110 92 107 100<0.056 E0.025 <0.130 <0.090 <0.110 94 106 99<0.056 E0.098 <0.130 <0.090 <0.110 95 105 99<0.224 <0.200 <0.520 <0.360 <0.440 98 96 99<0.112 <0.100 <0.260 <0.180 <0.220 100 95 99<0.112 <0.100 <0.260 <0.180 <0.220 82 117 95<0.112 <0.100 <0.260 <0.180 <0.220 81 117 96<0.112 <0.100 <0.260 <0.180 <0.220 90 91 96<0.056 <0.050 <0.130 <0.090 <0.110 88 106 93<0.056 E0.007 <0.130 <0.090 <0.110 94 112 99<0.056 E0.015 <0.130 <0.090 <0.110 96 105 101<0.056 <0.050 <0.130 <0.090 <0.110 92 107 99<0.056 E0.061 <0.130 <0.090 <0.110 99 108 102<0.060 <0.050 <0.090 <0.090 <0.110 103 122 106<0.060 E0.011 <0.090 <0.090 <0.110 92 98 99<0.112 <0.100 <0.260 <0.180 <0.220 100 95 100
58 Table 3

Table 3. Analytical results for VOCs in the water samples, SWR and Loveland Reservoirs, San Diego County, Calif.—Continued
PCODESite name Date Time
S 9 S 1998 1550SWR near recreation area 10-Sep-1998 1020SWR near recreation area 3-Nov-1998 1205SWR near recreation area 3-Nov-1998 1215SWR near recreation area 6-Jan-1999 1100SWR near recreation area 1-Mar-1999 1220SWR near recreation area 3-May-1999 1310SWR near recreation area 3-May-1999 1320SWR near recreation area 12-Jul-1999 1320SWR near recreation area 12-Jul-1999 1330SWR minimum pool boundary east 10-Sep-1998 1240SWR minimum pool boundary east 10-Sep-1998 1250SWR minimum pool boundary east 3-Nov-1998 1340SWR minimum pool boundary east 6-Jan-1999 1130SWR minimum pool boundary east 2-Mar-1999 840SWR minimum pool boundary east 3-May-1999 1350SWR minimum pool boundary east 3-May-1999 1400SWR minimum pool boundary east 12-Jul-1999 1420SWR east end reservoir fill boundary 10-Sep-1998 1310SWR east end reservoir fill boundary 3-Nov-1998 1400SWR east end reservoir fill boundary 6-Jan-1999 1150SWR east end reservoir fill boundary 1-Mar-1999 1240SWR east end reservoir fill boundary 3-May-1999 1440SWR east end reservoir fill boundary 12-Jul-1999 1440SWR east end reservoir fill boundary 20-Sep-1999 1250SWR near Gum Tree Cove Pond 10-Sep-1998 930SWR near Gum Tree Cove Pond 10-Sep-1998 940SWR near Gum Tree Cove Pond 3-Nov-1998 1430SWR near Gum Tree Cove Pond 6-Jan-1999 1220SWR near Gum Tree Cove Pond 1-Mar-1999 1310SWR near Gum Tree Cove Pond 3-May-1999 1510SWR near Gum Tree Cove Pond 12-Jul-1999 1500Loveland Reservoir near dam site 1 10-Sep-1998 1610Loveland Reservoir near dam site 1 10-Sep-1998 1620Loveland Reservoir near dam site 1 4-Nov-1998 1030Loveland Reservoir near dam site 1 4-Nov-1998 1040Loveland Reservoir near dam site 1 7-Jan-1999 1010Loveland Reservoir near dam site 1 2-Mar-1999 1150
4-Ch
loro
tolu
ene
Tolu
ene
trans
-1,
3-D
ichl
orop
rope
ne
Tric
hlor
oeth
ylen
e
Viny
l chl
orid
e
1,4-
Bro
mof
luor
oben
zene
(s
urro
gate
)
1,2-
Dic
hlor
oeth
ane-
d4
(sur
roga
te)
Tolu
ene-
d8 (
surr
ogat
e)
77277 34010 34699 34488 39175 99834 99832 99833(µµµµg/L) (µµµµg/L) (µg/L) (µµµµg/L) (µµµµg/L) (%) (%) (%)
<0.112 <0.100 <0.260 <0.180 <0.220 98 96 101<0.112 <0.100 <0.260 <0.180 <0.220 82 120 98<0.112 <0.100 <0.260 <0.180 <0.220 84 119 97<0.112 <0.100 <0.260 <0.180 <0.220 90 94 96<0.056 <0.050 <0.130 <0.090 <0.110 88 105 93<0.056 E0.007 <0.130 <0.090 <0.110 92 108 99<0.056 <0.050 <0.130 <0.090 <0.110 94 109 100<0.056 <0.050 <0.130 <0.090 <0.110 93 104 99<0.056 E0.010 <0.130 <0.090 <0.110 95 104 100<0.224 <0.200 <0.520 <0.360 <0.440 101 95 101<0.112 <0.100 <0.260 <0.180 <0.220 103 97 101<0.056 <0.050 <0.130 <0.090 <0.110 108 127 103<0.112 E0.038 <0.260 <0.180 <0.220 92 93 98<0.056 <0.050 <0.130 <0.090 <0.110 88 106 94<0.056 <0.050 <0.130 <0.090 <0.110 92 112 99<0.056 E0.013 <0.130 <0.090 <0.110 94 111 99<0.056 E0.010 <0.130 <0.090 <0.110 95 105 100<0.056 <0.054 <0.134 <0.092 <0.112 96 96 98<0.056 <0.050 <0.130 <0.090 <0.110 82 116 97<0.112 E0.046 <0.260 <0.180 <0.220 90 93 97<0.056 E0.011 <0.130 <0.090 <0.110 86 105 91<0.056 <0.050 <0.130 <0.090 <0.110 95 109 99<0.056 E0.017 <0.130 <0.090 <0.110 93 104 100<0.060 0.265 <0.090 <0.090 <0.110 100 103 99<0.112 <0.100 <0.260 <0.180 <0.220 100 96 100<0.112 <0.100 <0.260 <0.180 <0.220 101 96 101<0.056 E0.008 <0.130 <0.090 <0.110 107 124 104<0.112 <0.100 <0.260 <0.180 <0.220 92 93 98<0.056 <0.050 <0.130 <0.090 <0.110 87 105 94<0.056 <0.050 <0.130 <0.090 <0.110 94 108 100<0.056 <0.050 <0.130 <0.090 <0.110 98 107 100<0.056 <0.054 <0.134 <0.092 <0.112 98 95 99<0.056 <0.054 <0.134 <0.092 <0.112 97 91 98<0.056 <0.050 <0.130 <0.090 <0.110 111 132 103<0.056 E0.013 <0.130 <0.090 <0.110 111 135 105<0.112 <0.100 <0.260 <0.180 <0.220 89 91 98<0.056 <0.050 <0.130 <0.090 <0.110 86 107 93
59 Table 3

Table 3. Analytical results for VOCs in the water samples, SWR and Loveland Reservoirs, San Diego County, Calif.—Continued
PCODESite name Date Time
S 9 S 1998 1550Loveland Reservoir near dam site 1 4-May-1999 1040Loveland Reservoir near dam site 1 4-May-1999 1050Loveland Reservoir near dam site 1 13-Jul-1999 1020Loveland Reservoir near dam site 1 13-Jul-1999 1030Loveland Reservoir near dam site 1 21-Sep-1999 1000Loveland Reservoir near dam site 1 21-Sep-1999 1020Loveland Reservoir east end near source inlet site 2 10-Sep-1998 1650Loveland Reservoir east end near source inlet site 2 10-Sep-1998 1700Loveland Reservoir east end near source inlet site 2 4-Nov-1998 1155Loveland Reservoir east end near source inlet site 2 4-Nov-1998 1205Loveland Reservoir east end near source inlet site 2 7-Jan-1999 1035Loveland Reservoir east end near source inlet site 2 2-Mar-1999 1220Loveland Reservoir east end near source inlet site 2 4-May-1999 1120Loveland Reservoir east end near source inlet site 2 4-May-1999 1130Loveland Reservoir east end near source inlet site 2 13-Jul-1999 1100Sweetwater River at low flow barrier at SWR 6-Jan-1999 1515Sweetwater River at low flow barrier at SWR 7-Jan-1999 1420Sweetwater River at low flow barrier at SWR 2-Mar-1999 1540Sweetwater River at low flow barrier at SWR 3-May-1999 1645Sweetwater River at low flow barrier at SWR 12-Jul-1999 1620Sweetwater River at low flow barrier at SWR 20-Sep-1999 1630Perdue Treatment Plant—finished water at SWR 7-Jan-1999 1350Perdue Treatment Plant—finished water at SWR 2-Mar-1999 1630Perdue Treatment Plant—finished water at SWR 3-May-1999 1607Perdue Treatment Plant—finished water at SWR 12-Jul-1999 1700Perdue Treatment Plant—finished water at SWR 20-Sep-1999 1430Perdue Treatment Plant—imported raw water at SWR 20-Sep-1999 1500
4-Ch
loro
tolu
ene
Tolu
ene
trans
-1,
3-D
ichl
orop
rope
ne
Tric
hlor
oeth
ylen
e
Viny
l chl
orid
e
1,4-
Bro
mof
luor
oben
zene
(s
urro
gate
)
1,2-
Dic
hlor
oeth
ane-
d4
(sur
roga
te)
Tolu
ene-
d8 (
surr
ogat
e)
77277 34010 34699 34488 39175 99834 99832 99833(µµµµg/L) (µµµµg/L) (µg/L) (µµµµg/L) (µµµµg/L) (%) (%) (%)
<0.056 <0.050 <0.130 <0.090 <0.110 92 105 100<0.056 E0.009 <0.130 <0.090 <0.110 91 108 100<0.056 E0.013 <0.130 <0.090 <0.110 99 108 101<0.056 E0.053 <0.130 <0.090 <0.110 98 108 100<0.060 E0.006 <0.090 <0.090 <0.110 90 94 97<0.060 E0.013 <0.090 <0.090 <0.110 90 97 98<0.056 <0.054 <0.134 <0.092 <0.112 97 96 99<0.056 <0.054 <0.134 <0.092 <0.112 97 96 97<0.112 <0.100 <0.260 <0.180 <0.220 79 120 95<0.056 E0.013 <0.130 <0.090 <0.110 110 131 103<0.056 <0.050 <0.130 <0.090 <0.110 91 92 99<0.056 E0.021 <0.130 <0.090 <0.110 88 106 93<0.056 <0.050 <0.130 <0.090 <0.110 94 105 99<0.056 E0.015 <0.130 <0.090 <0.110 93 108 98<0.056 E0.034 <0.130 <0.090 <0.110 100 111 102<0.112 E0.072 <0.260 <0.180 <0.220 93 94 99<0.112 E0.059 <0.260 <0.180 <0.220 90 93 98<0.056 E0.027 <0.130 <0.090 <0.110 88 106 93<0.056 <0.050 <0.130 <0.090 <0.110 92 107 100<0.112 E0.112 <0.260 <0.180 <0.220 97 107 101<0.060 <0.050 <0.090 <0.090 <0.110 108 121 106<0.112 <0.100 <0.260 <0.180 <0.220 89 91 96<0.056 E0.012 <0.130 <0.090 <0.110 81 108 86<0.056 <0.050 <0.130 <0.090 <0.110 89 107 88<0.056 <0.050 <0.130 <0.090 <0.110 92 102 96<0.060 E0.006 <0.090 <0.090 <0.110 88 100 83<0.060 E0.068 <0.090 <0.090 <0.110 101 116 103
60 Table 3

lifornia
se of interference or is below method reporting limits. centage recovery; <, compound was not detected at a
Atrazine Benfluralin Butylate Carbaryl
39632 82673 4028 82680
(µµµµg/L) (µµµµg/L) (µµµµg/L) (µµµµg/L)
<0.001 <0.002 <0.002 <0.003<0.001 <0.002 <0.002 <0.003<0.001 <0.002 <0.002 <0.003<0.001 <0.002 <0.002 <0.003<0.001 <0.002 <0.002 <0.003<0.001 <0.002 <0.002 <0.003<0.001 <0.002 <0.002 <0.003<0.001 <0.002 <0.002 <0.003<0.001 <0.002 <0.002 <0.003<0.001 <0.002 <0.002 <0.003<0.001 <0.002 <0.002 <0.003<0.001 <0.002 <0.002 <0.003<0.001 <0.002 <0.002 <0.003<0.001 <0.002 <0.002 <0.003<0.001 <0.002 <0.002 <0.003<0.001 <0.002 <0.002 <0.003<0.001 <0.002 <0.002 <0.003<0.001 <0.002 <0.002 <0.003<0.001 <0.002 <0.002 <0.003<0.001 <0.002 <0.002 <0.003<0.001 <0.002 <0.002 <0.003<0.001 <0.002 <0.002 <0.003<0.001 <0.002 <0.002 <0.003<0.001 <0.002 <0.002 <0.003<0.001 <0.002 <0.002 <0.003<0.001 <0.002 <0.002 <0.003<0.001 <0.002 <0.002 <0.003<0.001 <0.002 <0.002 <0.003<0.001 <0.002 <0.002 <0.003<0.001 <0.002 <0.002 <0.003<0.001 <0.002 <0.002 <0.003<0.001 <0.002 <0.002 <0.003<0.001 <0.002 <0.002 <0.003<0.001 <0.002 <0.002 <0.003<0.001 <0.002 <0.002 <0.003<0.001 <0.002 <0.002 <0.003
Table 4. Analytical results for pesticide concentrations in water samples, Sweetwater and Loveland Reservoirs, San Diego County, Ca
[See table 1 for site identification number. Time is denoted in 24-hour scale. An “E” indicates that the value has been estimated becauThe number given below each compound is its parameter code (PCODE). Calif., California; SWR, Sweetwater Reservoir; %, perconcentration above the reporting level; µg/L, microgram per liter]
61 Table 4
2,6-Diethyaniline
Acetochlor Alachlor alpha-HCH
PCODE 82660 49260 46342 34253
Site name Date Time (µµµµg/L) (µµµµg/L) (µµµµg/L) (µµµµg/L)
SWR near pump tower 9-Sep-1998 1550 <0.003 <0.002 <0.002 <0.002SWR near pump tower 9-Sep-1998 1600 <0.003 <0.002 <0.002 <0.002SWR near pump tower 3-Nov-1998 1030 <0.003 <0.002 <0.002 <0.002SWR near pump tower 3-Nov-1998 1040 <0.003 <0.002 <0.002 <0.002SWR near pump tower 6-Jan-1999 0930 <0.003 <0.002 <0.002 <0.002SWR near pump tower 1-Mar-1999 1030 <0.003 <0.002 <0.002 <0.002SWR near pump tower 1-Mar-1999 1045 <0.003 <0.002 <0.002 <0.002SWR near pump tower 3-May-1999 1115 <0.003 <0.002 <0.002 <0.002SWR near pump tower 3-May-1999 1130 <0.003 <0.002 <0.002 <0.002SWR near pump tower 12-Jul-1999 1120 <0.003 <0.002 <0.002 <0.002SWR near pump tower 12-Jul-1999 1130 <0.003 <0.002 <0.002 <0.002SWR near pump tower 20-Sep-1999 1140 <0.003 <0.002 <0.002 <0.002SWR near pump tower 20-Sep-1999 1150 <0.003 <0.002 <0.002 <0.002SWR near Vista del Lago station 10-Sep-1998 0845 <0.003 <0.002 <0.002 <0.002SWR near Vista del Lago station 10-Sep-1998 0900 <0.003 <0.002 <0.002 <0.002SWR near Vista del Lago station 3-Nov-1998 1110 <0.003 <0.002 <0.002 <0.002SWR near Vista del Lago station 6-Jan-1999 1000 <0.003 <0.002 <0.002 <0.002SWR near Vista del Lago station 1-Mar-1999 1100 <0.003 <0.002 <0.002 <0.002SWR near Vista del Lago station 3-May-1999 1150 <0.003 <0.002 <0.002 <0.002SWR near Vista del Lago station 3-May-1999 1200 <0.003 <0.002 <0.002 <0.002SWR near Vista del Lago station 12-July-1999 1210 <0.003 <0.002 <0.002 <0.002SWR near Vista del Lago station 12-July-1999 1220 <0.003 <0.002 <0.002 <0.002SWR center of minimum pool 9-Sep-1998 1630 <0.003 <0.002 <0.002 <0.002SWR center of minimum pool 9-Sep-1998 1640 <0.003 <0.002 <0.002 <0.002SWR center of minimum pool 3-Nov-1998 1140 <0.003 <0.002 <0.002 <0.002SWR center of minimum pool 3-Nov-1998 1150 <0.003 <0.002 <0.002 <0.002SWR center of minimum pool 6-Jan-1999 1030 <0.003 <0.002 <0.002 <0.002SWR center of minimum pool 1-Mar-1999 1130 <0.003 <0.002 <0.002 <0.002SWR center of minimum pool 3-May-1999 1235 <0.003 <0.002 <0.002 <0.002SWR center of minimum pool 3-May-1999 1240 <0.003 <0.002 <0.002 <0.002SWR center of minimum pool 12-July-1999 1240 <0.003 <0.002 <0.002 <0.002SWR center of minimum pool 12-July-1999 1250 <0.003 <0.002 <0.002 <0.002SWR center of minimum pool 20-Sep-1999 1220 <0.003 <0.002 <0.002 <0.002SWR center of minimum pool 20-Sep-1999 1230 <0.003 <0.002 <0.002 <0.002SWR near recreation area 10-Sep-1998 1010 <0.003 <0.002 <0.002 <0.002SWR near recreation area 10-Sep-1998 1020 <0.003 <0.002 <0.002 <0.002

—Continued
.001 <0.002 <0.002 <0.003
.001 <0.002 <0.002 <0.003
.001 <0.002 <0.002 <0.003
.001 <0.002 <0.002 <0.003
.001 <0.002 <0.002 <0.003
.001 <0.002 <0.002 <0.003
.001 <0.002 <0.002 <0.003
.001 <0.002 <0.002 <0.003
.001 <0.002 <0.002 <0.003
.001 <0.002 <0.002 <0.003
.001 <0.002 <0.002 <0.003
.001 <0.002 <0.002 <0.003
.001 <0.002 <0.002 <0.003
.001 <0.002 <0.002 <0.003
.001 <0.002 <0.002 <0.003
.001 <0.002 <0.002 <0.003
.001 <0.002 <0.002 <0.003
.001 <0.002 <0.002 <0.003
.001 <0.002 <0.002 <0.003
.001 <0.002 <0.002 <0.003
.001 <0.002 <0.002 <0.003
.001 <0.002 <0.002 <0.003
.001 <0.002 <0.002 <0.003
.001 <0.002 <0.002 <0.003
.001 <0.002 <0.002 <0.003
.001 <0.002 <0.002 <0.003
.001 <0.002 <0.002 <0.003
.001 <0.002 <0.002 <0.003
.001 <0.002 <0.002 <0.003
.001 <0.002 <0.002 <0.003
.001 <0.002 <0.002 <0.003
.001 <0.002 <0.002 <0.003
.001 <0.002 <0.002 <0.003
.001 <0.002 <0.002 <0.003
.001 <0.002 <0.002 <0.003
.001 <0.002 <0.002 <0.003
.001 <0.002 <0.002 <0.003
.001 <0.002 <0.002 <0.003
.001 <0.002 <0.002 <0.003
zine Benfluralin Butylate Carbaryl
632 82673 4028 82680
g/L) (µµµµg/L) (µµµµg/L) (µµµµg/L)
Table 4. Analytical results for pesticide concentrations in water samples, Sweetwater and Loveland Reservoirs, San Diego County, California
62 Table 4
SWR near recreation area 3-Nov-1998 1205 <0.003 <0.002 <0.002 <0.002 <0SWR near recreation area 3-Nov-1998 1215 <0.003 <0.002 <0.002 <0.002 <0SWR near recreation area 6-Jan-1999 1100 <0.003 <0.002 <0.002 <0.002 <0SWR near recreation area 1-Mar-1999 1220 <0.003 <0.002 <0.002 <0.002 <0SWR near recreation area 3-May-1999 1310 <0.003 <0.002 <0.002 <0.002 <0SWR near recreation area 3-May-1999 1320 <0.003 <0.002 <0.002 <0.002 <0SWR near recreation area 12-July-1999 1320 <0.003 <0.002 <0.002 <0.002 <0SWR near recreation area 12-July-1999 1330 <0.003 <0.002 <0.002 <0.002 <0SWR minimum pool boundary east 10-Sep-1998 1240 <0.003 <0.002 <0.002 <0.002 <0SWR minimum pool boundary east 10-Sep-1998 1250 <0.003 <0.002 <0.002 <0.002 <0SWR minimum pool boundary east 3-Nov-1998 1340 <0.003 <0.002 <0.002 <0.002 <0SWR minimum pool boundary east 6-Jan-1999 1130 <0.003 <0.002 <0.002 <0.002 <0SWR minimum pool boundary east 2-Mar-1999 0840 <0.003 <0.002 <0.002 <0.002 <0SWR minimum pool boundary east 3-May-1999 1350 <0.003 <0.002 <0.002 <0.002 <0SWR minimum pool boundary east 3-May-1999 1400 <0.003 <0.002 <0.002 <0.002 <0SWR minimum pool boundary east 12-July-1999 1420 <0.003 <0.002 <0.002 <0.002 <0SWR east end reservoir fill boundary 10-Sep-1998 1310 <0.003 <0.002 <0.002 <0.002 <0SWR east end reservoir fill boundary 3-Nov-1998 1400 <0.003 <0.002 <0.002 <0.002 <0SWR east end reservoir fill boundary 6-Jan-1999 1150 <0.003 <0.002 <0.002 <0.002 <0SWR east end reservoir fill boundary 3-May-1999 1440 <0.003 <0.002 <0.002 <0.002 <0SWR east end reservoir fill boundary 12-July-1999 1440 <0.003 <0.002 <0.002 <0.002 <0SWR east end reservoir fill boundary 20-Sep-1999 1250 <0.003 <0.002 <0.002 <0.002 <0SWR near Gum Tree Cove Pond 10-Sep-1998 0930 <0.003 <0.002 <0.002 <0.002 <0SWR near Gum Tree Cove Pond 10-Sep-1998 0940 <0.003 <0.002 <0.002 <0.002 <0SWR near Gum Tree Cove Pond 3-Nov-1998 1430 <0.003 <0.002 <0.002 <0.002 <0SWR near Gum Tree Cove Pond 6-Jan-1999 1220 <0.003 <0.002 <0.002 <0.002 <0SWR near Gum Tree Cove Pond 1-Mar-1999 1310 <0.003 <0.002 <0.002 <0.002 <0SWR near Gum Tree Cove Pond 3-May-1999 1510 <0.003 <0.002 <0.002 <0.002 <0SWR near Gum Tree Cove Pond 12-July-1999 1500 <0.003 <0.002 <0.002 <0.002 <0Loveland Reservoir near dam site 1 10-Sep-1998 1610 <0.003 <0.002 <0.002 <0.002 <0Loveland Reservoir near dam site 1 10-Sep-1998 1620 <0.003 <0.002 <0.002 <0.002 <0Loveland Reservoir near dam site 1 4-Nov-1998 1030 <0.003 <0.002 <0.002 <0.002 <0Loveland Reservoir near dam site 1 4-Nov-1998 1040 <0.003 <0.002 <0.002 <0.002 <0Loveland Reservoir near dam site 1 7-Jan-1999 1010 <0.003 <0.002 <0.002 <0.002 <0Loveland Reservoir near dam site 1 2-Mar-1999 1150 <0.003 <0.002 <0.002 <0.002 <0Loveland Reservoir near dam site 1 4-May-1999 1040 <0.003 <0.002 <0.002 <0.002 <0Loveland Reservoir near dam site 1 4-May-1999 1050 <0.003 <0.002 <0.002 <0.002 <0Loveland Reservoir near dam site 1 13-July-1999 1020 <0.003 <0.002 <0.002 <0.002 <0Loveland Reservoir near dam site 1 13-July-1999 1030 <0.003 <0.002 <0.002 <0.002 <0
2,6-Diethyaniline
Acetochlor Alachlor alpha-HCH Atra
PCODE 82660 49260 46342 34253 39
Site name Date Time (µµµµg/L) (µµµµg/L) (µµµµg/L) (µµµµg/L) (µµµµ

and Loveland Reservoirs, San Diego County, California—Continued
.003 <0.002 <0.002 <0.002 <0.001 <0.002 <0.002 <0.003
.003 <0.002 <0.002 <0.002 <0.001 <0.002 <0.002 <0.003
.003 <0.002 <0.002 <0.002 <0.001 <0.002 <0.002 <0.003
.003 <0.002 <0.002 <0.002 <0.001 <0.002 <0.002 <0.003
.003 <0.002 <0.002 <0.002 <0.001 <0.002 <0.002 <0.003
.003 <0.002 <0.002 <0.002 <0.001 <0.002 <0.002 <0.003
.003 <0.002 <0.002 <0.002 <0.001 <0.002 <0.002 <0.003
.003 <0.002 <0.002 <0.002 <0.001 <0.002 <0.002 <0.003
.003 <0.002 <0.002 <0.002 <0.001 <0.002 <0.002 <0.003
.003 <0.002 <0.002 <0.002 <0.001 <0.002 <0.002 <0.003
.003 <0.002 <0.002 <0.002 <0.001 <0.002 <0.002 <0.003
.003 <0.002 <0.002 <0.002 <0.001 <0.002 <0.002 <0.003
.003 <0.002 <0.002 <0.002 <0.001 <0.002 <0.002 <0.003
.003 <0.002 <0.002 <0.002 <0.001 <0.002 <0.002 <0.003
.003 <0.002 <0.002 <0.002 <0.001 <0.002 <0.002 <0.003
.003 <0.002 <0.002 <0.002 <0.001 <0.002 <0.002 <0.003
.003 <0.002 <0.002 <0.002 <0.001 <0.002 <0.002 <0.003
.003 <0.002 <0.002 <0.002 <0.001 <0.002 <0.002 <0.003
.003 <0.002 <0.002 <0.002 <0.001 <0.002 <0.002 <0.003
.003 <0.002 <0.002 <0.002 <0.001 <0.002 <0.002 <0.003
.003 <0.002 <0.002 <0.002 <0.001 <0.002 <0.002 <0.003
.003 <0.002 <0.002 <0.002 <0.001 <0.002 <0.002 <0.003
.003 <0.002 <0.002 <0.002 0.004 <0.002 <0.002 <0.003
2,6-yaniline
Acetochlor Alachlor alpha-HCH Atrazine Benfluralin Butylate Carbaryl
2660 49260 46342 34253 39632 82673 4028 82680
g/L) (µµµµg/L) (µµµµg/L) (µµµµg/L) (µµµµg/L) (µµµµg/L) (µµµµg/L) (µµµµg/L)
Table 4. Analytical results for pesticide concentrations in water samples, Sweetwater
63 Table 4
Loveland Reservoir near dam site 1 21-Sep-1999 1000 <0Loveland Reservoir near dam site 1 21-Sep-1999 1020 <0Loveland Reservoir east end near source inlet site 2 10-Sep-1998 1650 <0Loveland Reservoir east end near source inlet site 2 10-Sep-1998 1700 <0Loveland Reservoir east end near source inlet site 2 4-Nov-1998 1155 <0Loveland Reservoir east end near source inlet site 2 4-Nov-1998 1205 <0Loveland Reservoir east end near source inlet site 2 7-Jan-1999 1035 <0Loveland Reservoir east end near source inlet site 2 2-Mar-1999 1220 <0Loveland Reservoir east end near source inlet site 2 4-May-1999 1120 <0Loveland Reservoir east end near source inlet site 2 4-May-1999 1130 <0Loveland Reservoir east end near source inlet site 2 13-July-1999 1100 <0Sweetwater River at low flow barrier at SWR 6-Jan-1999 1515 <0Sweetwater River at low flow barrier at SWR 7-Jan-1999 1420 <0Sweetwater River at low flow barrier at SWR 2-Mar-1999 1540 <0Sweetwater River at low flow barrier at SWR 3-May-1999 1645 <0Sweetwater River at low flow barrier at SWR 12-July-1999 1620 <0Sweetwater River at low flow barrier at SWR 20-Sep-1999 1630 <0Perdue Treatment Plant—finished water at SWR 7-Jan-1999 1350 <0Perdue Treatment Plant—finished water at SWR 2-Mar-1999 1630 <0Perdue Treatment Plant—finished water at SWR 3-May-1999 1607 <0Perdue Treatment Plant—finished water at SWR 12-July-1999 1700 <0Perdue Treatment Plant—finished water at SWR 20-Sep-1999 1430 <0Perdue Treatment Plant—imported raw water at SWR 20-Sep-1999 1500 <0
Dieth
PCODE 8
Site name Date Time (µµµµ

—Continued
thyl-zine
Diazinon Dieldrin Disulfoton
40 39572 39381 82677
g/L) (µµµµg/L) (µµµµg/L) (µµµµg/L)
.002 0.012 <0.001 <0.017
.002 E0.003 <0.001 <0.017
.002 E0.004 <0.001 <0.017
.002 <0.010 <0.001 <0.017
.002 <0.010 <0.001 <0.017
.002 <0.002 <0.001 <0.017
.002 0.007 <0.001 <0.017
.002 E0.003 <0.001 <0.017
.002 0.007 <0.001 <0.017
.002 <0.002 <0.001 <0.017
.002 <0.002 <0.001 <0.017
.002 <0.010 <0.001 <0.017
.002 <0.002 <0.001 <0.017
.002 0.008 <0.001 <0.017
.002 E0.004 <0.001 <0.017
.002 0.004 <0.001 <0.017
.002 <0.002 <0.001 <0.017
.002 <0.002 <0.001 <0.017
.002 0.013 <0.001 <0.017
.002 E0.003 <0.001 <0.017
.002 <0.002 <0.001 <0.017
.002 <0.002 <0.001 <0.017
.002 0.011 <0.001 <0.017
.002 0.005 <0.001 <0.017
.002 E0.009 <0.001 <0.017
.002 <0.010 <0.001 <0.017
.002 0.009 <0.001 <0.017
.002 <0.002 <0.001 <0.017
.002 0.004 <0.001 <0.017
.002 E0.004 <0.001 <0.017
.002 <0.002 <0.001 <0.017
.002 <0.002 <0.001 <0.017
.002 <0.010 <0.001 <0.017
.002 <0.002 <0.001 <0.017
.002 0.009 <0.001 <0.017
.002 0.007 <0.001 <0.017
.002 <0.010 <0.001 <0.017
.002 E0.004 <0.001 <0.017
Table 4. Analytical results for pesticide concentrations in water samples, Sweetwater and Loveland Reservoirs, San Diego County, California
64 Table 4
Carbofuran Chlorpyrifos Cyanazine DacthalDeeatra
PCODE 82674 38933 4041 82682 40
Site name Date Time (µµµµg/L) (µµµµg/L) (µµµµg/L) (µµµµg/L) (µµµµ
SWR near pump tower 9-Sep-1998 1550 <0.003 <0.004 <0.004 <0.002 <0SWR near pump tower 9-Sep-1998 1600 <0.003 <0.004 <0.004 <0.002 <0SWR near pump tower 3-Nov-1998 1030 <0.003 <0.004 <0.004 <0.002 <0SWR near pump tower 3-Nov-1998 1040 <0.003 <0.004 <0.004 <0.002 <0SWR near pump tower 6-Jan-1999 0930 <0.003 <0.004 <0.004 <0.002 <0SWR near pump tower 1-Mar-1999 1030 <0.003 <0.004 <0.004 <0.002 <0SWR near pump tower 1-Mar-1999 1045 <0.003 <0.004 <0.004 <0.002 <0SWR near pump tower 3-May-1999 1115 <0.003 <0.004 <0.004 <0.002 <0SWR near pump tower 3-May-1999 1130 <0.003 <0.004 <0.004 <0.002 <0SWR near pump tower 12-Jul-1999 1120 <0.003 <0.004 <0.004 <0.002 <0SWR near pump tower 12-Jul-1999 1130 <0.003 <0.004 <0.004 <0.002 <0SWR near pump tower 20-Sep-1999 1140 <0.003 <0.004 <0.004 <0.002 <0SWR near pump tower 20-Sep-1999 1150 <0.003 <0.004 <0.004 <0.002 <0SWR near Vista del Lago station 10-Sep-1998 0845 <0.003 <0.004 <0.004 <0.002 <0SWR near Vista del Lago station 10-Sep-1998 0900 <0.003 <0.004 <0.004 <0.002 <0SWR near Vista del Lago station 3-Nov-1998 1110 <0.003 <0.004 <0.004 <0.002 <0SWR near Vista del Lago station 6-Jan-1999 1000 <0.003 <0.004 <0.004 <0.002 <0SWR near Vista del Lago station 1-Mar-1999 1100 <0.003 <0.004 <0.004 <0.002 <0SWR near Vista del Lago station 3-May-1999 1150 <0.003 <0.004 <0.004 <0.002 <0SWR near Vista del Lago station 3-May-1999 1200 <0.003 <0.004 <0.004 <0.002 <0SWR near Vista del Lago station 12-July-1999 1210 <0.003 <0.004 <0.004 <0.002 <0SWR near Vista del Lago station 12-July-1999 1220 <0.003 <0.004 <0.004 <0.002 <0SWR center of minimum pool 9-Sep-1998 1630 <0.003 <0.004 <0.004 <0.002 <0SWR center of minimum pool 9-Sep-1998 1640 <0.003 <0.004 <0.004 <0.002 <0SWR center of minimum pool 3-Nov-1998 1140 <0.003 <0.004 <0.004 <0.002 <0SWR center of minimum pool 3-Nov-1998 1150 <0.003 <0.004 <0.004 <0.002 <0SWR center of minimum pool 6-Jan-1999 1030 <0.003 <0.004 <0.004 <0.002 <0SWR center of minimum pool 1-Mar-1999 1130 <0.003 <0.004 <0.004 <0.002 <0SWR center of minimum pool 3-May-1999 1235 <0.003 <0.004 <0.004 <0.002 <0SWR center of minimum pool 3-May-1999 1240 <0.003 <0.004 <0.004 <0.002 <0SWR center of minimum pool 12-July-1999 1240 <0.003 <0.004 <0.004 <0.002 <0SWR center of minimum pool 12-July-1999 1250 <0.003 <0.004 <0.004 <0.002 <0SWR center of minimum pool 20-Sep-1999 1220 <0.003 <0.004 <0.004 <0.002 <0SWR center of minimum pool 20-Sep-1999 1230 <0.003 <0.004 <0.004 <0.002 <0SWR near recreation area 10-Sep-1998 1010 <0.003 <0.004 <0.004 <0.002 <0SWR near recreation area 10-Sep-1998 1020 <0.003 <0.004 <0.004 <0.002 <0SWR near recreation area 3-Nov-1998 1205 <0.003 <0.004 <0.004 <0.002 <0SWR near recreation area 3-Nov-1998 1215 <0.003 <0.004 <0.004 <0.002 <0

lifornia—Continued
<0.002 0.006 <0.001 <0.017<0.002 <0.002 <0.001 <0.017<0.002 0.004 <0.001 <0.017<0.002 0.005 <0.001 <0.017<0.002 <0.002 <0.001 <0.017<0.002 <0.002 <0.001 <0.017<0.002 0.011 <0.001 <0.017<0.002 0.006 <0.001 <0.017<0.002 0.007 <0.001 <0.017<0.002 <0.002 <0.001 <0.017<0.002 <0.002 <0.001 <0.017<0.002 0.005 <0.001 <0.017<0.002 0.005 <0.001 <0.017<0.002 <0.002 <0.001 <0.017<0.002 E0.002 <0.001 <0.017<0.002 0.005 <0.001 <0.017<0.002 <0.002 <0.001 <0.017<0.002 0.005 <0.001 <0.017<0.002 <0.002 <0.001 <0.017<0.002 <0.010 <0.001 <0.017<0.002 0.010 <0.001 <0.017<0.002 E0.004 <0.001 <0.017<0.002 <0.002 <0.001 <0.017<0.002 <0.010 <0.001 <0.017<0.002 <0.002 <0.001 <0.017<0.002 E0.004 <0.001 <0.017<0.002 <0.010 <0.001 <0.017<0.002 <0.002 <0.001 <0.017<0.002 <0.002 <0.001 <0.017<0.002 <0.002 <0.001 <0.017<0.002 <0.002 <0.001 <0.017<0.002 <0.002 <0.001 <0.017<0.002 <0.002 <0.001 <0.017<0.002 <0.002 <0.001 <0.017<0.002 <0.002 <0.001 <0.017<0.002 <0.002 <0.001 <0.017<0.002 <0.002 <0.001 <0.017<0.002 <0.002 <0.001 <0.017<0.002 <0.002 <0.001 <0.017
Deethyl-atrazine
Diazinon Dieldrin Disulfoton
4040 39572 39381 82677
(µµµµg/L) (µµµµg/L) (µµµµg/L) (µµµµg/L)
Table 4. Analytical results for pesticide concentrations in water samples, Sweetwater and Loveland Reservoirs, San Diego County, Ca
65 Table 4
SWR near recreation area 6-Jan-1999 1100 <0.003 <0.004 <0.004 <0.002SWR near recreation area 1-Mar-1999 1220 <0.003 <0.004 <0.004 <0.002SWR near recreation area 3-May-1999 1310 <0.003 <0.004 <0.004 <0.002SWR near recreation area 3-May-1999 1320 <0.003 <0.004 <0.004 <0.002SWR near recreation area 12-July-1999 1320 <0.003 <0.004 <0.004 <0.002SWR near recreation area 12-July-1999 1330 <0.003 <0.004 <0.004 <0.002SWR minimum pool boundary east 10-Sep-1998 1240 <0.003 <0.004 <0.004 <0.002SWR minimum pool boundary east 10-Sep-1998 1250 <0.003 <0.004 <0.004 <0.002SWR minimum pool boundary east 3-Nov-1998 1340 <0.003 <0.004 <0.004 <0.002SWR minimum pool boundary east 6-Jan-1999 1130 <0.003 <0.004 <0.004 <0.002SWR minimum pool boundary east 2-Mar-1999 0840 <0.003 <0.004 <0.004 <0.002SWR minimum pool boundary east 3-May-1999 1350 <0.003 <0.004 <0.004 <0.002SWR minimum pool boundary east 3-May-1999 1400 <0.003 <0.004 <0.004 <0.002SWR minimum pool boundary east 12-July-1999 1420 <0.003 <0.004 <0.004 <0.002SWR east end reservoir fill boundary 10-Sep-1998 1310 <0.003 <0.004 <0.004 <0.002SWR east end reservoir fill boundary 3-Nov-1998 1400 <0.003 <0.004 <0.004 <0.002SWR east end reservoir fill boundary 6-Jan-1999 1150 <0.003 <0.004 <0.004 <0.002SWR east end reservoir fill boundary 3-May-1999 1440 <0.003 <0.004 <0.004 <0.002SWR east end reservoir fill boundary 12-July-1999 1440 <0.003 <0.004 <0.004 <0.002SWR east end reservoir fill boundary 20-Sep-1999 1250 <0.003 <0.004 <0.004 <0.002SWR near Gum Tree Cove Pond 10-Sep-1998 0930 <0.003 <0.004 <0.004 <0.002SWR near Gum Tree Cove Pond 10-Sep-1998 0940 <0.003 <0.004 <0.004 <0.002SWR near Gum Tree Cove Pond 3-Nov-1998 1430 <0.003 <0.004 <0.004 <0.002SWR near Gum Tree Cove Pond 6-Jan-1999 1220 <0.003 <0.004 <0.004 <0.002SWR near Gum Tree Cove Pond 1-Mar-1999 1310 <0.003 <0.004 <0.004 <0.002SWR near Gum Tree Cove Pond 3-May-1999 1510 <0.003 <0.004 <0.004 <0.002SWR near Gum Tree Cove Pond 12-July-1999 1500 <0.003 <0.004 <0.004 <0.002Loveland Reservoir near dam site 1 10-Sep-1998 1610 <0.003 <0.004 <0.004 <0.002Loveland Reservoir near dam site 1 10-Sep-1998 1620 <0.003 <0.004 <0.004 <0.002Loveland Reservoir near dam site 1 4-Nov-1998 1030 <0.003 <0.004 <0.004 <0.002Loveland Reservoir near dam site 1 4-Nov-1998 1040 <0.003 <0.004 <0.004 <0.002Loveland Reservoir near dam site 1 7-Jan-1999 1010 <0.003 <0.004 <0.004 <0.002Loveland Reservoir near dam site 1 2-Mar-1999 1150 <0.003 <0.004 <0.004 <0.002Loveland Reservoir near dam site 1 4-May-1999 1040 <0.003 <0.004 <0.004 <0.002Loveland Reservoir near dam site 1 4-May-1999 1050 <0.003 <0.004 <0.004 <0.002Loveland Reservoir near dam site 1 13-July-1999 1020 <0.003 <0.004 <0.004 <0.002Loveland Reservoir near dam site 1 13-July-1999 1030 <0.003 <0.004 <0.004 <0.002Loveland Reservoir near dam site 1 21-Sep-1999 1000 <0.003 <0.004 <0.004 <0.002Loveland Reservoir near dam site 1 21-Sep-1999 1020 <0.003 <0.004 <0.004 <0.002
Carbofuran Chlorpyrifos Cyanazine Dacthal
PCODE 82674 38933 4041 82682
Site name Date Time (µµµµg/L) (µµµµg/L) (µµµµg/L) (µµµµg/L)

Table 4. Analytical results for pesticide concentrations in water samples, Sweetwater and Loveland Reservoirs, San Diego County, California—Continued
66
Love <0.004 <0.002 <0.002 <0.002 <0.001 <0.017Love <0.004 <0.002 <0.002 <0.002 <0.001 <0.017Love <0.004 <0.002 <0.002 <0.002 <0.001 <0.017Love <0.004 <0.002 <0.002 <0.002 <0.001 <0.017Love <0.004 <0.002 <0.002 <0.002 <0.001 <0.017Love <0.004 <0.002 <0.002 <0.002 <0.001 <0.017Love <0.004 <0.002 <0.002 <0.002 <0.001 <0.017Love <0.004 <0.002 <0.002 <0.002 <0.001 <0.017Love <0.004 <0.002 <0.002 <0.002 <0.001 <0.017Swee <0.004 <0.002 <0.002 <0.010 <0.001 <0.017Swee <0.004 <0.002 <0.002 <0.010 <0.001 <0.017Swee <0.004 <0.002 <0.002 <0.002 <0.001 <0.017Swee <0.004 <0.002 <0.002 <0.002 <0.001 <0.017Swee <0.004 <0.002 <0.002 <0.002 <0.001 <0.017Swee <0.004 <0.002 <0.002 <0.002 <0.001 <0.017Perd <0.004 <0.002 <0.002 <0.002 <0.001 <0.017Perd <0.004 <0.002 <0.002 <0.002 <0.001 <0.017Perd <0.004 <0.002 <0.002 <0.002 <0.001 <0.017Perd <0.004 <0.002 <0.002 <0.002 <0.001 <0.017Perd <0.004 <0.002 <0.002 <0.002 <0.001 <0.017Perd <0.004 <0.002 <0.002 <0.002 <0.001 <0.017
os Cyanazine DacthalDeethyl-atrazine
Diazinon Dieldrin Disulfoton
4041 82682 4040 39572 39381 82677
(µµµµg/L) (µµµµg/L) (µµµµg/L) (µµµµg/L) (µµµµg/L) (µµµµg/L)
Table 4
land Reservoir east end near source inlet site 2 10-Sep-1998 1650 <0.003 <0.004land Reservoir east end near source inlet site 2 10-Sep-1998 1700 <0.003 <0.004land Reservoir east end near source inlet site 2 4-Nov-1998 1155 <0.003 <0.004land Reservoir east end near source inlet site 2 4-Nov-1998 1205 <0.003 <0.004land Reservoir east end near source inlet site 2 7-Jan-1999 1035 <0.003 <0.004land Reservoir east end near source inlet site 2 2-Mar-1999 1220 <0.003 <0.004land Reservoir east end near source inlet site 2 4-May-1999 1120 <0.003 <0.004land Reservoir east end near source inlet site 2 4-May-1999 1130 <0.003 <0.004land Reservoir east end near source inlet site 2 13-July-1999 1100 <0.003 <0.004twater River at low flow barrier at SWR 6-Jan-1999 1515 <0.003 <0.004twater River at low flow barrier at SWR 7-Jan-1999 1420 <0.003 <0.004twater River at low flow barrier at SWR 2-Mar-1999 1540 <0.003 <0.004twater River at low flow barrier at SWR 3-May-1999 1645 <0.003 <0.004twater River at low flow barrier at SWR 12-July-1999 1620 <0.003 <0.004twater River at low flow barrier at SWR 20-Sep-1999 1630 <0.003 <0.004
ue Treatment Plant—finished water at SWR 7-Jan-1999 1350 <0.003 <0.004ue Treatment Plant—finished water at SWR 2-Mar-1999 1630 <0.003 <0.004ue Treatment Plant—finished water at SWR 3-May-1999 1607 <0.003 <0.004ue Treatment Plant—finished water at SWR 12-July-1999 1700 <0.003 <0.004ue Treatment Plant—finished water at SWR 20-Sep-1999 1430 <0.003 <0.004ue Treatment Plant—imported raw water at SWR 20-Sep-1999 1500 <0.003 <0.004
Carbofuran Chlorpyrif
PCODE 82674 38933
Site name Date Time (µµµµg/L) (µµµµg/L)

lifornia—Continued
Lindane Linuron MalathionAzinphos-
methyl
39341 82666 39532 82686
(µµµµg/L) (µµµµg/L) (µµµµg/L) (µµµµg/L)
<0.004 <0.002 <0.005 <0.001<0.004 <0.002 0.009 <0.001<0.004 <0.002 <0.005 <0.001<0.004 <0.002 <0.005 <0.001<0.004 <0.002 <0.005 <0.001<0.004 <0.002 <0.005 <0.001<0.004 <0.002 <0.005 <0.001<0.004 <0.002 <0.005 <0.001<0.004 <0.002 <0.005 <0.001<0.004 <0.002 <0.005 <0.001<0.004 <0.002 <0.005 <0.001<0.004 <0.002 <0.005 <0.001<0.004 <0.002 <0.005 <0.001<0.004 <0.002 <0.005 <0.001<0.004 <0.002 <0.005 <0.001<0.004 <0.002 <0.005 <0.001<0.004 <0.002 <0.005 <0.001<0.004 <0.002 <0.005 <0.001<0.004 <0.002 <0.005 <0.001<0.004 <0.002 <0.005 <0.001<0.004 <0.002 <0.005 <0.001<0.004 <0.002 <0.005 <0.001<0.004 <0.002 <0.005 <0.001<0.004 <0.002 <0.005 <0.001<0.004 <0.002 <0.005 <0.001<0.004 <0.002 <0.005 <0.001<0.004 <0.002 <0.005 <0.001<0.004 <0.002 <0.005 <0.001<0.004 <0.002 <0.005 <0.001<0.004 <0.002 <0.005 <0.001<0.004 <0.002 <0.005 <0.001<0.004 <0.002 <0.005 <0.001<0.004 <0.002 <0.005 <0.001<0.004 <0.002 <0.005 <0.001<0.004 <0.002 <0.005 <0.001<0.004 <0.002 <0.005 <0.001<0.004 <0.002 <0.005 <0.001<0.004 <0.002 <0.005 <0.001
Table 4. Analytical results for pesticide concentrations in water samples, Sweetwater and Loveland Reservoirs, San Diego County, Ca
67 Table 4
EPTC Ethalfluralin Ethoprophos Fonofos
PCODE 82668 82663 82672 4095
Site name Date Time (µµµµg/L) (µµµµg/L) (µµµµg/L) (µµµµg/L)
SWR near pump tower 9-Sep-1998 1550 <0.002 <0.004 <0.003 <0.003SWR near pump tower 9-Sep-1998 1600 <0.002 <0.004 <0.003 <0.003SWR near pump tower 3-Nov-1998 1030 <0.002 <0.004 <0.003 <0.003SWR near pump tower 3-Nov-1998 1040 <0.002 <0.004 <0.003 <0.003SWR near pump tower 6-Jan-1999 0930 <0.002 <0.004 <0.003 <0.003SWR near pump tower 1-Mar-1999 1030 <0.002 <0.004 <0.003 <0.003SWR near pump tower 1-Mar-1999 1045 <0.002 <0.004 <0.003 <0.003SWR near pump tower 3-May-1999 1115 <0.002 <0.004 <0.003 <0.003SWR near pump tower 3-May-1999 1130 <0.002 <0.004 <0.003 <0.003SWR near pump tower 12-Jul-1999 1120 <0.002 <0.004 <0.003 <0.003SWR near pump tower 12-Jul-1999 1130 <0.002 <0.004 <0.003 <0.003SWR near pump tower 20-Sep-1999 1140 <0.002 <0.004 <0.003 <0.003SWR near pump tower 20-Sep-1999 1150 <0.002 <0.004 <0.003 <0.003SWR near Vista del Lago station 10-Sep-1998 0845 <0.002 <0.004 <0.003 <0.003SWR near Vista del Lago station 10-Sep-1998 0900 <0.002 <0.004 <0.003 <0.003SWR near Vista del Lago station 3-Nov-1998 1110 <0.002 <0.004 <0.003 <0.003SWR near Vista del Lago station 6-Jan-1999 1000 <0.002 <0.004 <0.003 <0.003SWR near Vista del Lago station 1-Mar-1999 1100 <0.002 <0.004 <0.003 <0.003SWR near Vista del Lago station 3-May-1999 1150 <0.002 <0.004 <0.003 <0.003SWR near Vista del Lago station 3-May-1999 1200 <0.002 <0.004 <0.003 <0.003SWR near Vista del Lago station 12-July-1999 1210 <0.002 <0.004 <0.003 <0.003SWR near Vista del Lago station 12-July-1999 1220 <0.002 <0.004 <0.003 <0.003SWR center of minimum pool 9-Sep-1998 1630 <0.002 <0.004 <0.003 <0.003SWR center of minimum pool 9-Sep-1998 1640 <0.002 <0.004 <0.003 <0.003SWR center of minimum pool 3-Nov-1998 1140 <0.002 <0.004 <0.003 <0.003SWR center of minimum pool 3-Nov-1998 1150 <0.002 <0.004 <0.003 <0.003SWR center of minimum pool 6-Jan-1999 1030 <0.002 <0.004 <0.003 <0.003SWR center of minimum pool 1-Mar-1999 1130 <0.002 <0.004 <0.003 <0.003SWR center of minimum pool 3-May-1999 1235 <0.002 <0.004 <0.003 <0.003SWR center of minimum pool 3-May-1999 1240 <0.002 <0.004 <0.003 <0.003SWR center of minimum pool 12-July-1999 1240 <0.002 <0.004 <0.003 <0.003SWR center of minimum pool 12-July-1999 1250 <0.002 <0.004 <0.003 <0.003SWR center of minimum pool 20-Sep-1999 1220 <0.002 <0.004 <0.003 <0.003SWR center of minimum pool 20-Sep-1999 1230 <0.002 <0.004 <0.003 <0.003SWR near recreation area 10-Sep-1998 1010 <0.002 <0.004 <0.003 <0.003SWR near recreation area 10-Sep-1998 1020 <0.002 <0.004 <0.003 <0.003SWR near recreation area 3-Nov-1998 1205 <0.002 <0.004 <0.003 <0.003SWR near recreation area 3-Nov-1998 1215 <0.002 <0.004 <0.003 <0.003

—Continued
.004 <0.002 <0.005 <0.001
.004 <0.002 <0.005 <0.001
.004 <0.002 <0.005 <0.001
.004 <0.002 <0.005 <0.001
.004 <0.002 <0.005 <0.001
.004 <0.002 <0.005 <0.001
.004 <0.002 <0.005 <0.001
.004 <0.002 <0.005 <0.001
.004 <0.002 <0.005 <0.001
.004 <0.002 <0.005 <0.001
.004 <0.002 <0.005 <0.001
.004 <0.002 <0.005 <0.001
.004 <0.002 <0.005 <0.001
.004 <0.002 <0.005 <0.001
.004 <0.002 <0.005 <0.001
.004 <0.002 <0.005 <0.001
.004 <0.002 <0.005 <0.001
.004 <0.002 <0.005 <0.001
.004 <0.002 <0.005 <0.001
.004 <0.002 <0.005 <0.001
.004 <0.002 <0.005 <0.001
.004 <0.002 <0.005 <0.001
.004 <0.002 <0.005 <0.001
.004 <0.002 <0.005 <0.001
.004 <0.002 <0.005 <0.001
.004 <0.002 <0.005 <0.001
.004 <0.002 <0.005 <0.001
.004 <0.002 <0.005 <0.001
.004 <0.002 <0.005 <0.001
.004 <0.002 <0.005 <0.001
.004 <0.002 <0.005 <0.001
.004 <0.002 <0.005 <0.001
.004 <0.002 <0.005 <0.001
.004 <0.002 <0.005 <0.001
.004 <0.002 <0.005 <0.001
.004 <0.002 <0.005 <0.001
.004 <0.002 <0.005 <0.001
.004 <0.002 <0.005 <0.001
.004 <0.002 <0.005 <0.001
ane Linuron MalathionAzinphos-
methyl
341 82666 39532 82686
g/L) (µµµµg/L) (µµµµg/L) (µµµµg/L)
Table 4. Analytical results for pesticide concentrations in water samples, Sweetwater and Loveland Reservoirs, San Diego County, California
68 Table 4
SWR near recreation area 6-Jan-1999 1100 <0.002 <0.004 <0.003 <0.003 <0SWR near recreation area 1-Mar-1999 1220 <0.002 <0.004 <0.003 <0.003 <0SWR near recreation area 3-May-1999 1310 <0.002 <0.004 <0.003 <0.003 <0SWR near recreation area 3-May-1999 1320 <0.002 <0.004 <0.003 <0.003 <0SWR near recreation area 12-July-1999 1320 <0.002 <0.004 <0.003 <0.003 <0SWR near recreation area 12-July-1999 1330 <0.002 <0.004 <0.003 <0.003 <0SWR minimum pool boundary east 10-Sep-1998 1240 <0.002 <0.004 <0.003 <0.003 <0SWR minimum pool boundary east 10-Sep-1998 1250 <0.002 <0.004 <0.003 <0.003 <0SWR minimum pool boundary east 3-Nov-1998 1340 <0.002 <0.004 <0.003 <0.003 <0SWR minimum pool boundary east 6-Jan-1999 1130 <0.002 <0.004 <0.003 <0.003 <0SWR minimum pool boundary east 2-Mar-1999 0840 <0.002 <0.004 <0.003 <0.003 <0SWR minimum pool boundary east 3-May-1999 1350 <0.002 <0.004 <0.003 <0.003 <0SWR minimum pool boundary east 3-May-1999 1400 <0.002 <0.004 <0.003 <0.003 <0SWR minimum pool boundary east 12-July-1999 1420 <0.002 <0.004 <0.003 <0.003 <0SWR east end reservoir fill boundary 10-Sep-1998 1310 <0.002 <0.004 <0.003 <0.003 <0SWR east end reservoir fill boundary 3-Nov-1998 1400 <0.002 <0.004 <0.003 <0.003 <0SWR east end reservoir fill boundary 6-Jan-1999 1150 <0.002 <0.004 <0.003 <0.003 <0SWR east end reservoir fill boundary 3-May-1999 1440 <0.002 <0.004 <0.003 <0.003 <0SWR east end reservoir fill boundary 12-July-1999 1440 <0.002 <0.004 <0.003 <0.003 <0SWR east end reservoir fill boundary 20-Sep-1999 1250 <0.002 <0.004 <0.003 <0.003 <0SWR near Gum Tree Cove Pond 10-Sep-1998 0930 <0.002 <0.004 <0.003 <0.003 <0SWR near Gum Tree Cove Pond 10-Sep-1998 0940 <0.002 <0.004 <0.003 <0.003 <0SWR near Gum Tree Cove Pond 3-Nov-1998 1430 <0.002 <0.004 <0.003 <0.003 <0SWR near Gum Tree Cove Pond 6-Jan-1999 1220 <0.002 <0.004 <0.003 <0.003 <0SWR near Gum Tree Cove Pond 1-Mar-1999 1310 <0.002 <0.004 <0.003 <0.003 <0SWR near Gum Tree Cove Pond 3-May-1999 1510 <0.002 <0.004 <0.003 <0.003 <0SWR near Gum Tree Cove Pond 12-July-1999 1500 <0.002 <0.004 <0.003 <0.003 <0Loveland Reservoir near dam site 1 10-Sep-1998 1610 <0.002 <0.004 <0.003 <0.003 <0Loveland Reservoir near dam site 1 10-Sep-1998 1620 <0.002 <0.004 <0.003 <0.003 <0Loveland Reservoir near dam site 1 4-Nov-1998 1030 <0.002 <0.004 <0.003 <0.003 <0Loveland Reservoir near dam site 1 4-Nov-1998 1040 <0.002 <0.004 <0.003 <0.003 <0Loveland Reservoir near dam site 1 7-Jan-1999 1010 <0.002 <0.004 <0.003 <0.003 <0Loveland Reservoir near dam site 1 2-Mar-1999 1150 <0.002 <0.004 <0.003 <0.003 <0Loveland Reservoir near dam site 1 4-May-1999 1040 <0.002 <0.004 <0.003 <0.003 <0Loveland Reservoir near dam site 1 4-May-1999 1050 <0.002 <0.004 <0.003 <0.003 <0Loveland Reservoir near dam site 1 13-July-1999 1020 <0.002 <0.004 <0.003 <0.003 <0Loveland Reservoir near dam site 1 13-July-1999 1030 <0.002 <0.004 <0.003 <0.003 <0Loveland Reservoir near dam site 1 21-Sep-1999 1000 <0.002 <0.004 <0.003 <0.003 <0Loveland Reservoir near dam site 1 21-Sep-1999 1020 <0.002 <0.004 <0.003 <0.003 <0
EPTC Ethalfluralin Ethoprophos Fonofos Lind
PCODE 82668 82663 82672 4095 39
Site name Date Time (µµµµg/L) (µµµµg/L) (µµµµg/L) (µµµµg/L) (µµµµ

ter and Loveland Reservoirs, San Diego County, California—Continued
<0.002 <0.004 <0.003 <0.003 <0.004 <0.002 <0.005 <0.001<0.002 <0.004 <0.003 <0.003 <0.004 <0.002 <0.005 <0.001<0.002 <0.004 <0.003 <0.003 <0.004 <0.002 <0.005 <0.001<0.002 <0.004 <0.003 <0.003 <0.004 <0.002 <0.005 <0.001<0.002 <0.004 <0.003 <0.003 <0.004 <0.002 <0.005 <0.001<0.002 <0.004 <0.003 <0.003 <0.004 <0.002 <0.005 <0.001<0.002 <0.004 <0.003 <0.003 <0.004 <0.002 <0.005 <0.001<0.002 <0.004 <0.003 <0.003 <0.004 <0.002 <0.005 <0.001<0.002 <0.004 <0.003 <0.003 <0.004 <0.002 <0.005 <0.001<0.002 <0.004 <0.003 <0.003 <0.004 <0.002 <0.005 <0.001<0.002 <0.004 <0.003 <0.003 <0.004 <0.002 <0.005 <0.001<0.002 <0.004 <0.003 <0.003 <0.004 <0.002 <0.005 <0.001<0.002 <0.004 <0.003 <0.003 <0.004 <0.002 <0.005 <0.001<0.002 <0.004 <0.003 <0.003 <0.004 <0.002 <0.005 <0.001<0.002 <0.004 <0.003 <0.003 <0.004 <0.002 <0.005 <0.001<0.002 <0.004 <0.003 0.020 <0.004 <0.002 <0.005 <0.001<0.002 <0.004 <0.003 <0.003 <0.004 <0.002 <0.005 <0.001<0.002 <0.004 <0.003 <0.003 <0.004 <0.002 <0.005 <0.001<0.002 <0.004 <0.003 <0.003 <0.004 <0.002 <0.005 <0.001<0.002 <0.004 <0.003 <0.003 <0.004 <0.002 <0.005 <0.001<0.002 <0.004 <0.003 <0.003 <0.004 <0.002 <0.005 <0.001
EPTC Ethalfluralin Ethoprophos Fonofos Lindane Linuron MalathionAzinphos-
methyl
82668 82663 82672 4095 39341 82666 39532 82686
(µµµµg/L) (µµµµg/L) (µµµµg/L) (µµµµg/L) (µµµµg/L) (µµµµg/L) (µµµµg/L) (µµµµg/L)
Table 4. Analytical results for pesticide concentrations in water samples, Sweetwa
69 Table 4
Loveland Reservoir east end near source inlet site 2 10-Sep-1998 1650Loveland Reservoir east end near source inlet site 2 10-Sep-1998 1700Loveland Reservoir east end near source inlet site 2 4-Nov-1998 1155Loveland Reservoir east end near source inlet site 2 4-Nov-1998 1205Loveland Reservoir east end near source inlet site 2 7-Jan-1999 1035Loveland Reservoir east end near source inlet site 2 2-Mar-1999 1220Loveland Reservoir east end near source inlet site 2 4-May-1999 1120Loveland Reservoir east end near source inlet site 2 4-May-1999 1130Loveland Reservoir east end near source inlet site 2 13-July-1999 1100Sweetwater River at low flow barrier at SWR 6-Jan-1999 1515Sweetwater River at low flow barrier at SWR 7-Jan-1999 1420Sweetwater River at low flow barrier at SWR 2-Mar-1999 1540Sweetwater River at low flow barrier at SWR 3-May-1999 1645Sweetwater River at low flow barrier at SWR 12-July-1999 1620Sweetwater River at low flow barrier at SWR 20-Sep-1999 1630Perdue Treatment Plant—finished water at SWR 7-Jan-1999 1350Perdue Treatment Plant—finished water at SWR 2-Mar-1999 1630Perdue Treatment Plant—finished water at SWR 3-May-1999 1607Perdue Treatment Plant—finished water at SWR 12-July-1999 1700Perdue Treatment Plant—finished water at SWR 20-Sep-1999 1430Perdue Treatment Plant—imported raw water at SWR 20-Sep-1999 1500
PCODE
Site name Date Time

—Continued
pamide p,p′′′′-DDE Parathion Pebulate
684 34653 39542 82669
g/L) (µµµµg/L) (µµµµg/L) (µµµµg/L)
.003 <0.006 <0.004 <0.004
.003 <0.006 <0.004 <0.004
.003 <0.006 <0.004 <0.004
.003 <0.006 <0.004 <0.004
.003 <0.006 <0.004 <0.004
.003 <0.006 <0.004 <0.004
.003 <0.006 <0.004 <0.004
.003 <0.006 <0.004 <0.004
.003 <0.006 <0.004 <0.004
.003 <0.006 <0.004 <0.004
.003 <0.006 <0.004 <0.004
.003 <0.006 <0.004 <0.004
.003 <0.006 <0.004 <0.004
.003 <0.006 <0.004 <0.004
.003 <0.006 <0.004 <0.004
.003 <0.006 <0.004 <0.004
.003 <0.006 <0.004 <0.004
.003 <0.006 <0.004 <0.004
.003 <0.006 <0.004 <0.004
.003 <0.006 <0.004 <0.004
.003 <0.006 <0.004 <0.004
.003 <0.006 <0.004 <0.004
.003 <0.006 <0.004 <0.004
.003 <0.006 <0.004 <0.004
.003 <0.006 <0.004 <0.004
.003 <0.006 <0.004 <0.004
.003 <0.006 <0.004 <0.004
.003 <0.006 <0.004 <0.004
.003 <0.006 <0.004 <0.004
.003 <0.006 <0.004 <0.004
.003 <0.006 <0.004 <0.004
.003 <0.006 <0.004 <0.004
.003 <0.006 <0.004 <0.004
.003 <0.006 <0.004 <0.004
.003 <0.006 <0.004 <0.004
.003 <0.006 <0.004 <0.004
.003 <0.006 <0.004 <0.004
.003 <0.006 <0.004 <0.004
Table 4. Analytical results for pesticide concentrations in water samples, Sweetwater and Loveland Reservoirs, San Diego County, California
70 Table 4
Parathion-methyl
Metolachor Metribuzin Molinate Napro
PCODE 82667 39415 82630 82671 82
Site name Date Time (µµµµg/L) (µµµµg/L) (µµµµg/L) (µµµµg/L) (µµµµ
SWR near pump tower 9-Sep-1998 1550 <0.006 <0.002 <0.004 <0.004 <0SWR near pump tower 9-Sep-1998 1600 <0.006 <0.002 <0.004 <0.004 <0SWR near pump tower 3-Nov-1998 1030 <0.006 <0.002 <0.004 <0.004 <0SWR near pump tower 3-Nov-1998 1040 <0.006 <0.002 <0.004 <0.004 <0SWR near pump tower 6-Jan-1999 0930 <0.006 <0.002 <0.004 <0.004 <0SWR near pump tower 1-Mar-1999 1030 <0.006 <0.002 <0.004 <0.004 <0SWR near pump tower 1-Mar-1999 1045 <0.006 <0.002 <0.004 <0.004 <0SWR near pump tower 3-May-1999 1115 <0.006 <0.002 <0.004 <0.004 <0SWR near pump tower 3-May-1999 1130 <0.006 <0.002 <0.004 <0.004 <0SWR near pump tower 12-Jul-1999 1120 <0.006 <0.002 <0.004 <0.004 <0SWR near pump tower 12-Jul-1999 1130 <0.006 <0.002 <0.004 <0.004 <0SWR near pump tower 20-Sep-1999 1140 <0.006 <0.002 <0.004 <0.004 <0SWR near pump tower 20-Sep-1999 1150 <0.006 <0.002 <0.004 <0.004 <0SWR near Vista del Lago station 10-Sep-1998 0845 <0.006 <0.002 <0.004 <0.004 <0SWR near Vista del Lago station 10-Sep-1998 0900 <0.006 <0.002 <0.004 <0.004 <0SWR near Vista del Lago station 3-Nov-1998 1110 <0.006 <0.002 <0.004 <0.004 <0SWR near Vista del Lago station 6-Jan-1999 1000 <0.006 <0.002 <0.004 <0.004 <0SWR near Vista del Lago station 1-Mar-1999 1100 <0.006 <0.002 <0.004 <0.004 <0SWR near Vista del Lago station 3-May-1999 1150 <0.006 <0.002 <0.004 <0.004 <0SWR near Vista del Lago station 3-May-1999 1200 <0.006 <0.002 <0.004 <0.004 <0SWR near Vista del Lago station 12-July-1999 1210 <0.006 <0.002 <0.004 <0.004 <0SWR near Vista del Lago station 12-July-1999 1220 <0.006 <0.002 <0.004 <0.004 <0SWR center of minimum pool 9-Sep-1998 1630 <0.006 <0.002 <0.004 <0.004 <0SWR center of minimum pool 9-Sep-1998 1640 <0.006 <0.002 <0.004 <0.004 <0SWR center of minimum pool 3-Nov-1998 1140 <0.006 <0.002 <0.004 <0.004 <0SWR center of minimum pool 3-Nov-1998 1150 <0.006 <0.002 <0.004 <0.004 <0SWR center of minimum pool 6-Jan-1999 1030 <0.006 <0.002 <0.004 <0.004 <0SWR center of minimum pool 1-Mar-1999 1130 <0.006 <0.002 <0.004 <0.004 <0SWR center of minimum pool 3-May-1999 1235 <0.006 <0.002 <0.004 <0.004 <0SWR center of minimum pool 3-May-1999 1240 <0.006 <0.002 <0.004 <0.004 <0SWR center of minimum pool 12-July-1999 1240 <0.006 <0.002 <0.004 <0.004 <0SWR center of minimum pool 12-July-1999 1250 <0.006 <0.002 <0.004 <0.004 <0SWR center of minimum pool 20-Sep-1999 1220 <0.006 <0.002 <0.004 <0.004 <0SWR center of minimum pool 20-Sep-1999 1230 <0.006 <0.002 <0.004 <0.004 <0SWR near recreation area 10-Sep-1998 1010 <0.006 <0.002 <0.004 <0.004 <0SWR near recreation area 10-Sep-1998 1020 <0.006 <0.002 <0.004 <0.004 <0SWR near recreation area 3-Nov-1998 1205 <0.006 <0.002 <0.004 <0.004 <0SWR near recreation area 3-Nov-1998 1215 <0.006 <0.002 <0.004 <0.004 <0

lifornia—Continued
<0.003 <0.006 <0.004 <0.004<0.003 <0.006 <0.004 <0.004<0.003 <0.006 <0.004 <0.004<0.003 <0.006 <0.004 <0.004<0.003 <0.006 <0.004 <0.004<0.003 <0.006 <0.004 <0.004<0.003 <0.006 <0.004 <0.004<0.003 <0.006 <0.004 <0.004<0.003 <0.006 <0.004 <0.004<0.003 <0.006 <0.004 <0.004<0.003 <0.006 <0.004 <0.004<0.003 <0.006 <0.004 <0.004<0.003 <0.006 <0.004 <0.004<0.003 <0.006 <0.004 <0.004<0.003 <0.006 <0.004 <0.004<0.003 <0.006 <0.004 <0.004<0.003 <0.006 <0.004 <0.004<0.003 <0.006 <0.004 <0.004<0.003 <0.006 <0.004 <0.004<0.003 <0.006 <0.004 <0.004<0.003 <0.006 <0.004 <0.004<0.003 <0.006 <0.004 <0.004<0.003 <0.006 <0.004 <0.004<0.003 <0.006 <0.004 <0.004<0.003 <0.006 <0.004 <0.004<0.003 <0.006 <0.004 <0.004<0.003 <0.006 <0.004 <0.004<0.003 <0.006 <0.004 <0.004<0.003 <0.006 <0.004 <0.004<0.003 <0.006 <0.004 <0.004<0.003 <0.006 <0.004 <0.004<0.003 <0.006 <0.004 <0.004<0.003 <0.006 <0.004 <0.004<0.003 <0.006 <0.004 <0.004<0.003 <0.006 <0.004 <0.004<0.003 <0.006 <0.004 <0.004<0.003 <0.006 <0.004 <0.004<0.003 <0.006 <0.004 <0.004<0.003 <0.006 <0.004 <0.004
Napropamide p,p′′′′-DDE Parathion Pebulate
82684 34653 39542 82669
(µµµµg/L) (µµµµg/L) (µµµµg/L) (µµµµg/L)
Table 4. Analytical results for pesticide concentrations in water samples, Sweetwater and Loveland Reservoirs, San Diego County, Ca
71 Table 4
SWR near recreation area 6-Jan-1999 1100 <0.006 <0.002 <0.004 <0.004SWR near recreation area 1-Mar-1999 1220 <0.006 <0.002 <0.004 <0.004SWR near recreation area 3-May-1999 1310 <0.006 <0.002 <0.004 <0.004SWR near recreation area 3-May-1999 1320 <0.006 <0.002 <0.004 <0.004SWR near recreation area 12-July-1999 1320 <0.006 <0.002 <0.004 <0.004SWR near recreation area 12-July-1999 1330 <0.006 <0.002 <0.004 <0.004SWR minimum pool boundary east 10-Sep-1998 1240 <0.006 <0.002 <0.004 <0.004SWR minimum pool boundary east 10-Sep-1998 1250 <0.006 <0.002 <0.004 <0.004SWR minimum pool boundary east 3-Nov-1998 1340 <0.006 <0.002 <0.004 <0.004SWR minimum pool boundary east 6-Jan-1999 1130 <0.006 <0.002 <0.004 <0.004SWR minimum pool boundary east 2-Mar-1999 0840 <0.006 <0.002 <0.004 <0.004SWR minimum pool boundary east 3-May-1999 1350 <0.006 <0.002 <0.004 <0.004SWR minimum pool boundary east 3-May-1999 1400 <0.006 <0.002 <0.004 <0.004SWR minimum pool boundary east 12-July-1999 1420 <0.006 <0.002 <0.004 <0.004SWR east end reservoir fill boundary 10-Sep-1998 1310 <0.006 <0.002 <0.004 <0.004SWR east end reservoir fill boundary 3-Nov-1998 1400 <0.006 <0.002 <0.004 <0.004SWR east end reservoir fill boundary 6-Jan-1999 1150 <0.006 <0.002 <0.004 <0.004SWR east end reservoir fill boundary 3-May-1999 1440 <0.006 <0.002 <0.004 <0.004SWR east end reservoir fill boundary 12-July-1999 1440 <0.006 <0.002 <0.004 <0.004SWR east end reservoir fill boundary 20-Sep-1999 1250 <0.006 <0.002 <0.004 <0.004SWR near Gum Tree Cove Pond 10-Sep-1998 0930 <0.006 <0.002 <0.004 <0.004SWR near Gum Tree Cove Pond 10-Sep-1998 0940 <0.006 <0.002 <0.004 <0.004SWR near Gum Tree Cove Pond 3-Nov-1998 1430 <0.006 <0.002 <0.004 <0.004SWR near Gum Tree Cove Pond 6-Jan-1999 1220 <0.006 <0.002 <0.004 <0.004SWR near Gum Tree Cove Pond 1-Mar-1999 1310 <0.006 <0.002 <0.004 <0.004SWR near Gum Tree Cove Pond 3-May-1999 1510 <0.006 <0.002 <0.004 <0.004SWR near Gum Tree Cove Pond 12-July-1999 1500 <0.006 <0.002 <0.004 <0.004Loveland Reservoir near dam site 1 10-Sep-1998 1610 <0.006 <0.002 <0.004 <0.004Loveland Reservoir near dam site 1 10-Sep-1998 1620 <0.006 <0.002 <0.004 <0.004Loveland Reservoir near dam site 1 4-Nov-1998 1030 <0.006 <0.002 <0.004 <0.004Loveland Reservoir near dam site 1 4-Nov-1998 1040 <0.006 <0.002 <0.004 <0.004Loveland Reservoir near dam site 1 7-Jan-1999 1010 <0.006 <0.002 <0.004 <0.004Loveland Reservoir near dam site 1 2-Mar-1999 1150 <0.006 <0.002 <0.004 <0.004Loveland Reservoir near dam site 1 4-May-1999 1040 <0.006 <0.002 <0.004 <0.004Loveland Reservoir near dam site 1 4-May-1999 1050 <0.006 <0.002 <0.004 <0.004Loveland Reservoir near dam site 1 13-July-1999 1020 <0.006 <0.002 <0.004 <0.004Loveland Reservoir near dam site 1 13-July-1999 1030 <0.006 <0.002 <0.004 <0.004Loveland Reservoir near dam site 1 21-Sep-1999 1000 <0.006 <0.002 <0.010 <0.004Loveland Reservoir near dam site 1 21-Sep-1999 1020 <0.006 <0.002 <0.004 <0.004
Parathion-methyl
Metolachor Metribuzin Molinate
PCODE 82667 39415 82630 82671
Site name Date Time (µµµµg/L) (µµµµg/L) (µµµµg/L) (µµµµg/L)

Table 4. Analytical results for pesticide concentrations in water samples, Sweetwater and Loveland Reservoirs, San Diego County, California—Continued
72
Love <0.004 <0.004 <0.003 <0.006 <0.004 <0.004Love <0.004 <0.004 <0.003 <0.006 <0.004 <0.004Love <0.004 <0.004 <0.003 <0.006 <0.004 <0.004Love <0.004 <0.004 <0.003 <0.006 <0.004 <0.004Love <0.004 <0.004 <0.003 <0.006 <0.004 <0.004Love <0.004 <0.004 <0.003 <0.006 <0.004 <0.004Love <0.004 <0.004 <0.003 <0.006 <0.004 <0.004Love <0.004 <0.004 <0.003 <0.006 <0.004 <0.004Love <0.004 <0.004 <0.003 <0.006 <0.004 <0.004Swee <0.004 <0.004 <0.003 <0.006 <0.004 <0.004Swee <0.004 <0.004 <0.003 <0.006 <0.004 <0.004Swee <0.004 <0.004 <0.003 <0.006 <0.004 <0.004Swee <0.004 <0.004 <0.003 <0.006 <0.004 <0.004Swee <0.004 <0.004 <0.003 <0.006 <0.004 <0.004Swee <0.004 <0.004 <0.003 <0.006 <0.004 <0.004Perd <0.004 <0.004 <0.003 <0.006 <0.004 <0.004Perd <0.004 <0.004 <0.003 <0.006 <0.004 <0.004Perd <0.004 <0.004 <0.003 <0.006 <0.004 <0.004Perd <0.004 <0.004 <0.003 <0.006 <0.004 <0.004Perd <0.004 <0.004 <0.003 <0.006 <0.004 <0.004Perd <0.004 <0.004 <0.003 <0.006 <0.004 <0.004
Metribuzin Molinate Napropamide p,p′′′′-DDE Parathion Pebulate
82630 82671 82684 34653 39542 82669
(µµµµg/L) (µµµµg/L) (µµµµg/L) (µµµµg/L) (µµµµg/L) (µµµµg/L)
Table 4
land Reservoir east end near source inlet site 2 10-Sep-1998 1650 <0.006 <0.002land Reservoir east end near source inlet site 2 10-Sep-1998 1700 <0.006 <0.002land Reservoir east end near source inlet site 2 4-Nov-1998 1155 <0.006 <0.002land Reservoir east end near source inlet site 2 4-Nov-1998 1205 <0.006 <0.002land Reservoir east end near source inlet site 2 7-Jan-1999 1035 <0.006 <0.002land Reservoir east end near source inlet site 2 2-Mar-1999 1220 <0.006 <0.002land Reservoir east end near source inlet site 2 4-May-1999 1120 <0.006 <0.002land Reservoir east end near source inlet site 2 4-May-1999 1130 <0.006 <0.002land Reservoir east end near source inlet site 2 13-July-1999 1100 <0.006 <0.002twater River at low flow barrier at SWR 6-Jan-1999 1515 <0.006 <0.002twater River at low flow barrier at SWR 7-Jan-1999 1420 <0.006 <0.002twater River at low flow barrier at SWR 2-Mar-1999 1540 <0.006 <0.002twater River at low flow barrier at SWR 3-May-1999 1645 <0.006 <0.002twater River at low flow barrier at SWR 12-July-1999 1620 <0.006 <0.002twater River at low flow barrier at SWR 20-Sep-1999 1630 <0.006 <0.002
ue Treatment Plant—finished water at SWR 7-Jan-1999 1350 <0.006 <0.002ue Treatment Plant—finished water at SWR 2-Mar-1999 1630 <0.006 <0.002ue Treatment Plant—finished water at SWR 3-May-1999 1607 <0.006 <0.002ue Treatment Plant—finished water at SWR 12-July-1999 1700 <0.006 <0.002ue Treatment Plant—finished water at SWR 20-Sep-1999 1430 <0.006 0.004ue Treatment Plant—imported raw water at SWR 20-Sep-1999 1500 <0.006 0.005
Parathion-methyl
Metolachor
PCODE 82667 39415
Site name Date Time (µµµµg/L) (µµµµg/L)

lifornia—Continued
Propyzamide Propachlor Propanil Propargite
82676 4024 82679 82685
(µµµµg/L) (µµµµg/L) (µµµµg/L) (µµµµg/L)
<0.003 <0.007 <0.004 <0.013<0.003 <0.007 <0.004 <0.013<0.003 <0.007 <0.004 <0.013<0.003 <0.007 <0.004 <0.013<0.003 <0.007 <0.004 <0.013<0.003 <0.007 <0.004 <0.013<0.003 <0.007 <0.004 <0.013<0.003 <0.007 <0.004 <0.013<0.003 <0.007 <0.004 <0.013<0.003 <0.007 <0.004 <0.013<0.003 <0.007 <0.004 <0.013<0.003 <0.007 <0.004 <0.013<0.003 <0.007 <0.004 <0.013<0.003 <0.007 <0.004 <0.013<0.003 <0.007 <0.004 <0.013<0.003 <0.007 <0.004 <0.013<0.003 <0.007 <0.004 <0.013<0.003 <0.007 <0.004 <0.013<0.003 <0.007 <0.004 <0.013<0.003 <0.007 <0.004 <0.013<0.003 <0.007 <0.004 <0.013<0.003 <0.007 <0.004 <0.013<0.003 <0.007 <0.004 <0.013<0.003 <0.007 <0.004 <0.013<0.003 <0.007 <0.004 <0.013<0.003 <0.007 <0.004 <0.013<0.003 <0.007 <0.004 <0.013<0.003 <0.007 <0.004 <0.013<0.003 <0.007 <0.004 <0.013<0.003 <0.007 <0.004 <0.013<0.003 <0.007 <0.004 <0.013<0.003 <0.007 <0.004 <0.013<0.003 <0.007 <0.004 <0.013<0.003 <0.007 <0.004 <0.013<0.003 <0.007 <0.004 <0.013<0.003 <0.007 <0.004 <0.013<0.003 <0.007 <0.004 <0.013<0.003 <0.007 <0.004 <0.013
Table 4. Analytical results for pesticide concentrations in water samples, Sweetwater and Loveland Reservoirs, San Diego County, Ca
73 Table 4
Pendi-methalin
cis-Permethrin
Phorate Prometon
PCODE 82683 82687 82664 4037
Site name Date Time (µµµµg/L) (µµµµg/L) (µµµµg/L) (µµµµg/L)
SWR near pump tower 9-Sep-1998 1550 <0.004 <0.005 <0.002 E0.008SWR near pump tower 9-Sep-1998 1600 <0.004 <0.005 <0.002 E0.006SWR near pump tower 3-Nov-1998 1030 <0.004 <0.005 <0.002 E0.008SWR near pump tower 3-Nov-1998 1040 <0.004 <0.005 <0.002 E0.008SWR near pump tower 6-Jan-1999 0930 <0.004 <0.005 <0.002 E0.008SWR near pump tower 1-Mar-1999 1030 <0.004 <0.005 <0.002 <0.018SWR near pump tower 1-Mar-1999 1045 <0.004 <0.005 <0.002 <0.018SWR near pump tower 3-May-1999 1115 <0.004 <0.005 <0.002 E0.007SWR near pump tower 3-May-1999 1130 <0.004 <0.005 <0.002 E0.006SWR near pump tower 12-Jul-1999 1120 <0.004 <0.005 <0.002 <0.018SWR near pump tower 12-Jul-1999 1130 <0.004 <0.005 <0.002 <0.018SWR near pump tower 20-Sep-1999 1140 <0.004 <0.005 <0.002 E0.008SWR near pump tower 20-Sep-1999 1150 <0.004 <0.005 <0.002 E0.008SWR near Vista del Lago station 10-Sep-1998 0845 <0.004 <0.005 <0.002 E0.008SWR near Vista del Lago station 10-Sep-1998 0900 <0.004 <0.005 <0.002 E0.006SWR near Vista del Lago station 3-Nov-1998 1110 <0.004 <0.005 <0.002 E0.008SWR near Vista del Lago station 6-Jan-1999 1000 <0.004 <0.005 <0.002 E0.008SWR near Vista del Lago station 1-Mar-1999 1100 <0.004 <0.005 <0.002 <0.018SWR near Vista del Lago station 3-May-1999 1150 <0.004 <0.005 <0.002 E0.008SWR near Vista del Lago station 3-May-1999 1200 <0.004 <0.005 <0.002 E0.007SWR near Vista del Lago station 12-July-1999 1210 <0.004 <0.005 <0.002 <0.018SWR near Vista del Lago station 12-July-1999 1220 <0.004 <0.005 <0.002 E0.005SWR center of minimum pool 9-Sep-1998 1630 <0.004 <0.005 <0.002 E0.008SWR center of minimum pool 9-Sep-1998 1640 <0.004 <0.005 <0.002 E0.006SWR center of minimum pool 3-Nov-1998 1140 <0.004 <0.005 <0.002 E0.007SWR center of minimum pool 3-Nov-1998 1150 <0.004 <0.005 <0.002 E0.008SWR center of minimum pool 6-Jan-1999 1030 <0.004 <0.005 <0.002 E0.008SWR center of minimum pool 1-Mar-1999 1130 <0.004 <0.005 <0.002 <0.018SWR center of minimum pool 3-May-1999 1235 <0.004 <0.005 <0.002 E0.006SWR center of minimum pool 3-May-1999 1240 <0.004 <0.005 <0.002 E0.007SWR center of minimum pool 12-July-1999 1240 <0.004 <0.005 <0.002 <0.018SWR center of minimum pool 12-July-1999 1250 <0.004 <0.005 <0.002 0.005SWR center of minimum pool 20-Sep-1999 1220 <0.004 <0.005 <0.002 0.008SWR center of minimum pool 20-Sep-1999 1230 <0.004 <0.005 <0.002 E0.007SWR near recreation area 10-Sep-1998 1010 <0.004 <0.005 <0.002 E0.008SWR near recreation area 10-Sep-1998 1020 <0.004 <0.005 <0.002 E0.006SWR near recreation area 3-Nov-1998 1205 <0.004 <0.005 <0.002 E0.008SWR near recreation area 3-Nov-1998 1215 <0.004 <0.005 <0.002 E0.007

—Continued
.003 <0.007 <0.004 <0.013
.003 <0.007 <0.004 <0.013
.003 <0.007 <0.004 <0.013
.003 <0.007 <0.004 <0.013
.003 <0.007 <0.004 <0.013
.003 <0.007 <0.004 <0.013
.003 <0.007 <0.004 <0.013
.003 <0.007 <0.004 <0.013
.003 <0.007 <0.004 <0.013
.003 <0.007 <0.004 <0.013
.003 <0.007 <0.004 <0.013
.003 <0.007 <0.004 <0.013
.003 <0.007 <0.004 <0.013
.003 <0.007 <0.004 <0.013
.003 <0.007 <0.004 <0.013
.003 <0.007 <0.004 <0.013
.003 <0.007 <0.004 <0.013
.003 <0.007 <0.004 <0.013
.003 <0.007 <0.004 <0.013
.003 <0.007 <0.004 <0.013
.003 <0.007 <0.004 <0.013
.003 <0.007 <0.004 <0.013
.003 <0.007 <0.004 <0.013
.003 <0.007 <0.004 <0.013
.003 <0.007 <0.004 <0.013
.003 <0.007 <0.004 <0.013
.003 <0.007 <0.004 <0.013
.003 <0.007 <0.004 <0.013
.003 <0.007 <0.004 <0.013
.003 <0.007 <0.004 <0.013
.003 <0.007 <0.004 <0.013
.003 <0.007 <0.004 <0.013
.003 <0.007 <0.004 <0.013
.003 <0.007 <0.004 <0.013
.003 <0.007 <0.004 <0.013
.003 <0.007 <0.004 <0.013
.003 <0.007 <0.004 <0.013
.003 <0.007 <0.004 <0.013
.003 <0.007 <0.004 <0.013
zamide Propachlor Propanil Propargite
676 4024 82679 82685
g/L) (µµµµg/L) (µµµµg/L) (µµµµg/L)
Table 4. Analytical results for pesticide concentrations in water samples, Sweetwater and Loveland Reservoirs, San Diego County, California
74 Table 4
SWR near recreation area 6-Jan-1999 1100 <0.004 <0.005 <0.002 E0.008 <0SWR near recreation area 1-Mar-1999 1220 <0.004 <0.005 <0.002 <0.018 <0SWR near recreation area 3-May-1999 1310 <0.004 <0.005 <0.002 E0.006 <0SWR near recreation area 3-May-1999 1320 <0.004 <0.005 <0.002 E0.006 <0SWR near recreation area 12-July-1999 1320 <0.004 <0.005 <0.002 <0.018 <0SWR near recreation area 12-July-1999 1330 <0.004 <0.005 <0.002 <0.018 <0SWR minimum pool boundary east 10-Sep-1998 1240 <0.004 <0.005 <0.002 E0.008 <0SWR minimum pool boundary east 10-Sep-1998 1250 <0.004 <0.005 <0.002 E0.006 <0SWR minimum pool boundary east 3-Nov-1998 1340 <0.004 <0.005 <0.002 E0.007 <0SWR minimum pool boundary east 6-Jan-1999 1130 <0.004 <0.005 <0.002 E0.007 <0SWR minimum pool boundary east 2-Mar-1999 0840 <0.004 <0.005 <0.002 <0.018 <0SWR minimum pool boundary east 3-May-1999 1350 <0.004 <0.005 <0.002 E0.007 <0SWR minimum pool boundary east 3-May-1999 1400 <0.004 <0.005 <0.002 E0.007 <0SWR minimum pool boundary east 12-July-1999 1420 <0.004 <0.005 <0.002 E0.005 <0SWR east end reservoir fill boundary 10-Sep-1998 1310 <0.004 <0.005 <0.002 E0.006 <0SWR east end reservoir fill boundary 3-Nov-1998 1400 <0.004 <0.005 <0.002 E0.007 <0SWR east end reservoir fill boundary 6-Jan-1999 1150 <0.004 <0.005 <0.002 E0.007 <0SWR east end reservoir fill boundary 3-May-1999 1440 <0.004 <0.005 <0.002 E0.006 <0SWR east end reservoir fill boundary 12-July-1999 1440 <0.004 <0.005 <0.002 <0.018 <0SWR east end reservoir fill boundary 20-Sep-1999 1250 <0.004 <0.005 <0.002 E0.007 <0SWR near Gum Tree Cove Pond 10-Sep-1998 0930 <0.004 <0.005 <0.002 E0.008 <0SWR near Gum Tree Cove Pond 10-Sep-1998 0940 <0.004 <0.005 <0.002 E0.006 <0SWR near Gum Tree Cove Pond 3-Nov-1998 1430 <0.004 <0.005 <0.002 E0.008 <0SWR near Gum Tree Cove Pond 6-Jan-1999 1220 <0.004 <0.005 <0.002 E0.007 <0SWR near Gum Tree Cove Pond 1-Mar-1999 1310 <0.004 <0.005 <0.002 <0.018 <0SWR near Gum Tree Cove Pond 3-May-1999 1510 <0.004 <0.005 <0.002 0.007 <0SWR near Gum Tree Cove Pond 12-July-1999 1500 <0.004 <0.005 <0.002 E0.005 <0Loveland Reservoir near dam site 1 10-Sep-1998 1610 <0.004 <0.005 <0.002 E0.003 <0Loveland Reservoir near dam site 1 10-Sep-1998 1620 <0.004 <0.005 <0.002 E0.002 <0Loveland Reservoir near dam site 1 4-Nov-1998 1030 <0.004 <0.005 <0.002 E0.004 <0Loveland Reservoir near dam site 1 4-Nov-1998 1040 <0.004 <0.005 <0.002 E0.004 <0Loveland Reservoir near dam site 1 7-Jan-1999 1010 <0.004 <0.005 <0.002 E0.003 <0Loveland Reservoir near dam site 1 2-Mar-1999 1150 <0.004 <0.005 <0.002 <0.018 <0Loveland Reservoir near dam site 1 4-May-1999 1040 <0.004 <0.005 <0.002 <0.018 <0Loveland Reservoir near dam site 1 4-May-1999 1050 <0.004 <0.005 <0.002 E0.004 <0Loveland Reservoir near dam site 1 13-July-1999 1020 <0.004 <0.005 <0.002 <0.018 <0Loveland Reservoir near dam site 1 13-July-1999 1030 <0.004 <0.005 <0.002 <0.018 <0Loveland Reservoir near dam site 1 21-Sep-1999 1000 <0.004 <0.005 <0.002 <0.018 <0Loveland Reservoir near dam site 1 21-Sep-1999 1020 <0.004 <0.005 <0.002 E0.005 <0
Pendi-methalin
cis-Permethrin
Phorate Prometon Propy
PCODE 82683 82687 82664 4037 82
Site name Date Time (µµµµg/L) (µµµµg/L) (µµµµg/L) (µµµµg/L) (µµµµ

r and Loveland Reservoirs, San Diego County, California—Continued
0.004 <0.005 <0.002 E0.003 <0.003 <0.007 <0.004 <0.0130.004 <0.005 <0.002 E0.002 <0.003 <0.007 <0.004 <0.0130.004 <0.005 <0.002 E0.004 <0.003 <0.007 <0.004 <0.0130.004 <0.005 <0.002 <0.018 <0.003 <0.007 <0.004 <0.0130.004 <0.005 <0.002 E0.003 <0.003 <0.007 <0.004 <0.0130.004 <0.005 <0.002 <0.018 <0.003 <0.007 <0.004 <0.0130.004 <0.005 <0.002 <0.018 <0.003 <0.007 <0.004 <0.0130.004 <0.005 <0.002 <0.018 <0.003 <0.007 <0.004 <0.0130.004 <0.005 <0.002 <0.018 <0.003 <0.007 <0.004 <0.0130.004 <0.005 <0.002 <0.018 <0.003 <0.007 <0.004 <0.0130.004 <0.005 <0.002 E0.003 <0.003 <0.007 <0.004 <0.0130.004 <0.005 <0.002 E0.012 <0.003 <0.007 <0.004 <0.0130.004 <0.005 <0.002 E0.012 <0.003 <0.007 <0.004 <0.0130.004 <0.005 <0.002 <0.018 <0.003 <0.007 <0.004 <0.0130.004 <0.005 <0.002 E0.007 <0.003 <0.007 <0.004 <0.0130.004 <0.005 <0.002 E0.008 <0.003 <0.007 <0.004 <0.0130.004 <0.005 <0.002 <0.020 <0.003 <0.007 <0.004 <0.0130.004 <0.005 <0.002 E0.007 <0.003 <0.007 <0.004 <0.0130.004 <0.005 <0.002 E0.004 <0.003 <0.007 <0.004 <0.0130.004 <0.005 <0.002 <0.018 <0.003 <0.007 <0.004 <0.0130.004 <0.005 <0.002 <0.018 <0.003 <0.007 <0.004 <0.013
endi-ethalin
cis-Permethrin
Phorate Prometon Propyzamide Propachlor Propanil Propargite
82683 82687 82664 4037 82676 4024 82679 82685
(µµµµg/L) (µµµµg/L) (µµµµg/L) (µµµµg/L) (µµµµg/L) (µµµµg/L) (µµµµg/L) (µµµµg/L)
Table 4. Analytical results for pesticide concentrations in water samples, Sweetwate
75 Table 4
Loveland Reservoir east end near source inlet site 2 10-Sep-1998 1650 <Loveland Reservoir east end near source inlet site 2 10-Sep-1998 1700 <Loveland Reservoir east end near source inlet site 2 4-Nov-1998 1155 <Loveland Reservoir east end near source inlet site 2 4-Nov-1998 1205 <Loveland Reservoir east end near source inlet site 2 7-Jan-1999 1035 <Loveland Reservoir east end near source inlet site 2 2-Mar-1999 1220 <Loveland Reservoir east end near source inlet site 2 4-May-1999 1120 <Loveland Reservoir east end near source inlet site 2 4-May-1999 1130 <Loveland Reservoir east end near source inlet site 2 13-July-1999 1100 <Sweetwater River at low flow barrier at SWR 6-Jan-1999 1515 <Sweetwater River at low flow barrier at SWR 7-Jan-1999 1420 <Sweetwater River at low flow barrier at SWR 2-Mar-1999 1540 <Sweetwater River at low flow barrier at SWR 3-May-1999 1645 <Sweetwater River at low flow barrier at SWR 12-July-1999 1620 <Sweetwater River at low flow barrier at SWR 20-Sep-1999 1630 <Perdue Treatment Plant—finished water at SWR 7-Jan-1999 1350 <Perdue Treatment Plant—finished water at SWR 2-Mar-1999 1630 <Perdue Treatment Plant—finished water at SWR 3-May-1999 1607 <Perdue Treatment Plant—finished water at SWR 12-July-1999 1700 <Perdue Treatment Plant—finished water at SWR 20-Sep-1999 1430 <Perdue Treatment Plant—imported raw water at SWR 20-Sep-1999 1500 <
Pm
PCODE
Site name Date Time

—Continued
encarb Triallate Trifluralin
681 82678 82661
g/L) (µµµµg/L) (µµµµg/L)
.002 <0.001 <0.002
.002 <0.001 <0.002
.002 <0.001 <0.002
.002 <0.001 <0.002
.002 <0.001 <0.002
.002 <0.001 <0.002
.002 <0.001 <0.002
.002 <0.001 <0.002
.002 <0.001 <0.002
.002 <0.001 <0.002
.002 <0.001 <0.002
.002 <0.001 <0.002
.002 <0.001 <0.002
.002 <0.001 <0.002
.002 <0.001 <0.002
.002 <0.001 <0.002
.002 <0.001 <0.002
.002 <0.001 <0.002
.002 <0.001 <0.002
.002 <0.001 <0.002
.002 <0.001 <0.002
.002 <0.001 <0.002
.002 <0.001 <0.002
.002 <0.001 <0.002
.002 <0.001 <0.002
.002 <0.001 <0.002
.002 <0.001 <0.002
.002 <0.001 <0.002
.002 <0.001 <0.002
.002 <0.001 <0.002
.002 <0.001 <0.002
.002 <0.001 <0.002
.002 <0.001 <0.002
.002 <0.001 <0.002
.002 <0.001 <0.002
.002 <0.001 <0.002
.002 <0.001 <0.002
.002 <0.001 <0.002
.002 <0.001 <0.002
Table 4. Analytical results for pesticide concentrations in water samples, Sweetwater and Loveland Reservoirs, San Diego County, California
76 Table 4
Simazine Tebuthiuron Terbucil Terbufos Thiob
PCODE 4035 82670 82665 82675 82
Site name Date Time (µµµµg/L) (µµµµg/L) (µµµµg/L) (µµµµg/L) (µµµµ
SWR near pump tower 9-Sep-1998 1550 0.024 <0.01 <0.007 <0.013 <0SWR near pump tower 9-Sep-1998 1600 0.020 <0.01 <0.007 <0.013 <0SWR near pump tower 3-Nov-1998 1030 0.020 <0.01 <0.007 <0.013 <0SWR near pump tower 3-Nov-1998 1040 0.019 <0.01 <0.007 <0.013 <0SWR near pump tower 6-Jan-1999 0930 0.018 <0.01 <0.007 <0.013 <0SWR near pump tower 1-Mar-1999 1030 <0.020 <0.01 <0.007 <0.013 <0SWR near pump tower 1-Mar-1999 1045 <0.020 <0.01 <0.007 <0.013 <0SWR near pump tower 3-May-1999 1115 0.014 <0.01 <0.007 <0.013 <0SWR near pump tower 3-May-1999 1130 0.014 <0.01 <0.007 <0.013 <0SWR near pump tower 12-Jul-1999 1120 0.015 <0.01 <0.007 <0.013 <0SWR near pump tower 12-Jul-1999 1130 0.011 <0.01 <0.007 <0.013 <0SWR near pump tower 20-Sep-1999 1140 0.016 <0.01 <0.007 <0.013 <0SWR near pump tower 20-Sep-1999 1150 0.014 <0.01 <0.007 <0.013 <0SWR near Vista del Lago station 10-Sep-1998 0845 0.022 <0.01 <0.007 <0.013 <0SWR near Vista del Lago station 10-Sep-1998 0900 0.019 <0.01 <0.007 <0.013 <0SWR near Vista del Lago station 3-Nov-1998 1110 0.020 <0.01 <0.007 <0.013 <0SWR near Vista del Lago station 6-Jan-1999 1000 0.017 <0.01 <0.007 <0.013 <0SWR near Vista del Lago station 1-Mar-1999 1100 0.016 <0.01 <0.007 <0.013 <0SWR near Vista del Lago station 3-May-1999 1150 0.017 <0.01 <0.007 <0.013 <0SWR near Vista del Lago station 3-May-1999 1200 0.016 <0.01 <0.007 <0.013 <0SWR near Vista del Lago station 12-July-1999 1210 0.009 <0.01 <0.007 <0.013 <0SWR near Vista del Lago station 12-July-1999 1220 0.011 <0.01 <0.007 <0.013 <0SWR center of minimum pool 9-Sep-1998 1630 0.024 <0.01 <0.007 <0.013 <0SWR center of minimum pool 9-Sep-1998 1640 0.020 <0.01 <0.007 <0.013 <0SWR center of minimum pool 3-Nov-1998 1140 0.019 <0.01 <0.007 <0.013 <0SWR center of minimum pool 3-Nov-1998 1150 0.020 <0.01 <0.007 <0.013 <0SWR center of minimum pool 6-Jan-1999 1030 0.016 <0.01 <0.007 <0.013 <0SWR center of minimum pool 1-Mar-1999 1130 <0.020 <0.01 <0.007 <0.013 <0SWR center of minimum pool 3-May-1999 1235 0.012 <0.01 <0.007 <0.013 <0SWR center of minimum pool 3-May-1999 1240 0.017 <0.01 <0.007 <0.013 <0SWR center of minimum pool 12-July-1999 1240 <0.010 <0.01 <0.007 <0.013 <0SWR center of minimum pool 12-July-1999 1250 0.011 <0.01 <0.007 <0.013 <0SWR center of minimum pool 20-Sep-1999 1220 0.016 <0.01 <0.007 <0.013 <0SWR center of minimum pool 20-Sep-1999 1230 0.014 <0.01 <0.007 <0.013 <0SWR near recreation area 10-Sep-1998 1010 0.021 <0.01 <0.007 <0.013 <0SWR near recreation area 10-Sep-1998 1020 0.017 <0.01 <0.007 <0.013 <0SWR near recreation area 3-Nov-1998 1205 0.020 <0.01 <0.007 <0.013 <0SWR near recreation area 3-Nov-1998 1215 0.018 <0.01 <0.007 <0.013 <0SWR near recreation area 6-Jan-1999 1100 0.017 <0.01 <0.007 <0.013 <0

lifornia—Continued
<0.002 <0.001 <0.002<0.002 <0.001 <0.002<0.002 <0.001 <0.002<0.002 <0.001 <0.002<0.002 <0.001 <0.002<0.002 <0.001 <0.002<0.002 <0.001 <0.002<0.002 <0.001 <0.002<0.002 <0.001 <0.002<0.002 <0.001 <0.002<0.002 <0.001 <0.002<0.002 <0.001 <0.002<0.002 <0.001 <0.002<0.002 <0.001 <0.002<0.002 <0.001 <0.002<0.002 <0.001 <0.002<0.002 <0.001 <0.002<0.002 <0.001 <0.002<0.002 <0.001 <0.002<0.002 <0.001 <0.002<0.002 <0.001 <0.002<0.002 <0.001 <0.002<0.002 <0.001 <0.002<0.002 <0.001 <0.002<0.002 <0.001 <0.002<0.002 <0.001 <0.002<0.002 <0.001 <0.002<0.002 <0.001 <0.002<0.002 <0.001 <0.002<0.002 <0.001 <0.002<0.002 <0.001 <0.002<0.002 <0.001 <0.002<0.002 <0.001 <0.002<0.002 <0.001 <0.002<0.002 <0.001 <0.002<0.002 <0.001 <0.002<0.002 <0.001 <0.002<0.002 <0.001 <0.002<0.002 <0.001 <0.002<0.002 <0.001 <0.002
Thiobencarb Triallate Trifluralin
82681 82678 82661
(µµµµg/L) (µµµµg/L) (µµµµg/L)
Table 4. Analytical results for pesticide concentrations in water samples, Sweetwater and Loveland Reservoirs, San Diego County, Ca
77 Table 4
SWR near recreation area 1-Mar-1999 1220 <0.020 <0.01 <0.007 <0.013SWR near recreation area 3-May-1999 1310 0.012 <0.01 <0.007 <0.013SWR near recreation area 3-May-1999 1320 0.014 <0.01 <0.007 <0.013SWR near recreation area 12-July-1999 1320 0.013 <0.01 <0.007 <0.013SWR near recreation area 12-July-1999 1330 0.010 <0.01 <0.007 <0.013SWR minimum pool boundary east 10-Sep-1998 1240 0.022 <0.01 <0.007 <0.013SWR minimum pool boundary east 10-Sep-1998 1250 0.017 <0.01 <0.007 <0.013SWR minimum pool boundary east 3-Nov-1998 1340 0.019 <0.01 <0.007 <0.013SWR minimum pool boundary east 6-Jan-1999 1130 0.017 <0.01 <0.007 <0.013SWR minimum pool boundary east 2-Mar-1999 0840 <0.005 <0.01 <0.007 <0.013SWR minimum pool boundary east 3-May-1999 1350 0.016 <0.01 <0.007 <0.013SWR minimum pool boundary east 3-May-1999 1400 0.017 <0.01 <0.007 <0.013SWR minimum pool boundary east 12-July-1999 1420 0.013 <0.01 <0.007 <0.013SWR east end reservoir fill boundary 10-Sep-1998 1310 0.016 <0.01 <0.007 <0.013SWR east end reservoir fill boundary 3-Nov-1998 1400 0.019 <0.01 <0.007 <0.013SWR east end reservoir fill boundary 6-Jan-1999 1150 0.018 <0.01 <0.007 <0.013SWR east end reservoir fill boundary 3-May-1999 1440 0.015 <0.01 <0.007 <0.013SWR east end reservoir fill boundary 12-July-1999 1440 0.005 <0.01 <0.007 <0.013SWR east end reservoir fill boundary 20-Sep-1999 1250 0.014 <0.01 <0.007 <0.013SWR near Gum Tree Cove Pond 10-Sep-1998 0930 0.022 <0.01 <0.007 <0.013SWR near Gum Tree Cove Pond 10-Sep-1998 0940 0.019 <0.01 <0.007 <0.013SWR near Gum Tree Cove Pond 3-Nov-1998 1430 0.019 <0.01 <0.007 <0.013SWR near Gum Tree Cove Pond 6-Jan-1999 1220 0.017 <0.01 <0.007 <0.013SWR near Gum Tree Cove Pond 1-Mar-1999 1310 <0.020 <0.01 <0.007 <0.013SWR near Gum Tree Cove Pond 3-May-1999 1510 0.012 <0.01 <0.007 <0.013SWR near Gum Tree Cove Pond 12-July-1999 1500 0.015 <0.01 <0.007 <0.013Loveland Reservoir near dam site 1 10-Sep-1998 1610 0.023 <0.01 <0.007 <0.013Loveland Reservoir near dam site 1 10-Sep-1998 1620 0.006 <0.01 <0.007 <0.013Loveland Reservoir near dam site 1 4-Nov-1998 1030 0.023 <0.01 <0.007 <0.013Loveland Reservoir near dam site 1 4-Nov-1998 1040 0.010 <0.01 <0.007 <0.013Loveland Reservoir near dam site 1 7-Jan-1999 1010 0.013 <0.01 <0.007 <0.013Loveland Reservoir near dam site 1 2-Mar-1999 1150 <0.020 <0.01 <0.007 <0.013Loveland Reservoir near dam site 1 4-May-1999 1040 0.012 <0.01 <0.007 <0.013Loveland Reservoir near dam site 1 4-May-1999 1050 0.014 <0.01 <0.007 <0.013Loveland Reservoir near dam site 1 13-July-1999 1020 0.011 <0.01 <0.007 <0.013Loveland Reservoir near dam site 1 13-July-1999 1030 0.010 <0.01 <0.007 <0.013Loveland Reservoir near dam site 1 21-Sep-1999 1000 0.011 <0.01 <0.007 <0.013Loveland Reservoir near dam site 1 21-Sep-1999 1020 0.012 <0.01 <0.007 <0.013Loveland Reservoir east end near source inlet site 2 10-Sep-1998 1650 0.021 <0.01 <0.007 <0.013Loveland Reservoir east end near source inlet site 2 10-Sep-1998 1700 0.006 <0.01 <0.007 <0.013
Simazine Tebuthiuron Terbucil Terbufos
PCODE 4035 82670 82665 82675
Site name Date Time (µµµµg/L) (µµµµg/L) (µµµµg/L) (µµµµg/L)

Table 4. Analytical results for pesticide concentrations in water samples, Sweetwater and Loveland Reservoirs, San Diego County, California—Continued
78 Ta
Loveland <0.007 <0.013 <0.002 <0.001 <0.002Loveland <0.007 <0.013 <0.002 <0.001 <0.002Loveland <0.007 <0.013 <0.002 <0.001 <0.002Loveland <0.007 <0.013 <0.002 <0.001 <0.002Loveland <0.007 <0.013 <0.002 <0.001 <0.002Loveland <0.007 <0.013 <0.002 <0.001 <0.002Loveland <0.007 <0.013 <0.002 <0.001 <0.002Sweetwat <0.007 <0.013 <0.002 <0.001 <0.002Sweetwat <0.007 <0.013 <0.002 <0.001 <0.002Sweetwat <0.007 <0.013 <0.002 <0.001 <0.002Sweetwat <0.007 <0.013 <0.002 <0.001 <0.002Sweetwat <0.007 <0.013 <0.002 <0.001 <0.002Sweetwat <0.007 <0.013 <0.002 <0.001 <0.002Perdue Tr <0.007 <0.013 <0.002 <0.001 <0.002Perdue Tr <0.007 <0.013 <0.002 <0.001 <0.002Perdue Tr <0.007 <0.013 <0.002 <0.001 <0.002Perdue Tr <0.007 <0.013 <0.002 <0.001 <0.002Perdue Tr <0.007 <0.013 <0.002 <0.001 <0.002Perdue Tr <0.007 <0.013 <0.002 <0.001 <0.002
Terbucil Terbufos Thiobencarb Triallate Trifluralin
82665 82675 82681 82678 82661
(µµµµg/L) (µµµµg/L) (µµµµg/L) (µµµµg/L) (µµµµg/L)
ble 4
Reservoir east end near source inlet site 2 4-Nov-1998 1155 0.019 <0.01Reservoir east end near source inlet site 2 4-Nov-1998 1205 0.010 <0.01Reservoir east end near source inlet site 2 7-Jan-1999 1035 0.013 <0.01Reservoir east end near source inlet site 2 2-Mar-1999 1220 <0.020 <0.01Reservoir east end near source inlet site 2 4-May-1999 1120 0.010 <0.01Reservoir east end near source inlet site 2 4-May-1999 1130 0.012 <0.01Reservoir east end near source inlet site 2 13-July-1999 1100 0.012 <0.01er River at low flow barrier at SWR 6-Jan-1999 1515 0.007 <0.01er River at low flow barrier at SWR 7-Jan-1999 1420 0.011 <0.01er River at low flow barrier at SWR 2-Mar-1999 1540 <0.010 <0.01er River at low flow barrier at SWR 3-May-1999 1645 0.007 E0.01er River at low flow barrier at SWR 12-July-1999 1620 <0.005 <0.01er River at low flow barrier at SWR 20-Sep-1999 1630 <0.005 <0.01eatment Plant—finished water at SWR 7-Jan-1999 1350 0.016 <0.01eatment Plant—finished water at SWR 2-Mar-1999 1630 <0.005 <0.01eatment Plant—finished water at SWR 3-May-1999 1607 0.015 <0.01eatment Plant—finished water at SWR 12-July-1999 1700 0.012 <0.01eatment Plant—finished water at SWR 20-Sep-1999 1430 0.009 <0.01eatment Plant—imported raw water at SWR 20-Sep-1999 1500 0.008 <0.01
Simazine Tebuthiuron
PCODE 4035 82670
Site name Date Time (µµµµg/L) (µµµµg/L)

lifornia—Continued
Table 4. Analytical results for pesticide concentrations in water samples, Sweetwater and Loveland Reservoirs, San Diego County, Ca79 Table 4
Diazinon-d10 (surrogate)
alpha-HCH-d6 (surrogate)
Terbuthyl-azine
(surrogate)
PCODE 91063 91065 91064
Site name Date Time (%) (%) (%)
SWR near pump tower 9-Sep-1998 1550 97 107 104SWR near pump tower 9-Sep-1998 1600 92 93 99SWR near pump tower 3-Nov-1998 1030 96 89 105SWR near pump tower 3-Nov-1998 1040 99 88 100SWR near pump tower 6-Jan-1999 0930 112 100 114SWR near pump tower 1-Mar-1999 1030 104 106 129SWR near pump tower 1-Mar-1999 1045 112 112 117SWR near pump tower 3-May-1999 1115 99 86 91SWR near pump tower 3-May-1999 1130 100 87 92SWR near pump tower 12-Jul-1999 1120 88 85 NASWR near pump tower 12-Jul-1999 1130 87 78 NASWR near pump tower 20-Sep-1999 1140 102 87 NASWR near pump tower 20-Sep-1999 1150 107 84 NASWR near Vista del Lago station 10-Sep-1998 0845 98 98 100SWR near Vista del Lago station 10-Sep-1998 0900 91 94 103SWR near Vista del Lago station 3-Nov-1998 1110 98 87 101SWR near Vista del Lago station 6-Jan-1999 1000 107 95 107SWR near Vista del Lago station 1-Mar-1999 1100 96 97 100SWR near Vista del Lago station 3-May-1999 1150 129 128 121SWR near Vista del Lago station 3-May-1999 1200 98 90 99SWR near Vista del Lago station 12-July-1999 1210 100 76 NASWR near Vista del Lago station 12-July-1999 1220 101 88 NASWR center of minimum pool 9-Sep-1998 1630 98 103 104SWR center of minimum pool 9-Sep-1998 1640 96 106 103SWR center of minimum pool 3-Nov-1998 1140 90 87 95SWR center of minimum pool 3-Nov-1998 1150 97 87 97SWR center of minimum pool 6-Jan-1999 1030 102 90 104SWR center of minimum pool 1-Mar-1999 1130 95 99 110SWR center of minimum pool 3-May-1999 1235 96 84 97SWR center of minimum pool 3-May-1999 1240 121 114 118SWR center of minimum pool 12-July-1999 1240 99 89 NASWR center of minimum pool 12-July-1999 1250 98 90 NASWR center of minimum pool 20-Sep-1999 1220 107 87 NASWR center of minimum pool 20-Sep-1999 1230 99 75 NASWR near recreation area 10-Sep-1998 1010 90 89 102SWR near recreation area 10-Sep-1998 1020 94 91 100SWR near recreation area 3-Nov-1998 1205 98 87 99

—Continued
Table 4. Analytical results for pesticide concentrations in water samples, Sweetwater and Loveland Reservoirs, San Diego County, California80 Table 4
SWR near recreation area 3-Nov-1998 1215 98 85 100SWR near recreation area 6-Jan-1999 1100 103 94 107SWR near recreation area 1-Mar-1999 1220 101 103 120SWR near recreation area 3-May-1999 1310 103 89 90SWR near recreation area 3-May-1999 1320 99 91 96SWR near recreation area 12-July-1999 1320 87 77 NASWR near recreation area 12-July-1999 1330 89 77 NASWR minimum pool boundary east 10-Sep-1998 1240 99 97 99SWR minimum pool boundary east 10-Sep-1998 1250 99 92 102SWR minimum pool boundary east 3-Nov-1998 1340 98 87 98SWR minimum pool boundary east 6-Jan-1999 1130 105 93 106SWR minimum pool boundary east 2-Mar-1999 840 102 97 116SWR minimum pool boundary east 3-May-1999 1350 96 86 94SWR minimum pool boundary east 3-May-1999 1400 94 91 99SWR minimum pool boundary east 12-July-1999 1420 106 74 NASWR east end reservoir fill boundary 10-Sep-1998 1310 84 80 86SWR east end reservoir fill boundary 3-Nov-1998 1400 102 91 101SWR east end reservoir fill boundary 6-Jan-1999 1150 106 97 112SWR east end reservoir fill boundary 3-May-1999 1440 86 82 87SWR east end reservoir fill boundary 12-July-1999 1440 79 75 NASWR east end reservoir fill boundary 20-Sep-1999 1250 107 82 NASWR near Gum Tree Cove Pond 10-Sep-1998 0930 97 94 100SWR near Gum Tree Cove Pond 10-Sep-1998 940 99 96 105SWR near Gum Tree Cove Pond 3-Nov-1998 1430 100 88 101SWR near Gum Tree Cove Pond 6-Jan-1999 1220 100 93 107SWR near Gum Tree Cove Pond 1-Mar-1999 1310 118 106 134SWR near Gum Tree Cove Pond 3-May-1999 1510 92 78 83SWR near Gum Tree Cove Pond 12-July-1999 1500 110 82 NALoveland Reservoir near dam site 1 10-Sep-1998 1610 92 89 95Loveland Reservoir near dam site 1 10-Sep-1998 1620 97 92 101Loveland Reservoir near dam site 1 4-Nov-1998 1030 97 89 97Loveland Reservoir near dam site 1 4-Nov-1998 1040 97 89 96Loveland Reservoir near dam site 1 7-Jan-1999 1010 102 92 106Loveland Reservoir near dam site 1 2-Mar-1999 1150 109 103 121Loveland Reservoir near dam site 1 4-May-1999 1040 99 88 99Loveland Reservoir near dam site 1 4-May-1999 1050 102 89 99Loveland Reservoir near dam site 1 13-July-1999 1020 101 87 NALoveland Reservoir near dam site 1 13-July-1999 1030 96 75 NA
Diazinon-d10 (surrogate)
alpha-HCH-d6 (surrogate)
Terbuthyl-azine
(surrogate)
PCODE 91063 91065 91064
Site name Date Time (%) (%) (%)

lifornia—Continued
Table 4. Analytical results for pesticide concentrations in water samples, Sweetwater and Loveland Reservoirs, San Diego County, Ca81 Table 4
Loveland Reservoir near dam site 1 21-Sep-1999 1000 96 90 NALoveland Reservoir near dam site 1 21-Sep-1999 1020 104 87 NALoveland Reservoir east end near source inlet site 2 10-Sep-1998 1650 98 94 102Loveland Reservoir east end near source inlet site 2 10-Sep-1998 1700 96 91 100Loveland Reservoir east end near source inlet site 2 4-Nov-1998 1155 96 92 94Loveland Reservoir east end near source inlet site 2 4-Nov-1998 1205 106 98 108Loveland Reservoir east end near source inlet site 2 7-Jan-1999 1035 102 92 107Loveland Reservoir east end near source inlet site 2 2-Mar-1999 1220 100 107 116Loveland Reservoir east end near source inlet site 2 4-May-1999 1120 96 84 95Loveland Reservoir east end near source inlet site 2 4-May-1999 1130 123 120 120Loveland Reservoir east end near source inlet site 2 13-July-1999 1100 96 72 NASweetwater River at low flow barrier at SWR 6-Jan-1999 1515 105 97 110Sweetwater River at low flow barrier at SWR 7-Jan-1999 1420 109 100 110Sweetwater River at low flow barrier at SWR 2-Mar-1999 1540 104 101 117Sweetwater River at low flow barrier at SWR 3-May-1999 1645 87 84 90Sweetwater River at low flow barrier at SWR 12-July-1999 1620 107 88 NASweetwater River at low flow barrier at SWR 20-Sep-1999 1630 107 80 NAPerdue Treatment Plant—finished water at SWR 7-Jan-1999 1350 94 97 106Perdue Treatment Plant—finished water at SWR 2-Mar-1999 1630 98 98 123Perdue Treatment Plant—finished water at SWR 3-May-1999 1607 94 87 104Perdue Treatment Plant—finished water at SWR 12-July-1999 1700 84 78 NAPerdue Treatment Plant—finished water at SWR 20-Sep-1999 1430 99 87 NAPerdue Treatment Plant—imported raw water at SWR 20-Sep-1999 1500 104 80 NA
Diazinon-d10 (surrogate)
alpha-HCH-d6 (surrogate)
Terbuthyl-azine
(surrogate)
PCODE 91063 91065 91064
Site name Date Time (%) (%) (%)
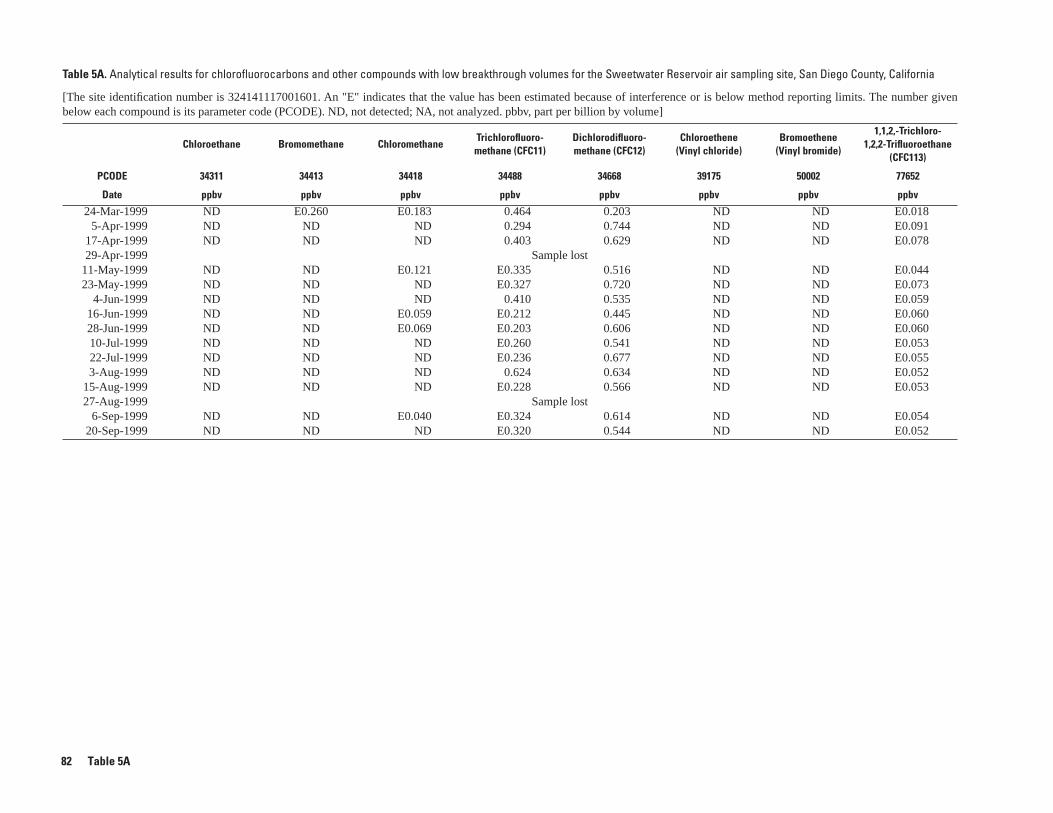
82 Table 5A
Table 5A. Analytical results for chlorofluorocarbons and other compounds with low breakthrough volumes for the Sweetwater Reservoir air sampling site, San Diego County, California
[The site identification number is 324141117001601. An "E" indicates that the value has been estimated because of interference or is below method reporting limits. The number given below each compound is its parameter code (PCODE). ND, not detected; NA, not analyzed. pbbv, part per billion by volume]
Chloroethane Bromomethane ChloromethaneTrichlorofluoro-methane (CFC11)
Dichlorodifluoro- methane (CFC12)
Chloroethene (Vinyl chloride)
Bromoethene (Vinyl bromide)
1,1,2,-Trichloro-1,2,2-Trifluoroethane
(CFC113)
PCODE 34311 34413 34418 34488 34668 39175 50002 77652
Date ppbv ppbv ppbv ppbv ppbv ppbv ppbv ppbv
24-Mar-1999 ND E0.260 E0.183 0.464 0.203 ND ND E0.0185-Apr-1999 ND ND ND 0.294 0.744 ND ND E0.091
17-Apr-1999 ND ND ND 0.403 0.629 ND ND E0.07829-Apr-1999 Sample lost
11-May-1999 ND ND E0.121 E0.335 0.516 ND ND E0.04423-May-1999 ND ND ND E0.327 0.720 ND ND E0.073
4-Jun-1999 ND ND ND 0.410 0.535 ND ND E0.05916-Jun-1999 ND ND E0.059 E0.212 0.445 ND ND E0.06028-Jun-1999 ND ND E0.069 E0.203 0.606 ND ND E0.06010-Jul-1999 ND ND ND E0.260 0.541 ND ND E0.05322-Jul-1999 ND ND ND E0.236 0.677 ND ND E0.0553-Aug-1999 ND ND ND 0.624 0.634 ND ND E0.052
15-Aug-1999 ND ND ND E0.228 0.566 ND ND E0.05327-Aug-1999 Sample lost
6-Sep-1999 ND ND E0.040 E0.324 0.614 ND ND E0.05420-Sep-1999 ND ND ND E0.320 0.544 ND ND E0.052

83 Table 5B
Table 5B. Analytical results for the remaining volatile organic compound analytes for the Sweetwater Reservoir air sampling site, San Diego County, California
[The site identification number is 324141117001601. VOC, volatile organic compound. An "E" indicates that the value has been estimated because of interference or is below method reporting limits. The number given below a compound is its parameter code (PCODE). Calif., California; SWR, Sweetwater Reservoir; ND, not detected; NA, not analyzed. pbbv, part per billion by volume]

Table 5B. Analytical results for the remaining VOC analytes for the SWR air sampling site, San Diego County, Calif.—Continued
Dib
rom
omet
hane
Bro
mod
ichl
oro-
met
hane
Carb
onte
trac
hlor
ide
1,2-
Dic
hlor
oeth
ane
Bro
mof
orm
Dib
rom
ochl
oro-
met
hane
Chlo
rofo
rm
Tolu
ene
Ben
zene
2-Pr
open
enitr
ile (A
cryl
onitr
ile)
Chlo
robe
nzen
e
Ethy
lben
zene
Hex
achl
oroe
than
e
Met
hyle
nech
lori
de
Tetr
achl
oroe
then
e (P
CE)
PCODE 30217 32101 32102 32103 32104 32105 32106 34010 34030 34215 34301 34371 34396 34423 34475
Date ppbv ppbv ppbv ppbv ppbv ppbv ppbv ppbv ppbv ppbv ppbv ppbv ppbv ppbv ppbv
24-Mar-1999 ND ND E0.103 E0.010 ND ND E0.029 0.524 0.286 ND E0.003 E0.070 ND E0.078 0.095
5-Apr-1999 ND ND E0.116 E0.007 ND ND E0.015 0.569 0.401 ND E0.002 0.110 ND ND E0.037
17-Apr-1999 ND ND E0.109 E0.009 ND ND E0.044 1.133 1.252 ND E0.004 0.207 ND 0.162 E0.057
29-Apr-1999
11-May-1999 ND ND 0.156 E0.003 ND ND E0.010 0.762 0.487 ND ND 0.105 ND ND E0.033
23-May-1999 ND ND E0.129 E0.008 ND ND E0.023 0.697 0.280 ND ND 0.087 ND ND E0.019
4-Jun-1999 ND ND E0.062 E0.002 ND ND E0.007 0.106 ND ND ND E0.019 ND ND E0.004
16-Jun-1999 ND ND E0.139 ND ND ND ND 0.495 0.537 ND ND 0.082 ND ND E0.016
28-Jun-1999 ND ND E0.081 ND ND ND E0.008 0.592 0.294 ND ND 0.101 ND ND E0.013
10-Jul-1999 ND ND E0.079 ND ND ND E0.019 0.657 0.232 ND ND 0.096 ND ND E0.018
22-Jul-1999 ND E0.016 E0.078 ND ND ND E0.044 1.030 0.334 ND ND 0.173 ND E0.029 E0.030
3-Aug-1999 ND E0.005 E0.069 E0.001 ND E0.004 E0.005 1.329 0.421 ND ND 0.203 ND ND E0.041
15-Aug-1999 ND E0.001 E0.100 E0.001 ND ND E0.003 0.432 0.157 ND ND E0.061 ND ND E0.008
27-Aug-1999 ND ND E0.075 ND ND ND E0.003 0.859 ND ND ND 0.147 ND ND E0.024
8-Sep-1999 ND E0.001 E0.078 ND ND ND E0.017 0.834 0.263 ND ND 0.117 ND ND E0.026
20-Sep-1999 ND ND E0.083 ND ND ND E0.020 1.035 0.333 ND ND 0.187 ND ND E0.034
Sample lost
84 Table 5B

Table 5B. Analytical results for the remaining VOC analytes for the SWR air sampling site, San Diego County, Calif.—Continued
PCODE
Date
24-Mar-1999
5-Apr-1999
17-Apr-1999
29-Apr-1999
11-May-1999
23-May-1999
4-Jun-1999
16-Jun-1999
28-Jun-1999
10-Jul-1999
22-Jul-1999
3-Aug-1999
15-Aug-1999
27-Aug-1999
8-Sep-1999
20-Sep-1999
1,1-
Dic
hlor
oeth
ane
1,1-
Dic
hlor
oeth
ene
1,1,
1-Tr
ichl
oro-
etha
ne
1,1,
2-Tr
ichl
oro-
etha
ne
1,1,
2,2-
Tetr
achl
oro-
etha
ne
1,2-
Dic
hlor
oben
zene
1,2-
Dic
hlor
opro
pane
tran
s-1
,2-D
ichl
oro-
ethe
ne
1,2,
4-Tr
ichl
oro
benz
ene
1,3-
Dic
hlor
oben
zene
1,4-
Dic
hlor
oben
zene
Nap
htha
lene
tran
s-1
,3-D
ichl
oro-
prop
ene
cis
-1,3
-Dic
hlor
o-pr
open
e
Tric
hlor
oeth
ene
(TCE
)
34496 34501 34506 34511 34516 34536 34541 34546 34551 34566 34571 34696 34699 34704 39180
ppbv ppbv ppbv ppbv ppbv ppbv ppbv ppbv ppbv ppbv ppbv ppbv ppbv ppbv ppbv
ND ND 0.074 ND ND ND ND ND ND ND E0.017 E0.006 ND ND E0.009
ND ND 0.075 ND ND ND ND ND ND ND E0.018 E0.012 ND ND E0.001
ND ND 0.091 ND ND ND ND ND ND ND E0.054 E0.027 ND ND E0.018
ND ND 0.085 ND ND ND ND ND ND ND E0.020 E0.027 ND ND E0.003
ND ND 0.090 ND ND ND ND ND ND ND E0.015 E0.013 ND ND E0.002
ND ND E0.039 ND ND ND ND ND ND ND E0.002 E0.002 ND ND ND
ND E0.046 E0.050 ND ND ND ND ND ND ND E0.010 E0.054 ND ND E0.009
ND ND E0.056 ND ND ND ND ND ND ND E0.017 E0.025 ND ND ND
ND ND E0.055 ND ND ND ND ND ND ND E0.016 E0.019 ND ND E0.035
ND ND 0.072 ND ND ND ND ND ND ND E0.036 E0.040 ND ND E0.004
ND ND 0.067 ND ND ND ND ND ND ND E0.047 E0.034 ND ND E0.026
ND ND E0.042 ND ND ND ND ND ND ND E0.013 E0.009 ND ND E0.0004
ND ND E0.047 ND ND ND ND ND ND ND E0.032 E0.038 ND ND E0.009
ND ND E0.059 ND ND ND ND ND ND ND E0.020 E0.017 ND ND E0.001
ND ND E0.062 ND ND ND ND ND ND ND E0.033 E0.034 ND ND E0.004
Sample lost
85 Table 5B
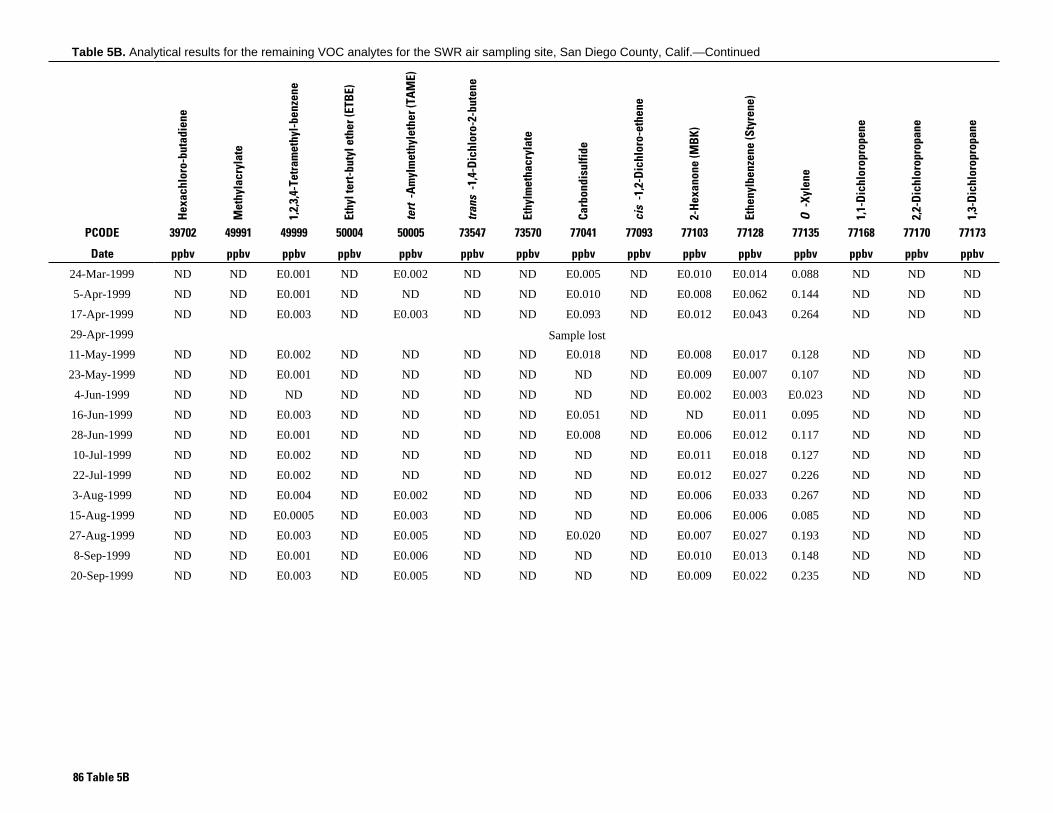
Table 5B. Analytical results for the remaining VOC analytes for the SWR air sampling site, San Diego County, Calif.—Continued
PCODE
Date
24-Mar-1999
5-Apr-1999
17-Apr-1999
29-Apr-1999
11-May-1999
23-May-1999
4-Jun-1999
16-Jun-1999
28-Jun-1999
10-Jul-1999
22-Jul-1999
3-Aug-1999
15-Aug-1999
27-Aug-1999
8-Sep-1999
20-Sep-1999
Hex
achl
oro-
buta
dien
e
Met
hyla
cryl
ate
1,2,
3,4-
Tetr
amet
hyl-
benz
ene
Ethy
l ter
t-bu
tyl e
ther
(ETB
E)
tert
-Am
ylm
ethy
leth
er (T
AM
E)
tran
s-1
,4-D
ichl
oro-
2-bu
tene
Ethy
lmet
hacr
ylat
e
Carb
ondi
sulfi
de
cis
-1,2
-Dic
hlor
o-et
hene
2-H
exan
one
(MB
K)
Ethe
nylb
enze
ne (S
tyre
ne)
O-X
ylen
e
1,1-
Dic
hlor
opro
pene
2,2-
Dic
hlor
opro
pane
1,3-
Dic
hlor
opro
pane
39702 49991 49999 50004 50005 73547 73570 77041 77093 77103 77128 77135 77168 77170 77173
ppbv ppbv ppbv ppbv ppbv ppbv ppbv ppbv ppbv ppbv ppbv ppbv ppbv ppbv ppbv
ND ND E0.001 ND E0.002 ND ND E0.005 ND E0.010 E0.014 0.088 ND ND ND
ND ND E0.001 ND ND ND ND E0.010 ND E0.008 E0.062 0.144 ND ND ND
ND ND E0.003 ND E0.003 ND ND E0.093 ND E0.012 E0.043 0.264 ND ND ND
ND ND E0.002 ND ND ND ND E0.018 ND E0.008 E0.017 0.128 ND ND ND
ND ND E0.001 ND ND ND ND ND ND E0.009 E0.007 0.107 ND ND ND
ND ND ND ND ND ND ND ND ND E0.002 E0.003 E0.023 ND ND ND
ND ND E0.003 ND ND ND ND E0.051 ND ND E0.011 0.095 ND ND ND
ND ND E0.001 ND ND ND ND E0.008 ND E0.006 E0.012 0.117 ND ND ND
ND ND E0.002 ND ND ND ND ND ND E0.011 E0.018 0.127 ND ND ND
ND ND E0.002 ND ND ND ND ND ND E0.012 E0.027 0.226 ND ND ND
ND ND E0.004 ND E0.002 ND ND ND ND E0.006 E0.033 0.267 ND ND ND
ND ND E0.0005 ND E0.003 ND ND ND ND E0.006 E0.006 0.085 ND ND ND
ND ND E0.003 ND E0.005 ND ND E0.020 ND E0.007 E0.027 0.193 ND ND ND
ND ND E0.001 ND E0.006 ND ND ND ND E0.010 E0.013 0.148 ND ND ND
ND ND E0.003 ND E0.005 ND ND ND ND E0.009 E0.022 0.235 ND ND ND
Sample lost
86 Table 5B

Table 5B. Analytical results for the remaining VOC analytes for the SWR air sampling site, San Diego County, Calif.—Continued
PCODE
Date
24-Mar-1999
5-Apr-1999
17-Apr-1999
29-Apr-1999
11-May-1999
23-May-1999
4-Jun-1999
16-Jun-1999
28-Jun-1999
10-Jul-1999
22-Jul-1999
3-Aug-1999
15-Aug-1999
27-Aug-1999
8-Sep-1999
20-Sep-1999
2-Et
hylto
luen
e
1,2,
3-Tr
imet
hyl-
benz
ene
1,2,
4-Tr
imet
hyl-
benz
ene
Isop
ropy
lben
zene
(Cum
ene)
N-p
ropy
lben
zene
1,3,
5-Tr
imet
hyl-
benz
ene
1-Ch
loro
-2-m
ethy
l-be
nzen
e
1-Ch
loro
-4-m
ethy
l-be
nzen
e
Bro
moc
hlor
o m
etha
ne
N-B
utyl
benz
ene
sec
-But
ylbe
nzen
e
tert
-But
ylbe
nzen
e
1-Is
opro
pyl-
4-m
ethy
l-be
nzen
e
1,2,
3-Tr
ichl
oro-
prop
ane
1,1,
1,2-
Tetr
achl
oro-
etha
ne
77220 77221 77222 77223 77224 77226 77275 77277 77297 77342 77350 77353 77356 77443 77562
ppbv ppbv ppbv ppbv ppbv ppbv ppbv ppbv ppbv ppbv ppbv ppbv ppbv ppbv ppbv
E0.015 E0.010 E0.060 E0.003 E0.012 E0.017 ND ND ND E0.001 E0.001 ND E0.002 ND ND
E0.015 E0.011 E0.064 E0.006 E0.013 E0.016 ND ND ND E0.002 ND ND E0.003 ND ND
E0.030 E0.027 0.120 E0.010 E0.024 E0.033 ND ND ND E0.005 E0.002 ND E0.008 ND ND
E0.023 E0.022 0.111 E0.005 E0.017 E0.026 ND ND ND E0.006 E0.001 ND E0.008 ND ND
E0.018 E0.011 0.074 E0.003 E0.017 E0.020 ND ND ND E0.001 E0.001 ND E0.003 ND E0.024
E0.004 E0.002 E0.016 E0.001 E0.004 E0.004 ND ND ND ND ND ND E0.002 ND ND
E0.020 E0.022 0.125 E0.002 E0.017 E0.020 ND ND ND E0.005 ND ND E0.006 ND ND
E0.026 E0.023 0.107 E0.004 E0.022 E0.026 ND ND ND E0.003 E0.001 ND E0.007 ND ND
E0.027 E0.016 0.111 E0.005 E0.022 E0.029 ND ND ND E0.003 E0.001 ND E0.018 ND ND
E0.044 E0.042 0.192 E0.006 E0.034 E0.052 ND ND ND E0.005 E0.002 ND E0.031 ND ND
E0.052 E0.043 0.227 E0.009 E0.041 E0.060 ND ND ND E0.007 E0.003 ND E0.045 ND ND
E0.016 E0.011 E0.067 E0.003 E0.014 E0.016 ND ND ND E0.001 E0.0004 ND E0.007 ND ND
E0.060 E0.049 0.243 E0.010 E0.047 E0.065 ND ND ND E0.008 E0.003 ND E0.051 ND ND
E0.029 E0.023 0.121 E0.005 E0.024 E0.033 E0.001 ND ND E0.004 E0.001 ND E0.016 ND ND
E0.055 E0.046 0.237 E0.010 E0.043 E0.067 ND ND ND E0.006 E0.002 ND E0.016 ND ND
Sample lost
87 Table 5B

Table 5B. Analytical results for the remaining VOC analytes for the SWR air sampling site, San Diego County, Calif.—Continued
PCODE
Date
24-Mar-1999
5-Apr-1999
17-Apr-1999
29-Apr-1999
11-May-1999
23-May-1999
4-Jun-1999
16-Jun-1999
28-Jun-1999
10-Jul-1999
22-Jul-1999
3-Aug-1999
15-Aug-1999
27-Aug-1999
8-Sep-1999
20-Sep-1999
1,2,
3-Tr
ichl
oro-
benz
ene
1,2-
Dib
rom
oeth
ane
Met
hyl t
ert
-but
ylet
her (
MTB
E)
3-Ch
loro
-1-p
rope
ne
4-M
ethy
l-2-
pent
anon
e (M
IBK)
Ace
tone
Bro
mob
enze
ne
Die
thyl
eth
er
Diis
opro
pyle
ther
(DIP
E)
Met
hyla
cryl
onitr
ile
2-B
utan
one
(Met
hyl e
thyl
ke
tone
)
Met
hylm
etha
cryl
ate
Tetr
ahyd
rofr
an
1,2-
Dib
rom
o-3-
chlo
ro-p
ropa
ne
(DB
CP)
77613 77651 78032 78109 78133 81552 81555 81576 81577 81593 81595 81597 81607 82625
ppbv ppbv ppbv ppbv ppbv ppbv ppbv ppbv ppbv ppbv ppbv ppbv ppbv ppbv
ND ND 0.478 ND E0.020 NA ND ND ND ND 0.164 ND E0.020 ND
ND ND 0.493 ND E0.016 NA ND ND ND ND E0.124 ND ND ND
ND ND 1.459 ND E0.029 NA ND ND ND ND 0.335 ND E0.009 ND
ND ND 0.482 ND E0.017 NA ND ND ND ND 0.147 ND ND ND
ND ND 0.843 ND E0.013 NA ND ND ND ND 0.228 ND ND ND
ND ND 0.124 ND E0.003 NA ND ND ND ND E0.024 ND ND ND
ND ND 0.526 ND E0.011 NA ND ND ND ND E0.064 ND ND ND
ND ND 0.622 ND E0.013 NA ND ND ND ND 0.196 ND ND ND
ND ND 0.871 ND E0.026 NA ND ND ND ND 0.258 ND ND ND
ND ND 1.427 ND E0.025 NA ND ND ND ND 0.251 ND ND ND
ND ND 1.759 ND E0.026 NA ND ND ND ND 0.227 ND ND ND
ND ND 0.641 ND E0.007 NA E0.001 ND ND ND 0.186 ND ND ND
ND ND 1.108 ND E0.034 ND ND ND ND ND 0.213 ND ND ND
ND ND 1.154 0.140 E0.022 1.224 E0.007 ND ND ND 0.244 ND E0.002 ND
ND ND 1.339 ND E0.029 1.107 ND ND ND ND 0.377 ND E0.003 ND
Sample lost
88 Table 5B

Table 5B. Analytical results for the remaining VOC analytes for the SWR air sampling site, San Diego County, Calif.—Continued
PCODE
Date
24-Mar-1999
5-Apr-1999
17-Apr-1999
29-Apr-1999
11-May-1999
23-May-1999
4-Jun-1999
16-Jun-1999
28-Jun-1999
10-Jul-1999
22-Jul-1999
3-Aug-1999
15-Aug-1999
27-Aug-1999
8-Sep-1999
20-Sep-1999
m,p
-Xyl
ene
1,2,
3,5-
Tetr
amet
hyl-
benz
ene
1,2,
4,5-
Tetr
amet
hyl-
benz
ene
Met
hyla
ceta
te
tert
-Am
ylal
coho
l
tert
-But
ylal
coho
l
85795
ppbv ppbv ppbv ppbv ppbv ppbv
0.251 E0.002 E0.002 E0.004 E0.005 E0.112
0.412 E0.004 E0.003 ND ND E0.044
0.730 E0.009 E0.007 E0.015 E0.007 0.148
0.373 E0.009 E0.007 ND ND E0.040
0.321 E0.003 E0.002 ND E0.003 E0.029
E0.071 ND ND ND ND E0.004
0.270 E0.013 E0.010 ND ND ND
0.339 E0.005 E0.004 ND ND E0.035
0.352 E0.007 E0.004 ND ND E0.073
0.649 E0.013 E0.008 ND ND 0.139
0.771 E0.015 E0.010 ND E0.004 E0.117
0.202 E0.003 E0.002 E0.012 E0.003 E0.027
0.530 E0.012 E0.008 ND E0.001 E0.092
0.421 E0.006 E0.004 ND E0.003 E0.097
0.679 E0.013 E0.010 E0.014 E0.006 E0.155
Sample lost
89 Table 5B

90 Table 6
Table 6. Analytical results for pesticide concentrations from the Sweetwater Reservoir air sampling site, San Diego County, California
[The site identification number is 324141117001601. Air sampling results for pesticides in nanogram per cubic meter (ng/m3). GFF, glass fiber filter; PUF, polyurethane foam; ND, not detected; NA, not analyzed; %, percentage recovery; m3, cubic meter; g, gram; ng/m3, nanogram per cubic meter]

Table 6. Analytical results for pesticide concentrations from the Sweetwater Reservoir air sampling site, San Diego County, California—Continued
Begin date sample
TypeAir
volume (m3)
Particle weight
(g)
Total suspended
particles (µg/m3)
2,6-
Die
thyl
-ana
line
Acet
ochl
or
Alac
hlor
alph
a-H
CH
Atra
zine
Benf
lura
lin
Buty
late
Carb
aryl
(est
imat
ed)
Carb
ofur
an
(est
imat
ed)
(ng/m3) (ng/m3) (ng/m3) (ng/m3) (ng/m3) (ng/m3) (ng/m3) (ng/m3) (ng/m3)
11-May-99 GFF 261.8 0.0153 58.4 ND ND ND ND ND ND ND ND ND
Top PUF ND ND ND ND ND ND ND ND ND
Back PUF ND ND ND ND ND ND ND ND ND
01-Jun-99 GFF 268.1 0.0099 36.9 ND ND ND ND ND ND ND ND ND
Top PUF ND ND ND ND ND ND ND ND ND
Back PUF ND ND ND ND ND ND ND ND ND
22-Jun-99 GFF 252.9 0.0117 46.3 ND ND ND ND ND ND ND ND ND
Sample lost Top PUF NA NA NA NA NA NA NA NA NA
Sample lost Back PUF NA NA NA NA NA NA NA NA NA
13-Jul-99 GFF 220.44 0.0065 29.5 ND ND ND ND ND ND ND 0.16 ND
Top PUF ND ND ND ND ND ND ND ND ND
Back PUF ND ND ND ND ND ND ND ND ND
03-Aug-99 GFF 228.14 0.0018 7.9 ND ND ND ND ND ND ND ND ND
Top PUF ND ND ND ND ND ND ND ND ND
Back PUF ND ND ND ND ND ND ND ND ND
24-Aug-99 GFF 261.46 0.0083 31.7 ND ND ND ND ND ND ND ND ND
Top PUF ND ND ND ND ND ND ND ND ND
Back PUF ND ND ND ND ND ND ND ND ND
14-Sep-99 GFF 253.69 0.0099 39.0 ND ND ND ND ND ND ND ND ND
Top PUF ND ND ND ND ND ND ND ND ND
Back PUF ND ND ND ND ND ND ND ND ND
91 Table 6

Table 6. Analytical results for pesticide concentrations from the Sweetwater Reservoir air sampling site, San Diego County, California—Continued
Begin date sample
Type
11-May-99 GFF
Top PUF
Back PUF
01-Jun-99 GFF
Top PUF
Back PUF
22-Jun-99 GFF
Sample lost Top PUF
Sample lost Back PUF
13-Jul-99 GFF
Top PUF
Back PUF
03-Aug-99 GFF
Top PUF
Back PUF
24-Aug-99 GFF
Top PUF
Back PUF
14-Sep-99 GFF
Top PUF
Back PUF
Chlo
rpyr
ifos
Cyan
azin
e
Dact
hal
Des
ipro
pyl a
traz
ine
Dia
zino
n
Diel
drin
Dim
etho
ate
Disu
lfoto
n
Endo
sulfa
n I
Endo
sulfa
n II
Endo
sulfa
n su
lfate
EPTC
(ng/m3) (ng/m3) (ng/m3) (ng/m3) (ng/m3) (ng/m3) (ng/m3) (ng/m3) (ng/m3) (ng/m3) (ng/m3) (ng/m3)
ND ND ND ND ND ND ND ND ND ND ND ND
ND ND ND ND ND ND ND ND ND ND ND ND
ND ND ND ND ND ND ND ND ND ND ND ND
ND ND ND ND ND ND ND ND ND ND ND ND
0.37 ND ND ND ND ND ND ND ND ND ND ND
ND ND ND ND ND ND ND ND ND ND ND ND
ND ND ND ND ND ND ND ND ND ND ND ND
NA NA NA NA NA NA NA NA NA NA NA NA
NA NA NA NA NA NA NA NA NA NA NA NA
ND ND ND ND 0.08 ND ND ND ND ND ND ND
0.57 ND 0.07 ND 1.30 ND ND ND ND ND ND ND
ND ND ND ND ND ND ND ND ND ND ND ND
ND ND ND ND ND ND ND ND ND ND ND ND
0.41 ND 0.10 ND 1.67 ND ND ND ND ND ND ND
ND ND ND ND ND ND ND ND ND ND ND ND
ND ND ND ND ND ND ND ND ND ND ND ND
1.02 ND 0.09 ND 2.04 ND ND ND ND ND ND ND
ND ND ND ND 0.16 ND ND ND ND ND ND ND
ND ND ND ND 0.24 ND ND ND ND ND ND ND
0.65 ND 0.07 ND 1.24 ND ND ND ND ND ND ND
ND ND ND ND ND ND ND ND ND ND ND ND
92 Table 6

Table 6. Analytical results for pesticide concentrations from the Sweetwater Reservoir air sampling site, San Diego County, California—Continued
Begin date sample
Type
11-May-99 GFF
Top PUF
Back PUF
01-Jun-99 GFF
Top PUF
Back PUF
22-Jun-99 GFF
Sample lost Top PUF
Sample lost Back PUF
13-Jul-99 GFF
Top PUF
Back PUF
03-Aug-99 GFF
Top PUF
Back PUF
24-Aug-99 GFF
Top PUF
Back PUF
14-Sep-99 GFF
Top PUF
Back PUF
Etha
lflur
alin
Ethi
on
Etho
prop
hos
Fono
fos
Lind
ane
Linu
ron
Mal
athi
on
Azi
npho
s-m
ethy
l
Met
hyl p
arat
hion
Met
olac
hlor
Met
ribuz
in
Mol
inat
e
(ng/m3) (ng/m3) (ng/m3) (ng/m3) (ng/m3) (ng/m3) (ng/m3) (ng/m3) (ng/m3) (ng/m3) (ng/m3) (ng/m3)
ND ND ND ND ND ND ND ND ND ND ND ND
ND ND ND ND ND ND ND ND ND ND ND ND
ND ND ND ND ND ND ND ND ND ND ND ND
ND ND ND ND ND ND ND ND ND ND ND ND
ND ND ND ND ND ND ND ND ND ND ND ND
ND ND ND ND ND ND ND ND ND ND ND ND
ND ND ND ND ND ND ND ND ND ND ND ND
NA NA NA NA NA NA NA NA NA NA NA NA
NA NA NA NA NA NA NA NA NA NA NA NA
ND ND ND ND ND ND ND ND ND ND ND ND
ND ND ND ND ND ND 0.32 ND ND ND ND ND
ND ND ND ND ND ND ND ND ND ND ND ND
ND ND ND ND ND ND ND ND ND ND ND ND
ND ND ND ND ND ND 0.32 ND ND ND ND ND
ND ND ND ND ND ND ND ND ND ND ND ND
ND ND ND ND ND ND ND ND ND ND ND ND
ND ND ND ND ND ND 0.56 ND ND ND ND ND
ND ND ND ND ND ND ND ND ND ND ND ND
ND ND ND ND ND ND 0.13 ND ND ND ND ND
ND ND ND ND ND ND 0.30 ND ND ND ND ND
ND ND ND ND ND ND ND ND ND ND ND ND
93 Table 6

Table 6. Analytical results for pesticide concentrations from the Sweetwater Reservoir air sampling site, San Diego County, California—Continued
Begin date sample
Type
11-May-99 GFF
Top PUF
Back PUF
01-Jun-99 GFF
Top PUF
Back PUF
22-Jun-99 GFF
Sample lost Top PUF
Sample lost Back PUF
13-Jul-99 GFF
Top PUF
Back PUF
03-Aug-99 GFF
Top PUF
Back PUF
24-Aug-99 GFF
Top PUF
Back PUF
14-Sep-99 GFF
Top PUF
Back PUF
Nap
ropa
mid
e
p,p
'-DD
E
Para
thio
n
Pebu
late
Pend
imet
hila
n
cis
-Per
met
hrin
Phor
ate
Prom
eton
Pron
amid
e
Prop
achl
or
Prop
anil
Prop
argi
te
(ng/m3) (ng/m3) (ng/m3) (ng/m3) (ng/m3) (ng/m3) (ng/m3) (ng/m3) (ng/m3) (ng/m3) (ng/m3) (ng/m3)
ND ND ND ND ND ND ND ND ND ND ND ND
ND ND ND ND ND ND ND ND ND ND ND ND
ND ND ND ND ND ND ND ND ND ND ND ND
ND ND ND ND ND ND ND ND ND ND ND ND
ND ND ND ND ND ND ND ND ND ND ND ND
ND ND ND ND ND ND ND ND ND ND ND ND
ND ND ND ND ND ND ND ND ND ND ND ND
NA NA NA NA NA NA NA NA NA NA NA NA
NA NA NA NA NA NA NA NA NA NA NA NA
ND ND ND ND ND ND ND ND ND ND ND ND
ND 0.06 ND ND ND ND ND ND ND ND ND ND
ND ND ND ND ND ND ND ND ND ND ND ND
ND ND ND ND ND ND ND ND ND ND ND ND
ND 0.07 ND ND ND ND ND ND ND ND ND ND
ND ND ND ND ND ND ND ND ND ND ND ND
ND ND ND ND ND ND ND ND ND ND ND ND
ND 0.08 ND ND ND ND ND ND ND ND ND ND
ND ND ND ND ND ND ND ND ND ND ND ND
ND ND ND ND ND ND ND ND ND ND ND ND
ND 0.05 ND ND ND ND ND ND ND ND ND ND
ND ND ND ND ND ND ND ND ND ND ND ND
94 Table 6

Table 6. Analytical results for pesticide concentrations from the Sweetwater Reservoir air sampling site, San Diego County, California—Continued
Begin date sample
Type
11-May-99 GFF
Top PUF
Back PUF
01-Jun-99 GFF
Top PUF
Back PUF
22-Jun-99 GFF
Sample lost Top PUF
Sample lost Back PUF
13-Jul-99 GFF
Top PUF
Back PUF
03-Aug-99 GFF
Top PUF
Back PUF
24-Aug-99 GFF
Top PUF
Back PUF
14-Sep-99 GFF
Top PUF
Back PUF
Sim
azin
e
Tebu
thiu
ron
Terb
acil
Terb
ufos
Thio
benc
arb
Tria
llate
Trifl
ural
in
alph
a-H
CH-d
6
Dia
zino
n-d
10
(ng/m3) (ng/m3) (ng/m3) (ng/m3) (ng/m3) (ng/m3) (ng/m3) (%) (%)
ND ND ND ND ND ND ND 28 59
ND ND ND ND ND ND ND 48 80
ND ND ND ND ND ND ND 47 85
ND ND ND ND ND ND ND 19 31
ND ND ND ND ND ND ND 47 82
ND ND ND ND ND ND ND 40 79
ND ND ND ND ND ND ND 29 41
NA NA NA NA NA NA NA NA NA
NA NA NA NA NA NA NA NA NA
ND ND ND ND ND ND ND 59 64
ND ND ND ND ND ND ND 60 69
ND ND ND ND ND ND ND 59 59
ND ND ND ND ND ND ND 61 65
ND ND ND ND ND ND ND 64 78
ND ND ND ND ND ND ND 68 80
ND ND ND ND ND ND ND 67 67
ND ND ND ND ND ND ND 68 70
ND ND ND ND ND ND ND 68 95
ND ND ND ND ND ND ND 61 68
ND ND ND ND ND ND 0.07 61.0 85.0
ND ND ND ND ND ND ND 65.0 79.0
95 Table 6

96 Table 7
Table 7. Analytical results for polynuclear aromatic hydrocarbon compound concentrations in core segments and reservoir and urban runoff diversion system pond surficial bed sediment samples, Sweetwater Reservoir, San Diego County, California
[An “E” indicates that the value has been estimated because of interference or is below method reporting limits. The number given below the compound is its parameter code (PCODE). Calif., California; ID, identification; SWR, Sweetwater Reservoir; surf, surficial sample; NA, not analyzed; PAHs, polynuclear aromatic hydrocarbons; URDS, urban runoff diversion system; %, percentage recovery; <, compound was not detected at a concentration above the reporting level; µg/kg, microgram per kilogram; cm, centimeter]

Table 7. Analytical results for PAHs from SWR, San Diego County, Calif., core segments, surficial bed sediment, and URDS samples—Continued
Phen
ol
p-C
reso
l
C8-a
lkyl
-phe
nol
Nap
htha
lene
C1-1
28 is
omer
s
2-Et
hyl-
naph
thal
ene
2,6-
Dim
ethy
l-na
phth
alen
e
PCODE 49413 49451 49402 49948 49406Type (µµµµg/kg) (µµµµg/kg) (µµµµg/kg) (µµµµg/kg) (µµµµg/kg) (µµµµg/kg) (µµµµg/kg)
SWR Core - Depth 000 - 004 cm 24-Sep-1998 324161116599401 core E20.7 E33.3 NA E8.0 <30 <30 162
SWR Core - Depth 008 - 012 cm 24-Sep-1998 324161116599401 core E12.6 E25.2 NA E5.4 <20 <20 114
SWR Core - Depth 016 - 020 cm 24-Sep-1998 324161116599401 core E8.6 E45.5 NA E5.8 20.0 <10 91.2SWR Core - Depth 024 - 028 cm 24-Sep-1998 324161116599401 core E15.2 E57.8 NA E11.7 31.2 <20 158SWR Core - Depth 032 - 036 cm 24-Sep-1998 324161116599401 core 15.7 23.1 NA E7.5 33.7 <10 196SWR Core - Depth 044 - 048 cm 24-Sep-1998 324161116599401 core 11.0 10.6 NA E2.3 11.2 <10 134SWR Core - Depth 056 - 060 cm 24-Sep-1998 324161116599401 core E5.9 E18.2 NA E2.5 <10 <10 60.0SWR Core - Depth 068 - 072 cm 24-Sep-1998 324161116599401 core E8.3 E6.0 NA E1.7 E5.2 <10 32.3SWR Core - Depth 084 - 088 cm 24-Sep-1998 324161116599401 core E11.9 E13.9 NA E5.8 E14.2 <10 90.8SWR Core - Depth 100 - 104 cm 24-Sep-1998 324161116599401 core E6.2 E4.1 NA E1.8 <10 <10 37.5SWR Core - Depth 116 - 120 cm 24-Sep-1998 324161116599401 core 16.4 E5.4 NA E2.2 E7.2 <10 77.8SWR Core - Depth 132 - 136 cm 24-Sep-1998 324161116599401 core 27.5 E7.6 NA E2.7 <10 <10 83.6SWR Core - Depth 148 - 152 cm 24-Sep-1998 324161116599401 core 12.5 E3.4 NA E1.4 <10 <10 E3.3SWR Core - Depth 164 - 168 cm 24-Sep-1998 324161116599401 core 12.7 E3.0 NA E2.2 <10 <10 29.2SWR Core - Depth 180 - 184 cm 24-Sep-1998 324161116599401 core E10.1 E2.1 NA E1.5 <10 <10 <10SWR near pump tower 04-Nov-1998 324130117002501 surf 915 4,900 NA 38.7 82.2 <10 159SWR near Vista del Lago station 04-Nov-1998 324139117000801 surf 10.9 39.3 NA E2.8 12.1 <10 86SWR center of minimum pool 04-Nov-1998 324131117000101 surf 19.9 54.6 NA E5.6 19.4 <10 157SWR near recreation site 04-Nov-1998 324126116595701 surf 60.6 863 NA 10.4 33.8 <10 224SWR minimum pool boundary East 04-Nov-1998 324137116592401 surf 33.1 34.6 NA E4.4 18.1 <10 229SWR east end fill boundary 04-Nov-1998 324209116585001 surf E9.6 14.2 NA E2.4 E8.6 <10 24.6SWR near Gum Tree Cove Pond 04-Nov-1998 324147116593501 surf 17.7 19.4 NA E4.2 15.4 <10 146Loveland Reservoir near dam 04-Nov-1998 324703116473101 surf 14.6 14.5 NA E2.8 11.4 <10 69.2Loveland Reservoir east end near source inlet 04-Nov-1998 324737116453501 surf 16.4 61.0 NA E3.1 11.6 <10 29.2URDS Alcena Court Pond_01 05-Nov-1998 324223116585901 core 37.2 68.6 NA 4.4 12.3 <10 54.2URDS Alcena Court Pond_02 05-Nov-1998 324221116585801 core 12.8 E7.5 NA E2.7 11.2 <10 41.2URDS Gumtree Cove Pond_01 05-Nov-1998 324202116593401 core 25.0 11.7 NA E2.8 <10 <10 95.8URDS Hansen's Creek Pond_01 05-Nov-1998 324239116583401 core E9.2 67.8 NA E2.1 E6.6 <10 71.2URDS Hansen's Creek Pond_02 05-Nov-1998 324241116583501 core 42.1 14.1 NA E5.0 20.5 <10 129URDS Vista del Lago_01 05-Nov-1998 324142117001301 core 97.0 E316 NA 28.4 159 14.1 51.0
Site name Date Site ID
97 Table 7

Table 7. Analytical results for PAHs from SWR, San Diego County, Calif., core segments, surficial bed sediment, and URDS samples—Continued
PCODEType
SWR Core - Depth 000 - 004 cm 24-Sep-1998 324161116599401 core
SWR Core - Depth 008 - 012 cm 24-Sep-1998 324161116599401 core
SWR Core - Depth 016 - 020 cm 24-Sep-1998 324161116599401 coreSWR Core - Depth 024 - 028 cm 24-Sep-1998 324161116599401 coreSWR Core - Depth 032 - 036 cm 24-Sep-1998 324161116599401 coreSWR Core - Depth 044 - 048 cm 24-Sep-1998 324161116599401 coreSWR Core - Depth 056 - 060 cm 24-Sep-1998 324161116599401 coreSWR Core - Depth 068 - 072 cm 24-Sep-1998 324161116599401 coreSWR Core - Depth 084 - 088 cm 24-Sep-1998 324161116599401 coreSWR Core - Depth 100 - 104 cm 24-Sep-1998 324161116599401 coreSWR Core - Depth 116 - 120 cm 24-Sep-1998 324161116599401 coreSWR Core - Depth 132 - 136 cm 24-Sep-1998 324161116599401 coreSWR Core - Depth 148 - 152 cm 24-Sep-1998 324161116599401 coreSWR Core - Depth 164 - 168 cm 24-Sep-1998 324161116599401 coreSWR Core - Depth 180 - 184 cm 24-Sep-1998 324161116599401 coreSWR near pump tower 04-Nov-1998 324130117002501 surfSWR near Vista del Lago station 04-Nov-1998 324139117000801 surfSWR center of minimum pool 04-Nov-1998 324131117000101 surfSWR near recreation site 04-Nov-1998 324126116595701 surfSWR minimum pool boundary East 04-Nov-1998 324137116592401 surfSWR east end fill boundary 04-Nov-1998 324209116585001 surfSWR near Gum Tree Cove Pond 04-Nov-1998 324147116593501 surfLoveland Reservoir near dam 04-Nov-1998 324703116473101 surfLoveland Reservoir east end near source inlet 04-Nov-1998 324737116453501 surfURDS Alcena Court Pond_01 05-Nov-1998 324223116585901 coreURDS Alcena Court Pond_02 05-Nov-1998 324221116585801 coreURDS Gumtree Cove Pond_01 05-Nov-1998 324202116593401 coreURDS Hansen's Creek Pond_01 05-Nov-1998 324239116583401 coreURDS Hansen's Creek Pond_02 05-Nov-1998 324241116583501 coreURDS Vista del Lago_01 05-Nov-1998 324142117001301 core
Site name Date Site ID
1,6-
Dim
ethy
l-na
phth
alen
e
C2-1
28 is
omer
s
Ace
naph
thyl
ene
1,2-
Dim
ethy
l-na
phth
alen
e
Ace
naph
then
e
C3-1
28 is
omer
s
2,3,
6-Tr
imet
hyl-
naph
thal
ene
49404 49403 49429(µµµµg/kg) (µµµµg/kg) (µµµµg/kg) (µµµµg/kg) (µµµµg/kg) (µµµµg/kg) (µµµµg/kg)
E21.8 E312 <30 <30 <30 E29.2 <30
E4.1 E306 <20 <20 <20 21.9 <20
E3.0 E167 E2.6 <10 <10 13.2 <10E6.2 E285 E5.3 <20 <20 30.0 <2014.0 221 E3.2 E2.9 E2.3 16.9 E3.2E9.4 156 E2.3 <10 <10 12.6 <10<13.0 E131 E2.4 <10 <10 15.4 <10E4.6 36.0 E2.9 <10 <10 18.4 <10E9.2 E180 <20 <20 <20 21.4 <20E8.2 E81.9 <10 <10 <10 12.8 <10E6.2 93.6 E2.5 E1.5 E1.8 E9.8 E2.0E7.2 99.2 <10 <10 <10 <10 <10E1.0 E6.0 <10 <10 <10 <10 <10E6.2 E65.1 <10 <10 <10 8.6 <10<10 <10 <10 <10 <10 <10 <1021.2 157 E9.4 <10 E3.3 67.4 <10E7.5 105 E3.0 <10 <10 22.6 <1020.9 256 E2.9 <10 <10 43.9 <1024.2 345 E4.7 <10 <10 59.0 <1024.0 251 E4.5 <10 <10 39.4 <10E3.6 26.1 E2.6 <10 <10 <10 <1013.3 163 E3.3 <10 <10 38.4 <1012.8 75.6 E3.5 <10 <10 14.5 E2.8E4.9 36.3 E4.6 <10 <10 25.8 <10E6.1 62.9 E3.9 <10 <10 14.3 <10E5.0 60.6 E2.9 <10 <10 <10 <1010.6 105 E4.5 <10 <10 29.1 <10E6.0 81.2 E4.3 <10 E1.1 E7.7 <1014.3 152 E8.3 <10 <10 39.9 <1066.6 E306 26.4 <15 26.7 88.8 24.9
98 Table 7

Table 7. Analytical results for PAHs from SWR, San Diego County, Calif., core segments, surficial bed sediment, and URDS samples—Continued
PCODEType
SWR Core - Depth 000 - 004 cm 24-Sep-1998 324161116599401 core
SWR Core - Depth 008 - 012 cm 24-Sep-1998 324161116599401 core
SWR Core - Depth 016 - 020 cm 24-Sep-1998 324161116599401 coreSWR Core - Depth 024 - 028 cm 24-Sep-1998 324161116599401 coreSWR Core - Depth 032 - 036 cm 24-Sep-1998 324161116599401 coreSWR Core - Depth 044 - 048 cm 24-Sep-1998 324161116599401 coreSWR Core - Depth 056 - 060 cm 24-Sep-1998 324161116599401 coreSWR Core - Depth 068 - 072 cm 24-Sep-1998 324161116599401 coreSWR Core - Depth 084 - 088 cm 24-Sep-1998 324161116599401 coreSWR Core - Depth 100 - 104 cm 24-Sep-1998 324161116599401 coreSWR Core - Depth 116 - 120 cm 24-Sep-1998 324161116599401 coreSWR Core - Depth 132 - 136 cm 24-Sep-1998 324161116599401 coreSWR Core - Depth 148 - 152 cm 24-Sep-1998 324161116599401 coreSWR Core - Depth 164 - 168 cm 24-Sep-1998 324161116599401 coreSWR Core - Depth 180 - 184 cm 24-Sep-1998 324161116599401 coreSWR near pump tower 04-Nov-1998 324130117002501 surfSWR near Vista del Lago station 04-Nov-1998 324139117000801 surfSWR center of minimum pool 04-Nov-1998 324131117000101 surfSWR near recreation site 04-Nov-1998 324126116595701 surfSWR minimum pool boundary East 04-Nov-1998 324137116592401 surfSWR east end fill boundary 04-Nov-1998 324209116585001 surfSWR near Gum Tree Cove Pond 04-Nov-1998 324147116593501 surfLoveland Reservoir near dam 04-Nov-1998 324703116473101 surfLoveland Reservoir east end near source inlet 04-Nov-1998 324737116453501 surfURDS Alcena Court Pond_01 05-Nov-1998 324223116585901 coreURDS Alcena Court Pond_02 05-Nov-1998 324221116585801 coreURDS Gumtree Cove Pond_01 05-Nov-1998 324202116593401 coreURDS Hansen's Creek Pond_01 05-Nov-1998 324239116583401 coreURDS Hansen's Creek Pond_02 05-Nov-1998 324241116583501 coreURDS Vista del Lago_01 05-Nov-1998 324142117001301 core
Site name Date Site ID
9H-F
luor
ene
C4-1
28 is
omer
s
1-M
ethy
l-9H
-flu
oren
e
C1-1
66 is
omer
s
Dib
enzo
-thi
phen
e
Phen
anth
rene
Ant
hrac
ene
49399 49398 49409 49434(µµµµg/kg) (µµµµg/kg) (µµµµg/kg) (µµµµg/kg) (µµµµg/kg) (µµµµg/kg) (µµµµg/kg)
E6.1 <30 E5.2 NA NA E10.2 <30
E5.5 <20 <20 NA NA E8.6 <20
E6.0 <10 E3.1 NA NA E9.7 E3.7E15.0 <20 E5.6 NA NA E18.1 E5.416.7 <10 E6.7 NA NA 16.0 E4.8E7.9 11.3 E4.8 NA NA E6.0 E4.1E5.0 <10 <10 NA NA E6.3 E3.3E3.7 <10 E1.8 NA NA E5.0 E2.6E13.5 <20 E6.4 NA NA E14.4 E6.5E3.2 <10 E3.8 NA NA E4.0 E3.1E5.5 <10 E3.6 NA NA E1.5 E4.8E5.6 <10 E4.6 NA NA E6.2 E4.1E1.2 <10 E2.0 NA NA E3.1 E2.4E1.8 <10 E1.8 NA NA E5.3 E2.2<10 <10 E1.1 NA NA E1.8 <1010.5 53.0 E7.3 NA NA 14.7 E5.1E4.5 27.8 E2.8 NA NA E5.9 E2.4E8.8 49.7 E3.7 NA NA 11.4 E2.6E21.9 58.6 E8.5 NA NA 17.2 E4.4E5.8 E6.8 E2.8 NA NA E8.1 E3.8E1.5 <10 E2.0 NA NA E1.8 E1.6E7.0 <10 E4.7 NA NA E8.8 E3.7E2.2 <10 E6.9 NA NA E7.0 E3.5E2.8 <10 E2.8 NA NA 14.5 4.5E2.5 <10 E2.4 NA NA E9.7 E4.3E2.2 <10 E2.4 NA NA E5.3 E3.2 <10 <10 E4.5 NA NA E3.3 E4.5E2.4 <10 <10 NA NA 10.4 E5.5E4.6 <10 E3.8 NA NA 25.6 E9.3<22.0 141 E7.4 NA NA 269 61.8
99 Table 7

Table 7. Analytical results for PAHs from SWR, San Diego County, Calif., core segments, surficial bed sediment, and URDS samples—Continued
PCODEType
SWR Core - Depth 000 - 004 cm 24-Sep-1998 324161116599401 core
SWR Core - Depth 008 - 012 cm 24-Sep-1998 324161116599401 core
SWR Core - Depth 016 - 020 cm 24-Sep-1998 324161116599401 coreSWR Core - Depth 024 - 028 cm 24-Sep-1998 324161116599401 coreSWR Core - Depth 032 - 036 cm 24-Sep-1998 324161116599401 coreSWR Core - Depth 044 - 048 cm 24-Sep-1998 324161116599401 coreSWR Core - Depth 056 - 060 cm 24-Sep-1998 324161116599401 coreSWR Core - Depth 068 - 072 cm 24-Sep-1998 324161116599401 coreSWR Core - Depth 084 - 088 cm 24-Sep-1998 324161116599401 coreSWR Core - Depth 100 - 104 cm 24-Sep-1998 324161116599401 coreSWR Core - Depth 116 - 120 cm 24-Sep-1998 324161116599401 coreSWR Core - Depth 132 - 136 cm 24-Sep-1998 324161116599401 coreSWR Core - Depth 148 - 152 cm 24-Sep-1998 324161116599401 coreSWR Core - Depth 164 - 168 cm 24-Sep-1998 324161116599401 coreSWR Core - Depth 180 - 184 cm 24-Sep-1998 324161116599401 coreSWR near pump tower 04-Nov-1998 324130117002501 surfSWR near Vista del Lago station 04-Nov-1998 324139117000801 surfSWR center of minimum pool 04-Nov-1998 324131117000101 surfSWR near recreation site 04-Nov-1998 324126116595701 surfSWR minimum pool boundary East 04-Nov-1998 324137116592401 surfSWR east end fill boundary 04-Nov-1998 324209116585001 surfSWR near Gum Tree Cove Pond 04-Nov-1998 324147116593501 surfLoveland Reservoir near dam 04-Nov-1998 324703116473101 surfLoveland Reservoir east end near source inlet 04-Nov-1998 324737116453501 surfURDS Alcena Court Pond_01 05-Nov-1998 324223116585901 coreURDS Alcena Court Pond_02 05-Nov-1998 324221116585801 coreURDS Gumtree Cove Pond_01 05-Nov-1998 324202116593401 coreURDS Hansen's Creek Pond_01 05-Nov-1998 324239116583401 coreURDS Hansen's Creek Pond_02 05-Nov-1998 324241116583501 coreURDS Vista del Lago_01 05-Nov-1998 324142117001301 core
Site name Date Site ID
Acr
idin
e
Phen
anth
ridi
ne
9H-C
arba
zol
C5-1
28 is
omer
s
C2-1
66 is
omer
s
2-M
ethy
l-A
nthr
acen
e
4,5-
Met
hyle
ne-
phen
anth
rene
49435 49411(µµµµg/kg) (µµµµg/kg) (µµµµg/kg) (µµµµg/kg) (µµµµg/kg) (µµµµg/kg) (µµµµg/kg)
NA NA NA <30 NA <30 E6.3
NA NA NA <20 NA <20 E4.9
NA NA NA <10 NA <10 E4.3 NA NA NA <20 NA <20 E7.4 NA NA NA <10 NA <10 E6.7 NA NA NA <10 NA <10 E3.7 NA NA NA <10 NA <10 E3.9 NA NA NA <10 NA <10 E3.6 NA NA NA <20 NA <20 E8.0 NA NA NA <10 NA <10 E3.7 NA NA NA <10 NA E3 E6.5 NA NA NA <10 NA E3 E6.6 NA NA NA <10 NA <10 <10 NA NA NA <10 NA <10 <10 NA NA NA <10 NA <10 E1.8 NA NA NA <10 NA <10 <10 NA NA NA <10 NA <10 E4.2 NA NA NA <10 NA <10 E4.5 NA NA NA <10 NA <10 E6.4 NA NA NA 24.1 NA <10 E3.9 NA NA NA <10 NA <10 <10 NA NA NA <10 NA <10 E4.4 NA NA NA <10 NA <10 E3.3 NA NA NA <10 NA <10 E3.4 NA NA NA <10 NA <10 E3.5 NA NA NA <10 NA <10 4.2 NA NA NA <10 NA <10 E5.0 NA NA NA <10 NA <10 E4.2 NA NA NA <10 NA <10 E8.7 NA NA NA 62.0 NA 30 47.3
100 Table 7

Table 7. Analytical results for PAHs from SWR, San Diego County, Calif., core segments, surficial bed sediment, and URDS samples—Continued
PCODEType
SWR Core - Depth 000 - 004 cm 24-Sep-1998 324161116599401 core
SWR Core - Depth 008 - 012 cm 24-Sep-1998 324161116599401 core
SWR Core - Depth 016 - 020 cm 24-Sep-1998 324161116599401 coreSWR Core - Depth 024 - 028 cm 24-Sep-1998 324161116599401 coreSWR Core - Depth 032 - 036 cm 24-Sep-1998 324161116599401 coreSWR Core - Depth 044 - 048 cm 24-Sep-1998 324161116599401 coreSWR Core - Depth 056 - 060 cm 24-Sep-1998 324161116599401 coreSWR Core - Depth 068 - 072 cm 24-Sep-1998 324161116599401 coreSWR Core - Depth 084 - 088 cm 24-Sep-1998 324161116599401 coreSWR Core - Depth 100 - 104 cm 24-Sep-1998 324161116599401 coreSWR Core - Depth 116 - 120 cm 24-Sep-1998 324161116599401 coreSWR Core - Depth 132 - 136 cm 24-Sep-1998 324161116599401 coreSWR Core - Depth 148 - 152 cm 24-Sep-1998 324161116599401 coreSWR Core - Depth 164 - 168 cm 24-Sep-1998 324161116599401 coreSWR Core - Depth 180 - 184 cm 24-Sep-1998 324161116599401 coreSWR near pump tower 04-Nov-1998 324130117002501 surfSWR near Vista del Lago station 04-Nov-1998 324139117000801 surfSWR center of minimum pool 04-Nov-1998 324131117000101 surfSWR near recreation site 04-Nov-1998 324126116595701 surfSWR minimum pool boundary East 04-Nov-1998 324137116592401 surfSWR east end fill boundary 04-Nov-1998 324209116585001 surfSWR near Gum Tree Cove Pond 04-Nov-1998 324147116593501 surfLoveland Reservoir near dam 04-Nov-1998 324703116473101 surfLoveland Reservoir east end near source inlet 04-Nov-1998 324737116453501 surfURDS Alcena Court Pond_01 05-Nov-1998 324223116585901 coreURDS Alcena Court Pond_02 05-Nov-1998 324221116585801 coreURDS Gumtree Cove Pond_01 05-Nov-1998 324202116593401 coreURDS Hansen's Creek Pond_01 05-Nov-1998 324239116583401 coreURDS Hansen's Creek Pond_02 05-Nov-1998 324241116583501 coreURDS Vista del Lago_01 05-Nov-1998 324142117001301 core
Site name Date Site ID
C1-1
78 is
omer
s
1-M
ethy
l-Ph
enan
thre
ne
C3-1
66 is
omer
s
C2-1
78 is
omer
s
Fluo
rant
hene
Pyre
ne
C3-1
78 is
omer
s
49410 49466 49387(µµµµg/kg) (µµµµg/kg) (µµµµg/kg) (µµµµg/kg) (µµµµg/kg) (µµµµg/kg) (µµµµg/kg)
<30 <30 NA <30 E15.7 E17.3 <30
<20 <20 NA <20 E13.6 E13.4 <20
<10 <10 NA <10 15.8 13.3 <10<20 <20 NA <20 20.9 E17.4 <2017.1 E5.4 NA 10.0 21.0 15.5 E4.910.0 E2.6 NA E5.9 15.4 13.6 <10<10 <10 NA <10 12.1 10.0 <10E5.6 <10 NA <10 E9.0 E8.8 <10<20 <20 NA <20 28.4 22.8 <20<10 <10 NA <10 11.0 E9.0 <1011.5 E2.6 NA E8.7 23.1 18.0 <10E9.2 <10 NA <10 16.7 15.2 <10<10 <10 NA <10 E7.1 11.4 <10<10 <10 NA <10 E9.0 E8.0 <10<10 <10 NA <10 E3.7 E3.9 <1010.5 <10 NA <10 12.3 E9.9 <10 <10 <10 NA <10 10.9 11.2 <1010.1 <10 NA <10 15.5 15.7 <10E6.3 E5.4 NA E5.1 18.8 17.7 <10
INTERFERENCE <10 NA <10 14.3 14.6 <10<10 <10 NA <10 E3.8 E3.2 <10E9.0 E3.9 NA <10 15.5 16.0 <1010.6 <10 NA E9.6 15.0 14.8 <1014.5 E3.4 NA 17.1 35.8 33.1 E6.811.9 E3.7 NA 38.5 27.2 32.0 15.6E3.9 E4.2 NA 13.4 18.5 22.5 13.0 <10 E5.60 NA <80 11.9 12.8 <1010.1 E3.90 NA 16.2 30.0 29.3 E5.5
E23.0 E6.0 NA 16.3 75.4 78.6 E9.8485 88.5 NA 504 407 371 367
101 Table 7

Table 7. Analytical results for PAHs from SWR, San Diego County, Calif., core segments, surficial bed sediment, and URDS samples—Continued
PCODEType
SWR Core - Depth 000 - 004 cm 24-Sep-1998 324161116599401 core
SWR Core - Depth 008 - 012 cm 24-Sep-1998 324161116599401 core
SWR Core - Depth 016 - 020 cm 24-Sep-1998 324161116599401 coreSWR Core - Depth 024 - 028 cm 24-Sep-1998 324161116599401 coreSWR Core - Depth 032 - 036 cm 24-Sep-1998 324161116599401 coreSWR Core - Depth 044 - 048 cm 24-Sep-1998 324161116599401 coreSWR Core - Depth 056 - 060 cm 24-Sep-1998 324161116599401 coreSWR Core - Depth 068 - 072 cm 24-Sep-1998 324161116599401 coreSWR Core - Depth 084 - 088 cm 24-Sep-1998 324161116599401 coreSWR Core - Depth 100 - 104 cm 24-Sep-1998 324161116599401 coreSWR Core - Depth 116 - 120 cm 24-Sep-1998 324161116599401 coreSWR Core - Depth 132 - 136 cm 24-Sep-1998 324161116599401 coreSWR Core - Depth 148 - 152 cm 24-Sep-1998 324161116599401 coreSWR Core - Depth 164 - 168 cm 24-Sep-1998 324161116599401 coreSWR Core - Depth 180 - 184 cm 24-Sep-1998 324161116599401 coreSWR near pump tower 04-Nov-1998 324130117002501 surfSWR near Vista del Lago station 04-Nov-1998 324139117000801 surfSWR center of minimum pool 04-Nov-1998 324131117000101 surfSWR near recreation site 04-Nov-1998 324126116595701 surfSWR minimum pool boundary East 04-Nov-1998 324137116592401 surfSWR east end fill boundary 04-Nov-1998 324209116585001 surfSWR near Gum Tree Cove Pond 04-Nov-1998 324147116593501 surfLoveland Reservoir near dam 04-Nov-1998 324703116473101 surfLoveland Reservoir east end near source inlet 04-Nov-1998 324737116453501 surfURDS Alcena Court Pond_01 05-Nov-1998 324223116585901 coreURDS Alcena Court Pond_02 05-Nov-1998 324221116585801 coreURDS Gumtree Cove Pond_01 05-Nov-1998 324202116593401 coreURDS Hansen's Creek Pond_01 05-Nov-1998 324239116583401 coreURDS Hansen's Creek Pond_02 05-Nov-1998 324241116583501 coreURDS Vista del Lago_01 05-Nov-1998 324142117001301 core
Site name Date Site ID
C4-1
78 is
omer
s
1-M
ethy
l-Py
rene
C1-2
02 is
omer
s
C2-2
02 is
omer
s
C5-1
78 is
omer
s
Ben
z (a
) ant
hrac
ene
Chry
sene
49388 49436 49450(µµµµg/kg) (µµµµg/kg) (µµµµg/kg) (µµµµg/kg) (µµµµg/kg) (µµµµg/kg) (µµµµg/kg)
<30 <30 <30 <30 <30 E11.8 E16.1
<20 E6.9 <20 <20 <20 E8.5 E12.5
<10 <10 E7.6 <10 <10 E7.8 13.3<20 <20 E11.8 E14.0 <20 E8.5 E12.6<10 E4.0 13.9 E8.5 <10 E5.3 E9.4<10 E3.4 E9.8 <10 <10 E5.7 E8.4<10 <10 E5.6 <10 <10 E5.8 11.2<10 <10 E6.4 E3.5 <10 E2.7 E5.4<20 <20 E12.4 <20 <20 E8.8 E15.4<10 <10 E6.4 <10 <10 E5.0 E7.7<10 E3.0 13.4 <10 <10 E2.1 E8.9<10 <10 12.4 <10 <10 E5.4 E8.2<10 <10 E5.7 <10 <10 E4.0 E6.8<10 <10 <10 <10 <10 E3.3 E5.2<10 <10 <10 <10 <10 E2.0 E3.5 <10 <10 <10 <10 <10 E3.9 E6.5 <10 <10 E6.3 <10 <10 E3.1 E7.6<10 E2.6 10.6 <10 <10 E5.0 10.6<10 E3.4 12.5 <10 <10 E6.2 11.3 <10 E2.1 E8.8 13.0 <10 E6.6 10.4 <10 <10 <10 <10 <10 E1.0 E2.1<10 E2.8 10.5 16.2 <10 E7.3 12.9<10 E2.7 13.7 16.7 <10 E5.9 15.6 <10 E2.8 20.9 27.9 <10 11.3 26.4 <10 E3.7 25.3 22.4 20.7 10.2 23.2 <10 E4.3 21.3 18.5 <10 E9.7 16.6 <10 <10 <10 <10 <10 E4.6 10.3 <10 E3.1 20.7 22.7 <10 11.4 22.3 <10 E5.7 44.0 71.6 <10 25.8 54.3<200 43.8 E 536 <800 123 315
102 Table 7

Table 7. Analytical results for PAHs from SWR, San Diego County, Calif., core segments, surficial bed sediment, and URDS samples—Continued
PCODEType
SWR Core - Depth 000 - 004 cm 24-Sep-1998 324161116599401 core
SWR Core - Depth 008 - 012 cm 24-Sep-1998 324161116599401 core
SWR Core - Depth 016 - 020 cm 24-Sep-1998 324161116599401 coreSWR Core - Depth 024 - 028 cm 24-Sep-1998 324161116599401 coreSWR Core - Depth 032 - 036 cm 24-Sep-1998 324161116599401 coreSWR Core - Depth 044 - 048 cm 24-Sep-1998 324161116599401 coreSWR Core - Depth 056 - 060 cm 24-Sep-1998 324161116599401 coreSWR Core - Depth 068 - 072 cm 24-Sep-1998 324161116599401 coreSWR Core - Depth 084 - 088 cm 24-Sep-1998 324161116599401 coreSWR Core - Depth 100 - 104 cm 24-Sep-1998 324161116599401 coreSWR Core - Depth 116 - 120 cm 24-Sep-1998 324161116599401 coreSWR Core - Depth 132 - 136 cm 24-Sep-1998 324161116599401 coreSWR Core - Depth 148 - 152 cm 24-Sep-1998 324161116599401 coreSWR Core - Depth 164 - 168 cm 24-Sep-1998 324161116599401 coreSWR Core - Depth 180 - 184 cm 24-Sep-1998 324161116599401 coreSWR near pump tower 04-Nov-1998 324130117002501 surfSWR near Vista del Lago station 04-Nov-1998 324139117000801 surfSWR center of minimum pool 04-Nov-1998 324131117000101 surfSWR near recreation site 04-Nov-1998 324126116595701 surfSWR minimum pool boundary East 04-Nov-1998 324137116592401 surfSWR east end fill boundary 04-Nov-1998 324209116585001 surfSWR near Gum Tree Cove Pond 04-Nov-1998 324147116593501 surfLoveland Reservoir near dam 04-Nov-1998 324703116473101 surfLoveland Reservoir east end near source inlet 04-Nov-1998 324737116453501 surfURDS Alcena Court Pond_01 05-Nov-1998 324223116585901 coreURDS Alcena Court Pond_02 05-Nov-1998 324221116585801 coreURDS Gumtree Cove Pond_01 05-Nov-1998 324202116593401 coreURDS Hansen's Creek Pond_01 05-Nov-1998 324239116583401 coreURDS Hansen's Creek Pond_02 05-Nov-1998 324241116583501 coreURDS Vista del Lago_01 05-Nov-1998 324142117001301 core
Site name Date Site ID
C3-2
02 is
omer
s
C1-2
28 is
omer
s
C4-2
02 is
omer
s
C5-2
02 is
omer
s
C2-2
28 is
omer
s
Ben
zo (b
) flu
oran
then
e
Ben
zo (k
) flu
oran
then
e
49458 49397(µµµµg/kg) (µµµµg/kg) (µµµµg/kg) (µµµµg/kg) (µµµµg/kg) (µµµµg/kg) (µµµµg/kg)
<30 <30 <30 <30 <30 E18.8 E12.6
<20 <20 <20 <20 <20 E11.6 E9.8
<10 <10 <10 <10 <10 E11.7 E9.1<20 <20 <20 <20 <20 E16.3 E9.5<10 E5.0 <10 <10 <10 E9.9 E8.0<10 E7.6 <10 <10 <10 E8.2 E8.1<10 <10 <10 <10 <10 E11.8 E7.8<10 <10 <10 <10 <10 E4.5 E4.2<20 E9.5 <20 <20 <20 E13.4 E12.3<10 <10 <10 <10 <10 E7.5 E6.2<10 E5.3 <10 <10 <10 E6.8 E9.0<10 E7.2 <10 <10 E6.1 E8.6 E6.9<10 <10 <10 <10 <10 E7.2 E4.4<10 <10 <10 <10 <10 E6.9 E5.2<10 <10 <10 <10 <10 E3.9 E2.7<10 <10 <10 <10 <10 E4.7 E5.3<10 <10 <10 <10 <10 E5.6 E4.7 <10 E4.3 <10 <10 <10 E8.5 E6.4<10 <10 <10 <10 <10 11.5 E7.1 <10 E3.9 <10 <10 <10 E8.2 E7.4<10 <10 <10 <10 <10 E1.3 E1.8<10 <10 <10 <10 <10 12.0 10.1 <10 E6.1 <10 <10 E5.2 13.6 10.2 <10 19.8 <10 <10 E9.4 25.4 17.6 <10 17.4 <10 <10 17.8 32.2 18.6 <10 12.1 <10 <10 <10 19.4 14.8<10 <10 <10 <10 <10 11.2 E8.9 <10 11.8 <10 <10 <10 19.8 18.6 <10 30.8 <10 <10 28.2 62.0 56.2220 399 191 217 415 137 119
103 Table 7

Table 7. Analytical results for PAHs from SWR, San Diego County, Calif., core segments, surficial bed sediment, and URDS samples—Continued
PCODEType
SWR Core - Depth 000 - 004 cm 24-Sep-1998 324161116599401 core
SWR Core - Depth 008 - 012 cm 24-Sep-1998 324161116599401 core
SWR Core - Depth 016 - 020 cm 24-Sep-1998 324161116599401 coreSWR Core - Depth 024 - 028 cm 24-Sep-1998 324161116599401 coreSWR Core - Depth 032 - 036 cm 24-Sep-1998 324161116599401 coreSWR Core - Depth 044 - 048 cm 24-Sep-1998 324161116599401 coreSWR Core - Depth 056 - 060 cm 24-Sep-1998 324161116599401 coreSWR Core - Depth 068 - 072 cm 24-Sep-1998 324161116599401 coreSWR Core - Depth 084 - 088 cm 24-Sep-1998 324161116599401 coreSWR Core - Depth 100 - 104 cm 24-Sep-1998 324161116599401 coreSWR Core - Depth 116 - 120 cm 24-Sep-1998 324161116599401 coreSWR Core - Depth 132 - 136 cm 24-Sep-1998 324161116599401 coreSWR Core - Depth 148 - 152 cm 24-Sep-1998 324161116599401 coreSWR Core - Depth 164 - 168 cm 24-Sep-1998 324161116599401 coreSWR Core - Depth 180 - 184 cm 24-Sep-1998 324161116599401 coreSWR near pump tower 04-Nov-1998 324130117002501 surfSWR near Vista del Lago station 04-Nov-1998 324139117000801 surfSWR center of minimum pool 04-Nov-1998 324131117000101 surfSWR near recreation site 04-Nov-1998 324126116595701 surfSWR minimum pool boundary East 04-Nov-1998 324137116592401 surfSWR east end fill boundary 04-Nov-1998 324209116585001 surfSWR near Gum Tree Cove Pond 04-Nov-1998 324147116593501 surfLoveland Reservoir near dam 04-Nov-1998 324703116473101 surfLoveland Reservoir east end near source inlet 04-Nov-1998 324737116453501 surfURDS Alcena Court Pond_01 05-Nov-1998 324223116585901 coreURDS Alcena Court Pond_02 05-Nov-1998 324221116585801 coreURDS Gumtree Cove Pond_01 05-Nov-1998 324202116593401 coreURDS Hansen's Creek Pond_01 05-Nov-1998 324239116583401 coreURDS Hansen's Creek Pond_02 05-Nov-1998 324241116583501 coreURDS Vista del Lago_01 05-Nov-1998 324142117001301 core
Site name Date Site ID
Ben
zo (e
) pyr
ene
Ben
zo (a
) pyr
ene
Pery
lene
C1-2
52 is
omer
s
C3-2
28 is
omer
s
C2-2
52 is
omer
s
C4-2
28 is
omer
s
49389(µµµµg/kg) (µµµµg/kg) (µµµµg/kg) (µµµµg/kg) (µµµµg/kg) (µµµµg/kg) (µµµµg/kg)
E13.9 E17.5 462 <30 <30 <30 <30
E11.8 E13.6 379 <20 <20 <20 <20
E9.6 E9.3 308 <10 <10 <10 <10E11.4 E11.9 464 <20 <20 <20 <20E7.0 E6.5 469 <10 <10 <10 <10E7.0 E7.2 468 <10 <10 <10 <10E8.6 E7.6 417 <10 <10 <10 <10E5.7 <10 233 <10 <10 <10 <10E11.8 E10.0 656 <20 <20 <20 <20E6.5 E5.3 415 <10 <10 <10 <10E6.4 E6.0 464 E7.5 <10 <10 <10E6.2 E5.8 531 E8.5 <10 <10 <10E6.0 E4.6 328 <10 <10 <10 <10E5.1 E4.6 348 <10 <10 <10 <10E3.0 E2.5 122 <10 <10 <10 <10E6.9 E7.3 10.1 <10 <10 <10 <10E7.3 E3.6 146.0 <10 <10 <10 <1012.5 E2.6 376.0 <10 <10 <10 <1013.0 E7.2 343 <10 <10 <10 <10E9.9 E8.7 298.0 <10 <10 <10 <10 <10 <10 E7.1 <10 <10 <10 <1015.5 12.9 326 <10 <10 <10 <1015.4 17.2 23.2 <10 <10 <10 <1023.0 18.2 21.1 14.8 <10 <10 <1032.5 16.7 E7.8 E7.6 <10 <10 <1025.3 15.0 E7.2 <10 <10 <10 <1014.8 E8.7 <10 <10 <10 <10 <1023.5 17.1 10.9 E8.3 <10 <10 <1074.1 46.9 21.1 48.5 <10 <10 <10195 74.9 100 416 <300 296 73.7
104 Table 7

Table 7. Analytical results for PAHs from SWR, San Diego County, Calif., core segments, surficial bed sediment, and URDS samples—Continued
PCODEType
SWR Core - Depth 000 - 004 cm 24-Sep-1998 324161116599401 core
SWR Core - Depth 008 - 012 cm 24-Sep-1998 324161116599401 core
SWR Core - Depth 016 - 020 cm 24-Sep-1998 324161116599401 coreSWR Core - Depth 024 - 028 cm 24-Sep-1998 324161116599401 coreSWR Core - Depth 032 - 036 cm 24-Sep-1998 324161116599401 coreSWR Core - Depth 044 - 048 cm 24-Sep-1998 324161116599401 coreSWR Core - Depth 056 - 060 cm 24-Sep-1998 324161116599401 coreSWR Core - Depth 068 - 072 cm 24-Sep-1998 324161116599401 coreSWR Core - Depth 084 - 088 cm 24-Sep-1998 324161116599401 coreSWR Core - Depth 100 - 104 cm 24-Sep-1998 324161116599401 coreSWR Core - Depth 116 - 120 cm 24-Sep-1998 324161116599401 coreSWR Core - Depth 132 - 136 cm 24-Sep-1998 324161116599401 coreSWR Core - Depth 148 - 152 cm 24-Sep-1998 324161116599401 coreSWR Core - Depth 164 - 168 cm 24-Sep-1998 324161116599401 coreSWR Core - Depth 180 - 184 cm 24-Sep-1998 324161116599401 coreSWR near pump tower 04-Nov-1998 324130117002501 surfSWR near Vista del Lago station 04-Nov-1998 324139117000801 surfSWR center of minimum pool 04-Nov-1998 324131117000101 surfSWR near recreation site 04-Nov-1998 324126116595701 surfSWR minimum pool boundary East 04-Nov-1998 324137116592401 surfSWR east end fill boundary 04-Nov-1998 324209116585001 surfSWR near Gum Tree Cove Pond 04-Nov-1998 324147116593501 surfLoveland Reservoir near dam 04-Nov-1998 324703116473101 surfLoveland Reservoir east end near source inlet 04-Nov-1998 324737116453501 surfURDS Alcena Court Pond_01 05-Nov-1998 324223116585901 coreURDS Alcena Court Pond_02 05-Nov-1998 324221116585801 coreURDS Gumtree Cove Pond_01 05-Nov-1998 324202116593401 coreURDS Hansen's Creek Pond_01 05-Nov-1998 324239116583401 coreURDS Hansen's Creek Pond_02 05-Nov-1998 324241116583501 coreURDS Vista del Lago_01 05-Nov-1998 324142117001301 core
Site name Date Site ID
Ben
zo (g
,h,i)
per
ylen
e
Inde
no (1
,2,3
-c,d
) py
rene
Dib
enzo
(a,h
) an
thra
cene
C3-2
52 is
omer
s
C4-2
52 is
omer
s
C5-2
28 is
omer
s
C5-2
52 is
omer
s
49408 49390 49461(µµµµg/kg) (µµµµg/kg) (µµµµg/kg) (µµµµg/kg) (µµµµg/kg) (µµµµg/kg) (µµµµg/kg)
E18.9 E14.0 <30 <30 <30 <30 <30
E14.6 E7.9 E4.5 <20 <20 <20 <20
E7.8 E6.4 <10 <10 <10 <10 <10E10.9 E8.1 <20 <20 <20 <20 <20E6.8 E7.6 <10 <10 <10 <10 <10E7.2 E7.8 <10 <10 <10 <10 <10E7.7 E5.4 <10 <10 <10 <10 <10E4.3 E2.5 <10 <10 <10 <10 <10E13.2 E8.7 <20 <20 <20 <20 <20E5.1 E3.8 <10 <10 <10 <10 <10E7.1 E7.4 E3.6 <10 <10 <10 <10E5.9 E7.0 <10 <10 <10 <10 <1012.7 E4.5 <10 <10 <10 <10 <10E8.2 E5.9 <10 <10 <10 <10 <10E4.8 E2.5 <10 <10 <10 <10 <10 <10 <10 <10 <10 <10 <10 <10E5.5 E3.2 <10 <10 <10 <10 <10E8.4 E3.7 <10 <10 <10 <10 <10E8.8 E7.2 <10 <10 <10 <10 <10NA E.07 E2.3 <10 <10 <10 <10E1.4 E1.3 <10 <10 <10 <10 <1011.3 E9.1 <10 <10 <10 <10 <10E7.4 E6.9 <10 <10 <10 <10 <1014.0 11.7 E2.7 <10 <10 <10 <1023.4 17.1 E3.4 <10 <10 <10 <1018.2 11.8 E3.1 <10 <10 <10 <1016.0 10.2 <10 <10 <10 <10 <1018.0 18.1 E3.6 <10 <10 <10 <1053.5 42.4 E9.0 <10 <10 <10 <10248 87.5 30.4 138 <10 59.7 <10
105 Table 7

Table 7. Analytical results for PAHs from SWR, San Diego County, Calif., core segments, surficial bed sediment, and URDS samples—Continued
PCODEType
SWR Core - Depth 000 - 004 cm 24-Sep-1998 324161116599401 core
SWR Core - Depth 008 - 012 cm 24-Sep-1998 324161116599401 core
SWR Core - Depth 016 - 020 cm 24-Sep-1998 324161116599401 coreSWR Core - Depth 024 - 028 cm 24-Sep-1998 324161116599401 coreSWR Core - Depth 032 - 036 cm 24-Sep-1998 324161116599401 coreSWR Core - Depth 044 - 048 cm 24-Sep-1998 324161116599401 coreSWR Core - Depth 056 - 060 cm 24-Sep-1998 324161116599401 coreSWR Core - Depth 068 - 072 cm 24-Sep-1998 324161116599401 coreSWR Core - Depth 084 - 088 cm 24-Sep-1998 324161116599401 coreSWR Core - Depth 100 - 104 cm 24-Sep-1998 324161116599401 coreSWR Core - Depth 116 - 120 cm 24-Sep-1998 324161116599401 coreSWR Core - Depth 132 - 136 cm 24-Sep-1998 324161116599401 coreSWR Core - Depth 148 - 152 cm 24-Sep-1998 324161116599401 coreSWR Core - Depth 164 - 168 cm 24-Sep-1998 324161116599401 coreSWR Core - Depth 180 - 184 cm 24-Sep-1998 324161116599401 coreSWR near pump tower 04-Nov-1998 324130117002501 surfSWR near Vista del Lago station 04-Nov-1998 324139117000801 surfSWR center of minimum pool 04-Nov-1998 324131117000101 surfSWR near recreation site 04-Nov-1998 324126116595701 surfSWR minimum pool boundary East 04-Nov-1998 324137116592401 surfSWR east end fill boundary 04-Nov-1998 324209116585001 surfSWR near Gum Tree Cove Pond 04-Nov-1998 324147116593501 surfLoveland Reservoir near dam 04-Nov-1998 324703116473101 surfLoveland Reservoir east end near source inlet 04-Nov-1998 324737116453501 surfURDS Alcena Court Pond_01 05-Nov-1998 324223116585901 coreURDS Alcena Court Pond_02 05-Nov-1998 324221116585801 coreURDS Gumtree Cove Pond_01 05-Nov-1998 324202116593401 coreURDS Hansen's Creek Pond_01 05-Nov-1998 324239116583401 coreURDS Hansen's Creek Pond_02 05-Nov-1998 324241116583501 coreURDS Vista del Lago_01 05-Nov-1998 324142117001301 core
Site name Date Site ID
Coro
nene
Nitr
oben
zene
-d5
(sur
roga
te)
2-Fl
uoro
biph
enyl
(s
urro
gate
)
Terp
heny
l-d14
(sur
roga
te)
(µµµµg/kg) (%) (%) (%)<30 NA NA NA
E4.6 NA NA NA
E2.4 NA NA NA<20 NA NA NA<10 NA NA NA<10 NA NA NA<10 NA NA NA<10 NA NA NA<20 NA NA NA<10 NA NA NA<10 NA NA NA<10 NA NA NAE3.9 NA NA NAE2.6 NA NA NAE1.5 NA NA NA <10 E171.3 78.1 44.0 <10 95.6 80.0 106.4 <10 107.1 73.7 107.0E4.7 115.2 84.4 125.8E2.2 112.9 74.0 71.6 <10 73.7 83.8 124.3
E4.70 127.1 77.6 92.5 <10 119.3 81.9 97.4
E4.10 119.1 86.0 105.8E10.8 128.4 73.0 99.6
7.1 92.2 87.7 117.8 <10 93.6 71.6 100.9
E4.10 63.0 58.2 61.9E21.7 133.1 90.8 104.2E70.0 78.8 85.8 111.5
106 Table 7

107 Table 8
I Dieldrin(µg/kg)
p,p′-DDE(µg/kg)
Endrin(µg/kg)
p,p′-DDD(µg/kg)
Arochlor 1242
(µg/kg)
SWR Core - D <2.50 3.90 <2.50 <2.50 <15.00
SWR Core - D <2.00 2.40 <2.00 <2.00 <10.00
SWR Core - D <1.00 2.60 <1.00 1.00 <5.00
SWR Core - D <1.50 3.40 <1.50 2.10 <10.00
SWR Core - D <1.25 5.28 <1.25 <1.25 <12.50
SWR Core - D <1.25 5.21 <1.25 <1.25 <12.50
SWR Core - D <1.00 3.70 <1.00 2.20 <5.00
SWR Core - D <0.50 5.10 <0.50 3.10 <5.00
SWR Core - D <1.50 3.00 <1.50 5.20 <10.00
SWR Core - D <0.50 3.30 <0.50 14.00 <5.00
SWR Core - D <1.25 8.11 <1.25 21.12 <12.50
SWR Core - D <1.25 13.40 <1.25 13.26 <12.50
SWR Core - D <0.50 <0.50 <0.50 <0.50 <5.00
SWR Core - D <0.50 <0.50 <0.50 <0.50 <5.00
SWR Core - D <0.50 <0.50 <0.50 <0.50 <5.00
SWR near Pu <1.25 5.63 <1.25 <1.25 <12.50
SWR near Vis <1.25 2.10 <1.25 <1.25 <12.50
SWR center o <1.25 E4.17 <1.25 <1.25 <12.50
SWR near rec <1.25 3.63 <1.25 <1.25 <12.50
SWR minimu <1.00 3.50 <1.00 <1.00 <5.00
SWR east end <0.50 0.93 <0.50 <0.50 <5.00
SWR near Gu <1.25 E3.55 <1.25 <1.25 <12.50
Loveland Res <1.25 2.20 <1.25 <1.25 <12.50
Loveland Ressource inlet
<1.25 E4.01 <1.25 <1.25 <12.50
URDS Vista <1.00 8.30 <1.00 <5.00 <10.00
URDS Alcen <1.25 E3.98 <1.25 <1.25 <12.50
URDS Alcen <1.25 2.66 <1.25 <1.25 <12.50
URDS Gumt <1.25 E4.50 <1.25 <1.25 <12.50
URDS Hanse <1.00 20.30 <1.00 2.30 <5.00
URDS Hanse <1.25 E30.60 <1.25 E2.94 <12.50
Table 8. Analy tem (URDS) ponds surficial bed sediment samples, Sweetwater a
[An “E” indic rficial sample; NA, not analyzed; <, compound was not detected a
Site Name Date Site ID TypeLindane(µg/kg)
Heptachlor(µg/kg)
Aldrin(µg/kg)
Heptachlor epoxide(µg/kg)
Chlor-dane
(µg/kg)
Endosulfan(µg/kg)
epth 000 - 004 cm 24-Sept-1998 324161116599401 core <2.50 <2.50 <2.50 <2.50 <15.00 <2.50
epth 008 - 012 cm 24-Sept-1998 324161116599401 core <2.00 <2.00 <2.00 <2.00 <10.00 <2.00
epth 016 - 020 cm 24-Sept-1998 324161116599401 core <1.00 <1.00 <1.00 <1.00 5.70 <1.00
epth 024 - 028 cm 24-Sept-1998 324161116599401 core <1.50 <1.50 <1.50 <1.50 <10.00 <1.50
epth 032 - 036 cm 24-Sept-1998 324161116599401 core <1.25 <1.25 <1.25 <1.25 <12.50 <1.25
epth 044 - 048 cm 24-Sept-1998 324161116599401 core <1.25 <1.25 <1.25 <1.25 <12.50 <1.25
epth 056 - 060 cm 24-Sept-1998 324161116599401 core <1.00 <1.00 <1.00 <1.00 <5.00 <1.00
epth 068 - 072 cm 24-Sept-1998 324161116599401 core <0.50 <0.50 <0.50 <0.50 8.40 <0.50
epth 084 - 088 cm 24-Sept-1998 324161116599401 core <1.50 <1.50 <1.50 <1.50 <10.00 <1.50
epth 100 - 104 cm 24-Sept-1998 324161116599401 core <0.50 <0.50 <0.50 <0.50 <5.00 <0.50
epth 116 - 120 cm 24-Sept-1998 324161116599401 core <1.25 <1.25 <1.25 <1.25 <12.50 <1.25
epth 132 - 136 cm 24-Sept-1998 324161116599401 core <1.25 <1.25 <1.25 <1.25 <12.50 <1.25
epth 148 - 152 cm 24-Sept-1998 324161116599401 core <0.50 <0.50 <0.50 <0.50 <5.00 <0.50
epth 164 - 168 cm 24-Sept-1998 324161116599401 core <0.50 <0.50 <0.50 <0.50 <5.00 <0.50
epth 180 - 184 cm 24-Sept-1998 324161116599401 core <0.50 <0.50 <0.50 <0.50 <5.00 <0.50
mp Tower 09-Sept-1998 324131117002502 surf <1.25 <1.25 <1.25 <1.25 <12.50 <1.25
ta del Lago 09-Sept-1998 324139117000802 surf <1.25 <1.25 <1.25 <1.25 <12.50 <1.25
f minimum pool 09-Sept-1998 324131117000102 surf <1.25 <1.25 <1.25 <1.25 <12.50 <1.25
reation area 09-Sept-1998 324126116595702 surf <1.25 <1.25 <1.25 <1.25 <12.50 <1.25
m pool boundary East 09-Sept-1998 324137116592402 surf <1.00 <1.00 <1.00 <1.00 9.40 <1.00
res. fill boundary 09-Sept-1998 324209116585002 surf <0.50 <0.50 <0.50 <0.50 <5.00 <0.50
m Tree Cove 09-Sept-1998 324147116593502 surf <1.25 <1.25 <1.25 <1.25 <12.50 <1.25
ervoir near dam 09-Sept-1998 324703116473102 surf <1.25 <1.25 <1.25 <1.25 <12.50 <1.25
ervoir east end near 09-Sept-1998 324737116453502 surf <1.25 <1.25 <1.25 <1.25 <12.50 <1.25
del Lago_01 05-Nov-1998 324142117001301 surf <1.50 <1.00 <1.00 <1.60 92.00 <2.40
a Court Pond_01 05-Nov-1998 324223116585901 surf <1.25 <1.25 <1.25 <1.25 <12.50 <1.25
a Court Pond_02 05-Nov-1998 324221116585801 surf <1.25 <1.25 <1.25 <1.25 <12.50 <1.25
ree Cove Pond_01 05-Nov-1998 324202116593401 surf <1.25 <1.25 <1.25 <1.25 <12.50 <1.25
n's Creek Pond_01 05-Nov-1998 324239116583401 surf <1.00 <1.00 <1.00 <1.00 10.70 <1.00
n's Creek Pond_02 05-Nov-1998 324241116583501 surf <1.25 <1.25 <1.25 <1.25 <12.50 <1.25
tical results for organochlorine insecticides concentrations in selected core segments and reservoir and urban runoff diversion sysnd Loveland Reservoirs, San Diego County, California
ates that the value has been estimated because of interference or is below method reporting limits. SWR, Sweetwater Reservoir; surf, sut a concentration above the reporting level; %, percentage recovery. µg/kg, microgram per kilogram; cm, centimeter]

108 T
hlor 60/kg)
TotalPCB
(µg/kg)
Isodrin(Surrogate)
(%)
Nonachlor-biphenyl
(Surrogate)(%)
alphaHCH-d6
(Surrogate)(%)
SWR C .00 <45.00 NA NA NA
SWR C .00 <30.00 NA NA NA
SWR C .00 <15.00 NA NA NA
SWR C .00 <30.00 NA NA NA
SWR C .50 <37.50 NA NA NA
SWR C .50 <37.50 NA NA NA
SWR C .00 <15.00 NA NA NA
SWR C .00 <15.00 NA NA NA
SWR C .00 <30.00 NA NA NA
SWR C .00 <15.00 NA NA NA
SWR C .50 <37.50 NA NA NA
SWR C .50 <37.50 NA NA NA
SWR C .00 <15.00 NA NA NA
SWR C .00 <15.00 NA NA NA
SWR C .00 <15.00 NA NA NA
SWR n .40 NA 101 90 69
SWR n .50 NA 101 97 83
SWR c .50 NA 83 78 67
SWR n .50 NA 70 60 49
SWR m .00 NA 74 66 79
SWR e .00 NA 112 126 58
SWR n .50 NA 84 89 67
Lovela .50 NA 77 83 70
Lovelasour
.50 NA 82 91 70
URDS .00 NA NA 38 50
URDS .50 NA 69 102 92
URDS .50 NA 70 100 61
URDS .50 NA 65 95 76
URDS .00 NA 60 67 89
URDS .50 NA 50 108 79
Table 8 em (URDS) ponds surficial bed sediment samples, Sweet
able 8
Site Name Date Site ID Typep,p′-DDT(µg/kg)
p,p′-Methoxy-
chlor(µg/kg)
Mirex(µg/kg)
Toxa-phene(µg/kg)
Arochlor 1254
(µg/kg)
Aroc12
(µg
ore - Depth 000 - 004 cm 24-Septt-1998 324161116599401 Core <2.50 <10.00 <2.50 <250 <15.00 <15
ore - Depth 008 - 012 cm 24-Septt-1998 324161116599401 Core <2.00 <8.00 <2.00 <200 <10.00 <10
ore - Depth 016 - 020 cm 24-Sept-1998 324161116599401 Core <1.00 <4.00 <1.00 <100 <5.00 <5
ore - Depth 024 - 028 cm 24-Sept-1998 324161116599401 Core <1.50 <6.00 <1.50 <150 <10.00 <10
ore - Depth 032 - 036 cm 24-Sept-1998 324161116599401 Core <1.25 <5.00 <1.25 <125 <12.50 <12
ore - Depth 044 - 048 cm 24-Sept-1998 324161116599401 Core <1.25 <5.00 <1.25 <125 <12.50 <12
ore - Depth 056 - 060 cm 24-Sept-1998 324161116599401 Core <1.00 <4.00 <1.00 <100 <5.00 <5
ore - Depth 068 - 072 cm 24-Sept-1998 324161116599401 Core E0.54 <2.00 <0.50 <50 <5.00 <5
ore - Depth 084 - 088 cm 24-Sept-1998 324161116599401 Core <1.50 <6.00 <1.50 <150 <10.00 <10
ore - Depth 100 - 104 cm 24-Sept-1998 324161116599401 Core <0.50 <2.00 <0.50 <50 <5.00 <5
ore - Depth 116 - 120 cm 24-Sept-1998 324161116599401 Core <1.25 <5.00 <1.25 <125 <12.50 <12
ore - Depth 132 - 136 cm 24-Sept-1998 324161116599401 Core <1.25 <5.00 <1.25 <125 <12.50 <12
ore - Depth 148 - 152 cm 24-Sept-1998 324161116599401 Core <0.50 <2.00 <0.50 <50 <5.00 <5
ore - Depth 164 - 168 cm 24-Sept-1998 324161116599401 Core <0.50 <2.00 <0.50 <50 <5.00 <5
ore - Depth 180 - 184 cm 24-Sept-1998 324161116599401 Core <0.50 <2.00 <0.50 <50 <5.00 <5
ear Pump Tower 09-Sept-1998 324131117002502 surf <1.25 <5.00 <1.25 <125 <12.50 27
ear Vista del Lago 09-Sept-1998 324139117000802 surf <1.25 <5.00 <1.25 <125 <12.50 <12
enter of minimum pool 09-Sept-1998 324131117000102 surf <1.25 <5.00 <1.25 <125 <12.50 <12
ear recreation area 09-Sept-1998 324126116595702 surf <1.25 <5.00 <1.25 <125 <12.50 <12
inimum pool boundary East 09-Sept-1998 324137116592402 surf <1.00 <4.00 <1.00 <100 <5.00 <5
ast end res. fill boundary 09-Sept-1998 324209116585002 surf <0.50 <2.00 <0.50 <50 <5.00 <5
ear Gum Tree Cove 09-Sept-1998 324147116593502 surf <1.25 <5.00 <1.25 <125 <12.50 <12
nd Reservoir near dam 09-Sept-1998 324703116473102 surf <1.25 <5.00 <1.25 <125 <12.50 <12
nd Reservoir east end near ce inlet
09-Sept-1998 324737116453502 surf <1.25 <5.00 <1.25 <125 <12.50 <12
Vista del Lago_01 05-Nov-1998 324142117001301 surf <10.00 <7.00 <1.00 <100 8.30 14
Alcena Court Pond_01 05-Nov-1998 324223116585901 surf <1.25 <5.00 <1.25 <125 <12.50 <12
Alcena Court Pond_02 05-Nov-1998 324221116585801 surf <1.25 <5.00 <1.25 <125 <12.50 <12
Gumtree Cove Pond_01 05-Nov-1998 324202116593401 surf <1.25 <5.00 <1.25 <125 <12.50 <12
Hansen's Creek Pond_01 05-Nov-1998 324239116583401 surf <1.00 <4.00 <1.00 <100 <5.00 <5
Hansen's Creek Pond_02 05-Nov-1998 324241116583501 surf <1.25 <5.00 <1.25 <125 <12.50 <12
. Analytical results for organochlorine insecticides concentrations in selected core segments and reservoir and urban runoff diversion systwater and Loveland Reservoirs, San Diego County, California—Continued

Trace metals
ic n
Aluminum(%)
Iron(%)
Titanium (%)
Nitrogen (%)
5 5.81 5.56 0.54 0.33
3 6.38 5.66 0.54 0.32
8 7.56 6.00 0.58 0.30
4 7.11 5.77 0.54 0.32
5 7.36 5.91 0.54 0.30
2 8.59 6.16 0.54 0.29
5 8.94 6.06 0.53 0.31
6 7.99 6.24 0.56 0.29
9 8.10 6.05 0.54 0.27
5 10.78 6.85 0.58 0.26
2 9.13 6.12 0.54 0.30
7 6.59 5.83 0.55 0.33
9 7.04 5.77 0.55 0.76
5 6.09 5.98 0.56 NA
4 7.30 5.86 0.49 0.27
0 7.21 5.59 0.47 0.28
5 5.66 5.50 0.49 0.03
6 4.53 5.30 0.51 0.28
1 4.80 5.60 0.48 0.37
6 7.50 5.85 0.48 0.29
4 7.60 5.71 0.52 0.21
9 9.29 6.31 0.58 0.02
8 5.48 4.99 0.60 0.02
0 7.15 5.92 0.53 0.21
8 5.93 5.79 0.52 0.02
6 7.23 5.61 0.58 0.02
Table 9. Analytical results for major and trace element concentrations in bed sediment core, Sweetwater Reservoir, San Diego County, California
ter Reservoir; NA, not analyzed; %, percentage
109 Table 9
Site name
Major metals
Silicon(%)
Calcium (%)
Magnesium (%)
Potassium (%)
Sodium(%)
Phosphorus(%)
Total carbon
(%)
Organcarbo
(%)
SWR Core - Depth 000 - 004 cm 19.28 1.81 1.13 0.30 0.50 0.088 3.26 3.0
SWR Core - Depth 008 - 012 cm 22.02 1.59 1.05 0.28 0.49 0.096 3.06 2.8
SWR Core - Depth 016 - 020 cm 22.23 1.59 1.03 0.30 0.49 0.088 2.92 2.7
SWR Core - Depth 024 - 028 cm 19.47 2.73 1.15 0.37 0.54 0.093 3.46 3.0
SWR Core - Depth 024 - 028 cm 21.79 2.59 1.23 0.41 0.54 0.097 3.41 3.0
SWR Core - Depth 032 - 036 cm 20.40 2.39 1.30 0.46 0.53 0.093 3.40 3.0
SWR Core - Depth 040 - 044 cm 21.23 1.96 1.18 0.40 0.46 0.090 3.05 2.7
SWR Core - Depth 048 - 052 cm 13.61 1.51 1.00 0.28 0.49 0.110 2.76 2.5
SWR Core - Depth 056 - 060 cm 22.35 1.68 0.98 0.36 0.50 0.110 2.80 2.5
SWR Core - Depth 064 - 068 cm 22.30 1.45 0.95 0.57 0.49 0.120 2.60 2.4
SWR Core - Depth 072 - 076 cm 22.25 2.36 1.23 0.54 0.55 0.093 3.51 3.2
SWR Core - Depth 080 - 084 cm 22.34 2.79 1.03 0.39 0.54 0.089 3.73 3.1
SWR Core - Depth 088 - 092 cm 22.10 2.46 0.98 0.37 0.50 0.083 8.52 2.9
SWR Core - Depth 096 - 100 cm 22.92 2.05 0.90 0.34 0.51 0.095 4.70 2.9
SWR Core - Depth 104 - 108 cm 19.60 1.93 0.90 0.38 0.54 0.100 3.11 2.8
SWR Core - Depth 104 - 108 cm 20.44 1.99 0.91 0.42 0.58 0.100 3.10 2.9
SWR Core - Depth 112 - 116 cm 20.94 1.96 0.85 0.31 0.53 0.084 3.19 2.8
SWR Core - Depth 120 - 124 cm 19.63 1.81 0.75 0.24 0.56 0.081 3.22 2.9
SWR Core - Depth 128 - 132 cm 20.35 1.37 0.75 0.34 0.55 0.085 3.54 3.5
SWR Core - Depth 136 - 140 cm 22.54 1.34 0.60 0.93 0.46 0.083 2.96 2.9
SWR Core - Depth 144 - 148 cm 22.76 1.38 0.70 0.30 0.56 0.094 2.74 2.7
SWR Core - Depth 152 - 156 cm 25.65 1.73 0.98 1.32 0.83 0.066 2.70 2.6
SWR Core - Depth 160 - 164 cm 20.47 1.91 1.10 0.74 1.29 0.059 2.35 2.2
SWR Core - Depth 168 - 172 cm 23.48 1.48 0.78 0.29 0.56 0.089 2.64 2.7
SWR Core - Depth 176 - 180 cm 21.68 1.50 0.58 0.31 0.39 0.092 2.70 2.0
SWR Core - Depth 184 - 188 cm 24.96 1.76 1.15 0.90 1.03 0.066 2.46 3.3
[The site identification number is 324161116599401. Bed sediment core sampling was done on September 24, 1998. SWR, Sweetwarecovery; ng/g, nanogram per gram; cm, centimeter]

Nickel(ng/g)
Scandium (ng/g)
Strontium(ng/g)
Vanadium(ng/g)
Zinc(ng/g)
21.8 10.1 36 179 153
24.3 9.5 30 186 151
22.1 10.5 35 186 154
23.5 11.1 62 178 150
26.2 12.2 56 178 150
22.3 11.0 59 180 150
22.0 12.0 41 184 140
23.1 11.0 31 195 151
25.2 11.4 29 189 147
24.9 10.5 55 205 163
25.9 11.5 68 179 141
21.7 11.1 60 187 141
26.0 10.3 58 185 131
21.7 10.8 46 204 141
28.6 10.8 53 199 137
29.3 9.9 58 194 149
28.9 9.3 44 198 139
26.3 8.4 39 194 151
26.1 7.5 42 202 160
28.8 10.7 83 209 154
33.9 9.1 52 213 143
24.1 9.0 93 186 137
22.1 7.4 56 179 137
24.9 10.2 37 209 141
33.2 8.9 34 223 140
24.0 7.9 70 188 144
Table 9. Results for major and trace metals from the Sweetwater bed sediment core, California—Continued
110 Table 9
Site name
Trace metals
Arsenic(ng/g)
Barium(ng/g)
Cadmium(ng/g)
Chromium(ng/g)
Cobalt(ng/g)
Copper(ng/g)
Lead(ng/g)
Lithium(ng/g)
Manganese(ng/g)
Merc ury(ng/g)
SWR Core - Depth 000 - 004 cm 18.7 235 0.13 42 25.8 87 25 49.5 1,750 0.066
SWR Core - Depth 008 - 012 cm 15.0 202 0.13 42 25.6 90 27 53.4 1,730 0.052
SWR Core - Depth 016 - 020 cm 15.0 200 0.13 46 24.7 103 22 53.9 1,590 0.056
SWR Core - Depth 024 - 028 cm 24.8 284 0.18 53 25.0 128 29 61.3 1,570 0.057
SWR Core - Depth 024 - 028 cm 25.6 274 0.21 48 24.9 130 23 63.1 1,480 0.059
SWR Core - Depth 032 - 036 cm 26.1 256 0.19 51 25.8 151 28 66.9 1,510 0.055
SWR Core - Depth 040 - 044 cm 25.6 186 0.17 53 26.6 143 22 54.4 1,600 0.064
SWR Core - Depth 048 - 052 cm 18.7 163 0.16 52 30.8 112 18 51.8 1,710 0.054
SWR Core - Depth 056 - 060 cm 18.5 153 0.19 51 29.4 109 28 55.6 1,670 0.058
SWR Core - Depth 064 - 068 cm 21.6 277 0.22 56 28.7 101 19 61.8 1,530 0.062
SWR Core - Depth 072 - 076 cm 22.0 286 0.24 57 26.2 183 34 65.1 1,440 0.057
SWR Core - Depth 080 - 084 cm 17.6 272 0.20 53 28.0 222 27 73.4 1,330 0.055
SWR Core - Depth 088 - 092 cm 20.9 263 0.20 56 23.7 184 34 63.0 1,150 0.050
SWR Core - Depth 096 - 100 cm 13.4 205 0.22 53 29.2 221 23 68.9 1,180 0.049
SWR Core - Depth 104 - 108 cm 14.1 223 0.22 51 31.0 205 26 78.6 1,190 0.046
SWR Core - Depth 104 - 108 cm 15.2 230 0.20 57 30.4 200 29 85.6 1,300 0.045
SWR Core - Depth 112 - 116 cm 18.8 216 0.24 57 30.8 233 22 77.8 1,220 0.050
SWR Core - Depth 120 - 124 cm 19.8 200 0.26 51 28.1 324 18 74.9 1,250 0.055
SWR Core - Depth 128 - 132 cm 22.6 251 0.34 51 28.6 513 29 78.3 1,260 0.061
SWR Core - Depth 136 - 140 cm 25.4 207 0.27 64 33.2 304 29 86.3 1,160 0.035
SWR Core - Depth 144 - 148 cm 15.1 272 0.19 60 31.0 97 20 67.6 900 0.044
SWR Core - Depth 152 - 156 cm 16.7 241 0.10 71 34.6 53 28 44.8 839 0.027
SWR Core - Depth 160 - 164 cm 11.9 240 0.080 58 33.6 48 21 37.9 1,120 0.028
SWR Core - Depth 168 - 172 cm 12.3 226 0.12 58 30.0 99 28 59.6 951 0.040
SWR Core - Depth 176 - 180 cm 15.5 302 0.070 60 32.2 95 34 66.1 849 0.040
SWR Core - Depth 184 - 188 cm 11.5 363 0.060 63 34.4 54 30 48.9 878 0.030

111 Table 10
Table 10. Results of cesium 137 age determinations and estimated dates for bed sediment core segments, Sweetwater Reservoir, San Diego County, Calfiornia
[The site identification number is 324161116599401. Bed sediment core sections were sampled on September 24, 1998. SWR, Sweetwater Reservoir. cm, centimeter; pCi/g, pico curie per gram]
Site nameCesium 137
(pCi/g)Estimated
date
SWR core - depth 008–016 cm 0.107 1997
SWR core - depth 028–036 cm 0.216 1990
SWR core - depth 044–052 cm 0.259 1987
SWR core - depth 060–068 cm 0.307 1981
SWR core - depth 076–084 cm 0.252 1978
SWR core - depth 088–092 cm 0.130 1971
SWR core - depth 096–100 cm 0.273 1968
SWR core - depth 104–108 cm 0.264 1966
SWR core - depth 112–116 cm 0.521 1962
SWR core - depth 120–124 cm 0.276 1959
SWR core - depth 128–132 cm 0.290 1957
SWR core - depth 136–140 cm 0.0895 1953
SWR core - depth 152–156 cm –0.0256 1945
SWR core - depth 168–172 cm 0.0548 1935

112 Table 11
Depth Interval (cm)
Color Description
0–5 Olive black (5Y 2/1) with olive gray (5Y 4/1) streaks Soft, fine grained, fluid
5–10 Mostly olive black Silty (no sand but not very sticky)
10–15 Olive gray with streaks of olive black Trending to all olive gray
15–26 Olive gray Gas pockets (1–4 mm); soft; no sand
26–40 Olive black (oxidizes to olive gray) Same texture as above
40–58 Slightly lighter but still olive black Same texture as above; few gas pockets
58–60 Distinctive tan layer— olive gray (5Y 3/2) Same soft texture
60–72 A little darker (5Y 4/1 to 5Y 2/1) Same soft texture
72–75 Mottled olive gray and black Firmer texture; no sand
75–127 Uniform olive black Smaller gas pockets (1 mm), firmer and drier; no sand but maybe more clay
127–140 Mottled olive gray with few streaks of olive black Firmer texture
140–144 Mottled/streaky olive black and gray No data
144–148 Mostly olive gray with olive black streaks at 148cm No data
148–158 Very uniform olive gray Almost no gas pockets; smooth and stiffer
158–173 Distinctive uniform olive gray Drier; no gas pockets; siltier; lots of small sparkles
173–180 A few dark streaks Sudden change to no sparkles; smoother; more clayey; few small gas pockets
180–183 Olive black layer with olive gray streaks Same texture as above
183–202 Olive gray with a few olive black streaks Smooth with a few small gas pockets; no sand
202–216 Trending to same stuff as 158–173 cm layer Drier and firmer with almost no gas pockets; silty with lots of sparkles
Table 11. Visual descriptive comments of core contents, color, and texture for the Sweetwater Reservoir sampling sites, San Diego County, California
[General description: 216 cm (centimeter) long/dark with gas pockets and some layering to almost 130 cm; more tan with smaller gas pockets from about 130–216 cm with small, sparkly dots. No organic detritus or visible biota in entire core. mm, millimeter]

land Reservoirs, San Diego County, California
g limits. The number given below each compoundnia; NA, not analyzed; —, no data; %, percentage
1,1,
1-Tr
ichl
oroe
than
e
1,1,
2-Tr
ichl
oroe
than
e
1,1-
Dic
hlor
oeth
ane
1,1-
Dic
hlor
oeth
ylen
e
1,1-
Dic
hlor
opro
pene
06 34511 34496 34501 77168
/L) (µµµµg/L) (µµµµg/L) (µµµµg/L) (µµµµg/L)
03 <0.06 <0.07 <0.04 <0.0303 <0.06 <0.07 <0.04 <0.0303 <0.06 <0.07 <0.04 <0.0356 0.74 0.84 0.10 0.5803 <0.06 <0.07 <0.04 <0.0303 <0.06 <0.07 <0.04 <0.0324 0.41 0.37 0.25 0.2303 <0.06 <0.07 <0.04 <0.0303 <0.06 <0.07 <0.04 <0.0303 <0.06 <0.07 <0.04 <0.03
1,2-
Dic
hlor
oeth
ane
1,2-
Dic
hlor
opro
pane
tran
s-1,
2-D
ichl
oroe
thyl
ene
2,2-
Dic
hlor
opro
pane
tran
s-1,
4-D
ichl
oro-
2-bu
tene
03 34541 34546 77170 73547
/L) (µµµµg/L) (µµµµg/L) (µµµµg/L) (µµµµg/L)
.1 <0.07 <0.03 <0.08 <0.7
.1 <0.07 <0.03 <0.08 <0.7
.1 <0.07 <0.03 <0.08 <0.7
.5 0.87 0.63 0.48 E8.8
.1 <0.07 <0.03 <0.08 <0.7
.1 <0.07 <0.03 <0.08 <0.7
.8 0.39 0.23 0.28 3.6
.1 <0.07 <0.03 <0.08 <0.7
.1 <0.07 <0.03 <0.08 <0.7
.1 <0.07 <0.03 <0.08 <0.7
Table 12. Quality assurance analytical results for volatile organic compound (VOC) concentrations in water samples, Sweetwater and Love
[Time is denoted in 24-hour scale. An “E” indicates that the value has been estimated because of interference or is below method reportinis its parameter code (PCODE). ID, identification; SWR, Sweetwater Reservoir; QC, quality control; QA, quality assurance; CA, Califorrecovery; <, compound was not detected at a concentration above the reporting level; µg/L, microgram per liter]
113 Table 12
Ace
tate
vin
yul
Acr
olei
n to
tal
PCODE 77057 34210 345
Site name Date Time Site ID Sample type (µµµµg/L) (µµµµg/L) (µµµµg
SWR near Vista Del Lago station 12-Jul-1999 1208 324139117000801 Blank NA NA <0.SWR center of minimum pool 1-Mar-1999 1131 324131117000101 Replicate NA NA <0.SWR center of minimum pool 1-Mar-1999 1138 324131117000101 Blank NA NA <0.SWR east end reservoir fill boundary 10-Sep-1998 1313 324209116585001 Spike NA NA 0.Loveland Reservoir near dam site 1 4-Nov-1998 1041 324703116473101 Replicate NA NA <0.Loveland Reservoir near dam site 1 4-Nov-1998 1048 324703116473101 Blank NA NA <0.Loveland Reservoir near dam site 1 21-Sep-1999 1023 324703116473101 Spike NA NA 0.Loveland Reservoir East end near source inlet site 2 4-May-1999 1131 324737116453501 Replicate NA NA <0.QC/QA site for Sacramento project office CA 9-Sep-1998 1418 88888801 Blank NA NA <0.QC/QA site for Sacramento project office CA 7-Sep-1999 1118 88888801 Blank NA NA <0.
1,2,
3-Tr
ichl
orop
ropa
ne
1,2-
Dib
rom
oeth
ane
PCODE 77443 77651 321
Site name Date Time Site ID Sample type (µµµµg/L) (µµµµg/L) (µµµµg
SWR near Vista Del Lago station 12-Jul-1999 1208 324139117000801 Blank <0.2 <0.04 <0SWR center of minimum pool 1-Mar-1999 1131 324131117000101 Replicate <0.2 <0.04 <0SWR center of minimum pool 1-Mar-1999 1138 324131117000101 Blank <0.2 <0.04 <0SWR east end reservoir fill boundary 10-Sep-1998 1313 324209116585001 Spike 2.1 0.56 1Loveland Reservoir near dam site 1 4-Nov-1998 1041 324703116473101 Replicate <0.2 <0.04 <0Loveland Reservoir near dam site 1 4-Nov-1998 1048 324703116473101 Blank <0.2 <0.04 <0Loveland Reservoir near dam site 1 21-Sep-1999 1023 324703116473101 Spike 1.2 0.32 0Loveland Reservoir East end near source inlet site 2 4-May-1999 1131 324737116453501 Replicate <0.2 <0.04 <0QC/QA site for Sacramento project office CA 9-Sep-1998 1418 88888801 Blank <0.2 <0.04 <0QC/QA site for Sacramento project office CA 7-Sep-1999 1118 88888801 Blank <0.2 <0.04 <0

11
Ta ater and Loveland Reservoirs, San Diego County,C
1,2,
3-Tr
ichl
orob
enze
ne
1,2,
3-Tr
imet
hylb
enze
ne
1,2,
4-Tr
ichl
orob
enze
ne
1,2,
4-Tr
imet
hylb
enze
ne
77613 77221 34551 77222
) (µµµµg/L) (µµµµg/L) (µµµµg/L) (µµµµg/L)
SW <0.3 <0.1 <0.2 <0.06SW <0.3 <0.1 <0.2 <0.06SW <0.3 <0.1 <0.2 <0.06SW 2.8 1.4 1.9 0.65Lo <0.3 <0.1 <0.2 <0.06Lo <0.3 <0.1 <0.2 <0.06Lo 1.4 0.6 0.9 0.3Lo <0.3 <0.1 <0.2 <0.06Q <0.3 <0.1 <0.2 <0.06Q <0.3 <0.1 <0.2 <0.06
Isop
ropy
lben
zene
But
ylbe
nzen
e
n-Pr
opyl
benz
ene
1,2-
Dic
hlor
oben
zene
77223 77342 77224 34536
) (µµµµg/L) (µµµµg/L) (µµµµg/L) (µµµµg/L)
SW <0.03 <0.2 <0.04 <0.05SW <0.03 <0.2 <0.04 <0.05SW <0.03 <0.2 <0.04 <0.05SW 0.56 1.6 0.5 0.52Lo <0.03 <0.2 <0.04 <0.05Lo <0.03 <0.2 <0.04 <0.05Lo 0.24 0.8 0.23 0.29Lo <0.03 <0.2 <0.04 <0.05Q <0.03 <0.2 <0.04 <0.05Q <0.03 <0.2 <0.04 <0.05
4 Table 12
ble 12. Quality assurance analytical results for volatile organic compound (VOC) concentrations in water samples, Sweetwalifornia—Continued
2-H
exan
one
Ace
tone
Acr
ylon
itrile
PCODE 77103 81552 34215
Site name Date Time Site ID Sample type (µµµµg/L) (µµµµg/L) (µµµµg/L
R near Vista Del Lago station 12-Jul-1999 1208 324139117000801 Blank <0.7 <5 <1R center of minimum pool 1-Mar-1999 1131 324131117000101 Replicate <0.7 <5 <1R center of minimum pool 1-Mar-1999 1138 324131117000101 Blank <0.7 <5 <1R east end reservoir fill boundary 10-Sep-1998 1313 324209116585001 Spike 8.9 78 15
veland Reservoir near dam site 1 4-Nov-1998 1041 324703116473101 Replicate <0.7 <5 <1veland Reservoir near dam site 1 4-Nov-1998 1048 324703116473101 Blank <0.7 <5 <1veland Reservoir near dam site 1 21-Sep-1999 1023 324703116473101 Spike 4.8 43 9veland Reservoir East end near source inlet site 2 4-May-1999 1131 324737116453501 Replicate <0.7 <5 <1
C/QA site for Sacramento project office CA 9-Sep-1998 1418 88888801 Blank <0.7 <5 <1C/QA site for Sacramento project office CA 7-Sep-1999 1118 88888801 Blank <0.7 <5 <1
1,3,
5-Tr
imet
hylb
enze
ne
1,3-
Dic
hlor
oben
zene
1,4-
Dic
hlor
oben
zene
PCODE 77226 34566 34571
Site name Date Time Site ID Sample type (µµµµg/L) (µµµµg/L) (µµµµg/L
R near Vista Del Lago station 12-Jul-1999 1208 324139117000801 Blank <0.04 <0.05 <0.05R center of minimum pool 1-Mar-1999 1131 324131117000101 Replicate <0.04 <0.05 <0.05R center of minimum pool 1-Mar-1999 1138 324131117000101 Blank <0.04 <0.05 <0.05R east end reservoir fill boundary 10-Sep-1998 1313 324209116585001 Spike 0.55 0.51 0.5
veland Reservoir near dam site 1 4-Nov-1998 1041 324703116473101 Replicate <0.04 <0.05 <0.05veland Reservoir near dam site 1 4-Nov-1998 1048 324703116473101 Blank <0.04 <0.05 <0.05veland Reservoir near dam site 1 21-Sep-1999 1023 324703116473101 Spike 0.24 0.25 0.26veland Reservoir East end near source inlet site 2 4-May-1999 1131 324737116453501 Replicate <0.04 <0.05 <0.05
C/QA site for Sacramento project office CA 9-Sep-1998 1418 88888801 Blank <0.04 <0.05 <0.05C/QA site for Sacramento project office CA 7-Sep-1999 1118 88888801 Blank <0.04 <0.05 <0.05

11
Ta ater and Loveland Reservoirs, San Diego County,C
Bro
mob
enze
ne
Bro
moe
then
e
Bro
mof
orm
Carb
on d
isul
fide
81555 50002 32104 77041
) (µµµµg/L) (µµµµg/L) (µµµµg/L) (µµµµg/L)
SW <0.04 <0.1 <0.1 <0.37SW <0.04 <0.1 <0.1 <0.37SW <0.04 <0.1 <0.1 <0.37SW 0.52 1.2 1.3 0.97Lo <0.04 <0.1 <0.1 <0.37Lo <0.04 <0.1 <0.1 <0.37Lo 0.26 0.5 0.6 E0.34Lo <0.04 <0.1 <0.1 <0.37Q <0.04 <0.1 <0.1 <0.37Q <0.04 <0.1 <0.1 <0.37
Dib
rom
ochl
orom
etha
ne
Chlo
rofo
rm
cis-
1,2-
Dic
hlor
oeth
ylen
e
cis-
1,3-
Dic
hlor
opro
pene
32105 32106 77093 34704
) (µµµµg/L) (µµµµg/L) (µµµµg/L) (µµµµg/L)
SW <0.2 0.15 <0.04 <0.09SW E0.1 0.16 <0.04 <0.09SW <0.2 E0.01 <0.04 <0.09SW 2.1 0.73 0.58 0.85Lo <0.2 <0.05 <0.04 <0.09Lo <0.2 <0.05 <0.04 <0.09Lo 1.1 0.28 0.25 0.42Lo <0.2 <0.05 <0.04 <0.09Q <0.2 <0.05 <0.04 <0.09Q <0.2 0.13 <0.04 <0.09
5 Table 12
ble 12. Quality assurance analytical results for volatile organic compound (VOC) concentrations in water samples, Sweetwalifornia—Continued
sec-
But
ylbe
nzen
e
tert
-But
ylbe
nzen
e
Ben
zene
PCODE 77350 77353 34030
Site name Date Time Site ID Sample type (µµµµg/L) (µµµµg/L) (µµµµg/L
R near Vista Del Lago station 12-Jul-1999 1208 324139117000801 Blank <0.05 <0.1 <0.1R center of minimum pool 1-Mar-1999 1131 324131117000101 Replicate <0.05 <0.1 E0.01R center of minimum pool 1-Mar-1999 1138 324131117000101 Blank <0.05 <0.1 <0.1R east end reservoir fill boundary 10-Sep-1998 1313 324209116585001 Spike 0.52 1.08 0.58
veland Reservoir near dam site 1 4-Nov-1998 1041 324703116473101 Replicate <0.05 <0.1 <0.1veland Reservoir near dam site 1 4-Nov-1998 1048 324703116473101 Blank <0.05 <0.1 <0.1veland Reservoir near dam site 1 21-Sep-1999 1023 324703116473101 Spike 0.24 0.49 0.26veland Reservoir East end near source inlet site 2 4-May-1999 1131 324737116453501 Replicate <0.05 <0.1 <0.1
C/QA site for Sacramento project office CA 9-Sep-1998 1418 88888801 Blank <0.05 <0.1 <0.1C/QA site for Sacramento project office CA 7-Sep-1999 1118 88888801 Blank <0.05 <0.1 <0.1
Tetr
achl
orom
etha
ne
Chlo
robe
nzen
e
Chlo
roet
hane
PCODE 32102 34301 34311
Site name Date Time Site ID Sample type (µµµµg/L) (µµµµg/L) (µµµµg/L
R near Vista Del Lago station 12-Jul-1999 1208 324139117000801 Blank <0.09 <0.03 <0.1R center of minimum pool 1-Mar-1999 1131 324131117000101 Replicate <0.09 <0.03 <0.1R center of minimum pool 1-Mar-1999 1138 324131117000101 Blank <0.09 <0.03 <0.1R east end reservoir fill boundary 10-Sep-1998 1313 324209116585001 Spike 0.93 0.54 1.3
veland Reservoir near dam site 1 4-Nov-1998 1041 324703116473101 Replicate <0.09 <0.03 <0.1veland Reservoir near dam site 1 4-Nov-1998 1048 324703116473101 Blank <0.09 <0.03 <0.1veland Reservoir near dam site 1 21-Sep-1999 1023 324703116473101 Spike 0.42 0.26 0.5veland Reservoir East end near source inlet site 2 4-May-1999 1131 324737116453501 Replicate <0.09 <0.03 <0.1
C/QA site for Sacramento project office CA 9-Sep-1998 1418 88888801 Blank <0.09 <0.03 <0.1C/QA site for Sacramento project office CA 7-Sep-1999 1118 88888801 Blank <0.09 <0.03 <0.1

11
Ta d Loveland Reservoirs, San Diego County,C
Dic
hlor
odifl
uoro
met
hane
Diis
opro
pyl e
ther
1,1,
1,2-
Tetr
achl
oroe
than
e
1,1,
2,2,
-Tet
rach
loro
etha
ne
4668 81577 77562 34516
g/L) (µµµµg/L) (µµµµg/L) (µµµµg/L)
SW 0.1 <0.1 <0.04 <0.13SW 0.1 <0.1 <0.04 <0.13SW 0.1 <0.1 <0.04 <0.13SW 1.3 1.2 0.52 1.69Lo 0.1 <0.1 <0.04 <0.13Lo 0.1 <0.1 <0.04 <0.13Lo 0.3 0.5 0.24 0.84Lo 0.1 <0.1 <0.04 <0.13Q 0.1 <0.1 <0.04 <0.13Q 0.1 <0.1 <0.04 <0.13
tert
-Pen
tyl m
ethy
l eth
er
Ethy
lben
zene
1,1,
2-Tr
ichl
orot
riflu
oroe
than
e
Tetr
ahyd
rofu
ran
0005 34371 77652 81607
g/L) (µµµµg/L) (µµµµg/L) (µµµµg/L)
SW 0.1 <0.03 <0.03 <9SW 0.1 <0.03 <0.03 <9SW 0.1 <0.03 <0.03 <9SW 1.1 0.57 0.51 24Lo 0.1 <0.03 <0.03 <9Lo 0.1 <0.03 <0.03 <9Lo 0.7 0.25 0.2 14Lo 0.1 <0.03 <0.03 <9Q 0.1 <0.03 <0.03 <9Q 0.1 <0.03 <0.03 <9
6 Table 12
ble 12. Quality assurance analytical results for volatile organic compound (VOC) concentrations in water samples, Sweetwater analifornia—Continued
1,2-
Dib
rom
o-3-
chlo
ropr
opan
e
Dib
rom
omet
hane
Bro
mod
ichl
orom
etha
ne
PCODE 82625 30217 32101 3
Site name Date Time Site ID Sample type (µµµµg/L) (µµµµg/L) (µµµµg/L) (µµµµ
R near Vista Del Lago station 12-Jul-1999 1208 324139117000801 Blank <0.2 <0.05 E0.01 <R center of minimum pool 1-Mar-1999 1131 324131117000101 Replicate <0.2 <0.05 0.16 <R center of minimum pool 1-Mar-1999 1138 324131117000101 Blank <0.2 <0.05 <0.05 <R east end reservoir fill boundary 10-Sep-1998 1313 324209116585001 Spike 2.2 0.6 0.68 E
veland Reservoir near dam site 1 4-Nov-1998 1041 324703116473101 Replicate <0.2 <0.05 <0.05 <veland Reservoir near dam site 1 4-Nov-1998 1048 324703116473101 Blank <0.2 <0.05 <0.05 <veland Reservoir near dam site 1 21-Sep-1999 1023 324703116473101 Spike 1.3 0.31 0.28 Eveland Reservoir East end near source inlet site 2 4-May-1999 1131 324737116453501 Replicate <0.2 <0.05 <0.05 <
C/QA site for Sacramento project office CA 9-Sep-1998 1418 88888801 Blank <0.2 <0.05 <0.05 <C/QA site for Sacramento project office CA 7-Sep-1999 1118 88888801 Blank <0.2 <0.05 <0.05 <
Hex
achl
oroe
than
e
Die
thyl
eth
er
Ethy
l ter
t-bu
tyl e
ther
PCODE 34396 81576 50004 5
Site name Date Time Site ID Sample type (µµµµg/L) (µµµµg/L) (µµµµg/L) (µµµµ
R near Vista Del Lago station 12-Jul-1999 1208 324139117000801 Blank <0.4 <0.2 <0.05 <R center of minimum pool 1-Mar-1999 1131 324131117000101 Replicate <0.4 <0.2 <0.05 <R center of minimum pool 1-Mar-1999 1138 324131117000101 Blank <0.4 <0.2 <0.05 <R east end reservoir fill boundary 10-Sep-1998 1313 324209116585001 Spike 4.7 2.1 0.53
veland Reservoir near dam site 1 4-Nov-1998 1041 324703116473101 Replicate <0.4 <0.2 <0.05 <veland Reservoir near dam site 1 4-Nov-1998 1048 324703116473101 Blank <0.4 <0.2 <0.05 <veland Reservoir near dam site 1 21-Sep-1999 1023 324703116473101 Spike 1.5 0.9 0.27veland Reservoir East end near source inlet site 2 4-May-1999 1131 324737116453501 Replicate <0.4 <0.2 <0.05 <
C/QA site for Sacramento project office CA 9-Sep-1998 1418 88888801 Blank <0.4 <0.2 <0.05 <C/QA site for Sacramento project office CA 7-Sep-1999 1118 88888801 Blank <0.4 <0.2 <0.05 <

11
Ta ater and Loveland Reservoirs, San Diego County,C
Met
hyl m
etha
cryl
ate
Met
hyl a
cryl
onitr
ile
Bro
moc
hlor
omet
hane
Met
hyl a
cryl
ate
81597 81593 77297 49991
) (µµµµg/L) (µµµµg/L) (µµµµg/L) (µµµµg/L)
SW <0.3 <0.6 <0.04 <1SW <0.3 <0.6 <0.04 <1SW <0.3 <0.6 <0.04 <1SW 4.1 6.7 0.55 19Lo <0.3 <0.6 <0.04 <1Lo <0.3 <0.6 <0.04 <1Lo 2.6 4.4 0.29 11Lo <0.3 <0.6 <0.04 <1Q <0.3 <0.6 <0.04 <1Q <0.3 <0.6 <0.04 <1
Chlo
rom
etha
ne
Dic
hlor
omet
hane
2-B
utan
one
4-M
ethy
l-2-
pent
anon
e
34418 34423 81595 78133
) (µµµµg/L) (µµµµg/L) (µµµµg/L) (µµµµg/L)
SW <0.2 <0.4 <2 <0.4SW <0.2 <0.4 <2 <0.4SW <0.2 <0.4 <2 <0.4SW E1.8 4.7 22 4.1Lo <0.2 <0.4 <2 <0.4Lo <0.2 <0.4 <2 <0.4Lo E0.9 1.9 12 2.6Lo — <0.4 <2 <0.4Q <0.3 <0.4 <2 <0.4Q <0.2 <0.4 <2 <0.4
7 Table 12
ble 12. Quality assurance analytical results for volatile organic compound (VOC) concentrations in water samples, Sweetwalifornia—Continued
Hex
achl
orob
utad
iene
1,2,
3,5-
Tetr
amet
hylb
enze
ne
Ethy
l met
hacr
ylat
e
PCODE 39702 50000 73570
Site name Date Time Site ID Sample type (µµµµg/L) (µµµµg/L) (µµµµg/L
R near Vista Del Lago station 12-Jul-1999 1208 324139117000801 Blank <0.1 <0.2 <0.3R center of minimum pool 1-Mar-1999 1131 324131117000101 Replicate <0.1 <0.2 <0.3R center of minimum pool 1-Mar-1999 1138 324131117000101 Blank <0.1 <0.2 <0.3R east end reservoir fill boundary 10-Sep-1998 1313 324209116585001 Spike 1.2 3.0 3.0
veland Reservoir near dam site 1 4-Nov-1998 1041 324703116473101 Replicate <0.1 <0.2 <0.3veland Reservoir near dam site 1 4-Nov-1998 1048 324703116473101 Blank <0.1 <0.2 <0.3veland Reservoir near dam site 1 21-Sep-1999 1023 324703116473101 Spike 0.6 1.0 1.6veland Reservoir East end near source inlet site 2 4-May-1999 1131 324737116453501 Replicate <0.1 <0.2 <0.3
C/QA site for Sacramento project office CA 9-Sep-1998 1418 88888801 Blank <0.1 <0.2 <0.3C/QA site for Sacramento project office CA 7-Sep-1999 1118 88888801 Blank <0.1 <0.2 <0.3
Met
hyl i
odid
e
tert
-But
yl m
ethy
l eth
er
Bro
mom
etha
ne
PCODE 77424 78032 34413
Site name Date Time Site ID Sample type (µµµµg/L) (µµµµg/L) (µµµµg/L
R near Vista Del Lago station 12-Jul-1999 1208 324139117000801 Blank <0.2 E0.1 <0.1R center of minimum pool 1-Mar-1999 1131 324131117000101 Replicate <0.2 0.2 <0.1R center of minimum pool 1-Mar-1999 1138 324131117000101 Blank <0.2 <0.2 <0.1R east end reservoir fill boundary 10-Sep-1998 1313 324209116585001 Spike E1.3 2.1 E1.6
veland Reservoir near dam site 1 4-Nov-1998 1041 324703116473101 Replicate <0.2 E0.1 <0.1veland Reservoir near dam site 1 4-Nov-1998 1048 324703116473101 Blank <0.2 <0.2 <0.1veland Reservoir near dam site 1 21-Sep-1999 1023 324703116473101 Spike E0.4 1.4 E0.5veland Reservoir East end near source inlet site 2 4-May-1999 1131 324737116453501 Replicate <0.2 0.2 <0.1
C/QA site for Sacramento project office CA 9-Sep-1998 1418 88888801 Blank <0.2 <0.2 <0.1C/QA site for Sacramento project office CA 7-Sep-1999 1118 88888801 Blank <0.2 E0.1 <0.1

11
Ta r and Loveland Reservoirs, San Diego County,C
O-X
ylen
e
4-Is
opro
pyl-
1-m
ethy
lben
zene
1,2,
3,4-
Tetr
amet
hylb
enze
ne
1,3-
Dic
hlor
opro
pane
77135 77356 49999 77173
(µµµµg/L) (µµµµg/L) (µµµµg/L) (µµµµg/L)
SW <0.06 <0.11 <0.2 <0.1SW <0.06 <0.11 <0.2 <0.1SW <0.06 <0.11 <0.2 <0.1SW 0.71 1.01 E3.4 1.4Lo <0.06 <0.11 <0.2 <0.1Lo <0.06 <0.11 <0.2 <0.1Lo 0.33 0.47 1.3 0.8Lo <0.06 <0.11 <0.2 <0.1Q <0.06 <0.11 <0.2 <0.1Q <0.06 <0.11 <0.2 <0.1
O-E
thyl
tolu
ene
4-Ch
loro
tolu
ene
Tolu
ene
tran
s-1,
3-D
ichl
orop
rope
ne
77220 77277 34010 34699
(µµµµg/L) (µµµµg/L) (µµµµg/L) (µµµµg/L)
SW <0.1 <0.06 E0.02 <0.13SW <0.1 <0.06 <0.05 <0.13SW <0.1 <0.06 E0.01 <0.13SW 1.05 0.59 0.61 1.20Lo <0.1 <0.06 E0.01 <0.13Lo <0.1 <0.06 <0.05 <0.13Lo 0.44 0.28 0.27 0.72Lo <0.1 <0.06 E0.02 <0.13Q <0.1 <0.06 <0.05 <0.13Q <0.1 <0.06 E0.01 <0.13
8 Table 12
ble 12. Quality assurance analytical results for volatile organic compound (VOC) concentrations in water samples, Sweetwatealifornia—Continued
m- a
nd p
-Xyl
ene
Nap
htha
lene
2-Ch
loro
tolu
ene
PCODE 85795 34696 77275
Site name Date Time Site ID Sample type (µµµµg/L) (µµµµg/L) (µµµµg/L)
R near Vista Del Lago station 12-Jul-1999 1208 324139117000801 Blank E0.02 <0.2 <0.04R center of minimum pool 1-Mar-1999 1131 324131117000101 Replicate <0.06 <0.2 <0.04R center of minimum pool 1-Mar-1999 1138 324131117000101 Blank — <0.2 <0.04R east end reservoir fill boundary 10-Sep-1998 1313 324209116585001 Spike 1.41 E5.4 0.54
veland Reservoir near dam site 1 4-Nov-1998 1041 324703116473101 Replicate <0.06 <0.2 <0.04veland Reservoir near dam site 1 4-Nov-1998 1048 324703116473101 Blank <0.06 <0.2 <0.04veland Reservoir near dam site 1 21-Sep-1999 1023 324703116473101 Spike 0.63 1.5 0.23veland Reservoir East end near source inlet site 2 4-May-1999 1131 324737116453501 Replicate <0.06 <0.2 <0.04
C/QA site for Sacramento project office CA 9-Sep-1998 1418 88888801 Blank <0.06 <0.2 <0.04C/QA site for Sacramento project office CA 7-Sep-1999 1118 88888801 Blank <0.06 <0.2 <0.04
3-Ch
loro
prop
ene
Styr
ene
Tetr
achl
oroe
thyl
ene
PCODE 78109 77128 34475
Site name Date Time Site ID Sample type (µµµµg/L) (µµµµg/L) (µµµµg/L)
R near Vista Del Lago station 12-Jul-1999 1208 324139117000801 Blank <0.2 E0.01 <0.1R center of minimum pool 1-Mar-1999 1131 324131117000101 Replicate <0.2 <0.04 <0.1R center of minimum pool 1-Mar-1999 1138 324131117000101 Blank <0.2 <0.04 <0.1R east end reservoir fill boundary 10-Sep-1998 1313 324209116585001 Spike 1 0.59 1.2
veland Reservoir near dam site 1 4-Nov-1998 1041 324703116473101 Replicate <0.2 <0.04 <0.1veland Reservoir near dam site 1 4-Nov-1998 1048 324703116473101 Blank <0.2 <0.04 <0.1veland Reservoir near dam site 1 21-Sep-1999 1023 324703116473101 Spike 0.3 0.24 0.6veland Reservoir East end near source inlet site 2 4-May-1999 1131 324737116453501 Replicate <0.2 <0.04 <0.1
C/QA site for Sacramento project office CA 9-Sep-1998 1418 88888801 Blank <0.2 <0.04 <0.1C/QA site for Sacramento project office CA 7-Sep-1999 1118 88888801 Blank <0.2 <0.04 <0.1

11
Ta ater and Loveland Reservoirs, San Diego County,C
1,2-
Dic
hlor
oeth
ane-
d 4 (s
urro
gate
)
Tolu
ene-
d 8 (s
urro
gate
)
99832 99833
(%) (%)
SW 105 100SW 107 93SW 108 94SW 93 99Lo 130 103Lo 118 100Lo 92 97Lo 106 98Q 92 99Q 104 91
9 Table 12
ble 12. Quality assurance analytical results for volatile organic compound (VOC) concentrations in water samples, Sweetwalifornia—Continued
Tric
hlor
oeth
ylen
e
Viny
l chl
orid
e
1,4-
Bro
mofl
uoro
benz
ene
(sur
roga
te)
PCODE 34488 39175 99834
Site name Date Time Site ID Sample type (µµµµg/L) (µµµµg/L) (%)
R near Vista Del Lago station 12-Jul-1999 1208 324139117000801 Blank <0.09 <0.1 95R center of minimum pool 1-Mar-1999 1131 324131117000101 Replicate <0.09 <0.1 88R center of minimum pool 1-Mar-1999 1138 324131117000101 Blank <0.09 <0.1 91R east end reservoir fill boundary 10-Sep-1998 1313 324209116585001 Spike 0.94 1.3 100
veland Reservoir near dam site 1 4-Nov-1998 1041 324703116473101 Replicate <0.09 <0.1 109veland Reservoir near dam site 1 4-Nov-1998 1048 324703116473101 Blank <0.09 <0.1 104veland Reservoir near dam site 1 21-Sep-1999 1023 324703116473101 Spike 0.38 0.4 88veland Reservoir East end near source inlet site 2 4-May-1999 1131 324737116453501 Replicate <0.09 <0.1 92
C/QA site for Sacramento project office CA 9-Sep-1998 1418 88888801 Blank 0.09 0.1 96C/QA site for Sacramento project office CA 7-Sep-1999 1118 88888801 Blank 0.09 0.1 92

120 T
Table ter samples, Sweetwater and Loveland Reservoirs, San Diego County, California
[Time imated because of interference or is below method reporting limits. The number given below each compound is its r; QC, quality control; QA, quality assurance; CA, California; %, percentage recovery; <, compound was not detec
2,6
-Die
thyl
anili
ne
Ace
toch
lor
Ala
chlo
r
alph
a-H
CH
Atr
azin
e
Ben
flura
lin
82660 49260 46342 34253 39632 82673
Site ID Sample type (mg/L) (mg/L) (mg/L) (mg/L) (mg/L) (mg/L)
SWR 24130117002501 Replicate <0.003 <0.002 <0.002 <0.002 <0.001 <0.002
SWR 24131117000101 Replicate <0.003 <0.002 <0.002 <0.002 <0.001 <0.002
SWR 24209116585001 Spike 0.101 0.117 0.123 0.130 0.124 0.110
SWR 24209116585001 Blank <0.003 <0.002 <0.002 <0.002 <0.001 <0.002
Love 24703116473101 Spike 0.095 0.101 0.120 0.098 0.112 0.078
QC/Q 88888801 Blank <0.003 <0.002 <0.002 <0.002 <0.001 <0.002
QC/Q 88888801 Blank <0.003 <0.002 <0.002 <0.002 <0.001 <0.002
But
ylat
e
Carb
aryl
Carb
ofur
an
Ch
lorp
yifo
s
Cyan
azin
e
Dac
thal
4028 82680 82674 38933 4041 82682
Site ID Sample type (mg/L) (mg/L) (mg/L) (mg/L) (mg/L) (mg/L)
SWR 4130117002501 Replicate <0.002 <0.003 <0.003 <0.004 <0.004 <0.002
SWR 4131117000101 Replicate 0.002 <0.003 <0.003 <0.004 <0.004 <0.002
SWR 4209116585001 Spike 0.120 E1.000 E0.524 0.116 0.160 0.115
SWR 4209116585001 Blank <0.002 <0.003 <0.003 <0.004 <0.004 <0.002
Love 4703116473101 Spike 0.108 E0.104 E0.137 0.100 0.121 0.122
QC/Q 88888801 Blank <0.002 <0.003 <0.003 <0.004 <0.004 <0.002
QC/Q 88888801 Blank 0.002 <0.003 <0.003 <0.004 <0.004 0.002
able 13
13. Quality assurance analytical results for pesticide concentrations in wa
is denoted in 24-hour scale. An “E” indicates that the value has been estparameter code (PCODE). ID, identification; SWR, Sweetwater Reservoited at a concentration above the reporting level; mg/L, milligram per liter]
PCODE
Site name Date Time
near pump tower 12-Jul-1999 1131 3
center of minimum pool 6-Jan-1999 1031 3
east end reservoir fill boundary 10-Sep-1998 1313 3
east end reservoir fill boundary 1-Mar-1999 1248 3
land Reservoir near dam site 1 2-Mar-1999 1153 3
A site for Sacramento project office CA 9-Sep-1998 1408
A site for Sacramento project office CA 7-Sep-1999 1118
PCODE
Site name Date Time
near pump tower 12-Jul-1999 1131 32
center of minimum pool 6-Jan-1999 1031 32
east end reservoir fill boundary 10-Sep-1998 1313 32
east end reservoir fill boundary 1-Mar-1999 1248 32
land Reservoir near dam site 1 2-Mar-1999 1153 32
A site for Sacramento project office CA 9-Sep-1998 1408
A site for Sacramento project office CA 7-Sep-1999 1118

121 Tab
Dee
thyl
atra
zine
Dia
zino
n
Die
ldri
n
Dis
ulfo
ton
EPTC
Etha
lflur
alin
4040 39572 39381 82677 82668 82663
Time Site ID Sample type (mg/L) (mg/L) (mg/L) (mg/L) (mg/L) (mg/L)
SWR ne 1131 324130117002501 Replicate <0.002 <0.002 <0.001 <0.017 <0.002 <0.004
SWR ce 1031 324131117000101 Replicate <0.002 <0.002 <0.001 <0.017 <0.002 <0.004
SWR ea 1313 324209116585001 Spike E0.069 0.126 0.102 0.091 0.119 0.107
SWR ea 1248 324209116585001 Blank <0.002 <0.002 <0.001 <0.017 <0.002 <0.004
Lovelan 1153 324703116473101 Spike E0.042 0.106 0.105 0.104 0.115 0.112
QC/QA 1408 88888801 Blank <0.002 <0.002 <0.001 <0.017 <0.002 <0.004
QC/QA 1118 88888801 Blank <0.002 <0.002 <0.001 <0.017 <0.002 <0.004
Etho
prop
hos
Fono
fos
Lind
ane
Linu
ron
Mal
athi
on
Azi
npho
s-m
ethy
l
82672 4095 39341 82666 39532 82686
Time Site ID Sample type (mg/L) (mg/L) (mg/L) (mg/L) (mg/L) (mg/L)
SWR ne 1131 324130117002501 Replicate <0.003 <0.003 <0.004 <0.002 <0.005 <0.001
SWR cen 1031 324131117000101 Replicate <0.003 <0.003 <0.004 <0.002 <0.005 <0.001
SWR eas 1313 324209116585001 Spike 0.107 0.119 0.119 0.117 0.147 E0.174
SWR eas 1248 324209116585001 Blank <0.003 <0.003 <0.004 <0.002 <0.005 <0.001
Loveland 1153 324703116473101 Spike 0.111 0.101 0.091 0.122 0.109 E0.139
QC/QA 1408 88888801 Blank <0.003 <0.003 <0.004 <0.002 <0.005 <0.001
QC/QA 1118 88888801 Blank <0.003 <0.003 <0.004 <0.002 <0.005 <0.001
Table 13 ions in water samples, Sweetwater and Loveland Reservoirs, San Diego County, California—Continued
le 13
PCODE
Site name Date
ar pump tower 12-Jul-1999
nter of minimum pool 6-Jan-1999
st end reservoir fill boundary 10-Sep-1998
st end reservoir fill boundary 1-Mar-1999
d Reservoir near dam site 1 2-Mar-1999
site for Sacramento project office CA 9-Sep-1998
site for Sacramento project office CA 7-Sep-1998
PCODE
Site name Date
ar pump tower 12-Jul-1999
ter of minimum pool 6-Jan-1999
t end reservoir fill boundary 10-Sep-1998
t end reservoir fill boundary 1-Mar-1999
Reservoir near dam site 1 2-Mar-1999
site for Sacramento project office CA 9-Sep-1998
site for Sacramento project office CA 7-Sep-1999
. Quality assurance analytical results for pesticide concentrat

122 Table
Par
athi
on-m
ethy
l
Met
olac
hor
Met
ribu
zin
Mol
inat
e
Nap
ropa
mid
e
p,p′′′′
-DD
E
82667 39415 82630 82671 82684 34653
Time Site ID Sample type (mg/L) (mg/L) (mg/L) (mg/L) (mg/L) (mg/L)
SWR near 1131 324130117002501 Replicate <0.006 <0.002 <0.004 <0.004 <0.003 <0.006
SWR cente 1031 324131117000101 Replicate <0.006 <0.002 <0.004 <0.004 <0.003 <0.006
SWR east 1313 324209116585001 Spike 0.172 0.118 0.126 0.122 0.117 0.080
SWR east 1248 324209116585001 Blank <0.006 <0.002 <0.004 <0.004 <0.003 <0.006
Loveland R 1153 324703116473101 Spike 0.112 0.117 0.082 0.120 0.118 0.057
QC/QA sit 1408 88888801 Blank <0.006 <0.002 <0.004 <0.004 <0.003 <0.006
QC/QA sit 1118 88888801 Blank <0.006 <0.002 <0.004 <0.004 <0.003 <0.006
Pa
rath
ion
Pebu
late
Pen
dim
etha
lin
cis-
Perm
ethr
in
Phor
ate
Prom
eton
39542 82669 82683 82687 82664 4037
Time Site ID Sample type (mg/L) (mg/L) (mg/L) (mg/L) (mg/L) (mg/L)
SWR near 1131 324130117002501 Replicate <0.004 <0.004 <0.004 <0.005 <0.002 <0.018
SWR cente 1031 324131117000101 Replicate <0.004 <0.004 <0.004 <0.005 <0.002 E0.007
SWR east e 1313 324209116585001 Spike 0.181 0.122 0.115 0.073 0.089 0.135
SWR east e 1248 324209116585001 Blank <0.004 <0.004 <0.004 <0.005 <0.002 <0.018
Loveland R 1153 324703116473101 Spike 0.130 0.110 0.102 0.046 0.102 0.117
QC/QA sit 1408 88888801 Blank 0.004 <0.004 <0.004 <0.005 <0.002 <0.018
QC/QA sit 1118 88888801 Blank 0.004 <0.004 <0.004 <0.005 <0.002 <0.018
Table 13. Q s in water samples, Sweetwater and Loveland Reservoirs, San Diego County, California—Continued
13
PCODE
Site name Date
pump tower 12-Jul-1999
r of minimum pool 6-Jan-1999
end reservoir fill boundary 10-Sep-1998
end reservoir fill boundary 1-Mar-1999
eservoir near dam site 1 2-Mar-1999
e for Sacramento project office CA 9-Sep-1998
e for Sacramento project office CA 7-Sep-1999
PCODE
Site name Date
pump tower 12-Jul-1999
r of minimum pool 6-Jan-1999
nd reservoir fill boundary 10-Sep-1998
nd reservoir fill boundary 1-Mar-1999
eservoir near dam site 1 2-Mar-1999
e for Sacramento project office CA 9-Sep-1998
e for Sacramento project office CA 7-Sep-1999
uality assurance analytical results for pesticide concentration

123 Table
Prop
yzam
ide
Prop
achl
or
Prop
anil
Prop
argi
te
Sim
azin
e
Teb
uthi
uron
Terb
acil
82676 4024 82679 82685 4035 82670 82665
Time Site ID Sample type (mg/L) (mg/L) (mg/L) (mg/L) (mg/L) (mg/L) (mg/L)
SWR near 1131 324130117002501 Replicate <0.003 <0.007 <0.004 <0.013 0.015 <0.01 <0.007
SWR cente 1031 324131117000101 Replicate <0.003 <0.007 <0.004 <0.013 0.018 <0.01 <0.007
SWR east 1313 324209116585001 Spike 0.129 0.131 0.127 0.117 0.140 0.12 E0.122
SWR east 1248 324209116585001 Blank <0.003 <0.007 <0.004 <0.013 <0.005 <0.01 <0.007
Loveland R 1153 324703116473101 Spike 0.100 0.124 0.124 0.108 0.106 0.14 E0.095
QC/QA sit 1408 88888801 Blank <0.003 <0.007 <0.004 <0.013 <0.005 <0.01 <0.007
QC/QA sit 1118 88888801 Blank <0.003 <0.007 <0.004 <0.013 <0.005 <0.01 <0.007
Terb
ufos
Te
rbut
hyla
zine
Thio
benc
arb
Tria
llate
Trifl
ural
in
Dia
zino
n-d 1
0 (su
rrog
ate)
alph
a-H
CH-d
6 (su
rrog
ate)
82675 91064 82681 82678 82661 91063 91065
Time Site ID Sample type (mg/L) (mg/L) (mg/L) (mg/L) (mg/L) (%) (%)
SWR near 9 1131 324130117002501 Replicate <0.013 E0.0551 <0.002 <0.001 <0.002 96 92
SWR cente 9 1031 324131117000101 Replicate <0.013 111 <0.002 <0.001 <0.002 107 98
SWR east 8 1313 324209116585001 Spike 0.098 101 0.121 0.113 0.111 97 90
SWR east 9 1248 324209116585001 Blank <0.013 108 <0.002 <0.001 <0.002 104 105
Loveland R 9 1153 324703116473101 Spike 0.092 106 0.105 0.103 0.089 96 89
QC/QA sit 8 1408 88888801 Blank <0.013 98.8 <0.002 <0.001 <0.002 93 89
QC/QA sit 9 1118 88888801 Blank <0.013 -999999 <0.002 <0.001 <0.002 E230 E218
Table 13. Q ations in water samples, Sweetwater and Loveland Reservoirs, San Diego County, California—Continued
13
PCODE
Site name Date
pump tower 12-Jul-1999
r of minimum pool 6-Jan-1999
end reservoir fill boundary 10-Sep-1998
end reservoir fill boundary 1-Mar-1999
eservoir near dam site 1 2-Mar-1999
e for Sacramento project office CA 9-Sep-1998
e for Sacramento project office CA 7-Sep-1999
PCODE
Site name Date
pump tower 12-Jul-199
r of minimum pool 6-Jan-199
end reservoir fill boundary 10-Sep-199
end reservoir fill boundary 1-Mar-199
eservoir near dam site 1 2-Mar-199
e for Sacramento project office CA 9-Sep-199
e for Sacramento project office CA 7-Sep-199
uality assurance analytical results for pesticide concentr

124 Table 14
Table 14. Quality assurance analytical results for polynuclear aromatic hydrocarbon compound concentrations in core segments and urban runoff diversion system pond surficial bed sediment samples, Sweetwater Reservoir, San Diego County, California
[An “E” indicates that the value has been estimated because of interference or is below method reporting limits. The number given below a compound is its parameter code, or PCODE (if a code has been assigned). Calif., California; CRM, Certified Reference material; Dup, duplicate; NA, not analyzed; PAH, polynuclear aromatic hydrocarbon; QA, quality assurrance; Surf. Bed Sed., surficial bed sediment; SWR, Sweetwater Reservoir; URDS, urban runoff diversion system. %, percentage recovery; <, compound was not detected at a concentration above the reporting level; µg/kg, microgram per kilogram]

Table 14. QA analytical results for PAHs in core segments, surficial bed sediment, and URDS samples from the SWR, San Diego County, Calif.—Continued
Phen
ol
p-c
reso
l
C8-a
lkyl
-phe
nol
Nap
htha
lene
C1-1
28 is
omer
s
2-et
hyl-
naph
thal
ene
2,6-
dim
ethy
l-na
phth
alen
e
1,6-
dim
ethy
l-na
phth
alen
e
PCODE 49413 49451 49402 49948 49406 49404
Site name Date Site ID Type (µµµµg/kg) (µµµµg/kg) (µµµµg/kg) (µµµµg/kg) (µµµµg/kg) (µµµµg/kg) (µµµµg/kg) (µµµµg/kg)
Core method 24-Sep-1998 983649001 Spike 52.0 E10.2 NA 78.8 NA 68.5 79.7 87.5Core method 24-Sep-1998 983648001 Blank E1.3 E0.9 NA <5 <5 <5 <5 <5Core matrix 24-Sep-1998 98365crm352 Spike NA NA NA 44.9 NA NA NA NA
Core method 24-Sep-1998 983299000 Spike 68.1 45.4 NA 80.9 NA 81.3 80.2 75.2
Core method 24-Sep-1998 983298000 Blank E1.0 <5 NA <5 <5 <5 <5 <5
Core - CRM 352 matrix 24-Sep-1998 98329crm352 Spike NA NA NA 57.3 NA NA NA NA
Surf. Bed Sed. method 04-Nov-1998 990128002 Blank E0.8 <5 NA E0.4 NA NA <5 <5Surf. Bed Sed. method 04-Nov-1998 990129002 Spike 70.9 22.3 NA 105 NA 98.4 95.5 97.8Surf. Bed Sed. CRM 352 matrix 04-Nov-1998 99011crm352 Spike NA NA NA 49.7 NA NA NA NAURDS Vista del Lago_01 05-Nov-1998 324142117001301 Spike 52.0 E10.2 NA 78.8 NA 68.5 79.7 87.5URDS Vista del Lago_01 05-Nov-1998 324142117001301 Blank E1.3 E0.9 NA <5 <5 <5 <5 <5URDS Vista del Lago_01 05-Nov-1998 324142117001301 Dup 141 E523 NA 27.5 160 11.1 46.0 44.2SWR near recreation area 04-Nov-1998 324126116595701 Dup 55.6 E964 NA E9.7 35.8 <10 E284 26.9
125 Table 14

Table 14. QA analytical results for PAHs in core segments, surficial bed sediment, and URDS samples from the SWR, San Diego County, Calif.—Continued
PCODE
Site name Date Site ID TypeCore method 24-Sep-1998 983649001 SpikeCore method 24-Sep-1998 983648001 BlankCore matrix 24-Sep-1998 98365crm352 Spike
Core method 24-Sep-1998 983299000 Spike
Core method 24-Sep-1998 983298000 BlankCore - CRM 352 matrix 24-Sep-1998 98329crm352 Spike
Surf. Bed Sed. method 04-Nov-1998 990128002 BlankSurf. Bed Sed. method 04-Nov-1998 990129002 SpikeSurf. Bed Sed. CRM 352 matrix 04-Nov-1998 99011crm352 SpikeURDS Vista del Lago_01 05-Nov-1998 324142117001301 SpikeURDS Vista del Lago_01 05-Nov-1998 324142117001301 BlankURDS Vista del Lago_01 05-Nov-1998 324142117001301 Dup
SWR near recreation area 04-Nov-1998 324126116595701 Dup
C2-1
28 is
omer
s
Ace
naph
thyl
ene
1,2-
dim
ethy
l-na
phth
alen
e
Ace
naph
then
e
C3-1
28 is
omer
s
2,3,
6-tr
imet
hyl-
naph
thal
ene
9H-F
luor
ene
C4-1
28 is
omer
s
49403 49429 49399
(µµµµg/kg) (µµµµg/kg) (µµµµg/kg) (µµµµg/kg) (µµµµg/kg) (µµµµg/kg) (µµµµg/kg) (µµµµg/kg)NA 65.1 83.8 71.1 NA 70.4 68.2 NA<5 <5 <5 <5 <5 <5 <5 <5NA NA NA 51.8 NA NA NA NANA 78.8 75.3 79.8 NA 78.0 74.8 NA
<5 <5 <5 <5 <5 <5 <5 <5
NA NA NA 61.9 NA NA NA NA <5 <5 <5 <5 <5 <5 <5 <5
NA 92.1 95.1 95.8 NA 107 114 NANA NA NA 59.6 NA NA NA NANA 65.1 83.8 71.1 NA 70.4 68.2 NA<5 <5 <5 <5 <5 <5 <5 <5E262 26.2 26.4 <10 157 20.6 <15.0 85.0311 E4.0 <10 <10 54.3 E3.5 18.6 52.3
126 Table 14

Table 14. QA analytical results for PAHs in core segments, surficial bed sediment, and URDS samples from the SWR, San Diego County, Calif.—Continued
PCODE
Site name Date Site ID TypeCore method 24-Sep-1998 983649001 SpikeCore method 24-Sep-1998 983648001 BlankCore matrix 24-Sep-1998 98365crm352 Spike
Core method 24-Sep-1998 983299000 Spike
Core method 24-Sep-1998 983298000 BlankCore - CRM 352 matrix 24-Sep-1998 98329crm352 Spike
Surf. Bed Sed. method 04-Nov-1998 990128002 BlankSurf. Bed Sed. method 04-Nov-1998 990129002 SpikeSurf. Bed Sed. CRM 352 matrix 04-Nov-1998 99011crm352 SpikeURDS Vista del Lago_01 05-Nov-1998 324142117001301 SpikeURDS Vista del Lago_01 05-Nov-1998 324142117001301 BlankURDS Vista del Lago_01 05-Nov-1998 324142117001301 Dup
SWR near recreation area 04-Nov-1998 324126116595701 Dup
1-m
ethy
l-9H
-Flu
oren
e
C1-1
66 is
omer
s
dibe
nzo-
thip
hene
Phen
anth
rene
Ant
hrac
ene
Acr
idin
e
Phen
anth
ridi
ne
9H-c
arba
zol
49398 49409 49434
(µµµµg/kg) (µµµµg/kg) (µµµµg/kg) (µµµµg/kg) (µµµµg/kg) (µµµµg/kg) (µµµµg/kg) (µµµµg/kg)73.8 NA NA 76.8 71.9 NA NA NA<5 NA NA <5 <5 NA NA NANA NA NA NA 49.2 NA NA NA75.8 NA NA 84.4 74.8 NA NA NA
<5 NA NA <5 <5 NA NA NA
NA NA NA NA 48.4 NA NA NAE0.8 NA NA <5 <5 NA NA NA
121 NA NA 108 95.9 NA NA NANA NA NA NA 50.8 NA NA NA73.8 NA NA 76.8 71.9 NA NA NA<5 NA NA <5 <5 NA NA NA<20.0 NA NA 226 42.8 NA NA NAE9.9 NA NA 20.9 E4.2 NA NA NA
127 Table 14

Table 14. QA analytical results for PAHs in core segments, surficial bed sediment, and URDS samples from the SWR, San Diego County, Calif.—Continued
PCODE
Site name Date Site ID TypeCore method 24-Sep-1998 983649001 SpikeCore method 24-Sep-1998 983648001 BlankCore matrix 24-Sep-1998 98365crm352 Spike
Core method 24-Sep-1998 983299000 Spike
Core method 24-Sep-1998 983298000 BlankCore - CRM 352 matrix 24-Sep-1998 98329crm352 Spike
Surf. Bed Sed. method 04-Nov-1998 990128002 BlankSurf. Bed Sed. method 04-Nov-1998 990129002 SpikeSurf. Bed Sed. CRM 352 matrix 04-Nov-1998 99011crm352 SpikeURDS Vista del Lago_01 05-Nov-1998 324142117001301 SpikeURDS Vista del Lago_01 05-Nov-1998 324142117001301 BlankURDS Vista del Lago_01 05-Nov-1998 324142117001301 Dup
SWR near recreation area 04-Nov-1998 324126116595701 Dup
C5-1
28 is
omer
s
C2-1
66 is
omer
s
2-M
ethy
l-A
nthr
acen
e
4,5-
met
hyle
ne-
phen
anth
rene
C1-1
78 is
omer
s
1-M
ethy
l-Ph
enan
thre
ne
C3-1
66 is
omer
s
C2-1
78 is
omer
s
49435 49411 49410
(µµµµg/kg) (µµµµg/kg) (µµµµg/kg) (µµµµg/kg) (µµµµg/kg) (µµµµg/kg) (µµµµg/kg) (µµµµg/kg)NA NA 63.6 77.8 NA 83.0 NA NA<5 NA <5 <5 <5 <5 NA <5NA NA NA NA NA NA NA NANA NA 71.4 83.1 NA 86.6 NA NA
<5 NA <5 <5 <5 <5 NA <5
NA NA NA NA NA NA NA NA <5 NA <5 <5 <5 <5 NA <5
NA NA 91.9 103 NA 103 NA NANA NA NA NA NA NA NA NANA NA 63.6 77.8 NA 83.0 NA NA<5 NA <5 <5 <5 <5 NA <566.7 NA 16.2 42.0 322 56.3 NA 595<10 NA <10 E6.7 E6.0 E4.4 NA E5.0
128 Table 14

Table 14. QA analytical results for PAHs in core segments, surficial bed sediment, and URDS samples from the SWR, San Diego County, Calif.—Continued
PCODE
Site name Date Site ID TypeCore method 24-Sep-1998 983649001 SpikeCore method 24-Sep-1998 983648001 BlankCore matrix 24-Sep-1998 98365crm352 Spike
Core method 24-Sep-1998 983299000 Spike
Core method 24-Sep-1998 983298000 BlankCore - CRM 352 matrix 24-Sep-1998 98329crm352 Spike
Surf. Bed Sed. method 04-Nov-1998 990128002 BlankSurf. Bed Sed. method 04-Nov-1998 990129002 SpikeSurf. Bed Sed. CRM 352 matrix 04-Nov-1998 99011crm352 SpikeURDS Vista del Lago_01 05-Nov-1998 324142117001301 SpikeURDS Vista del Lago_01 05-Nov-1998 324142117001301 BlankURDS Vista del Lago_01 05-Nov-1998 324142117001301 Dup
SWR near recreation area 04-Nov-1998 324126116595701 Dup
Fluo
rant
hene
Pyre
ne
C3-1
78 is
omer
s
C4-1
78 is
omer
s
1-M
ethy
l-Py
rene
C1-2
02 is
omer
s
C2-2
02 is
omer
s
C5-1
78 is
omer
s
49466 49387 49388
(µµµµg/kg) (µµµµg/kg) (µµµµg/kg) (µµµµg/kg) (µµµµg/kg) (µµµµg/kg) (µµµµg/kg) (µµµµg/kg)75.7 77.3 NA NA NA NA NA NA<5 <5 <5 <5 <5 <5 <5 <5NA 112 NA NA NA NA NA NA96.0 85.0 NA NA NA NA NA NA
<5 <5 <5 <5 <5 <5 <5 <5
NA 57.7 NA NA NA NA NA NA <5 <5 <5 <5 <5 <5 <5 <5
119 118 NA NA NA NA NA NANA E343 NA NA NA NA NA NA75.7 77.3 NA NA NA NA NA NA<5 <5 <5 <5 <5 <5 <5 <5255 254 435 202 36.0 200 436 <80020.2 18.8 <10 <10 E2.8 12.1 <10 <10
129 Table 14

Table 14. QA analytical results for PAHs in core segments, surficial bed sediment, and URDS samples from the SWR, San Diego County, Calif.—Continued
PCODE
Site name Date Site ID TypeCore method 24-Sep-1998 983649001 SpikeCore method 24-Sep-1998 983648001 BlankCore matrix 24-Sep-1998 98365crm352 Spike
Core method 24-Sep-1998 983299000 Spike
Core method 24-Sep-1998 983298000 BlankCore - CRM 352 matrix 24-Sep-1998 98329crm352 Spike
Surf. Bed Sed. method 04-Nov-1998 990128002 BlankSurf. Bed Sed. method 04-Nov-1998 990129002 SpikeSurf. Bed Sed. CRM 352 matrix 04-Nov-1998 99011crm352 SpikeURDS Vista del Lago_01 05-Nov-1998 324142117001301 SpikeURDS Vista del Lago_01 05-Nov-1998 324142117001301 BlankURDS Vista del Lago_01 05-Nov-1998 324142117001301 Dup
SWR near recreation area 04-Nov-1998 324126116595701 Dup
Ben
z (a
) Ant
hrac
ene
Chry
sene
C3-2
02 is
omer
s
C1-2
28 is
omer
s
C4-2
02 is
omer
s
C5-2
02 is
omer
s
C2-2
28 is
omer
s
Ben
zo (b
) flu
oran
then
e
49436 49450 49458
(µµµµg/kg) (µµµµg/kg) (µµµµg/kg) (µµµµg/kg) (µµµµg/kg) (µµµµg/kg) (µµµµg/kg) (µµµµg/kg)123 133 NA NA NA NA NA 123<5 <5 <5 <5 <5 <5 <5 <5NA 98.6 NA NA NA NA NA 10785.6 78.4 NA NA NA NA NA 82.8
<5 <5 <5 <5 <5 <5 <5 <5
NA 63.1 NA NA NA NA NA 73.2 <5 <5 <5 <5 <5 <5 <5 <5
112 119 NA NA NA NA NA 134NA 71.3 NA NA NA NA NA 84.3122.9 133.1 NA NA NA NA NA 122.6<5 <5 <5 <5 <5 <5 <5 <5128 229 158 405 171 101 645 129E7.0 13.4 <10 <10 <10 <10 <10 16.6
130 Table 14

Table 14. QA analytical results for PAHs in core segments, surficial bed sediment, and URDS samples from the SWR, San Diego County, Calif.—Continued
PCODE
Site name Date Site ID TypeCore method 24-Sep-1998 983649001 SpikeCore method 24-Sep-1998 983648001 BlankCore matrix 24-Sep-1998 98365crm352 Spike
Core method 24-Sep-1998 983299000 Spike
Core method 24-Sep-1998 983298000 BlankCore - CRM 352 matrix 24-Sep-1998 98329crm352 Spike
Surf. Bed Sed. method 04-Nov-1998 990128002 BlankSurf. Bed Sed. method 04-Nov-1998 990129002 SpikeSurf. Bed Sed. CRM 352 matrix 04-Nov-1998 99011crm352 SpikeURDS Vista del Lago_01 05-Nov-1998 324142117001301 SpikeURDS Vista del Lago_01 05-Nov-1998 324142117001301 BlankURDS Vista del Lago_01 05-Nov-1998 324142117001301 Dup
SWR near recreation area 04-Nov-1998 324126116595701 Dup
Ben
zo (k
) flu
oran
then
e
Ben
zo (e
) pyr
ene
Ben
zo (a
) pyr
ene
Pery
lene
C1-2
52 is
omer
s
C3-2
28 is
omer
s
C2-2
52 is
omer
s
C4-2
28 is
omer
s
49397 49389
(µµµµg/kg) (µµµµg/kg) (µµµµg/kg) (µµµµg/kg) (µµµµg/kg) (µµµµg/kg) (µµµµg/kg) (µµµµg/kg)115 89.5 98.0 72.3 NA NA NA NA<5 <5 <5 <5 <5 <5 <5 <5NA NA 89.2 NA NA NA NA NA81.8 65.9 71.8 57.9 NA NA NA NA
<5 <5 <5 <5 <5 <5 <5 <5
NA NA 61.2 NA NA NA NA NA <5 <5 <5 <5 <5 <5 <5 <5
139 112.1 115 99.6 NA NA NA NANA NA 70.2 NA NA NA NA NA115.2 89.5 98.0 72.3 NA NA NA NA<5 <5 <5 <5 <5 <5 <5 <579.5 174 75.8 117 467 <300 278 <80E8.4 15.2 E8.7 E497 <10 <10 <10 <10
131 Table 14

Table 14. QA analytical results for PAHs in core segments, surficial bed sediment, and URDS samples from the SWR, San Diego County, Calif.—Continued
PCODE
Site name Date Site ID TypeCore method 24-Sep-1998 983649001 SpikeCore method 24-Sep-1998 983648001 BlankCore matrix 24-Sep-1998 98365crm352 Spike
Core method 24-Sep-1998 983299000 Spike
Core method 24-Sep-1998 983298000 BlankCore - CRM 352 matrix 24-Sep-1998 98329crm352 Spike
Surf. Bed Sed. method 04-Nov-1998 990128002 BlankSurf. Bed Sed. method 04-Nov-1998 990129002 SpikeSurf. Bed Sed. CRM 352 matrix 04-Nov-1998 99011crm352 SpikeURDS Vista del Lago_01 05-Nov-1998 324142117001301 SpikeURDS Vista del Lago_01 05-Nov-1998 324142117001301 BlankURDS Vista del Lago_01 05-Nov-1998 324142117001301 Dup
SWR near recreation area 04-Nov-1998 324126116595701 Dup
Ben
zo (g
,h,i)
per
ylen
e
Inde
no (1
,2,3
-c,d
) py
rene
Dib
enzo
(a,h
) an
thra
cene
C3-2
52 is
omer
s
C4-2
52 is
omer
s
C5-2
28 is
omer
s
C5-2
52 is
omer
s
Coro
nene
49408 49390 49461
(µµµµg/kg) (µµµµg/kg) (µµµµg/kg) (µµµµg/kg) (µµµµg/kg) (µµµµg/kg) (µµµµg/kg) (µµµµg/kg)101 112 101 NA NA NA NA E63.3<5 <5 <5 <5 <5 <5 <5 <5NA NA NA NA NA NA NA NA56.3 78.3 78.3 NA NA NA NA E17.7
<5 <5 <5 <5 <5 <5 <5 <5
NA NA NA NA NA NA NA NA <5 <5 <5 <5 <5 <5 <5 <5
103 125 120 NA NA NA NA E41.3NA NA NA NA NA NA NA NA101 112 101 NA NA NA NA E63.3<5 <5 <5 <5 <5 <5 <5 <5241 63.5 25.4 148 <10 <10 <10 E65.5E7.9 E7.8 <10 <10 <10 <10 <10 <10
132 Table 14

Table 14. QA analytical results for PAHs in core segments, surficial bed sediment, and URDS samples from the SWR, San Diego County, Calif.—Continued
PCODE
Site name Date Site ID TypeCore method 24-Sep-1998 983649001 SpikeCore method 24-Sep-1998 983648001 BlankCore matrix 24-Sep-1998 98365crm352 Spike
Core method 24-Sep-1998 983299000 Spike
Core method 24-Sep-1998 983298000 BlankCore - CRM 352 matrix 24-Sep-1998 98329crm352 Spike
Surf. Bed Sed. method 04-Nov-1998 990128002 BlankSurf. Bed Sed. method 04-Nov-1998 990129002 SpikeSurf. Bed Sed. CRM 352 matrix 04-Nov-1998 99011crm352 SpikeURDS Vista del Lago_01 05-Nov-1998 324142117001301 SpikeURDS Vista del Lago_01 05-Nov-1998 324142117001301 BlankURDS Vista del Lago_01 05-Nov-1998 324142117001301 Dup
SWR near recreation area 04-Nov-1998 324126116595701 Dup
Nitr
oben
zene
-d5
(sur
roga
te)
2-Fl
uoro
biph
enyl
(s
urro
gate
)
Terp
heny
l-d 1
4
(sur
roga
te)
(%) (%) (%)NA NA NANA NA NANA NA NANA NA NA
NA NA NA
NA NA NA43 60 109
65 77 13556 78 13353 54 9487 79 89NA 86 93131 81 97
133 Table 14

134 Table 15
Table 15. Quality assurance analytical results for organochlorine concentrations in select core segments and in reservoir and urban runoff diversion system (URDS) ponds surficial bed sediments from the Sweetwater Reservoir, San Diego County, California
[Dup, duplicate; NA, not analyzed; SWR, Sweetwater Reservoir.%, percentage recovery; <, compound was not detected at a concentration above the reporting level; µg/kg, microgram per kilogram]
Site name DateSite identification
numberType
Lindane(µµµµg/kg)
Hepta-chlor
(µµµµg/kg)
Aldrin(µµµµg/kg)
Heptachlor epoxide (µµµµg/kg)
Chlor-dane
(µµµµg/kg)
Endo-sulfan I (µµµµg/kg)
Dieldrin (µµµµg/kg)
p,p'-DDE (µµµµg/kg)
Endrin (µµµµg/kg)
p,p'-DDD (µµµµg/kg)
SWR near recreation area 09-Sep-1998 324126116595702 Dup <1.25 <1.25 <1.25 <1.25 <12.50 <1.25 <1.25 4.46 <1.25 <1.25
URDS Vista del Lago_01 05-Nov-1998 324142117001301 Dup <1.1 <1.10 <1.00 <1.30 109.0 <2.90 <1.00 11.00 <2.10 <5.00
Site name DateSite identification
numberType
p,p'-DDT (µµµµg/kg)
p,p'-Methoxy-
chlor (µµµµg/kg)
Mirex (µµµµg/kg)
Toxa-phene
(µµµµg/kg)
Arochlor 1242
(µµµµg/kg)
Arochlor 1254
(µµµµg/kg)
Arochlor 1260
(µµµµg/kg)
TotalPCB
(µµµµg/kg)
Isodrin (surro-gate)(%)
Nonachlor-obiphenyl
(surro-gate)(%)
Alpha HCH-d6 (surro-gate)(%)
SWR near recreation area 09-Sep-1998 324126116595702 Dup <1.25 <5.00 <1.25 <125 <12.50 <12.50 <12.50 NA 88 79 66
URDS Vista del Lago_01 05-Nov-1998 324142117001301 Dup <10.00 <11.00 <1.00 <100 <10.00 6.70 NA NA NA 27 60


