52
Infosys Technologies Limited Report for the first quarter ended June 30, 2004

1
Infosys Technologies LimitedReport for the first quarter ended June 30, 2004
2
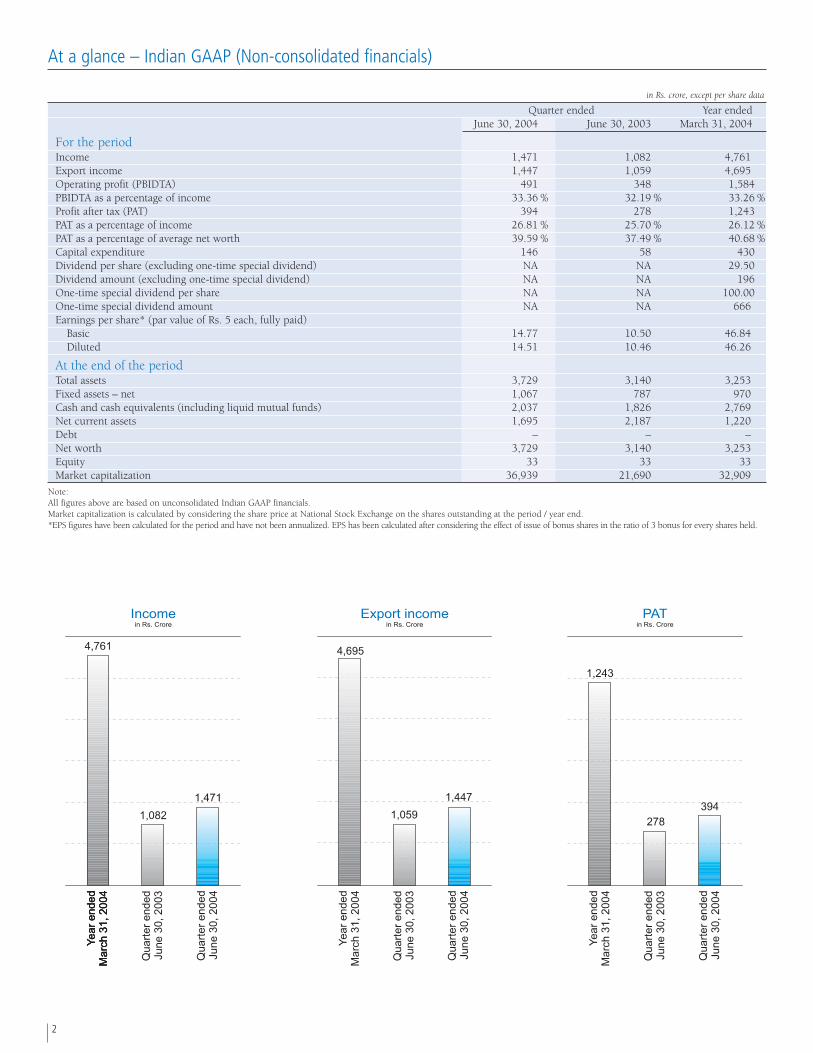
At a glance – Indian GAAP (Non-consolidated financials)
in Rs. crore, except per share data
Quarter ended Year endedJune 30, 2004 June 30, 2003 March 31, 2004
For the periodIncome 1,471 1,082 4,761Export income 1,447 1,059 4,695Operating profit (PBIDTA) 491 348 1,584PBIDTA as a percentage of income 33.36 % 32.19 % 33.26 %Profit after tax (PAT) 394 278 1,243PAT as a percentage of income 26.81 % 25.70 % 26.12 %PAT as a percentage of average net worth 39.59 % 37.49 % 40.68 %Capital expenditure 146 58 430Dividend per share (excluding one-time special dividend) NA NA 29.50Dividend amount (excluding one-time special dividend) NA NA 196One-time special dividend per share NA NA 100.00One-time special dividend amount NA NA 666Earnings per share* (par value of Rs. 5 each, fully paid)
Basic 14.77 10.50 46.84Diluted 14.51 10.46 46.26
At the end of the periodTotal assets 3,729 3,140 3,253Fixed assets – net 1,067 787 970Cash and cash equivalents (including liquid mutual funds) 2,037 1,826 2,769Net current assets 1,695 2,187 1,220Debt – – –Net worth 3,729 3,140 3,253Equity 33 33 33Market capitalization 36,939 21,690 32,909
Note:All figures above are based on unconsolidated Indian GAAP financials.Market capitalization is calculated by considering the share price at National Stock Exchange on the shares outstanding at the period / year end.*EPS figures have been calculated for the period and have not been annualized. EPS has been calculated after considering the effect of issue of bonus shares in the ratio of 3 bonus for every shares held.

3
Letter to the shareholder
Dear shareholder,
Your company is delighted to report strong growth in the first quarter of this fiscal year. Indian GAAP revenues grew by 12.4% over Q4 FY2004, while net profitsfrom ordinary activities witnessed an increase of 15.8%. Revenues in US GAAP terms grew by 10.6%, as compared to the quarter ended March 31, 2004.
Your company revised its initial guidance for fiscal year 2005. Consolidated income guidance under Indian GAAP was originally between Rs. 5,994 crore andRs. 6,041 crore. It has been revised to between Rs. 6,731 crore and Rs. 6,772 crore, an estimated growth of 39% to 40%, as against the initial 24%. In US GAAPterms the guidance for revenues was revised from between $ 1,381 million and $ 1,392 million, to $ 1,476 million and $ 1,485 million, an estimated growth of39% to 40%, as against the initial guidance of 30% to 31%.
The quarter saw the rupee weakening against the US dollar. The closing Rupee – US Dollar rate as on June 30, 2004 was Rs. 45.99, as compared to Rs. 43.40 asat March 31, 2004. This resulted in a rupee depreciation of 5.97% against the US dollar. Additionally, the average Rupee-US dollar rate was Rs. 45.31 during thequarter, as compared to Rs. 44.68 during the quarter ending March 31, 2004, resulting, in a rupee depreciation of 1.41% against the US dollar.
The company adopted the revised Accounting Standard (AS) 11 on Accounting for the Effects of Changes in Foreign Exchange Rates, effective April 1, 2004under Indian GAAP. Consequent to this, the company revised its accounting policy relating to forward exchange contracts and has marked-to-market all itsforward exchange contracts as of June 30, 2004. This is in line with its accounting practices required under the US GAAP. As a result of this, the profits for thequarter ended June 30, 2004 under Indian GAAP are lower by Rs. 32.41 crore.
This quarter, your company introduced a new approach to outsourcing, called ‘Modular Global Sourcing’. The new approach gives clients flexibility and allowsthem to align their businesses to their outsourcing initiatives. At the same, it optimizes on cost, quality and time-to-market for all clients. Your company continuesto benefit from the positive demand environment for offshore services. Further, it has built systems and processes to scale up to the increasing needs of themarketplace. Pricing has stabilized, as have margins. Your company’s billing for three clients (on an LTM basis) is more than $ 50 million each.
The focus on integration of your company’s subsidiaries with the overall strategy and operations of the company continues. Additionally, the restructuring intoIntegrated Business Units is starting to yield good results. It has resulted in multiple engines of growth with strong leadership.
This quarter saw a gross addition of 3,233 in terms of employees, including 746 lateral hires. The net employee addition for the quarter stood at 2,305. Clearly,your company remains an employer of choice.
Your company added 29 new clients during the quarter, taking the total number of clients to 419. There were significant wins in the financial services sectors. Oneof the top ten banks in the US selected your company and its subsidiary, Progeon, as strategic partners for IT and BPO. Further, your company started workingwith a leading services company providing consultative services for the secondary loan market. In the Asia Pacific region, a subsidiary of one of the largestbanking groups in Japan established a relationship with your company to build competitive applications and systems.
In the high-tech industry, a global leader in providing industrial hardware, software and services selected your company to support its business critical orderprocessing systems worldwide. Your company partnered with one of the world’s premier providers of IT equipment for power protection to help in the developmentand enhancement of its new line of power infrastructure and management products.
The Retail Practice, which has introduced innovative solutions in the marketplace, has also seen strong gains this quarter. A major US retailer of toys, children’sapparels and baby products chose your company to play a critical role in selecting and implementing new packages to transform its international merchandise.In healthcare and insurance, a European multi-billion dollar insurance organization selected your company for the replacement of its existing global database.Further, in the Energy and Utilities industry, your company is partnering with one of the largest electric utilities systems in the US, to improve customersatisfaction, while reducing customer-service operational cost.
The Banking Business Unit (BBU) made considerable headway in several countries this quarter, including the UAE, Saudi Arabia and Nigeria. Finacle® bankingsolutions have also been deployed by an offshore bank in Cayman Islands, and one of the largest banks in Asia, headquartered in India, has licensed Finacle®
solutions to power its international operations across 21 countries.
As always, your company continues to strengthen its relationship with existing clients. A substantial 98.5% of business this quarter was repeat business.
Your company’s strong growth has been made possible through the continued effort and dedication of all Infoscions. On your behalf, we thank them forcontributing to yet another successful quarter.
Nandan M. Nilekani S. GopalakrishnanBangalore Chief Executive Officer, President Chief Operating Officer
July 13, 2004 and Managing Director and Deputy Managing Director

4
Auditors’ report to the members of Infosys Technologies Limited
We have audited the attached Balance Sheet of Infosys Technologies Limited (the Company) as at June 30, 2004, the Profit and Loss Account and Cash FlowStatement of the Company for the quarter ended on that date, annexed thereto. These financial statements are the responsibility of the Company’s management.Our responsibility is to express an opinion on these financial statements based on our audit.
We conducted our audit in accordance with auditing standards generally accepted in India. Those Standards require that we plan and perform the audit to obtainreasonable assurance about whether the financial statements are free of material misstatement. An audit includes examining, on a test basis, evidence supportingthe amounts and disclosures in the financial statements. An audit also includes assessing the accounting principles used and significant estimates made bymanagement, as well as evaluating the overall financial statement presentation. We believe that our audit provides a reasonable basis for our opinion.
We report that:
(a) we have obtained all the information and explanations which to the best of our knowledge and belief were necessary for the purposes of our audit;
(b) in our opinion, proper books of account have been kept by the Company so far as appears from our examination of those books;
(c) the Balance Sheet, the Profit and Loss Account and the Cash Flow Statement dealt with by this report are in agreement with the books of account;
(d) in our opinion, the Balance Sheet, the Profit and Loss Account and the Cash Flow Statement dealt with by this report comply with the Accounting Standardsissued by the Institute of Chartered Accountants of India, to the extent applicable; and
(e) in our opinion and to the best of our information and according to the explanations given to us, the said accounts give a true and fair view in conformity withthe accounting principles generally accepted in India:
(i) in the case of the Balance Sheet, of the state of affairs of the Company as at June 30, 2004;
(ii) in the case of the Profit and Loss Account, of the profit of the Company for the quarter ended on that date; and
(iii) in the case of the Cash Flow Statement, of the cash flows of the Company for the quarter ended on that date.
for Bharat S. Raut & Co.Chartered Accountants
Subramanian SureshPartner
Membership No. 83673
BangaloreJuly 13, 2004

5
Balance sheet as at
in Rs. crore
June 30, 2004 June 30, 2003 March 31, 2004SOURCES OF FUNDSSHAREHOLDERS’ FUNDSShare capital 33.43 33.12 33.32Reserves and surplus 3,695.78 3,106.71 3,220.11
3,729.21 3,139.83 3,253.43APPLICATION OF FUNDSFIXED ASSETSOriginal cost 1,635.70 1,363.55 1,570.23Less: Depreciation and amortization 852.01 621.03 803.41Net book value 783.69 742.52 766.82Add: Capital work-in-progress 283.07 44.23 203.48
1,066.76 786.75 970.30INVESTMENTS 931.58 127.38 1,027.38DEFERRED TAX ASSETS 36.01 38.34 35.63CURRENT ASSETS, LOANS AND ADVANCESSundry debtors 818.98 557.30 632.51Cash and bank balances 1,023.48 1,373.51 1,638.01Loans and advances 710.98 806.17 693.22
2,553.44 2,736.98 2,963.74LESS: CURRENT LIABILITIES AND PROVISIONSCurrent liabilities 484.48 354.08 560.44Provisions 374.10 195.54 1,183.18NET CURRENT ASSETS 1,694.86 2,187.36 1,220.12
3,729.21 3,139.83 3,253.43
As per our report attached.
for Bharat S. Raut & Co.Chartered Accountants
Subramanian Suresh N. R. Narayana Murthy Nandan M. Nilekani S. Gopalakrishnan Deepak M. SatwalekarPartner Chairman and Chief Mentor Chief Executive Officer, Chief Operating Officer Director
Membership No. 83673 President and Managing Director and Deputy Managing Director
Marti G. Subrahmanyam Omkar Goswami Larry Pressler Rama BijapurkarDirector Director Director Director
Claude Smadja Sridar A. Iyengar K. Dinesh S. D. ShibulalDirector Director Director Director
T. V. Mohandas Pai Srinath Batni V. BalakrishnanBangalore Director and Director Company Secretary andJuly 13, 2004 Chief Financial Officer Senior Vice President – Finance

6
Profit and loss account for the
in Rs. crore, except per share data
Quarter ended Year endedJune 30, 2004 June 30, 2003 March 31, 2004
INCOMESOFTWARE SERVICES AND PRODUCTS
Overseas 1,447.42 1,058.65 4,694.69Domestic 23.97 23.33 66.20
1,471.39 1,081.98 4,760.89SOFTWARE DEVELOPMENT EXPENSES 791.91 572.78 2,495.31GROSS PROFIT 679.48 509.20 2,265.58SELLING AND MARKETING EXPENSES 87.39 79.72 335.08GENERAL AND ADMINISTRATION EXPENSES 101.24 81.18 346.85
188.63 160.90 681.93OPERATING PROFIT BEFORE INTEREST, DEPRECIATION AND AMORTIZATION 490.85 348.30 1,583.65INTEREST – – –DEPRECIATION AND AMORTIZATION 49.38 44.26 230.90OPERATING PROFIT AFTER INTEREST, DEPRECIATION AND AMORTIZATION 441.47 304.04 1,352.75OTHER INCOME 17.99 32.44 127.39PROVISION FOR INVESTMENTS (0.01) 6.36 9.67NET PROFIT BEFORE TAX 459.47 330.12 1,470.47PROVISION FOR TAXATION 65.00 52.00 227.00
NET PROFIT AFTER TAX 394.47 278.12 1,243.47Balance brought forward 70.51 – –Less: Residual dividend paid for Fiscal 2004 2.32 – –
Dividend tax on the above 0.30 – –
67.89 – –AMOUNT AVAILABLE FOR APPROPRIATION 462.36 278.12 1,243.47DIVIDEND
Interim – – 96.09Final – – 99.96One-time special dividend – – 666.41
Total dividend – – 862.46Dividend tax – – 110.50Amount transferred - general reserve – – 200.00Balance in Profit and Loss account 462.36 278.12 70.51
462.36 278.12 1,243.47EARNINGS PER SHAREEquity shares of par value Rs. 5/- each
Basic 14.77 10.50 46.84Diluted 14.51 10.46 46.26
Number of shares used in computing earnings per shareBasic 26,71,36,028 26,49,80,696 26,54,47,776Diluted 27,18,51,267 26,59,17,468 26,87,87,016
As per our report attached.
for Bharat S. Raut & Co.Chartered Accountants
Subramanian Suresh N. R. Narayana Murthy Nandan M. Nilekani S. Gopalakrishnan Deepak M. SatwalekarPartner Chairman and Chief Mentor Chief Executive Officer, Chief Operating Officer Director
Membership No. 83673 President and Managing Director and Deputy Managing Director
Marti G. Subrahmanyam Omkar Goswami Larry Pressler Rama BijapurkarDirector Director Director Director
Claude Smadja Sridar A. Iyengar K. Dinesh S. D. ShibulalDirector Director Director Director
T. V. Mohandas Pai Srinath Batni V. BalakrishnanBangalore Director and Director Company Secretary andJuly 13, 2004 Chief Financial Officer Senior Vice President – Finance

7
Cash flow statement for the
in Rs. crore
Quarter ended Year endedJune 30, 2004 June 30, 2003 March 31, 2004
CASH FLOWS FROM OPERATING ACTIVITIESNet profit before tax 459.47 330.12 1,470.47Adjustments to reconcile net profit before tax to cash provided by operating activities
(Profit) / Loss on sale of fixed assets (0.07) (0.01) (0.04)Depreciation and amortization 49.38 44.26 230.90Interest and dividend income (28.27) (22.75) (100.28)Provisions for investments (0.01) 6.36 9.67Effect of exchange differences on translation of foreign currency cash and cash equivalents (13.57) 3.28 6.59
Changes in current assets and liabilitiesSundry debtors (186.47) (45.16) (120.37)Loans and advances (26.95) (9.85) (1.34)Current liabilities and provisions (68.75) 39.01 245.50Income taxes paid during the period / year (7.95) (11.06) (107.13)
NET CASH GENERATED BY OPERATING ACTIVITIES 176.81 334.20 1,633.97CASH FLOWS FROM INVESTING ACTIVITIESPurchase of fixed assets and change in capital work-in-progress (145.84) (58.38) (429.87)Proceeds on disposal of fixed assets 0.07 0.10 1.43(Investments) / disposal in securities 95.81 (100.54) (1,003.85)Interest and dividend income 28.27 22.75 100.28
NET CASH USED IN INVESTING ACTIVITIES (21.69) (136.07) (1,332.01)CASH FLOWS FROM FINANCING ACTIVITIESProceeds from issuance of share capital on exercise of stock options 83.93 1.06 122.27Dividends paid during the period / year, including dividend tax (867.18) (108.35) (216.75)
NET CASH USED IN FINANCING ACTIVITIES (783.25) (107.29) (94.48)Effect of exchange differences on translation of foreign currency cash and cash equivalents 13.57 (3.28) (6.59)NET (DECREASE) / INCREASE IN CASH AND CASH EQUIVALENTS (614.56) 87.56 200.89CASH AND CASH EQUIVALENTS AT THE BEGINNING OF THE PERIOD / YEAR 1,839.40 1,638.51 1,638.51
CASH AND CASH EQUIVALENTS AT THE END OF THE PERIOD / YEAR 1,224.84 1,726.07 1,839.40
As per our report attached.
for Bharat S. Raut & Co.Chartered Accountants
Subramanian Suresh N. R. Narayana Murthy Nandan M. Nilekani S. Gopalakrishnan Deepak M. SatwalekarPartner Chairman and Chief Mentor Chief Executive Officer, Chief Operating Officer Director
Membership No. 83673 President and Managing Director and Deputy Managing Director
Marti G. Subrahmanyam Omkar Goswami Larry Pressler Rama BijapurkarDirector Director Director Director
Claude Smadja Sridar A. Iyengar K. Dinesh S. D. ShibulalDirector Director Director Director
T. V. Mohandas Pai Srinath Batni V. BalakrishnanBangalore Director and Director Company Secretary andJuly 13, 2004 Chief Financial Officer Senior Vice President – Finance

8
Schedules to the profit and loss account for the
in Rs. crore
Quarter ended Year endedJune 30, 2004 June 30, 2003 March 31, 2004
SOFTWARE DEVELOPMENT EXPENSES
Salaries and bonus including overseas staff expenses 597.34 454.78 2,015.47Staff welfare 3.35 3.13 13.17Contribution to provident and other funds 15.76 10.75 49.90Overseas travel expenses 56.38 41.61 168.19Consumables 2.35 1.72 8.94Cost of software packages
for own use 20.58 13.60 64.84for service delivery to clients 3.51 9.86 16.04
Consultancy charges 72.95 26.68 109.89Computer maintenance 2.84 2.30 11.89Communication expenses 8.81 8.18 32.18Provision for post-sales client support and warranties 7.22 0.17 0.30Rent 0.82 – 4.50
791.91 572.78 2,495.31SELLING AND MARKETING EXPENSESSalaries and bonus including overseas staff expenses 52.70 49.84 207.25Staff welfare 0.12 0.08 0.59Contribution to provident and other funds 0.37 0.38 1.73Overseas travel expenses 12.77 8.78 40.45Consumables 0.06 0.06 0.19Cost of software packages
for own use – 0.01 0.18Computer maintenance – 0.01 0.02Communication expenses 0.01 – 0.01Traveling and conveyance 0.44 0.32 1.43Rent 3.00 2.96 15.19Telephone charges 1.08 1.10 5.06Professional charges 2.84 1.96 5.75Printing and stationery 0.23 0.27 0.99Advertisements 0.14 0.12 0.53Brand building 5.59 5.72 34.23Office maintenance 0.07 0.04 0.24Power and fuel – 0.02 0.04Insurance charges 0.03 0.03 0.11Rates and taxes 0.03 0.03 0.08Bank charges and commission – 0.01 0.02Commission charges 4.17 2.27 7.27Marketing expenses 3.52 0.85 5.99Sales promotion expenses 0.22 0.11 0.69Miscellaneous expenses – 4.75 7.04
87.39 79.72 335.08GENERAL AND ADMINISTRATION EXPENSESSalaries and bonus including overseas staff expenses 20.06 16.90 73.11Contribution to provident and other funds 1.57 1.14 4.64Overseas travel expenses 2.05 1.70 6.36Traveling and conveyance 7.97 4.33 22.27Rent 4.02 7.11 19.19Telephone charges 8.64 7.29 29.21Professional charges 9.09 6.49 33.92Printing and stationery 1.29 2.34 5.87Advertisements 2.09 0.99 5.50Office maintenance 8.27 6.23 28.83Repairs to building 1.32 1.90 10.28Repairs to plant and machinery 1.57 1.09 4.85Power and fuel 8.85 7.20 28.68Insurance charges 7.12 5.13 23.73Rates and taxes 2.29 1.21 5.38Donations 4.22 3.50 14.29Auditor’s remuneration
statutory audit fees 0.09 0.07 0.31certification charges – – 0.03others – – 0.24out-of-pocket expenses 0.01 0.01 0.02
Provision for bad and doubtful debts 6.33 3.29 15.99Provision for doubtful loans and advances 0.02 0.01 0.14Bank charges and commission 0.24 0.19 0.73Commission to non-whole time directors 0.39 0.39 1.49Postage and courier 1.37 1.24 3.91Books and periodicals 0.58 0.24 1.51Research grants 0.10 0.06 0.54Freight charges 0.23 0.15 0.84Professional membership and seminar participation fees 1.45 0.62 3.57Miscellaneous expenses 0.01 0.36 1.42
101.24 81.18 346.85

9
Schedules to the statement of cash flows for the
in Rs. crore
Quarter ended Year endedJune 30, 2004 June 30, 2003 March 31, 2004
CHANGE IN LOANS AND ADVANCESAs per the Balance Sheet 710.98 806.17 693.22Less: Deposits with financial institutions and body corporate,
included in cash and cash equivalents (201.36) (352.56) (201.39)Advance income taxes separately considered (200.82) (163.25) (209.98)
308.80 290.36 281.85Less: Opening balance considered (281.85) (280.51) (280.51)
26.95 9.85 1.34CHANGE IN CURRENT LIABILITIES AND PROVISIONSAs per the Balance Sheet 858.58 549.62 1,743.62Add / (Less): Provisions separately considered in the cash flow Statement
Income taxes (361.76) (190.54) (313.49)Dividends – – (766.37)Dividend tax – – (98.19)
496.82 359.08 565.57Less: Opening balance considered (565.57) (320.07) (320.07)
(68.75) 39.01 245.50INCOME TAXES PAIDCharge as per the Profit and Loss Account 65.00 52.00 227.00Add: Increase in advance income taxes (9.16) (126.74) (80.01)
Increase / (Decrease) in deferred taxes 0.38 1.53 (1.18)Less: (Increase) / Decrease in income tax provision (48.27) 84.27 (38.68)
7.95 11.06 107.13PURCHASE OF FIXED ASSETS AND CHANGE IN CAPITAL WORK-IN-PROGRESSAs per the Balance Sheet 66.25 90.71 302.95Less: Opening Capital work-in-progress (203.48) (76.56) (76.56)Add: Closing Capital work-in-progress 283.07 44.23 203.48
145.84 58.38 429.87INVESTMENTS/ DISPOSAL IN SECURITIESAs per the Balance Sheet 931.58 127.38 1,027.38Add: Provisions on investments (0.01) 6.36 9.67
931.57 133.74 1,037.05Less: Opening balance considered (1,027.38) (33.20) (33.20)
(95.81) 100.54 1,003.85
CASH AND CASH EQUIVALENTS AT THE END OF THE YEARAs per the Balance Sheet 1,023.48 1,373.51 1,638.01Add: Deposits with financial institutions and body corporate, included herein 201.36 352.56 201.39
1,224.84 1,726.07 1,839.40

10
1. Extracts of significant accounting policies and notes on accounts
Company overviewInfosys Technologies Limited (Infosys or the company) along with its majority owned and controlled subsidiary, Progeon Limited, India (Progeon), and whollyowned subsidiaries Infosys Technologies (Australia) Pty. Limited (Infosys Australia), Infosys Technologies (Shanghai) Co. Limited (Infosys China) and InfosysConsulting, Inc., USA (Infosys Consulting) is a leading global information technology services company. The Company provides end-to-end business solutionsthat leverage technology thus enabling its clients to enhance business performance. The Company provides solutions that span the entire software life cycleencompassing consulting, design, development, re-engineering, maintenance, systems integration and package evaluation and implementation. In addition, theCompany offers software products for the banking industry and business process management services.
1.1 Significant accounting policies
1.1.1. Basis of preparation of financial statements
The accompanying financial statements are prepared in accordance with Indian Generally Accepted Accounting Principles (“GAAP”) under the historical costconvention on the accruals basis. GAAP comprises mandatory accounting standards issued by the Institute of Chartered Accountants of India (“ICAI”), theprovisions of the Companies Act, 1956 and guidelines issued by the Securities and Exchange Board of India. Accounting policies have been consistently appliedexcept where a newly issued accounting standard is initially adopted or a revision to an existing accounting standard requires a change in the accounting policyhitherto in use.Management evaluates all recently issued or revised accounting standards on an ongoing basis. There are no accounting standards that although not mandatoryfor adoption as of the balance sheet date, have material impact on the financial statements.
1.1.2 Change in accounting policy
The accounting standard on “The effect of changes in foreign exchange rates” was revised with effect from April 1, 2004 and prescribes accounting for forwardexchange contracts based on whether these are entered into for hedging purposes or for trading /speculation purposes. Further, it has been recently clarified thatthe revised standard does not cover forward exchange contracts entered in to hedge the foreign currency risk of a firm commitment or a highly probable forecasttransaction. Up to March 31, 2004, such segregation was not required and the difference between the forward rate and the exchange rate on the date of thetransaction was recognized as income or expense over the life of the contract.
The Company has adopted the revised accounting standard effective April 1, 2004 to the extent applicable in respect of outstanding forward exchange contracts.
The forward exchange contracts constitute hedges from an economic perspective, and the Company has decided to account for these forward exchange contractsbased on their designation as ‘effective hedges’ or ‘not effective’. To designate a forward contract as an effective hedge, management objectively evaluates and evidenceswith appropriate supporting documentation at the inception of each forward contract, whether these forward contracts are effective in achieving offsetting cash flowsattributable to the hedged risk or not. The gain or loss on effective hedges is recorded in the foreign currency fluctuation reserve until the hedged transactionsoccur and are then recognized in the profit and loss account. In the absence of an effective hedge, the gain or loss is recognized in the profit and loss account.
Gains and losses on forward exchange contracts are computed by multiplying the foreign currency amount of the forward exchange contract by the differencebetween the forward rate available at the reporting date for the remaining maturity of the contract and the contracted forward rate (or the forward rate last usedto measure a gain or loss on that contract for an earlier period). The Company also assesses on an ongoing basis at the end of each reporting period whetherdesignated hedges are effective and prospectively reclassifies the hedge as necessary.
Consequent to the change in the accounting policy, the charge to the profit and loss account for the quarter ended June 30, 2004 is higher by Rs. 32.41 crore.
1.2 Notes on accountsAll amounts in the financial statements are presented in Rupees crore, except for per share data and as otherwise stated. All exact amounts are stated with thesuffix “/-”. One crore equals 10 million.
The previous period’s / year’s figures have been regrouped / reclassified, wherever necessary to conform to the current period’s presentation.
1.2.1 Aggregate expensesThe following are the aggregate amounts incurred on certain specific expenses that are required to be disclosed under Schedule VI to the Companies Act, 1956.
Quarter ended Year endedJune 30, 2004 June 30, 2003 March 31, 2004
Salaries and bonus including overseas staff expenses 670.10 521.52 2,295.83Contribution to provident and other funds 17.70 12.27 56.27Staff welfare 3.47 3.21 13.76Overseas travel expenses 71.20 52.09 215.00Consumables 2.41 1.78 9.13Cost of software packages – – –
for own use 20.58 13.61 65.02for service delivery to clients 3.51 9.86 16.04
Computer maintenance 2.84 2.31 11.91Communication expenses 8.82 8.18 32.19Consultancy charges 72.95 26.68 109.89Provision for post-sales client support 7.22 0.17 0.30Traveling and conveyance 8.41 4.65 23.70Rent 7.84 10.07 38.88Telephone charges 9.72 8.39 34.27Professional charges 11.93 8.45 39.67Printing and stationery 1.52 2.61 6.86Advertisements 2.23 1.11 6.03Office maintenance 8.34 6.27 29.07
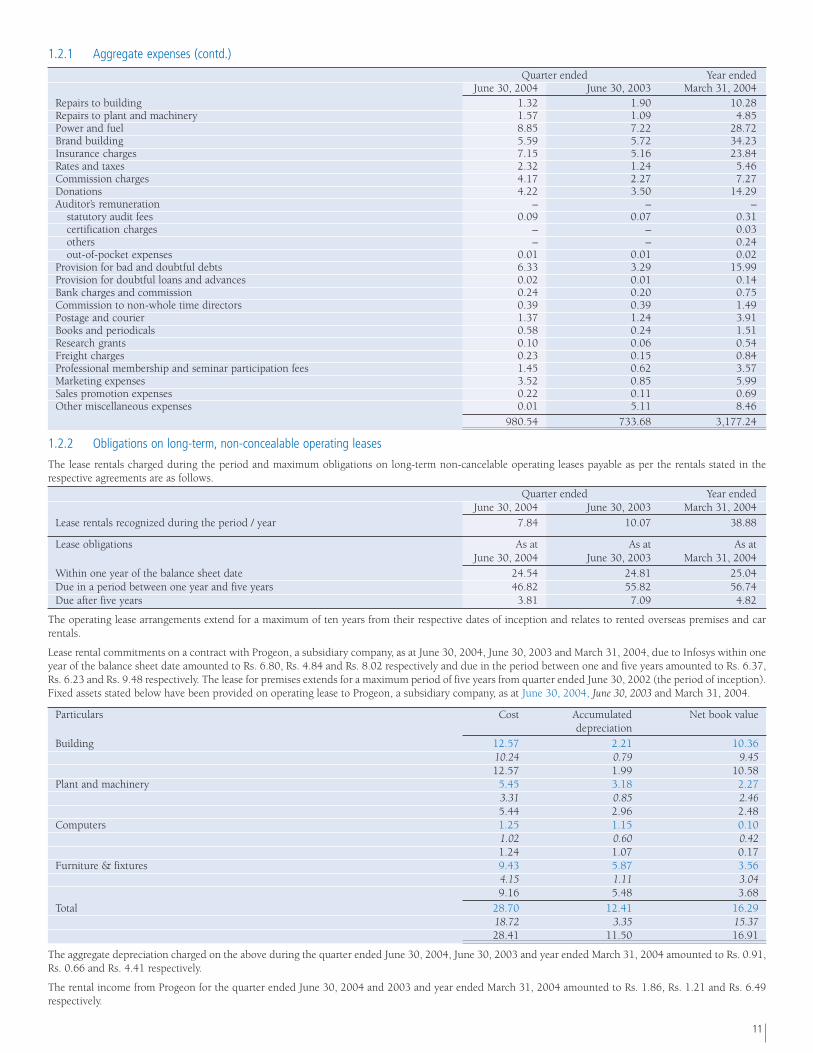
11
1.2.1 Aggregate expenses (contd.)
Quarter ended Year endedJune 30, 2004 June 30, 2003 March 31, 2004
Repairs to building 1.32 1.90 10.28Repairs to plant and machinery 1.57 1.09 4.85Power and fuel 8.85 7.22 28.72Brand building 5.59 5.72 34.23Insurance charges 7.15 5.16 23.84Rates and taxes 2.32 1.24 5.46Commission charges 4.17 2.27 7.27Donations 4.22 3.50 14.29Auditor’s remuneration – – –
statutory audit fees 0.09 0.07 0.31certification charges – – 0.03others – – 0.24out-of-pocket expenses 0.01 0.01 0.02
Provision for bad and doubtful debts 6.33 3.29 15.99Provision for doubtful loans and advances 0.02 0.01 0.14Bank charges and commission 0.24 0.20 0.75Commission to non-whole time directors 0.39 0.39 1.49Postage and courier 1.37 1.24 3.91Books and periodicals 0.58 0.24 1.51Research grants 0.10 0.06 0.54Freight charges 0.23 0.15 0.84Professional membership and seminar participation fees 1.45 0.62 3.57Marketing expenses 3.52 0.85 5.99Sales promotion expenses 0.22 0.11 0.69Other miscellaneous expenses 0.01 5.11 8.46
980.54 733.68 3,177.24
1.2.2 Obligations on long-term, non-concealable operating leases
The lease rentals charged during the period and maximum obligations on long-term non-cancelable operating leases payable as per the rentals stated in therespective agreements are as follows.
Quarter ended Year endedJune 30, 2004 June 30, 2003 March 31, 2004
Lease rentals recognized during the period / year 7.84 10.07 38.88
Lease obligations As at As at As atJune 30, 2004 June 30, 2003 March 31, 2004
Within one year of the balance sheet date 24.54 24.81 25.04Due in a period between one year and five years 46.82 55.82 56.74Due after five years 3.81 7.09 4.82
The operating lease arrangements extend for a maximum of ten years from their respective dates of inception and relates to rented overseas premises and carrentals.
Lease rental commitments on a contract with Progeon, a subsidiary company, as at June 30, 2004, June 30, 2003 and March 31, 2004, due to Infosys within oneyear of the balance sheet date amounted to Rs. 6.80, Rs. 4.84 and Rs. 8.02 respectively and due in the period between one and five years amounted to Rs. 6.37,Rs. 6.23 and Rs. 9.48 respectively. The lease for premises extends for a maximum period of five years from quarter ended June 30, 2002 (the period of inception).Fixed assets stated below have been provided on operating lease to Progeon, a subsidiary company, as at June 30, 2004, June 30, 2003 and March 31, 2004.
Particulars Cost Accumulated Net book valuedepreciation
Building 12.57 2.21 10.3610.24 0.79 9.4512.57 1.99 10.58
Plant and machinery 5.45 3.18 2.273.31 0.85 2.465.44 2.96 2.48
Computers 1.25 1.15 0.101.02 0.60 0.421.24 1.07 0.17
Furniture & fixtures 9.43 5.87 3.564.15 1.11 3.049.16 5.48 3.68
Total 28.70 12.41 16.2918.72 3.35 15.3728.41 11.50 16.91
The aggregate depreciation charged on the above during the quarter ended June 30, 2004, June 30, 2003 and year ended March 31, 2004 amounted to Rs. 0.91,Rs. 0.66 and Rs. 4.41 respectively.
The rental income from Progeon for the quarter ended June 30, 2004 and 2003 and year ended March 31, 2004 amounted to Rs. 1.86, Rs. 1.21 and Rs. 6.49respectively.

12
1.2.3 Related party transactionsThe company entered into related party transactions with Progeon, a subsidiary company. The transactions in addition to the lease commitments described innote 1.2.2 are set out below.
Particulars Quarter ended Year endedJune 30, 2004 June 30, 2003 March 31, 2004
Capital transactions:Financing transactions - amount paid to Progeon for issue of nil (nil; 1,22,50,000) fully paid equity shares of Rs. 10/- each at par – – 12.25Rental deposit – – 1.61
Revenue transactions:Purchase of services 0.12 0.14 0.70Sale of services
Business consulting services 0.04 – 0.12Shared services including facilities and personnel 3.80 3.01 12.70
3.84 3.01 12.82
The company entered into related party transactions with Infosys Australia, a subsidiary company. The transactions are set out below.
Particulars Quarter ended Year endedJune 30, 2004 June 30, 2003 March 31, 2004
Capital transactions:Purchase of fixed assets – – 3.50Transfer of advances – – 2.33
Revenue transactions:Purchase of services 59.36 – 47.20Sale of services
Software services & products-overseas 0.12 – 2.93Shared services including facilities and personnel – – -
0.12 – 2.93
The company entered into related party transactions with Infosys Shanghai, a subsidiary company. The transactions are set out below.
Particulars Quarter ended Year endedJune 30, 2004 June 30, 2003 March 31, 2004
Capital transactions:Financing transactions - amount remitted towards capital – – 4.55
Revenue transactions:Purchase of services – – –Sale of services
Software services & products-overseas – – –Shared services including facilities and personnel – – –
– – –
The company entered into related party transactions with Infosys Consulting, a subsidiary company. The transactions are set out below.
Particulars Quarter ended Year endedJune 30, 2004 June 30, 2003 March 31, 2004
Capital transactions:Financing transactions - amount paid to Infosys Consulting for issue of
50,00,000 (nil; nil) common stock of US$ 1.00 par value, fully paid 21.97 – –Revenue transactions:
Purchase of services – – –Sale of services
Software services & products-overseas – – –Shared services including facilities and personnel 0.08 – –
0.08 – –
Sundry Debtors includes dues from subsidiary companies, as given below.
Particulars Quarter ended Year endedJune 30, 2004 June 30, 2003 March 31, 2004
Capital transactions:Progeon Limited, India – – –Infosys Technologies (Shanghai) Company Limited, China – – –Infosys Technologies (Australia) Pty. Limited, Australia 0.13 – –Infosys Consulting, Inc., USA – – –
Sundry Creditors includes dues to subsidiary companies, as given below.
Particulars Quarter ended Year endedJune 30, 2004 June 30, 2003 March 31, 2004
Capital transactions:Progeon Limited, India 1.61 – 1.61Infosys Technologies (Shanghai) Company Limited, China – – –Infosys Technologies (Australia) Pty. Limited, Australia 16.46 – 11.34Infosys Consulting, Inc., USA – – –

13
Loans and Advances includes dues from subsidiary companies, as given below.
Particulars Quarter ended Year endedJune 30, 2004 June 30, 2003 March 31, 2004
Progeon Limited, India – – –Infosys Technologies (Shanghai) Company Limited, China 0.98 – 0.85Infosys Technologies (Australia) Pty. Limited, Australia – – –Infosys Consulting, Inc., USA – – –
The company has an alliance with Supplychainge Inc., USA to jointly market and deliver lead-time optimization solutions. Prof. Marti G. Subrahmanyam, anexternal director of the company, is also a director on the board of Supplychainge Inc. During the quarter ended June 30, 2004 and 2003 and year endedMarch 31, 2004, the company paid Rs. nil, Rs. 0.71 and Rs. 0.71 respectively to Supplychainge Inc. towards marketing services under this alliance. Additionally,amount receivable from Supplychainge Inc. as at June 30, 2004, June 30, 2003 and March 31, 2004 amounted to Rs. nil, Rs. 0.03 and Rs. nil respectively, anamount that has been outstanding for a period exceeding six months and fully provided.
During the quarter ended June 30, 2004, an amount of Rs. 4.00 has been donated to Infosys Foundation, a not-for-profit trust, in which certain directors of thecompany are trustees. Donation to the Foundation for the quarter ended June 30, 2003 and year ended March 31, 2004 were Rs. 3.50 and Rs. 12.00 respectively.
1.2.4 Transactions with key management personnel
Key management personnel comprise our directors and statutory officers.
Particulars of remuneration and other benefits provided to key management personnel during the quarters ended June 30, 2004 and 2003 and the year endedMarch 31, 2004 are set out below.
Salary Contribution to Perquisites Totalprovident and and incentives remuneration
other fundsExecutive directors
Quarter ended June 30, 2004 0.39 0.08 0.44 0.91Quarter ended June 30, 2003 0.29 0.06 0.32 0.67Year ended March 31, 2004 1.31 0.24 0.92 2.47
Commission Sitting fees Reimbursement of Totalexpenses remuneration
Independent directorsQuarter ended June 30, 2004 0.39 0.01 0.11 0.51Quarter ended June 30, 2003 0.31 0.01 0.11 0.43Year ended March 31, 2004 1.49 0.04 0.34 1.87
Other Senior Management Personnel
Salary Contribution Perquisites Total Total Outstandingto provident and remuneration loans granted loans and
and other funds incentives advancesOther Senior Management Personnel
Quarter ended June 30, 2004 0.03 0.01 0.11 0.15 – –Quarter ended June 30, 2003 0.03 0.01 0.06 0.10 – –Year ended March 31, 2004 0.12 0.04 0.22 0.38 – –
In addition, the details of the options granted to non-whole time directors and other senior officers during the quarters ended June 30, 2004 and 2003 and yearended March 31, 2004 are as follows.
Name Date of grant Option plan Number of Exercise price Expirationoptions granted (in Rs.) of options
Non-Whole time DirectorsSridar A. Iyengar April 10, 2003 1999 2,000 3,049.75 April 9, 2013
1.2.5 Pro forma disclosures relating to the Employee Stock Option Plans (“ESOPs”)
The Securities and Exchange Board of India (“SEBI”) issued the Employee Stock Option Scheme and Employee Stock Purchase Scheme Guidelines in 1999,which is applicable to all stock option schemes established on or after June 19, 1999. In accordance with these guidelines, the excess of the market price of theunderlying equity shares as of the date of the grant of the options over the exercise price of the options, including up-front payments, if any, is to be recognizedand amortized on a straight-line basis over the vesting period. All options under the 1998 and 1999 stock option plans have been issued at fair market value,hence there are no compensation costs.
The company’s 1994 stock option plan was established prior to the SEBI guidelines on stock options.
Had the stock compensation costs for this stock option plan been determined as per the guidelines issued by SEBI, the company’s reported net profit would havebeen reduced to the pro forma amounts indicated below.
Quarter ended Year endedJune 30, 2004 June 30, 2003 March 31, 2004
Net profit:As reported 394.47 278.12 1,243.47
Adjusted pro forma 394.47 273.09 1,230.57

14
1.2.6 Fixed assets
Profit / (loss) on disposal of fixed assets:
Quarter ended Year endedJune 30, 2004 June 30, 2003 March 31, 2004
Profit on disposal of fixed assets 0.07 0.01 0.04(Loss) on disposal of fixed assets – – –
Profit / (loss) on disposal of fixed assets, net 0.07 0.01 0.04
Depreciation charged to the profit and loss account relating to assets costing less than Rs. 5,000/- each
Quarter ended Year endedJune 30, 2004 June 30, 2003 March 31, 2004
Charged during the period / year 0.89 1.64 28.61
The company has entered into lease-cum-sale agreements to acquire certain properties. In accordance with the terms of these agreements, the company has theoption to purchase the properties on expiry of the lease period. The company has already paid 99% of the value of the properties at the time of entering into thelease-cum-sale agreements. These amounts are disclosed as “Land - leasehold” under “Fixed assets” in the financial statements. Additionally, certain land has beenpurchased for which the company has possession certificate for which sale deeds are yet to be executed as at June 30, 2004.
During the year ended March 31, 2004, management reduced the remaining estimated useful life of the intellectual property in a commercial software applicationproduct to three months, effective August 2003 and treasury management product to two months, effective November 2003. The revised estimation representsmanagement’s present evaluation of the expected future commercial benefits from these products. The revision has resulted in an increased charge to the profitand loss account of Rs. 20.28 during the year ended March 31, 2004.
1.2.7 Investment activity
Details of investments in and disposal of securities during the quarter ended June 30, 2004 and 2003 and year ended March 31, 2004:
Quarter ended Year endedJune 30, 2004 June 30, 2003 March 31, 2004
Investment in securitiesSubsidiaries 21.97 – 83.49Long-term investments – 0.54 0.54Liquid mutual funds – 100.00 930.03
21.97 100.54 1,014.06Redemption / Disposal of investment in securities
Subsidiaries – – –Long-term investments – – 10.21Liquid mutual funds 117.78 – –
117.78 – 10.21
Net movement in investments (95.81) 100.54 1,003.85
The following are the particulars of strategic investments made during the quarter ended June 30, 2004 and 2003 and during the year ended March 31, 2004:
Particulars of investee companies Quarter ended Year endedJune 30, 2004 June 30, 2003 March 31, 2004
Progeon Limited, India – – 12.25Infosys Technologies (Shanghai) Co. Limited, China – – 4.55Infosys Technologies (Australia) Pty. Limited, Australia – – 66.69Infosys Consulting, Inc., USA 21.97 – –M-Commerce Ventures Pte. Limited, Singapore * – 0.54 (0.07)
21.97 0.54 83.42
* Net of redemptions
Subsidiaries
On April 8, 2004, the Board approved the formation of a new wholly-owned subsidiary, Infosys Consulting, Inc., incorporated in Texas, USA (Infosys Consulting)to add business consulting capabilities to Infosys’ global delivery model. The Board approved an investment of up to US$ 20 million in Infosys Consulting. As ofJune 30, 2004, the company had invested US$ 5 million (Rs. 21.97) in the subsidiary.
On January 2, 2004, the company acquired 100% of equity in Expert Information Services Pty. Limited, Australia. The transaction value approximates Aus $ 32.0million (US $ 24.32 million or Rs. 110.90). The consideration comprises a payment in cash on conclusion, an earn-out on achieving financial conditions over athree year period ending March 31, 2007, and the release of the balance retained in escrow for representations and warranties made by the selling share holders.The acquired company has been renamed as Infosys Technologies (Australia) Pty. Limited. As of June 30, 2004, the company had invested Rs. 66.69 for1,01,08,869 equity shares of Aus $ 0.11 par value, fully paid.
On October 10, 2003, the company set up a wholly-owned subsidiary in the People's Republic of China named Infosys Technologies (Shanghai) Co. Limited. Thesubsidiary will be capitalized at US$ 5 million (Rs. 22.78). As of June 30, 2004, the company had invested US$ 1 million (Rs. 4.55) in the subsidiary.
Infosys holds 99.99% of the equity share capital of Progeon. The equity shares have been issued to Infosys as per the terms of the stock subscription agreementsigned in April 2002, between Infosys, Citicorp International Finance Corporation (“CIFC”) and Progeon. 1,22,49,993 equity shares have been issued to Infosysin April 2002 and 1,22,50,000 in March 2004 for an aggregate consideration of Rs. 24.50. Pursuant to the agreement, CIFC has been issued 43,75,000 0.0005%cumulative convertible preference shares each on June 30, 2002 and March 31, 2004 for an aggregate consideration of Rs. 93.80. The preference shares areconvertible to an equal number of equity shares based on certain events as agreed between the company and CIFC.

15
Other investments
During the year ended March 31, 2004, the Company invested Rs. 0.54 in M-Commerce Ventures Pte. Limited, Singapore (M-Commerce) for 20 ordinary sharesof face value Singapore $ (“S$”) 1/- each, fully paid at par and 180 redeemable preference shares of face value S$ 1/- each, fully paid for a premium of S$ 1,110.The company also received Rs. 0.61 towards return of premium of S$ 1,110/- each on 216 redeemable preference shares of face value of S$ 1/- each during theyear. Accordingly, the aggregate investment in M-Commerce as at March 31, 2004 amounts to Rs. 2.04.
During the year ended March 31, 2004, the company received from CiDRA Corporation, USA (CiDRA), an amount of Rs. 6.05 in cash; 72,539 Class A commonstock of par value US$ 0.001 each of CiDRA, 2,139 Non-voting redeemable preferred stock of par value US$ 0.01 each of CiDRA, 12,921, Series A preferred stockpar value $0.001 of CyVera Corporation, USA on a buy back offer. The company also received 12,720 Series A preferred stock par value $0.001 of CyVeraCorporation, USA, due to company's holding in CiDRA.
During the year ended March 31, 2004, Infosys received Rs. 3.22 from Workadia Inc. and Rs. 0.47 from Stratify Inc. towards recovery of the amounts invested.The remainder of the investment was written off during the year ended March 31, 2004.
1.2.8 Segment reporting
The company’s operations predominantly relate to providing IT services, delivered to customers globally operating in various industry segments. Accordingly, ITservice revenues represented along industry classes comprise the primary basis of segmental information set out in these financial statements. Secondary segmentalreporting is performed on the basis of the geographical location of customers.
The accounting principles consistently used in the preparation of the financial statements are also consistently applied to record income and expenditure inindividual segments. These are as set out in the note on significant accounting policies.
Industry segments at the company are primarily financial services comprising customers providing banking, finance and insurance services; manufacturingcompanies; companies in the telecommunications and the retail industries; and others such as utilities, transportation and logistics companies.
Income and direct expenses in relation to segments is categorized based on items that are individually identifiable to that segment, while the remainder of thecosts are categorized in relation to the associated turnover of the segment. Certain expenses such as depreciation, which form a significant component of totalexpenses, are not specifically allocable to specific segments as the underlying services are used interchangeably. The company believes that it is not practical toprovide segment disclosures relating to those costs and expenses, and accordingly these expenses are separately disclosed as “unallocated” and directly chargedagainst total income.
Fixed assets used in the company’s business or liabilities contracted have not been identified to any of the reportable segments, as the fixed assets and services areused interchangeably between segments. Accordingly, no disclosure relating to total segment assets and liabilities are made.
Customer relationships are driven based on the location of the respective client. North America comprises the United States of America, Canada and Mexico;Europe includes continental Europe (both the east and the west), Ireland and the United Kingdom; and the Rest of the World comprising all other places exceptthose mentioned above and India.
Geographical revenues are segregated based on the location of the customer who is invoiced or in relation to which the revenue is otherwise recognized.
Industry segmentsQuarter ended June 30, 2004, June 30, 2003 and year ended March 31, 2004:
Financial services Manufacturing Telecom Retail Others TotalRevenues 489.59 227.65 256.38 171.91 325.86 1,471.39
400.97 170.54 156.14 127.38 226.95 1,081.981,722.08 716.47 774.83 563.16 984.35 4,760.89
Identifiable operating expenses 207.90 104.72 133.33 60.61 134.69 641.25178.24 72.76 66.94 45.51 92.49 455.94728.69 311.01 317.93 210.29 413.33 1,981.25
Allocated expenses 112.90 52.49 59.12 39.64 75.14 339.29102.92 43.78 40.08 32.70 58.26 277.74433.73 180.08 193.52 141.58 247.08 1,195.99
Segmental operating income 168.79 70.44 63.93 71.66 116.03 490.85119.81 54.00 49.12 49.17 76.20 348.30559.66 225.38 263.38 211.29 323.94 1,583.65
Unallocable expenses 49.3844.26
230.90Operating income 441.47
304.041,352.75
Other income (expense), net 18.0026.08
117.72Net profit before taxes 459.47
330.121,470.47
Income taxes 65.0052.00
227.00Net profit after taxes 394.47
278.121,243.47

16
Geographic segments
Quarter ended June 30, 2004, June 30, 2003 and year ended March 31, 2004:
North America Europe India Rest of the world TotalRevenues 966.75 326.92 23.97 153.75 1,471.39
805.95 190.11 23.33 62.59 1,081.983,401.42 913.84 66.20 379.43 4,760.89
Identifiable operating expenses 411.10 126.84 4.79 98.52 641.25348.03 76.83 10.35 20.73 455.94
1,422.01 371.35 18.25 169.64 1,981.25Allocated expenses 222.93 75.38 5.53 35.45 339.29
206.89 48.80 5.99 16.06 277.74856.13 229.10 16.73 94.03 1,195.99
Segmental operating income 332.72 124.70 13.65 19.78 490.85251.03 64.48 6.99 25.80 348.30
1,123.28 313.39 31.22 115.76 1,583.65Unallocable expenses 49.38
44.26230.90
Operating income 441.47304.04
1,352.75Other income (expense), net 18.00
26.08117.72
Net profit before taxes 459.47330.12
1,470.47Income taxes 65.00
52.00227.00
Net profit after taxes 394.47278.12
1,243.47
1.2.9 Reconciliation of basic and diluted shares used in computing earnings per share
At the annual general meeting held on June 12, 2004, the shareholders approved the issue of bonus shares in the ratio of three bonus shares. The record date forthe bonus issue was July 2, 2004 and shares were allotted on July 3, 2004. All basic and diluted shares used in determining earnings per share are afterconsidering the effect of bonus issue.
Quarter ended Year endedJune 30, 2004 June 30, 2003 March 31, 2004
Number of shares considered as basic weighted average shares outstanding 26,71,36,028 26,49,80,696 26,54,47,776Add: Effect of dilutive issues of shares/stock options 47,15,239 9,36,772 33,39,240
Number of shares considered as weighted average shares and potential shares outstanding 27,18,51,267 26,59,17,468 26,87,87,016

17
Consolidated financial statements of Infosys Technologies Limited and its subsidiaries
Principles of consolidationThe financial statements are prepared in accordance with the principles and procedures for the preparation and presentation of consolidated financial statementsas laid down under the accounting standard on Consolidated Financial Statements issued by the ICAI. The financial statements of the parent company, Infosys,and its subsidiaries, Infosys Technologies (Australia) Pty. Ltd. (“Infosys Australia”), Infosys Technologies (Shanghai) Co. Limited (“Infosys China”), InfosysConsulting, Inc., USA (“Infosys Consulting”) and Progeon Limited (“Progeon”) have been combined on a line-by-line basis by adding together the book values oflike items of assets, liabilities, income and expenses after eliminating intra-group balances and transactions and resulting unrealized gains / losses. The consolidatedfinancial statements are prepared applying uniform accounting policies in use at Infosys and its subsidiaries.
Management’s statement on significant accounting policies contained in the audited financial statements.
The significant accounting policies of the company relate to revenue recognition, expenditure, fixed assets and capital work-in-progress, depreciation, retirementbenefits to employees-principally gratuity, superannuation and provident fund benefits, research and development, income tax, earning per share, foreigncurrency transactions and investments.
A complete set of the audited consolidated financial statements is available at www.infosys.com.
Auditors’ report to the board of directors on the consolidated financial statements ofInfosys Technologies Limited and its subsidiaries
We have audited the attached consolidated balance sheet of Infosys Technologies Limited (the Company) and its subsidiaries (collectively called ‘the InfosysGroup’) as at June 30, 2004, the consolidated profit and loss account and the consolidated cash flow statement for the quarter ended on that date, annexedthereto. These financial statements are the responsibility of the Company’s management. Our responsibility is to express an opinion on these financial statementsbased on our audit.
We conducted our audit in accordance with the auditing standards generally accepted in India. Those Standards require that we plan and perform the audit toobtain reasonable assurance about whether the financial statements are free of material misstatement. An audit includes examining, on a test basis, evidencesupporting the amounts and disclosures in the financial statements. An audit also includes assessing the accounting principles used and significant estimatesmade by management, as well as evaluating the overall financial statement presentation. We believe that our audit provides a reasonable basis for our opinion.
We report that the consolidated financial statements have been prepared by the Company’s management in accordance with the requirements of AccountingStandard (AS) 21, Consolidated Financial Statements, issued by the Institute of Chartered Accountants of India.
In our opinion and to the best of our information and according to the explanations given to us, the consolidated financial statements give a true and fair view inconformity with the accounting principles generally accepted in India:
(a) in the case of the consolidated balance sheet, of the state of affairs of the Infosys Group as at June 30, 2004;
(b) in the case of the consolidated profit and loss account, of the profit of the Infosys Group for the quarter ended on that date; and
(c) in the case of the consolidated cash flow statement, of the cash flows of the Infosys Group for the quarter ended on that date.
for Bharat S. Raut & Co.Chartered Accountants
Subramanian SureshBangalore Partner
July 13, 2004 Membership No. 83673
18
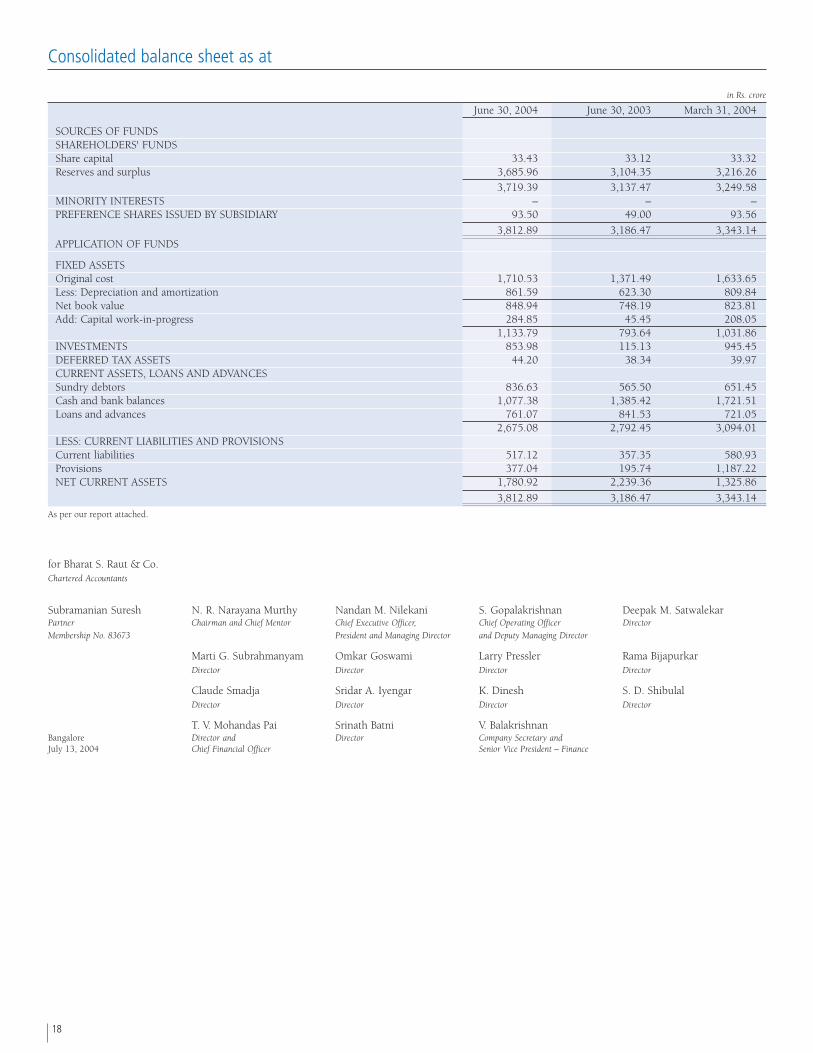
Consolidated balance sheet as at
in Rs. crore
June 30, 2004 June 30, 2003 March 31, 2004
SOURCES OF FUNDSSHAREHOLDERS' FUNDSShare capital 33.43 33.12 33.32Reserves and surplus 3,685.96 3,104.35 3,216.26
3,719.39 3,137.47 3,249.58MINORITY INTERESTS – – –PREFERENCE SHARES ISSUED BY SUBSIDIARY 93.50 49.00 93.56
3,812.89 3,186.47 3,343.14APPLICATION OF FUNDS
FIXED ASSETSOriginal cost 1,710.53 1,371.49 1,633.65Less: Depreciation and amortization 861.59 623.30 809.84Net book value 848.94 748.19 823.81Add: Capital work-in-progress 284.85 45.45 208.05
1,133.79 793.64 1,031.86INVESTMENTS 853.98 115.13 945.45DEFERRED TAX ASSETS 44.20 38.34 39.97CURRENT ASSETS, LOANS AND ADVANCESSundry debtors 836.63 565.50 651.45Cash and bank balances 1,077.38 1,385.42 1,721.51Loans and advances 761.07 841.53 721.05
2,675.08 2,792.45 3,094.01LESS: CURRENT LIABILITIES AND PROVISIONSCurrent liabilities 517.12 357.35 580.93Provisions 377.04 195.74 1,187.22NET CURRENT ASSETS 1,780.92 2,239.36 1,325.86
3,812.89 3,186.47 3,343.14
As per our report attached.
for Bharat S. Raut & Co.Chartered Accountants
Subramanian Suresh N. R. Narayana Murthy Nandan M. Nilekani S. Gopalakrishnan Deepak M. SatwalekarPartner Chairman and Chief Mentor Chief Executive Officer, Chief Operating Officer Director
Membership No. 83673 President and Managing Director and Deputy Managing Director
Marti G. Subrahmanyam Omkar Goswami Larry Pressler Rama BijapurkarDirector Director Director Director
Claude Smadja Sridar A. Iyengar K. Dinesh S. D. ShibulalDirector Director Director Director
T. V. Mohandas Pai Srinath Batni V. BalakrishnanBangalore Director and Director Company Secretary andJuly 13, 2004 Chief Financial Officer Senior Vice President – Finance
19
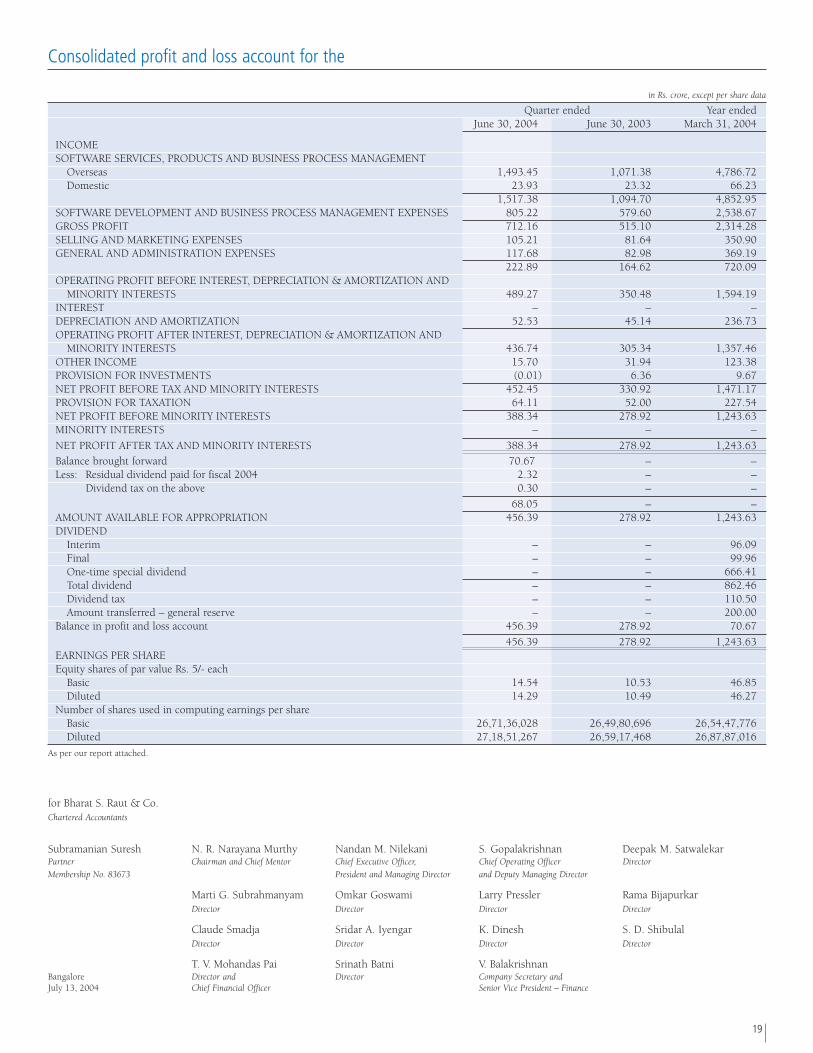
Consolidated profit and loss account for the
in Rs. crore, except per share data
Quarter ended Year endedJune 30, 2004 June 30, 2003 March 31, 2004
INCOMESOFTWARE SERVICES, PRODUCTS AND BUSINESS PROCESS MANAGEMENT
Overseas 1,493.45 1,071.38 4,786.72Domestic 23.93 23.32 66.23
1,517.38 1,094.70 4,852.95SOFTWARE DEVELOPMENT AND BUSINESS PROCESS MANAGEMENT EXPENSES 805.22 579.60 2,538.67GROSS PROFIT 712.16 515.10 2,314.28SELLING AND MARKETING EXPENSES 105.21 81.64 350.90GENERAL AND ADMINISTRATION EXPENSES 117.68 82.98 369.19
222.89 164.62 720.09OPERATING PROFIT BEFORE INTEREST, DEPRECIATION & AMORTIZATION AND
MINORITY INTERESTS 489.27 350.48 1,594.19INTEREST – – –DEPRECIATION AND AMORTIZATION 52.53 45.14 236.73OPERATING PROFIT AFTER INTEREST, DEPRECIATION & AMORTIZATION AND
MINORITY INTERESTS 436.74 305.34 1,357.46OTHER INCOME 15.70 31.94 123.38PROVISION FOR INVESTMENTS (0.01) 6.36 9.67NET PROFIT BEFORE TAX AND MINORITY INTERESTS 452.45 330.92 1,471.17PROVISION FOR TAXATION 64.11 52.00 227.54NET PROFIT BEFORE MINORITY INTERESTS 388.34 278.92 1,243.63MINORITY INTERESTS – – –
NET PROFIT AFTER TAX AND MINORITY INTERESTS 388.34 278.92 1,243.63Balance brought forward 70.67 – –Less: Residual dividend paid for fiscal 2004 2.32 – –
Dividend tax on the above 0.30 – –
68.05 – –AMOUNT AVAILABLE FOR APPROPRIATION 456.39 278.92 1,243.63DIVIDEND
Interim – – 96.09Final – – 99.96One-time special dividend – – 666.41Total dividend – – 862.46Dividend tax – – 110.50Amount transferred – general reserve – – 200.00
Balance in profit and loss account 456.39 278.92 70.67
456.39 278.92 1,243.63EARNINGS PER SHAREEquity shares of par value Rs. 5/- each
Basic 14.54 10.53 46.85Diluted 14.29 10.49 46.27
Number of shares used in computing earnings per shareBasic 26,71,36,028 26,49,80,696 26,54,47,776Diluted 27,18,51,267 26,59,17,468 26,87,87,016
As per our report attached.
for Bharat S. Raut & Co.Chartered Accountants
Subramanian Suresh N. R. Narayana Murthy Nandan M. Nilekani S. Gopalakrishnan Deepak M. SatwalekarPartner Chairman and Chief Mentor Chief Executive Officer, Chief Operating Officer Director
Membership No. 83673 President and Managing Director and Deputy Managing Director
Marti G. Subrahmanyam Omkar Goswami Larry Pressler Rama BijapurkarDirector Director Director Director
Claude Smadja Sridar A. Iyengar K. Dinesh S. D. ShibulalDirector Director Director Director
T. V. Mohandas Pai Srinath Batni V. BalakrishnanBangalore Director and Director Company Secretary andJuly 13, 2004 Chief Financial Officer Senior Vice President – Finance

20
Consolidated cash flow statement for the
in Rs. crore
Quarter ended Year endedJune 30, 2004 June 30, 2003 March 31, 2004
CASH FLOWS FROM OPERATING ACTIVITIESNet profit before tax 452.45 330.92 1,471.17
Adjustments to reconcile net profit before tax to cash provided by operating activities(Profit) / Loss on sale of fixed assets (0.07) (0.01) 0.41Depreciation and amortization 52.53 45.14 236.73Interest and dividend income (29.36) (23.30) (102.23)Provisions for investments (0.01) 6.36 9.67Effect of exchange differences on translation of foreign currency cash and cash equivalents (12.99) 3.20 4.91
Changes in current assets and liabilitiesSundry debtors (185.18) (46.85) (132.80)Loans and advances (34.62) (9.47) (17.67)Current liabilities and provisions (56.43) 37.90 262.20Income taxes paid during the period / year (12.05) (11.18) (108.60)
NET CASH GENERATED BY OPERATING ACTIVITIES 174.27 332.71 1,623.79CASH FLOWS FROM INVESTING ACTIVITIESPurchases of fixed assets and change in capital work-in-progress (154.46) (61.13) (425.86)Acquisition of Expert Information Systems Pty. Limited, Australia – – (66.68)Proceeds on disposal of fixed assets 0.07 0.25 1.43(Investments) / disposal in securities 91.48 (100.54) (934.17)Interest and dividend income 29.36 23.30 102.23
NET CASH USED IN INVESTING ACTIVITIES (33.55) (138.12) (1,323.05)CASH FLOWS FROM FINANCING ACTIVITIESProceeds from the issue of preference share capital (0.06) – 44.56Proceeds from issuance of share capital on exercise of stock options 83.93 1.06 122.27Dividends paid during the period / year, including dividend tax (867.18) (108.35) (216.75)
NET CASH USED IN FINANCING ACTIVITIES (783.31) (107.29) (49.92)Effect of exchange differences on translation of foreign currency cash and cash equivalents 13.31 (3.20) (5.76)NET (DECREASE) / INCREASE IN CASH AND CASH EQUIVALENTS (629.28) 84.10 245.06CASH AND CASH EQUIVALENTS AT THE BEGINNING OF THE PERIOD / YEAR 1,929.36 1,684.30 1,684.30
CASH AND CASH EQUIVALENTS AT THE END OF THE PERIOD / YEAR 1,300.08 1,768.40 1,929.36
As per our report attached.
for Bharat S. Raut & Co.Chartered Accountants
Subramanian Suresh N. R. Narayana Murthy Nandan M. Nilekani S. Gopalakrishnan Deepak M. SatwalekarPartner Chairman and Chief Mentor Chief Executive Officer, Chief Operating Officer Director
Membership No. 83673 President and Managing Director and Deputy Managing Director
Marti G. Subrahmanyam Omkar Goswami Larry Pressler Rama BijapurkarDirector Director Director Director
Claude Smadja Sridar A. Iyengar K. Dinesh S. D. ShibulalDirector Director Director Director
T. V. Mohandas Pai Srinath Batni V. BalakrishnanBangalore Director and Director Company Secretary andJuly 13, 2004 Chief Financial Officer Senior Vice President – Finance
21
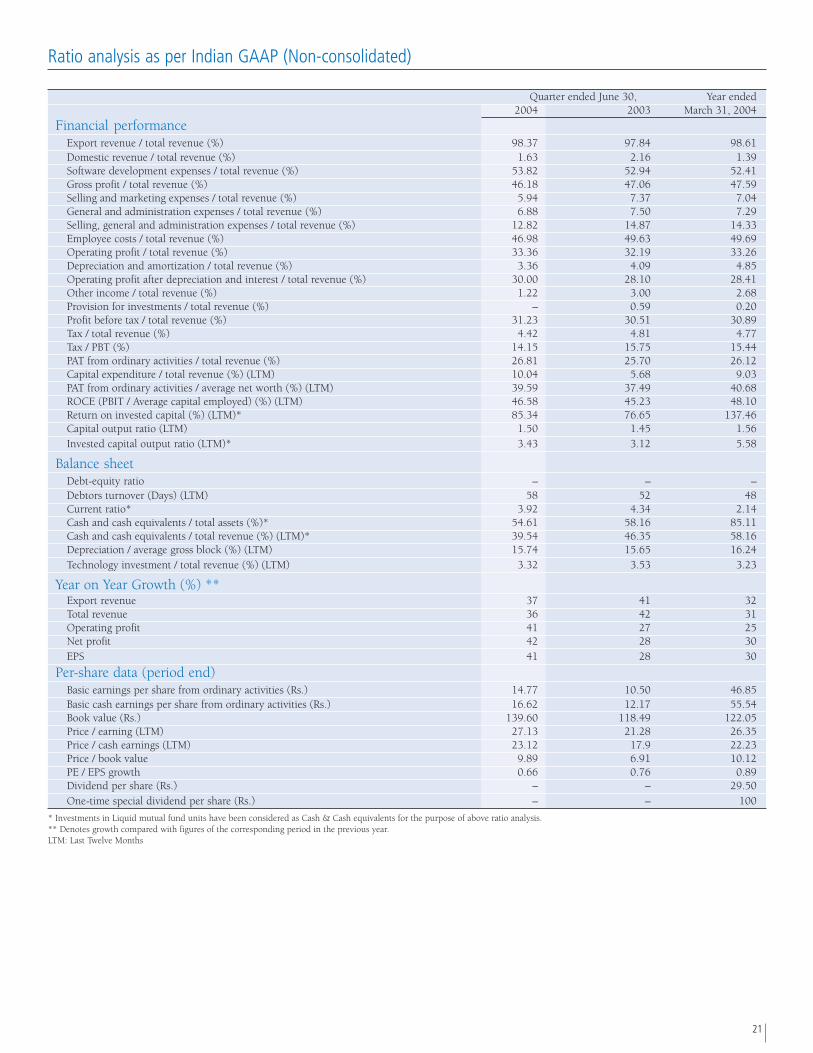
Ratio analysis as per Indian GAAP (Non-consolidated)
Quarter ended June 30, Year ended2004 2003 March 31, 2004
Financial performanceExport revenue / total revenue (%) 98.37 97.84 98.61Domestic revenue / total revenue (%) 1.63 2.16 1.39Software development expenses / total revenue (%) 53.82 52.94 52.41Gross profit / total revenue (%) 46.18 47.06 47.59Selling and marketing expenses / total revenue (%) 5.94 7.37 7.04General and administration expenses / total revenue (%) 6.88 7.50 7.29Selling, general and administration expenses / total revenue (%) 12.82 14.87 14.33Employee costs / total revenue (%) 46.98 49.63 49.69Operating profit / total revenue (%) 33.36 32.19 33.26Depreciation and amortization / total revenue (%) 3.36 4.09 4.85Operating profit after depreciation and interest / total revenue (%) 30.00 28.10 28.41Other income / total revenue (%) 1.22 3.00 2.68Provision for investments / total revenue (%) – 0.59 0.20Profit before tax / total revenue (%) 31.23 30.51 30.89Tax / total revenue (%) 4.42 4.81 4.77Tax / PBT (%) 14.15 15.75 15.44PAT from ordinary activities / total revenue (%) 26.81 25.70 26.12Capital expenditure / total revenue (%) (LTM) 10.04 5.68 9.03PAT from ordinary activities / average net worth (%) (LTM) 39.59 37.49 40.68ROCE (PBIT / Average capital employed) (%) (LTM) 46.58 45.23 48.10Return on invested capital (%) (LTM)* 85.34 76.65 137.46Capital output ratio (LTM) 1.50 1.45 1.56Invested capital output ratio (LTM)* 3.43 3.12 5.58
Balance sheetDebt-equity ratio – – –Debtors turnover (Days) (LTM) 58 52 48Current ratio* 3.92 4.34 2.14Cash and cash equivalents / total assets (%)* 54.61 58.16 85.11Cash and cash equivalents / total revenue (%) (LTM)* 39.54 46.35 58.16Depreciation / average gross block (%) (LTM) 15.74 15.65 16.24Technology investment / total revenue (%) (LTM) 3.32 3.53 3.23
Year on Year Growth (%) **Export revenue 37 41 32Total revenue 36 42 31Operating profit 41 27 25Net profit 42 28 30EPS 41 28 30
Per-share data (period end)Basic earnings per share from ordinary activities (Rs.) 14.77 10.50 46.85Basic cash earnings per share from ordinary activities (Rs.) 16.62 12.17 55.54Book value (Rs.) 139.60 118.49 122.05Price / earning (LTM) 27.13 21.28 26.35Price / cash earnings (LTM) 23.12 17.9 22.23Price / book value 9.89 6.91 10.12PE / EPS growth 0.66 0.76 0.89Dividend per share (Rs.) – – 29.50One-time special dividend per share (Rs.) – – 100
* Investments in Liquid mutual fund units have been considered as Cash & Cash equivalents for the purpose of above ratio analysis.** Denotes growth compared with figures of the corresponding period in the previous year.LTM: Last Twelve Months
22
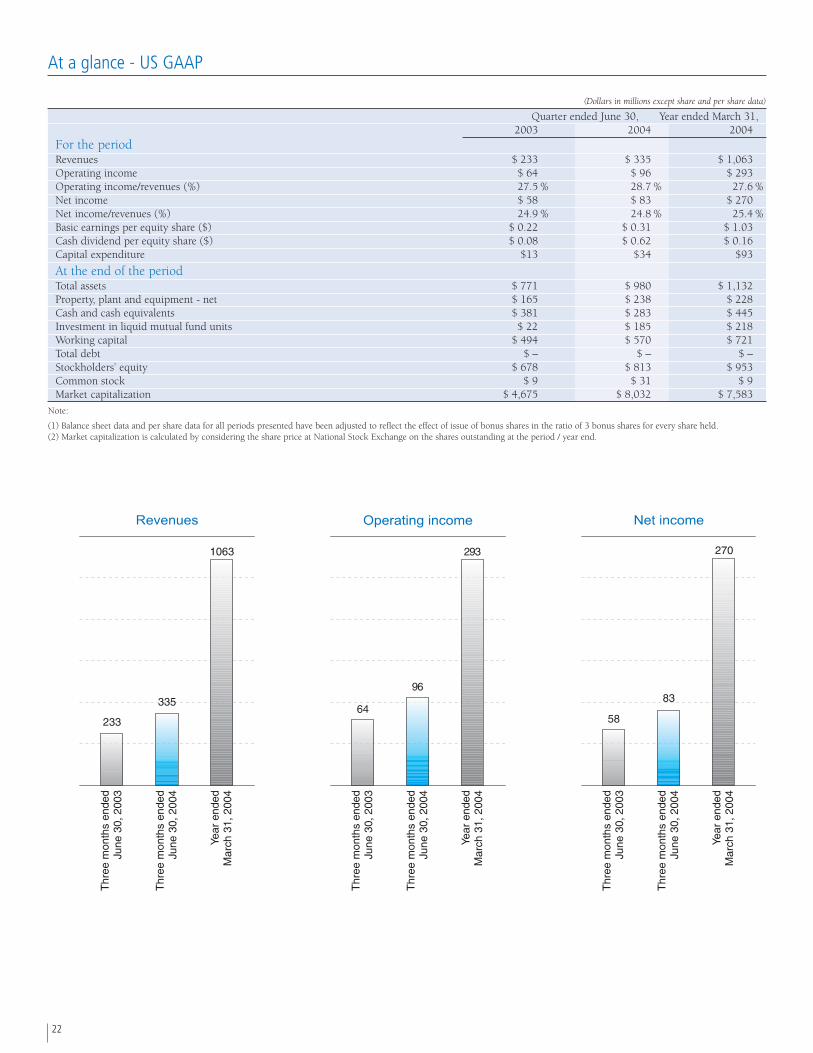
At a glance - US GAAP
(Dollars in millions except share and per share data)
Quarter ended June 30, Year ended March 31,2003 2004 2004
For the periodRevenues $ 233 $ 335 $ 1,063Operating income $ 64 $ 96 $ 293Operating income/revenues (%) 27.5 % 28.7 % 27.6 %Net income $ 58 $ 83 $ 270Net income/revenues (%) 24.9 % 24.8 % 25.4 %Basic earnings per equity share ($) $ 0.22 $ 0.31 $ 1.03Cash dividend per equity share ($) $ 0.08 $ 0.62 $ 0.16Capital expenditure $13 $34 $93
At the end of the periodTotal assets $ 771 $ 980 $ 1,132Property, plant and equipment - net $ 165 $ 238 $ 228Cash and cash equivalents $ 381 $ 283 $ 445Investment in liquid mutual fund units $ 22 $ 185 $ 218Working capital $ 494 $ 570 $ 721Total debt $ – $ – $ –Stockholders’ equity $ 678 $ 813 $ 953Common stock $ 9 $ 31 $ 9Market capitalization $ 4,675 $ 8,032 $ 7,583
Note:
(1) Balance sheet data and per share data for all periods presented have been adjusted to reflect the effect of issue of bonus shares in the ratio of 3 bonus shares for every share held.(2) Market capitalization is calculated by considering the share price at National Stock Exchange on the shares outstanding at the period / year end.

23
UNITED STATES SECURITIES AND EXCHANGE COMMISSIONWashington, D.C. 20549
FORM 6-K
Report of Foreign IssuerPursuant to Rule 13a-16 or 15d-16 of the Securities Exchange Act of 1934
For the quarter ended June 30, 2004
Commission File Number: 333-72195
INFOSYS TECHNOLOGIES LIMITED(Exact name of Registrant as specified in its charter)
Not Applicable(Translation of Registrant’s name into English)
Bangalore, Karnataka, India(Jurisdiction of incorporation or organization)
Electronics City, Hosur Road, Bangalore, Karnataka, India 560 100. +91-80-2852-0261(Address of principal executive offices)
Indicate by check mark registrant files or will file annual reports under cover Form 20-F or Form 40-F.Form 20-F � Form 40-F �
Indicate by check mark whether the registrant by furnishing the information contained in this Form is also thereby furnishing the information to theCommission pursuant to Rule 12g 3-2(b) under the Securities Exchange Act of 1934
Yes � No �
If “Yes” is marked, indicate below the file number assigned to registrant in connection with Rule 12g 3-2(b).Not Applicable
Currency of Presentation and Certain Defined TermsIn this Quarterly Report, references to “U.S.” or “United States” are to the United States of America, its territories and its possessions. References to “India” are tothe Republic of India. References to “$” or “dollars” or “U.S. dollars” are to the legal currency of the United States and references to “Rs.” or “rupees” or “Indianrupees” are to the legal currency of India. Our financial statements are presented in Indian rupees and translated into U.S. dollars and are prepared in accordancewith United States Generally Accepted Accounting Principles, or U.S. GAAP. References to “Indian GAAP” are to Indian Generally Accepted Accounting Principles.References to a particular “fiscal” year are to our fiscal year ended March 31 of such year.
All references to “we,” “us,” “our,” “Infosys” or the “Company” shall mean Infosys Technologies Limited. “Infosys” is a registered trademark of Infosys TechnologiesLimited in the United States and India. All other trademarks or tradenames used in this Quarterly Report are the property of their respective owners.
Except as otherwise stated in this Quarterly Report, all translations from Indian Rupees to U.S. dollars are based on the noon buying rate in the City of New Yorkon June 30, 2004, for cable transfers in Indian rupees as certified for customs purposes by the Federal Reserve Bank of New York which was Rs. 45.99 per $1.00.No representation is made that the Indian rupee amounts have been, could have been or could be converted into U.S. dollars at such a rate or any other rate. Anydiscrepancies in any table between totals and sums of the amounts listed are due to rounding. Information contained in our website, www.infosys.com, is not partof this Quarterly Report.
Forward-looking Statements May Prove InaccurateIn addition to historical information, this Quarterly Report contains certain forward-looking statements within the meaning of Section 27A of the Securities Actof 1933, as amended, and Section 21E of the Securities Exchange Act of 1934, as amended. The forward-looking statements contained herein are subject tocertain risks and uncertainties that could cause actual results to differ materially from those reflected in the forward-looking statements. Factors that might causesuch differences include but are not limited to, those discussed in the section entitled “Management’s Discussion and Analysis of Financial Condition and Resultsof Operations” and elsewhere in this report. Readers are cautioned not to place undue reliance on these forward-looking statements, which reflect management’sanalysis only as of the date hereof. In addition, readers should carefully review the other information in this Quarterly Report and in the Company’s periodicreports and other documents filed with the Securities and Exchange Commission (“SEC”) from time to time.
24
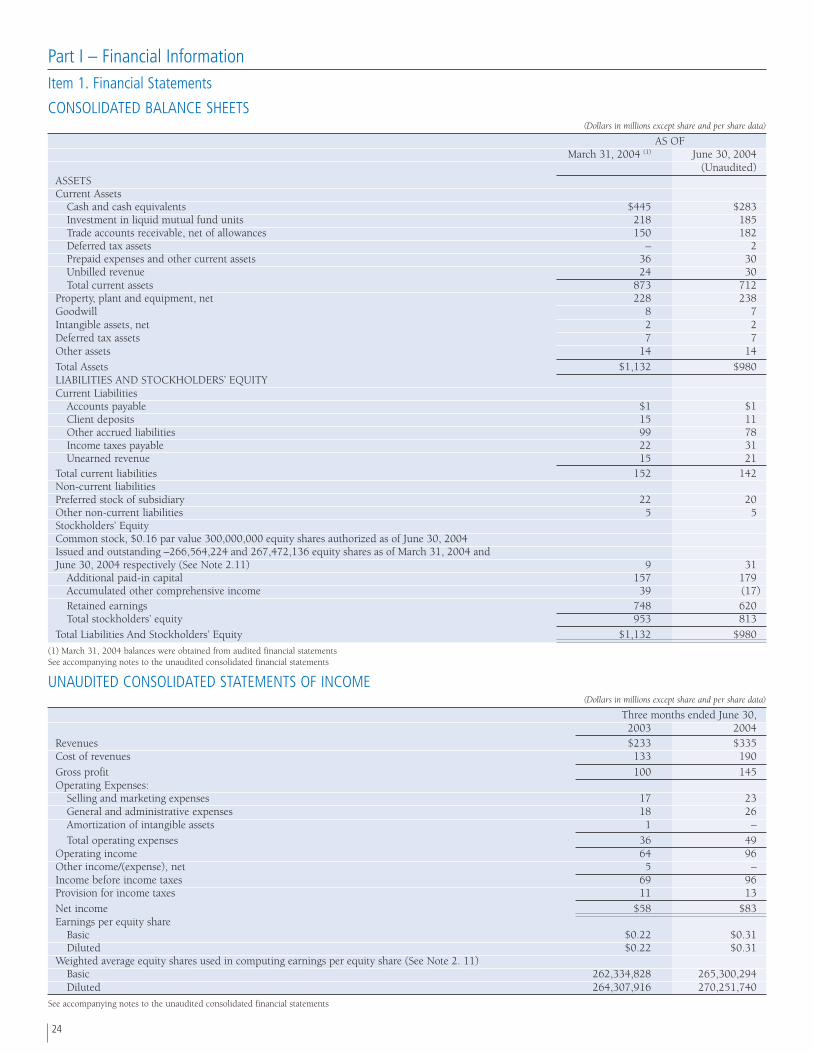
Part I – Financial InformationItem 1. Financial Statements
CONSOLIDATED BALANCE SHEETS(Dollars in millions except share and per share data)
AS OFMarch 31, 2004 (1) June 30, 2004
(Unaudited)ASSETSCurrent Assets
Cash and cash equivalents $445 $283Investment in liquid mutual fund units 218 185Trade accounts receivable, net of allowances 150 182Deferred tax assets – 2Prepaid expenses and other current assets 36 30Unbilled revenue 24 30Total current assets 873 712
Property, plant and equipment, net 228 238Goodwill 8 7Intangible assets, net 2 2Deferred tax assets 7 7Other assets 14 14
Total Assets $1,132 $980LIABILITIES AND STOCKHOLDERS’ EQUITYCurrent Liabilities
Accounts payable $1 $1Client deposits 15 11Other accrued liabilities 99 78Income taxes payable 22 31Unearned revenue 15 21
Total current liabilities 152 142Non-current liabilitiesPreferred stock of subsidiary 22 20Other non-current liabilities 5 5Stockholders’ EquityCommon stock, $0.16 par value 300,000,000 equity shares authorized as of June 30, 2004Issued and outstanding –266,564,224 and 267,472,136 equity shares as of March 31, 2004 andJune 30, 2004 respectively (See Note 2.11) 9 31
Additional paid-in capital 157 179Accumulated other comprehensive income 39 (17)Retained earnings 748 620Total stockholders’ equity 953 813
Total Liabilities And Stockholders’ Equity $1,132 $980
(1) March 31, 2004 balances were obtained from audited financial statementsSee accompanying notes to the unaudited consolidated financial statements
UNAUDITED CONSOLIDATED STATEMENTS OF INCOME(Dollars in millions except share and per share data)
Three months ended June 30, 2003 2004
Revenues $233 $335Cost of revenues 133 190
Gross profit 100 145Operating Expenses:
Selling and marketing expenses 17 23General and administrative expenses 18 26Amortization of intangible assets 1 –
Total operating expenses 36 49Operating income 64 96Other income/(expense), net 5 –Income before income taxes 69 96Provision for income taxes 11 13
Net income $58 $83Earnings per equity share
Basic $0.22 $0.31Diluted $0.22 $0.31
Weighted average equity shares used in computing earnings per equity share (See Note 2. 11)Basic 262,334,828 265,300,294Diluted 264,307,916 270,251,740
See accompanying notes to the unaudited consolidated financial statements

25
UNAUDITED CONSOLIDATED STATEMENTS OF STOCKHOLDERS’ EQUITY AND COMPREHENSIVE INCOME(Dollars in millions except share and per share data)
Common stock Additional Comprehensive Accumulated Deferred stock Retained TotalShares Par value paid-in income other compensation earnings stockholders’
(See Note 2.11) capital comprehensive equityincome
Balance as of March 31, 2003 264,972,312 $9 $127 $(32) $(3) $525) $626)
Common stock issued 25,152 – – –) –) –) –)
Cash dividends – – – –) –) (23) (23)
Amortization of compensation
related to stock option grants – – – –) 1) –) 1)
Comprehensive income
Net income – – – $58) –) –) 58) 58)
Other comprehensive income
Translation adjustment – – – 16) 16) –) –) 16)
Comprehensive income $74)
Balance as of June 30, 2003 264,997,464 $9 $127 $(16) $(2) $560) $678)
Balance as of March 31, 2004 266,564,224 $9 $157 $39) –) $748) $953)
Common stock issued 907,912 – 18 –) –) –) 18)
Cash dividends – – – –) –) (189) (189)
Income tax benefit arising on
exercise of stock options – – 4 –) –) –) 4)
Stock split effected in the form of a
stock dividend (See Note 2. 11) – 22 – –) –) (22) –)
Comprehensive income
Net income – – – $83) –) –) 83) 83)
Other comprehensive income
Translation adjustment – – – (56) (56) –) –) (56)
Comprehensive income $27)
Balance as of June 30, 2004 267,472,136 $31 $179 $(17) –) $620) $813)
See accompanying notes to the unaudited consolidated financial statements

26
UNAUDITED CONSOLIDATED STATEMENTS OF CASH FLOWS
(Dollars in millions except share and per share data)
Three months ended June 30,2003 2004
OPERATING ACTIVITIES:Net income $58 $83Adjustments to reconcile net income to net cash provided by operating activitiesDepreciation 9 12Amortization of intangible assets 1 –Provision for investments 1 –Deferred taxes – (2)Amortization of stock compensation expense 1 –Changes in assets and liabilitiesTrade accounts receivable (10) (41)Prepaid expenses and other current assets (2) 5Unbilled revenue (1) (7)Income taxes 9 12Accounts payable – (1)Client deposits – (4)Unearned revenue 2 7Other accrued liabilities 6 (17)
Net cash provided by operating activities 74 47Investing Activities:Expenditure on property, plant and equipment (13) (34)Loans to employees 1 (1)Investment in liquid mutual fund units (22) –Redemption of liquid mutual fund units – 20
Net cash used in investing activities (34) (15)Financing Activities:Proceeds from issuance of common stock – 18Payment of dividends (23) (188)
Net cash used in financing activities (23) (170)Effect of exchange rate changes on cash 10 (24)Net increase in cash and cash equivalents during the period 27 (162)Cash and cash equivalents at the beginning of the period 354 445
Cash and cash equivalents at the end of the period $381 $283Supplementary information:Cash paid towards taxes $2 $3Stock split effected in the form of a stock dividend (See Note 2.11)
See accompanying notes to the unaudited consolidated financial statements

27
NOTES TO THE UNAUDITED CONSOLIDATED FINANCIAL STATEMENTS
1 Company overview and significant accounting policies1.1 Company overviewInfosys Technologies Limited (Infosys) along with its majority-owned and controlled subsidiary, Progeon Limited (Progeon), and wholly-owned subsidiaries Infosys Technologies(Australia) Pty. Limited (Infosys Australia), Infosys Technologies (Shanghai) Co. Limited (Infosys China) and Infosys Consulting Inc (Infosys Consulting) is a leading global informationtechnology, or IT, services company. The company provides end-to-end business solutions that leverage technology thus enabling its clients to enhance business performance. Thecompany provides solutions that span the entire software life cycle encompassing consulting, design, development, re-engineering, maintenance, systems integration and packageevaluation and implementation. In addition, the company offers software products for the banking industry and business process management services.
1.2 Basis of preparation of financial statementsThe consolidated financial statements include Infosys and its subsidiaries (the company) and are prepared in accordance with accounting principles generally accepted in the UnitedStates of America (GAAP). Infosys consolidates entities in which it owns or controls more than 50% of the voting shares. The results of acquired businesses are included in theconsolidated financial statements from the date of acquisition. Inter-company balances and transactions are eliminated on consolidation.
Interim information presented in the consolidated financial statements has been prepared by the management without audit and, in the opinion of management, includes alladjustments of a normal recurring nature that are necessary for the fair presentation of the financial position, results of operations and cash flows for the periods shown, and is inaccordance with GAAP. These financial statements should be read in conjunction with the consolidated financial statements and related notes included in the company’s annual reporton Form 20-F for the fiscal year ended March 31, 2004.
1.3 Use of estimatesThe preparation of consolidated financial statements in conformity with GAAP requires management to make estimates and assumptions. These estimates and assumptions affect thereported amounts of assets and liabilities, the disclosures of contingent assets and liabilities at the date of the financial statements and the reported amounts of revenues and expensesduring the reporting period. Significant estimates and assumptions are used for, but not limited to accounting for costs and efforts expected to be incurred to complete performanceunder software development arrangements, allowance for uncollectible accounts receivable, future obligations under employee benefit plans, provisions for post-sales customersupport, the useful lives of property, plant, equipment and intangible assets and income tax valuation allowances. Actual results could differ from those estimates. Appropriate changesin estimates are made as management become aware of changes in circumstances surrounding the estimates. Changes in estimates are reflected in the financials statements in theperiod in which changes are made and, if material, their effects are disclosed in the notes to the consolidated financial statements.
1.4 Revenue recognitionThe company derives revenues primarily from software development and related services, licensing of software products and from business process management services. Arrangementswith customers for software development and related services are either on a fixed-price, fixed-time frame or on a time-and-material basis.
Revenue on time-and-material contracts is recognized as the related services are performed. Revenue from the end of the last billing to the balance sheet date is recognized as unbilledrevenues. Revenue from fixed-price, fixed-time frame contracts is recognized as per the percentage-of-completion method. Guidance has been drawn from paragraph 95 of Statementof Position (SOP) 97-2, Software Revenue Recognition, to account for revenue from fixed-price arrangements for software development and related services in conformity with SOP81-1. The input (efforts expended) method has been used to measure progress towards completion as there is a direct relationship between input and productivity. Provisions forestimated losses, if any, on uncompleted contracts are recorded in the period in which such losses become probable based on the current contract estimates. Costs and earnings inexcess of billings are classified as unbilled revenue while billings in excess of costs and earnings are classified as unearned revenue. Maintenance revenue is recognized ratably over theterm of the underlying maintenance agreement.
The company provides its clients with a fixed-period warranty for corrections of errors and telephone support on all its fixed-price, fixed-time frame contracts. Costs associated withsuch support services are accrued at the time related revenues are recorded and included in cost of revenues. The company estimates such costs based on historical experience andestimates are reviewed on a periodic basis for any material changes in assumptions and likelihood of occurrence.
In accordance with SOP 97-2, license fee revenues are recognized when persuasive evidence of an arrangement exists, delivery has occurred, the license fee is fixed and determinable,and the collection of the fee is probable. Arrangements to deliver software products generally have three elements: license, implementation and Annual Technical Services (ATS). Thecompany has applied the principles in SOP 97-2 to account for revenue from these multiple element arrangements. Vendor specific objective evidence of fair value (VSOE) has beenestablished for ATS. VSOE is the price charged when the element is sold separately. When other services are provided in conjunction with the licensing arrangement, the revenue fromsuch contracts are allocated to each component of the contract using the residual method, whereby revenue is deferred for the undelivered services and the residual amounts arerecognized as revenue for delivered elements. In the absence of an established VSOE for implementation, the entire arrangement fee for license and implementation is recognized asthe implementation is performed. Revenue from client training, support and other services arising due to the sale of software products is recognized as the services are performed. ATSrevenue is recognized ratably over the period in which the services are rendered.
Revenues from business process management and other services are recognized on both, the time-and-material and fixed-price, fixed-time frame basis. Revenue on time-and-materialcontracts is recognized as the related services are rendered. Revenue from fixed-price, fixed-time frame contracts is recognized as per the proportional performance method using anoutput measure of performance.
When the company receives advances for services and products, such amounts are reported as client deposits until all conditions for revenue recognition are met.
1.5 Cash and cash equivalentsThe company considers all highly liquid investments with a remaining maturity at the date of purchase / investment of three months or less and that are readily convertible to knownamounts of cash to be cash equivalents. Cash and cash equivalents comprise cash, and cash on deposit with banks, and corporations.
1.6 InvestmentsInvestments in non-readily marketable equity securities of other entities where the company is unable to exercise significant influence and for which there are no readily determinablefair values are recorded at cost. Declines in value judged to be other than temporary are included in earnings.
Investment securities designated as “available for sale” are carried at their fair value. Fair value is based on quoted market prices. Temporary unrealized gains and losses, net of therelated tax effect are reported as a separate component of stockholders’ equity until realized. Realized gains and losses and declines in value judged to be other than temporary onavailable for sale securities are included in earnings.
The cost of securities sold is based on the specific identification method. Interest and dividend income are recognized when earned.
1.7 Property, plant and equipmentProperty, plant and equipment are stated at cost, less accumulated depreciation. The company depreciates property, plant and equipment over their estimated useful lives using thestraight-line method. The estimated useful lives of assets are as follows:
Buildings 15 years Vehicles 5 yearsPlant and equipment 5 years Computer equipment 2-5 yearsFurniture and fixtures 5 years

28
The cost of software purchased for internal use is accounted under SOP 98-1, Accounting for the Costs of Computer Software Developed or Obtained for Internal Use. Deposits paidtowards the acquisition of these long lived assets outstanding at each balance sheet date and the cost of assets not put to use before such date are disclosed under “Capital work-in-progress”. Costs of improvements that substantially extend the useful life of particular assets are capitalized. Repairs and maintenance cost are charged to earnings when incurred. Thecost and related accumulated depreciation are removed from the consolidated financial statements upon sale or disposition of the asset.
The company evaluates the recoverability of these assets whenever events or changes in circumstances indicate that their carrying amounts may not be recoverable. Recoverability ofassets to be held and used is measured by a comparison of the carrying amount of an asset to future undiscounted net cash flows expected to be generated by the asset. If such assetsare considered to be impaired, the impairment to be recognized is measured by the amount by which the carrying value of the assets exceeds the fair value of the assets. Assets to bedisposed are reported at the lower of the carrying value or the fair value less the cost to sell.
1.8 Business combinationsBusiness combinations have been accounted using the purchase method under the provisions of Financial Accounting Standards Board (FASB) Statement of Financial AccountingStandard (SFAS) No. 141, Business Combinations. Cash and amounts of consideration that are determinable at the date of acquisition are included in determining the cost of theacquired business.
1.9 GoodwillGoodwill represents the cost of the acquired businesses in excess of the fair value of identifiable tangible and intangible net assets purchased. Goodwill is tested for impairment on anannual basis, relying on a number of factors including operating results, business plans and future cash flows. Recoverability of goodwill is evaluated using a two-step process. The firststep involves a comparison of the fair value of a reporting unit with its carrying value. If the carrying amount of the reporting unit exceeds its fair value, the second step of the processinvolves a comparison of the fair value and carrying value of the goodwill of that reporting unit. If the carrying value of the goodwill of a reporting unit exceeds the fair value of thatgoodwill, an impairment loss is recognized in an amount equal to the excess. Goodwill of a reporting unit shall be tested for impairment between annual tests if an event occurs orcircumstances change that would more likely than not reduce the fair value of the reporting unit below its carrying amount.
1.10 Intangible assetsIntangible assets are amortized over their respective individual estimated useful lives on a straight-line basis. The estimated useful life of an identifiable intangible asset is based on anumber of factors including the effects of obsolescence, demand, competition, and other economic factors (such as the stability of the industry, and known technological advances),and the level of maintenance expenditures required to obtain the expected future cash flows from the asset.
Intangible assets are evaluated for recoverability whenever events or changes in circumstances indicate that their carrying amounts may not be recoverable. Recoverability of assets tobe held and used is measured by a comparison of the carrying amount of an asset to future undiscounted net cash flows expected to be generated by the asset. If such assets areconsidered to be impaired, the impairment to be recognized is measured by the amount by which the carrying value of the assets exceeds the fair value of the assets.
1.11 Research and developmentResearch and development costs are expensed as incurred. Software product development costs are expensed as incurred until technological feasibility is achieved. Research anddevelopment costs and software development costs incurred under contractual arrangements with customers are accounted as cost of revenues.
1.12 Foreign currencyThe functional currency of the company is the Indian rupee (Rs.). The functional currency for Infosys Australia, Infosys China and Infosys Consulting is the respective local currency.The consolidated financial statements are reported in U.S. dollars. The translation of Rs. to U.S. dollars is performed for balance sheet accounts using the exchange rate in effect at thebalance sheet date and for revenue, expense and cash-flow items using a monthly average exchange rate for the respective periods. The gains or losses resulting from such translationare included in “Other comprehensive income”, a separate component of stockholders’ equity. The translation of the financial statements of foreign subsidiaries from the local currencyto the functional currency of the company is also performed on the same basis.
Foreign-currency denominated assets and liabilities are translated into the functional currency at exchange rates in effect at the balance sheet date. The gains or losses resulting fromsuch translation are included in earnings. Transaction gains or losses realized upon settlement of foreign currency transactions are included in determining net income for the periodin which the transaction is settled. Revenue, expense and cash-flow items denominated in foreign currencies are translated into the functional currency using the exchange rate ineffect on the date of the transaction.
1.13 Earnings per shareBasic earnings per share is computed by dividing net income for the period by the weighted average number of equity shares outstanding during the period. Diluted earnings per shareis computed by dividing net income by the diluted weighted average number of equity shares outstanding during the period. The dilutive effect of convertible securities is reflectedin diluted earnings per share by application of the if-converted method. Diluted earnings per share reflects the potential dilution from equity shares issuable through employee stockoptions and preferred stock of subsidiary.
If the number of common shares outstanding increases as a result of a stock dividend or stock split or decreases as a result of a reverse stock split, the computations of basic and dilutedEPS is adjusted retroactively for all periods presented to reflect that change in capital structure. If such changes occur after the close of the reporting period but before issuance of thefinancial statements, the per-share computations for that period and any prior-period financial statements presented is based on the new number of shares.
1.14 Income taxesIncome taxes are accounted for using the asset and liability method. Deferred tax assets and liabilities are recognized for the future tax consequences attributable to differences betweenthe financial statement carrying amounts of existing assets and liabilities, and their respective tax bases. Deferred tax assets and liabilities are measured using enacted tax rates expectedto apply to taxable income in the years in which those temporary differences are expected to be recovered or settled. The effect of changes in tax rates on deferred tax assets andliabilities is recognized as income in the period that includes the enactment date. The measurement of deferred tax assets is reduced, if necessary, by a valuation allowance for any taxbenefits of which future realization is not more likely than not. Changes in valuation allowance from period to period are reflected in the income statement of the period of change.Deferred taxes are not provided on the undistributed earnings of subsidiaries outside India where it is expected that the earnings of the foreign subsidiary will be permanentlyreinvested. Tax benefits earned on exercise of employee stock options in excess of compensation charged to earnings are credited to additional paid in capital. The income taxprovision for the interim period is based on the best estimate of the effective tax rate expected to be applicable for the full fiscal year.
1.15 Fair value of financial instrumentsIn determining the fair value of its financial instruments, the company uses a variety of methods and assumptions that are based on market conditions and risks existing at each balancesheet date. The methods used to determine fair value include discounted cash flow analysis and dealer quotes. All methods of assessing fair value result in general approximation ofvalue, and such value may never actually be realized.
1.16 Concentration of riskFinancial instruments that potentially subject the company to concentrations of credit risk consist principally of cash equivalents, trade accounts receivable, investment securities andhedging instruments. By nature, all such financial instruments involve risk, including the credit risk of non-performance by counterparties. In management’s opinion, as of June 30,2004 there was no significant risk of loss in the event of non-performance of the counterparties to these financial instruments, other than the amounts already provided for in thefinancial statements, if any. Exposure to credit risk is managed through credit approvals, establishing credit limits and monitoring procedures. The company’s cash resources areinvested with corporations, financial institutions and banks with high investment grade credit ratings. Limitations are established by the company as to the maximum amount of cashthat may be invested with any such single entity.

29
1.17 Derivative financial instrumentsOn April 1, 2001, the company adopted SFAS 133, Accounting for Derivative Instruments and Hedging Activities as amended, when the rules became effective for companies withfiscal years ending March 31. The company enters into foreign exchange forward contracts where the counter party is generally a bank. The company purchases foreign exchangeforward contracts to mitigate the risk of changes in foreign exchange rates on accounts receivable and forecasted cash flows denominated in certain foreign currencies. Although thesecontracts constitute hedges from an economic perspective, they do not qualify for hedge accounting under SFAS 133, as amended. Any derivative that is either not designated a hedge,or is so designated but is ineffective per SFAS 133, is marked to market and recognized in earnings immediately.
1.18 Retirement benefits to employees
1.18.1 GratuityIn accordance with the Payment of Gratuity Act, 1972, Infosys provides for gratuity, a defined benefit retirement plan (the Gratuity Plan) covering eligible employees. The GratuityPlan provides a lump sum payment to vested employees at retirement, death, incapacitation or termination of employment, of an amount based on the respective employee’s salary andthe tenure of employment.
Liabilities with regard to the Gratuity Plan are determined by actuarial valuation. The company fully contributes all ascertained liabilities to the Infosys Technologies LimitedEmployees’ Gratuity Fund Trust (the Trust). In case of Progeon, contributions are made to the Progeon Employees Gratuity Fund Trust. Trustees administer contributions made to theTrust and contributions are invested in specific designated instruments as permitted by law and investments are also made in mutual funds that invest in the specific designatedinstruments.
1.18.2 SuperannuationCertain employees of Infosys are also participants in a defined contribution plan. The company makes monthly contributions under the superannuation plan (the Plan) to the InfosysTechnologies Limited Employees Superannuation Fund Trust based on a specified percentage of each covered employee’s salary. The company has no further obligations to the Planbeyond its monthly contributions. Certain employees of Progeon are also eligible for superannuation benefit. Progeon makes monthly provisions under the superannuation plan basedon a specified percentage of each covered employee’s salary. Progeon has no further obligations to the superannuation plan beyond its monthly provisions which are periodicallycontributed to a trust fund, the corpus of which is invested with the Life Insurance Corporation of India.
1.18.3 Provident fundEligible employees of Infosys receive benefits from a provident fund, which is a defined contribution plan. Both the employee and the company make monthly contributions to theprovident fund plan equal to a specified percentage of the covered employee’s salary. The company contributes a part of the contributions to the Infosys Technologies LimitedEmployees’ Provident Fund Trust. The remaining portion is contributed to the Government administered provident fund.
In respect of Progeon, eligible employees receive benefits from a provident fund, which is a defined contribution plan. Both the employee and Progeon make monthly contributionsto this provident fund plan equal to a specified percentage of the covered employee’s salary. Amounts collected under the provident fund plan are deposited in a governmentadministered provident fund.
1.19 Stock-based compensationThe company applies the intrinsic value-based method of accounting prescribed by Accounting Principles Board (APB) Opinion No. 25, Accounting for Stock Issued to Employees,and related interpretations including FASB Interpretation No. 44, Accounting for Certain Transactions involving Stock Compensation an interpretation of APB Opinion No. 25, issuedin March 2000, to account for its fixed stock option plans. Under this method, compensation expense is recorded on the date of grant only if the current market price of the underlyingstock exceeded the exercise price. SFAS 123, Accounting for Stock-Based Compensation, established accounting and disclosure requirements using a fair value-based method ofaccounting for stock-based employee compensation plans. As allowed by SFAS 123, the Company has elected to continue to apply the intrinsic value-based method of accountingdescribed above, and has adopted the disclosure requirements of SFAS 148, Accounting for Stock-Based Compensation – Transition and Disclosure, an amendment of FASB StatementNo. 123. All stock options issued to date have been accounted as a fixed stock option plan.
The following table illustrates the effect on net income and earnings per share if the company had applied the fair value recognition provisions of SFAS Statement No. 123, Accountingfor Stock-Based Compensation, to stock-based employee compensation.
(Dollars in millions except share and per share data)
Three months ended June 30,2003 2004
Net income, as reported $58 $83Add: Stock-based employee compensation expense included in reported net income, net of related tax effects 1 –Deduct: Total stock-based employee compensation expense determined under fair value based method for
all awards, net of related tax effects (15) (9)
Pro forma net income $44 $74Earnings per share: (See Note 2.11)Basic – as reported $0.22 $0.31Basic – pro forma $0.17 $0.28Diluted – as reported $0.22 $0.31Diluted – pro forma $0.17 $0.28
The fair value of each option is estimated on the date of grant using the Black-Scholes model with the following assumptions:
Three months ended June 30,2003 2004
Dividend yield % 0.2 % –Expected life 1-5 years –Risk free interest rate 5.7 % –Volatility 60-75 % –
There were no grants of stock options during the three months ended June 30, 2004.
1.20 DividendsFinal dividends on common stock are recorded as a liability on the date of declaration by the stockholders and interim dividends are recorded as a liability on the date of declarationby the board of directors.
1.21 ReclassificationsCertain reclassifications have been made to conform prior period data to the current presentations.

30
2 Notes to the unaudited consolidated financial statements2.1 Cash and cash equivalentsThe cost and fair values for cash and cash equivalents are as follows:
(Dollars in millions except share and per share data)
As ofMarch 31, 2004 June 30, 2004
Cost and fair valuesCash and bank deposits $397 $236Deposits with corporations 48 47
$445 $ 283
Cash and cash equivalents include restricted cash balances in the amount of $1 million as of June 30, 2004. The restrictions are primarily on account of unclaimed dividends.
2.2 Trade accounts receivableTrade accounts receivable as of March 31, 2004 and June 30, 2004, net of allowance for doubtful accounts of $3 million and $4 million respectively, amounted to $150 million and$182 million. The age profile of trade accounts receivable, net of allowances is given below.
In %
As of
March 31, 2004 June 30, 2004Period (in days)0 – 30 69.7 82.231 – 60 21.6 6.061 – 90 4.7 6.4More than 90 4.0 5.4
100.0 100.0
2.3 Business combinationOn January 2, 2004 the company acquired, for cash, 100% of the equity in Expert Information Services Pty. Limited, Australia for $14 million. The purchase consideration includes$3 million retained in escrow for representations and warranties made by the selling shareholders. The acquired company was renamed as “Infosys Technologies (Australia) Pty.Limited”. There is a further contingent consideration payable to the sellers subject to continued employment and meeting of defined operating and financial performance parameters.The contingent consideration is being accounted as compensation.
The purchase price, including transaction costs, has been allocated based on management’s estimates and independent appraisals of fair values as follows:(Dollars in millions except share and per share data)
Component Purchase price allocated)
Plant and equipment $1)Net current assets 5)Non current liabilities (1)Customer contracts 2)Goodwill 7)
Total purchase price $14)
The identified customer contracts intangible is being amortized over a period of two years beginning January 2004, being management’s estimate of the useful life of the asset. Thecompany believes that the acquisition resulted in recognition of goodwill primarily because of the acquired company’s market position, skilled employees, management strength andpotential to serve as a platform for enhancing business opportunities in Australia. The goodwill has been allocated to the Australia reporting unit.
2.4 Prepaid expenses and other current assetsPrepaid expenses and other current assets consist of the following:
(Dollars in millions except share and per share data)
As ofMarch 31, 2004 June 30, 2004
Rent deposits $3 $3Security deposits with service providers 2 3Loans to employees 13 13Prepaid expenses 13 11Other current assets 5 –
$36 $30
Other current assets represent advance payments to vendors for the supply of goods and rendering of services and marked to market gains on foreign exchange forward contracts.Deposits with service providers relate principally to leased telephone lines and electricity supplies.
2.5 Property, plant and equipment – netProperty, plant and equipment consist of the following:
(Dollars in millions except share and per share data)
As ofMarch 31, 2004) June 30, 2004)
Land $21) $23)Buildings 106) 102)Furniture and fixtures 59) 59)Computer equipment 107) 108)Plant and equipment 65) 63)Capital work-in-progress 48) 62)
406) 417)Accumulated depreciation (178) (179)
$228) $238)

31
Depreciation expense amounted to $9 million and $12 million for the three months ended June 30, 2003 and 2004 respectively. The amount of third party software expensed duringthe three months ended June 30, 2003 and 2004 was $3 million and $5 million respectively.
2.6 Intangible assetsDuring fiscal 2003, the company acquired the intellectual property rights to the Trade IQ product from IQ Financial Systems Inc., USA for its banking business unit. The considerationpaid amounted to $4 million and was recorded as an intangible asset and amortized over two years being management’s initial estimate of the useful life. In the same fiscal year, thecompany also entered into an agreement for transferring the intellectual property rights in a commercial software application product used in the design of high performance structuralsystems. The company is required to pay the committed consideration of $5 million within ten years of the contract date. The ownership of intellectual property in the producttransfers to the company on remittance of the consideration. The committed consideration of $5 million was recorded as an intangible asset and was being amortized over management’sestimate of the useful life, which was initially 5 years. Amortization of the cost of these products aggregated to $1 million for the three months ended June 30, 2003. On subsequentreporting dates in fiscal 2004, management revised its estimates of the remaining useful life of these intangible assets and the recorded values of these intangible assets have beencompletely amortized as of March 31, 2004.
The identified customer contracts intangible arising from the purchase price allocation of Expert Information Services Pty. Limited, Australia is being amortized over a period of twoyears beginning January 2004, being management’s estimate of the useful life of the asset. The unamortized balance as of June 30, 2004 was $2 million.
2.7 Other assetsOther assets represent the non-current portion of loans to employees.
2.8 Related partiesThe company provides loans to eligible employees in accordance with policy. No loans have been made to employees in connection with equity issues. The employee loans arerepayable over fixed periods ranging from 1 to 100 months. The annual rates of interest at which the loans have been made to employees vary between 0% through 4%. Loansaggregating $27 million were outstanding as of March 31, 2004 and June 30, 2004.
The required repayments of employee loans outstanding as of June 30, 2004 are as detailed below.
(Dollars in millions except share and per share data)
Year ending June 30, Repayment
2005 $132006 32007 22008 32009 2Thereafter 4
$27
The estimated fair values of related party receivables amounted to $24 million and $22 million as of March 31, 2004 and June 30, 2004 respectively. These amounts have beendetermined using available market information and appropriate valuation methodologies. Considerable judgment is required to develop these estimates of fair value. Consequently,these estimates are not necessarily indicative of the amounts that the company could realize in the market.
2.9 Other accrued liabilitiesOther accrued liabilities comprise the following:
(Dollars in millions except share and per share data)
As ofMarch 31, 2004 June 30, 2004
Accrued compensation to staff $71 $36Accrued dividends – 1Provision for post sales client support 1 3Withholding taxes payable 9 11Provision for expenses 16 15Retainage 1 2Marked to market loss accrued on foreign exchange forward contracts – 7Others 1 3
$99 $78
2.10 Employee post-retirement benefits
2.10.1 GratuityNet gratuity cost was $1 million for the three months ended June 30, 2003 and 2004. The significant component of net gratuity cost was service cost which approximated $1 millionfor the three months ended June 30, 2003 and 2004.
The company had previously disclosed in the financial statements for the year ended March 31, 2004 that the company expects to contribute approximately $5 million to the gratuitytrusts during fiscal 2005. As of June 30, 2004, $1 million of contributions have been made. The company presently anticipates contributing an additional $4 million to the gratuitytrusts in fiscal 2005 for a total of $5 million.
2.10.2 SuperannuationThe company contributed $1 million to the superannuation plan in the three months ended June 30, 2004.
2.10.3 Provident fundThe company contributed $1 million and $2 million to the provident fund in the three months ended June 30, 2003 and 2004 respectively.
2.11 Stockholders’ equityInfosys has only one class of capital stock referred to as equity shares. On June 12, 2004, the shareholders of the company approved a 3:1 bonus issue on the equity shares of thecompany. The bonus issue has the nature of a stock split effected in the form of a stock dividend with 3 additional shares being issued for every share held. Bonus shares were allottedto shareholders on July 3, 2004. As the change in the capital structure of the company has been effected before the date of issuance of these financial statements, the change in thecapital structure has been given retroactive effect in the balance sheet and statement of stockholders’ equity and comprehensive income as of June 30, 2004. The computations of basicand diluted EPS has also been adjusted retroactively for all periods presented to reflect the change in capital structure. All references in these financial statements to number of shares,per share amounts and market prices of equity shares are retroactively restated to reflect stock splits made.

32
The rights of equity shareholders are set out below.
2.11.1 VotingEach holder of equity shares is entitled to one vote per share. The equity shares represented by American Depositary Shares (ADS) carry similar rights to voting and dividends as theother equity shares. Each ADS represent one underlying equity share.
2.11.2 DividendsShould the company declare and pay dividends, such dividends will be paid in Indian Rupees. Indian law mandates that any dividend be declared out of distributable profits only afterthe transfer of a specified percentage of net income computed in accordance with current regulations to a general reserve. Moreover, the remittance of dividends outside India isgoverned by Indian law on foreign exchange and is subject to applicable taxes.
2.11.3 LiquidationIn the event of liquidation of the company, the holders of common stock shall be entitled to receive any of the remaining assets of the company, after distribution of all preferentialamounts. The amounts will be in proportion to the number of equity shares held by the stockholders.
2.11.4 Stock optionsThere are no voting, dividend or liquidation rights to the holders of options issued under the company’s stock option plans.
2.12 Preferred stock of subsidiaryInfosys holds a majority of the equity shares of Progeon. The equity shares have been issued to Infosys as per the terms of the stock subscription agreement signed in April 2002,between Infosys, Citicorp International Finance Corporation (CIFC) and Progeon. 12,250,000 equity shares have been issued to Infosys in each of April 2002 and March 2004 for anaggregate consideration approximating $5 million. Pursuant to the agreement, CIFC has been issued 4,375,000 (0.0005%) cumulative convertible preference shares in each ofJune 30, 2002 and March 31, 2004 for an aggregate consideration approximating $20 million.
Unless earlier converted pursuant to an agreement in this behalf between the company and CIFC, these cumulative convertible preference shares shall automatically be converted intoequity shares upon the earlier of, (i) one year prior to Progeon’s initial public offering (IPO) date, (ii) June 30, 2005, or (iii) at the holder’s option, immediately upon the occurrenceof any Liquidity Event.; The term “Liquidity Event” includes any of a decision of the Board of Directors of the company to make an IPO, merger, reconstruction, capital reorganizationor other event which, in the sole opinion of the holder of the convertible preference shares, amounts to an alteration in the capital structure of the company. Each preference share isconvertible into one equity share, par value $0.20 each. Indian law requires redemption of preference shares within a period of 20 years.
2.13 Other income/(expense), netOther income/(expense), net, consists of the following:
(Dollars in millions except share and per share data)
Three months ended June 30,2003 2004
Interest income $4 $4Income from mutual fund investments – 3Foreign exchange gain/ (loss), net 2 (7)Provision for investments (1) –
$5 $ –
The provision for investments during the three months ended June 30, 2003 include write-downs to investments in CiDRA Corporation ($1.0 million) and Stratify Inc ($0.4 million).These write-downs were required due to the non-temporary impact of adverse market conditions on these entities’ business models and contemporary transactions on the securitiesof the entities which have been indicative of their current fair value
2.14 Research and developmentGeneral and administrative expenses in the accompanying statements of income include research and development expenses of $1 million and $3 million for the three months endedJune 30, 2003 and 2004 respectively.
2.15 Employees’ Stock Offer Plans (ESOP)In September 1994, the company established the 1994 plan, which provided for the issue of 6,000,000 warrants, as adjusted, to eligible employees. The warrants were issued to anemployee welfare trust (the Trust). In 1997, in anticipation of a share dividend to be declared by the company, the Trust exercised all warrants held by it and converted them intoequity shares. As and when the Trust issued options/stock to eligible employees, the difference between the market price and the exercise price was accounted as deferred stockcompensation expense and amortized over the vesting period. Such amortized deferred compensation expense was $1 million for the three months ended June 30, 2003. Thedeferred stock compensation expense has been completely amortized as of March 31, 2004. The 1994 plan lapsed in fiscal 2000, and consequently no further shares will be issued toemployees under this plan.
1998 Employees Stock Offer Plan (the 1998 Plan). The company’s 1998 Plan provides for the grant of non-statutory stock options and incentive stock options to employees of thecompany. The establishment of the 1998 Plan was approved by the board of directors in December 1997 and by the stockholders in January 1998. The Government of India hasapproved the 1998 Plan, subject to a limit of 5,880,000 equity shares representing 5,880,000 ADS to be issued under the 1998 Plan. Unless terminated sooner, the 1998 Plan willterminate automatically in January 2008. All options under the 1998 Plan will be exercisable for equity shares represented by ADSs. The 1998 Plan is administered by a CompensationCommittee comprising four members, all of who are independent directors on the Board of Directors.
1999 Stock Offer Plan (the 1999 Plan). In fiscal 2000, the company instituted the 1999 Plan. The stockholders and the Board of Directors approved the 1999 Plan in June 1999. The1999 Plan provides for the issue of 26,400,000 equity shares to employees. The 1999 Plan is administered by a Compensation Committee comprising four members, all of who areindependent directors on the Board of Directors. Under the 1999 Plan, options will be issued to employees at an exercise price, which shall not be less than the Fair Market Value(FMV). Under the 1999 Plan, options may also be issued to employees at exercise prices that are less than FMV only if specifically approved by the members of the company in ageneral meeting. All options under the 1999 plan are exercisable for equity shares.
The options under the 1998 Plan and 1999 Plan vest over a period of one through four years and expire 5 years from the date of completion of vesting.
Progeon’s 2002 Plan provides for the grant of stock options to its employees and was approved by its board of directors and stockholders in June 2002. All options under the 2002 Planare exercisable for equity shares. The 2002 Plan is administered by a Compensation Committee comprising two members, all of whom are directors of the company. The 2002 Planprovides for the issue of 5,250,000 equity shares to employees, at an exercise price, which shall not be less than the FMV. Options may also be issued to employees at exercise pricesthat are less than FMV only if specifically approved by the members of the company in general meeting. The options issued under the 2002 Plan vest in periods ranging between onethrough six years, although accelerated vesting based on performance conditions is provided in certain instances. All options granted have been accounted for as a fixed plan.
Options to purchase 1,801,175 shares of Progeon, were outstanding as of June 30, 2003. There were no grants, forfeitures or exercises during the three months ended June 30, 2003.Options to purchase 199,600 shares of Progeon, with a weighted average exercise price of $2.29 and fair value $0.89 have been granted during the three months ended June 30, 2004.Options to purchase 74,450 shares with a weighted average exercise price of $1.71 were forfeited during the period. Options to purchase 3,247,075 shares were outstanding as ofJune 30, 2004 with a weighted average remaining contractual life of 2.71 years and weighted average exercise price of $1.08. Options to purchase 431,741 shares wereexercisable as of June 30, 2004 with a weighted average exercise price of $0.69. Options to purchase 2,700 shares of Progeon at a weighted average exercise price of $0.69 wereexercised during the three months ended June 30, 2004.

33
The activity in the warrants / equity shares of the 1994, 1998 and 1999 ESOP in the three months ended June 30, 2003 and 2004 are set out below and are adjusted to reflect thechange in the capital structure of the company. (See Note 2.11)
Three months ended June 30,2003 2004
Shares arising Weighted Shares arising Weightedout of options average out of options average
exercise price exercise price
1994 Option plan:Outstanding at the beginning of the period 1,272,800) $0.3 1,266,400) $0.3Granted –) – –) –Forfeited –) –) –Exercised –) – (1,266,400) $0.3Outstanding at the end of the period 1,272,800) – –) –1998 Option plan:Outstanding at the beginning of the period 5,006,812) 3,871,008)Granted 107,600) $21 –) –Forfeited (220,588) $36 (107,904) $45Exercised (25,032) $9 (21,628) $30Outstanding at the end of the period 4,868,792) 3,741,476)Exercisable at the end of the period 1,316,952) 1,605,266)Weighted-average fair value of options granted during the period $6 –1999 Option plan:Outstanding at the beginning of the period 20,244,684) 18,362,120)Granted 604,200) $16 –) –Forfeited (305,720) $24 (313,704) $24Exercised (120) $14 (886,284) $20Outstanding at the end of the period 20,543,044) 17,162,132)Exercisable at the end of the period 5,783,320) 8,788,964)Weighted-average fair value of options granted during the period $7 –
The following table summarizes information about stock options outstanding as of June 30, 2004.
Options Outstanding Options ExercisableRange of No. of shares Weighted average Weighted No. of shares Weightedexercise prices arising out of remaining contractual average arising out of averageper share ($) options life in years exercise price options exercise price
1998 Plan9-25 937,396 5.4 $20 209,150 $1626-50 2,311,520 5.2 $40 1,011,716 $4451-75 236,720 4.4 $60 142,800 $6076-100 198,840 3.9 $81 184,600 $81101-165 57,000 3.7 $130 57,000 $130Total 3,741,476 1,605,266
1999 Plan13-25 10,838,348 5.2 $19 4,300,544 $2126-50 6,302,184 4.4 $34 4,466,820 $3451-70 21,600 3.8 $55 21,600 $55Total 17,162,132 8,788,964
2.16 Income taxesThe provision for income taxes in the income statement comprises:
(Dollars in millions except share and per share data)
Three months ended June 30,2003 2004)
Current taxesDomestic taxes $3 $4)Foreign taxes 8 11)
11 15)Deferred taxesDomestic taxes – (1)Foreign taxes – (1)
– (2)Aggregate taxes $11 $13)
All components of the aggregate taxes of $11 million and $13 million for the three months ended June 30, 2003 and 2004 are allocated to the continuing operations of the company.Tax benefits of $4 million earned on exercise of employee stock options have been credited to additional paid in capital during the three months ended June 30, 2004.
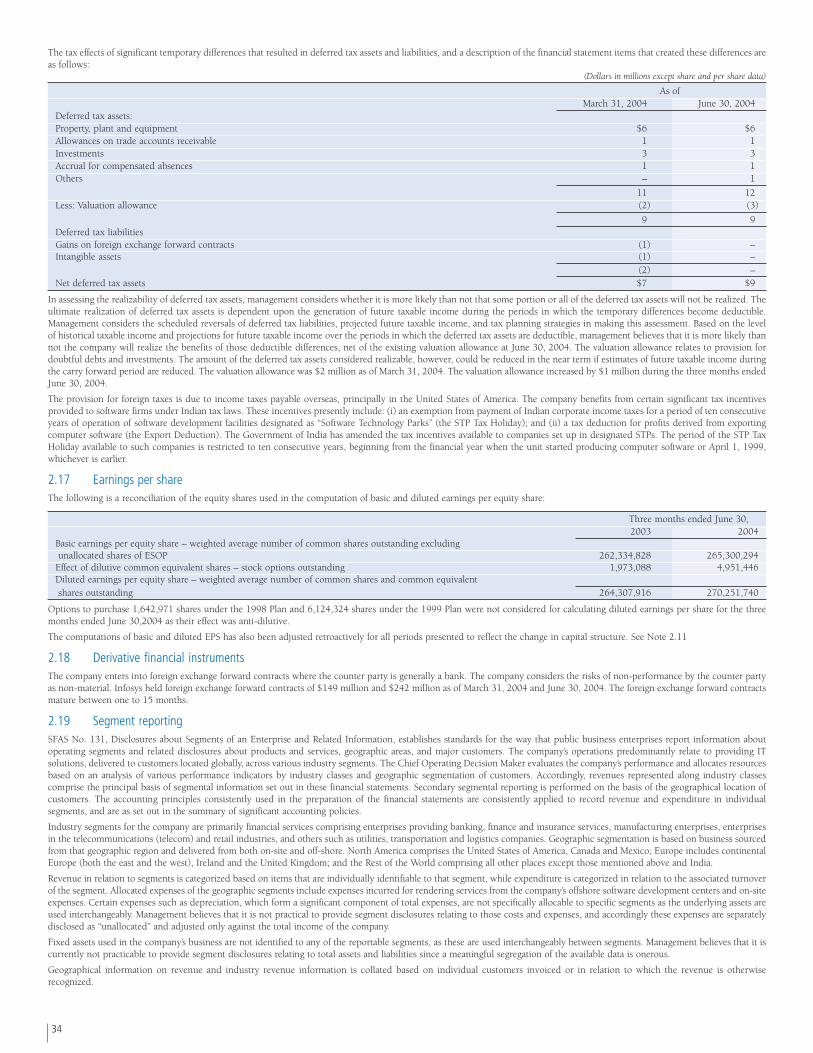
34
The tax effects of significant temporary differences that resulted in deferred tax assets and liabilities, and a description of the financial statement items that created these differences areas follows:
(Dollars in millions except share and per share data)
As ofMarch 31, 2004) June 30, 2004)
Deferred tax assets:Property, plant and equipment $6) $6)Allowances on trade accounts receivable 1) 1)Investments 3) 3)Accrual for compensated absences 1) 1)Others –) 1)
11) 12)Less: Valuation allowance (2) (3)
9) 9)Deferred tax liabilitiesGains on foreign exchange forward contracts (1) –)Intangible assets (1) –)
(2) –)Net deferred tax assets $7) $9)
In assessing the realizability of deferred tax assets, management considers whether it is more likely than not that some portion or all of the deferred tax assets will not be realized. Theultimate realization of deferred tax assets is dependent upon the generation of future taxable income during the periods in which the temporary differences become deductible.Management considers the scheduled reversals of deferred tax liabilities, projected future taxable income, and tax planning strategies in making this assessment. Based on the levelof historical taxable income and projections for future taxable income over the periods in which the deferred tax assets are deductible, management believes that it is more likely thannot the company will realize the benefits of those deductible differences, net of the existing valuation allowance at June 30, 2004. The valuation allowance relates to provision fordoubtful debts and investments. The amount of the deferred tax assets considered realizable, however, could be reduced in the near term if estimates of future taxable income duringthe carry forward period are reduced. The valuation allowance was $2 million as of March 31, 2004. The valuation allowance increased by $1 million during the three months endedJune 30, 2004.
The provision for foreign taxes is due to income taxes payable overseas, principally in the United States of America. The company benefits from certain significant tax incentivesprovided to software firms under Indian tax laws. These incentives presently include: (i) an exemption from payment of Indian corporate income taxes for a period of ten consecutiveyears of operation of software development facilities designated as “Software Technology Parks” (the STP Tax Holiday); and (ii) a tax deduction for profits derived from exportingcomputer software (the Export Deduction). The Government of India has amended the tax incentives available to companies set up in designated STPs. The period of the STP TaxHoliday available to such companies is restricted to ten consecutive years, beginning from the financial year when the unit started producing computer software or April 1, 1999,whichever is earlier.
2.17 Earnings per shareThe following is a reconciliation of the equity shares used in the computation of basic and diluted earnings per equity share:
Three months ended June 30,2003 2004
Basic earnings per equity share – weighted average number of common shares outstanding excluding unallocated shares of ESOP 262,334,828 265,300,294Effect of dilutive common equivalent shares – stock options outstanding 1,973,088 4,951,446Diluted earnings per equity share – weighted average number of common shares and common equivalent shares outstanding 264,307,916 270,251,740
Options to purchase 1,642,971 shares under the 1998 Plan and 6,124,324 shares under the 1999 Plan were not considered for calculating diluted earnings per share for the threemonths ended June 30,2004 as their effect was anti-dilutive.
The computations of basic and diluted EPS has also been adjusted retroactively for all periods presented to reflect the change in capital structure. See Note 2.11
2.18 Derivative financial instrumentsThe company enters into foreign exchange forward contracts where the counter party is generally a bank. The company considers the risks of non-performance by the counter partyas non-material. Infosys held foreign exchange forward contracts of $149 million and $242 million as of March 31, 2004 and June 30, 2004. The foreign exchange forward contractsmature between one to 15 months.
2.19 Segment reportingSFAS No. 131, Disclosures about Segments of an Enterprise and Related Information, establishes standards for the way that public business enterprises report information aboutoperating segments and related disclosures about products and services, geographic areas, and major customers. The company’s operations predominantly relate to providing ITsolutions, delivered to customers located globally, across various industry segments. The Chief Operating Decision Maker evaluates the company’s performance and allocates resourcesbased on an analysis of various performance indicators by industry classes and geographic segmentation of customers. Accordingly, revenues represented along industry classescomprise the principal basis of segmental information set out in these financial statements. Secondary segmental reporting is performed on the basis of the geographical location ofcustomers. The accounting principles consistently used in the preparation of the financial statements are consistently applied to record revenue and expenditure in individualsegments, and are as set out in the summary of significant accounting policies.
Industry segments for the company are primarily financial services comprising enterprises providing banking, finance and insurance services, manufacturing enterprises, enterprisesin the telecommunications (telecom) and retail industries, and others such as utilities, transportation and logistics companies. Geographic segmentation is based on business sourcedfrom that geographic region and delivered from both on-site and off-shore. North America comprises the United States of America, Canada and Mexico; Europe includes continentalEurope (both the east and the west), Ireland and the United Kingdom; and the Rest of the World comprising all other places except those mentioned above and India.
Revenue in relation to segments is categorized based on items that are individually identifiable to that segment, while expenditure is categorized in relation to the associated turnoverof the segment. Allocated expenses of the geographic segments include expenses incurred for rendering services from the company’s offshore software development centers and on-siteexpenses. Certain expenses such as depreciation, which form a significant component of total expenses, are not specifically allocable to specific segments as the underlying assets areused interchangeably. Management believes that it is not practical to provide segment disclosures relating to those costs and expenses, and accordingly these expenses are separatelydisclosed as “unallocated” and adjusted only against the total income of the company.
Fixed assets used in the company’s business are not identified to any of the reportable segments, as these are used interchangeably between segments. Management believes that it iscurrently not practicable to provide segment disclosures relating to total assets and liabilities since a meaningful segregation of the available data is onerous.
Geographical information on revenue and industry revenue information is collated based on individual customers invoiced or in relation to which the revenue is otherwiserecognized.

35
2.19.1 Industry segments(Dollars in millions except share and per share data)
Three months ended June 30, 2003 Financial services Manufacturing Telecom Retail Others Total
Revenues $87 $36 $34 $27 $49 $233Identifiable operating expenses 38 15 14 10 20 97Allocated expenses 24 9 9 7 12 61Segmental operating income 25 12 11 10 17 75Unallocable expenses 11Operating income 64Other income, net 5Income before income taxes 69Provision for income taxes 11
Net income $58
Three months ended June 30, 2004 Financial services Manufacturing Telecom Retail Others Total
Revenues $114 $50 $60 $38 $73 $335Identifiable operating expenses 49 23 28 14 30 144Allocated expenses 30 11 14 9 17 81Segmental operating income 35 16 18 15 26 110Unallocable expenses 14Operating income 96Other income, net –Income before income taxes 96Provision for income taxes 13
Net income $83
2.19.2 Geographic segments(Dollars in millions except share and per share data)
Three months ended June 30, 2003 North America Europe India Rest of the World Total
Revenues $174 $41 $5 $13 $233Identifiable operating expenses 74 16 2 5 97Allocated expenses 46 10 1 4 61Segmental operating income 54 15 2 4 75Unallocable expenses 11Operating income 64Other income, net 5Income before income taxes 69Provision for income taxes 11
Net income $58
Three months ended June 30, 2004 North America Europe India Rest of the World Total
Revenues $218 $75 $5 $37 $335Identifiable operating expenses 94 29 1 20 144Allocated expenses 52 17 1 13 83Segmental operating income 72 29 3 4 108Unallocable expenses 12Operating income 96Other income, net –Income before income taxes 96Provision for income taxes 13
Net income $83
2.19.3 Significant clientsNo client individually accounted for more than 10% of the revenues in the three month ended June 30, 2003 and 2004.
2.20 LitigationThe company is subject to legal proceedings and claims, which have arisen, in the ordinary course of its business. Legal actions, when ultimately concluded and determined, will not,in the opinion of management, have a material effect on the results of operations or the financial position of the company.
Ms. Jennifer Griffith, a former employee, has filed a lawsuit against the company and its former director, Mr. Phaneesh Murthy. The lawsuit has been served on the company.Management is reviewing the allegations. Based on its present knowledge of facts, management estimates that the lawsuit will not have a material impact on the results of operationsor financial position of the company.
2.21 Commitments and contingenciesThe company has outstanding performance guarantees for various statutory purposes totaling $2 million as of March 31, 2004 and June 30, 2004. These guarantees are generallyprovided to governmental agencies.
36
Item 2. Managements Discussion and Analysis of Financial Condition and Results of OperationsInvestors are cautioned that this discussion contains forward-looking statements that involve risks and uncertainties. When used in this discussion, the words “anticipate,”“believe,” “estimate,” “expect,” “intend,” “project,” “seek,” “should,” “will” and other similar expressions as they relate to us or our business are intended to identify suchforward-looking statements. We undertake no obligation to publicly update or revise any forward-looking statements, whether as a result of new information, future events,or otherwise. Actual results, performances or achievements could differ materially from those expressed or implied in such forward-looking statements. Factors that couldcause or contribute to such differences include those described under the heading “Risk Factors” in this Quarterly Report. Readers are cautioned not to place undue relianceon these forward-looking statements, as they speak only as of the date of this Quarterly Report. The following discussion and analysis should be read in conjunction withour financial statements included herein and the notes thereto.
OverviewWe are a leading global IT services company founded in 1981, and headquartered in Bangalore, India. Progeon Limited (“Progeon”) is a majority-owned and controlledsubsidiary while Infosys Technologies (Australia) Pty. Limited (Infosys Australia), Infosys Technologies (Shanghai) Co. Limited (Infosys China) and Infosys Consulting Inc.(Infosys Consulting) are our wholly-owned and controlled subsidiaries. We provide end-to-end business solutions that leverage technology, thus enabling our clients toenhance business performance. Our solutions span the entire software life cycle, encompassing consulting, design, development, re-engineering, maintenance, systemsintegration, package evaluation, and implementation. In addition, we offer software products for the banking industry and we also offer business process managementservices through Progeon, which typically include offsite customer relationship management, finance and accounting, administration and sales order processing functions.
We completed our initial public offering of equity shares in India in 1993 and our initial public offering of ADSs in the United States in 1999. In August 2003, on behalf ofour stockholders, we completed a sponsored secondary offering of ADSs in the United States. We did not receive any of the proceeds from this sponsored secondaryoffering.
Our revenues grew from $121 million in fiscal 1999 to $1,063 million in fiscal 2004, representing a compound annual growth rate of 54.4%. Our net income grew from$18 million, after a one-time stock compensation expense to $270 million during the same period, representing a compound annual growth rate of 72.9%. Our revenuegrowth is attributable to a number of factors, including an increase in the size and number of projects for existing and new clients. For fiscal 2004, 93.4% of our revenuecame from repeat business, which we define as revenue from a client who also contributed to our revenue during the prior fiscal year. Between March 31, 1999 andMarch 31, 2004 our total employees grew from approximately 3,800 to approximately 23,800 representing a compound annual growth rate of 44.3%. In addition, Progeonhad approximately 1,900 employees as of March 31, 2004. Our revenues were $335 million for the three months ended June 30, 2004 and repeat business was 98.5% ofour revenues for the period. We had approximately 28,000 employees as of June 30, 2004 including 2,300 employees in Progeon.
We use a distributed project management methodology that we refer to as our Global Delivery Model. We divide projects into components that we execute simultaneouslyat client sites and at our geographically dispersed development centers in India and around the world. Our Global Delivery Model allows us to efficiently execute projectsacross time zones and development centers, thereby optimizing our cost structure. We also offer a secure and redundant infrastructure for all client data. We earned 71.2%of our total revenues from North America, 19.2% from Europe, 1.4% from India and 8.2% from the rest of the world for fiscal 2004.
Our revenues are generated principally from IT services provided on either a time-and-materials or a fixed-price, fixed-time frame basis. Revenues from services providedon a time-and-materials basis are recognized as the related services are performed. Revenues from services provided on a fixed-price, fixed-time frame basis are recognizedpursuant to the percentage of completion method. Most of our client contracts, including those that are on a fixed-price, fixed-time frame, basis can be terminated with orwithout cause, without penalties and with short notice periods between zero and 90 days. Since we collect revenues on contracts as portions of the contracts are completed,terminated contracts are only subject to collection for portions of the contract completed through the time of termination. Our contracts do not contain specific termination-related penalty provisions. In order to manage and anticipate the risk of early or abrupt contract terminations, we monitor the progress on all contracts and change ordersaccording to their characteristics and the circumstances in which they occur. This includes a focused review of our ability and our client's ability to perform on the contract,a review of extraordinary conditions that may lead to a contract termination, as well as historical client performance considerations. Since we also bear the risk of costoverruns and inflation with respect to fixed-price, fixed-time frame projects, our operating results could be adversely affected by inaccurate estimates of contract completioncosts and dates, including wage inflation rates and currency exchange rates that may affect cost projections. Losses on contracts, if any, are provided for in full in the periodwhen determined. Although we revise our project completion estimates from time to time, such revisions have not, to date, had a material adverse effect on our operatingresults or financial condition. We also generate revenue from software application products, including banking software. Such software products represented 2.8% of ourtotal revenues for fiscal 2004.
Even though we are witnessing a stable pricing environment at present, we have experienced pricing pressure from our clients, especially during the recent economicdownturn, which has adversely affected our revenues, margins and gross profits. For example, clients often expect that as we do more business with them, they will receivevolume discounts. Additionally, clients may ask for fixed-price arrangements or reduced rates. We attempt to use fixed-price agreements for work where the specificationsare complete, so individual rates are not negotiated. We are also adding new services at higher price points and where more value is added for our clients.
Our cost of revenues primarily consists of salary and other compensation expenses, depreciation, overseas travel expenses, cost of software purchased for internal use,subcontracting costs, data communications expenses and computer maintenance. We depreciate our personal computers and servers over two years and mainframecomputers over three years. Third party software is written off over the estimated useful life. Cost of revenues also includes amortization of deferred stock compensationexpense arising from option grants relating to the 1994 stock option plan which have been accounted for under the intrinsic value method. The deferred stock compensationexpenses have been completely amortized as of March 31, 2004.
We typically assume full project management responsibility for each project that we undertake. Approximately 68.1% of the total billed person months during fiscal 2004was performed at our global development centers in India, and the balance of the work was performed at client sites and global development centers located outside India.The proportion of work performed at our facilities and at client sites varies from quarter to quarter. We charge higher rates and incur higher compensation and otherexpenses for work performed at client sites and global development centers located outside India. Services performed at a client site or global development centers locatedoutside India typically generate higher revenues per-capita at a lower gross margin than the same services performed at our facilities in India. As a result, our total revenues,cost of revenues and gross profit in absolute terms and as a percentage of revenues fluctuate from quarter to quarter based on the proportion of work performed outsideIndia. Additionally, any increase in work performed at client sites or global development centers located outside India can decrease our gross profits. We hire subcontractorson a limited basis from time to time for our own IT development needs, and we generally do not perform subcontracted work for other IT service providers. For fiscal 2004approximately 2.3% of our cost of revenues was attributable to subcontracting costs. We do not anticipate that our subcontracting needs will increase significantly as weexpand our business.
Revenues and gross profits are also affected by employee utilization rates. We define employee utilization as the proportion of total billed person months to total availableperson months excluding support personnel. We manage utilization by monitoring project requirements and timetables. The number of consultants assigned to a projectwill vary according to size, complexity, duration, and demands of the project. An unanticipated termination of a significant project could also cause us to experience lowerIT professional utilization resulting in a higher than expected number of unassigned IT professionals. In addition, we do not fully utilize our IT professionals when they areenrolled in training programs, particularly our 14-week training course for new employees.
Selling and marketing expenses represent 5.0%, 7.4% and 7.2% of total revenues for fiscal 2002, 2003 and 2004. Our selling and marketing expenses primarily consist ofexpenses relating to salaries of sales and marketing personnel, travel, brand building, sales and marketing offices and telecommunications. We have recently decided toincrease our selling and marketing expenses as a percentage of revenues to increase brand awareness among target clients and promote client loyalty and repeat businessamong existing clients. During fiscal 2003, we redeployed certain employees from our delivery function to sales and marketing. General and administrative expenses

37
represent 8.1%, 7.7% and 7.7% of total revenues for fiscal 2002, 2003 and 2004. Our general and administrative expenses comprise of expenses relating to salaries of seniormanagement and other support personnel, travel expenses, legal and other professional fees, telecommunications, utilities and other miscellaneous administrative costs.
Amortization of stock compensation expense consists of costs relating to option grants under the 1994 stock option plan which have not been included in costof revenues. These costs have been accounted under the intrinsic value method. The deferred stock compensation expenses have been completely amortized as ofMarch 31, 2004.
Our amortization of intangible assets consists of non-cash expenses arising from the acquisition of certain intellectual property rights and identified intangibles arising frompurchase price allocations for business combinations. We amortize intangible assets over their estimated useful lives.
Other income/(expense), net includes interest income, income from mutual fund investments, foreign currency exchange gains/losses including marked to marketgain/losses on foreign exchange forward contracts, and provisions for losses on investments.
Our functional currency is the Indian rupee. The functional currency for Infosys Australia, Infosys China and Infosys Consulting is the respective local currency. Thefinancial statements included in this Report are reported in U.S. dollars. The translation of rupees to dollars is performed for the balance sheet accounts using the exchangerate in effect at the balance sheet date, and for revenue and expense accounts using a monthly average exchange rate for the respective periods. The gains or losses resultingfrom such translation are reported as other comprehensive income.
Generally, Indian law requires residents of India to repatriate any foreign currency earnings to India to control the exchange of foreign currency. More specifically,Section 8 of the Foreign Exchange Management Act, or FEMA, requires an Indian company to take all reasonable steps to realize and repatriate into India all foreignexchange earned by the company outside India, within such time periods and in the manner as specified by the Reserve Bank of India, or RBI. The RBI has promulgatedguidelines that require the company to repatriate any realized foreign exchange back to India, and either:
• sell it to an authorized dealer for rupees within seven days from the date of receipt of the foreign exchange;• retain it in a foreign currency account such as an Exchange Earners Foreign Currency; or EEFC, account with an authorized dealer; or• use it for discharge of debt or liabilities denominated in foreign exchange.
We typically collect our earnings and pay expenses denominated in foreign currencies using a dedicated foreign currency account located in the local country of operation.In order to do this, we are required to, and have obtained, special approval from the RBI to maintain a foreign currency account in overseas countries like the United States.However, the RBI approval is subject to limitations, including a requirement that we repatriate all foreign currency in the account back to India within a reasonable time,except an amount equal to our local monthly operational cost of our overseas branch and personnel. We currently pay such expenses and repatriate the remainder of theforeign currency to India on a regular basis. We have the option to retain those in an EEFC account (foreign currency denominated) or an Indian-rupee-denominatedaccount. We convert substantially all of our foreign currency to rupees to fund operations and expansion activities in India.
Our failure to comply with these regulations could result in RBI enforcement actions against us.
Income taxesOur net income earned from providing services outside India is subject to tax in the country where we perform the work. Most of our tax paid in countries other than Indiacan be applied as a credit against our Indian tax liability to the extent that the same income is subject to tax in India.
Currently, we benefit from the tax holidays the Government of India gives to the export of IT services from specially designated software technology parks in India. As aresult of these incentives, our operations have been subject to relatively low tax liabilities. These tax incentives include a 10-year tax holiday from Indian corporate incometaxes for the operation of most of our Indian facilities and a partial taxable income deduction for profits derived from exported IT services. We can use either of these twotax incentives. As a result of these two tax exemptions, a substantial portion of our pre-tax income has not been subject to significant tax in recent years. These tax incentivesresulted in a decrease in our income tax expense of $51 million, $78 million and $26 million for fiscal 2003, 2004 and three months ended June 30, 2004 compared to theeffective tax rates that we estimate would have applied if these incentives had not been available.
The Finance Act, 2000 phases out the ten-year tax holiday over a ten-year period from fiscal 2000 through fiscal 2009. Accordingly, facilities set up in India on or beforeMarch 31, 2000 have a ten-year tax holiday, new facilities set up on or before March 31, 2001 have a nine-year tax holiday and so forth until March 31, 2009. AfterMarch 31, 2009, the tax holiday will no longer be available to new facilities. Our current tax holidays expire in stages by 2009. For companies opting for the partial taxableincome deduction for profits derived from exported IT services, the Finance Act, 2000 phases out the deduction over five years beginning April 1, 2000.
When our tax holiday and taxable income deduction expire or terminate, our tax expense will materially increase, reducing our profitability. As a result of such taxincentives, our effective tax rate for fiscal 2004 was 15.8% and our Indian statutory tax rate for the same period was 35.9%.
Results for the three months ended June 30, 2004 compared to the three months ended June 30, 2003Revenues. Our revenues were $335 million in the three months ended June 30, 2004, representing an increase of $102 million, or 43.8 % over revenues of $233 millionfor the three months ended June 30, 2003. Revenues continued to increase in most segments of our services. The increase in revenues was attributable, in part, to anincrease in business from existing clients and from certain new clients, particularly in industries such as retail, telecom, utilities and logistics. Our clients in the financialservices industry comprised 34.0% and 37.3% of revenues for the three months ended June 30, 2004 and 2003. Clients in the manufacturing sector comprised 14.9%and 15.5% of revenues for the same periods. Our clients in the retail industry comprised 11.3% and 11.6% of revenues for the three months ended June 30, 2004 and 2003,while our clients in the telecom industry comprised 17.9% and 14.6% of revenues for the same periods. Clients in other industries such as utilities, logistics and servicescontributed 21.8% and 21.0% of revenues for the three months ended June 30, 2004 and 2003. Sales of our software products represented 2.4% of our total revenues forthe three months ended June 30, 2004 as compared to 3.6% for the three months ended June 30, 2003. Revenues from services represented 97.6% of total revenues for thethree months ended June 30, 2004, as compared to 96.4% for the three months ended June 30, 2003. Revenues from fixed-price, fixed-time frame contracts and from time-and-materials contracts represented 29.7% and 70.3% of total services revenues for the three months ended June 30, 2004, as compared to 35.7% and 64.3% for the threemonths ended June 30, 2003. Revenues from North America, Europe, India and the rest of the world represented 65.1%, 22.4%, 1.5% and 11.0% of total revenues for thethree months ended June 30, 2004 as compared to 74.7%, 17.6%, 2.1% and 5.6% for the three months ended June 30, 2003.
During the three months ended June 30, 2004, the total billed person months for our services other than business process management grew by 44.7% compared to thethree months ended June 30, 2003. The onsite and offshore volume growth were 39.1% and 47.6% during the three months ended June 30, 2004 as compared to the threemonths ended June 30, 2003. This growth during the three months ended June 30, 2004 was offset by a pricing decline of 0.6% in U.S. dollar terms consisting of 0.6%decline in onsite rates and a 2.2% increase in offshore rates compared to the three months ended June 30, 2003.
Cost of revenues. Our cost of revenues was $190 million for the three months ended June 30, 2004, representing an increase of $57 million, or 42.9%, over our cost ofrevenues of $133 million for the three months ended June 30, 2003. Cost of revenues represented 56.7% and 57.1% of total revenues for the three months ended June 30,2004 and 2003. The increase in our cost of revenues is mainly attributable to an increase of approximately $47 million in personnel costs due to new hires and compensationreview effected in April 2004, $3 million in depreciation expenses, $1 million in communication expenses, $5 million in overseas travel expenses, $2 million in softwarepurchased for own use, and $2 million in accruals for post sales client support offset by a decrease of approximately $3 million in subcontractor costs. Cost of revenue forthe three months ended June 30, 2003 also included amortization of deferred stock compensation expense of $1 million. The deferred stock compensation has beencompletely amortized as of March 31, 2004.
Gross profit. As a result of the foregoing, our gross profit was $145 million for the three months ended June 30, 2004, representing an increase of $45 million, or 45.0%, overour gross profit of $100 million for fiscal 2003. As a percentage of revenues, gross profit increased to 43.3% for the three months ended June 30, 2004 from 42.9% for the

38
three months ended June 30, 2003. The increase is attributable to a 43.8 % increase in revenues for the three months ended June 30, 2004 offset by a 42.9% increase in costof revenues in the same period compared to the three months ended June 30, 2003.
Selling and marketing expenses. We incurred selling and marketing expenses of $23 million in the three months ended June 30, 2004 representing an increase of $6 million,or 35.3%, over the $17 million expended in the three months ended June 30, 2003. As a percentage of total revenues, selling and marketing expenses were 6.9% and 7.3%for the three months ended June 30, 2004 and 2003. The number of our sales and marketing personnel increased to 313 as of June 30, 2004, from 275 as of June 30, 2003.The increase in selling and marketing expenses is mainly attributable to increase of approximately $3 million in personnel costs of selling and marketing employees onaccount of new hires and compensation review effective April 2004, $1 million in overseas travel expenses, and $2 million in other expenses.
General and administrative expenses. Our general and administrative expenses were $26 million for the three months ended June 30, 2004, representing an increase of$8 million, or 44.4%, over general and administrative expenses of $18 million for the three months ended June 30, 2003. General and administrative expenses were 7.8%and 7.7% of total revenues for the three months ended June 30, 2004 and 2003. The increase in general and administrative expenses was primarily attributable to increaseof approximately $2 million for personnel costs on account of new hires and compensation review effective April 2004 and increase of $1 million each in travel,telecommunication charges, office maintenance, power and fuel charges, insurance charges, professional charges and provision for doubtful accounts. The factors whichaffect the fluctuations in our provisions for bad debts and write offs of uncollectible accounts include the financial health and economic environment of our clients. Wespecifically identify the credit loss and then make the provision. No one client has contributed significantly to a loss, and we have had no significant changes in ourcollection policies or payment terms. There has also been a decrease of $1 million in rental expenses.
Amortization of stock compensation expenses. Amortization of stock compensation expenses was less than $1 million for the three months ended June 30, 2003. The deferredstock compensation has been completely amortized as of March 31, 2004.
Amortization of intangible assets. Amortization of intangible assets was $1 million for the three months ended June 30, 2003. This relates to amortization of certain intellectualproperty rights we acquired through purchases and licenses of software during fiscal 2003. These intangible assets were completely amortized as of March 31, 2004. Theamortization for the three months ended June 30, 2004 represents amortization of the identified customer contract intangibles arising on the allocation of purchase price ofExpert Information Services Pty. Limited, Australia. The same was less than $1 million for the three months ended June 30, 2004.
Operating income. Our operating income was $96 million for the three months ended June 30, 2004 representing an increase of $32 million, or 50.0%, over our operatingincome of $64 million for the three months ended June 30, 2003. As a percentage of revenues, operating income increased to 28.7% for the three months ended June 30,2004 from 27.5% for the three months ended June 30, 2003.
Other income/(expense),net. Other income, consisting mainly of interest and dividend income, foreign exchange gains and provision for investments, was $5 million for thethree months ended June 30, 2003. The same was less than $1 million for the three months ended June 30, 2004. Interest and dividend income increased to $7 millionduring the three months ended June 30, 2004 compared to $4 million during the three months ended June 30, 2003. This increase is on account of the increased level ofcash invested.
We had foreign currency exchange gains of $ 2 million in the three months ended June 30, 2003 compared to a loss of $7 million in the three months ended June 30, 2004.The exchange rate between the rupee and the U.S. dollar decreased by 2.4% from Rs. 47.53 per U.S. dollar on March 31, 2003 to Rs. 46.40 on June 30, 2003. The exchangerate between the rupee and the U.S. dollar increased by 6.0% from Rs. 43.40 per U.S. dollar on March 31, 2004 to Rs. 45.99 on June 30, 2004. The average exchange ratebetween the rupee and the U.S. dollar was Rs. 46.95 and Rs. 45.31 per U.S. dollar for the three months ended June 30, 2003 and 2004 respectively. For the three monthsended June 30, 2004 and 2003, U.S. dollar denominated revenues represented and 77.5% and 87.3% of total revenues. The company purchases foreign exchange forwardcontracts to mitigate the risk of changes in foreign exchange rates on accounts receivable and forecasted cash flows denominated in certain foreign currencies. As of June 30,2004 and 2003 we had $242 million and $275 million of forward cover. Our accounting policy requires us to mark to market and recognize the effect in earningsimmediately of any derivative that is either not designated a hedge, or is so designated but is ineffective as per SFAS 133. Mark to market gains for the three months endedJune 30, 2003 was less than $1 million while the loss for the three months ended June 30, 2004 was $7 million.
Provision for investments during the three months ended June 30, 2003 include write-downs to investments in CiDRA Corporation ($1.0 million) and Stratify Inc($0.4 million). These write-downs were required due to the non-temporary impact of adverse market conditions on these entities' business models and contemporarytransactions on the securities of the entities which have been indicative of their current fair value.
Provision for income taxes. Our provision for income taxes was $13 million for the three months ended June 30, 2004, representing an increase of $2 million, or 18.2% overour provision for income taxes of $11 million for the three months ended June 30, 2003. Our effective tax rate decreased to 13.5% for three months ended June 30, 2004from 15.9% for the three months ended June 30, 2003.
Net income. Our net income was $83 million for the three months ended June 30, 2004, representing an increase of $25 million, or 43.1%, over our net income of$58 million for the three months ended June 30, 2003. As a percentage of total revenues, net income decreased to 24.8% for three months ended June 30, 2004 from 24.9%for three months ended June 30, 2003.
Liquidity and capital resourcesOur growth has been financed largely by cash generated from operations and, to a lesser extent, from the proceeds from the sale of equity. In 1993, we raised approximately$4.4 million in gross aggregate proceeds from our initial public offering of equity shares in India. In 1994, we raised an additional $7.7 million through private placementsof our equity shares with foreign institutional investors, mutual funds, Indian domestic financial institutions and corporations. On March 11, 1999 we raised $70.4 millionin gross aggregate proceeds from our initial U.S. public offering of ADSs.
As of June 30, 2004 we had $283 million in cash and cash equivalents, $185 million invested in liquid mutual fund units, $570 million in working capital and nooutstanding bank borrowings or long term debt. We believe that a sustained reduction in IT spending, a longer sales cycle, and a continued economic downturn in any ofthe various industry segments in which we operate, could result in a decline in our revenue and negatively impact our liquidity and cash resources.
Net cash provided by operating activities was $47 million and $74 million for the three months ended June 30, 2004 and 2003. Net cash provided by operations consistedprimarily of net income and increases in unearned revenue and provision for income taxes, offset in part by an increase in accounts receivable and decrease in other accruedliabilities. Trade accounts receivable increased by $41 million during the three months ended June 30, 2004. Accounts receivable as a percentage of last 12 months revenuesrepresented 15.6% and 14.7% as of June 30, 2004 and 2003.
Prepaid expenses and other current assets decreased by $5 million during the three months ended June 30, 2004, as compared to a $2 million increase during the threemonths ended June 30, 2003. The decrease during the three months ended June 30, 2004 is primarily due to reversal of marked to market gains on forward foreignexchange contracts as of March 31, 2004. There has been an increase in unbilled revenues of $7 million during the three months ended June 30, 2004. Unbilled revenuesrepresent revenues that are recognized but not yet invoiced. Unearned revenues increased by $7 million during the three months ended June 30, 2004. Unearned revenueresulted primarily from advance client billings on fixed-price, fixed-time frame contracts for which related efforts have not been expended. Revenues from fixed-price,fixed-time frame contracts and from time-and-materials contracts represented 29.7% and 70.3% of total services revenues for the three months ended June 30, 2004, ascompared to 35.7% and 64.3% for the three months ended June 30, 2003.
Other accrued liabilities decreased by $17 million during the three months ended June 30, 2004, primarily due to the payment during the period of a one-time incentiveof approximately $23 million to employees on the company achieving one billion dollars in annual revenues offset by $7 million accrual of marked to market loss onforward foreign exchange contracts. Other accrued liabilities increased by $6 million during the three months ended June 30, 2003.
Net cash used in investing activities was $15 million and $34 million for the three months ended June 30, 2004 and 2003. Net cash used in investing activities, relating

39
to our acquisition of additional property, plant and equipment for the three months ended June 30, 2004 and 2003, was $34 million and $13 million. During thethree months ended June 30, 2003, we invested $22 million in liquid mutual funds, while we redeemed investments of $20 million during the three months endedJune 30, 2004.
We provide various loans primarily to employees in India who are not executive officers or directors, including car loans, home loans, personal computer loans, telephoneloans, medical loans, marriage loans, personal loans, salary advances, education loans and loans for rental deposits. All of these loans, except for the housing and car loans,are available to all of our employees, who are not executive officers or directors, in India. Housing and car loans are available only to mid-level managers, senior managersand non-executive officers. The loan program is designed to assist our employees and increase employee satisfaction. These loans are generally collateralized against theassets of the loan and the terms of the loans range from 1 to 100 months. In the aggregate, these loans represented approximately $27 million as of March 31, 2004 and June30 2004. During fiscal 2004, we discontinued fresh disbursements under several of these loan schemes including housing and car loans.
Net cash used in financing activities for the three months ended June 30, 2004 was $170 million. This is primarily comprises $18 million of cash raised by issuance ofcommon stock on exercise of stock options by employees, offset by dividend payments of $188 million. Dividend payments are on account of a final dividend of Rs. 15 perequity share for fiscal 2004 and a special one-time dividend of Rs. 100 per equity share paid in June 2004. Net cash used in financing activities for three months endedJune 30, 2003 primarily comprised $23 million of dividend payments. As of June 30, 2004, we had contractual commitments for capital expenditure of $50 million. Thesecommitments include approximately $43 million in domestic purchases and $7 million in imports and overseas commitments for hardware, supplies and services tosupport our operations generally, which we expect to be significantly completed by December 2004.
We have provided information to the public regarding forward-looking guidance on our business operations. This information is consistent with market expectations.
Reconciliation between Indian and U.S. GAAPAll financial information in this annual report is presented in U.S. GAAP, although we also report for Indian statutory purposes under Indian GAAP. There are materialdifferences between financial statements prepared in Indian and U.S. GAAP. The material differences that affect us are primarily attributable to U.S. GAAP requirementsfor the:
• accounting for stock-based compensation;• deferred taxes; and• accounting for foreign exchange forward contracts
Reconciliation of net income(Dollars in millions)
Three months ended June 30,2003) 2004)
Net profit as per Indian GAAP $59) $86)Amortization of stock compensation expense (1) –)Forward contracts - marked to market –) (4)Deferred taxes –) 1)Net income as per U.S. GAAP $58) $83)
Quantitative and qualitative disclosures about market risk
GeneralMarket risk is the risk that changes in the price of a financial instrument will impact future earnings or cash flow. The value of a financial instrument may change as a resultof changes in the interest rates, foreign currency exchange rates, commodity prices, equity prices and other market changes that affect market risk sensitive instruments.Market risk is attributable to all market sensitive financial instruments including foreign currency receivables and payables.
Our exposure to market risk is a function of our borrowing activities and revenue generating activities in foreign currency. The objective of market risk management is toavoid excessive exposure of our earnings and equity to loss. Most of our exposure to market risk arises out of our foreign currency accounts receivable.
Risk management proceduresWe manage market risk through treasury operations. Treasury operations' objectives and policies are approved by senior management and our audit committee. Theactivities of treasury operations include management of cash resources, implementing hedging strategies for foreign currency exposures, borrowing strategies, if any, andensuring compliance with market risk limits and policies.
Components of market riskExchange rate risk. Our exposure to market risk arises principally from exchange rate risk. Even though our functional currency is the Indian rupee, we transact a majorportion of our business in foreign currencies, particularly the U.S. dollar. The exchange rate between the rupee and the dollar has changed substantially in recent yearsand may fluctuate substantially in the future. Consequently, the results of our operations are adversely affected as the rupee appreciates against dollar. For the threemonths ended June 30, 2004, and 2003 our U.S. dollar denominated revenues represented 77.5% and 87.3% of our total revenues. Our exchange rate risk primarilyarises from our foreign currency revenues, receivables and payables. We have sought to reduce the effect of exchange rate fluctuations on our operating results bypurchasing foreign exchange forward contracts to cover a portion of outstanding accounts receivable. As of March 31, 2004 and June 30, 2004, we had outstandingforward contracts in the amount of $149 million and $242 million. These contracts typically mature within one to fifteen months, must be settled on the day of maturityand may be cancelled subject to the payment of any gains or losses in the difference between the contract exchange rate and the market exchange rate on the date ofcancellation. We use these instruments only as a hedging mechanism and not for speculative purposes. We may not purchase adequate contracts to insulate ourselves fromforeign exchange currency risks. The policies of the Reserve Bank of India may change from time to time which may limit our ability to hedge our foreign currencyexposures adequately. In addition, any such contracts may not perform adequately as a hedging mechanism. We may, in the future, adopt more active hedging policies,and have done so in the past.
Fair value. The fair value of our market rate risk sensitive instruments approximates their carrying value.
Critical accounting policiesWe consider the policies discussed below to be critical to an understanding of our financial statements as their application places the most significant demands onmanagement's judgment, with financial reporting results relying on estimation about the effect of matters that are inherently uncertain. Specific risks for these criticalaccounting policies are described in the following paragraphs. For all of these policies, future events rarely develop exactly as forecast, and the best estimates routinelyrequire adjustment.

40
EstimatesWe prepare financial statements in conformity with U.S. GAAP, which requires us to make estimates and assumptions that affect the reported amounts of assets andliabilities, disclosure of contingent assets and liabilities on the date of the financial statements and the reported amounts of revenues and expenses during the financialreporting period. We primarily make estimates related to contract costs expected to be incurred to complete development of software, allowances for doubtful accountsreceivable, our future obligations under employee retirement and benefit plans, useful lives of property, plant and equipment, future income tax liabilities and contingenciesand litigation.
We continually evaluate these estimates and assumptions based on the most recently available information, our own historical experience and on various other assumptionsthat are believed to be reasonable under the circumstances, the results of which form the basis for making judgments about the carrying values of assets and liabilities thatare not readily apparent from other sources. Since the use of estimates is an integral component of the financial reporting process, actual results could differ from thoseestimates.
Revenue recognitionWe derive our revenues primarily from software development and related services, licensing of software products and from business process management services. We makeand use significant management judgments and estimates in connection with the revenue that we recognize in any accounting period. Material differences may result in theamount and timing of our revenue for any period, if we made different judgments or utilized different estimates.
Arrangements with customers for software development and related services are either on a fixed-price, fixed-time frame or on a time-and-material basis. Revenueon time-and-material contracts is recognized as the related services are rendered. Revenue from the end of the last billing to the balance sheet date is recognized as unbilledrevenues. Maintenance revenues are recognized ratably over the term of the underlying maintenance arrangement. When the company receives advances for services andproducts, such amounts are reported as client deposits until all conditions for revenue recognition are met.
Revenue from our fixed-price arrangements for software development and related services that involves significant production, modification or customization of thesoftware, is accounted in conformity with ARB No. 45, using the guidance in Statement of Position (SOP) 81-1, and the Accounting Standards Executive Committee’sconclusion in paragraph 95 of SOP 97-2. Fixed-price arrangements, which are similar to “contracts to design, develop, manufacture, or modify complex aerospace orelectronic equipment to a buyer’s specification or to provide services related to the performance of such contracts” and “contracts for services performed by architects,engineers, or architectural or engineering design firms,” as laid out in Paragraph 13 of SOP 81-1, are also accounted for in conformity with SOP 81-1.
In the above mentioned fixed price arrangements, revenue has been recognized using the percentage-of-completion method. Costs and earnings in excess of billings areclassified as unbilled revenue while billings in excess of costs and earnings are classified as unearned revenue. In measuring progress towards completion, we have selecteda method that we believe is reliable and best approximates the progress to completion. The input (efforts expended) method has been used to measure progress towardscompletion as there is a direct relationship between labor hour input and productivity and the method indicates the most reliable measure of progress. However, we evaluateeach contract and apply judgment to ensure the existence of a relationship between labor hours input and productivity.
At the end of every reporting period, we evaluate each project for estimated revenue and estimated efforts. Any revisions or updates to existing estimates are made whereverrequired by obtaining approvals from officers having the requisite authority. Management regularly reviews and evaluates the status of each contract in progress to estimatethe profit or loss. As part of the review, detailed actual efforts and a realistic estimate of efforts to complete all phases of the project is compared with the details of the originalestimate and the total contract price. To date, we have not had any fixed-price, fixed-time frame contracts that resulted in a material loss. However, our policy is to establisha provision for losses on a contract as soon as losses become evident. We evaluate change orders according to their characteristics and the circumstances in which they occur.If such change orders are considered by the parties to be a normal element within the original scope of the contract, no change in the contract price is made. Otherwise, theadjustment to the contract price may be routinely negotiated. Contract revenue and costs are adjusted to reflect change orders approved by the client and us, regarding bothscope and price. Changes are reflected in revenue recognition only after the change order has been approved by both parties. The same principle is also followed forescalation clauses. Costs that are incurred for a specific anticipated contract that will result in no future benefits unless the contract is obtained are not included in contractcosts or deferred costs before the signing of the contract. Such costs are deferred only if the costs can be directly associated with a specific anticipated contract and if theirrecoverability from that contract is determined to be probable.
We provide our clients with a fixed-period warranty for corrections of errors and telephone support on all fixed-price, fixed-time frame contracts. Costs associated withsuch support services are accrued at the time related revenues are recorded and included in cost of revenues. We estimate such costs based on historical experience, andreview estimates on a periodic basis for any material changes in assumptions and likelihood of occurrence.
In accordance with SOP 97-2, Software Revenue Recognition, license fee revenues are recognized when persuasive evidence of an arrangement exists, delivery has occurred,the license fee is fixed and determinable, and the collection of the fee is probable. Arrangements to deliver our software product generally have three elements: license,implementation and Annual Technical Services, or ATS. We have applied the principles in SOP 97-2 to account for revenue from these multiple element arrangements.Vendor Specific Objective Evidence of fair value or VSOE has been established for ATS. VSOE is the price charged when the element is sold separately. When other servicesare provided in conjunction with the licensing arrangement, the revenue from such contracts are allocated to each component of the contract using the residual method,whereby revenue is deferred for the undelivered services and the residual amounts are recognized as revenue for delivered elements. In the absence of an established VSOEfor implementation, the entire arrangement fee for license and implementation is recognized as the implementation is performed. Revenue from client training, support andother services arising due to the sale of software products is recognized as the services are performed. ATS revenue is recognized ratably over the period in which the servicesare rendered.
Revenues from business process management and other services are recognized on both the time-and-material and fixed-price, fixed-time frame bases. Revenue on time-and-material contracts is recognized as the related services are rendered. Revenue from fixed-price, fixed-time frame contracts is recognized as per the proportionalperformance method using an output measure of performance.
We recognize revenue only on collectibility being probable and hence credit losses do not have an impact on our revenue recognition policy. Fluctuations in ourprovisions for bad debts and write offs of uncollectible accounts depend on the financial health and economic environment governing our clients. Our provisions are basedon specific identification of the credit loss. No one client has contributed significantly to credit losses. We have had no significant changes in our collection policies orpayment terms.
Income taxesAs part of our financial reporting process, we are required to estimate our liability for income taxes in each of the tax jurisdictions in which we operate. This processrequires us to estimate our actual current tax exposure together with an assessment of temporary differences resulting from differing treatment of items, such asdepreciation on property, plant and equipment, for tax and accounting purposes. These differences result in deferred tax assets and liabilities, which are included withinour balance sheet.
We face challenges from domestic and foreign tax authorities regarding the amount of current taxes due. These challenges include questions regarding the timing andamount of deductions and the allocation of income among various tax jurisdictions. Based on our evaluation of our tax position and the information presently available tous, we believe we have adequately accrued for probable exposures as of June 30, 2004. To the extent we are able to prevail in matters for which accruals have beenestablished or are required to pay amounts in excess of our reserves, our effective tax rate in a given financial statement period may be materially impacted.
Our deferred tax liabilities mainly arise from taxable basis differences in foreign exchange forward contracts, intangible assets and investments in liquid mutual funds. Ourdeferred tax assets comprise assets arising from basis differences in depreciation on property, plant and equipment, investments for which the ultimate realization of the tax

41
asset may be dependent on the availability of future capital gains, and provisions for doubtful accounts receivable. We assess the likelihood that our deferred tax assets willbe recovered from future taxable income. This assessment takes into consideration tax planning strategies, including levels of historical taxable income and assumptionsregarding the availability and character of future taxable income over the periods in which the deferred tax assets are deductible. We believe it is more likely than not thatwe will realize the benefits of those deductible differences, net of the existing valuation allowance at June 30, 2004. The ultimate amount of deferred tax assets realized maybe materially different from those recorded, as influenced by potential changes in income tax laws in the tax jurisdictions where we operate.
To the extent we believe that realization of a deferred tax asset is not likely, we establish a valuation allowance or increase this allowance in an accounting period andinclude an expense within the tax provision in our statements of income. As of March 31, 2004 and June 30, 2004, we recorded valuation allowances of $2 million and$3 million due to uncertainties related to our ability to utilize some of our deferred tax assets comprising provisions for doubtful accounts receivable and investments. In theevent that actual results differ from these estimates of valuation allowance or if we adjust these estimates in future periods, we may need to establish an additional valuationallowance, which could materially impact our financial position and results of operations.
Business Combinations, Goodwill and Intangible AssetsWe account for business combinations in accordance with SFAS No. 141, Business Combinations. Cash and amounts of consideration that are determinable at the date ofacquisition are included in determining the cost of the acquired business. The accounting for contingent consideration based on earnings or other performance measuresis a matter of judgment that depends on the relevant facts and circumstances. If the substance of the contingent consideration is to provide compensation for services, useof property, or profit sharing, we account for the additional consideration as an expense of the appropriate period. Otherwise, the additional consideration paid is recordedas an additional cost of the acquired business.
Goodwill represents the cost of the acquired businesses in excess of the fair value of identifiable tangible and intangible net assets purchased. We generally seek theassistance of independent valuation experts in determining the fair value of the identifiable tangible and intangible net assets of the acquired business. We assign all theassets and liabilities of the acquired business, including goodwill, to reporting units in accordance with SFAS No. 142, Goodwill and Other Intangible Assets.
We test goodwill for impairment on an annual basis. In this process, we rely on a number of factors including operating results, business plans and future cash flows.Recoverability of goodwill is evaluated using a two-step process. The first step involves a comparison of the fair value of a reporting unit with its carrying value. If thecarrying amount of the reporting unit exceeds its fair value, the second step of the process involves a comparison of the fair value and carrying value of the goodwill of thatreporting unit. If the carrying value of the goodwill of a reporting unit exceeds the fair value of that goodwill, an impairment loss is recognized in an amount equal to theexcess. Goodwill of a reporting unit shall be tested for impairment between annual tests if an event occurs or circumstances change that would more likely than not reducethe fair value of the reporting unit below its carrying amount.
We amortize intangible assets over their respective individual estimated useful lives on a straight-line basis. Our estimates of the useful lives of identified intangible assetsare based on a number of factors including the effects of obsolescence, demand, competition, and other economic factors (such as the stability of the industry, and knowntechnological advances), and the level of maintenance expenditures required to obtain the expected future cash flows from the asset.
We evaluate intangible assets for recoverability whenever events or changes in circumstances indicate that their carrying amounts may not be recoverable. Recoverability ofassets to be held and used is measured by a comparison of the carrying amount of an asset to future undiscounted net cash flows expected to be generated by the asset. Ifsuch assets are considered to be impaired, the impairment to be recognized is measured by the amount by which the carrying value of the assets exceeds the fair value of theassets.
In evaluating goodwill and intangible assets for impairment, we may seek the assistance of independent valuation experts, perform internal valuation analyses and considerother information that is publicly available. The results of our evaluation may be dependent on a number of factors including estimates of future market growth and trends,forecasted revenue and costs, discount rates and other variables. While we use assumptions which we believe are fair and reasonable, actual future results may differ fromthe estimates arrived at using the assumptions.
Off-balance sheet arrangementsNone
Risk factorsThis Quarterly Report contains forward-looking statements that involve risks and uncertainties. Our actual results could differ materially from those anticipated in theseforward-looking statements as a result of certain factors, including those set forth in the following risk factors and elsewhere in this Quarterly Report.
Risks related to our company and our industry
Our revenues and expenses are difficult to predict and can vary significantly from period to period, which could cause our share price to decline.
Our revenues and profitability have grown rapidly in recent years and are likely to vary significantly in the future from period to period. Therefore, we believe that period-to-period comparisons of our results of operations are not necessarily meaningful and should not be relied upon as an indication of our future performance. It is possiblethat in the future some of our results of operations may be below the expectations of market analysts and our investors, which could cause the share price of our equityshares and our ADSs to decline significantly.
Factors which affect the fluctuation of our operating results include:
• the size, timing and profitability of significant projects;• changes in our pricing policies or those of our competitors;• the proportion of services that we perform outside India as opposed to at our development centers in India;• the effect of wage pressures, seasonal hiring patterns and the time required to train and productively utilize new employees, particularly information
technology, or IT, professionals;• the size and timing of facilities expansion;• unanticipated cancellations, contract terminations or deferrals of projects; and• unanticipated variations in the duration, size and scope of our projects.
A significant part of our total operating expenses, particularly expenses related to personnel and facilities, are fixed in advance of any particular period. As a result,unanticipated variations in the number and timing of our projects or employee utilization rates, or the accuracy of our estimates of the resources required to completeongoing projects, may cause significant variations in our operating results in any particular period.
There are also a number of factors, other than our performance, that are not within our control that could cause fluctuations in our operating results from period to period.These include:
• the duration of tax holidays or exemptions and the availability of other Government of India incentives;• currency exchange rate fluctuations, particularly when the rupee appreciates in value against the dollar since the majority of our revenues are in dollars
and a significant part of our costs are in rupees; and• other general economic factors.

42
We have not been able to sustain our previous profit margins or levels of profitability.
As a percentage of total revenues, net income decreased to 25.4% for fiscal 2004 from 25.8% for fiscal 2003. Net income decreased to 25.8% of revenues for fiscal 2003from 30.2% of revenues for fiscal 2002. Net income was 24.8% of revenues for the three months ended June 30, 2004. As we have experienced declines in demand,pricing pressures for our services, volatility of the rupee against the dollar and increased wage pressures in India, we have not been able to sustain our historical levels ofprofitability. During fiscal 2004 and the three months ended June 30, 2004, we incurred substantially higher selling and marketing expenses to increase brand awarenessamong target clients and promote client loyalty and repeat business among existing clients, and we expect to continue to incur substantially higher selling and marketingexpenses in the future, which could result in declining profitability. While our Global Delivery Model allows us to manage costs efficiently, as the proportion of our servicesdelivered at client sites increases, we may not be able to keep our operating costs as low in the future.
The current economic environment, pricing pressure and rising wages in India have negatively impacted our revenues and operating results.
Spending on IT products and services in most parts of the world has significantly decreased due to a challenging global economic environment. Some of our clients havecancelled, reduced or deferred expenditures for IT services. Pricing pressures from our clients, wage pressures in India and an increase in our sales and marketingexpenditures have also negatively impacted our operating results. For example, clients often expect that as we do more business with them, they will receive volumediscounts. Additionally, clients may ask for fixed-price arrangements or reduced rates.
If the current economic recovery does not continue, our utilization and billing rates for our IT professionals could be adversely affected which may result in lower gross andoperating profits.
Any inability to manage our growth could disrupt our business and reduce our profitability.
We have grown significantly in recent periods. Between March 31, 1999 and March 31, 2004 our total employees grew from approximately 3,800 to approximately23,800 representing a compound annual growth rate of 44.3%. In addition, Progeon had approximately 1,900 employees as of March 31, 2004. We had approximately28,000 employees as of June 30, 2004 including 2,300 employees in Progeon. In addition, in the last five fiscal years we have undertaken major expansions of our existingfacilities, as well as the construction of new facilities.
We expect our growth to place significant demands on our management and other resources. It will require us to continue to develop and improve our operational, financialand other internal controls, both in India and elsewhere. In particular, continued growth increases the challenges involved in:
• recruiting, training and retaining sufficient skilled technical, marketing and management personnel;
• adhering to our high quality and process execution standards;
• preserving our culture, values and entrepreneurial environment;
• developing and improving our internal administrative infrastructure, particularly our financial, operational, communications and other internal
systems; and
• maintaining high levels of client satisfaction.
Our growth strategy also relies on the expansion of our operations to other parts of the world, including Europe, Australia and other parts of Asia. In April 2004, weannounced the formation of a U.S. subsidiary focused on consulting and announced our intention to hire aggressively in the United States. The costs involved in enteringthese markets may be higher than expected and we may face significant competition in these regions. Our inability to manage growth in these regions may have an adverseeffect on our business, results of operations and financial condition.
We may face difficulties in providing end-to-end business solutions for our clients, which could lead to clients discontinuing their work with us, which in turn could harm ourbusiness.
Over the past three years, we have been expanding the nature and scope of our engagements by extending the breadth of services we offer. We have recently added newservice offerings, such as IT consulting, business process management, systems integration and IT outsourcing. The success of these service offerings is dependent, in part,upon continued demand for such services by our existing and new clients and our ability to meet this demand in a cost-competitive and effective manner. In addition, ourability to effectively offer a wider breadth of end-to-end business solutions depends on our ability to attract existing or new clients to these service offerings. To obtainengagements for such end-to-end solutions, we also are more likely to compete with large, well-established international consulting firms, resulting in increased competitionand marketing costs. Accordingly, we cannot be certain that our new service offerings will effectively meet client needs or that we will be able to attract existing and newclients to these service offerings.
The increased breadth of our service offerings may result in larger and more complex projects with our clients. This will require us to establish closer relationships with ourclients and a thorough understanding of their operations. Our ability to establish such relationships will depend on a number of factors including the proficiency of our ITprofessionals and our management personnel.
Larger projects may involve multiple engagements or stages, and there is a risk that a client may choose not to retain us for additional stages or may cancel or delayadditional planned engagements. These terminations, cancellations or delays may result from the business or financial condition of our clients or the economy generally, asopposed to factors related to the quality of our services. Such cancellations or delays make it difficult to plan for project resource requirements, and inaccuracies in suchresource planning may have a negative impact on our profitability. While our Global Delivery Model allows us to manage costs efficiently, as the proportion of our servicesdelivered at client sites increases, we may not be able to keep our operating costs as low in the future.
Intense competition in the market for IT services could affect our cost advantages, which could reduce our share of business from clients and decrease our revenues.
The IT services market is highly competitive. Our competitors include large consulting firms, divisions of large multinational technology firms, IT outsourcing firms, IndianIT services firms, software firms and in-house IT departments of large corporations.
The IT services industry is experiencing rapid changes that are affecting the competitive landscape, including recent divestitures and acquisitions that have resulted inconsolidation within the industry. These changes may result in larger competitors with significant resources. In addition, some of our competitors have added or announcedplans to add cost-competitive offshore capabilities to their service offerings. Many of these competitors are substantially larger than us and have significant experience withinternational operations, and we may face competition from them in countries in which we currently operate, as well as in countries in which we expect to expand ouroperations. We also expect additional competition from IT services firms with current operations in other countries, such as China and the Philippines. While we believethat we are well positioned in our markets relative to our competitors, such competitors may be able to offer services using offshore and onshore models that are moreeffective than ours.
Many of our competitors, including Accenture, EDS and IBM, have significantly greater financial, technical and marketing resources, generate greater revenues and havegreater name recognition than we do. We cannot be reasonably certain that we will be able to compete successfully against such competitors, or that we will not lose clientsto such competitors. Additionally, we believe that our ability to compete also depends in part on factors outside our control, such as the price at which our competitors offercomparable services, and the extent of our competitors' responsiveness to their clients' needs.
Our revenues are highly dependent upon a small number of clients, and the loss of any one of our major clients could significantly impact our business.
We have historically earned, and believe that in the future we will continue to earn, a significant portion of our revenues from a limited number of corporate clients. Infiscal 2004, 2003 and three months ended June 30, 2004, our largest client accounted for 5.0%, 5.8% and 5.3% of our total revenues, and our five largest clients togetheraccounted for 22.6%, 23.4% and 21.6% of our total revenues for fiscal 2004, 2003 and the three months ended June 30, 2004. The volume of work we perform for

43
specific clients is likely to vary from year to year, particularly since we historically have not been the exclusive external IT services provider for our clients. Thus, a majorclient in one year may not provide the same level of revenues in a subsequent year. However, in any given year, a limited number of clients tend to contribute a significantportion of our revenues.
There are a number of factors, other than our performance, that could cause the loss of a client and that may not be predictable. In certain cases, we have significantlyreduced the services provided to a client when the client either changed its outsourcing strategy by moving more work in-house or replaced its existing software withpackaged software supported by the licensor. Another circumstance which may result in our loss of a client is a reduction in spending on IT services due to a challengingeconomic environment. If we were to lose one of our major clients or have it significantly reduce its volume of business with us, our revenues and profitability could bereduced.
Our revenues are highly dependent on clients primarily located in the United States, as well as clients concentrated in certain industries, and economic slowdowns, changes inU.S. law and other restrictions or factors that affect the economic health of the United States and these industries may affect our business.
A significant portion of our revenues is derived from clients located in the United States, as well as clients in certain industries. In fiscal 2004, 2003 and the three monthsended June 30, 2004, approximately 70.0%, 72.0% and 63.9%of our revenues were derived from the United States. For the same periods, we earned 36.6%, 37.6% and34.0% of our revenues from the financial services industry, and 14.8%, 16.4% and 14.9% from the manufacturing industry. Consequently, if the current economic recoveryin the United States does not continue, our clients may reduce or postpone their IT spending significantly, which may in turn lower the demand for our services andnegatively affect our revenues and profitability. Further, any significant decrease in the growth of the financial services or other industry segments on which we focus mayreduce the demand for our services and negatively affect our revenues and profitability.
Recently, some organizations have expressed concerns about a perceived association between offshore outsourcing and the loss of jobs in the United States. There has alsobeen increasing political and media attention in the United States to the growth of offshore outsourcing. Within the last two years, some U.S. states have enacted legislationrestricting government agencies from outsourcing their back office processes and IT solutions work to companies outside the United States. It is also possible that U.S.private sector companies that work with these states may be restricted from outsourcing their work related to government contracts. We currently do not have significantcontracts with U.S. federal or state government entities. However, there can be no assurance that these restrictions will not extend to private companies, such as our clients.In the future, we may also enter into significant contracts with U.S. federal or state government entities. Any changes to existing laws or the enactment of new legislationrestricting offshore outsourcing may adversely impact our ability to do business in the United States, particularly if these changes are widespread.
Our success depends in large part upon our highly skilled IT professionals and our ability to attract and retain these personnel.
Our ability to execute projects and to obtain new clients depends largely on our ability to attract, train, motivate and retain highly skilled IT professionals, particularlyproject managers and other mid-level professionals. If we cannot hire and retain additional qualified personnel, our ability to bid on and obtain new projects, and tocontinue to expand our business will be impaired and our revenues could decline. We believe that there is significant worldwide competition for IT professionals with theskills necessary to perform the services we offer. We may not be able to hire and retain enough skilled and experienced IT professionals to replace those who leave.Additionally, we may not be able to redeploy and retrain our IT professionals to keep pace with continuing changes in technology, evolving standards and changing clientpreferences. Our inability to attract and retain IT professionals may have a material adverse effect on our business, results of operations and financial condition.
Our success depends in large part upon our management team and key personnel and our ability to attract and retain them.
We are highly dependent on the senior members of our management team, including the continued efforts of our Chairman, our Chief Executive Officer, our ChiefOperating Officer, our Chief Financial Officer, other executive members of the board and the management council, which consists of executive and other officers. Ourfuture performance will be affected by any disruptions in the continued service of these persons. We do not maintain key man life insurance for any of the senior membersof our management team or other key personnel. Competition for senior management in our industry is intense, and we may not be able to retain such senior managementpersonnel or attract and retain new senior management personnel in the future. The loss of any members of our senior management or other key personnel may have amaterial adverse effect on our business, results of operations and financial condition.
Our failure to complete fixed-price, fixed-time frame contracts on budget and on time may negatively affect our profitability.
As an element of our business strategy, we offer a portion of our services on a fixed-price, fixed-time frame basis, rather than on a time-and-materials basis. In fiscal 2004,2003 and three months ended June 30, 2004, revenues from fixed-price, fixed-time frame projects accounted for 33.7%, 36.7% and 29.7% of our total services revenues.Although we use our software engineering methodologies and processes and past project experience to reduce the risks associated with estimating, planning and performingfixed-price, fixed-time frame projects, we bear the risk of cost overruns, completion delays and wage inflation in connection with these projects. If we fail to estimateaccurately the resources and time required for a project, future wage inflation rates, or currency exchange rates, or if we fail to complete our contractual obligations withinthe contracted time frame, our profitability may suffer.
Our client contracts can typically be terminated without cause and with little or no notice or penalty, which could negatively impact our revenues and profitability.
Our clients typically retain us on a non-exclusive, project-by-project basis. Most of our client contracts, including those that are on a fixed-price, fixed-time frame basis,can be terminated with or without cause, with between zero and 90 days' notice and without termination-related penalties. Additionally, our contracts with clients aretypically limited to discrete projects without any commitment to a specific volume of business or future work. Our business is dependent on the decisions and actions ofour clients, and there are a number of factors relating to our clients that are outside our control that might result in the termination of a project or the loss of a client,including:
• financial difficulties for a client;• a change in strategic priorities, resulting in a reduced level of IT spending;• a demand for price reductions;• a change in outsourcing strategy by moving more work to client in-house IT departments or to our competitors; and• the replacement by our clients of existing software with packaged software supported by licensors.
Our client contracts are often conditioned upon our performance, which, if unsatisfactory, could result in less revenue generated than anticipated.
A number of our contracts have incentive-based or other pricing terms that condition some or all of our fees on our ability to meet defined goals. Our failure to meet these goals or aclient's expectations in such performance-based contracts may result in a less profitable or an unprofitable engagement.
Our business will suffer if we fail to anticipate and develop new services and enhance existing services in order to keep pace with rapid changes in technology and the industrieson which we focus.
The IT services market is characterized by rapid technological change, evolving industry standards, changing client preferences and new product and service introductions.Our future success will depend on our ability to anticipate these advances and develop new product and service offerings to meet client needs. We may not be successful inanticipating or responding to these advances in a timely basis, or, if we do respond, the services or technologies we develop may not be successful in the marketplace.Further, products, services or technologies that are developed by our competitors may render our services non-competitive or obsolete.
Disruptions in telecommunications, system failures, or virus attacks could harm our service delivery model, which could result in client dissatisfaction and a reduction of ourrevenues.
A significant element of our distributed project management methodology, which we refer to as our Global Delivery Model is to continue to leverage and expand ourglobal development centers. We currently have 31 global development centers located in various countries around the world. Our global development centers are linked

44
with a network architecture that uses multiple service providers and various satellite and optical links with alternate routing. We may not be able to maintain active voiceand data communications between our various global development centers and between our global development centers and our clients’ sites at all times due to disruptionsin telecommunications, system failures or virus attacks. Any significant loss in our ability to communicate could result in a disruption in business, which could hinder ourperformance or our ability to complete client projects on time. This, in turn, could lead to client dissatisfaction and a material adverse effect on our business, results ofoperations and financial condition.
We may be liable to our clients for damages caused by system failures, which could damage our reputation and cause us to lose clients.
Many of our contracts involve projects that are critical to the operations of our clients’ businesses, and provide benefits which may be difficult to quantify. Any failure in aclient's system or breaches of security could result in a claim for substantial damages against us, regardless of our responsibility for such failure. Although we attempt to limitour contractual liability for consequential damages in rendering our services, we cannot be assured that the limitations on liability we provide for in our service contractswill be enforceable in all cases, or that they will otherwise be sufficient to protect us from liability for damages. We maintain general liability insurance coverage, includingcoverage for errors or omissions, however, we cannot be assured that such coverage will continue to be available on reasonable terms or will be available in sufficientamounts to cover one or more large claims, or that the insurer will not disclaim coverage as to any future claim.
A successful assertion of one or more large claims against us that exceeds our available insurance coverage or changes in our insurance policies, including premium increasesor the imposition of a large deductible or co-insurance requirement, could adversely affect our operating results.
We are investing substantial cash assets in new facilities, and our profitability could be reduced if our business does not grow proportionately.
As of June 30, 2004, we had contractual commitments of approximately $50 million for capital expenditures. Although we have successfully developed new facilities in thepast, we may still encounter cost overruns or project delays in connection with new facilities. Additionally, future financing for additional facilities, whether within India orelsewhere, may not be available on attractive terms or at all. Such expansions will significantly increase our fixed costs. If we are unable to grow our business and revenuesproportionately, our profitability will be reduced.
We may be unable to recoup our investment costs to develop our software products.
In fiscal 2004, 2003 and the three months ended June 30, 2004, we earned 2.8%, 4.6% and 2.4% of our total revenue from the sale of software products. The developmentof our software products requires significant investments. The markets for our primary suite of software products that we call Finacle® are competitive. Our current softwareproducts or any new software products that we develop may not be commercially successful and the costs of developing such new products may not be recouped. Sincesoftware product revenues typically occur in periods subsequent to the periods in which the costs are incurred for the development of such software products, delayedrevenues may cause periodic fluctuations of our operating results.
Our insiders are significant shareholders, are able to exercise significant control over the election of our board and may have interests which conflict with those of our othershareholders or holders of our ADSs.
Our executive officers and directors, together with members of their immediate families, beneficially owned, in the aggregate, approximately 22.4% of our issued equityshares as of June 30, 2004. As a result, acting together, this group has the ability to exercise significant control over most matters requiring our shareholders' approval,including the election and removal of directors and significant corporate transactions.
We may engage in acquisitions, strategic investments, strategic partnerships or alliances or other ventures that may or may not be successful.
We may acquire or make strategic investments in complementary businesses, technologies, services or products, or enter into strategic partnerships or alliances with thirdparties in order to enhance our business. For example, we recently acquired Expert Information Services Pty. Limited, Australia and established Infosys Consulting, Inc. Itis possible that we may not identify suitable acquisition, strategic investment or strategic partnership candidates, or if we do identify suitable candidates, we may notcomplete those transactions on terms commercially acceptable to us or at all. The inability to identify suitable acquisition targets or investments or the inability to completesuch transactions may affect our competitiveness and our growth prospects.
If we acquire a company, we could have difficulty in assimilating that company's personnel, operations, technology and software. In addition, the key personnel of theacquired company may decide not to work for us. In some cases, we could have difficulty in integrating the acquired products, services or technologies into our operations.These difficulties could disrupt our ongoing business, distract our management and employees and increase our expenses. As of the date of this Report, we have noagreements to enter into any material acquisition, investment, partnership, alliance or other joint venture transaction.
We make strategic investments in new technology start-up companies in order to gain experience in or exploit niche technologies. As of June 30, 2004, we have invested anaggregate amount of approximately $11.4 million in strategic investments. However, our investments may not be successful. The lack of profitability of any of ourinvestments could have a material adverse effect on our operating results. In fiscal 2004 and 2003, we made loss provisions of $2.1 million and $3.2 million related toinvestments.
Our earnings may be adversely affected if we are required to change our accounting policies with respect to the expensing of stock options.
We do not currently deduct the expense of employee stock option grants from our income based on the fair value method. The Financial Accounting Standards Board hasissued an exposure draft, which if adopted, would require companies to change their accounting policies to record the fair value of stock options issued to employees as anexpense. Many companies have or are in the process of voluntarily changing their accounting policies to expense the fair value of stock options. Stock options are animportant component of our employee compensation package. If we change our accounting policy with respect to the treatment of employee stock option grants, ourearnings could be adversely affected. We have adopted the pro forma disclosure provisions of SFAS No. 123, Accounting for Stock-Based Compensation. Had compensationcost for our stock-based compensation plan been determined in a manner consistent with the fair value approach described in SFAS No. 123, our net income as reportedwould have been reduced to the pro forma amounts of approximately $223 million, $137 million and $74 million in fiscal 2004, 2003 and the three months endedJune 30, 2004.
Risks related to investments in Indian companies and international operations generally
Our net income would decrease if the Government of India reduces or withdraws tax benefits and other incentives it provides to us.
Currently, we benefit from the tax holidays the Government of India gives to the export of IT services from specially designated software technology parks in India. As a result of theseincentives, which include a 10-year tax holiday from Indian corporate income taxes for the operation of most of our Indian facilities and a partial taxable income deductionfor profits derived from exported IT services, our operations have been subject to relatively low tax liabilities. These tax incentives resulted in a decrease in our income taxexpense of $78 million, $51 million and $26 million for fiscal 2004, 2003 and the three months ended June 30, 2004 compared to the effective tax rates that we estimatewould have applied if these incentives had not been available.
The Finance Act, 2000 phases out the 10-year tax holiday over a ten-year period from fiscal 2000 through fiscal 2009. Additionally, the Finance Act, 2002 required that tenpercent of all income derived from services performed in software technology parks be subject to income tax for a one-year period which ended March 31, 2003. Forcompanies opting for the partial taxable income deduction for profits derived from exported IT services, the Finance Act, 2000 phases out the deduction over five yearsbeginning on April 1, 2000. When our tax holiday and taxable income deduction expire or terminate, our tax expense will materially increase, reducing our profitability.
Wage pressures in India may prevent us from sustaining our competitive advantage and may reduce our profit margins.
Wage costs in India have historically been significantly lower than wage costs in the United States and Europe for comparably skilled professionals, which has been oneof our competitive strengths. However, wage increases in India may prevent us from sustaining this competitive advantage and may negatively affect our profit margins.
45
Wages in India are increasing at a faster rate than in the United States, which could result in increased costs for IT professionals, particularly project managers and othermid-level professionals. We may need to increase the levels of our employee compensation more rapidly than in the past to remain competitive. Compensation increasesmay result in a material adverse effect on our business, results of operations and financial condition.
Terrorist attacks or a war could adversely affect our business, results of operations and financial condition.
Terrorist attacks, such as the attacks of September 11, 2001 in the United States and other acts of violence or war, such as the recent conflict in Iraq, have the potential tohave a direct impact on our clients. To the extent that such attacks affect or involve the United States, our business may be significantly impacted, as the majority of ourrevenues are derived from clients located in the United States. In addition, such attacks may make travel more difficult, may make it more difficult to obtain work visas formany of our IT professionals who are required to work in the United States, and may effectively curtail our ability to deliver our services to our clients. Such obstacles tobusiness may increase our expenses and negatively affect the results of our operations. Many of our clients, in particular for our newer services, such as business processmanagement and IT outsourcing, visit several IT services firms prior to reaching a decision on vendor selection. Terrorist threats, attacks or war could make travel moredifficult and delay, postpone or cancel decisions to use our services.
Regional conflicts in South Asia could adversely affect the Indian economy, disrupt our operations and cause our business to suffer.
South Asia has from time to time experienced instances of civil unrest and hostilities among neighboring countries, including between India and Pakistan. In recent yearsthere have been military confrontations between India and Pakistan that have occurred in the region of Kashmir and along the India-Pakistan border. Military activity orterrorist attacks in the future could influence the Indian economy by disrupting communications and making travel more difficult and such political tensions could createa greater perception that investments in Indian companies involve higher degrees of risk. This, in turn, could have a material adverse effect on the market for securities ofIndian companies, including our equity shares and our ADSs, and on the market for our services.
Restrictions on immigration may affect our ability to compete for and provide services to clients in the United States, which could hamper our growth and cause our revenuesto decline.
The vast majority of our employees are Indian nationals. The ability of our IT professionals to work in the United States, Europe and in other countries depends on theability to obtain the necessary visas and work permits. As of June 30, 2004, the majority of our IT professionals in the United States held H-1B visas (approximately 3,600persons), allowing the employee to remain in the United States during the term of the work permit, and work as long as he or she remains an employee of the sponsoringfirm, or L-1 visas (approximately 700 persons), allowing for the employee to stay in the United States only temporarily. Although there is no limit to new L-1 visas, there isa limit to the aggregate number of new H-1B visas that the U.S. Citizenship and Immigration Services, or CIS, may approve in any government fiscal year. In 2000, theUnited States temporarily increased the annual limit for H-1B visas to 195,000, however this increase expired in 2003 and the limit was returned to 65,000 annually.Further, in response to the terrorist attacks in the United States, the CIS has increased the level of scrutiny in granting visas. This may also lead to limits on the number ofL-1 visas granted. The U.S. immigration laws may also require us to meet certain levels of compensation, and to comply with other legal requirements, as a condition toobtaining or maintaining work visas for our IT professionals working in the United States.
Immigration laws in the United States and in other countries are subject to legislative change, as well as to variations in standards of application and enforcement due topolitical forces and economic conditions. It is difficult to predict the political and economic events that could affect immigration laws, or the restrictive impact they couldhave on obtaining or monitoring work visas for our IT professionals. Our reliance on work visas for a significant number of IT professionals makes us particularly vulnerableto such changes and variations as it affects our ability to staff projects with IT professionals who are not citizens of the country where the work is to be performed. As a result,we may not be able to obtain a sufficient number of visas for our IT professionals or may encounter delays or additional costs in obtaining or maintaining the condition ofsuch visas.
Changes in the policies of the Government of India or political instability could delay the further liberalization of the Indian economy and adversely affect economic conditionsin India generally, which could impact our business and prospects.
Since 1991, successive Indian governments have pursued policies of economic liberalization, including significantly relaxing restrictions on the private sector. Nevertheless,the role of the Indian central and state governments in the Indian economy as producers, consumers and regulators has remained significant. The current Government ofIndia, formed in May 2004 has announced policies and taken initiatives that support the continued economic liberalization policies that have been pursued by previousgovernments. However, these liberalization policies may not continue in the future. The rate of economic liberalization could change, and specific laws and policiesaffecting technology companies, foreign investment, currency exchange and other matters affecting investment in our securities could change as well. A significant changein India's economic liberalization and deregulation policies could adversely affect business and economic conditions in India generally, and our business in particular.
Political instability could also delay the reform of the Indian economy and could have a material adverse effect on the market for securities of Indian companies, includingour equity shares and our ADSs, and on the market for our services.
Currency exchange rate fluctuations may affect the value of our ADSs.
Our functional currency is the Indian rupee although we transact a major portion of our business in foreign currencies and accordingly face foreign currency exposurethrough our sales in the United States and elsewhere and purchases from overseas suppliers in dollars. Historically, we have held a substantial majority of our cash funds inrupees. Accordingly, changes in exchange rates may have a material adverse effect on our revenues, cost of services sold, gross margin and net income, which may in turnhave a negative impact on our business, operating results and financial condition. The exchange rate between the rupee and the dollar has changed substantially in recentyears and may fluctuate substantially in the future. We expect that a majority of our revenues will continue to be generated in U.S. dollars for the foreseeable future and thata significant portion of our expenses, including personnel costs, as well as capital and operating expenditures, will continue to be denominated in Indian rupees. Consequently,the results of our operations are adversely affected as the rupee appreciates against the dollar.
We have sought to reduce the effect of exchange rate fluctuations on our operating results by purchasing foreign exchange forward contracts to cover a portion ofoutstanding accounts receivable. As of June 30, 2004, we had outstanding forward contracts in the amount of $242 million. This increase is primarily attributable to ourdecision to actively hedge our foreign currency exposure in light of the recent steady appreciation of the Indian rupee against the U.S. dollar. We may not purchase contractsadequate to insulate ourselves from foreign exchange currency risks. Additionally, the policies of the Reserve Bank of India may change from time to time which may limitour ability to hedge our foreign currency exposures adequately.
Fluctuations in the exchange rate between the rupee and the dollar will also affect the dollar conversion by Deutsche Bank Trust Company Americas, the Depositary, of anycash dividends paid in rupees on the equity shares represented by the ADSs. In addition, these fluctuations will affect the dollar equivalent of the rupee price of equity shareson the Indian stock exchanges and, as a result, the prices of our ADSs in the United States, as well as the dollar value of the proceeds a holder would receive upon the salein India of any equity shares withdrawn from the Depositary under the Depositary Agreement. Holders may not be able to convert rupee proceeds into dollars or any othercurrency, and there is no guarantee of the rate at which any such conversion will occur, if at all.
Our international expansion plans subject us to risks inherent in doing business on an international level.
Currently, we have global development centers in six countries around the world. The majority of our global development centers are located in India. We intend toestablish new development facilities, potentially in Southeast Asia, Africa, Latin America and Europe. In April 2004, we announced the formation of a consultingsubsidiary in the United States. Because of our limited experience with facilities outside of India, we are subject to additional risks related to our international expansionstrategy, including risks related to complying with a wide variety of national and local laws, restrictions on the import and export of certain technologies and multiple andpossibly overlapping tax structures. In addition, we may face competition in other countries from companies that may have more experience with operations in suchcountries or with international operations generally. We may also face difficulties integrating new facilities in different countries into our existing operations, as well asintegrating employees that we hire in different countries into our existing corporate culture. In 2003, China experienced an outbreak of Severe Acute Respiratory Syndrome,
46
or SARS. As a result travel restrictions to the region were heightened. Our international expansion strategy in China may face difficulty resulting from a potential outbreakof SARS recurring again. Our international expansion plans may not be successful and we may not be able to compete effectively in other countries.
It may be difficult for you to enforce any judgment obtained in the United States against us or our affiliates.
We are incorporated under the laws of India and many of our directors and executive officers reside outside the United States. Virtually all of our assets and the assets ofmany of these persons are located outside the United States. As a result, you may be unable to effect service of process upon us outside India or upon such persons outsidetheir jurisdiction of residence. In addition, you may be unable to enforce against us in courts outside of India, or against these persons outside the jurisdiction of theirresidence, judgments obtained in courts of the United States, including judgments predicated solely upon the federal securities laws of the United States.
We have been advised by our Indian counsel that the United States and India do not currently have a treaty providing for reciprocal recognition and enforcement ofjudgments (other than arbitration awards) in civil and commercial matters. Therefore, a final judgment for the payment of money rendered by any federal or state court inthe United States on civil liability, whether or not predicated solely upon the federal securities laws of the United States, would not be enforceable in India. However, theparty in whose favor such final judgment is rendered may bring a new suit in a competent court in India based on a final judgment that has been obtained in the UnitedStates. The suit must be brought in India within three years from the date of the judgment in the same manner as any other suit filed to enforce a civil liability in India. Itis unlikely that a court in India would award damages on the same basis as a foreign court if an action is brought in India. Furthermore, it is unlikely that an Indian courtwould enforce foreign judgments if it viewed the amount of damages awarded as excessive or inconsistent with Indian practice. A party seeking to enforce a foreignjudgment in India is required to obtain approval from the Reserve Bank of India under the Foreign Exchange Management Act, 1999, to execute such a judgment or torepatriate any amount recovered.
The laws of India do not protect intellectual property rights to the same extent as those of the United States, and we may be unsuccessful in protecting our intellectual propertyrights. We may also be subject to third party claims of intellectual property infringement.
We rely on a combination of patent, copyright, trademark and design laws, trade secrets, confidentiality procedures and contractual provisions to protect our intellectualproperty. However, the laws of India do not protect proprietary rights to the same extent as laws in the United States. Therefore, our efforts to protect our intellectualproperty may not be adequate. Our competitors may independently develop similar technology or duplicate our products or services. Unauthorized parties may infringeupon or misappropriate our products, services or proprietary information.
The misappropriation or duplication of our intellectual property could disrupt our ongoing business, distract our management and employees, reduce our revenues andincrease our expenses. We may need to litigate to enforce our intellectual property rights or to determine the validity and scope of the proprietary rights of others. Any suchlitigation could be time consuming and costly. As the number of patents, copyrights and other intellectual property rights in our industry increases, and as the coverage ofthese rights increase, we believe that companies in our industry will face more frequent infringement claims. Defense against these claims, even if not meritorious, could beexpensive and divert our attention and resources from operating our company.
Although there are currently no material pending or threatened intellectual property claims against us, infringement claims may be asserted against us in the future.However, if we become liable to third parties for infringing their intellectual property rights, we could be required to pay a substantial damage award and be forced todevelop non-infringing technology, obtain a license or cease selling the applications or products that contain the infringing technology. We may be unable to develop non-infringing technology or to obtain a license on commercially reasonable terms, or at all.
Our ability to acquire companies organized outside India depends on the approval of the Government of India and/or the Reserve Bank of India and failure to obtain thisapproval could negatively impact our business.
Generally, the Reserve Bank of India must approve any acquisition by us of any company organized outside of India. The Reserve Bank of India has recently permittedacquisitions of companies organized outside of India without approval where the transaction value is:
• if in cash, up to 100% of the proceeds from an ADS offering or up to 100% of the net worth of the company; and• if in stock, up to the greater of $100 million or ten times the acquiring company's previous fiscal year's export earnings.
Any required approval from the Reserve Bank of India and the Ministry of Finance of the Government of India or any other government agency may not be obtained. Ourfailure to obtain approvals for acquisitions of companies organized outside India may restrict our international growth, which could negatively affect our business andprospects.
Indian law limits our ability to raise capital outside India and may limit the ability of others to acquire us, which could prevent us from operating our business or entering intoa transaction that is in the best interests of our shareholders.
Indian law relating to foreign exchange management constrains our ability to raise capital outside India through the issuance of equity or convertible debt securities.Generally, any foreign investment in, or acquisition of, an Indian company requires approval from relevant government authorities in India, including the Reserve Bank ofIndia. There are, however, certain exceptions to this approval requirement for IT companies on which we are able to rely. Changes to such policies may create restrictionson our capital raising abilities. For example, a limit on the foreign equity ownership of Indian IT companies may constrain our ability to seek and obtain additional equityinvestment by foreign investors. In addition, these restrictions, if applied to us, may prevent us from entering into certain transactions, such as an acquisition by a non-Indian company, which might otherwise be beneficial for us and the holders of our equity shares and ADSs.
Additionally, under current Indian law, the sale of an IT services company can result in the loss of the tax benefits for specially designed software technology parks in India.The potential loss of this tax benefit may discourage others from acquiring us or entering into a transaction with us that is in the best interest of our shareholders.
Risks related to the ADSs
Indian law imposes foreign investment restrictions that limit a holder's ability to convert equity shares into ADSs, which may cause our ADSs to trade at a premium or discountto the market price of our equity shares.
Except under limited circumstances, the Reserve Bank of India must approve the sale of equity shares underlying ADSs by a non-resident of India to a resident of India.Since foreign exchange controls are in effect in India, the Reserve Bank of India will also approve the price at which equity shares are transferred based on a specifiedformula, and a higher price per share may not be permitted. Additionally, except under certain limited circumstances, if an investor seeks to convert the rupee proceedsfrom a sale of equity shares in India into foreign currency and then repatriate that foreign currency from India, he or she will have to obtain an additional Reserve Bank ofIndia approval for each transaction. Required approval from the Reserve Bank of India or any other government agency may not be obtained on terms favorable to a non-resident investor or at all.
Investors who exchange ADSs for the underlying equity shares and are not holders of record will be required to declare to us details of the holder of record, and the holderof record will be required to disclose the details of the beneficial owner. Any investor who fails to comply with this requirement may be liable for a fine of up to Rs. 1,000for each day such failure continues. Such restrictions on foreign ownership of the underlying equity shares may cause our ADSs to trade at a premium or discount to theequity shares.
An investor in our ADSs may not be able to exercise preemptive rights for additional shares and may thereby suffer dilution of his or her equity interest in us.
Under the Indian Companies Act, a company incorporated in India must offer its holders of equity shares preemptive rights to subscribe and pay for a proportionatenumber of shares to maintain their existing ownership percentages prior to the issuance of any new equity shares, unless such preemptive rights have been waived bythree-fourths of the shares voting on the resolution to waive such rights. Holders of ADSs may be unable to exercise preemptive rights for equity shares underlying ADSsunless a registration statement under the Securities Act is effective with respect to such rights or an exemption from the registration requirements of the Securities Act is
47
available. We are not obligated to prepare and file such a registration statement and our decision to do so will depend on the costs and potential liabilities associated withany such registration statement, as well as the perceived benefits of enabling the holders of ADSs to exercise their preemptive rights, and any other factors we considerappropriate at the time. No assurance can be given that we would file a registration statement under these circumstances. If we issue any such securities in the future, suchsecurities may be issued to the Depositary, which may sell such securities for the benefit of the holders of the ADSs. There can be no assurance as to the value, if any, theDepositary would receive upon the sale of such securities. To the extent that holders of ADSs are unable to exercise preemptive rights granted in respect of the equity sharesrepresented by their ADSs, their proportional interests in us would be reduced.
ADS holders may be restricted in their ability to exercise voting rights.
At our request, the Depositary will mail to you any notice of shareholders’ meeting received from us together with information explaining how to instruct the Depositary toexercise the voting rights of the securities represented by ADSs. If the Depositary receives voting instructions from you in time, relating to matters that have been forwardedto you, it will endeavor to vote the securities represented by your ADSs in accordance with such voting instructions. However, the ability of the Depositary to carry outvoting instructions may be limited by practical and legal limitations and the terms of the securities on deposit. We cannot assure that you will receive voting materials intime to enable you to return voting instructions to the Depositary in a timely manner. Securities for which no voting instructions have been received will not be voted. Theremay be other communications, notices or offerings that we only make to holders of our equity shares, which will not be forwarded to holders of ADSs. Accordingly, you maynot be able to participate in all offerings, transactions or votes that are made available to holders of our equity shares.
Item 3. Quantitative and Qualitative Disclosure About Market Risk
3.1 Foreign Currency Market RiskThis information is set forth under the caption “Exchange Rate Risk” under the Components of Market Risk above, and is incorporated herein by reference.
Item 4. Controls and ProceduresBased on their evaluation as of the end of the period covered by this quarterly report, our Chief Executive Officer and Chief Financial Officer believe, based on an evaluationperformed under the supervision and with the participation of management, including our Chief Executive Officer and Chief Financial Officer, that the design andoperation of our disclosure controls and procedures (as defined in Rules 13a-14(c) and 15d-14(c) under the Securities Exchange Act of 1934, as amended) are effective toensure that material information relating to Infosys is made known to them by others within our Company during the period in which this Quarterly Report was beingprepared. There have been no material changes in our internal controls over financial reporting that occurred during the period covered by the quarterly report whichmaterially affected, or would be reasonably likely to affect, our internal control over financial reporting.
Part II - Other InformationItem 1. Legal ProceedingsThe Company is subject to legal proceedings and claims, which have arisen in the ordinary course of its business. These legal actions, when ultimately concluded anddetermined, will not, in the opinion of management, have a material effect on the results of operations or the financial position of the Company.
Ms. Jennifer Griffith, a former employee has filed a lawsuit against the Company and its former director, Mr. Phaneesh Murthy. The lawsuit has been served on the Company.Management is reviewing the allegations. Based on its present knowledge of facts, management estimates that the lawsuit will not have a material impact on the results ofoperations or financial position of the Company.
Item 2. Changes in securities and use of proceedsOur Board recommended that our shareholders approve a bonus share issuance of three additional equity shares for every equity share held on a July 2, 2004, the recorddate. Our Board also recommended a stock dividend of one ADS for every ADS held on the July 2, 2004 record date. Our shareholders approved the issue of bonus sharesand stock dividend of ADS, in the Annual General Meeting of the Shareholders ("AGM"), held on June 12, 2004. The bonus shares were allotted to all shareholders on July3, 2004 and distributed on July 5, 2004. The additional ADSs pursuant to the stock dividend on ADSs were distributed to holders of ADSs on July 6, 2004. Following thedistribution of the stock dividend on the ADS, each ADS represents on conversion one equity share. Consequent to the issue of bonus shares to the holders of equityshares and the issue of stock dividend to the holders of the ADSs, the company has 267,472,136 equity shares including 21,182,848 equity shares underlying 21,182,848ADSs.
Our shareholders approved in the AGM for the delisting of our equity shares from the Bangalore Stock Exchange. The company’s equity shares were de-listed from theBangalore Stock Exchange on June 22, 2004.
Item 3. Default upon senior securities
None
Item 4. Submission of matters to a vote of security holders
a) The company held its AGM on June 12, 2004b) The following directors retired by rotation at the AGM held on June 12, 2004, were eligible for re-election and were re-elected by a requisite
majority vote:
Deepak M Satwalekar Marti G SubrahmanyamS Gopalakrishnan S D ShibulalT V Mohandas Pai
In addition to being re-elected as a director to retire by rotation, Mr. S. Gopalakrishnan, was re-appointed as Deputy Managing Director and Chief OperatingOfficer for a period of five years with effect from October 17, 2004, when his current term of appointment as a whole-time director expires.
c) The following are the other directors whose term of office as a director continues after the AGM:
N R Narayana Murthy Nandan M NilekaniK Dinesh Philip YeoOmkar Goswami Larry PresslerClaude Smadja Rama BijapurkarSridar Iyengar Srinath Batni

48
Item 5. Other informationThe following is a brief description of the matters voted upon at the AGM of the company held on June 12, 2004 along with votes cast for, against or withheld, as well asthe number of abstentions and broker non-votes, as to each matter. The matters to be voted upon were notified to the shareholders on record and all Registered Holders ofthe American Depositary Receipts (the “ADRs”) who were holding the ADRs on a record date determined by the Depositary. 913 shareholders representing in aggregate3,912,093 shares attended the AGM in person and 330 shareholders representing in aggregate 26,077,384 shares attended the AGM through a proxy, including two proxiesrepresenting the Depositary to carry out the instructions of the holders of ADRs representing 1,922,143 ADRs. The number of shares mentioned in this paragraph have notbeen adjusted for the bonus shares and stock dividend issuance.
Brief Description of the matter put to vote Votes for (1)(2)(3) Votes against / Abstentions / Brokerwithheld (1)(2)(4) Non-votes (1)(2)
1. To receive, consider and adopt the balance sheet as at March 31, 2004 and the profit &loss account for as per the Indian GAAP (unconsolidated) year ended on that date andthe report of the directors and the auditors thereon. 914 1 –
2. To declare a final dividend and a special one-time dividend. 914 1 –3. To appoint a director in place of Mr. Deepak M. Satwalekar who retires by rotation and
being eligible, offers himself for re-election. 914 1 –4. To appoint a director in place of Prof. Marti G. Subrahmanyam who retires by rotation
and being eligible, offers himself for re-election. 914 1 –5. To appoint a director in place of Mr. S. Gopalakrishnan who retires by rotation and being
eligible, offers himself for re-election. 914 1 –6. To appoint a director in place of Mr. S. D. Shibulal who retires by rotation and being
eligible, offers himself for re-election. 914 1 –7. To appoint a director in place of Mr. T. V. Mohandas Pai who retires by rotation and being
eligible, offers himself for re-election. 914 1 –8. To appoint Auditors to hold office from the conclusion of this meeting until the conclusion
of the next Annual General Meeting and to fix their remuneration. 914 1 –9. To de-list the equity shares of the company from Bangalore Stock Exchange. 914 1 –
10. To approve payment of remuneration in the form of commission to non-executive directors. 914 1 –11. To approve revision of remuneration payable to Mr. S. Gopalakrishnan,
Mr. T. V. Mohandas Pai, Mr. Srinath Batni and Mr. S. D. Shibulal. 914 1 –12. To approve revision of remuneration payable to Mr. N. R. Narayana Murthy,
Mr. Nandan M. Nilekani, Mr. S. Gopalakrishnan, Mr. K. Dinesh,Mr. T. V. Mohandas Pai, Mr. Srinath Batni and Mr. S. D. Shibulal. 914 1 –
13. To approve the reappointment of Mr. S. Gopalakrishnan as Deputy Managing Director ofthe company. 914 1 –
14. To amend the Capital Clause in the Memorandum of Association to increase theAuthorized Capital of the Company. 914 1 –
15. To amend the Capital Clause in the Articles of Association to increase the AuthorizedCapital of the Company. 914 1 –
16. To issue bonus shares. 914 1 –17. To form a new Trust for the welfare of the employees. 914 1 –
1. Under the Indian Companies Act 1956, voting is by show of hands unless a poll is demanded by a member or members present in person, or by proxy holding at least one-tenthof the total shares entitled to vote on the resolution or by those holding paid-up capital of at least Rs. 50,000. Under the Articles of the company, members present by proxy shallbe entitled to vote only on a poll but not on a show of hands, unless such member is a body corporate present by a representative in which case such proxy shall have a vote onthe show of hand as if he were a member.
2. Under the Indian Companies Act and as per the Articles of the company, on a show of hand every member present in person shall have one vote and upon a poll the voting rightsof every member whether present in person or by proxy, shall be in proportion to his share of the paid-up capital of the company.
3. The number of members who are shown to have voted for the resolutions includes one representative of the Depositary, with instructions to vote as such, on behalf of the holdersof ADRs.
4. The number of members who are shown to have voted against the resolution includes one representative of the Depositary, with instructions to vote as such, on behalf of theholders of the ADRs.
Item 6. Exhibits and reports
SIGNATURES
Pursuant to the requirements of the Securities Exchange Act of 1934, the registrant has duly caused this report to be signed on its behalf by the undersigned, thereunto dulyorganized.
Dated: July 22, 2004 INFOSYS TECHNOLOGIES LIMITED
/s/ NANDAN M. NILEKANINandan M. NilekaniChief Executive Officer, Presidentand Managing Director
EXHIBIT INDEX
Exhibit Number Description of Document31.1 Certification of Chief Executive Officer and Chief Financial Officer under Section 302 of the Sarbanes Oxley Act.32.1 Certification of Chief Executive Officer and Chief Financial Officer under Section 906 of the Sarbanes Oxley Act.

49
Exhibit 31.1CHIEF EXECUTIVE OFFICER CERTIFICATION
I, Nandan M. Nilekani, Chief Executive Officer, President and Managing Director of Infosys Technologies Limited, certify that:1. I have reviewed this Quarterly Report on Form 6-K of Infosys Technologies Limited;2. Based on my knowledge, this report does not contain any untrue statement of a material fact or omit to state a material fact necessary to make the statements made, in
light of the circumstances under which such statements were made, not misleading with respect to the period covered by this report;3. Based on my knowledge, the financial statements, and other financial information included in this report, fairly present in all material respects the financial condition,
results of operations and cash flows of the registrant as of, and for, the periods presented in this report;4. The registrant's other certifying officer(s) and I are responsible for establishing and maintaining disclosure controls and procedures (as defined in Exchange Act Rules
13a-15(e) and 15d-15(e)) for the registrant and have:(a) Designed such disclosure controls and procedures, or caused such disclosure controls and procedures to be designed under our supervision, to ensure that
material information relating to the registrant, including its consolidated subsidiaries, is made known to us by others within those entities, particularly during theperiod in which this report is being prepared;
(b) Evaluated the effectiveness of the registrant’s disclosure controls and procedures and presented in this report our conclusions about the effectiveness of thedisclosure controls and procedures, as of the end of the period covered by this report based on such evaluation; and
(c) Disclosed in this report any change in the registrant's internal control over financial reporting that occurred during the registrant’s most recent fiscal quarter thathas materially affected, or is reasonably likely to materially affect, the registrant's internal control over financial reporting; and
5. The registrant's other certifying officer(s) and I have disclosed, based on our most recent evaluation of internal control over financial reporting, to the registrant’sauditors and the audit committee of the registrant’s board of directors (or persons performing the equivalent functions):(a) All significant deficiencies and material weaknesses in the design or operation of internal control over financial reporting which are reasonably likely to adversely
affect the registrant’s ability to record, process, summarize and report financial information; and(b) Any fraud, whether or not material, that involves management or other employees who have a significant role in the registrant's internal control over financial
reporting.
/s/ NANDAN M. NILEKANI
Chief Executive Officer, Presidentand Managing Director
Date: July 22, 2004
CHIEF FINANCIAL OFFICER CERTIFICATIONI, T.V. Mohandas Pai, Chief Financial Officer and Head-Finance and Administration of Infosys Technologies Limited, certify that:1. I have reviewed this Quarterly Report on Form 6-K of Infosys Technologies Limited;2. Based on my knowledge, this report does not contain any untrue statement of a material fact or omit to state a material fact necessary to make the statements made, in
light of the circumstances under which such statements were made, not misleading with respect to the period covered by this report;3. Based on my knowledge, the financial statements, and other financial information included in this report, fairly present in all material respects the financial condition,
results of operations and cash flows of the registrant as of, and for, the periods presented in this report;4. The registrant's other certifying officer(s) and I are responsible for establishing and maintaining disclosure controls and procedures (as defined in Exchange Act Rules
13a-15(e) and 15d-15(e)) for the registrant and have:(a) Designed such disclosure controls and procedures, or caused such disclosure controls and procedures to be designed under our supervision, to ensure that
material information relating to the registrant, including its consolidated subsidiaries, is made known to us by others within those entities, particularly during theperiod in which this report is being prepared;
(b) Evaluated the effectiveness of the registrant’s disclosure controls and procedures and presented in this report our conclusions about the effectiveness of thedisclosure controls and procedures, as of the end of the period covered by this report based on such evaluation; and
(c) Disclosed in this report any change in the registrant's internal control over financial reporting that occurred during the registrant's most recent fiscal quarter thathas materially affected, or is reasonably likely to materially affect, the registrant's internal control over financial reporting; and
5. The registrant's other certifying officer(s) and I have disclosed, based on our most recent evaluation of internal control over financial reporting, to the registrant'sauditors and the audit committee of the registrant’s board of directors (or persons performing the equivalent functions):(a) All significant deficiencies and material weaknesses in the design or operation of internal control over financial reporting which are reasonably likely to adversely
affect the registrant’s ability to record, process, summarize and report financial information; and(b) Any fraud, whether or not material, that involves management or other employees who have a significant role in the registrant's internal control over financial
reporting.
/s/ T.V. MOHANDAS PAI
Chief Financial Officer andHead - Finance and Administration
Date: July 22, 2004
Exhibit 32.1CERTIFICATION OF CHIEF EXECUTIVE OFFICER AND CHIEF FINANCIAL OFFICER PURSUANT TO 18 U.S.C. SECTION 1350, AS ADOPTED PURSUANT
TO SECTION 906 OF THE SARBANES-OXLEY ACT OF 2002I, Nandan M. Nilekani, certify, pursuant to 18 U.S.C. Section 1350, as adopted pursuant to Section 906 of the Sarbanes-Oxley Act of 2002, that the Quarterly Report ofInfosys Technologies Limited on Form 6-K for the quarterly period ended June 30, 2004, fully complies with the requirements of Section 13(a) or 15(d) of the SecuritiesExchange Act of 1934 and that information contained in such Quarterly Report on Form 6-K fairly presents in all material respects the financial condition and results ofoperations of Infosys Technologies Limited.
/s/ NANDAN M. NILEKANI
Nandan M. NilekaniChief Executive Officer
I, T. V. Mohandas Pai, certify, pursuant to 18 U.S.C. Section 1350, as adopted pursuant to Section 906 of the Sarbanes-Oxley Act of 2002, that the Quarterly Report ofInfosys Technologies Limited on Form 6-K for the quarterly period ended June 30, 2004 fully complies with the requirements of Section 13(a) or 15(d) of the SecuritiesExchange Act of 1934 and that information contained in such Quarterly Report on Form 6-K fairly presents in all material respects the financial condition and results ofoperations of Infosys Technologies Limited.
/s/ T. V. MOHANDAS PAI
T. V. Mohandas Pai July 22, 2004 Chief Financial Officer

50
Shareholder information
1. Registered office Electronics City, Hosur Road, Bangalore 560 100, India.Tel.: +91-80-2852-0261, Fax: +91-80-2852-0362Website: www.infosys.com
2. Listing on stock exchanges In India : The Stock Exchange, Mumbai (BSE), and the National StockExchange of India Ltd. (NSE).
Outside India : NASDAQ National Market in the US.
3. Par value of equity shares Rs. 5/- each fully paid-up4. Registrar and share transfer agents Share transfers in physical form and other communication regarding share certificate dividends,
change of address, etc., may be addressed to:Karvy Computershare Private Limited,Registrars and Share Transfer Agents;T.K.N. Complex, No. 51/2, Vanivilas Road;Opposite National College, Basavanagudi;Bangalore 560 004, India.Tel.: +91-80-2662-1184, Fax: +91-80-2662-1169E-mail: [email protected].
5. Stock market data relating to shares listed in Indiaa. The company's market capitalization is included in the computation of the BSE-30 Sensitive Index (Sensex), the BSE Dollex and S&P CNX NIFTY Index.b. Monthly high and low quotations as well as the volume of shares traded at BSE and NSE for the quarter ended June 30, 2004 are:
BSE NSEHigh Low Volume High Low Volume
Rs. Rs. Nos. Rs. Rs. Nos.April, 2004 6,000 4,960 45,51,645 5,945 4,951 1,06,86,132May 5,399 4,200 34,60,632 5,487 4,125 85,48,380June 5,657 4,982 32,11,131 5,660 4,982 90,36,698
Total 1,12,23,408 2,82,71,210
Volume traded to average shares outstanding (%)Quarter ended June 30, 2004 18.22% 45.91%Quarter ended June 30, 2003 36.62% 97.41%The number of shares outstanding is 6,15,72,322. American Depositary Shares (ADSs) have been excluded for the purpose of this calculation.
6. Share transfer system
Shares sent for physical transfer are effected after giving a notice of 15 days to the seller for sale confirmation. The share transfer committee of the companymeets as often as required.
The total number of shares transferred in physical form during the three months ended June 30, 2004 was nil (quarter ended June 30, 2003-52).
7. Investor services – Complaints Received
Quarter Ended
Nature of complaints June 30, 2004 June 30, 2003Received Attended to Received Attended to
Non-receipt of dividend warrants 41 41 47 47
Total 41 41 47 47
The company has attended to most of the investors’ grievances / correspondences within a period of 10 days from the date of receipt of the same, during thequarter ended June 30, 2004 except in cases that are constrained by disputes or legal impediments.
8. Legal proceedings
There are some pending cases relating to disputes over title to shares, in which the company has been made a party. However, these cases are not material in nature.
9. Categories of shareholders as on June 30, 2004
Category No. of shareholders Voting strength (%) No. of shares heldIndian Promoters 19 22.02 1,47,24,559Foreign Institutional Investors 319 39.74 2,65,72,621Non Resident Indians 1,384 0.69 4,61,293Indian Financial Institutions 15 3.25 21,74,684Mutual Funds 158 2.80 18,81,767Banks 27 0.08 50,492Corporate Bodies 3,019 1.31 8,73,539Trust 28 0.84 5,60,764Employees 2930 4.92 32,87,379Public 1,59,767 16.40 1,09,60,373Equity shares underlying American Depositary Shares* 1 7.92 52,95,712Overseas Corporate Bodies 17 0.03 24,851
Total 1,67,684 100.00 6,68,68,034*Held by beneficial owners outside India.
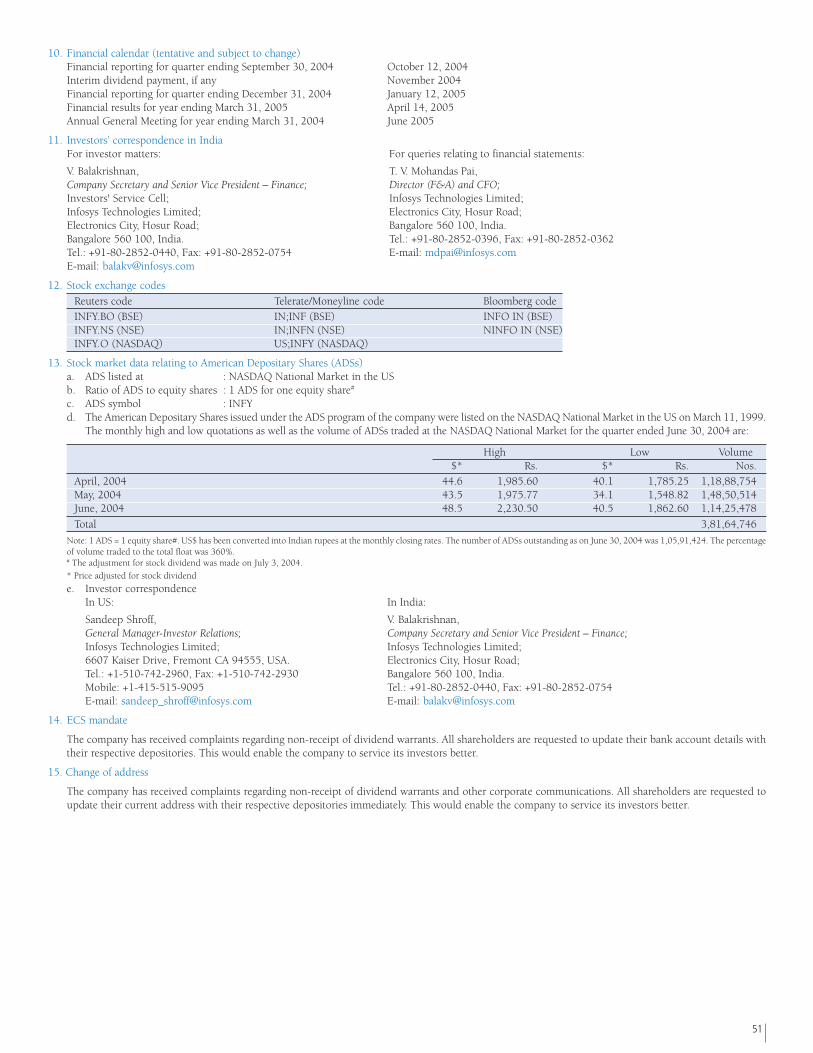
51
10. Financial calendar (tentative and subject to change)Financial reporting for quarter ending September 30, 2004 October 12, 2004Interim dividend payment, if any November 2004Financial reporting for quarter ending December 31, 2004 January 12, 2005Financial results for year ending March 31, 2005 April 14, 2005Annual General Meeting for year ending March 31, 2004 June 2005
11. Investors’ correspondence in IndiaFor investor matters: For queries relating to financial statements:
V. Balakrishnan, T. V. Mohandas Pai,Company Secretary and Senior Vice President – Finance; Director (F&A) and CFO;Investors' Service Cell; Infosys Technologies Limited;Infosys Technologies Limited; Electronics City, Hosur Road;Electronics City, Hosur Road; Bangalore 560 100, India.Bangalore 560 100, India. Tel.: +91-80-2852-0396, Fax: +91-80-2852-0362Tel.: +91-80-2852-0440, Fax: +91-80-2852-0754 E-mail: [email protected]: [email protected]
12. Stock exchange codes
Reuters code Telerate/Moneyline code Bloomberg codeINFY.BO (BSE) IN;INF (BSE) INFO IN (BSE)INFY.NS (NSE) IN;INFN (NSE) NINFO IN (NSE)INFY.O (NASDAQ) US;INFY (NASDAQ)
13. Stock market data relating to American Depositary Shares (ADSs)a. ADS listed at : NASDAQ National Market in the USb. Ratio of ADS to equity shares : 1 ADS for one equity share#
c. ADS symbol : INFYd. The American Depositary Shares issued under the ADS program of the company were listed on the NASDAQ National Market in the US on March 11, 1999.
The monthly high and low quotations as well as the volume of ADSs traded at the NASDAQ National Market for the quarter ended June 30, 2004 are:
High Low Volume $* Rs. $* Rs. Nos.
April, 2004 44.6 1,985.60 40.1 1,785.25 1,18,88,754May, 2004 43.5 1,975.77 34.1 1,548.82 1,48,50,514June, 2004 48.5 2,230.50 40.5 1,862.60 1,14,25,478
Total 3,81,64,746
Note: 1 ADS = 1 equity share#. US$ has been converted into Indian rupees at the monthly closing rates. The number of ADSs outstanding as on June 30, 2004 was 1,05,91,424. The percentageof volume traded to the total float was 360%.# The adjustment for stock dividend was made on July 3, 2004.
* Price adjusted for stock dividend
e. Investor correspondenceIn US: In India:
Sandeep Shroff, V. Balakrishnan,General Manager-Investor Relations; Company Secretary and Senior Vice President – Finance;Infosys Technologies Limited; Infosys Technologies Limited;6607 Kaiser Drive, Fremont CA 94555, USA. Electronics City, Hosur Road;Tel.: +1-510-742-2960, Fax: +1-510-742-2930 Bangalore 560 100, India.Mobile: +1-415-515-9095 Tel.: +91-80-2852-0440, Fax: +91-80-2852-0754E-mail: [email protected] E-mail: [email protected]
14. ECS mandate
The company has received complaints regarding non-receipt of dividend warrants. All shareholders are requested to update their bank account details withtheir respective depositories. This would enable the company to service its investors better.
15. Change of address
The company has received complaints regarding non-receipt of dividend warrants and other corporate communications. All shareholders are requested toupdate their current address with their respective depositories immediately. This would enable the company to service its investors better.

52
Infosys Technologies Limited
BankersICICI Bank Ltd.Bank of America
Company SecretaryV. Balakrishnan
AuditorsBharat S. Raut and Co.Chartered Accountants
Independent Auditors(US GAAP)KPMG LLP
© 2004 Infosys Technologies Limited, Bangalore, India. Infosys acknowledges the proprietaryrights in the trademarks and product names of other companies mentioned in the document.
United StatesAddison15305 Dallas ParkwaySuite 210Addison, TX 75001Tel. : 1 972 770 0450Fax : 1 972 770 0490
Atlanta400 Galleria ParkwaySuite 1490Atlanta, GA 30339Tel. : 1 770 980 7955Fax : 1 770 980 7956
Bellevue205 108th Avenue NESuite 550Bellevue, WA 98004Tel. : 1 425 452 5300Fax : 1 425 452 8440
Berkeley HeightsTwo Connell DriveSuite 4100Berkeley HeightsNew Jersey 07922Tel. : 1 908 286 3100Fax : 1 908 286 3125
Charlotte900 West Trade StreetSuite 750Charlotte, NC 28202Tel. : 1 704 264 1536
Fremont6607 Kaiser DriveFremont, CA 94555Tel. : 1 510 742 3000Fax : 1 510 742 3090
Lake ForestOne Spectrum PointeSuite 350Lake Forest, CA 92630Tel. : 1 949 206 8400Fax : 1 949 206 8499
Lisle2300 Cabot DriveSuite 250Lisle, IL 60532Tel. : 1 630 482 5000Fax : 1 630 505 9144
Livonia39111 W Six Mile RoadSuite 120Livonia, MI 48152Tel. : 1 734 779 1629
Phoenix10851 N Black Canyon FwySuite 830Phoenix, AZ 85029Tel. : 1 602 944 4855Fax : 1 602 944 4879
QuincyTwo Adams PlaceQuincy, MA 02169Tel. : 1 781 356 3100Fax : 1 781 356 3150
Reston11951 Freedom Drive13th Floor, Reston VA 20190Tel. : 1 703 251 4425Fax : 1 510 248 2084
Rochester134 West University DriveSuite 305Rochester, MI 48307Tel. : 1 248 608 2500Fax : 1 248 608 2557
Visit Infosys atwww.infosys.com
Call us atwithin the U.S.1 800 ITL INFO
outside the U.S.91 80 2852 0261
BelgiumAirport Boulevard Office ParkBessenveldstraat 251831-Diegem, BelgiumTel. : 32 2 716 4888Fax : 32 2 716 4880
Canada5140 Yonge StreetSuite 1400Toronto, Ontario M2N 6L7Tel. : 1 416 224 7400Fax : 1 416 224 7449
ChinaBeijing Representative Office14th Floor, IBM TowerPacific Century Place2A Workers Stadium Road NorthChaoyang DistrictBeijing 100027Tel. : 86 10 6539 1095 / 1063Fax : 86 10 6539 1060
France12 Avenue de I’ArcheFaubourg de l’Arche92419 Courbevoie CedexParisTel. : 33 1 46 91 84 56Fax : 33 1 46 91 88 45
GermanyTOPAS 1Mergenthalerallee 7765760 Eschborn/FrankfurtTel. : 49 6196 9694 0Fax : 49 6196 9694 200
Liebknechtstrasse 33D-70565 StuttgartTel. : 49 711 7811 570Fax : 49 711 7811 571
Hong Kong16F Cheung Kong Centre2 Queen’s Road CentralCentral, Hong KongTel. : 852 2297 2231Fax : 852 2297 0066
ItalyVia Torino 220123 Milano, ItalyTel. : 39 02 7254 6456Fax : 39 02 7254 6400
JapanIzumi Garden Wing 2F1-6-3, Roppongi, Minato-kuTokyo 106 0032Tel. : 81 3 5545 3251Fax : 81 3 5545 3252
MauritiusII & III FloorHassamal Shopping CenterCorner Remono Street& Queen StreetRose Hill, MauritiusTel. : 230 401 9200Fax : 230 464 1318
ScandinaviaStureplan 4C, 4tr114 35, StockholmSwedenTel. : 46 8 463 1112Fax : 46 8 463 1114
Switzerland1st Floor, Badenerstrasse 5308048, ZurichTel. : 41 43 817 4170Fax : 41 43 817 4150
The NetherlandsNewtonlaan 1153584 BH UtrechtTel. : 31 30 210 6462Fax : 31 30 210 6860
United Arab EmiratesY-45, P.O. Box 8230Sharjah Airport InternationalFree Zone (SAIF Zone)SharjahTel. : 971 6 5571 068Fax : 971 6 5571 056
United KingdomEmerald House15 Lansdowne RoadCroydon, Surrey CR0 2BXTel. : 44 208 774 3300Fax : 44 208 686 6631
3rd Floor, 288 Bishops GateLondon, EC2M 4QPTel. : 44 207 959 3029Fax : 44 207 959 3089
IndiaBangaloreElectronics City, Hosur RoadBangalore 560 100Tel. : 91 80 2852 0261Fax : 91 80 2852 0362
Reddy BuildingK-310, 1st Main, 5th BlockKoramangalaBangalore 560 095Tel. : 91 80 2553 2591 / 92Fax : 91 80 2553 0391
BhubaneswarPlot No. E/4, Info CityBhubaneswar 751 024Tel. : 91 674 232 0032Fax : 91 674 232 0100
ChennaiNo.138Old Mahabalipuram RoadSholinganallurChennai 600 119Tel. : 91 44 2450 9530 / 40Fax : 91 44 2450 0390
HyderabadSurvey No. 210Manikonda VillageLingampallyRangareddy (Dist)Hyderabad 500 019Tel. : 91 40 2300 5222Fax : 91 40 2300 5223
MangaloreKuloor Ferry Road, KottaraMangalore 575 006Tel. : 91 824 245 1485 / 88Fax : 91 824 245 1504
MohaliB 100, Industrial AreaPhase VIII, SAS NagarMohali 160 059Tel. : 91 172 509 0510
91 172 223 7191Fax : 91 172 223 7193
Mumbai85, ‘C’, Mittal Towers8th Floor, Nariman PointMumbai 400 021Tel. : 91 22 2284 6490Fax : 91 22 2284 6489
MysoreNo. 350Hebbal Electronics CityHootagalli, Mysore 571 186Tel. : 91 821 240 4101Fax : 91 821 240 4200
New DelhiK30, Green Park MainBehind Green Park MarketNew Delhi 110 016Tel. : 91 11 2651 4829Fax : 91 11 2685 3366
PunePlot No. 1Rajiv Gandhi Infotech ParkHinjawadi, Taluka MulshiPune 411 057Tel. : 91 20 2293 2800Fax : 91 20 2293 2832
Thiruvananthapuram3rd Floor, Bhavani, TechnoparkThiruvananthapuram 695 581Tel. : 91 471 270 0888Fax : 91 471 270 0889
Subsidiaries
Infosys Technologies(Australia) Pty. Limited
MelbourneLevel 2 & 3, 484, St. Kilda RoadMelbourne VIC 3004Tel. : 61 3 9860 2000Fax : 61 3 9860 2999
Level 18 & 25150 Lonsdale StreetMelbourne VIC 3000Tel. : 61 3 8664 6100Fax : 61 3 8650 6199
SydneyLevel 4, 77 Pacific HighwayNorth Sydney NSW 2060Tel. : 61 2 8912 1500Fax : 61 2 8912 1555
Infosys Technologies(Shanghai) Co. Ltd.Bldg 24 & 25PuDong Software ParkNo. 498 Guo Shou Jing RoadPuDong New Area, ShanghaiChina 201203Tel. : 86 21 5027 1588Fax : 86 21 5080 2927
Progeon LimitedPlot No. 26/3, 26/4 and 26/6Electronics City, Hosur RoadBangalore 560 100Tel. : 91 80 2852 2405Fax : 91 80 2852 2411
27, SJR TowersBannerghatta RoadJ. P. Nagar III PhaseBangalore 560 078Tel. : 91 80 2658 8668Fax : 91 80 2658 8676
Progeon SRO4th Floor, 26, 28 & 30Masarykova StreetBrno 60200Czech RepublicTel. : 420 731 146 275
Infosys Consulting, Inc.15305 Dallas ParkwaySuite 210Addison, TX 75001Tel. : 1 972 770 0450Fax : 1 972 770 0490


