RiverL ake Attributes for Intermittently Open and Closed Lakes and Lagoons (ICOLLs) applicable to the National Objectives Framework for Fresh Water Prepared for: Ministry for the Environment
Transcript
RiverLake
Attributes for Intermittently Open and Closed Lakes and Lagoons (ICOLLs) applicable to the National Objectives Framework for Fresh Water
Prepared for:
Ministry for the Environment
RiverLake
Attributes for Intermittently Open and Closed Lakes and Lagoons (ICOLLs) applicable to the National Objectives Framework for Fresh Water
Authors/ Contributors:
K. D. HamillDavid KellyDavid HamiltonClive Howard-WilliamsBarry RobertsonMarc SchallenbergBill VantNick Ward
Prepared for:
Ministry for the Environment
Released by: ………………………………
Keith Hamill
Date: 14 October 2014Status: FinalReference: wk-1028
All rights reserved. This publication may not be reproduced or copied in any form without the permission of the client. Such permission is to be given only in accordance with the terms of the client's contract with River Lake Ltd.
Possible attributes applicable to ICOLLs and brackish lakes for the NOF
Contents
1 Introduction....................................................................................................................................61.1 Background..................................................................................................................................61.2 Expert panel for ICOLLs and brackish lakes..................................................................................61.3 Meetings......................................................................................................................................71.4 Ecosystem health.........................................................................................................................7
2 Characteristics of ICOLLs and brackish lakes....................................................................................82.1 Definition for the purpose of the NPS-FM....................................................................................82.2 Sensitivity to external nutrient loads...........................................................................................92.3 Ecology of ICOLLs and brackish lakes.........................................................................................10
3 Attributes and Thresholds.............................................................................................................153.1 Approach....................................................................................................................................153.2 Phytoplankton (chlorophyll-a)...................................................................................................173.3 The concentration of total nitrogen and total phosphorus........................................................213.5 Macroalgae and sediment anoxia..............................................................................................263.7 Aquatic Macrophytes.................................................................................................................323.8 Potential attributes not proposed for use in the NOF-FW..........................................................363.9 What other attribute tables should apply to brackish lakes and ICOLLs?...................................37
4 Current state of ICOLLs and brackish lakes using the proposed attributes......................................384.1 Introduction...............................................................................................................................384.2 Method......................................................................................................................................384.3 Results........................................................................................................................................394.4 Discussion...................................................................................................................................42
Appendix 1: Terms of reference for expert panel....................................................................................52
Appendix 2: Guiding Principles for NOF Attribute Development..............................................................54
Appendix 3: Narrative definitions of Ecosystem Health for ICOLLs...........................................................55
Appendix 4: Estuary definitions (including Intermittently Closed / Open Estuaries).................................56
14 October 2014 1
Possible attributes applicable to ICOLLs and brackish lakes for the NOF
Executive Summary
This report describes the advice of an expert panel on possible attributes and thresholds relevant to the ecosystem health of Intermittently Closed and Open Lakes and Lagoons (ICOLLs) and brackish lakes, and their potential for consideration as part of the National Objectives Framework (NOF) in the National Policy Statement for Freshwater Management (NPS-FM). The work was initiated by the Ministry for the Environment (MfE) with the intention of clarifying ambiguity in Appendix 2 of the current NPS-FM with respect to how attributes and bottom-lines apply to ICOLLs.
A number of potential attributes were identified. Phytoplankton biomass (using chlorophyll-a as a proxy), total nitrogen and total phosphorus have relatively robust thresholds that readily fulfil the first four Guiding Principles. The thresholds are similar to those set for Lakes in the NPS-FM, but the monitoring and reporting differs to account for intermittent marine influence.
Two new potential attributes were identified: anoxia caused by macroalgae (using Gross Eutrophic Zones (GEZ) as a proxy), and Macrophytes. Managing these two attributes was viewed by the panel as important for maintaining ecosystem health of marine influenced lakes (Principle 1). They fulfil Principle 2 (regarding management and band thresholds) reasonably well; however it is recognised that the thresholds for GEZ and macrophyte cover rely on a degree of professional judgement, the indicator of GEZ is not widely monitored and that some further work may be needed to standardise protocols. There was little monitoring data available to assess the state of GEZs at a national scale (Principle 4).
The following tables outline our proposed attributes and thresholds relating to the ecosystem health of lakes with marine influence and for consideration as part of the NOF:
14 October 2014 2
Possible attributes applicable to ICOLLs and brackish lakes for the NOF
Value Ecosystem health
Freshwater Body Type Intermittently Closed and Open Lakes and Lagoons (ICOLLs) and brackish lakes
Attribute Phytoplankton
Attribute Unit mg/m3 (milligrams chlorophyll-a per cubic metre)
Attribute State Numeric Attribute State Narrative Attribute State
Annual Median *
Annual Maximum
A ≤2 ≤10 Ecological communities are healthy and resilient.
B >2 and ≤5 >10 and ≤25 Ecological communities are slightly impacted by additional algal growth arising from nutrients levels that are elevated.
C >5 and ≤12 >25 and ≤60 Ecological communities are moderately impacted by phytoplankton biomass elevated well above natural conditions. Reduced water clarity likely to affect habitat available for native macrophytes.National Bottom Line 12 60
D >12 >60 Excessive algal growth making ecological communities at high risk of undergoing a regime shift to a persistent, degraded state without macrophyte/seagrass cover.
* Median to apply both during periods when the ICOLL is open and during periods when the ICOLL is closed. Based on a rolling median of at least 12 samples for each situation (i.e. open or closed), and assuming a regular (e.g. monthly) monitoring regime.
Value Ecosystem health
Freshwater Body Type Intermittently Closed and Open Lakes and Lagoons (ICOLLs) and brackish lakes
Attribute Total Nitrogen
Attribute Unit mg/m3 (milligrams per cubic metre)
Attribute State Numeric Attribute State
Narrative Attribute State
Annual Median *
A ≤160 Ecological communities are healthy and resilient.
B >160 and ≤350 Ecological communities are slightly impacted by additional algal growth arising from nutrients levels that are elevated above natural conditions.
C >350 and ≤750 Ecological communities are moderately impacted by additional phytoplankton and macro arising from elevated nutrients levels. The cover and diversity of native macrophytes is likely to be low.National Bottom Line 750
D >750 High risk of excessive algal growth and likelihood of undergoing a regime shift to a persistent, degraded state without macrophyte/seagrass cover.
* Median to apply both during periods when the ICOLL is open and during periods when the ICOLL is closed. Based on a rolling median of at least 12 samples for each situation (i.e. open or closed), and assuming a regular (e.g. monthly) monitoring regime.
14 October 2014 3
Possible attributes applicable to ICOLLs and brackish lakes for the NOF
Value Ecosystem health
Freshwater Body Type Intermittently Closed and Open Lakes and Lagoons (ICOLLs) and brackish lakes
Attribute Total Phosphorus
Attribute Unit mg/m3 (milligrams per cubic metre)
Attribute State Numeric Attribute State
Narrative Attribute State
Annual Median *
A ≤10 Ecological communities are healthy and resilient.
B >10 and ≤20 Ecological communities are slightly impacted by additional algal growth arising from nutrients levels that are elevated above natural conditions.
C >20 and ≤50 Ecological communities are moderately impacted by additional phytoplankton and macroalgae arising from elevated nutrients levels. The cover and diversity of native macrophytes is likely to be low.National Bottom Line 50
D >50 High risk of excessive algal growth and likelihood of undergoing a regime shift to a persistent, degraded state without macrophyte/seagrass cover.
* Median to apply both during periods when the ICOLL is open and during periods when the ICOLL is closed. Based on a rolling median of at least 12 samples for each situation (i.e. open or closed), and assuming a regular (e.g. monthly) monitoring regime.
14 October 2014 4
Possible attributes applicable to ICOLLs and brackish lakes for the NOF
Value Ecosystem health
Freshwater Body Type Intermittently Closed and Open Lakes and Lagoons (ICOLLs) and brackish lakes
Attribute Macroalgae - cover, biomass and sediment anoxia measured as Gross Eutrophic Zones (GEZ)1
Attribute Unit Percent cover and area in hectares 2
Attribute State Numeric Attribute State
Narrative Attribute State
A GEZ <0.5% cover Extent of macroalgal biomass and cover is similar to natural conditions, and has little impact on surrounding ecology.
B GEZ 0.5-5% cover Ecological communities are slightly impacted by additional macroalgal biomass arising from elevated nutrients levels.
C GEZ 5-15% cover Ecological communities are moderately impacted by macroalgae and sediment anoxia. Lake primary production well above natural conditions.National Bottom Line GEZ 15% cover or
>20ha
D GEZ >15% cover or >20ha
Extensive areas of macroalgae and sediment anoxia cause adverse impacts on aquatic macrophytes, sediment macrofauna, fish and birdlife. Internal loads likely to be substantial and high risk of ecological communities undergoing a regime shift to a degraded state.
1 GEZ = Gross Eutrophic Zones characterised as macroalgal biomass > 500g/m2 (wet weight) combined with anoxic surface sediments. Macroalgae includes macroscopic, loosely adhered epiphytes and periphyton.2 Results to be based on a survey during the period of likely maximum annual biomass.
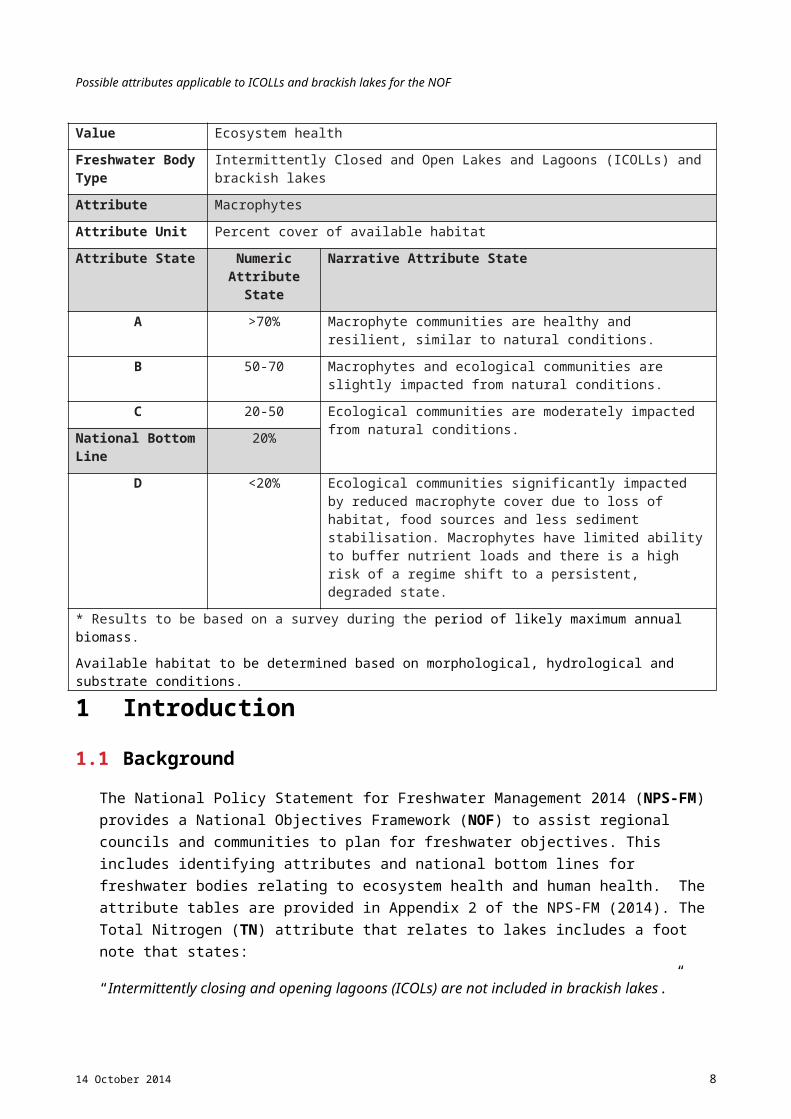
Value Ecosystem health
Freshwater Body Type Intermittently Closed and Open Lakes and Lagoons (ICOLLs) and brackish lakes
Attribute Macrophytes
Attribute Unit Percent cover of available habitat
Attribute State Numeric Attribute State
Narrative Attribute State
A >70% Macrophyte communities are healthy and resilient, similar to natural conditions.
B 50-70 Macrophytes and ecological communities are slightly impacted from natural conditions.
C 20-50 Ecological communities are moderately impacted from natural conditions.
National Bottom Line 20%
D <20% Ecological communities significantly impacted by reduced macrophyte cover due to loss of habitat, food sources and less sediment stabilisation. Macrophytes have limited ability to buffer nutrient loads and there is a high risk of a regime shift to a persistent, degraded state.
* Results to be based on a survey during the period of likely maximum annual biomass.
Available habitat to be determined based on morphological, hydrological and substrate conditions.
14 October 2014 5
Possible attributes applicable to ICOLLs and brackish lakes for the NOF
1 Introduction
1.1 Background
The National Policy Statement for Freshwater Management 2014 (NPS-FM) provides a National Objectives Framework (NOF) to assist regional councils and communities to plan for freshwater objectives. This includes identifying attributes and national bottom lines for freshwater bodies relating to ecosystem health and human health. The attribute tables are provided in Appendix 2 of the NPS-FM (2014). The Total Nitrogen (TN) attribute that relates to lakes includes a foot note that states:
“Intermittently closing and opening lagoons (ICOLs) are not included in brackish lakes.”
This footnote has caused ambiguity as to whether the other attributes (e.g. phytoplankton, total phosphorus, TN for polymictic lakes) perhaps should apply to intermittently closed and open lakes and lagoons (ICOLLs).
In order to resolve the uncertainty around the application of the lake attribute tables to ICOLLs, the Ministry for the Environment (MfE) convened a science panel for ICOLLs consisting of national lake and coastal experts (see Terms of Reference in Appendix 1). The purpose of the ICOLLs expert panel was to:
Identify the feasibility of developing attributes for ICOLLs and advise on necessary work packages and timeframes;
Propose a set of draft attributes and numbers for ICOLLs; and
Consider potential attributes against the first three criteria in the ‘Guiding Principles for NOF Attribute Development’ (Appendix 2).
In the course of defining an ICOLL, it was decided to also consider the relevance of attributes described for ICOLLs to be applied to brackish lakes. The panel was in agreement that there were no instances in which the described attributes were exclusive to only ICOLLs, therefore the attributes discussed in this report relate to both ICOLLs and brackish lakes.
This report describes the advice of the expert panel on possible attributes and thresholds for consideration as part of the NOF. The report also assesses potential attributes using Principles 1, 2, 3 and 4 the Guiding Principles for NOF Attribute Development, namely: 1) attribute link to the national value, 2) measurement and band thresholds for the attribute, 3) relationship to limits and management, and 4) evaluation of current state of the attribute at a national scale.
1.2 Expert panel for ICOLLs and brackish lakes
The members of the expert panel were: Barry Robertson (Wriggle Coastal Management), Bill Vant (Waikato Regional Council), Clive Howard Williams (NIWA), David Hamilton (University of Waikato), David Kelly (Cawthron), Marc Schallenberg (University of Otago), Nick Ward (Environment Southland), Piet Verburg (NIWA), and Keith Hamill (River Lake Ltd) who acted as co-ordinator.
14 October 2014 6
Possible attributes applicable to ICOLLs and brackish lakes for the NOF
1.3 Meetings
The ICOLLs’ expert panel met on four occasions in the process of developing the draft attributes for ICOLLs, although not all members were present on all occasions:
15 August 2014: teleconference discussing the definition of ICOLLs, the feasibility of task and a draft set of key attributes relevant to ICOLLs.
20 August 2014: teleconference discussing relevant attributes in more detail and identifying sources of data for establishing numeric thresholds.
27 August 2014: Meeting in Wellington discussing the definition and classification of ICOLLs, narrative definitions and possible numeric thresholds for macroalgae and macrophyte cover.
September 2014: Meeting in Wellington discussing possible numeric thresholds for phytoplankton (chlorophyll-a), total nitrogen, total phosphorus, and nitrogen areal loading.
The group tested each of the thresholds by asking how it differed from the thresholds previously set for lakes. If it was different then an explanation was provided as to why it was different.
1.4 Ecosystem health
The attributes and thresholds for ICOLLs and brackish lakes that are described in this report are intended to support Ecosystem Health. Appendix 1 of the NPS-FM describes ecosystem health (Te Hauora o te Wai) as:
“The freshwater management unit supports a healthy ecosystem appropriate to that freshwater body type (river, lake, wetland, or aquifer).
In a healthy freshwater ecosystem ecological processes are maintained, there is a range and diversity of indigenous flora and fauna, and there is resilience to change.
Matters to take into account for a healthy freshwater ecosystem include the management of adverse effects on flora and fauna of contaminants, changes in freshwater chemistry, excessive nutrients, algal blooms, high sediment levels, high temperatures, low oxygen, invasive species, and changes in flow regime. Other matters to take into account include the essential habitat needs of flora and fauna and the connections between water bodies. The health of flora and fauna may be indicated by measures of macroinvertebrates.”
There may be other values associated with ICOLLs that might require different attributes and different thresholds (e.g. fishery values or mahinga kai values). These were not considered by the panel.
14 October 2014 7
Possible attributes applicable to ICOLLs and brackish lakes for the NOF
2 Characteristics of ICOLLs and brackish lakes
2.1 Definition for the purpose of the NPS-FM
ICOLLs, as their name implies, are characterised by being intermittently open and closed to the sea. This gives them characteristics typical of both lakes and estuaries. When closed they have little or no tidal connection and behave like a terminal lake with a long water residence time (e.g. in the order of months). In this state, water level is determined by catchment runoff, evaporation and seepage. When open, the water level drops and ICOLLs become tidal and more saline due to marine intrusions. Often the entrances to ICOLLs are artificially opened to reduce flooding of surrounding land. Artificial opening generally keep ICOLLs open to the sea, and at a lower water level for a longer period of time than would naturally occur.
ICOLLs and brackish lakes can fit within an estuary classification system. They are ecologically different from shallow lakes in that they have intermittent regime shifts in hydrology, chemistry and ecology driven by changes in salinity and the opening/closing regime. For the purpose of the NPS-FM we have used the following definitions:
Brackish Lake: A coastal lake that either consistently or temporarily exceeds a (marine derived) salinity of 0.5 psu and which has its permanent or temporary connection to the sea some distance downstream from the lake. These systems are located in upper estuaries and at least sometimes exhibit tidal fluctuations. Sometimes they are located above ICOLLs. Examples of brackish lakes include: Lake Waihola, Lake Waipori, Tomahawk Lagoon #2 (Otago), Muriwai/ Coopers Lagoon (Canterbury), and Lake Wairarapa (Wellington). Our definition of brackish lakes does not include lakes where salinity is of geothermal origin.
ICOLL: A coastal lagoon or tidal lagoon with an intermittently closed and open direct connection to the sea. These systems form in topographic depressions, next to the sea and are nearly or completely enclosed by a sand/gravel bar. ICOLLs have either permanently, intermittently or partially brackish water (i.e. marine derived salinity > 0.5 psu). Examples of New Zealand ICOLLs (as defined in this report) are: Waituna Lagoon, Lake Brunton (Southland), Hawksbury Lagoon, Tomahawk Lagoon #1 (Otago), Te Waihora/Lake Ellesmere, Wairewa/Lake Forsyth, Wainono Lagoon (Canterbury), Three Mile Lagoon, Five Mile Lagoon, (West Coast), Te Whanga (Chatham Island), Lake Onoke (Wellington) and Whakaki Lagoon (Hawkes Bay).
For the purpose of this document we have not considered tidal river mouth lagoons that might intermittently open and close (also known as hapua). Tidal river mouth lagoons tend to be narrow, with a well-defined channel. They are characterised by a shift in morphology due to the dynamics of marine and fluvial processes. Examples of hapua / river mouth lagoons include: Waiau Lagoon (Southland), Kakanui River estuary (Otago), Opihi Lagoon (Canterbury), Wairau Lagoons (Marlborough), Rakaia River Lagoon (Canterbury), and Piha Lagoon (Auckland). Kirk and Lauder (2000) provide a detailed discussion distinguishing coastal lagoons including ICOLLs from river mouth lagoons/hapua.
These definitions have been based on a definition of estuaries described in Madden et al. (2008) and a classification of different estuarine types used by CSWRCB (2012) (see Appendix 4). The threshold salinity of 0.5 psu approximately corresponds to where changes in geochemistry occur is the salinity
14 October 2014 8
Possible attributes applicable to ICOLLs and brackish lakes for the NOF
threshold which roughly delineates (Dyer 1997) and the approximate seaward extent of inanga spawning.
Brackish lakes and ICOLLs span a spectrum, with some appearing more characteristic of freshwater lakes and some more characteristic of estuaries. Consequently it is expected that there could be overlap with ongoing work developing a classification system and attributes for defining the ecological health of estuaries. We recommend that there is opportunity to review the attributes we have developed once the work on estuaries has been completed.
From a planning perspective, ICOLLs have been classified as either freshwater or coastal waters depending on where regional councils historically chose to set the boundary for the Coastal Marine Area (CMA). Regional councils have drawn coastal marine area (CMA) boundaries in their Regional Coastal Plans for all rivers in their regions. The locations of these boundaries do not necessarily coincide with the extent of marine water influence. Nevertheless, ICOLLs within the CMA boundary at or downstream of the outlet from the lagoon are generally managed as fresh water, while ICOLLs with the CMA boundary at or above the inflowing streams or rivers are managed as part of the coastal marine area (and therefore are not required to have objectives set using the attributes provided in the NPS-FM).
2.2 Sensitivity to external nutrient loads
Morphological characteristics of ICOLLs have an important influence on their vulnerability to external nutrient loads. Haines et al. (2006) described a framework for assessing the vulnerability of ICOLLs to external loads in New South Wales. They used morphometric parameters such as area, volume, shape and proportion of time the lagoon is open or closed to the ocean, to define three separate factors that each measures one aspect of the natural sensitivity. These factors were:
A measure of how efficiently a coastal lagoon can remove pollutants through tidal flushing, called ‘Evacuation Factor’. It is the product of the tidal prism ratio and a shape function, after adjusting for the proportion of time the lagoon is open.
A measure of the relative ratio between the input loads from the catchment and the resident volume of the ICOLL after adjusting for the proportion of time the lagoon is closed, called ‘Dilution Factor’.
A measure of the water level variability in an ICOLL called ‘Assimilation Factor’. It is the ratio of the catchment inflow volume and the lagoon area, after adjusting for the proportion of time the lagoon is closed. This was thought to influence the extent and diversity of biological processes and their capacity to assimilate or accommodate external inputs.
Other factors can also be important in determining the sensitivity of a lagoon to external pressures. For example, the size of the lagoon plays an important role in the extent of tidal flushing (evacuation). This was identified as a factor whereby Te Waihora was more sensitive to external nutrient loads than Waituna Lagoon because of its greater size and consequently its reduced efficiency of tidal flushing (Gale et al. 2007; Schallenberg et al. 2010).
14 October 2014 9
Possible attributes applicable to ICOLLs and brackish lakes for the NOF
In order for our attributes to be applicable to ICOLLs throughout New Zealand, we have recommended attributes that reflect the ecological response of an ICOLL to nutrient over-enrichment (e.g. algal biomass, nutrient concentration), rather than drivers of enrichment (e.g. nitrogen areal loading). Nevertheless, differences in the vulnerability of lakes and lagoons to pressures means that there is a risk that thresholds set at a national level are overly conservative for some lagoons or too lax for others.
Changing the opening regime can potentially affect the sensitivity of an ICOLL to external nutrient loads. However, as noted by Haines et al. (2006) it is ‘not recommended that coastal lagoon entrances be opened artificially to reduce sensitivity to external inputs without thorough environmental investigation, as changing the entrance behaviour may lead to other impacts, such as drying out of fringing wetlands, increased shoaling at the entrance, and changes to macrophyte and benthos communities.’
The panel recognised that one of the difficulties in establishing appropriate NOF ecological attributes for ICOLLS and other brackish lakes was around achievability related to legacy effects (e.g. past inputs of nutrient rich sediments). Some of the ICOLLS considered are in highly modified landscapes, and opening/closing frequencies are now predominantly controlled around preventing inundation of surrounding rural and urban land. The panel considered if separate less-strict attributes could/should be developed for highly modified systems that might increase the achievability for regional authorities. The panel ultimately arrived at the position that it was not appropriate to do so, because there was little ecological justification and because rehabilitation goals can be set and achieved over long timeframes. Our focus has been on setting attributes for ecological health that can be applied to ICOLLs regardless of legacy. A similar approach was taken for NOF attributes of freshwater lakes which can have similar legacy issues (e.g. Lake Horowhenua).
2.3 Ecology of ICOLLs and brackish lakes
2.3.1 Healthy ecosystems
ICOLLs are complex systems. Their biological, chemical and physical states are constantly changing in response to internal and external variables such as climate, inflows (from groundwater, rivers and the sea), the water quality of inflows, and interactions between species. Unlike other shallow lakes they have significant fluctuations in salinity and variable hydrology with intermittent opening, and these can have major impacts on the structure and functioning of the lagoons’ ecosystem (Schallenberg et al. 2003).
Characteristics of a brackish lakes and ICOLLs in a healthy state are described in Appendix 3, and include:
Extensive beds of indigenous aquatic macrophytes (e.g. the sea grass Ruppia spp., or Zostera spp.). Macrophyte beds are a key component of healthy ICOLLs, acting to regulate water quality and phytoplankton growth, and providing habitat for invertebrates and fish (Kelly and Jellyman 2007; Schallenberg et al. 2010). Overseas studies have shown that submerged aquatic plant
14 October 2014 10
Possible attributes applicable to ICOLLs and brackish lakes for the NOF
cover needs to be consistently >30–60% to ensure a clear-water state (e.g. Jeppesen et al. 1994; Tatrai et al. 2009; Blindow et al. 2002).
Low cover of macroalgae. Blooms of macroalgae are linked to sediment anoxia and can contribute to the collapse of macrophytes. An increase in the cover of macroalgae can lead to macrophyte collapse in ICOLLs (Viaroli et al. 2009, WTG 2012).
Restricted distribution of anoxic sediment. Sediment anoxia excludes most communities of benthic macrofauna (e.g. Grizzle & Penniman 1991), increases the production of sulphides which can be toxic to rooted macrophytes (Lamers et al. 2013; Holmer & Bondgaard 2001; Geurts et al. 2009); and can result in the release of dissolved phosphorus and ammonium that exacerbate eutrophication (e.g. Søndergaard et al. 2003; Pratt et al. 2013).
Low concentrations of phytoplankton. High concentrations of phytoplankton in the water column reduce light penetration and can lead to the collapse of sea grass beds. Lakes and lagoons with high residence time are particularly vulnerable to phytoplankton blooms.
Low or moderate nitrogen (N) and phosphorus (P) concentrations and loads. N and P are essential plant nutrients in aquatic systems and their supply in inflowing waters favours the growth of phytoplankton and macroalgae, which can proliferate to nuisance levels.
Low sedimentation rates of fine sediments. Deposition of fine sediment contributes to source material that reduces light penetration when resuspended, contributes to bottom-sediment anoxia, and is associated with reduced diversity and density of benthic macrofauna (Pratt et al. 2013).
These factors are often influenced by human activities, leading to the degradation of ICOLLs and brackish lakes. Scanes (2012) identified features of Australian (New South Wales) ICOLLs at different levels of disturbance as:
Reference Condition: clear waters with minimal algal blooms, strong macrophyte growth and good fish assemblages.
Moderately Disturbed: some eutrophication symptoms but still supporting healthy aquatic macrophyte and fish communities; the system exhibits some resilience to disturbance.
Highly Disturbed: algal dominated, turbid systems, aquatic macrophytes absent or reduced with associated changes in fish assemblages; the system has undergone a regime shift, having lost key components of a healthy system
2.3.2 Salinity variations
The combination of freshwater and marine influences makes the management of ICOLLs and brackish lakes distinctly different from the management of freshwater lakes. The fluctuating salinity regime supports a unique assemblage and dynamics of species adapted to live in environments of fluctuating salinity (Hamilton et al. 2012). Incursions of seawater can provide positive benefits like flushing of nutrients and sediments, dilution of nutrient and phytoplankton concentrations, and improved fish passage to the sea. On the other hand they also result in stresses, by increasing salinity. In ICOLLs and
14 October 2014 11
Possible attributes applicable to ICOLLs and brackish lakes for the NOF
brackish lakes upstream from ICOLLs, openings of the barrier bar results in lowered water levels which can increase wind resuspension of bottom sediments and cause desiccation of sea grass beds (Hamill and Schallenberg 2013, Robertson and Funnell 2012). Prolonged periods of high salinity can compromise the germination of sea grass and promote the proliferation of nuisance macroalgae (e.g. Bachelotia in Waituna Lagoon) (Sim et al. 2006, Gerbeaux 1989, WLTG 2013).
Opening an ICOLL can cause a shift in the type of algae growing in the lagoon. Phytoplankton biomass (using chlorophyll-a in water samples as a proxy) tends to be greater when the lagoon is closed (because of reduced flushing), but macroalgal biomass can grow to nuisance levels both when ICOLLs are open (e.g. the marine brown alga, Bachelotia in Waituna) and closed (WLTG2013).
Salinity-induced regime shifts can occur from a low-salinity, clear-water state (that encourages high value submerged aquatic macrophytes) to a high-salinity, turbid-water state (characterised by high phytoplankton biomass). Jeppesen et al. (2007a) found that an increase in salinity reduced water clarity due to a reduction in zooplankton (e.g. Daphnia sp.) abundance and reduced grazing of phytoplankton. The effect was strongest in brackish lakes with medium to high nutrient loading. They concluded that improved water quality can be obtained by reducing the nutrient loading or enhancing the freshwater input to enhance the abundance of Daphnia (typically at salinities <2 psu). In lagoons open to the sea it becomes very difficult to distinguish the impact of changes in salinity due to opening from related co-variables such as increased flushing, lower water levels etc.
2.3.3 The effect of nutrient loads
The eutrophication on estuaries creates primary and secondary responses. The primary responses are high levels of phytoplankton (using chlorophyll-a as a proxy), epiphytes and/or macroalgae1. The presence of primary symptoms at high levels indicates that an estuary is in the first stages of displaying undesirable eutrophic conditions. The second, much more degraded state, occurs when secondary symptoms of depleted dissolved oxygen, anoxic sulphide-rich sediments, sea grass loss, and nuisance or toxic algal blooms begin to appear (Wriggle Coastal Management 2012, Bricker et al. 1999).
Increasing the load of nutrients to a brackish lade or ICOLL typically increases plant and algal growth (primary productivity), but the response is often not linear. The structure of biological communities initially confers resistance to change, but as nutrient loads increase beyond a certain threshold the ecosystem becomes vulnerable to rapid change. This is referred to as a regime shift. In shallow lakes and ICOLLs, increasing nutrient loads often result in a shift from a macrophyte dominated, clear water state, to a degraded turbid water state without macrophytes. Ecological feedbacks cause degraded systems to be resilient against restoration efforts (Scheffer 2004, Schallenberg & Sorrell 2009).
We consider that an appropriate national bottom-line for ICOLLs (and brackish lakes) is the condition where the ecological community is at high risk of a regime shift and loss of macrophytes. This is typically characterised by elevated biomass of macroalgae, more anoxic sediments and increasing phytoplankton concentrations.
1 We use the term macroalgae in this report to refer generically to algae that are visible to the naked eye and may include periphyton or epiphytes. They are distinguished from phytoplankton and macrophytes.
14 October 2014 12
Possible attributes applicable to ICOLLs and brackish lakes for the NOF
2.3.4 The need for multiple attributes
Multiple indicators need to be measured to understand the ecological state of ICOLLs and brackish lakes because of complex interactions that occur between the water quality, sediments and biology (Drake et al. 2010). Compared to lakes, macroalgae can be a particularly dominant feature of ICOLLs as they become more eutrophic. A considerable amount of nutrient can be assimilated by macroalgae, and when this occurs, assessing the condition of an ICOLL based solely on water quality variables (e.g. TN, TP, chlorophyll-a) can be misleading.
Another reason for considering multiple indicators to assess health is that management actions can potentially improve some values but degrade other values. For example, opening a lagoon may improve water quality because of improved flushing, but long periods of opening can compromise sea grass germination and growth (Robertson & Funnell 2011).
Using multiple indicators (i.e. chlorophyll-a, TN and TP) was also considered important when setting attributes and thresholds for lakes because sometimes the relationship between TN, TP and phytoplankton (measured as chlorophyll-a) can become decoupled. This also applies to ICOLLs and brackish lake. Reasons for this decoupling between nutrients and phytoplankton include:
Ecological feedbacks and resilience: Shallow lakes and ICOLLs can demonstrate significant regime shifts and thus a hysteresis which will affect nutrient- chlorophyll-a relationships. Thus relationships of nutrient concentrations to chlorophyll-a concentrations are not linear in these lakes, particularly when comparing the degradation and recovery pathways. Specifically, the degradation pathway may show significant ecological resilience characterised by low chlorophyll-a for the measured nutrient concentrations (at a time when submerged macrophytes are present and compete effectively for nutrients) and vice versa when macrophytes are absent and planktonic algae represent the sole biological uptake mechanism for nutrients.
Dissolved organic nutrients: Many oligotrophic lakes in New Zealand are characterised by increasing relative concentrations of nutrients in dissolved organic forms compared with other lakes. Thus TP and TN in particular, increasingly start to diverge from their biological proxy status as a planktonic growth potential metric.
Suspended sediments: Sediment resuspension in shallow lakes can lead to high TP concentrations, most of which is unavailable to phytoplankton or macroalgae. Partially due to frequent sediment resuspension, shallow lakes are also often characterised by shallow light penetration depths and thus one would expect low biological response for the level of nutrients (P in particular) in these lakes.
Times lags: The time lag between nutrient pulses and biological responses can temporarily decouple the link between nutrient concentrations and chlorophyll-a. Time scales for coupling/decoupling may be quite diverse. For example, organic N and P must undergo mineralisation to transform it into forms most available to phytoplankton (e.g. dissolved reactive phosphorus, nitrate, ammonium). In addition, many phytoplankton taxa can store excess phosphorus as polyphosphate granules, temporarily decoupling P uptake from cell growth and division.
14 October 2014 13
Possible attributes applicable to ICOLLs and brackish lakes for the NOF
Photoadaptation and the use of accessory pigments: Photoadaptation by algae (changes in the chla: carbon ratio) can alter the specific chlorophyll a content of cells, potentially leading to false inferences about the phytoplankton biomass. Photoadaptation can happen in response to seasonal changes in available light, changes in turbidity, changes in water depth (mixing depth) and changes in phytoplankton species composition.
Grazing: Intense grazing pressure by zooplankton and bivalves can substantially reduce the phytoplankton biomass in lakes, despite nutrients being available to potentially support a higher phytoplankton biomass.
Allelopathy: Some macrophyte species are able to produce extracellular metabolites that inhibit phytoplankton growth. This can decouple phytoplankton biomass from nutrient concentrations in the water column.
Nitrogen fixation: Some cyanobacteria are able to harvest nitrogen from dinitrogen gas dissolved in the water column. Dominance of the phytoplankton community by such taxa can lead to a decoupling of phytoplankton biomass from supplies of nitrate and ammonium (i.e. TN).
Co-management of both N and P is also likely to be required given that nutrient limitation can vary with salinity, season, and/or plant species composition.
14 October 2014 14
Possible attributes applicable to ICOLLs and brackish lakes for the NOF
3 Attributes and Thresholds
3.1 Approach
3.1.1 Information sources
Comprehensive water quality and ecological data exists only for a relatively small number of ICOLLs and brackish lakes in New Zealand. This presents challenges for establishing national thresholds. In order to address this data gap we used multiple information sources including literature and data on:
New Zealand and overseas ICOLLs (e.g. Drake et al. 2010, Schallenberg 2014, Scanes 2012, WLTG 2013)
New Zealand and overseas shallow lakes (e.g. Kelly et al. 2013)
New Zealand and overseas coastal lagoons and estuaries (e.g. Bricker et al. 1999, Wriggle 2012).
For a number of attributes we found a correspondence of thresholds identified for the protection of ecological health in shallow lakes and estuaries.
3.1.2 Attributes
The attributes used in the NPS-FM are not the full set of variables that define ‘life supporting capacity’ or ‘ecosystem health’ of a waterbody. Instead, they are a subset of key variables for which numbers can at this time be assigned at a national level. The attributes of themselves do not define life supporting capacity. Similarly the attributes identified for ICOLLs and brackish lakes are a subset of the key attributes associated with the ecosystem health of an ICOLL and exclude a number of important variables for which it is more difficult to set appropriate thresholds at a national level.
A list of possible attributes of ICOLLs and brackish lake ecosystem health and indicative narrative definitions is provided in Appendix 3. For many of these attributes it is difficult to set relevant thresholds at a national level. However, just because an attribute has not been proposed for consideration as part of the NOF does not mean it is unimportant for maintaining ecosystem health.
ICOLLs are complex systems; ensuring the maintenance of good ecological health requires management measures to account for multiple attributes. To manage one attribute at the expense of another could result in perverse and unintended consequences. For example, keeping an ICOLL open to the sea will often reduce phytoplankton biomass (i.e. concentration of chlorophyll-a) and nutrient concentrations, however it can also change the salinity regime, encourage growth of macroalgae, and compromise the health of macrophytes. We have tried to include sufficient attributes to avoid the most obvious of these unintended consequences for ICOLLs.
The attributes and thresholds identified for ICOLLs in this report are integrated and should be considered together. In particular, including an attribute for macroalgae recognises that macroalgae can be a major component of primary production in ICOLLs, but it also allows us to propose slightly less
14 October 2014 15
Possible attributes applicable to ICOLLs and brackish lakes for the NOF
precautionary thresholds for total nitrogen then what might otherwise be used for marine influenced systems.
3.1.3 Banding framework
The thresholds we have identified for bands are based on the understanding that the banding framework is intended to be used to help communities set objectives for improving water quality, but they are not intended to be used as a proxy for assessing or reporting on whether water quality has been maintained in any particular water body2. In our view, using the band thresholds to assess whether water quality has been maintained would be inappropriate. It could risk significant deteriorations in water quality in some ICOLLs and lakes, and would result in an inconsistent degree of protection across water bodies. The values set for bottom-lines have been selected to correspond to conditions which could elicit a catastrophic regime shift.
The band values set for lakes in the NPS-FM (2014) broadly correspond to the values for different lake trophic levels in Burns et al. (2000), although the bands in the NPS-FM provide less differentiation for pristine and degraded lakes or ICOLLs. The annual median value of NPS-FM bands for lake chlorophyll-a, total nitrogen (stratified lakes) and total phosphorus correspond to the following trophic states from Burns et al (2000): Band A corresponds to ‘oligotrophic’ or better, Band B corresponds to ‘mesotrophic’, Band C corresponds to ‘eutrophic’, and Band D corresponds to ‘supertrophic’ or worse. The TN values for polymictic lakes are less stringent because many shallow lakes have naturally higher values of TN than deep lakes.
It should be noted that the band description we have used for chlorophyll a, TN and TP are different from the descriptions currently used in the NPS-FM for lakes. This is not because of any inherent difference between ICOLLs and other lakes, but is instead because the descriptions currently used to describe the bands for lakes could be improved. In particular, we have removed statements that Band A is close to ‘reference conditions’. There are two reasons for this:
The thresholds for the A Band are considerably less stringent than likely reference conditions. For example, Schallenberg (2014) estimated the following average reference condition thresholds for brackish lakes/lagoons: chlorophyll a <0.3 mg/m3, TN < 128 mg/m3, TP < 2.4 mg/m3.
The A band is likely to be more stringent than can be achieved, even under reference conditions, by some brackish lakes and ICOLLs with naturally high nutrient inputs (e.g. from peat influence).
3.2 Phytoplankton (chlorophyll-a)
3.2.1 Why phytoplankton is important
Phytoplankton are ubiquitous in freshwater and marine ecosystems, they dominate primary productivity of many systems and play a major role in the cycling of carbon, nutrients, and oxygen. High
2 There are well established methods for assessing the significance and magnitude of water quality trends in lakes (e.g. Burns et al. 2000; Verburg et al. 2010; Hamill 2011, 2014).
14 October 2014 16
Possible attributes applicable to ICOLLs and brackish lakes for the NOF
concentrations of phytoplankton in the water column can have a number of undesirable effects including:
Reduced water clarity and photic depth which reduces the light available to macrophytes and can contribute to the collapse of macrophyte or sea grass beds;
Large diurnal fluctuation in dissolved oxygen (DO) and a reduction in the daily minimum DO concentration. Low DO puts stress on aquatic organisms and contributes to anoxic sediments and bottom waters.
Phytoplankton can produce nuisance blooms which are often made up of inedible taxa, buoyant taxa which can form surface scums, nitrogen fixing taxa which add more nitrogen to the system, and toxin-producing taxa (e.g., most often cyanobacteria and dinoflagellates).
The concentration of phytoplankton in a lagoon is influenced by a multitude of factors including: temperature, light regime, nutrients, suitability of the salinity regime for particular species, grazing by zooplankton and shellfish and fish, turbulence, and flushing rates. The phytoplankton community consists of multiple species with the dominant species changing seasonally and spatially.
The concentration of phytoplankton (chlorophyll-a by proxy) is typically lower in estuaries compared to lakes because of light limitation from turbid water, more flushing, and more grazing/filtering by zooplankton and shellfish.
Chlorophyll-a is widely used as a proxy for phytoplankton abundance and trophic state in both lakes and estuaries. There is a good correlation between elevated concentrations of chlorophyll and elevated turbidity as well as degraded sea grass condition and fish community structure (Scanes 2012).
3.2.2 Thresholds for chlorophyll-a
The thresholds identified for chlorophyll-a are shown in Table 3.1. It is intended that the thresholds for chlorophyll-a are applied both during periods when a lagoon is open and during periods when it is closed. This means that for the purpose of comparing the state of an ICOLL with proposed thresholds the monitoring data should be analysed separately for closed periods and open periods. The overall state of the ICOLL defaults to the state during the worse period for any particular attribute.
A lagoon is likely to have higher chlorophyll-a concentrations when it is closed rather than when it is open, because this generally corresponds to a period of less flushing and higher nutrient concentrations. For example, in Waituna Lagoon it is rare for chlorophyll-a to exceed 10 mg/m3 when the lagoon is open but can reach 120 mg/m3 when the lagoon is closed (Hamill 2011).
The proposed thresholds are the same as those set for Lakes in the NPS-FM (2014). The thresholds for chlorophyll-a were based on the following rationale:
There are no compelling reasons as to why the chlorophyll a thresholds for ICOLLs or brackish lakes should be set either more or less stringent than for shallow lakes. ICOLLs might be considered more sensitive than lakes to high concentrations of chlorophyll-a because sea grass (e.g. Ruppia sp.), which is often a dominant macrophyte species in healthy ICOLLs, requires high levels of illumination during spring (Gerbeaux 1989; Gerbeaux and Ward 1991). On the other
14 October 2014 17
Possible attributes applicable to ICOLLs and brackish lakes for the NOF
hand, ICOLLs are more frequently flushed than shallow lakes; this can potentially reset the system and reduce to the impacts of periods of low water clarity. ICOLLs also tend to be shallow with light penetration reduced by resuspension of bottom sediments.
There is good agreement between thresholds set for Lakes in the NPS-FM, thresholds derived to protect ecological integrity of shallow lakes, and thresholds used to assess eutrophication in estuaries.
The ASSETTS approach to assessing eutrophication in estuaries (Bricker et al. 1999) sets the following values for chlorophyll-a (highest concentration during annual bloom period): hypereutrophic >60 mg/m3, high 20-60 mg/m3, medium 5-20 mg/m3, and low 0-5 mg/m3. These values correspond reasonably closely with the annual maximum chlorophyll-a values set for lakes in the NPS-FM (2014). The ASSETTS approach typically uses the 90 percentile statistic of chlorophyll-a because it was recognized that the calculation of chlorophyll-a concentrations should be based on commonly observed peaks, rather than a single exceptional one, and must reflect a significant event in space and/or time (Brickers et al. 2003).
Chlorophyll a thresholds to protect seagrass in Maryland coastal lagoons were set at chlorophyll-a <15 mg/m3 (Wazniak et al. 2007).
3.2.3 Risks
The use of an annual maximum is simple to apply, is more likely to account for short term blooms and is consistent with the approach taken for lakes in the NPS-FM (2014). However the use of maximum values for assessing a waterbody carries a risk of assessing a waterbody as worse than it actually is due to outliers in the data. High chlorophyll-a results can sometimes occur due to measurement errors, unrepresentative samples (e.g. sampling surface scums), or sample contamination (e.g. including some macroalgae in the sample bottle). This risk could be reduced by using a 95th percentile value3 instead of a maximum value.
Table 3.1: Proposed attributes and thresholds for phytoplankton (chlorophyll-a)
Value Ecosystem health
Freshwater Body Type Intermittently Closed and Open Lakes and Lagoons (ICOLLs) and brackish lakes
Attribute Phytoplankton
Attribute Unit mg/m3 (milligrams chlorophyll-a per cubic metre)
Attribute State Numeric Attribute State Narrative Attribute State
Annual Median *
Annual Maximum
A ≤2 ≤10 Ecological communities are healthy and resilient.
B >2 and ≤5 >10 and ≤25 Ecological communities are slightly impacted by additional algal growth arising from nutrients levels that are elevated.
3 If this was done it is recommended to calculate percentiles using the Hazen method.
14 October 2014 18
Possible attributes applicable to ICOLLs and brackish lakes for the NOF
C >5 and ≤12 >25 and ≤60 Ecological communities are moderately impacted by phytoplankton biomass elevated well above natural conditions. Reduced water clarity likely to affect habitat available for native macrophytes.National Bottom Line 12 60
D >12 >60 Excessive algal growth making ecological communities at high risk of undergoing a regime shift to a persistent, degraded state without macrophyte/seagrass cover.
* Median to apply both during periods when the ICOLL is open and during periods when the ICOLL is closed. Based on a rolling median of at least 12 samples for each situation (i.e. open or closed), and assuming a regular (e.g. monthly) monitoring regime.
3.2.4 Assessment using the principles for NOF attribute development
The suitability of using chlorophyll-a as an attribute of ecosystem health for ICOLLs and brackish lakes was assessed using Principles 1, 2 and 3 of the Guiding Principles for NOF Attribute Development (see Appendix 2). The assessment is summarised in the table below. Phytoplankton is an inherent component of lake and estuary ecosystems, there are national protocols for monitoring and reporting on chlorophyll-a, and chlorophyll a is commonly used to define trophic state bands. There are multiple ways to prevent phytoplankton blooms (e.g. bio-manipulation, capping sediments), but the most straight forward way to improve the ecological status of shallow lakes is to reduce external nutrient loads (Jeppesen et al. 2007).
Assessment of chlorophyll-a as an attribute for ICOLLs and brackish lakes
Criteria Assessment of chlorophyll-a as an attribute
Link to the national value (Ecosystem Health)
Is the attribute required to support the value? Yes. Phytoplankton directly impact on lagoon ecosystem health. High levels or blooms may cause turbid water, loss of macrophytes, hypoxia, reduced abundance and diversity of invertebrates and fish, and potential for toxin production by high levels of noxious species, contribute to N-fixation and toxin production etc.
Does the attribute represent the value? Yes. Phytoplankton is a key component of lake ecosystems and chlorophyll-a concentration is widely used as a measure of ecosystem health.
Measurement and band thresholds
Are there established protocols for measurement of the attribute?
Yes. (e.g. Burns et al. 2000).
Samples should be representative of the lake or basin of concern. They are not intended to apply to surface scums.
Do experts agree on the summary statistic and associated time period?
Generally good agreement, but some members of the panel advised the use of a 90 percentile value rather than a maximum value for chlorophyll a. This would reduce the risk of classifying a lake based on a single exceptional peak that may not reflect long term water quality.
14 October 2014 19
Possible attributes applicable to ICOLLs and brackish lakes for the NOF
Criteria Assessment of chlorophyll-a as an attribute
Do experts agree on thresholds for the numerical bands and associated band descriptors?
Yes. There is good agreement between widely used thresholds for lakes and estuaries.
Relationship to limits and management
Do we know what to do to manage this attribute? Yes.
Do we understand the drivers associated with the attribute?
Yes. There can be complex biological relationships driving phytoplankton growth and biomass in some lagoons, but ultimately excessive phytoplankton biomass is caused by high nutrients.
Do quantitative relationships link the attribute state to resource use limits and/or management interventions?
Yes. There are strong relationships between chlorophyll-a and the concentration and load of nitrogen and phosphorus (e.g. Burns et al. 2000, Jeppesen et al. 2007, Kelly et al. 2013).
3.3 The concentration of total nitrogen and total phosphorus
3.3.1 Why nitrogen and phosphorus are important
The loading of nitrogen and phosphorus is a strong driver of eutrophication in lakes and estuaries (e.g. Burns et al. 2000; Sutula 2011, McLaughlin et al. 2012). Increases in nutrient loading to shallow coastal lakes and lagoons have been associated with blooms of cyanobacteria and other phytoplankton taxa, macroalgal blooms, a decline in macrophyte cover and species richness, a decline in macroinvertebrate community species richness, anoxic bottom waters and sediments (e.g. Schallenberg and Schallenberg 2012, Jeppesen et al. 2007).
As previously explained, chlorophyll a, TN and TP concentrations are positively correlated across a broad trophic gradient. However, within systems, chlorophyll-a can be decoupled from TN and/or TP concentrations. For example, the extent to which nitrogen and phosphorus drives algal growth differs between lakes and it is common to find seasonal and temporal variation in which nutrient might be potentially most limiting (e.g. Abell and Hamilton 2014; Kelly et al. 2013, Hamill and Schallenberg 2013). Kelly et al. (2013) found that chlorophyll-a and trophic status in shallow lakes are most often controlled by phosphorus, but macrophyte species composition (and in some cases cover) was inhibited by increasing total nitrogen (TN) concentration. This emphasised the importance of co-management of both nitrogen and phosphorus for maintaining the health of shallow lake ecosystems (see also Larned et a; 2011).
In estuaries and coastal lagoons, algal production is more commonly controlled by nitrogen, rather than phosphorus loads. This may be due to phosphorus release from sediments under more saline conditions (Jordan et al. 2008), or the ability of epibenthic macroalgae to utilised phosphorus recycled and diffused from the sediments, or high rates of microbial denitrification (Webster and Harris 2004). In ICOLLs the management for both N and P is particularly important because of their characteristic
14 October 2014 20
Possible attributes applicable to ICOLLs and brackish lakes for the NOF
switching between freshwater and brackish conditions (Schallenberg and Schallenberg 2012, Wriggle 2012).
Managing ICOLLs and brackish lakes for both N and P may also be important for reducing the risk of cyanobacteria blooms. Some cyanobacteria can fix nitrogen, thus reduction in nitrogen loads without corresponding reduction in phosphorus loads has the potential for favouring these cyanobacteria over other algal species (Hamilton et al. 2012, Sutula 2011).
ICOLLs and coastal lagoons are highly susceptible to nutrient over-enrichment because they are seagrass-dominated. The high light requirements of seagrass makes them more sensitive to reduced light availability from phytoplankton and macroalgae, stimulated by nutrient loads (Cloern 2001).
3.3.2 Thresholds for total nitrogen concentration
The thresholds identified for total nitrogen (TN) concentration are shown in Table 3.2. It is intended that the thresholds for TN are applied both during periods when a lagoon is open and during periods when it is closed.
The proposed thresholds are the same as those set for brackish lakes in the NPS-FM (2014). The bottom-line threshold of annual median TN 750 mg/m3 was determined for the following reasons:
In a survey of New Zealand brackish lakes and lagoons sampled in late summer, the cover of aquatic plants was inhibited with increasing water column total nitrogen concentration while the chlorophyll-a concentration in the water column increased with total nitrogen concentration. There was a threshold nitrogen concentration of about 1000 mg/m3, below which lakes were dominated by aquatic plants, and above which lakes were dominated by phytoplankton (Schallenberg and Schallenberg 2012; Norton et al. 2014). Using the same dataset, Drake et al. (2010) found that a TN concentration of 800 mg/m3 corresponded to < 30% cover of macrophytes.
Overseas studies have found a loss of macrophyte cover in shallow lakes when in-lake TN concentration of between 1000-2000 mg/m3 and TP was moderately high (see enclosure experiments by González Sagrario et al. (2005) and regression analysis of 44 Danish lakes in Jeppesen et al. (2007)). It was rare for these lakes to have greater than 50% macrophyte cover when the TN concentration was > 1000 mg/m3 (Jeppesen et al. 2007; Kelly et al. 2013).
Nutrient thresholds to protect seagrass in Maryland coastal lagoons were set at median values for total nitrogen <650 m g/m3 and total phosphorus <370 mg/m3 (Wazniak et al. 2007).
14 October 2014 21
Possible attributes applicable to ICOLLs and brackish lakes for the NOF
Table 3.2: Proposed attributes and thresholds for total nitrogen
Value Ecosystem health
Freshwater Body Type Intermittently Closed and Open Lakes and Lagoons (ICOLLs) and brackish lakes
Attribute Total Nitrogen
Attribute Unit mg/m3 (milligrams per cubic metre)
Attribute State Numeric Attribute State
Narrative Attribute State
Annual Median *
A ≤160 Ecological communities are healthy and resilient.
B >160 and ≤350 Ecological communities are slightly impacted by additional algal growth arising from nutrients levels that are elevated above natural conditions.
C >350 and ≤750 Ecological communities are moderately impacted by additional phytoplankton and macroalgae arising from elevated nutrients levels. The cover and diversity of native macrophytes is likely to be low.National Bottom Line 750
D >750 High risk of excessive algal growth and likelihood of undergoing a regime shift to a persistent, degraded state without macrophyte/seagrass cover.
* Median to apply both during periods when the ICOLL is open and during periods when the ICOLL is closed. Based on a rolling median of at least 12 samples for each situation (i.e. open or closed), and assuming a regular (e.g. monthly) monitoring regime.
3.3.3 Thresholds for total phosphorus concentration
The thresholds identified for total phosphorus (TP) concentration are shown in Table 3.3. It is intended that the thresholds for TP are applied both during periods when a lagoon is open and during periods when it is closed.
The identified thresholds are the same as those set for lakes in the NPS-FM (2014). The bottom-line threshold of annual median TP 50 mg/m3 was based on the following reasons:
Kelly et al. (2013) reviewed international literature on shallow coastal lakes to determine the effect of nutrient loads on water quality and ecological integrity. They found that the transition between lakes with some and no macrophyte cover occurred at an in-lake TP concentration of:
o 100-130 mg/m3 for studies of European lakes (e.g. Søndergaard et al. 2005);
o about 50 mg/m3 for studies of Florida lakes (e.g. Jeppesen et al. 2007); and
o about 50 mg/m3 for 19 shallow South Island lakes (Drake et al 2010, Schallenberg and Kelly 2012, 2013).
14 October 2014 22
Possible attributes applicable to ICOLLs and brackish lakes for the NOF
Kelly et al. (2013) found that an in-lake TP concentration of about 50 mg/m3 corresponded to a chlorophyll-a concentration of about 10 mg/m3, and a 42% decline in macroinvertebrate richness compared to reference condition lakes.
A study of shallow Danish lakes found that a summer mean chlorophyll-a concentration of less than 12 mg/m3 corresponded to a TP concentration of less than about 50 mg/m3 (Jeppesen et al. 2007).
Nutrient thresholds to protect seagrass in Maryland coastal lagoons were set at median values for total nitrogen <650 mg/m3 and total phosphorus <370 mg/m3 (Wazniak et al. 2007).
3.3.4 Risks
There is reasonable data to support setting TN and TP thresholds for ICOLLs consistent with those currently in the NPS-FM (2014) for brackish lakes. However, we recognise that there is limited information on the relationship of nitrogen concentrations on macroalgae biomass in ICOLLs and there is a risk that these thresholds may not be strict enough for some ICOLLs where seagrass is a dominant part of the community. Some of this risk could be mitigated by applying the TN and TP thresholds alongside other attributes proposed for chlorophyll-a, macroalgae and macrophyte cover.
Table 3.3: Proposed attributes and thresholds for total phosphorus
Value Ecosystem health
Freshwater Body Type Intermittently Closed and Open Lakes and Lagoons (ICOLLs) and brackish lakes
Attribute Total Phosphorus
Attribute Unit mg/m3 (milligrams per cubic metre)
Attribute State Numeric Attribute State
Narrative Attribute State
Annual Median *
A ≤10 Ecological communities are healthy and resilient.
B >10 and ≤20 Ecological communities are slightly impacted by additional algal growth arising from nutrients levels that are elevated above natural conditions.
C >20 and ≤50 Ecological communities are moderately impacted by additional phytoplankton and macroalgae arising from elevated nutrients levels. The cover and diversity of native macrophytes is likely to be low.National Bottom Line 50
D >50 High risk of excessive algal growth and likelihood of undergoing a regime shift to a persistent, degraded state without macrophyte/seagrass cover.
* Median to apply both during periods when the ICOLL is open and during periods when the ICOLL is closed. Based on a rolling median of at least 12 samples for each situation (i.e. open or closed), and assuming a regular (e.g. monthly) monitoring regime.
14 October 2014 23
Possible attributes applicable to ICOLLs and brackish lakes for the NOF
3.3.5 Assessment using the principles for NOF attribute development
The suitability of using TN and TP as an attribute of ecosystem health for ICOLLs and brackish lakes was assessed using Principles 1, 2 and 3 of the Guiding Principles for NOF Attribute Development (see Appendix 2). The assessment is summarised in the table below. Nutrients are the key driver of algal blooms (phytoplankton and macroalgae) that adversely affect ecosystem health. The nutrient concentrations found in lakes and ICOLLs can be influenced by the opening regime and biological changes but are ultimately driven by external nutrient loads.
Assessment of TN and TP as an attributes for ICOLLs and brackish lakes
Criteria Assessment of TN and TP as an attribute
Link to the national value (Ecosystem Health)
Is the attribute required to support the value? Yes. Excessive loads and concentrations of nitrogen and phosphorus are the key driver of phytoplankton, epiphyton and macroalgae that can adversely affect ecosystem health.
Does the attribute represent the value? Yes. Nutrients are key drivers of primary productivity and algal blooms, but they are also commonly used as part of an assessment of trophic state (e.g. the TLI).
Measurement and band thresholds
Are there established protocols for measurement of the attribute?
Yes (e.g. see Burns et al. 2000)
Do experts agree on the summary statistic and associated time period?
Yes. Generally wide agreement
Do experts agree on thresholds for the numerical bands and associated band descriptors?
Yes. There is good agreement between widely used thresholds for lakes and estuaries as discussed above.
Relationship to limits and management
Do we know what to do to manage this attribute? Yes, control internal and external nutrient loads.
Do we understand the drivers associated with the attribute?
Yes. In-lake nutrient concentrations reflect the residual of external loads, internal loads, assimilation (e.g. plant and macroalgal uptake), and removal (e.g. flushing, denitrification) (see Hamilton et al. 2012).
Do quantitative relationships link the attribute state to resource use limits and/or management interventions?
Yes. Across a broad trophic gradient there are strong relationships between in-lake nutrient concentrations and external loads. In some systems this is decoupled by high internal nutrient loading, denitrification, flushing, etc. Making imprecise relationships (McLaughlin et al. 2012), but ultimately productivity and health is a function of external loads (Kelly et al. 2013).
14 October 2014 24
Possible attributes applicable to ICOLLs and brackish lakes for the NOF
3.4
14 October 2014 25
Possible attributes applicable to ICOLLs and brackish lakes for the NOF
3.5 Macroalgae and sediment anoxia
3.5.1 Why macroalgae are important
Macroalgae are a natural and common part of coastal lagoon ecosystems but under conditions of high nutrient loads and/or poor flushing, opportunistic species can attain high biomass and cover large areas of a lagoon. They are often a major component of the total plant biomass and primary production (Sutula 2011). In New Zealand ICOLLs and brackish lakes, macroalgae are often associated with blooms growing on the substrate, and growing on macrophytes. Nuisance taxa include: green algae Ulva sp., Cladophora sp., red algae Gracilaria sp., brown algae Bachelotia sp. (common in Waituna Lagoon), diatoms Melosira sp. and benthic cyanobacteria like Oscillatoria sp.
High cover (e.g. >50%) and biomass of macroalgae can cause a number of undesirable effects including:
Causing sediment anoxia and sulphide release underneath accumulations;
Contributing to water column and sediment hypoxia;
Reducing the abundance and diversity of infauna species (Sutula et al. 2011);
Shading and smothering of seagrass beds, ultimately causing their collapse. For example, an increase in the cover of macroalgae is often the first indication of macrophyte collapse in ICOLLs (Viaroli et al. 2009, WLTG 2012).
Causing noxious odours.
In some situations it is possible for the algae to continue growth after being covered by sediment. Such buried algae can promote new algal growth by causing nutrient enrichment within the sediment as they decompose and by providing over-wintering material for new growth in spring.
In a review of macroalgae, Sutula et al. (2011) noted that ‘there is overwhelming evidence that blooms of macroalgae are stimulated by high nutrient loading, particularly of nitrogen (N) and phosphorus (P)’, but modelling of macroalgae biomass should also account for physical and biological processes such as nutrient uptake, internal nutrient cycling, grazing and flushing. Macroalgae show a strong response to increased nitrogen loads, and they can store nitrogen in their tissue (e.g. Sutula et al. 2011).
3.5.2 Why is sediment anoxia important
Sediment anoxia is often considered a secondary symptom of eutrophication that occurs as a result of excessive accumulation of phytoplankton, macroalgae and the input of fine organic sediment.
Sediment anoxia excludes normal communities of benthic macrofauna (e.g. Grizzle & Penniman 1991); increases the production of sulphides which can be toxic to rooted macrophytes (Lamers et al. 2013; Holmer & Bondgaard 2001; Viaroli et al. 2008; Geurts et al. 2009); and can result in the release of dissolved phosphorus and ammonium that exacerbate eutrophication (e.g. Søndergaard et al. 2003; Pratt et al. 2013).
The redox potential discontinuity (RPD) layer is often used as an indicator of the depth of predominantly anoxic sediments, resulting in sulphide production. The RPD depth is a recognisable
14 October 2014 26
Possible attributes applicable to ICOLLs and brackish lakes for the NOF
division zone between oxidised (sub-oxic) and reduced chemical conditions in the sediment. The oxidised part appears as rust-brown, and the reduced layer below this is generally grey-green or black (Fenchel and Riedel 1970; Graf 1992; Robertson and Stevens 2013).
3.5.3 Possible attributes for macroalgae
The expert panel discussed several different indicators that might be suitable as an attribute for assessing the effects of macroalgae in ICOLLs and brackish lakes. The indicators considered were:
Mean cover macroalgae, with a possible bottom-line threshold of 50% cover;
Mean biomass of macroalgae, with a possible bottom-line threshold of 500 g wet wt./m2;
Gross Eutrophic Zones, with a possible bottom-line threshold of 15% of the lagoon area, or 30 hectares.
It was decided that Gross Eutrophic Zones (GEZ) had the best potential as a possible attribute because, by incorporating a measure of anoxic surface sediments, it assesses the worst effects of excessive macroalgae.
3.5.4 Gross Eutrophic Zones
Gross Eutrophic Zones (GEZ) have been used as an indicator of excessive opportunistic macroalgae (including epiphytes) that are associated with anoxic sediment (Robertson and Stevens 2012). For the purpose of applying to ICOLLs and brackish lakes GEZ is defined as areas with: macroalgal biomass of >500 g wet wt./m2, and macroalgal cover >50%, and anoxic conditions in near-surface sediment (i.e. RPD within 1cm of the surface). In some cases sediments can be anoxic near the surface but oxygenated below depths due to changes in substrate; for the purpose of defining a GEZ we would still consider this to be anoxic surface sediments (Robertson and Stevens 2013).
Macroalgal biomass and sediment anoxia are measured in representative quadrats either within discernable patches of macroalgae or along transects across potentially available habitat in an estuary. An estimate of percentage cover over the lagoon should be undertaken using stratified random sampling. These methods are described in Robertson and Stevens (2013) and are based on methods applied for assessing macroalgal cover for the Opportunistic Macroalgae Blooming Tool (OMBT) developed for the European Water Framework Directive (WFD) (WFD-UKTAG 2014; Scanlan et al. 2007).
GEZ is proposed as an indicator with potential to be an attribute in the NPS-FM for assessing severe impacts of macroalgae. There is also potential to set thresholds for macroalgal cover and biomass, but some additional work is required to identify the extent of lagoon area that can be impacted by significant and sustained algal blooms before the ecosystem is significantly degraded.
PhD research on tidal lagoon estuaries and ICOLLs is underway to more accurately assess thresholds for macroalgal biomass. The research is focusing on the effect of moderate macroalgal biomass (i.e. 100 to 1000 g wet wt./m2) on sediment redox potential and the macrofaunal community.
14 October 2014 27
Possible attributes applicable to ICOLLs and brackish lakes for the NOF
3.5.5 Thresholds for Gross Eutrophic Zones
The thresholds identified for macroalgae and Gross Eutrophic Zone (GEZ) are shown in Table 3.4. It is intended that the thresholds apply during the maximum growing season; this can vary for different systems but is generally during summer. The area of an ICOLL fluctuates with water level, so the percent area is intended to be calculated based on the area of the lagoon around the time of the survey.
The thresholds for macroalgae and Gross Eutrophic Zone cover were based on the following information:
An effects threshold of 500-1000 g wet wt./m2 (wet weight per square metre) was proposed by Scanlan et al. (2007) to avoid threshold effects on benthic macrofauna in estuaries, but the authors emphasised that the proposed thresholds required further validation.
McLaughlin et al. (2012) reviewed and tested the biomass thresholds proposed by Scanlan et al. (2007) and considered them reasonable for application to Southern Californian estuaries. For example the review found elimination of surface deposit feeders which are an important functional group of invertebrates for fish and bird diets) when macroalgal biomass is in the range of 700-800 g wet wt./m2.
In a survey of eight Californian tidal lagoon estuaries (including some ICOLLs), Sutula et al. (2014) found that macroalgae of 175 g dw.m2 (1450 g ww/m2), total organic carbon of 1.1% , and sediment TN of 0.1% were thresholds associated with anoxic conditions near the surface (RPD <1cm).
Green et al. (2014) studied the effect of macroalgae biomass on invertebrate fauna. They found that macroalgal abundances as low as 110-120 g dw/m2 (or 840-930 g wet wt./m2) had significant and rapid negative effects on benthic invertebrate abundance (declining by >67%) and species richness (declining by >19%) within two weeks at most sites.
A review of monitoring data from 25 typical NZ estuaries (shallow, short residence time estuaries) supports an opportunistic macroalgal biomass “exhaustion” threshold of approximately 1000-2000 g wet wt/m2 above which there was a major shift in the chemistry of the underlying sediment to surface anoxia (zero RPD), elevated TOC (>1.5%) and a degraded macrofaunal community (Wriggle Coastal Management database 2009-2014). Such conditions have been used to identify Gross Eutrophic Zones (GEZ). Based on the measured detrimental impact on macrofauna in NZ tidal lagoon, it has been estimated that if GEZ is >15% of the estuary area or >30ha then estuary ecological condition is seriously impaired.
Waituna Lagoon (Hamilton et al. 2012) was estimated to have a mean macroalgal biomass of 800-1000 g wet wt./m2 when the lagoon was showing signs of gross eutrophication (RPD at surface) and a degraded seagrass community. At 100-300 g wet wt. /m2 the seagrass community was maintained with moderately low levels of stress.
Literature indicates that where macroalgal growth is excessive in estuaries (mainly shallow tidal lagoon estuaries), sediment anoxia almost always occurs and is accompanied by a degraded macrofaunal community. Due to the similarities between ICOLLs and permanently open tidal
14 October 2014 28
Possible attributes applicable to ICOLLs and brackish lakes for the NOF
lagoon estuaries (e.g. keystone species are seagrass in both estuary types), it is expected that a similar, if not more extreme, response to excessive macroalgae occurs in shallow ICOLLs.
ICOLLs and brackish lakes are likely to be more sensitive to macroalgal cover than estuaries because the macroalgal cover tends to occur sub-tidally rather than in intertidal areas. Consequently, subtidal dissolve oxygen concentrations in decaying beds and in underlying sediments are likely to be reduced, giving rise to a more degraded macrofaunal community and higher levels of physiological stress to seagrass beds in the ICOLs as compared to the intertidal habitat. Also such conditions in lagoons can reduce denitrification and enhance sediment P release, leading to build-up of P in the overlying water column. Consequently, the macroalgae ratings derived from effects on estuaries have been adjusted to account for the greater sensitivity of ICOLLs and brackish lakes.
3.5.6 Risks and uncertainties
There is little data, but much anecdotal evidence on the direct effect of macroalgae on macrophytes in ICOLLs or brackish lakes (Sutula et al. 2011) and there is limited information on the spatial extent of sediment anoxia caused by macroalgae (i.e. GEZs) that results in widespread ecological impacts in lagoons. The proposed thresholds are heuristic. However, a heuristic approach is considered reasonable because the GEZ attribute represents locations of severe degradation, with anoxia causing significant loss of benthic fauna and increases in internal nutrient loads.
It is recognised that GEZ is currently not widely monitored in New Zealand ICOLLs or brackish lakes, and that some further work may be needed to standardise protocols and confirm thresholds for subtidal ICOLL habitat. However based on the strength of overseas research and New Zealand evidence on the critical role of macroalgae in ICOLL health, we propose GEZ as an indicator with potential to be an attribute in the NPS-FM.
14 October 2014 29
Possible attributes applicable to ICOLLs and brackish lakes for the NOF
Table 3.4: Proposed attributes and interim thresholds for macroalgal Gross Eutrophic Zones (GEZ)
Value Ecosystem health
Freshwater Body Type Intermittently Closed and Open Lakes and Lagoons (ICOLLs) and brackish lakes
Attribute Macroalgae - cover, biomass and sediment anoxia measured as Gross Eutrophic Zones (GEZ)1
Attribute Unit Percent cover and area in hectares 2
Attribute State Numeric Attribute State
Narrative Attribute State
A GEZ <0.5% cover Extent of macroalgal biomass and cover is similar to natural conditions, and has little impact on surrounding ecology.
B GEZ 0.5-5% cover Ecological communities are slightly impacted by additional macroalgal biomass arising from elevated nutrients levels.
C GEZ 5-15% cover Ecological communities are moderately impacted by macroalgae and sediment anoxia. Lake primary production well above natural conditions.National Bottom Line GEZ 15% cover or
>20ha
D GEZ >15% cover or >20ha
Extensive areas of macroalgae and sediment anoxia cause adverse impacts on aquatic macrophytes, sediment macrofauna, fish and birdlife. Internal loads likely to be substantial and high risk of ecological communities undergoing a regime shift to a degraded state.
1 GEZ = Gross Eutrophic Zones characterised as macroalgal biomass > 500g/m2 (wet weight) combined with anoxic surface sediments. Macroalgae includes macroscopic, loosely adhered epiphytes and periphyton.2 Results to be based on a survey during the period of likely maximum annual biomass.
3.5.7 Assessment using the principles for NOF attribute development
The suitability of using macroalgae and Gross Eutrophic Zones (GEZ) as an attribute of ecosystem health for ICOLLs and brackish lakes was assessed using Principles 1, 2 and 3 of the Guiding Principles for NOF Attribute Development (see Appendix 2). The assessment is summarised in the table below. In summary, GEZ is a measure of the biomass and cover of macroalgal and the extent of anoxic sediments. These are primary symptoms of eutrophication in coastal lagoons, and can cause macrophyte die-off, loss of benthic fauna and a regime shift to a degraded state. Macroalgae have well-established, albeit complex relationship with external and internal nutrient loads. There are multiple ways to manage macroalgal blooms (e.g. bio-manipulation, capping sediments, flushing), but ultimately, macroalgal biomass and cover is related external nutrient loads.
Assessing macroalgae biomass and/or GEZ is routinely monitored in only a few ICOLLs or brackish lakes in New Zealand, and it is likely that some additional work will be required to ensure a single, standardised monitoring protocol.
14 October 2014 30
Possible attributes applicable to ICOLLs and brackish lakes for the NOF
Assessment of macroalgae and Gross Eutrophic Zones as an attribute for ICOLLs and brackish lakes
Criteria Assessment of macroalgae & GEZ as an attribute
Link to the national value (Ecosystem Health)
Is the attribute required to support the value? Yes. Excessive macroalgae and epiphytes are known to cause macrophyte die-off and sediment anoxia, that suffocates benthic fauna and accelerates internal nutrient loads.
Does the attribute represent the value? Yes. Excessive levels of either macroalgae or phytoplankton can indicate eutrophic conditions that risk a regime shift to a degraded state. Often the dominant form of algae (macroalgae or planktonic) alternates over time in relation to opening and closure.
Measurement and band thresholds
Are there established protocols for measurement of the attribute?
Methods have been developed but their application to ICOLLs /brackish lakes is relatively new. Further work is needed to standardise the protocols.
Do experts agree on the summary statistic and associated time period?
Yes. It is proposed that a single survey near the time of maximum annual biomass is a pragmatic frequency for surveillance monitoring of macroalgae.
Do experts agree on thresholds for the numerical bands and associated band descriptors?
The thresholds are heuristic. There is limited information on the spatial extent of GEZ required to cause widespread ecological impacts in a lagoon, but any GEZ reflects at least localised degradation and increased internal nutrient loading.
Further research is recommended to develop and confirm thresholds for subtidal ICOLL habitat.
Relationship to limits and management
Do we know what to do to manage this attribute? Yes. Control nutrient internal and external nutrient loads, alter opening regime, etc.
Do we understand the drivers associated with the attribute?
Yes. There can be complex biological relationships driving macroalgae accumulations in some ICOLLs/brackish lakes, but ultimately excessive macroalgal biomass is caused by high nutrient loads. In Waituna lagoon macroalgae tend to be more abundant during periods when the lagoon is open.
Do quantitative relationships link the attribute state to resource use limits and/or management interventions?
Yes, blooms of macroalgae are stimulated by high nutrient loading, particularly of N and P. High accumulations of macroalgae cause sediment anoxia. A model has been developed for Waituna Lagoon relating nutrient loads to phytoplankton biomass, macroalgae biomass and macrophytes (Hamilton et al. 2012).
3.6
14 October 2014 31
Possible attributes applicable to ICOLLs and brackish lakes for the NOF
3.7 Aquatic Macrophytes
3.7.1 Why macrophytes are important
Aquatic macrophytes are a very important feature of brackish lakes and ICOLLs. They regulate water quality and phytoplankton growth, and provide habitat for invertebrates and fish.
The loss of macrophyte cover is the key response of shallow lakes and lagoons also referred to as a regime shift from a macrophyte-dominated clear water state to an algae-dominated turbid water state (e.g. Tatrai et al. 2009; Scheffer 2004).
3.7.2 Thresholds macrophyte cover
The thresholds identified for macrophyte cover are shown in Table 3.5. It is intended that the thresholds apply around the time of maximum biomass; this can vary for different systems but is generally during summer.
The percent cover is assessed as a percentage of the available habitat. Available habitat is determined by morphological (e.g. depth), hydraulic (e.g. water velocity) and photic condition (e.g. water clarity) in a waterbody. There was disagreement among the expert panel members as to whether available habitat should be based on natural conditions or on current conditions. This is particularly relevant in ICOLLs where water levels have been lowered, resulting in more sediment resuspension, reduced water clarity and more restricted habitat for macrophytes. In these situations, raising water levels can help improve water clarity and potential habitat for macrophytes, but it will also flood surrounding land.
The available habitat for macrophytes could be based on the current state of a lagoon, the natural state of a lagoon, or assuming a target hydrological regime set by the community. These have different implications and risks – requiring input from not just scientist but also policy makers and the community:
If based on current conditions than the indicator will have little value in many cases (e.g. a decline in clarity reduces available habitat for macrophytes, which makes it easier to achieve the attribute).
If based on natural (or reference) conditions, then it may be very difficult for some ICOLLs, with lower than natural water levels, to achieve the bottom-line threshold without increasing water levels (e.g. Te Waihora).
If based on current morphologic and/or hydraulic conditions, then we will be setting thresholds that accept the ecological effects of altered hydrology and/or historical degradation in sediment quality. These changes in hydrology and sediment quality may themselves be impacting on water quality.
We propose that available habitat is determined based on morphological, hydrological and substrate conditions. Ideally these would be based on what would occur under natural/reference conditions, but it is recognised that there may be management constraints on the extent to which the hydraulic regime (e.g. mean water levels) can be changed to improve water quality and ecological health. The aim should
14 October 2014 32
Possible attributes applicable to ICOLLs and brackish lakes for the NOF
be to compare macrophyte cover with the maximum potential habitat given the hydrological regime set by the community.
If the decision over which hydrological regime to accept as the "target" regime (e.g. whether to set the target at the natural state or some other more altered state) is left to the community, it is envisaged that scientific guidance will need to be provided to identify the extent of "available habitat" once the target regime has been chosen. This guidance should identify the habitat available for aquatic macrophytes, taking into account that seagrass grow in the photic zone, so their coverage in lagoons is influenced largely by the depth of the lagoon. Deeper lagoons (i.e. lagoons >3 m average depth) have larger portions of their bed below the photic zone and thus would have less seagrass coverage, however shallower lagoons (i.e. lagoons <0.5 m average depth) are likely to experience higher turbidity from wind stirring of fine-grained bed sediments, which also inhibits light penetration and seagrass productivity. Therefore, ideal seagrass conditions are expected at intermediate depths (i.e. lagoons with typical depths of approximately 1-2 m) (see Haines et al. 2006).
The proposed thresholds for macrophyte cover were based on the following information:
Overseas studies have shown that submerged aquatic plant cover needs to be consistently between 30% and 60% to ensure a clear water state (e.g. Jeppesen et al. 1994; Tatrai et al. 2009; Blindow et al. 2002).
Kelly and Jellyman (2007) studied the collapse of macrophytes in Te Waihora and observed a shift in macroinvertebrate communities from being dominated by macrophytes-associated phytofauna to predominantly sediment dwelling species (i.e., chironomids, oligochaetes). Through size-related shifts in macroinvertebrate species, they associated these foodweb changes with slower growth rates of juvenile shortfin eels observed in prior to macrophytes collapse (Kelly and Jellyman 2007).
Aquatic macrophyte cover has been mapped in few New Zealand ICOLLs and brackish lakes. The most extensive studies have been on:
o Waituna Lagoon which, in 2007, had 65% of the lagoon area with some seagrass growth (and 30% with high density seagrass) (Robertson and Stevens 2007). Although the lagoon has not subsequently been broad scale mapped, extensive transect studies indicate a large decline in area of high density seagrass in subsequent years (crudely estimated at >10% of estuary area). Such a decline coincided with extensive macroalgal growth and anoxic sediment conditions (e.g. Sutherland et al. 2014).
o Lake Brunton which, in 2009 and 2013 had 30-35% of the lagoon area with low density seagrass growth (Robertson and Stevens 2013) and moderately clear water conditions. Nutrient loads to this estuary, are relatively high and at times when the estuary remains closed for months, macroalgal growth is elevated. It is expected that this estuary is currently on the threshold of shifting towards a more degraded state with low macrophyte cover.
14 October 2014 33
Possible attributes applicable to ICOLLs and brackish lakes for the NOF
3.7.3 Risks and uncertainties
Although macrophytes are an important component of brackish lakes and ICOLLs, there are only a few studies showing response relationships between aquatic macrophytes and secondary consumers (e.g. invertebrates) (Kelly and Jellyman 2007, Sutula et al. 2011). The proposed thresholds for bands are to some extent normative.
The panel was not in full agreement as to whether the attribute should apply to all aquatic macrophytes or be restricted to native aquatic macrophytes. Applying it to all aquatic macrophytes more accurately reflects the ecosystem services provided by the macrophyte community (e.g. their ability to maintain a clear water state). Applying it to native macrophytes recognises that some exotic macrophytes are undesirable pests in lakes. The proposed attribute applies to all macrophytes because most pest macrophyte species are intolerant of brackish conditions.
Table 3.5: Proposed attributes and interim thresholds for macrophyte cover
Value Ecosystem health
Freshwater Body Type Intermittently Closed and Open Lakes and Lagoons (ICOLLs) and brackish lakes
Attribute Macrophytes
Attribute Unit Percent cover of available habitat
Attribute State Numeric Attribute State
Narrative Attribute State
A >70% Macrophyte communities are healthy and resilient, similar to natural conditions.
B 50-70 Macrophytes and ecological communities are slightly impacted from natural conditions.
C 20-50 Ecological communities are moderately impacted from natural conditions.
National Bottom Line 20%
D <20% Ecological communities significantly impacted by reduced macrophyte cover due to loss of habitat, food sources and less sediment stabilisation. Macrophytes have limited ability to buffer nutrient loads and there is a high risk of a regime shift to a persistent, degraded state.
* Results to be based on a survey during period of likely maximum annual biomass.
Available habitat to be determined based on morphological, hydrological and substrate conditions.
3.7.4 Assessment using the principles for NOF attribute development
The suitability of using aquatic macrophytes as an attribute of ecosystem health for ICOLLs and brackish lakes was assessed using Principles 1, 2 and 3 of the Guiding Principles for NOF Attribute Development
14 October 2014 34
Possible attributes applicable to ICOLLs and brackish lakes for the NOF
(see Appendix 2). The assessment is summarised in the table below. Overall, aquatic macrophytes play a vital role in the ecology of ICOLLs and brackish lakes. The concept of a lake undergoing a regime shift from a clear water state to a degraded state is largely defined by the loss of macrophyte cover. Macrophyte cover is easily surveyed using standard methods, but these may need to be standardised if this attribute is adopted. The bands set for macrophyte cover are somewhat subjective, but there is literature supporting the proposed bottom line. A key reason for having an attribute based on macrophyte cover is that macrophytes respond to multiple drivers that are directly impacted by how ICOLLs are managed, i.e. the opening/closing regime and the water level, as well as indirect effects driven by nutrient loads.
Assessment of aquatic macrophytes as an attribute for ICOLLs and brackish lakes
Criteria Assessment of macrophytes as an attribute
Link to the national value (Ecosystem Health)
Is the attribute required to support the value? Yes. Aquatic macrophytes stabilise sediments, attenuate nutrient inputs,and provide habitat and nursery for aquatic invertebrates and fish.
Does the attribute represent the value? Yes. Aquatic plants (including seagrass) play a vital role in the ecology of shallow lakes and ICOLLs. The concept of a lake undergoing a regime shift from a clear water state to a degraded state is largely defined by the loss of macrophyte cover.
Measurement and band thresholds
Are there established protocols for measurement of the attribute?
There are several standard methods for mapping macrophyte cover. Further work is required to identify which protocol would be best applied to this attribute and how ‘available habitat’ should be defined.
Do experts agree on the summary statistic and associated time period?
Yes. Survey during the growing season
Do experts agree on thresholds for the numerical bands and associated band descriptors?
The band thresholds are normative, but the bottom line is supported by literature.
Relationship to limits and management
Do we know what to do to manage this attribute? Yes. Different management approaches required in different waterbodies. A decline in macrophyte cover can be caused by excessive nutrients, high algal biomass (planktonic, epiphytes or macroalgae), turbid water, grazing by fish or wildfowl.
Do we understand the drivers associated with the attribute?
Yes. Macrophytes thrive in pristine waterbodies but decline in depth and abundance in eutrophic conditions associated with high turbidity, high nutrient concentrations and high algal biomass. Exotic macrophytes displace natives in many NZ lakes but this is not such a problem in brackish water.
Do quantitative relationships link the attribute state to resource use limits and/or management
Yes but it is the relationship is complex and often weak. The abundance and health of aquatic macrophytes are
14 October 2014 35
Possible attributes applicable to ICOLLs and brackish lakes for the NOF
Criteria Assessment of macrophytes as an attribute
interventions? affected by the opening and closing regime, and nutrient loads. The precise response to nutrient loads can be complex (see Hamilton et al. 2012; WLTG 2013, Sutula et al. 2011).
3.8 Potential attributes not proposed for use in the NOF-FW
There are other attributes of brackish lakes and ICOLLs that are important but for which we have not identified any thresholds for the purpose of the NPS-FM. In particular the expert panel discussed the loading of nitrogen and phosphorus (as compared to concentration) and the sedimentation rate of fine sediment. Thresholds were not identified for these attributes because of the difficulty in applying values relevant to all ICOLLs and brackish lakes at a national scale.
3.8.1 Areal loading of total nitrogen or total phosphorus
The loading of nitrogen and phosphorus is strongly related to the ecological health of brackish lakes and ICOLLs as it is for lakes. Considerable information is available to relate loading rates to regime shifts from macrophyte (e.g. sea grass) dominated systems to macroalgae and eventually phytoplankton dominated systems (e.g. Scanes 2012; Schallenberg & Schallenberg 2012). Nitrogen loading rates were recommended for Waituna Lagoon to ensure it was maintained in a moderate ecological condition (Scanes 2012, WLTG 2013). However it is difficult to set thresholds for nutrient loading at a national scale because different lagoons have different levels of vulnerability to nutrient loading (Haine et al. 2006) and because there can be wide variability in estimating nutrient loading (see Snelder 2014; Kelly et al. 2013).
Nutrient loads are perhaps more ecologically relevant to these systems than in-lake nutrient concentrations, but further work is needed to understand variation in vulnerabilities among systems as well as to standardise and verify nutrient loading measurement methodologies (e.g. Snelder 2014).
3.8.2 Deposition of fine sediment
The deposition of fine sediment contributes to reduced light penetration when resuspended; to sediment anoxia and is associated with reduced diversity and density of benthic macrofauna (Pratt et al. 2013).
Consideration was given to setting a threshold for fine sediment (mud) deposition (e.g. Robertson and Stevens 2008); however a threshold was not identified because of the lack of data and complications in defining a system health threshold for the purpose of the NOF.
14 October 2014 36
Possible attributes applicable to ICOLLs and brackish lakes for the NOF
3.9 What other attribute tables should apply to brackish lakes and ICOLLs?
The ICOLL expert panel gave consideration to whether other attribute tables are applicable to brackish lakes and ICOLLs. It was agreed that:
It would be appropriate to include ICOLLs as a Freshwater Body Type in the current attribute tables that apply to the attributes of Ammonia toxicity, cyanobacteria –plankton.
No recommendation is made regarding the applicability of the dissolved oxygen attribute. In order to make a recommendation on this requires further work. However, the integrated nature of the sediment redox layer (RPD) provides a proxy for low dissolved oxygen.
14 October 2014 37
Possible attributes applicable to ICOLLs and brackish lakes for the NOF
4 Current state of ICOLLs and brackish lakes using the proposed attributes
4.1 Introduction
Water quality data on ICOLLs and brackish lakes was compiled in order to test their current state against the proposed attributes. This was done to address the following questions in the guiding principles for NOF attribute development (Appendix 2):
“Evaluation of current state of the attribute on a national scale
• What do we know about the current state of the attribute at a national scale?
• Is there data of sufficient quality, quantity and representativeness to assess the current state of the attribute on a national scale?”
4.2 Method
Data was collated for as many ICOLLs and brackish lakes as possible. Data relating to chlorophyll-a, total nitrogen and total phosphorus was available for 17 ICOLLs /brackish lakes. However, only 10 ICOLLs/brackish lakes had sufficient monitoring data to compare open and closed periods independently using more than 12 sample occasions (see Table 4.1). Most water quality monitoring data (i.e. chlorophyll-a, TN and TP) had been collected by regional councils and has been used in other publications. This was complemented by data from one off surveys (e.g. from Drake et al. 2010).
Very few ICOLLs or brackish lakes have comprehensive data on macrophyte cover and even fewer on Gross Eutrophic Zones (macroalgal biomass and sediment anoxia). We have reported macroalgal cover but this on its own cannot be used to assess the GEZ attribute. In some cases, where survey data is not available, we have used qualitative statements to describe macrophyte or macroalgae cover based on observations of the authors. Te Whanga (Chatham Islands) had survey data on macroalgae cover along the lagoon edge but it was difficult to convert to a percent of the whole lagoon and was not used for this report.
Identifying the available habitat for macrophytes requires interpreting site specific information. This was beyond the scope of a broad scale assessment. Instead macrophyte cover has been expressed simply as a percent of the lagoon area. In some cases macrophyte cover is reported as frequency of occurrence along transects (e.g. Sutherland et al. 2014); this is not the same as percent cover but we have used it as a proxy.
Information on open and closed periods was readily available for only some ICOLLs. Where information on open and closed periods was not available we used salinity as a proxy measurement. Samples with salinity above the median were assumed to be during an open period and samples with less than median salinity were assumed to be during a closed period. This is a very approximate assumption and not accurate for some ICOLLs (e.g. Lake Onoke), however for the specific ICOLLs for which it was used it was considered sufficient for the purpose of this assessment because we were primarily interested in more sensitive periods when the lagoon is closed.
14 October 2014 38
Possible attributes applicable to ICOLLs and brackish lakes for the NOF
4.3 Results
Out of the 17 ICOLLs and brackish lakes with data, only one was in the A band (Five Mile Lagoon), five were in the C band, and 11 were below the proposed bottom-line in the D band. There was monitoring data from three separate basins of Te Whanga on the Chatham Islands; the northern basin was placed in the D band due to high concentrations of chlorophyll-a, TN and TP, the central basin was placed in the D band due to occasionally high chlorophyll-a concentrations and the southern basin was placed in the C band (Table 4.2). The maximum concentrations of chlorophyll-a recorded in Lake Forsyth are extremely high and occurred during a bloom of Nodularia sp.
Data on Gross Eutrophic Zones (i.e. surface anoxia under macroalgae) was only available for Waituna Lagoon. GEZ in Waituna Lagoon has ranged from < 5% cover (2007, 2011, 2012) to 38% cover (2010), while macroalgae cover has ranged from about 5% to 90% cover (e.g. in 2009 and 2010). In 2010 about 60% of Waituna Lagoon was covered with macroalgae with >50% cover. Biomass was not measured but photographs indicated a likely density of >500g wet wt./m2) (Robertson and Stevens 2007, 2010; Sutherland et al. 2014). Lake Brunton in 2009 had 80% of the lagoon area with dense macroalgal growth (i.e. quadrates with >50% cover) and anoxic sediments. Again biomass was not measured but the density was estimated from photographs to be >500g wet wt./m2) (Robertson and Stevens 2009, 2013). Lake Onoke in 2007a had no nuisance macroalgal growth or anoxic sediments (Robertson and Stevens 2007).
The frequency of ICOLLs and brackish lakes failing to meeting the proposed bottom-lines was assessed for each water quality attribute to indicate which attribute was most strict. The comparison was made only for water quality attributes when lagoons were closed. The percentage of lake sites placed in the D band was 16% (3/19) by median chlorophyll-a, 45% (5/11) by maximum chlorophyll-a, 42% (8/19) by median TN, and 37% (7/19) by median TP. The median chlorophyll-a statistic appears to be considerably less strict than the maximum chlorophyll-a, median TN and median TP.
About half the ICOLLs/brackish lakes with macrophyte cover information were below the proposed bottom-line. For Lake Waihola and upper Lake Onoke the low cover of macrophytes caused the overall band to be lower than the band that would be assigned based on only water quality variables of chlorophyll-a, TN and TP. In the case of Lake Waihola, the low macrophyte cover resulted in the lake dropping to the D band.
The overall grading was compared against the percent of the catchment in native vegetation and an expert assessment of ecological integrity (EI) (from Drake et al. 2010) for nine ICOLLs and brackish lakes where ecological integrity had been assessed (see Figure 4.1). This comparison shows that better grades were associated with high EI and a high percent of the catchment in native vegetation, while lakes with a D grade were associated with low EI and a low percent of the catchment in native vegetation.
Lakes Wairarapa and Onoke were classified in the below the proposed bottom-line (in the D band) despite being assigned a relatively high EI by the expert ranking. These lakes were classified in the D band on the basis of TP only, and may reflect the resuspension of bottom sediments. In many shallow lakes the concentration of TP is strongly associated with inorganic suspended sediment (e.g. Hamill and Schallenberg 2013, Perry and Milne 2012). The higher concentrations of TP in Lake Onoke during periods when the lagoon is open probably reflects more resuspension of bottom sediment due to lower water levels compared to when the lagoon is closed.
14 October 2014 39
Possible attributes applicable to ICOLLs and brackish lakes for the NOF
Table 4.1: ICOLLs and brackish lakes with water quality data to test attributes, period of data and number of sample points used.
Lake nameICOLL/ Brackish Region
max depth
Lake size (ha)
catchment size (ha)
number (closed/open)
Water quality data period References / comments
Waituna Lagoon ICOLL Southland 3.3 1634 21000 44/15 2005-2010 Hamill 2011; Robertson and Stevens 2007, 2010Lake Brunton ICOLL Southland 3.3 26 1600 1 2012 Kelly and Schallenberg 2012; Robertson and Stevens 2009, 2013Tomahawk #1 Lagoon ICOLL Otago ca. 2 20 466 1 Late summer 2004 Drake et al. 2010 data - not sure if open or closedFive-Mile Lagoon ICOLL Westland 1 Late summer 2008 Drake et al. 2010 data - unsure if open or closedTe Waihora/ Lake Ellesmere ICOLL Canterbury 3.0 21300 250000 80/19 2005-2013 Hamill and Schallenberg 2013 Lake Forsyth/ Wairewa ICOLL Canterbury 4.0 559 10921 >75/>80 2005-2013 Median salinity (5.8 psu) was used as a proxy for open/closed period Wainono Lagoon ICOLL Canterbury 3.0 399 8492 50/43 2005-2013 Median salinity (1.8psu) was used as a proxy for open/closed period Te Whanga (north basin) ICOLL Chatham Islands 21/21 2006-2014 Median salinity (24 psu) was used as a proxy for open/closed period Te Whanga (central basin) ICOLL Chatham Islands 22/20 2006-2015 Median salinity (27 psu) was used as a proxy for open/closed period Te Whanga (southern basin) ICOLL Chatham Islands 20/19 2006-2016 Median salinity (24 psu) was used as a proxy for open/closed period Whakaki Lagoon ICOLL Hawke Bay 1 Late summer 2006 Drake et al. 2010 data - unsure if open or closed
Lake Onoke ICOLL Wellington 6 640 342,285 11 / 44 2009-2014Robertson and Stevens 2007. WQ sample site influenced by the Ruamahanga River.
Upper Onoke Brackish Wellington 1 Late summer 2006 Drake et al. 2010 data; Lake Waihola Brackish Otago 2.2 608 5011 30 2005-2009 Schallenberg and Waite 2004Lake Waipori Brackish Otago 1.0 184 22237 29 2002-2006Coopers Lagoon/ Muriwai Brackish Canterbury 3.2 2 85 93 2005-2013Lake Wairarapa Brackish Wellington 2.5 8000 57245 14 2006-2010 average of 4 sites pooledLake Kohangatera Brackish Wellington 2.1 17 2023 1 March 2011 Perrie and Milne 2012Lake Kohangapiripiri Brackish Wellington 1.8 13 380 1 March 2011 Perrie and Milne 2012
17800
14 October 2014 40
Possible attributes applicable to ICOLLs and brackish lakes for the NOFTable 4.2: Water quality data for ICOLLs and brackish lakes. Shaded cells indicate where an attribute does not comply with the proposed bottom-line threshold.
Lake nameICOLL/ Brackish
Lowest grade
Chl a (mg/m3) median closed
Chl a (mg/m3) median
open
Chl a max (mg/m3)
closed
Chl a max (mg/m3)
open
TN (mg/m3) median closed
TN (mg/m3) median open
TP (mg/m3) median closed
TP (mg/m3) median open
Macroalgae cover (%)
Macrophyte cover (%)
Waituna Lagoon ICOLL D 3.7 1.5 37 9 930 330 42 29 <5 to 60 21 - 70Lake Brunton ICOLL C 1.5 595 27 80 50-67Tomahawk #1 Lagoon ICOLL D 5.5 1072 138 15.0Five-Mile Lagoon ICOLL A 0.3 128 2 80.7Te Waihora/ Lake Ellesmere ICOLL D 63.0 62.0 521 162 1900 1700 190 160 low 0.0Lake Forsyth/ Wairewa ICOLL D 32.0 42.0 60365 14000 1100 1300 120 135 3.0Wainono Lagoon ICOLL D 11.0 8.2 238 84 1500 1200 230 100Te Whanga (north basin) ICOLL D 10.5 4.0 299 31 820 1 83 76Te Whanga (central basin) ICOLL D 1.5 1.5 306 4 435 330 39 27Te Whanga (southern basin) ICOLL C 2.9 1.7 18 4 375 420 23 33Whakaki Lagoon ICOLL D 71.8 2409 510 1.5Lake Onoke ICOLL D 4.2 4 18 19 590 290 23 54 0 0 - 7.7Upper Onoke Brackish C 1.1 261 14 42.5Lake Waihola Brackish D 5.3 26 455 46 4.5 - 16Lake Waipori Brackish C 2.0 23 550 40Coopers Lagoon/ Muriwai Brackish D 1.6 48 1800 9Lake Wairarapa Brackish D 6.0 31 520 80 3.0Lake Kohangatera Brackish C <3 490 25 highLake Kohangapiripiri Brackish C <3 720 26 highNote:Macrophyte cover is expressed as a percentage of the total lake.Lake Kohangatera and Kohangapiripiri had LakeSPI scores of 89 and 63 respectively.Numbers in italics are based on a single sample.
14 October 2014 41
Possible attributes applicable to ICOLLs and brackish lakes for the NOF
0
10
20
30
40
50
60
70
80
90
100
0 20 40 60 80 100
% C
atch
men
t Nati
ve
Ecological Integrity
Grade AGrade CGrade D
Upper Onoke
Five Mile Lagoon
Wairarapa
Onoke
Wairarapa
OnokeWhakaki
WaiholaTomahawk 1Te Waihora
Forsyth
Figure 4.1: Comparison of overall grading with percent of the catchment in native vegetation and an expert assessment of ecological integrity (from Drake et al. 2010).
4.4 Discussion
The proposed attributes of chlorophyll-a, total nitrogen and total phosphorus concentrations have good quality, long term monitoring water quality data for a high proportion of the large ICOLLs and brackish lakes in New Zealand. The geographic spread and range of trophic states is augmented with spot surveys from a further 7 ICOLLs and brackish lakes. The data is considered to be of sufficient quality, quantity and representativeness to assess the current state on a national scale for these attributes.
There is insufficient information on percent cover of Gross Eutrophic Zones (GEZ) to assess the current state on a national scale (available only for Waituna Lagoon). A larger number of ICOLLs (4) have data on macroalgae cover but the geographic spread is relatively poor and it is difficult to extrapolate to a national scale. No macroalgae data was available for the brackish lakes.
Similarly, there is insufficient information on macrophyte cover (percent of available habitat) to assess the current state on a national scale. This is because identifying the available habitat for macrophytes requires interpreting site specific information that was not available for this assessment. However, there is reasonable information on macrophyte cover expressed simply as a percent of the lagoon area from 13 ICOLLs and brackish lakes around New Zealand. This provides a conservative assessment (i.e. over-estimates failure) and is considered reasonable for the purposes of screening.
Based on the proposed attributes about two thirds (11/17) of ICOLLs with monitoring data fall below the proposed bottom-lines for one or more attributes. The percentage of lake sites placed in the D band was 16% for median chlorophyll-a, 45% for maximum chlorophyll-a, 42% for median TN, and 37% for median TP.
14 October 2014 42
Possible attributes applicable to ICOLLs and brackish lakes for the NOF
We are aware of eight ICOLLs that are currently being managed for freshwater, i.e. the Coastal Marine Area boundary is at or downstream of the outlet from the lagoon. These ICOLLs are: Waituna Lagoon, Lake Brunton, Tomahawk Lagoon, Lake Hawksbury, Wainono Lagoon, Lake Forsyth/Wairewa, and Te Waihora/Lake Ellesmere. We have information to test the attributes on seven of these ICOLLs. All would be classified in the D band on the basis of one or more attributes.
5
14 October 2014 43
Possible attributes applicable to ICOLLs and brackish lakes for the NOF
6 Conclusions
Brackish lakes and Intermittently Closed and Open Lakes and Lagoons (ICOLLs) are complex systems that reflect characteristics of both freshwater lakes and coastal lagoon estuaries. We have identified five attributes that would support the value of ecosystem health in ICOLLs and brackish lakes and could be considered for incorporating into the NOF; these are:
Phytoplankton chlorophyll-a concentration,
Total nitrogen concentration,
Total phosphorus concentration,
Macroalgal Gross Eutrophic Zones (GEZ), and
Macrophyte cover.
The thresholds proposed for phytoplankton (measured as chlorophyll-a), TN and TP are similar to those set for lakes in the NPS-FM, but the monitoring and reporting differs to account for intermittent marine influence so that:
The thresholds apply both during periods when the ICOLL is open and during periods when the ICOLL is closed. This means that for the purpose of comparing the state of an ICOLL with proposed thresholds the monitoring data should be analysed separately for closed periods and open periods. The overall state of the ICOLL defaults to the state during the worse period for any particular attribute.
Where attributes are expressed as a median value it is intended that these apply to a rolling median of 12 samples for each situation (i.e. open or closed), and assuming a regular (e.g. monthly) monitoring regime.
Where attributes are expressed as a maximum value it is intended that these apply as the maximum from two years of monitoring, assuming a regular (e.g. monthly) monitoring regime.
‘Macroalgae (Gross Eutrophic Zones)’ and ‘macrophyte cover’ are not currently in the NPS-FM. These condition indicators are important for representing and maintaining ecosystem health of brackish lakes and ICOLLs. However the thresholds rely on a degree of expert assessment, and monitoring protocols may need to be standardised. It is recommended that further work is undertaken to confirm measures and thresholds for macroalgae. This will improve the information available for any subsequent reviews of the NPS-FM.
The description of bands for chlorophyll a, TN and TP are different from the descriptions currently used in the NPS-FM for lakes. The descriptions we have provided more accurately reflect what the bands mean for ICOLLs, brackish lakes and freshwater lakes.
The proposed attributes of chlorophyll-a, total nitrogen and total phosphorus concentrations have good quality, long term monitoring water quality data for a high proportion of the large ICOLLs and brackish lakes in New Zealand. Only a small number of ICOLLs have information on macroalgae cover
14 October 2014 44
Possible attributes applicable to ICOLLs and brackish lakes for the NOF
and only Waituna Lagoon has information on GEZ, making it difficult to assess this attribute on a national scale. Similarly, there is insufficient information on macrophyte cover when expressed as percent of available habitat to assess the current state on a national scale, but a reasonable number of ICOLLs have an estimate of macrophyte cover if expressed as a percentage of the whole lagoon.
14 October 2014 45
Possible attributes applicable to ICOLLs and brackish lakes for the NOF
References
Abell J.M., Hamilton D.P. 2014. Biogeochemical processes and phytoplankton nutrient limitation in the inflow transition zone of a large eutrophic lake during a summer rain event. Ecohydrology DOI: 10.1002/eco.1503.
Bricker, S.B., Clement, C.G., Pirhalla, D.E., Orlando, S.P., and Farrow, D.R.G. 1999. National Estuarine Eutrophication Assessment. Effects of Nutrient Enrichment in the Nation’s Estuaries. NOAA, National Ocean Service, Special Projects Office and National Centres for Coastal Ocean Science, Silver Spring.
Bricker, S.B., Ferreira J.G., Simas T. 2003. An integrated methodology for assessment of estuarine trophic status. Ecological Modelling 169: 39–60.
Burns N.; Bryers G.; Bowman E. 2000. Protocol for monitoring trophic levels of New Zealand lakes and reservoirs. Prepared for Ministry of the Environment by Lakes Consulting, March 2000. Web: http://www.mfe.govt.nz/publications/water/protocol-monitoring-trophic-levelsmar-2000/index.html
Blindow I., Hargeby A. & Andersson G. 2002. Seasonal changes of mechanisms maintaining clear water in a shallow lake with abundant Chara vegetation. Aquatic Botany 72:315–334.
Cloern, J. 2001. Our evolving conceptual model of the coastal eutrophication problem. Marine Ecology Progress Series 210: 223–253.
Drake D.C., Kelly D. & Schallenberg M. 2010. Shallow coastal lakes in New Zealand: current conditions, catchment-scale human disturbance, and determination of ecological integrity. Hydrobiologia 658: 87-101.
Dyer K.R. 1997. Estuaries. A physical introduction. 2nd edition. Chichester, John Wiley & Sons. (chapter 9)
Fenchel, T. M., Riedel, R. J. 1970. The sulfide system: a new biotic community underneath the oxidized layer of marine sand bottoms. Mar. Biol. 7: 255-268
Gale E., Pattiaratchi C., Ranasinge R. 2007. Processes driving circulation, exchange and flushing within intermittently closing and opening lakes and lagoons. Marine and Freshwater Research 58, 709–719.
Gerbeaux P. 1989. Aquatic plant decline in Lake Ellesmere: A case for macrophyte management in a shallow New Zealand Lake. PhD thesis. Lincoln University. 318 pp.
Gerbeaux P., Ward J.C. 1991. Factors affecting water clarity in Lake Ellesmere, New Zealand. New Zealand Journal of Marine and Freshwater Research 25: 289-296.
Geurts J.J.M., Sarneel J.M., Willers B.J.C., Roelofs J.G.M., Verhoeven J.T.A. & Lamers L.P.M. 2009. Interacting effects of sulphate pollution, sulphide toxicity and eutrophication on vegetation development in fens: a mesocosm experiment. Environmental Pollution 157: 2072–2081.
Possible attributes applicable to ICOLLs and brackish lakes for the NOF
González Sagrario M. A., Jeppesen E., Gomà J., Søndergaard M., Lauridsen T., & Landkildehus F. 2005. Does high nitrogen loading prevents clear-water conditions in shallow lakes at intermediate high phosphorus concentrations. Freshwater Biology 50: 27–41.
Graf G. 1992. Benthic-pelagic coupling: a benthc view. Oceanogr mar Biol Annu Rev 30: 149-190.
Green L., Sutula M., Fong P. 2014. How much is too much? Identifying benchmarks of adverse effects of macroalgae on the macrofauna in intertidal flats. Ecol Appl. 24(2):300-14.
Grizzle R.E. & Penniman C.A. 1991. Effects of organic enrichment on estuarine macrofaunal benthos: a comparison of sediment profile imaging from traditional methods. Marine Ecology Progress Series 74: 249-262.
Hamill K.D., Schallenberg M. 2013. Mechanisms that drive in-lake nutrient processing with Te Waihora/Lake Ellesmere: Inter-annual water quality variability. Prepared for Environment Canterbury by River Lake Ltd.
Hamill K.D. 2011. Southland Water 2010: Our Ecosystems technical report for lakes and lagoons. Prepared for Environment Southland by Opus International Consultants.
Hamill K.D. 2014. Auckland lake water quality: state and trends. Prepared for Auckland Council by River Lake Ltd.
Hamilton D.P., Jones H.F.E., Özkundakci D., McBride C., Allan M.G., Faber J. & Pilditch C.A. 2012. Waituna Lagoon Modelling: Developing quantitative assessments to assist with lagoon management. University of Waikato. ERI report number: 004.
Haines P.E., Tomlinson R.B., Thom B.G. 2006. Morphometric assessment of intermittently open/closed coastal lagoons in New South Wales, Australia. Estuarine, Coastal and Shelf Science 67: 321-332.
Holmer M. & Bondgaard E.J. 2001. Photosynthetic and growth response of eelgrass to low oxygen and high sulfide concentrations during hypoxic events. Aquatic Botany 70: 29–38.
Jeppesen E., Søndergaard M., Kanstrup E., Petersen B., Henriksen R.B., Hammershøj M., Mortensen E., Jensen J.P., & Have A. 1994. Does the impact of nutrients on biological structure and function of brackish and freshwater lakes differ? Hydrobiologia 275/276: 15–30.
Jeppesen E., Søndergaard M., Meerhoff M., Lauridsen T., Jensen J. 2007. Shallow lake restoration by nutrient loading reduction-some recent findings and challenges ahead. Hydrobiologia 584: 239-252.
Jeppesen E., Søndergaard M., Pedersen A.R., Jürgens K., Strzelczak A., Lauridsen T.L., Johansson L.S. 2007a. Salinity Induced Regime Shift in Shallow Brackish Lagoons. Ecosystems 10: 47–57
Jordan T.E., Cornwell J.C., Boynton W.R., Anderson J.T. 2008. Changes in phosphorous biogeochemistry along an estuarine salinity gradient: The iron conveyer belt. Limnology and Oceanography 53(1): 172-184.
14 October 2014 47
Possible attributes applicable to ICOLLs and brackish lakes for the NOF
Kelly D., Shearer K., Schallenberg M. 2013. Nutrient loading to shallow coastal lakes in Southland for sustaining ecological integrity values. Prepared for Environment Southland by Cawthron Institute. Report No. 2375.
Kelly D.J., Jellyman D.J. 2007. Changes in trophic linkages to shortfin eels (Anguilla australis) since the collapse of submerged macrophytes in Lake Ellesmere, New Zealand. Hydrobiologia 579: 161-173.
Kirk R.M., Lauder G.A. 2000. Significant coastal lagoon systems in the South Island, New Zealand. Coastal processes and lagoon mouth closure. Science for Conservation 146. Department of Conservation.
Kjerfve B. [ED.] 1994. Coastal lagoon processes. Elsevier
Lamers L.P.M., Govers L.L., Janssen I.C.J.M., Geurts J.J.M., Van der Welle M.E.W., Katwijk M.M., Van der Heide T., Roelofs J.G.M., Smolders A.J.P. 2013. Sulfide as a soil phytotoxin—a review. Frontiers in Plant Science 4: 268. doi: 10.3389/fpls.2013.00268
Larned S., Hamilton D., Zeldis J., Howard-Williams C., 2011. Nutrient-limitation in New Zealand rivers, lakes and estuaries: a discussion paper. Prepared for Land and Water Forum, September 2011.
McLaughlin K., Sutula M., Busse L., Anderson S., Crooks J., Dagit R., Gibson D., Johnston K., Nezlin N., Stratton L. 2012. Southern California Bight 2008 Regional Monitoring Program: VIII. Estuarine Eutrophication. Southern California Coastal Water Research Project.
Madden C., Goodin K., Allee B., Finkbeiner M., Bamford D., 2008. Coastal and Marine Ecological Classification Standard. NOAA and Nature-Serve. 77p.
Norton N.; Allan M., Hamilton D., Horrell G., Sutherand D., Meredith A. 2014. Technical Report to support water quality and Water Quantity limit setting process in Selwyn Waihora Catchment. Predicting consequences of future scenarios: Te Waihora/Lake Ellesmere. Environment Canterbury Report No. R14/14
NPS-FM 2014: National policy statement for freshwater management. Issued by notice in gazette on 4 July 2014.
Perry A., Milne J. 2012. Lake water quality and ecology in the Wellington region. State and trends. Greater Wellington Regional Council. ISBN: 978-1-927217-04-7
Pratt D.R., Lohrer A.M., Pilditch C.A., Thrush S.F. 2014. Changes in ecosystem function across sedimentary gradients in estuaries. Ecosystems 17: 182–194
Robertson, H.; Funnell, E. 2011. Aquatic plant dynamics of Waituna Lagoon, New Zealand: trade-offs in managing opening events of a Ramsar site. Wetlands Ecology and Management. 20(5): 433-445.
Robertson B.M.; Stevens L. 2007. Waituna Lagoon Macrophyte (Ruppia) Mapping. Report prepared by Wriggle Coastal Management for Department of Conservation. 12p.
Robertson B.M.; Stevens L. 2007a. Lake Onoke 2007 - Vulnerability Assessment & Monitoring Recommendations. Prepared for Greater Wellington Regional Council. 57p.
14 October 2014 48
Possible attributes applicable to ICOLLs and brackish lakes for the NOF
Robertson B.; Stevens L. 2008. Motupipi Estuary 2008 Fine Scale Monitoring. Prepared for Tasman District Council by Wriggle Coastal Management.
Robertson B.M.; Stevens L. 2009. Lake Brunton. Synoptic survey, macrophyte mapping and vulnerability assessment. Report prepared for Environment Southland. 17p.
Robertson B.M.; Stevens L. 2010. Waituna Lagoon Macrophyte (Ruppia) Monitoring. Report prepared by Wriggle Coastal Management for Department of Conservation. 11p.
Robertson B.; Stevens L. 2013. Lake George - Broad Scale Habitat Mapping 2013. Prepared for Environment Southland by Wriggle Coastal Management.
Scanes P. 2012. Nutrient loads to protect environmental values in Waituna Lagoon. Report prepared for Environment Southland. 11 pp.
Scanlan C. M., Foden J., Wells E. & Best M. A. 2007. The monitoring of opportunistic macroalgal blooms for the water framework directive. Marine Pollution Bulletin 55: 162-171
Schallenberg M. 2014. Determining the reference condition of New Zealand lakes. Science for Conservation Series. Prepared for Department of Conservation by Hydrosphere Research Ltd
Schallenberg M., Hall C.J. & Burns CW. 2003. Consequences of climate-induced salinity increases on zooplankton abundance and diversity in coastal lakes. Marine Ecology Progress Series 251: 181-189.
Schallenberg M, Kelly D. 2012. Ecological Condition of the Six Shallow Southland Lakes. Prepared for the Environment Southland. Cawthron Report 2138. 45p.
Schallenberg M, Kelly D. 2013. Ecological condition in relation to reference condition in shallow Southland lakes. Prepared for the Environment Southland. Hydrosphere Report.
Schallenberg M, Larned S, Hayward S, Arbuckle C. 2010. Contrasting effects of managed opening regimes on water quality in two intermittently closed and open coastal lakes. Estuarine, Coastal and Shelf Science 86: 587-597.
Schallenberg M., Schallenberg, L. 2012. Eutrophication of coastal lagoons: a literature review. Report to Environment Southland. Hydrosphere Research Ltd. Dunedin 45p.
Schallenberg M., & Sorrell B. 2009. Regime shifts between clear and turbid water in New Zealand lakes: environmental correlates and implications for management and restoration. New Zealand Journal of Marine and Freshwater Research 43: 701–712.
Schallenberg M.; Waite E. 2004. Survey of Aquatic Macrophytes in Lake Waihola, Summer 2002-2003. Limnology Report No. 9, Department of Zoology, University of Otago. http://www.erg.otago.ac.nz/attachments/182_Report9%20-%20Waihola%20aquatic%20plants.pdf
Scheffer M. 2004. The ecology of shallow lakes. Kluwer Academic Publishers. Dordrecht, the Netherlands.
Possible attributes applicable to ICOLLs and brackish lakes for the NOF
Sim L., Chambers J. & Davis J. 2006.Ecological regime shifts in salinised wetland systems. I. Salinity thresholds for the loss of submerged macrophytes. Hydrobiologia, 573: 89-107.
Snelder T. 2014 Contaminant load calculator. Envirolink Project 1746-ESRC 266 . Prepared for Environment Southland
Søndergaard M., Jensen J.P., & Jeppesen E. 2003. Role of sediment and internal loading of phosphorus in shallow lakes. Hydrobiologia 506–509: 135–145
Søndergaard M., Jensen J.P., Jeppesen E. 2005. Seasonal response of nutrients to reduced phosphorus loading in 12 Danish lakes. Freshwater Biology 50: 1605- 1615.
Sutherland D., Taumoepeau A., Stevens E. 2014. Macrophyte monitoring in Waituna Lagoon – Summer 2014. Prepared for Department of Conservation by NIWA.
Sutula M. 2011. Review of Indicators for Development of Nutrient Numeric Endpoints in California Estuaries. Southern California Coastal Water Research Project Technical Report No. 646
Sutula M.; Green L.; Cicchetti G.; Detenbeck N.; Fong P. 2014. Thresholds of Adverse Effects of Macroalgal Abundance and Sediment Organic Matter on Benthic Habitat Quality in Estuarine Intertidal Flats. Estuaries and Coasts DOI 10.1007/s12237-014-9796-3
Tatrai I., Boros G., Gyorgy A., Matyas K., Korponai J., Pomogyi P., Havasi M. & Kucserka T. 2009. Abrupt shift from clear to turbid state in a shallow eutrophic, biomanipulated lake. Hydrobiologia. 620: 149–161.
Verburg, P., Hamill, K.D., Unwin, M., Hamilton, D. 2010. Lake water quality in New Zealand 2010: Status and trends. Prepared for Ministry for the Environment by NIWA, Opus International Consultants and University of Waikato.
Viaroli P., Bartoli M., Giordani G., Naldi M., Orfanidis S., Zaldivar J. 2008. Community shifts, alternative stable states, biogeochemical control and feedbacks in eutrophic coastal lagoons: a brief overview. Aquatic Conservation: Marine and Freshwater Ecosystems 18: 105-117.
Wazniak, C., & Hall, M. (2007). Linking water quality to living resources in a mid-Atlantic lagoon system, USA. Ecological Applications 17:S64–S78. http://dx.doi.org/10.1890/05-1554.1
Waituna Lagoon Technical Group 2013. Ecological guidelines for Waituna Lagoon. Prepared for Environment Southland, December 2013.
Wriggle Coastal Management 2012. Preliminary Guidance Document: Nutrient Load Criteria to Limit Eutrophication in Typical NZ Estuary Types - Tidal Lagoon and Tidal River Estuaries. Prepared for Environment Southland by Wriggle Coastal Management.
Webster I. & Harris G. 2004. Anthropogenic impacts on the ecosystem of coastal lagoons: modelling fundamental biogeochemical processes and management implications. Marine and Freshwater Research 55: 67-78
Possible attributes applicable to ICOLLs and brackish lakes for the NOF
WFD-UKTAG 2014. UKTAG Transitional and Coastal Water Assessment Method Macroalgae Opportunistic Macroalgal Blooming Tool. Water Framework Directive – United Kingdom Advisory Group (WFD-UKTAG).
14 October 2014 51
Possible attributes applicable to ICOLLs and brackish lakes for the NOF
Appendix 1: Terms of reference for expert panel
14 October 2014 52
Possible attributes applicable to ICOLLs and brackish lakes for the NOF
.
14 October 2014 53
Possible attributes applicable to ICOLLs and brackish lakes for the NOF
Appendix 2: Guiding Principles for NOF Attribute Development
This paper explains the fundamental purpose of attributes in the National Objectives Framework (NOF) and the guiding principles that were used to develop them.
The National Policy Statement for Freshwater Management 2014 (NPS-FM 2014) requires councils to set freshwater objectives and limits in regional plans. The purpose of the NOF is to assist councils with this.
To achieve this requirement of the NPS-FM 2014 all attributes were judged against specific criteria, some of which are included below, that were divided into five categories. This provided a logical stepwise approach to assess each attribute. In some instances steps will be revisited as this can be an iterative process.
1. Link to the National value
• Is the attribute required to support the value?
• Does the attribute represent the value?
2. Measurement and band thresholds
• Are there established protocols for measurement of the attribute?
• Do experts agree on the summary statistic and associated time period?
• Do experts agree on thresholds for the numerical bands and associated band descriptors?
3. Relationship to limits and management
• Do we know what to do to manage this attribute?
• Do we understand the drivers associated with the attribute?
• Do quantitative relationships link the attribute state to resource use limits and/or management interventions?
4. Evaluation of current state of the attribute on a national scale
• What do we know about the current state of the attribute at a national scale?
• Is there data of sufficient quality, quantity and representativeness to assess the current state of the attribute on a national scale?
5. Implications of including the attribute in the NOF
• Do we understand/can we estimate the extent (spatial), magnitude, and location of failures to meet the proposed bottom line for the attribute on a national scale?
Possible attributes applicable to ICOLLs and brackish lakes for the NOF
Appendix 3: Narrative definitions of Ecosystem Health for ICOLLs
Draft narrative definitions of ecosystem health developed for Greater Wellington Regional Council by Wriggle Coastal Management.
Seagrass and saltmarshMacrophyte & macroalgae
Biology
Seagrass and saltmarsh are present and in a condition within an acceptable range of that found under natural conditions
Macrophytes should comprise a balanced community with few nuisance blooms of opportunistic macroalgae and epiphyte cover
Phytoplankton The phytoplankton community is balanced with a low frequency of algal blooms
InvertebratesInvertebrate communities are resilient and their structure, composition and diversity are within an acceptable range of those found under natural conditions
FishFish communities are resilient and their structure, composition and diversity are within an acceptable range of those found under natural conditions
Water quality
Salinity The natural salinity regime is maintained
Dissolved oxygen Dissolved oxygen concentration is sufficient to sustain aquatic plant, invertebrate and fish communities
Clarity Water clarity is sufficient to sustain aquatic plant, invertebrate and fish communities
Nutrients
Substrate quality
Sedimentation rate The sedimentation rate is within an acceptable range of that expected under natural conditions.
Mud content The mud content and areal extent of soft mud habitats is within an acceptable range of that found under natural conditions
Sediment anoxia There is low incidence of sediment anoxia with no gross anoxic areas and/or nuisance conditions
Toxicants Concentrations are less than those which can cause toxicity impacts to biota
Plant available nutrient concentrations should not cause an imbalance in natural populations of biota
Toxicants Concentrations are less than those which can cause toxicity impacts to biota
Aquatic plants
Organic carbon The total organic carbon content is within an acceptable range of that found under natural conditions
Nutrients Nutrient concentrations should not cause an imbalance in natural populations of biota
Mahinga kai Taonga species are present in quantities, size and of a quality that is appropriate for the area
14 October 2014 55
Possible attributes applicable to ICOLLs and brackish lakes for the NOF
Appendix 4: Estuary definitions (including Intermittently Closed / Open Estuaries)
The current, widely used, conceptual US definition of estuaries (Madden et al. 2008), including intermittently closed/open estuaries, which includes spatial boundaries, is as follows:
The Estuarine System consists of tidal habitats and adjacent tidal wetlands with water that is at least occasionally diluted by freshwater runoff from the land (<30psu) and is at least partially enclosed by land but has open, partly obstructed, or sporadic access to the open ocean. The salinity may be periodically increased above that of the open ocean by evaporation. The Estuarine System extends upstream and landward to where ocean derived salts measure less than 0.5psu during the period of average annual low flow and seaward to an imaginary line closing the mouth of the four main estuary types: tidal river, tidal lagoon, fjord or embayment type estuary.
The geomorphology and hydrology determine the degree of the physical enclosure, which in turn impacts the residence time for water within an estuary and the steepness of biological, physical and chemical gradients between terrestrial and marine end members. The degree of enclosure defines Estuarine Systems, and establishes a degree of temporal, chemical, biological and ecological distinctiveness from marine waters and biogeochemistry. A river flowing directly into the ocean is very different than a coastal Estuarine System that slowly discharges into the ocean.
Estuarine Systems can occur on the continental land mass or on islands in waters of any depth, provided they have sufficient enclosure and significant freshwater flow. Although they are coastal features by definition, many Estuarine Systems have water depths much greater than 30 m (e.g. fiords). All areas within the enclosed morphology that generally defines the estuary are classified as Estuarine, regardless of depth. The depth of an estuarine water column can be significantly greater than 30 m and retain the characteristics of an estuary.
The definitions of terms for the classification of estuaries are as follows (California State Water Resources Control Board (SWRCB) 2012):
Coastal Embayment or Enclosed Bay Estuary: This class of estuary is bounded by enclosing landforms, forming a topographic depression and, in effect are, indentations along the coast that enclose an area of oceanic water within distinct headlands or harbour works. Enclosed bays includes all bays where the narrowest distance between headlands or outermost harbour works is less than 75 % of the greatest dimension of the enclosed portion of the bay. They are perennially open to tidal exchange with a large ocean inlet and, as consequence, are well-flushed, sometimes deep and subject to potentially high energy input from tides and currents. These estuaries have enclosure ratios (100*CA mouth/Area estuary) > 0.1 and subtidal habitat > 50% of the total estuarine area. Includes: bay, coastal bight, sound.
Tidal Lagoon or Coastal Lagoon: This class of estuary tends to be nearly or completed enclosed by a sand bar, forming a topographic depression. Lagoons are shallow in depth, with reduced exchange with the ocean, and quiescent in terms of wind, current and wave energy. They have an enclosure rations of <0.1 and subtidal habitat of <50%. The flushing times tend to be long relative to riverine estuaries and even embayments, as the restricted exchange with the marine end member and reduced river input lengthen residence times (cut-offs to be defined). They can be perennially, intermittently, ephemerally
14 October 2014 56
Possible attributes applicable to ICOLLs and brackish lakes for the NOF
open to surface water tidal exchange, or permanently closed, but receive exchange with the coastal ocean through the sand berm. Includes; Barrier Island estuary, Bar-built estuary, Lagoon, Tidal inlet.
Tidal River or River Mouth Estuary: This class of estuary tends to be linear in form (no well-defined topographic depression) with a well-defined channel and fresh and brackish water vegetation and/or riparian vegetation occurring near the mouth. These estuaries are typically characterized by high rates of deposition and erosion, with sediments consisting of poorly sorted materials. They can be associated with a delta, bar or barrier island and other depositional features. These estuaries have high flushing rates (cut-offs to be defined) and enclosure ratios >0.1. They can be perennially, intermittently or ephemerally open to surface water tidal exchange. Includes: Drowned river valley Deltaic estuary River channel Salt wedge estuary Tidal fresh marsh
Fiords. Fiords are deep, seasonally cold-water estuaries with low to moderate riverine inputs and exist at mid to high latitudes. This class of estuary has relatively complex, usually rocky shorelines and bottoms and is partially enclosed sometimes by mountainous landforms, often with a geologic sill formation at the seaward end due to formation by glacial action. The morphology combined with a low exchange of bottom waters with the ocean can result in formation of hypoxic bottom waters. Because of their depth, these estuaries tend to have low surface area to volume ratios. They have moderate watershed to water area ratios and low to moderate wetland to water ratios.
Intermittently Closed Open Estuaries
In general, both tidal river and tidal lagoon type estuaries can have intermittently closed/open mouth configurations. Tidal Lagoon type estuaries with intermittently closed open mouths are termed ICOLLs (intermittently closed open lakes and lagoons), tidal river estuaries with intermittently closed open mouths are termed ICOTRLs.
Intermittently closed and open lakes and lagoons (ICOLLs) make up 13% of the world’s coastline (Kjerfve 1994) and occur where there is high interannual variability in rainfall and wave climate and, although found throughout the world, are particularly common on the African (18% of the coastline) and North American continents (18% of the coastline; Kjerfve 1994) and are locally common in Southeastern Australia, Western Australia, South Africa, New Zealand, Mexico, Texas, and the Altlantic coast of Brazil and Uraguay (Haines et al. 2006). During periods of low rainfall, longshore drift of sand/gravel forms and maintains a berm above high tide, closing off ICOLLs to the sea from days to years (Haines et al. 2006) and are reopened through storm or flood events or through artificial means.