Report No. 1 6522-TUN Republicof Tunisia Higher Education: Challenges and Opportunities May 8, 1997 H luman Development Group Middle East and North Africa Region Documentof the World Bank Public Disclosure Authorized Public Disclosure Authorized Public Disclosure Authorized Public Disclosure Authorized
Transcript
Report No. 1 6522-TUN
Republic of TunisiaHigher Education:Challenges and OpportunitiesMay 8, 1997
H luman Development GroupMiddle East and North Africa Region
Document of the World Bank
Pub
lic D
iscl
osur
e A
utho
rized
Pub
lic D
iscl
osur
e A
utho
rized
Pub
lic D
iscl
osur
e A
utho
rized
Pub
lic D
iscl
osur
e A
utho
rized
CURRENCY EQUIVALENTS
Currency unit: Tunisian Dinar (TD)US$1 = TDI.04TDI = US$0.96
ABBREVIATIONS AND ACRONYMS
CNE Commission Nationale d'EvaluationNational Evaluation Commission
DEA Dipl6me d'Etudes ApprofondiesDiploma of Advanced Studies
DESS Dipl6me d'Etudes Superieures SpecialiseesDiploma of Higher Specialized Studies
DGRST Direction Generale de la Recherche Scientifique et TechniqueScientific and Technical Research Department
EESR Etablissement d'enseignement superieur et de rechercheHigher Education and Research Establishment
EFEB Examen de fin d'etudes fondamentalesBasic Education Completion Examination
EPA Etablissement public a caractere administratifAdministrative Public Establishment
ISET Institut superieur des etudes technologiquesHigher Technical Education Institute
ISFM Institut superieur de formation des maltresHigher Teacher Training Institute
MEN Ministere de I'Education NationaleMinistry of Education
MENA Middle East and North Africa RegionMES Ministere de l'Enseignement Superieur
Ministry of Higher EducationMFPE Ministere de la Formation Professionnelle et de I'Emploi
Ministry of Vocational Training and EmploymentONEF Observatoire National de l'Emploi et de la Formation
National Employment and Training LaboratorySAGES Systeme d'analyse et de gestion de 1'enseignement superieur
Higher Education Analysis and Management SystemSMIG Salaire minimum interprofessionnel garanti
Guaranteed Interoccupational minimum wageUE Union Europeenne
European Union
Vice President: Mr. Kemal Dervi,Director: Mr. Daniel RitchieSector Director: Mr. Jacques BaudouyTask Manager: Mr. Benoit Millot
- 11 -
ABSTRACT
1. Higher education in Tunisia today is still a largely effective and well-performing system. However,with the doubling of enrollments expected over the next ten years, the system is going to encounterobstacles that could prevent it tomorrow from playing the role expected of it by a society and economy inrapid transformation. This report, which builds on a wealth of studies completed by Tunisian experts,identifies some of those obstacles and suggests a series of coordinated counter-measures.
2. The problems identified stem from four sets of circumstances: (i) low internal efficiency (despite arigorous selection process in the previous cycles), linked to the not easily reversible channeling of studentsinto compartmentalized fields of study; (ii) institutional organization and resource allocation methods thatleave education establishments with little responsibility, do not foster openness to the external world, andare not conducive to private initiative; (iii) a teaching profession characterized by low statute-basedworkloads, inappropriate criteria for hiring and promotion, devaluation of professorial function, and lack oftraining in and evaluation of pedagogical skills; and (iv) a financing system funded almost entirely by thepublic sector, burdened by major but ineffective transfer payments, and likely to be incapable of coveringthe costs involved in expanding enrollment capacity to meet inevitable increases in demand.
3. Various means of rectifying these problems are available: (i) an adaptable modular style ofacademic organization that will eliminate the disadvantages of rigid channeling/assignment of students,make university-level career paths more flexible, and reduce the number of failures (particularly in the firstcycles); (ii) greater decentralization of decision-making for universities, results-oriented resource allocation,greater autonomy in funding management, and a legal climate conducive to the opening of privateestablishments; (iii) separation of teaching and research, introduction of the possibility of exercising one orthe other of these functions on a basis of specific time obligations (with opportunities to move between thetwo of them), and provision of educator training and evaluation services; and (iv) application of a range ofmeasures for financing expansion of the system-recovery of social service and teaching service costs (incombination with targeting of transfer payments toward the most disadvantaged), more rational deploymentof teaching personnel, and greater participation by the private sector.
- iii -
TABLE OF CONTENTS
Abstract ...... iTable of Contents ............ iiiExecutive Summary ............ vi
I INTRODUCTION .I
II ECONOMIC AND SECTORAL FRAMEWORK .I
A Macroeconomic Setting .2B Sectoral Setting .2
III CURRENT SITUATION OF HIGHER EDUCATION .5
A Enrollment .5B Resources .8C Financing .14D Product .18
IV INSTITUTIONAL ENVIRONMENT AND INCENTIVES .21
A Routing of Students to Departments/Disciplines .21B Curriculum Organization .22C Distribution of Responsibilities .24D The Teaching Function .27E An Incipient Private Sector .33F Research and Relations with the outside World .37
This report is based on the results of a mission that visited Tunisia in June 1996. The missionconsisted of Benoit Millot (human resources economist, mission leader), Anne-Marie Leroy (publicadministration specialist), Francis Steier (education economist), Alenoush Saroyan (assessmentspecialist), Quentin Thompson (education planner), and Alain Shoenenberger (economist). The missionalso benefited from contributions from Lauritz Holm-Nielsen (research specialist), Dung-Kim Pham(operations analyst), Pierre Weiss (sociologist) and Andre Legrand (law specialist), the comments ofWilliam Experton, Jamil Salmi and Christopher Shaw (peer reviewers), and discussions with MouradEzzine. The mission would like to express its profound thanks to the staff of the Ministry of HigherEducation in Tunis, without whose assistance this report would not have been possible. Jacques Baudouyis the Manager of MNSHD and Daniel Ritchie the Director of MN 1.
- iv -
Text tables
2.1 Selectivity in Public Primary and Secondary Education (1994/95)3.1 Comparison of Private and Public Costs, by Education Level (1990)3.2 Average, Minimum and Maximum Budget Transfers Via Higher Education Expenditures (1990/91)3.3 Graduates Produced by Tunisian Universities (1995)3.4 Civil Service: Annual Salary and Total Remuneration, by Corps and Grade (1995)4.1 Matrix of Responsibilities in the Higher Education System4.2 Teaching Staff Recruitment, by Grade (1995)5.1 The Basic Scenario and its "Pessimistic Variant": Financing Deficits (1997-2006)5.2 Alternative Scenarios: Financing Surpluses and Deficits (1997-2006)5.3 Teaching Potential and Workload, by University
Text graphs
3.1 Higher Education: Unit Cost/Enrollment Ratio (1972-1994)
Text boxes
1. Enrollment Rates, by Level: International Comparisons2. Public Education and Higher Education Expenditures: International Comparisons3. Weekly Program Workloads in Higher Education: International Comparisons4. Salary and Total Remuneration for Two Teaching Career Paths5. Share of Private Financing in Higher Education in a Number of Asian Countries (ca. 1985)6. Student Loan Repayment Default Rates: International Comparisons (1980-88)7. Private Higher Education in Latin America8. The Swiss National Research Fund (FNRS)
Annexes
1. Structure of Education in Tunisia2. Primary and Secondary Education: Basic Data3. Higher Education Enrollment: Trend and Distribution4. Repeating in Higher Education5. GDP, State Budget, Education Budget and Higher Education Budget6. Comparative Changes in Enrollment and Unit Cost in Higher Education7. Unit Costs in Higher Education: International Comparisons8. Higher Education Operating Budget: Distribution by Expenditure Categories9. Higher Education Operating Budget: Distribution by Expenditure Category in Various OECD
Countries10. Data on Student/Teacher Rates in Higher Education11. Annual Remuneration in the Tunisian Civil Service12. Unemployment and Education Level13. Teacher Recruitment Procedures in Higher Education14. Distribution of Teachers, by Categories and Establishments (1995/96)
- v -
15. Distribution of Public and Private Expenditure by Type of Higher Education Establishment inVarious OECD Countries
16. Foreign Students Enrolled in U.S. Universities, by Region of Origin and Discipline (1991-92)17. Enrollment Projections, by Education Sector18. Financing Scenarios (1997-2006)19. Projection of Teacher Needs20. Teaching Capacity, Workload and Deficit, by Establishment
I
- vi -
EXECUTIVE SUMMARY
I. Context
1. This study of the higher education sector in Tunisia not only forms part of preparatory work for theNinth Plan, which has already resulted in a series of thorough reports by domestic agencies, but is also animportant element in the dialogue between the Ministry of Higher Education and the World Bank.
2. The question motivating this study is whether higher education is ready to play the crucial roleexpected of it by the Tunisian economy in its quest for competitiveness and openness to the rest of theworld. The higher education sector can be regarded in a generally positive light at the present juncture.However, its rapid expansion-both inevitable and welcome-can be expected to reveal dysfunctionswhich, though still manageable so far, will worsen and possibly paralyze the sector unless appropriate stepsare taken. If the educational, institutional and financial situation remains unchanged, expansion of thesector will create multiple problems instead of valuable opportunities.
II. Diagnostic Assessment of the Present Situation
3. Higher education in Tunisia has long been regarded as a well-organized and well-managed systemthat emphasizes quality, a fact this report readily acknowledges. The report also recognizes the merits ofthe recent reforms and the very real improvements resulting from them. If the critical appraisal that nowfollows dwells on the failings of the system, it does so in order to lay the foundations for measures designedto tackle these shortcomings and to safeguard the prospects of a favorable outcome.
A. Production function of higher education
4. Flows. The schooling which leads to higher education is long and selective. Higher education isthe final stage in a lengthy (13-year) education process which is characterized-in the name of quality-bya very high degree of selectivity. The effect of failures and rejections of potential students at the pre-university level is such that only one child in every 12 entering first year of primary school obtains his orher baccalaureat. Gross primary-school enrollment rates in excess of 100% drop to 43% in the secondarycycle and to 13% in higher education. This last figure is lower than in the group of comparable-incomecountries, especially the South Asian "models," and also lower than what is generally regarded as adequatefor the era of global competition. Technical education is poorly developed, possibilities of transfer fromone education stream to another are nonexistent, and all efforts are focused first on the hazardous passage tosecondary education and after that on the unlikely event of admittance to higher education. Instead ofcertifying that knowledge has been acquired, the examination system merely regulates access to thefollowing cycles. In particular, the baccalaureat, while it gives access to higher education, is not a diplomacertifying completion of a course of studies. With very few exceptions, students who fail the examinationcannot take advantage of their secondary schooling either to go on to higher education or to enter the jobmarket.
5. Although strictly rationed in practice. higher education is entering an era of mass pressure. It hasalready gone through a major growth process which, by replicating the pattern of specializations seen in thesecondary cycle, has mainly expanded the non-science streams. Despite all present obstacles, however, thesimple fact of demographic pressure has increased the number of enrollments in higher education verysignificantly, doubling it over 10 years and pushing it to 120,000 in 1996 (with girls making up 44% of thetotal). In higher education, which is 97% public, and where virtually all those (and only those) who
- vii -
successfully obtain their baccalaureat are to be found, the most crowded degree courses are the longer onesin general fields and in law and literature, a distribution different from that observed in countries againstwhich Tunisia must compete. This emphasis is the result of an iterative channeling process that assignsstudents strictly in accordance with availability of places and is still too little influenced by the needs of theeconomy. Efforts are under way to achieve a more strategically balanced distribution in favor of shortcycles, but the process is naturally a rather slow one and does not necessarily coincide with students'expectations.
6. The poor internal efficiency of higher education, particularly at the first-cycle stage. can be blamedon the centralized and not easily reversible channeling of students and on inadequate staffing. Selectiondoes not end with the baccalaureat. The first cycle of higher education, for instance, is burdened withrepeaters-in addition to the fact that it rejects many students. This double-edged internal inefficiencysuggests that, despite its severity, the baccalaureat has proven unable to select those young people bestsuited to university studies. It also means that the channeling system-however objective, and despite theunlikely possibility of subsequent re-channeling--does not make the best of existing potential for success.Furthermore, such inefficiencies seem to point to weaknesses in academic monitoring practices in highereducation.
7. Inputs. The drop in unit costs suggests that the student body may have increased in size to thedetriment of quality of service. Tunisia invests more-proportionately-in the education sector (5.6% ofGNP) than the majority of its neighbors, but less than they do in higher education (18% of sectorexpenditure). The country's choice appears to have been to build up the educational pyramid in stages,since the main budgetary effort in the sector was focused initially on basic education and has only recentlybeen redirected to the post-primary levels. These levels are now under the pressure of a population growthrate that was high until a short time ago (1.8% between 1989 and 1995, but 3.1% between 1980 and 1985).In the meantime, unit costs have declined (to a current figure of approximately US$2,000 a year), althoughit is not easy to say whether this is attributable to economies of scale and/or a disquieting loss of quality.
8. Use of teaching personnel is less than optimal. Teacher/student ratios (averaging 1:17 across allestablishments) vary greatly from one discipline to another. However, on average, they fall within themedian range observed in comparable countries and are not out of line with the pedagogic demands of thedifferent disciplines. On the other hand, statute-based teacher workloads are light, particularly at the higherlevels, which means that classroom obligations cannot be covered without massive recourse to overtime.All the same, despite a decline in real terms, faculty salaries are by far the highest in the public sector,thanks to a system of bonuses paid automatically and at the maximum allowable levels, regardless of actualperformance ratings or other factors they are supposed to reflect.
9. Transfers. Because targeting of the substantial funds appropriated for student aid is not sufficientlydiscriminating, these resources have little redistributive impact. Quality. pricing and administration ofassistance in kind, as well as selection and monitoring of financial aid recipients. are less than optimal. The42% of non-payroll resources the Ministry of Higher Education allocates for transfer expenditures does notappear to be achieving the expected goals of balanced distribution. In the case of assistance in kind, there isevidence of wastage and misapplication, whether such assistance is rationed (dormitory services) or not(cafeteria services). Financial aid, which is geared to parents' means, consists of scholarships or loans (thelatter introduced in 1987/88); in both instances, the effects of poor targeting are apparent, partly because ofthe questionable accuracy of non-wage-earner tax returns. The scholarship allocation system (whichbenefits 37% of students) does not ensure that the neediest are selected, despite the low income thresholdrequired for eligibility. The difficulties involved in keeping track of borrowers and loan repayments makes
- viii -
loan administration arrangements costly and undermines the goal of ensuring conditions of equal access forall students.
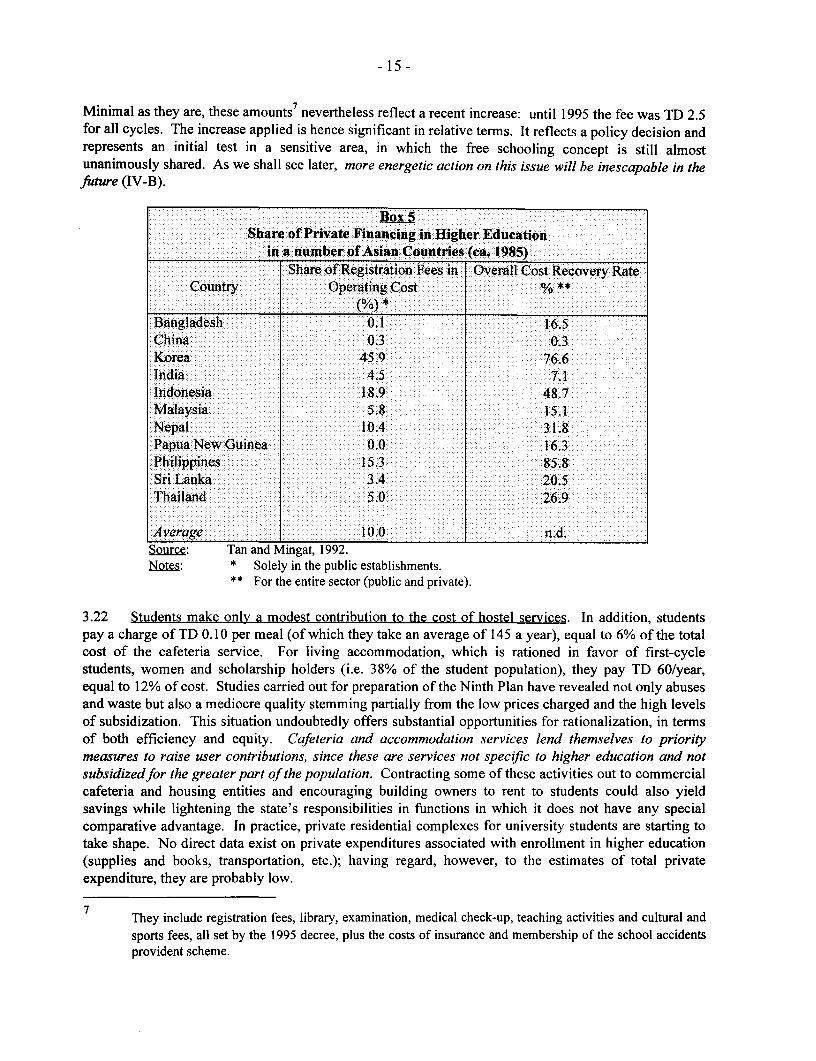
10. User contributions. Both academic services and board and lodging services (the latter entirelvunder government management. although a private lodging sector has recently emerged) are heavilysubsidized. with onlv marginal contributions from students. Even with the recent increase in registrationfees to TD 15 for first-cycle students, users will now be contributing less than 1% to the cost of theireducation. In the final analysis, a virtually free tuition system and largely ineffective assistancearrangements have combined to create a regressive pattern in which it is ultimately the highest-incomepopulation groups that benefit most from government efforts in favor of higher education.
11. Outputs. Lack of standardized information on the quality of education, and a scarcity of labormarket data, prevent evaluation of the external efficiency of university-level training. Lack of adequate datamakes it impossible to assess the experience and knowledge accumulated by the 13,000 students whograduate every year from Tunisia's higher education system, or to draw comparisons with graduates in othercountries. Hence, any reliable pronouncement on the system's pedagogic performance or product quality isruled out, although the high rate of success of Tunisian students pursuing third-cycle studies abroad is anencouraging sign. At the same time, the unreliable nature of available data on unemployment, on themethods graduates use to find employment, and on the duration of that employment is another obstacle toaccurate appraisal of the external efficiency of higher education, and will remain so until the EmploymentObservatory, now being set up, is in operation. Fragmentary information does indicate, however, thatgraduates of the system are well thought of by private sector employers and less likely to be unemployed.The present data gaps coincide with a period when the state guaranteed automatic equivalency betweenlevel of qualifications and level of employment, now a thing of the past. As far as macroeconomicperformance is concerned, the development of higher education will not by itself stimulate employment;employment creation is mostly determined by the regulatory environment and by economic growth, but bythe same token skilled manpower has to be available in order for growth to accelerate.
B. Educational and institutional factors
12. Organization of studies. Despite a series of refornms and an attempt to introduce a system oflearning modules. higher education remains inflexible, hierarchical and compartmentalized. A number oflegislative measures have been enacted to reform the organization of higher education study programs,including in particular the introduction of a module-based system designed to promote greater flexibility.However, implementation of these measures has led to a renewal, in fragmented form, of old programinsularities. It has revived a closed system in which there is no switching between academic paths and nopossibility of rerouting midway into a degree course, all of which exacerbates the consequences of mistakesmade at the time of the initial channeling/assignment process. New degree courses may be introduced (orexisting ones closed down) and curricula may be designed (or redesigned), but with minimal concern forchanges in labor market trends or in the demand for particular qualifications or skills. However, theMinistry of Higher Education has recently launched a new initiative aimed at adapting courses and curriculato these trends.
13. Institutional framework. Creation of universities as intermediary bodies between theircomponent faculties and schools and the central authorities has failed to settle the question ofresponsibilities within the higher education sector, which remains heavily centralized. The way resourcesare allocated to these faculties and schools (often referred to in this report as "establishments") is unrelatedto performance but instead is the outcome of negotiations in which the central authorities have the lastword. The decentralization process, which began with creation of the universities to provide an
- ix -
intermediate echelon between the central ministry and the 89 higher education and research establishments(EESRs) henceforth to be grouped together in one or other of the six universities, has been only partiallycompleted. The criteria by which responsibilities are to be assigned among the three echelons aresomewhat vague; for the moment, the universities, although in principle they oversee the establishments,actually have only a subsidiary administrative role in the teaching, financial and personnel arenas. TheMinistry of Higher Education is still the preeminent sector agent as regards the allocation of subsidies to theuniversities, which are negotiated directly. The autonomy of the establishments is in fact limited, in thesense that even when they successfully mobilize resources of their own to finance applied research they aresubject to prior control checks and are unable to use these resources as they see fit, since such funds must bedeployed according to distribution requirements set by law.
14. The preference given to research over teaching in the university faculty incentive system. incombination with a lack of educator training and systematic performance evaluation, has had adverseeffects on the quality of instruction. Operating under a statute that differs from the regular civil servicerules and regulations in certain respects, full-time teachers in the higher education sector have a dualfunction: to teach and to conduct research. In actual practice, their hiring, tenure and promotions dependmainly on their research activities and only marginally on their teaching and tutoring performance.However, the actual possibilities for research are limited, either for lack of resources (at all echelons), lackof incentive (in the case of senior faculty), or heavy involvement in teaching and tutoring activities (in thecase of junior faculty). The results are: little prospect of promotion, a flattening of the career pyramid, ascarcity of level A teachers (at least in certain disciplines and in the provincial universities), andincreasingly heavy recourse to contract teachers who do not always offer adequate guarantees of quality.The lack of pedagogical training for faculty, and of systematic evaluation of their performance, threatensthe quality of instruction provided.
15. Relations with the outside world. Initiatives to organize activities focused on the surroundingworld. especially research projects with partners in the production sector, are thwarted not only by the factthat the establishments lack control over their "own resources" but also by the reluctance of a still nervousprivate sector to participate. Research performance at the university level is undermined by the fact thatscattered small teams work in isolation from one another, by the realities of the teaching profession, and bythe excessive supervision to which the hardly independent establishments are subject. The end result is thatthe higher education sector receives few research commissions from local businesses, which still constituteonly a small group, are often small-scale and perhaps traditional, and have not always realized theimportance of research and development in achieving those advances which the Government advocates tobring the Tunisian economy up to speed with Europe and the rest of the world. Other types of exchangesbetween the sector and its surrounding environment-release of professionals by the private sector toprovide specialized teaching, participation in university entities, student traineeships with business firms,etc.-are still not widespread.
16. Private sector. The historical context being what it is. the lack of any clear and incentive legalframework explains whv the private sector still plays only a limited role in higher education, despite evidentsigns of effective demand. The private higher education sector is still in its infancy and limited to certainfields of study, but it has been left to evolve in a legal void. This situation does not help to promote whatwould otherwise be its "natural" development, considering the number of potential students being rejectedby the public tertiary system and the growing need for both educational and financial diversification. Thesuccess of Tunisia's main private university and the ease with which its graduates appear to findemployment point to the existence of effective demand from households and expectations on the part of thelabor market. However, the draft law now in preparation should provide the sector with the legal securityessential to its development.
m. Recommendations for the Future
17. Tunisia is entering a phase of its history marked by increasingly radical and rapid changes. Itscloser links with the European Union and efforts to become part of the global economy require expandedinvestment in developing both the potential and quality of its human capital. The pressure to become partof the international market not only leaves no other choice but also imposes a quest for greatercompetitiveness. In parallel fashion, higher education too is entering a transitional phase, which must becompleted successfully. Tunisia is not alone in this: many countries have had to face-and in variousregions of the world are still facing-the same economic exigencies and accompanying expansion of highereducation. Fundamental national specifics aside, there are lessons to be drawn from these experiences,which tend to demonstrate that the key requirement in higher education at the present time is for a newapproach.
18. With the appearance of larger cohorts of students, the problems identified will become much moreacute: the institutional framework supporting higher education threatens to founder under the weight ofmass demand and of financing mechanisms incapable of covering the cost of responding to this demand.These numerous and widely differing problems will require "two-tier treatment" geared to circumstancesand to reactions to the treatment itself. A wide range of measures will be needed to ensure growth that iseducationally sound and financially viable. This report presents a list of options which coincide, on anumber of points, with the recommendations made by the Plan committees, and which, on others,correspond to actions already taken by the Government. These options are designed to reawaken theenthusiasm of players-students, faculty, administrators-for their roles in higher education, and are builtaround the principles of flexibility, diversification, accountability, and evaluation.
19. Decompartmentalize academic paths and reduce dropout rates-by allowing students to makechanges during their university career, creating bridges between disciplines and authorizing course shifts.As a result, channeling/assignment would no longer be viewed as an unappealable sentence, and positivecurriculum adjustments would be possible. In addition, the student failure rate would be reduced to aminimum, leading not only to a radical cut in the number of repeaters but also to official recognition of theacademic achievements of students who drop out of higher education before completing their course ofstudies. Modules and credit systems are proven means of achieving such objectives-means that alreadyexist in Tunisia, although they need to be reformulated and systematized. Changes of discipline andtransfers between educational institutions will help lower repeater rates, although better supervision willalso be needed if a system prone to produce failures is to be replaced by one that facilitates successes. Atthe same time, modernization and adaptation of study program content will be unavoidable, an issue onwhich expert task forces are currently working.
20. Increase institutional responsibility for allocating and administering resources. Expansion ofthe higher education system will make greater decentralization of decision-making inevitable. In theprocess, it will force the central sector authorities to reduce their involvement in university administration,to devote more attention to their incentive, promotional and arbitration functions, and to strengthen theirprogramming capabilities. In addition, the division of tasks between universities and establishments shouldbe reconfigured. This will undoubtedly involve reinforcing the role of the universities to ensure betteroverall sector functioning. The chief steps here would be to eliminate duplications of effort and paralleldecision networks, to shorten spending approval processes, and to foster cooperation. The first area inwhich universities could be given greater responsibilities is student admissions and mobilization of publicfunds. A threefold approach is advocated: (i) the establishments would be authorized to adjust access to thedifferent study programs to reflect demand; (ii) information would be assembled on each establishment's
- xl -
performance in terms of intrinsic quality of instruction and success on the employment market; and (iii)funding allocation formulas would take account of both inputs and performance. Resource allocationformulas would provide a powerful tool for encouraging the establishments to take initiatives, for vestingsystem administrators with real responsibility, and in fact for regulating the system as a whole. However, itis critically important that these formulas be selected with care.
21. The establishments would be responsible for their own hiring policies (a situation that would notrule out adjustments and realignments). They would also make their own spending decisions, operating freeof prior checks and controls in administering their resources in the form of public funds and the increasedstudent contributions they would be receiving directly. The same principle would apply, and with all themore reason, in the case of resources they themselves generated, whether by leasing their facilities,providing teaching services for a range of clients, or earning fees on research contracts. They would also bemore directly involved in the deployment and promotion of teaching personnel, even if the principle ofnational certification remained in force. Introduction of permanent arrangements for evaluating theirperformance would be an essential corollary, and would enhance the credibility of the sector. Thesemeasures would undoubtedly lead to greater diversification among the establishments, and even to theirbeing ranked. Although a tacit ranking exists at present, it would become more transparent and thussounder. Finally, their legal status could possibly be modified.
22. Encourage participation by the private sector to promote a broader choice of services. Thiswould require the state to give up the de facto monopoly it continues to exercise in higher education.Demographic growth, the need to make choice a possibility, and the aspirations of the many potentialstudents rejected by the public system will continue to fuel the demand for private sector services. There isno reason to thwart this demand, especially when the official sector itself looks likely to be overwhelmed bythe same pressures. However, the domestic private sector will never have room and opportunity to developuntil a more dispassionate approach can be adopted toward this issue. This will come about if the draft lawnow in preparation lays down clear rules and regulations governing legal status, financing arrangements,hiring practices, teaching obligations, and systems of equivalencies or accreditation.
23. Open up faculty career development opportunities; upgrade and evaluate the teachingfunction. In order to meet its considerable need for qualified teachers, the higher education sector musttake action on several fronts simultaneously. It would be advisable, first of all, to dissociate teachingobligations from research obligations. This would allow recognition that research obligations are notessential in all cycles, or always feasible, or necessarily more admirable. For this to occur, teaching abilitywould have to be considered a career requirement and made the object of specific training (thefundamentals initially, followed by continuing courses). Several solutions are possible: the simplest wouldbe to systematize the current recourse to secondary-school teachers [agreges] (who are highly qualified),particularly for the first cycle and for some second-cycle teaching work, while increasing the weight givento teaching activities in performance evaluation/promotion reviews (a policy originally introduced in 1995in connection with the hiring of lecturers [maitres de confirences]. Another effective solution-with onlyminimum side effects-would be to offer a choice between two tracks in the same career path, eitherteacher or teacher-researcher, with clearly differentiated pedagogic obligations (instruction, but also hoursfor consultation, advice and tutoring). Choices could be exercised for limited periods, allowing alternationbetween the two areas. Steps could be taken to restore the original function of the bonus system by using itas a means of recognizing the value of teaching. One condition for success here would be the introductionof a transparent and objective evaluation procedure carried out through appropriately organized structures,an initiative that would involve a greater degree of decentralization in personnel management. At the sametime, distance learning, making use of the newest communications technologies, should be systematicallyencouraged.
- xii -
24. Take advantage of expansion to experiment with new types of university institution. Toimprove the internal efficiency of higher education, it will be necessary to develop short cycles and reformfirst cycles, by improving staffing ratios, setting up "common core" programs in the major disciplines, andredefining course curricula and diplomas to provide graduates with qualifications relevant to the job market.Expert task forces are already studying these approaches. This report suggests going even farther, by
gradually setting up specialized establishments to provide first-cycle instruction and absorb the new cohortsof students. The mission of these new establishments-of the "college," "pre-university institute" or"university-preparatory" type-would be to round out candidates' secondary schooling, give careerguidance, prepare some of them for the job market and encourage others to pursue full-scale universitystudies in existing conventional establishments.
25. The institutional changes suggested above would make it possible to respond simultaneously toseveral of the structural challenges identified, and to mitigate the pressure expected to build up on thehigher education sector, by:
(i) improving internal effectiveness and moderating the rigid separations between degreecourses. The colleges would provide a transition phase. By orienting and screeningstudents for possible university studies, they would eliminate the causes of the presenthigh repeater rates. Open to all holders of the baccalaureat, they would provideeducation of a modular type, with a particular focus on multipurpose courses, leading toaward of a special diploma distinct from the certificate giving access to second-cyclestudies.
(ii) separating teaching and research. Relieved of the obligation to engage in research,teachers in the colleges would be in a position to devote themselves exclusively to theireducational responsibilities, on the basis of which their performance would be evaluatedand their remuneration set. Students would have the benefit of much closer monitoring,which should lead to a decline in the number of dropouts. Teachers working towarduniversity degrees would devote more of their time to research, which would beconcentrated in a smaller number of better-equipped centers.
(iii) encouraging autonomy. These new establishments would provide an opportunity to testformulas for vesting them with greater independence and responsibility. Testing wouldfocus on public resource allocation procedures and funding administration methods.
26. Unit operating costs per student in such colleges would be lower than in existing first-cycleestablishments, since they would not need any research infrastructure, would use their teaching staff moreeffectively, and would reduce repeater rates. Their introduction would clearly pose many questions-forinstance, on linkages between the two types of establishment, and arrangements for the transition period.However, the example set by the Higher Technical Education Institutes (ISETs) is clear evidence of theability of the Tunisian higher education system to launch and manage new structures.
27. Ensure that expansion is financially viable. Given the projected increase in enrollments, thepresent financial structure of the higher education sector threatens to produce a deadlock before long. Intheory, there are several ways such a situation could be avoided, all of which presuppose strong economicgrowth (6% per annum) and a proportional increase in government appropriations for higher education. Anadditional requirement is an improvement in sector internal efficiency, but this will take time. A necessarypart of the process will be to utilize the potential represented by the present low statute-based workloads of
- xiii -
faculty members, which offer the possibility of major savings. But it will be difficult to cut costs further(the unit figure has already been lowered substantially) without running the risk of a dangerous deteriorationin quality, already being felt in some university departments. Alternative sources of financing will thus benecessary, particularly outside the public sector. However, even if the private sector grew at an annual rateof 15% it would not provide the means of eliminating the financial deficit.
28. In the final analysis, only user contributions can ensure the sustainability of the higher educationsector. It would be logical to begin with meal and dormitory services, which are not directly associatedwith tuition, something the great majority of users have to finance themselves. However, this type ofmeasure would still not close the gap, and student participation in covering education costs would inevitablyfollow. The student aid system would then obviously have to be expanded and retargeted, particularly itsloan and scholarship provisions, although care would be needed to ensure that inability to pay did not resultin exclusion from higher education. As a practical matter, a package of measures would have to beintroduced to cover the deficit.
29. Selection, sequencing and application of the measures. The technical and financial feasibility ofthe options proposed here remain to be assessed, and such issues as how they are to be combined, whatsequence they are to follow, and whether they are politically feasible still have to be resolved by theTunisian authorities. Whatever final plan is decided on, it will need to be the subject of a promotioncampaign, and its implementation should be carefully evaluated.
I. INTRODUCTION
1.1 Higher education in Tunisia is abundantly documented. Knowledge of the sector andunderstanding of the way it functions and of its problems is also well developed. This is probably explainedby the status accorded to an institution that is the crown of the entire educational structure in a countrywhere knowledge and culture have reigned as national values for centuries. It is no doubt also connected,more recently, with the developing awareness of the new role that higher education is called on to play inthe future of the modem Tunisia and the process of "bringing it up to speed."' A third factor is theemergence of the difficulties being experienced by a sector undergoing rapid expansion, difficulties thatcould well thwart the ambitions reposed in it.
1.2 The priority status of higher education is recognized in the preparatory work on the Ninth Plan. Forits part, the World Bank, whose partnership with Tunisia dates back more than 30 years, is currentlyengaged in a dialogue with the Government concerning higher education. The present report is a product ofthat dialogue. It does not aspire to be exhaustive and seeks primarily to complement the work done inTunisia itself. The report accordingly begins with an overview of the current situation of higher educationand seeks to shed special light on some of the problems that could well jeopardize its future.
1.3 In this way, the analysis that follows forms a natural component of extension of the Report of theSectoral Commission on Higher Education (Commission Sectorielle Chargee de l'EnseignementSuperieur), prepared for the purposes of the Ninth Plan under the responsibility of the Ministry of HigherEducation (MES), and relies greatly on the observations and conclusions of that very comprehensive report(MES 1996a). The analysis could well serve as a platform for discussion concerning a new Bank project insupport of higher education in Tunisia. A number of points are therefore left for more detailed, moreoperationally-oriented treatment later, which could take place as part of the process of the preparation ofthat project.
1.4 The report will examine the following topics:
(a) the economic and sectoral environment;(b) the "production function" of higher education;(c) the institutional and economic setting;(d) the needed resources to cope with the inevitable expansion.
II. ECONOMIC AND SECTORAL FRAMEWORK
2.1 Of the 21 strategic studies commissioned as part of preparation of the Ninth Plan, one (study no. 20,on education financing) deals widely with higher education while two others (no. I1, on Vocational Skillsand Education and Training Arrangements, and no. 12, on Innovation, Technology and Research) cover thatsubsector in part. This reflects the central place occupied by higher education in the country's concerns.
According to the Ministry of Industry, the agency responsible for implementing it, the process of bringingthe country up to speed (Programme de Mise a Niveau) "comprises a series of actions, addressed tobusiness and its environment, designed to enable the productive system to adjust to the requirements of thenew international setting." Started in 1996, the program is aimed primarily at bringing Tunisia up to thelevel of the technological and competitiveness requirements of the European Union.
-2 -
Having banked for a long time now on the build-up of human capital, and pursuing a deliberate policy ofopen growth and use of skilled labor, Tunisia must inevitably face up to the question of the future of itshigher education in charting its medium-term development path. This is not to suggest that this highereducation is currently beset by irreparable ills--the situation continues to be on the favorable side, andcomparisons with neighboring countries are flattering. However, the circumstances that have presided overrecent developments are undergoing profound change and failure to recognize this could well lead--at best--to a stalemate.
A. Macroeconomic Setting
2.2 The economic setting is broadly favorable, and Tunisia is frequently cited, within and outside theregion, as an example of successful transition between a state-controlled economy and a market-orientedeconomy. Macroeconomic adjustment has been well handled (inflation has been brought under control, thebudget deficit reduced and the debt burden trimmed); a start has been made on government divestiture;liberalization encompasses prices, trade, local and foreign investment and, to a less degree, the labor marketand the banking and financial sectors; opening up to the European and world economies is proceedingapace, and GNP has grown steadily since the beginning of the 1990s (at between 2.6 and 8% a year).These advances have not been achieved at the cost of the social sectors, which on the contrary have alsorealized spectacular gains: first, average income has risen, while its dispersion has been narrowing, and thenumber of poor has been greatly reduced; second, the health and education coverage indicators haveimproved substantially. This progress on the twin economic and social fronts has been facilitated by astrong, clear and continuous political commitment.
2.3 Continuation of the efforts to promote an efficient economy alongside effective social services andequitable protection mechanisms will be indispensable for Tunisia to take up the new, already loomingchallenges. As change in the rest of the world is accelerating, the country is going to have to buckle downto a process of continuous adaptation. Bringing the country up to speed will be a long-haul process;narrowing the gap with the European Union will entail costs before it produces gains. Private initiative andinvestment remain weak and the incentives to get them moving inadequate. Decentralization has not yetrun its course. The shrinking of civil service recruitment could well sharpen the labor market tensions, justwhen labor productivity and competitiveness need to improve. A bold human resources policy, particularlyin higher education, will help to strengthen the economic gains posted and cement social cohesion.
B. Sectoral Setting
2.4 In terms both of enrollment and of teaching content and quality, higher education is dependent on along process which shapes primary and secondary education. In counterpart, secondary education dependson the universities to supply it with teachers. This situation calls for a rapid overview of basic andsecondary education, especially since these subsectors are themselves undergoing change: an in-depthreform was launched in 1989, and its phased implementation is still ongoing. At the primary/secondarylevels, the system is structured in accordance with a 9/4 sequence which makes it abnormally long (Annex1).
2.5 Good enrollment performance. With net enrollment rates exceeding 96%, Tunisia is close touniversal primary schooling and leads the Middle East and North Africa (MENA) countries. The structure
2 The main problems affecting primary and secondary education, and the recommended solutions, aresummarized in a strategy paper which is due to appear very soon (World Bank 1 996a).
of population growth is already having repercussions on the primary-age classes, whose enrollments arebeginning to fall. In secondary education, with a gross registration rate of 52% (1994), Tunisia occupies amiddle rank in the MENA reference group and in the emerging countries group (43% in Indonesia and 60%in Malaysia) but lags behind the more dynamic Southeast Asian countries (Annex 2), where the rates rangefrom 70 to 98%. Concerning enrollment of girls, equality has been practically achieved in primaryeducation and is well advanced at the secondary level, where girls lag only three percentage points behindthe national average enrollment rate. The gender gap persists in adult illiteracy, with averages of 33%overall but 45% for women. While this gap undoubtedly has a generational aspect, it has neverthelesscontinued--and this is what makes it serious--to be sustained by dropouts from the present school system.
Marked selectivity
2.6 Failure is in fact the main method of flow regulation in pre-university education. For 1994/95,repeater rates are of the order of 13-17% in basic and 21% in secondary education, with dropout rates of 5%and 12%, respectively. Applied from the first basic cycle, selection stiffens at transition to the second cycle(the 6th-7th year promotion rate is barely 60%) and continues through secondary school, culminating atthe end of the latter with a high-school graduation (baccalaurwat) success rate of only 32% on average and42% in the public sector (Solaux 1996).
2.7 Financial waste. defeat of pedagogic purposes and social exclusion are the counterparts of theselosses, whose only justification (in part illusory) is maintenance of quality. Repeating (and dropping out)absorb human and financial resources and generate incremental costs that have to be funded at the cost ofother investments. The large volume of repeaters helps to overload classrooms and clog the dynamics ofthe teaching process. Finally, school failure and rejection are often forerunners to social exclusion,especially in an environment in which the school is perceived as the main path to social mobility. Theinstitution of the basic education completion examination (EFEB) in 1998 will not in itself suffice toremedy a phenomenon that seriously impairs the efficiency of the system if the other bottlenecks are notalso alleviated. The causes of the losses--still poorly known--merit in-depth examination; such a study hasjust been started, with the Bank's cooperation.
2.8 The sharp selectivity in basic and secondarv education crystallizes around four stages: (i) thecurrent 6th-7th transition, at the end of the first basic cycle; (ii) the EFEB , which from 1998 will mark theend both of the second basic cycle and of compulsory education and will govern the separation between thecontinued long general studies and short vocational education streams; (iii) the I Ith-12th transition, whichat the end of the first secondary cycle (common stream) determines channeling into the various coursesleading to the baccalaureat, and finally (iv) the baccalaureat itself, at the end of high school, opening thedoor directly to higher education (table 2.1).
-4 -
Table 2.1 Selectivity in public primary and secondary education (1994/95)
Level/Cycle Years Promotion Repeating Dropout(%) (%) (%)
Source: Based on data from the Ministry of Education.Notes: The figures in bold print refer to the four stages referred to in the previous
paragraph.(*) The future EFEB will be located at this level.
2.9 Selection is tending to shift to increasingly higher levels of the school system; the new EFEBwill gradually replace the 6th-7th bar, while the latter will cease to be watertight. This encouraging trendreflects the determination to combat premature exit from the system. Already, whereas the rate ofadmission from the 6th to the 7th year rose from 26 to 90% between 1979 and 1995, the baccalaureatsuccess rate fell, from 52 to 32%. These phased selection devices relieve higher education ofresponsibility for regulating the overall level of student flows and require it solely to see to their internalrouting. Opening the successive control gates that mark out the schooling path, even to a limited degree,will be reflected in increased pressure on the secondary education final cycles and, ultimately, on highereducation (see chapter VI).
2.10 A total of 1,878,000 pupils were enrolled in primary education in 1995/96, of whom 418,000(22%) for the second cycle. Of these, 188,000 pupils left, 52% of them without a diploma. In that yearsecondary education registered 308,000 pupils, producing 28,000 high-school graduates (bacheliers) atthe same time as it lost 37,000 pupils by dropout. In private education, the picture varies according toeducation level: marginal in primary, where it accounts for only 0.6% of enrollment, it serves as asecond chance channel for 10% of secondary education pupils.
2.11 Vocational training. Essentially under the supervisory jurisdiction of the Ministry ofVocational Training and Employment (MFPE), vocational training. which reaches only a smallpopulation (24,000 students), has an ambiguous role falling between recovery of persons excluded from
- 5 -
general education and commitment to a true, complete course of training that imparts skills and leads to adiploma. Primarily in order to recover some of the 98,000 children excluded from primary and the37,000 excluded from secondary school, vocational training tends rather to be used--tardily andimperfectly--to resolve school failure problems and is hardly capable of ensuring production of theoperational and value-enhancing know-how that the economy needs.
2.12 On that point, a recent MFPE study (study no. I 1) finds that a majority of businesses undergoingreconstruction are experiencing difficulty in finding skilled labor. Yet instead of focusing essentially onresolving this difficulty, vocational training serves in large part as a refuge for persons rejected by thetraditional school. This skewing of its function stems from an excessively fragmented view of theeducation system. It amounts to making one link in the system shoulder a responsibility that bears littlerelation to its natural function. More serious, it contaminates the latter by pinning on it the dismissivelabel of "training of last resort". Finally, vocational training does not allow those for whom it constitutestheir sole stock of learning to go on later to higher-level studies: blocking as it does any educationalfuture, it is not surprisingly viewed as a siding into which students can be shunted.
2.13 In the last analysis, the total interdependence between, on the one hand. all education levels(primary/secondary) and all education types (general/technical/vocational) and. on the other, highereducation bears an important message: designing an education system capable of facing up to theeconomic and social challenges of the future demands a global approach. In the developed world, thereare a large number of particularly dynamic countries (Australia, for example) where the barriers betweentypes and levels of education are tending to become more and more blurred. In concrete terms, thismeans that in Tunisia, where supervisory authority in the education sector is divided among threeministries, those ministries need to cooperate extremely closely and to abandon their practice of "passingthe buck" to each other.
III. CURRENT SITUATION OF HIGHER EDUCATION
A. Enrollment
Flow levels, trends and distribution
3.1 In the last university year a total of 113,000 students were enrolled in Tunisia's public highereducation system, comprising six universities (four of them in Tunis), the Higher Teacher TrainingInstitutes (Instituts Superieurs de Formation des Maitres--ISFMs) and the Higher Technical EducationInstitutes (Instituts Supe'rieurs d'Enseignement Technologique--ISETs) and a number of schools andinstitutes. This enrollment figure includes both the students enrolled in the 67 establishments under thedirect supervision of the Ministry of Higher Education (MES) and those (just under 7%) belonging to the 22establishments administered by other ministries (under "joint responsibility" arrangements). In addition,some 3,000 students are enrolled in private establishments. To be able to assess the relative importance ofthese enrollment complements, we need to review their evolution, refer them to the pertinent age tranchesand compare them with the figures for "comparable" countries; it will also be helpful to analyze their
composition and finally to track the flows they generate.
3.2 Despite a sharp rise in enrollments. tuition fees continue to be relatively low. From a studentpopulation of barely 10,000 in 1970, higher education in Tunisia slowly began to gain strength, with anannual growth rate of 3% up to 1985/86, when it still attracted only 42,000 students. The ensuing period
- 6 -
saw the creation of new universities, and enrollment soared, growing at an annual rate of 11% between1986/87 and 1995/96 and hence doubling over the last six years, reflecting the improvement in the internaloutput of the education system and, more particularly, the sharp rise in the number of high school graduates(bacheliers) posted in the early 1980s. This evolution is reflected in the gross enrollment rates,3 which rosefrom 5% in 1980 to 11% in 1993 (Annex 3). As a result, Tunisia achieved parity with Algeria and Morocco(11% and 10%, respectively) but continued to lag behind the other MENA countries, the lower middleincome countries (weighted average rate 24%), neighboring countries of southern Europe: Portugal (23%)and Spain (41%), and even Israel (35%). In light of this situation, combined with the thrust coming fromsecondary education, the observed trend can be expected not just to continue but to intensify (box 1).Although the overall enrollment rate for women is still relatively modest, they already account for 44% ofthe total student population, a fact that makes Tunisia a model for the region.
EntroltmentROates by Levelt0 International ConparisonsComntr Primar SeCondary HIghe
Averag 9462 9 1Source: World Bank, 1996b.(a) Source: World Bank, 1996c
3.3 The classical disciplines continue to be predominant. More than one student in two is enrolled inthe arts, law and economics faculties. Only one fourth of enrollment is in the scientific and technicalstreams and 10% in medicine and biology, with the remaining 5% divided between agricultural sciencesand teacher training. This indicates a skew against scientific and technical education which hasrepercussions on the channeling that takes place in the 1 Ith year, to which has to be added that effectedin the first year of university. This imbalance is out of line with the efforts being made to bring thecountry up to speed and also with what is happening in the more advanced countries: in the EUcountries, the proportion of first-cycle graduates accounted for by the scientific and technical disciplines
The net rates are not very significant, owing to the dispersion of the students over the age curve.
-7 -
is at least 32% (Austria) and rises to 60% and beyond (Belgium and Germany);4 a similar trend is notedin the new industrialized countries (Chile, Korea). In parallel, the figures show excessive growth ineducation courses of average duration (4 years) and long duration (5-7 years), in which 72% and 18%,respectively of the students are concentrated, to the detriment of the short vocational training streams (2-3 years), with only 10% of the students (MEN/MES 1996). The combination of these two skews issymptomatic of a rigid, upward-looking education system geared to self-perpetuation. The reforminitiated with inter alia creation of the ISETs, seeks to create this openness and its results are highlypromising and greatly appreciated in higher education circles. Yet as the public authorities have come torealize, engineers/technicians and managers continue to represent a dangerously low minority ofgraduates, whereas these are two priority education categories in most of the countries pursuingaggressive economic policies.
Internal efficiency
3.4 Repeaters and drop-outs represent a heavy burden. Annual university output was 13,000graduates in 1994/95. This signifies an average success rate of 62%, around which there is a widedispersion, ranging from a low of 35% (Tunis I, Arts) to highs of 95% (ISET) and 98% (ISFM).University education thus harbors 3,800 unsuccessful students each year. Above all, however, it puts upwith a repeaters population which accounts for 31% of total enrollment in the large faculties andinstitutes (Annex 4). The streams with the highest enrollment also those with the heaviest losses: themain sources of dropouts are the law, economics and management and arts faculties; the arts facultiesalso account for the main contingents of repeaters (49% of enrollment at Tunis I, 47% at Sousse and51% at Sfax). Overall, one student in two quits the circuit during the first cycle and only one in tengraduates on time. The skimming-off of the secondary. the severity of the baccalaureat examination andthe first-year channeling of students hence do not suffice for this purpose: the system still rejects somechosen students and compels others to excessively prolong their stay at university, which they tend totackle tardily. as a result of the long duration and low internal efficiency of pre-university education.
3.5 Despite the progress accomplished recently, a source of inefficiency remains that needs to bestudied seriously and without delay. It is to the first cycle that attention needs to be given since itabsorbs the growing flows of students certified by the baccalaureat and that suffers the overcrowdingmost detrimental to the efficiency of the teaching and the quality of the results. It is in this buffer cyclethat, in the last analysis, there occurs, in an indirect and perverse manner, the selection of the studentswho will ultimately be called on to continue university education proper and be brought up to standard ifneed be. This cycle hence produces a large number of rejects who have not merely failed to obtainvalidation of their university education but also carry the stigma of failure. One avenue worth exploringwould be to make the first cycle play this role offirst, preparatory year of university education directlyand transparently and apply institutional, financial and pedagogic rules of the game (with specialistteachers) specific to it, thereby enabling it to perform the preparation and selection functions openly andefficiently, while validating the training received. This would allow the university to devote itself to itstrue role, including research, and cease to be parasitized by activities in which it does not excel and thatabsorb the energy of its teaching staff and a large part of its resources. In any case, the situationwarrants at least that the first cycles receive special treatment through improvement of their teachingmethods, adjustments to their staffing ratio and curricula, and revision of their diplomas, to ensure theproduction ofjob market entrants who are appropriately qualified rather than tainted byfailure.
National Science Foundation, 1996.
-8 -
B. Resources
Public resources
3.6 Over the last twenty years Tunisia has devoted on average 5.3% of GNP to the education sectorand around 1% to the higher education subsector. This refers solely to public resources included in thestate budget. By way of indication, in 1992 higher education expenditure represented 0.9% of GNP inSpain and Portugal and 1.4% in Ireland (OECD 1995). In terms of public expenditure on education as aproportion of the state budget (including debt service), the ratios are 18% for the education sector as awhole and 3.8% for higher education alone (Strategic Study no. 20 and Jaoua 1995). Since no pertinentstandard exists, the important thing is to determine the evolution of these resources and how and for whatpurposes they are utilized. That is the purpose of this section.
3.7 Within the sector. efforts have addressed first of all the pre-university levels. In 1992 Tunisialed the other MENA countries and the majority of the Asian countries in terms of share of GNP devotedto the education sector as a whole (5.6%, against 5.3% for Morocco and 4.1% for Egypt). In terms ofshare of public education expenditure in the total budget, Tunisia also ranks well in the MENA region,on a par with Morocco (nearly 18%) and well ahead of Egypt (10%). The value of these comparisons isof course reduced by the fact that the budget burden varies from country to country; in this sense Tunisia,with a total budget representing 33% of GNP, occupies a middle rank between Colombia (15%) andEgypt (43%), two extreme countries in this regard. To assess Tunisia's international ranking in the caseof higher education, it is wiser to use the share allocated to higher education in the total education budget(box 2). In 1992 this share amounted to 36% in Egypt and 39% in Jordan but only 18.5% in Tunisia,which in this regard was closer to Iran (13%) and Morocco (16%). Here we have an indicator that,within an education sector that is globally well provided for, no priority is apparently accorded to highereducation. Each country stands at a particular point in the development of its education system: in thecase of Tunisia, the authorities have deliberately chosen to lay solid bases first at the primarv and then atthe secondary levels. It is on these bases that expansion of university education can now go forward.The vital question is whether public resources will suffice to finance this expansion.
i Public lucation and Hb igher EducationExpenbdituesInternaonlC pais
- Total ~~~~~~~~33.- 43.0 - 314264So~urce: World bank, 1996b(a) Source: Mingat, 1995(b) Source: World Bank, 1 996c
- 9 -
3.8 Evolution of resources. The trends over time (1972-94) indicate first of all that the share ofresources allocated to the education sector as a whole in the state budget (operating and investment) andthat of the resources accruing to higher education have been declining slowly and more or less in parallelsince the early 1970s (Annex 5). Moreover, looking only at operating expenditures, the ratio of highereducation to education sector expenditures has remained remarkably stable, around an average of 19.5%.for practically 25 years. In the case of investment expenditure this ratio shows much more irregular short-term movements, causing it to fluctuate between 27 and 47%, depending on the year, without any real trendbeing discernible. In both cases, the start of the decade marks an upward turn of the ratios: the share ofhigher education in the operating budget (excluding debt service) rose from 5.1 to 5.9% between 1988 and1995. Moreover, it is apparent that, taking into account the increase in Tunisia's state budget burden as apercentage of GNP (a gain of ten points between 1972 and 1974), the volumes of resources available for theeducation sector and the higher education subsector have risen substantially, in both cases doubling inconstant dinars between 1981 and 1994. We can hardly expect this increase to continue on a scale thatwould provide for expansion of the system (chapter V).
3.9 Public expenditure per student is already headed downward. For an accurate understanding of thesignificance of these figures, however, we need to examine them by reference to the clientele served. Ourfirst finding is that the current education budget has been continuously and regularly losing ground toenrollment, the gap widening faster beginning with the period 1985-87, which marks the upturn of theenrollment curve (Annex 6). This dual movement produces a declining trend in public current expenditureper unit served, i.e. in public (or fiscal) unit cost, from about TD 2,500 to TD 1,400 (constant dinars) overthe period 1987 to 1994 (graph 3.1). The data are inadequate to determine whether, however classical itmay be, this decline in the average annual unit cost of schooling reflects a growth in the institution'sefficiency or a deterioration in school physical and teaching conditions. Unit fiscal expenditure on highereducation in Tunisia, at about US$2,000, slightly exceeds that of the other MENA region countries(Morocco US$ 1,000, Jordan US$1,500) but represents less than one third of the average expenditure of theOECD countries (average US$7,940, Spain US$3,370, Ireland US$7,270). In terms of per capita GNP(135%), the effort is comparable to that of countries like Thailand (178%) or Jordan (128% but on the otherhand is far higher than that of the OECD countries (average 45%, Ireland 57%, Spain 29%). From anotherpoint of view, whereas it cost 9 times as much to educate a university student than a primary pupil inTunisia (and 39 times as much in India), the ratio was 1:4 in Korea and 1:2 in Spain (Annex 7). Thecomposition of expenditure undoubtedly plays a role in this; in particular, the relative size of transferexpenditures skews international comparisons of the ratios which, although useful for relativizing situations,do not suffice to answer the question.
- 10-
Graph 3.1Higher Education: Unit Cost/Enrollment Ratio
(1972-1994)
I6 e ,t _; Ci 0 000 ;=0 Hi EE \
140 0
3 1000i;X
I 00
200
0 1 0000 20000 0 0 4O 0 500 8DD / *a a 0 DDDDD
El.11. .It
3.10 The cost per graduate is boosted by the low internal efficiency. Unit expenditure is only a partialand static indicator which does not take into account the system's efficiency in "producing" its graduates:we also need to how much the latter cost. In a system characterized by repeaters and dropouts, this costdoes not come down simply to unit cost multiplied by theoretical number of years required to obtain adegree; it must also incorporate the incremental cost stemming from the education of students who neededto stay on in the system in order to obtain their degree and those who left it without graduating. By way ofillustration, in the human sciences faculties the incremental cost per graduate due to these losses is 165%.To this purely financial additional cost attributable to the poor internal return there have of course to beadded the qualitative losses, more difficult to quantify, attributable to the deterioration in workingconditions, which has long been recognized (cf. Experton 1988).
3.11 Dispersion by department or discipline. Looking only at the subsidizing of unit operating costs,we note a marked dispersion between disciplines: the differential between Tunis II University (technicalsciences and medicine), the best endowed university and the biggest user of equipment and material, andTunis III (law, economics and management), the least well endowed, is 1:3.5. Looking at the entireoperating budget (excluding joint-responsibility establishments) in 1996, we find a narrower differential(2.4) in public unit cost between the technical sciences (TD 3,530) and law and economics (TD 1,475). Thelarge share represented by salary expenditures helps explains this relatively narrow range.
3.12 Composition of the expenditure. The breakdown of the current higher education budget bycategories (Annex 8) gives an idea of the production function of higher education. It brings out two salientfacts: (i) salary costs account for over half the higher education budget (54%, a relatively low figure, wellbelow that found in the OECD countries--see Annex 9) and their budget share is rising, and (ii) of the non-salary portion of the budget, resources allocated to university services represent the largest item (54% ofthis category, i.e. 19% of the total budget). This leaves some 27% for academic, non-salary expenditures,within which subsidies allocated to and directly administered by the establishments account for 17% (Jaoua1995). These data provide several leads: (i) the key role of transfer expenditures, (ii) the importance ofsalary expenditures, and (iii) the relatively minimal role of expenditures controlled directly by theestablishments. The first of these leads has been amply explored in the Plan preparation studies (Ben Aiech1995 and Abdessalem 1995). The other two merit more thorough study and are discussed in greater detaillater in this report.
- I1 -
Weight and determination of salary expenditure
3.13 The factors that serve to determine these salary expenditures, particularly those relating to teachers,are of two kinds: quantity, and price. While the way in which the two factors are combined is undoubtedlyassessed primarily on a financial basis, the assessment ought in the final analysis to be based on pedagogicconsiderations and take account of input quality just as much as of the "final product." Unfortunately, fewdata are available from which to study this aspect of the question, either in order to compare studentperformance over time or to evaluate teacher performance (see later, IV-D).
3.14 A high but very variable and declining overall staffing ratio. Over the ten-year period 1985-95teaching staff grew at a lower annual rate (6.3%) than student enrollment (10.5%). As a result, theteacher/student rate deteriorated steadily from the mid-1980s, when it reached its minimum (barely 1:12),and currently exceeds 1:17. There is a striking dispersion in teacher/student ratios between disciplineswhich reflects two phenomena associated on the one hand with differences in teaching methods and on theother with different student numbers: they range from generous ratios for the agricultural sciences (1:6) andthe technical sciences (1:7), with their high teacher demand and low student numbers, to ratios fordisciplines that are both less "labor-intensive" and have much larger student populations, such as law,economics and management (1:33). Comparison with the emerging countries of Southeast Asia in the1980s shows that, on average, Tunisia is better placed in the area of public higher education than thosecountries were ten years ago (Annex 10).
3.15 Low statutory workloads. The relatively low staff complement in terms of numbers could havebeen expected to be offset by the combined effect of two factors: the quality of the teaching staff, and theintensity of their interaction with the students. The first factor is not favored by the systems of evaluationand promotion (see below, IV-D), while the second factor seems to be severely curtailed by the statutoryworkloads in effect. At the bottom of the scale, assistant lecturers, who are required to perform 13 hours ofpractical work a week (which can be reduced to 8 hours temporarily for thesis preparation), have little timeto spare for student monitoring; at the other extreme, lecturers and professors are required to provide only 4-1/2 course hours a week and have no particular incentive to take on tutorial activities. This distribution ofservices by hierarchical rank is not an optimum one and is overall weaker than the distribution observed inother countries (box 3). It could advantageously be replaced by an alternative system that woulddifferentiate among teachers according to whether they actually conduct research, devote themselvesexclusively to teaching or combine one of these two activities with administrative duties. It should at thevery least be corrected by the combination of a more demanding workload in terms of teaching hours forlecturers [maitres de conference] and professors, an overhaul of the presently unbalanced system ofpromotion criteria, a lengthening of the career path, and more systematic recourse to qualified secondaryschool teachers where it is not essential to have teacher/researchers.
- 12 -
We kly Program WorMloads in Higher Education:.I nternational Comparisons
TUNISIA1.
I. Assistants :13 hours of PWor 9 hours of SW] (with waiverpossiblew-limited to 3 for completion of thesis, reducingthe workload to 8 hours .of PW.or 5 hours of SW)
2. Assistantlecturers 12 hours of PW DO8 hours of SW
3. Lecturers and course Tprofessors 4.30 course hours
4,]Assistants} 4 hoursPW = Practical work ("travaux pratiques ")SW = Supervised work ("travaux diriges')
3.16 Teacher remuneration. Higher education teacher remuneration is the highest in the civil service.Bonuses account for the bulk of this remuneration: 5 salary as such accounts for only one fourth of it at
most. Average total annual remuneration thus ranges from TD 11,000 for an assistant to TD 18,500 for aprofessor, in both cases newly recruited. Estimating whether these are high amounts is a difficult (andsensitive) task owing to the lack of indisputable reference points: the private education sector is still tooembryonic to serve as a basis for comparison,6 and the data required to construct a true control group in thesector are lacking. This makes it necessary to stay with the public sector (Annex 11). In the first place,
6 As a general rule, in many countries, teachers are remunerated less well in the private sector than in the
public sector.
- 13 -
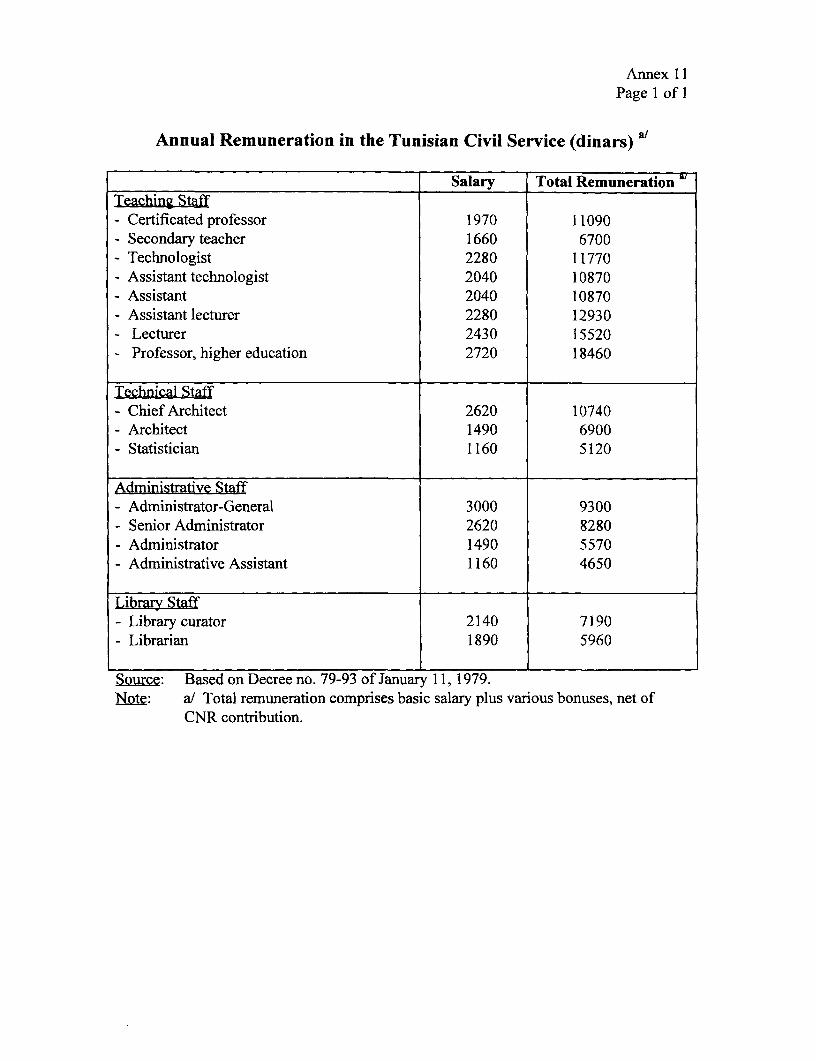
these remunerations have to be compared with the average of TD 1 1,100 received by a qualified secondaryschool teacher (who has a higher program workload). They also have to be compared with the salaries ofTunisian senior civil servants: TD 12,400 a year for a senior administrator (administrateur geinral) whohas attained the rank and performs the duties of a ministry director general (against TD 22,300 for aprofessor at the grade ceiling); TD 7,800 on average for an administrator-advisor (administrateur-conseiller) recruited, like the assistants, with a degree testifying to six years of higher studies. Thecomparison ought in theory to be weighted by the number of hours actually worked; in that case teachers ingrade A would be at an even clearer advantage in relation to their upper administration colleagues.
3.17 The salary profiles are not very finely drawn. either within grades or across the entire careerspectrum. In terms of actual remuneration, including bonuses, however, the gaps widen. Because of this,the (hypothetical) career paths of a "go-getter" who is rapidly promoted to professor and attains the peak ofhis/her career at age 45 and that of a teacher who is in less of a hurry and less ambitious and does not risebeyond the grade of assistant lecturer do not differ spectacularly: over his/her entire professional life thefirst teacher will accumulate total discounted income about 14% greater than the second teacher (box 4). Inthese circumstances, when internal promotion prospects are blocked for assistants and assistant lecturers, itis only natural to seek supplemental income sources outside.
0 Box 4Salary and Total Remuneration for two
Teaching Career Paths
23000 . .: ...
21000.
21000 - d j'- i
16000-
1800C0 --.:-j-.; .,-s--.jj-- *-b17020 -
E1 000 -. .-. ';.-
, 1t00-.......
e *W w -! . .... .. .. ... j.i. <,
10008X- - j.... .. ..-......, ,,S,
.000 . .0 ..2 000*
. ....00.
Age
3.18 The salary (including allowances) of a higher-education teacher in Tunisia represents between 6.6times (assistant) and 11.2 times (professor) per capita GNP. In order to arrive at orders of magnitude, wenote that in Indonesia in the 1980s this ratio stood at 5.7 for the entire teaching corps, across all categories.Comparison of the same ratios for secondary-school teacher salaries produces a similar result: 4.1 in
-14-
Tunisia (1995) and 3.2 in Indonesia, an average of 2.7 for Asia, and 2.5 in Portugal. To confirm theassumption that teachers tend to be better-off in Tunisia, we would need of course to take account of serviceobligations which, as we saw earlier, are on the light side by international standards. However, the questionneeds to be further refined by factoring in its time dimension. We then find that teachers' annualremuneration declined in real value between 1987 (index 100) and 1994 (index 91.5); this erosion ofpurchasing power is greater than the erosion suffered by teachers at the pre-university levels. In light of theobservations noted earlier, one would be tempted to interpret this development as a realignment.
3.19 The fact that many university staff engage in other remunerated activities is probably explainedmore by an abundance of free time than by the amount of the salary, even if the two reasons are mutuallyreinforcing. One type of supplementary activity consists of teaching over and above the compulsory servicehours but within the official university framework. A professor may receive overtime payment of TD320/year for one course hour a week, TD 240 for one hour of supervised work and TD 160 for one hour ofpractical work (for an assistant, the rates are 15% lower). In brief, increasing his/her workload by I hour aweek brings a professor a salary gain of 1.7%; doubling it gives him 9% of additional income. This lowreturn, combined with the availability of free time, makes the numerous accounts of additionalsupplementary activities outside the university administrative framework extremely plausible. For theestablishment. however, these supplemental hours constitute the oxygen without which the teaching systemwould be unable to function under the current statutory conditions (see chapter V, section B).
C. Financing
Financing sources
3.20 Accessible and practically free of cost to all who because they possess the baccalaureat areautomatically eligible to enroll in it, public higher education is financed almost entirely out of public funds.Putting aside the indirect costs associated with loss of earnings, the share of direct costs borne by the
families is less than 5% of the total cost of public higher education and represents about TD 100 a year.This is less than the contribution noted at the pre-university levels, as has been shown by study no. 20 (table3.1): whereas a year of higher education costs the state nine times as much as a year of primary school, forthe user the cost ratio is only 1:3.
Table 3.1 Comparison of Private and Public Costs, by Education Level (1990)
Private Cost Public Cost Social Cost Share of Private(TD) (TD) (TD) Cost (%)
Source: Based on MEN/MES, 1996--Report on first stage.
Users' contribution
3.21 The level of tuition cost recovery is very low. Enrollment fees, the sole means of cost recoveryfrom users, amount to TD 15/year for the first cycle (TD 20/year for the second and TD 61.5/year for thethird cycle), i.e. barely 1% of schooling cost. While this case is not an exceptional one, there are alsocountries where cost recovery is substantial, which shows that there is wide room for maneuver (box 5).
- 15 -
Minimal as they are, these amounts7 nevertheless reflect a recent increase: until 1995 the fee was TD 2.5for all cycles. The increase applied is hence significant in relative terms. It reflects a policy decision andrepresents an initial test in a sensitive area, in which the free schooling concept is still almostunanimously shared. As we shall see later, more energetic action on this issue will be inescapable in thefuture (IV-B).
Box 5Share of Private Financing in Higher Education
in a number of Asian Countries (ca. 1985)Share of Registration Fees in Overall Cost Recovery Rate
Average 10.0 n.d.Source: Tan and Mingat, 1992.Notes: * Solely in the public establishments.
* * For the entire sector (public and private).
3.22 Students make only a modest contribution to the cost of hostel services. In addition, studentspay a charge of TD 0.10 per meal (of which they take an average of 145 a year), equal to 6% of the totalcost of the cafeteria service. For living accommodation, which is rationed in favor of first-cyclestudents, women and scholarship holders (i.e. 38% of the student population), they pay TD 60/year,equal to 12% of cost. Studies carried out for preparation of the Ninth Plan have revealed not only abusesand waste but also a mediocre quality stemming partially from the low prices charged and the high levelsof subsidization. This situation undoubtedly offers substantial opportunities for rationalization, in termsof both efficiency and equity. Cafeteria and accommodation services lend themselves to prioritymeasures to raise user contributions, since these are services not specific to higher education and notsubsidizedfor the greater part of the population. Contracting some of these activities out to commercialcafeteria and housing entities and encouraging building owners to rent to students could also yieldsavings while lightening the state's responsibilities in functions in which it does not have any specialcomparative advantage. In practice, private residential complexes for university students are starting totake shape. No direct data exist on private expenditures associated with enrollment in higher education(supplies and books, transportation, etc.); having regard, however, to the estimates of total privateexpenditure, they are probably low.
They include registration fees, library, examination, medical check-up, teaching activities and cultural andsports fees, all set by the 1995 decree, plus the costs of insurance and membership of the school accidentsprovident scheme.
- 16-
Assistance
3.23 In addition to the non-discriminatory teaching and cafeteria service subsidies and the selectiveaccommodation subsidy, the state also compensates students on a non-personal basis for transportationexpenses (TD 44 per capita). Finally, the state provides selective direct assistance to certain students;since tuition is practically free of charge, this assistance in fact represents a public contribution to theiropportunity costs. The assistance is channeled through two instruments: scholarships, and loans. Bothscholarships and loans are administered by the National Social Services Office (Office National desOeuvres--ONO) through two "windows," each with its specific clientele. The distinction between themis based on the annual income of the applicant's parents: for incomes below TD 1,450 students areeligible for a scholarship, while below TD 4,200 they are channeled to the loans system.
3.24 Scholarships. In practice, there are over 40,000 scholarship students (37% of the studentpopulation, a lower proportion than that in neighboring countries). Although the income ceiling forscholarship eligibility is below the guaranteed inter-occupational minimum wage (SMIG) (of the order ofTD 1,550), the redistributive efficiency of the scholarships (the unit amount of which is TD 400/year) isdifficult to confirm since eligibility is based on parents' income returns. Thus, the distribution ofscholarships by father's socio-occupational category shows over-representation of the non-wage-earningcategories, for which the returns most need to be treated with caution (Ben Aiech, 1995). While thosewho effectively have the lowest incomes are not necessarily found in these categories, only a morethorough study can furnish a true picture. For lack of such a study we must adhere to the hypothesis thatunder current fiscal conditions the scholarships targeting method used leaves a margin of error thatundoubtedly penalizes salaried families.
3.25 Loans. The student loans system, instituted in 1987/88, currently reaches about 1,000 newstudents each year, i.e. less than 1% of the student population. These loans, for the same amount asscholarships and repayable over 10 years at a negative real interest rate (2.5%), are in great demand sinceonly one application in ten is accepted.8 Since eligibility is again based on tax returns, appraisal of loanapplications carries a priori the same risk of error as scholarships. The essential difficulty of the scheme,however, lies in recovery. Repayment of the loan, which is demandable from students who have found apermanent job, is monitored through the student's membership of a social security fund--automatic forwage-earners--and administered by the Ministry of Finance. Of the 800 first-generation borrowers, only350 could be traced and have begun to pay off their debts. The low recovery rate is attributable to twoseparate factors: some students have not found a permanent job and are therefore excused from repayingthe loan; others have a job but evade monitoring.9 The first situation is not a true case of repaymentdefault and forms part of the risk borne by the government. In the second case, however, the student is intheory liable to the penalties provided for in the ordinary regulations governing public debts; however,since it is not possible to distinguish between the two cases, the penalties are not applied. It thereforeseems that the necessary conditions for replacing scholarships by loans are not yet present. A number ofmeasures will need to be taken for them to be met. Across the world, many experiments have been tried(over 50 are known) in the widest possible variety of economic settings. The results are often moderate,particularly as regards loan recovery (box 6). Lessons can nevertheless be drawn from these
8 The nominal money market rate was 8.8% in 1994 (World Bank, 1995a).
The effective recovery rate is also affected by the administrative and program management costs and alsothe indirect subsidy involved in charging interest at below the market rate (cf. Albrecht & Ziderman 1993).
- 17 -
experiments--including the failed ones--as the basis for improving the efficiency and the equity of theprogram (Woodhall 1983 and 1990; Johnstone 1986; Colclough 1996).
3.26 In sum, the future of the assistance scheme can only be envisioned as part of an overall approachthat integrates the policy of user-charging for the various services provided or financed by the state with thefinancing constraints. It is not a matter of a single scheme but of several schemes that have to be supported(as was the case in Chile; cf. Castafieda 1986). The main underlying principle of an assistance policy is toensure that no student qualified to pursue a course of study is prevented from doing so by financialobstacles. From this point of view, the available courses of action would be based on combining (i) moresignificant cost recovery on the education side; (ii) adoption of a more elaborate, more diversified andmore discriminatory charging policy for ancillary services not directly education to teaching, the range ofwhich could advantageously be diversified and which could he contracted out to professionals; (iii)introduction of greater selectivity into the awarding of scholarships, with better targeting in favor of themost disadvantaged students; (iv) transfer of responsibility for managing the student loans scheme tobanking institutions with a direct interest in recouping the funds they have put up, and (v) narrowing thegap between loan terms and market conditions and improvement of the loan recovery mechanisms.
3.27 Summary of redistribution efforts. A balance sheet of net transfers on behalf of higher educationwould serve to identify who are the true winners (and losers) of the financial flows channeled to it.Accurate estimation of the resulting redistribution will need to take account of education costs,differentiated by disciplines. It should similarly include not only the current benefits enjoyed by the usersbut also the future benefits accruing to them in the form of incremental income attributable to the educationreceived. The exercise then takes on an intergenerational dimension which, owing to the inadequacy andunsuitability of the data available to deal with it, poses serious methodological problems and consequentlyrisks (Nelson 1977; Bowman, Millot, Schiffelbein 1986; Lemelin, Millot, Perrot 1989).
3.28 On the other hand, using a shortcut, we can estimate the budget transfer differentials by reference tocertain criteria that characterize households. This is what was done in one of the studies performed as partof preparation of the Ninth Plan (Oueslati 1995). This study, which is based on the 1990/91 household
- 18 -
consumption survey, reveals first of all that, overall, students from low-income families (defined as thosewith incomes below the guaranteed inter-occupational minimum wage (SMIG) are in the great minority:8% of the students came from such families, while 38% came from households with incomes five timeshigher than those of the SMIG families.'0
3.29 At the extremes. however, the fact of receiving an expensive education free of cost automaticallyresults in positive transfers in favor of the better-off population groups. Thus, whether we look atgeographic origin, residential milieu (urban/rural) or parents' social/income level, we systematically findthat the better-off families and those living closest to the urban centers tend to benefit most from highereducation and, conversely, that the most disadvantaged, least urbanized and geographically most remotefamilies benefit least (table 3.2). These findings contrast with those for the pre-university levels, wheretransfers are clearly progressive and tend to mitigate the income distribution inequalities. Here we have aclassic perverse effect of exclusively public financing, an effect which when factored in helps tip the scale infavor of cost recovery, combined with a soundly targeted assistance scheme.
Table 3.2 Average, Minimum and Maximum Budget Transfersvia Higher-Education Expenditures
(1990/91)Average Minimum Transfer Maximum Transfer
3.30 This deployment of human and financial resources has enabled the (public) sector to produce about13,000 graduates a year. A good half of these are produced by the Tunis universities, almost two thirds ofwhose graduates have master's degrees. Proportionally, the provincial universities graduate moretechnicians and engineers than their Tunis counterparts (table 3.3). In terms of ratio of total enrollment tonumber of graduates, the provincial and Tunis universities are on a par, at about 10:1. The enrollmentexplosion and the improvement in registration rates will have a positive impact only provided that the
In passing, the survey serves to establish that while children of senior professionals are undoubtedly over-represented in higher education (23% of total enrollment), their share is exceeded by children ofhouseholds whose head is not economically active (25%), a manifestly heterogeneous and misleadingcategory, which undoubtedly includes genuine retirees but also self-employed people of various kinds whoare very much economically active.
- 19-
graduates from the system bring incremental knowledge with them and hence that the quality of theeducation also tends to rise steadily. Unless potential employers perceive the new graduates as contributinga value added, as it were, the progress achieved in terms of access to higher education will be wiped out byincreased unemployment and a frustration shared by students and employers, equally disenchanted.
Table 3.3 Graduates Produced by Tunisian Universities (1995)Medical
Technicians Master's Engineers Professions Total
Tunis universities 1470 5410 530 330 7740
Center and Southuniversities 1220 2170 390 510 4290
Teacher TrainingInstitute 1250 1250
Total 3940 7580 920 840 13280 (a)
Source: Based on MES 1995/96.Note: (a) Plus 180 specialist degrees awarded by Tunis I and II.
3.31 Tailoring to market needs. Data are lacking from which to assess the quantitative and afortiori the qualitative match between these products and employers' requirements, and we are reducedat this stage to seeking disparate factors: in particular, recent data on unemployment by graduate levelare not available. The problems involved in measuring unemployment moreover suggest that it mightwell be generally overestimated (Rama 1996). It is evident from the 1989 National Population andEmployment Survey (ENPE) that 2% of unemployed persons had a higher education, compared with4.7% of the employed population (INS 1991); this datum needs to be further refined since over theperiod 1984-89 the proportion of employed higher-education graduates rose much more slowly than thatof unemployed graduates. Processing of the 1994 survey findings should reveal whether these trends arepersisting. Meanwhile, the Employment Promotion Office (OPE) points to three trends over the period1987-92: (i) a net fall in the proportion of skilled workers among job seekers, (ii) an (irregular) fall inthe share of skilled workers in job placements, and (iii) an increase in skilled worker positions inemployment supply (Annex 12). Assuming that the majority of workers classified as "skilled" arehigher-education graduates, the superposition of these three trends suggests that there are simultaneousgraduate deficits and surpluses, generating an unemployment that probably affects first-job seekers.Better labor market information is indispensable in order to throw light on these questions and enablethe higher education (and vocational training) establishments to target their activities more accurately.The Employment Observatory to be set up at the Ministry of Vocational Training and Employmentshould meet this need.
3.32 Education/salary relationship. The situation is no better with respect to data on salariesaccording to education level. This makes it impossible to estimate the output rate, which could furnish astatic indication of the market valuation of the training." In the civil service, salaries are administered
The most recent estimate is based on data that go back to 1980. At that time the private output rate inhigher education was estimated at 27%, against 13% for secondary education, but was below the regionalaverage, estimated at 39%. Using these date one can also infer a segmentation of the labor market, in
-20 -
prices which remunerate graduates automatically. Using civil service salary grids we can collate thestaff whose rank implies that they were recruited on the basis of a public higher education diploma (table3.4): these senior staff generally begin their careers at a salary equivalent to about 2.5 times that of acivil servant at the bottom of the hierarchy. Within the category so defined, the maximum salary fallsshort of double the minimum salary. Finally, we note that the range is slightly wider for administrativethan for technical staff. For the private sector, fragmentary data obtained from the 1990 annualenterprises survey point to a ratio between professionals (in principle, higher education graduates) andunskilled personnel of 3.5:1 in offshore business and 3.5 in the rest of the sector. The results of the 1995Integrated Household Living Standards Survey will constitute an extremely valuable source ofinformation from which to determine precisely the relationships between education investment level andthe other social data. In particular, they should provide a basis from which to construct gain functions.Rapid availability of these results is therefore vitally important.
Table 3.4 Civil Service: Annual Salary and Total Remuneration,by Corps and Grade (1995)
Source: Based on a series of decrees concerning civil service remuneration.
* Remuneration = basic salary + various allowances.(a) Simple average of the emoluments of chief administrators, administrator-advisers,
public services advisers and administrators.(b) Simple average of the emoluments of chief, principal, public works and assistant engineers.
3.33 Entry into the job market. There is no systematic follow-up of students through which toobtain an idea of job-market entry conditions together with the most efficient establishments.Fragmentary data presented in Strategic Study no. 11 (Ministry of Economic Development 1996) appear
which the possession of a higher education degree would be of considerable importance (Abdennadher A.,Karaa A., J.M. Plassard 1994)
- 21 -
to indicate that market-entry is fastest and easiest for arts graduates, who rather rarely prolong theirstudies beyond the master's level, the great majority of whom find a stable job within 18 months aftergraduation, and who describe their job match to the education and training they have received assatisfactory. These positive findings are no doubt explained in part by the fact that most graduates fromthese disciplines adjust their aspirations more rapidly to actual employment availabilities and arerecruited directly as teachers, an increasingly rare situation. The extremely long stays in university, andthe lengthy period before they enter the job market (often over two and a half years) in the case of theirhuman and basic sciences colleagues suggest that the transition from the university to the world of workis not an easy one for everybody. Here again, a system of regular monitoring of the students would beextremely valuable, not only for the students but also for the education establishments and thesupervisory authorities.
3.34 It is even more difficult to assess the quality of the product from the available data (acharacteristic that Tunisia shares with its neighbors; cf. Heyneman 1996). Interviews with employersreveal an overall positive evaluation of the engineers being graduated by the schools. The volume ofexport of graduates "made in Tunisia" is an interesting indicator but one about which we possess less inthe way of quantifiable data than of anecdotal information: the anecdotes revolve around youngTunisians who went off to more developed countries after completing local university training and wereoffered good jobs in those countries despite the often high unemployment rates and immigrationobstacles which have been multiplying over the past several years, especially in Europe. For its part, theTunisian Technical Cooperation Agency (Agence Tunisienne de Cooperation Technique--ATCT) reports260 bilateral cooperation staff in Europe and nearly 90 in the United States, and in its 20 years ofexistence has recruited more than 14,000 cooperation staff serving in 25 Gulf and African countries.Lastly, MES reports a very high degree of success on the part of Tunisian students who have gone abroadto complete their thesis, an indication of the continuing high quality of Tunisia's higher educationsystem.
IV. INSTITUTIONAL ENVIRONMENT AND INCENTIVES
4.1 Development of the institutional environment of Tunisia's university sector is vital to enable theuniversities to experience dynamic development commensurate with the quantitative, financial andqualitative challenges that will appear during the next few years. Several components of that environmentcall for discussion: (i) channeling/assignment of students; (ii) curriculum organization; (iii) distribution ofteaching, administrative and financial responsibilities, and (iv) the place of the private sector and openingup to the outside world.
A. Routing of students to departments/disciplines
4.2 A routing system that is transparent and fair. but not easy to reverse and still lagging behind theneeds of the economy. Routing of students to the various disciplines upon university entry is an importantstage in the education program since entry is open to all high-school graduates (bacheliers)--and only tothem. Channeling students to the various public education departments or disciplines and institutions ishence the only area for maneuvering available to the public authorities to regulate student inflows, since itcannot directly control their total volume. Because it does not apply overall rationing, the governmentexercises its preferences through internal rationing, differentiating among the various disciplines. Theoperation thus consists in matching the students' wishes and government priorities, which are reflected inthe variation, from one year to the next, in the number of places offered in the different degree courses.
-22 -
Despite its rigidity, the system has succeeded in adjusting supply by limiting access to certain courses withno future and opening it up to those offering promising prospects for growth (English, for example). Butthe carryover of early channeling operations conducted in secondary school limits the room for maneuver atthe higher education level.
4.3 The current discipline routing system is based on an algorithm that evaluates the aptitudes requiredto succeed in the discipline in light of the baccalauriat results. Students who, after several rounds, fail toget into one of the departments or disciplines of their choice and are enrolled in one that does not suit theirwishes, can opt to sit a reassignment examination at the end of the year and, if they pass it, to start theircourse again (from scratch) in the coveted department or discipline. The fact that students lose a year byrepeating in this way is a deterrent, and until recently few have opted to do it. Apart from this not veryattractive possibility, there is no appeal.
4.4 Technically, the system appears to be running smoothly and, despite the recriminations heaped on itby rejected students, it is equitable in terms of principle and transparent in its application. Its weakness isnot intrinsic, but rather stems (i) upstream, from the restriction of admission to bacheliers only,12 and,above all, (ii) downstream, from the rigidity of the university system, which channels students to disciplinesonce and for all. This rigidity, which is reflected in the monolithic nature of the curriculum and the lack ofcross-over paths, makes it impossible to correct assignments which, though perhaps soundly based at thetime they were decided on, have since turned out to be (or have been confirmed to be) mistaken. Finally,being totally centralized, the system takes all responsibility away from the universities and establishments,which passively submit to student routing and only take action downstream to correct mistakes.13
B. Curriculum Organization
4.5 A number of curriculum organization reforms have been implemented successively at the level ofeach university cycle. The first reform implemented was that of the general master's degree curriculum,which was restructured through the creation of modules (decree of November 22, 1992). This well-intentioned reform displayed its shortcomings as soon as it was implemented (1994/95): cutting the oldannual programs into obligatory slices did not introduce the kind of chronological flexibility in whichsuccess is confirmed by a "negotiable" certificate based on a sequence only certain stages of which arecompulsory. Moreover, because the modules are not dimensioned consistently, they do not allow inter-disciplinary flexibility: a year in science can yield three modules while ten can be earned in economics.The specialization of certain universities by disciplines (Tunis 1, 1, III) does not help to add flexibility to thesystem. The 3rd cycle curriculum has also been reorganized (decree of September 6, 1993), with thecreation and/or reform of intermediate degrees (DEA and DESS) and of the doctorate, which was theculmination of the efforts of a decade and the scope of which was reduced.
4.6 A moreflexible approach is needed to ensure that student channeling at the start of the first cycledoes not preclude any chance of reassignment later. The basic principle of this approach is twofold: (i) togive the students the opportunity to alter their course of study at several points along their universitycareer, without incurring any penalty, and (ii) to allow universities an opportunity to adjust their syllabusesin light of the demands expressed.
12 In particular, entry is closed to technical training graduates.13 In Portugal, a numerus clausus is applied, based on evaluation by the establishments. In Spain (where a
numerus clausus is applied to 70% of disciplines), the number of places available in each institution isdetermined by the University Council.
-23 -
4.7 First of all, the routing authorities could base their decisions on a set of indicators of labor-marketmL~y by graduates, according to discipline or department (waiting time, nature of first job, relationshipwith the disciplines taught, salary, and so on) and arrange for the values of these indicators to bedisseminated widely among the candidates; this wouldfacilitate better self-selection on the part of studentsand more refined adjustment both of assignments and of curricula. Regular publication of such informationwould undoubtedly lead to implicit classification of the disciplines and consequently of the institutions inwhich they are organized. Moreover, such an approach would eventually lead to differentiation of theinstitutions which would reflect any quality differences and at the same time any specialization based onlocal economic situations. Finally, it would probably involve modification of the present routing system,which on the supply side takes account only of intake capacities. Departments or disciplines not postinggood scores on the indicators for several years in a row would undergo in-depth examination, andconsideration should be given to redeploying them, following a search for a consensus with respect to them(if the market value of these departments or disciplines is low, does their cultural or social value justifyretaining them?). It would make sense to activate the National Employment and Training Observatory(Observatoire National de l'Emploi et de la Formation--ONEF) and entrust it with the tasks of compiling,updating and disseminating the indicators.
4.8 Despite the very positive reforms referred to above, the current curricula and certification structureis still not very propitious to this approach, and the reforms need to be deepened to make the system moreflexible and less compartmentalized. The MES is already engaged in debate on this subject, and has set up21 expert committees (corresponding to the 21 maitrises currently offered). A more markedly modularorganization would make it possible both to reduce losses (and hence enhance internal efficiency) and toreact to changes emanating from the labor market (and enhance external efficiency). Without disruptingthe system, a structure could reasonably be conceived in which modules of a standardized value can beaccumulated in the first cycle, by making the effort to define a coherent compulsory core for each broadfamily of disciplines; this necessitates reformatting the modules to ensure both their compatibility with acommon core and greater polyvalence. This arrangement could be expected not only to boost the system'sefficiency but also to promote better quality (cf. for example the comments in the report by Ketele 1996).Such a reorganization of the first cycles would allow for a clearer distribution of roles, eliminate theconfusions between research and teaching, and facilitate final screening for the purposes of the trueuniversity studies of the second cycle. Geared entirely to teaching, and certified by a specific diploma,these preparatory cycles could be grouped together into colleges with their own teaching bodies and
14regulations
4.9 There is in point of fact no compelling reason to maintain a single system, mandatory for allestablishments. Efforts could therefore be addressed to devising an organization that differs from oneuniversity to another. This would entail on the one hand decentralization of the work of redesigning themodules and programs, as well as the accreditation decisions, and on the other setting up a system ofequivalencies (controlled at the central level) to ensure the essential permeability between faculties andbetween universities. Student mobility between universities would also have implications for resourcesmanagement and would need to be reflected in an appropriate flexibility in this field and an increased roleat the university level.
14 The creation of such institutes is envisaged by the commission that is currently discussing the future of theTunis Science Departnent.
-24 -
C. Distribution of Responsibilities
4.10 The institutional structure. Responsibilities in the sector are shared among the MES (and otherministries, in the case of jointly supervised establishments) at the central level and among the HigherEducation and Research Establishments (faculties and schools) (Etablissements d'Enseignement Superieuret de Recherche--EESRs) at the local level. The law of July 28, 1989 added the universities to the structurein order to alleviate the growing difficulty of maintaining communication between what had grown into alarge number of establishments and the ministry. The graft has not yet fully taken, owing partly to the law'ssilence or ambiguity on certain points and partly to acquired habits. Coexistence of university presidents,appointed by decree, and department deans, elected by the teachers, is not a simple matter. Running counterto the direct relations between the deans and the ministry, yet lacking extensive responsibilities, theuniversity presidents have difficulty in establishing their authority, which continues to be limited, in thefinancial and administrative as well as in the pedagogic areas. They are often perceived as an extra echelonunnecessarily inserted into the decision-making circuit rather than as university representatives whoseexistence is still relatively fragile. By the same token, the creation of the universities, which were supposedto pave the way for decentralization of the system, has not really achieved that objective; in particular, thethree-tier system in place today has not succeeded in improving administrative management performance.l5
4.11 Under their statutes, universities and EESRs are administrative-type public establishments(etablissements publics a caractere administratif--EPAs) possessing juridical personality and financialautonomy. This having been said, the distribution of the respective responsibilities of the universities andof the establishments grouped together in them, as ratified by the July 1989 law and the December 1989enabling decree, is not always clear. Moreover, the interviews with the university presidents themselvesreveal a certain latitude in assessing their role and in interpreting the legal instruments. The same lack ofunanimity with respect to this distribution is evident among the people at the establishment level. Thedistribution is indeed complex, many decisions requiring the involvement of at least two or three authorities(table 4.1).
Some progress has, however, begun to be evident, thanks in particular to the adoption of a managementinformation program which has introduced greater transparency (World Bank 1992).
- 25 -
Table 4.1 Matrix of Responsibilities in the Higher Education SystemMinistry of Civil Service Ministry of M.E.S. University EstablishmentFinance Ministry Research
Teaching
-Admissions
-Discipline organization
-Establishments organization A P-Diplomas-Examinations organization-Student discipline
-Promotion-Assignments and changes between Puniversities
-Assignments and changes between Pestablishments
-Discipline . P-Supplementary hours P
Administrative Staff
-Recruitment
-Assignments and changes between Puniversities
-Assignments and changes between - Pestablishments
-Remuneration-Discipline P P
Finances and Budget-Execution of estabs.budget P P-Execution of univs. budget C-Setting estabs. budget A P-Execution of estabs. budget C-Equipment maintenance
Research-Program formulation - P-Program financing p P-Contracts C P-Patents-General contracts framework -Negotiation and signature C P
Notes: Decision authorityApproval authority AProposal authority PConsultation C
- 26 -
4.12 The great majority of decisions continue to be the prerogative of the ministry. a minority of themappertain to the establishments, and the university administers the remainder while exercising partialsupervision over the establishments. Lacking their own premises (in the case of Tunis) and with verylimited budgets and personnel of their own, the universities play no part in pedagogic decisions. They donot express opinions on student admissions or channeling between departments and have no role indrawing up the curricula or designing the modules; they administer neither staff movements (exceptamong their component establishments) nor--apart from overtime--staff remuneration. The result is that,teaching staff allocations and changes being decided on at the central level, they can disrupt theexecution of a program and conflict with a university's plans for launching new modules.16 Teacherpromotion prerogatives are totally outside the university presidents' jurisdiction, while the elected deans,for their part, hesitate to exercise their prerogatives (especially when penalties are involved). Theawarding of scholarships is outside the jurisdiction of both the presidents and the deans, and is theprerogative of the University Social Services Office (OOU).
4.13 Resources allocation is a centralized process in which account is taken only of inputs. Duringthe budget discussions the university presidents compile the proposals put forward by the establishmentheads and then, after a first screening, discuss them with the MES, which presents the amended proposalsto the Ministry of Finance. The supervision exercised by the MES strips the control university presidentsare supposed to perform of its usefulness. If a university-managed student routing system wereinstituted, allocation of resources could also be perfonrned at that level, and the universities would in turndistribute the subsidies to the establishments.
4.14 The university is not involved in the management of salary expenditures, nor is it the approvingauthority for either equipment expenditures (title II) or operating expenditures. What is more, sincetransfers from title I to title II, and between chapters of a given title, are prohibited, no leeway remains toallocate funds during a given fiscal year in order to adjust to new situations. In these circumstances, onecan hardly speak of operational autonomy. Similarly, a number of the people interviewed preferred totalk in terms of deconcentration rather than decentralization. Measures have recently been taken tointroduce greater flexibility (authorization for carryover of unspent allocations, designation of secondarypayment authorities, recourse to payment by check, etc.), but these do not confer any real autonomy uponthe establishments.
4.15 There is very little incentive to raise internal resources. Equivalent to public resources, ownresources deriving from outside contracts are in fact subject to the same constraints and controls aspublic resources, with all the delays that this implies, for example in obtaining expenditureauthorizations. Moreover, those EESRs that manage to attract such outside resources by means ofcontracts are afraid of having their public financing cut. The same kind of mistrust aroused by excessivecontrol leads teachers to accept totally private assignments that not only do not benefit the institution towhich they belong but often cause them to reduce the time they devote to it even further.
4.16 In order to eliminate to these perverse results, rekindle interest in seeking externalfinancing andlighten the government's supervisory responsibilities, it would suffice to leave the institutions totallatitude in using private funds obtained through the conclusion of contracts. In parallel, the amount ofthe funds earned by the institutions in this way should not affect the amount of the public subsidiesallocated to them.
16 While the favorable opinion of the departure and arrival establishments is undoubtedly necessary, fewestablishment heads utilize this power to oppose a ministerial decision.
- 27 -
4.17 More generally, loosening the administrative constraints would not only allow the universities toattract a larger flow of financial resources but also generate productivity gains in public resourcesmanagement and would probably be greeted positively by the staff, on both the teaching and theadministrative sides, that operate the system. For that purpose, however, a suitable legal status isrequired that specifies a supervisory jurisdiction that is less stringent and geared less to a priori control.Legal formulas already in fact exist in Tunisia that allow public institutions more autonomy than the
EPAs. An example is the Health Services Public Establishment (Etablissement Public de Sante--EPS), aformula already tried and tested in the case of hospitals, which also are providers of services addressed toa private clientele under public supervisory jurisdiction. The ISETs have the benefit of a lessconstricting statute, one that appears to give satisfaction both to their administrators and to thesupervisory authority. At the extreme, there is also the case of the Industrial/Commercial PublicEstablishment (Etablissement Public a Caractere Industriel ou Commercial--EPIC) whose purposes,however, are far removed from those of the university. It would be of interest to undertake, as quicklyas possible, an in-depth study of these formulas and their variants and to explore the possibilities ofadapting them to the needs of the universities and their staff These needs concern the university'scapacity first to control the channeling of new student intakes among the various EESRs and second toreallocate resources among EESRs in step with enrollment trends and the university's long-termobjectives.
4.18 In the set-up suggested here, the university's supervisory jurisdiction over the EESRs would besubstantially increased and would largely replace that now exercised by MES. The formula to bedevised would of course center on increased decentralization of resources and decision-making authorityand could be reflected in program-contracts concluded between MES and the universities. Thesecontracts would prescribe each university 's objectives, specify performance indicators and lay down theprinciple of the universities' accountability. In brief, it would be a question of the phased introduction ofa global resource allocation system, along with periodic evaluations of the beneficiary establishments.Experiences in other parts of the world are not lacking. those of the Netherlands, the United Kingdom,Chile and Pakistan deserve to be studied. 17 Changes of this kind do not take effect automatically: theywould conflict with current attitudes and could arouse opposition. They would have to be subjected,alongside the essential technical expertise, to the broadest possible consultation. They would also, bothprior to and during their implementation, have to be accompanied by training programs, especially inthe management area, for university staffs, who are not ready to perform their new role.
D. The teaching function
4.19 One of the great challenges of tomorrow's higher education relates to the people responsible formaking it work, i.e. the teachers. As we have seen, they have played a crucial role in the current issue,
17 Autonomy of the establishments and output-based allocation of resources naturally go hand in hand. In theUnited Kingdom, where resources are allocated on this basis, the 130 universities are autonomous, areresponsible for their financial, academic and administrative affairs and themselves decide on curricula,admissions and examinations. An interesting discussion of the various university financing mechanismscan be found in Albrecht & Ziderman 1 992b. In particular, the concept is discussed of "buffer institutions"more or less independent of the ministries and responsible for distributing the resources amonguniversities. See also Sheehan 1996.
-28 -
that of costs. Tomorrow, the issue to be faced is going to be that of teacher availability; beyond that it ison them that the quality of education is going to depend.'8 This issue therefore merits a close look.
1. Statutory provisions governing the teaching career
Priority accorded to research activities in the teaching career
4.20 Full-time teachers fall under the general civil service rules and regulations, except as providedotherwise in their own special statute. This special statute governing teacher/researchers (decree ofSeptember 6, 1993) defines four grades: professor, lecturer [maitre de conferences] (which togetherform "level A"), assistant lecturer [maitre assistant] and assistant ("level B"). To these are added fourother categories: professor emeritus, visiting teacher, associate teacher and contractual assistant. Theirrole is twofold: (i) to participate in the development of knowledge and ensure its transmission throughstudent tutoring, counseling and guidance and also through the improvement of teaching methods, and(ii) to participate in scientific research and contribute to its development and the application of its results.The statutory definition of their functions thus places research and teaching activities on an equal
footing. In practice, things are different, teaching being relegated to second place.
4.21 Recruitment and advancement. These are codified by a series of requirements and tests whichgive precedence to research and a subordinate place to teaching activities, at every career level (Annex13). Access to the first echelon--that of assistant--is by open competition after six years of higherstudies, supported by evidence of preparation of a thesis. Following a two-year probationary period,which includes no teacher training, confirmation takes place in theory on the basis of the state ofprogress of the thesis. Recruitment of assistant lecturers, and also access to the title of lecturer, aresubject to a competition based on the candidate's research work.
4.22 Teaching is accorded only marginal weight as a factor in the hiring process or in an individual'scareer development. In practice,. only research activities really count. Apart from prescribing a numberof hours, the rules governing teacher status do not lay down any quantified obligations in terms of timeto be spent with students, in correcting examinations, or in performing services for the university: ateacher/researcher "owes" a small number of hours of teaching and may devote the whole of theremaining time to the activity basic to his/her evaluation, i.e. research. These incentives might hence beexpected to lead the universities to devote themselves essentially to research. According to the evidencecollected, however, this applies to only a minority of them.
4.23 There are several reasons for this situation:
(a) The incentives system is actually very weak: (i) The career path is short. The seniorityrequirements for a promotion candidate allow a university teacher to reach the grade of professor at theend of ten years or so. Those that have attained professor grade are at the peak of their career. They nolonger have any incentive, or are under any constraint, to continue to do research or to tutor and trainyoung researchers; (ii) once they have achieved a regular appointment, assistants have only a moderate
The issue of the place of teachers is being discussed more or less everywhere in the world (Higginson,1996).
- 29 -
incentive to complete their thesis.)9 The fact that assistants can achieve tenure without having completedtheir thesis hardly constitutes an incentive. This possibility, combined with a criterion that gives toomuch weight to subjective considerations (progress of the thesis), represents an anomaly. It should,however, be noted that the committees have recently stopped awarding tenure to assistants who do notsubmit a completed thesis.
(b) The system of national recruitment and centralized assignment leaves little responsibilityto the university and establishment authorities and thereby encourages a passive attitude to the taking ofdecisions, even when these affect their own functioning. Finally, the available physical resources, interms of both premises and equipment, are usually inadequate.
(c) Pressure of student numbers takes a heavy toll of the available time, especially at levelB. The very smallness of the teaching service obligations explains why almost all teachers put inadditional hours, sometimes going so far as to double their schedules: what is reasonable at level A,with a maximum workload of 9 hours, even below international standards, can become a very heavy loadfor level B staff if they do indeed pursue completion of their thesis.
4.24 In the final analysis. the priority accorded to research over teaching is not only detrimental toAhequality of the research but is also to some extent illusory. The inadequacy of the resources, theadministrative difficulties in managing them, the lack of critical mass and the absence of appliedresearch outlets all combine to reduce the feasibility of doing true research, or in any event of doing it assystematically as the criteria applied by the current recruiting and promotion system would tend tosuggest.
A jammed-up promotion and recruitment system
4.25 As a result, career paths are often blocked, especially in the arts and humanities, and someassistants are on the point of completing their career path at that grade. The effects of absence ofresearch; refusal by those that do perform research to apply for positions available in the provinces, farfrom their team; the malthusian attitude of certain juries, and finally the traditional clannishness allcombine to paralyze recruitment and eventually jeopardize the maintenance of a good academic level.Analysis of the results of the 1995 recruitment competitions session confirms this finding anddemonstrates the increasing weakness of the candidacies as one ascends through the hierarchy; thisweakness cannot be explained merely by the relative youth of teachers aspiring to be assistant lecturersor by certain difficulties in arranging some of the examining juries (table 4.2).
This comment refers of course primarily to those who began their thesis under the "old regime" of the statethesis, a monumental work the drafting of which could take over ten years or even, in some disciplines,extend over a teacher's entire career. The new thesis was only introduced in 1993 and, since the legislationgranted the option to continue under the old regime, they are many people today still engaged in writing astate thesis.
4.26 These figures show first that the Tunisian universities are going to have serious difficulty in copingwith the growth in student numbers and in increasing the recruitment of teachers other than teacher-researchers and raising the number of assistants, and second that juries, having a very restricted range ofchoice, can exercise true selection only by refraining from filling the positions. On that point, moreover, forthe same juries to be required simultaneously to evaluate individual qualifications and handle recruitmentapplications is an unhealthy situation. Eventually, under the pressure of numerical needs, quality is likely todeteriorate and replenishment of the teaching body to dry up. Tunisian universities are already resortingincreasingly to non-research teachers to conduct the courses, a heterogeneous group that umbles togetherassociate teachers,20 contractual assistants recruited under two-year, renewable contracts,) and, above all,secondary school teachers assigned to university establishments. 22
4.27 The career pyramid is becoming increasingly flatter. In 1995-96 30.5% of higher educationteachers were not teacher-researchers: about one third were contractual teachers, and the rest secondaryteachers. Professors and lecturers are greatly in the minority, rarely accounting for more than 15% ofteaching staff; in some faculties at Kairouan and Sfax they represent less than 5%, and some disciplines inthe provinces have no level A teacher (Annex 14).
4.28 Counting for little in recruitment and promotion, and benefiting neither from financial incentivesnor evaluation, teaching is the most greatly neglected function from the quality standpoint. Initialpedagogic training remains to be organized. There is no continuing training system in place. The teacherscan hence do no more than reproduce the teaching methods to which they were themselves exposed whenthey were students. Focusing the evaluation system on research has negative effects on teaching: forteachers to hold themselves at the disposal of the students for advice and counseling is perceived as a wasteof time, especially considering that little in the way of premises is available for that purpose; teachersappointed to the provinces visit their faculties only for their courses and immediately return to Tunis, wheremost of the research teams are located.
4.29 Owing to the small number of program hours required of level A teachers, and the growingshortage of the latter, students are entrusted in the main to the least qualified teachers (assistants orcontractual teachers). This situation no doubt helps to explain the high failure rates in the first cycle of
20 Qualified persons who have at least ten years of non-university professional activity and are able todemonstrate reputation and experience related to the discipline taught.
21 Among holders of a DEA, a secondary education teacher certificate or a diploma attesting to six years of
22 higher-level studies (these are in fact students who are being helped in this way to begin their thesis).These are the only ones who have received teacher training.
- 31 -
higher education, which is when the students are most in need of tutoring and assistance. At the same time,the qualified secondary education teachers assigned to higher education are undoubtedly not used to the besteffect, despite their unique and invaluable teaching experience.
2. Toward development of the teaching function
4.30 The improvement in internal efficiency in primary and secondary education is going to channelsubstantial student flows to the universities. The need to diversify and professionalize the training isalready being partly recognized with the development of the ISETs and the phased setting-up of DESSs.Studies remain to be done on a personnel profile more closely tailored to the new situation. Thisnecessitates redressing the balance of university activities in favor of teaching and reconsidering the dogmathat every higher-education teacher is necessarily a teacher-researcher. The changes are particularlynecessary and urgent in the first cycle, since at that level teaching requires much greater availability on thepart of the teachers.
Coping with enrollment growth
4.31 Doubling the number of higher education teachers in five years and tripling it in eight, which iswhat needs to be done according to the MES projections, is out of reach at the current pace of recruitmentand promotion, even without considering the government's budget constraints. The Ninth Plan forecastsput the universities' needs at 600 additional teachers a year over the period (to which would have to beadded 240 teachers for the ISETs and IPEls), with a further 530 over the Tenth Plan period. It isparadoxical to be facing this problem when teaching service obligations are low by reference tointernational standards. The first step to be taken would therefore be to raise the required minima and addto them "service" hours comprising participation in university life (councils, linkages with enterprises andso on) and assistance to students. It would be useful to prescribe the service obligations of all kinds for allgrades more clearly and to quantify them.23
Removing career path blocks and maintaining quality
4.32 It is essential that parallel measures be taken to make the career of teacher more fluid andintroduce alternative career paths. First of all, tenure should be granted only after obtaining of thedoctorate, and a strict limit should be imposed on renewal of contracts during thesis preparation. Norshould it be granted until after appropriate pedagogic training (which remains to be put in place), whichshould be continued through refresher training over the teacher's entire career.
4.33 Making the teaching function more attractive. Secondly, the incentives to lecturers and above allprofessors to tutor and train young teacher-researchers should be increased& the requiredtutoring/supervision activity should be quantified, evaluated and perhaps even recognized by abolishing or
24modulating bonuses; the career path should be lengthened by increasing the seniority requirements forapplication for a higher grade and possibly by instituting an additional grade for professors; lastly,teaching, as well as research, should be taken into account in the process of evaluating individuals forpromotion to any grade.
23 For the purpose of fine-tuning to the needs of the faculties, the ministry could confine itself to setting
ranges and allow the deans to negotiate the individual adjustments.24 -They are currently practically automatic and have lost their incentive function.
- 32 -
4.34 Opening up career paths. Thirdly, action to diversify and professionalize teaching isindispensable. Moreover, the necessity to substantially raise the number of hours of teaching points up theneed to tailor the rules to the realities of the situation, i.e. to create a category of higher educationteachers of senior level but devoted entirely to teaching These teachers could be assigned in priority to thefirst cycle.
4.35 At this level, it is in fact not at all necessary to be a teacher-researcher, any more than it is in orderto teach living languages in management courses or management in arts courses. It is moreover veryunlikely that 14,000 teacher-researchers will all be high-level researchers and remain so throughout theirentire career: for the teachers also, the change of scale entails qualitative changes. This diversification ofthe function of higher education teacher already exists in many foreign countries, where it reflects thediversification of the institutions: those devoted to the first cycles do not use researchers and place a heavyprogram workload on the teachers, as do many professionally-oriented second-cycle institutions. That is thegeneral situation in, for example, North America and Asia, where teacher-researchers in the full meaning ofthe term are in fact in the minority. It is also partly the case in Tunisia, with ISET teachers and the use ofsecondary teachers; however, continuation of the current trends in the universities could well have seriousadverse repercussions on teaching quality.
4.36 Several solutions merit consideration. They include.
- either create a new teaching corps, recruited at the doctorate (completed thesis) level but withheavy teaching obligations limited only by the need to ensure their own continued training and to maintaincontact with the research staff;
- or extend the corps of teacher technologists to all disciplines, which would necessitate adjustingtheir statute to make it applicable to specialists in the non-technological disciplines;
- increase the number and systematic utilization of qualified secondary-school teachers, whorepresent a high-level teaching corps that is particularly well suited to the first cycles; this would meanincreasing the number of disciplines open to teachers seeking qualification [agr6gation];
- or again, and this is the mostflexible solution, allow teachers to choose between two career pathswithin the teacher-researchers corps. One path would be geared to teaching and would involve "heavy"service and student presence obligations. The other would have lighter program loads (though heavierthan they are today) but would raise the quantitative and qualitative requirements for research activities.The choice, which would be setforth in a "contract"for a period of three to five years, would determine thenature of the evaluation over the course of the teacher's career.
4.37 This last solution would allow shuttling between the two statutes andfree up the career paths ofthose teachers who devote themselves to their students. It would also allow the institutions to tailor theactivities of their departmental teaching staff to their specific needs and objectives. Logically, withdeveloping needs the majority of teachers (particularly those responsible for the first cycles) would end upin the "teaching" track and a minority in more tightly structured research teams.
Systematizing evaluation
4.38 Setting up a strict and transparent evaluation system is a precondition for the arrangementsdescribed above to succeedfully. It is also an essential step in order to put the university sector and itsactors on the path to enhanced efficiency. Until very recently, no systematic arrangement existed in Tunisia
- 33 -
for evaluating teaching performance. A National Evaluation Commission (Commission Nationaled'Evaluation--CNE) has only just been set up. One of the CNE's first initiatives was to conduct a survey ofteachers to ascertain their activities during the academic year 1995/96. The survey was rejected by some ofthe target teachers, who feared lack of expertise on the part of those who will be responsible for utilizing itsfindings, penalization of teachers "overly committed" to teaching activities and, more generally,encroachment on academic freedom. The survey is nevertheless usable and will serve as a starting referencebase.
4.39 Tunisia cannot tackle the new phase of university expansion without first ensuring that it will nottake place at the cost of teaching quality. The only way to achieve this is to systematize the process ofevaluation, not only of staff but also of programs and establishments, and bring it into general use. Teacherevaluation must, however, pursue clear objectives and be organized around specific and transparent criteriaso that teachers know perfectly well what the evaluation process is all about and collaborate in it. It isimportant also that teachers know who is responsible for the evaluation and that they take part in the processthemselves. The object of the evaluation may essentially be either (i) to furnish information for promotiondecisions, or (ii) to facilitate pedagogic enrichment. In the first case it will tend to take the form of annualreports and it will be necessary to publicize the indicators used and the grid of activities evaluated, withtheir respective weightings, for both teaching and research. In the second case it will be based more onspecifically-targeted interventions with the assistance of pedagogic experts.
4.40 A resource center specializing in pedagogic assistance could be an extremely useful evaluationtool--especially in evaluations of the second kind This center, like those located in North America and theNetherlands, would provide collective support (in the form of workshops) or individual support(consultation) for teachers who are new, in difficulty or simply wishing to improve their technique. It wouldinclude educational engineering experts, could serve as the base for launching pilot experiments anddevelop into an advisory assistance, initiative and research center for distance education and the newinteractive media that are developing so rapidly.
4.41 More flexible and decentralized management of teaching staff. Universities should be givengreater responsibility for managing their teaching staff so as to enable them to pursue a true institutionalpolicy, reward the best performers and exert necessary pressure on the others. In particular, theuniversities ought to play a decisive role in selecting the teachers who are to work in them and, on the basisof aggregate staff quotas, decide on positions to be open to all candidates or promotions to be grantedinternally. Individual determination of service obligations through choice of one or the other track,discipline, teacher evaluation, evaluation of tutoring activities and participation in the life of the institutionand the awarding and modulation of bonuses ought to be decided at the university level.
E. An incipient private sector
4.42 Alongside the public higher education system there exists a private sector which in 1994/95attracted only about 3,000 students, two thirds of whom attended the Universite Libre of Tunis while theothers were dispersed among about ten small establishments. With less than 3% of total enrollment, theprivate sector is hence still at the embryonic stage, whereas it captures 10% of secondary pupils. There isan explanation for this modest place of private higher education. The tradition of private education at alllevels--beginning with the Kouttabs for basic school--is a historic fact in Tunisia, associated with Islamicculture and religion. The main raison d'etre of this private education has always been connected withreligion. At the higher education level, the Universite Ezzitouna--a prestigious 1,000-year-oldestablishment devoted, however, exclusively to Koranic studies--forms an integral part of the public
- 34 -
university system. There was therefore no particular reason, as long as the state entirely met a demand thatit controlled upstream, to promote the emergence of a non-denominational private education system.
4.43 The premises of demand exist. Currently, private higher education in Tunisia is limited to the dataprocessing and management areas (81% of enrollment) and ventures into neither the basic disciplines of thepublic faculties nor the vocational disciplines of the secondary sector of the ISETs or the public schools.Bacheliers who opt directly for the private sector without first trying their luck in the public sector seem tobe very few in number. The private sector tends in fact more to recruit students who have failed thebaccalaureat, those who have passed it but are dissatisfied with their discipline assignments, and"cartouchards," i.e. students who have exhausted their right to repeat a class (World Bank 1995b). Herewe find a classic source of pressure pushing students toward the private sector, i.e. rationing, in one form oranother, by the public sector. In the case of Tunisia, the high failure rates in the public sector and thesearch for an alternative to public university programs, are a guaranteed source of private-sector demand.Another, no less classic factor boosting demand for private education is the low--or declining--quality inthe public institutions. The available information does not suffice to show whether this is the case inTunisia. However, it appears to be widely felt there, even among advocates of a larger private sector, thatthe sharp rise in private-sector demand is not explained by the deficiencies of the public higher educationsystem. Moreover, the existence of an effective demand is evidenced by the fact that registration fees rangefrom DT 1,300 to DT 2,000 a year, 100 times more than public university fees.
4.44 The lack of legal status does not encourage initiative to meet this demand. Private higher educationis not governed by any official legal instrument whereas private primary and secondary and vocationaleducation are regulated by precise legislation. This legal vacuum has for a number of years now affordedprotagonists an opportunity to exchange contradictory interpretations concerning the right to set up privateuniversities. Even though the law's silence on this matter no doubt permits certain defacto situations andhas allowed the setting up of a few establishments, it promotes a climate of speculation and uncertainty thatin the final analysis is unhealthy and is in any case likely to discourage initiative. An example of thisclimate is the heated controversy that broke out recently concerning ministerial directives aimed atrestricting the right of public-sector teachers to work in private establishments: depending as they do 70%on part-time teachers coming from the public universities, the private establishments could probably notsurvive if this source were to dry up. The preparation and subsequent tabling of a draft law have donenothing to relieve the atmosphere. 2 Does this mean there is no future for a private university system inTunisia?
4.45 To judge from what is happening elsewhere in the world, this is by no means the case. The last fewyears have witnessed a veritable explosion of private higher education in India, Romania, Chile, Jordan andthe Dominican Republic. In the last country, the private sector's share in total registrations, barely 5% in1991 (World Bank 1995c), had risen to 71% three years later. Over the same period the enrollment rate inhigher education rose from 3 to 15%. In Latin America as a whole, the private sector receives, on average,3 8% of students (box 7). And in the MENA region itself, it is probable that within five or ten years we shallno longer be able to state, as we could in 1988, that "in the Arab countries higher education is basically afunction of government" (Za'Rour 1988).
25 The mechanism operates just as frequently at the secondary school level (E. James 1993).26 The laws of July 29, 1989 and February 17, 1993, respectively.27 The bill should finally be submitted and enacted into law in 1997.
Source: Garcia Guadilla 1996.* The totals and averages are for all Latin American countries together, including those not shown in the table.
4.46 The example of other countries shows. on the one hand, that a great variety of formulas existsand. on the other hand, that purely private establishments (receiving no public funding) are relativelyrare. The marginal place occupied by the private sector in Tunisia is not the stigma of a particulareconomic or education system or level. The countries where higher education remains a quasi-statemonopoly include Sweden and Austria, for example, as well as Pakistan. The first two have enrollmentrates of the order of 40%; conversely, in Pakistan the rate is 19%, i.e. not far below that of Portugal(23%), where the private sector commands 45% of enrollment. Above all, the example of Latin Americaclearly illustrates the sector's very marked heterogeneity in terms of teaching quality, status of theestablishments, type of certification and financing method, especially considering that these arecountries where the sector is expanding rapidly (Garcia Guadilla 1996). Regarding quality, in a givencountry a jumble of establishments can be found, ranging from bottom-of-the-scale establishments thatuse (and pay) professors at a discount and award degrees with low market value to selective schools thatconstitute elitist nuclei of excellence highly esteemed by the market. The method of financing alsovaries widely, from heavily subsidized establishments, as commonly found in western Europe (Belgium,the Netherlands, the United Kingdom--see Annex 15), to universities that are practically autonomous.2 8
Finally, creating private establishments serves a whole series of purposes, ranging from the purelyeducational to the essentially profit-seeking (Blomqvist and Jimenez 1989, and West 1995). As a result,
28 The use of education vouchers financed on a fiscal basis makes it possible to encourage private schools
without limiting access to them to better-off students. See West 1996.
-36 -
the private education issue can vary widely in its specifics and hence lends itself to discussion in termsmore of combinations of specific features than of generalizations.29
4.47 It is in Tunisia itself, however, that we find the preconditions for the rapid development ofprivate higher education. First, in light of the heavy pressure exerted by secondary-school leaver flows,it is doubtful that the state budget will be able to cope by itself with the growing enrollment numbers (seechapter V). This will call for an increased effort on the part of private operators. Next, as we have seen,the selectivity of public secondary and higher education fuels the demand for private education. Aboveall, however, the existence of a healthy private sector would be a diversifying factor that could inject astimulating zeal for emulation into the sector, especially at a time when Tunisia is opening up to theinternational economy and the outside world and pursuing a general policy of bringing the country up tospeed: the state has nothing to lose, and society everything to gain, from a sensible development of theprivate university. The only thing is, the issue has a strong ideological connotation, and in the eyes ofmany people education--even higher education--continues to be a function that belongs exclusively togovernment. There is reason to believe that this attitude--which has its historical roots--is today tendingto yield ground.
4.48 The framework within which a private education sector could develop in this way needs to becarefully thought through and debated by the present andffuture actors in it. Its basic philosophy shouldbe to promote and stimulate rather than to direct and control. Its role would be to furnish minimumassurances to both investors and consumers and thereby enable both groups to take decisions committingthem over the long term, since it is over the long term that higher education is programmed and that itproduces its effects. The following are the main issues it would need to address:
(a) Status. Should private education be planned as a sector that legitimately pursues profitor one that is totally non-profit-seeking? The two formulas can co-exist, bearing in mind that theyinvolve different rights and obligations, especially as regards financing. In any event, there would needto be total consistency with the investment and tax codes and the latter should, where appropriate, bepartially revised to improve the incentives they offer; in addition, the accreditation procedures should besimple and transparent.
(b) Financing. Should the aim be to make the establishments financially autonomous or toencourage a subsidized private sector? Here again, the choice could be left open, bearing in mind thatthe increased burden borne by the state would inevitably be accompanied by the imposition of a broadergamut of obligations on the establishments with respect either to teaching, to teachers or to diplomas.
(c) Hiring. Should standard criteria be imposed on all the establishments? Pedagogically,that does not seem necessary. Financially, the state must be able to play its supervisory role and act tomake sure the system does not falsify the democratic nature of the teaching. To that end it could adaptits revised scholarships system to offset the obstacle of private-sector registration fees for students whocannot afford them; in so doing, it would ensure respect by the sector as a whole for the principle ofequity.
In Greece, the place of private initiative in higher education has swung between extremes. Initiallysubstantial and often the work of public benefactors, it was later ended in favor of a public monopoly andhas since made a strong comeback in response to excess demand (Patrinos 1995). The variety ofcombinations of private and public financing is mirrored in the all the other social sectors. See Torres &Mathur 1996.
- 37 -
(d) Curricula. Should the authorities adhere to the principle of a uniform curriculum orallow diversification? The rapidly growing demand for skills argues in favor of diversification. Thisdiversification could be tested progressively, remembering that the state--in association with therepresentatives of the branch--would retain quality control and would seek to guarantee in this area, asin the others, professional standards of conduct.
(e) Diplomas. Should the aim be to perpetuate a single national system and should allprivate establishments be bound by a national diplomas grid? Here again, in opting for flexibility, theauthorities should allow the establishments latitude to choose between aiming for equivalence indiplomas (a form of maximum integration with the public sector) and simple recording of diplomascertifying success in diversified courses and ratified solely by the market.
F. Research and Relations with the Outside World
4.49 Across the world, research is one of the major means by which universities maintain relationswith the "outside world." It is also an instrument of growth. While no "model" exists in the matter,certain conditions have to be met (Parker 1992) if research is to effectively play a dynamic role. InTunisia, these requirements are only partially met: the rigidities on the university side and a certainreserve on the part of this outside world--if by that we understand the private sector--prevent researchfrom functioning as a true interface.
4.50 Dual jurisdiction. On the university side, research is developed and encouraged at MES by theScientific and Technical Research Department (Direction Generale de la Recherche Scientifique etTechnique--DGRST). In particular, the DGRST administers the international cooperation programs,distributes resources among the higher education establishments and evaluates the proposed programs.For its part, the State Secretariat for Scientific and Technological Research (Prime Minister's Office)defines priority programs and operates through calls for bids. In 1995, the Department counted a total of390 teams with 3,000 researchers, of whom one half were enrolled for doctoral studies.
4.51 Contract receipts are subject to strict distribution rules. The decree of February 28, 1994concerning "methods of utilization of resources received in the context of opening up the highereducation and scientific research establishments to the exterior" prescribes that receipts obtained fromoutside contracts shall be utilized in accordance with the following distribution: 30% for remunerationof the participants, 30% for the institution (to upgrade working conditions) and 40% for execution of theterms of the agreement. Departure from this distribution is possible, except for the percentage assignedto improving working conditions in the institution. The establishments are hence a priori not free to setthe resource allocation rules best suited to the project in question; problems of interpretation inevitablyarise (for example, the distinction between upgrading of working conditions and remuneration of theparticipants). The administrative lead times in obtaining approval of expenditures out of these funds arestill too long (at least two months). Another decree authorizes the institution to spend half the funds(instead of 30%) without prior control; however, this authority is not often used (paying officers prefer toplay it safe regarding the legality of the expenditures, and deans are not always familiar with theprocedures involved).
4.52 The will exists. Despite these administrative and financial obstacles, the Tunis Faculte desSciences, for example, the country's oldest university institution, conducts numerous research projects incollaboration with other institutions in Tunisia and abroad. With 90 laboratories, it has produced ahundred or so state theses over the last two years. The share of research agreements entered into withmedium-sized and large Tunisian businesses, most of them public enterprises, remains modest, however,
- 38 -
in relation to total research financing (10%). In some disciplines, this share is much higher (30% ingeology, explained by the existence of a mining sector). For its part, the Sfax National EngineeringSchool (Ecole Nationale d'Ingenieurs de Sfax) affords a good example of the case of institutionsintegrated into their local economic fabric and trying, in spite of the difficulties, to develop a researchpolicy of partnership with business (biological engineering, water technology, environment).
4.53 On the business side, the relatively small size of the private sector explains the continuing lowdemand; the studies and research projects financed on a contractual basis generally emanate from theenterprises. Small and medium-sized enterprises take little part in activities of this kind, except in veryspecific circumstances. The Research Secretariat grants assistance to private enterprises that do researchand development (equipment and studies). The Investment Incentives Code (1994) provides for R&Dinvestment "bonuses" amounting to 30% of total cost, with a ceiling of TD 25,000. This assistance isconditional on a minimum level of self-financing.
4.54 The Research Secretariat's program is in the start-up stage and accomplishments to date are stillvery few. The Investment Incentive Code does not include any specific measures to encouragecollaboration between the public and private sectors. Scientific and technical professional-level staffingis poor and often inadequate in private enterprises. There is hence a dearth of qualified professionals toinitiate and manage joint research projects, except perhaps in the (semi)public sector, where staffingappears to be satisfactory and there is some collaboration with the engineering schools.
4.55 In sum, the rigidity of the university system combines with the lack of interest on the part ofprivate enterprise to limit interactions between the university and business worlds through the medium ofresearch. the reasons imputable to the former reinforcing the lack of enthusiasm of the latter. and viceversa: (i) lack of decision-making and management autonomy, with respect both to regulation of theuniversity curriculum and to the administrative and financial areas, reflected in, for example, lack offlexibility in resource allocation and in research projects organization and implementation; (ii) lack ofmotivation of a broad segment of the corps of researchers, who are able to exploit a rent situation thanksto their secure status and the absence of any evaluation of their activities; (iii) cautiousness of the stillweak industrial world, dominated by small family enterprises, many of them set up by men of experiencebut with few academic qualifications and sometimes with a wary attitude toward the universities; (iv)the still limited scope for collaboration of the medium-sized enterprises, whose technological level is stillnot very far advanced, making it difficult for them to enter into complex relationships whose benefits arenot obvious, and (v) frustrating experiences for representatives of the economy on the boards ofuniversity establishments, where their influence continues to be negligible.
4.56 The studies done by the Plan commissions30 identify the obstacles to and constraints on thedevelopment of research and its role as an instrument of interaction with the outside world. They alsoyield a series of recommendations which, concurrently with the "natural" development of the privatesector, ought in theory to remove these obstacles and correct the skews noted. While theserecommendations undoubtedly point in the right direction, they could be strengthened on a number ofpoints, especially at the institutional level. In particular, the university and research establishmentscould be given greater autonomy by adopting more flexible financial management arrangements, such as(i) a posteriori budget control so as to avoid the need for frequent requests for prior expenditureauthorizations; (ii) the technique of the financial ceiling attached to a services contract, whereby a set of
30 In particular those set forth in study no. 12 and by the "Scientific Research" subcommittee of the "HigherEducation" sectoral commission.
- 39 -
services is performed within the framework of an overall budget negotiated in light of the task assignedand predetermined objectives, and (iii) autonomous management of research and training projects.
4.57 Simplifying and liberalizing administrative and budgetary procedures and the state regulationsgoverning research project management should help to bring the university and the enterprises in thisfield closer together. Upgrading the status of research necessarily involves, however, prior revision ofthe status of university teachers and researchers (see IV, D).
4.58 The private sector can make a substantial contribution to education. It would, however, benecessary to limit part-time and fixed-term teaching positions to very specialized instruction based onthe teachers' experience in industry. The gap between remuneration levels and market rates should benarrowed ifpossible. As a general rule, it would be worthwhile to foster mobility between private sectorand university, for example by providing opportunities for university teacher-researchers to work in abusiness for a specified period without having to give up their civil service gains. Empoweringuniversity boards could help motivate business heads and more broadly the representatives of society ingeneral to play a more active role in training program formulation and research orientation. Thisupgrading is only feasible, however, provided the government confers some degree of managementautonomy and effective decision-making authority on the establishments.
4.59 The development of an entity with true non-profit company status (foundation, association, etc.)could facilitate research partnership and financing (through donations and legacies, from foreigninstitutions, etc.). Consideration could then be given to setting up a National Scientific Research Fundto manage scientific research, first by financing training and general research projects, within theframework of a specified overall budget, and second by managing priority programs defined andfinanced by the government (for the example of Switzerland, see box 8).
:xTHE SWISS NATIONAL SCIENTIFC RESEARCH FUND (FNRS)
Switzerland's Nattonal Scientific Resarch Fund (Funds National de la Recherche Scientifque--FNRS) was set up in 1952, asfoundation under private law. The Fund promotes basic research, manages the national research programs and priorityprograms, awards fellowships, supports scientific publications, maintains international relationships and dissemninates scientificfindings and information. It was endowed by the Swiss Confederation with SwF 325 million in 1995; research subsidiesrepresent the greater part of the budget (75%). These figures represent 3,100 scientific researcher positions. The nationalresearch programs harness the potential of the university and private research centers to help resolve maJor problems selected bythe federal govenmment (example of the 7th series. nanoscienees, diseases of the nenous system, migration flows, ransportationand environment, Swiss external policy). Two specific ptOgrarms, aceounting for about 9% of the annual budget, are devoted toimproving teaching.and research. First, about 450 fe:llowships have been.awarded to starter researchers (bachelor'slmaster'sdegree) and more than 100 to advanced researchers (doctorate level) upon presentation of a personat research and trainingproject. Second, just under 1% of the budget is devoted to personat. subsidies to provide the high schools with qualified reliefstaff.. The funds disttibuted by the FNRS represent about 3% of the sums devoted to R&D in Switzerland, and about 12% of thepublic funds.
The purpose of the priority programs is to ensure and maintain a high level of research in certain key fields, having regard to therapid pace of development in science, and also to promote the creation and development, in disciplines deemed to be of strategicimportance, of skill centers within the higher education institutions. Parliament decides on the research topics and their overallbudget (environment, biotechnologyi data processing and so on).
Under the top-level authority of the Foundation's Board, which includes representatives of all the higher education, institutions,learned societies and economic and cultral institutions and also of the federal and cantonal authorities, the National ResearchCouncil and the commissions (whose members are volunteers) decide autonomously on allocation of the funds and subsidies.
-Subee. Swiss National Scientific ResearchFnd. . .
- 40 -
4.60 Finally, the outside world, to which higher education must continue to draw as close as possible,to the point of erasing the boundary between them, also has an international dimension, one whoseimportance is constantly growing. In that regard, opening up its universities as much as possible to theworld beyond its borders, through exchanges of professors and students,3 ' would be a step of cardinalimportance for Tunisia--a historically penetrable country. At a time when the processes of economictake-off and bringing the country up to speed are boosting the supply of interesting and remunerativejobs in Tunisia and thereby reducing the "brain drain" risk, sending students to the large universities andschools and laboratories of more advanced countries probably offers a renewed advantage. Expensiveas it is, the formula nevertheless yields long-term benefits, proven in practice by the Asian countries thathave utilized it: South Korea alone had 25,000 students inscribed in the American universities in 1992(Annex 16). In parallel, opening up positions for foreign teachers and researchers that offer goodconditions for invited visitors can have a very positive impact on local scientific life; this can moreoverbe arranged under exchange agreements linking the filling of these positions with the sending ofTunisian students abroad. Finally, the Tunisian universities cannot stand aloof from the process offormidable change ushered in by the development of the new communication technologies which allowus to hook into interactive scientific networks at low cost.32 It would be advisable to set up a specializedunit (which could very conveniently be domiciled at the resource center the creation of which issuggested in para. 4.43) with specific responsibility to monitor developments in this field closely andexamine how the requirements for connecting into these networks can be met as soon as possible andhow certain areas of education can be repositioned in light of the possibilities offered by these networks.
V. PRECONDITIONS FR SUSTAINABLE EPASION
5.1 The preceding two chapters, which took a static approach, drew attention to certain factors thatcurrently impede the smooth functioning of higher education. This final chapter takes a more dynamicapproach and guides the attention of planners to factors that could impair the positive development of thesector. To that end, it presents simulations of that development and discusses the preconditions for itsfinancial sustainability.
A. Inescapable Pressu
5.2 Natural population growth and education demographics, social challenges and economic choices,world competition and political resolve: the combined effect of all these factors is to make spectacularexpansion of higher education in Tunisia in the near future inevitable. Unless the authorities first of allreconsider the principle of right of access to higher education by all high school graduates (bacheliers) andsecondly considerably toughen selectivity at the secondary school level, student enrollment will rise bymore than 7% a year, doubling within barely ten years and surpassing 200,000 by the turn of themillennium. Since they are unlikely to do either of these things, we can take these figures as solidpredictions.
31 Cf. J. Delors' introduction to the recent UNESCO report (Delors 1996) and also UNESCO's guidelinesdocument on changes and developments in higher education (UNESCO 1996).
32 A discussion on the relationships between new technologies, electronic networks and higher education can
be found in Crawford, Eisemon & Holm-Nielsen 1995. A survey of the implications of these newtechnologies is presented in Hills 1994.
-41 -
5.3 This apparently inexorable development also happens to fit in well with the policy goals concernedwith ensuring that Tunisia is well positioned to face up to the intensified international competition that willensue with opening up to the EU. In terms of enrollment rates, the expected expansion will help to narrowthe gap between Tunisia and the other LMICs, enabling it to move closer to the estimated minimumthreshold of 25%33 and thereby build up the necessary human resources to equip it to take up thechallenges of competition (World Bank 1995). The only truly flexible factor in the enrollment trend--theonly one, that is, amenable to MES control--is cohort distribution by department or discipline; on thatpoint, the projections prepared by MES staff reflect the government's intent to modify the currentdistribution to give greater weight to the technical and scientific disciplines (Annex 17). It should beborne in mind, however, that another source of flexibility exists, this time upstream, i.e. at the secondarylevel: any action affecting transition at this level would obviously generate very appreciable changes inhigher education inflows (see chapter II).
5.4 Another prerequisite for this expansion to be handled to full advantage is that teachers,infrastructure and budgets must all be in place when it happens. It will call for a substantial increase inthe financial and human resources provided to the system. The circumstances attending the provision ofthese resources are discussed in this chapter, which begins by simulating a number of resourceaugmentation scenarios and goes on to suggest ways of influencing the cost determinants.34
B. Mobilizing Additional Resources
5.5 Initially, all the proposed scenarios assume a constant ratio of higher education current (title I)expenditure to GDP. Since real annual GDP growth is assumed to be constant at 6% over the next tenyears, government title I expenditure is also assumed to increase by 6% a year. Unit costs are alsoassumed to be constant; in the absence of efficiency gains, this obviously leaves no scope for improvingquality. The simulations relate to three families of variables: first, enrollment levels; second, theexpenditures devoted to them, and finally, the resources allocated to those expenditures. Capitalexpenditures are dealt with separately, on the basis of unit costs. There is no need, in the case of theseexpenditures, to draw up a resources/expenditure balance sheet since the receipts inflow to this budget(title II) is relatively unstable and in any event dependent partly on external contributions. We thereforeestimate financing needs instead.
Sensitivity analysis
5.6 Four series of simulations were performed in this way, corresponding to four distinct scenarios:a basic scenario (status quo as regards financing) and three families of scenarios based on three possiblemajor lines of reform.
Basic scenario. Tuition fees are those currently charged (TD 15, 20 and 61.5 a year for the first,second and third cycles, respectively). The charges for university meals and housing and theterms of utilization of university cafeterias (145 meals per student per year) and of access tohousing (30% of enrollment) remain unchanged, as do the conditions of award of scholarships(maximum annual family income TD 1,450).
A parallel threshold of 70% has been estimated for secondary education.
The simulations were based on the spreadsheets used by MES in preparing the Ninth Plan (MES 1996).
- 42 -
Scenarios Ia. Ib, Ic. Tuition fees are increased to cover respectively 10% (scenario la), 20%(scenario lb) and 30% (scenario Ic) of average recurrent unit cost. These increases would raisetuition fees to about TD 190, 380 and 570, respectively. The simulations assume a singleadjustment, at the beginning of the period.
Scenario 2. The meal price is raised from TD 0.100 to TD 0.850 (representing 50% of recurrentunit cost) and the charge for accommodation in university halls of residence from TD 60 to TD120 a year (25% of current unit cost). Both adjustments take place all at once, at the beginningof the period.
Scenario 3. Private higher education capacity is increased, replacing the public sector, moreparticularly in the economics/ management and the arts/human sciences disciplines, enrollmentin which will grow by 15% a year under this scenario, beginning with the first year of thesimulation period. Such an increase would mean increasing current enrollment in the privatesector practically fourfold.
5.7 The results of the basic scenario simulations are summarized in table 5.1. Two points call forcomment. First of all, if we adhere to the minimalist and conservative hypotheses of this scenario, thesimulations indicate a continuous financing deficit throughout the period,35 rising from 7% in 1997 to28% in 2002, then declining steadily to 20% in 2006. In absolute terms, it would peak at TD 80 milliona year over the period 2002-04. The projections thus send a clear signal: if everything remainedunchanged as regards cost recoverv and cost structure. a sustained budget effort -- an annual increase of6% in the operating budget--would be insufficient to finance the expected expansion of enrollment. Therequired investment effort would be even greater: MES staff have calculated it at about TD 136 milliona year over the Ninth Plan period.
Table 5.1 The Basic Scenario and its "Pessimistic Variant":Financing Deficits
5.8 Turning to the second point, it has to be borne in mind that the basic scenario hypotheses areoptimistic in several respects. At least three series of factors could potentially boost the financing deficit:
(a) Enrollment: The new high school graduate (bachelier) enrollment figures are thoseprojected by the Ministry of National Education (MEN). They are based on given secondary enrollment,repeater and dropout rates and finally baccalaureat success rates. If the authorities decided to boost newbachelier inflows by adjusting any of these variables (which is to be desired, in view of the weak secondary
A deficit is defined as the shortfall between available resources and operating expenditure. The percentagedeficit (or surplus) is calculated on resources.
- 43 -
enrollment rates and Tunisia's economic ambitions), total bachelier enrollment would be raised and with itthe financing deficit.
(b) Expenditure: The basic scenario assumes the status quo in terms of quality, i.e. that noeffort is made to enhance it, for example by improving teacher/student rates (analysis of the behavior of unitcosts shows that they decline with increasing enrollment, a fact that can be explained either by economies ofscale or by an effective decline in quality or, most likely, a combination of the two--see graph 3.1).
(c) Resources: The pace of growth of the Tunisian economy may not be sustainable at 6%throughout the ten-year projection period; after all, the Tunisian economy is still partly vulnerable toclimatic hazards: GDP growth averaged 4.5% over the period 1987-94 then slipped back to 3.3% in 1994and 2.6% in 1995. In its projections for the period 1998-2003, the Country Assistance Strategy--(CAS)looks to average annual growth of 5.2%, with fluctuations within the range 3.5-6.2% (World Bank 1996d).By way of indication, based on a definitely pessimistic hypothesis, we note that a decline in annual GDPgrowth from 6 to 3% over 1998-2001 would have major repercussions on the financing deficits in the basicscenario, raising them from 12 to 15% in 1998, from 23 to 34% in 2000 and from 28 to 43% in 2002 (table5.1). In this case the decisive variable turns out to be economic growth.
5.9 This leaves no alternative but to act by raising the students' contribution to the costs until nowcharged to the budget. This is done in simulations 1, 2 and 3 which, in one form or another, proposeboosting internally-generated resources by raising tuition fees (scenarios la, lb and 1c) and universitysocial services charges (scenario 2) and through a de facto increase in other resources via increased privateenrollment (scenario 3).36 Table 5.2 suggests that, ceteris paribus, raising tuition fees clearly offers thegreatest scope for bridging the financing deficit. followed by raising student services charges. Greaterprivate-sector participation would have only a limited impact compared with the basic scenario, and thebudgetary argument, though real, would not suffice by itself to justify increased private-sector participationin higher education. (The projections are detailed in Annex 18).
Table 5.2 Alternative Scenarios: Financing Surpluses and Deficits(1997-2006)
Source: Projections based on the MES model.Note The gray boxes mark a deficit-minimizing critical path.
36 From the point of view of government financing, this hypothesis is equivalent to a situation in which
private sector students are enrolled in the public system and pay tuition fees equal to recurrent unit costs.
-44 -
5.10 None of the measures described in the three scenarios would suffice by itself to meet the financingneeds generated by expansion of the system. Even with a sharp increase (30%) in tuition fees,37 the currentbudget would remain in deficit (with the deficit possibly fluctuating within the range TD 10-15 million ayear for four years) up to 2006. This necessitates applying a combination of these measures. Purely by wayof illustration, we note that raising the tuition costs recovery rate to 30%, reassessing hostel and cafeteriacharges and at the same time raising private enrollment by 15% a year would produce a financing surplusranging between 5 and 16% throughout the period in question.
5.11 Without going that far, it should be noted that, just as the basic scenario was resolutely optimistic,so the scenarios depicted in table 5.2 are highly theoretical in that they simulate events (increases in feesand charges, increased private sector participation) occurring immediately and all together at the beginningof the period, just when the prevailing circumstances will require that they be phased in. Politicalfeasibilitywill continue to be the sole criterion in determining the appropriate combination of these measures andtheir implementation timing and in charting the critical path of necessary decisions for durable financing ofexpansion (see Haddad 1993 for a discussion of the prerequisites of success in implementing educationreforms). The interdependence of the measures becomes particularly critical when we factor in the equitycriterion. Thus, setting social services (room and board) charges at close to cost, justified in financing termsand in order to attract the private sector to invest in these services, would correlatively entail reassessing thescholarship amounts, which would in turn call for stronger selectivity in awarding them (see III.C above).
C. Trimming Costs
5.12 The fragility of the basic scenario, together with the political difficulties inherent in speedyimplementation of a meaningful cost recovery scheme as in the alternative scenarios, suggests the need toconsider cost-cutting measures. Two kinds of measures are possible, i.e. measures designed to (i) reduceproduction factor costs, and (ii) enhance the internal yield of the system.
5.13 Reducing production factor costs. The expected expansion will necessitate an appreciableincrease in human resources, especially teaching staff. However, recruitment sources are limited in relationto needs (nearly 1,000 new teachers a year, including nearly 900 for the MES, while maintaining the currentteacher/student rates--see Annex 19). It would therefore be advisable to investigate whether raising theteachers' statutory number of hours a week would be an effective means of raising potential teachingcapacity. Since the current teaching workload is so small, raising it obviously offers a natural source ofsavings.
5.14 In performing the calculations it is useful to distinguish clearly between two concepts: potentialteaching capacity, and actual teaching workload. "Teaching capacity" is defined as the total annual numberof statutory hours of teaching in a given establishment, which comes down to theoretical capacity toconduct courses using the "nornal" hours owed by the teachers. The establishment's "teaching workload"is equal to the total hours of teaching (supervised work (SW) equivalent) required to teach the subjectsleading the students enrolled in the establishment's various disciplines to their degree; in other words, it isthe true expression of need. It was possible to quantify these concepts precisely by applying the HigherEducation Analysis and Management System (Systeme d'Analyse et de Gestion de 1 'EnseignementSuperieur--SAGES) as part of the Higher Education Restructuring Project (World Bank 1992). For most
Envisaged as a possibility by the Plan Commission.38 Given the 26 weeks of courses per year, the potential teaching capacity is 26 times the product of "number
of teachers per category multiplied by number of statutory hours expressed in equivalent SW hours".
- 45 -
education disciplines, the teaching workload is of course higher than the potential workload.39 At presentthe teaching deficit is met by means of additional hours.40
5.15 For the country as whole. the teaching deficit represents a substantial proportion of teachingpotential: 56%, which is equivalent, in terms of staff working under the current statutory conditions, toabout 2,500 teachers.4 ' Table 5.3 summarizes teaching potentials, workloads and deficits, by university.While many faculties (Sciences in Tunis; Sciences at Sfax; Arts and Economic Sciences at Sfax; Arts atSousse) have deficits of over 50%, the situation is even more critical in some schools, which have deficitsexceeding 100% (the detailed results, by establishment, are given in Annex 20).
Table 5.3 Teaching Potential and Workload, by University
NM: In calculating the deficits only the understaffed disciplines are taken into account.a/ In this case, there is a surplus.
5.16 In these circumstances, increasing the teachers' statutory number of hours would enable MES toachieve two objectives, Initially, it would reduce the deficit and thereby help reduce new recruitment needs.In the following period (by means of certain remuneration adjustments), it would slow the growth of the
total salary bill, compared to its growth without any increase in statutory hours.
5.17 To be able to fine-tune the first-phase simulation it would be necessary to do the calculations foreach establishment. Let us consider, purely by way of indication, the national level. Assuming, for thecurrent year, a uniform pro am workload increase of 30% for all teachers, the teaching deficit would bereduced by 264,400 hours. MES would then have several options. They include (i) simply curtailing the
The only establishments without deficits are the faculties of pharmacy, medicine and surgery, ENIT andPolytechnique-Tunis, IPEST and INSAT, ENIS and ENIG, and three of the twelve ISFMs.
40 Additional hours are designated heures complmentaires when worked by a tenured teacher and heuressuppl6mentaires in the case of a part-time teacher.
41 The sum of the deficits for all disciplines of a given establishment is its teaching deficit. This is thearithmetic sum of the true deficits; disciplines with a negative deficit ("teaching surplus"), i.e. overstaffeddisciplines, are not taken into account.
42 The increase in potential teaching capacity (reduction of the deficit assuming that all teaching hours areinterchangeable) for the year would be 0.3 x 881,320 = 264,400 hours.
- 46 -
number of additional tenured/part-time staff hours by 264,400, and (ii) combining a reduction in the numberof new teacher recruitments with a cut in the tenured/part-time additional hours budget.
5.18 The purely financial repercussions of such a decision on reducing the salary bill would depend on anumber of politically sensitive hypotheses, notably agreements concluded with the unions. Despite itsstrong logical justification and its potentially important overall financial impact, the measure obviouslyneeds to be studied meticulously since it reaches far beyond this financial context and would have profoundrepercussions on the profession. In particular, it should only be envisaged in measured combination withthe suggested changes in the organization of the profession (see IV.D above). It could not be separatedfrom the issues of "specialization" in teaching and research activities and in addition ought to beconsidered in conjunction with the question of reorganization of the first cycles. This is a perfect exampleof an area that will callfor compromises between the parties.
5.19 Improving the system's internal efficiency. As indicated in chapter III, the internal efficiency ofhigher education in Tunisia leaves something to be desired. In 1995/96, repeaters accounted for 31% ofenrollment (Annex 4), a substantial waste of human and financial resources. This points to the need to cutthe number of repeaters. Reducing their number by half, for example, would yield appreciable savings,amounting to about 15% of recurrent expenditures under the basic scenario and a substantial reduction inthe financing deficit, which would peak in 2002 at 9% instead of the basic scenario's 28%.43 Here,therefore, we have another means of action. It could not, any more than the others, be implementedimmediately. Creating first-cycle colleges would undoubtedly produce an improvement in output andthereby help reduce unit operating costs. Finally, there is no reason to think--pending a detailedpreinvestment study--that the initial investment costs it would generate exceed those that would benecessitated in any event by the growth of student reception capacities if the structures remainedunchanged.
5.20 The situation will rapidly become critical. However, MES has a battery of measures at its disposalthrough which to ensure the sustainability, in terms of both financial and human resources, of the expectedenrollment expansion and at the same time enhance internal efficiency; provided these measures are taken,it will be possible to maintain quality and perhaps even to improve it. In addition to the measures suggestedabove, there are in fact other means of action that merit study. These include: (i) increasing theestablishment's internal resources (through growth of continued training, renting of premises and equipmentto associations and enterprises, and so on),4 and (ii) increasing the number of weeks in the university year.This last measure would offer two advantages. First, it would generate savings by raising potential teachingcapacity (lengthening the year by five weeks would raise it by nearly 20%); second, it would result inimproved utilization of premises.
5.21 Once the options have been clarified by means of technical analyses, the choice of the reforms andtheir combination packages, proportioning of the measures and timing of their implementation will, ofcourse, be policy decisions. Points of attack and opportunities for action are not lacking, even though the
A refined simulation would require knowledge of the following factors: conditions of improvement ofinternal efficiency, by discipline, establishment and cycle (for example, conversion of some first cyclesinto preparatory cycles, upgrading of the pedagogic quality of the teaching body--training, staffing ratios,etc.). It would also have to take into account the decrease in dropouts.Granting the establishments greater financial autonomy, together with a more effective incentives systemthat encourages contract-seeking, would obviously help boost their internal resources. These advantageswould supplement those that could be expected to accrue in other areas (see IV.C above).
- 47 -
constraints are great and the pressures immediate. Since this issue is all about the future of its young peopleand hence of the nation, Tunisia has powerful means at its disposal through which to convert tomorrow'schallenges into opportunities. There are grounds for hope, since from the Tunisian viewpoint "it is moreserious to sacrifice quality than to trim quantitative requirements" (Charfi 1996). The authorities' growingawareness of these challenges strengthens this hope.
- 48 -
BIBLIOGRAPHY
Abdennhader C., Karaa A., et Plassard J.M. 1994. Tester la dualite du marche du travail: l'exemple de laTunisie. Revue d'Economie du Developpement, 1994/1Abdessalem, T. Aout 1995. "Etude strategique No.20. Le Financement de l 'Education. Equite et
efficacite dans la production de 1 'Enseignement Superieur." Ministere de l'Education, Ministere del'Enseignement Superieur, Republique Tunisienne.
Albrecht, D., Ziderman, A. 1991. "Deferred Cost Recoveryfor Higher Education. Student LoanPrograms in Developing Countries." World Bank Discussion Paper No.137.
Albrecht, D., Ziderman, A. 1992. "Funding Mechanisms for Higher Education. Financing for Stability,Efficiency, and Responsiveness." World Bank Discussion Paper No.153.
Albrecht, D., Ziderman, A. 1993. "Student Loans: An Effective Instrument for Cost Recovery in HigherEducation? ". Volume 8, Number 1. The World Bank Research Observer.
Banque mondiale. 1992. "Republique Tunisienne. Rapport d'Evaluation. Projet de Restructuration de1 'Enseignement Superieur. " Rapport No.9795-TUN. Division population et ressources humaines.Departement geographique 1, Region Moyen-Orient et Afrique du Nord.
. 1995a. "Republique Tunisienne. Vers le 21e siecle. Memorandum Economique. " (endeux volumes). Rapport No.14375-TUN. Division des Operations Geographiques I, DepartementMaghreb & Iran, Bureau regional Moyen-Orient et Afrique du Nord.
. 1 995b. "Republique Tunisienne. Allhgement de la Pauvrete : Bdtir sur les Acquis pourPreparer l 'Avenir. " Division des Operations Geographiques I. Departement Maghreb & Iran.Bureau regional Moyen-Orient et Afrique du Nord.
. 1995c. "Republique Tunisienne. Role du Secteur Prive dans la Production et leFinancement des Services d'Education et de Formation. " Rapport No. 1473 6-TUJN. Division desressources humaines. Departement Maghreb et Iran. Region Moyen-Orient et Afrique du Nord.
. 1995d. "Le developpement a l 'oeuvre. L 'enseignement superieur. Les leqons de/ 'experience. "
. 1 996e. "De 'economie planifige ai 'economie de marche. Rapport sur lede'veloppement dans le monde. "
Ben Aiech, C. 1995. "Etude Strategique No.20. Le Financement de l 'Education. Les depenses detransfert dans le secteur de I 'Education et de I 'Enseignement Supe'rieur. " Republique Tunisienne.Ministere de l'Education. Ministere de l'Enseignement Superieur.
Blomqvist, A., Jimenez, E. 1989. "The Public Role in Private Post-Secondary Education. A Review ofIssues and Options. " Working Papers (WPS 240). Country Economics Department
Bowman, M.J., Millot, B., Schiefelbein, E. 1986. "An Adult Like Cycle Perspective on Public Subsidiesto Higher Education in Three Countries. " Economics of Education Review, Vol.5, No.2, pp.135-145.
Castaneda, T. 1986. "Innovations in the Financing of Education: The Case of Chile. " Report No.EDT35.Discussion Paper. Education and Training Series. The World Bank, Education and TrainingDepartment, Operations Policy Staff.
Charfi, M. 1996. "La reforme du systeme educatif en Tunisie."Colclough, C. 1996. "Education and the Market: Which Parts of the Neoliberal Solution are Correct?"
World Development, Vol.24, No.4.Crawford, M., Eisemon, T., Holm-Nielsen, L. 1995. "Interactive Technology and Electronic Networks in
Higher Education and Research: Issues & Innovations. " Working Papers. The World Bank.Human Capital Development and Operations Policy, HCOWP 62.
Delors, J. 1996. "L 'education un tresor est cachg dedans. " Rapport a I'UNESCO de la CommissionIntemationale sur l'education pour le vingt et unieme siecle. Paris, Editions Odile Jacob.
-49 -
Experton, W. 1988. "L 'enseignement supe'rieur en Tunisie. Mission Banque mondiale du 24 janvier au12fivrier 1988. "
Garcia Guadilla, C. 1996. "Situaci6ny principales dinamicas de transformaci6n de la educaci6nsuperior en America Latina " UNESCO.
Haddad, W. 1994. "The Dynamics of Education Policymaking. Case Studies of Burkina Faso, Jordan,Peru, and Thailand " EDI Development Policy Case Series. Analytical Case Studies, Number 10.Economic Development Institute of the World Bank.
Heyneman, S. 1996. "The Quality of Education in the Middle East and North Africa. " Working PaperSeries No.3. Technical Department Europe and Central Asia, Middle East and North Africa.
Higginson, F. 1996. "Le r6le de 1 'enseignant et le changement mondial : document d'orientation."Secteur de l'education, UNESCO.
Hills, G. 1994. "Universities of Tomorrow. " CEPES Papers on Higher Education.Institut National de la Statistique. 1989. "Enquete Nationale Population Emploi. " Republique
Tunisienne. Ministere du Plan et du Developpement Regional.Institut National de la Statistique. 1994. "Annuaire Statistique de la Tunisie. " Republique Tunisienne.
Ministere du Plan et du Developpement Regional. Annee 1992 - 93. Volume No.36.James, E. 1993. "Why is there proportionately more enrollment in private schools in some countries?"
Working Papers No.1069. Public Sector Management and Private Sector Development. CountryEconomics Department. The World Bank.
Jaoua, A. 1995. "Etude Strategique No.20. Le financement de l 'education. Les depenses budgetairesdans le systeme iducatif. " Republique Tunisienne. Ministere de l'Education. Ministere de1'Enseignement Superieur.
Johnstone, D. 1986. "Sharing the Costs of Higher Education. Student Financial Assistance in the UnitedKingdom, the Federal Republic of Germany, France, Sweden, and the United States. " New York,College Entrance Examination Board.
De Ketele, J.M. 1996 "Etude Strategique No.20. Le Financement de V 'Education. Propositions pour uneamelioration de la qualite de 1 'enseignement en Tunisie. " Republique Tunisienne. Ministere del'Education. Ministere de l'Enseignement Superieur.
Lemelin, C., Millot, B., Perrot, J. 1989. "Les depenses publiques pour l'enseignement universitaire et letaux de rendementfiscal : le cas du Quebec et de la France. " Centre de Recherche sur lesPolitiques Economiques. Cahier de recherche No.12. Universite du Quebec a Montreal.
Mingat, A., Tan, J.P. 1994. "International Perspectives on Education: Some Ideas for Data Analysis."The World Bank. Education and Social Policy Department.
Mingat, A. 1995. "Towards Improving our Understanding of the Strategy of High Performing AsianEconomies in the Education Sector. " IREDU ; CNRS and University of Dijon.
Ministere du Developpement Economique, Ministere de l'Education Nationale, Ministere del'Enseignement Superieur, Ministere de la Formation Professionnelle et de l'Emploi. RepubliqueTunisienne. 1996. "Etude Strategique No. 11. Qualifications Professionnelles et Dispositifsd 'Education et de Formation. 2eme rapport d 'etape.
Ministere de l'Education. Ministere de l'Enseignement Superieur. Republique Tunisienne. 1996. "EtudeStrategique No.20. Le Financement de l 'Education. Rapport de deuxieme etape (versionprovisoire). "
Ministere de l'Enseignement Superieur. 1996. Bureau des Etudes, de la Programmation et de laPlanification. Republique Tunisienne. "Les Perspectives d'Evolution de l'Enseignement Superieur1997-2007."
Ministere de l'Enseignement Superieur. 1996. Bureau des Etudes, de la Planification et de laProgrammation. Republique Tunisienne. 1995/1996. "L'Enseignement et la Formation Superieursen Chiffres."
- 50 -
Nelson, S. 1978. "The Equity of Public Subsidies for Higher Education: Some Thoughts on theLiterature. " Paper No.5. The Brookings Institution.
OECD. 1995. "Education at a Glance. OECD Indicators. " Centre for Educational Research andInnovation. Indicators of Education Systems.
Oueslati, A. 1995. "Etude Strategique No.20. Le Financement de I 'Education. " Distribution desdepenses des menages et de l'Etat en matiere d'Education et d'Enseignement Superieur. Ministerede I'Education. Ministere de I'Enseignement Sup6rieur. Republique Tunisienne.
Parker, L. 1992. "Industry-University Collaboration in Developed and Developing Countries. " PHREEBackground Paper Series. Document No.PHREE/92/64. Education and Employment Division.Population and Human Resources Department. The World Bank.
Rama, M. 1996. "How Bad is Tunisian Unemployment ? Assessing Labor Market Efficiency in aDeveloping Country. " The World Bank.
Sheehan, J. 1995. "New Mechanisms for Funding Higher Education. Recent Experience andImplementation Issues. " Department of Economics. University College. Dublin.
Solaux, G. 1996. "Rapport sur le Secteur Educatif Tunisien. ".Tan, J.P., Mingat, A. 1992. "Education in Asia. A comparative Study of Cost and Financing. " World
Bank Regional and Sectoral Studies.UNESCO, 1995. "Changement et developpement dans 1 'enseignement supirieur . document
d'orientation. " Organisation des Nations Unies pour l'education, la science et la culture.West, E. 1995. "Education with and without the State. " Working Paper HCOWP 61. Human Capital
Development and Operations Policy. The World Bank.West, E. 1996. "Education Vouchers in Practice and Principle. A world Survey. " Working Papers
HCDWP 64. Human Capital Development. The World Bank.Winkler, D. 1994 "La Educacion Superior en America Latina Cuestiones Sobre Eficiencia y Equidad."
Documentos para discusi6n del Banco Mundial.Woodhall, M. 1983. "Student Loans as a Means of Financing Higher Education. Lessons from
International Experience. " World Bank Staff Working Papers Nr.599.Woodhall, M. 1990. "Student Loans in Higher Education. Western Europe and the USA." Intemational
Institute for Educational Planning.World Bank. 1993 "The East Asian Miracle. Economic Growth and Public Policy."
. 1995. "Claiming the Future. Choosing Prosperity in the Middle East and North Africa."
. 1996a. "Memorandum and Recommendation of the President of the International BankforReconstruction and Development to the Executive Directors on a Country Assistance Strategy ofthe World Bank Group for the Republic of Tunisia. " Report No.1 5617-TUN. Country Operations I.Maghreb and Iran Department. Middle East and North Africa Region.
. 1996b. "Vietnam. Education Financing Sector Study. " Human Resources OperationsDivision. Country Department 1, East Asia and Pacific Region.
. 1996c. "Teaching to Succeed. Education in the Middle East and North Africa."
. 1996d. "Republic of Tunisia Education and training Strategy Note. " Human ResourcesGroup. Middle East and North Africa Region.
Za'Rour, G. 1988. "Universities in Arab Countries. " Working Paper. Policy, Planning, and Research.Education and Employment. Population and Human Resources Department. The World Bank.
Annex IPage I of I
STRUCTURE OF EDUCATION IN TUNISIA
HIGHER EDUCATION Year
FI_l +H++ 1 13 1~~A!cAA~BA
SC. A. Exper. 4e A. Math 4e A. Arts 4e A. EconlMan 4e A. Tech. F i
Source: Ministry of EducationPrimary Education StatisticsSchool year 1995/96
Annex 3Page 1 of 1
Higher Education Enrollment: Trend and Distribution
1. Enrollment Trend (1961/62 - 1995/96)
Year Enrollment Average Annual Growth Rate1961/62 2310 --1970/71 10350 18.11980/81 30150 12.61985/86 41590 6.61990/91 66540 9.91995/96 112630 11.1
II. Enrollment Distribution, by Establishment (1995/96)
Ezzitouna University 950Tunis I University 20670Tunis 11 University 22370Tunis III University 24770Center University 21970South University 16880ISET 2120ISFM 2910Total 112650
III. Enrollment Distribution, by Discipline (1995/96)
Discipline Enrollment Share (%)Literature, arts, human and religious 36310 32.2sciencesLegal, economic and management 37540 33.3sciencesBasic sciences 14500 12.9Technical sciences 5570 5.0Medical and biological sciences 13900 12.3Agricultural and agro-food sciences 1920 1.7Teacher training 2910 2.6Grand Total 112650 100.0
IV. Enrollment Distribution, by Cycle (1995/96)
Cycle Enrollment Share (%)Ist cycle 67550 60.02nd cycle 34280 30.43rd year and + 3960 3.53rd cycle 6850 6.1Total 112650 100.0
Source: Ministry of Higher Education 1996
Annex 4Page 1 of 1
Repeating in Higher Education (1995/96)
New Students Repeaters Totalenrollment % enrollment % enrollment
Ezzitouna University 470 57 350 43 820
Tunis I University 10570 54 8900 46 19460of which:Faculty of Arts, Manouba (M) 4290 51 4060 49 8350Journalism and Inform. Sciences 660 96 30 4 690Institute (m)
Tunis II University 14640 79 3970 21 18610of which:Sciences Faculty, Tunis (M) 5170 67 2490 33 7660National Engineering School (m) 880 93 60 7 940
Tunis III University 18750 76 6020 24 24770of which:Faculty of Law (M) 4240 61 2700 39 6940Business College (m) 1360 93 100 7 1460
Center University 13940 68 6550 32 20490of which:Faculty of Arts, Sousse (M) 2190 53 1970 47 4160Faculty of Medicine, Mounastir 640 89 80 11 720
(m)
South University 9860 66 5080 34 14940Of which:Faculty of Arts & Human 2000 49 2080 51 4080Sciences, Sfax (M)National Engineering School, 720 90 80 10 800Sfax (m)
ISET 1760 89 210 11 1970TOTAL 69990 31080 101070Note: Date relating to establishments with over 500 students.
For each university, the table shows the establishments with the highest repeater rate(M) and the lowest repeater rate (m).
Source: Ministry of Higher Education 1996.
Annex 5Page 1 of 1
GDP, State Budget, Education Budget and Higher Education Budget(1981-94)
Year GDP State State Budget Education Education Higher Higher Higher(DT Budget (*) as share of Budget (all Budget as share Education Education Education
millions) (DT GDP (%) levels) (*) of State Budget Budget Budget as Share Budget as Sharemillion) (DT million) (%) (*) of Education of State Budget
(DT million) Budget (%) (%)
1981 4162 1046 25.1 201 19.2 45 22.4 4.3
1984 6240 1700 27.2 352 20.7 71 20.2 4.2
1991 12172 3055 25.0 736 24.1 155 21.2 5.1
1992 13994 3285 23.5 814 24.8 170 20.9 5.2
1993 15246 3586 23.5 877 24.5 190 21.7 5.3
1994 16173 3910 24.2 980 25.1 221 22.6 5.7
Note: * The budgets are the sum of the operating and capital budgets.Source: Ministry of Higher Education 1996
Annex 6Page 1 of 1
COMPARATIVE CHANGES IN ENROLLMENT AND UNIT COSTIN HIGHER EDUCATION
900 (1972-1994)
800
+ Enrollment700 -0- Unit Cost
600
(0500
-400
300
200
100
N n I T (to co ( co 0 N cX IT t 0 1- co ) O0 - N XaNl- t- rN- N- N- N,- Nl- t- co c GO co co (0(0 ( co co co 0) 0) 0) 0) 0o) a) ) a) cl) C) a) a) 0) 0) 0) 0) 0) a) 0 0) ax a) 0) a 0) 0) a )
Years
Annex 7Page 1 of 1
Unit Costs in Higher Education: International Comparisons
Unit Costs as Unit Costs Ratio:Costs Unit Costs Share of Per Higher Education/
($) Capita GDP (%) Primary EducationRegionMENA Region (1990)Tunisia 1926 135 9Egypt 1515 230 12Jordan 1514 128 9Morocco 959 92 5
Asia Region (mid-1980s)Indonesia 497 106 7Korea 2132 104 4Malaysia 3540 190 14Thailand 1267 178 3
Latin America(1981)Average 991 67 8OECD (1992)United States (public) 11880 52 2France (public) 6020 33 3Netherlands 8720 53 3Spain 3770 29 2New Zealand 6080 43 3Average 7940 45 2Sources: MENA region: World Bank 1996c
Asia: Tan and Mingat 1992OECD: OECD 1995Latin America: Winkler 1994
Annex 8Page 1 of 1
Higher Education Operating Budget: Distribution by Expenditure Categories(1987 and 1994)
TEACHER RECRUITMENT PROCEDURES IN HIGHER EDUCATION
1. Assistants
Assistants are recruited by competitive examination before a national jury.Candidates are required to hold a secondary education teaching certificate, an advanced studiesdegree or a diploma attesting to six years of higher education. They are also required to provideevidence that they are preparing a thesis and that it is sufficiently advanced for them to be able todefend it within a time limit of three years, which can be extended only twice, for one year.
There is a separate national jury for each discipline. It comprises three professors,lecturers or assistant lecturers elected by the entire teaching body at these grades in the disciplineconcerned plus two other teachers of these same grades appointed by the minister, who maybelong to foreign universities. The recruitment examination consists of a discussion relating tothe work carried out by the candidate and the latter's discipline and the state of progress of thethesis. On the other hand, no prior pedagogic training is required (nor in fact is any organizedtraining provided within the university).
The pertinent regulations state only that the jury shall take into consideration,inter alia, the course work done; however, the wording leaves the impression that it is thedisciplinary content of the course, much more than its pedagogic design, that will be decisive.
An assistant first of all serves a two-year probationary period, at the end of whichan evaluation is performed by two grade A teachers in the same discipline. The latter draw up areport and submit it to the establishment's scientific council, which renders an opinion withrespect to confirmation in the grade. While the regulations provide that the two evaluators maycarry out a "teaching inspection" of the classes the assistant teaches, the regulations indicate thattimely completion of the thesis is the decisive factor (in fact, the state of the work, indicating thatcompletion can be expected by the prescribed deadline), and in practice teaching inspectionnever takes place save perhaps in very exceptional cases.
Assistants are required to perform 13 hours of practical work (PW) or 9 hours ofsupervised work (SW) a week. In principle, they are not required to do course work; if they do,one course hour is equated to 1 hr 50 mins of SW or 2 hr 45 mins of PW. However, to allowcandidates to present the thesis within the time limit, the teaching program can be reduced to 8hours of PW or 5 hours of SW, for a maximum of three years, by decision taken by the presidentof the university in light of the opinion of the scientific council of the candidate's establishmentand the report of the thesis director. The assistant grade comprises seven echelons.
2. Assistant Lecturers (maltres-assistants)
Assistant lecturers are also recruited by means of a national jury specialized bydiscipline. Their duties are to assist the professors and lecturers in organizing teaching programs
Annex 13Page 2 of 3
and examinations and monitoring the work of the assistants. Candidates are required to hold adoctorate (or one of the old diplomas: state doctorate and 3rd-cycle doctorate). The jurycomprises five professors or lecturers from the discipline in question, three elected and twoappointed. The examination consists of a 20-minute presentation and a 1-hour public discussionsession relating to the work of the candidate and the latter's discipline. The jury also takes intoconsideration the projects, studies, course work, etc. done by the candidate. In the case oftenured assistants who have presented their doctorate, the recruitment jury consists of apromotion commission which decides in light of two reports, drawn up by two of its members.
Assistant lecturers are required to perform teaching service comprising 12 hoursof PW and 8 hours of SW a week; course work carries the same equivalencies as for assistants.Their tenure is confirmed following one year of probation. The assistant lecturer gradecomprises six echelons.
3. Lecturers (maitres de confirence)
Candidates for the grade of lecturer are required to hold, in addition to thedoctorate, the university habilitation certificate, itself issued by the establishment authorized todo so by the minister. Candidates may also hold a Tunisian or foreign state doctorate or aforeign doctorate and foreign habilitation, provided they possess teaching and researchexperience.
To obtain habilitation, an assistant lecturer (a candidate for habilitation mustpossess this grade), is required to present documentation including a set of publications and adetailed summary report on research activities conducted; where appropriate, the candidate mayalso present a second report on teaching and monitoring activities.
Authorization to appear before a habilitation jury is granted by the dean with theagreement of the Doctorate and Habilitation Theses Commission and in light of two favorablereports drawn up by two professors or lecturers designated by the this commission.
The jury comprises five members, including at least three professors, designatedby the president of the university upon proposal by the dean. The jury may include membersbelonging to a foreign university. The two rapporteurs form part of the jury. The examinationconsists of a presentation to and a discussion with the jury, which assesses the candidate's abilityto design, direct, lead and coordinate research activities.
Having obtained the certificate of habilitation, assistant lecturers are required topresent themselves at the lecturers recruitment competition armed with documentation settingforth they works they have conducted, together with a detailed report on their teaching andmonitoring activities and, where appropriate, their participation in the life of the institution.
The national jury for the discipline concerned, consists of five professors, threeelected and two appointed.
Annex 13Page 3 of 3
The examination comprises:
- a discussion, lasting a maximum of two hours, on the work performed andthe discipline in question,
- and/or a one-hour discussion on the work performed and the disciplineplus a half-hour lesson, following eight hours of preparation, relating to aspecialized subject of the discipline chosen by the candidate.
Assistant lecturers with at least three years standing may choose either option;others must undergo the second option. The jury takes into account both tests and the value ofthe work done, the courses conducted and the teaching, scientific, monitoring, etc. activitiesperformed by the candidate. Lecturers serve a one-year probationary period before beingconfirmed in the grade and are required to perform 4 hr 30 minutes of course work per week. Ifthey perform PW or SW, one hour of PW is assimilated to 30 minutes of course work, and onehour of SW to 45 minutes of course work. The lecturer grade comprises four echelons.
4. Professors (professeurs)
Candidature for the grade of professor is open to lecturers with at least four yearsof seniority in that grade. They are required to present a detailed report describing their teaching,scientific and monitoring activities and their participation on the life of the institution.
Recruitment is the responsibility of a national consultative commission for eachdiscipline, composed of five professors, three elected and two appointed, who may belong to aforeign university.
The grade of professor comprises four echelons. There is no probationary period.
The special statute prescribes a common definition of the functions of professorsand lecturers: preparing programs, supervising assistant lecturers and assistants, coordinating theteaching and research teams, monitoring the work of the students, and responsibility forexaminations. The weekly service requirements are the same as for lecturers.
Annex 14Page 1 of I
Distribution of Teachers, by Categories and Establishments (1995/96)
Contract Statutory Staff Other GrandStaff Staff Total
(1) Category Category (2) Total (3)A B
Ezzitouna University 4 12 39 3 54 58Tunis I University 85 95 452 210 757 842Tunis II University 155 278 915 805 1,998 2,153Tunis III University 97 78 468 110 656 753Center University 143 100 486 453 1,039 1,182South University 131 79 495 264 838 969ISFM 0 0 0 319 319 319ISET 84 4 88 27 119 203Total 699 646 2943 2291 5780 6479
Source: Ministry of Higher Education.(1) Including foreigners (41% oftotal contractual staff).(2) Including teaching-hospital categories.(3) MES and jointly supervised establishments.
Annex 15Page 1 of 1
Distribution of Public and Private Expenditure by Type of HigherEducation Establishment in Various OECD Countries (1992)
Public Subsidized private Non-subsidized Totalestablishments establishments private
_ _ _ _ _ _ _ _ _ _ ~~(% )Tunis I UniversityFaculty of Arts, Manouba 44040 67303 17368 39.4Faculty of Human and Social Sciences, Tunis 49355 54844 17790 36.0Living Languages Institute, Bourgiba 23187 32369 13198 56.9Journalism and Information Sciences Institute 10425 16544 9312 89.3Advanced Documentation Institute 4150 9459 6617 159.4Advanced Leadership, Culture and Youth Institute 4836 9096 8192 169.4
Subtotal 135993 189615 72477 53.3Tunis II UniversityFaculty of Sciences, Tunis 77975 112381 44642 57.3Nat. School of Archit. and Urban Planning, Tunis 18536 31861 17486 94.3School of Fine Arts, Tunis 24513 30009 9914 40.4ENSI 8220 14452 9620 117.0ENITPolytechnique School, TunisCollege of Science and Technology, Tunis 34992 38002 12407 35.5IPEI, Nabeul 20185 25810 7937 39.3Faculty of Sciences, Bizerta 24535 42211 19174 78.1IPEST X
Subtotal 220055 332590 152651 69.4Tunis III UniversityFaculty of Law and Political Sciences, Tunis 32571 34729 6733 20.7Fac. of Economic and Management Sciences, Tunis 39374 42917 15213 38.6Institute of Advanced Management Studies, Tunis 32729 43394 21126 64.5Institute of Advanced Business Studies 20070 32945 19630 97.8Faculty of Legal, Political and Social Sciences 12215 12428 5500 45.0Business College 17315 17050 6450 37.3Institute of Advanced Accounting Studies 17991 32270 22031 122.5
Subtotal 172265 215733 96683 56.1
Only understaffed disciplines are taken into account.