REPORT OF SUB- GROUP-II ON METALS AND MINERALS – STRATEGY BASED UPON THE DEMAND AND SUPPLY FOR MINERAL SECTOR of The Working Group on Mineral Exploration and Development (Other than Coal & Lignite) FOR THE 12TH FIVE YEAR PLAN GOVERNMENT OF INDIA PLANNING COMMISSION
Transcript
REPORT OF
SUB- GROUP-II ON
METALS AND MINERALS – STRATEGY BASED UPON THE DEMAND AND SUPPLY FOR
MINERAL SECTOR
of The Working Group
on
Mineral Exploration and Development (Other than Coal & Lignite)
(Copper, cobalt, molybdenum, selenium and tellurium) CHAPTER –II LEAD AND ZINC
(lead and zinc, Cadmium, Silver, Nickel, Antimony, Arsenic, Bismuth, Mercury, indium, Tungsten and Tin)
CHAPTER –III ALUMINIUM CHAPTER – IV CEMENT AND LIMESTONE CHAPTER – V DIAMOND AND PRECIOUS STONES CHAPTER – VI GOLD AND PRECIOUS METALS
(Gold, Platinum group of metals and silver) CHAPTER – VII DIMENSIONAL AND DECORATIVE STONES CHAPTER – VIII INDUSTRIAL/NON-METALLIC MINERALS CHAPTER – IX BEACH SAND MINERALS
PREFACE The Planning Commission constituted a Working Group on Mineral Exploration and Development (other than coal and lignite) in the context of formulation of the Twelfth Five Year Plan (2012-17) , for over all development of mining sector keeping in view of future requirement of sector, under the Chairmanship of Secretary, Ministry of Mines, Governments of India vide Office Order No I & M-3(24)/2010 dated 23.02.2011. The composition of the Working Group and its terms of reference are given at Appendix-I. The Chairman of the Working Group constituted four Sub-Groups, of which Sub-Group-2 was set up on the Mineral Output Industries under my Chairmanship with Shri Bhupal Nanda as member secretary. The composition of the Sub-Group and the terms of reference are appended at Appendix-II. Basic thrust of the sub group was to review status of industry, to assess demand and supply of minerals & metals keeping in light o the growth rate of economy & suggest strategies for development of each mineral and even to suggest acquisition of raw material & technology abroad. The first meeting of the Sub-Group-2 was held on 19.04.2011 at New Delhi when it was decided to constitute eleven Core Groups with Co-Convenors to study and give recommendations on various mineral output industries. The composition of these Core Groups is placed at Appendix-III. These Core Groups met a number of times and deliberated on the subject in detail keeping in view the terms of reference of the Working Group as applicable. The reports of the Core Groups bring out the present status and projections for demand and supply of various industries and minerals connected therewith, as well as short-term and long-term strategy for mineral development. Subsequently, in the second meeting of the Sub-Group-2 held on 10.06.2011, draft suggested recommendations were presented before Secretary (Mines) and the suggestions made by the members were noted and discussed again. Subsequently on 30.06.2011 another presentation was made by the undersigned before Secretary (Mines) during the Working Group meeting & all final suggestions received from working group members were incorporated in all reports & recommendations were finalized. The sub group report has an Executive Summary, Recommendations and mineral-wise chapters along with implementation agenda , is the outcome of the combined coordinated efforts of all members of the SubGroup-2 and in particular all the Co-Convenors specifically Shri R.K. Bansal from FIMI. I would like to express my sincere thanks to all the members for their valuable suggestions, active support and contribution.
(G.SRINIVAS) JOINT SECRETARY (MINES)
and
CHAIRMAN SUB-GROUP-2 ON MINERAL
OUTPUT INDUSTRIES
EXECUTIVE SUMMARY
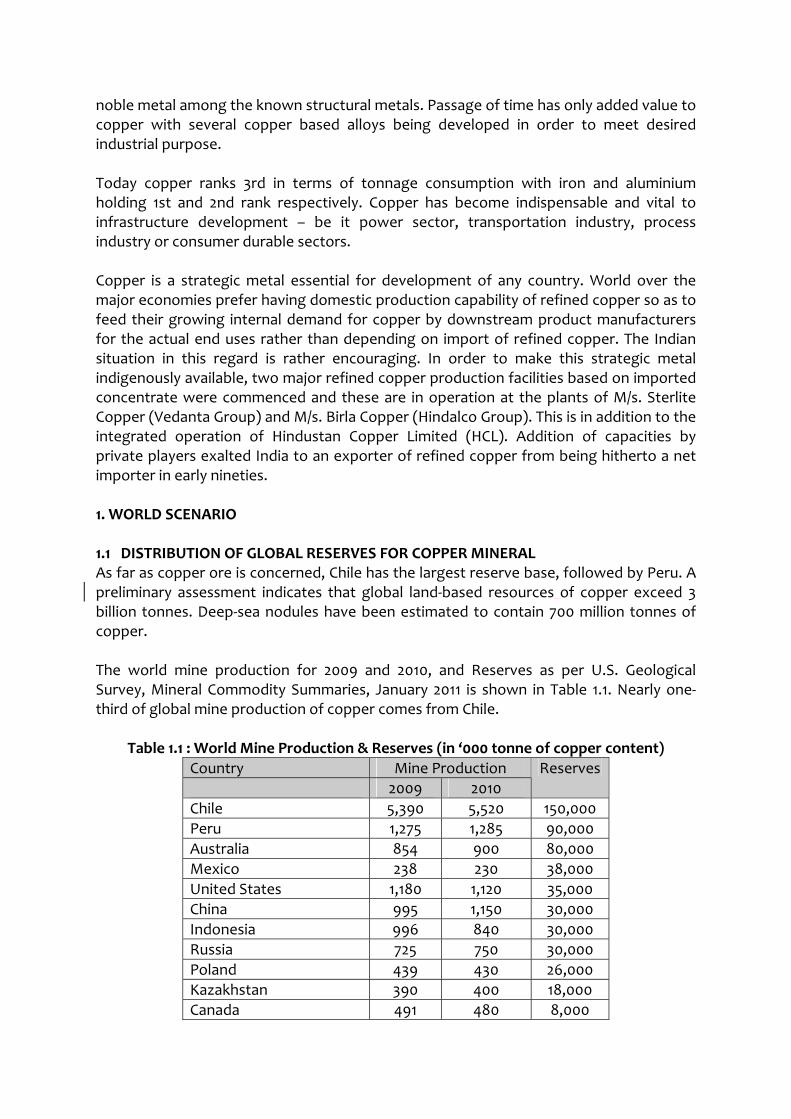
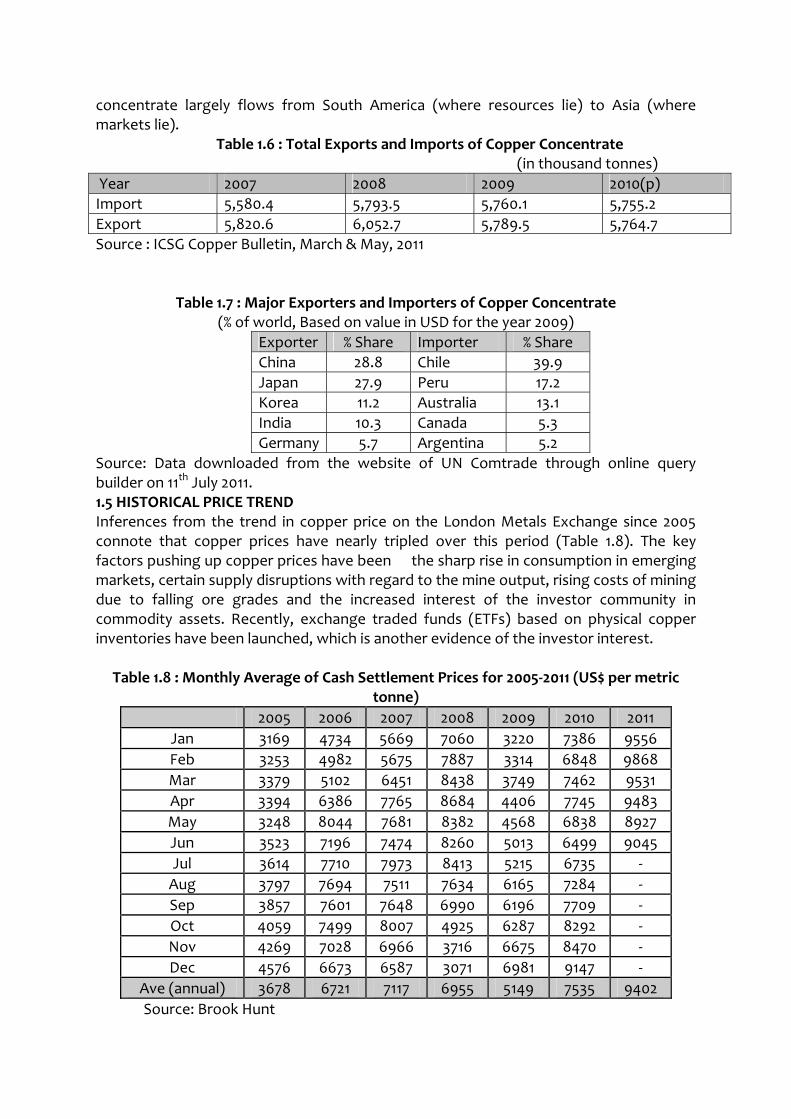
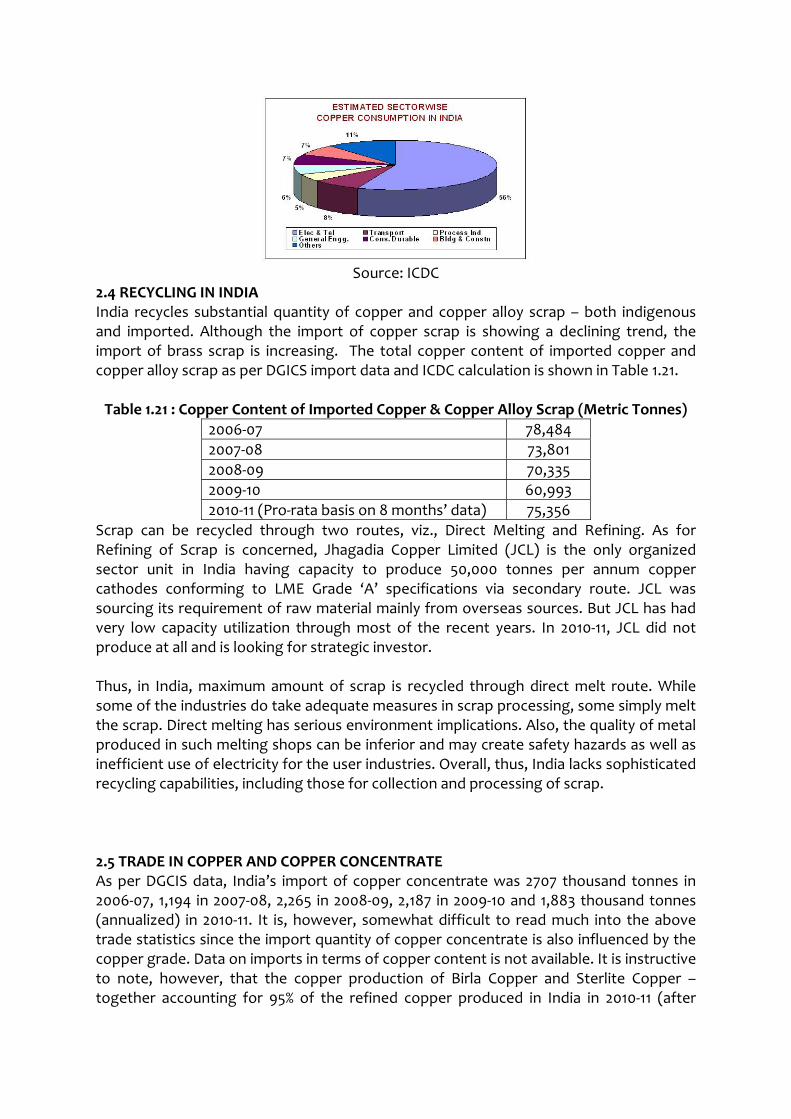
1. COPPER Copper is a strategic metal essential for development of any country. Many countries preferred to build domestic production capability for refined copper to feed growing demand of copper by downstream industries for the actual end uses rather than depending on import of refined copper. To make this strategic metal indigenously available, two major refined copper production facilities based on imported concentrate were installed by M/s. Sterlite Copper (Vedanta Group) and M/s. Birla Copper (Hindalco Group). This was in addition to the integrated operation of Hindustan Copper Limited (HCL). World Scenario As far as copper ore is concerned, Chile has the largest reserve base, followed by Peru. Chile’s share in world copper reserve base is 24%. Total world reserves (contained copper) are estimated at 630, 000 thousand tones. Deep-sea nodules have been estimated to contain 700 million tonnes of copper. Nearly one-third of global mine production of copper comes from Chile (5520 thousand tones in the year 2010) followed by Peru (1285 thousand tones in the year 2010).
Indian Scenario As per the provisional data of Indian Bureau of Mines (IBM) as on 1.4.2010, there has been only minor change in the reserve position between 2005 and 2010. As on 1.4.2010, total reserves of copper are estimated (in metal terms) at 4.8 million tones and resources at 12.3 million tones.
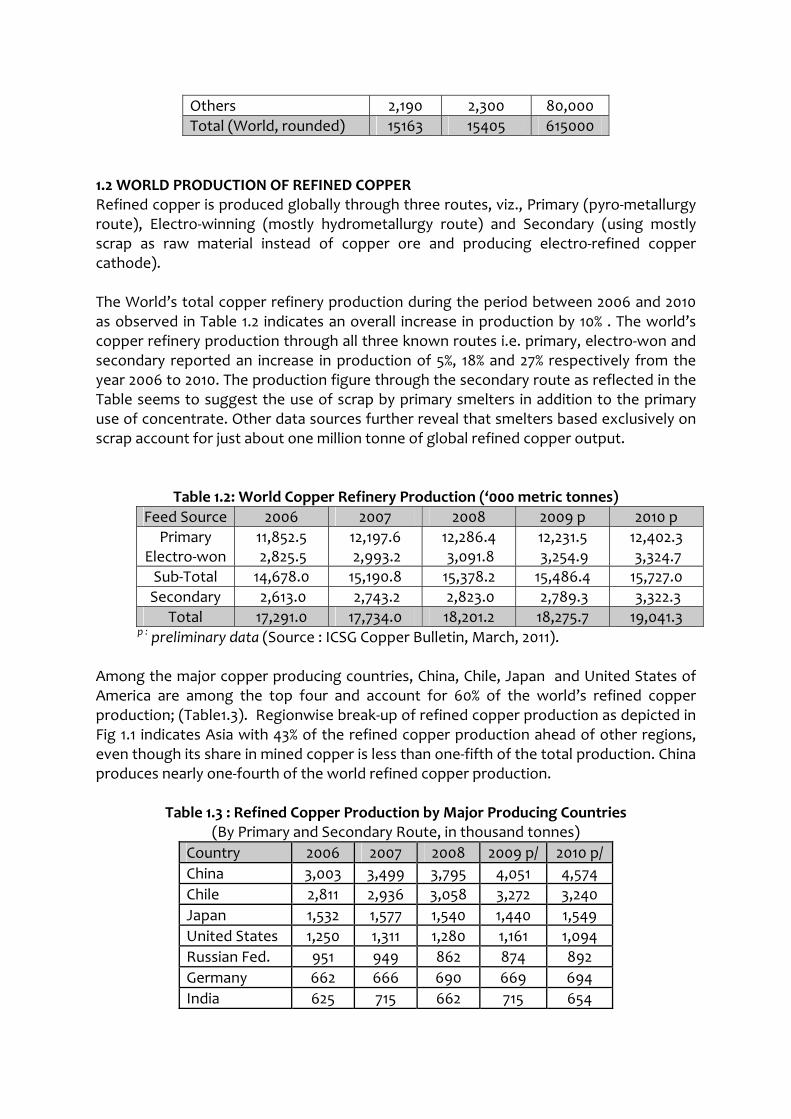
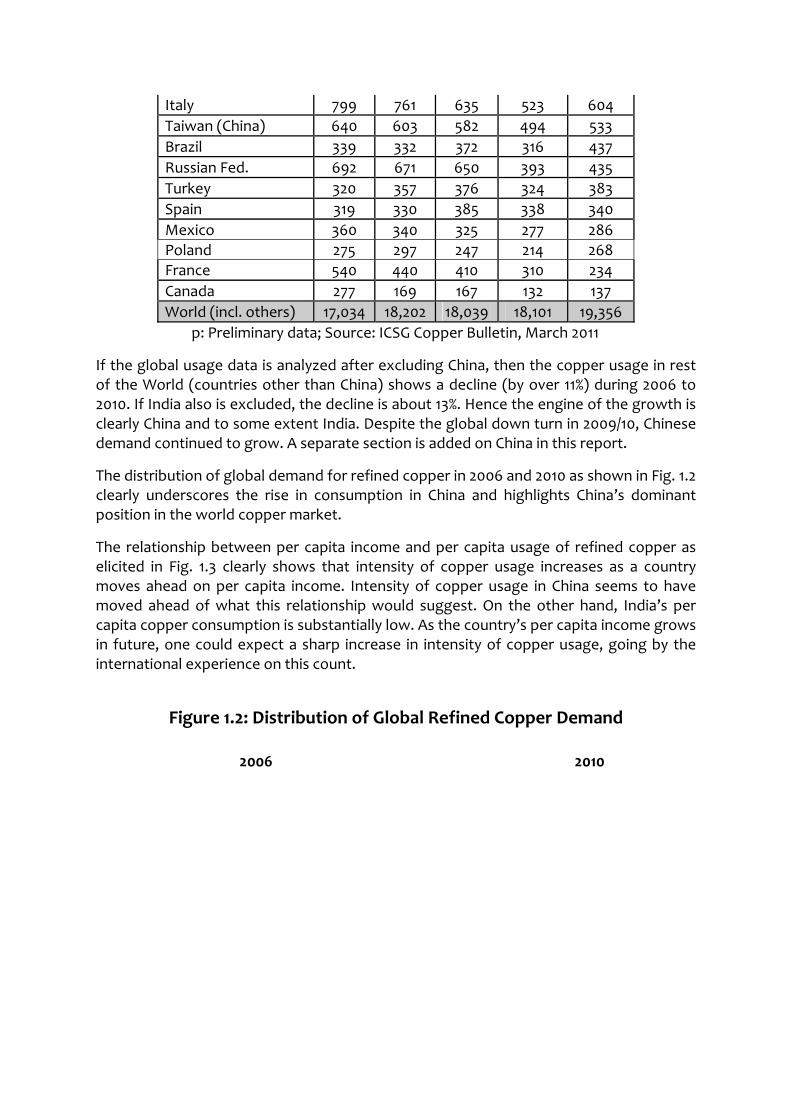
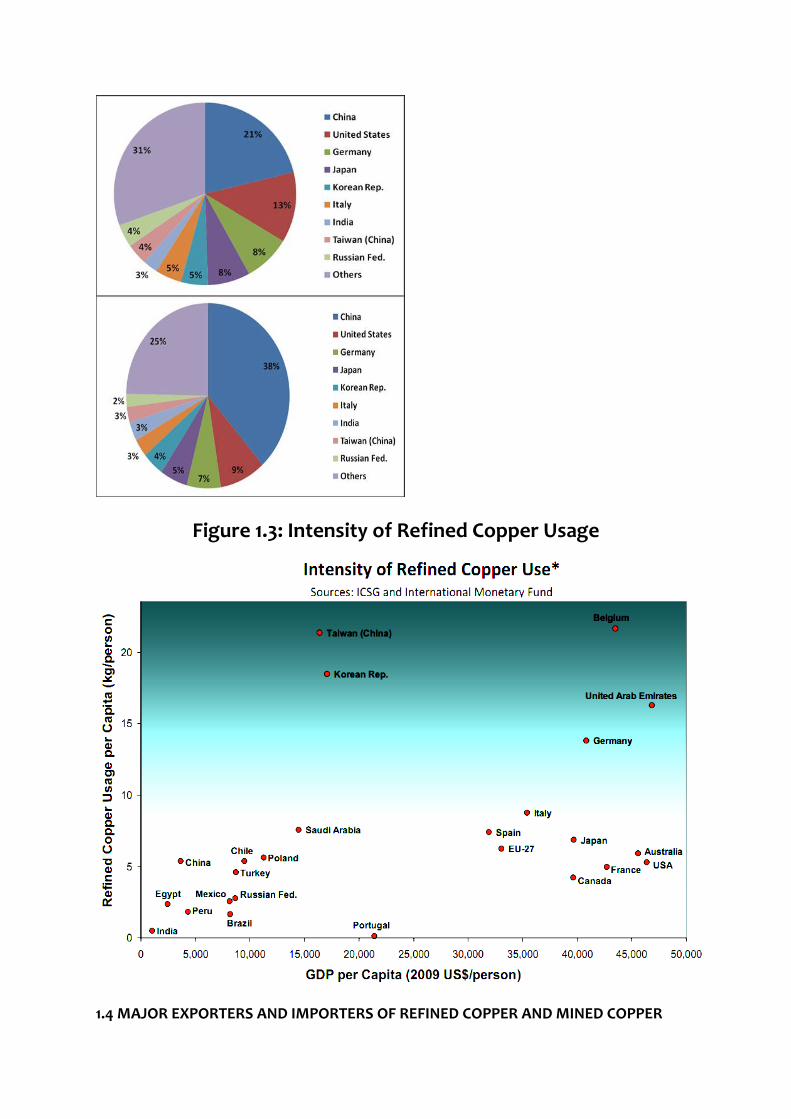
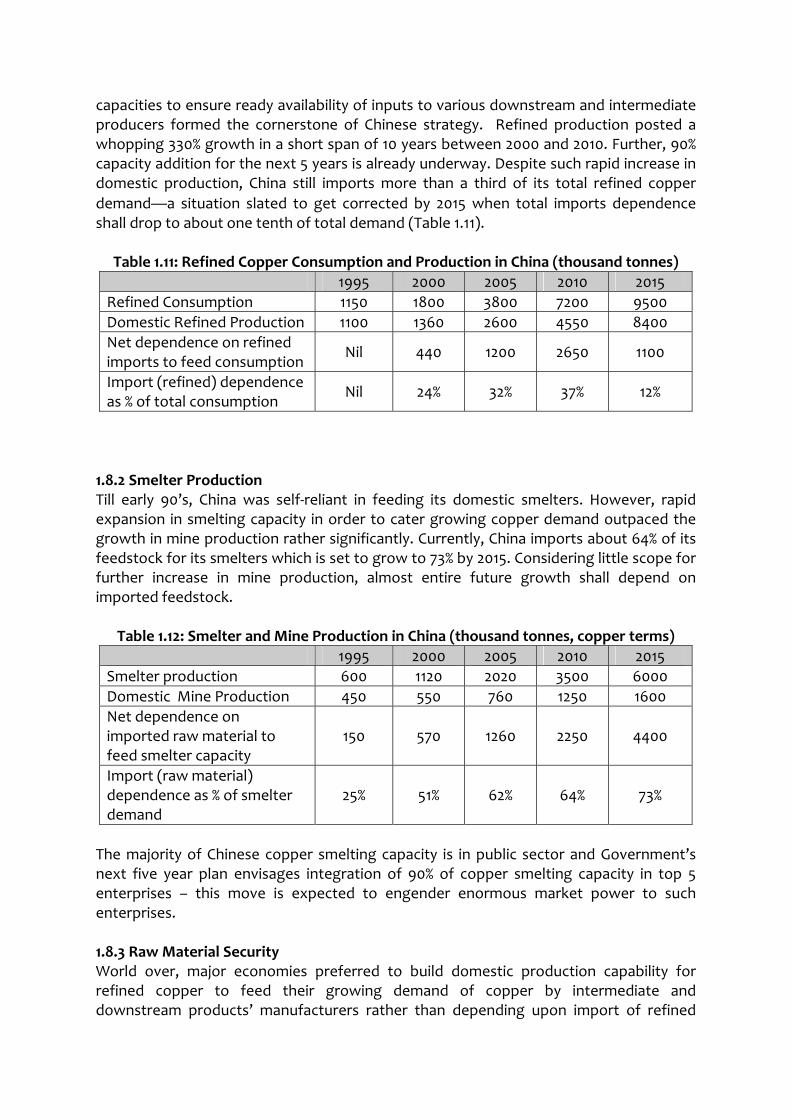
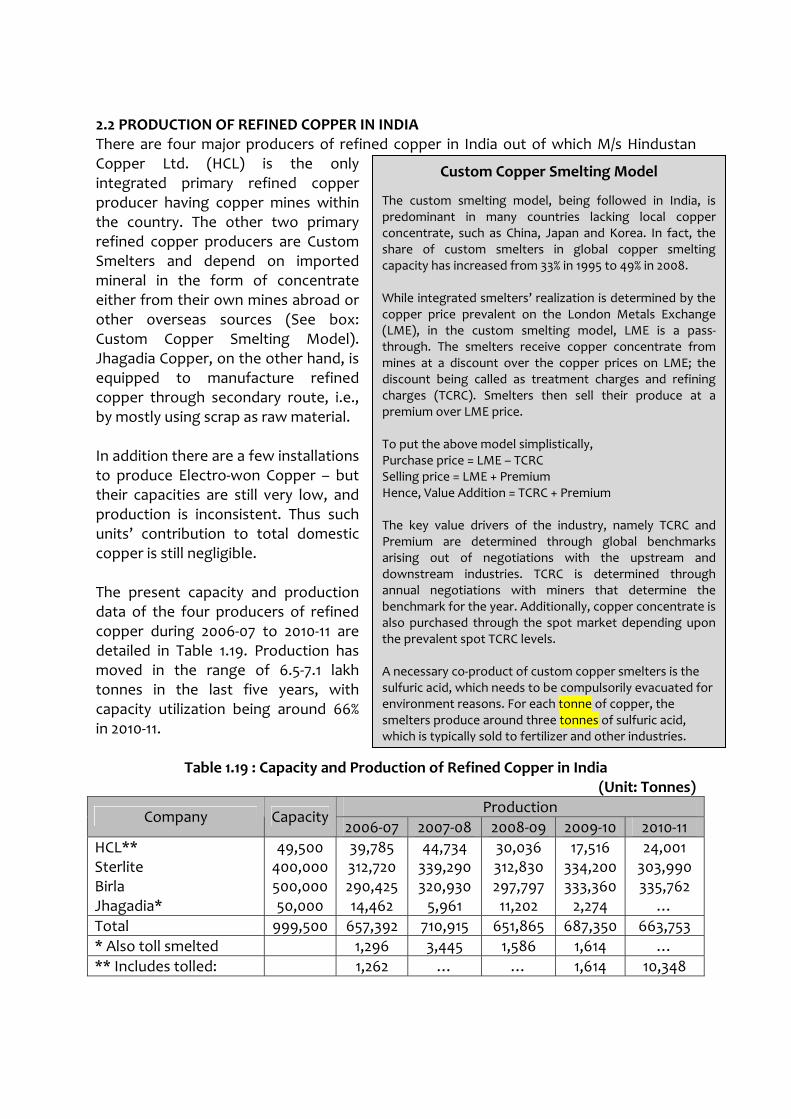
Though India is abundant in copper resources, but the mined production of copper is quite low and stagnant since last five years. HCL is the lone producer of copper in India. It is producing 3.12 million tones of ore and around 30,000 tonnes of metal every year, which is less than 5% of the country’s requirement of copper concentrate. Sterlite and Birla are the leading producers of refined copper in India. Jhagadia copper on the other hand is producing refined copper through secondary route i.e. by mostly using scrap as raw material. The total capacity of HCL for production of refined copper is 51,500 tones.HCL has applied for three RP’s over an extent of 3039.70 ha also applied for three PL’s over an extent of 65.64 ha. DEVELOPMENT OF INDIGENOUS RESOURCES This calls for intensive/ extensive exploration for copper to be taken up in India either by existing copper producers or by inviting independent junior exploration companies for green field exploration by granting RP and PL’s. Export and Import of Refined Copper Major Copper concentrate Export countries are China, Japan, Korea, India and Germany. Major import countries are Chile, Peru, Australia, Canada and Argentina. India’s share in the export of Copper concentrate is 10.3 %. India’s exports were mainly to China and Germany. Raw material security All over the world, major economies preferred to build domestic production capability for refined copper to feed growing demand of copper by intermediate and downstream product’s manufacturers rather than depending upon import of refined copper itself. A case in point is of Japan, whose 100% of primary smelting capacities are based on imported feedstock.
However, more than 70% of such imported concentrates comes from mines wherein Japanese entities have made investment (strategic or financial) – mostly with a proviso to supply proportionate concentrates to smelters in Japan. China is gradually following a similar model to securitize feedstock as entire incremental smelting capacity shall have to be based on imported feedstock. In order to safeguard against supply risk and also to benefit from commodity cycles, China has been aggressively scouting for copper mining assets across the globe. It may be worth mentioning that by 2016, total supply by such overseas mining assets shall touch 1.5 million tonne copper i.e. almost 25% of total domestic demand, hence taking total raw material security of China from domestic and overseas mines to 50%.
The imperative for India is that it will have to compete with China on all fronts (mining assets to raw material supply to refined imports) often with Chinese state enterprises to ensure supply of copper to feed its growing demand. Future Demand and Supply India’s refined copper consumption has increased at 10% per annum over last four years.Electrical, transport and consumer durable manufacturing sector are expecting to lead the growth in future copper demand.The future copper demand by 2015-16 is projected at GDP growth rate of 8% is 1.2 million tonnes.HCL,Birla,Sterlite have indicated expansion plans of production capacities in the coming five years to meet the concentrate requirement(in copper terms) of 1.38 million tones by producing 1.34 million tones at the end of 2015-16.
2. ZINC & LEAD Zinc is the third most used non-ferrous metal after aluminium and copper. Globally, about 50% of zinc produced is used in galvanizing of steel products to protect them from corrosion. Lead is one of the most widely used metals and over 80% of all lead produced is used in making lead–acid batteries for the storage of energy.
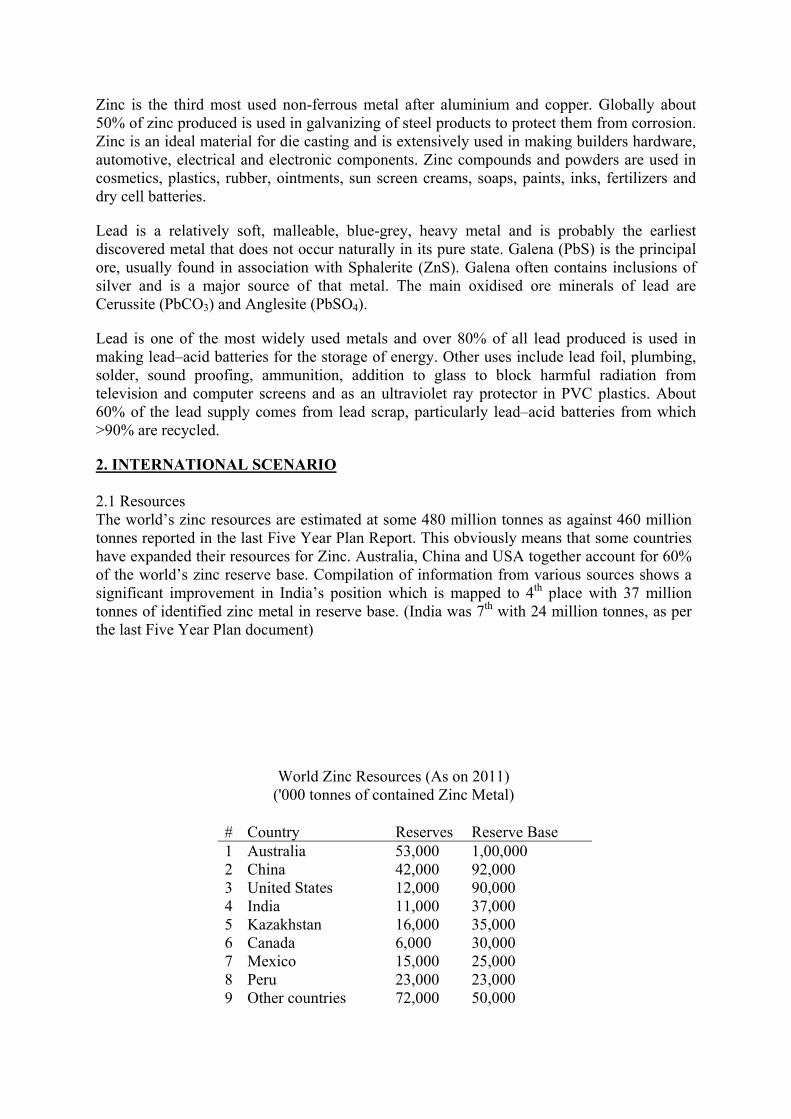
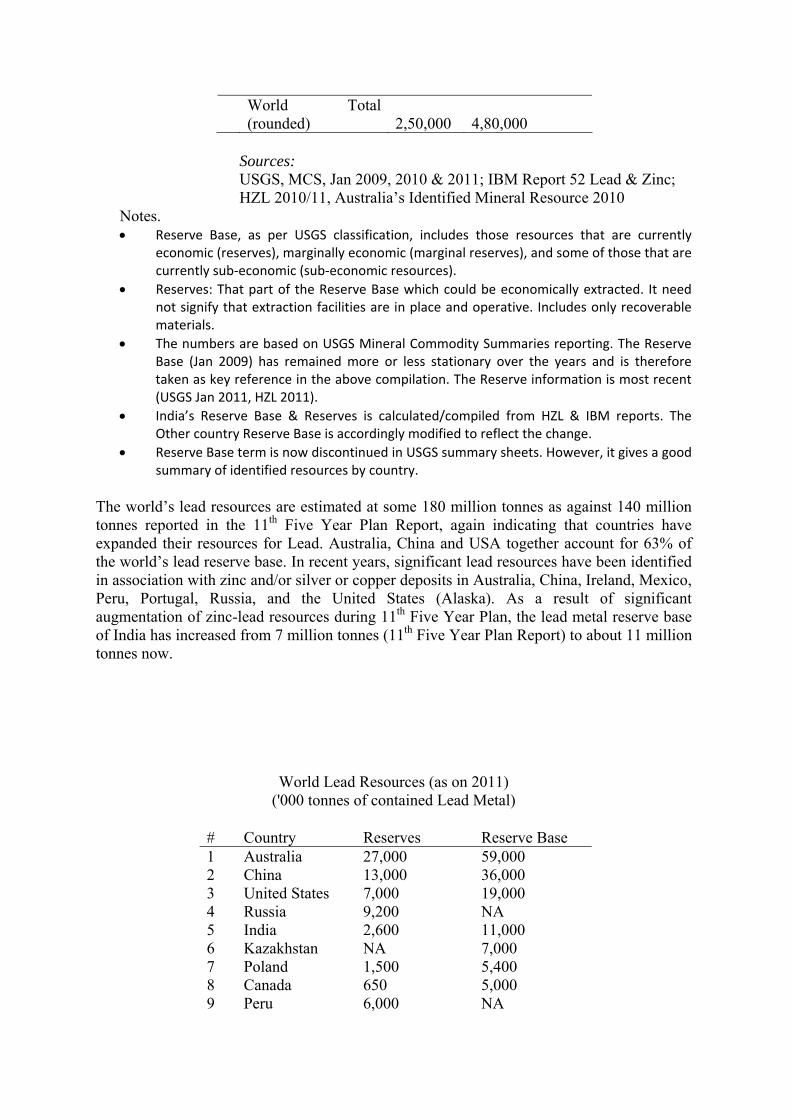
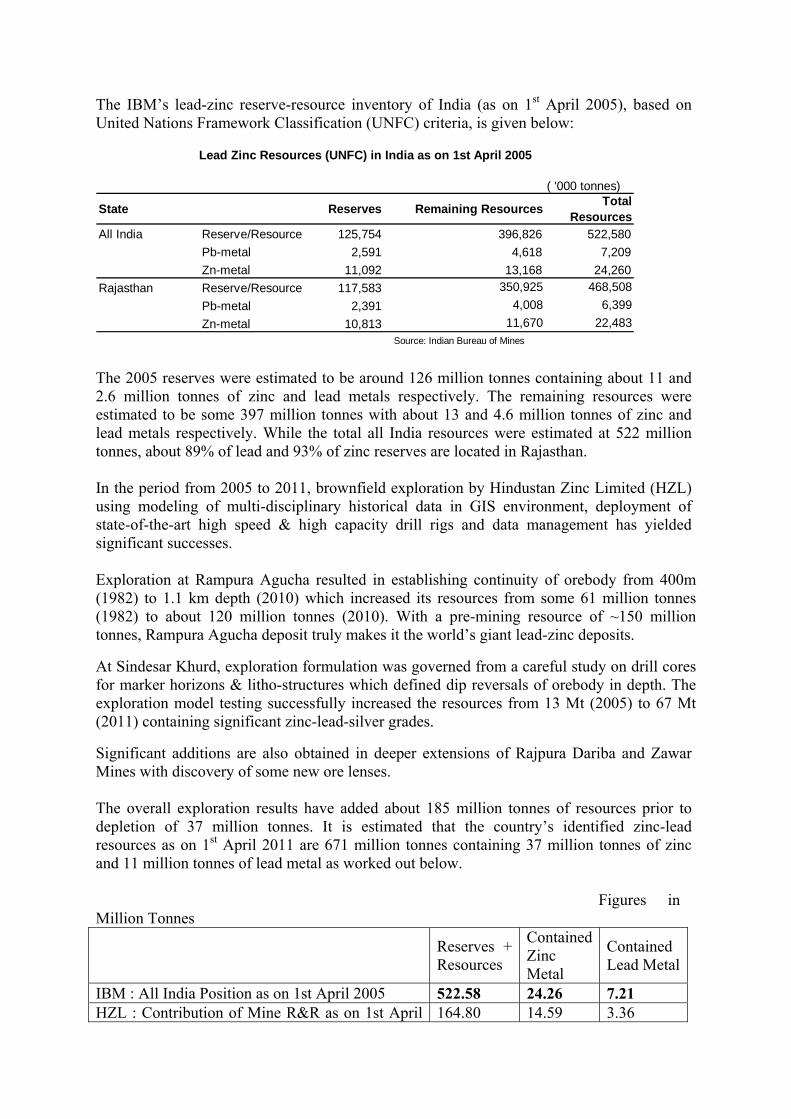
World Scenario Zinc The world’s zinc resources are estimated at some 480 million tonnes as against 460 million tonnes reported in the XI Five Year plan Report. This obviously means that some countries have expanded their resources for Zinc. Australia, China and USA together account for 60% of the world’s zinc reserve base. Lead The world’s lead resources are estimated at some 180 million tonnes as against 140 million tonnes reported in the 11th Five Year Plan Report, again indicating that countries have expanded their resources for Lead. Australia, China and USA together account for 63% of the world’s lead reserve base. Indian Scenario The IBM’s lead-zinc reserve-resource inventory of India (as on 1st April 2005), based on United Nations Framework Classification (UNFC) criteria, is given below.
( '000 tonnes)
State Reserves Remaining ResourcesTotal
Resources
All India Reserve/Resource 125,754 396,826 522,580
Zn-metal 10,813 11,670 22,483 Source: Indian Bureau of Mines
Lead Zinc Resources (UNFC) in India as on 1st April 2005
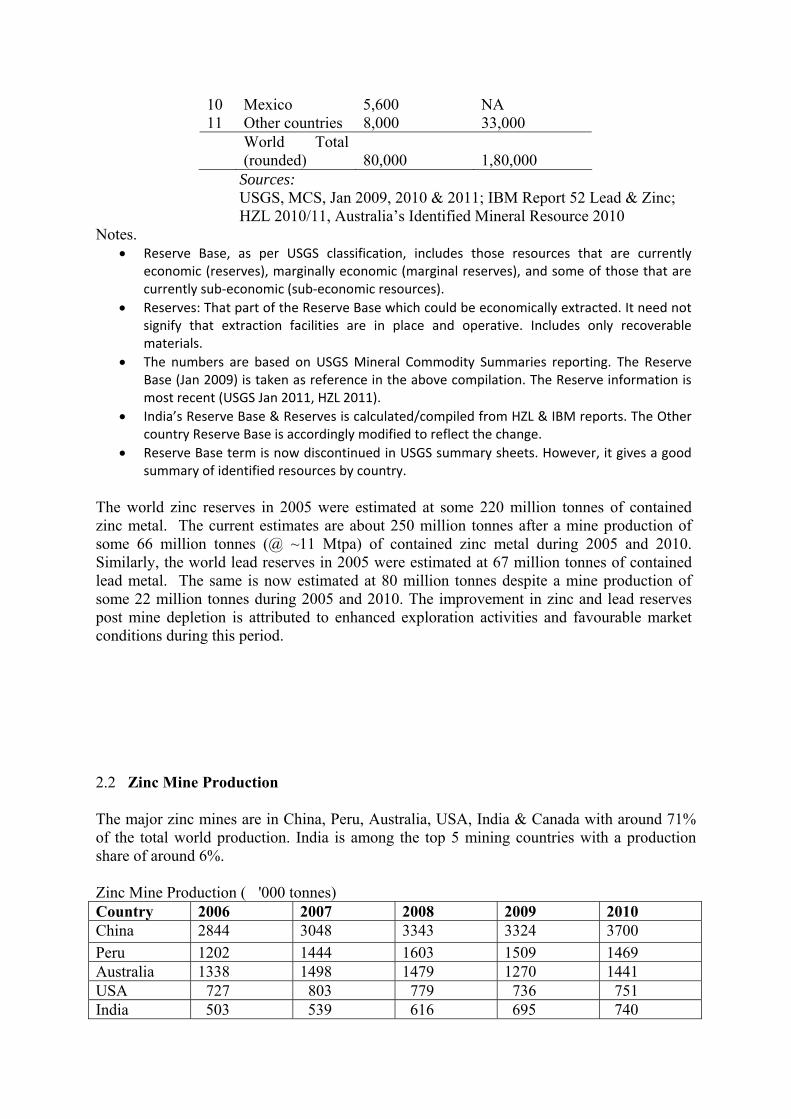
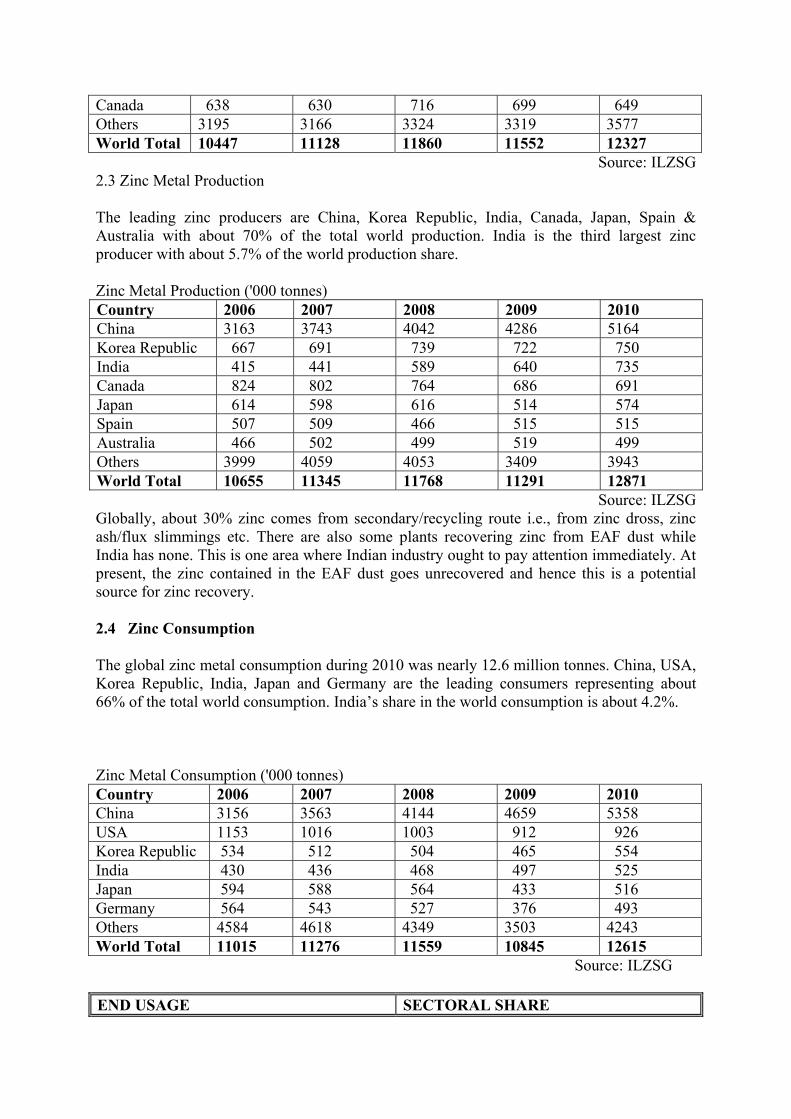
Zinc Mine Production: The major zinc mines are in China, Peru, Australia, USA, India & Canada with around 71% of the total world production. India is among the top 5 mining countries with a production share of around 6%. Zinc Metal Production: The leading zinc producers are China, Korea Republic, India, Canada, Japan, Spain & Australia with about 70% of the total world production. India is the third largest zinc producer with about 5.7% of the world production share. Zinc Consumption The global zinc metal consumption during 2010 was nearly 12.6 million tonnes. China, USA, Korea Republic, India, Japan and Germany are the leading consumers representing about 66% of the total world consumption. India’s share in the world consumption is about 4.2%. Exports and Imports Global exim trade of zinc metal is around 3.5 million tonnes every year. The main zinc metal exporters are Canada, Australia, Netherlands, Spain and South Korea. India’s exports during the last 4 years is 802 thousand tones. It is noteworthy that from being a net importer eight years ago, India has become a net exporter. India imported during the last four years 267 thousand tones of Zinc metal. The major Lead mines are in China, Australia, USA, Peru, Mexico & India constituting 81% of the total world production. India is among the top six mining countries with a production share of around 2.3%.In 2010 India produced 97 thousand tones.
The global lead metal consumption in 2010 was 9.3 million tonnes. China, USA, Germany, India and Korea Republic are major consumers representing nearly 70% of the world consumption. India’s share in the world lead metal consumption is around 3.3%. Raw Material Security The raw material used by primary smelters is zinc concentrate and lead concentrate. With rapid expansions of smelter capacities, imports of zinc concentrate and lead concentrate are inevitable as domestic production (current as well as estimated) will be insufficient to meet the requirements. A supportive tariff regime (nil duty) is required on raw material namely zinc concentrate and lead concentrate to enable Indian zinc smelters and lead smelters to compete on a level playing field.
Future Demand and Supply ZINC
Demand for zinc in India is expecting from 6,00,000 lakh tones in 2012-13 to 8,80,000 tonnes in 2016-17.Considering continuous supply of 20,000 tones from secondary route and 50,000 tonnes from imports in every year about 9 lakh tones production are projected with marginal increase from 2012-13 to 2015-16.This production projections are given is in correlation with gradual reduction of exports with reference to domestic consumption. The current zinc production capacity of HZL is 9,17,000 tones. Zinc Demand-Supply Scenario Based on the above data, the Zinc Demand Supply scenario during 12th Five Year Plan are: Year Demand India’s Imports Secondary Exports Supply
Production (E) Zinc 2012-13 600000 916500 50000 20000 386500 600000 2013-14 660000 917000 50000 20000 327000 660000 2014-15 730000 959000 50000 20000 299000 730000 2015-16 800000 979000 50000 20000 249000 800000 2016-17 880000 979000 50000 20000 169000 880000 Lead HZL is the lone producer of lead in India. Its current primary lead capacity is 85,000 tonnes per anum. In addition a lead smelter of 1 lakh metric tones per annum is expected to be operational in 2011-12.Lead demand in 2012-13 an 2016-17 is estimated at 4,33,000 tonnes and 5,68,000 tonnes respectively. Part of this projected demand is met through domestic primary lead supplies i.e. 1,85,000 tonnes per annum. Further, 50,000 tonnes per annum imports are projected to be continued. The remaining demand projected is to be met through secondary (organized sector) assuming 250,000 tonnes in 2012-13 and gradually increasing up to 350,000 tonnes by 2016-17, which is the terminal year for 12th five year plan. The Lead Demand and Primary Lead Supply during the 12th Five Year Plan would be (tonnes): Year Lead Primary Lead Demand Supply 2012-13 433000 185000 2013-14 464000 185000 2014-15 496000 185000 2015-16 531000 185000 2016-17 568000 185000
3. ALUMINIUM Aluminium is one of the most common and widely used metals and the metal' s production outstrips that of all other non-ferrous metals. Aluminium ranks second, next only to steel, in
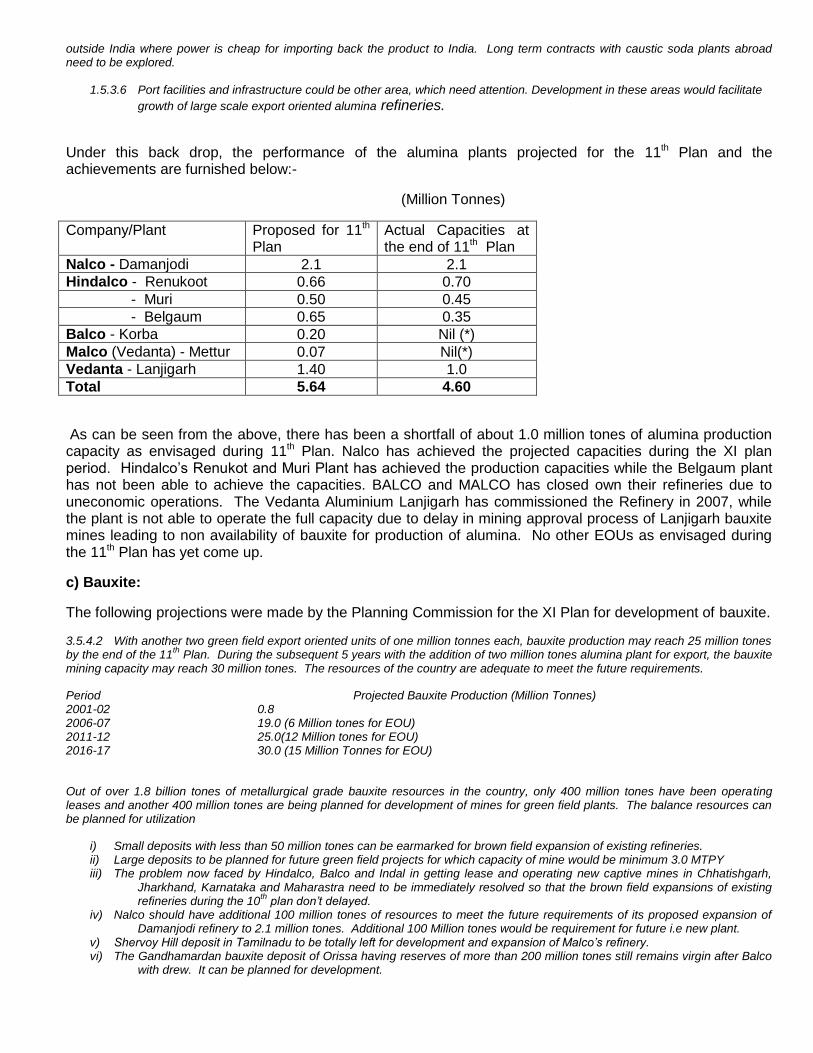
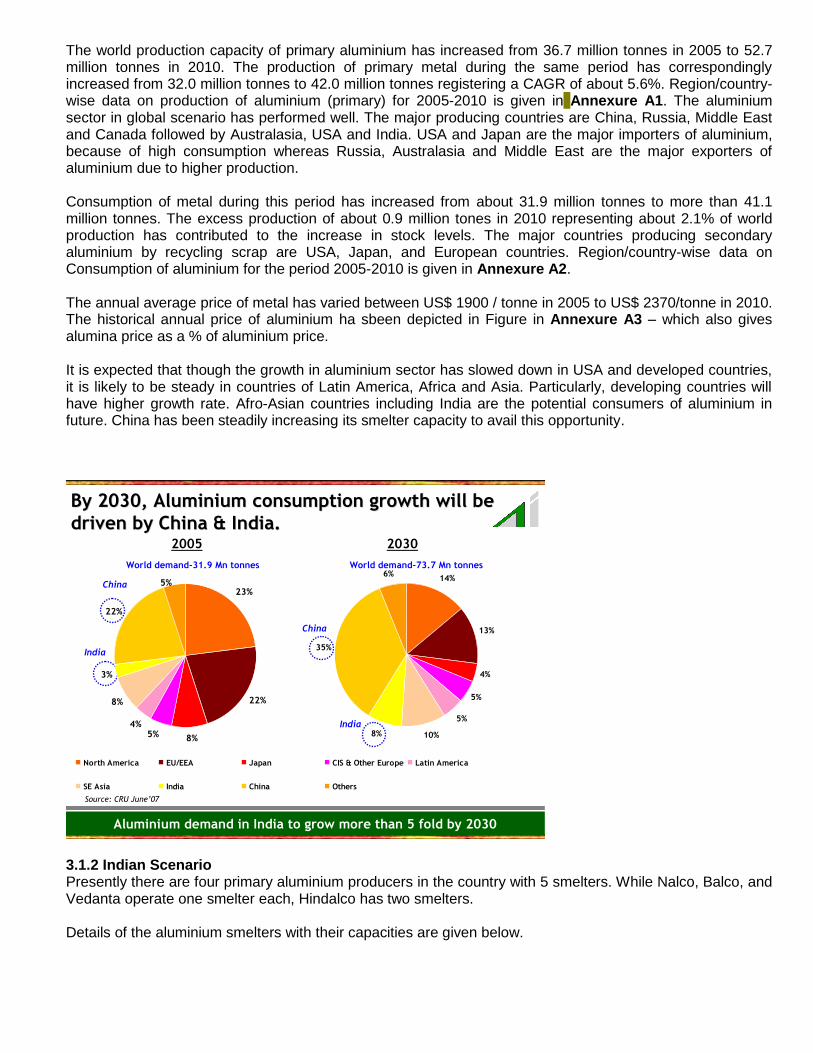
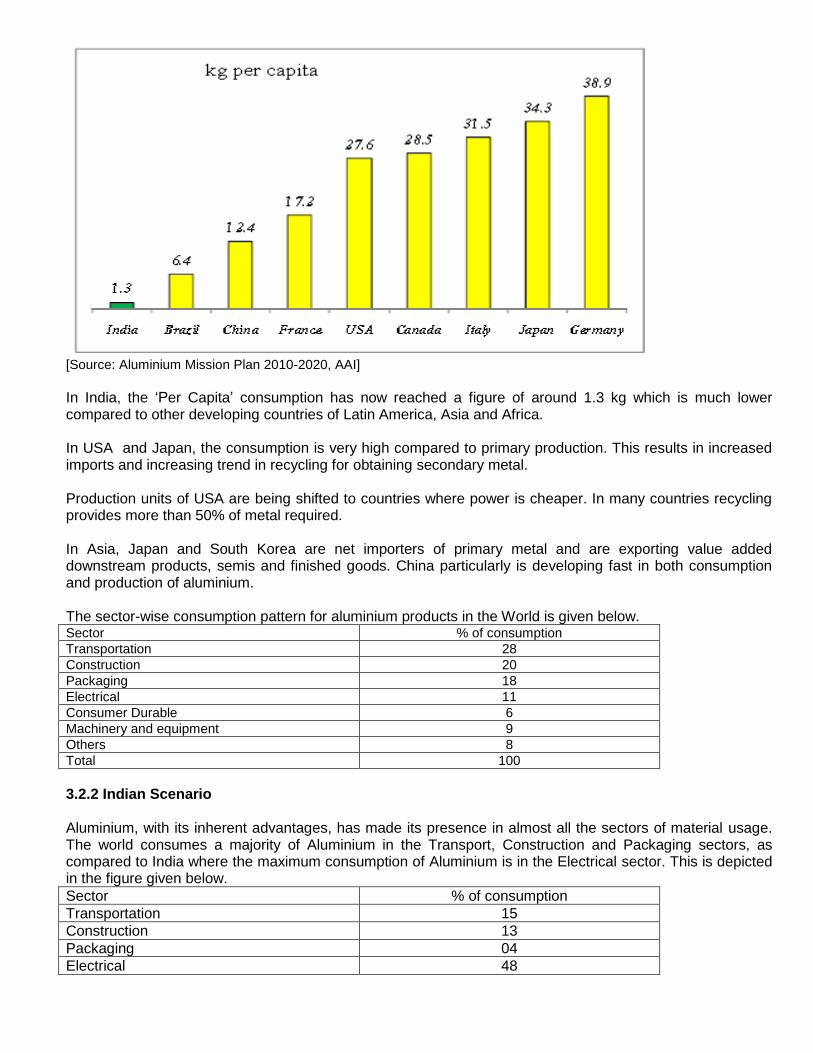
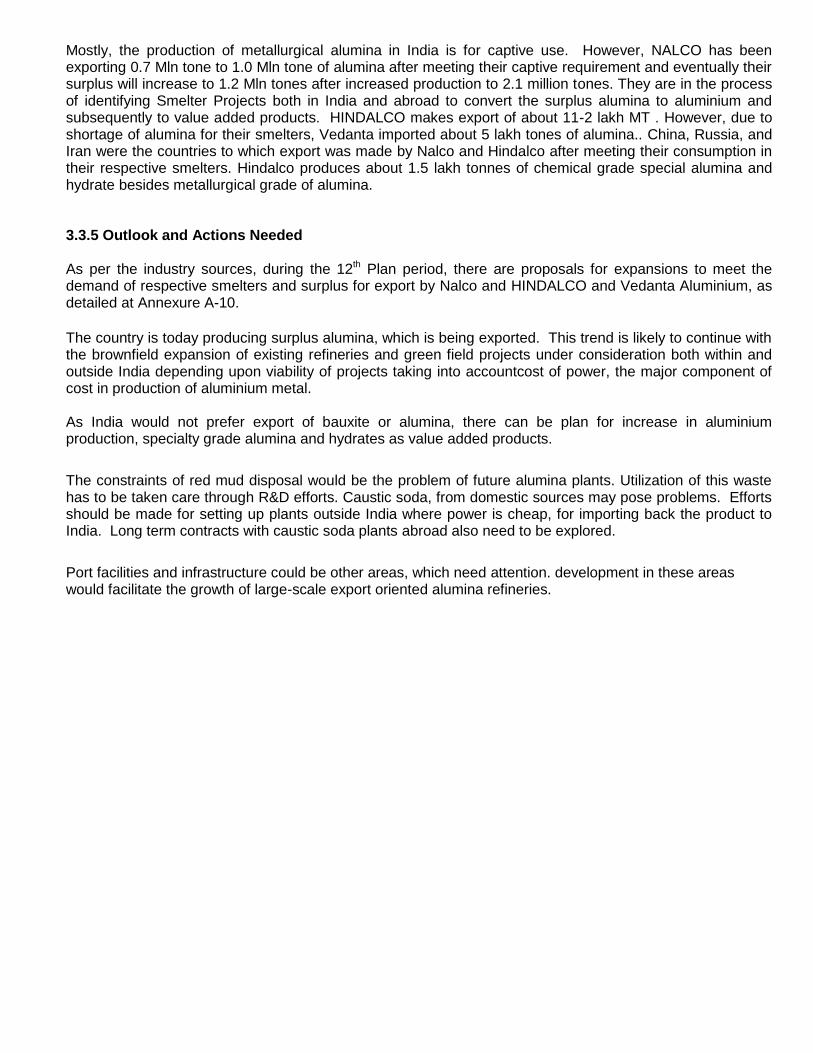
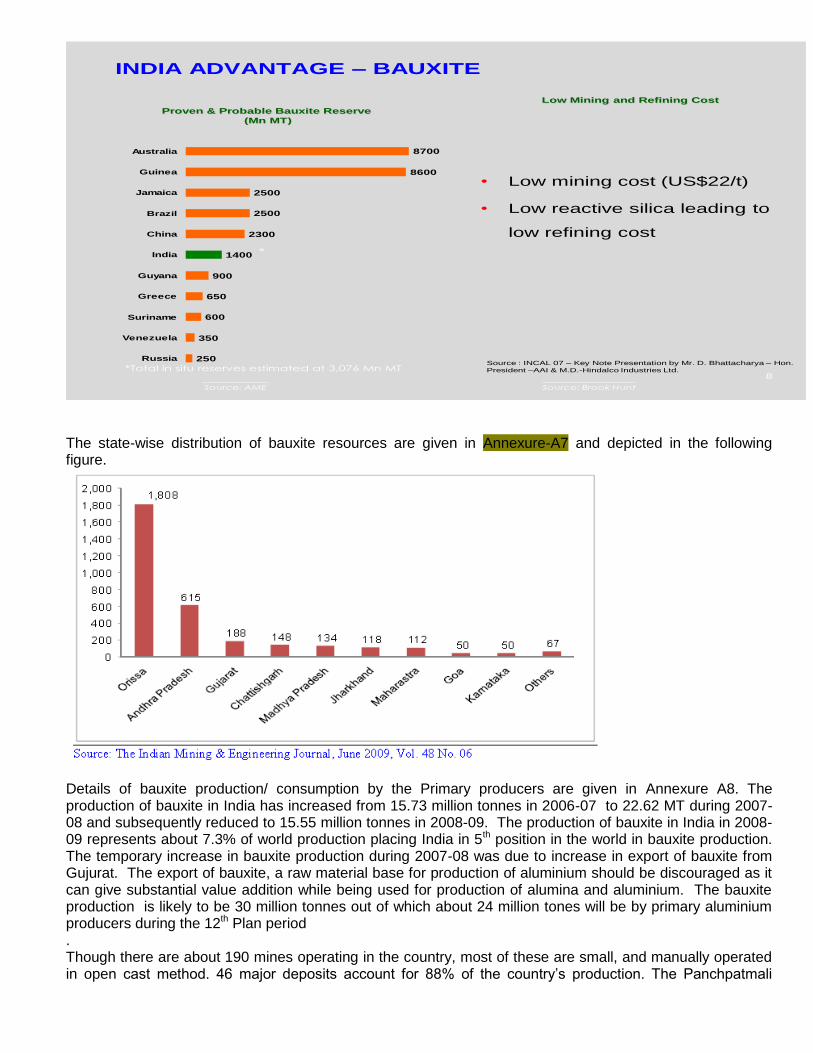
terms of volumes used, due to its versatility, which stems from its excellent properties. Bauxite is still the only ore used for commercial production of aluminium using the basic processes of Bayer Process for alumina refining and Hall-Heroult Process for aluminium smelting with improvements for better performance. World Scenario: The world production capacity of primary aluminium has increased from 36.7 million tonnes in 2005 to 52.7 million tonnes in 2010. The production of primary metal during the same period has correspondingly increased from 32.0 million tonnes to 42.0 million tonnes registering a CAGR of about 5.6%. World alumina refining capacity has increased from 68.4 million tonnes in 2005 to about 105.9 million tones in 2010. The world production of alumina has increased from 61 million tonnes in 2005 to about 81.6 million tones in 2010. China is the main producer of alumina in the world (35.7%) followed by Australia (24.1%). The total world bauxite resources (Measured, Indicated and Inferred) are estimated to be of the order of 55 to 75 billion tones while the reserves (Measured) are estimated to be at 28 billion tonnes. Except in Australia, the bauxite reserves are mostly available in countries with developing economy which account for nearly 70% of the total bauxite reserves. World Bauxite production range is varied between 193 to 211 million tonnes between 2006-2010. Major producers are Australia, China, Brazil, India and Guinea,and Jamaica. Australia alone accounts for 33% of the world production. Besides aluminium, which consumes bulk of the bauxite production, chemical, refractory and cement industries together consume bauxite to the tune of 10 – 12% of total production. Indian Scenario The total production capacity of aluminium in India has increased from 1.08 million tones in 2006-07 to 1.71 million tones in 2010-11. The production of primary aluminium in India was 1.63 million tonnes in 2010-11 whereas the consumption during 2010 was 1.59 million tonnes, representing a “Per Capita” consumption of about 1.3 kg which was in the range of 0.5 kg about a decade back. The installed capacity of alumina refineries in India is currently stand at 4.60 million tones with break up of NALCO 2.1 Million tonne, Vedanta 1 Million tonne, and HINDALCO 1.5 Million tonnes. The production of alumina in 2010-11 in India is 3.6 million tones with breakup of Hindalco – 1.35 million tones, NALCO- 1.55 million tones and Vedanta – 0.70 million tones. The total resources of bauxite in India stand at 3290 Million tonnes out of which 900 million tones are of reserves category and balance 2390 million tones are of remaining resources. India occupies 6th place in the world with a share of 3.19% of world reserves. Odisha and Andhra Pradesh account for more than 90% of country’s metallurgical grade resources. The production of bauxite in India has increased from 15.73 million tonnes in 2006-07 to 22.62 MT during 2007-08 and subsequently reduced to 15.55 million tonnes in 2008-09. The production of bauxite in India in 2008-09 represents about 7.3% of world production placing India in 5th position in the world in bauxite production. The temporary increase in bauxite production during 2007-08 was due to increase in export of bauxite from Gujurat state. It is projected that aluminium production capacity in India at the end of the 12th Plan period would be about 4.7 Million Tonnes. This would require about 9.2 Million Tonnes of alumina. So, if all the announced alumina capacity additions fructify, India would be surplus in alumina and would be a significant player in alumina trade. To produce 13.3 Million Tonnes of alumina at the end of the 12th Plan period, the bauxite requirement would be about 40 Million Tonnes. All efforts should be directed towards ensuring bauxite availability to the alumina refineries.
4. CEMENT AND LIMESTONE
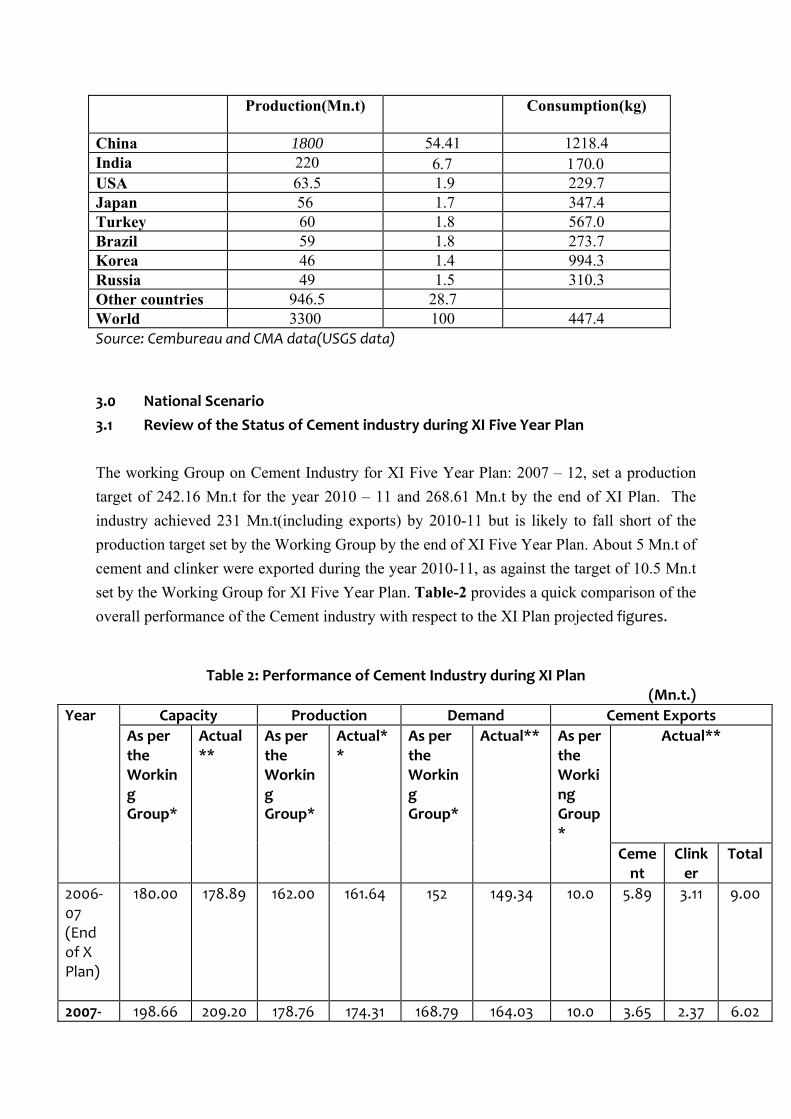
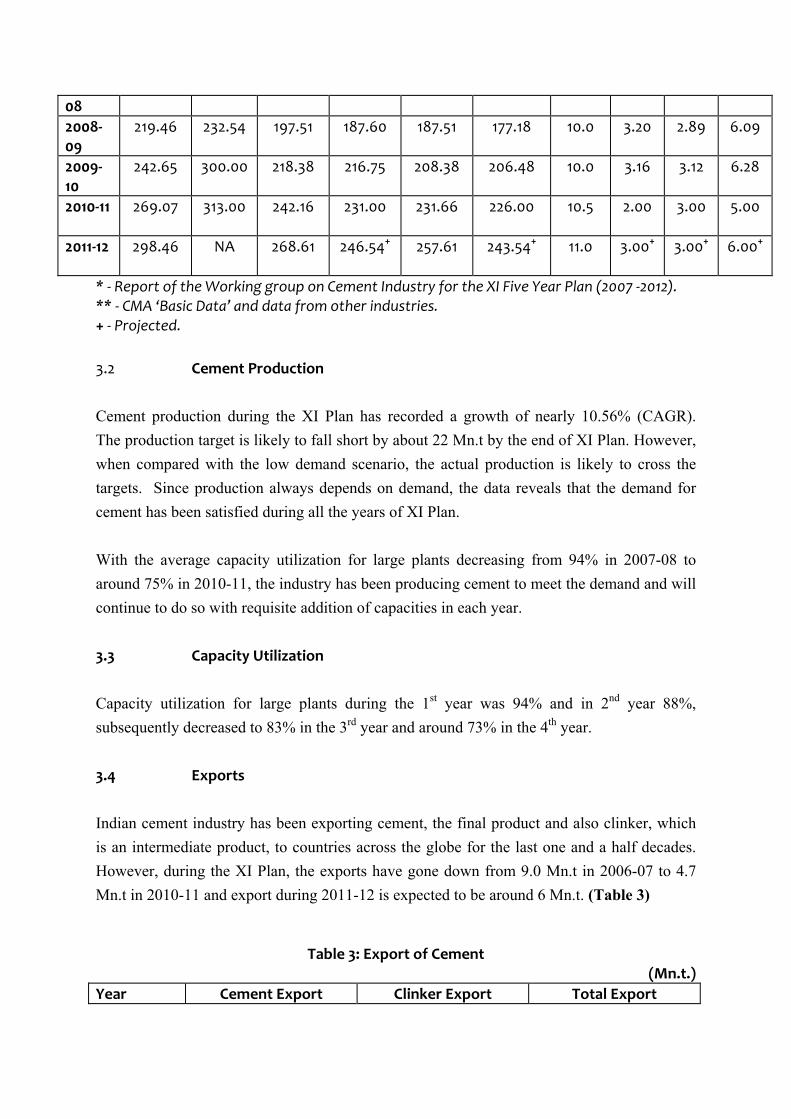
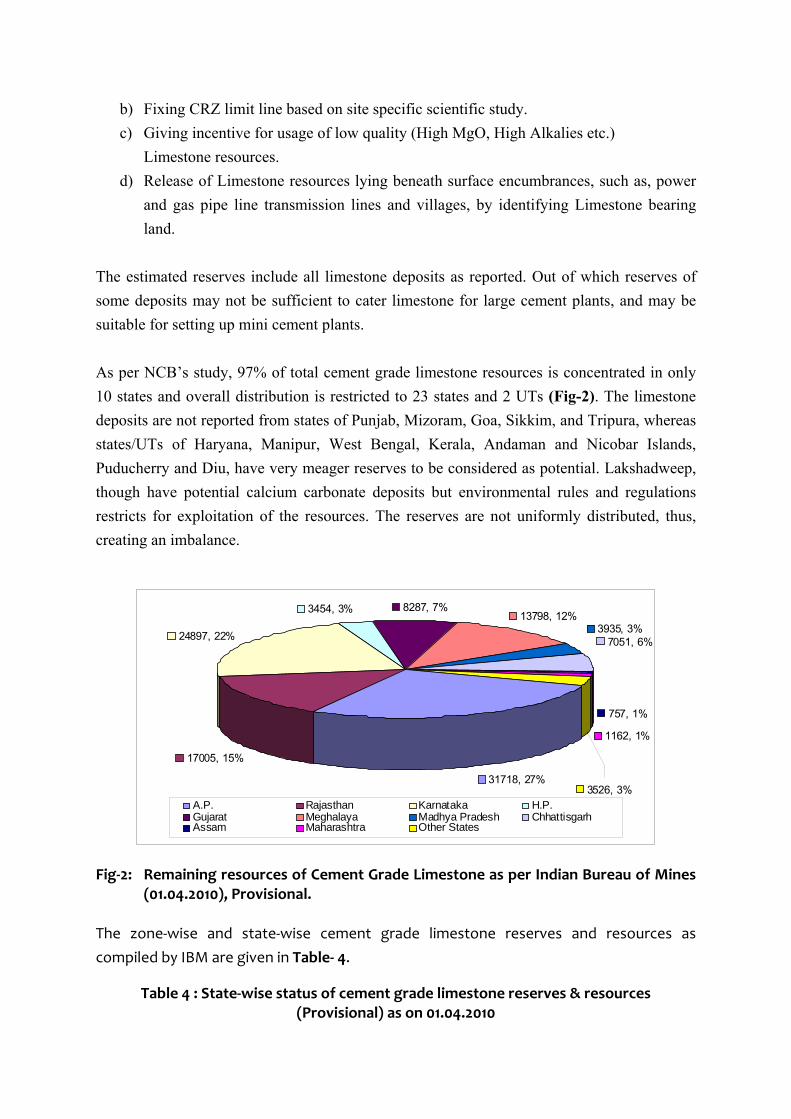
Limestone occupies the top position among non-fuel solid mineral deposits in the volume of annual extraction. Limestone is the primary and major constituent for the manufacture of cement. Indian cement industry has been serving the nation’s construction industry since 1914 and has now achieved a remarkable status with total installed capacity of about 313 million tonnes as on 31ST March 2011 and Cement Production of 231 million tonnes which is second largest in the world, being next to China. World Scenario India is only next to the largest producer of cement in the world, namely China. During the last one decade cement production in the world has gone up by more than 75%. The consumption level of Cement in the Asian countries continues to increase rapidly. The per capita consumption of cement is considered as an important index of the country’s economic growth. Paradoxically, per capita cement consumption in India is still one of the lowest among major cement producing countries. Growth of cement industry is bound to spur a proportionate demand on limestone availability. The world cement production in the year 2010 is 3300 million tones. Indian Scenario National Council for Cement and Building Materials (NCB) and Indian Bureau of Mines (IBM), Government of India have been carrying out the compilation of the National Inventory of Cement Grade Limestone. The limestone resources are classified as per United Nations Framework Classification (UNFC) system. As per IBM the total cement grade limestone resources is 124,539.551 million tonnes, out of which the total cement grade limestone reserves is 8948.926 million tonnes UNFC code (111), (121) and (122), and the total remaining resources is 115,590.625 million tonnes. The production of the cement by India in the year 2011-12 is 246 million tones falling short by 22 million tones than the proposed target. Cluster mining approach in order to utilize the small deposits for further industrialization of the mining area may be adopted in the sector which will improve the workability of small quaries.
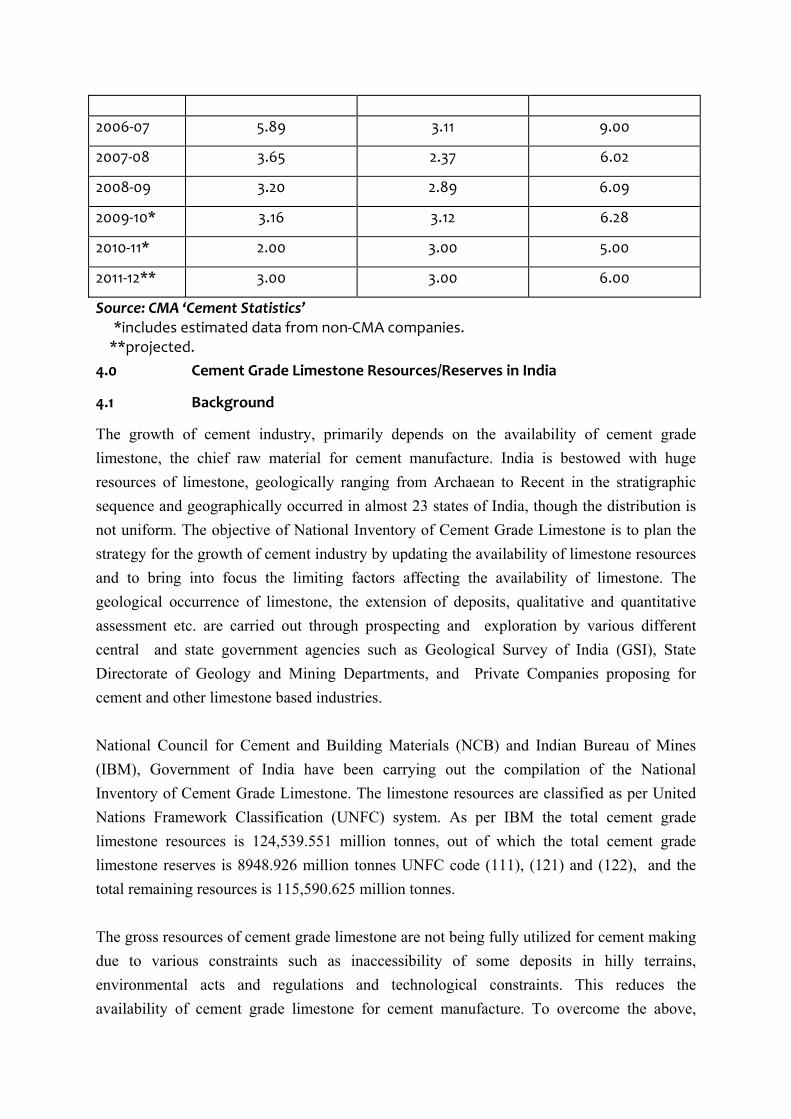
Exports and imports Indian cement industry has been exporting cement, the final product and also clinker, which is an intermediate product, to countries across the globe for the last one and a half decades.The projected export for the year 2011-12 is 3 million tones for both cement and clinker. Availability of Limestone Reserves for Future Requirements The total cement grade limestone resources as estimated by IBM, based on the UNFC classification system is at 124,539.551 million tonnes out of which the remaining resources is of 115,590.625 million tonnes as on 1st April 2010. However, 30% (approximate) of the reserves i.e. 34677.19 million tonnes fall under forest and other regulated areas which are not available for cement manufacture.
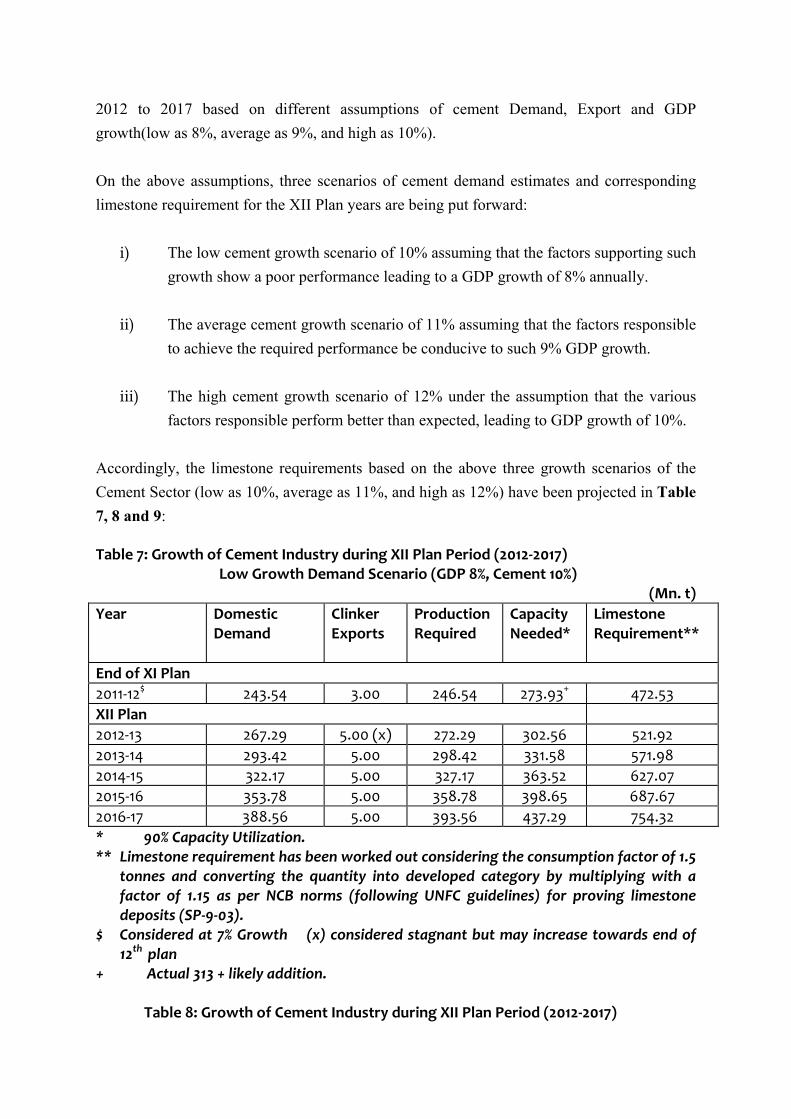
Future demand and supply The Projections estimate the year-wise growth from 2012 to 2017 based on different assumptions of cement Demand, Export and GDP growth (low as 8%, average as 9%, and high as 10%).The total limestone requirement in the XII Plan (2012-2017) with the growth scenarios of cement @ 10%, 11% and 12% for the respective GDP growth of 8%, 9% and 10% and balance life of reserves is projected below: Total Limestone Requirement in the XII Plan (2012-2017) 2012 – 2017 Scenario – I
(10%) Scenario –II (11%)
Scenario – III (12%)
Limestone Requirement during 12th Plan projected for various growth Scenarios (Mn.t)
3162.96 3252.73 3344.87
5. DIAMOND AND PRECIOUS STONES
Diamond The word diamond is a derivation of the Greek word, “Adamas”, which means “Invincible”. Diamonds have held human fascination for centuries. The first recorded history of diamonds dates back some 3,000 years, to India, where it is believed that diamonds were first recognized and mined. After India, alluvial diamonds were first discovered in Brazil in 1726 and then in 1867 in the Cape Colony, now a province in South Africa. Two years later, in 1869, the first primary sources of diamonds were discovered at Kimberley in South Africa.
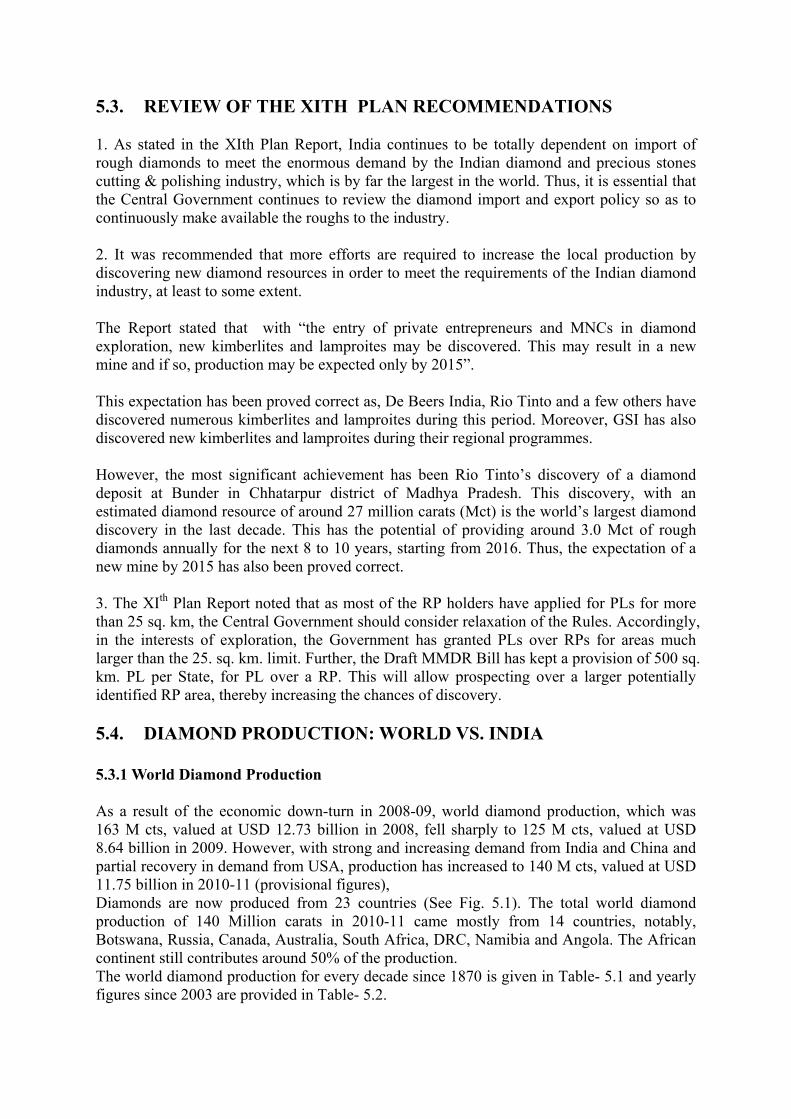
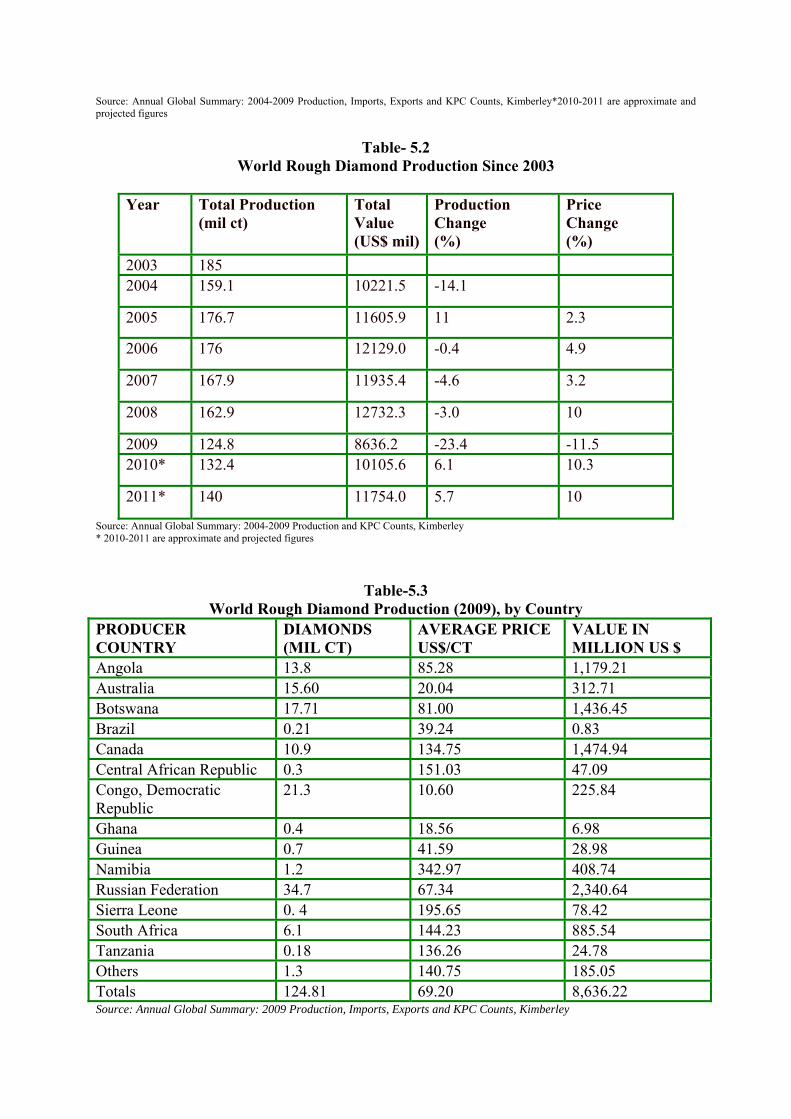
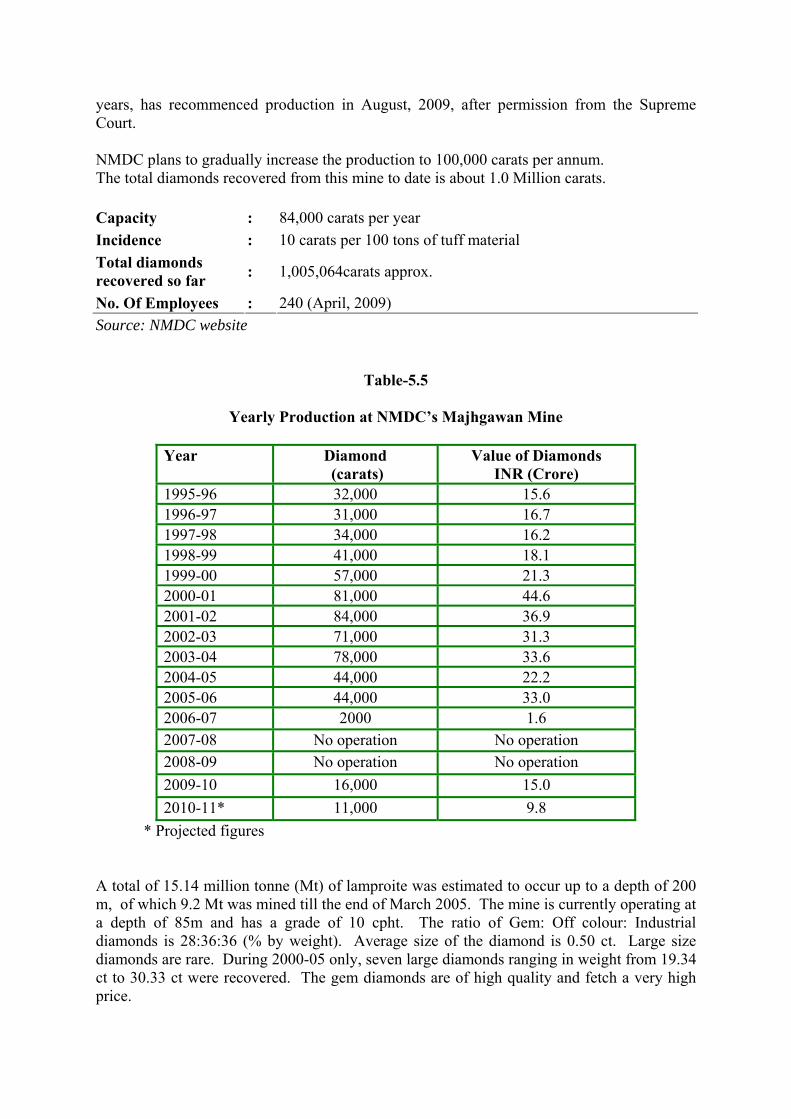
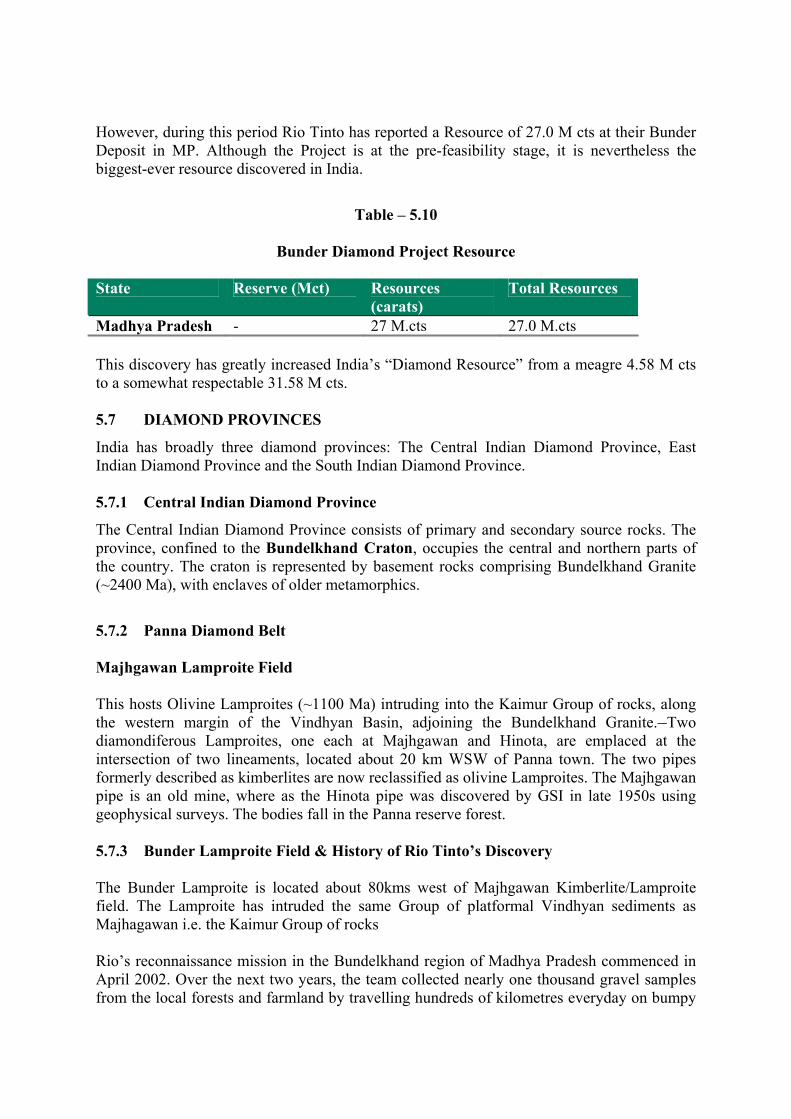
World Scenario The only authentic source for this data is from USGS. As per this the “Total Reserves” stand unchanged at 580 M.cts, while there is a minor addition in “Total Reserve Base” from 1250 M.ct to 1300 M.ct. As a result of the economic down-turn in 2008-09, world diamond production, which was 163 M cts, valued at USD 12.73 billion in 2008, fell sharply to 125 M cts, valued at USD 8.64 billion in 2009. However, with strong and increasing demand from India and China and partial recovery in demand from USA, production has increased to 140 M cts, valued at USD 11.75 billion in 2010-11.The major producing countries are Botswana, Russia, Canada, Australia, South Africa, DRC, Namibia and Angola. Indian Scenario According to IBM, India has Reserves + Resources of 4.6 M.ct. In addition, the Bunder Deposit of M/s Rio Tinto India has added a Reserve Base of 27 M.ct., which is expected to be in operation from 2016. NMDC continues to be the only organized producer of diamonds in India, from its Majhgawan mine at Panna, Madhya Pradesh. This mine, which was closed for a couple of years, has recommenced production in August, 2009.The production during the year 2009-10 is 16,000 carats. The projected production during the year 2010-11 is around 11,000 carats. Diamond Cutting and Polishing in India With 800,000 strong workforce and deployment of the latest technology, India continues to be the dominant player in the world’s diamond cutting and polishing industry. In fact, according to India's Gem & Jewellery Export Promotion Council (GJEPC), India has further strengthened it’s world dominance. Compared to the last Plan, India has:
1. 60% share by value vs 50%
2. 85% share by caratage vs 80% 3. 92% share by no. of diamonds vs 90%, as 11 out of every 12 rough diamond pieces are processed in India.
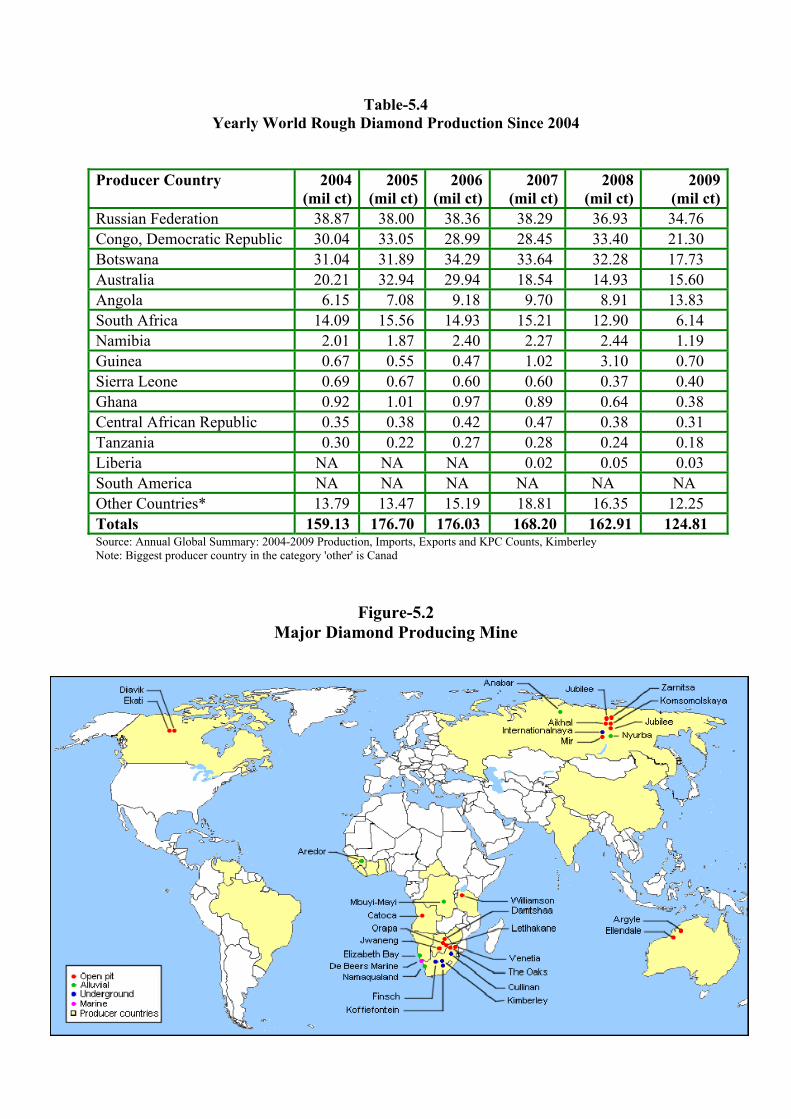
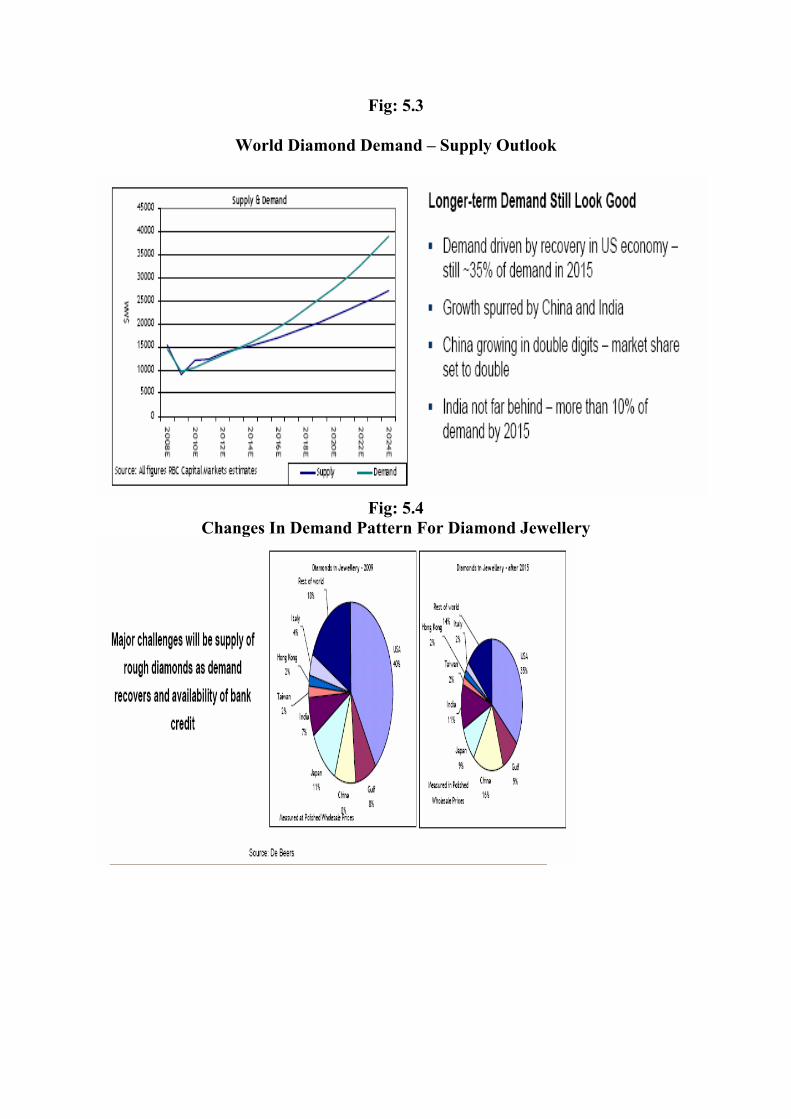
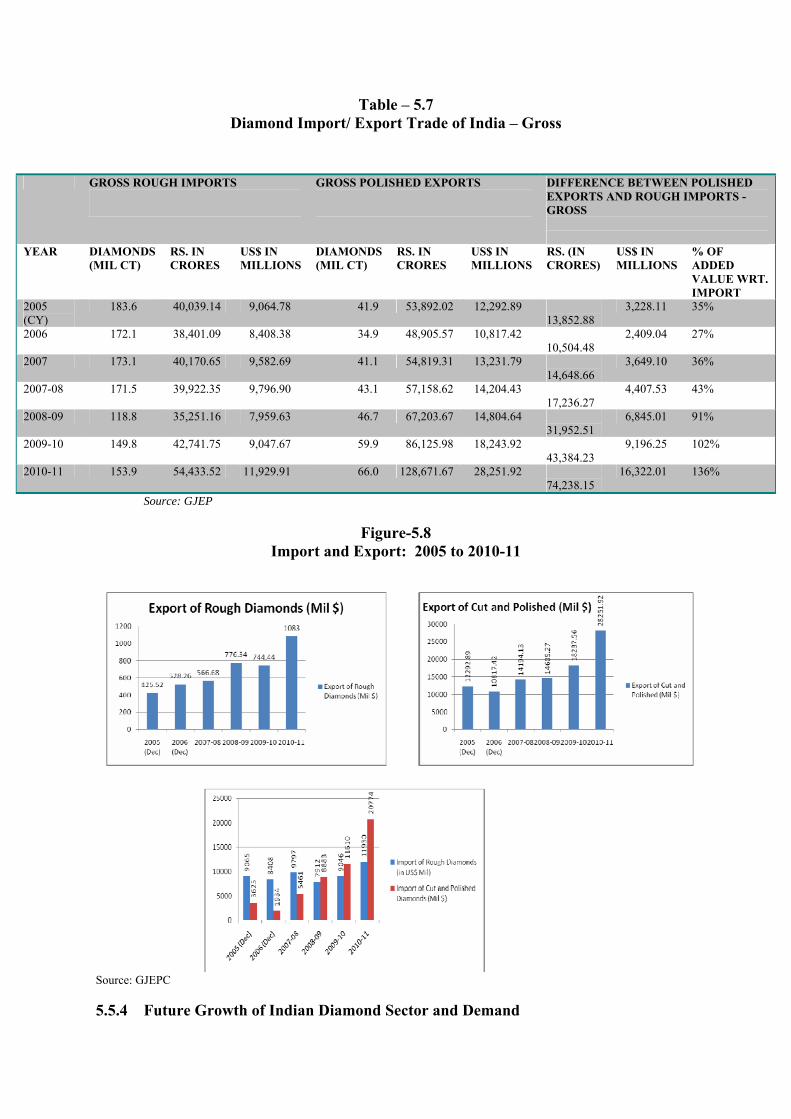
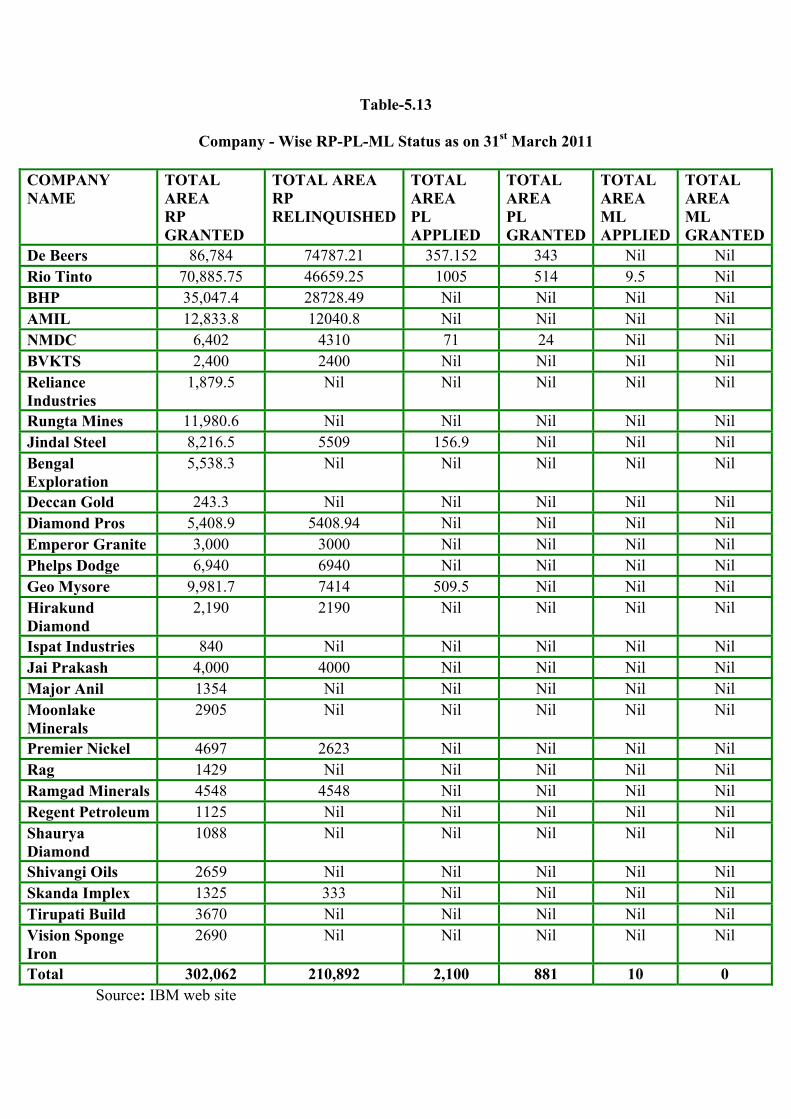
Exports and imports India exported cut and polished diamonds worth US$28.26 billion in the year ending March 31, 2011 (provisional figures), against rough diamond imports of US$ 11.93 billion, with a significant value addition of US$ 16.32 billion., according to GJEPC data. This reflects the strong recovery of the diamond industry from the global recession. Future Growth of Indian Diamond Sector and Demand The Indian cutting and polishing sector is facing growing competition from China and due to the fact that the producing African countries are demanding a greater share of processing of roughs within their countries. Thus, according to a KPMG analysis, by 2015, India’s share in value terms will come down to 49.3% share (from the present 65%), of the world diamond roughs. In the same period China’s share is expected to grow to 21.3%, with 7.1% to Russia, 5.5% to South Africa, 4.7% to Israel and 1.4% to the US. Status of Diamond Exploration in India Private companies like De Beers India and Rio Tinto India,based on the good geological database provided by GSI, were granted RPs for diamond exploration. The total area covered under RP’s is 1,40,000 Sq.Km. The major focus was in the states of Andhra Pradesh, Chhattisgarh, Karnataka and Madhya Pradesh. Total expenditure in Diamond exploration in the last ten years by the two major private players, Rio Tinto and De Beers is almost US$ 100 million, of which Rio’s investment is US$ 70 million.
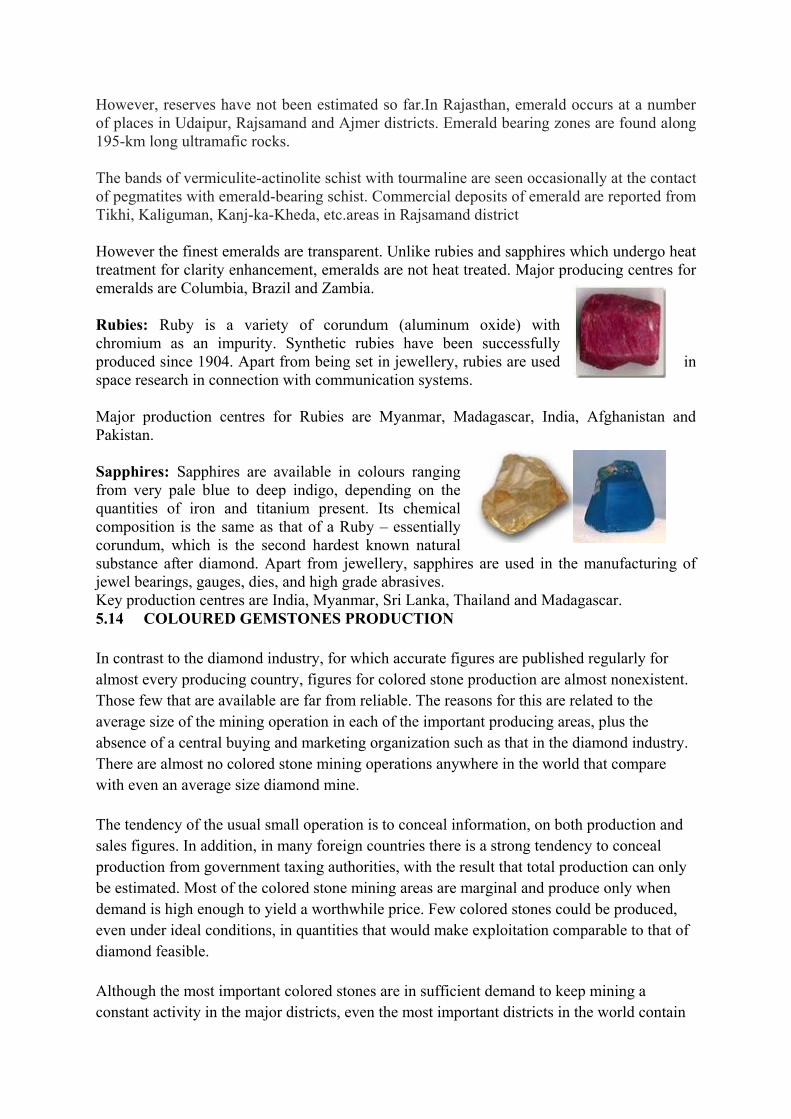
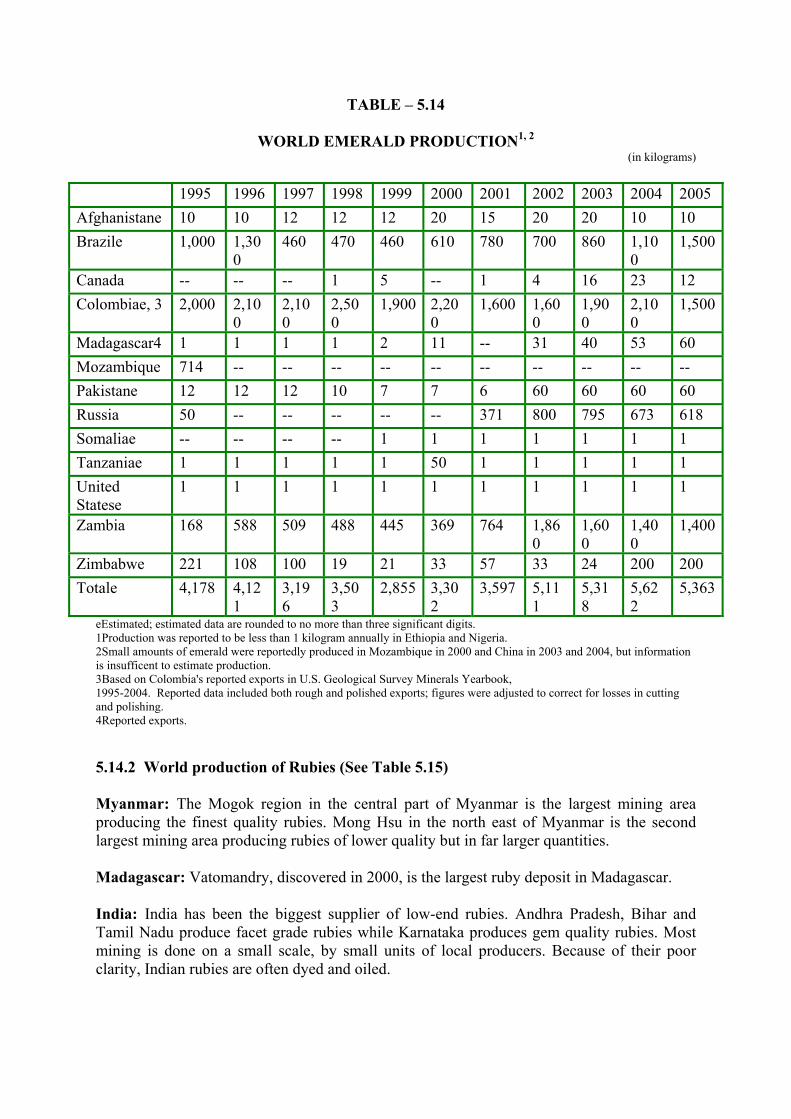
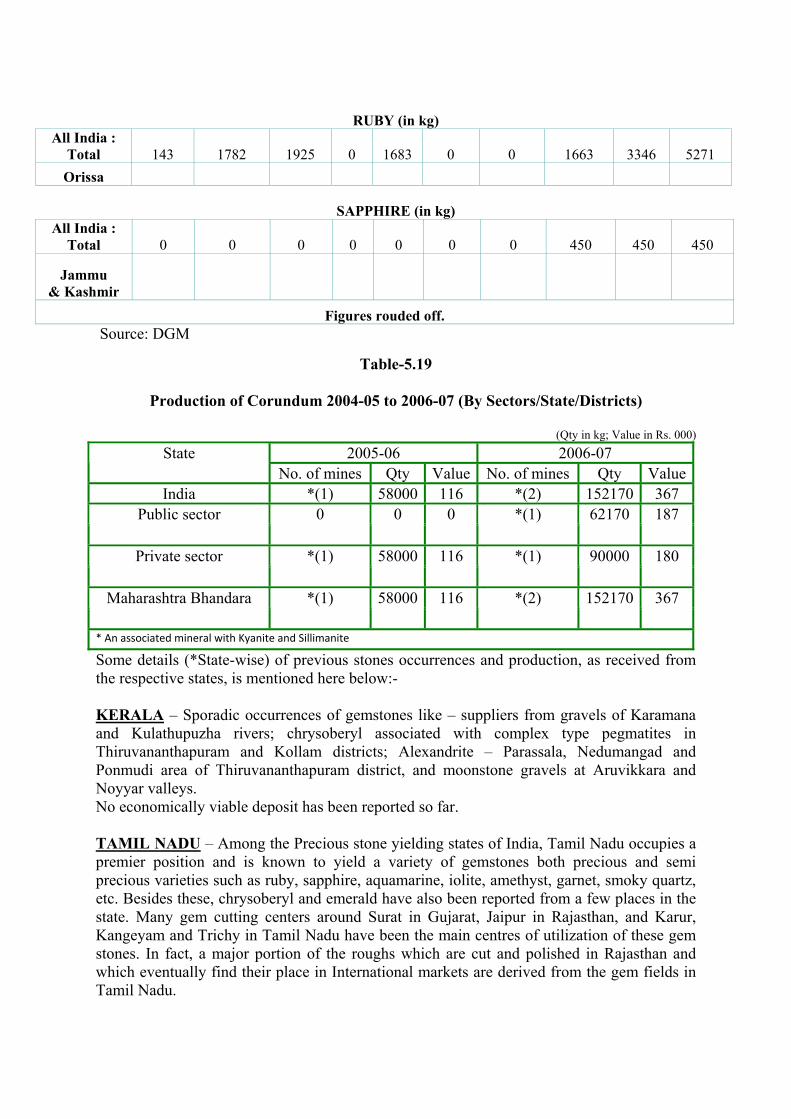
PRECIOUS STONES Coloured gemstones have been an integral part of the gems and jewellery industry at all times. Going by contemporary definition, any stone other than diamonds is labelled as a ‘Coloured Gemstone’. Coloured gemstones may be precious or semi-precious. Important gemstones are Rubies, Emeralds, Sapphire.
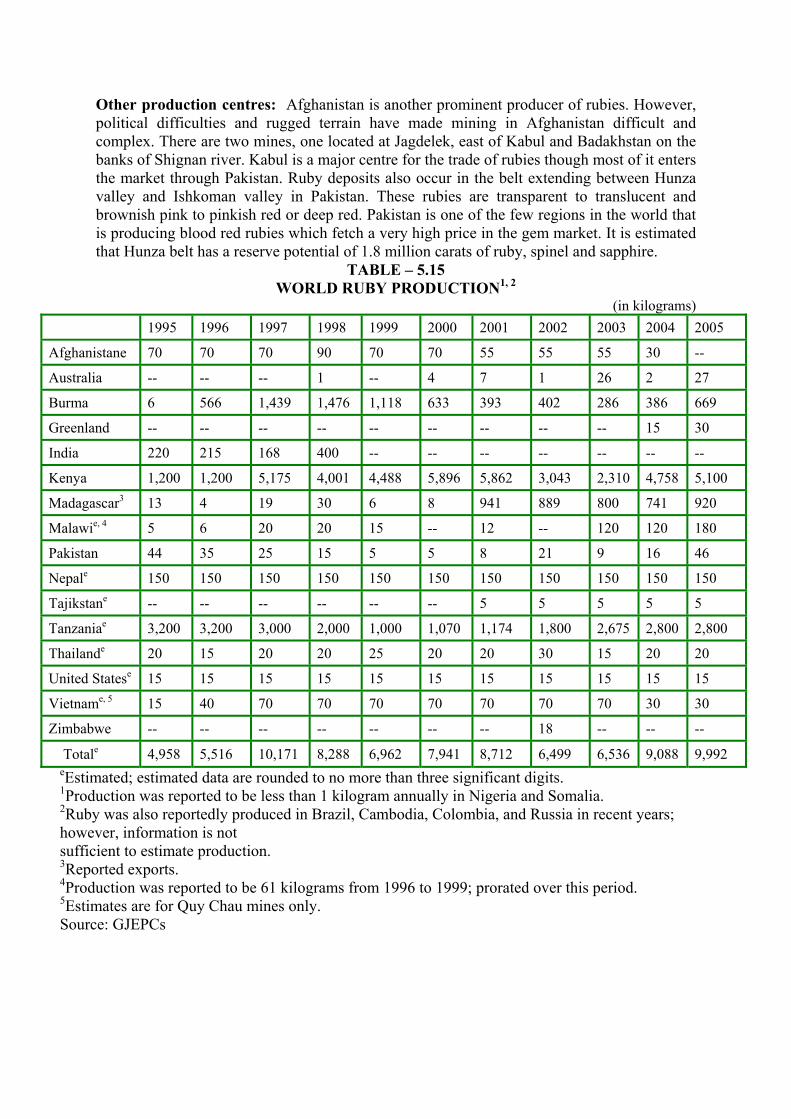
Major producers of precious stone in world Major producers of precious stones in world are: Columbia, Brazil, Sri Lanka,Australia,Myanmar,Madagascar,Zambia,Afghanistan and Pakistan.
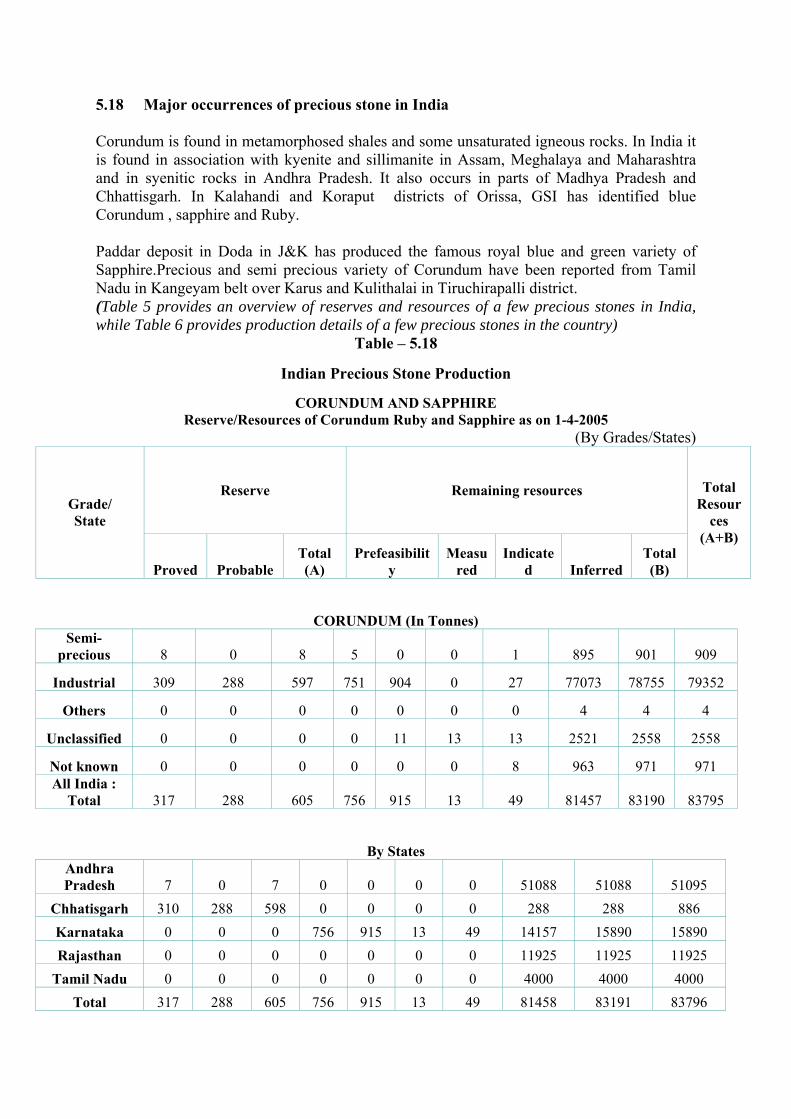
Major producers of precious stone in India Andhra Pradesh, Karnataka, Odisha, Meghalaya,Assam, Chattisgarh,Madhya pradesh, Kerala, Jammu & Kashmir, Tamil Nadu.
India’s Export and imports of Coloured Gemstones The country is also a leading source of a spectrum of coloured gemstones, moving from its traditional concentration on emeralds, and later tanzanite, to today offering the world a dazzling array of choice in terms of colour and quality. Exports of coloured gemstones were US$ 315 million in 2010-11, the major importing countries being USA, Hongkong, Thailand, UAE and Japan. The total imports, on the other hand, amounted to USD 146 million, the major exporting countries being Hongkong, UAE, Brazil, Zambia, Thailand, USA and Tanzania . Some important precious stones like emerald, ruby, sapphire, and other semi precious stones like tanzanite, topaz, opal have been discussed in detail in the main report with respect to their country wise production and cutting polishing industry.
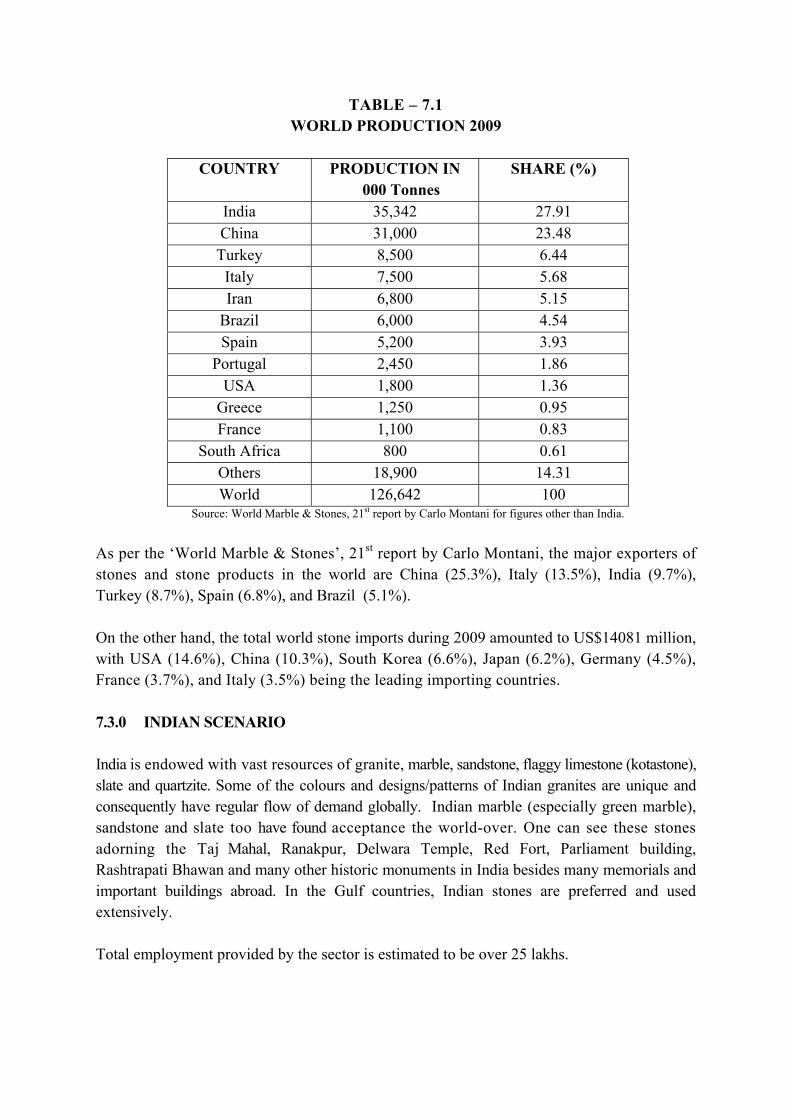
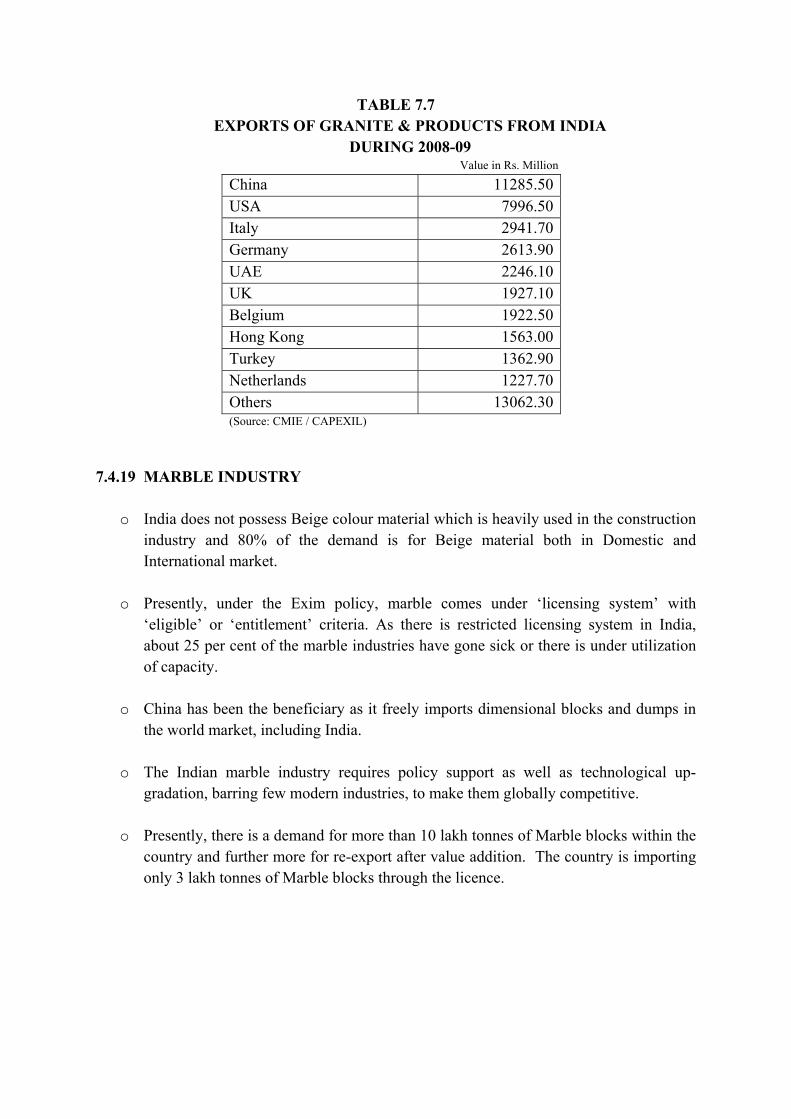
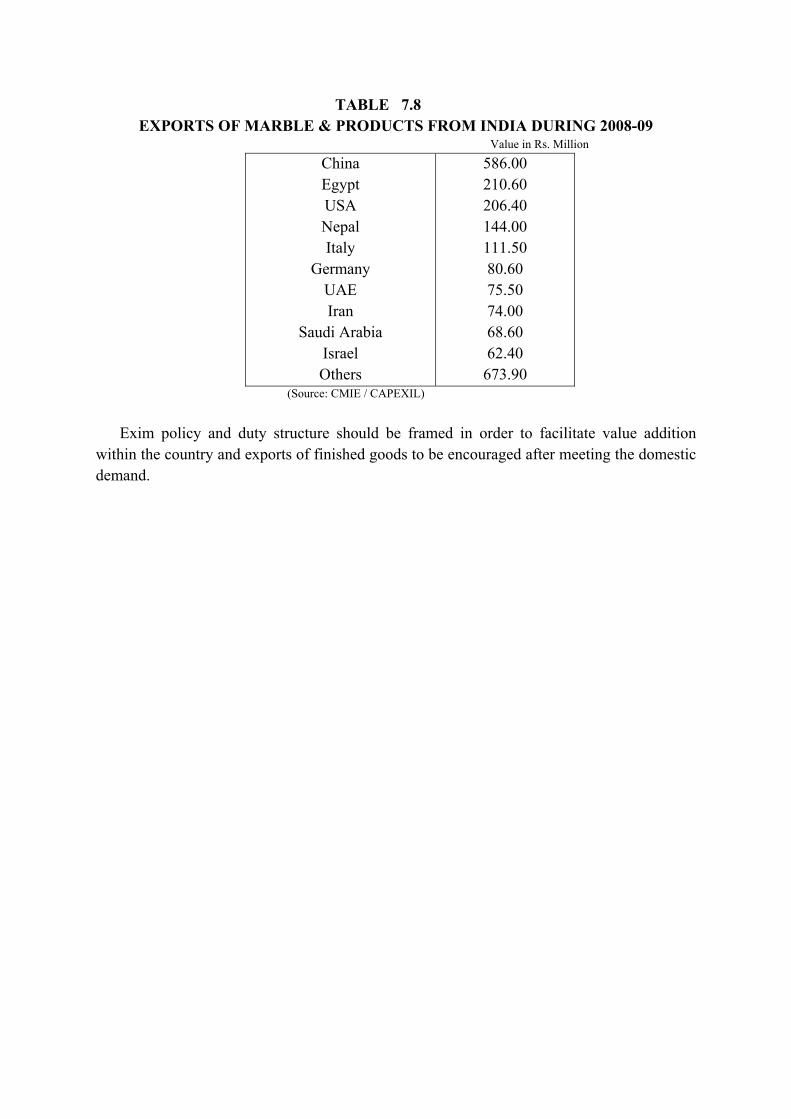
6.DIMENSIONAL AND DECORATIVE STONES India is the largest producer of ‘Dimensional and Decorative Stones’ viz. marble, granite, sandstone, slate, flaggy limestone etc. which form a major component of the construction sector. This sector accounts for 6-8% of the country’s GDP and is the second highest employer after agriculture. The quality of Indian stones conforms to the highest International Standards and provides excellent uniformity and consistency. World Scenario The global stone production is over 126 million tonnes in the year 2009, with India followed by China, Turkey and Italy being the leading producers. As per the ‘World Marble & Stones’, 21st report by Carlo Montani, the major exporters of stones and stone products in the world are China (25.3%), Italy (13.5%), India (9.7%), Turkey (8.7%), Spain (6.8%), and Brazil (5.1%). On the other hand, the total world stone imports during 2009 amounted to US$14081 million, with USA (14.6%), China (10.3%), South Korea (6.6%), Japan (6.2%), Germany (4.5%), France (3.7%), and Italy (3.5%) being the leading importing countries. Indian Scenario
India possesses one of the best granite deposits in the world having excellent varieties comprising over 200 shades. India accounts for over 20% of the world resources in granite. The total Granite Reserves in India as per IBM are: 42,916 million cu. M.
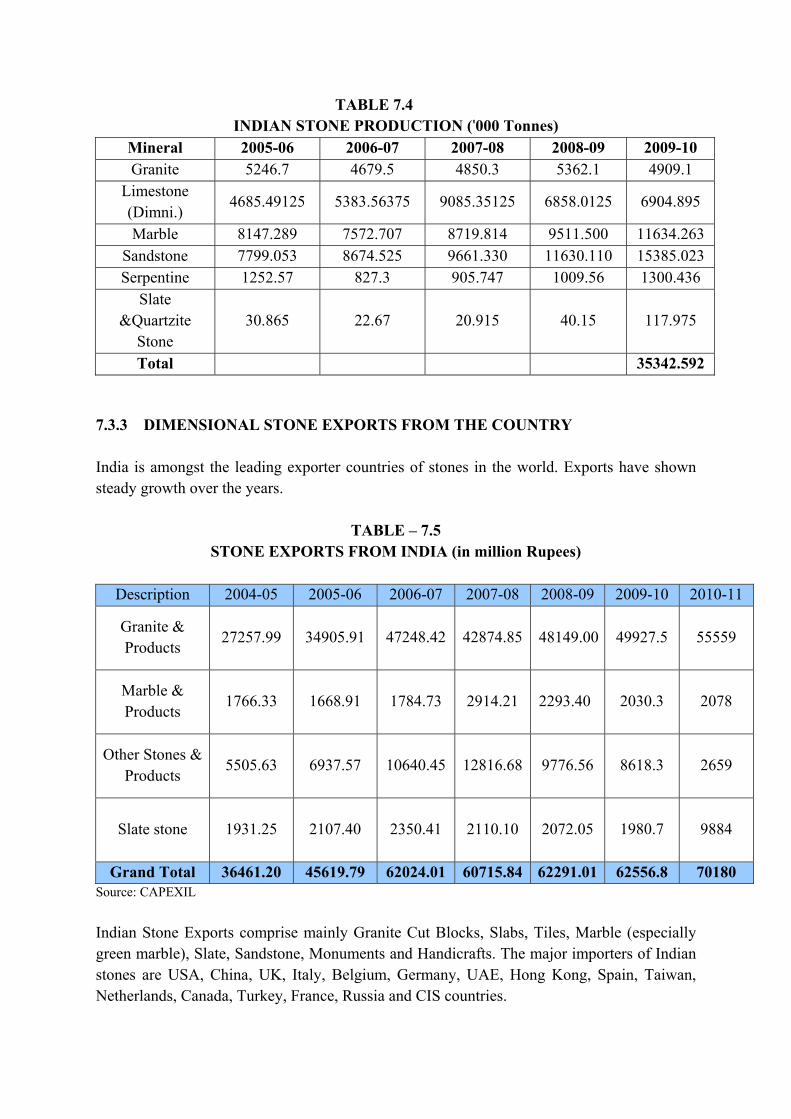
The Indian stone production during the year 2009-10 is 35342 thousand tones, in value terms, the estimated turnover of the Indian Dimensional Stone market in 2009-10 was of the order of Rs.30,000 crores out of which the southern states accounted for Rs.18,000 crores, Rajasthan Rs.7000 crores, and the rest of India Rs.5000 crores. Granite alone accounts for 2/3rd of the value of production. Dimensional stone exports from India India is amongst the leading exporter countries of stones in the world. Indian Stone Exports comprise mainly Granite Cut Blocks, Slabs, Tiles, Marble (especially green marble), Slate, Sandstone, Monuments and Handicrafts. The major importers of Indian stones are USA, China, UK, Italy, Belgium, Germany, UAE, Hong Kong, Spain, Taiwan, Netherlands, Canada, Turkey, France, Russia and CIS countries. The value of exports for the year 2010-11 is 70180 Million rupees. Projections for domestic consumption and exports The growth is continuing and the demand for marble, granite, sandstone and other dimensional stones and stone products is anticipated to grow at around 15% CAGR. A similar rate of growth in exports can also be achieved with the help of suitable policy framework, infrastructure and other facilities which are expected to be provided to the industry. There is a strong need for well-planned, concerted and dedicated efforts towards export promotion of Indian stones. The emphasis needs to be on popularization of Indian stones in both the traditional markets and exploration of new avenues by strengthening the activities of the Centre for Development of Stones (C-DOS) in Rajastha by upgrading it into a national centre of excellence. Alternative option for exporting granite and marble in processed form to maximize export earnings is to develop and promote artifacts and special decorative and ornamental items of high value addition. There is tremendous skill in the country, which can
be explored and supported with special incentives. This can certainly bring about substantial foreign exchange addition, as well as significant employment generation. Projections for investment in Dimensional stone industry: Present investment in dimensional stone industry in India is estimated at Rs.20, 000 crores. It is expected that given the right policy support, the total turnover of the sector estimated to be around Rs. 30,000 crores (2009-10) will increase to over Rs. 40,000 crores by 2012-13, and thereafter double every five years considering an estimated growth rate of 15%. To sustain this growth, it is estimated that investment in this sector will have to go up to about Rs. 1,07,500 crores by 2022 – 23 (including foreign investment).
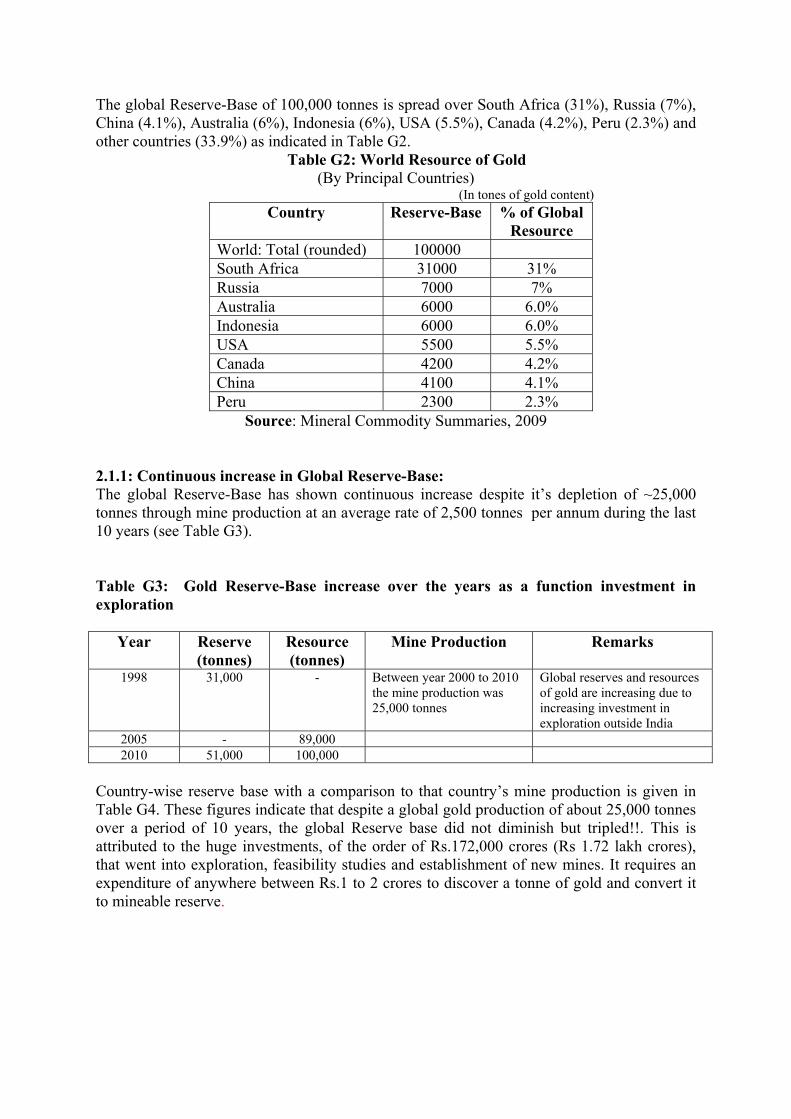
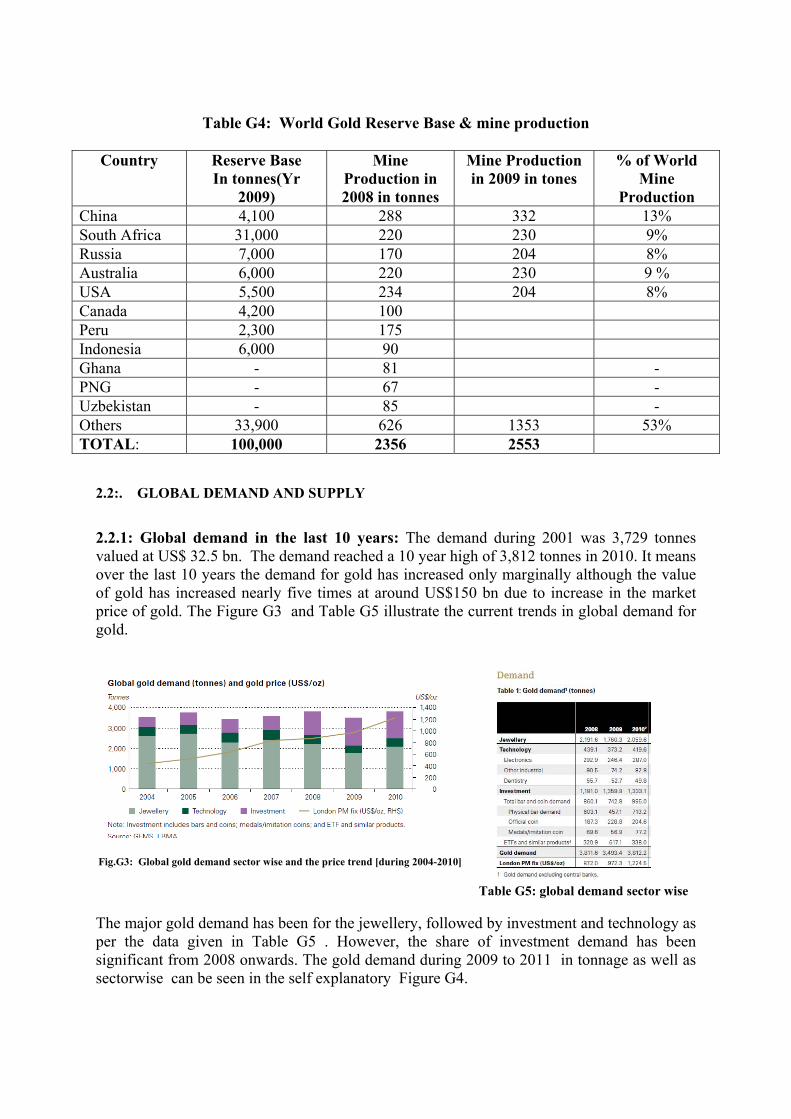
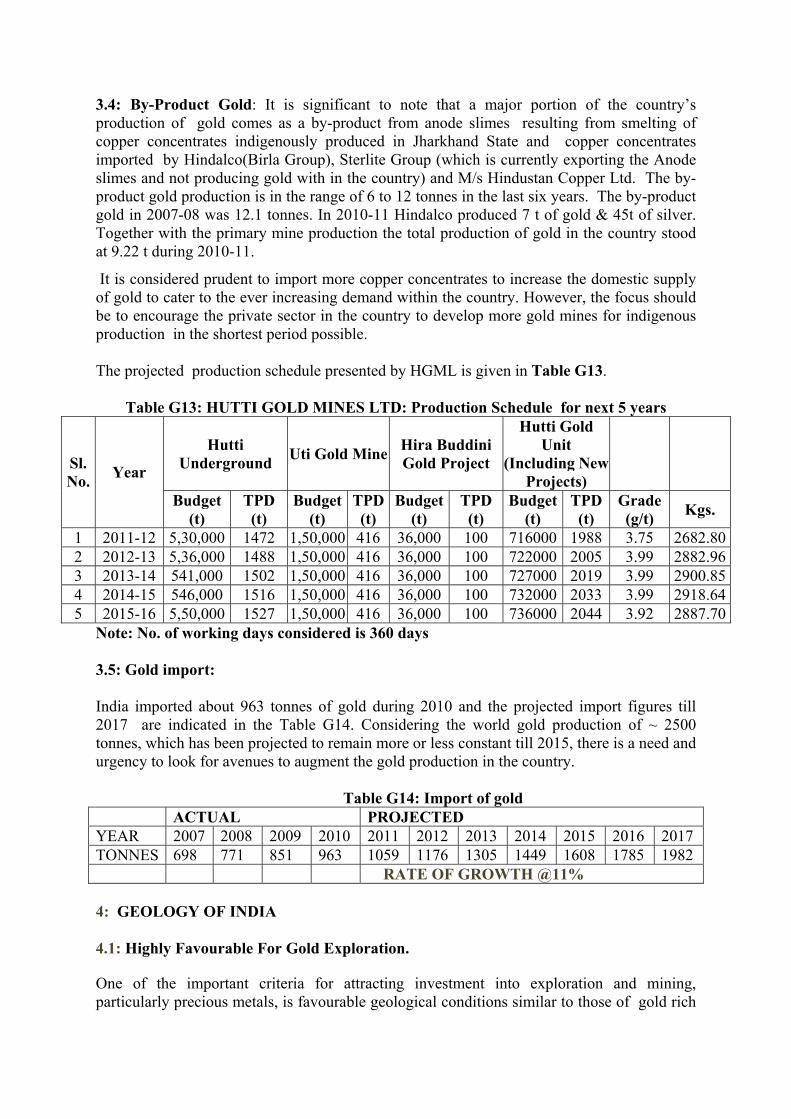
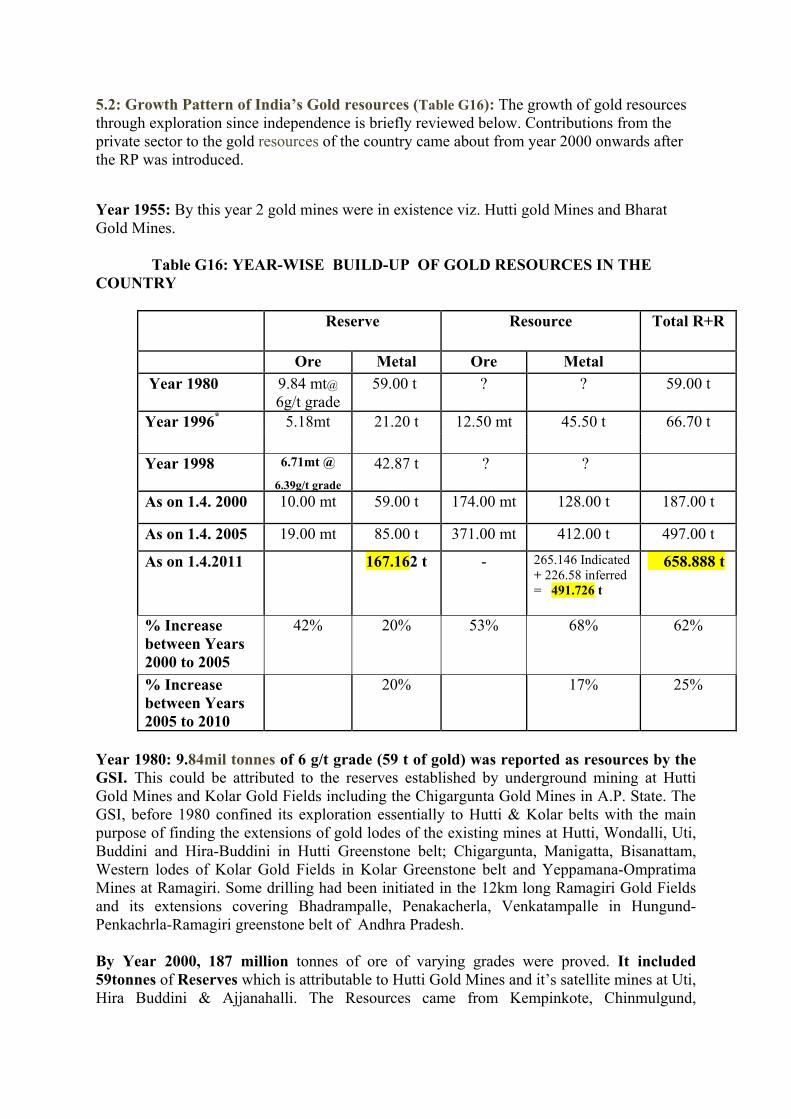
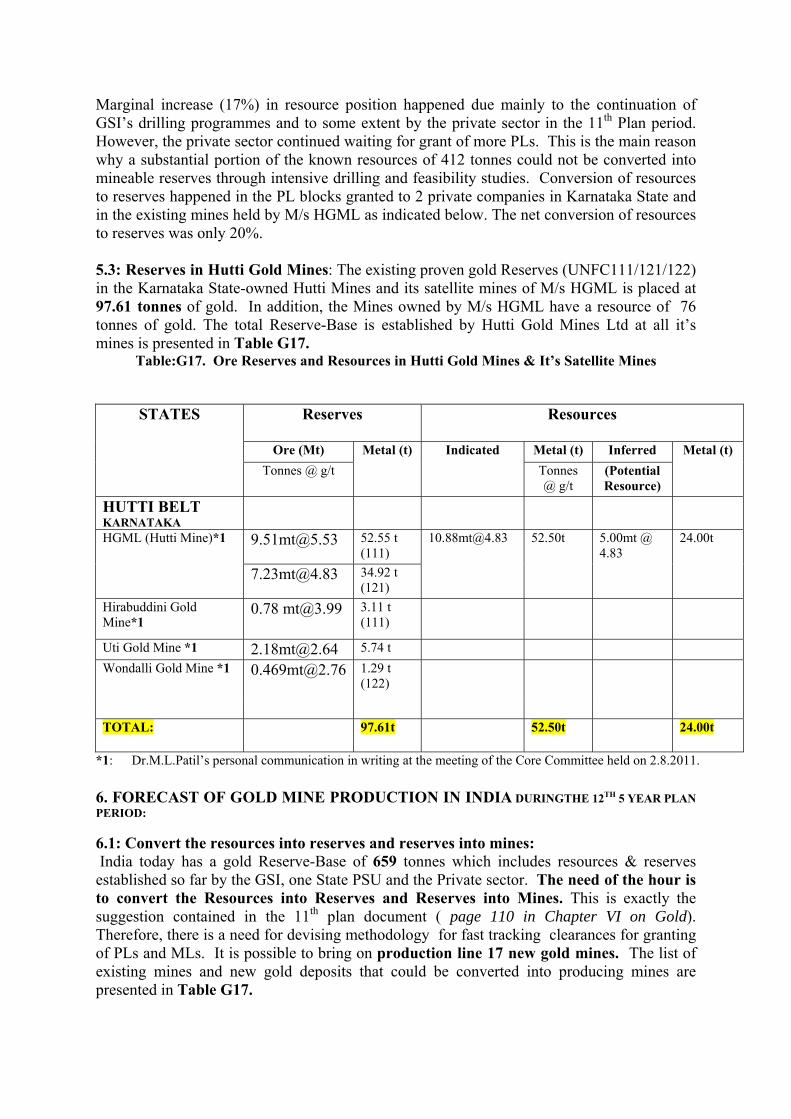
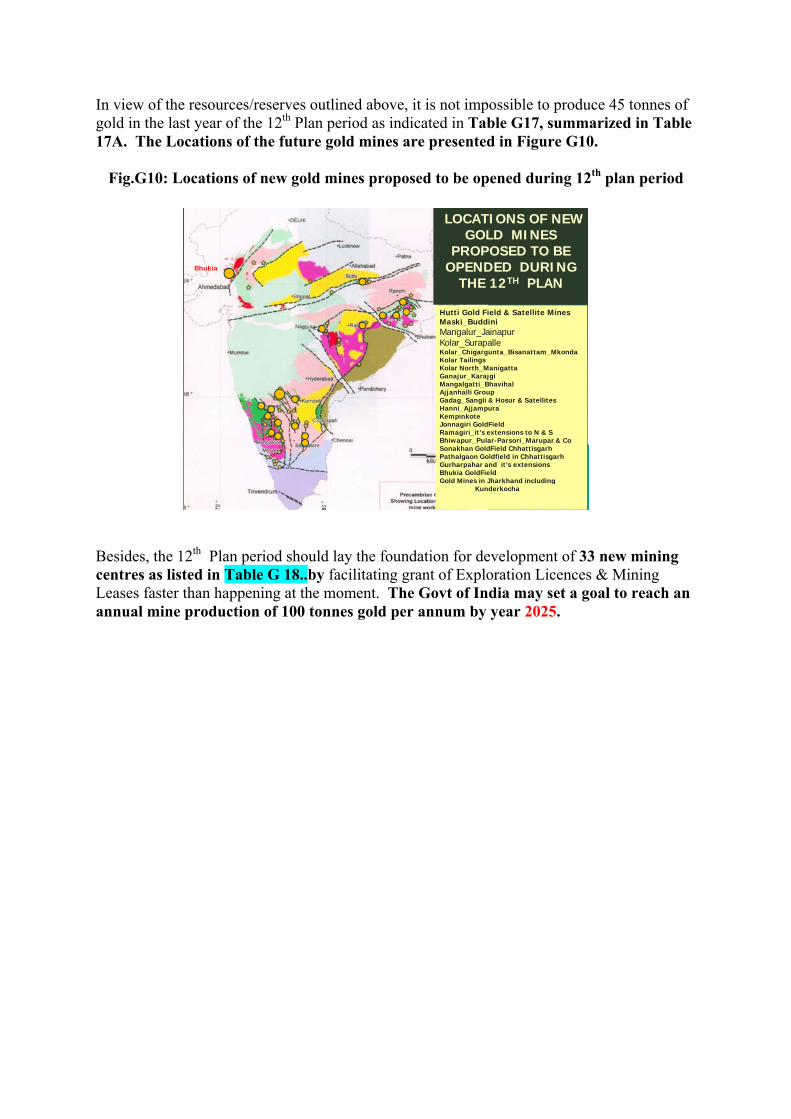
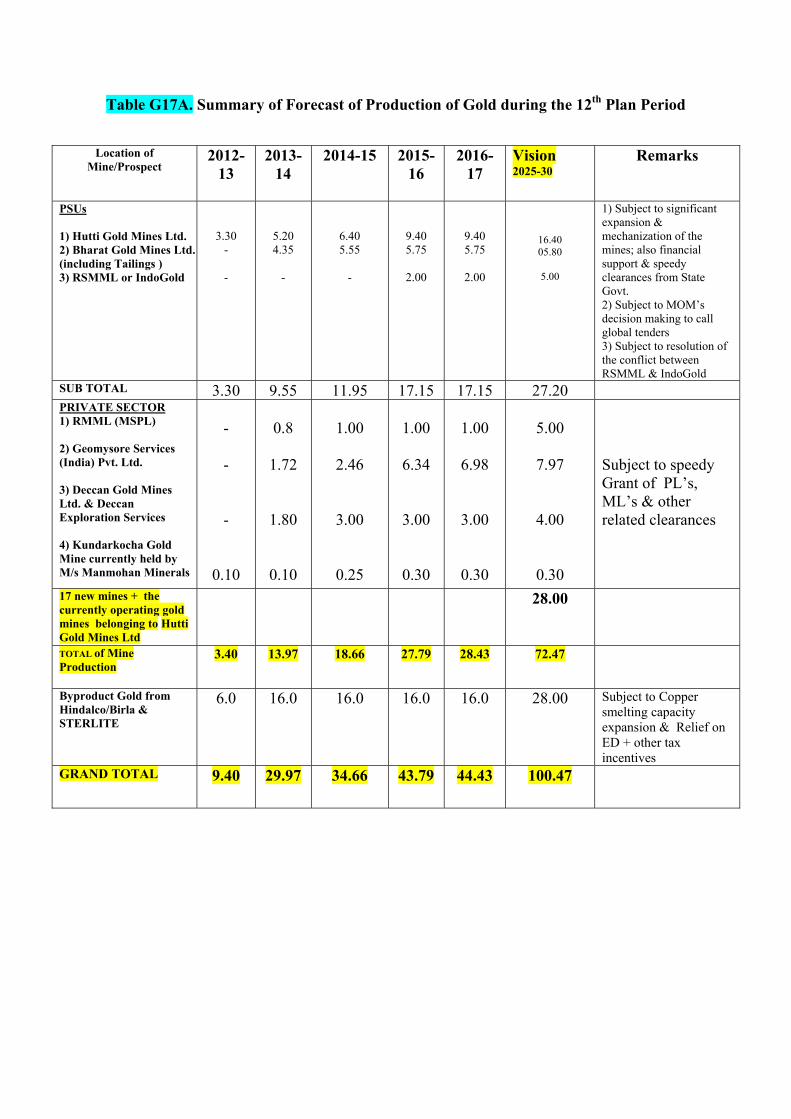
7. GOLD AND PRECIOUS METALS Gold has a high commercial status because it has always been in high demand for it's fine jewellery characteristics; enjoys high value even for a very small volume; easily encashable; indestructible and non-corrosive hence lasts forever as a commodity. Because of these qualities gold is often treated as currency. It is important to note that stock of gold in a country’s treasury and it's annual accumulation lead to growth of a Nation's Gross Domestic Product (GDP). World Scenario The term Reserve-Base refers to both Resources and Reserves. The global geological reserves of gold have been placed at 51,000 tonnes out of which, about 14% is located in Australia, 12% in South Africa, 10% in Russia, 6% in USA , 6% in Indonesia, 3.9% in Peru, 3.7% in China and 3.3% in Uzbekistan. The global Reserve-Base of 100,000 tonnes is spread over South Africa (31%), Russia (7%), China (4.1%), Australia (6%), Indonesia (6%), USA (5.5%), Canada (4.2%), Peru (2.3%) and other countries (33.9%). The total Gold production from mines in the world during the year 2,553 tons. The major producers are China, South Africa, Australia and USA. The supply of Gold by way of recycling is 1,653 tons. Thus the total supply was 4,196 tons. Indian Scenario The total Reserve-Base in the country as on 1.4.2011 is 658 tonnes of gold metal. This tonnage is spread over 13 different States of the Country. Out of this tonnage 167 tonnes is categorized as Reserves in the sense they are economically mineable. The remaining about 491 tonnes of metallic gold is classified as resource of which 265 tonnes is the actual drilled resources and the remaining 226 tonnes is the projected potential resource which falls under 331/332 UNFC categories. India’s contribution to the world mine production is insignificant being 2.22 tonnes which continues to come from only one major producing mine and its two satellite mines viz. (i) Hira-Buddini and (ii) Uti, all belonging to Hutti Gold Mines Ltd. It is significant to note that a major portion of the country’s production of gold comes as a by-product from anode slimes resulting from smelting of copper concentrates indigenously produced in Jharkhand State and copper concentrates imported by Hindalco(Birla Group). The by-product gold in 2007-08 was 12.1 tonnes. In 2010-11 Hindalco produced 7 t of gold & 45t of silver. Together with the primary mine production the total production of gold in the country stood at 9.22 t during 2010-11.
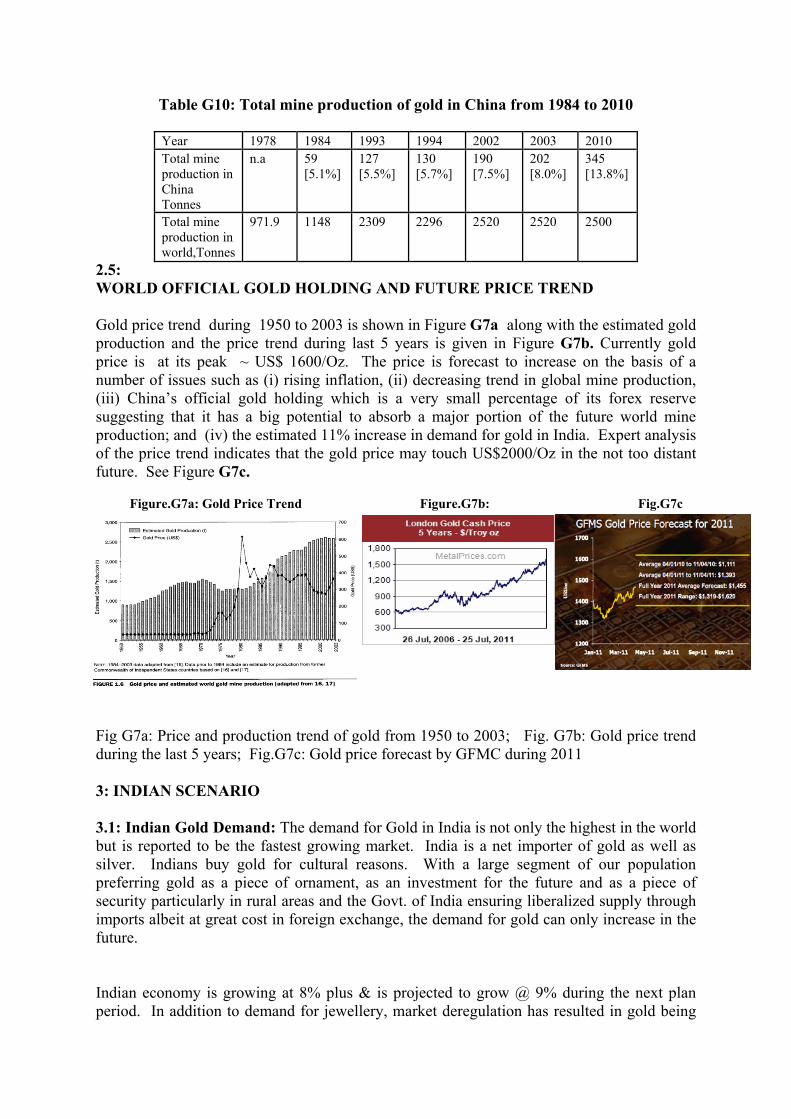
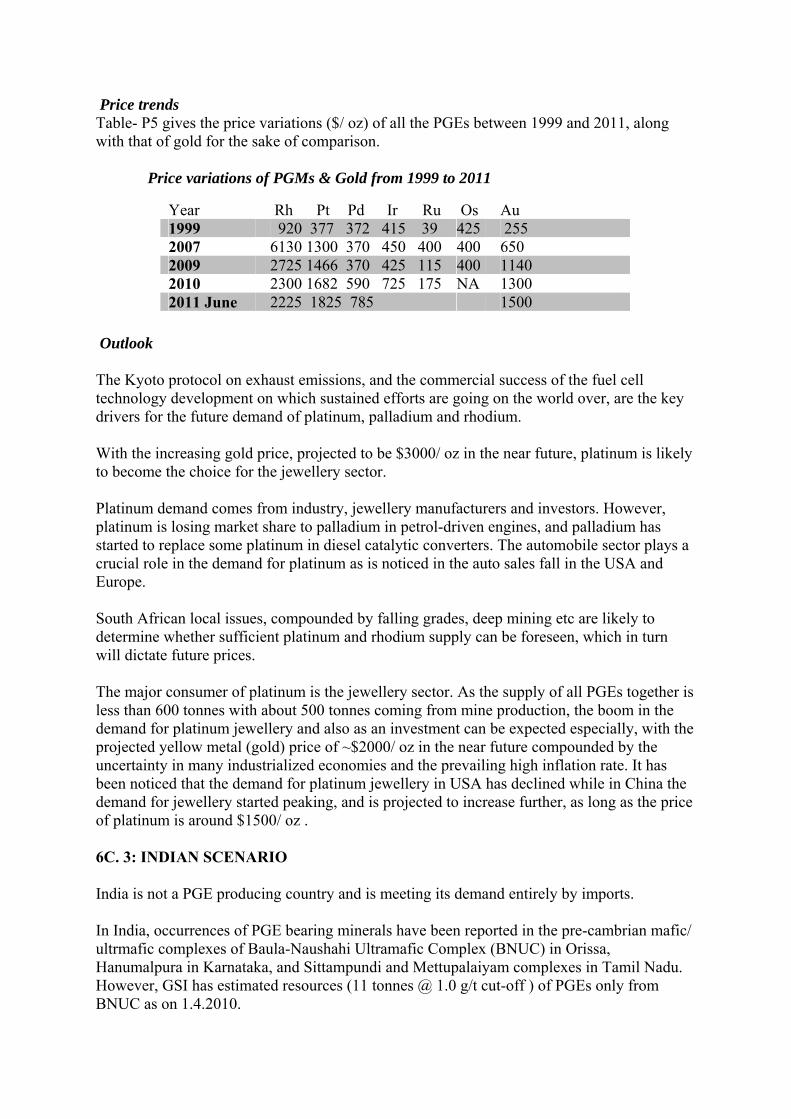
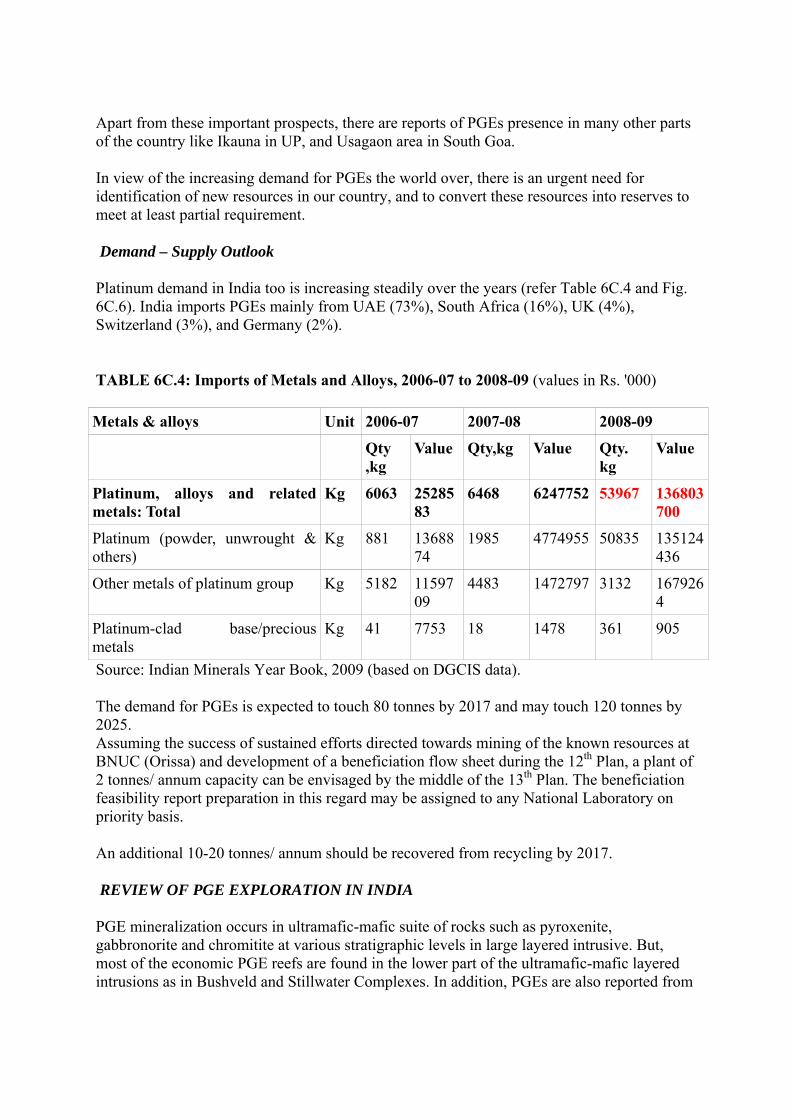
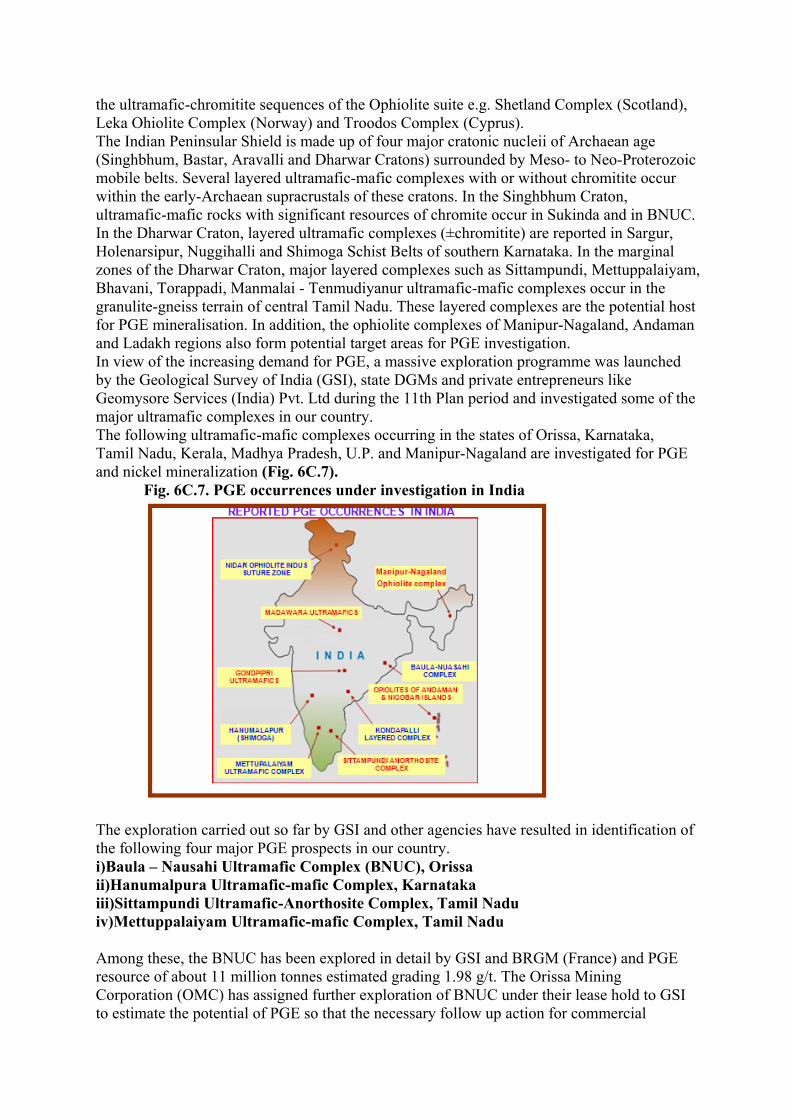
India imported about 963 tons of gold during 2010.The projected imports at the growth rate of 11% from 2012-2017 are 9305 tons at an average of 1861 tons per year. As per world Gold council estimation, expected gold consumption India during the year 2011 1167 tons, against the 800 tons, projected in 11th plan for he year 2011-12.Considering the production expansions of HGML, BGML and RSMML and opening of new mines from private sector viz. MSPL, Geomysore, Deccan Gold and Manmohan Minerals during the 12th plan period from 2013-14, Gold production is projected at 28.00 tonnes from mines and 16 tonnes from by product totaled 44.00 tonnes by 2015-16. Platinum Group of Elements The Platinum Group of Elements (PGEs) covering platinum (Pt), palladium (Pd), rhodium (Rh), iridium (Ir), osmium (Os) and ruthenium (Ru) find applications in several important fields including automobile industry, medicine, jewellery, electrical and electronic sectors. World scenario: The largest reserves of PGE are located in the Bushveld Igneous Complex [BIC] of South Africa. The world reserve base of PGE is estimated to be 80,000 tonnes localised mostly in South Africa (87.5%), followed by Russia 8%) and USA (2.5%). Mine production (exclusively) by principal countries during the year 201 was 380(in tones of metal content). Indian Scenario In India, occurrences of PGE bearing minerals have been reported in the pre-cambrian mafic/ ultrmafic complexes of Baula-Naushahi Ultramafic Complex (BNUC) in Orissa, Hanumalpura in Karnataka, and Sittampundi and Mettupalaiyam complexes in Tamil Nadu. However, GSI has estimated resources (11 tonnes @ 1.0 g/t cut-off ) of PGEs only from BNUC as on 1.4.2010. The major consumer of platinum is the jewellery sector. As the supply of all PGEs together is less than 600 tonnes with about 500 tonnes coming from mine production, the boom in the demand for platinum jewellery and also as an investment can be expected especially, with the projected yellow metal (gold) price of ~$2000/ oz in the near future compounded by the uncertainty in many industrialized economies and the prevailing high inflation rate. Platinum demand in India too is increasing steadily over the years (refer Table 6C.4 and Fig. 6C.6). India imports PGEs mainly from UAE (73%), South Africa (16%), UK (4%), Switzerland (3%), and Germany (2%).
Table for Imports of Metals and Alloys, 2006-07 to 2008-09 (values in Rs. '000)
Metals & alloys Unit 2006-07 2007-08 2008-09
Qty ,kg
Value Qty,kg Value Qty. kg
Value
Platinum, alloys and related metals: Total
Kg 6063 2528583
6468 6247752 53967 136803700
Platinum (powder, unwrought & others)
Kg 881 1368874
1985 4774955 50835 135124436
Other metals of platinum group Kg 5182 1159709
4483 1472797 3132 1679264
Platinum-clad base/precious metals
Kg 41 7753 18 1478 361 905
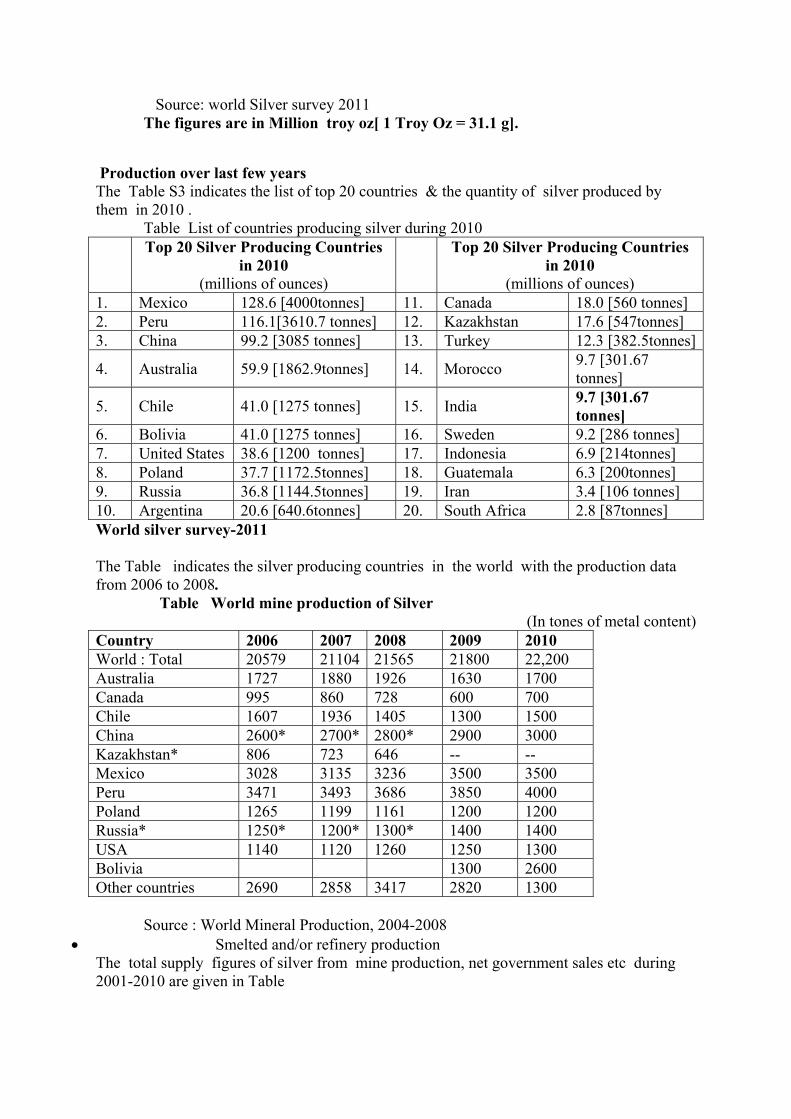
Silver: Silver is metal used both as precious metal for investment and Jewellary and has good industrial use also. India is the largest importer and largest consumer of silver in the world. The average domestic consumption of silver in the country on an average ~ 3000 tonnes per annum. The current pattern of utilization of silver in the country and bearing in mind the anticipated increase in the GDP, the future demand for silver in the country is likely toexceed 6000 tonnes per annum by 2017. Distribution of global reserves
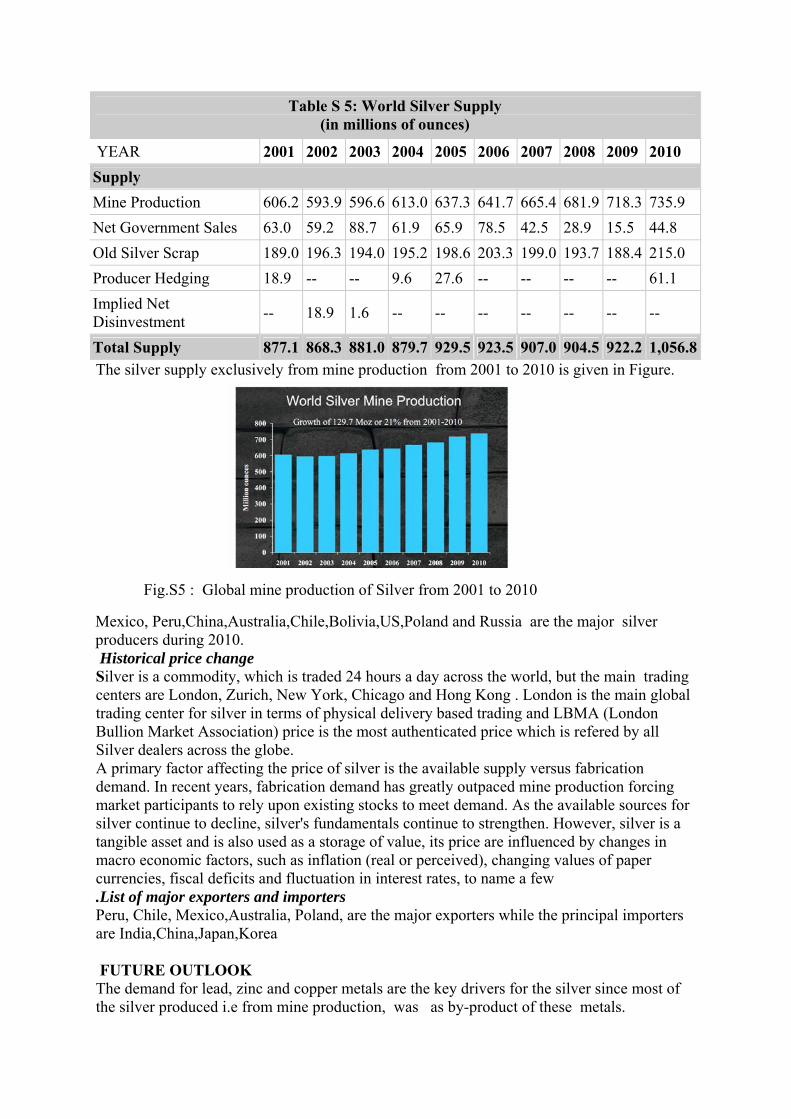
The total silver metal reserves of the world are 510,000 Tonnes Out of this, the major silver reserves are situated at Peru (120,000 tonnes metal),Chile (70,000Tonnes), Australia (69,000 tonnes),Poland ( 69,000 Tonnes),China (43,000Tonnes,), Mexico (37,000Tonnes),USA (25,000 Tonnes) Canada (7000 Tonnes) while the rest of the countries together contained 50,000 Tonnes, as per the report of Mineral commodity summaries -2011. The global production of silver is of the order of 1057 MOz (about 32,873 tonnes during 2010). Major portion of it is originating from lead, lead-zinc and copper mines as by product. Stand-alone silver mines are scarce and few mines are only in operation. Out of the current production of silver in India [185 tonnes in 2010] around 139 tonnes is originating as byproduct of smelting of lead, zinc ores and a small quantity of 218 kg is being produced as a co-product of refining of gold from Hutti Gold Mines. The country has a resource base of 10,000 tonnes silver as of 1.4.2011. However, presence of an additional source of 10,000 tonnes is estimated in view of the reported 577 Million tonnes of lead-zinc ore resources by HZL.
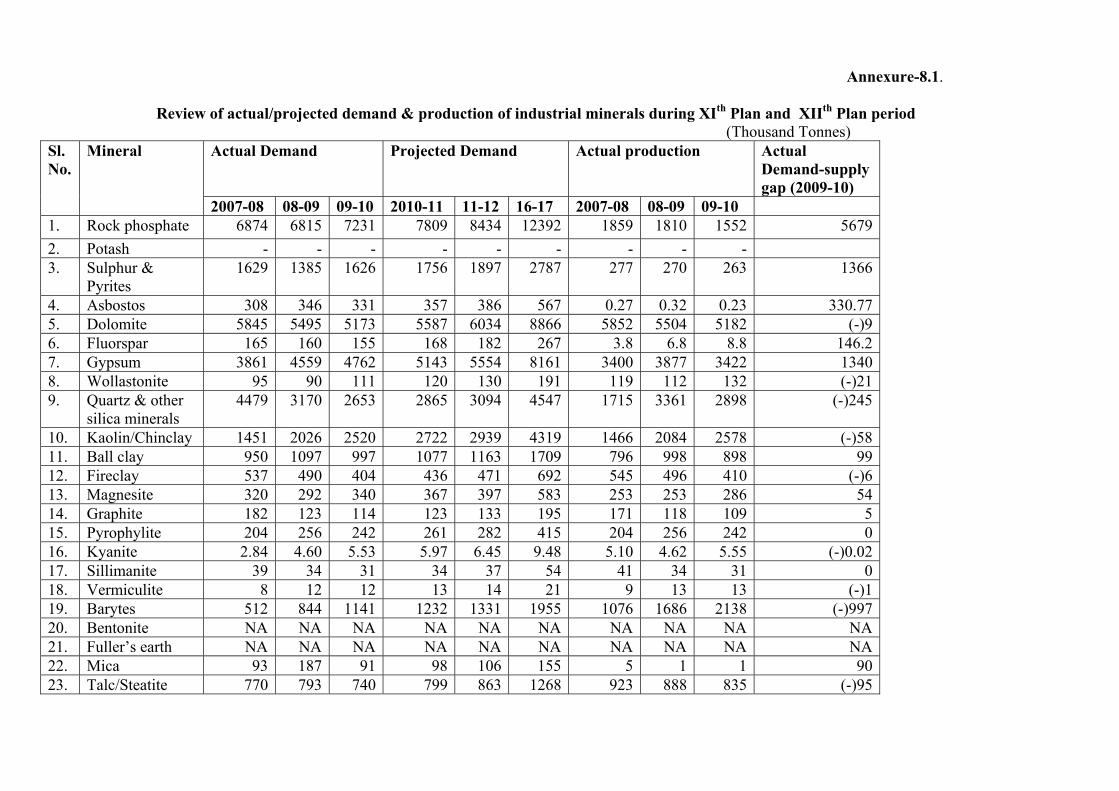
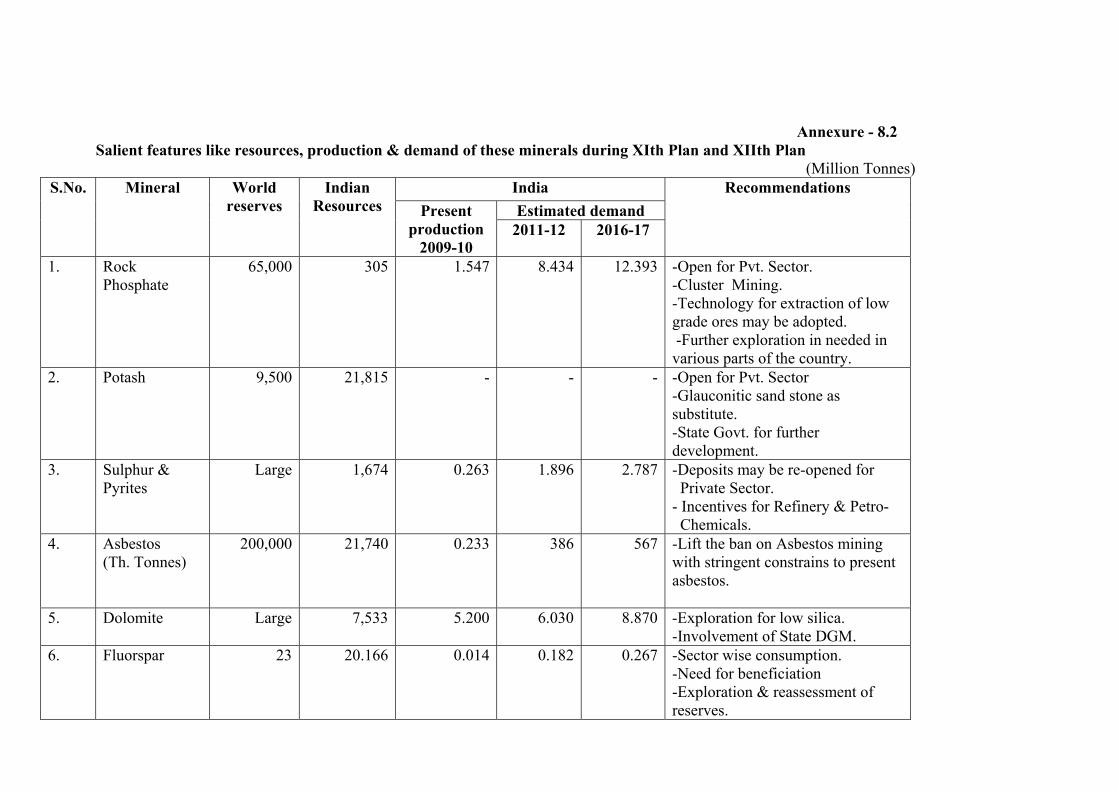
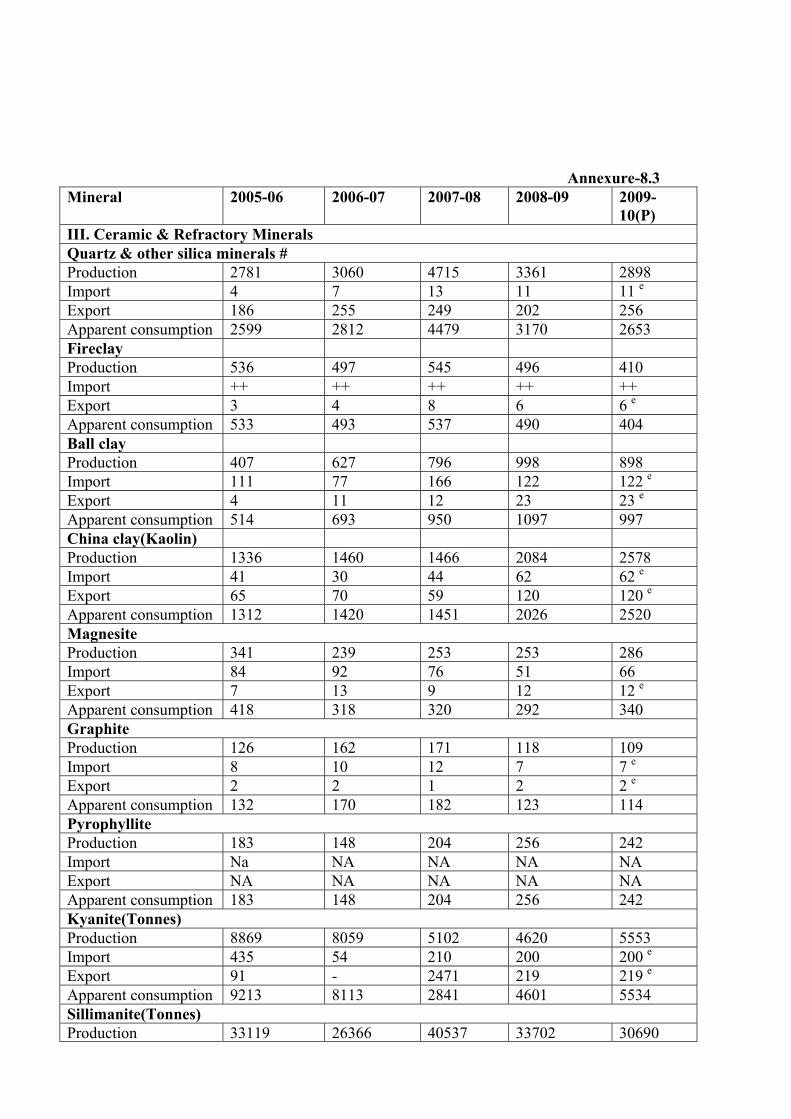
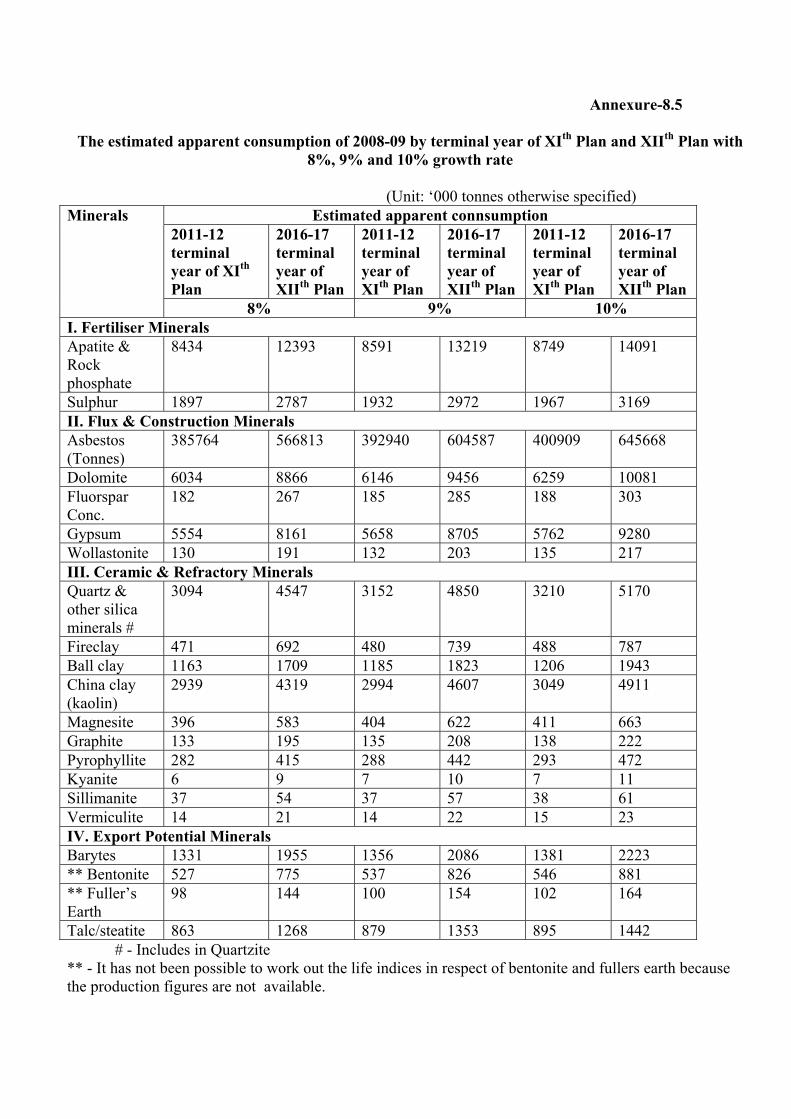
8.INDUSTRIAL / NON – METALLIC MINERALS
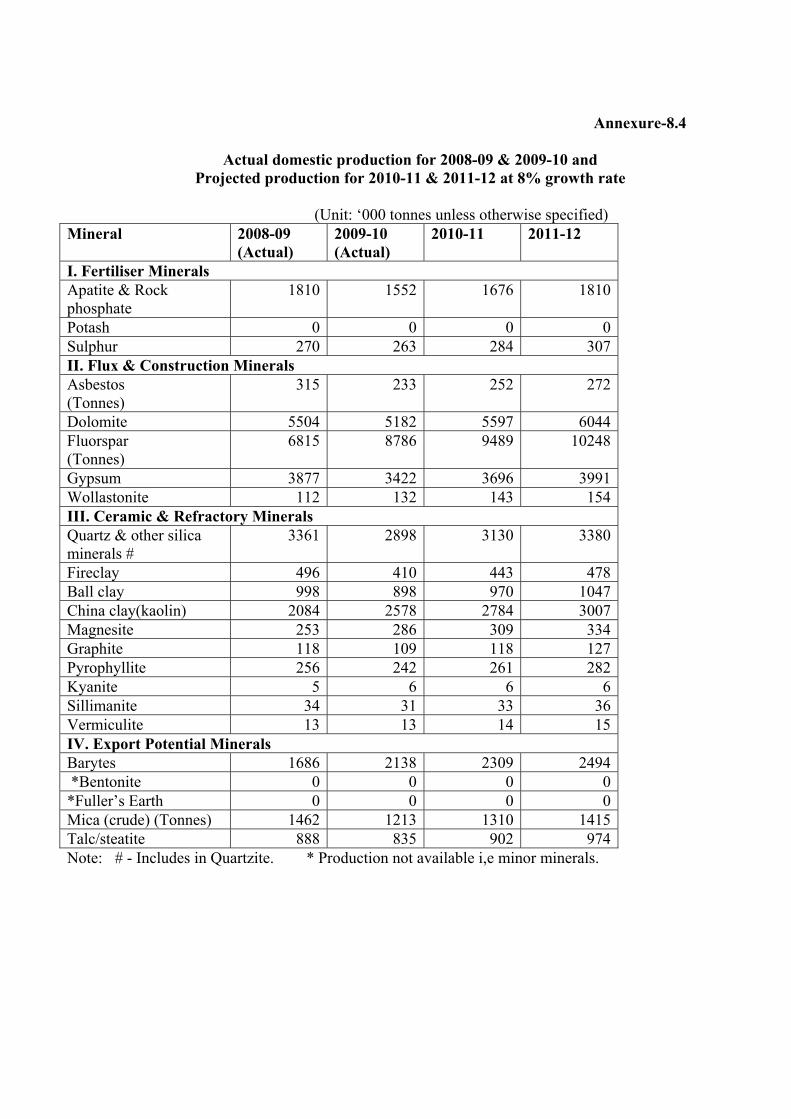
Under Industrial/Non-Metallic minerals, Fertilizer minerals, Flux & Construction minerals, Ceramic & Refractory minerals & Export Potential Minerals like Barytes, Bentonite, Mica & Steatite are dealt. These minerals have potential use in the down stream industries like glass, ceramic, fertilizer, refractory and chemical etc. The Reserve/Resource status, production, current demand/supply and future projections etc have been discussed in detail in the relevant mineral wise chapter. Some of the important minerals from each industry mentioned above are summarized below: Rock Phosphate: Global Scenario The rock phosphate or phosphorite is mainly fossiliferrous calcareous sandstone exhibiting reddish-brown colour at places, being ferruginous. The total world reserves are 65,000 Million tonnes. World production of marketable phosphate rock was 176 million tonnes in 2010, a 6% increase compared with that of 2009. The United States with 26 million tonnes, China with 65 million tonnes and Morocco and Western Sahara with 26 million tonnes were the leading
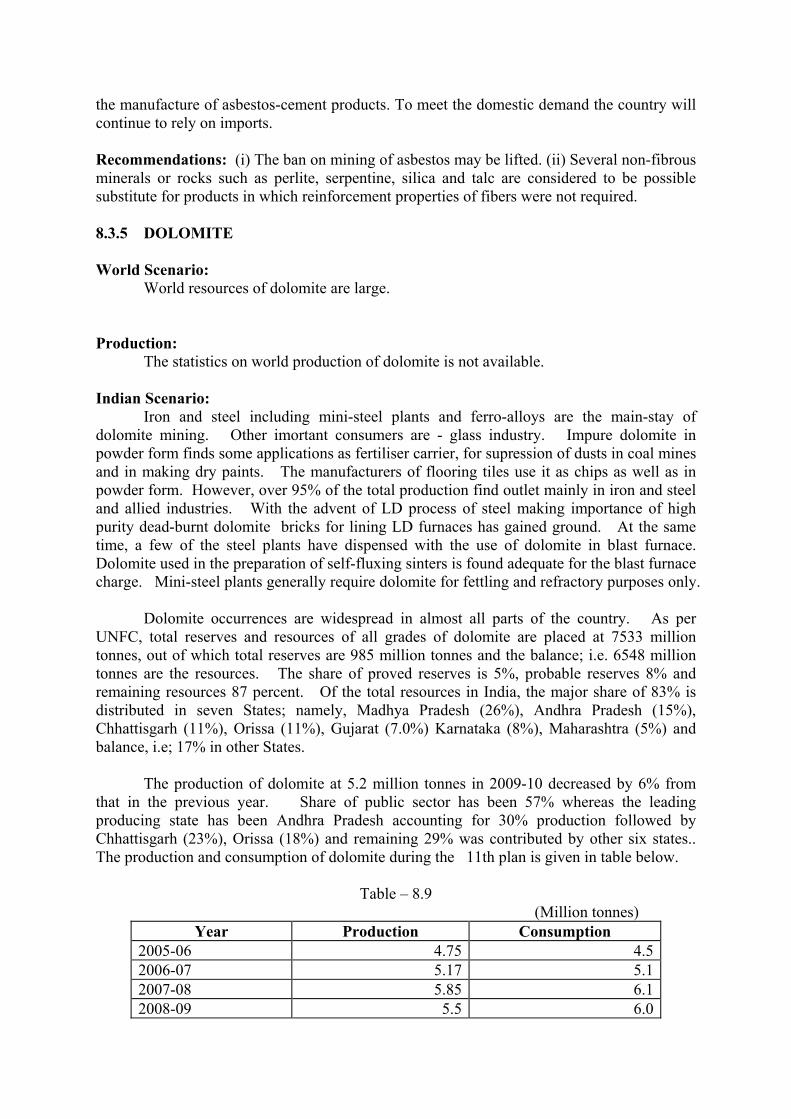
producing countries, accounting for 67% of the production. India’s production is a meager 1.55 million tonnes. As a result, India will continue to rely on imports to meet its demand.
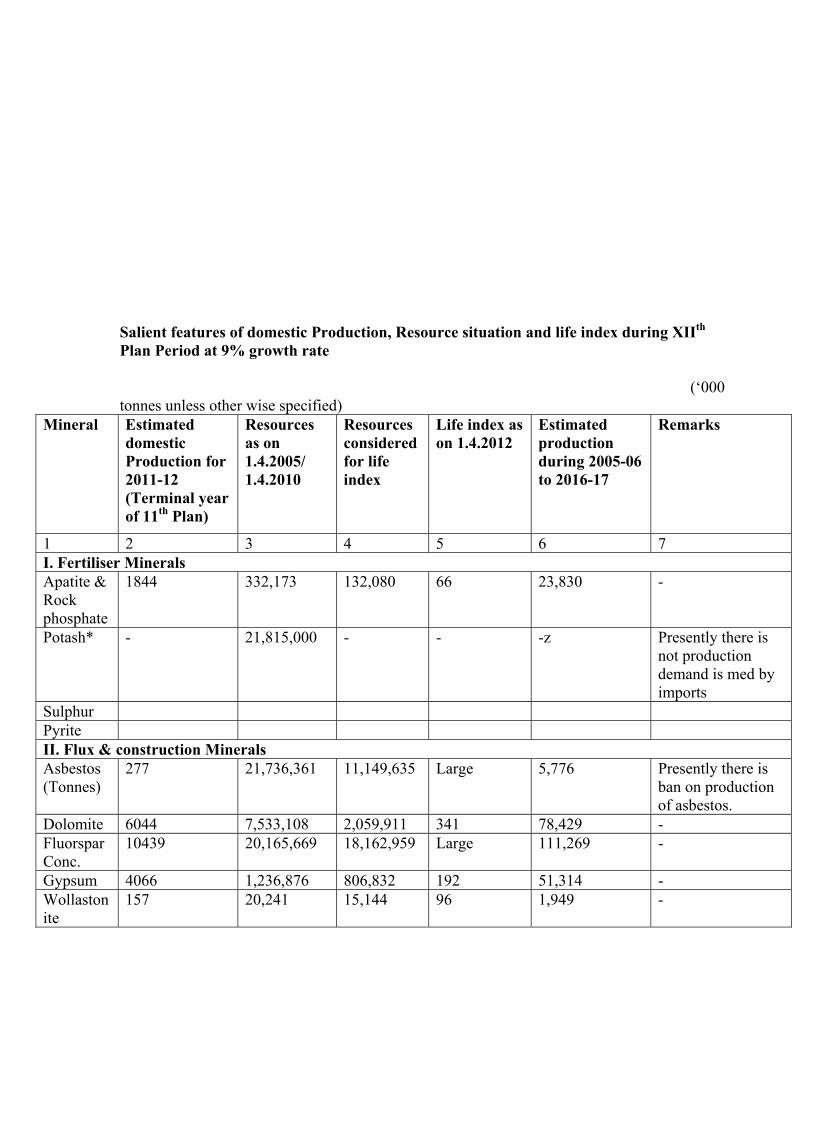
Indian Scenario: The total reserves as per IBM as on 1.4.2010 are 3,52,53,050 tonnes.Resources are 26,32,55,701 tonnes and total reserves/resources are 29,85,08,751 tonnes. The total production of phosphorite at 1.55 million tonnes in 2009-10 decreased by about 14% from that in the previous year due to less lifting of ore at crushing plant of Jhamarkotra mine of RSMML, Rajasthan
Future demand and supply The apparent demand of apatite and rock phosphate was 7.23 million tonnes in 2009-10. The apparent consumption of apatite and rock phosphate is estimated at 8.59 million tonnes by 2011-12 and at 13.22 million tonnes by 2016-17 at 9% growth rate.
Asbestos: World Scenario: The world has 200 million tonnes of identified resources. The important countries where resources of asbestos are available are United States, Brazil, Canada, China, Kazakistan and Russia. The world production of asbestos was 2.0 million tonnes in 2010. The important producers were Russia (1000 thousand tonnes), China (350 thousand tonnes), Brazil (270 thousand tonnes) and Kazakistan (230 thousand tonnes). Canada and Zimbabwe are major producers of chrysotile variety. India’s production was 233 tonnes only
Indian Scenario
As per United Nation’s Framework Classification (UNFC) system, total resources (reserves and remaining resources) of asbestos in the country as on 1.4.2005 are placed at 21.74 million tonnes. Of these, 6.04 million tonnes are reserves and 15.70 million tonnes are remaining resources. Out of total resources of 21.74 million tonnes, Rajasthan accounts for 61% and Karnataka 38%. The production of asbestos at 233 tonnes in 2009-10 decreased by about 26% from that in the previous year. The decrease in production was due to closure of mines. The entire production of asbestos was of chrysotile variety and was reported from Andhra Pradesh. The internal consumption of asbestos was about 109 thousand tonnes per annum, almost entirely in asbestos-cement and asbestos-based products manufacturing. The apparent consumption of asbestos during 2009-10 was about 331 thousand tonnes. The apparent demand of asbestos is estimated at 393 thousand tonnes by 2011-12 and at 605 thousand tonnes by 2016-17 at 9 % growth rate. Exports of asbestos decreased to 918 tonnes in 2008-09 from 3,942 tonnes in previous year. Whereas imports decreased to 346,658 tonnes from 331,705 tonnes.There is an urgent need for removal of restrictions of the mining of Chrysotile Asbestos and start the mining with appropriate precautions FLUOROSPAR:
Fluorspar is an indispensable material to aluminium metallurgy. There are two primary grade of fluorspar which is defined based on the CaF2 contents of the material: metallurgical grade fluorspar is any material containing < 97 % CaF2 whereas which acid grade fluorspar is material containing >97 % CaF2.
World scenario: The world reserves of fluorspar are 230,000(in thousand tonnes). World production of fluorspar was 5.4 million tonnes in 2010. China (3.0 million tonnes), Mexico (1.0 million tonnes), Mongolia (0.4 million tonnes), Russia (0.2 million tones and South Africa (0.10 million tones) were the principal producers. India’s production is negligible in the world context Indian Scenario As per the UNFC, the total resources (reserves and remaining resources) of flluorite in the country as on 1.4.2005 were estimated at 20.16 million tonnes. Out of these, 9.21 million tonnes were placed under reserves category and 10.95 million tonnes under remaining resources category. The total production reported from the year 2005-06 to 2009-10 is 13,782 tonnes. Cluster mining approach in order to utilize the small deposits for further industrialization of the mining area may be adopted in the sector which will improve the workability of small quaries. The average total consumption of fluorspar by all industries has been around 72,000 tonne per annum. The exports of fluorspar has decreased to around 203 tonnes in 2008-09 from 467 in 2007-08 whereas imports have considerably decreased to 153,749 tonnes in 2008-09 from 162,110 tonnes in 2007-08. The apparent domestic demand of fluorspar is estimated at 185 thousand tones by 2011-12 and at 285 thousand tones by 2016-17 at 9% growth rate
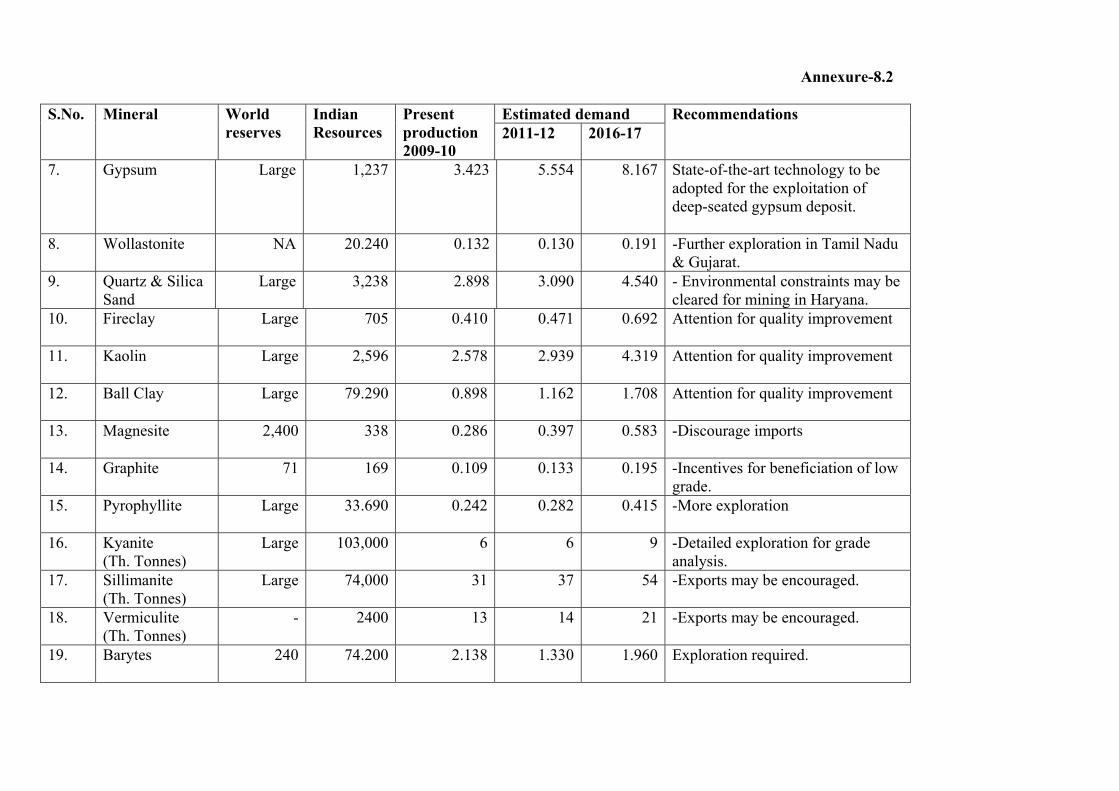
MAGNESITE
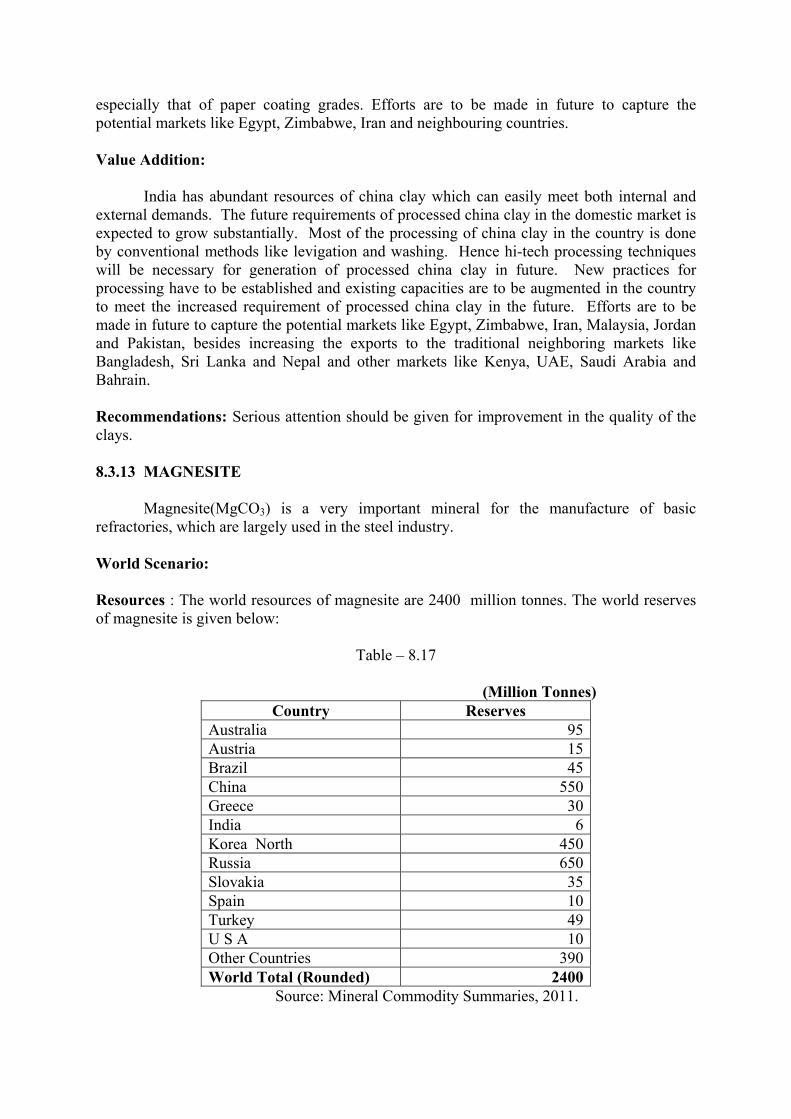
Magnesite(MgCO3) is a very important mineral for the manufacture of basic refractories, which are largely used in the steel industry. World Scenario Resources : The world resources of magnesite are 2400 million tones. The world production of magnesite was 24.3 million tonnes in 2009, an decrease of about 5% compared with that of 2008. China was the principal producer, contributing about 62%, followed by Turkey (8%), Russia (11%),Korea RP(5%), Slovakia (2%) and Austria (2%). India’s production was of the order of 286 thousand tonnes in 2009-10. Indian Scenario The total reserves/resources of magnesite as per UNFC system as on 1.4.2005 are about 338 million tonnes of which reserves and remaining resources are 76 million tonne and 262 million tonnes, respectively.
Production of magnesite in 2009-10 at 286,383 tonnes registered an increase of about 13% from that in the previous year. There were 8 reporting mines as against 16 in the previous year. Five principal producers accounted for 94% output in 2009-10. About 60% production of magnesite was contributed by public sector. Tamil Nadu continued to be the major producing State, having a maximum share of 78% output, followed by Uttaranchal 20% and Karnataka 3%. The consumption of magnesite in the organised sector increased to 282 thousand tonnes in 2009-10 because of higher consumption reported by refractory industry. The apparent
domestic demand of magnesite is estimated at 403 thousand tonnes by 2011-12 and at 622 thousand tonnes by 2016-17 at 9% growth rate.
The exports of magnesite increased to 12,000 tonnes in 2008-09 from 8,697 tonnes in the previous year. The imports also increased to 51,422 tonnes in 2008-09 from 76,287 tonnes in the previous year. Out of the total imports, magnesite (calcined) were 12,992 tonnes only. The imports were mainly from People’s Republic of China, Iceland, Australia, Nether land, Japan, and Slova Rep. GRAPHITE
Graphite is used as a raw material in a large number of industries such as crucible, foundry facing, dry cell battery, lubricants, pencils, paints, etc.
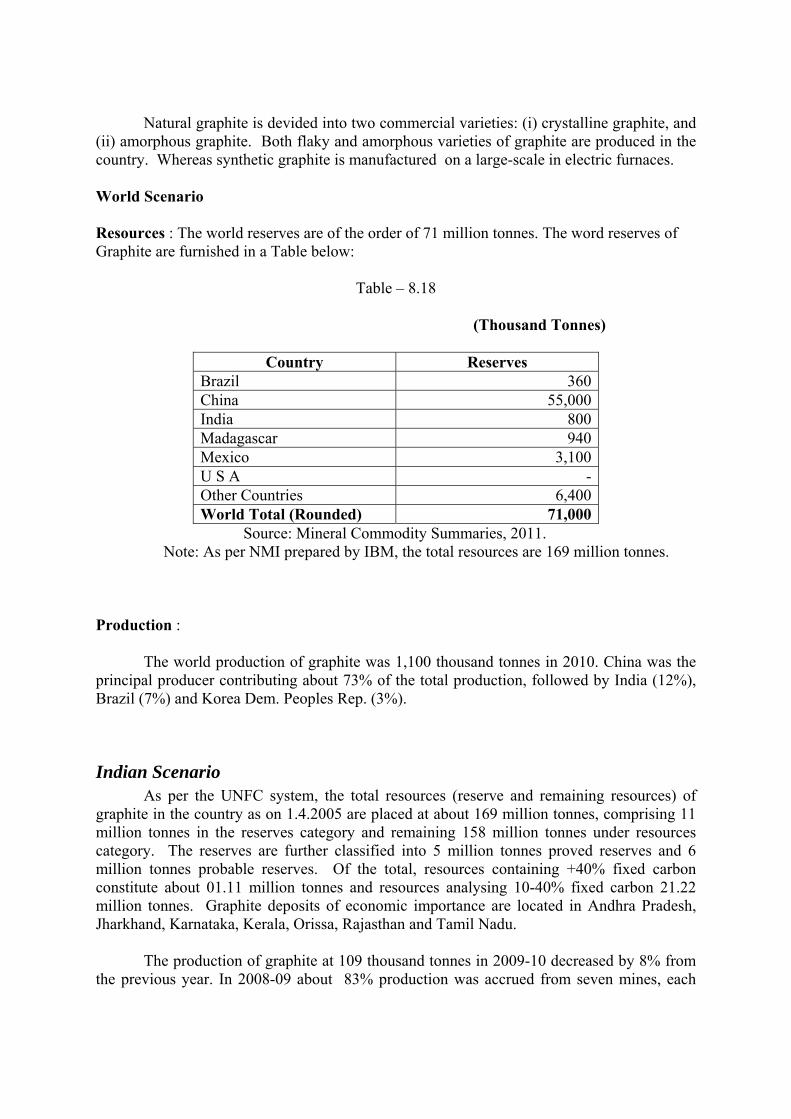
World Scenario Resources : The world reserves are of the order of 71 million tones. The world production of graphite was 1,100 thousand tonnes in 2010. China was the principal producer contributing about 73% of the total production, followed by India (12%), Brazil (7%) and Korea Dem. Peoples Rep. (3%).
Indian Scenario
As per the UNFC system, the total resources (reserve and remaining resources) of graphite in the country as on 1.4.2005 are placed at about 169 million tonnes, comprising 11 million tonnes in the reserves category and remaining 158 million tonnes under resources category.
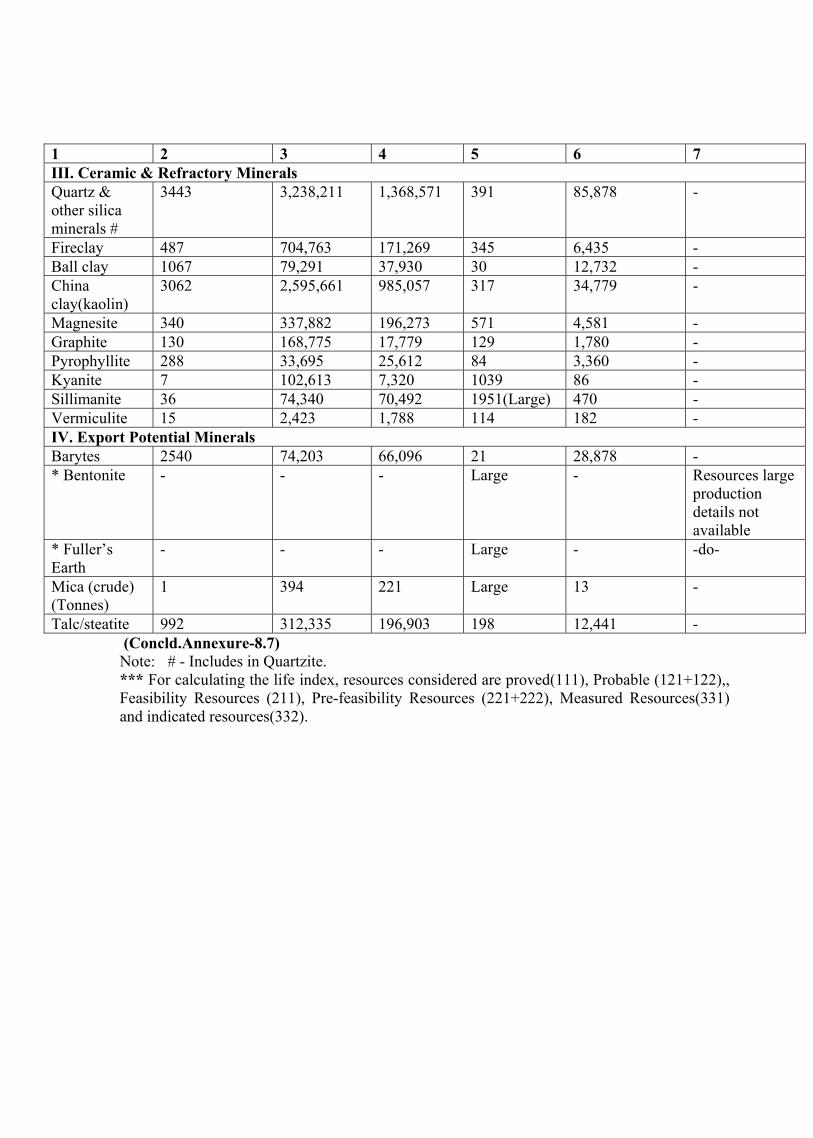
The production of graphite at 109 thousand tonnes in 2009-10 decreased by 8% from the previous year. In 2008-09 about 83% production was accrued from seven mines, each producing more than 5,000 tonnes and Tamil Nadu was in the leading position contributing about 46% output followed by Orissa and Jharkhand. Consumption of various grades of graphite in the organised sector was in the range of 14 thousand tonnes during the last three years. Out of total consumption, the refractory 45% and crucible industries 30% accounted for 75% and foundry industry 7%. The apparent domestic demand of graphite run of mine is estimated at 135 thousand tonnes by 2011-12 and at 208 thousand tonnes by 2016-17at 9% growth rate.
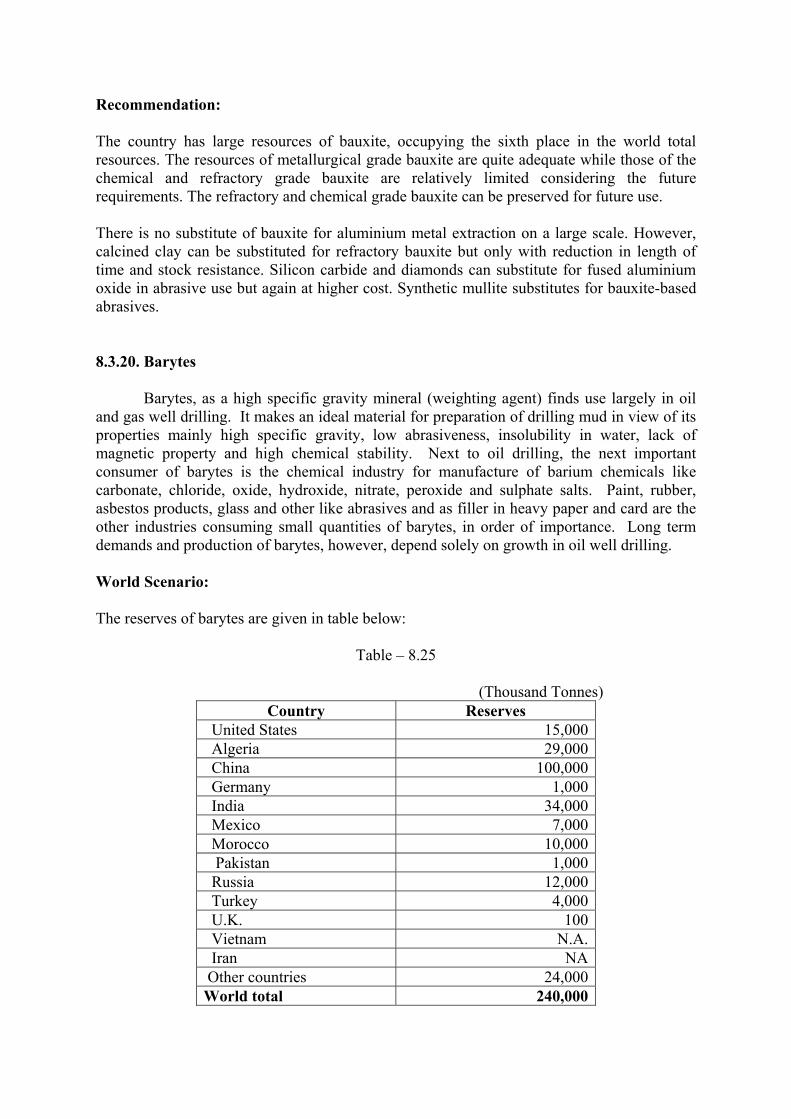
The exports showed an increasing trend; the export being 1909 tonnes of natural graphite in 2008-09 as against 1420 tonnes in the previous year and the imports of 7309 tonnes from 11666 tonnes in 2007-08. However, exports and imports of graphite crucibles increased. Barytes Barytes, as a high specific gravity mineral (weighting agent) finds use largely in oil and gas well drilling. Next to oil drilling, the next important consumer of barytes is the chemical industry for manufacture of barium chemicals like carbonate, chloride, oxide, hydroxide, nitrate, peroxide and sulphate salts. World Scenario The total world resources are 240,000(in thousand tones). World production of barytes was 6.9 million tonnes in 2010. The important producers were China (3.6 million tonnes), India (1 million tonnes), USA (0.67 million tonnes), Morocco (0.46 million tonnes) and Mexico (0.4 million tonnes) were the principal producers. India occupies second position. Indian Scenario
The total resources of barytes in India as on 1.4.2005 as per UNFC are placed at 74.2 million tonnes constituting 46% reserves and 54% remaining or additional resources. Andhra Pradesh alone accounted for more than 99% country’s reserves as well as more than 94% country’s remaining resources of barytes.
The production of barytes at about 2.14 million tonnes in 2009-10 increased by about 27% from that in the previous year. Andhra Pradesh continued to be the premier State accounting for almost the entire production .
The domestic consumption of barytes in the organised sector increased to 141,300 tonnes in 2008-09 from 126,000 tonnes in 2007-08. Oil and gas drilling industry, the main consumer of barytes in India, accounted for 70% consumption followed by chemical industry (24%). The apparent domestic demand of barytes is estimated at 1.36 million tonnes by 2011-12 and at 2.09 million tonnes by 2016-17 at 9 % growth rate.
The exports of barytes increased to 843,789 tonnes in 2008-09 as against 564,800 tonnes in the previous year. Venezuala was the main buyer followed by Saudi Arabia,USA and UAE.. Imports were 1674 tonnes mainly from China.
TALC, SOAPSTONE AND STEATITE Talc is a hydrous magnesium silicate. In trade, talc often includes: (I) the mineral talc in the form of flakes and fibres; (ii) steatite, the massive compact cryptocrystalline variety of high-grade talc; and (iii) soapstone, the massive talcose rock containing variable talc (usually 50%), soft and soapy to feel.
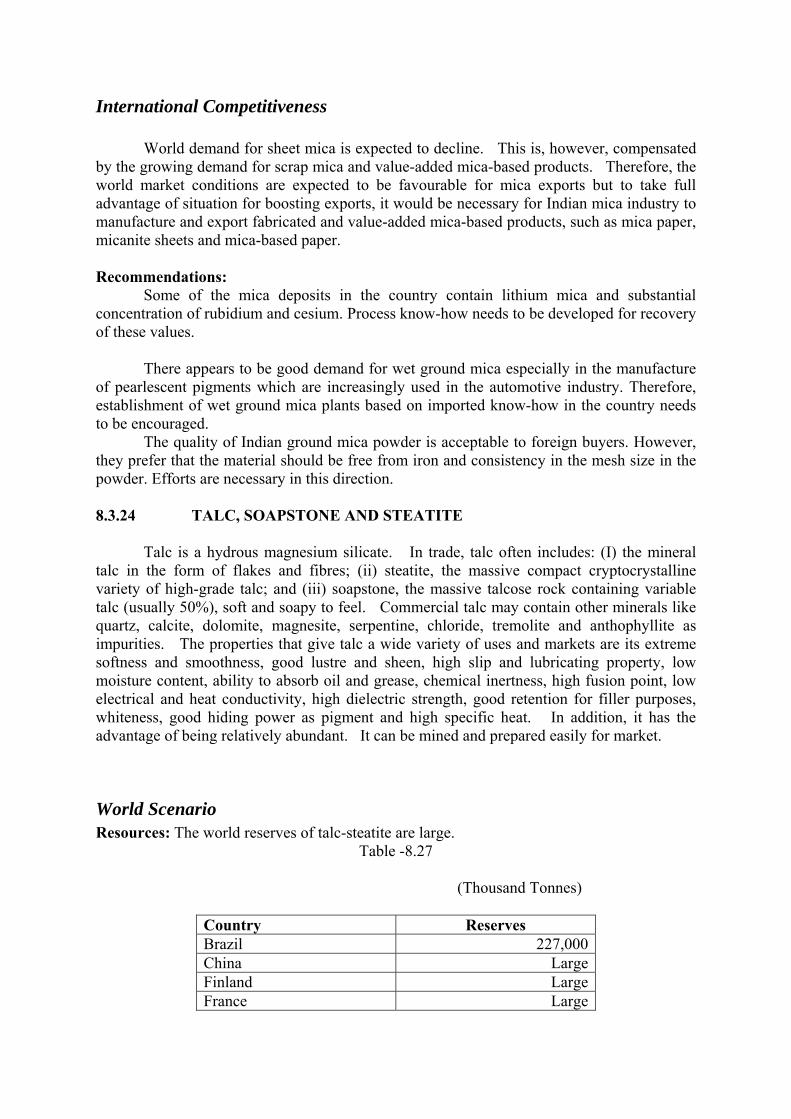
World Scenario
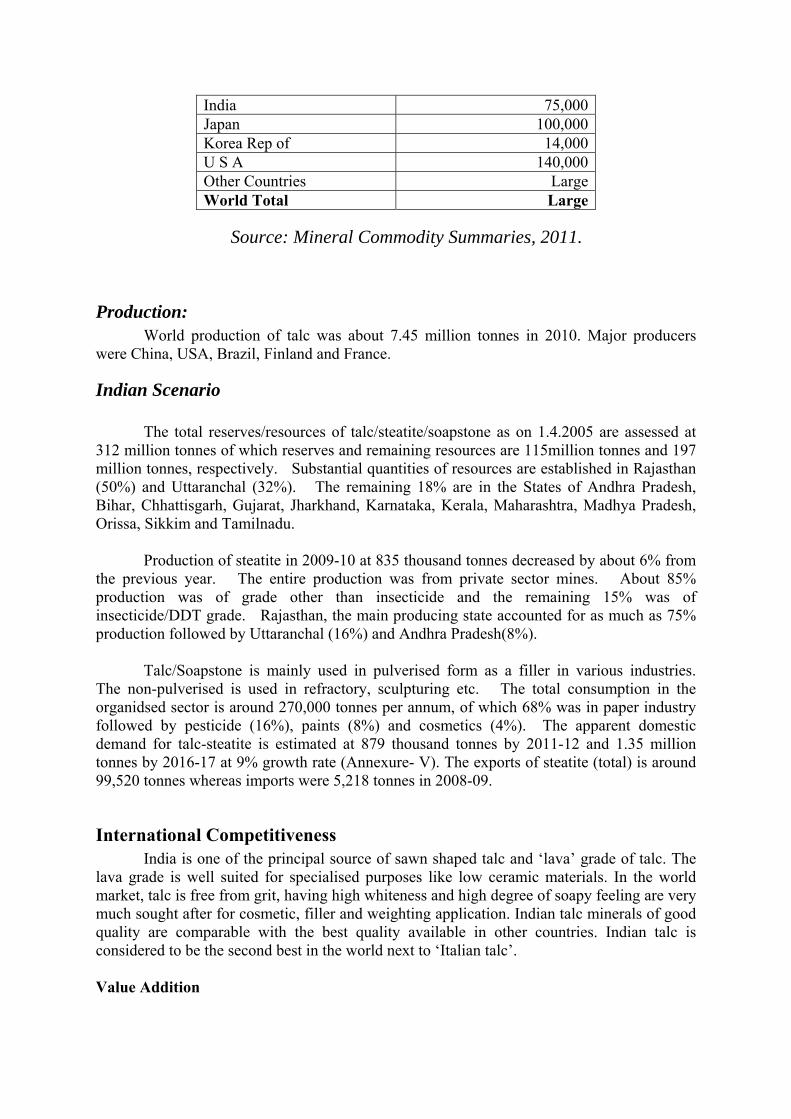
The total world resources are 551,000(in thousand tones). World production of talc was about 7.45 million tonnes in 2010. Major producers were China, USA, Brazil, Finland and France
Indian Scenario
The total reserves/resources of talc/steatite/soapstone as on 1.4.2005 are assessed at 312 million tonnes of which reserves and remaining resources are 115million tonnes and 197 million tonnes, respectively. Substantial quantities of resources are established in Rajasthan (50%) and Uttaranchal (32%).
Production of steatite in 2009-10 at 835 thousand tonnes decreased by about 6% from the previous year. The entire production was from private sector mines. About 85% production was of grade other than insecticide and the remaining 15% was of insecticide/DDT grade. Rajasthan, the main producing state accounted for as much as 75% production followed by Uttaranchal (16%) and Andhra Pradesh(8%). The total consumption in the organidsed sector is around 270,000 tonnes per annum, of which 68% was in paper industry followed by pesticide (16%), paints (8%) and cosmetics (4%). The apparent domestic demand for talc-steatite is estimated at 879 thousand tonnes by 2011-12 and 1.35 million tonnes by 2016-17 at 9% growth rate.
The exports of steatite (total) is around 99,520 tonnes whereas imports were 5,218 tonnes in 2008-09.
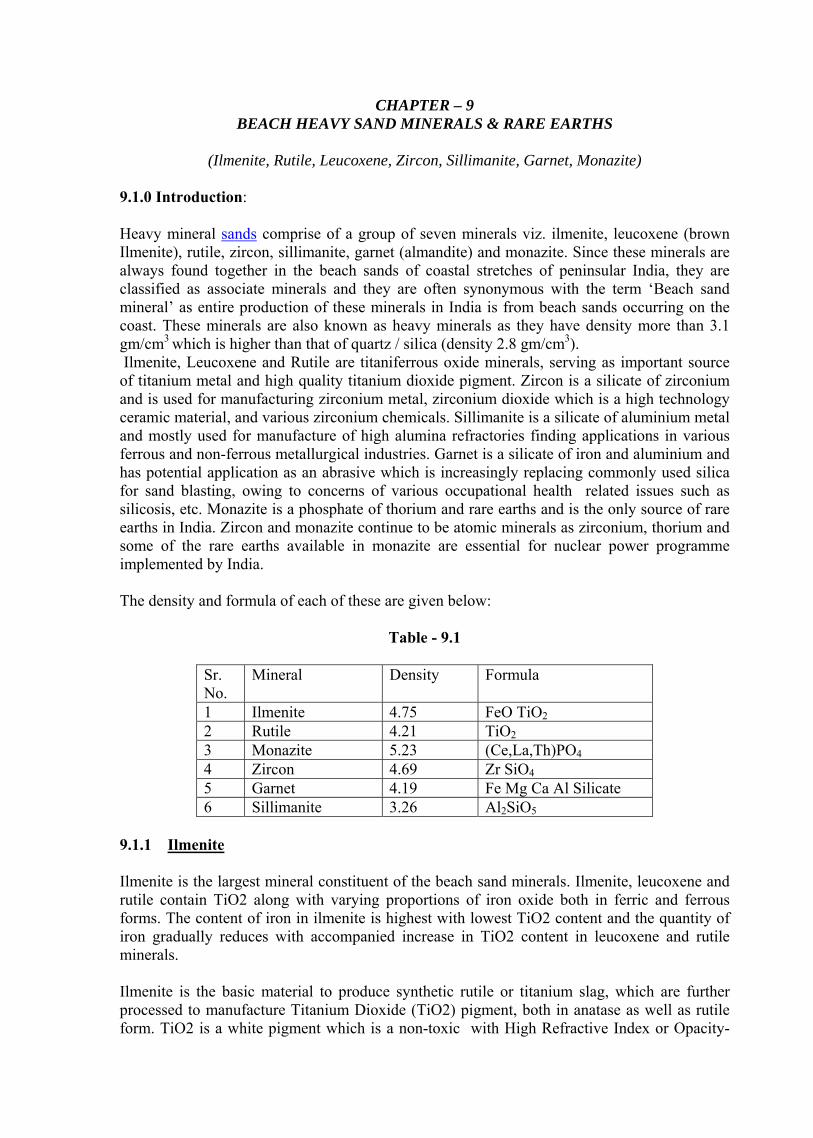
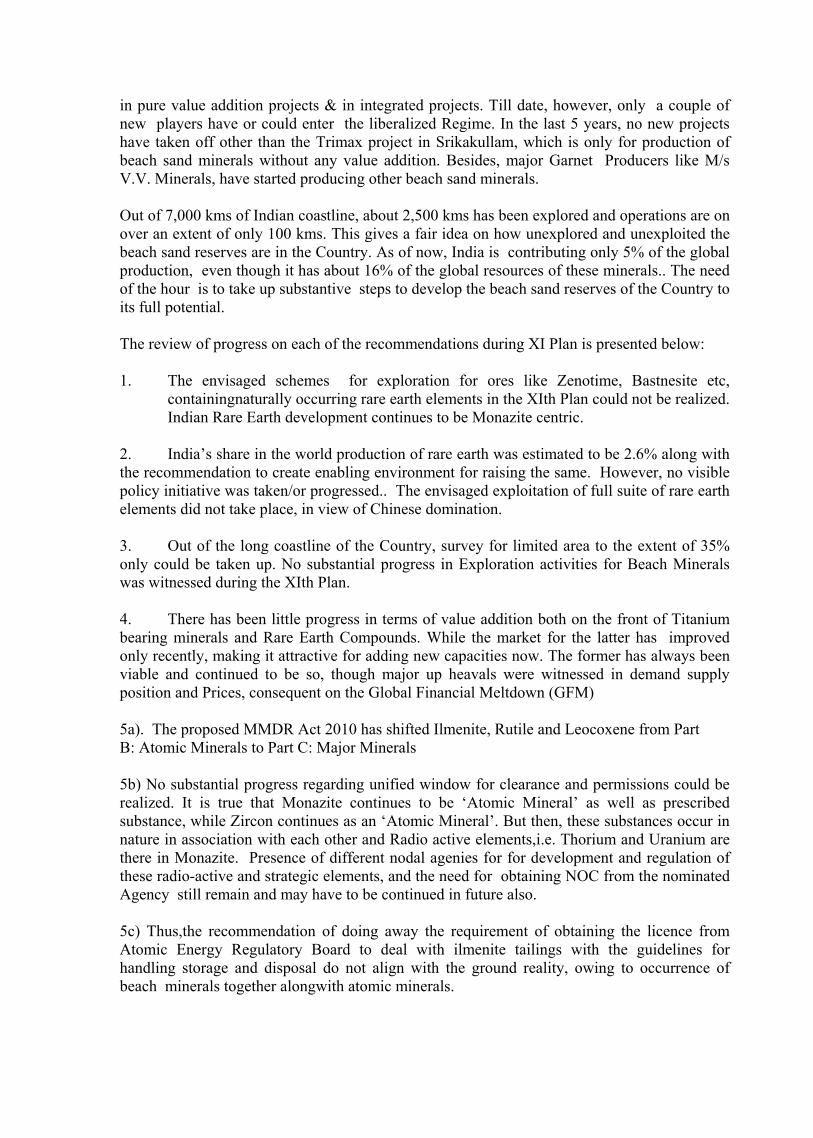
9.BEACH SAND MINERALS & RARE EARTHS Heavy mineral sands comprise of a group of seven minerals viz. ilmenite, leucoxene (brown Ilmenite), rutile, zircon, sillimanite, garnet (almandite) and monazite. Since these minerals
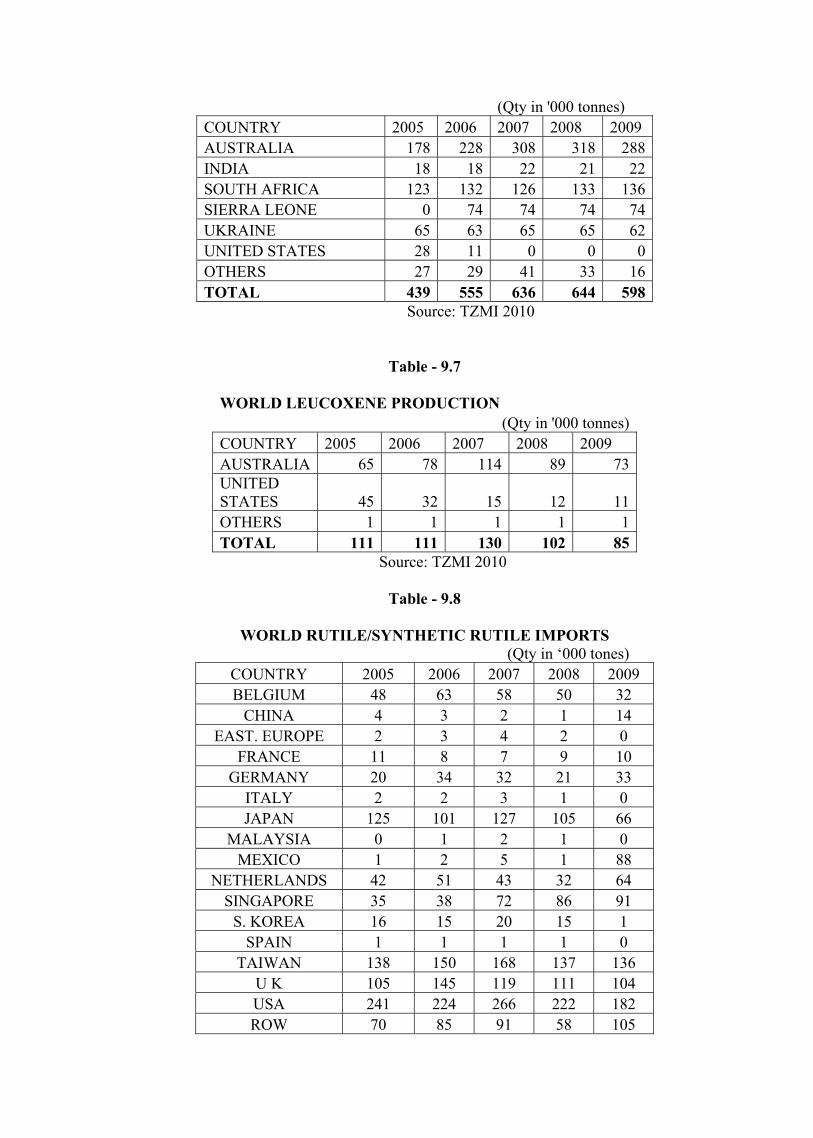
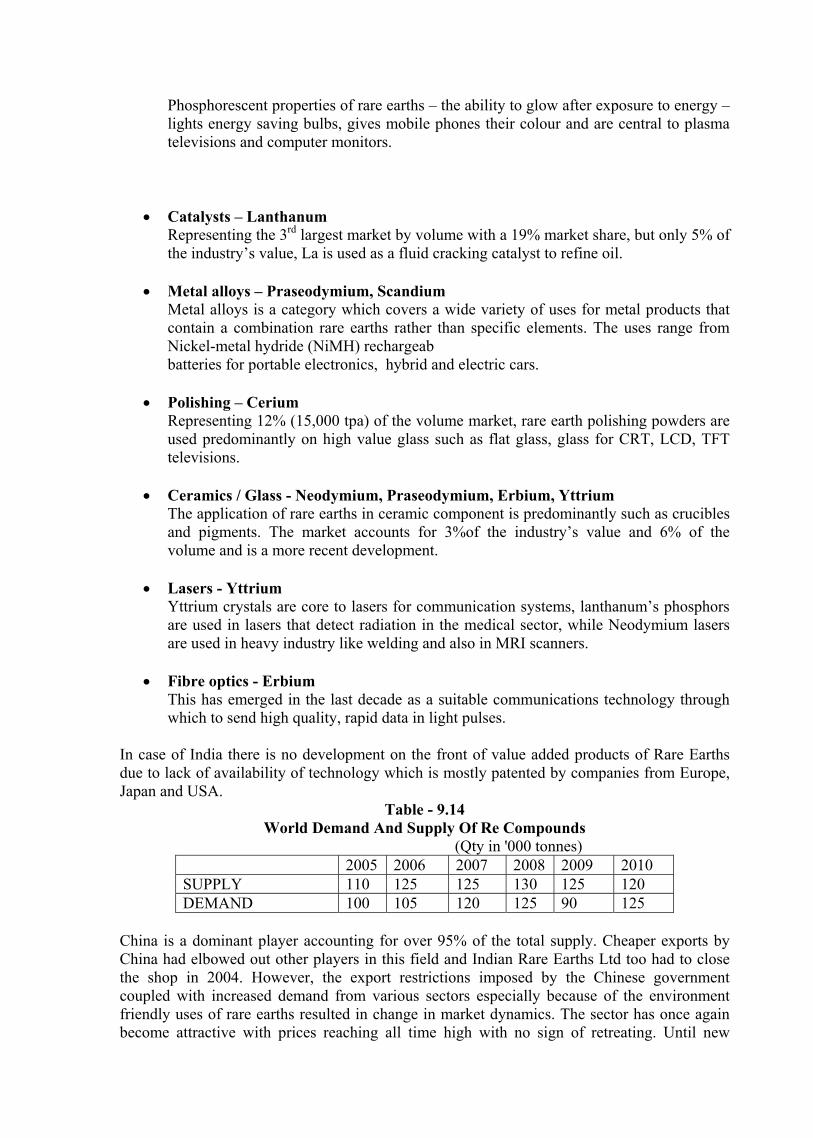
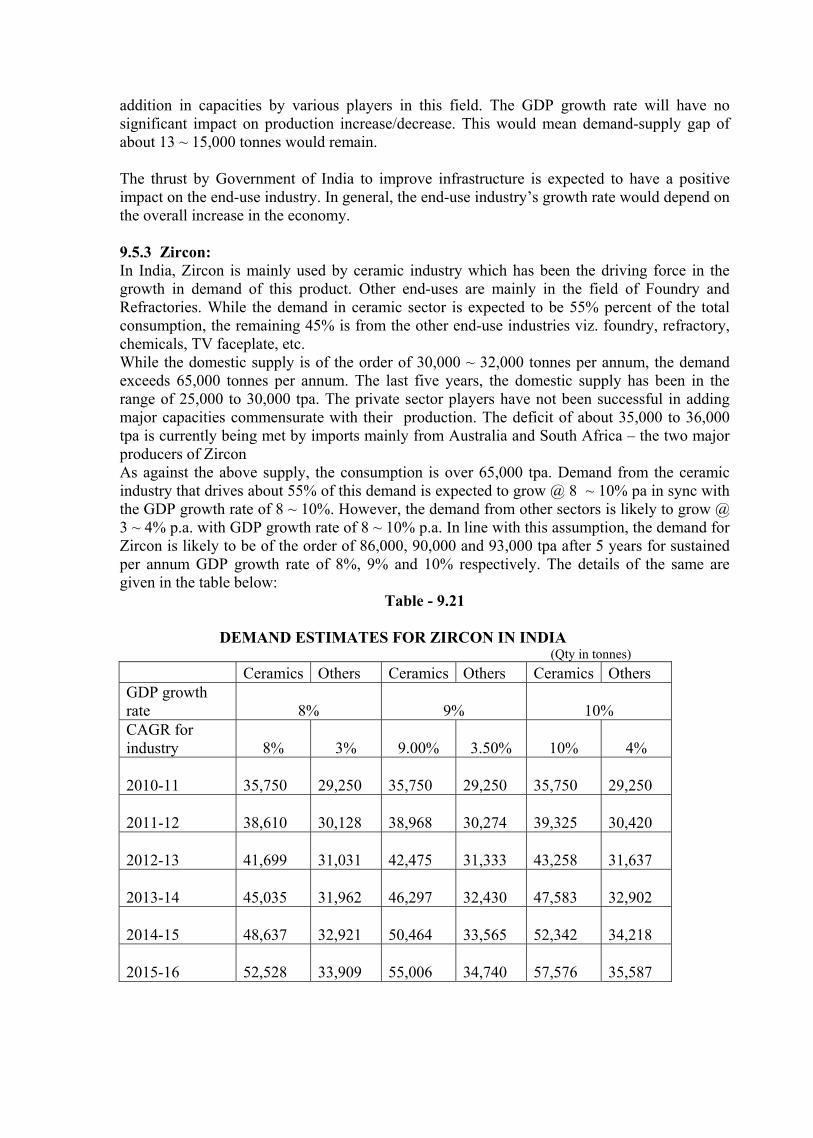
are always found together in the beach sands of coastal stretches of peninsular India, they are classified as associate minerals and they are often synonymous with the term ‘Beach sand mineral’ as entire production of these minerals in India is from beach sands occurring on the coast. World scenario: The total world reserves for beach sand minerals are as follows (in million tones): Ilmenite- 650.05, Rutile-42.5, Zircon-55.4, Sillimanite-0.54,Garnet-12.5, RE minerals-113.7. The total world beach sand production (in thousand tones) is Ilmenite- 9305, Rutile- 598, Zircon-1056, Sillimanite- 35, Garnet-1410, Leucoxene – 0.085 amounting to 12404 thousand tones in the year 2009. The major producers are USA, China, South Africa, Madagascar, Norway & Brazil. Indian Scenarion: The total reserves for beach sand minerals as per USGS are as follows (in million tones): Ilmenite- 85, Rutile-7.4, Zircon-3.4, Sillimanite-0.067,Garnet-6.5, RE minerals-3.1 The total beach sand resources are at 942.58 million tones, Andhra Pradesh, Orissa, Tamil Nadu and Kerala have a share of 35%, 24%, 21% and 19% respectively as per AMDR compilation. Future Demand and Supply ILMENITE: The major chunk of consumption of the ilmenite is for manufacture of Synthetic Rutile. The current demand is 3,50,000 TPA and the supply is around 8,00,000 TPA, excess mineral is exported. The demand of ilmenite as per the GDP growth rate of 8%,9% and 10% is 3.19,3.27 & 3.35 lakh tones.The projected production is around 8,00,000 tonnes per annum. RUTILE: The current demand is 36,000 TPA. The domestic production is 20,000 TPA. The rest of the demand is met by imports. Projected demand for the next five years is 44,000 TPA to 45,000 TPA as per the GDP growth rate of 8%,9% and 10%.The projected production is 30,000 TPA. ZIRCON The production for the last five years is 30,000 TPA. And the current demand is 65,000 TPA. The deficit supply is met by imports. Projected demand for the next five years is 86,000 TPA to 90,000 TPA as per the GDP growth rate of 8%,9% and 10%.The projected production is going to remain at the rate of 30-35,000 TPA. The rest is met by way of imports. GARNET The production for the last five years is 75,000 TPA. And the current demand is limited and the major chunk is exported. The domestic consumption is hardly a couple of thousand tonnes per annum and as such the change is GDP growth rate would make little impact on the same especially in the backdrop of very high production at present. SILLIMANITE
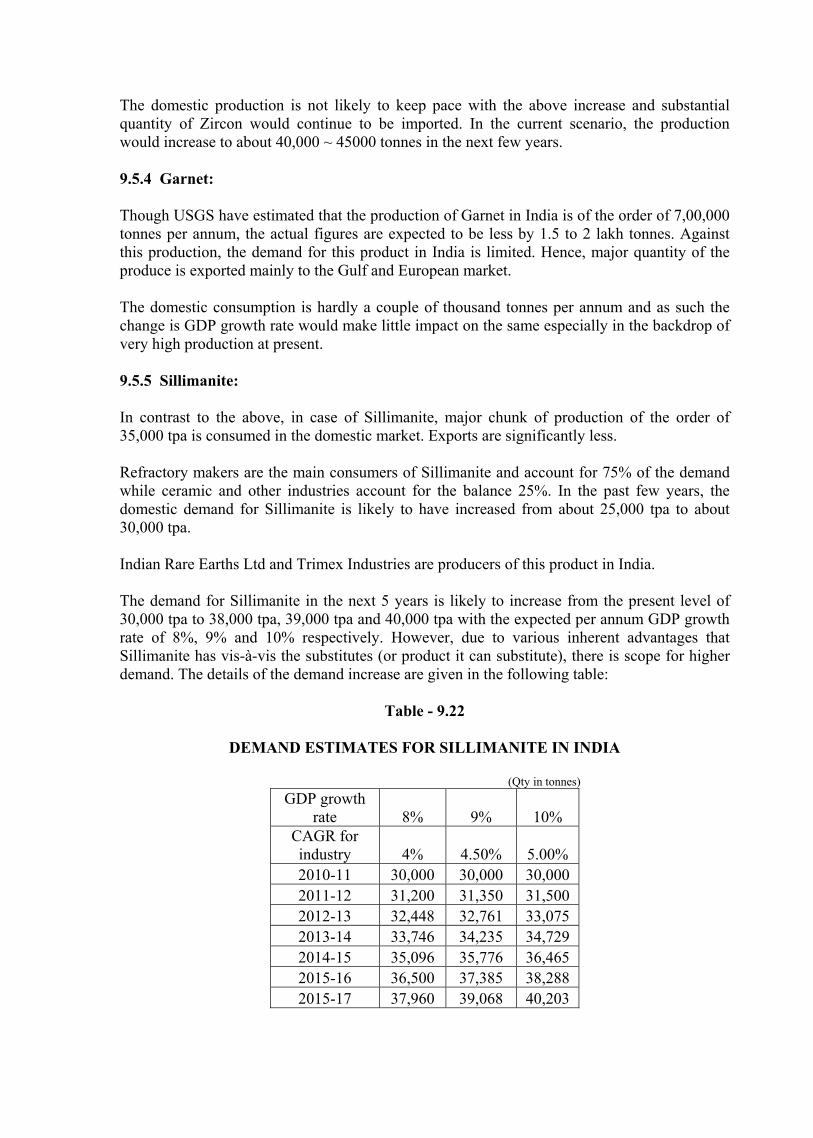
The production for the last five years is 35,000 TPA. And the current demand is 32,000 TPA. Projected demand for the next five years is 35,000 TO 40,000 TPA as per the GDP growth rate of 8%,9% and 10%.The projected production is going to be doubled in the coming couple of years and the projected demand is met adequately. Rare Earth Compounds Two PSU’s viz. IREL & KMML along with two leading private players i.e. M/s TRIMEX Sands Pvt. Ltd and M/s V.V. Minerals are engaged in beneficiation of beach sand minerals. While KMML uses their entire ilmenite production for its captive consumption to produce Synthetic Rutile. The installed capacity of the other three companies taken together is about 10 lakh tons of associated minerals. The two PSU’s and the other two private companies are planning to augment the capacity of their units. As a result the Indian supply is expected to be to reach about 18 lakh tons per annum by the end of XII Plan. It is worth mentioning that the share of Indian beach sand mineral production is limited to 5-7%, but tradable Indian share is around 15% due to limited level of value addition. Initiatives to Meet the Current and Future Demand Supply Gap Indian reserves of the major beach sand mineral i.e. is approx 16% of the world reserves whereas the production accounts to only approx 6 – 7% of the world production. It is essential to set up joint venture projects in association with state governments to enhance beach mineral production with further down stream applications where the reserves have been established and economic beneficiation can be looked into:
- Bramhagiri deposit of Orissa.
- Godavari, Krishna and Vishakapatnam districts of A.P.
These minerals are considered as strategic because of the following main reasons: 1. Substitutes are limited or lead to a loss of properties and are often subject to the same
constraints (e.g. production is concentrated in a few geographies). 2. As many of these can only be produced as a by-product of base metals extraction,
potential for accelerating production / supply on standalone basis is very limited 3. Inconsistent mining regulations, legislative regimes and environmental risks for
many of these minerals 4. Continued advances in technology development – there is a swift increase in demand
for metal intensive technology such as LCD screens, hybrid cars, wind turbine magnets, hi-tech defense applications and various other applications in modern
economy. Most of these scientific advances require key mineral inputs. These applications are critical to the end product.
5. Dependence on these technologies is increasing worldwide.
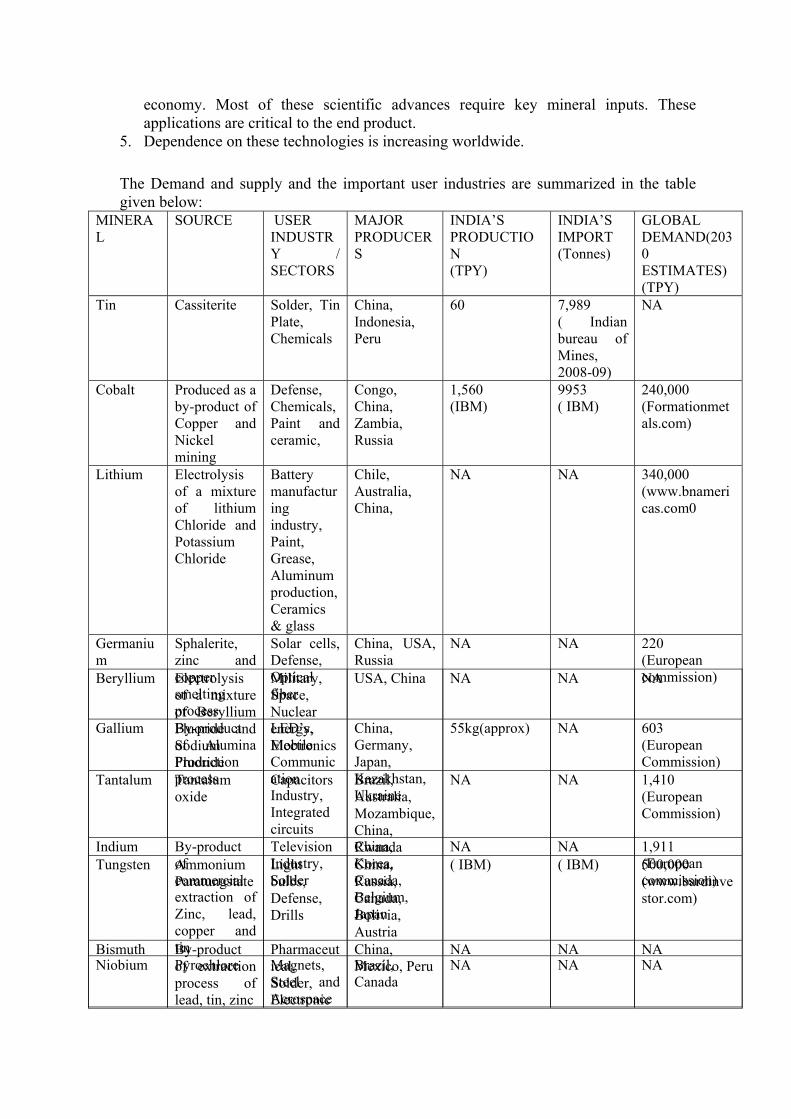
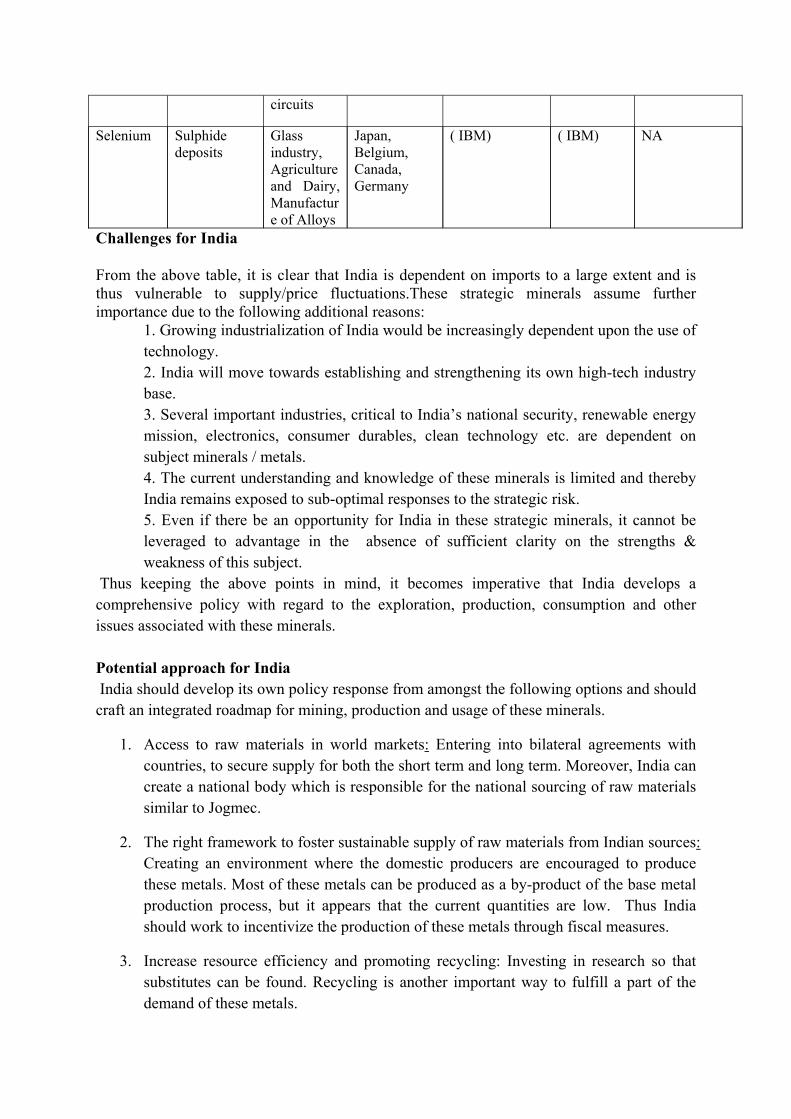
The Demand and supply and the important user industries are summarized in the table given below:
MINERAL
SOURCE USER INDUSTRY / SECTORS
MAJOR PRODUCERS
INDIA’S PRODUCTION (TPY)
INDIA’S IMPORT (Tonnes)
GLOBAL DEMAND(2030 ESTIMATES) (TPY)
Tin Cassiterite Solder, Tin Plate, Chemicals
China, Indonesia, Peru
60 7,989 ( Indian bureau of Mines, 2008-09)
NA
Cobalt Produced as a by-product of Copper and Nickel mining
Defense, Chemicals, Paint and ceramic,
Congo, China, Zambia, Russia
1,560 (IBM)
9953 ( IBM)
240,000 (Formationmetals.com)
Lithium Electrolysis of a mixture of lithium Chloride and Potassium Chloride
Bismuth By-product of extraction process of lead, tin, zinc
Pharmaceutical, Solder, Electronic
China, Mexico, Peru
NA NA NA
Challenges for India
From the above table, it is clear that India is dependent on imports to a large extent and is thus vulnerable to supply/price fluctuations.These strategic minerals assume further importance due to the following additional reasons:
1. Growing industrialization of India would be increasingly dependent upon the use of technology. 2. India will move towards establishing and strengthening its own high-tech industry base. 3. Several important industries, critical to India’s national security, renewable energy mission, electronics, consumer durables, clean technology etc. are dependent on subject minerals / metals. 4. The current understanding and knowledge of these minerals is limited and thereby India remains exposed to sub-optimal responses to the strategic risk. 5. Even if there be an opportunity for India in these strategic minerals, it cannot be leveraged to advantage in the absence of sufficient clarity on the strengths & weakness of this subject.
Thus keeping the above points in mind, it becomes imperative that India develops a comprehensive policy with regard to the exploration, production, consumption and other issues associated with these minerals. Potential approach for India India should develop its own policy response from amongst the following options and should craft an integrated roadmap for mining, production and usage of these minerals.
1. Access to raw materials in world markets: Entering into bilateral agreements with countries, to secure supply for both the short term and long term. Moreover, India can create a national body which is responsible for the national sourcing of raw materials similar to Jogmec.
2. The right framework to foster sustainable supply of raw materials from Indian sources: Creating an environment where the domestic producers are encouraged to produce these metals. Most of these metals can be produced as a by-product of the base metal production process, but it appears that the current quantities are low. Thus India should work to incentivize the production of these metals through fiscal measures.
3. Increase resource efficiency and promoting recycling: Investing in research so that substitutes can be found. Recycling is another important way to fulfill a part of the demand of these metals.
circuits
Selenium Sulphide deposits
Glass industry, Agriculture and Dairy, Manufacture of Alloys
Japan, Belgium, Canada, Germany
( IBM) ( IBM) NA
4. Build a national stockpile: Evaluating the option of building a national stock pile for identified materials. This will not only help to meet supply in case of exigencies but also keep prices under control.
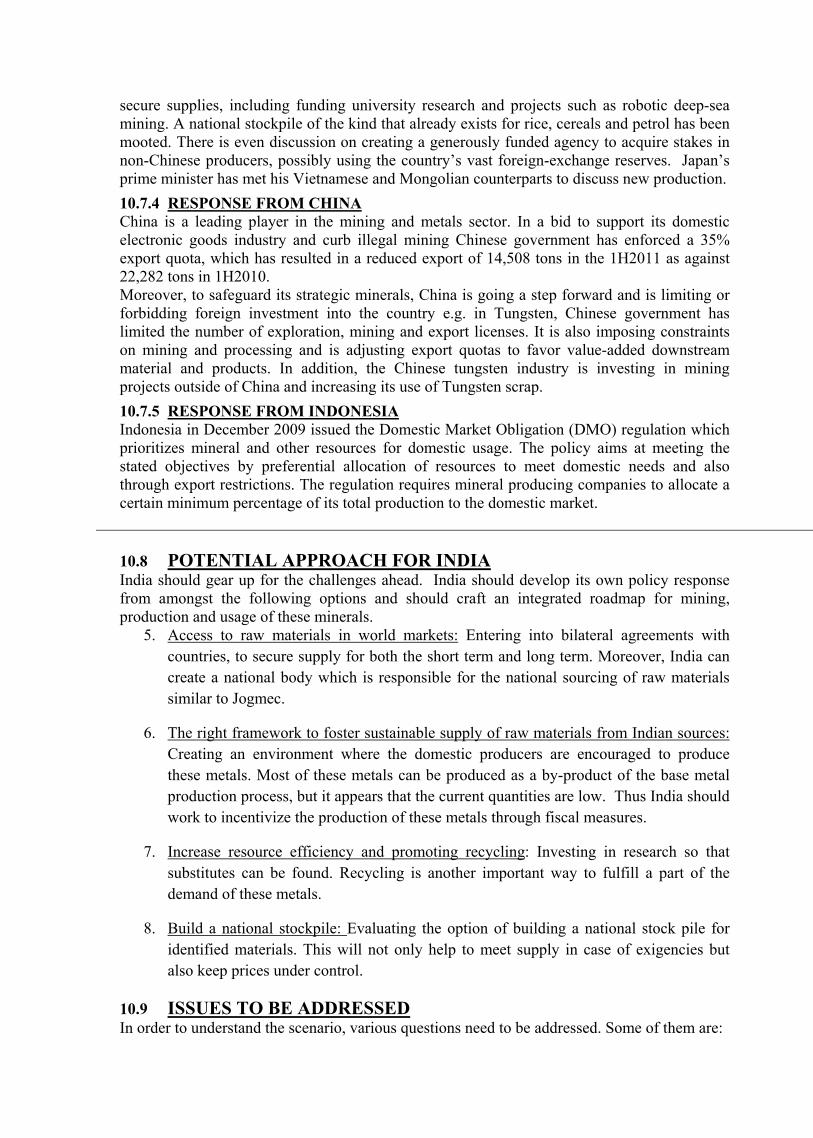
TIN: The world reserves are 5.2 million tones. China reserves stands at around 1.5 million tons which forms 29% of world reserves, the largest reserves of tin in the world for any single country. Indonesia, Brazil and Peru also have substantial quantity of tin reserves with 15%, 11% and 14% respectively.
The total world production in 2010 is 2,61,000 tonnes. The major producers are China, Indonesia, Peru and Bolivia producing about 80% of world production.
Tin reserves and resources in India as of 01.04.2005 are:
India produced 59,776kgs of tin in FY09, all of which came from Dantewada district of Chhattisgarh. The primary consumers of the metal in India are the tin plate and solder industries.
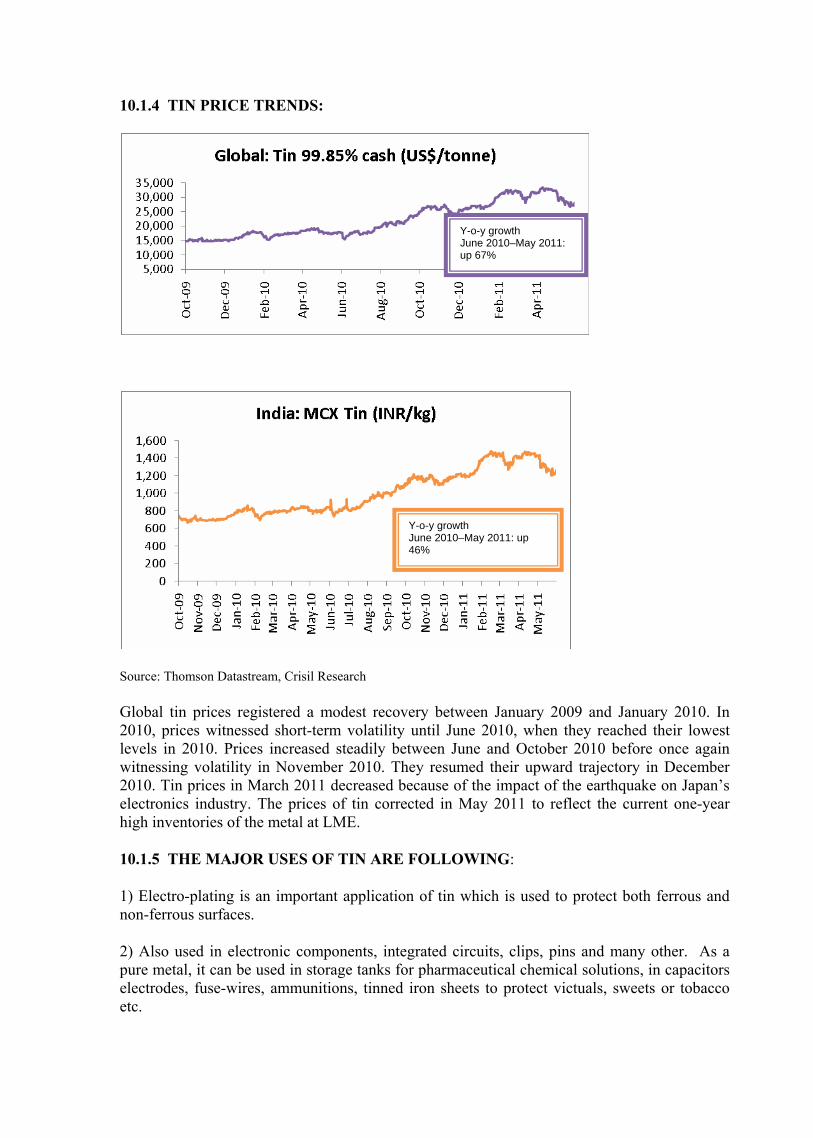
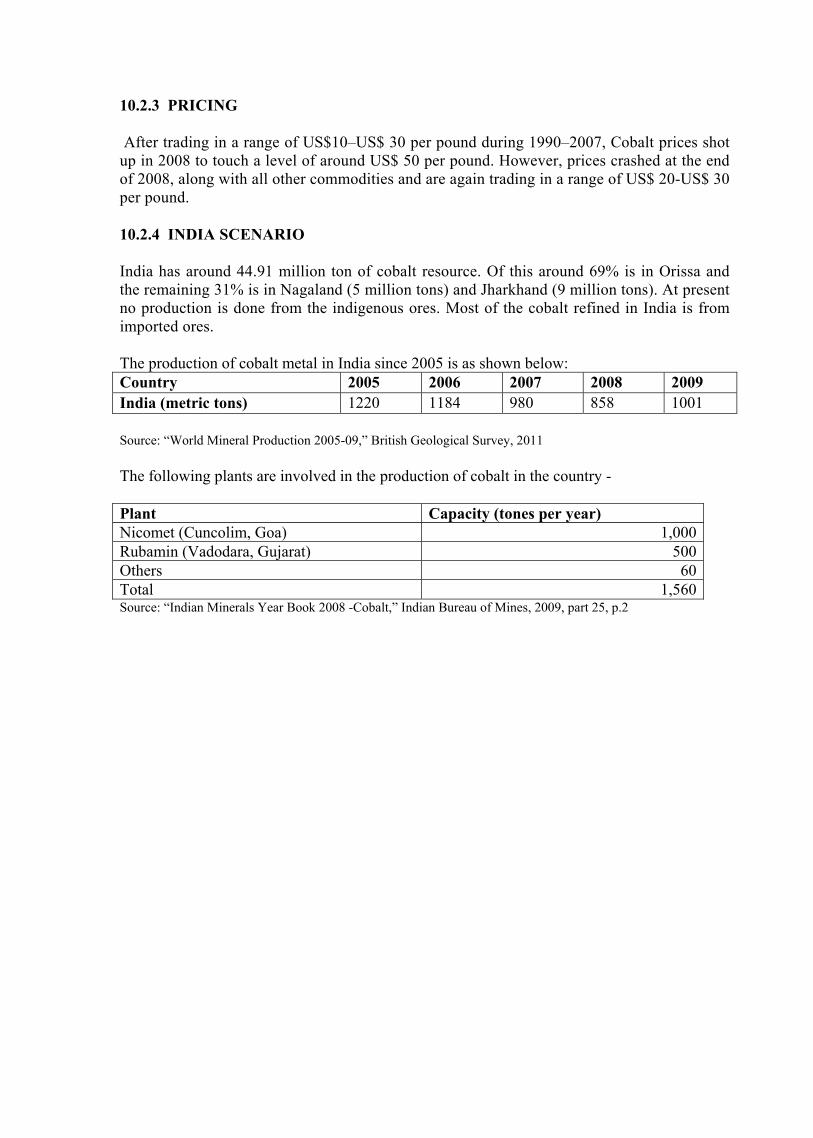
COBALT: The world reserves are 7.3 million tones. Congo reserves stands at around 3.4 million tons which forms 50% of world reserves. Australia, Brazil, Canada and China are other major countries having substantial quantity of cobalt reserves.
The total world production in 2010 is 88,000 tonnes. The major producers are Congo, Australia, Zambia.
India has around 44.91 million ton of cobalt resource. Of this around 69% is in Orissa and the remaining 31% is in Nagaland (5 million tons) and Jharkhand (9 million tons). At present no production is done from the indigenous ores. Most of the cobalt refined in India is from imported ores. India produced 1001 tonnes of cobalt during the year 2010.
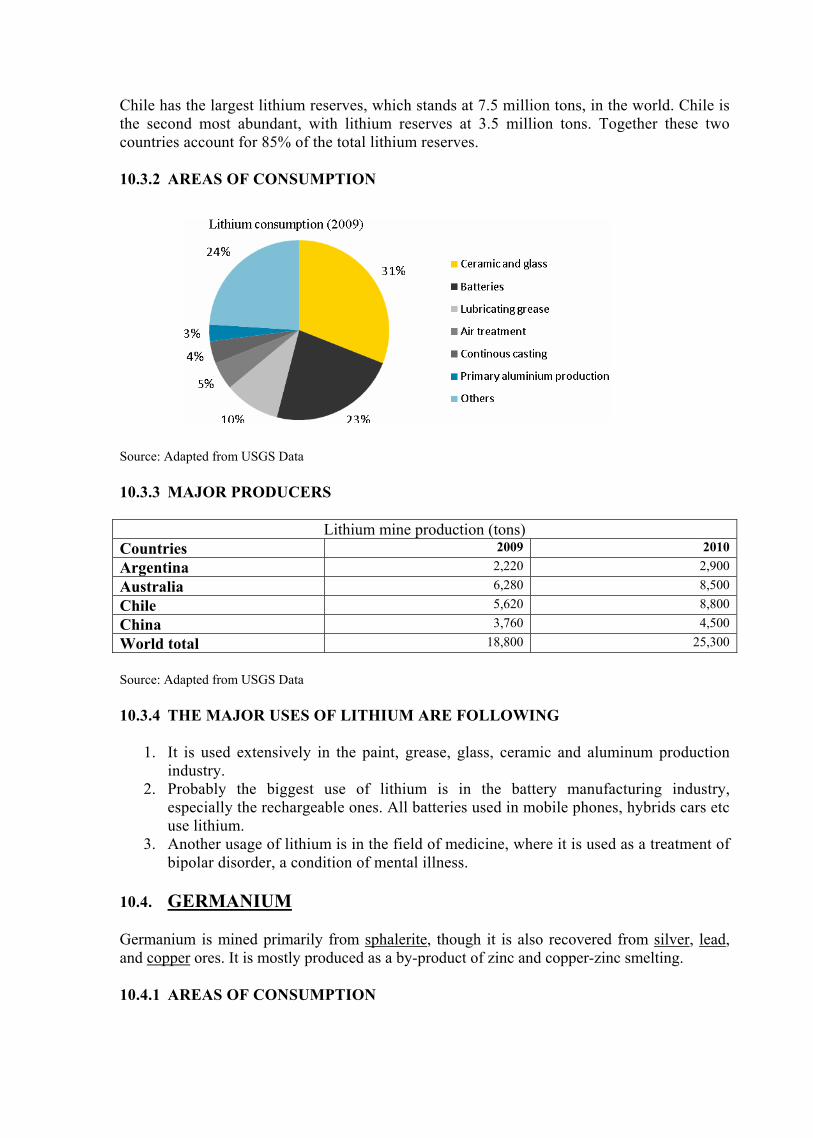
LITHIUM: The world reserves are 13 million tones. China reserves stands at around 7.5 million tons which forms more than 50% of world reserves. Chile is the second most abundant, with lithium reserves at 3.5 million tons. Together these two countries account for 85% of the total lithium reserves.
The total world production in 2010 is 25,300 tonnes. The major producers are China, Chile, Australia and Argentina.
GERMANIUM: Germanium is mined primarily from sphalerite, though it is also recovered from silver, lead, and copper ores. It is mostly produced as a by-product of zinc and copper-zinc smelting. The total world production is 1,20,000 tonnes in the year 2010.The major producers are USA, China and Russia. Around 30% of the total germanium consumed is produced from recycling scrap.
GALLIUM: Gallium is recovered from sodium aluminate liquors obtained in Bayer’s alumina process during aluminum production. Traces of gallium are also found in zinc ores. Primary gallium production in terms of metal content was around 106 tons in 2010 and 79 tons in 2009. China, Germany, Kazakhstan and Ukraine were leading producers of gallium in 2010. Refined gallium production, which includes some scrap refining, was estimated to be about 161 tons in 2010. In 2010, the world primary gallium production capacity was around 184 tons, refinery capacity was 177 tons. world gallium recycling capacity is around 141 tons in 2010.
INDIUM: It is mainly produced as a by-product of the commercial extraction of zinc, lead, copper and tin. Major producers of Indium are China, Canada, and Korea etc.The total world production in the year 2010 is 574 tons.
NIOBIUM: The primary mineral from which Niobium is obtained is pyrochlore. The world’s largest deposit is located in Araxa, Brazil and is owned by Companhia Brasileira de Metalurgia Mineracao (CBMM). Though, Niobium and Tantalum minerals often occur together but approximately 85%–90% of the niobium industry obtains its Niobium ores from sources other than those associated with the mining of tantalum containing ores. The total world production in the year 2009 is 61,700 tons. Major producers are Brazil and Canada.
BERRYLIUM:The proven reserves are there in USA which are around 15,000 tonnes.The mojor producer is USA which produced 170 tonnes during the year 2010.
India has substantial deposits of beryl ore and the processing technologies for treating the indigenous resource have been comprehensively developed and a pilot plant is being operated by the Department of Atomic Energy.
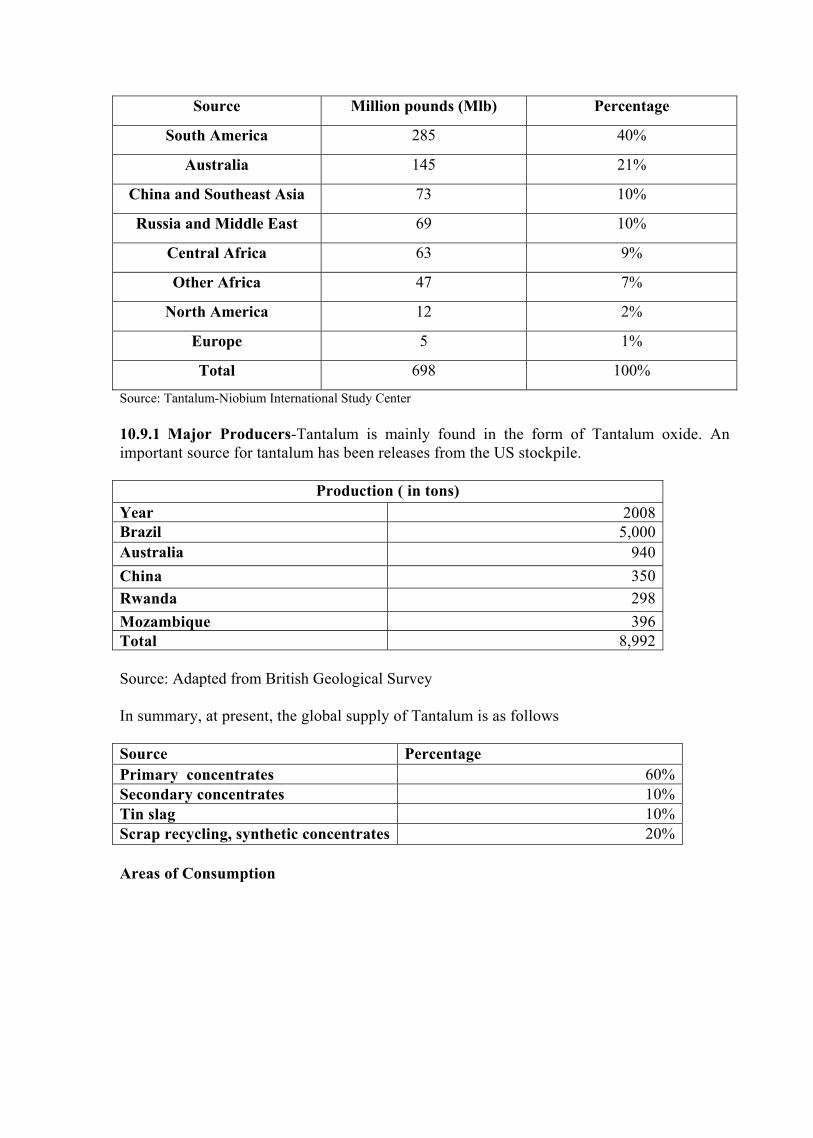
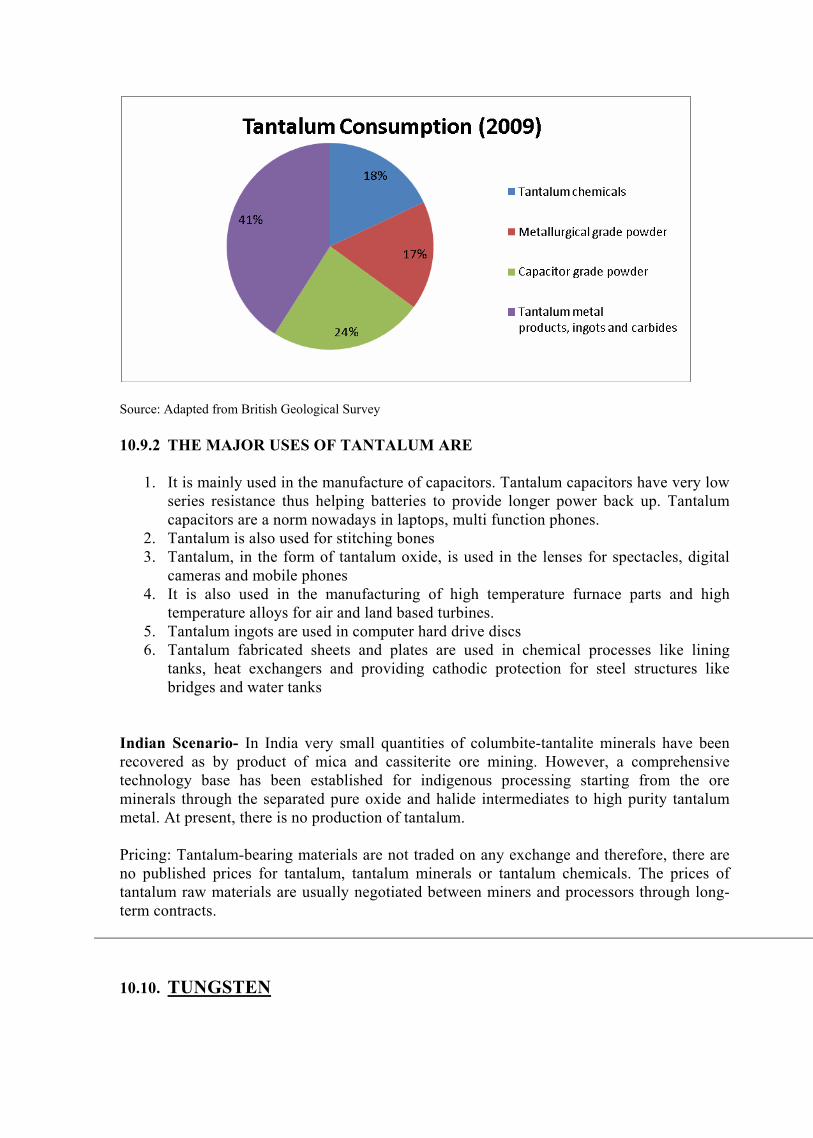
TANTALUM: The main resource base is from South America, Austrlia, China and Russia which account for 40%, 21%,10%,10% of the total resource base which is 698 Million pounds. The major producers are, Brazil, Australia, China.The total production during the year 2008 is 8,992 tons.
TUNGSTEN: The world reserves are 2.9 million tons. China reserves stands at around 60% of the total world reserves. Canada and Russia follow with 13% and 9% share. The total world production in 2010 is 25,300 tonnes. The major producers are China, Russia and Canada. The total world production in 2009 is 58,000 tonnes.
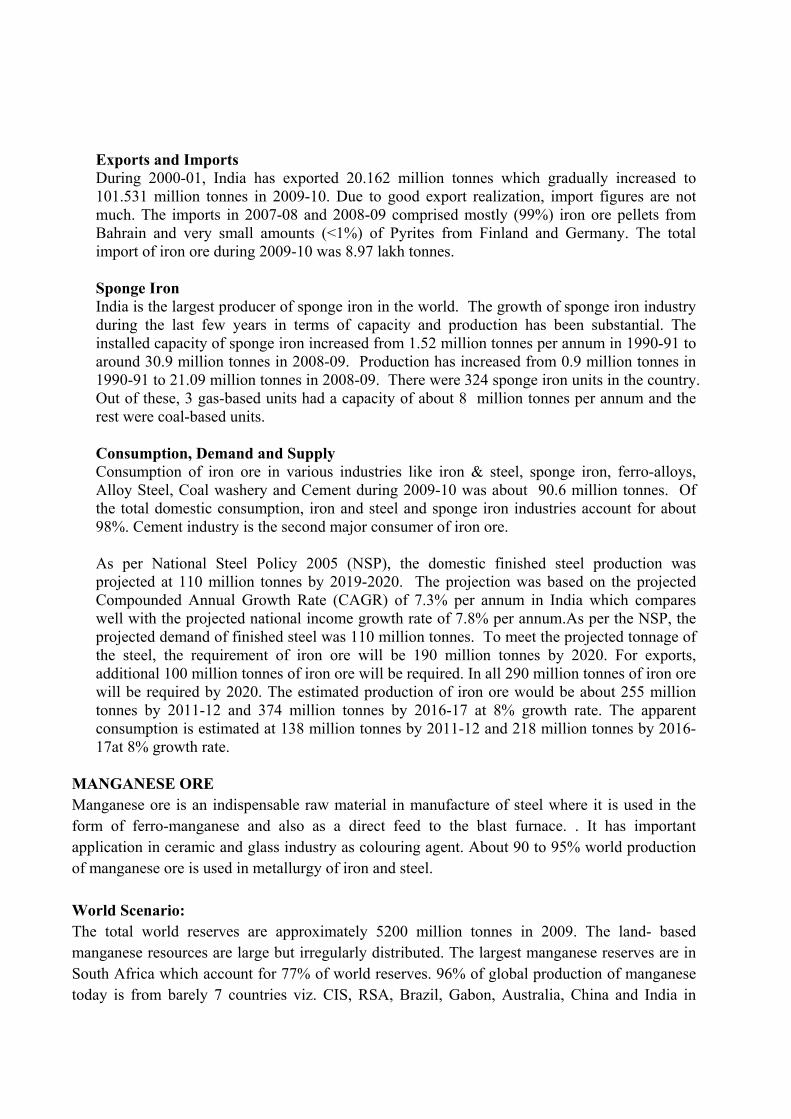
Tungsten reserves and resources in India as of 01.04.2005 are:
Reserves Resources Total
Ore 0 87,387,464 87,387,464
Metal 0 142,094 142,094
BISMUTH: The world reserves are 320,000 tons. China reserves stands at 240,000 tons. Canada and Russia follow with 13% and 9% share. The total world production in 2010 is 7,600 tons. The major producers are China and Mexico.
SELENIUM: The world reserves are 88,000 tons. Chile reserves stands at 20,000 tons. The total world production in 2010 is 2,260 tons. The major producers are Japan and Germany. In India Selenium is produced by Hindalco. It reported an annual production of about 36.810 tons in 2008-09. Selenium was also produced by Hindustan Copper Ltd (HCL) at its Ghatsila copper smelter but no production has been reported in the recent years. India imported around 164 tons of Selenium in 2008-09.
11. Ferrous Minerals
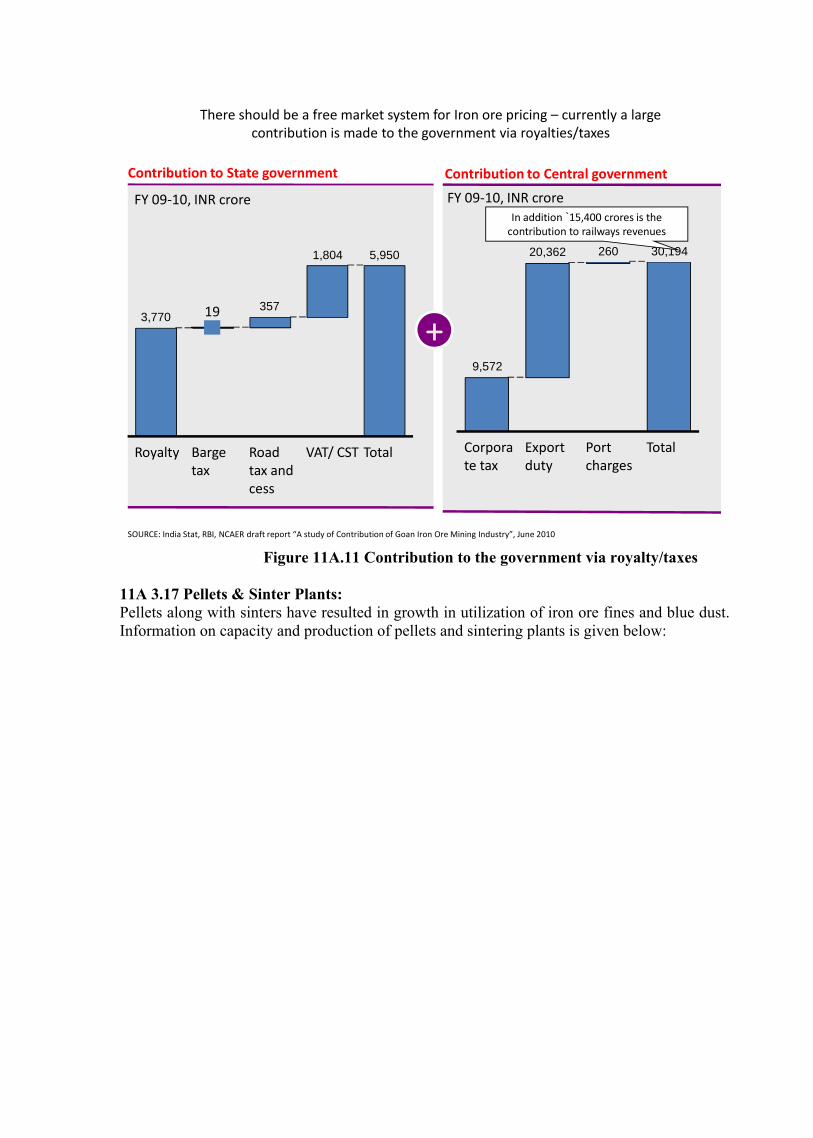
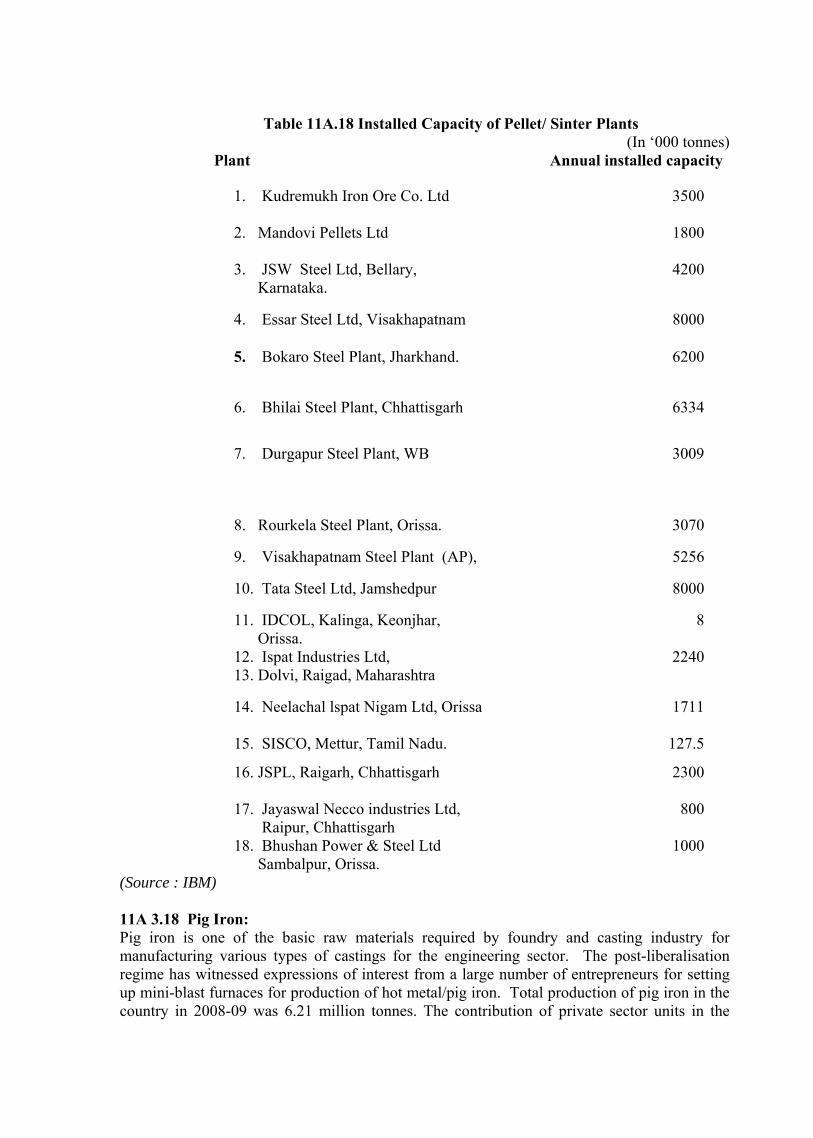
Iron ore is the basic raw material mainly used in the making of pig iron, sponge iron, steel and alloy steel. Iron & steel industry is the major consumer of iron ore in the country. This industry uses iron ore in lumps as well as fines after pelletization, sintering or briquetting. Sponge iron is another major consumer of iron ore. Sponge iron is used as a substitute in place of scrap in electric arc furnaces and in mini-steel plants.
World Scenario
Iron ore deposits are distributed in different parts of the world. The world reserve base of crude iron ore is estimated to be around 160 billion tonnes and the reserves in iron content are estimated to be around 77 billion tones.
Among the leading producers of Iron ore in the world, China, Brazil, Australia, India & Russia are important from their level of production. Sweden is equally important for underground mining and its level of automation. In case of above major 5 countries, about 90% of iron ore comes from open cast mining method whereas in the case of Sweden, the entire production is from the underground mining.
In 2009, the world production of Iron Ore was 2,248 million tonnes as against 2214 million tonnes in the previous year. It is evident that, during the last 5 years, the production of Iron ore increased from 1567 million tonnes to 2248 million tones.
Indian Scenario
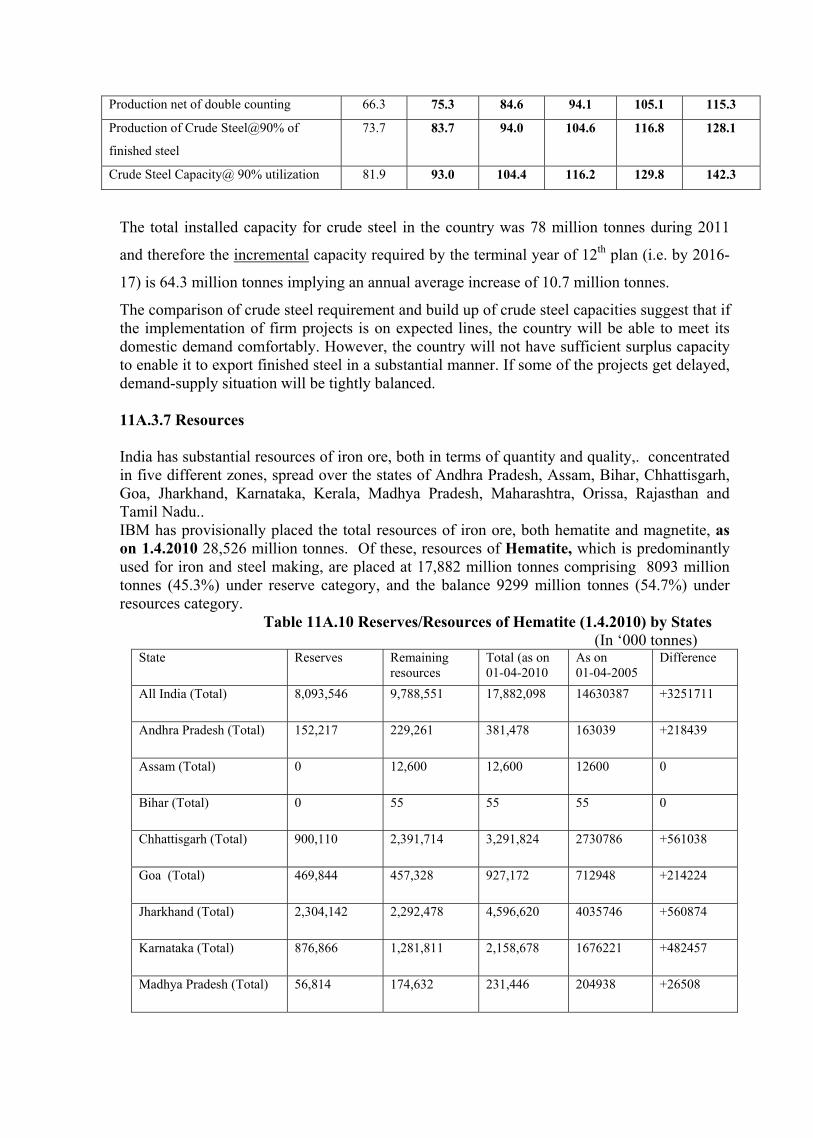
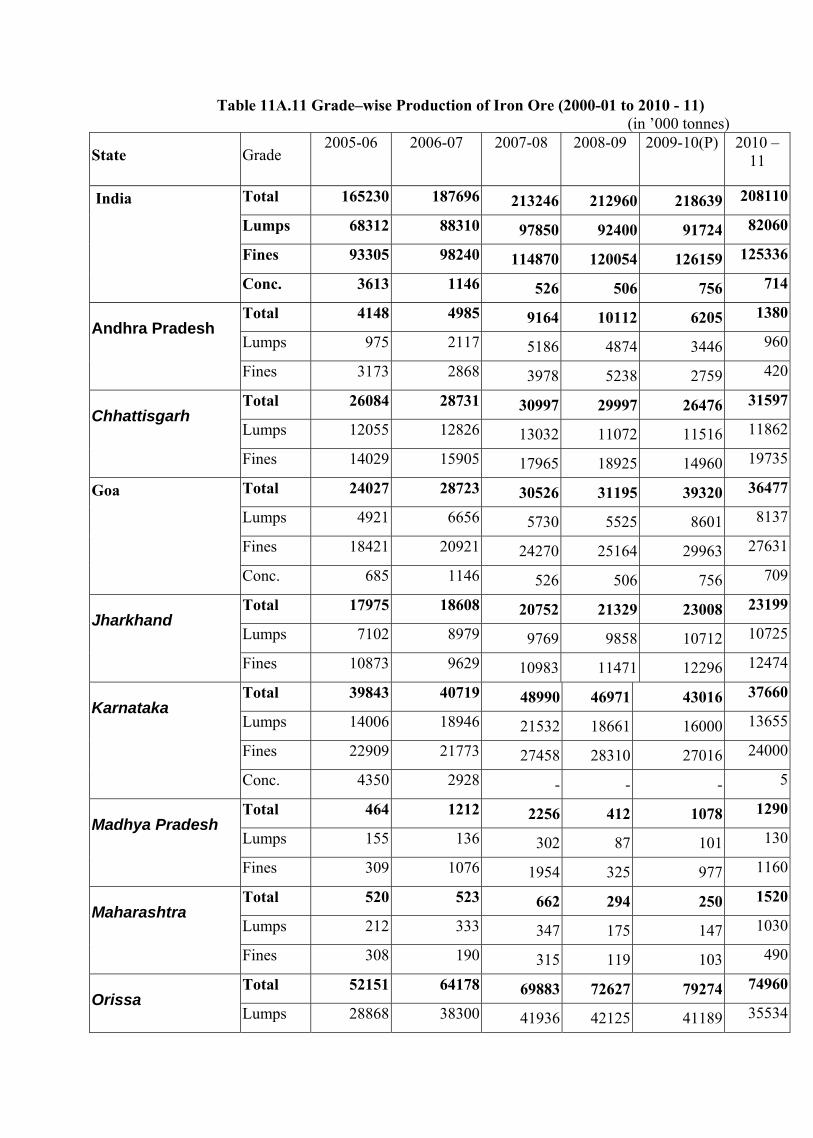
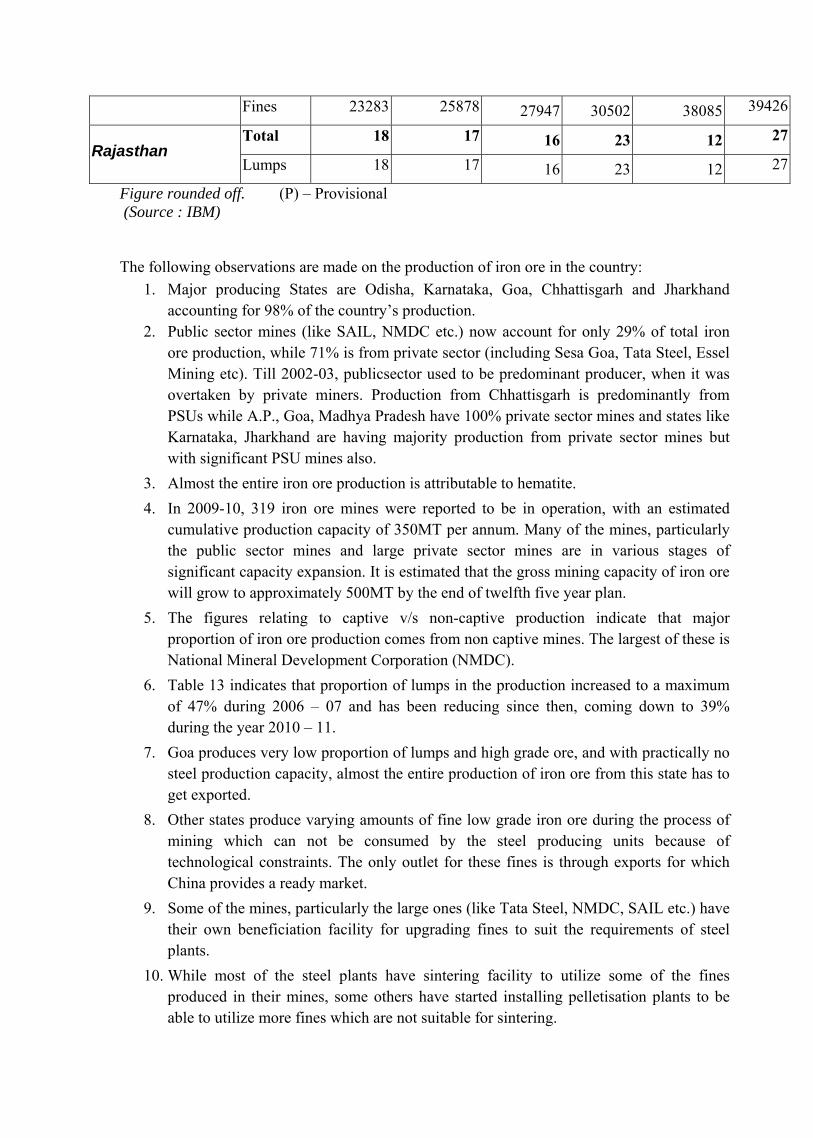
The total resources of iron ore, both Hematite and Magnetite, as on 1.4.2010 are estimated at 28526 Million tonnes (Provisional fig. provided by IBM). Of these, resources of Hematite, which is considered to be superior because of its high grade, are placed at 17882 (P) million tonnes with 8093 million tonnes (45.3%) under reserve category and the balance 9299 million tonnes (54.7%) under resources category. India is the leading producer of iron ore in the world. Indian production of iron ore constitutes around 10% of the world iron ore output. The production of iron ore constituting lumps, fines and concentrates was estimated at 218.64 million tonnes in the year 2009-10. During 2009-10, among the states, Orissa recorded the highest production of 79 million tonnes (36%), followed by Karnataka 43 million tonnes (20%), Goa 39 million tonnes (18%), Chhattisgarh 26 million tonnes (12%) , Jharkhand 23 million tonnes (11%). The remaining 3% production was reported from Andhra Pradesh, Madhya Pradesh, Maharashtra and Rajasthan.Grade wise analysis reveals that, out of total output of 218 million tonnes, iron ore lumps accounted for 91.7 million tonnes (41.9%), fines 126.2 million tonnes (57.7%) and concentrates 0.76 million tonnes(0.3%), respectively.
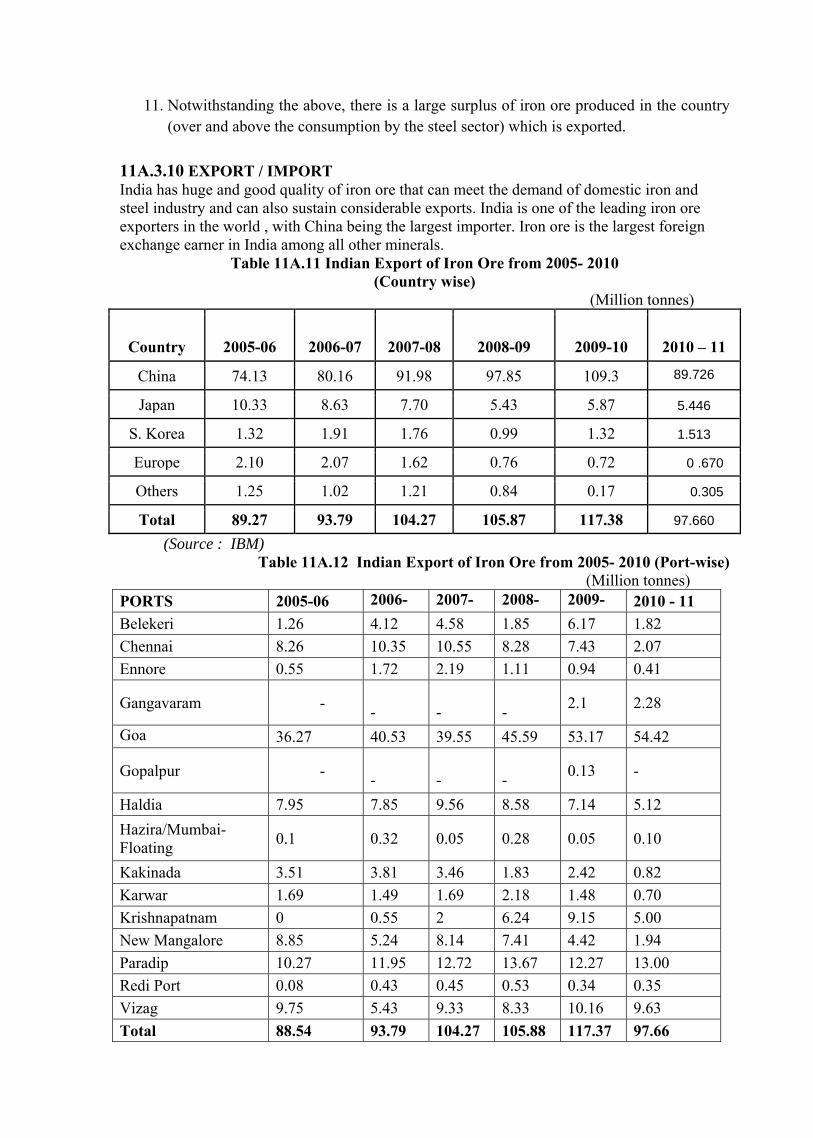
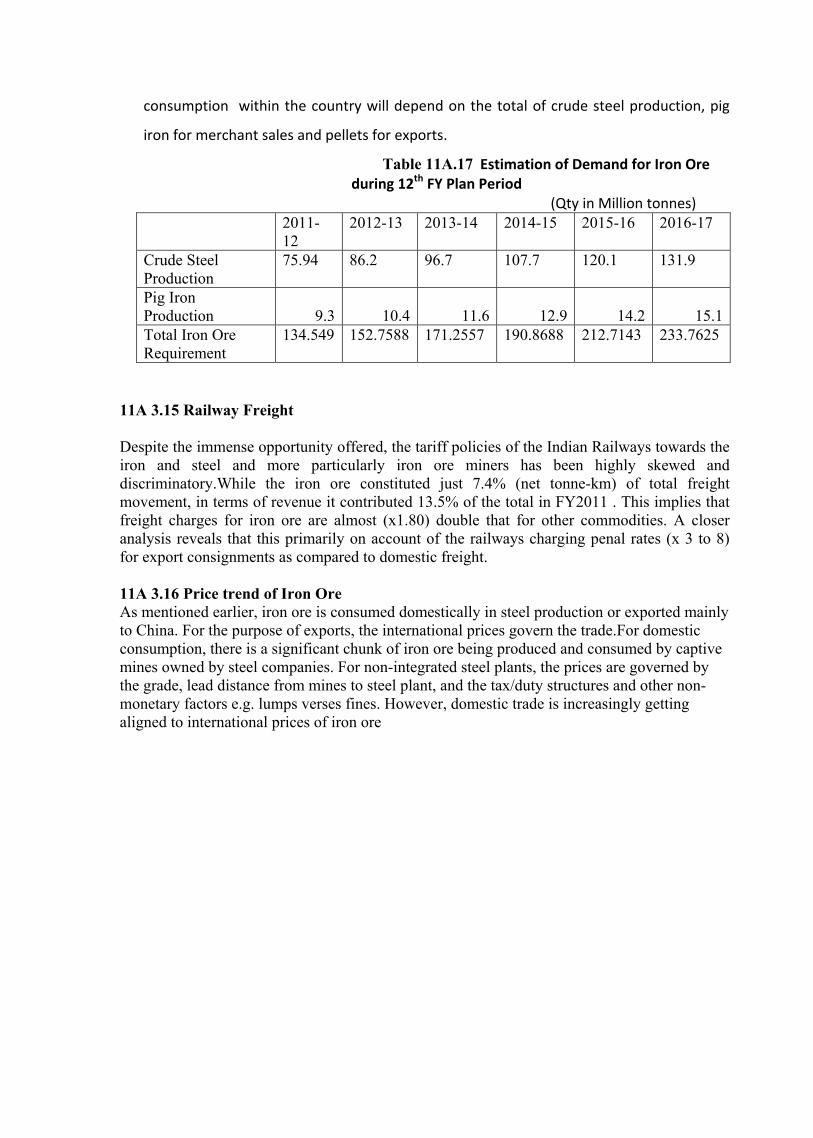
Exports and Imports During 2000-01, India has exported 20.162 million tonnes which gradually increased to 101.531 million tonnes in 2009-10. Due to good export realization, import figures are not much. The imports in 2007-08 and 2008-09 comprised mostly (99%) iron ore pellets from Bahrain and very small amounts (<1%) of Pyrites from Finland and Germany. The total import of iron ore during 2009-10 was 8.97 lakh tonnes. Sponge Iron India is the largest producer of sponge iron in the world. The growth of sponge iron industry during the last few years in terms of capacity and production has been substantial. The installed capacity of sponge iron increased from 1.52 million tonnes per annum in 1990-91 to around 30.9 million tonnes in 2008-09. Production has increased from 0.9 million tonnes in 1990-91 to 21.09 million tonnes in 2008-09. There were 324 sponge iron units in the country. Out of these, 3 gas-based units had a capacity of about 8 million tonnes per annum and the rest were coal-based units. Consumption, Demand and Supply Consumption of iron ore in various industries like iron & steel, sponge iron, ferro-alloys, Alloy Steel, Coal washery and Cement during 2009-10 was about 90.6 million tonnes. Of the total domestic consumption, iron and steel and sponge iron industries account for about 98%. Cement industry is the second major consumer of iron ore. As per National Steel Policy 2005 (NSP), the domestic finished steel production was projected at 110 million tonnes by 2019-2020. The projection was based on the projected Compounded Annual Growth Rate (CAGR) of 7.3% per annum in India which compares well with the projected national income growth rate of 7.8% per annum.As per the NSP, the projected demand of finished steel was 110 million tonnes. To meet the projected tonnage of the steel, the requirement of iron ore will be 190 million tonnes by 2020. For exports, additional 100 million tonnes of iron ore will be required. In all 290 million tonnes of iron ore will be required by 2020. The estimated production of iron ore would be about 255 million tonnes by 2011-12 and 374 million tonnes by 2016-17 at 8% growth rate. The apparent consumption is estimated at 138 million tonnes by 2011-12 and 218 million tonnes by 2016-17at 8% growth rate.
MANGANESE ORE Manganese ore is an indispensable raw material in manufacture of steel where it is used in the form of ferro-manganese and also as a direct feed to the blast furnace. . It has important application in ceramic and glass industry as colouring agent. About 90 to 95% world production of manganese ore is used in metallurgy of iron and steel. World Scenario: The total world reserves are approximately 5200 million tonnes in 2009. The land- based manganese resources are large but irregularly distributed. The largest manganese reserves are in South Africa which account for 77% of world reserves. 96% of global production of manganese today is from barely 7 countries viz. CIS, RSA, Brazil, Gabon, Australia, China and India in
decreasing order of tonnages raised annually. The global resource base is close to 12 billion tonnes. World production of manganese ore was 33.4 million tonnes in 2009, a 12.56% decrease as compared with that of 2008. China is the leading producer at 12 million tonnes, accounting for about 36% of the total world production. India’s production was about 2.44 million tonnes in 2009-10.
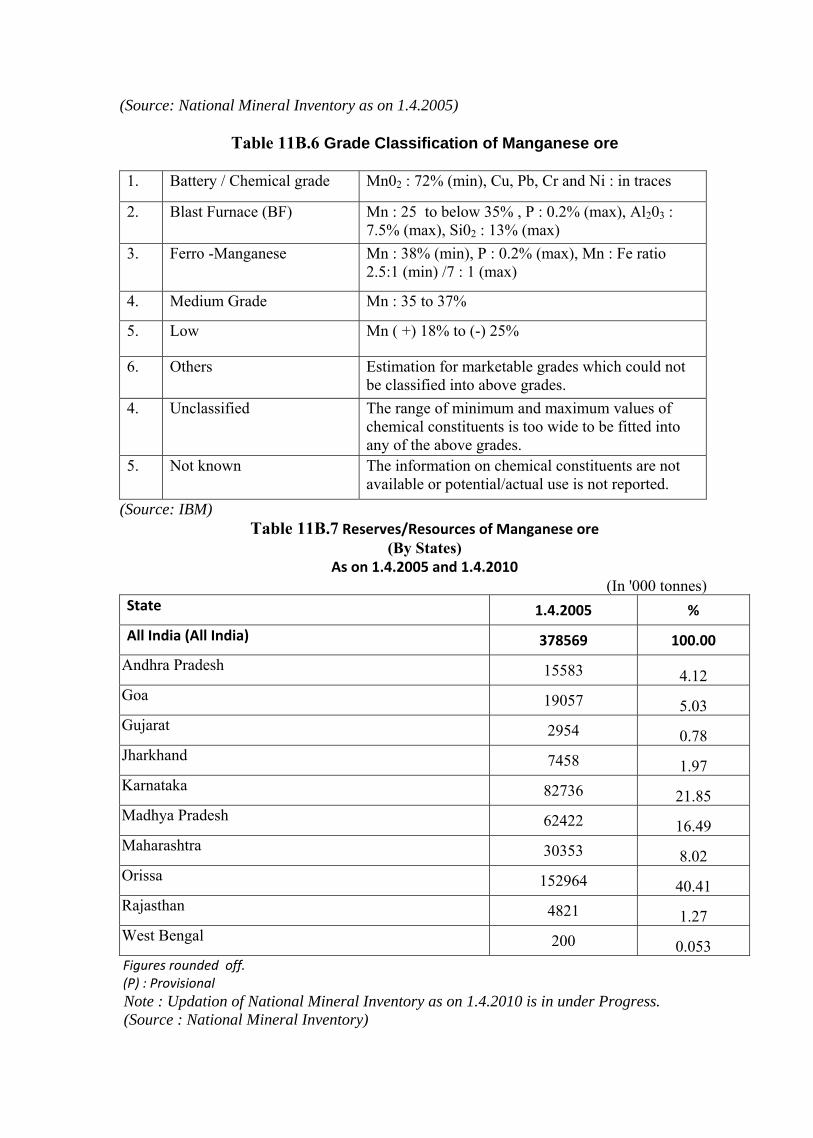
Indian Scenario The total resources of manganese ore in the country as per UNFC system as on 1.4.2005 are placed at 378.57 million tonnes. Out of these, 138.15 million tonnes are categorized as reserves and the balance 240.42 million tonnes are in the remaining resources category. Gradewise, ferro-manganese grade accounts for only 7%, medium grade 8%, BF grade 34% and the remaining 51% are of mixed, low, others, unclassified, and not known grades including 0.5 million tonnes of battery/chemical grade.
The production of Manganese ore in 2009-10 was 2.44 million tonnes as against 3.62 million tonnes in the previous year. Madhya Pradesh and Orissa were the leading producing states account for about 25% each of the total production in 2009-10. Next in the order of production were Maharashtra (24%), Karnataka (13%) and Andhra Pradesh 10%. The remaining 3% of total production was reported from Goa, Gujarat, Jharkhand, and Rajasthan..
Exports and Imports During 2008-09, India Exported 2.05 lakh tonnes of Manganese ore. This quantity increased to 2.89 lakh tonnes during 2009-10(P). Exports were mainly to China, Bhutan & Japan. During the last five years i.e., 2005-06 to 2009-2010 the import of manganese ore increased from 3000 tonnes to 7.98 lakh tonnes. South Africa (42%), Australia (41%), Gabon (5%) and Ivory Coast (3%) were the main suppliers of manganese ore.
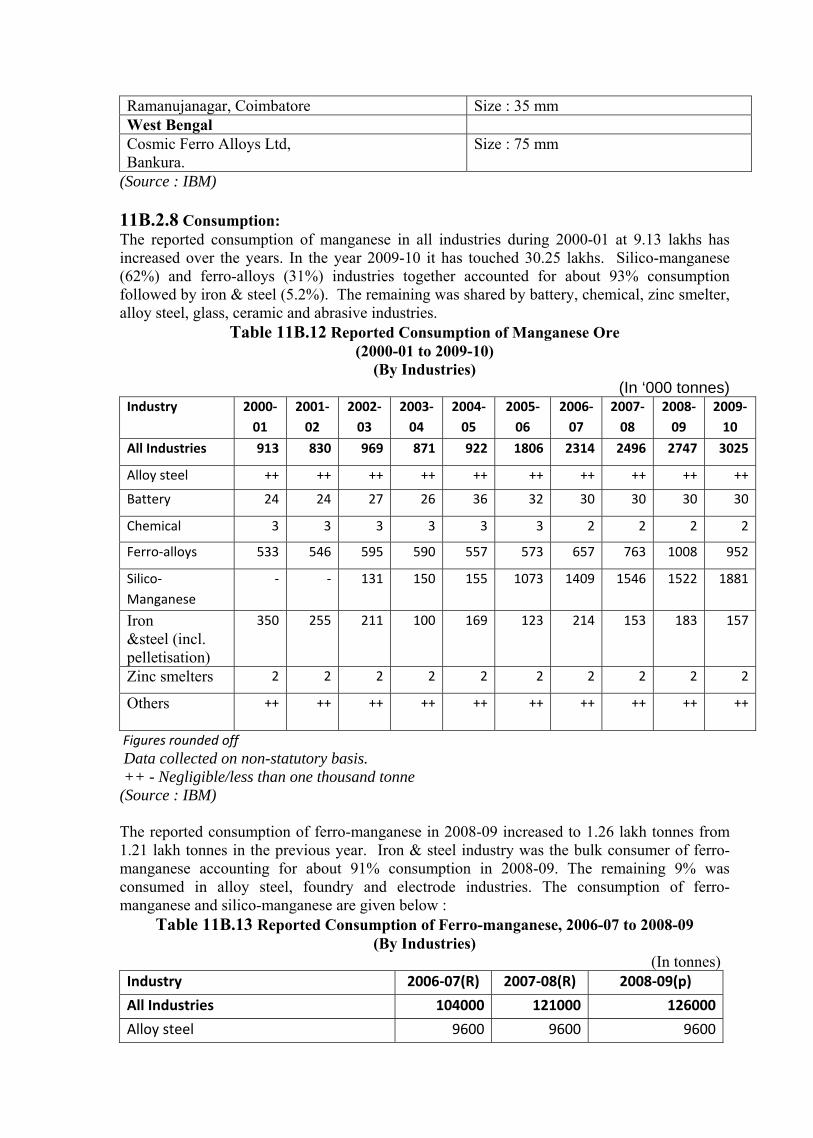
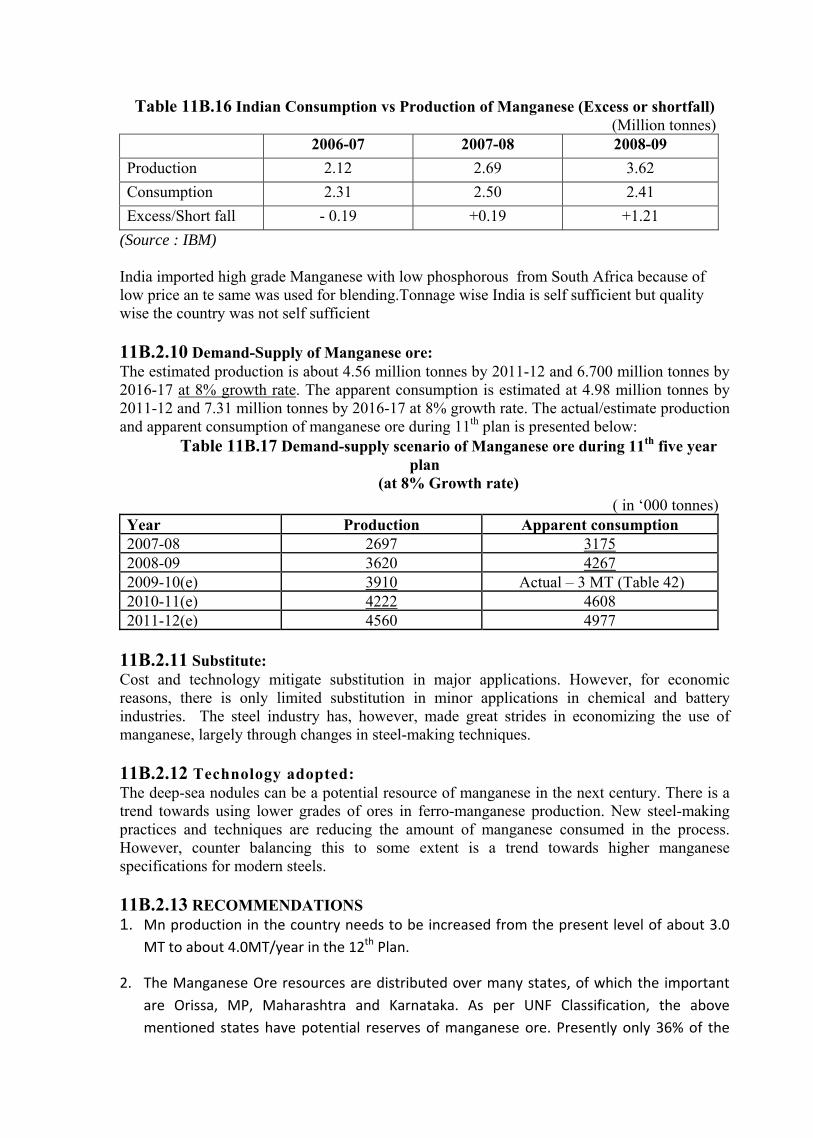
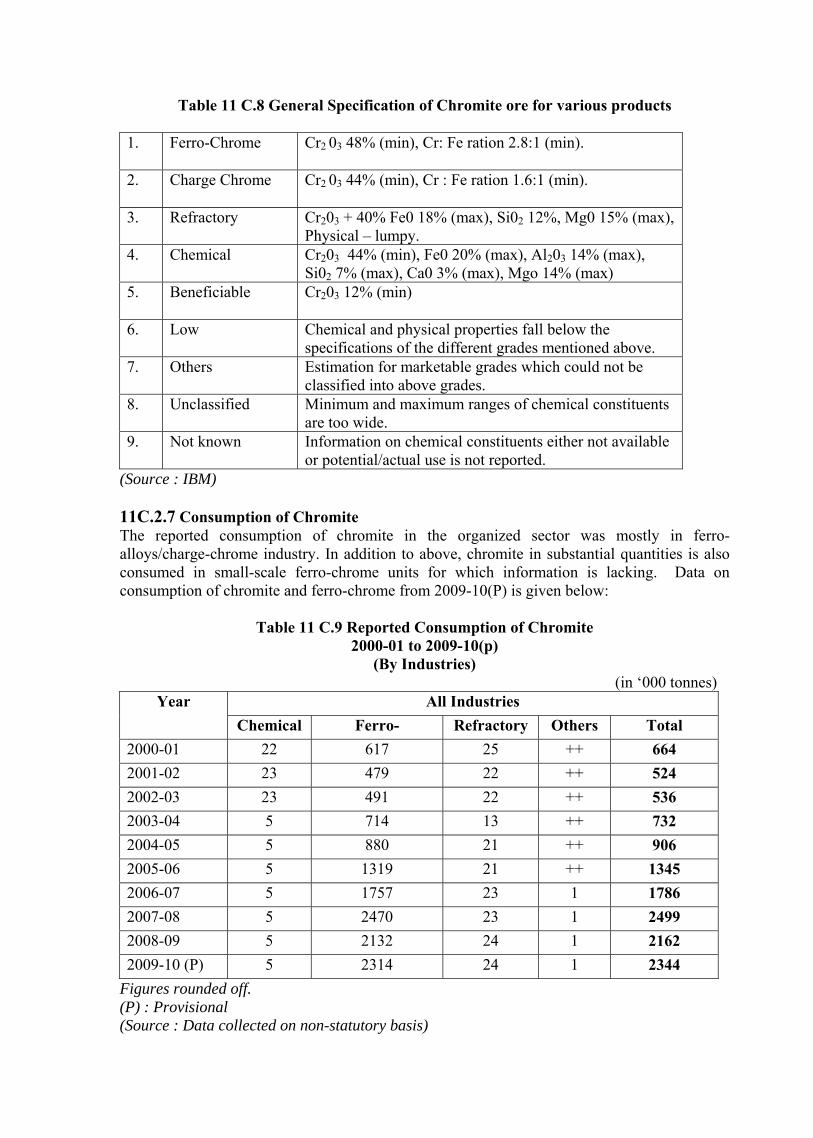
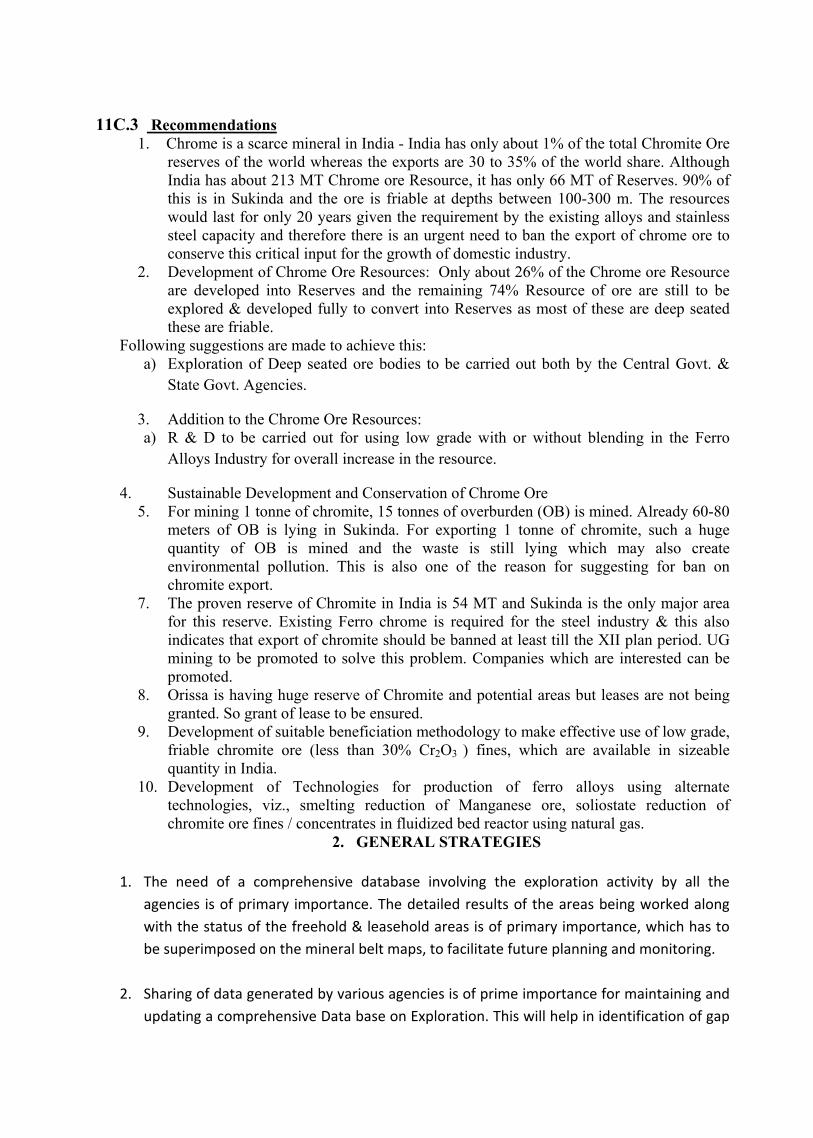
Consumption, Demand and Supply The reported consumption of manganese in all industries during 2000-01 at 9.13 lakhs has increased over the years. In the year 2009-10 it has touched 30.25 lakhs. Silico-manganese (62%) and ferro-alloys (31%) industries together accounted for about 93% consumption followed by iron & steel (5.2%). The estimated production is about 4.56 million tonnes by 2011-12 and 6.700 million tonnes by 2016-17 at 8% growth rate. The apparent consumption is estimated at 4.98 million tonnes by 2011-12 and 7.31 million tonnes by 2016-17 at 8% growth rate. CHROMITE Chromite is an important commercial chromium bearing mineral. It has got its critical importance in the steel industry because it imparts unique qualities to the products to which it is added like production of stainless steel, high temperature alloys, ferro-chrome, charge-chrome, refractories etc. and have numerous industrial and defense applications. World Scenario
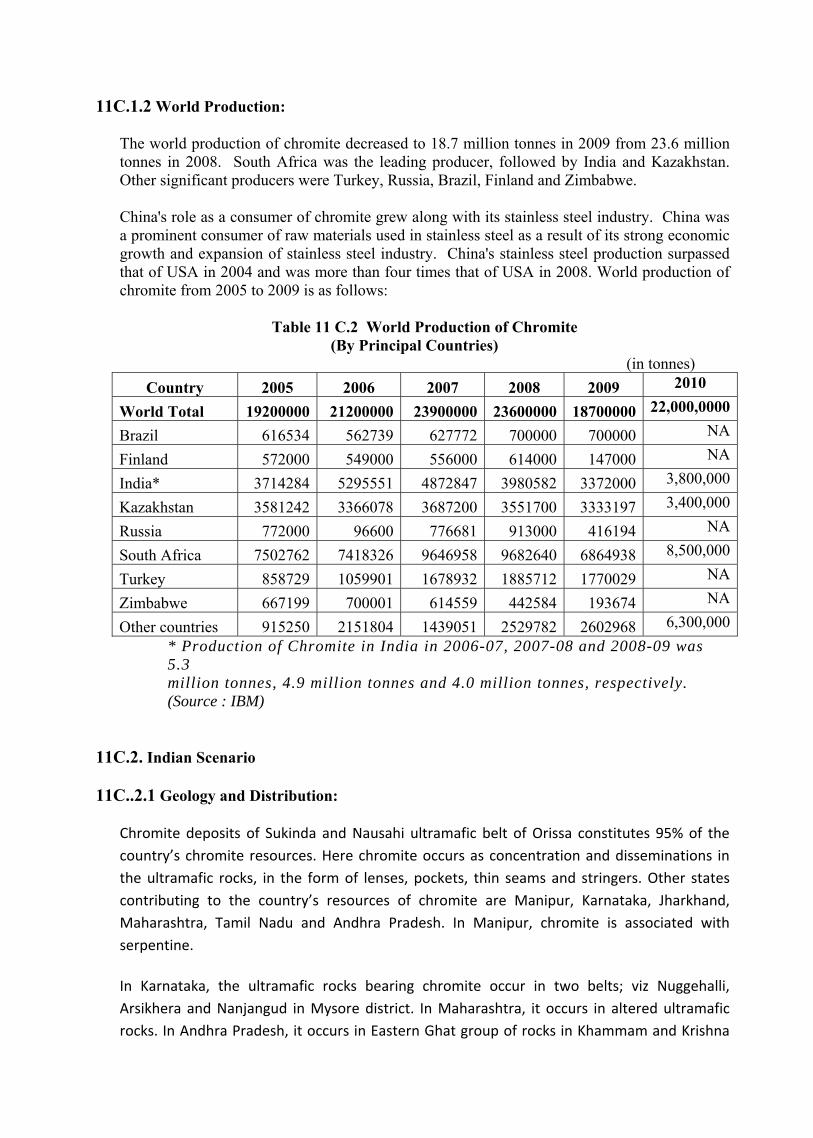
World reserves of shipping-grade chromite are more than 350 Million tones, sufficient to meet conceivable demand for countries. About 88% of world's chromium resources are concentrated in Kazakhstan and South Africa, These two countries are the major sources for chromite ore globally. United States chromium resources are mostly in Stillwater complex in Montana. The world production of chromite decreased to 18.7 million tonnes in 2009 from 23.6 million tonnes in 2008. South Africa was the leading producer, followed by India and Kazakhstan. Other significant producers were Turkey, Russia, Brazil, Finland and Zimbabwe. Indian Scenario As per UNFC system, total resources of chromite in the country as on 1.4.2010(P) are estimated at 203.3 million tonnes, comprising 53.9 million tonnes reserves (26.5%) and 149.4 million tonnes remaining resources (73.5%). More than 95% resources of chromite are located in Orissa, mostly in the Sukinda valley in Cuttack and Jajpur districts. The production of chromite at 3.41 million tonnes during 2009-10 decreased by 16% as compared to the previous year owing to decrease in market condition and demand. Orissa continued to be the major producing state of chromite, accounting for almost entire production during 2009-10. Export and Imports During 2009-10, India Exported 6.89 lakh tonnes of Chromite ore and bulk share of about 82% was of chromite concentrate while chromite lumps and other Chromite together accounted for 18%. Exports were mainly to China (77%) and Japan (22%). During 2009-10, India Imported 0.96 lakh tonnes of Chromite ore. Lumpy chromite accounted for 55% while concentrate and other forms accounted for remaining 45%. Imports were mainly from Oman (75%), UAE (9%), South Africa and Turkey (7% each). Consumption, Demand and Supply The estimated production of chromite is about 5.01 million tonnes by 2011-12 and 7.37 million tonnes by 2016-17 at 8% growth rate. The apparent consumption is estimated at 2.74 million tonnes by 2011-12 and 4.35 million tonnes by 2016-17 at 8% growth rate. Status of Chromite exploration in India Total potential area is approximately 2720 sq km which includes 2690 sq km in Peninsular India and 306 sq km in Extra Peninsular India. Total explored area is 604 sq km which includes 88.7 sq km lease hold areas. Free hold un-explored area is around 2116 sq km. Free hold explored area for reassessment is around 515.3 sq km.
RECOMMENDATIONS (Sub Group II)
GENERAL RECOMMENDATIONS (Sub Group-II)
1. As the major developed and developing countries are trying to acquire overseas mines by
way of purchasing assets abroad or diplomatic support, the Indian Govt. needs to play a facilitative role to help by involving diplomatic support. It may also include Govt. to Govt. co‐ordination, and formation of consortiums of public and private sector to work jointly to acquire the mining assets. Govt. may consider creating techno‐economic analysis unit in Ministry under an Economic Advisor and associate stakeholders including NMCC, MEA, FIMI,CII etc. in the process. Strengthen ties with mineral rich countries and provinces with functional and specific MoUs and utilize IMG mechanism to align domestic stakeholders with MoUs. Japanese smelters have made investments in other countries for supply of raw
material.
Implementing agencies – Ministry of Mines and Ministry of External Affairs.
2. Currently, RP applicant puts significant amount of time (8-12 or more months) in getting aerial survey permissions which involves obtaining ‘No Objection Certificates’ at various levels, security clearances from different Government department etc. Hence, simplification of Aerial survey procedures and approvals are required in order to increase the exploration range to find out more reserves.
Implementing agency – Ministry of Mines and Ministry of Civil Aviation.
3. Cluster mining approach in order to utilize the small deposits for further industrialization of
the mining area may be adopted in the sector which will improve the workability of small
quarries.
Implementing agencies – State Governments, Industry associations
4. To support development of suitable technology for various small deposits, there is a need for identification of a dedicated Centralized R&D institute/centre for process development
of precious metals.
Implementing agencies – CSIR, Ministry of Mines
5. To encourage efforts on exploration of low grade ores, initiatives are required to be taken by way of relaxation in taxation policy such as flow through options to offset risk in exploration. There is a need to create mechanism by which access venture capital is available to the mining companies on the lines of Toronto stock exchange (TSX)
a. Implementation agencies – Ministry of Mines and Ministry of Finance & SEBI
1. COPPER
1.1 Intensive exploration of copper mineral for additional resources within the country using
modern means and by involving private sector participation as well as inviting junior miners should be encouraged in XII plan because India’s import dependency with respect to copper concentrate will be 90% of its requirement even if the current expansion plans of HCL are achieved.
Implementing agencies – GSI, ministry of Mines, state Governments, HCL. Fund requirement – 50 Crores for GSI in the12th plan where metal specific focused
exploration project to be formulated.
1.2 All existing known resources / deposits of copper need to be brought into production through private or public sector investment. To increase range of down stream products so as to raise per capita copper consumption from 0.5 kg to 1.0 kg. by end of XIII plan.
Implementing agencies – HCL. Fund requirement – 2000 Crore for HCL through I&EBR.
1.3 As the major developed and developing countries are trying to acquire overseas mines by
way of purchasing assets abroad or diplomatic support, the Indian Government needs to play a facilitative role to help by involving diplomatic support. It may also include Government-to-Government co-ordination, and formation of consortiums of public and private sector to work jointly to acquire the mining assets. Government may consider creating techno-economic analysis unit in Ministry under an Economic Advisor and associate stakeholders including NMCC, MEA, FIMI, CII etc. in the process. Strengthen ties with mineral rich countries and provinces with functional and specific MoUs and Utillize IMG mechanism to align domestic stakeholders with MoUs. Japanese smelters have made investments in other countries for supply of raw material. Further, China often with government support acquired copper mining assets in other countries. Similar such approach by Indian government is needed by providing financial support by the government.
Implementing agencies – Ministry of Mines, DIPP and Ministry of External Affairs. Fund requirement – 10 Crore to set up a cell in Ministry of Mines
1.4 To ensure recovery of by products during custom smelting model, it may be worthwhile
to reduce the customs duty on copper concentrate from 2.5% at present to NIL, at least till CST is phased out. Further, in order to leverage these custom based smelters Government may by way of FTAs/ PTAs into India’s access to copper concentrate. This needs intense negotiations in bilateral agreement with resource rich countries i.e. Australia, Peru and Chile.
Implementing agencies – Ministry of Commerce in consultation with Ministry of Mines, ministry of Finance and Ministry of External Affairs.
1.5 It is necessary to encourage recycling of scrap with adoption of appropriate technology. Proper scrap collection and segregation mechanism needs to be established by creation of R & D institutions under an overarching framework for coordinated work.
Implementing agency – Ministry of Mines – providing grants to Indian Copper Development Centre.(ICDC)
Fund requirement – 20 Crore to Ministry of Mines for assisting in developing appropriate technology for recycling and 5 crore by way of grants to R & D institutions as ICDC.
1.6 The disincentive on gold production through copper route has been persisting. The
following duty changes may be considered for encouraging smelters to recover Gold and Silver from slimes:
Since there is no countervailing duty on finished gold imports, excise duty (Rs. 300 per 10 grams) on domestically produced gold vitiates the level playing field. Hence, excise duty on finished gold should be removed.
Gold contained in copper concentrate should be exempted from the countervailing duty and additional customs duty, following the exemption from basic customs duty in the recent Budget. This step is necessary to remove the disincentive that exists currently with respect to production of gold for copper producers.
Implementing agency – Ministry of Finance.
2. LEAD AND ZINC 2.1 To encourage efforts on exploration of low grade ores, initiatives are required to be taken
by way of relaxation in taxation policy such as flow through options to offset risk in exploration. There is a need to create mechanism by which access venture capital is available to the mining companies on the lines of Toronto stock exchange (TSX).
Implementation agencies – Ministry of Mines and Ministry of Finance & SEBI
2.2 Duty structure needs to be reviewed suitably for procurement of geophysical and
geochemical surveying instruments so that exploring agencies can undertake intensive exploration at low cost.
Implementation agencies – Ministry of Mines and Ministry of Finance.
2.3 Currently, RP applicant puts significant amount of time (8-12 or more months) in getting aerial survey permissions which involves obtaining ‘No Objection Certificates’ at various levels, security clearances from different Government departments etc. Hence, simplification of Aerial survey procedures and approvals are required in order to increase the exploration range to find out more reserves.
Implementing agency – Ministry of Mines and Ministry of Civil Aviation.
2.4 Nearly 50% of the estimated all India resource is low grade (<5% grade) and are currently not mined. To make these low grade deposits as economically viable mining projects, special relaxation in royalty and taxation need to be considered.
Implementing agency – Ministry of Finance and Industrial associations 2.5 Completion of feasibility studies on marginal grade deposits to establish their economic
viability as new mining projects is required to augment the zinc-lead reserves of India in a time bound manner during this 12th plan period through R & D institutions under an overarching framework for coordinated work.
Implementing agency – Ministry of Mines. Fund requirement – 5 crore for engaging a consultant for developing feasibility studies for
marginal grade deposits.
2.6 With rapid expansions of smelter capacities, imports of zinc concentrate and lead
concentrate are inevitable as domestic production (current as well as estimated) will be insufficient to meet the requirements. A supportive tariff regime (nil duty) is required on raw material namely zinc concentrate and lead concentrate to enable Indian zinc smelters and lead smelters to compete on a level playing field during FTAs.
Implementing agencies – Ministry of Commerce and Ministry of Finance.
2.7 A considerable part of India’s requirement of Zinc die cast alloys & Lead alloys are fulfilled by imports. Taxation and Technological transfer measures should be taken to develop indigenous downstream producers of these alloys so that India becomes self sufficient in value added products of zinc & lead as well.
Implementing agencies – Ministry of Mines and Ministry of Finance, C- TEMPO and Industry associations
2.8 Various policy initiatives have been taken by the Ministry of Environment & Forests and
Central Pollution Control Board, towards eco-friendly lead-zinc recycling sectors. Presently, the registration scheme for Recycling/Reprocessing of Hazardous Wastes comes under the purview of State Pollution Control Boards/Committees. Therefore, it is necessary that the state regulatory bodies will monitor the recycling sectors effectively by making suitable norms and rules so that sustainable approach can be taken place under proposed sustainable development framework (SDF) document.
Implementing agencies – Ministry of Environment and forests and State Governments.
3. ALUMINIUM 3.1 Aluminium smelting being energy‐intensive, allocation of captive coal blocks or linkages
should be given at par with IPP’s for primary aluminium smelters.
Implementing agency – Ministry of Coal, Ministry of Mines
3.2 Many large Bauxite Greenfield mining projects such as Vedanta, Utkal Alumina and Anrak etc., are held up for want of Forest/ Environmental clearances. Also land acquisition became an issue. Holistic review to be taken to ensure faster clearances and land acquisition, particularly for weathered deposits like bauxite.
Implementing agencies – Ministry of Mines, Ministry of Environment and Forests, Ministry of
Tribal Affairs, Ministry of Rural development and concerned State Governments.
3.3 Value addition in Aluminium alloys and semis to be encouraged through removing inverted duty structures.
Implementing agency – Ministry of Commerce
3.4 Induction and promotion of appropriate technologies indigenously or through Joint ventures required to be promoted by government funding.
Implementing agencies – Ministry of Mines, Ministry of Finance, Ministry of Commerce, JNARDDC.
Fund requirement for technology development – Rs 5Crore for JNARDDC.
3.5 It is necessary to encourage recycling of scrap with adoption of appropriate technology. Proper scrap collection and segregation mechanism needs to be established. This will help mineral and energy conservation.
Implementing agency – Ministry of Mines – providing grants to Aluminium Association of India for developing mechanism for scrap utilization and issues involved in segregation.
Fund requirement – 25 Crore to Aluminium Association of India for developing appropriate recycling technology
3.6 Development of appropriate technology through R & D for utilisation of Red Mud
generated during Alumina production, including recovery of Gallium and Vanadium. Development downstream products to popularise aluminium as a metal in construction, automobile, packaging and other sectors and increase per capita consumption from 1.3 kg to 2.0 kg per capita by end of XIII plan
Implementing agency – JNARDDC Fund requirement – Rs 5 Crore to JNARDDC for developing the appropriate technology
4. CEMENT AND LIMESTONE
4.1 The exploration for the cement grade limestone including special thematic mapping and
geochemical mapping should intensify in the areas beyond known limestone belts by GSI. Search for occurrence in Himalayas and Indo Gangetic Plains and Indian deserts needs to be intensified. This will increase the conversion of resources into reserves. Further, the limestone deposits are explored up to a depth of approximately 70 meters. There is a need to explore Limestone at greater depth.
Implementation agencies – GSI and State Governments. 4.2 At present periodic assessment of the captive limestone mines is not taken up. The
directives issued time to time for carrying out statutory exploration/ reassessment required to be monitored and reviewed to assess the availability of limestone reserves after assessing the current demand.
Implementation agency – IBM and State Governments
4.3 Cluster mining approach in order to utilise the small deposits for further industrialization of the mining area may be adopted in the sector which will improve the workability of small quarries.
Implementing agencies – State Governments, Industry associations
4.4 There are deposits existing in Northern and North eastern India which are of high value but with deficiency in infrastructure are not economical or accessible to exploit. Such deposits may be identified and seeing their potential, infrastructure should be developed which will lead to holistic development of that region.
Implementing agency – Ministry of Mines, DONEAR and State governments.
4.5 Review of the provisions of the CRZ is essential to enable eco-friendly use of enormous reserves of cement grade limestone available along Gujarat coast and to provide raw material security to existing plants.
Implementation agency – National institute of Oceanography, Ministry of Mines, MOEF. 4.6 Incentives on utilization of mineral beneficiation techniques with better recovery from
low grade limestone and mine rejects may be provided in the form of appropriate royalty reliefs.
Implementation agency- Ministry of Mines
4.7 Fiscal taxation measures to be adopted to encourage the utilization of low grade limestone. Further, utilisation of low grade limestone can be also encouraged by adopting the method of blending high grade imported limestone without compromising the quality of cement.
Implementing agencies – Ministry of Finance and Ministry of Commerce.
4.8 To encourage higher use of fly ash and slag, suitable fiscal taxation measures to be adopted for optimal utilisation and conservation of available limestone resources. Special studies to be conducted on sand, sand resources, and sand substitutes including M-sand (crushed aggregates)
Implementation agencies – Ministry of Industries and Ministry of Finance. For study -C-TEMPO, NCCBM, State Governments.
5. DIAMOND AND PRECIOUS STONES 5.1 India is the producer of some of the well known diamonds like Great Moghul, Koh-i-noor,
Nizam, Hope and Daryia-i- noor etc., in the world. However, all the diamonds have been found in gravel or alluvium as the host rock has not been discovered. It needs investor friendly policies to offset the high expenditure and high risk in exploration to attract junior and other players in exploration to locate diamondiferous host rocks as kimberlite and lamproite.
Implementing agency – Ministry of Mines and Ministry of Finance and SEBI
5.2 Airborne survey being crucial technique to locate kimberlites and lamproites needs simplification of procedures for approvals.
Implementing agency – Ministry of Civil Aviation .
5.3 The diamond exploration and exploitation being the capital intensive exercise needs support from the government by way of policy changes, incentives to attract venture capital, speedy approvals and assured right of transition from RP to ML.
Implementing agency – Ministry of Mines.
5.4 For conducting regional surveys and technology upgradation for diamonds by GSI viz. regional airborne geophysical surveys, magneto-telluric survey, litho probe project and tele-seismic (seismic tomography) project etc., Government financial support may be extended. State government DMG exploration wings need to be strengthened.
Implementing agency – GSI Fund requirement – Rs. 200 crores for conducting exploratory surveys with focus on
Diamonds. 5.5 Commission exploration programmes and surveys to ascertain availability of coloured
gemstones in mission mode by GSI. Appropriate budgetary support is necessary.
Implementing agency – GSI. Fund requirement – Rs. 20 Crores for mineral investigation scheme of GSI.
5.6 Need for appropriate regulatory framework to prevent illegal mining of coloured
gemstones.
Implementing agencies – State Government.
5.7 To negotiate favourable trade regimes and agreements with countries which currently impose high tariffs on imports of coloured gemstones from India. (Eg. Brazil, Maxico and China).
Implementing agencies – Ministry of Commerce.
5.8 With 800,000 strong workforce and deployment of the latest technology, India continues to be the dominant player in the world’s diamond cutting and polishing industry. India is facing growing competition from China and due to the fact that producing countries in Africa wants a share of processing within their countries. Thus, for India to retain its dominant position in cutting and polishing, the diamond industry needs to upgrade their equipment and skills for cutting and polishing of larger size diamonds and colored stones. Gem and Jewellary Export Promotion Council (GJEPC)may be identified as a nodal agency for this purpose.
Implementation agency- Ministry of Commerce, GJEPC, Hindustan Diamond Company Pvt. Ltd.
Fund requirement – 100 crore for developing the skill of the work force by assisting GJEPC.
6. GOLD AND PRECIOUS METALS
6.1 A central coordinating agency to be identified for taking a mission approach on gold and precious metals and achieving the objectives set out in this document.
Implementing agency – Ministry of Mines, GSI and C-TEMPO.. Fund requirement – Rs 10 Crores for exploration of Gold deposits in the country.
6.2 To accelerate the rate of exploration to tap the immense potential for Gold and precious metals in the country and to cover larger area through faster grants, seamless transition etc.
Implementing agencies – Ministry of Mines, GSI and State Governments and private sector
Fund requirement – 50 crore for GSI
6.3 To support exploitation of available resources by accelerating production from HGML, recovery from KGF tailings, reviving abandoned mines and faster approvals of other primary producers.
Implementing agencies – Ministry of Mines, Government of Karnataka, HGML.
.
6.4 Encouraging copper smelters for recovery of gold and silver from anode slimes, measures like removal of excise duty on finished gold, exemption from the countervailing duty and exemption of additional customs duty for gold contained in copper concentrate, are required.
Implementing agency – Ministry of Finance
6.5 To support development of suitable technology for various small deposits, there is a need for identification of a dedicated Centralised R&D institute/centre for process development of precious metals.
Implementing agencies – CSIR, Ministry of Mines, MECL Fund requirement Rs. 25 Crores
6.6 Ensuring availability of skilled/ trained manpower in geology, mining, processing of precious metals as well as tradesman partnership between industry, academic institutions and research labs
Implementing agencies – Ministry of Mines and Ministry of HRD Fund requirement Rs. 25 Crore to CSIR and ISM
6.7 Boula Nuasahi Ultra Maffic Complex (BNUC), Orissa having 15 tonnes of PGEs at 1 g/t of Pt+Pd should be accorded priority in developing it into economically viable deposit by identifying National Institutes to carry out detailed feasibility studies & to set up 2 t/annum PGE recovery plant by end of 12th Plan.
Implementing agencies – Government of Odisha, Orissa Mining Corporation, CSIR and
Ministry of Mines Fund requirement – Rs 25 Crores to CSIR
6.8 Feasibility studies on Sittampundi & Hanumalpura deposits to be initiated simultaneously
Implementing agencies- State Governments, Ministry of Mines Fund requirements – Rs 15 Crores to CSIR
6.9 Detailed exploration in the 10‐12 areas identified by GSI needs a major thrust during 12th plan to identify more resources.
Implementing agencies – Ministry of Mines and concerned State Governments
6.10 Recovery of Gold from KGF tailings, reviving abandoned mines of BGML.
Implementing agencies – Ministry of Mines by engaging consultant.
Fund requirement – 2 crore
6.11nvesting into R&D and to encourage recycling through technology mission approach specific to PGEs by recycling the catalytic converters, E‐waste and other PG bearing wastes and through project grants under S & T projects.
Implementing agency – Ministry of mines, DST, CSIR, BARC etc Fund requirement – Rs.100 Crores
7. DIMENSION AND DECORATIVE STONES
7.1 Centre for Development of Stones (CDOS), Rajasthan, which is a state govt. agency to be upgraded and re-designated as a National agency for technology/ skill upgradation, market development support etc. for Marble. A separate national agency is required to be established in southern India for development of granite and other stones.
Implementing agency – Ministry of Mines and State Governments Fund requirement – Rs 100 Crore
7.2 In order to promote the dimension stone industry by taking country as a whole there is a
need to have a suitable rate of royalty in all the states. Implementing agencies –Ministry of Mines, State Governments
7.3 Initiatives to be taken in the form of fiscal measures as customs and excise duties to
encourage import of dimension stones rather than finished products. This will encourage value addition and transfer of technology in the field of dimension stones in the country, which will contribute employment generation and foreign exchange earnings for GDP growth.
Implementing agencies – Ministry of Finance, Ministry of Commerce and Director General of Foreign Trade
7.4 The dimensional stone sector should be given the status of industry so that it can qualify
for the fiscal benefits like financial incentives, low cost loans etc. Implementing agencies – Ministry of Finance and State Governments
7.5 Necessary infrastructure facilities like water, power, road network in the mining areas of dimension stones which are generally located in remote areas may be provided by the State Governments.
Implementing agencies – State Governments
7.6 Necessary clearances for the deposits located in the forest areas are required to be expedited by evolving a faster mechanism.
Implementation agencies – Ministry of Environment and Forests and State
Governments
8. INDUSTRIAL AND NON-METALLIC MINERALS
8.1 Detailed exploration for chemical and fertiliser grade rock phosphate is needed in order to convert the resources in to reserves. New deposits to be searched in Andhra Pradesh, Madhya Pradesh, and Rajasthan. Besides, beneficiation of low grade rock Phosphate should be promoted indigenously.
Implementing agencies – GSI and State Governments
8.2 Private sector participation in rock phosphate and potash mining needs to be promoted in order to make available the above two minerals to reduce import dependence for promotion of fertilisers for agricultural sector.
Implementing agencies – Ministry of Fertilisers and State Governments
8.3 The country is deficient in all fertiliser minerals hence, concentrated effort should be made by making consortium of public private companies to acquire assets abroad specifically in the countries like Uzebkistan, Jordan etc. Strengthen ties with mineral rich countries and provinces with functional and specific MoUs and Utillize IMG mechanism to align domestic stakeholders with MoUs
Implementing agencies – Techno-economic advisory unit Ministry of Mines Fund requirement - 1000 Crores through public private partnership to acquire
mining assets abroad
8.4 Country being deficient in Pyrites and Sulphur which are essential for fertiliser industry, thus taxation policy intervention to be introduced to recover the sulphur going as gaseous emissions in the refinery and petro-chemical industries.
Implementing agencies – Ministry of Petroleum and Natural Gas
8.5 Restrictions of mining of Chrysotile variety of Asbestos used in flux and construction industries are required to be lifted in view of its increasing demand by framing necessary guidelines.
Implementing agency – Ministry of Mines
8.6 Exploration of low silica dolomite which is used as flux to be initiated in the states of Andhra Pradesh and Orissa.
(Implementing agency – State Government).
8.7 R & D for setting beneficiation facilities to utilize fluorspar from other parts of the country in the Chemical Industry.
Implementation agency – CSIR & IBM
8.8 Mining technology upgradation by adopting State-of-the-art technology for the exploitation of deep-seated gypsum deposits in Rajasthan is required.
Implementation agency – Ministry of Mines 8.9 There is an increasing demand for wollastonite in the international markets, especially in
ceramic and plastic industries and in construction activities. Since, wollastonite is mined and exported by only a few countries in the world, there is a scope for increasing the exports of this mineral from India in value-added form as coated powders. To augment the reserves of wollastonite further exploration is necessary in the States of Tamil Nadu and Gujarat.
Implementing agencies – Ministry of Commerce
8.10 Demand for oil and gas remained strong and the oil price remained high, encouraging exploration lead to high demand for Barytes, since 85 % of the world’s barytes is used in the petroleum industry. More exploration is necessary to locate new deposits in Rajasthan, Himachal Pradesh, etc.
Implementing agencies – State Governments
8.11 Detailed exploration for deposits of high grade fireclay is necessary to meet the increasing demand from refractory industry.
Implementing agencies – State Governments
8.12 Application of graphite in clay-bonded graphite crucibles has to be substituted by silicon carbide-graphite crucibles to improve upon the use of inferior grade ore with less quantity and at the same time ensuring longer life of crucible. Beneficiation of low grade ore having less than 10% Fixed Carbon is required to be given incentives.
Implementing agencies – Ministry of Mines
9. BEACH SAND MINERALS AND RARE EARTHS
9.1 Out of 7,000 kms of Indian coastline, about 2,500 kms has been explored and operations are on over an extent of only 100 kms. No substantial progress in Exploration activities for Beach Minerals was witnessed during the XIth Plan. Substantive steps to develop the beach sand reserves of the Country to its full potential by adopting suitable exploration strategy with modern techniques.
Implementing agencies - Department of Atomic Energy.
9.2 Grant of concessions and land acquisition to be simplified and facilitated in order to facilitate exploitation of all the minerals available in the Beach Sand Minerals, therefore strategy is need for full exploitation of all seven minerals.
Implementing agencies - Ministry of Mines, DAE, IBM, AMD and State Governments
9.3 In order to have better synergy for promotion of beach sand minerals, mechanism for
better coordination amongst AMD, IBM and State DGMs should be evolved, which may consists of specialists/ experts of institutions as well.
Implementing agency – AMD and IBM
9.4 To promote technology for Titanium sponge, Rare earths production and usage, policy on value addition and technology transfer with appropriate guidelines in FDI need to be incorporated.
Implementing agency – Ministry of Mines, Ministry of Finance, DAE, State Governments
9.5 Mineral Exclusion Certificates (MECs) in the areas where beach sands exists should be
insisted by the authorities before allotting land for other purposes in order to avoid wastage of precious minerals.
Implementation agency – State Governments
9.6 Study to be conducted in order to have fair idea on the nature of replenishment of heavy
minerals by tidal wave action all along the east coast from Andhra to Tamil Nadu will be helpful to check the trend of production pattern and thus check illegal mining/collection of such minerals.
Implementing agencies – National Institute of Oceanography and C-TEMPO Fund requirement – 1 Crore
10. STRATEGIC MINERALS AND METALS
10.1Creation of a national body and a corpus fund responsible for the national sourcing of
strategic minerals and metals such as Tin, Cobalt, Lithium, Germanium, Gallium, Indium, Niobium, Beryllium, Tantalum, Tungsten, Bismuth and Selenium etc. and Rare Earths to be established.
Implementing agencies – Ministry of Mines – forming a national body consisting, Ministry of Commerce, Ministry of Industries, Ministry of Defence, FIMI, other Industries bodies and C - TEMPO
Fund requirement – creation of corpus fund Rs. 500 Crores
10.2Bilateral agreements both for long and short term requirements for securing the supply of strategic minerals by strengthening ties with mineral rich countries and provinces with functional and specific MoUs and Utillize IMG mechanism to align domestic stakeholders with MoUs.
Implementing agencies – Ministry of Mines
10.3Encouraging domestic producers by incentivizing by-product recovery. Implementing agency – Ministry of Mines
10.4Investing into R&D to find substitutes and to encourage recycling through technology mission approach specific to strategic minerals and through project grants under S & T projects. Further, Reorient JNARDDC into a National Mineral Research and Development Centre (NMRDC) to conduct and coordinate pre-competitive research on Technology metals, Energy Critical Metals and Rare Earth Metals with CSIR, DRDO and MOM institutions on Australian CRC pattern.
Implementing agency – Ministry of mines, DST, CSIR, BARC etc Fund requirement – Rs.100 Crores (includes 50 crores as grant for JNARDC)
10.5Strategy to address supply chain disruptions and ways to build a national stock pile, for strategically critical input materials, by identifying Non Ferrous Technology Development Centre as a coordinating agency with financial support.
Implementing agency – Ministry of mines and NFTDCc
Fund requirement – Rs.1000 Crores
10.6A comprehensive study to assess: Potential market size and demand; potential influence of substitution and price levels. Current exploration, production and availability of these minerals. Ways to incentivize Base Metal producers to produce these strategic metals
Areas of competitive advantage India may have in sectors like Information technology and how best to leverage it for country’s long term advantage
Establishment of an Indian Competence Network on strategic minerals with all relevant stakeholders including recyclers, manufacturers, public authorities, government and researchers is essential for a successful implementation.
Implementing Agency – Ministry of Mines Fund requirement – Rs. 50 Lakhs
. 11. FERROUS MINERALS
IRON ORE
11.1.1 To promote the domestic steel industry, assured Iron ore linkages need to be promoted.
Implementing agencies – Ministry of Mines, Ministry of Steel.
11.1.2 The beneficiation effort particularly pelletisation needs to be encouraged by appropriate incentives in the export of Iron ore.
Implementing agencies - Ministry of Finance, Ministry of Mines, Ministry of Steel. MANGANESE ORE 11.2.1 India is deficient in high-grade, low-phosphorous manganese ore reserves. As large
consumers are directly importing, for small consumers necessary support through PSU’s needs to be extended.
Implementing agencies - Ministry of Steel, Ministry of Commerce.
11.2.2 In view of significant increase in demand for manganese ore by 12th Plan end, the production capacity needs significant augmentation and, correspondingly, reserves and resources also need to be augmented. Investor-friendly atmosphere for exploration/exploitation of low-grade, low tonnage, scattered deposits and to discover high-grade deposits to be created.
Implementing agencies – Ministry of Steel, Ministry of Mines, State Governments 11.2.3 India should acquire mines of high-grade Manganese deposits available in South
Africa as a part of raw material security. Implementing agencies – Ministry of Steel, MOIL
CHROME ORE 11.3.1 The state of Odisha has more than 90% of chromite resources and reserves in the
country, predominantly located in Sukhinda valley.The mines are going deeper and ore is becoming friable at lower levels. Exploration of deep seated ore bodies needs to be carried out on urgent basis.
Implementing agencies – OMC, Govt of Odisha Fund requirement – Rs 25 crores to Orissa mining corporation (State govt to allocate funds).
11.3.2 Exploration efforts also need intensification to identify more deposits of chromite in the country. Underground mining technology needs to be promoted.
Implementing agencies – GSI
Fund requirement – Rs 25 crores for GSI as a part of mineral exploration.
11.3.3 Development of suitable technology for beneficiation of low-grade, friable chromite ore (30% Cr2O3) fines which are available in sizeable quantity in India.
Implementing agencies – Ministry of Mines, CSIR, NML (Fund requirement – Rs 5 crores to NML,CSIR & OMC
11.3.4 Further restrictions on exports of chromite ore/concentrates in view of the limited resources in India and increasing demand for steel industry.
Implementing agencies – Ministry of Mines, Ministry of Commerce, Ministry of Steel
11.3.5 R & D is required for development of suitable technology for extraction of Nickel from
the Chromite overburden from the Sukinda area of Odisha. Implementing agencies – CSIR and Ministry of Mines Fund requirement – Rs.1 crore to CSIR
11.3.6 Acquisition of technology assets abroad pertaining to application of low grade Iron ore and other technology for pig Iron, sponge iron and pelletisation. Further, for technology gathering participation in mining technology related events such as PDAC, China Mining Expo. etc. and organize mining technology related events in collaboration with CII and FIMI.
Implementing agencies - Ministry of Mines, C-TEMPO and Ministry of Steel Fund requirement - 500.00 for acquisition of assets and 5 crores for participation in tech.
related events
CHAPTER – I COPPER
opper has been in use since ages and its probably one of the most widely used metals, its application & utility as known from annals of history signifies its importance in the development of civilization and industrialization. In fact, metal fabricators technology owes its beginning to copper. Copper as a metal stands out
among all the structural metals, possessing all characteristics attributable to a metal. It has excellent thermal and electrical conductivity and in this aspect it is rated next only to silver. Copper is malleable and ductile, and could be worked by practically all known metal forming techniques. Its mechanical properties viz. strength, hardness, elongation, resistance to mechanical and thermal shock, wear and abrasion resistance, etc. makes it suitable for most applications. Copper has excellent resistance to oxidation and corrosion under most natural and other environments and in this respect, it is the only
C
noble metal among the known structural metals. Passage of time has only added value to copper with several copper based alloys being developed in order to meet desired industrial purpose. Today copper ranks 3rd in terms of tonnage consumption with iron and aluminium holding 1st and 2nd rank respectively. Copper has become indispensable and vital to infrastructure development – be it power sector, transportation industry, process industry or consumer durable sectors. Copper is a strategic metal essential for development of any country. World over the major economies prefer having domestic production capability of refined copper so as to feed their growing internal demand for copper by downstream product manufacturers for the actual end uses rather than depending on import of refined copper. The Indian situation in this regard is rather encouraging. In order to make this strategic metal indigenously available, two major refined copper production facilities based on imported concentrate were commenced and these are in operation at the plants of M/s. Sterlite Copper (Vedanta Group) and M/s. Birla Copper (Hindalco Group). This is in addition to the integrated operation of Hindustan Copper Limited (HCL). Addition of capacities by private players exalted India to an exporter of refined copper from being hitherto a net importer in early nineties. 1. WORLD SCENARIO 1.1 DISTRIBUTION OF GLOBAL RESERVES FOR COPPER MINERAL As far as copper ore is concerned, Chile has the largest reserve base, followed by Peru. A preliminary assessment indicates that global land‐based resources of copper exceed 3 billion tonnes. Deep‐sea nodules have been estimated to contain 700 million tonnes of copper. The world mine production for 2009 and 2010, and Reserves as per U.S. Geological Survey, Mineral Commodity Summaries, January 2011 is shown in Table 1.1. Nearly one‐third of global mine production of copper comes from Chile.
Table 1.1 : World Mine Production & Reserves (in ‘000 tonne of copper content)
Country Mine Production
2009 2010
Reserves
Chile 5,390 5,520 150,000
Peru 1,275 1,285 90,000
Australia 854 900 80,000
Mexico 238 230 38,000
United States 1,180 1,120 35,000
China 995 1,150 30,000
Indonesia 996 840 30,000
Russia 725 750 30,000
Poland 439 430 26,000
Kazakhstan 390 400 18,000
Canada 491 480 8,000
Others 2,190 2,300 80,000
Total (World, rounded) 15163 15405 615000
1.2 WORLD PRODUCTION OF REFINED COPPER Refined copper is produced globally through three routes, viz., Primary (pyro‐metallurgy route), Electro‐winning (mostly hydrometallurgy route) and Secondary (using mostly scrap as raw material instead of copper ore and producing electro‐refined copper cathode). The World’s total copper refinery production during the period between 2006 and 2010 as observed in Table 1.2 indicates an overall increase in production by 10% . The world’s copper refinery production through all three known routes i.e. primary, electro‐won and secondary reported an increase in production of 5%, 18% and 27% respectively from the year 2006 to 2010. The production figure through the secondary route as reflected in the Table seems to suggest the use of scrap by primary smelters in addition to the primary use of concentrate. Other data sources further reveal that smelters based exclusively on scrap account for just about one million tonne of global refined copper output.
Table 1.2: World Copper Refinery Production (‘000 metric tonnes)
Total 17,291.0 17,734.0 18,201.2 18,275.7 19,041.3 p : preliminary data (Source : ICSG Copper Bulletin, March, 2011). Among the major copper producing countries, China, Chile, Japan and United States of America are among the top four and account for 60% of the world’s refined copper production; (Table1.3). Regionwise break‐up of refined copper production as depicted in Fig 1.1 indicates Asia with 43% of the refined copper production ahead of other regions, even though its share in mined copper is less than one‐fifth of the total production. China produces nearly one‐fourth of the world refined copper production.
Table 1.3 : Refined Copper Production by Major Producing Countries (By Primary and Secondary Route, in thousand tonnes)
Country 2006 2007 2008 2009 p/ 2010 p/
China 3,003 3,499 3,795 4,051 4,574
Chile 2,811 2,936 3,058 3,272 3,240
Japan 1,532 1,577 1,540 1,440 1,549
United States 1,250 1,311 1,280 1,161 1,094
Russian Fed. 951 949 862 874 892
Germany 662 666 690 669 694
India 625 715 662 715 654
Korean Rep. 576 582 531 539 566
Poland 557 533 527 503 547
Zambia 418 431 417 414 525
Australia 429 442 502 446 417
Peru 508 414 465 423 394
Scandinavia 407 358 396 345 347
Spain 299 308 319 329 343
Kazakhstan 428 406 398 368 323
Canada 501 454 442 336 319
Mexico 369 357 295 261 290
p: Preliminary data; Source: ICSG Copper Bulletin, March 2011
Figure 1.1 : World Refined Copper Production by Region
Source: WBMS www.world-bureau.com
Region %
Asia 43 America 32 Europe 19 Africa 4 Oceania 2 Total 100
1.3 WORLD COPPER DEMAND / USAGE The world refined copper demand/usage of the major copper consuming countries as reflected in Table 1.4 indicate an increase of about 13.6% in demand/usage in 2010 as compared to that reported in 2006. This exceeds the 10.1% increase in production as reported during the corresponding period. A key contributor to the growth in copper demand has been China, where demand more than doubled in the last four years. China now accounts for over 38% of the global copper demand.
Table 1.4 : Refined Copper Usage by Major Consuming Countries (thousand tonnes)
Country 2006 2007 2008 2009 p/ 2010 p/
China 3,604 4,957 5,202 7,119 7,423
United States 2,130 2,137 2,020 1,629 1,761
Germany 1,415 1,392 1,398 1,134 1,302
Japan 1,282 1,252 1,185 876 1,049
Korean Rep. 812 821 780 901 837
India 450 540 570 610 635
Italy 799 761 635 523 604
Taiwan (China) 640 603 582 494 533
Brazil 339 332 372 316 437
Russian Fed. 692 671 650 393 435
Turkey 320 357 376 324 383
Spain 319 330 385 338 340
Mexico 360 340 325 277 286
Poland 275 297 247 214 268
France 540 440 410 310 234
Canada 277 169 167 132 137
World (incl. others) 17,034 18,202 18,039 18,101 19,356
p: Preliminary data; Source: ICSG Copper Bulletin, March 2011
If the global usage data is analyzed after excluding China, then the copper usage in rest of the World (countries other than China) shows a decline (by over 11%) during 2006 to 2010. If India also is excluded, the decline is about 13%. Hence the engine of the growth is clearly China and to some extent India. Despite the global down turn in 2009/10, Chinese demand continued to grow. A separate section is added on China in this report.
The distribution of global demand for refined copper in 2006 and 2010 as shown in Fig. 1.2 clearly underscores the rise in consumption in China and highlights China’s dominant position in the world copper market.
The relationship between per capita income and per capita usage of refined copper as elicited in Fig. 1.3 clearly shows that intensity of copper usage increases as a country moves ahead on per capita income. Intensity of copper usage in China seems to have moved ahead of what this relationship would suggest. On the other hand, India’s per capita copper consumption is substantially low. As the country’s per capita income grows in future, one could expect a sharp increase in intensity of copper usage, going by the international experience on this count.
Figure 1.2: Distribution of Global Refined Copper Demand
2006 2010
Figure 1.3: Intensity of Refined Copper Usage
1.4 MAJOR EXPORTERS AND IMPORTERS OF REFINED COPPER AND MINED COPPER
Chile continues to be the largest exporter of copper since it has the largest mineral base, exploration and copper extraction operations. Similarly many exporting countries do have their own mineral resources. There are exceptions too, for instance, Japan and India export refined copper despite having very low reserve base.
China is the biggest importer of refined copper (Table 1.5). China and the US, the two largest consumers of copper, feature among top importers of the world despite having a significant production base as well.
Table 1.5 : Major Importers and Exporters of Refined Copper (thousand tonnes)
Importers 2007 2008 2009 2010 p/
China 1,553 1,504 3,185 2,922
Germany 844 833 659 744
Italy 743 617 544 628
United States 832 724 664 605
Taiwan (China) 615 585 498 536
Korean Rep. 420 407 488 413
Turkey 288 288 291 333
Brazil 218 252 209 253
Thailand 244 265 214 240
France 432 434 265 227
Netherlands 307 291 228 201
Malaysia 199 179 171 180
Saudi Arabia 152 159 131
TOTAL 6847 6538 7547 7282
Exporters 2007 2008 2009 2010 p/
Chile 2910 2983 3179 3161
Zambia 491 585 675 753
Japan 428 424 627 528
Russian Fed. 278 222 483 451
Peru 335 391 366 344
Australia 295 358 316 325
Poland 240 297 306 293
Kazakhstan 349 344 309 272
Netherlands 303 281 228 198
Belgium 199 260 235 189
Canada 298 290 222 184
India 215 170 185 184
Indonesia 169 143 197 161
China 126 96 73 39
TOTAL 6636 6844 7401 7082
p: Preliminary data; Source : ICSG Copper Bulletin, March & May, 2011. The total Exports and imports of copper concentrate and the top five importers and exporters of copper concentrates are reflected in Table 1.6 and 1.7. Predictably, the mine‐deficient Asian economies feature in the list of importers. To generalize, copper
concentrate largely flows from South America (where resources lie) to Asia (where markets lie).
Table 1.6 : Total Exports and Imports of Copper Concentrate (in thousand tonnes)
Year 2007 2008 2009 2010(p)
Import 5,580.4 5,793.5 5,760.1 5,755.2
Export 5,820.6 6,052.7 5,789.5 5,764.7
Source : ICSG Copper Bulletin, March & May, 2011
Table 1.7 : Major Exporters and Importers of Copper Concentrate (% of world, Based on value in USD for the year 2009)
Exporter % Share Importer % Share
China 28.8 Chile 39.9
Japan 27.9 Peru 17.2
Korea 11.2 Australia 13.1
India 10.3 Canada 5.3
Germany 5.7 Argentina 5.2
Source: Data downloaded from the website of UN Comtrade through online query builder on 11th July 2011. 1.5 HISTORICAL PRICE TREND Inferences from the trend in copper price on the London Metals Exchange since 2005 connote that copper prices have nearly tripled over this period (Table 1.8). The key factors pushing up copper prices have been � the sharp rise in consumption in emerging markets, certain supply disruptions with regard to the mine output, rising costs of mining due to falling ore grades and the increased interest of the investor community in commodity assets. Recently, exchange traded funds (ETFs) based on physical copper inventories have been launched, which is another evidence of the investor interest.
Table 1.8 : Monthly Average of Cash Settlement Prices for 2005‐2011 (US$ per metric tonne)
2005 2006 2007 2008 2009 2010 2011
Jan 3169 4734 5669 7060 3220 7386 9556
Feb 3253 4982 5675 7887 3314 6848 9868
Mar 3379 5102 6451 8438 3749 7462 9531
Apr 3394 6386 7765 8684 4406 7745 9483
May 3248 8044 7681 8382 4568 6838 8927
Jun 3523 7196 7474 8260 5013 6499 9045
Jul 3614 7710 7973 8413 5215 6735 ‐
Aug 3797 7694 7511 7634 6165 7284 ‐
Sep 3857 7601 7648 6990 6196 7709 ‐
Oct 4059 7499 8007 4925 6287 8292 ‐
Nov 4269 7028 6966 3716 6675 8470 ‐
Dec 4576 6673 6587 3071 6981 9147 ‐
Ave (annual) 3678 6721 7117 6955 5149 7535 9402
Source: Brook Hunt
Copper prices are expected to remain firm vis‐à‐vis the historical levels in the coming years too, as the factors mentioned above continue to exert their influence. Projections of Commodities Research Unit (CRU) suggest copper prices to move in the range of $8,500 to $9,800 per tonne during 2011‐2015. Long‐term price projections of another research house, Brook Hunt, estimate average copper price at $7,464/tonne during 2021‐2025. The trend in long‐term Treatment charges and Refining Charges (TCRC), which represent the charges effectively realized by custom smelters for converting the concentrate produced in mines into refined copper shows tightness in concentrate market as a result of which, TCRCs have been weak in the recent past with current levels being less than half of those prevailing in 2005 (Table 1.9).
Table 1.9 : Copper Concentrate Long‐Term TCRCs for 2005‐2011 (US$/tonne)
2005 2006 2007 2008 2009 2010 2011
Jan 602 812 339 254 424 263 317
Feb 610 837 339 254 424 263 317
Mar 623 849 339 254 424 263 317
Apr 624 977 339 254 424 263 317
May 610 1143 339 254 424 263 ‐
Jun 637 1058 339 254 424 263 ‐
Jul 799 471 288 237 283 263 ‐
Aug 817 471 288 237 283 263 ‐
Sep 823 471 288 237 283 263 ‐
Oct 843 471 288 237 283 263 ‐
Nov 864 471 288 237 283 263 ‐
Dec 895 471 288 237 283 263 ‐
Ave (annual)
729 709 314 246 354 263 317
If one looks at the combined picture emerging from increasing LME and falling TCRCs (Figure 1.4), it is an advantageous scenario for integrated copper producers, but not for custom smelters who have a conversion business model.
Figure 1.4: Trend in LME and TCRC
1.6 TRENDS IN END‐USER INDUSTRY Globally, the major usage of copper is accounted for by electrical/electronic sector owing to copper’s excellent electrical conductivity. While the percentage consumption in electrical sector is very high (50‐60%) in developing economies, in countries with matured economy sectors like construction also account for major usage of copper. Figure 1.5 shows world average Sectorwise copper consumption (%) and the share of Electrical/Electronic sector is about 42%.
Figure 1.5: World Copper Consumption by Sector (%)
42%
28%
12%
9%
9%
E lectrical/E lectronicC ons tructionTransportationC onsumer / GeneralIndus tria l Machinery
S ource : S tandard C IB G loba l Research
www.standardbank.co.z a
1.7 FUTURE DEMAND AND SUPPLY Long‐term dynamics of global copper demand and supply as depicted in Table 1.10 project growth in both demand and supply segments. It may be noted that there is a slight difference between global demand and supply figures mentioned in the below table from the numbers extracted from ICSG. This difference though could be attributed to the different sources of data compilation; the trends projected by both the sources are however on the same line. Long‐term projections suggest that, between 2010 and 2025, global refined copper production as well as consumption is likely to increase by over 65%, which is significantly high from that projected and realised in the last five years. This signals a likelihood of increased copper intensity, particularly in emerging markets that are moving up on the per capita income trajectory.
By 2025, global refined copper consumption is projected to touch close to 32 million tonnes vis‐à‐vis the current 19 million tonnes. Bulk of the increase in refined copper production during 2010 to 2025 is expected to result from the electro‐refining route, while the electro‐won route is expected to add less than 1 million tonnes over this period.
As seen in Figure 1.6, there is apparently a mismatch between the projected mine capacities and the global demand for mine output and this may call upon the probable at likely mine projects to bridge the gap to meet the demand for mine output.
Table 1.10 : Global Copper Scenario: Long‐Term Dynamics (All figures in terms of copper; thousand tonnes)
2008 2010 2011
(P) 2015 (P)
2025 (P)
Copper Conc. Production from Mines 12633 12915 12971 16717 23560
Concentrate Requirement of Smelters 12647 12984 13049 16545 23660
Smelter Production (after Mkt adj.) 14260 14695 14998 18582 26501
Electro‐Refined Copper Production (incl. Scrap addition)
15227 15769 16216 19774 28504
SX‐EW Copper Production 3110 3337 3423 4286 4135
Total Refined Copper Production 18336 19106 19639 24060 32639
Total Refined Copper Consumption 18041 19241 20208 23322 31559
Source: Brook Hunt – A Wood Mackenzie Company
Figure 1.6: Global Market Demand for Mine Output
1.8 CHINESE SCENARIO 1.8.1 Refined Consumption and Production In China the development and growth in production of copper and copper based products in the last two decades is rather exponential. Strong support from Governments (Central and Provincial) and facilitative industry structure played a crucial role in the phenomenal success of this Sector. Rapid growth in domestic production
capacities to ensure ready availability of inputs to various downstream and intermediate producers formed the cornerstone of Chinese strategy. Refined production posted a whopping 330% growth in a short span of 10 years between 2000 and 2010. Further, 90% capacity addition for the next 5 years is already underway. Despite such rapid increase in domestic production, China still imports more than a third of its total refined copper
demand—a situation slated to get corrected by 2015 when total imports dependence shall drop to about one tenth of total demand (Table 1.11).
Table 1.11: Refined Copper Consumption and Production in China (thousand tonnes)
1995 2000 2005 2010 2015
Refined Consumption 1150 1800 3800 7200 9500
Domestic Refined Production 1100 1360 2600 4550 8400
Net dependence on refined imports to feed consumption
Nil 440 1200 2650 1100
Import (refined) dependence as % of total consumption
Nil 24% 32% 37% 12%
1.8.2 Smelter Production Till early 90’s, China was self‐reliant in feeding its domestic smelters. However, rapid expansion in smelting capacity in order to cater growing copper demand outpaced the growth in mine production rather significantly. Currently, China imports about 64% of its feedstock for its smelters which is set to grow to 73% by 2015. Considering little scope for further increase in mine production, almost entire future growth shall depend on imported feedstock.
Table 1.12: Smelter and Mine Production in China (thousand tonnes, copper terms)
1995 2000 2005 2010 2015
Smelter production 600 1120 2020 3500 6000
Domestic Mine Production 450 550 760 1250 1600
Net dependence on imported raw material to feed smelter capacity
150 570 1260 2250 4400
Import (raw material) dependence as % of smelter demand
25% 51% 62% 64% 73%
The majority of Chinese copper smelting capacity is in public sector and Government’s next five year plan envisages integration of 90% of copper smelting capacity in top 5 enterprises – this move is expected to engender enormous market power to such enterprises. 1.8.3 Raw Material Security World over, major economies preferred to build domestic production capability for refined copper to feed their growing demand of copper by intermediate and downstream products’ manufacturers rather than depending upon import of refined
copper itself. As in the case of Japan, whose entire 100% of primary smelting capacities are based on imported feedstock. However, more than 70% of such imported concentrates comes from mines wherein Japanese entities have made investment (strategic or financial) – mostly with a proviso to supply proportionate concentrates to smelters in Japan. As a step further, two major Japanese smelters are in the process of executing two mines (Caserones and Seira Gorda) in Chile with combined capacity of 350 kt contained copper per annum which shall account for about 40% of total requirement of these two smelters.
China is gradually following a similar model to securitize feedstock—as entire incremental smelting capacity shall have to be based on imported feedstock. In order to place safeguard against supply risk and also to benefit from commodity cycles, China has been aggressively scouting for copper mining assets across the globe. A number of Chinese entities, often with support of Government, have snapped up quite a good number of copper assets in various parts of the world. Figure 1.7 depicts the production profile of copper mining assets which were acquired by Chinese entities in the recent past. It may be worth mentioning that by 2016, total supply by such overseas mining assets shall touch 1.5 million tonne copper – almost 25% of total domestic demand – hence taking total raw material security of China from domestic and overseas mines to 50%.
Figure 1.7: Chinese Foreign Mine Projects
The imperative for India is that it will have to compete with China on all fronts (mining assets to raw material supply to refined imports) – often with mighty Chinese state
enterprises–to ensure supply of copper to feed its growing demand.
2. INDIAN SCENARIO 2.1 INDIAN RESERVES OF COPPER ORE India has very limited known reserves of copper ore exploitable for copper production. The reserve position in India as on 01.04.2005 is shown in Table 1.13. Total resources, in
copper terms, add up to about 11.4 million tonnes, of which reserves are 4.4 million tonnes. As per the provisional data of Indian Bureau of Mines (IBM) as of 1.4.2010, there has been only a marginal change to the reserve position between 2005 and 2010. As of 1.4.2010, total reserves are estimated (in metal terms) at 4.8 million tonnes and resources at 12.3 million tonnes. Current level of reserves is, thus, equivalent to just about five years of copper production in India.
Table 1.13 : Reserves of Copper Ore in India (1.4.2005, in thousand tonnes)
Ores Metal
Proved STD111 135,461 1,644
Reserves Probable STD121 48,178 494
STD122 185,854 2,246
Total (A) 369,493 4,384
Feasibility STD211 3,375 3
Pre‐feasibility STD221 2,230 12
STD222 13,995 60
Measured STD331 112,019 1,052
Remaining Indicated STD332 158,678 1,396
resources Inferred STD333 734,637 4,509
Reconnaissance STD334 _ ‐
Total (B) 1,024,934 7,034
Total resources (A+B) 1,394,427 11,418
Source: Annual Report, Ministry of Mines, 2010‐11
Table 1.14 : HCL Ore Reserves and Resources as per UNFC Standard (1.4.2010)
Parameters UNFC code Million Tonnes
(A) Mineral reserve
1. Proved 111 142.22
2. Probable Mineral Reserve 121 129.15
122 29.06
Sub total (A) 300.43
(B) Remaining resources
1. Feasibility 211 43.39
2. Pre feasibility 221
222 34.25
3. Measured 331 119.33
4. Indicated 332 5.99
5. Inferred 333
6. Reconnaissance 334
Sub total (B) 202.96
Total 503.39
Source: HCL
Most of the existing reserves are owned by Hindustan Copper Ltd. (Table 1.14). Hindustan Copper owns 36% of the resources in terms of ore and over 39% of the resources in terms of metal (4.5 million tonnes). Against the resources of 503.39 million tonnes of copper ore held by Hindustan Copper Ltd., based on their current production capacity and actual production of mined copper and refined copper, a total mine life of 100 years is expected for the reserves held by Hindustan Copper Ltd. Table 1.15 captures the current and planned mine capacity of Hindustan Copper.
Table 1.15 : Mines Production Capacity of Hindustan Copper
(Unit: in Million Tonnes)
Production Capacity No. Mine Type of Mine Location
Current After Expansion
1 Malanjkhand Open cast Malanjkhand, M.P 2.0 5.5 (underground)
Notes: i. Banwas & Chapri‐Sidheswar are development of new mines ii. Rakha & Kendadih Mines are re‐opening of closed mines.
Green Field Exploration: HCL has applied for prospecting licenses in the states of Rajasthan, Madhya Pradesh, Jharkhand and Haryana. Baniwali‐ki Dhani: HCL has been granted prospecting lease of Baniwali‐ki Dhani comprising area of 36.0 sq km on 29.9.2010 for three years. The company plans to start exploration activity in 2011‐12. Reconnaissance Permit over an area of 580.73 sq km in the district Balaghat , Madhya Pradesh: The RP has been approved for grant by the Central Government on 5.10.2010. However, the permit is yet to be granted by the State Government. The company intends to undertake the reconnaissance work by appointing an agency in the year 2011‐12, after RP has been granted by the State Government, which is in advance stage of approval. Reserves & Resources: HCL JORC equivalent copper ore resource and reserve statement as –on 1.4.2010 is furnished in Table 1.16.
Table 1.16 : HCL Copper Ore Resources and Reserves converted to JORC Code (1.4.2010)
* Includes discounts for ore loss and dilution. Reserves = Resources – Ore Loss + Dilution
In addition, M/s. Sterlite Industries has been making attempts to have copper exploration/mining activities started within the country; however, it has not yet been able to start any mining activity in India. The status is shown in Table 1.17.
Table 1.17 : Status of Applied RP/PL/ML of Sterlite Industries
S.No Particulars District/ State Applied Area
Sq. km Date of
Application Status
Applied RPs
1 Udaipurwati
block
Sikar and Jhunjhunu Rajasthan
431.80 5 Oct'07 Application is pending, awaiting relinquishment of major part of the area by Anglo and Golden Patriot
2 Khodana block Mahendragarh, Bhiwani and
Rohtak, Haryana 2089.00 6 Feb'08
Director Mines and Industry of Haryana Govt. interviewed SIIL on 3/11/08, along with other parties at Chandigarh for selection of suitable party. No decision has been taken yet.
3 Golwa‐
Gangutana Block
Mahendragarh Haryana
518.90 14 July'08 RP application submitted, regular follow‐ups underway. HCL is a major contender.
Total applied RP area 3039.70
Applied PLs
4 Muradpur‐
Pacheri block Jhunjhunu Rajasthan
20.40 4 Oct'07 / 9 Jun'08
5 Baniwali ki dhani and Doken area
Sikar, Rajasthan 27.81 4 Oct'07 / 9 Jun'08
Reapplied for PL on dated 09/06/08 as per the Govt. notification along with Revenue records and Maps
6 Pacho ka Kharkhara
Sikar, Rajasthan 17.43 4 Oct'07 ME Sikar informed that area is presently reserved by GSI. Awaiting dereservation by GSI
Total applied PL area 65.64
Applied ML
7 Kallur Raichur Distt. Karnataka
2.60 10.12.08 Applied for ML along with Revenue maps and records. Regular follow‐up underway
Source: Sterlite Copper
It is but obvious that India does not possess abundant copper reserves, and the production of mined copper too has also been quite low and stagnant. Ore production of Hindustan Copper, the only producer in India, is furnished in Table 1.18. It shows the production being stagnant at around 30,000 tonnes in copper terms over the last five years, which is less than 5% of the country’s requirement of copper in concentrate.
Table 1.18: Copper Ore Production by Hindustan Copper Ltd
2006‐07 2007‐08 2008‐09 2009‐10 2010‐11
Ore (lakh tonnes) 32.71 32.45 29.83 32.05 36.03
MIC (tonnes) 30,231 31,378 27,589 28,202 31,683
Custom Copper Smelting Model
The custom smelting model, being followed in India, is predominant in many countries lacking local copper concentrate, such as China, Japan and Korea. In fact, the share of custom smelters in global copper smelting capacity has increased from 33% in 1995 to 49% in 2008. While integrated smelters’ realization is determined by the copper price prevalent on the London Metals Exchange (LME), in the custom smelting model, LME is a pass‐through. The smelters receive copper concentrate from mines at a discount over the copper prices on LME; the discount being called as treatment charges and refining charges (TCRC). Smelters then sell their produce at a premium over LME price. To put the above model simplistically, Purchase price = LME – TCRC Selling price = LME + Premium Hence, Value Addition = TCRC + Premium The key value drivers of the industry, namely TCRC and Premium are determined through global benchmarks arising out of negotiations with the upstream and downstream industries. TCRC is determined through annual negotiations with miners that determine the benchmark for the year. Additionally, copper concentrate is also purchased through the spot market depending upon the prevalent spot TCRC levels. A necessary co‐product of custom copper smelters is the sulfuric acid, which needs to be compulsorily evacuated for environment reasons. For each tonne of copper, the smelters produce around three tonnes of sulfuric acid, which is typically sold to fertilizer and other industries.
2.2 PRODUCTION OF REFINED COPPER IN INDIA There are four major producers of refined copper in India out of which M/s Hindustan Copper Ltd. (HCL) is the only integrated primary refined copper producer having copper mines within the country. The other two primary refined copper producers are Custom Smelters and depend on imported mineral in the form of concentrate either from their own mines abroad or other overseas sources (See box: Custom Copper Smelting Model). Jhagadia Copper, on the other hand, is equipped to manufacture refined copper through secondary route, i.e., by mostly using scrap as raw material. In addition there are a few installations to produce Electro‐won Copper – but their capacities are still very low, and production is inconsistent. Thus such units’ contribution to total domestic copper is still negligible. The present capacity and production data of the four producers of refined copper during 2006‐07 to 2010‐11 are detailed in Table 1.19. Production has moved in the range of 6.5‐7.1 lakh tonnes in the last five years, with capacity utilization being around 66% in 2010‐11.
Table 1.19 : Capacity and Production of Refined Copper in India (Unit: Tonnes)
Production Company Capacity
2006‐07 2007‐08 2008‐09 2009‐10 2010‐11
HCL** Sterlite Birla Jhagadia*
49,500 400,000 500,000 50,000
39,785 312,720 290,425 14,462
44,734 339,290 320,930 5,961
30,036 312,830 297,797 11,202
17,516 334,200 333,360 2,274
24,001 303,990 335,762
…
Total 999,500 657,392 710,915 651,865 687,350 663,753
* Also toll smelted 1,296 3,445 1,586 1,614 …
** Includes tolled: 1,262 … … 1,614 10,348
As per IBM’s IMYB 2009 and recent publication reg. Markey survey of copper (both available on IBM’s website), the capacity of HCL is 51500 tonnes. (Khetri 31000 t + ICC Ghatsila 20500 t). The above may be cross checked by FIMI as they have not given any source.
2.3 DEMAND DURING LAST FIVE YEARS The demand for copper in India has been on a path of showing steady growth in the recent years, except during the recession period. Copper is made available from various sources, viz., supply by indigenous refined copper manufacturers, import of refined copper (mostly cathode & CCR rod) as also scrap (both imported and domestic). For assessing the total demand of copper in a particular year, it is required to also include the copper content of imported copper and copper alloy semis. Theoretically the quantity of copper containing semis exported during the year need to be subtracted from the sum total to arrive at the exact demand figure/ year. But the semis export figure, being still not very substantial, has not been considered. Additionally, to assess possible demand for refined copper, and therefore, for copper concentrate in India, such subtraction is not necessary.
The estimated total demand for refined copper in India during 2006‐07 to 2010‐11 is shown in Table 1.20. Over the last four years, demand has increased at a CAGR of 10.1%, notwithstanding low growth in 2009‐10 in the wake of global economic crisis. It may be noted that direct use of scrap does not feature in the table below, as data on the same is not available from any authentic source. However, industry feedback / estimates indicate that direct use of scrap could be about 30‐35% of the refined copper consumption. Provided those estimates are correct, copper consumption in India during 2010‐11 could be in the region of around 7.25 lakh tonnes, which is an estimate used in a subsequent section for arriving at projections of copper consumption in India.
Table 1.20 : Estimated Refined Copper Demand in India (Metric Tonnes)
Domestic
Refined Supply Cathode + CCR Rod Import
Copper Semis Import + Copper Content of Copper
Alloy Semis Import
Total
2006‐07 281,232 19,045 81,025 381,302
2007‐08 374,422 23,781 92,192 490,395
2008‐09 425,141 24,546 87,988 537,675
2009‐10 434,942 21,497 92,485 548,924
2010‐11 427,847 16,072* 116,917* 560,836* Source: Industry estimates and ICDC estimate based on DGCIS data * Pro‐rata basis on 8 months’ data
The estimated pattern of end‐use of copper in India is shown in Figure 1.8. More than half
of the copper usage is in the electrical and wiring applications —this is much higher than the global average.
Figure 1.8: Pattern of End‐Use of Copper in India
Source: ICDC
2.4 RECYCLING IN INDIA India recycles substantial quantity of copper and copper alloy scrap – both indigenous and imported. Although the import of copper scrap is showing a declining trend, the import of brass scrap is increasing. The total copper content of imported copper and copper alloy scrap as per DGICS import data and ICDC calculation is shown in Table 1.21. Table 1.21 : Copper Content of Imported Copper & Copper Alloy Scrap (Metric Tonnes)
Scrap can be recycled through two routes, viz., Direct Melting and Refining. As for Refining of Scrap is concerned, Jhagadia Copper Limited (JCL) is the only organized sector unit in India having capacity to produce 50,000 tonnes per annum copper cathodes conforming to LME Grade ‘A’ specifications via secondary route. JCL was sourcing its requirement of raw material mainly from overseas sources. But JCL has had very low capacity utilization through most of the recent years. In 2010‐11, JCL did not produce at all and is looking for strategic investor. Thus, in India, maximum amount of scrap is recycled through direct melt route. While some of the industries do take adequate measures in scrap processing, some simply melt the scrap. Direct melting has serious environment implications. Also, the quality of metal produced in such melting shops can be inferior and may create safety hazards as well as inefficient use of electricity for the user industries. Overall, thus, India lacks sophisticated recycling capabilities, including those for collection and processing of scrap. 2.5 TRADE IN COPPER AND COPPER CONCENTRATE As per DGCIS data, India’s import of copper concentrate was 2707 thousand tonnes in 2006‐07, 1,194 in 2007‐08, 2,265 in 2008‐09, 2,187 in 2009‐10 and 1,883 thousand tonnes (annualized) in 2010‐11. It is, however, somewhat difficult to read much into the above trade statistics since the import quantity of copper concentrate is also influenced by the copper grade. Data on imports in terms of copper content is not available. It is instructive to note, however, that the copper production of Birla Copper and Sterlite Copper – together accounting for 95% of the refined copper produced in India in 2010‐11 (after
2006‐07 78,484
2007‐08 73,801
2008‐09 70,335
2009‐10 60,993
2010‐11 (Pro‐rata basis on 8 months’ data) 75,356
adjusting for tolling of Hindustan Copper material) – is based completely on imported concentrate. Refined copper is traded globally in the form of copper cathodes and continuous cast rods (CCR) while other forms are very insignificant. India’s copper exports (Table 1.22) have reduced over the last few years, with expansion of domestic demand and range‐bound production. Still, exports accounted for 36% of the domestic production. The domestic industry, thus, continues to have a high export orientation. Refined copper imports account for less than 4% of the domestic demand for refined copper.
Table 1.22 : Import and Export of Refined Copper in India (Tonnes)
Year Export Import
2006‐07 376,000 19,045
2007‐08 337,000 23,781
2008‐09 226,000 24,546
2009‐10 252,000 21,497
2010‐11 235,874 16,072*
* Pro‐rata basis on 8 months’ data Source: Industry data for exports; DGCIS for imports
2.6 LIKELY FUTURE DEMAND As mentioned in Table 1.20, India’s refined copper consumption has increased at 10% p.a. over the last four years. Over the same period, GDP grew at an average annual rate of 8.1%. The elasticity of copper consumption w.r.t. GDP growth, therefore, turns out to be nearly 1.25. Also, the trend seen globally of copper consumption intensity increasing at higher income levels will support growth in copper consumption. Indeed, projections of Brook Hunt indicate that India’s copper consumption is likely to overtake that of Japan by 2015 and that of Germany by 2018. India is likely to be the third largest copper market in 2020 with a market size of 1.75 million tonne and the second largest copper market in the year 2025 with a market size of 2.75 million tonne, as per these projections. As per the feedback from the end‐user industries, it appears that high growth in copper demand is likely to be from sectors like:
‐ Electrical ; ‐ Transport (auto and railways); ‐ ACR Manufacturers; ‐ Consumer durable manufacturing sector.
There are also some newer potential end use sectors emerging, including Gas supply, plumbing tube, Solar water heater and Desalination. Keeping the above factors in mind, copper demand (including direct usage of scrap) is projected in Table 1.23 at various GDP growth scenarios.
Table 1.23 : Projected Copper Demand in India (Tonnes)
@ GDP Growth rate of
8% 9% 10%
2011‐12 780,340 794,280 801,200
2012‐13 873,900 905,480 921,450
2013‐14 978,800 1,032,240 1,059,650
2014‐15 1,096,320 1,176,700 1,218,600
2015‐16 1,227,900 1,341,500 1,401,400
2.7 LIKELY FUTURE PRODUCTION Tables 1.24 and 1.25 show the plans of Indian copper producers over the next five years. It can be seen that Hindustan Copper has planned more than tripling of its mine output vis‐à‐vis stagnant performance in the last few years. If these plans succeed, then – based on industry projections – India’s dependence on import of copper concentrate can come down from 95% at present to about 90% by 2015‐16. With regard to refined copper, production capacity in India is projected to remain at the same level till 2013‐14, but is likely to increase by another 5 lakh tonnes by 2015, which will take India’s refined copper capacity to 1.5 million tonnes. Since nearly 90% of this production will be based on imported copper concentrate, it suggests a requirement of import of nearly 1.35 million tonnes of copper concentrate (MIC terms).
Table 1.24 : Projected Production Capacity of HCL for Ore and MIC
2011‐12 2012‐13 2013‐14 2014‐15 2015‐16 2016‐17
Ore (lakh tonnes)
36.0 42.6 49.9 90.8 112.6 127.1
MIC (tonnes) 35,000 39,434 46,993 88,768 111,212 128,508
Table 1.25 : Projected Capacity and Production of Refined Copper (Tonnes)
Year Capacity Production
Concentrate Requirement* (Copper terms)
2011‐12 949,500 735,500 758,000
2012‐13 949,500 797,500 822,000
2013‐14 949,500 847,500 874,000
2014‐15 1,449,500 1,322,500 1,363,000
2015‐16 1,449,500 1,347,500 1,389,000
* Rounded off Tables 1.24 and 1.25 are based on indicative plans shared by HCL, Birla Copper and Sterlite. 3. PRECIOUS METALS IN INDIAN COPPER INDUSTRY Copper concentrate invariably contains precious metals like gold, silver and selenium. However, production of these metals has not been up to the potential in the Indian copper industry. Birla Copper recovers these metals to some extent, but it has not been very enthusiastic about refining gold. While its precious metals refinery has a capacity of 15 tonnes of gold, average capacity utilization was just 53% in the last five years, as can be seen in Table 1.26. Sterlite Copper does not produce gold and silver; and instead, exports
anode slime containing these metals. Hindustan Copper Ltd has discontinued their precious metal recovery plant since 2007‐08 on economic considerations. One issue that has affected gold recovery from the copper sector has been that of an inverted duty structure with respect to gold & silver content. While copper industry was paying duty on the gold content in imported concentrate at an ad‐valorem rate, the duty on finished gold was specific and much lower than the duty on input gold content. Additionally, a significant amount of working capital remained locked up in CVD (countervailing duty) and additional customs duty, imposing an additional burden in terms of financing cost. Given this inverted duty structure, copper producers seem to have preferred buying concentrates that would contain minimum level of gold and silver to the extent possible. In Union Budget 2011, import duty on gold content in concentrate was removed. But, it imposed an excise duty of Rs 300 per 10 gm on finished gold. This duty cannot be passed on to buyers of gold since there is no countervailing duty on finished gold. Thus, the potential of copper industry to produce gold remains under‐utilized.
Table 1.26 : Production of Gold/Silver/Selenium in Indian Copper Industry (tonnes)
Birla Copper HCL Sterlite (content in exported slimes)
Year
Gold Silver Selenium Gold Silver Gold Silver
2006‐07 10.33 48.46 23.52 0.13 1.71 8.44 62.10
2007‐08 9.14 52.94 44.37 … … 9.91 80.14
2008‐09 4.87 37.31 38.81 … … 5.50 79.13
2009‐10 9.11 44.86 41.27 … … 10.57 88.66
2010‐11 6.96 45.06 73.87 … … 10.09 76.29
4. REVIEW OF 11th 5 YEAR PLAN REPORT 4.1 WORLD SCENARIO World reserve base has gone up from 470 million tonnes in 2005 to 630 million tonnes in 2010 – an increase by about 34%. During this period, the average LME price has shown a steep increase; the average LME price of 4097 US$/t of 2005‐06 has gone up to 7535 US$/t in the year 2010. The first four months of 2011 show an average price of 9,609 US$/t. During 2005‐2010, China has been the major consumer of copper both in terms of total tonnage and demand growth. 4.2 INDIAN SCENARIO During the 11th Five Year Plan Period, as per preliminary data on the website of IBM (Indian Bureau of Mines) suggests that during 2005‐10, India’s copper resource base has increased by just about 8%. As for refined copper production in India, substantial increase was observed – from 535,087 tonnes in 2005‐06 which went up to 663,721 tonnes in 2010‐11, ‐ a growth of 24% in 5 years, though production has been range‐bound in recent years.
Domestic refined consumption (cathode + CCR rod) grew by about 30 % during 2005‐06 and 2010‐11. 5. GOALS FOR 12th 5 YEAR PLAN 5.1 PRIORITY FOR INDIGENOUS DEVELOPMENT It is evident from the preceding discussion that there is a worldwide scarcity of copper primarily on account of the scarcity of sufficient resources in terms of both quantity and grade which determines the usage as well as prices of copper. The priority for India should be to secure access to raw material since India is heavily dependent on imported copper concentrates while having more than sufficient capacity for value addition within the country both on the smelting side and for further downstream applications. It is also evident that India will continue to have smelting and refining capacity surplus to its domestic consumption in the longer term perspective of 15 years based on long term plans of private producers. It is interesting to note that while India imports almost all its requirement of copper concentrates, it also exports a significant tonnage of refined copper. However, looking at the long term international scenario, there could be restrictions in sourcing copper concentrates from the international market leading to difficulties on these fronts. Therefore, it is imperative that intensive/extensive exploration for copper is taken up in India either by existing copper producers or by inviting independent junior exploration companies for green field exploration. 5.2 RAW MATERIALS SECURITY India is an importer of copper concentrate and net exporter of refined copper. India’s share in world copper mineral reserve is around 4.4 million tonnes which is 0.7% of known world reserves of 630 million tonnes (as per USGS data of 2010). Consumption of refined copper is growing and at present ore reserves are limited, therefore, there is an urgent need to increase the resources base of copper within the country by increased investment in exploration as well as investment in other geographies to acquire mining assets. As of now, there is a huge gap between domestic demand and production of concentrate. Almost 95% of concentrate requirement is met through import. 5.3 STRATEGIES FOR OVERSEAS ACQUISITION The two private copper producers in the country, namely Sterlite Industries and Birla Copper, have acquired mining properties for copper primarily in Australia with the purpose of producing and importing concentrates in India for their consumption. However, these constitute hardly 10 to 15% of their requirements. Sterlite Industries’ parent company, i.e. Vedanta Resources, has also acquired Konkola Copper Mines (KCM) in Zambia which is an integrated producer of copper. However, this is not relevant for India’s context, since, concentrates produced there are not available for being imported into India. Therefore, there is also a strong case for acquiring copper mining properties abroad with the purpose of importing the concentrates into India. HCL has entered into a MoU with NALCO for acquiring mines abroad in joint venture. 6. FUTURE KEY INITIATIVES AND RECOMMENDATIONS Copper is an indispensable metal for many important end‐use sectors, including infrastructure industries. Its development is linked closely with the economic progress of the country. Hence, it is imperative to have a strong domestic copper industry so that the end
use industry is assured of ready availability of copper and copper alloy products indigenously with both price and quality matching with the international suppliers. In the above backdrop, there are some critical issues that need to be addressed. 6.1 DEVELOPMENT OF INDIGENOUS RESOURCES Even though India does not have adequate copper resources to meet its internal demand, efforts need to be intensified to develop indigenous resources. This calls for intensive exploration of copper mineral within the country using modern means and by involving private sector as well as inviting junior exploration companies. Production capacity of Hindustan Copper needs to be enhanced and the current projections of the company need to be met. It may be reiterated that even if the current plans of HCL are fulfilled, India’s import dependency with respect to copper concentrate is projected to continue to the extent of > 90%. Simultaneously, the existing known resources/deposits of copper are need to be brought into production. Whether by HCL or through participation of private sector. 6.2 GOVERNMENT SUPPORT FOR OVERSEAS MINES ACQUISITION It may be noted that other countries lacking their own natural resources for copper, viz, China, Japan and Korea are seen to be actively supporting access of concentrate to their industry. The various means adopted include: direct government support in purchasing assets abroad (China), diplomatic support for acquisitions (China), support of financial institutions to tie‐up long‐term supplies (Japan), etc. Indian Government needs to play role of a facilitator to help Indian copper producers acquire overseas mines. This may include diplomatic support, since many assets are located in geo‐politically sensitive regions. It may also include joint participation in industry events, joint participation in bilateral talks, Government‐to‐Government co‐ordination, etc. 6.3 LEVERAGE FTAs / PTAs TO IMPROVE ACCESS TO RAW MATERIALS To improve India’s access to copper concentrates, various on‐going bilateral trade initiatives of the Government may be leveraged. India already has a preferential trade agreement with Chile – a major copper producer, though the extent of duty preference on copper concentrate is very marginal at present, and has scope to increase. Similarly, when India negotiates bilateral agreements with other resource‐rich countries, including Australia, Peru, etc, an effort must be made to fast‐track preferential access to copper concentrate in these countries. 6.4 VIABILITY OF CUSTOM SMELTING MODEL The projections made on domestic production of concentrate indicate that India will need to continue to rely on the custom smelting model for producing copper for the foreseeable future. It is, therefore, imperative to maintain the viability of the custom smelting model in India. In a scenario where TCRC charges have been declining, this industry has been under pressure. The effective duty protection (i.e. the difference in import duty on copper and copper concentrate) to the custom copper smelting industry has been compressed from over 30%, a decade earlier to just 2.5%, at present. This is nearly wiped out if one considers the additional burden of Central Sales Tax (CST at 2%).
Therefore, to ensure viability of the custom smelting model, it may be worthwhile to reduce the customs duty on copper concentrate from 2.5% at present to nil, at least till CST is phased out. 6.5 EFFECTIVE RECYCLING OF SCRAP While India recycles scrap in a large quantity, the same happens currently mostly in the unorganized sector and in a potentially hazardous way with regard to environment and safety. It is necessary to encourage recycling of scrap with adoption of appropriate technology. Proper scrap collection and segregation mechanism needs to be established. This will help mineral and energy conservation. 6.6 ENCOURAGE SMELTERS TO RECOVER GOLD AND SILVER The disincentive on gold production through copper route has persisted even after the changes in Union Budget 2011. In order to encourage gold production in the country through this route, the following duty changes need to be considered:
Since there is no countervailing duty on finished gold imports, excise duty on domestically produced gold vitiates the level playing field. Hence, excise duty on finished gold should be removed.
Gold contained in copper concentrate should be exempted from the countervailing duty and additional customs duty, following the exemption from basic customs duty in the Budget. This step is necessary to remove the disincentive that exists currently with respect to production of gold for copper producers.
6.7 STATISTICAL DATA Another important area of concern is lack of statistical data related to copper and copper alloy products in India. The Ministry of Mines may consider creating a nodal Centre or helping one of the existing relevant organizations to streamline facility for data collection on copper & copper alloys (both primary copper and scrap). This is important not only to assess domestic status and plan suitably the course of action, but is also required to be at par with important copper producer/user countries of the world. All these steps will help to ensure that copper, which is a critical sector for economic growth and infrastructure, will be able to grow and meet the needs of the Indian economy during its higher growth trajectory, without being undermined by the inadequacy of natural copper resource in India.
***
CHAPTER – II
ZINC AND LEAD
2. INTRODUCTION
Zinc is a brittle, crystalline, bluish white metal and is principally mined as the primary sulphide, Sphalerite, usually in association with Galena. Sphalerite contains 67% Zn and often includes traces of Cadmium, Gallium, Germanium and Indium as simple sulphides in solid solution. The secondary minerals Willemite (Zn2SiO4), Smithsonite (ZnCO3) and Hemimorphite (Zn4Si2O7(OH)2.H2O) also occur as ore. Zinc readily combines with other metals forming alloys - brass (copper and zinc), bronze (copper, tin and zinc) and nickel silver (copper, nickel and zinc).
Zinc is the third most used non-ferrous metal after aluminium and copper. Globally about 50% of zinc produced is used in galvanizing of steel products to protect them from corrosion. Zinc is an ideal material for die casting and is extensively used in making builders hardware, automotive, electrical and electronic components. Zinc compounds and powders are used in cosmetics, plastics, rubber, ointments, sun screen creams, soaps, paints, inks, fertilizers and dry cell batteries.
Lead is a relatively soft, malleable, blue-grey, heavy metal and is probably the earliest discovered metal that does not occur naturally in its pure state. Galena (PbS) is the principal ore, usually found in association with Sphalerite (ZnS). Galena often contains inclusions of silver and is a major source of that metal. The main oxidised ore minerals of lead are Cerussite (PbCO3) and Anglesite (PbSO4).
Lead is one of the most widely used metals and over 80% of all lead produced is used in making lead–acid batteries for the storage of energy. Other uses include lead foil, plumbing, solder, sound proofing, ammunition, addition to glass to block harmful radiation from television and computer screens and as an ultraviolet ray protector in PVC plastics. About 60% of the lead supply comes from lead scrap, particularly lead–acid batteries from which >90% are recycled.
2. INTERNATIONAL SCENARIO 2.1 Resources The world’s zinc resources are estimated at some 480 million tonnes as against 460 million tonnes reported in the last Five Year Plan Report. This obviously means that some countries have expanded their resources for Zinc. Australia, China and USA together account for 60% of the world’s zinc reserve base. Compilation of information from various sources shows a significant improvement in India’s position which is mapped to 4th place with 37 million tonnes of identified zinc metal in reserve base. (India was 7th with 24 million tonnes, as per the last Five Year Plan document)
World Zinc Resources (As on 2011) ('000 tonnes of contained Zinc Metal)
# Country Reserves Reserve Base 1 Australia 53,000 1,00,000 2 China 42,000 92,000 3 United States 12,000 90,000 4 India 11,000 37,000 5 Kazakhstan 16,000 35,000 6 Canada 6,000 30,000 7 Mexico 15,000 25,000 8 Peru 23,000 23,000 9 Other countries 72,000 50,000
World Total (rounded) 2,50,000 4,80,000
Sources: USGS, MCS, Jan 2009, 2010 & 2011; IBM Report 52 Lead & Zinc; HZL 2010/11, Australia’s Identified Mineral Resource 2010
Notes. Reserve Base, as per USGS classification, includes those resources that are currently
economic (reserves), marginally economic (marginal reserves), and some of those that are currently sub‐economic (sub‐economic resources).
Reserves: That part of the Reserve Base which could be economically extracted. It need not signify that extraction facilities are in place and operative. Includes only recoverable materials.
The numbers are based on USGS Mineral Commodity Summaries reporting. The Reserve Base (Jan 2009) has remained more or less stationary over the years and is therefore taken as key reference in the above compilation. The Reserve information is most recent (USGS Jan 2011, HZL 2011).
India’s Reserve Base & Reserves is calculated/compiled from HZL & IBM reports. The Other country Reserve Base is accordingly modified to reflect the change.
Reserve Base term is now discontinued in USGS summary sheets. However, it gives a good summary of identified resources by country.
The world’s lead resources are estimated at some 180 million tonnes as against 140 million tonnes reported in the 11th Five Year Plan Report, again indicating that countries have expanded their resources for Lead. Australia, China and USA together account for 63% of the world’s lead reserve base. In recent years, significant lead resources have been identified in association with zinc and/or silver or copper deposits in Australia, China, Ireland, Mexico, Peru, Portugal, Russia, and the United States (Alaska). As a result of significant augmentation of zinc-lead resources during 11th Five Year Plan, the lead metal reserve base of India has increased from 7 million tonnes (11th Five Year Plan Report) to about 11 million tonnes now.
World Lead Resources (as on 2011) ('000 tonnes of contained Lead Metal)
# Country Reserves Reserve Base 1 Australia 27,000 59,000 2 China 13,000 36,000 3 United States 7,000 19,000 4 Russia 9,200 NA 5 India 2,600 11,000 6 Kazakhstan NA 7,000 7 Poland 1,500 5,400 8 Canada 650 5,000 9 Peru 6,000 NA
10 Mexico 5,600 NA 11 Other countries 8,000 33,000
World Total (rounded) 80,000 1,80,000
Sources: USGS, MCS, Jan 2009, 2010 & 2011; IBM Report 52 Lead & Zinc; HZL 2010/11, Australia’s Identified Mineral Resource 2010
Notes. Reserve Base, as per USGS classification, includes those resources that are currently
economic (reserves), marginally economic (marginal reserves), and some of those that are currently sub‐economic (sub‐economic resources).
Reserves: That part of the Reserve Base which could be economically extracted. It need not signify that extraction facilities are in place and operative. Includes only recoverable materials.
The numbers are based on USGS Mineral Commodity Summaries reporting. The Reserve Base (Jan 2009) is taken as reference in the above compilation. The Reserve information is most recent (USGS Jan 2011, HZL 2011).
India’s Reserve Base & Reserves is calculated/compiled from HZL & IBM reports. The Other country Reserve Base is accordingly modified to reflect the change.
Reserve Base term is now discontinued in USGS summary sheets. However, it gives a good summary of identified resources by country.
The world zinc reserves in 2005 were estimated at some 220 million tonnes of contained zinc metal. The current estimates are about 250 million tonnes after a mine production of some 66 million tonnes (@ ~11 Mtpa) of contained zinc metal during 2005 and 2010. Similarly, the world lead reserves in 2005 were estimated at 67 million tonnes of contained lead metal. The same is now estimated at 80 million tonnes despite a mine production of some 22 million tonnes during 2005 and 2010. The improvement in zinc and lead reserves post mine depletion is attributed to enhanced exploration activities and favourable market conditions during this period. 2.2 Zinc Mine Production The major zinc mines are in China, Peru, Australia, USA, India & Canada with around 71% of the total world production. India is among the top 5 mining countries with a production share of around 6%. Zinc Mine Production (�'000 tonnes) Country 2006 2007 2008 2009 2010 China 2844 3048 3343 3324 3700
Peru 1202 1444 1603 1509 1469 Australia 1338 1498 1479 1270 1441 USA 727 803 779 736 751 India 503 539 616 695 740
Canada 638 630 716 699 649 Others 3195 3166 3324 3319 3577 World Total 10447 11128 11860 11552 12327
Source: ILZSG 2.3 Zinc Metal Production The leading zinc producers are China, Korea Republic, India, Canada, Japan, Spain & Australia with about 70% of the total world production. India is the third largest zinc producer with about 5.7% of the world production share. Zinc Metal Production ('000 tonnes) Country 2006 2007 2008 2009 2010 China 3163 3743 4042 4286 5164 Korea Republic 667 691 739 722 750 India 415 441 589 640 735 Canada 824 802 764 686 691 Japan 614 598 616 514 574 Spain 507 509 466 515 515 Australia 466 502 499 519 499 Others 3999 4059 4053 3409 3943 World Total 10655 11345 11768 11291 12871
Source: ILZSG Globally, about 30% zinc comes from secondary/recycling route i.e., from zinc dross, zinc ash/flux slimmings etc. There are also some plants recovering zinc from EAF dust while India has none. This is one area where Indian industry ought to pay attention immediately. At present, the zinc contained in the EAF dust goes unrecovered and hence this is a potential source for zinc recovery. 2.4 Zinc Consumption The global zinc metal consumption during 2010 was nearly 12.6 million tonnes. China, USA, Korea Republic, India, Japan and Germany are the leading consumers representing about 66% of the total world consumption. India’s share in the world consumption is about 4.2%. Zinc Metal Consumption ('000 tonnes) Country 2006 2007 2008 2009 2010 China 3156 3563 4144 4659 5358 USA 1153 1016 1003 912 926 Korea Republic 534 512 504 465 554 India 430 436 468 497 525 Japan 594 588 564 433 516 Germany 564 543 527 376 493 Others 4584 4618 4349 3503 4243 World Total 11015 11276 11559 10845 12615
Source: ILZSG During 2006 to 2010, world zinc consumption experienced a CAGR of 3.45%. This was a result of CAGR of above 14 % in China and around 5% in India, even when we saw decline in mature economies. The decline in 2009 was principally driven by the global economic meltdown in the initial part of the year. The continued fall of zinc LME prices in 2009 led to a number of zinc mines closures and shutdown or reduction of refined zinc metal production. In contrast, the later part of the year saw a strong rally in prices. Year 2010 was a year of redemption for much of the developed world. Europe, US and Japan woke up from a long slumber to post magnificent growth in 2010. This growth was stimulated by financial easing in USA & Japan and rising industrial growth in Europe. Developing economies were a mix of easing and tightening. 2.5 Metal Exports & Imports Global exim trade of zinc metal is around 3.5 million tonnes every year. The main zinc metal exporters are Canada, Australia, Netherlands, Spain & South Korea. Major Zinc Exporters ('000 tonnes) Country 2007 2008 2009 2010 Canada 614 599 592 547 Australia 404 415 454 397 Netherlands 323 311 335 341 Spain 220 192 217 318 S Korea 257 311 330 277
Source: ILZSG India’s exports during the last four years have been as follows: Year Exports ('000 tonnes) 2007-08 88 2008-09 221 2009-10 192 2010-11 301 It is noteworthy that from being a net importer eight years ago, India has become a net exporter. The main zinc metal importers are USA, Germany, Netherlands, China, Italy, Taiwan & China.
Major Zinc Importers ('000 tonnes) Country 2007 2008 2009 2010 USA 758 725 686 671 Germany 328 305 286 381 Netherlands 311 225 226 326 China 149 182 670 324 Italy 315 180 118 245 Taiwan, China 229 222 190 234
Source: ILZSG India’s Zinc imports during the last four years have been as follows: Year Imports ('000 tonnes)
2007-08 48 2008-09 56
2009-10 103 2010-11 60 2.6 Zinc Concentrate: Exports & Imports Global exim trade is around 4.5 million tones of metal in concentrate. The main zinc concentrate exporters are Australia, Peru, USA, Ireland, Mexico, Turkey & Canada. Major Zinc Concentrate Exporters ('000 tonnes) Country 2007 2008 2009 2010 Australia 1002 996 1032 1165 Peru 1125 1274 1191 1116 USA 820 726 790 764 Ireland 393 393 478 314 Mexico 107 88 151 211 Turkey 141 127 136 196 Canada 129 281 216 190
Source: ILZSG India’s zinc concentrate exports during the last four years have been as follows: Year Exports (‘000 tones) 2007-08 226 2008-09 76 2009-10 201 2010-11 66 The main zinc concentrate importers are China, Korea Republic, Belgium, Japan and Spain. Major Zinc Concentrate Importers ('000 tonnes) Country 2007 2008 2009 2010
China 780 1002 1643 1370 Korea Republic 667 744 671 710 Belgium 550 - - 557 Japan 559 620 471 505 Spain 629 554 455 502
Source: ILZSG India’s Zinc concentrates imports are as follows:
Year Imports ('000 tonnes) 2007-08 49 2008-09 75
2009-10 60 2010-11 65 2.7 Lead Mine Production The major Lead mines are in China, Australia, USA, Peru, Mexico & India constituting 81% of the total world production. India is among the top six mining countries with a production share of around 2.3%. Lead Mine Production ('000 tonnes) Country 2006 2007 2008 2009 2010 China 1331 1402 1403 1604 1851 Australia 621 589 594 525 583 USA 429 444 410 406 372 Peru 313 329 345 302 260 Mexico 135 137 141 144 182 India 69 78 84 82 97 Others 627 670 797 772 789 World Total 3525 3649 3774 3835 4134
Source: ILZSG 2.8 Lead Metal Production The leading lead producers are China, USA, Germany, Korea Republic, India & UK with about 71% of the total world production. India is the fifth largest lead producer with about 3.3% of the world production share.
Lead Metal Production ('000 tonnes) Country 2006 2007 2008 2009 2010 China 2715 2783 3452 3773 4199 USA 1303 1303 1280 1214 1256 Germany 379 405 415 391 405 Korea Republic 240 260 273 297 321 India 220 239 274 307 313
UK 298 275 303 312 301 Others 2965 3057 3063 2695 2777 World Total 8120 8322 9060 8989 9572
Source: ILZSG In the recent years Lead production from secondary sources form a major part of refined lead production. About 60% of the metal production is from secondary sources such as used lead batteries, lead scrap etc. In future the secondary source for lead will continue to rise, especially in developing countries. 2.9 Lead Consumption The global lead metal consumption in 2010 was 9.3 million tonnes. China, USA, Germany, India and Korea Republic are major consumers representing nearly 70% of the world consumption. India’s share in the world lead metal consumption is around 3.3%. Lead Metal Consumption ('000 tonnes) Country 2006 2007 2008 2009 2010 China 2213 2569 3456 3925 4213 USA 1622 1510 1515 1397 1445 Germany 387 409 369 314 342 India 275 282 290 297 312 Korea Rep 337 342 315 328 382 Others 3360 3262 3102 2671 2881 World Total 8194 8374 9047 8932 9575
Source: ILZSG During 2006 to 2010, world refined lead consumption experienced a CAGR of 3.97%. This was a result of CAGR of around 17% in China and above 3% in India and Korea Republic even when all mature economies had seen decline in their consumption levels. Major industrial application of Lead is in lead batteries with about 80% share, followed by rolled and extruded products with 6% share. Automobile sector is the major end-use sector. END USAGE SECTORAL SHARE Batteries 80% Rolled & Extruded Products 6%
Source: ILZSG 2.10 Lead Metal Exports & Imports Global exim trade of Lead metal is around 1.4 million tonnes.
Major countries exporting Lead metal are Australia, Germany, Canada, Belgium, UK and Mexico. Major Lead Exporters ('000 tonnes) Country 2007 2008 2009 2010 Australia 222 218 246 163 Germany 119 139 163 164 Canada 168 113 130 133 Belgium 84 79 93 111 UK 68 80 128 104 Mexico 46 81 119 104
Source: ILZSG USA, Korea Republic, Spain, Germany & Italy are the major lead metal importers. Major Lead Importers ('000 tonnes) Country 2007 2008 2009 2010 USA 267 313 253 272 Korea Republic 110 92 131 141 Spain 138 113 118 105 Germany 116 99 87 101 Italy 94 86 77 99
Source: ILZSG 2.11 Lead Concentrate Exports & Imports Global exim trade of Lead concentrate is around 1 million tonne. Peru, Australia & Russia are the major concentrate exporters. Major Lead Concentrate Exporters ('000 tonnes) Country 2007 2008 2009 2010 Peru 187 252 277 301 Australia 235 222 267 301 Russia 45 48 78 107
Source: ILZSG India’s Lead Concentrate Exports during the last four years have been as follows: Year Exports ('000 tonnes) 2007-08 65 2008-09 56 2009-10 31 2010-11 38 China, Korea Republic, Germany and Belgium are the major Lead concentrate importers. Major Lead Concentrate Importers('000 tonnes) Country 2007 2008 2009 2010
Source: ILZSG India’s Lead Concentrate Imports during the last four years have been as follows: Year Imports ('000 tonnes) 2007-08 6 2008-09 5 2009-10 7 2010-11 8 2.13 LME Prices LME prices in the last 4 years have seen extreme fluctuations. From unrealistic high levels of USD 3257/MT to the extreme lows of 2009 to current level of around USD 2159/MT; zinc manufacturers and users have been under tremendous pressure. High prices in 2007 were a result of deep structural imbalance with world market in deficit. Since then supply has exceeded the demand with surplus being record high in 2009. Add to that economic downturn, price recorded their lowest in 2009. Though the same levels of surplus continued in 2010, zinc consumption went up by around 14%. As a result and with sustained investors’ interests, zinc prices were in the range of USD 2200/MT. Generally lead metal follows zinc price trends. Though the actual prices may be different but movements are similar. Lead prices are generally driven by mine profitability, demand supply balance and growth in automotive sector (battery application). Annual average of settlement prices (in USD/MT) is: Year Zinc Lead 2007 3257 2594 2008 1864 2079 2009 1657 1726 2010 2159 2148 Long term outlook for zinc and lead is good with prices to remain buoyed by positive demand and matching supply. China & India are forecasted to drive this demand growth. The price forecast range for the next five years is given below: Year Zinc Lead 2011 2200-2400 2200-2400 2012 2000-2600 2200-2400 2013 2000-2700 2400-2600 2014 1800-2400 2800-3000 2015 2000-2200 3200-3500 3.0 INDIAN SCENARIO
The IBM’s lead-zinc reserve-resource inventory of India (as on 1st April 2005), based on United Nations Framework Classification (UNFC) criteria, is given below:
( '000 tonnes)
State Reserves Remaining ResourcesTotal
Resources
All India Reserve/Resource 125,754 396,826 522,580
Zn-metal 10,813 11,670 22,483 Source: Indian Bureau of Mines
Lead Zinc Resources (UNFC) in India as on 1st April 2005
The 2005 reserves were estimated to be around 126 million tonnes containing about 11 and 2.6 million tonnes of zinc and lead metals respectively. The remaining resources were estimated to be some 397 million tonnes with about 13 and 4.6 million tonnes of zinc and lead metals respectively. While the total all India resources were estimated at 522 million tonnes, about 89% of lead and 93% of zinc reserves are located in Rajasthan. In the period from 2005 to 2011, brownfield exploration by Hindustan Zinc Limited (HZL) using modeling of multi-disciplinary historical data in GIS environment, deployment of state-of-the-art high speed & high capacity drill rigs and data management has yielded significant successes. Exploration at Rampura Agucha resulted in establishing continuity of orebody from 400m (1982) to 1.1 km depth (2010) which increased its resources from some 61 million tonnes (1982) to about 120 million tonnes (2010). With a pre-mining resource of ~150 million tonnes, Rampura Agucha deposit truly makes it the world’s giant lead-zinc deposits.
At Sindesar Khurd, exploration formulation was governed from a careful study on drill cores for marker horizons & litho-structures which defined dip reversals of orebody in depth. The exploration model testing successfully increased the resources from 13 Mt (2005) to 67 Mt (2011) containing significant zinc-lead-silver grades.
Significant additions are also obtained in deeper extensions of Rajpura Dariba and Zawar Mines with discovery of some new ore lenses. The overall exploration results have added about 185 million tonnes of resources prior to depletion of 37 million tonnes. It is estimated that the country’s identified zinc-lead resources as on 1st April 2011 are 671 million tonnes containing 37 million tonnes of zinc and 11 million tonnes of lead metal as worked out below. Figures in Million Tonnes
Reserves + Resources
Contained Zinc Metal
Contained Lead Metal
IBM : All India Position as on 1st April 2005 522.58 24.26 7.21 HZL : Contribution of Mine R&R as on 1st April 164.80 14.59 3.36
2005 HZL : Mine R&R as on 1st April 2011 (Provisional)
313.18 27.51
7.2
HZL : Net addition during 2005-2011 148.38 12.92 3.84 Others: Significant reporting during 2005-2011 0.00 0.00 0.00 All India Net Position as on 1st April 2011 (Provisional) 670.96 37.18 11.05 Source: HZL India on the world zinc Reserve Base scale was at 7th position at the begining of 11th Five Year Plan. The country has now moved to a respectable 4th position mainly on account of significant exploration success reported by HZL. Reserves in the operative mines of HZL, based on JORC (Joint Ore Reserve Committee) criteria, and their life span are presented in table below:
Note:
Resources in Inferred categories and other ore blocked in pillars are not considered for production planning.
Exploration for up-gradation of the resources to mineable reserves has been intensified in the underground mines at Zawar, Rajpura Dariba and Sindesar Khurd. This will enhance the life of mines and pave the way for further expansion.
Rampura Agucha is one of the lowest cost zinc producers globally. An additional 1 Mtpa concentrator was successfully commissioned in March 2010 and its ore production capacity is enhanced from 5.0 million tonnes to 6.0 million tonnes per annum. Underground operation is likely to commence in the year 2015. At Sindesar Khurd, a new 1.5 Mtpa concentrator facility is now commissioned, one year ahead of schedule. Kayar deposit is expected to come into production during 2013-14.
Looking at the present scale of operations, zinc and lead resource position will become critical after some 10 years. Therefore, there is a strong need to focus on exploration activities in the country to find new economic resources for sustaining the present and planned expansions in zinc metal production, or to contemplate any increase in the primary lead metal production. This will require expeditious grant/clearances of RP, PL and ML for identification and establishment of newer resources and finally to mine development. 3.1 Exploration
HZL has been aggressively exploring both in brownfield and greenfield. A significant amount of drilling @ about 70,000m per annum using specialized technologies has been carried out during the last couple of years and several deep holes (+1,000m) have been drilled with success. A number of most advanced mineral exploration techniques viz. Heliborne Geophysical Surveys (VTEM), Titan Deep Earth Imaging (IP-Resistivity and MT), High Resolution Ground Magnetic surveys have been deployed to identify concealed targets. In addition, Remote Sensing studies including Hyper-spectral mineral mapping were also undertaken for selected areas. Advanced geochemical surveys involving multi-elemental analysis and field XRF assaying have helped in potential mineral target delineation. A vigorous use of GIS integration and Data Management system has been efficiently applied for meaningful interpretation. Going forward, it is envisaged that a total of 80,000-100,000m of drilling will be carried out each year. Maintaining high technical competency by inducting latest technology, skill enhancement of geoscientists through international exposure is also part of future plans. In addition to HZL, there are several other companies which have also applied and obtained RPs and PLs for Lead Zinc Exploration. 3.2 ZINC India has two primary zinc producers namely M/s Hindustan Zinc Ltd (HZL) with a capacity of 879000 tonnes and Binani Zinc Ltd (BZL) with a capacity of 38000 tonnes. Originally, Hindustan Zinc Ltd was a public sector unit and post disinvestment in 2002, it has become a private sector enterprise, owned by Vedanta Group. HZL is a vertically integrated producer from mining to smelting, with operations in Rajasthan as well as Andhra Pradesh. Over the last 8 years Hindustan Zinc has invested over INR 8000 Cr in order to increase the Indian zinc production capacities and thereby ensure India is self sufficient in Zinc metal. Binani Zinc Ltd is a custom smelter, based on imported zinc concentrates, with operations at Kochi in Kerala. Currently, India is a net exporter of zinc with a cumulative installed capacity of 917,000 tonnes for zinc. Mine capacity: Currently, HZL ore production capacities are as follows:
Sindesar Khurd 1500000 HZL’s production of zinc concentrates during the 11th Five Year Plan and estimates for 12th Five Year Plan will be on the following lines:
2012-13 75000 2013-14 76000 2014-15 160000 2015-16 200000 2016-17 200000 Zinc Capacity: The current zinc production capacities are as follows: Hindustan Zinc Ltd Capacity( tonnes) Chanderiya Hydro 1 210,000 Chanderiya Hydro 2 210,000 Rajpura Dariba 210,000 Chanderiya Pyro 105,000 Debari smelter 88,000 Vizag smelter 56,000 Sub- total 879,000 Binani Zinc Ltd Kochi smelter 38,000 India Total 917,000 Binani Zinc is at present finalizing its plans to expand its zinc production capacity to 100,000 tpy, during the 12th Five Year Plan. Production: During the 11th Five Year Plan, zinc production in India was as follows: Year HZL BZL Total Production 2007-08 426,323 31,903 458,226 2008-09 551,724 30,443 582,167 2009-10 578,411 35,352 613,763
2010-11 712,471 32,662 745,133 2011-12 (E) 826,000 37,000 863,000 The estimated zinc production during the 12th Five Year Plan will be as follws: Year HZL BZL Total Production (E) 2012-13 879,000 37,500 916500 2013-14 879,000 38,000 917000 2014-15 879,000 80,000 959000 2015-16 879,000 100,000 979000 2016-17 879,000 100,000 979000 Zinc Imports: India’s Zinc imports during the 11th Five Year Plan are given below:
Future imports will depend on the prevailing international price, currency rate, domestic metal availability, domestic metal demand, etc. As a conservative estimate, based on the recent import trends, it is reasonable to assume a quantity of 50000 tonnes per year as likely zinc imports during the 12th Five Year Plan. Zinc exports: HZL’s zinc exports during the 11th Five Year Plan was: Year Quantity
( tonnes) 2007-08 88000 2008-09 221000 2009-10 192000 2010-11 301000 2011-12 (E) 331000 Secondary Zinc: The estimated production of secondary zinc during the 11th Five Year Plan was:
Year Quantity (tonnes)
2007-08 10000 2008-09 11000 2009-10 12000
2010-11 14000 2011-12 (E) 16000
On a conservative basis, it is reasonable to assume 20000 tonnes per year as the likely secondary zinc production during the 12th Five Year Plan. In India, the domestic generated zinc dross, zinc ash/flux skimmings etc., are converted into Zinc Sulphate, Zinc Chloride and Zinc Oxide, while the metallics are melted and cast into zinc ingots. As indicated earlier the EAF dust should also be utilized for zinc recovery, as a sustainable development initiative. Zinc Demand-Supply Scenario Based on the above data, the Zinc Demand Supply scenario during the 11th Five Year Plan and 12th Five Year Plan are: 11th Five Year Plan
(Units: Tonnes) Year Demand India’s Imports Secondary Exports Supply Prodn(E) Zinc 2007-08 415000 458226 48000 10000 88000 428226 2008-09 420000 582167 57000 11000 221000 429167 2009-10 525000 613763 103000 12000 192000 536763 2010-11 503000 745133 60000 14000 301000 518133 2011-12 (E) 550000 863000 50000 16000 331000 598000 12th Five Year Plan Year Demand India’s Imports Secondary Exports* Supply* Production(E) Zinc 2012-13 600000 916500 50000 20000 386500 600000 2013-14 660000 917000 50000 20000 327000 660000 2014-15 730000 959000 50000 20000 299000 730000 2015-16 800000 979000 50000 20000 249000 800000 2016-17 880000 979000 50000 20000 169000 880000 *Only surplus zinc is exported, if all of zinc production is consumed within India, export will be zero. However, some surplus is expected to be there during next 5 years. Zinc is the third most widely used non ferrous metal after aluminium and copper. Today zinc has many modern uses: galvanizing, dry cell batteries, die casting, chemicals, alloys etc., roughly 70% of zinc consumed in India finds application in the galvanizing sector alone. Zinc sectoral demand is as follows:
Galvanizing: Hot dip galvanizing, as it is widely known, provides an ideal corrosion protection to steel articles – no other coating matches the unique advantages of galvanizing such as sacrificial action, barrier protection, lowest lifecycle cost, maintenance free protection, ease of inspection for quality, predictable performance, resistance to mechanical damage/abrasion and above all paintability (for enhanced protection) and weldability. The galvanized coating is applied by dipping thoroughly - cleaned steel articles into a bath of molten zinc; the pre-requisites for good galvanizing are “thorough cleaning” and “molten zinc”. By the dipping process, reaction between steel and molten zinc takes place and leads to the formation of a series of iron-zinc alloy layers on the steel and when the article is taken out from the galvanizing bath, the carried over zinc solidifies on the series of alloy layers. Galvanizing sector in India is a well established industry as this method has been practiced for several decades. India has been a traditional exporter of galvanized steel sheets, galvanized steel pipes, galvanized steel wires etc., India has also been executing turnkey projects in power transmission. In recent times, many technological improvements have taken place in the galvanizing process such as improved heating systems, sound environment protection, versatile materials handling systems, effective process controls, wiping systems for minimizing the excess zinc carryover etc. It is interesting to see the massive investments in India to the tune of US $ 500 billion in the 11th Five Year Plan in the infrastructural sectors, where steel and zinc play significant roles. During the 12th Five Year Plan, Govt of India proposes to double the investment i.e., US $1000 billion in power, telecom, highways, roads, ports, aviation etc. Transmission line towers use galvanized steel structurals, gusset plates, fasteners etc., Power Grid Corpn proposes to invest Rs.55000 crore till 2012 and its 60000 km network in the country will also be doubled. In addition, the Rural Electrification Programme intends to electrify villages by 2012. The government proposes to launch a National Electricity Fund (NEF) with a corpus of Rs.1.0 lakh crore for strengthening the power transmission and distribution infrastructure. Overall, the Energy Sector needs an investment of Rs.480,000 – Rs.600,000 crore (US $120 – 150 million) in the next five years with a significant private sector participation. The thrust on the telecom sector has given a boost to steel as well as zinc. The cell phone/handset has been growing at a phenomenal growth, 63 million subscribers in 2006, 90 million in 2007 and 105 million in 2008, with the total cell phone subscriber base being 650 million by 2010; this outlet has opened up a huge market for cell phone signal towers. At present there are about 300,000 – 330,000 towers; the country has to put 90000 towers every year so as to service the subscriber base. At the moment the tele-density in India is 55% only and it clearly points out the huge market potential for telecom towers. The thrust in the telecom and power sectors has given a push to galvanized cable trays too. The National Highways Development Project (NHDP) is one of India’s prestigious and priority projects. The galvanized guardrails/crash barriers are being used extensively in the highways sector along with galvanized lighting columns; the traffic sign posts also need to be galvanized so as to derive cost advantages. It is proposed to invest $50 billion in this sector, by which 67000 kms network will be upgraded to expressways/six or four lane highways in public-private partnership mode.
The street lamp poles in the country should also be galvanized instead of painting as is being done now. High mast lighting columns, imported earlier, are always galvanized in India now as a general practice. India’s construction segment is growing at a rate of 10% because of the extensive infrastructural projects, housing, industrial construction etc. RCC structures in coastal and corrosion – prone areas as well as petrochemical complexes, immersed columns etc., should start using galvanized steel reinforcements so as to avoid cracking/spalling of concrete due to corrosion of black rebars. This stipulation is already included in the relevant national standard specification document. Die Casting: The die casting process is said to be the “shortest route from molten metal to the finished product”. Die casting is one of the most efficient and versatile production methods which can be used for the manufacture of accurate and complex metal components. Zinc die casting alloys, well known as Mazak or Zamak alloys, show a unique combination of properties which permit rapid, economic casting of strong, durable, accurate parts. The zinc alloys are more easily cast, stronger and more ductile, require less finishing, can be held to closer tolerances and cast in thinner sections. Because of the low casting temperature, the die life for zinc die castings far exceeds the life in other die casting metals, the production rate (shots per hour) is also much higher. Dry Cell Batteries: Dry cell batteries are the most common and affordable energy source for torches, remote controls, toys, calculators, wall clocks, emergency lights etc., This sector is again a growing market, linked to the population growth and the changing life styles, electronics growth etc., Zinc Oxide: Zinc oxide has such an array of properties that it continues to increase its usefulness in our daily life. Zinc oxide is a white pigment with high opacity to ultraviolet rays. Insoluble in water, solvents, and neutral oils, it possesses high brightness, fine particle size, and relatively high refractive index. In paints, rubber, plastics and other organic compositions, it imparts whiteness. Also, when such compositions are exposed to exterior service conditions, zinc oxide, by absorption of ultraviolet rays, effectively protects the organic binders from the destructive rays of the sun. The thermal properties of zinc oxide are useful in several product categories, including rubber, ceramics, and electronics. As a reinforcement agent in selected rubber compounds for rapid-flexing service, zinc oxide improves durability through maintenance of lower operating temperatures because of lower heat generation and lower heat buildup. In ceramics, zinc oxide is useful as a flux in low-melting glasses and as a component of low coefficient of thermal expansion in thermal-shock-resistant glasses. In electronics, the vaporization of zinc oxide at elevated temperatures contributes significantly to the development of semiconductor properties. The many electronic properties of zinc oxide are utilized in such diverse applications as: Magnetic ferrites, Phosphors, Photochemicals, Piezoelectric materials, Semiconductors and Varistors. The zinc demand in India, assuming growth rates of 8%, 9% and 10% up to 2024-25 are indicated below:
3.3 LEAD Lead Concentrates: Hindustan Zinc Ltd (HZL) is the only primary lead producer in India. HZL’s Lead concentrates production during the 11th Five Year Plan and estimates for 12th Five Year Plan are as follows: Year MIC (tonnes) 11th Plan 2007-08 77724 2008-09 83802 2009-10 85848 2010-11 87928 2011-12 (E) 120000
12th Plan 2012-13 160000 2013-14 160000 2014-15 160000 2015-16 160000 2016-17 160000 Capacity: Primary Lead Capacity at HZL is as follows: Smelter location Capacity (tonnes) Chanderiya (Pyro) 35000 tpa Chanderiya (Ausmelt) 50000 tpa Total 85000 Lead Production: HZL’s Primary Lead Production during the 11th Five Year Plan was as follows:
Year Quantity (tonnes) 2007-08 58247 2008-09 60323 2009-10 64319 2010-11 57294 2011-12 (E) 140700 During the 12th Five Year Plan, HZL’s estimated Primary Lead Production would be: Year Quantity (tonnes)
Lead Imports: During the 11th Five Year Plan the Lead Imports were as follows:
Year Quantity (tonnes) 2007-08 72000 2008-09 103000 2009-10 110000 2010-11 85000 2011-12 (E) 50000 Based on the above and the increasing domestic production of primary lead as well as secondary lead; it is reasonable to assume lead imports of 50000 tonnes per year during the 12th Five Year Plan. Lead Exports: During the 11th Five Year Plan, the Lead exports were on the following lines: Year Quantity 2007-08 7000 2008-09 7000 2009-10 27000 2010-11 20000 2011-12 (E) 20000 It is reasonable to assume a level of 20000 tonnes of Lead exports per year during the 12th Five Year Plan, based on the recent trends. Secondary Lead: Estimated Production of Secondary Lead by the organized sector during the 11th Five Year Plan was as follows: Year Quantity (E) (Unit tonnes) 2007-08 152000 2008-09 144000 2009-10 166000 2010-11 200,000 2011-12 (E) 220,000 Production of Secondary Lead from the unorganized sector is not available, as they are small and widely scattered in the country. The MoEF, CPCB as well as SPCBs have been taking measures to make the unorganized recycling units adopt clean, eco–friendly processes and practices. Based on the recent growth trends and the increasing volumes of used lead batteries, it is reasonable to assume 250000 tonnes of Secondary Lead (organized sector) during 2012-13 and gradually going up to 350000 tonnes by 2016-17, terminal year of 12th Five Year Plan. Primary Lead Demand Supply: During the 11th Five Year Plan, the Lead Demand and Primary Lead Supply were as follows (tonnes): Year Lead Primary Lead Demand Supply
The Lead Demand and Primary Lead Supply during the 12th Five Year Plan would be (tonnes): Year Lead Primary Lead Demand Supply 2012-13 433000 185000 2013-14 464000 185000 2014-15 496000 185000 2015-16 531000 185000 2016-17 568000 185000 Lead Markets: Lead, an ancient metal has many usages: lead batteries, alloys, chemicals, radiation shielding, wheel balancing, sheets, pipes etc. Lead was used extensively in cable sheathing which has been replaced by polyethylene over a period of time. Lead has certain inherent hazardous characteristics. Therefore, lead has been replaced in paints, solders, gasoline additives etc. Lead free petrol, lead free solders, lead free paints are commonly available now. However, one usage sector which has come to stay is the lead batteries and it continues to grow steadily. Lead batteries are the most economical source of instant energy for a wide variety of applications. The sectoral uses of lead are as follows: Batteries 75% Alloys, chemicals 20% Cables, others 5% Batteries: Lead is commonly alloyed with other elements so as to improve its physical, mechanical or electrochemical properties. Commercial lead alloys contain one or more of the following elements: Antimony, Calcium, Tin, Silver, Bismuth etc., as key alloying additions. Antimony addition imparts hardness to the alloy; the lead antimony alloys have also been known as hard lead and widely used in conventional lead acid batteries for the transport sector. Lead calcium alloys are used in the manufacture of “maintenance free” batteries also known as VRLA (Valve Regulated Lead Acid) batteries. Calcium addition enhances the performance and life of the batteries. VRLA batteries are preferred in critical applications like telecom, railways, power etc., because of the inherent advantages. Lead alloys are used mainly in manufacture of lead batteries. Lead batteries have been used traditionally in the automotive sector only. The spectacular growth of the Indian automotive sector since liberalization is too well known; the Auto Mission Plan (AMP 2016) envisages reaching a level of US $ 145 billion by 2016 (as against US $ 34 billion in 2006). India is to emerge as the destination of choice in the world for design and manufacture of automobiles by 2016 particularly small cars; hence the immense prospects for lead batteries. Indian Automobile Industry ((April – Jan 2011)
Unit tonnes)
Production Sales Exports Passenger Vehicles 2394571 2039032 358583 Commercial Vehicles 603089 534622 61393 Three Wheelers 653973 430793 224498 Two Wheelers 10991025 9671800 1292696 Total
14642658
12676247
1937170
With the advent of computers, lead batteries find a wider usage in the UPS (Uninterrupted Power Supply) systems. With the huge demand – supply gaps in the power scenario, power cuts are very common and lead batteries are a source of stored energy through inverters. At present all the above three sectors namely automotive, UPS and inverter segments are witnessing double digit growths and hence the increased usage of lead batteries. Electric cars and electric scooters, using lead batteries are becoming more common as they are environmentally clean, noise free and ideal for short distance movements. Lead Oxides: They are mainly used in the manufacture of lead as well as VRLA batteries. They are also used as a coating on the screens of TVs, laptops, desktops etc. These chemicals also find application in glasses, ceramics etc. Radiation Shielding: Lead is a heavy metal with the highest density and therefore Lead bricks are used as a radiation shielding in X-ray rooms, nuclear reactors, etc. Chemical Lining: Lead is also used as a lining on the chemical vessels, due to its high corrosion resistance. Lead pipes are used for transporting acids, chemicals, etc. Lead– Long Term Growth The demand growth in Lead upto 2024-25, assuming growth of 8%, 9%, 10% are indicated below:
Primary cadmium metal production originates predominantly from Asia (China, Japan and Korea) and the Americas (Canada and Mexico). The worldwide cadmium metal production appears to have settled into a pattern of approximately 66% being produced in Asia, about 21 % in Americas, 11% in Europe and 2% in Australia.
Table I. Geographical Trends in Primary Cadmium Metal Production Percent of Total World Primary Cadmium Metal Production
Country 2004 2005 2006 2007 2008 2009 Belgium 4739 4739 4739 4740 4740 4700 Brazil 276 276 276 275 285 275 China 5407 5407 5407 5400 5400 5447 Germany 675 655 646 646 646 646 France 268 268 268 268 268 268 India 446 446 480 506 526 580 Japan 2777 1977 2529 2500 2433 2390 UK 592 598 598 590 592 590 United States 568 568 568 585 550 228 Others 1207 1047 1137 520 540 640 Total 16955 15975 16621 16030 15980 15760
Production:
There are only two primary producers with larger contribution by HZL. Binani Zinc produces 45-50 MT annually. HZL’s Cadmium production is as follows: Year Quantity (T) 2007-08 537 2008-09 470 2009-10 487 2010-11 493 2011-12 (E) 469 Consumption: In India demand of cadmium is on an average of 800 mt per annum; since the market is highly fragmented and unorganized, the demand is dominated by traders’ purchase and it is influenced by the price trend and through unorganized route, so actual consumption number is difficult to predict. The nature of usage pattern in India also makes it difficult to track actual numbers as major consumption is in Silverware and that is very unorganized market where numbers are not reported. Cadmium is generally used in the following sectors in India: Batteries: 4% Pigments 9% Electroplating: 4% Alloying & Soldering: 11% Silverware: 70% Misc: 2% Future Outlook for world market: Primary cadmium supply is still decreasing, but secondary cadmium supply is increasing to fill in the gap between supply and demand. Excess cadmium stocks appear to be in markets and need time to get depleted. Cadmium prices are once again reaching for the historical average prices of $2 per pound (not corrected for inflation) over the past 50 years and are continuing to climb. Cadmium applications are increasingly dominated by the nickel-cadmium battery. A modest but steady use continues in cadmium pigments and coatings for certain critical applications where viable substitutes have not been established. Cadmium stabilizers and the cadmium-containing brazing and soldering alloys are being replaced and eventually will disappear, but a small usage will probably continue for cadmium-containing specialty alloys and cadmium-based electronic compounds in solar cells and other electronic applications. The continued strength of the NiCd battery market has resulted from the strength of Chinese NiCd battery production which is due to their advantageous labour, production, overhead and profit costs. The impressive fact is that this increased Chinese production has not resulted in a significant decrease in Japanese NiCd production and must partially be considered new consumption, both for the growing domestic Chinese market and for their export market. However, these positive factors for the NiCd battery and cadmium markets must be tempered with the concerns over the human health and environmental issues surrounding cadmium, and
the steps that the Environment Directorate of the European Commission, along with certain Nordic countries, have taken to restrict the use of cadmium-containing products. Cadmium will continue to be produced as a by-product as long as zinc, lead and copper are produced. The real questions are whether primary producers will largely elect to curtail cadmium production as many have in the last three years because of environmental regulations and poor economics and disposal of cadmium as hazardous waste, or whether cadmium will continue to be refined and utilized as a valuable by-product and then recycled so as to minimize any impact on human health or environment. In India, there is no NiCd battery industry so the demand growth will be dependent on usage in Silver industry. Silver: Among the two players, only HZL produces Silver in the country. HZL’s Silver production is as follows: Year Quantity (kgs) 2007-08 80405 2008-09 105055 2009-10 138550 2010-11 148082 2011-12 (E) 366641 3. GENERAL Review of 11th Five Year Plan (Lead & Zinc) As India enters the 12th Five Year Plan period, it is interesting to look back and review the developments and trends during the 11th Five Year Plan:
1) The 11th Five Year Plan considered the demand-supply gaps in Zinc & Lead, for different financial years. However, it is impressive that, besides meeting the domestic demand, India could export substantial quantities of zinc during the 11th Five Year Plan.
2) Also, during the above period i.e., 11th Five Year Plan, the domestic players of zinc
also started manufacturing value-added products such as Continuous Galvanizing Alloy, Zamak Alloys for die casting, which is another positive development.
3) During the 11th Five Year Plan, a number of secondary zinc manufacturers, based on the electrolytic route, closed their operations due to the increasing power tariff. The secondary industry largely manufactures Zinc chloride, Zinc sulphate and Zinc oxide from Zinc ash, Zinc dross etc.
4) Due to the various policy initiatives taken by the Ministry of Environment & Forests, Central Pollution Control Board, there was a substantial improvement in eco-friendly
lead-zinc recycling sectors, though there is still room for maximizing the improvements. However, towards the end of 2010, the Central Government has shifted the Registration Scheme for Recycling/Reprocessing of Hazardous Wastes to the State Pollution Control Boards/Committees. It is hoped that the state regulatory bodies will monitor the recycling sectors effectively and apply stringent rules and norms for introducing cleaner operations across the country.
5) By and large, during the 11th Five Year Plan, the primary producers, recyclers, downstream units, etc. have adopted energy-efficient as well as eco-friendly operations and thereby become cost-competitive in order to survive and grow. It is a question of time before the remaining units in the SME sector also adopt these improvements in the coming years.
Recommendations/Suggestions
1. While India’s total identified zinc resources are 37 million tonnes of contained zinc metal, only 1/3rd constitutes the reserves. Country’s primary lead reserves, intimately associated with zinc, are also limited. Therefore, there is an acute need to take steps which can enhance the zinc reserve in the country.
a. Nearly 50% of the estimated all India resource is low grade (<5% grade) and currently not being mined. Mining of such deposits needs to be promoted. To make these specific deposits (low grade/marginal/sub‐marginal) as economically viable mining projects, special relaxation in royalty and taxation need to be considered. This will not only help in conserving the mineral resources but will also provide new employment opportunities.
b. Many of the reported base metal mineral deposits/occurrences are located in forest areas. Strategy needs to be evolved at the Central Govt. level so that resource augmentation and feasibility for potential mining of these deposits could be assessed. This will require exploratory drilling in forest areas. Hence, procedure should be simplified to grant permission for undertaking drilling exploration in forest areas during RP/PL tenure. This will establish the economic matrix so that these deposits do not remain in shelves.
2. India has a favourable geology for base‐metal mineralization and dedicated exploration approach could bring many more deposits on the mineral map of India. The future deposits are considered to be concealed and therefore, right exploration tools and technology will be required to locate them.
a. In order to promote mining‐exploration industry, it is necessary that the exploration related tools/equipment/technology is available in a cost effective manner. It is suggested that import duties (currently ~ 28%) on drilling items like rigs, bits, accessories and drilling fluids be brought at par in line with the CBM exploration which is duty free.
b. Duty structure also needs to be favourable for procurement of geophysical/geochemical surveying instruments so that exploring agencies can undertake extensive coverage at low cost.
c. Simplification for Aerial/Heliborne Survey Procedures: While RP is granted for 3 years, an applicant puts significant amount of time (8‐12+ months) merely in getting aerial survey permissions which involves obtaining ‘No Objection Certificates’ at
various levels, Security Clearances from different Government departments such as DGCA, MoD, GSI, DAE, state DMG, Telecommunications departments, Electricity Boards, Local Districts, Authorities etc. The role of MoD and DGCA need more clarity in terms of timely disposal. As per the data security norms of aerial survey, the acquired data is submitted back to MoD for security vetting (while the survey is carried out under the strict supervision of State officials) and there is no time limit when the data will be cleared by MoD. Upon receipt of cleared data the applicant then needs to undertake a vigorous interpretation work for target generation which may take a couple of months. Following drill target generation, a systematic detailed ground follow‐up involving drilling is required but by then the RP tenure is over and the applicant lands up without assessing RP’s real potential. In such cases, extension in RP tenure may be considered which will secure exploration interest of the RP holder.
3. Currently, Indian companies are investing heavily on exploration, expansion of smelter capacities, power etc. for enhancing Zinc and Lead production to meet the expanding domestic demand. Against this backdrop, while India enters into FTAs with several countries and regions, adequate care should be taken to maintain the current customs duty regime for zinc and lead so that our investments are not jeopardized, at this critical junction.
4. The raw materials used by primary smelters are zinc concentrate and lead concentrate. With rapid expansions of smelter capacities, imports of zinc concentrate and lead concentrate are inevitable as domestic production (current as well as estimated) will be insufficient to meet the requirements. A supportive tariff regime (nil duty) is required on raw materials namely zinc concentrate and lead concentrate to enable Indian zinc smelters and lead smelters to compete on a level playing field.
5. Imported Zinc concentrate also attracts other duties like CVD, Cess & SAD. These are by & large cenvat duties. However there is a strong case for removal of SAD on imported zinc concentrates
6. A considerable part of India’s requirement of Zinc die cast alloys & Lead alloys are fulfilled by imports. Measures should be taken to develop indigenous downstream producers of these alloys so that India becomes self sufficient in value added products of zinc & lead as well.
15 year Perspective Plan The long term future plan will depend on how quickly the new economic resources are located, especially during the next 5 years. It is expected that the ongoing exploration activities will result in new Greenfield projects. Completion of feasibility studies on marginal grade deposits should also establish their economic viability as new mining projects under the proposed recommendation. This will help to increase the zinc-lead reserves of India.
CHAPTER – IV
CEMENT AND LIMESTONE
1.0 Introduction
Limestone occupies the top position among non-fuel solid mineral deposits in the volume of
annual extraction. The mining of about 230 Mn.t limestone for cement industry is only next
to coal (537 Mn.t) during the year 2010 - 2011. Limestone is the primary and major
CHAPTER-III ALUMINIUM (Aluminium, Gallium, Vanadium and Silicon)
Introduction Aluminium is one of the most common and widely used metas and the metal's production outstrips that of all other non-ferrous metals. For a young metal that was produced for the first time in 1825, this is quite an achievement. It stands out, as the metal with the highest growth rate. Amongst metals, Aluminium ranks second, next only to steel, in terms of volumes used, due to its versatility, which stems from its excellent properties. It is exceptionally light, has high strength when alloyed, is impervious to rust & possesses a high degree of workability. It is also a good conductor of heat and electricity and has a soft luster, with an aesthetically pleasing appearance. Aluminium is highly recyclable and over 70% of the total metal produced till date, is still in use. The proportion of recycled metal in total aluminum produced is constantly increasing. ALUMINIUM: THE FASTEST GROWING INDUSTRIAL METAL IN THE WORLD
-
2.50
5.00
7.50
10.00
1960
1965
1970
1975
1980
1985
1990
1995
2000
2005
Tin Lead Crude Steel Zinc Nickel Copper Aluminium
WORLD ALUMINIUM - STRONGER GROWTH PROJECTED TILL 2015
3.0%
2.4%1.9%
2.1%1.8%
1.3% 1.2%
4.76%Alu
min
ium
Copper
Nic
kel
Zin
c
Cru
de
Stee
l
Lead
Tin
2005-
2015
Alu
min
ium
Dem
and
In view of the above vitures of Aluminium, there has been continous increase in production and consumption of Aluminium in the world. Indian integrated aluminium producers are looking to take advantage and benefit from this higher global demand and prices. Therefore the aluminium industry is emerging as a promising industrial sector in the World and in India. In the 12th Plan document for the period 2012-2017 which covers the aluminium sector in the order – aluminium (primary metal and downstream products), alumina (the intermediate product) and finally, bauxite (the mineral from which aluminium is extracted), the initial chapter reviews the performance of this sector during 11th plan vis-à-vis the projections made in the 11th Plan document. The World and Indian scenarios are then presented for this sector with present trend and future prospects and finally, the document evolves a prospective plan for a further period of 10 years. Bauxite is still the only ore used for commercial production of aluminium using the basic processes of Bayer Process for alumina refining and Hall-Heroult Process for aluminium smelting with improvements for better performance. In India, R&D efforts and technology improvement should continue to bring competitive advantage to the aluminium sector. There is also need to contemplate on the sustainable development, by taking appropriate measures to control environmental hazards. Despite the fact that aluminium production consumes significant amount of energy, during its life cycle it saves energy several times more than
consumed while production. Also in Recycling only 5 percent of the energy needed to extract metal and
perhaps this is greatest advantage, hence its paramount effect on reduction of gas emission besides fuel
savings in automobile application.
ALUMINIUM MASS FLOW
Review of 11th Plan and achievements Achievements during the 11th Plan period from 2006-07 to 2011-12 have been reviewed to evaluate the performance of aluminium sector. The downstream areas with many small units are mostly in the medium and small scale sectors. The correct assessment of this area has been difficult. The same is true also for secondary recycling. However, on the basis of available information, desired analysis for future forecast has been attempted. After slow growth for over a long period, there has been all round growth of aluminium sector. The per capita consumption which remained around 0.5 kg for over a decade is now approaching over 1.3 kg. With the continuing trend of economical growth, per capita income is likely to increase. As the economic conditions in the country keep substantially imporving and the income levels are raising, significant rise in demand and consumption of aluminium is expected. This will be due to higher consumption levels in packaging, building and structural, automotive and consumer durable sectors, besides normal consumption in electrical, transport and other industrial sectors. Taking into account the population growth and increase in Per-capita consumption , it is expected that the domestic consumption would be around 3.0 Million Tonnes around 2017 by the end of 12th Plan. This will exceed the planned growth of 9% projected by the Planning Commission. Various steps are to be taken for promotion of aluminium sector and facilitating its growth. Hence it is necessary to have yearly review of aluminium sector to assess the achievement and for taking appropriate remedial measures for solving the constraints faced.
23%
22%
8%5%4%
8%
3%
22%
5%
North America EU/EEA Japan CIS & Other Europe Latin America
SE Asia India China Others
14%
13%
4%
5%
5%
10%8%
35%
6%
a) Aluminium:-
The 11th Plan document had envisaged the following prospects for the aluminium production during the XIth plan period.
“3.3.2.2 Proposed Capacity expansion of aluminium smelter in 11th
Plan period are placed below :-
Company Planned for 10th Plan(2006-07) Likely to achieve (2011-12)
Nalco 345 460
Hindalco 356 356
Indal 100 100
Balco 250 400
2005
2030
Malco 025 025
Total 1076 1291
.
3.5.2.3 It is expected that per capita consumption would rise up to 0.8kg, 1 Kg and 1.1 Kg by end of 10th
,11th
and 12th
plan respectively. With optimistic assessment, the domestic consumption of 0.7 million tones of aluminium in 2001-02 would increase up to 0.92 million tones by 2006-07 and 1.28 million tones by 2011-12 and with 1.1 kg it may reach 1.5 million tones by 2016-17 i.e by the end of 12
th Plan. However, realistic figures with slow growth would be respectively 0.8 million tones, 1.5 million tones and 1.35
million tones. This matches to the domestic demand after sectoral uses of semifabs and proposed growth rate of 5-8%. The export and import from present level of 15,000 tonnes to 200-300 thousand tones by 2006-07 may reach 2006-07 and may reach 4,00,000 tonnes in another 5 years time. Aluminium metal forecast is placed below:-
2001-02 2006-07 2011-12 2016-17
Capacity 697 1076 1291 1291
Production 660 950 1250 1280
Consumption 700 920 1280 1500
Likely range of demand
(800-1024) 1150-1350 (1370-1600)
Export 150 200 300 400
Import 150 120 270 300+250*
Secondary Metal (Domestic)
40 50 60 70
For meeting the shortfall and reducing the import, there should be additional capcity of 400,000 tonnes by 2011-12. To meet the requirement of the 12
th Plan period, necessary steps have to be initiated in XI plan period.
3.5.2.4 To meet these projected demand of 11th
and 12th
Plan, there are already proposals for green field investments as well as brownfield expansions from both the present Indian companies as well as International Compnaies such as Alcan, Dubai Aluminium and Russian Aluminium Company in Joint Venture capital investments. Some new projects under proposals are given below :-.
Company Location State Capacity (lakh tpa) Investment Latest Development Alumina Aluminium
Raykal (L&T/Dubal)
Rayagada Orissa 30 15000 Jt Venture formed in 2005
Hindalco (Aditya Aluminium)
Sambalpur Orissa 2.60 110000 MOU signed in Apr 2005
Hindalco (Aditya Aluminium)
Rayagada Orissa 10.00 8000 Land identifaction complete
Hindalco Latehar Jahrkhand 3.25 7800 MoU signed in March 2005
Vedanta Alumina
Jharsuguda Orissa 5.00 7000 Board approval received in Dec 2005
JSW Aluminium
Vizag AP 15.00 2.50 6750 Proposal stage.
Utkal Aluminium
Jharsuguda Orissa 15.00 4796 Revived in 2005
Russian Aluminium
Orissa 10.00 4300 Proposal stage.
Vedanta Alumina
Lanjigarh Orissa 14.00 4000 Completion by March 2007
Balco Korba Chhatishgarh 2.50 4000 Completion by March 2006
Nalco Angul Orissa 5.25 1.15 4000 Under Active implementation
Hindalco Hirakud Orissa 0.81 1038 Civil work in progress.
Hindalco Belgaon Karnataka 3.00 843 Environmental clearance received
Hindalco Muri Jharkhand 3.40 796 All clearances in place.
3.5.2.5 The shortfall in domestic production availability of primary metal needs attention to initiate steps immediately:- 1. Green field smelters of about 4,00,000 tpy capacity to be planned now for the future. 2. Secondary recycling should be promoted to contribute 30% of domestic metal requirements. 3. Import of scrap to be increased with low duty which in turn can be exported as value added item. This will increase both import and export simultaneously giving benefit in international trade. 4. Where power is cheap abroad, smelters can be established to produce metal at low cost. 5. tolling of low alumina and getting back metal after smelting metal abroad where power is cheaper can also be planned. “
Under this backdrop, the following achievements have been made during the XIth five year plan:-
As regards capacity addition, for meeting the requirements, the following achievements have been made during the 11th Plan.
Company Likely to achieve (2011-12)
Actual Achievement
Nalco 460 460
Hindalco, including Indal 456 500
Balco(*) 400 250
Malco(**) 025 Nil
Vedanta Aluminium Nil 500
Total 1291 1710 (*) - Balco has closed down the old 1,00,000 TPA Smelter due to uneconomic operations
(**) – MALCO has closed down the 25,000 TPA Smelter due to uneconomic operations.
As can be seen from the above, while NALCO has achieved the projected capacity of 460,000 TPA Smelter, the capacity of HINDALCO has increased due to proposed brownfield expansion of the Hirakud Smelter in Orissa. Both BALCO & MALCO belonging to the Vedanta group have closed down their old Smelters since 2009 due to uneconomic operations. However, a new green field Smelter of 500,000 TPA has come up at Jharsuguda by M/s Vedanta Aluminium which is in operation now giving boost to the aluminium production capacity from the envisaged level of 1291 TPA to 1710 TPA. The XI plan has envisaged additional capacity creation of 4,00,000 TPA to meet the projected demand by 2011-12 and it has been achieved by the aluminium sector.
Even today there is only one recycling unit of Hindalco in organized sector at Taloja with 25,000 tonnes capacity. As recommended, the import duty on scrap has been reduced to zero now encouraging import of aluminium scrap Although the plant at Taloja was suffering due to want of availability of scrap, the production from the unit has improved and the plant is now operating at 80% of the rated capacity as against 60% capacity at the beginning of the XI Plan. This efforts will go a long way in reduction of energy consumption to meet the need of the down stream industries which can get benefit out of secondary aluminium. With the reduction in import duty, the import of aluminium scrap and other alloys has increased from 4.43 lakh tones during 2006-07 to 5.65 lakh tones in 2008-09. Similarly, the export of aluminium and alloys including the scrap has registered a growth from the level of 2.73 lakh tones during 2006-07 to 4.29 lakh tones during 2008-09.
b) Alumina:
The XI Plan document has made the following forecast for alumina production during the 11th Plan.
“3.5.3.2 The Alumina Capacity additions during the 10th Plan period and proposed capacities for the 11
th Plan are placed below:-
Company/Plant Total Capacity Planned in 10th
Plan(Million Tonnes) Proposed for XI Plan
Planned Achieved in 2005
Nalco, Damanjodi 2.10 1.57 2.1
Hindalco Renukoot (UP) 0.66 1.20 (from the existing Plants)
0.66
Muri(Jharkhand) 0.50 0.50
Belgaon , Karnataka 0.65 0.65
Balco, Korba 0.25 0.20 0.20
Vedanta, Mettur, MALCO 0.075 0.07 0.07
4.24 3.04 4.24
Vedanta Aluminium, Lanjigarh
1.40
Total 5.64
The country is today producing surplus alumina which is being exported. This trend is likely to continue with the establishment of green field export oriented alumina refineries. As such the with the surplus availability of alumina, the aluminium smelters in the country would not suffer. The projected capacities of alumina domestic consumption by smelters and surplus availability for export are placed below:-
2001-02 2006-07 2011-12
Capacity 2.72 4.24 5.64
Alumina Production 2.4 4.0 4.50
Internal Consumption 1.3 1.90 2.50
Likely Export 1.1 2.10 2.00*
(*) EOU plans to likely add 2 million tones. Total export around 3.8 million tones during 2011-12 and to increase by another 2.0 million tones around 2016-17.
3.5.3.3 As India would not prefer export of bauxite, there can be plans for increase in alumina production to export more of alumina, speciality grade alumina nd hydrates as value added products. 3.5.3.4 India has certain advantages of being a low cost area for production of alumina as reviewed from performances of Nalco. With this advantage, steps should be taken for export oriented alumina plants. In case of delays competitors would take advantage and the export margin might be lost. Timing could thus be an important factor. 3.5.3.5 The constraints of red mud disposal would be the problem of future alumina plants. Utilisation of this waste has to be taken care through R&D Efforts. Caustic soda from domestic sources may pose problems. Efforts should be made for setting up plants
outside India where power is cheap for importing back the product to India. Long term contracts with caustic soda plants abroad need to be explored.
1.5.3.6 Port facilities and infrastructure could be other area, which need attention. Development in these areas would facilitate
growth of large scale export oriented alumina refineries.
Under this back drop, the performance of the alumina plants projected for the 11th Plan and the achievements are furnished below:-
(Million Tonnes)
Company/Plant Proposed for 11th Plan
Actual Capacities at the end of 11th Plan
Nalco - Damanjodi 2.1 2.1
Hindalco - Renukoot 0.66 0.70
- Muri 0.50 0.45
- Belgaum 0.65 0.35
Balco - Korba 0.20 Nil (*)
Malco (Vedanta) - Mettur 0.07 Nil(*)
Vedanta - Lanjigarh 1.40 1.0
Total 5.64 4.60
As can be seen from the above, there has been a shortfall of about 1.0 million tones of alumina production capacity as envisaged during 11th Plan. Nalco has achieved the projected capacities during the XI plan period. Hindalco‟s Renukot and Muri Plant has achieved the production capacities while the Belgaum plant has not been able to achieve the capacities. BALCO and MALCO has closed own their refineries due to uneconomic operations. The Vedanta Aluminium Lanjigarh has commissioned the Refinery in 2007, while the plant is not able to operate the full capacity due to delay in mining approval process of Lanjigarh bauxite mines leading to non availability of bauxite for production of alumina. No other EOUs as envisaged during the 11th Plan has yet come up.
c) Bauxite:
The following projections were made by the Planning Commission for the XI Plan for development of bauxite.
3.5.4.2 With another two green field export oriented units of one million tonnes each, bauxite production may reach 25 million tones by the end of the 11
th Plan. During the subsequent 5 years with the addition of two million tones alumina plant for export, the bauxite
mining capacity may reach 30 million tones. The resources of the country are adequate to meet the future requirements.
Period Projected Bauxite Production (Million Tonnes) 2001-02 0.8 2006-07 19.0 (6 Million tones for EOU) 2011-12 25.0(12 Million tones for EOU) 2016-17 30.0 (15 Million Tonnes for EOU)
Out of over 1.8 billion tones of metallurgical grade bauxite resources in the country, only 400 million tones have been operating leases and another 400 million tones are being planned for development of mines for green field plants. The balance resources can be planned for utilization
i) Small deposits with less than 50 million tones can be earmarked for brown field expansion of existing refineries. ii) Large deposits to be planned for future green field projects for which capacity of mine would be minimum 3.0 MTPY iii) The problem now faced by Hindalco, Balco and Indal in getting lease and operating new captive mines in Chhatishgarh,
Jharkhand, Karnataka and Maharastra need to be immediately resolved so that the brown field expansions of existing refineries during the 10
th plan don’t delayed.
iv) Nalco should have additional 100 million tones of resources to meet the future requirements of its proposed expansion of Damanjodi refinery to 2.1 million tones. Additional 100 Million tones would be requirement for future i.e new plant.
v) Shervoy Hill deposit in Tamilnadu to be totally left for development and expansion of Malco’s refinery. vi) The Gandhamardan bauxite deposit of Orissa having reserves of more than 200 million tones still remains virgin after Balco
with drew. It can be planned for development.
vii) In Gujurat and Chhatishgarh, where chemical and refractory grade bauxite are mined, inferior grade which can be used as metallurgical grade is considered as waste and is not utilized properly. Additional Gujurat also has sufficient resources of metallurgical grade for future use , if required.
Although the 11th Plan had foreseen establishment of two numbers of EOU alumina refineries there by increasing the bauxite production capacities to 25 million tonnes, no significant progress has been achieved in that direction so far. The projected bauxite production vis a vis the actual achievements during the 11th plan are furnished below
Year Projected Bauxite Production Actual Acheivement
2006-07(10th Plan) 19.0 15.73
2011-12(11th Plan) 25.0 15.50 (2008-09)
The shortfall in achievement of bauxite production was mainly due to failure of establishment of EOU units as envisaged and also delay inobtaining approvals for starting the Lanjigarh bauxite mines.
Except for Nalco, the other two primary producers namely Hindalco and Vedanta are facing acute shortage of raw materials for sustained running of their refineries. No significant action has been taken for earmarking the small bauxite deposits less than 50 million tones to meet the brownfield expansion of the existing alumina refineries significantly hampering the growth of the aluminium industry. As envisaged Nalco has been allocated the Pottangi Mines having a resource of about 80 million tones to meet the expanded capacity of the Damanjodi Refinery and also 80 million tones in Jarella in Andhra Pradesh for establishment of EOU Units. No efforts have been made for development of the Gandhamardan bauxite deposit as envisaged during the 11th Plan.
12th Plan Outlook for the Aluminium Sector 3.1 Aluminium 3.1.1 World Scenario
(bhp billiton-paper)
THE GLOBAL DEMAND FOR ALUMINIUM
Current (Red) and expected 2030 (Blue) consumption in kg per capita broken down
geographically
(Data: CRU)
There has been an annual increase of 3.3% in the consumption of primary aluminium on a global scale
during the period 1980 to 2006. It is expected that the annual increase in the period 2006 to 2030 will be
3.7%, and this clearly indicates that the global market will demand more aluminium for some time to
come especially in key applications where energy savings, pollution, CO2 reduction, lightweighting etc
are vital.
Highly developed countries such as the USA and Japan have a high level of consumption per inhabitant.
The figure for these two countries is around 20kg per capita and this has not changed very much during
recent years. However, a very different picture appears for developing countries. Those countries that
have commenced a process of industrialisation and are experiencing intensive development also have a
rapidly increasing consumption of aluminium per inhabitant, whilst those countries that have yet to
experience significant development still have a low consumption of aluminium.
WORLD CONSUMPTION GROWTH –
PRIMARY METAL
WORLD ALUMINIUM - STRONGER GROWTH
PROJECTED TILL 2015
3.0%
2.4%1.9%
2.1%1.8%
1.3% 1.2%
4.76%
Alum
iniu
m
Copp
er
Nic
kel
Zinc
Crud
eSt
eel
Lead Tin
2005
-201
5Al
umin
ium
Dem
and
India 0.50 0.64 26%
China 9.60 11.24 17%
Others 17.87 14.73 -18%
World 27.98 26.60 -5%
Countries/ RegionY-o-Y Growth%
Apr-Dec 2009
USA -28
Europe -26
Germany -27
Japan -20
Middle East -3
The world production capacity of primary aluminium has increased from 36.7 million tonnes in 2005 to 52.7 million tonnes in 2010. The production of primary metal during the same period has correspondingly increased from 32.0 million tonnes to 42.0 million tonnes registering a CAGR of about 5.6%. Region/country-wise data on production of aluminium (primary) for 2005-2010 is given in Annexure A1. The aluminium sector in global scenario has performed well. The major producing countries are China, Russia, Middle East and Canada followed by Australasia, USA and India. USA and Japan are the major importers of aluminium, because of high consumption whereas Russia, Australasia and Middle East are the major exporters of aluminium due to higher production. Consumption of metal during this period has increased from about 31.9 million tonnes to more than 41.1 million tonnes. The excess production of about 0.9 million tones in 2010 representing about 2.1% of world production has contributed to the increase in stock levels. The major countries producing secondary aluminium by recycling scrap are USA, Japan, and European countries. Region/country-wise data on Consumption of aluminium for the period 2005-2010 is given in Annexure A2. The annual average price of metal has varied between US$ 1900 / tonne in 2005 to US$ 2370/tonne in 2010. The historical annual price of aluminium ha sbeen depicted in Figure in Annexure A3 – which also gives alumina price as a % of aluminium price. It is expected that though the growth in aluminium sector has slowed down in USA and developed countries, it is likely to be steady in countries of Latin America, Africa and Asia. Particularly, developing countries will have higher growth rate. Afro-Asian countries including India are the potential consumers of aluminium in future. China has been steadily increasing its smelter capacity to avail this opportunity.
27
By 2030, Aluminium consumption growth will be By 2030, Aluminium consumption growth will be
driven by China & India.driven by China & India.2005 2030
Source: CRU June’07
World demand-31.9 Mn tonnes World demand-73.7 Mn tonnes
China
India
India
China
Aluminium demand in India to grow more than 5 fold by 2030
23%
22%
8%5%4%
8%
3%
22%
5%
North America EU/EEA Japan CIS & Other Europe Latin America
SE Asia India China Others
14%
13%
4%
5%
5%
10%8%
35%
6%
3.1.2 Indian Scenario Presently there are four primary aluminium producers in the country with 5 smelters. While Nalco, Balco, and Vedanta operate one smelter each, Hindalco has two smelters. Details of the aluminium smelters with their capacities are given below.
Company Location Present capacity Production 2010-11 NALCO Angul,Odisha 460000 443600 HINDALCO Renukot,UP, }
Hirakud, Odisha} 500000 543670 BALCO Korba, Chattisgarh 250000 253140 Vedanta Jharsaguda, Odisha 500000 385360 TOTAL 1710000 1625770 [Source: Industry sources]
The total production capacity in India has increased from 1.08 million tones in 2006-07 to 1.71 million tones in 2010-11. Brownfield expansion of Nalco‟s Angul smelter and Hindalco‟s Hirakud smelter and Greenfield project of Vedanta‟s Jharsaguda smelter contributed to this increase in capacity. The production capacity is proposed to be enhanced to 4.7 million tones by the end of 12th Plan as per Annexure A-9. However, considering the bottlenecks, the capacity is likely to be 4.3 million tones taking into account the latest progress of the projects. The production of primary aluminium in India was 1.63 million tonnes in 2010-11 whereas the consumption during 2010 was 1.59 million tonnes, representing a „Per Capita‟ consumption of about 1.3 kg which was in the range of 0.5 kg about a decade back. Domestic consumption of aluminium in India has grown at a CAGR of 15% in the last 5 years, almost double that of the World which is at 8.1%. This has been due to increase in sectoral consumption by automobiles, packaging, building and structural areas. The consumption can easily grow and is expected to increase fast with the market economy. Domestic aluminium industries and down stream sector has to rise to the occasion and remain competitive to imports. 3.1.3 Outlook and Actions Needed The existing major companies like Nalco and Hindalco with captive power plants are able to produce aluminium at a reasonably low cost and are able to export by remaining competitive. For this reason, these two industries and Balco have planned for brown field expansions enhancing the capacity of captive power plants. Vedanta Aluminium has also embarked upon a massive expansion of its smelter at Jharsuguda taking the capcity from 0.5 MTPA to 1.6 MTPA. These expansions would be able to meet the increasing domestic demands while continuing with exports. Today there is only one re-cycling unit of Hindalco in organised sector at Taloja with 25,000 tonnes capacity. Even the downstream industries can get benefited out of increased production of secondary aluminium. Secondary production with less energy consumption will be available at a reasonable low price to bring competitiveness to downstream sectors. However, sporadic spread of recycling units should not be allowed. Only those meeting the pollution norms, prescribed specific consumption of power and producing quality aluminium above certain percentage of purity will be allowed.
given below
The following steps are needed to be taken immediately:
Secondary recycling should be promoted to contribute 30% of domestic metal requirement.
Import of scrap to be increased which in turn can be exported as value added item. This will increase both import and export simultaneously giving benefit in international trade. However, duty on import on scrap may be maintained at the level of virgin metal as both can be used interchangeably and differential duty could harm the primary aluminium producers and excessive use of scrap could be at the cost of quality and international reputation.
Where power is cheap abroad, smelters can be established to produce metal at low cost
Tolling of low cost alumina and getting back metal after smelting abroad where power is cheaper, can also be planned.
For increasing the consumption to develop aluminium sector in the country, the steps required are:-
To make primary metal available for domestic consumption at a competitive cost for secondary producers.
The R & D efforts in the domestic companies both in house and jointly in collaboration with academic institutions or users of aluminium products to be strengthened if required through Government intervention or fiscal measures to boost the use of aluminium and scale down the cost.
The versatile properties of aluminium as a building/construction material need to be propagated for its extensive use.
The environmental advantages of aluminium being an endlessly recyclable material consuming far less energy and substituting wood in the CDM efforts of the country need to be widely publicized by the producers of aluminium products.
3.1.4 Recycle
Aluminium is highly recyclable and over 70% of the total metal produced till date, is still in use. The proportion of recycled metal in total aluminum produced is constantly increasing. Aluminium is endlessly recyclable, & it is estimated that by the end of this century, 90 % of the Aluminium required annually, will be from a recycled source - a truly environment friendly material. Aluminium is also considered to be a Green Metal, and the Aluminium Industry is the only industry in the world to claim to become green house gas (GHG) neutral, by the year 2020. Recyclability rates for the two biggest applications of Aluminium worldwide, namely Construction and Transportation, range from 60 to 90% in most countries. The proportion of recycled aluminium has been increasing over the years, as given in the graph below. It is expected that in the years to come, it will reach a figure of about 35-40% of total aluminium consumption.
3.2 Aluminium Downstream Products 3.2.1 World Scenario Per-capita consumption of aluminium has been, steadily increasing in developed countries with new application areas. The 2007 data for the Per Capita aluminium consumption has been presented below in the graph.
[Source: Aluminium Mission Plan 2010-2020, AAI]
In India, the „Per Capita‟ consumption has now reached a figure of around 1.3 kg which is much lower compared to other developing countries of Latin America, Asia and Africa. In USA and Japan, the consumption is very high compared to primary production. This results in increased imports and increasing trend in recycling for obtaining secondary metal. Production units of USA are being shifted to countries where power is cheaper. In many countries recycling provides more than 50% of metal required. In Asia, Japan and South Korea are net importers of primary metal and are exporting value added downstream products, semis and finished goods. China particularly is developing fast in both consumption and production of aluminium. The sector-wise consumption pattern for aluminium products in the World is given below. Sector % of consumption
Transportation 28
Construction 20
Packaging 18
Electrical 11
Consumer Durable 6
Machinery and equipment 9
Others 8
Total 100
3.2.2 Indian Scenario Aluminium, with its inherent advantages, has made its presence in almost all the sectors of material usage. The world consumes a majority of Aluminium in the Transport, Construction and Packaging sectors, as compared to India where the maximum consumption of Aluminium is in the Electrical sector. This is depicted in the figure given below.
Sector % of consumption
Transportation 15
Construction 13
Packaging 04
Electrical 48
Consumer Durable 7
Machinery and equipment 7
Others 6
Total 100
Future growth rate is likely to be high in transport, building and construction areas, while all other sectors would also simultaneously grow. With stress on infrastructure, power sector is also likely to grow. With the country experiencing high growth in urban housing –residential as well as commercial, and automobiles besides food processing / packaging industries, consumption of aluminium in these sectors is expected to grow very fast. The change in consumption pattern to accelerate growth is depicted in figure below:
25
Change in consumption pattern to accelerate Change in consumption pattern to accelerate
growthgrowth
_______________________Source: World - Barclays & AlcoaIndia – Company Data
India PictureIndia Picture WorldWorld
Electrical sector still the major aluminium consumer in India
Growth is expected to be higher in consumption of downstream products and semis, particularly for sheets, extrusions and castings. To meet this growth, primary producers and potential downstream producers together with new players are to consolidate, strengthen and expand their manufacturing process. R&D efforts to bring in new usages, exploration and collaboration with other industries where aluminium could substitute other materials, development of alloys to suit to requirement of different industries and sector, changing the design pattern without sacrificing rather improving the functionalities of different products in collaboration with National Institutes of Design etc.
The growth in consumption pattern will require additional downstream capabilities within the .country. India‟s aluminium consumption in downstream industries including recycled metal is only 1.315 MT compared to 47. 3 MT of world consumption. Given a large pool of lowest skilled employees and with demography in India‟s favour, there is scope for pushing down stream industry to international scale with patronage of primary producers and setting up of aluminium parks in the vicinity of maznufacturing facilities of primary producers.
India Total Consumption 1.315 mtWorld Total Consumption 47.3 mt
Includes Recycled metal
2006
58% of the World’s consumption is in Rolled Products/Extrusions
Downstream capability therefore necessary for a country to create/service demand
Extrusions
24%
Wir
e Ro
d 10
%
Castings
27%
Others 5%
Rolled
34%
Rolled
17%
Castings
27%
Wire Rod
42%Extrusions
14%
3.2.3 Prospects of Downstream Semi-Fab Sectors
Production capacity of aluminium semis in the country exists in two distinct sectors i.e. primary producers having semis and original secondary producers. Though the capacity, production, market details etc. are well documented by the former, these details are difficult to be confirmed and compiled for the latter. Aluminium Association of India has made an attempt to compile information on aluminium industries and has brought out a publication “National Directory of Aluminium Industries 2010” and perhaps a reference to this publication may give an overall view of the secondary sector. I) Conductors The present capacity of wire rod manufacturing facilities of the primary producers are given below.
Plant Location Capacity in TPA Production
HINDALCO(Renukoot) 40000 43946
BALCO 43200 23430
NALCO 100000 42559
HINDALCO(HIRAKUD) 10000 437
Total 193200 110372
A map showing the Aluminium Wire-rod Plants in India is given below:
At present, out of total installed capacity, only 60% i.e. around 320,000 tonnes capacity is operational. Further, these plants are being operated at low capacities. Total production today is around 150,000 tonnes. Out of this, about 100000 tonnes is produced from Primary aluminium. The existing capacity is adequate to meet the future demand. Only modernization to meet world standards, production of alloy conductors besides improvements in quality and productivity would be required. It is forecast that by 2017, the production from Primary aluminium would be around 200000 tonnes. The details are given in Annexure A12. II) Extrusions The current capacity of extrusion manufacturing facilities by the primary aluminium producers are furnished below:-
Plant location Production Capacity in tones
Production in MT
HINDALCO, Renukoot 13700 18302
BALCO, Korba 8000 0
INDAL, Kalwa 8000 7253
Total 29,700 25,555
A map showing the Aluminium Extrusion Plants in India is given below:
The current production from Primary aluminium is around 600000 tonnes. It is expected that by 2017, extrusions production from Primary aluminium will increase to 1700000 tonnes. Details are presented in Annexure A12. III) Flat Rolled products A map showing Aluminium FRP Plants in India is given below:
Capacity: Hindalco 175,000 tonnes Balco 40,000 tonnes Nalco 18,000 tonnes ------------ 233,000 tonnes Actual capacity including un-organized sector is likely to be around 400,000 tonnes. Production from Primary aluminium now is around 300,000 tonnes. It is likely to increase to about 650000 tonnes by the end of the 12th Plan period. The details are given in Annexure A12. IV) Foils A map showing the Aluminium Foil Plants in India is given below:
The demand is around 60,000 tonnes. More capacity would be required to meet the future domestic demand and for export as well. V) Castings Demand is for about 145,000 tonnes. No assessment for its sector is possible. This area needs proper assessment for future planning and increasing production and promoting exports. Automobiles and engineering industries with the likely growth in future would increase the demand. To meet this and organize export, R & D and technology development in a systematic manner is essential. This is much required currently on Indian Casting Industry, which has now become major outsourcing for overseas markets. Thus, besides growing domestic market, substantial export market has also been observed.
3.3. Alumina 3.3.1 World Scenario World alumina refining capacity has increased from 68.4 million tonnes in 2005 to about 105.9 million tonnes in 2010.The major capacity additions include expansion of Gove in Australia and Alunourte refinery in Brazil and Greenfield plant of Vedanta in India. The world production of alumina has increased from 61 million tonnes in 2005 to about 81.6 million tones in 2010. The Region-wise data on production of alumina for the period 2005-2010 is given in the Annexure A4. China is the main producer of alumina in the world (35.7%) followed by Australia (24.1%). About 18-20 million tonnes of alumina is traded annually in international market. The international giants like Alcoa, Rio Tinto Alcan, Rusal, BHP Billiton, Clarindon etc play a major role in alumina trade. In India NALCO, contributes 0.7 million tones to 1.0 million tones of alumina traded annually in the international market whereas HINDALCO has a small presence of about 0.2 million tones. The multinational companies have stake in both smelters and alumina plants and hence, the refineries are mostly captive for the smelters. As a result alumina is moved within the integrated company systems and only about 25%- 35% of merchandise is for third party market sale. Out of this major part is also traded with long term contracts (70-85%) and balance (15-30%) through spot contracts . The producers of alumina are interested in booking a higher quantity through long term contracts for regular evacuation and sustained production alumina being a hygroscopic material. Similarly, smelters also derisk themselves against fluctuations in supplies and prices by entering in to long term contracts.. Long term trading of alumina is done mostly based on LME prices. With the fluctuations in LME, the price of alumina varies. The details are given as a graph in Annexure A3. There has been latest developments not to link long term trading of alumina to LME price of aluminium but to base it on its fundamentals shifting to spot based alumina index pricing, Some analysts like Platts, Metal Bulletin etc are publishing alumina index pricing; but it is yet to be given acceptance due to dependability of these indexes which are not reliable, like purchaser and seller of alumina being not willing to pass on the correct information. It is expected that alumina demand will grow in tune with aluminium demand and the price is likely to remain range bound between 14-16% of LME aluminium prices. However, the difficulty in mining the bauxite, the increase in input costs like diesel, fuel oil, caustic soda and pressure from local governments to increase royalty may have cost push effect when the price of alumina may tend to be more than 16% of LME price. New refineries are likely to come up in Guinea, Cameroon, Brazil, China, India and Australia to meet the additional demand. 3.3.2 Indian Scenario The installed capacity of alumina refineries in India is given at Annexure A-10 which stands at 4.60 million tones with break up of NALCO 2.1 Mln, Vedanta 1 Mln, and HINDALCO 1.5 Mln. An increase in capacity have taken place by Brownfield expansions of refineries of NALCO, HINDALCO and a new refinery has been started by Vedanta. The production of alumina in 2010-11 in India is as follows. Company Alumina (million tonnes) HINDALCO 1.35 NALCO 1.55 Vedanta 0.70 Total 3.60
Mostly, the production of metallurgical alumina in India is for captive use. However, NALCO has been exporting 0.7 Mln tone to 1.0 Mln tone of alumina after meeting their captive requirement and eventually their surplus will increase to 1.2 Mln tones after increased production to 2.1 million tones. They are in the process of identifying Smelter Projects both in India and abroad to convert the surplus alumina to aluminium and subsequently to value added products. HINDALCO makes export of about 11-2 lakh MT . However, due to shortage of alumina for their smelters, Vedanta imported about 5 lakh tones of alumina.. China, Russia, and Iran were the countries to which export was made by Nalco and Hindalco after meeting their consumption in their respective smelters. Hindalco produces about 1.5 lakh tonnes of chemical grade special alumina and hydrate besides metallurgical grade of alumina. 3.3.5 Outlook and Actions Needed As per the industry sources, during the 12th Plan period, there are proposals for expansions to meet the demand of respective smelters and surplus for export by Nalco and HINDALCO and Vedanta Aluminium, as detailed at Annexure A-10. The country is today producing surplus alumina, which is being exported. This trend is likely to continue with the brownfield expansion of existing refineries and green field projects under consideration both within and outside India depending upon viability of projects taking into accountcost of power, the major component of cost in production of aluminium metal. As India would not prefer export of bauxite or alumina, there can be plan for increase in aluminium production, specialty grade alumina and hydrates as value added products.
The constraints of red mud disposal would be the problem of future alumina plants. Utilization of this waste has to be taken care through R&D efforts. Caustic soda, from domestic sources may pose problems. Efforts should be made for setting up plants outside India where power is cheap, for importing back the product to India. Long term contracts with caustic soda plants abroad also need to be explored.
Port facilities and infrastructure could be other areas, which need attention. development in these areas would facilitate the growth of large-scale export oriented alumina refineries.
3.4 Bauxite 3.4.1 World Scenario The total world bauxite resources (Measured, Indicated and Inferred) are estimated to be of the order of 55 to 75 billion tones while the reserves (Measured) are estimated to be at 28 billion tonnes. Except in Australia, the bauxite reserves are mostly available in countries with developing economy which account for nearly 70% of the total bauxite reserves. The estimated reserves of bauxite of the world of all categories are placed at 28 billion tonnes. Country-wise distribution of bauxite reserves are given in Annexures A5 World production of bauxite varied between 193 to 211 million tonnes between 2006-2010. Country-wise bauxite production is given in Annexure A6. Major producers are Australia, China, Brazil, India and Guinea, and Jamaica. Australia alone accounts for 33% of the world production. Besides aluminium, which consumes bulk of the bauxite production, chemical, refractory and cement industries together consume bauxite to the tune of 10 – 12% of total production
World trade in bauxite is less preferred compared to alumina. The developed countries having smelters prefer to import alumina instead of bauxite, to reduce freight costs. Major countries exporting bauxite are Guinea, Brazil, Australia, Jamaica, Indonesia, Guyana and Greece. Major countries importing bauxite are USA, Canada, Irish Republic, Germany, Japan, Italy, France, Spain etc. Now, more refineries are planned in these bauxite exporting countries, to produce & export alumina. 3.4.2 Indian Scenario The total resources of bauxite in India stand at 3290 Million tonnes out of which 900 million tones are of reserves category and balance 2390 million tones are of remaining resources. India occupies 6th place in the world with a share of 3.19% of world reserves. Odisha and Andhra Pradesh account for more than 90% of country‟s metallurgical grade resources. The balance is distributed in Gujurat, Chattisgarh, Madhya Pradesh and Jharkhand. The resources of metallurgical grade bauxite are quite adequate. The chemical and refractory grade bauxites are mostly located in Gujarat, Karnataka, Chattisgarh, Jharkhand and Maharashtra.
8
INDIA ADVANTAGE – BAUXITE
• Low mining cost (US$22/t)
• Low reactive silica leading to
low refining cost
_____________Source: AME
*
*Total in situ reserves estimated at 3,076 Mn MT
Proven & Probable Bauxite Reserve
(Mn MT)
Low Mining and Refining Cost
250
350
600
650
900
1400
2300
2500
2500
8600
8700
Russia
Venezuela
Suriname
Greece
Guyana
India
China
Brazil
Jamaica
Guinea
Australia
__________________Source: Brook Hunt
Source : INCAL 07 – Key Note Presentation by Mr. D. Bhattacharya – Hon.
President –AAI & M.D.-Hindalco Industries Ltd.
The state-wise distribution of bauxite resources are given in Annexure-A7 and depicted in the following figure.
Details of bauxite production/ consumption by the Primary producers are given in Annexure A8. The production of bauxite in India has increased from 15.73 million tonnes in 2006-07 to 22.62 MT during 2007-08 and subsequently reduced to 15.55 million tonnes in 2008-09. The production of bauxite in India in 2008-09 represents about 7.3% of world production placing India in 5th position in the world in bauxite production. The temporary increase in bauxite production during 2007-08 was due to increase in export of bauxite from Gujurat. The export of bauxite, a raw material base for production of aluminium should be discouraged as it can give substantial value addition while being used for production of alumina and aluminium. The bauxite production is likely to be 30 million tonnes out of which about 24 million tones will be by primary aluminium producers during the 12th Plan period . Though there are about 190 mines operating in the country, most of these are small, and manually operated in open cast method. 46 major deposits account for 88% of the country‟s production. The Panchpatmali
bauxite mine of NALCO in Odisha alone accounts for about 30% of the country‟s production. In bauxite production. Odisha ranks the top which is followed by Gujarat, Maharashtra and Chhattisgarh. Except for Nalco all the remaining companies are not having adequate bauxite reserves in their mining leases to meet the requirement of existing capacity of their alumina refineries. These companies are forced to purchase bauxite from domestic market from small mine owners of the locality. Grant of mining lease, environmental clearance, land acquisition, forest clearance, etc. have been the major constraints for development of new mines. A close look at the proposed alumina plants and the brownfield expansions of the existing refineries will show that the capacity of the alumina refineries at the end of the 12th Plan period will be 13.27 Million tonnes. The anticipated bauxite mining facilities at the end of the 12th Plan period including those planned till date including the projects in pipeline of the primary aluminium producers is expected to be 23.78 million tonnes This leaves a gap of about 17 million tonnes of bauxite production which needs to be planned to maintain the projected growth rate. Production of bauxite from captive sources by the primary aluminium producers is given at Annexure - A With the abundance of resources , Eastern Ghats region of Odisha and Andhra Pradesh would be the area of major bauxite mining activities in future. The large deposits of these areas are with reserves of more than 50 million tonnes can be reserved for the Greenfield alumina refineries. Additional bauxite resources are required for the brown field expansion of the existing alumina refineries. The constraints experienced in getting the mining leases need to be resolved expeditiously to promote the planned growth. 3.4.3 Outlook and Actions Needed
The country has abundant resources of Bauxite of metallurgical grade. Development of bauxite mining in future would depend upon growth of aluminium sector i.e. the capacity of alumina refining. With the brown field expansions already planned by the existing industries, the refining capacity at the end of 12th Plan would be 10.40 million tonnes. This should increase bauxite production to around 31 million tonnes by 2017. During the subsequent five years with addition of two million tons alumina plant for export, the bauxite mining capacity may reach to 45 million tons. The resources of the country are adequate to sustain the future requirements.
Out of over 3.3 billion tonnes of metallurgical grade bauxite resources in the country, only 400 million tonne have been under operating leases. The balance resources can be planned for utilisation.
Small deposits with less than 50 million tons can be earmarked for brown field expansions of existing refineries.
Large deposits to be planned for future green field projects for which capacity of mine would be minimum 3.0 Million TPY.
The problem now faced by Hindalco, Vedanta in getting lease and operating new captive mines in Chattisgarh, Jharkhand, Karnataka Maharashtra and Odisha need to be immediately resolved so that the brown field expansions of existing refineries during the 12th Plan do not get delayed. Details of their requirements are placed in Annexure- XI.
In Gujarat and Chattisgharh, where chemical and refractory grade bauxites are mined, a little inferior grade which can be used as metallurgical grade is considered as waste and is not utilised properly. Additionally Gujarat also has sufficient resources of metallurgical grade for future use, if required.
Summary
With the continuing trend of economic growth, per capita income is likely to increase. At the higher level of income, rapid rise in demand and consumption of aluminium is expected. Higher consumption levels in packaging, building and structural, automotive and consumer durable sectors, besides normal consumption in electrical, transport and other industrial sectors will contribute to this. Taking into account the population growth and the „Per capita‟ consumption increase, it is expected that the domestic consumption would be around 3.0 Million Tonnes by the end of 12th Plan. This will exceed the planned growth of 9% projected by the Planning Commission. Various steps are to be taken for promotion of aluminium sector and facilitating its growth. Hence it is necessary to have yearly review of aluminium sector to assess the achievement and for taking remedial measures for solving the constraints faced.
While Greenfield projects for bauxite and alumina refinery have been getting delayed, the domestic aluminium sector has gone ahead with brown field expansion of bauxite mines and alumina plants matching the requirement of brown field expansion of smelters. Adequate success has been achieved in this regard. New alumina refinery plants are likely to come up by prospective companies such as Utkal Alumina, Anrak Aluminium etc. The brown field projects are reported to give competitive advantage to Indian exports with low cost in production of both alumina and metal. The brown field expansion and new green field capacity additions are primarily related to three major players i.e. Nalco, Hindalco and Vedanta group having control over Balco Smelter. The details of the Primary producers with respect to their present capacity and future additions on Aluminium and Alumina are given in Annexure A9 and A10. The present capacity utilization is about 95% for Primary Aluminium and 79% for Alumina. One of the main reasons for the shortfall in alumina production is the non-availability of sufficient quantity of bauxite to the alumina refineries. At the same time, some quantity of bauxite is being exported from the country. The import-export data for India is given in Annexure A11. It is projected that aluminium production capacity in India at the end of the 12th Plan period would be about 4.7 Million Tonnes. This would require about 9.2 Million Tonnes of alumina. So, if all the announced alumina capacity additions fructify, India would be surplus in alumina and would be a significant player in alumina trade. To produce 13.3 Million Tonnes of alumina at the end of the 12th Plan period, the bauxite requirement would be about 40 Million Tonnes. All efforts should be directed towards ensuring bauxite availability to the alumina refineries. 3.6 Research & Development and Other Areas 3.6.1 R& D activities R& D Activities are felt necessary in the following major thrust areas: Red mud is a major waste material generated out of the alumina refining process. As of now, there is no alternative to this process and hence, the generation of this waste material. Efforts are required to improve the process such that there is a substantial reduction in the quantity of red mud generated. Red mud contains a number of valuables like Titanium etc. Serious R&D efforts are to be initiated to economically recover these valuable materials from red mud. Usage of red mud for various applications like Portland cement, builing and construction materials etc would help in minimizing the storage requirement of this water material. The quality of bauxite has been depleting in various mines with respect to alumina and silica contents. Economic use of the low quality bauxite for alumina production should be a thrust area for research. India is importing a huge quantity of aluminium products mainly for defense applications, mainly due to non-availability of suitable alloys within the country. So, development of alloys and its commercial production could be one of the thrust areas. 3.6.2 Infrastructure
Bauxite mining areas are mostly located in underdeveloped regions of the country.
• The Greenfield alumina plants and mining would require infrastructure development of road and rail
systems.
• Railway have to gear up for required wagons and power for rail movement of raw materials and finish
products
• The bauxite mining belts of chattisgarh and Jharkhand also need improvements for the brownfield
expansions of existing plants.
• Port facilities in the eastern region ie., Orissa and Andhra Pradesh need immediate attention to improve
bulk handling and inland traffic. New ports like Gopalpur and Machlipatnam require to be developed.
• For steady power supply the grid system has to be strengthened.
3.6.3 Manpower The country has adequate technical, skilled and unskilled manpower. It would not be a constraint for growth. Rather the planned growth would offer opportunities for employment. Better work culture would help the industries to grow. 3.6.4 Constraints / thrust areas 1 The availability of bauxite and development of mine. 2 Availability of power 3 Railways including wagons and locomotives. 4 Port facilities 5 Forest and environment clearances. 6 Research and Development focusing on process improvement, newer applications through strategic planning of long-term goals involving technical solutions. Industry academia interactions to be strengthened. Technology Road Map for Indian Aluminium Industries is evolved to outline these agendas.
38
Brighter ideas with Aluminium
ANNEXURES
A1. Primary Aluminium Production – World Scenario
2005 2006 2007 2008 2009 2010
Thousand Tonnes
North America Of which USA Of which Canada Europe Of which Russia/CIS Of which Western Europe Asia Of which China Of which Middle East Of which India Africa Australasia Central & South America
World Production 31979 33785 38112 39909 37668 41988
World Capacity 36682 38467 41416 45298 48618 52715
[Source:CRU Monitor Aluminium Jan 2007, Mar 2009, Jan 2011] A2. Pirmary Aluminium Demand – World Scenario
2005 2006 2007 2008 2009 2010
Thousand Tonnes
North America Of which USA Europe Of which Germany Asia Of which China Of which Middle East Of which Japan Of which other Asia Of which India Africa Australasia Central & South America Of which Brazil
A9: Present Aluminium Capacity, Production during Last 5 Years, Plans for Expansion and Expected Capacity at the end of 12th Plan Period – Company-wise (All Figs in Thousand Tonnes)
TOTAL 1710 1142.74 1234.79 1346.74 1513.86 1625.77 2997 4695
A10: Present Alumina Capacity, Production during Last 5 Years, Plans for Expansion and Expected Capacity at the end of 12th Plan Period – Company-wise (All Figs in Thousand Tonnes)
constituent for the manufacture of cement. 1 tonne of clinker, which is the intermediate
product for making cement, requires about 1.5 tonnes of cement grade limestone for its
manufacture. In fact the location of a Greenfield cement plant is dictated by the availability
of requisite quality and quantity of limestone, besides the market.
Cement continues to be the major building material the world over for civil as well as
industrial constructions, as no other material has substituted it so far nor is likely to replace it
in the near future. Indian cement industry has been serving the nation’s construction industry
since 1914 and has now achieved a remarkable status with total installed capacity of about
313 million tonnes as on 31 March 2011 and Cement Production of 231 million tonnes which
is second largest in the world, being next to China. Cement is perhaps the only industry
where liberalization was put into concrete practice, even before the open market policy was
adopted as a policy. From controls to partial control in 1982 and to total decontrol in 1989,
the cement industry has passed through all the phases and today its track record both in
capacity creation and utilization is quite remarkable. It is one of the few industries which can
turn out a product conforming to international standards on its own.
2.0 World Scenario
India is only next to the largest producer of cement in the world, namely China. During the
last one decade cement production in the world has gone up by more than 75%. The
consumption level of cement in the Asian countries continues to increase rapidly. In view of
the growth of economies in the Asian region, the consumption is projected to rise further by
about 5% per annum in the next 10 years. The world cement production for the year 2010 is
given in Table 1.
The per capita consumption of cement is considered as an important index of the country’s
economic growth. Paradoxically, per capita cement consumption in India is still one of the
lowest among major cement producing countries (Table-1). Obviously it cannot remain
the same in the face of escalating growth of infrastructure development. The industry which
is growing at the present CAGR of + 7% has to gain further momentum to meet the demand
and aspirations of the growing population. Growth of cement industry is bound to spur a
proportionate demand on limestone availability. Therefore, limestone security is vital for
sustainable growth of the cement industry. This postulate is also borne out from a review of
the growth pattern of the industry and cement consumption during the previous Plan period
which will define the future limestone demand to meet the growth of cement industry. Table 1: World Cement Production 2010
Country Cement % of Total Per Capita Cement
Production(Mn.t) Consumption(kg)
China 1800 54.41 1218.4 India 220 USA 63.5 1.9 229.7 Japan 56 1.7 347.4 Turkey 60 1.8 567.0 Brazil 59 1.8 273.7 Korea 46 1.4 994.3 Russia 49 1.5 310.3 Other countries 946.5 28.7 World 3300 100 447.4 Source: Cembureau and CMA data(USGS data)
3.0 National Scenario
3.1 Review of the Status of Cement industry during XI Five Year Plan
The working Group on Cement Industry for XI Five Year Plan: 2007 – 12, set a production
target of 242.16 Mn.t for the year 2010 – 11 and 268.61 Mn.t by the end of XI Plan. The
industry achieved 231 Mn.t(including exports) by 2010-11 but is likely to fall short of the
production target set by the Working Group by the end of XI Five Year Plan. About 5 Mn.t of
cement and clinker were exported during the year 2010-11, as against the target of 10.5 Mn.t
set by the Working Group for XI Five Year Plan. Table-2 provides a quick comparison of the
overall performance of the Cement industry with respect to the XI Plan projected figures.
Table 2: Performance of Cement Industry during XI Plan (Mn.t.)
* ‐ Report of the Working group on Cement Industry for the XI Five Year Plan (2007 ‐2012). ** ‐ CMA ‘Basic Data’ and data from other industries. + ‐ Projected.
3.2 Cement Production
Cement production during the XI Plan has recorded a growth of nearly 10.56% (CAGR).
The production target is likely to fall short by about 22 Mn.t by the end of XI Plan. However,
when compared with the low demand scenario, the actual production is likely to cross the
targets. Since production always depends on demand, the data reveals that the demand for
cement has been satisfied during all the years of XI Plan.
With the average capacity utilization for large plants decreasing from 94% in 2007-08 to
around 75% in 2010-11, the industry has been producing cement to meet the demand and will
continue to do so with requisite addition of capacities in each year.
3.3 Capacity Utilization
Capacity utilization for large plants during the 1st year was 94% and in 2nd year 88%,
subsequently decreased to 83% in the 3rd year and around 73% in the 4th year.
3.4 Exports
Indian cement industry has been exporting cement, the final product and also clinker, which
is an intermediate product, to countries across the globe for the last one and a half decades.
However, during the XI Plan, the exports have gone down from 9.0 Mn.t in 2006-07 to 4.7
Mn.t in 2010-11 and export during 2011-12 is expected to be around 6 Mn.t. (Table 3)
Table 3: Export of Cement (Mn.t.)
Year Cement Export Clinker Export Total Export
2006‐07 5.89 3.11 9.00
2007‐08 3.65 2.37 6.02
2008‐09 3.20 2.89 6.09
2009‐10* 3.16 3.12 6.28
2010‐11* 2.00 3.00 5.00
2011‐12** 3.00 3.00 6.00
Source: CMA ‘Cement Statistics’ *includes estimated data from non‐CMA companies. **projected.
4.0 Cement Grade Limestone Resources/Reserves in India
4.1 Background
The growth of cement industry, primarily depends on the availability of cement grade
limestone, the chief raw material for cement manufacture. India is bestowed with huge
resources of limestone, geologically ranging from Archaean to Recent in the stratigraphic
sequence and geographically occurred in almost 23 states of India, though the distribution is
not uniform. The objective of National Inventory of Cement Grade Limestone is to plan the
strategy for the growth of cement industry by updating the availability of limestone resources
and to bring into focus the limiting factors affecting the availability of limestone. The
geological occurrence of limestone, the extension of deposits, qualitative and quantitative
assessment etc. are carried out through prospecting and exploration by various different
central and state government agencies such as Geological Survey of India (GSI), State
Directorate of Geology and Mining Departments, and Private Companies proposing for
cement and other limestone based industries.
National Council for Cement and Building Materials (NCB) and Indian Bureau of Mines
(IBM), Government of India have been carrying out the compilation of the National
Inventory of Cement Grade Limestone. The limestone resources are classified as per United
Nations Framework Classification (UNFC) system. As per IBM the total cement grade
limestone resources is 124,539.551 million tonnes, out of which the total cement grade
limestone reserves is 8948.926 million tonnes UNFC code (111), (121) and (122), and the
total remaining resources is 115,590.625 million tonnes.
The gross resources of cement grade limestone are not being fully utilized for cement making
due to various constraints such as inaccessibility of some deposits in hilly terrains,
environmental acts and regulations and technological constraints. This reduces the
availability of cement grade limestone for cement manufacture. To overcome the above,
utilization of low grade/marginal grade limestone could be further explored and relaxation in
environmental rules and regulations & CRZ limit may be considered. Emphasis is given to
explore cement grade limestone in already defined cement clusters to overcome the regional
imbalance and conservation of minerals.
4.2 Availability of Cement Grade Limestone
The total cement grade limestone resources of India, as compiled by IBM, is 124,
539.551 million tonnes as on 1st April 2010. The resources have been classified based on
UNFC system of classification. The total cement grade limestone reserves and the remaining
resources are 8948.926 million tonnes and 115,590.625 million tonnes respectively (Fig-1).
Fig 1: Status of Cement Grade Limestone Resources in India
There is a need to increase Limestone Reserves as compared to Total Limestone resources
through:
a) Regulatory relaxation on environmental and forest norms with stricter compliance
with Environmental Management Plan (EMP) in states such as HP and Meghalaya.
8948.926(7%)
115590.625 (93%)
Reserves Remaining Resources
b) Fixing CRZ limit line based on site specific scientific study.
c) Giving incentive for usage of low quality (High MgO, High Alkalies etc.)
Limestone resources.
d) Release of Limestone resources lying beneath surface encumbrances, such as, power
and gas pipe line transmission lines and villages, by identifying Limestone bearing
land.
The estimated reserves include all limestone deposits as reported. Out of which reserves of
some deposits may not be sufficient to cater limestone for large cement plants, and may be
suitable for setting up mini cement plants.
As per NCB’s study, 97% of total cement grade limestone resources is concentrated in only
10 states and overall distribution is restricted to 23 states and 2 UTs (Fig-2). The limestone
deposits are not reported from states of Punjab, Mizoram, Goa, Sikkim, and Tripura, whereas
states/UTs of Haryana, Manipur, West Bengal, Kerala, Andaman and Nicobar Islands,
Puducherry and Diu, have very meager reserves to be considered as potential. Lakshadweep,
though have potential calcium carbonate deposits but environmental rules and regulations
restricts for exploitation of the resources. The reserves are not uniformly distributed, thus,
creating an imbalance.
31718, 27%
17005, 15%
3454, 3% 8287, 7%
3935, 3%13798, 12%
7051, 6%
757, 1%
3526, 3%
1162, 1%
24897, 22%
A.P. Rajasthan Karnataka H.P.Gujarat Meghalaya Madhya Pradesh ChhattisgarhAssam Maharashtra Other States
Fig‐2: Remaining resources of Cement Grade Limestone as per Indian Bureau of Mines (01.04.2010), Provisional.
The zone‐wise and state‐wise cement grade limestone reserves and resources as
compiled by IBM are given in Table‐ 4.
Table 4 : State‐wise status of cement grade limestone reserves & resources (Provisional) as on 01.04.2010
(Mn. t.)
Zone / State Reserves Remaining Resources
Total Resources
East Zone:‐
Arunachal Pradesh ‐ 151.500 151.500
Assam 213.024 756.783 969.807
Bihar 11.472 438.282 449.754
Jharkhand 116.055 199.986 316.041
Manipur ‐ 38.423 38.423
Meghalaya 146.637 13797.798 13944.435
Nagaland 0.825 20.000 20.825
Orissa 534.993 426.627 961.620
West Bengal ‐ 4.417 4.417
Sub Total 1023.006 15833.816 16856.822
South Zone:‐
Andhra Pradesh 2564.219 31717.544 34281.763
Karnataka 717.732 24896.708 25614.440
Kerala 143.392 2.231 145.623
Puducherry ‐ 15.732 15.732
Tamil Nadu 465.288 230.698 695.986
Sub Total 3890.631 56862.913 60753.544
West Zone:‐
Chhattisgarh 852.056 7051.152 7903.208
Gujarat 670.897 8287.222 8958.119
Madhya Pradesh 391.644 3934.656 4326.300
Maharashtra 199.608 1161.636 1361.244
Daman Diu ‐ 48.840 48.840
Sub Total 2114.205 20483.506 22597.711
North Zone:‐
Haryana 9.675 48.538 58.213
Himachal Pradesh 162.927 3454.293 3617.220
Jammu & Kashmir 90.743 511.189 601.932
Rajasthan 1533.257 17004.643 18537.900
Uttarakhand 1.136 1011.581 1012.717
Uttar Pradesh 123.346 380.146 503.492
Sub Total 1921.084 22410.390 24331.474
Grand Total 8948.926 115590.625 124539.551
4.3 Potential Limestone Deposits for Future Growth of Cement Industry
Based on the prima-facie availability of freehold cement grade limestone deposits, there is
very limited scope of further addition of cement manufacturing capacity in the states of
Kerala, Tamil Nadu, Bihar, Uttar Pradesh, Manipur, Orissa and West Bangal.
However, states of Andhra Pradesh, Assam, Gujarat, Himachal Pradesh, Karnataka,
Chhattisgarh, Meghalaya, Jammu & Kashmir and Rajasthan have potential for further
creation/expansion of additional cement manufacturing capacity.
Andhra Pradesh: Majority of limestone deposits are concentrated in the district of Adilabad,
Kadapa, Guntur, Kurnool, Nalgonda, Khammam and Krishna. The total cement grade
limestone resources of Andhra Pradesh is 34,281.763 million tonnes.
Rajasthan: Cement grade limestone deposits are mainly available in the districts of Ajmer,
Chittorgarh, Jaisalmer, Jhunjhunu, Pali, Sirohi, Nagaur, Jaipur and Udaipur. Deposits of
Bundi and Kota districts are reportedly of low grade limestone. The total cement grade
resources of the state is estimated at 18,537.900 million tonnes.
(a) The data received by NCB from Rajasthan recently, indicated the additional
limestone reserves of 4120 Mn.t. in Jaisalmer, 968 Mn.t. in Jhunjhunu, 1235.02
Mn.t. in Chittorgarh and 221.37 Mn.t in Udaipur.
(b) Jaisalmer district has very high grade limestone deposits – CaO: 44 to 55%,
SiO2: 0.5 to 6% and FeO: <0.5% in and around Khinya, Abur, Sanu, Sam and
Ramgarh villages. Extensive mining activities are being carried out by Rajasthan
State Mineral Development Corporation (RSMDC) for Chemical and SMS
grade limestone, which have only 8 meter thickness and lying below 16 to 18 m
thick beds are of cement grade limestone. Huge quantities of limestone dumps
are already available all along the quarry site. These limestone dumps can cater
to the requirement of mega cement projects. The State DGM has reported a total
of 5290 Mn.t of limestone resources, all in measured resources category in the
district.
Karnataka: The limestone deposits are mainly distributed in the districts of Gulbarga,
Belgaum, Bijapur and Chitradurga. The total cement grade limestone resource of the state is
25,614.440 million tonnes.
(a) Recently additional resources of 850 million tonnes are reported in Devangiri
district.
(b) Gulbarga district alone possesses about 91 percent of the total limestone
reserves of the state. These limestone deposits are ideally suited for setting up
large/mega cement projects. The limestone deposits of Gulbarga district are
extended in adjoining Bijapur district.
Himachal Pradesh: Cement grade limestone is available in the districts of Bilaspur, Chamba,
Kangra, Kullu, Mandi, Sirmaur, Shimla, Solan, Lahul & Spiti, and Kinnaur. The total cement
grade limestone in the state as estimated and compiled by IBM is 3,617.220 million tonnes.
The geographical condition and general topography has restricted the growth of cement
industry in the state. However, due to continued scarcity of cement in the northern states and
rapid growth of construction activities in neighbouring states, there is enough potential for the
growth of cement industry in the state for utilizing the available limestone reserves.
(a) New finding of 1000 Million tonnes of limestone resources are reported from
the district of Lahul & Spiti and 100 million tonnes from Kinnaur district.
(b) Shimla is having the substantial cement grade limestone resources. Though the
limestone deposits are lying in hilly region, Shimla is relatively better placed in
terms of infrastructural facilities.
(c) Mandi district is also well connected through network of roads and highways
and therefore it will be easy to explore the possibility of setting up of major
cement units around Alsindi and Sundernagar.
(d) Solan district has significant limestone resources and can cater raw material for
cement manufacture.
(e) Chamba district has huge limestone deposits of cement and high grade deposits
in Broh-Shind area, which can sustain a large capacity plant. However
infrastructure and approach road to the limestone deposit has to be developed by
state government or potential entrepreneur.
Gujarat: Cement grade limestone is available in the districts of Amreli, Banaskantha,
Bhavnagar, Junagarh, Kutch, and Jamnagar. The total cement grade limestone resource as
estimated by IBM is 8,958.119 million tonnes.
(a) Kutch district possesses about 71 percent of the total limestone resources
available in the state. Extensive nummulitic limestone with little or not
overburden is reported in the district, which could not be developed due to poor
infrastructural facilities.
(b) Junagarh is having substantial cement grade limestone resources and can
sustain large capacity cement plant.
(c) Bhavnagar district is also rich district of Gujarat in respect of Cement grade
limestone. The milliolitic limestone of coastal region is shallow in depth, with
very erratic thickness. The brown to buff colored limestone is of very high grade
with impurities of Marl (siliceous carbonaceous material). The area is well
connected with roads/rail and located along the sea coast, and is ideally located
for major cement projects along south coast of Gujarat. The availability of these
potential deposits has been restricted partly due to CRZ (Coastal Regulation
Zone) implementation.
Meghalaya: Major limestone deposits are reported in three districts of West Garo Hills, East
Khasi Hills and Jaintia Hills. The total cement grade limestone resource of the state is
13944.435 million tonnes.
Jammu and Kashmir: The limestone deposits are mainly distributed in the districts of
Anantnag, Srinagar, Kathua, Baramula and Rajauri. The total cement grade limestone
resources in the state is 601.932 million tonnes.
Chhattisgarh: Limestone bearing districts of Chhattisgarh are Bastar, Bilaspur, Janjgir, Durg,
Raipur and Raigarh. The total cement grade limestone resources of the state is 7903.208
million tonnes.
(a) Raipur district possesses substantial quantities of cement grade limestone
resources and also has well-developed infrastructure. Though there is clustering
of major cement plants in Raipur – Bilaspur sector, there is scope for additional
cement capacity, provided a thorough study is conducted for market viability
and proper assessment of environmental impact etc.
Madhya Pradesh: Majority of limestone deposits are concentrated in the districts of Damoh,
Dhar, Neemuch, Sheopur, Rewa, Satna and Sidhi. The total cement grade limestone resources
of the state is 4326.3 million tonnes.
Maharashtra: Limestone bearing districts of Maharashtra are Chandrapur and Yavatmal.
The total cement grade limestone resources of the state is 1361.244 million tonnes.
(a) The Chandrapur district has the highest cement grade limestone resources in the
state and has potential to support additional cement capacity in the district.
(b) The limestone deposits in the Yavatmal district are low/marginal grade in nature.
Other States:
(a) The total cement grade limestone resources of Nagaland is 20.825 million tonnes.
(b) There are new limestone reserves reported from Arunachal Pradesh in East
Siang district. The total cement grade limestone resource of the state is 151.50
million tonnes.
(c) The cement grade limestone resource of Uttar Pradesh is 503.49 million tonnes.
5.0 Demand and Forecast of Limestone for the XII Plan
The growth trends of the Cement industry during the last 3 decades show that, on the whole,
the industry doubles its capacity in every 10 years. (Table 5)
Table 5: Cement Industry’s Expansion over Decades
Year Capacity (Mn. t)
1981 29
1991 61
2001 133
2010 (Dec.) 296
This trend should not however be taken axiomatically for projecting future growth, because
of several factors coming into play in the developing scenario. Besides, demand-supply
situation dictating the growth trends, the on-going developments in Regulatory Provisions
pose serious challenge to its growth. A few major factors witnessed as seriously impacting
growth of the industry are:
(a) Fluctuating Demand-Supply scenario over years, influenced by variable
growth of infrastructure development.
(b) Availability of Fly ash and BF Slag at reasonable cost.
(c) Undue delays in land acquisition for mine and plant.
(d) Dwindling supply of primary fuel – coal.
(e) Environmental Regulations delaying or stalling expansion or new ventures.
6.0 Availability of Limestone Reserves for Future Requirements
The total cement grade limestone resources as estimated by IBM, based on the UNFC
classification system is at 124,539.551 million tonnes out of which the remaining resources is
of 115,590.625 million tonnes as on 1st April 2010. However, 30% (approximate) of the
reserves i.e. 34677.19 million tonnes fall under forest and other regulated areas which are not
available for cement manufacture (Table-10). Cement companies are regularly conducting
further exploration of limestone at their captive leasehold areas and the updation of the data is
communicated to IBM which is reflected in the increased total reserves/resources.
Table 6: Availability of Limestone Reserves for Future Requirements (Mn.T)
Total Cement Grade Limestone Resources * 1,24,539.551
Reserves Restricted:
Under Forest (22.5%)
CRZ & Other Regulated Areas (7.5%)
Sub Total:
28,021.399
9340.466
37,361.865
Net Available remaining resources for future growth 87,177.686
* Data as per IBM records (01.04.2010)
Because of these factors inducing uncertainties, the conventional projections for growth of
the industry by the Planning Commission (Drafted by Cement Industry Experts) are confined
to each year for the duration of the Plan period. The Projections in the Report of the Working
Group on Cement Industry for the XIIth Plan provide estimates of the year-wise growth from
2012 to 2017 based on different assumptions of cement Demand, Export and GDP
growth(low as 8%, average as 9%, and high as 10%).
On the above assumptions, three scenarios of cement demand estimates and corresponding
limestone requirement for the XII Plan years are being put forward:
i) The low cement growth scenario of 10% assuming that the factors supporting such
growth show a poor performance leading to a GDP growth of 8% annually.
ii) The average cement growth scenario of 11% assuming that the factors responsible
to achieve the required performance be conducive to such 9% GDP growth.
iii) The high cement growth scenario of 12% under the assumption that the various
factors responsible perform better than expected, leading to GDP growth of 10%.
Accordingly, the limestone requirements based on the above three growth scenarios of the
Cement Sector (low as 10%, average as 11%, and high as 12%) have been projected in Table
7, 8 and 9: Table 7: Growth of Cement Industry during XII Plan Period (2012‐2017)
* 90% Capacity Utilization. ** Limestone requirement has been worked out considering the consumption factor of 1.5
tonnes and converting the quantity into developed category by multiplying with a factor of 1.15 as per NCB norms (following UNFC guidelines) for proving limestone deposits (SP‐9‐03).
$ Considered at 7% Growth (x) considered stagnant but may increase towards end of 12th plan
+ Actual 313 + likely addition. Table 8: Growth of Cement Industry during XII Plan Period (2012‐2017)
Average Growth Demand Scenario (GDP 9%, Cement 11%) (Mn. t)
Year Domestic Demand
Clinker Exports
Production Required
CapacityNeeded*
Limestone Requirement**
End of XI Plan
2011‐12$ 243.54 3.00 246.54 273.93+ 472.53
XII Plan
2012‐13 269.67 5.00(x) 274.67 305.19 526.45
2013‐14 298.67 5.00 303.67 337.41 582.03
2014‐15 330.87 5.00 335.87 373.19 643.75
2015‐16 366.60 5.00 371.60 412.89 712.23
2016‐17 406.27 5.00 411.27 456.97 788.27
* 90% Capacity Utilization. ** Limestone requirement has been worked out considering the consumption factor of 1.5
tonnes and converting the quantity into developed category by multiplying with a factor of 1.15 as per NCB norms (following UNFC guidelines) for proving limestone deposits (SP‐9‐03).
$ Considered at 7% Growth (x) considered stagnant but may increase towards end of 12th plan
+ Actual 313 + likely addition. Table 9: Growth of Cement Industry during XII Plan Period (2012‐2017) High Growth Demand Scenario (GDP 10%, Cement 12%)
(Mn. t)
Year Domestic Demand
Clinker Exports
Production Required
CapacityNeeded*
Limestone Requirement**
End of XI Plan
2011‐12$ 243.54 3.00 246.54 273.93+ 472.53
XII Plan
2012‐13 272.04 5.00(x) 277.04 307.83 531.00
2013‐14 303.97 5.00 308.97 343.30 592.20
2014‐15 339.73 5.00 344.73 383.03 660.73
2015‐16 379.77 5.00 384.77 427.53 737.49
2016‐17 424.63 5.00 429.63 477.36 823.45
* 90% Capacity Utilization. ** Limestone requirement has been worked out considering the consumption factor of 1.5
tonnes and converting the quantity into developed category by multiplying with a factor of 1.15 as per NCB norms (following UNFC guidelines) for proving limestone deposits (SP‐9‐03).
$ Considered at 7% Growth (x) considered stagnant but may increase towards end of 12th plan.
+ Actual 313 + likely addition.
The total limestone requirement in the XII Plan (2012‐2017) with the growth scenarios of
cement @ 10%, 11% and 12% for the respective GDP growth of 8%, 9% and 10% and balance
life of reserves is projected below: (Table 10 & 11)
Table 10: Total Limestone Requirement in the XII Plan (2012‐2017)
2012 – 2017 Scenario – I (10%)
Scenario –II (11%)
Scenario – III (12%)
Limestone Requirement during 12th Plan projected for various growth Scenarios (Mn.t)
3162.96 3252.73 3344.87
Life of the residual limestone reserves excluding the reserves falling under forest & CRZ beyond terminal year of XII Plan (Years)
54 53 52
Table 11: Projected Growth Scenario of Cement Industry
B. Cement Grade Limestone Resources Considering Environmental Constraints
10% 437.29 754.33 83542.20 1031.11 2025‐
26
2070‐71
11% 456.97 788.27 83452.41 1053.10 2024‐
25
2069‐70
12% 477.36 823.45 83360.30 1055.29 2023‐
24*
2068‐69
* ‐ No Capacity addition will be possible beyond 2023‐24 under 12% Scenario.
It is alarming to note from the estimates given above that the residual limestone reserves,
after meeting the existing capacities and their logical expansion, will be able to support
cement industry for 52 years (at 12% annual growth).
Limestone availability for sustainable development of the cement industry in meeting the
fast-track demand growth of infrastructure development is thus not assured beyond 52 years.
Mitigation of this crisis will need several radical steps, the important recommendations
arising therein are listed at 8.0.
7.0 Constraints for Limestone Availability
Exploration for the limestone deposits has extensively been carried out in the country but all
the available resources can not be exploited due to various constraints such as quality, poor
infrastructure in inaccessible areas, forest cover, environmental sensitivity, surface
encumbrances, CRZ, etc., and are described briefly.
7.1 Deposits in Inaccessible Areas
The limestone deposits located and explored in Jammu & Kashmir, Himachal Pradesh,
Uttarakhand and North-Eastern states of Himalayan region are difficult to exploit because of
difficult hilly terrain and inaccessibility. Though substantial reserves of cement grade
limestone deposits are available in these states, the constraints for large scale mining such as
unstable hill slopes and fragile eco-system, high seismicity of the region, procurement of fuel
and other raw materials at higher cost of transport from different states, etc. add up to higher
cost of production.
7.2 Infrastructural Facilities
Lack of infrastructural facilities like rail-road network, power supply, water availability, etc.
in and around a promising limestone deposit keeps the entrepreneur away. Absorbing
infrastructure development cost within cement plant cost may not be economically viable for
a particular deposit.
7.3 Forest and Human Settlements
The limestone deposits located near the villages, towns, cultivated lands, forest, historical
monuments, important civil structures like dams etc. are blocked due to safety regulations
and are not available for mining for cement manufacture. The forest conservation regulations
by Union Government and State Governments restrict the mining activities in some of the
promising deposits, falling under the reserved forest areas.
7.4 Nature of the deposit
Limestone deposits are classified as simple, complex and intricate depending upon their
occurrence, geological structure and their frequency of variation in quality. Limestone
mining from a simple deposit is cost effective as compared to intricate and complex deposits,
where the fluctuations in the grade often lead to the problems in cement manufacture or
require beneficiation before utilization and also require improved fuel with low ash contents.
Such deposits get the least priority for greenfield projects. Many limestone deposits of
uniform quality below a thick cover of overburden have also become uneconomical due to
higher cost of production and higher waste handling.
7.5 Environmental Constraints
The availability of potential limestone deposits has also been restricted due to environmental
constraints, as many of these deposits are located in reserve forests, bio-zones and
environmentally sensitive areas, near tourist centers/hill-stations or under thickly populated
or cultivated fields. The different environmental acts, rules and regulations of Government of
India restrict many cement grade limestone deposits to be exploited for cement manufacture.
For example the Environmental Protection Act 1986 and the Environmental Protection Rules
1986 declare the coastal stretches as Coastal Regulation Zone (CRZ) and impose restrictions
on industries, operations and processes in the CRZ. Setting up of new industries and
expansion of existing industries, except those directly related to water front or directly
needing foreshore facilities; Mining of sand, rock and other substrata material, except rare
minerals are prohibited under the above rule. Wildlife protection act has restricted mining in
the prescribed limits from wildlife sanctuaries which are notified/modified form time to time.
Population growth, rapid urbanization and developmental projects have also led to
encroachment of some of the potential limestone deposits. About 30% (approximate) of the
reserves have been restricted due to forest and other constraints.
8.0 Recommendations and Suggestions
In order to ensure the availability of cement grade limestone for projected cement production
and beyond, appropriate steps have to be taken up. In view of the rapid growth of cement
industry with an average CAGR of more than 8% and substantial increase in the capacity of
single location plant from 0.4 MTPA to 2.6 MTPA, the availability of cement grade
limestone to meet the requirement of projected cement capacity beyond XI Plan period has to
be ensured through appropriate measures as under:
(i) Special thematic mapping, geochemical mapping to be increased by GSI
targeting towards cement grade limestone.
(ii) Besides known limestone belts, occurrences in the Himalayas, Indo-gangetic
plains, desert area required special attention through systematic exploration.
(iii) Exploration activities need to be intensified.
(iv) Presently the average assessment depth for limestone reserves by
private/government exploration agencies is merely 30 – 70m which should be
increased.
(v) Geologically limestone is deposited in major geological basin, and clustering
of cement plants is developed accordingly. Initially small sizes of the leases
were granted to these plants. Due to the restriction for lateral expansion of
mine mineral would be blocked after certain depth keeping provisions of
statutory pit slopes, 7.5 m safety zone near boundary etc. Deeper mines could
be developed if two or more small quarries are allowed to merge or well
planned mining cooperatives are formed for winning blocked reserves from
depth as well as from common boundary zone or safety zones.
(vi) At present periodic assessment of the captive limestone mines is negligible.
The directives issued time to time for carrying out statutory exploration/
reassessment as per UNFC norms required to be monitored and reviewed to
assess the future availability of limestone reserves.
(vii) Strengthening of exploration capabilities of state DMG for exploration of
concealed deposit (Geophysical, deep drilling etc.), inaccessible areas
(airborne mineral survey, remote sensing, etc.) etc., keeping in view the
transfer of power to award the mining lease being decentralized.
(viii) Incentives on utilization of mineral beneficiation techniques with better
recovery from low grade limestone and mine rejects may be thought of by
reduction in limestone royalty charges which could be either based on
weighted ore recovery percentage or grade upgradation basis.
(ix) Encouraging import of Sweetener grade limestone, which will make low grade
deposit usable by blending. This can be achieved having lower royalty rate for
low-grade limestone deposits, which can be made usable with blending with
imported limestone.
(x) Concept of Special Mineral Economic Zones for limestone can be thought of
where the mineral wealth of the area can be shared. The plants should be
located conveniently away in non-mineralized belt. The plants, colonization,
inhabitation already in place in the limestone belt cannot be removed now.
(xi) As only 8948.926 million tonnes of total limestone is classified as reserve
category, there is, urgent need to convert the remaining limestone resources of
115590.625 million tonnes to reserve category by intensifying exploration
activity through central and state level exploration agencies.
(xii) There has not been substantial increase in total reserves of limestone during XI
plan period. The need to identify potential limestone deposits for Greenfield
projects, preferably away from the existing clusters are therefore paramount.
(xiii) The availability of potential limestone deposits of hill states and north-eastern
states is restricted due to Forest Conservation Act. Efforts have to be made to
release the deposits for exploitation on selective basis.
(xiv) The exploitation of offshore/onshore deposits has been restricted by declaring
coastal stretches as Coastal Regulation Zone (CRZ). Review of the provisions
of the CRZ is essential to enable eco-friendly use of enormous reserves of
cement grade limestone blocked along Gujarat coast and to save operating
plants from gradual demise.
(xv) Efforts have to be intensified to utilize 27% of marginal grade limestone. This
will improve the life of mine and mine environment by drastically reducing
the waste dumps presently lying in the existing quarries and occupying
precious land.
(xvi) In order to ensure rational utilization of reserves of various grades available in
the mining lease area and to assess the shortfall, if any, for expansion of
existing cement plants, periodic re-assessment of captive limestone reserves
has to be made mandatory.
(xvii) The Royalty rates of limestone need to be rationalized following one standard
norm.
(xix) Development of rail-road, infrastructural and communication network may be
taken up on priority to utilize the available resources especially in hilly and
inaccessible areas.
CHAPTER-V DIAMOND AND PRECIOUS STONES
5.1. INTRODUCTION The word diamond is a derivation of the Greek word, “Adamas”, which means “Invincible”. Diamonds have held human fascination for centuries. The first recorded history of diamonds dates back some 3,000 years, to India, where it is believed that diamonds were first recognized and mined. The Golconda region of Andhra Pradesh, where alluvial diamonds were mined from the Krishna gravels, were the only source of diamonds in the world until the 18th century. The Golconda region has produced the well known world famous diamonds like Great Moghul (787 ct), the Koh-i-noor (Mountain of Light), Pitt/ Regent (410 ct), Nizam (440 ct) and Hope (67 ct), Orloff, Daryia-i- noor etc. After India, alluvial diamonds were first discovered in Brazil in 1726 and then in 1867 in the Cape Colony, now a province in South Africa. Two years later, in 1869, the first primary sources of diamonds were discovered at Kimberley in South Africa. In fact, the volcanic rock “Kimberlite” derives it’s name after “Kimberley”. The discovery of diamonds in South Africa radically modified the world’s supply of diamonds. In 1871, world annual production, derived primarily from South Africa, exceeded 1 million carats for the first time.
5.2. ACTION PLAN FOR DIAMOND EXPLORATION IN INDIA
5.4.1 Target Areas for Kimberlite and Lamproite Exploration
Based on the geological milieu, tectonic setting, heat-flow regimes, gravity and magnetic data, distribution of known primary and secondary sources for diamond, etc., the cratonic areas to the north of the Southern Granulite Belt (SGT) and to the west and north of the Eastern Ghats Granulite Belt are considered as the most favoured areas for search of Kimberlites and Lamproites in the Peninsular India. The hitherto known diamondiferous Kimberlites and Lamproites may not be the primary source rocks for all the diamonds found in the vast stretches of conglomerate and gravel in different provinces. Better understanding of the Achaean-Proterozoic tectonics, various tectono-thermal events, heat-flow regimes, etc. will broadly guide in delineating favourable target areas such as ‘archons’ and ‘protons’ for kimberlite/ lamproite exploration. Besides, detailed morphological studies of diamonds occurring in the secondary source rocks vis-à-vis the known primary rocks may lead to identifying new target areas for search of Kimberlites/Lamproites. 1. Dharwar Craton and other areas in South India Granite-greenstone terrain of Andhra Pradesh and Karnataka and adjacent areas. Black soil cover has been the mystery and advance geophysical techniques must be used to resolve this mystery. Marginal areas occupied by the Proterozoic sedimentary basins and also thin Deccan Trap cover areas in Andhra Pradesh and Karnataka, eastern part of the Cuddapah basin and the Pakhal Basin, particularly occupied by the Munneru and the Paleru river basins. 2. Bastar Craton
Western part of the Bastar Craton in Maharashtra Areas occupied by the Mainpur and Tokapal kimberlite fields and marginal areas
occupied by the Chhattisgarh, Pairi-Khariar, Singora, Indravati, Sabari and Albaka sedimentary basins in Chhattisgarh
Area adjoining the Raigarh metamorphic belt in Chhattisgarh Granitic terrain adjoining the Khariar sedimentary basin in Orissa Areas covered by the Ib, Tel and Mand river basins in Orissa
3. Bundelkhand Craton and Platformal Vindhyan Sediments Panna and Bunder Diamond Belt and its surrounding Bundelkhand Granite terrain in Madhya Pradadesh and Uttar Pradesh
4. Look for Young Kimberlite/Lamproites
In South Africa and Canada the kimberlte/ lamproite rocks are of much younger age than those discovered in India. Thus, there is a possibility of finding the same in India also. Therefore, exploration strategy should also be targeted towards discovery of younger age primary source for diamonds.
5.3. REVIEW OF THE XITH PLAN RECOMMENDATIONS 1. As stated in the XIth Plan Report, India continues to be totally dependent on import of rough diamonds to meet the enormous demand by the Indian diamond and precious stones cutting & polishing industry, which is by far the largest in the world. Thus, it is essential that the Central Government continues to review the diamond import and export policy so as to continuously make available the roughs to the industry. 2. It was recommended that more efforts are required to increase the local production by discovering new diamond resources in order to meet the requirements of the Indian diamond industry, at least to some extent. The Report stated that with “the entry of private entrepreneurs and MNCs in diamond exploration, new kimberlites and lamproites may be discovered. This may result in a new mine and if so, production may be expected only by 2015”. This expectation has been proved correct as, De Beers India, Rio Tinto and a few others have discovered numerous kimberlites and lamproites during this period. Moreover, GSI has also discovered new kimberlites and lamproites during their regional programmes. However, the most significant achievement has been Rio Tinto’s discovery of a diamond deposit at Bunder in Chhatarpur district of Madhya Pradesh. This discovery, with an estimated diamond resource of around 27 million carats (Mct) is the world’s largest diamond discovery in the last decade. This has the potential of providing around 3.0 Mct of rough diamonds annually for the next 8 to 10 years, starting from 2016. Thus, the expectation of a new mine by 2015 has also been proved correct. 3. The XIth Plan Report noted that as most of the RP holders have applied for PLs for more than 25 sq. km, the Central Government should consider relaxation of the Rules. Accordingly, in the interests of exploration, the Government has granted PLs over RPs for areas much larger than the 25. sq. km. limit. Further, the Draft MMDR Bill has kept a provision of 500 sq. km. PL per State, for PL over a RP. This will allow prospecting over a larger potentially identified RP area, thereby increasing the chances of discovery. 5.4. DIAMOND PRODUCTION: WORLD VS. INDIA
5.3.1 World Diamond Production As a result of the economic down-turn in 2008-09, world diamond production, which was 163 M cts, valued at USD 12.73 billion in 2008, fell sharply to 125 M cts, valued at USD 8.64 billion in 2009. However, with strong and increasing demand from India and China and partial recovery in demand from USA, production has increased to 140 M cts, valued at USD 11.75 billion in 2010-11 (provisional figures), Diamonds are now produced from 23 countries (See Fig. 5.1). The total world diamond production of 140 Million carats in 2010-11 came mostly from 14 countries, notably, Botswana, Russia, Canada, Australia, South Africa, DRC, Namibia and Angola. The African continent still contributes around 50% of the production. The world diamond production for every decade since 1870 is given in Table- 5.1 and yearly figures since 2003 are provided in Table- 5.2.
Source: Annual Global Summary: 2004-2009 Production and KPC Counts, Kimberley * 2010-2011 are approximate and projected figures
Table-5.3 World Rough Diamond Production (2009), by Country
PRODUCER COUNTRY
DIAMONDS (MIL CT)
AVERAGE PRICE US$/CT
VALUE IN MILLION US $
Angola 13.8 85.28 1,179.21 Australia 15.60 20.04 312.71 Botswana 17.71 81.00 1,436.45 Brazil 0.21 39.24 0.83 Canada 10.9 134.75 1,474.94 Central African Republic 0.3 151.03 47.09 Congo, Democratic Republic
21.3 10.60 225.84
Ghana 0.4 18.56 6.98 Guinea 0.7 41.59 28.98 Namibia 1.2 342.97 408.74 Russian Federation 34.7 67.34 2,340.64 Sierra Leone 0. 4 195.65 78.42 South Africa 6.1 144.23 885.54 Tanzania 0.18 136.26 24.78 Others 1.3 140.75 185.05 Totals 124.81 69.20 8,636.22 Source: Annual Global Summary: 2009 Production, Imports, Exports and KPC Counts, Kimberley
Note: Zimbabwe accounts for 1 million carats in the category 'others'
Table-5.4 Yearly World Rough Diamond Production Since 2004
Producer Country 2004(mil ct)
2005(mil ct)
2006(mil ct)
2007(mil ct)
2008 (mil ct)
2009(mil ct)
Russian Federation 38.87 38.00 38.36 38.29 36.93 34.76 Congo, Democratic Republic 30.04 33.05 28.99 28.45 33.40 21.30 Botswana 31.04 31.89 34.29 33.64 32.28 17.73 Australia 20.21 32.94 29.94 18.54 14.93 15.60 Angola 6.15 7.08 9.18 9.70 8.91 13.83 South Africa 14.09 15.56 14.93 15.21 12.90 6.14 Namibia 2.01 1.87 2.40 2.27 2.44 1.19 Guinea 0.67 0.55 0.47 1.02 3.10 0.70 Sierra Leone 0.69 0.67 0.60 0.60 0.37 0.40 Ghana 0.92 1.01 0.97 0.89 0.64 0.38 Central African Republic 0.35 0.38 0.42 0.47 0.38 0.31 Tanzania 0.30 0.22 0.27 0.28 0.24 0.18 Liberia NA NA NA 0.02 0.05 0.03 South America NA NA NA NA NA NA Other Countries* 13.79 13.47 15.19 18.81 16.35 12.25 Totals 159.13 176.70 176.03 168.20 162.91 124.81 Source: Annual Global Summary: 2004-2009 Production, Imports, Exports and KPC Counts, Kimberley Note: Biggest producer country in the category 'other' is Canad
Figure-5.2 Major Diamond Producing Mine
Fig: 5.3
World Diamond Demand – Supply Outlook
Fig: 5.4
Changes In Demand Pattern For Diamond Jewellery
Fig: 5.5
Global Diamond Production (MM Carats)
Fig: 5.6
Projection for Diamond Mine Production
Where will the new supply come from?
2009’s output was driven by brutal cuts to output by De Beers. Alrosa produced but did not sell Rio took production holidays Only Ekati kept the pace Ramping up already – but no real growth
5.3.2 Indian Diamond Production NMDC continues to be the only organized producer of diamonds in India, from its Majhgawan mine at Panna, Madhya Pradesh. This mine, which was closed for a couple of
years, has recommenced production in August, 2009, after permission from the Supreme Court. NMDC plans to gradually increase the production to 100,000 carats per annum. The total diamonds recovered from this mine to date is about 1.0 Million carats. Capacity : 84,000 carats per year
Incidence : 10 carats per 100 tons of tuff material
* Projected figures A total of 15.14 million tonne (Mt) of lamproite was estimated to occur up to a depth of 200 m, of which 9.2 Mt was mined till the end of March 2005. The mine is currently operating at a depth of 85m and has a grade of 10 cpht. The ratio of Gem: Off colour: Industrial diamonds is 28:36:36 (% by weight). Average size of the diamond is 0.50 ct. Large size diamonds are rare. During 2000-05 only, seven large diamonds ranging in weight from 19.34 ct to 30.33 ct were recovered. The gem diamonds are of high quality and fetch a very high price.
5.5 INDIAN DIAMOND INDUSTRY The Indian diamond industry continues to be totally dependent on import of rough diamonds. If we see the geographical distribution of Indian diamond industry, it is mainly confined to Gujarat (Surat-Jaipur) and Mumbai region, with a negligible presence in Panna district of Madhya Pradesh.
Figure-5.7
Percentage Share of export Basket
Source: GJEPC
The gem and jewellery industry employs about 10 to 12 lakh workers, of which about 80% is engaged in diamond cutting and polishing industry (see Table- 5.6)
Table- 5.6 Major Diamond Cutting Countries
COUNTRY WORKFORCE ( 2011 ) India 800,000 China 25,000 Thailand 9000 Russia 5000 Armenia 3500 Sri Lanka 3000 Israel 2000 Belgium 1500 USA 400 Source: GJEPC
Rough Diamonds3%
Coloured Gemstone
1%
Others1%
cut& Polish Diamonds
65%
Gold Jewellery30%
5.5.1 Diamond Cutting and Polishing in India - Share in Global Trade
With a 800,000 strong workforce and deployment of the latest technology, India continues to be the dominant player in the world’s diamond cutting and polishing industry. In fact, according to India's Gem & Jewellery Export Promotion Council (GJEPC), India has further strengthened it’s world dominance. Compared to the last Plan, India has:
1. 60% share by value vs 50% 2. 85% share by caratage vs 80% 3. 92% share by no. of diamonds vs 90%, as 11 out of every 12 rough diamond pieces are processed in India.
The size of the Indian gems and jewellery industry is expected to cross $31 billion in 2010-11. Surat itself is expected to process $18 billion worth of the glittering gems during this period. 5.5.2 Consumption of Diamonds in India
Consumption of diamond jewellery in India is expected to touch $6.1 billion (Rs.30, 000 crore) in 2010-11, a 50 per cent increase compared to the current $4.2 billion diamond jewellery sales. In the last four years, the diamond jewellery sales have increased from $1 billion to $4.2 billion. Since the US, which accounts for 45 per cent of the global jewellery consumption, is yet to come out of recession, the accelerating diamond jewellery sales in India is set to provide the much-needed insulation to the Indian gems and jewellery industry, facing volatility in the US and UK markets.
Demand for diamond jewellery in India will rise from 7% in 2009 to 11% of global demand in 2015, according to RBC Capitals ( September, 2009 report). Again, a recent study by Klynveld Peat Marwick Goerdeler an accounting firm (KPMG) says India is set to realize total jewellery sales of $21 billion by 2010 and $37 billion by 2015. Currently, out of the eight key world retail markets, the US accounts for 45 per cent of the jewellery sales. India and China, which follow with 8.3 per cent and 8.9 per cent respectively, will emerge as the market equivalent of the US by 2015.
5.5.3 Diamond Imports and Exports by India India exported cut and polished diamonds worth US$28.26 billion in the year ending March 31, 2011 (provisional figures), against rough diamond imports of US$ 11.93 billion, with a significant value addition of US$ 16.32 billion., according to GJEPC data. This reflects the strong recovery of the diamond industry from the global recession.
Table – 5.7 Diamond Import/ Export Trade of India – Gross
Source: GJEP
Figure-5.8 Import and Export: 2005 to 2010-11
Source: GJEPC
5.5.4 Future Growth of Indian Diamond Sector and Demand
GROSS ROUGH IMPORTS
GROSS POLISHED EXPORTS
DIFFERENCE BETWEEN POLISHED EXPORTS AND ROUGH IMPORTS - GROSS
Since the US, which accounts for 45 per cent of the global jewellery consumption, is yet to come out of recession, the accelerating diamond jewellery sales in China and India are set to provide the much-needed insulation to the Indian gems and jewellery industry. The Indian cutting and polishing sector is facing growing competition from China and due to the fact that the producing African countries are demanding a greater share of processing of roughs within their countries. Thus, according to a KPMG analysis, by 2015, India’s share in value terms will come down to 49.3% share (from the present 65%), of the world diamond roughs. In the same period China’s share is expected to grow to 21.3%, with 7.1% to Russia, 5.5% to South Africa, 4.7% to Israel and 1.4% to the US.
A KPMG-GJEPC analysis shows that in 2015 China is forecast to have a 13% share of the worldwide market for jewelry consumption, second after the U.S. with a 26% share and followed by India with a 12% share. Global corporations view India as one of the key markets from where future growth will emerge. The growth in India’s consumer market will be primarily driven by a favorable population composition and rising disposable incomes. A recent study by the McKinsey Global Institute (MGI) suggests that if India continues to grow at the current pace, average household incomes will triple over the next two decades and it will become the world’s 5th-largest consumer economy by 2025, up from 12th now. Diamond represents increasing volume and value across all classes of Indian consumer market. Middle class, defined as households with disposable incomes from Rs 200,000 to 1,00,000 a year comprises about 50 million people, roughly 5% of the population at present. By 2025 the size of middle class will increase to about 583 million people, or 41% of the population. The good news for the Indian industry is that by 2016 Rio Tinto’s Bunder Mine in MP is likely to come into production. This has the potential of supplying around 3 M cts rough diamond annually for 8-10 years. It will also create tens of thousand of direct and indirect jobs in Madhya Pradesh on site and in the cutting and polishing industry. 5.5.5 Diamond Import and Export Policy in India
1. Diamond is freely importable item and the present applicable basic duty is 25%. The basic customs duty on cut and polish diamonds have been reduced from 15% to 5% (vide notification No.21/2002 dated 01.03.2002 as amended by notification No. 26/2003dated 1.3.2002).
2. The rough coloured gemstone half cut, broken diamonds and semi processed pieces
have been fully exempted from basic customs duty.
3. Foreign Direct Investment (FDI) in Diamond Mining is now up to 100% under automatic approval of Reserve Bank of India (RBI).
4. The royalty rates of 10% of sale price on ad valorem basis have been changed to
11.5% of sale price on ad valorem basis. This is 7% more than any country around the world.
5.5.6 World Reserves and Reserve Base of Diamonds The only authentic source for this data is from USGS. However, there is practically no change in the Reserve and Reserve Base figures as available in USGS, Mineral Commodity Summary for 2006 and 2009/ 2011. In these Summaries, the “Total Reserves” stand unchanged at 580 M.cts, while there is a minor addition in “Total Reserve Base” from 1250 M.ct to 1300 M.ct.
Table - 5.8 Country Reserves (Mct) (1) Reserve Base (2) United States NA NA Australia 95 230 Botswana 130 230 China 10 20 Congo (Kinshasa) 150 350 Russia 40 65 South Africa 70 150 Other countries 85 210 World total (rounded) 580 1300 (1)Source: 2011 Mineral commodity summary, USGS (2)Source: 2009 Mineral commodity summary, USGS (Verified by IBM) However, from available world diamond production statistics, there should be a depletion of about 750 M.cts in the last five years, at an average annual production of 150 M.cts. For the “Reserves” figure to remain unchanged, exactly 750 M.cts. would have been converted from the previous “Reserve Base” to that of “Reserves”. Moreover, it implies that during the last five years, 800 M.cts must have been added to “Reserve Base”, of which 750 M.cts has been mined, leading to an increase in the “Reserve Base” by only 50 M.cts. For instance, according to IBM, India has Reserves + Resources of 4.6 M.ct. In addition, the Bunder Deposit has added a Reserve Base of 27 M.ct. Thus, India should appear on the above list, with a “Resource Base” of 31.60 M.cts. Similarly, there could be gaps from other parts of the world. 5.6 OCCURRENCES AND RESOURCES OF DIAMONDS IN INDIA
The figures shown in Table – 5.9 below, are the same as mentioned in the XIth five year Plan report.
Table - 5.9
STATE RESERVE (CARATS)
RESOURCES (CARATS)
TOTAL RESOURCES
Andhra Pradesh 0 1822955 1822955
Chhattisgarh 0 1304000 1304000
Madhya Pradesh 1205577 249381 1454958
TOTAL 1205577 3376336 4581913
Source: IMYB 2009 of IBM publication
However, during this period Rio Tinto has reported a Resource of 27.0 M cts at their Bunder Deposit in MP. Although the Project is at the pre-feasibility stage, it is nevertheless the biggest-ever resource discovered in India.
Table – 5.10
Bunder Diamond Project Resource State Reserve (Mct) Resources
(carats) Total Resources
Madhya Pradesh - 27 M.cts 27.0 M.cts This discovery has greatly increased India’s “Diamond Resource” from a meagre 4.58 M cts to a somewhat respectable 31.58 M cts. 5.7 DIAMOND PROVINCES
India has broadly three diamond provinces: The Central Indian Diamond Province, East Indian Diamond Province and the South Indian Diamond Province. 5.7.1 Central Indian Diamond Province
The Central Indian Diamond Province consists of primary and secondary source rocks. The province, confined to the Bundelkhand Craton, occupies the central and northern parts of the country. The craton is represented by basement rocks comprising Bundelkhand Granite (~2400 Ma), with enclaves of older metamorphics.
5.7.2 Panna Diamond Belt Majhgawan Lamproite Field
This hosts Olivine Lamproites (~1100 Ma) intruding into the Kaimur Group of rocks, along the western margin of the Vindhyan Basin, adjoining the Bundelkhand Granite. Two diamondiferous Lamproites, one each at Majhgawan and Hinota, are emplaced at the intersection of two lineaments, located about 20 km WSW of Panna town. The two pipes formerly described as kimberlites are now reclassified as olivine Lamproites. The Majhgawan pipe is an old mine, where as the Hinota pipe was discovered by GSI in late 1950s using geophysical surveys. The bodies fall in the Panna reserve forest.
5.7.3 Bunder Lamproite Field & History of Rio Tinto’s Discovery The Bunder Lamproite is located about 80kms west of Majhgawan Kimberlite/Lamproite field. The Lamproite has intruded the same Group of platformal Vindhyan sediments as Majhagawan i.e. the Kaimur Group of rocks Rio’s reconnaissance mission in the Bundelkhand region of Madhya Pradesh commenced in April 2002. Over the next two years, the team collected nearly one thousand gravel samples from the local forests and farmland by travelling hundreds of kilometres everyday on bumpy
roads and with poor access to reach the sample location. In early 2004, promising results started to localise in a heavily forested area and the catchments were followed- up by ground magnetic survey. Subsequently, Rio identified several magnetic targets that required further investigation, as diamondiferous rocks often magnetically contrast with surrounding sediments.
On May 17, 2004 Rio discovered a brecciated outcrop that had clearly intruded the older, flat-lying sandstone beds on the side of a creek. A few blows of the hammer revealed the guts of the rock and – “Bingo!” , Rio recognised that they had found what they had been chasing in India for many years. The name as ‘Bunder’, was given after the numerous monkeys in the area.
A total of 14 Kimberlite/Lamproites have been discovered by Rio Tinto in Madhya Pradesh to date, of which 9 have been found within the Damoh West RP through a combination of ground geophysics (both magnetics and EM), soil sampling and prospecting. 5.7.3.1 Artisanal Mining in Panna
Mapping of diamond workings and incidence in Panna area suggest that the secondary sourced diamonds are dispersed all around the area and it’s very difficult to vector but it can be interpreted that as we move south the diamond quality and incidence gets poor. In a year, about 50,000 locals involve in this activity and it is the major source of income for these people.
(a) Laterites/ Paleochannels
Rounded boulders in the soil probably represent old river terraces or a paleochannels? Locals are mining the top 5-10 feet and are recovering few diamonds but the quality and incidence is very low, <0.1cpt and the diamonds are mostly of poor quality, with 10-15% gem to near gem and rest poor quality. (Data collected form the locals)
(b) Alluvial Diamonds
5.7.4 East Indian Diamond Province The Eastern Indian Diamond Province (EIDP) is confined to both the Bastar and the Singhbhum cratons. The Bastar Craton is bounded between the Narmada-Son Lineament on the north, the Mahanadi Rift on the east, the Eastern Ghats front on the southeast and the Godavari Rift on the southwest. The craton extends on the west up to Maharashtra and on the east up to Orissa through Chhattisgarh. This province is known for ancient diamond mining activity at a few places only viz., Wairagarh area in Maharashtra, Hirakud area in Orissa and at Koel Sankh river areas in Jharkhand. The ancient workings in Wairagarh area are in the conglomerates as well as gravels. The following are the kimberlite/lamproite fields discovered in the EIDP: 5.7.4.1 Raipur Kimberlite/Lamproite Field The Raipur Field, also known as Mainpur Kimberlite Field (MKF), is located within the Bastar Craton, close to its contact with the granulite terrain of the Paleo - Mesoproterozoic
Eastern Ghat Mobile Belt in the east. This contact is also marked by occurrences of Meso - Neoproterozoic alkali syenite complexes, the nearest being at Khariar in Orissa. The Archaean granite-greenstone of in the craton is overlain by Neoproterozoic platform sediments of the Chhattisgarh Supergroup deposited in different sub basins. The kimberlites of MKF are intrusive into the platformal sediments of the Pairi- Khariar basin. Tokapal Kimberlite/Lamproite Field During 1994-97 in Indravati basin, led to discovery of four kimberlite bodies at Tokapal, Duganpal, Bhejripadar and Parpa-Parakot to the WSW of Jagadalpur in Bastar District. 5.7.4.2 Naupada Lamproite Field The Nuapada area in the eastern Bastar craton is marked by the occurrence of several lamproite dykes, which are intrusive into Precambrian granitoid. Mineralogy of lamproite dykes occurring near Kalmidadar, Darlimunda, Parkom and Amlidadar are being studied. 5.7.4.3 Eastern Indian Gondwana Lamproites Lamprophyres occurring in the form of dykes and sills are known from the Gondwana Coal Fields in Damodar Valley in West Bengal and Jharkhand. The dykes are mostly Cretaceous age (105-121 My) and range in width from less than a metre to a few metres. They extend up to a few kilometres and occur within the Barakar Formation in Ranigunj, Jharia and Bokaro coal fields. However, their diamondiferous nature is yet to be established. 5.7.5 South Indian Diamond Province
The Southern Indian Diamond province (SIDP) perhaps the largest Diamond province in the country is confined to the Dharwar Craton. The Craton with a large and exposed Achaean basement and inter cratonic Proterozoic Cuddapah Basin and its equivalents viz., the Pakhal Basin and Kaladgi Basin and other younger basins viz., Kurnool, Pakhal, Bhima and Sullavai is bordered by the Godavari rift on the northeast, the Eastern Ghats Mobile Belt (EGMB) on the east and Arabian sea on the west. On the northern side, it extends below a vast cover of Deccan basalts. On the southern side the Craton it is bounded by granulite facies rocks. The craton is broadly divided into two – the western block (mostly in Karnataka) and eastern block (mostly in AP), separated by the Closepet Granite .The major rock types are the peninsular gneiss and its variants, supracrustals, younger granites and Proterozoic inter-cratonic sediments. The SIDP consists of both primary and secondary source rocks of diamonds. The hitherto known kimberlites, localised within the eastern block of the craton, are grouped into different fields. 5.7.5.1 Wajrakarur Kimberlite Field (WKF) The Wajrakarur Kimberlite Field (WKF) in Anantapur district, Andhra Pradesh is the southern most kimberlite field developed in the Dharwar Craton. It is the largest primary field recorded so far in the country .Till now, a total of 29 kimberlite bodies (pipes/dykes) have been discovered in about 80 x 70 km area falling in Anantapur district of AP by GSI and one each by NGRI (P-7 of Wajrakarur area) and CGWB(CC-1 of Chigicherla area), while NMDC located 3 bodies in their tenement in the Kalyandurg area. Apart from these, Rio Tinto reported 15 intrusives from this area.
5.7.5.2 Narayanpet Kimberlite Field (NKF)
The Narayanpet Kimberlite Field (NKF) falls in Mahabubnagar district, Andhra Pradesh and Gulbarga district, Karnataka 32 bodies have been discovered by GSI and 29 by De Beers, during 2001-04. Of the 29 bodies, 16 are in Gurmatkal-Yadgiri area and 12 in Wadagera area between the confluences of the Bhima and Krishna rivers. Surface samples from the Wadegara kimberlites are reported to contain diamonds. However, bulk sample testing of 13 kimberlite bodies from Maddur-Narayanapet-Gurmakal area, by GSI, did not yield diamond. 5.7.5.3 The Raichur Kimberlite Field (RKF) The Raichur Kimberlite Field (RKF) is in Raichur district, Karnataka and Mahabubnagar district, Andhra Pradesh. The RKF has 6 pipes out of which 3 pipes (SK1 to SK3) occur in Siddanpalli cluster and other three pipes (RK1 to RK3) are dispersed. 5.7.5.4 The Tungabhadra Kimberlite Field (TKF) The Tungabhadra Kimberlite Field (TKF) is in Raichur district, Karnataka and Mahabubnagar district, Andhra Pradesh. About 12 kimberlite intrusions were reported from these field: 8 bodies by GSI and four bodies by De Beers India. Besides, there are three Lamproite fields viz; the Nallamalai Lamproite Field(NLF) along the Nallamalai fold belt within the Cuddapah Basin ,the Krishna Lamproite Field (KLF) in Krishna and Nalgonda districts, Andhra Pradesh and Ramadugu Lamproite Field (RLF) in Nalgonda district, Andhra Pradesh. More than 50 lamproite bodies occurring as thin dyke-lets were identified in these fields. In the Cuddapah basin, De Beers India has discovered 4 kimberlites/ lamproites falling in Kurnool district and another 4 kimberlites in the basement rocks in Mahbubnagar district of Andhra Pradesh. In Kurnool district all the four kimberlite/lamproites, discovered by geological traverses, occur as thin dykes and are emplaced into the Tadipatri shales of Cuddapah basin. However, subsequent prospecting done on the PLs over these kimberlites/ lamproites, did not yield any encouraging results. Besides, De Beers India has recently discovered four new kimberlites in the RP area of Mahbubnagar district, on which work is in progress.
Table-5.11 Geological and Geographic Distribution of Diamond-host Rocks
AGE FORMATION/ GROUP
ROCK TYPE LOCATION
Gravel
1) Krishna-Pennar-Sagileru-Kundair- Hagari-Hindri River areas, A.P. 2) Ken-Ranj-Baghain River areas, M.P. 3) Maini-Mand-Ib River areas, M.P. 4) Mahanadi-Ib-Tel River areas, Orissa 5) Koel-Sankh River areas (?) , Jharkhand
Quaternary ---
Lateritic gravel Panna Diamond Belt, M. P.
Cretaceous Damodar Group Lamproitic(?) rocks
Damodar Valley Coal Fields, Jharkhand Mainpur kimberlites
(?) Jurassic
(?)Gollapalle sandstone
Conglomerate Mallavelli area, Krishna district, A. P.
Ramannapeta – Jaggyyapeta area, Krishna Valley, A.P.
(?) Meso Proterozoic
Cumbum Formation
Pebbly sandstone
Kolluru area. Krishna Valley, A.P.
(?) Paleo-proterozoic
Sakoli Group Conglomerate Wairagarh area, Maharashtra
Source: GSI
Fig: 5.9
Potential Area for Diamond exploration in India
0 1000Km
N
Diamond exploration areas
New Delhi
Bangalore
Kimberlite / lamproite
Alluvial diamonds
Dharwar CratonBastar Craton
Bundelkhand
SinghbhumCraton
5.8 STATUS OF DIAMOND EXPLORATION IN INDIA
The National Mineral Policy, 1993 paved the way for entry of the Private Sector, including foreign investment, for various minerals hitherto reserved for the Government or Public Sector. Diamond was one of those minerals.
Based on the good geological database provided by GSI, MNCs like De Beers, Rio Tinto, BHP and Phelps Dodge applied for and were granted RPs for diamond exploration in some states. Of these companies, only De Beers and Rio Tinto have persisted in the XIth Plan period.
As mentioned in the XIth Plan Report, RPs over 162,640 sq. km were granted in six states for diamond exploration upto August, 2005. This has increased to 302,062 sq. km. over ten states, upto March, 2011. Thus, RPs over almost 140,000 sq. km area have been granted for diamond exploration in the last six years. . It is evident from Table- 5.12 that the major focus was in the states of Andhra Pradesh, Chhattisgarh, Karnataka and Madhya Pradesh.
Table-5.12
State - Wise RP-PL-ML Status as on 31st March 2011 State Total Area
It can also be noted from Table- 5.13 that the two leading private companies for diamond exploration in India are De Beers India and Rio Tinto India. Moreover, in the wake of Rio’s success in Madhya Pradesh, Indian companies like Jindals, Rungta Mines and Reliance Industries, have also ventured into diamond exploration during this Plan period. Besides, a number of smaller Indian companies have also been granted RPs for diamond exploration. However, most of these companies have not carried out any systematic exploration.
Table-5.13
Company - Wise RP-PL-ML Status as on 31st March 2011
Total 302,062 210,892 2,100 881 10 0 Source: IBM web site
During the XIth Plan period, PLs over an area of around 2700 sq.km. were applied, of which PLs over 881 sq.km. have been granted to Rio Tinto, De Beers India and NMDC. Only one ML for diamonds over 9.50 sq.km. has been applied by Rio in MP, which is under process for approval.
With entry of private players and with introduction of latest technologies and expertise, the discovery rate has jumped exponentially. In the last 10 years a total of 84 kimberlites/lamproites have been discovered by De Beers and Rio Tinto alone, which includes 46 by De Beers and 38 by Rio Tinto. This is more than what GSI had discovered over the years until then. However, it goes to the credit of GSI that they have also discovered around 40 kimberlites and lamproites in the last decade, which will provide a base for further exploration by the private companies.
Consistent efforts by the Geological Survey of India to locate kimberlites have resulted in the discovery of more than 80 kimberlite bodies in the Indian Sub continent, i.e. 100 kimberlite and Lamproite bodies in India, kimberlites are located in Wajrakarur, Chigicherla, Timmasamudram and Kalyandurg, Siddanapalle, Chagapuram, Maddur, Kotakonda and Narayanpet areas in Andhra Pradesh and Karnataka, Behradih, Payalikhand, Kodomali, Tokapal in Chattisgarh, while lamproites are reported from Jaggayyapeta, Ramadugu, Aliabad, Banaganapalle, Chelima and Zangamarajupalle in Andhra Pradesh, Nawapara in Orissa, Majhgawan and Bunder in Madhya Pradesh and Damodar Valley in Jharkhand
As stated earlier, the most notable achievement has been the Bunder discovery in Madhya Pradesh by Rio Tinto. This is, by far, India’s largest diamond discovery and ranks amongst the world’s largest discoveries in the last decade.
Total expenditure in the last ten years by the two major private players, Rio Tinto and De Beers is almost US$ 100 million, of which Rio’s investment is US$ 70 million. Rio’s investment has been much higher due to the detailed investigations on the Bunder PL in MP. In addition, NMDC, Rungta Mines, Jindals, Reliance and others have also invested on diamond exploration.
5.9 Suggestions and Recommendations
5.9.1 Thrust on Diamond Exploration
That India has a favourable geological environment for diamonds, has been proved by the recent discovery of a sizeable diamond deposit by Rio Tinto at their Bunder Project in Madhya Pradesh. Moreover, De Beers and GSI have also discovered numerous kimberlites and lamproites in the last ten years.
World statistics show that less than 20% kimberlites/ lamproites are diamondiferous and that less than 1.0% result into diamond mines.
India has a favourable geological potential for diamonds over an area in excess of 1.0 million sq.km., including the 730,000 sq. km cratonic area. Of this area, barely 1/4th has been systematically explored under RPs.
Thus, there is a need for rapid coverage of the ground, with the latest technologies, in order to discover the kimberlites/ lamproites and to quickly access and select areas for detailed exploration.
5.9.2. Target for Diamond Production
Presently India imports 150-160 M ct of rough diamonds annually. The Majhgawan mine of NMDC has never touched a production figure of even 100,000 carats per annum. Whereas, Rio’s Bunder Project, which is at the pre-feasibility stage, may start producing around 3 to 3.5 Mct by 2016. However, even this would barely meet 2% of India’s huge demand.
However, India has the potential for new discoveries and should aim for meeting 5 to 7 % ie. 7 to 9 Mct annual diamond production by the end of the XIIIth Plan ie. by 2022. Considering the gestation period, anywhere from 5 to 10 years, from discovery to production, this is only possible if at least two Bunder-like deposits or several smaller deposits are discovered during the XIIth Plan itself.
For this, private investment needs to increase manifold and to attract this, India needs to have Investor friendly policies. 5.9.3. Value addition in Indian Diamond Industry India has been enjoying dominance in the world’s cut and polished diamonds market due to skill of the Indian artisan; India spends $10 per carat on the polishing and cutting of diamonds, against China's $17 and South Africa's $40 to $60. Currently India is not having any major diamond mines, almost all the rough diamonds which are cut & polished by its workforce are imported from Canada, Russia, Australia and African nations through trading hubs of Belgium, Israel, Dubai and China. In the past two decades, looking at India’s dominance, a number of players like Srilanka, Indonesia, Russia, Botswana & China tried to corner cutting and polishing business from India. However the Indian Diamond Industry managed not only to keep the technology of cutting and polishing of small diamonds but also learned and deployed the technology of cutting & polishing all shapes and sizes of diamonds, including the faceting of colour diamonds.
Demand for diamonds is overtaking supply as demand continues to grow, driven by the growth of emerging economies, such as China and India and Indian diamond processing industry is facing a problem of shortage of rough stones.
The new diamond mines are likely to come into production from 2016 onwards therefore Govt should ensure the security of supply of rough diamonds to guarantee the jobs of a million workers in the diamond sector.
Hence rules needs to be promulgated so that such diamonds mined be essentially traded in India only without sending it to other trading centres.
This will ensure lessening of transaction cost for the diamond manufacturing companies.
5.9.4. Investor-friendly Policies
Thus, if we have investor-friendly policies, remove bottlenecks, stick to time-lines and improve the regulatory regime, we will have a spate of investors, especially the “Juniors”. These small exploration companies or “Juniors”, with high expertise in exploration, are the backbone of new discoveries in countries like Australia, Canada and USA.
After all, India is competing for exploration investment against other countries and in order to do so, it has to have policies and regulations which are at least as attractive, if not more attractive than those countries against whom it is competing.
In order to remove the major bottlenecks and constraints identified, the following measures are required:
• Timely Grant of Mineral Licences
• State Government’s to follow “First in Time” principle
• On-line Mineral Tenement Information
• Simplify Procedure for Airborne Survey Permissions
• Streamline Procedure for Forest Permissions
• Quantum of Samples for collection to be specified for RPs also
• Simplify procedures for export of samples for testing purposes, for facilities not available in India
Availability of RP Reports after confidentiality period
5.9.6. Regional Surveys / Technology Upgradation by GSI
In general, GSI has provided a good geological data-base for the country, based on which private investors are applying for RPs for diamond exploration.
Going forward, with the aim of discovering deep seated mineral deposits, GSI needs to give emphasis on the following regional programmes during the XIIth Plan:
i) Regional Airborne Geophysical Surveys
GSI should have a programme for covering all the known mineral belts, cratonic and other potential areas on a grid of 250 m. line spacing, at a Mean Terrain Clearance (MTC) of preferably 80 m or at least 120, .as MTC above 120m does not give the desired resolution.
ii) Magneto-Telluric (MT) Survey
Our current understanding about the deeper geology, especially beneath the Indian Cratons and Deccan Traps is only limited. MT Surveys can be of great help in better delineation of the craton boundaries and better understanding of the lithosphere/ asthenoshere.
A regional MT survey data base for the country will provide another important tool for proper selection of areas for exploration, and aid in our quest for discovery of new mineral deposits, including deep-seated mineral deposits. GSI should undertake a national project to image in 3-D the lithosphere of the entire country. A collaborative programme by GSI, NGRI and Indian Institute of Geomagnetism (IIG) could be undertaken to cover the entire length and breadth of the country by MT Surveys. Some agencies, like Dublin Institute of Applied Sciences (DIAS) of Ireland, who have developed expertise in MT data processing and interpretation, could be consulted or approached for partnership in such a project.
iii). Lithoprobe Project
Canada has undertaken the Lithoprobe Project with great success. For instance, it demonstrated the applicability of high- resolution seismic reflection studies to mineral exploration. The project has many firsts, such as the development of portable seismic refraction recorder and a long-period magnetotelluric system. The seismic and MT data of Lithoprobe studies have provided significant new information relevant to exploration for diamonds in the Canadian shield. GSI should undertake a National LITHOPROBE Project on the same lines, as a multidisciplinary study of the whole Indian sub-continent. Such a project will provide a wealth of information, especially for targeting deep-seated mineral deposits.
Lithoprobe Project and Diamond Exploration Lithoprobe project will help the diamond exploration programmes, at scales from cratons to individual ore bodies. Specific transects will help outline the domainal nature, geometry and age relations of crust, subjacent mantle, and diamond-bearing roots in unusually rich detail for cratonic settings, such as those of the Dharwar, Bastar and Bundelkhand cratons, as well as circum cratonic mobile belts like Eastern Ghats Mobile Belt(EGMB) settings. The resolution of cratonic ensemble and its roots and mantle stratigraphy reconstruction as inferred from structural geometries observed in Lithoprobe seismic and magnetotelluric surveys, remain the clearest way to define targets in Archaean- Proterozoic shield settings.
The studies as enumerated above are the need of the hour in the Indian context and a national organisation like the Geological Survey of India should take lead in this endeavor to build synergy with the industry on one hand and academia on the other, to achieve the set goals of such a national project. iv) Teleseismics (Seismic Tomography) Project Although magnetotellurics has been proposed and accepted as a targeting tool, seismology is seen as a complementary technique in mapping cratonic boundaries. Analogous to lithosphere probing programs elsewhere in the world, a combined Teleseismics (Seismic Tomography) and Magnetotellurics Project is proposed. This would be a preferred method to image the 3D structure of the Indian continent - the extent of the Indian cratonic domains, the sub-continental lithospheric mantle and to delineate cratonic edges. In Africa the “Southern Africa Seismic Experiment” (1997-1999) and “Africa Array” scientific programme (2007-2011) were undertaken very successfully. Both programmes
were supported by a public-private partnership of organizations in academia, government and industry and aimed at building geophysical capacity and imaging the 3D structure of the African continent. The Southern Africa Seismic Experiment operated over a period of two years, with 82 broad-band seismic stations at 100km station spacing. More recently, Africa Array was a scientific programme established through a partnership of the University of the Witwatersrand, Johannesburg, Council of Geoscience, Pretoria (South Africa), the Pennsylvania State University (USA) and with private partnership by De Beers, Rio Tinto and BHP Billiton. Similar programmes are currently underway in Canada (Lithoprobe and related programs) by the Geological Survey of Canada, with participation by Universities and in Angola and Botswana, with participation by De Beers. 5.9.7 Upgrade GSI’s Laboratory Facilities
Precise chemistry of indicator minerals is required for search of Kimberlites and Lamproites as well as preliminary assessment of diamond potential of pipe rocks. For the purpose, equipment such as EPMA/SEM-EDX is required. 5.9.8 Upgrade of Diamond Industry
India is facing growing competition from China and due to the fact that producing countries in Africa wants a share of processing within their countries. Thus, for India to retain its dominant position in cutting and polishing, the diamond industry needs to upgrade their equipment and skills for cutting and polishing of larger size diamonds. The Government should also constantly review the import-export policies, with suitable incentives, as this sector is a major foreign exchange earner, providing considerable direct and indirect employment.
5.10 PRECIOUS STONES
Introduction
Coloured gemstones have been an integral part of the gems and jewellery industry at all times. Going by contemporary definition, any stone other than diamonds is labelled as a ‘Coloured Gemstone’ (diamond occupying the position of a separate sub segment due to its share in the overall global jewellery pie). Coloured gemstones may be precious or semi-precious:
Stones that qualify as being precious are Emeralds, Rubies and Sapphires.
Other coloured stones are labeled as ‘Semi-precious’; however, this terminology is changing, with the term ‘semi-precious stones’ being gradually replaced by ‘gemstone’ in common parlance.
Coloured gemstones are more often than not mined using picks, chisels, hammers and shovels by small scale miners. This is in contrast to diamond mining which usually comprises of very large, mechanised, highly efficient operations.
5.11 THE CLASSIFICATION OF GEMSTONES
Of the some 2000 minerals that have been identified, only about 90 have varieties that produce specimens possessing the requisite beauty and durability to be considered gemstones. Of this 90, only about 20 are particularly important to the jeweler.
Since most gemstones are minerals, the classification method used in gemology is the same one applied by mineralogists to the various minerals, with minor adjustments. Each mineral that produces gemstones is considered a gem SPECIES, A gem species is characterized by a definite chemical composition and usually a characteristic crystal structure. Therefore, each species possesses its own characteristic properties. However, most species include a number of different types of material with variations that are usually based on color and transparency; each of these is called a VARIETY.
5.12 DIFFERENCE BETWEEN PRECIOUS AND SEMIPRECIOUS
Perhaps the most obvious sign of a lack of appreciation of gemstones is the common use of the term "semiprecious". While in a famous retail store GEMOLOGIST noticed a couple examining with obvious interest and appreciation an attractive brooch set with green stones. He overheard the man ask about the stones in the piece. The "salesman", if he could be called that, answered, "Oh, those are just semiprecious stones called tourmaline". The prospective customers, who had shown keen interest in the brooch, left the store immediately without looking at other merchandise. This example points up a practice that is all too common among jewelers.
Almost every variety of the transparent gem species may occur in gem quality and be properly called a precious stone from a relative price stand point, whereas another specimen of the same variety may be almost worthless. Not every ruby is precious and not every piece of jade is semiprecious. This is one reason for calling all stones GEMSTONES and not classifying them as precious and semiprecious. More important is the fact that the moment that we call stones semiprecious, we have lessened their value in the eyes of the general public, and the desirability and sale of many stones of great merit are thus substantially decreased.
5.13 SNAPSHOT OF KEY PRECIOUS COLOURED GEMSTONES Emeralds: The wonderful green colour of emerald gives it a unique position in the gem kingdom. The green colour depends on the chromium content and iron traces serve to enhance it. Emeralds often contain inclusions and other flaws. Occurrences of emerald are reported from Rajasthan, Orissa, Tamil Nadu and Andhra Pradesh.
However, reserves have not been estimated so far.In Rajasthan, emerald occurs at a number of places in Udaipur, Rajsamand and Ajmer districts. Emerald bearing zones are found along 195-km long ultramafic rocks. The bands of vermiculite-actinolite schist with tourmaline are seen occasionally at the contact of pegmatites with emerald-bearing schist. Commercial deposits of emerald are reported from Tikhi, Kaliguman, Kanj-ka-Kheda, etc.areas in Rajsamand district However the finest emeralds are transparent. Unlike rubies and sapphires which undergo heat treatment for clarity enhancement, emeralds are not heat treated. Major producing centres for emeralds are Columbia, Brazil and Zambia. Rubies: Ruby is a variety of corundum (aluminum oxide) with chromium as an impurity. Synthetic rubies have been successfully produced since 1904. Apart from being set in jewellery, rubies are used in space research in connection with communication systems. Major production centres for Rubies are Myanmar, Madagascar, India, Afghanistan and Pakistan. Sapphires: Sapphires are available in colours ranging from very pale blue to deep indigo, depending on the quantities of iron and titanium present. Its chemical composition is the same as that of a Ruby – essentially corundum, which is the second hardest known natural substance after diamond. Apart from jewellery, sapphires are used in the manufacturing of jewel bearings, gauges, dies, and high grade abrasives. Key production centres are India, Myanmar, Sri Lanka, Thailand and Madagascar. 5.14 COLOURED GEMSTONES PRODUCTION
In contrast to the diamond industry, for which accurate figures are published regularly for almost every producing country, figures for colored stone production are almost nonexistent. Those few that are available are far from reliable. The reasons for this are related to the average size of the mining operation in each of the important producing areas, plus the absence of a central buying and marketing organization such as that in the diamond industry. There are almost no colored stone mining operations anywhere in the world that compare with even an average size diamond mine.
The tendency of the usual small operation is to conceal information, on both production and sales figures. In addition, in many foreign countries there is a strong tendency to conceal production from government taxing authorities, with the result that total production can only be estimated. Most of the colored stone mining areas are marginal and produce only when demand is high enough to yield a worthwhile price. Few colored stones could be produced, even under ideal conditions, in quantities that would make exploitation comparable to that of diamond feasible.
Although the most important colored stones are in sufficient demand to keep mining a constant activity in the major districts, even the most important districts in the world contain
these gemstones in a concentrations too low to warrant large scale exploitation in a high cost country such as the United States.By value, there is no question but that the most important sources of both colored stones and diamonds are the secondary or alluvial deposits
Fig: 5.10
5.14.1 World production of Emeralds (See Table 5.14) Columbia: Columbia is estimated to be the oldest producer of emeralds, having operations since 1000 A.D. Historically, emeralds have been mined in three main areas - Muzo, Coscuez and Chivor; with each area having several mines. The recent years have seen a shift towards new mining deposits in the La Pita area. Recent estimates indicate that while Muzo accounts for 10 per cent of the production, Cosquez produces 20 per cent and La Pita produces around 60 per cent. In terms of quality, Cosquez and La Pita produce commercial quality stones and Chivor produces a mix of fine and commercial stones. The top quality stones are produced in Muzo. Colombia’s political instability and increasing depth of mines has resulted in a decline in quality and quantity of emeralds as a whole. Brazil: Brazil is catching up with Colombia in the quality of emeralds mined as the mines get deeper. Production, estimated to be at 70 to 80 kilograms per month, is centred in the states of Tocantins, Golas, Itabira and Nova Era. In terms of volume, Brazil is the largest producer of emeralds. Zambia: It has been estimated that Zambia produces 20 per cent of the world’s emeralds. Zambian emeralds are known for their exceptional deep green colour, making them highly valuable. Kamakanga is the most prominent emerald mine.
eEstimated; estimated data are rounded to no more than three significant digits. 1Production was reported to be less than 1 kilogram annually in Ethiopia and Nigeria. 2Small amounts of emerald were reportedly produced in Mozambique in 2000 and China in 2003 and 2004, but information is insufficent to estimate production. 3Based on Colombia's reported exports in U.S. Geological Survey Minerals Yearbook, 1995-2004. Reported data included both rough and polished exports; figures were adjusted to correct for losses in cutting and polishing. 4Reported exports.
5.14.2 World production of Rubies (See Table 5.15) Myanmar: The Mogok region in the central part of Myanmar is the largest mining area producing the finest quality rubies. Mong Hsu in the north east of Myanmar is the second largest mining area producing rubies of lower quality but in far larger quantities. Madagascar: Vatomandry, discovered in 2000, is the largest ruby deposit in Madagascar. India: India has been the biggest supplier of low-end rubies. Andhra Pradesh, Bihar and Tamil Nadu produce facet grade rubies while Karnataka produces gem quality rubies. Most mining is done on a small scale, by small units of local producers. Because of their poor clarity, Indian rubies are often dyed and oiled.
Other production centres: Afghanistan is another prominent producer of rubies. However, political difficulties and rugged terrain have made mining in Afghanistan difficult and complex. There are two mines, one located at Jagdelek, east of Kabul and Badakhstan on the banks of Shignan river. Kabul is a major centre for the trade of rubies though most of it enters the market through Pakistan. Ruby deposits also occur in the belt extending between Hunza valley and Ishkoman valley in Pakistan. These rubies are transparent to translucent and brownish pink to pinkish red or deep red. Pakistan is one of the few regions in the world that is producing blood red rubies which fetch a very high price in the gem market. It is estimated that Hunza belt has a reserve potential of 1.8 million carats of ruby, spinel and sapphire.
Totale 4,958 5,516 10,171 8,288 6,962 7,941 8,712 6,499 6,536 9,088 9,992 eEstimated; estimated data are rounded to no more than three significant digits. 1Production was reported to be less than 1 kilogram annually in Nigeria and Somalia. 2Ruby was also reportedly produced in Brazil, Cambodia, Colombia, and Russia in recent years; however, information is not sufficient to estimate production. 3Reported exports. 4Production was reported to be 61 kilograms from 1996 to 1999; prorated over this period. 5Estimates are for Quy Chau mines only. Source: GJEPCs
5.14.3 World production of Sapphires (See Table 5.16) India: India is a notable producer of sapphires. Kashmiri sapphires, incidentally discovered in 1880 after being uncovered by an avalanche, are considered to be of a very high value. The key characteristic of Kashmiri sapphires is its pure and intensive blue colour which is maintained under artificial light. Myanmar: The colour of the sapphires found in Myanmar varies from royal blue to deep cornflower blue. Sapphire deposits occur in the Mogok region, Mong Hsu region and Kachin state. Mong Hsu region produces higher quantity of sapphires than Mogok region though the quality of produce is inferior. Though the quantity of pink sapphires produced by Kachin state is little, the quality is exceptional. Sri Lanka: Sri Lanka is home to some of the oldest sapphire mines in the world. Ratnapura district is known to have contributed to mining for thousands of years. Madagascar: Madagascar is one of the key producer of coloured gemstones. According to the International Coloured Gemstone Association (ICA) almost all gemstones except tanzanite, diamonds and jade are found in Madagascar. However, the industry is plagued by high levels of illegal trade. In the past decade, Madagascar has emerged as one of the key producers of sapphires.
eEstimated; estimated data are rounded to no more than three significant digits. 1Production was reported to be less than 1 kilogram annually in Nigeria and Somalia. 2Sapphire was also reportedly produced in Cambodia, Colombia, and Russia in recent years; however, information is not sufficient to estimate production. 3Estimates are for Shandong mines only. 4Reported production. 3Reported exports. 6Estimates are for Quy Chau mines only. Source: GJEPC 5.15 Overview of select semi-precious coloured gemstones Tanzanite: Tanzanite is one of the recent finds in the semi-precious gemstones segment, discovered recently in 1967. The stone is primarily mined and produced in Tanzania, exhumed entirely from weathered rock found in Merelani, Tanzania. Tanzanite occurs as orthorhombic crystals whose colour varies from colourless, yellow-green, brown, or blue to violet. Table 5.17 provides production figure. Colour is the most significant factor in determining the quality of tanzanite. Clarity is the second most important characteristic in the same. Carat weight comes next in order of significance and cut is the least important of the “4Cs” in determining the value of a tanzanite. Synthetic tanzanite has never been made. Topaz: The Oro Preto hills in Brazil hold almost the entire known commercial reserves of ‘Imperial’ and ‘Precious’ topaz. These hills produce colourless topaz which is then heat treated to give it a blue colour. Majority of the Topaz currently available in the market is produced by a single mine, Capao, located about five kilometers from the small village of Rodrigo Silva. While pink to reddish-orange is the most valuable colour, the most common colour of topaz is yellow with a reddish tint. Opal: Australia accounts for more than 95 per cent of the world supply of opals. The three states that house opal mines are Queensland, South Australia and New South Wales. Opals are found in locations all over the world, from Canada to Japan.
TABLE 5.17
WORLD TANZANITE PRODUCTION1, 2 (in kilograms)
1995
1996 1997 1998 1999 2000 2001 2002 2003 2004 2005
Tanzania
467 1,094
2,250
1,946
5,228
5,516
5,473
6,461
4,490
3,400
3,400
eEstimated; estimated data are rounded to no more than two significant digits. Source: GJEPC 5.16 Key processing centres for coloured gemstones
A few gemstones are used as gems in the crystal or other form in which they are found. Most however, are cut and polished for usage as jewelry. The two main classifications are stones cut as smooth, dome shaped stones called cabochons, and stones which are cut with a faceting machine by polishing small flat windows called facets at regular intervals at exact angles.
Stones which are opaque such as opal, turquoise, variscite, etc. are commonly cut as cabochons. These gems are designed to show the stone's color or surface properties as in opal and star sapphires. Grinding wheels and polishing agents are used to grind, shape and polish the smooth dome shape of the stones.
Gems which are transparent are normally faceted, a method which shows the optical properties of the stone's interior to its best advantage by maximizing reflected light which is perceived by the viewer as sparkle. There are many commonly used shapes for faceted stones. The facets must be cut at the proper angle, which varies depending on the optical properties of the gem. If the angles are too steep or too shallow, the light will pass through and not be reflected back toward the viewer. The faceting machine is used to hold the stone onto a flat lap for cutting and polishing the flat facets. Rarely, some cutters use special curved laps to cut and polish curved facets.
5.16.1 Cutting and polishing of precious and semi-precious stones has been mainly performed in the traditional low cost centres
Thailand: Thailand holds the top position in coloured gemstone cutting. It was in the 1980s that Thailand rose to prominence as a cutting center for gemstones. The development of skillful gem cutters through extensive training has been a success factor for Thailand. Proximity to the gem producing nations of Myanmar, Sri Lanka and Cambodia has also aided Thailand in easily sourcing the rough gemstones. Until recently, Thailand itself used to be a
significant producer of coloured gemstones. Thailand supplies around 80 per cent of the cut rubies and sapphires in the world. India: Jaipur is the world’s largest and most diversified center for cutting and polishing coloured gemstones. In 1927 when Jaipur was built, the maharajas of the time used to offer tax concessions to skillful artisans and jewellers thus laying the foundation of a thriving gemstone industry here. In 2005, India imported USD 83 million worth of coloured gemstones and exported USD 193 worth million worth of cut stones. Rough emeralds are imported from Colombia, rubies from Myanmar and aquamarines from Brazil. China: With rising labour costs in Thailand, China is replacing Thailand as a major cutting center for coloured gemstones. Sri Lanka: It is interesting to note that although the coloured gemstone cutting industry in Sri Lanka is an age-old traditional industry, it was only as recent as the 1980s (with industrialisation and the removal of trade barriers) that the industry began to make meaningful contributions to the country’s economy. However, the industry is currently facing a number of challenges such as competition from other low cost, more technology-savvy centres, difficulty in retaining talent, smaller enterprises losing out due to rapid fluctuations in gemstone prices etc.
5.17 Current trends The coloured gemstone industry is also drawn in to the web of the sweeping changes taking place across the upstream segments of the gems and jewellery industry Coloured gemstone mining countries increasingly processing in-house: • ZEIL (Zambia Emerald Industries Ltd.) is one of the largest emerald processing and cutting plants in the world involving more than 50 cutters. Madagascar and South Africa have already developed their own cutting industry. • Mineral Resources Governance Project (PGRM) has set up a lapidary school in the capital for two month cutting classes. A longer six month course has also been devised to train instructors who will then open regional cutting schools in gem-mining areas. The industry is getting more organised with the entry of large players who control an influential share of the supply • A case in point is that of Tanzanite One which acquired the Tanzanite mines controlled by Afgem, devising a new supply strategy for Tanzanite. Moreover, it has proposed the creation of Tanzanite foundation on the lines of Platinum Guild to promote Tanzanite. Stones that cannot be enhanced through irradiation or heat treatment are commanding higher prices because of the uncertainty over whether the other stones are treated or not. • An instance is the decrease in value of 3 carat yellow sapphire from USD 1000 a carat to USD 400 a carat.
5.18 Major occurrences of precious stone in India Corundum is found in metamorphosed shales and some unsaturated igneous rocks. In India it is found in association with kyenite and sillimanite in Assam, Meghalaya and Maharashtra and in syenitic rocks in Andhra Pradesh. It also occurs in parts of Madhya Pradesh and Chhattisgarh. In Kalahandi and Koraput districts of Orissa, GSI has identified blue Corundum , sapphire and Ruby. Paddar deposit in Doda in J&K has produced the famous royal blue and green variety of Sapphire.Precious and semi precious variety of Corundum have been reported from Tamil Nadu in Kangeyam belt over Karus and Kulithalai in Tiruchirapalli district. (Table 5 provides an overview of reserves and resources of a few precious stones in India, while Table 6 provides production details of a few precious stones in the country)
Table – 5.18
Indian Precious Stone Production
CORUNDUM AND SAPPHIRE Reserve/Resources of Corundum Ruby and Sapphire as on 1-4-2005
* An associated mineral with Kyanite and Sillimanite
Some details (*State-wise) of previous stones occurrences and production, as received from the respective states, is mentioned here below:- KERALA – Sporadic occurrences of gemstones like – suppliers from gravels of Karamana and Kulathupuzha rivers; chrysoberyl associated with complex type pegmatites in Thiruvananthapuram and Kollam districts; Alexandrite – Parassala, Nedumangad and Ponmudi area of Thiruvananthapuram district, and moonstone gravels at Aruvikkara and Noyyar valleys. No economically viable deposit has been reported so far. TAMIL NADU – Among the Precious stone yielding states of India, Tamil Nadu occupies a premier position and is known to yield a variety of gemstones both precious and semi precious varieties such as ruby, sapphire, aquamarine, iolite, amethyst, garnet, smoky quartz, etc. Besides these, chrysoberyl and emerald have also been reported from a few places in the state. Many gem cutting centers around Surat in Gujarat, Jaipur in Rajasthan, and Karur, Kangeyam and Trichy in Tamil Nadu have been the main centres of utilization of these gem stones. In fact, a major portion of the roughs which are cut and polished in Rajasthan and which eventually find their place in International markets are derived from the gem fields in Tamil Nadu.
Gemstone occurrences in Tamil Nadu are found mainly in four types of geological set up, namely:-i) associated with anorthosites and related rocks, ii) associated with pegmatites and pegmatoidal rocks, iii) associated with syenite and other alkaline rocks and iv) in garnet- sillimanite-graphite bearing para-gneisses.
Annual Production data : - Not available R.P/PL issued to Public/Private Entrepreneurs : - NIL ORISSA – there are a total of 28 gem tracts in Orissa containing ruby, emrald, sapphire, garnet, moonstone, Iolite, Alexandrite, Cat’s eye, beryl, aquaurarine, fibrolite, tourmaline, corundum, topaz etc. currently, there are six working mines, no pending PLs and 2 RPs. The production in 2008-09 was 365.1 kg while than in 2009-10 was 864.145 Kgs, all from Kalahandi district. Exploration for higher quality gemstones and better technologies for recovery is required. A project in collaboration with UNDP was taken earlier; a similar project needs to be undertaken again. 5.18.1 Indian Coloured Gemstones Industry India is known as the leading centre for cutting and polishing emeralds
India is the chief source of polished tanzanite
The country polishes the gamut of gems of virtually every hue
Jaipur - India’s major hub for cutting and polishing of coloured gemstones
5.18.2 India’s Export and imports of Coloured Gemstones The country is also a leading source of a spectrum of coloured gemstones, moving from its traditional concentration on emeralds, and later tanzanite, to today offering the world a dazzling array of choice in terms of colour and quality. The Indian coloured gemstone industry has also expanded enormously from its traditional roots and most exporters in Jaipur, the major centre, have incorporated semi-automatic
polishing machines and other modern technology into their set-up. Exports of coloured gemstones were US$ 315 million in 2010-11, the major importing countries being USA, Hongkong, Thailand, UAE and Japan. The total imports, on the other hand, amounted to USD 146 million, the major exporting countries being Hongkong, UAE, Brazil, Zambia, Thailand, USA and Tanzania .
Table – 5.20 India’s Import of Coloured Gemstones
[ Value US $ in Million ] ITEMS 1981-82 1991-92 2004-05 2005-06 2006-07 2007-08 2008-09 2009-10 2010-11
(p) EXPORTS 41 104 193 234 247 276 261 287 315
IMPORTS 19 46 83 115 132 147 106 117 146
Source: GJEPC 5.19.0 Action agenda for the Indian Government (Policy) Facilitating supply of Inputs
Ensure value retention for the Indian industry on domestic mining contracts awarded to international companies
Include raw material sourcing in the agenda of market focus programmes Commission exploration programmes and surveys to ascertain availability of coloured
gemstones in India Persist with direct procurement of coloured gemstones rough through
Government interactions Facilitating market access for Indian exports
Negotiate favorable trade regimes and agreements with countries which currently impose high tariffs on imports from India (e.g. Brazil, Mexico, China)
Coloured gemstones segment reform Spearhead initiatives to legalize current mining activity through an appropriate
licensing framework and develop a regulatory framework for new mining and exploration
1. INTRODUCTION: Gold has a high commercial status because it has always been in high demand for it's fine jewellery characteristics; enjoys high value even for a very small volume; easily encashable; indestructible and non-corrosive hence lasts forever as a commodity. Because of these qualities gold is often treated as currency. It is important to note that stock of gold in a country’s treasury and it's annual accumulation lead to growth of a Nation's Gross Domestic Product (GDP). Gold in bulk form is referred to as ‘bullion’ that can be cast as ingots or minted into coins. Gold bullion is traded in the commodity markets. On account of it's volatility in terms of price, gold has the ability to tilt the individual’s or a Nation's economic fortunes. People regard the investments made in precious metals in general and gold in particular as their stock-holding or savings. These are the reasons for the high demand for gold particularly in Asian countries. Gold Price Trends: Country wise official gold holding as on June 2011 is given in Table-G1. The table also shows the official gold holding as a percentage of the forex reserves each country holds. It is instructive to note that China’s official gold holding is reflected as a very small percentage of its huge forex reserve. This means, China has a huge potential to purchase major portion of the worlds mine production of gold every year. This one reason, amongst many other factors related to inflation and dwindling of world mine production should keep the world bullion price higher for years to come.
Table G1: World official gold holding Fig.G1: Gold reserve per person country wise in descending order
1.1. Characteristics of Gold: Gold (Symbol: Au, Atomic No.79) occurs in the Earth's crust as
a rare, non-radioactive metallic chemical element. The average concentration of gold in the earths crust is 0.005 g/tone which is much lower than most other metals. The predominant occurrence of gold is as native metal, often alloyed with up to 15% silver. The other gold minerals include alloys with tellurium, selenium, bismuth,mercury,copper,iron,rhodium,and platinum. There are no commonly occurring
gold oxides, silicates, carbonates, sulphates or sulphides. Therefore, gold generally occurs in a mineral form different to most other elements. Gold occurs as fine micron-size particles within some commonly occurring sulphide minerals such as pyrite, arsenopyrite, chalcopyrite and occasionally stibnite. Gold in extremely small quantities is associated with sphalerite (ZnS), pyrrhotite (FeS1-x), magnetite and hematite (both iron oxides). Most of the gold in native form contains minor amounts of silver, copper and platinum.
Pure native gold is soft but can be easily hardened by alloying with other metals such as silver and copper for purpose of jewellery. The content of gold in alloys is expressed in terms of carats. Pure unalloyed gold has a value of 24k (fineness 999). It's most important characteristic feature is that it is non-corrosive, highly ductile and malleable. It can be moulded into any shape and drawn as wires, hence it's greatest use is in Jewellery making.
It is important to recognize that from an economic point of view, the value of resources exploited today is greater than that of those exploited tomorrow. Mining industry being relatively labour intensive and largely situated in rural areas of our country deserves to be accorded priority status particularly in the case of gold which has an inherent strength as a tangible physical asset of great value for small volume and easily liquidatable. A large segment of our population including rural areas prefer gold not only as a piece of ornament but also as an investment for the future. Around 25,000 tonnes of gold, out of the 166,600 tonnes of above ground stocks ( Figure G2) is known to be available in India [Ref.R.H.Sawkar, Jour. Geol. Soc. India, 2011]. Fig.G2: Above ground sources of gold in the world 2. WORLD GOLD SCENARIO
2.1: Global Below Ground Reserve-Base: The term Reserve-Base refers to both Resources and Reserves. The global geological reserves of gold have been placed at 51,000 tonnes out of which, about 14% is located in Australia, 12% in South Africa, 10% in Russia, 6% in USA , 6% in Indonesia, 3.9% in Peru, 3.7% in China and 3.3% in Uzbekistan.
The global Reserve-Base of 100,000 tonnes is spread over South Africa (31%), Russia (7%), China (4.1%), Australia (6%), Indonesia (6%), USA (5.5%), Canada (4.2%), Peru (2.3%) and other countries (33.9%) as indicated in Table G2. Table G2: World Resource of Gold
(By Principal Countries) (In tones of gold content)
Country Reserve-Base % of Global Resource
World: Total (rounded) 100000 South Africa 31000 31% Russia 7000 7% Australia 6000 6.0% Indonesia 6000 6.0% USA 5500 5.5% Canada 4200 4.2% China 4100 4.1% Peru 2300 2.3%
Source: Mineral Commodity Summaries, 2009 2.1.1: Continuous increase in Global Reserve-Base: The global Reserve-Base has shown continuous increase despite it’s depletion of ~25,000 tonnes through mine production at an average rate of 2,500 tonnes per annum during the last 10 years (see Table G3). Table G3: Gold Reserve-Base increase over the years as a function investment in exploration
Year Reserve (tonnes)
Resource (tonnes)
Mine Production Remarks
1998 31,000 - Between year 2000 to 2010 the mine production was 25,000 tonnes
Global reserves and resources of gold are increasing due to increasing investment in exploration outside India
2005 - 89,000 2010 51,000 100,000
Country-wise reserve base with a comparison to that country’s mine production is given in Table G4. These figures indicate that despite a global gold production of about 25,000 tonnes over a period of 10 years, the global Reserve base did not diminish but tripled!!. This is attributed to the huge investments, of the order of Rs.172,000 crores (Rs 1.72 lakh crores), that went into exploration, feasibility studies and establishment of new mines. It requires an expenditure of anywhere between Rs.1 to 2 crores to discover a tonne of gold and convert it to mineable reserve.
Table G4: World Gold Reserve Base & mine production
Country Reserve Base
In tonnes(Yr 2009)
Mine Production in 2008 in tonnes
Mine Production in 2009 in tones
% of World Mine
Production China 4,100 288 332 13% South Africa 31,000 220 230 9% Russia 7,000 170 204 8% Australia 6,000 220 230 9 % USA 5,500 234 204 8% Canada 4,200 100 Peru 2,300 175 Indonesia 6,000 90 Ghana - 81 - PNG - 67 - Uzbekistan - 85 - Others 33,900 626 1353 53% TOTAL: 100,000 2356 2553
2.2:. GLOBAL DEMAND AND SUPPLY
2.2.1: Global demand in the last 10 years: The demand during 2001 was 3,729 tonnes valued at US$ 32.5 bn. The demand reached a 10 year high of 3,812 tonnes in 2010. It means over the last 10 years the demand for gold has increased only marginally although the value of gold has increased nearly five times at around US$150 bn due to increase in the market price of gold. The Figure G3 and Table G5 illustrate the current trends in global demand for gold.
Fig.G3: Global gold demand sector wise and the price trend [during 2004-2010]
Table G5: global demand sector wise The major gold demand has been for the jewellery, followed by investment and technology as per the data given in Table G5 . However, the share of investment demand has been significant from 2008 onwards. The gold demand during 2009 to 2011 in tonnage as well as sectorwise can be seen in the self explanatory Figure G4.
Fig.G4: Gold demand sector wise (2009-2011)
2.3: Gold Production: Year wise global production since 1970 is presented in the following Table G6 . The distribution of mine production of gold in the world, country wise is given in Figure G5.
Table-G6 @ In year 2009 China topped the list of major gold producing countries with an annual production of 332 tonnes.
The world mine production country wise during 2006 to 2008 is indicated in Table G7. The percentage share of goldmine production countrywise during 2008 is given in Figure G5.
Table G7: Gold production country-wise during 2006-2008 Forecast of world mine production as per World Gold Council report is, one of decline [Table G 8]. Fig.G5: Country-wise Distribution of gold production
Table G8 :Gold Supply and Demand Fore cast 2004 to 2015
2.4: Global Supply: The supply of gold in 2010 was 2,543tonnes from mine production and 1,653 tonnes by recycling. The total supply of gold was 4,196 tonnes. With the projected growth at 6% the supply during 2011 is expected to be 4,447 tonnes. As per the projection by GFMS and World Gold Council, the mine production is expected to be lower at ~2400 tonnes by 2015. The supply from old scrap is expected to cover the marginal deficit of the mine production (Table G9 & Figure G6).
Wold Gold Council
Table G9: Gold supply during 2009&2010 Fig.G6: Gold supply from 2009-2011 Table G10 reflects the mine production of China from 1984 to 2010 vis a vis total mine production of gold in the world. It is interesting to note the significant increase in the production of gold from 127 tonnes in 1993 to 345 tonnes by 2010 eclipsing South Africa since 2007.
Table G10: Total mine production of gold in China from 1984 to 2010 2.5: WORLD OFFICIAL GOLD HOLDING AND FUTURE PRICE TREND Gold price trend during 1950 to 2003 is shown in Figure G7a along with the estimated gold production and the price trend during last 5 years is given in Figure G7b. Currently gold price is at its peak ~ US$ 1600/Oz. The price is forecast to increase on the basis of a number of issues such as (i) rising inflation, (ii) decreasing trend in global mine production, (iii) China’s official gold holding which is a very small percentage of its forex reserve suggesting that it has a big potential to absorb a major portion of the future world mine production; and (iv) the estimated 11% increase in demand for gold in India. Expert analysis of the price trend indicates that the gold price may touch US$2000/Oz in the not too distant future. See Figure G7c.
Figure.G7a: Gold Price Trend Figure.G7b: Fig.G7c
Fig G7a: Price and production trend of gold from 1950 to 2003; Fig. G7b: Gold price trend during the last 5 years; Fig.G7c: Gold price forecast by GFMC during 2011 3: INDIAN SCENARIO 3.1: Indian Gold Demand: The demand for Gold in India is not only the highest in the world but is reported to be the fastest growing market. India is a net importer of gold as well as silver. Indians buy gold for cultural reasons. With a large segment of our population preferring gold as a piece of ornament, as an investment for the future and as a piece of security particularly in rural areas and the Govt. of India ensuring liberalized supply through imports albeit at great cost in foreign exchange, the demand for gold can only increase in the future. Indian economy is growing at 8% plus & is projected to grow @ 9% during the next plan period. In addition to demand for jewellery, market deregulation has resulted in gold being
Year 1978 1984 1993 1994 2002 2003 2010 Total mine production in China Tonnes
n.a 59 [5.1%]
127 [5.5%]
130 [5.7%]
190 [7.5%]
202 [8.0%]
345 [13.8%]
Total mine production in world,Tonnes
971.9 1148 2309 2296 2520 2520 2500
traded on the multi commodity exchange of India (MCX) and the National Commodity and Derivative Exchange (NCDEX). After the introduction of Gold Exchange – Traded Funds[ETFs] that use gold as a underlying asset, goldlinked debentures are also emerging as an investment option. The World Gold Council (WGC) has forecast the gold consumption in year 2011 to be 1167 tonnes [Fig G8]. The import bill of India due to gold (about 35 billion dollars) is the second highest next to oil which is placed at ~100 billion US dollars per annum. This is one of the factors behind India’s high trade deficit.
Fig.G8: Gold demand in India & China: Projection for 2011
3.2: Gold Reserve-Base of India: Current Status of Reserves & Resources of Gold in the Country: Compilation attempted by the members of this Core Group indicates that the total Reserve-Base in the country as on 1.4.2011 is 658 tonnes of gold metal. This tonnage is spread over 13 different States of the Country (Table G10). Out of this tonnage 167 tonnes is categorized as Reserves in the sense they are economically mineable. The remaining about 491 tonnes of metallic gold is classified as resource of which 265 tonnes is the actual drilled resources (UNFC……..) and the remaining 226 tonnes is the projected potential resource which falls under 331/332 UNFC categories. These resources of gold have to be upgraded through detailed prospecting to feasibility studies in order to convert them to mineable reserves. Feasibility studies include EIA and EMP studies amongst a host of other mining related issues.
Table-G10 ALL INDIA RESERVES/RESOURCES of GOLD, STATE-WISE EXPRESSED IN
3.3: Gold Production in the country: India’s contribution to the world mine production is insignificant being 2.22 tonnes which continues to come from only one major producing mine and its two satellite mines viz. (i) Hira-Buddini and (ii) Uti, all belonging to Hutti Gold Mines Ltd. In year 2009-10 HGML produced 2,070 kg of gold valued at Rs.339.38 crores and earned a net profit of Rs.93 crores. In year 2010-11 the HGML produced 2,220 kg of gold valued at about Rs.404.73 crores and earned a net profit of Rs.102 crores. The production of gold bullion during 2006-09are indicated in Table G11.
Table G11: Gold production in India during 2006 to 2010 from Mines and as by-product of smelting of copper concentrates
*Includes gold recovered as by-product from copper concentrates by Hindalco Industries Ltd and HCL.
3.3.1: Production in Hutti mines has declined but the Reserves were augmented: The production at Hutti Gold Mines in year 2004-05 was 3.5 tonnes. In 2010-11 the mine production was 2.22 tonnes. The best opportune time for significantly stepping up the production is now for the fact that gold is enjoying an all time high market price of ~Rs.250 crores per tonne. Hutti Gold Mines Ltd has a production schedule according to which it aims to reach a production of 2.9 tonnes during the next plan period. The Hutti mines has a proven reserve of 52.55 tonnes (UNFC 111) and inferred resource of over 75 tonnes. Therefore, HGML should take steps to increase its mine production to at least 8 tonnes by the end of the 12th Plan period.
3.4: By-Product Gold: It is significant to note that a major portion of the country’s production of gold comes as a by-product from anode slimes resulting from smelting of copper concentrates indigenously produced in Jharkhand State and copper concentrates imported by Hindalco(Birla Group), Sterlite Group (which is currently exporting the Anode slimes and not producing gold with in the country) and M/s Hindustan Copper Ltd. The by-product gold production is in the range of 6 to 12 tonnes in the last six years. The by-product gold in 2007-08 was 12.1 tonnes. In 2010-11 Hindalco produced 7 t of gold & 45t of silver. Together with the primary mine production the total production of gold in the country stood at 9.22 t during 2010-11.
It is considered prudent to import more copper concentrates to increase the domestic supply of gold to cater to the ever increasing demand within the country. However, the focus should be to encourage the private sector in the country to develop more gold mines for indigenous production in the shortest period possible. The projected production schedule presented by HGML is given in Table G13.
Table G13: HUTTI GOLD MINES LTD: Production Schedule for next 5 years
Note: No. of working days considered is 360 days 3.5: Gold import: India imported about 963 tonnes of gold during 2010 and the projected import figures till 2017 are indicated in the Table G14. Considering the world gold production of ~ 2500 tonnes, which has been projected to remain more or less constant till 2015, there is a need and urgency to look for avenues to augment the gold production in the country.
Table G14: Import of gold ACTUAL PROJECTED YEAR 2007 2008 2009 2010 2011 2012 2013 2014 2015 2016 2017 TONNES 698 771 851 963 1059 1176 1305 1449 1608 1785 1982 RATE OF GROWTH @11% 4: GEOLOGY OF INDIA 4.1: Highly Favourable For Gold Exploration. One of the important criteria for attracting investment into exploration and mining, particularly precious metals, is favourable geological conditions similar to those of gold rich
geological terrains of the world specifically Neoarchaean greenstone belts and Mesoproterozoic fold belts. In this regard India is well placed as acknowledged by our premier national organization, the GSI, as well as private investors who have surveyed large extents of the country in the last 15 years. Out of India’s land area of 3.3 million sq km approximately 2.4 million sq km comprises hard rock. About 700,000 sq km i.e. 25% of the hard rock area holds potential for mineral resources including precious metals. About 10,000 sq km area is under leases for mining and quarrying. Out of the 700,000 sq km available for mineral exploration 470,000 sq km was granted on RPs of which about 399,000 sq km area was for precious metals. Only 462 sq km or 0.12% of the granted RPs has been granted as Prospecting Licences. Almost the entire area sought for reconnaissance by private investors & PSUs covers Archaean Greenstone belts and Proterozoic Fold belts which are spread over in parts of Karnataka, Andhra Pradesh, Chhattisgarh, Jharkhand, Orissa, Eastern Maharashtra, Madhya Pradesh, Rajasthan and small portions of Kerala, Tamil Nadu, West Bengal and Meghalaya.
4.2: Presence of numerous gold prospects About 700 gold prospects, occurrences & gold shows are known in the country today. They are spread over 13 States of the Country and also in parts of the Himalayas. About 90 prospects among the 700 have resources which have the potential to deliver mineable gold reserves. About 491 tonnes of gold resources are known to exist in these deposits/prospects besides 167 tonnes of Reserves. Potential exists in the known geological tracts of the country to identify an additional 1000 tonnes of gold (Figure G9 & Table G15).
Fig.G9: Geological map of India showing gold deposits and Prospects 4.3: Craton-wise Productivity of Greenstone belts in terms of Kg of Gold per sq.km area: The following table shows, despite the fact that the geology of India is closely comparable with the other gold resource-rich cratons, the productivity of greenstone belts in
the country for eg., Dharwar Craton, in terms of kg/sqkm is only 8. It suggests that India is grossly under-explored.
Cratons Kg/Sq.km. 1. Yilgarn Block, Western Australia 50 2. Abitbi Belt, Slave Province, Canada 55 3. Barberton Belt, Rhodesia and Kaapvaal 80 4. Dharwar Craton, India including Kolar & Hutti Gold Field 22
(Excluding Kolar and Hutti) 08
Fig G7: Important areas for precious metal exploration
Geographic Area of Archaean greenstone belts and Proterozoic Fold Belts important for
Precious metals Exploration
BELTS Area In Sq Km
Dharwar Craton 227,700
Singhbum Belt 34130
Mahakoshal Belt 56710
Sakoli Fold Belt 4219
Kotri belt including Bailadila, Abujmahar & Sonakhan (Bastar Craton) 11431
Ophiolite Belt + Precambrian of the NE India )Rajasthan Proterozic Belts:
17,940200,000
Total area available for precious metals exploration : 715,030
DC
[Ref : Geological map produced by GSI. Area of the Cratons outlined by Dr. Vasudev
5. RESERVES AND RESOURCES OF GOLD: AN ANALYSIS 5.1: India Failed to Convert Existing Resources into Reserves: India failed to attract the required level of investments mainly due to delay in granting of PLs. Prospecting is necessary to convert the known resources into mineable reserves. The 11th Plan document had indeed called for conversion of known resources of 412 t of gold as at the end of March 2005 into reserves. That did not happen. The net result was that the investment and efforts that went into proving up of this resource remained unutilized for Societal benefit and nation’s economy. These issues speak of the urgency needed to convert the existing resources into reserve and reserves into mines.
5.2: Growth Pattern of India’s Gold resources (Table G16): The growth of gold resources through exploration since independence is briefly reviewed below. Contributions from the private sector to the gold resources of the country came about from year 2000 onwards after the RP was introduced.
Year 1955: By this year 2 gold mines were in existence viz. Hutti gold Mines and Bharat Gold Mines.
Table G16: YEAR-WISE BUILD-UP OF GOLD RESOURCES IN THE
COUNTRY
Reserve Resource Total R+R
Ore Metal Ore Metal
Year 1980 9.84 mt@ 6g/t grade
59.00 t ? ? 59.00 t
Year 1996* 5.18mt 21.20 t 12.50 mt 45.50 t 66.70 t
Year 1998 6.71mt @
6.39g/t grade
42.87 t ? ?
As on 1.4. 2000 10.00 mt 59.00 t 174.00 mt 128.00 t 187.00 t
As on 1.4. 2005 19.00 mt 85.00 t 371.00 mt 412.00 t 497.00 t
As on 1.4.2011 167.162 t - 265.146 Indicated + 226.58 inferred = 491.726 t
658.888 t
% Increase between Years 2000 to 2005
42% 20% 53% 68% 62%
% Increase between Years 2005 to 2010
20% 17% 25%
Year 1980: 9.84mil tonnes of 6 g/t grade (59 t of gold) was reported as resources by the GSI. This could be attributed to the reserves established by underground mining at Hutti Gold Mines and Kolar Gold Fields including the Chigargunta Gold Mines in A.P. State. The GSI, before 1980 confined its exploration essentially to Hutti & Kolar belts with the main purpose of finding the extensions of gold lodes of the existing mines at Hutti, Wondalli, Uti, Buddini and Hira-Buddini in Hutti Greenstone belt; Chigargunta, Manigatta, Bisanattam, Western lodes of Kolar Gold Fields in Kolar Greenstone belt and Yeppamana-Ompratima Mines at Ramagiri. Some drilling had been initiated in the 12km long Ramagiri Gold Fields and its extensions covering Bhadrampalle, Penakacherla, Venkatampalle in Hungund-Penkachrla-Ramagiri greenstone belt of Andhra Pradesh. By Year 2000, 187 million tonnes of ore of varying grades were proved. It included 59tonnes of Reserves which is attributable to Hutti Gold Mines and it’s satellite mines at Uti, Hira Buddini & Ajjanahalli. The Resources came from Kempinkote, Chinmulgund,
Lakkikoppa and Gadag Gold Fields in Karnataka; Jonnagiri in AP State; Lawa and Kundarkocha in Jharkhand State, Sonadehi in Chhattisgarh, Maharajagadai and Attappadi belt in Kerala State. For the first time Bhukia and Jagpara in Rajasthan appeared on the gold resource map of India. In April 2001 the Kolar Gold Fields of BGML was closed down. The exact reserves of gold left in the deep mines of the Kolar Gold Fields is not known. Even though the Chigargunta mine in the southern part of Kolar belt and Ramagiri Gold Mines were producing about 300 kgs of gold per annum, the axe fell on these mines too when BGML was declared closed by the Ministry of Mines. About 15 tonnes of drilled gold resource/reserve is estimated to exist at the moment in the two mines of Chigargunta area and Bisanattam mine. About 22 tonnes of drilled gold resource are likely to exist in the old gold mines spread over some 50 km tract extending from Jibutil in the South and Venkatampalle in the North in Ramagiri-Penakacherla greenstone belt. Year 2000-2010: Most of the States started granting Reconnaissance permits in year 2000. ~399,000 sq km area was granted for reconnaissance exploration of precious metals. Alongside GSI and MECL, the private sector too made new discoveries and defined resources of inferred to indicated JORC categories through reconnaissance drilling. The result was that within a period of 5 years the gold resources of the country quadrupled from 128 tonnes to 412 tonnes, an increase of 68%!!. What was needed at this juncture was conversion of the extant resource into mineable reserves as suggested in the 11th Plan document which did not happen. Only an area of 462 sq km which is 0.12% of the granted RP was approved for grant of PL by MoM (see Figure G9), many of which took more than 3 years for the States to execute the PLs due to Forest Clearance or lack of village maps!!. It took 13 years for the State owned PSU M/s Hutti Gold Mines Ltd to get a Mining Lease for gold!!
Fig .G9: Exploration of gold status from 1994
Marginal increase (17%) in resource position happened due mainly to the continuation of GSI’s drilling programmes and to some extent by the private sector in the 11th Plan period. However, the private sector continued waiting for grant of more PLs. This is the main reason why a substantial portion of the known resources of 412 tonnes could not be converted into mineable reserves through intensive drilling and feasibility studies. Conversion of resources to reserves happened in the PL blocks granted to 2 private companies in Karnataka State and in the existing mines held by M/s HGML as indicated below. The net conversion of resources to reserves was only 20%. 5.3: Reserves in Hutti Gold Mines: The existing proven gold Reserves (UNFC111/121/122) in the Karnataka State-owned Hutti Mines and its satellite mines of M/s HGML is placed at 97.61 tonnes of gold. In addition, the Mines owned by M/s HGML have a resource of 76 tonnes of gold. The total Reserve-Base is established by Hutti Gold Mines Ltd at all it’s mines is presented in Table G17.
Table:G17. Ore Reserves and Resources in Hutti Gold Mines & It’s Satellite Mines
*1: Dr.M.L.Patil’s personal communication in writing at the meeting of the Core Committee held on 2.8.2011.
6. FORECAST OF GOLD MINE PRODUCTION IN INDIA DURINGTHE 12TH 5 YEAR PLAN PERIOD:
6.1: Convert the resources into reserves and reserves into mines: India today has a gold Reserve-Base of 659 tonnes which includes resources & reserves established so far by the GSI, one State PSU and the Private sector. The need of the hour is to convert the Resources into Reserves and Reserves into Mines. This is exactly the suggestion contained in the 11th plan document ( page 110 in Chapter VI on Gold). Therefore, there is a need for devising methodology for fast tracking clearances for granting of PLs and MLs. It is possible to bring on production line 17 new gold mines. The list of existing mines and new gold deposits that could be converted into producing mines are presented in Table G17.
In view of the resources/reserves outlined above, it is not impossible to produce 45 tonnes of gold in the last year of the 12th Plan period as indicated in Table G17, summarized in Table 17A. The Locations of the future gold mines are presented in Figure G10.
Fig.G10: Locations of new gold mines proposed to be opened during 12th plan period
LOCATIONS OF NEW GOLD MINES
PROPOSED TO BE OPENDED DURING
THE 12TH PLAN Bhukia
Hutti Gold Field & Satellite MinesMaski_BuddiniMangalur_JainapurKolar_SurapalleKolar_Chigargunta_Bisanattam_MkondaKolar TailingsKolar North_ManigattaGanajur_KarajgiMangalgatti_BhavihalAjjanhalli GroupGadag_Sangli & Hosur & SatellitesHanni_AjjampuraKempinkoteJonnagiri GoldFieldRamagiri_it’s extensions to N & S Bhiwapur_Pular-Parsori_Marupar & CoSonakhan GoldField ChhattisgarhPathalgaon Goldfield in ChhattisgarhGurharpahar and it’s extensionsBhukia GoldFieldGold Mines in Jharkhand including
Kunderkocha
Besides, the 12th Plan period should lay the foundation for development of 33 new mining centres as listed in Table G 18..by facilitating grant of Exploration Licences & Mining Leases faster than happening at the moment. The Govt of India may set a goal to reach an annual mine production of 100 tonnes gold per annum by year 2025.
Table G17A. Summary of Forecast of Production of Gold during the 12th Plan Period
1) Subject to significant expansion & mechanization of the mines; also financial support & speedy clearances from State Govt. 2) Subject to MOM’s decision making to call global tenders 3) Subject to resolution of the conflict between RSMML & IndoGold
SUB TOTAL 3.30 9.55 11.95 17.15 17.15 27.20 PRIVATE SECTOR 1) RMML (MSPL) 2) Geomysore Services (India) Pvt. Ltd. 3) Deccan Gold Mines Ltd. & Deccan Exploration Services 4) Kundarkocha Gold Mine currently held by M/s Manmohan Minerals
- - -
0.10
0.8
1.72
1.80
0.10
1.00
2.46
3.00
0.25
1.00
6.34
3.00
0.30
1.00
6.98
3.00
0.30
5.00
7.97
4.00
0.30
Subject to speedy Grant of PL’s, ML’s & other related clearances
17 new mines + the currently operating gold mines belonging to Hutti Gold Mines Ltd
28.00
TOTAL of Mine Production
3.40 13.97
18.66 27.79 28.43 72.47
Byproduct Gold from Hindalco/Birla & STERLITE
6.0 16.0 16.0 16.0 16.0 28.00 Subject to Copper smelting capacity expansion & Relief on ED + other tax incentives
GRAND TOTAL 9.40 29.97 34.66 43.79 44.43 100.47
Table G17.Forecast of Production of Gold during the 12th Plan Period
Location of Mine/Prospect
2011-12
2012-13
2013-14
2014-15
2015-16
2016-17
Vision 2025-30
Remarks
Hutti Gold Mines Ltd.(Proposed): including Hutti Mine proper, Uti Gold Mine, Hira-Buddini:
Core Committee’s suggestion:
716,000 @ 3.75 g/t = 2.68 t
3 t
722,000 @ 3.99
g/t = 2.88 t
3 t
727,000 @ 3.99
g/t = 2.90 t
4 t
732,000 @ 3.99
g/t = 2.92 t
5 t
736,000 @ 3.92
g/t = 2.88 t
8 t
8 t
*15 .00 t
*15t:Subject to significant expansion ,mechanizationof the mines and additional exploration besides modern Technology inputs; also timely approval budgetary support; EC/FC etc. Relief on Excise Duty and taxes. Gold Refinery of higher capacity to accommodate higher production .
Ajjanahalli Gold Mines (HGML JV) (reopening of old and starting of new mines)
(i) Ganjur Gold Mines (ii) Mangalgatti Gold Mine, Dharwad
Bharath Gold Mines Ltd. a) 35 mil t of 0.55 g/t recoverable grade Tailing dumps in KGF @ 5000 tpd processing. b) Chigargunta Gold Mine-1 and Gold Mine-2 (reopening) c) Bisannattam Gold Mine (reopening) d) Ramagiri Gold Mine (reopening)
- - 10.0 10.0 10.0 10.0 20.00 t Relief on ED other tax incentives
Besides the above, 33 Potential new gold mines in India, listed in Table18 could be developed into production units at the end of the Plan period provided clearances happen at all levels within the first 3 years of the 12th plan period. Table18: 33 Gold Prospects having resources of different categories that could be developed into mines by 2025-30 Future plans of M/s HGML, Karnataka: Sinking a new shaft of 1000 meters depth at an envisaged cost of Rs.204 crores
Development of Main reef at an estimated cost of Rs.14.74 crores To develop the underground mine at Uti project at an estimated cost of Rs.14.85 crores. To ensure the plant efficiency at the new Sag & Ball mill plant and develop systems to ensure
minimum down time. To revive the Ingaldhal copper deposit in a joint venture with M/s HCL.
7. GLOBAL EXPLORATION EXPENDITURE TRENDS AND FORECAST FOR INDIA
TOTAL of Mine Production GRAND TOTAL
- -
- -
13.97 t
29.97 t
28.42 t44.42 t
74.47 t 102.47 t
KARNATAKA STATE 1. Kempinkote ANDHRA PRADESH 2. Manighatta 4. Bhadrampalle
15. Hirenagnur Gold Mine 16. Buddini-Maski Gold Mine 17. Kadoni Gold Mine 18. Uti South West Extension 19. Hutti Mine North Prospect) 20. Jainapur 21Wandalli Gold Mine 22.Surapalli Gold Mine Total 22 new gold mines in Karnataka
The current global exploration expenditure on gold alone is 5.71 billion US dollars (Rs.25,695 crores) which is 51% of the global all-minerals exploration expenditure (Table G20) which resulted in augmenting the resource base from 31,000 tonnes in 1998 to 100,000 tonnes by 2009 in a span of 11 years. The global investment on gold exploration was in the range of 3 to 4 billion dollars in the last 10 years. The source of information for world global exploration expenditure is Metals Economics Group, report prepared on World Exploration Trends for the PDAC international Convention held in March 2008 and 2010 in Toronto, Canada. 7.1: Forecast of exploration expenditure needed in India to achieve a targeted production of 45 tonnes of gold per annum by the end of 12th Plan Period: It is estimated that around 150 crore was spent during the last five years on gold exploration in India. It is necessary to carry out a huge amount of Core and RC drilling of the order of ~ 1million metres to convert the existing resources into mineable reserves and to identify new resources. Participation of the Private explorers in this endeavor is vital in realizing the projected production figures. The investments required is of the order of about Rs.1000 crores and another Rs.3000 crores for development of new mines and processing facilities to achieve the targeted production.
Table 19: Global Exploration Expenditure on Gold and PGE
8. REVIEW OF 11TH PLAN PROJECTIONS AND RECOMMENDATIONS The 11th plan document recognized the fact that India is the world’s biggest market for gold with an average annual consumption of about 800 tonnes of gold. The 11th plan document placed the gold resources of the country at 416 million tonnes (equivalent to 497 tonnes of gold metal) as on 1.4.2005. Of these 19.25 million tonnes (= 85 tonnes gold metal) are under ‘Reserves’ category and 397 million tonnes (= 412 tonnes gold metal) are under ‘Resources’ category. The later includes 6 tonnes categorized as placer gold resource. The 11th plan document emphasized the need for small scale mining of gold, adoption of modern gold extraction technology to treat low grade ores and modern methods of exploration particularly in the matter of selecting exploration targets.
Regarding the recommendations of the 11th plan document the following issues need to be reviewed and reconsidered.
1. A total of more than 110,740 sq km area has been noted in the document as potential for gold mineralization. Whereas, the area available for exploration exceed 700,000 sq km.
2. The production from the existing gold mine at Hutti in Karnataka was projected to be stepped up to 3.245 tonnes during 2009-10. This could not take place.
3. Kundarkocha gold mine in Jharkhand, which was the first private sector gold mine to be established in the country by M/s Manmohan Mineral Industries Pvt. Ltd., kept a production target of 200 kg of gold per annum. However, no such production is reported so far from this mine.
4. Revival of Chigargunta and Bisannattam gold mines and also reprocessing of the 35 million tonnes tailing dumps all belonging to BGML was another recommendation made in the document. These revival recommendation could not materialise.
SUMMARY AND RECCOMMENDATIONS The existing untapped gold ore resource is of the order of 490 tonnes of gold metal besides a reserve of 167 tonnes as of 1.4.2011. Geological considerations point to the potential that exist for establishing an additional resources of the order of 500 tonnes in the next 5 years. The available information on about 20 operating plants elsewhere in the world indicate that low grade (< ~2 g/t) and metallurgically difficult ores can be economically recovered at a market price in the range of 800 to 1000$ per Oz (~31 gm). However, there is a huge gap in the supply of technical man power to meet the requirement of opening up of 17 new mines and to bring the targeted ~ 45 tonnes of gold production into reality with in the 12th plan period. Therefore, HRD-related issues, besides investor-friendly laws should receive high priority. Between 1980 and 1990, Australia has increased production by 782%: North America by 460%: As the geological characteristics of granite-greenstone belts in India is more or less the same as in these countries it should not be difficult for India to achieve at least the targeted production during the 12th Plan period. Measures needs to be done to realise the gold bearing potential of the country On the basis of all the data on hand it is not unrealistic to set a goal of 28 tonnes/annum of gold production directly from 17 mines to be reached by the end of the 12th Plan period and a vision of 100 tonnes of production by 2025-30. To achieve the targeted gold production, the investments required is of the order of Rs.4000 crores, depending upon the magnitude of resource drilling that is to be undertaken and size of processing plants. Drilling meterage needed is approximately 1 million metres which could be achieved over a period of 3-4 years.
PLATINUM GROUP OF ELEMENTS (PGEs) INTRODUCTION
The Platinum Group of Elements (PGEs) covering platinum (Pt), palladium (Pd), rhodium (Rh), iridium (Ir), osmium (Os) and ruthenium (Ru) find applications in several important fields including automobile industry, medicine, jewellery, electrical and electronic sectors. About forty percent of the world supply of platinum is consumed by the jewellery sector. Due to their excellent properties and scarce occurrence, PGEs, especially platinum and palladium like gold are considered as a safe investment. Platinum, being more resistant to corrosion, has also got several industrial applications. It is used in the automobile industry as oxidation catalysts in catalytic converters to control exhaust emissions. Palladium, rhodium, iridium and ruthenium are used in electronic and electrochemical industries, while osmium finds applications in the medical field, such as in chemotherapy and pace makers (alloy of Pt and Os). These metals are poised to play a vital role in fuel cell technology once the economic viability of fuel cell is established, for which sustained efforts are going on around the world. As these metals are scarce in their occurrence in the Earth’s crust, their production is reported from very few countries e.g. South Africa, Zimbabwe, Russia, USA, Canada, and Australia. In India not a single gram is produced from mine sources and sustained efforts are going on to explore the potential PGE occurrences and to identify resources. GLOBAL SCENARIO Geological Occurrence: The six platinum group elements or PGEs (Ru, Rh, Pd, Os, Ir and Pt), are a family of six grayish to silver-white metals, except for osmium which has a slight bluish tinge, with close chemical and physical affinities. These six elements are classified into two groups with reference to the specific gravity of gold [19.2]. The elements, Ru, Rh, Pd (sp.gr ~ 12-12.4) are lighter, while the other three elements, Os, Ir and Pt are heavier than gold with sp.gr in the range 21-21.5. Distribution of resources
The largest reserves of PGE are located in the Bushveld Igneous Complex [BIC] of South Africa. The world reserve base (refer Table 6C.1 and Fig 6C.1 overleaf) of PGE is estimated to be 80,000 tonnes localised mostly in South Africa (87.5%), followed by Russia 8%) and USA (2.5%).
Production PGEs are produced commercially from primary ore deposits, secondary sources and by recycling of the above-ground resources. Primary ore deposits are those where the mine is
operated exclusively for PGEs, while secondary production comes from Cu-Ni sulphide ores, where PGEs are recovered as by-products. World Resources of PGE (By principal Countries)
Country Reserve base (In tonnes)
World: Total(rounded) 80000
Canada 390
Russia 6600
South Africa 70000
USA 2000
Other countries 850
Source: Indian Minerals Year Book, 2009.
Significant primary PGE deposits are situated in the Bushveld Igneous Complex (BIC) of South Africa, Great Dyke region of Zimbabwe, Lac Des Isles in North America, and Stillwater Lake in USA. The secondary resources [PGEs as by products] are obtained from Russia, Canada, and Australia. The PGEs commercially exploited at BIC are reported to contain 4-10 g/t in the Merensky, UG2 and Plat Reef ores. At Stillwater Lake, the grade of PGEs bearing ores is ~20g/t and in the Northern American deposit of Lac Des Isles the grade of PGEs is around ~ 2-4 g/t. Mine production by Principal countries Mine production (exclusively) by principal countries from 2006 to 2010 is given in the following Table-6C.2. While the figures of 2006 to 2008 are for the complete PGE group, the figures for 2009 and 2010 pertain to only Pt. and Pd. It is evident that South Africa is the predominant producer of PGEs accounting for over 60% of the global production.
Mine production of PGMs (By Principal Countries)
(In tonnes of metal content)
Country 2006 2007 2008 2009* 2010*
World : Total 504 498 452 373 380
Canada
Platinum 8.00 8.00 7.40 4.60 5.50
Palladium 14.00 14.00 12.90 6.50 9.40
Other platinum group of metals
0.90 0.90 0.80 NA NA
Russia
Platinum 29.00 23.00 25.00 21.0 24.0
Palladium 98.40 96.80 87.70 83.2 87.0
Other platinum group of metals
15.60 14.50 14.50 NA NA
South Africa
Platinum 168.13
165.84 146.14 141.0 138.0
Palladium 86.27 86.46 75.54 75.1 73.0
Other platinum group of metals
53.14 58.62 54.09 NA NA
USA
Platinum 4.29 3.86 3.58 3.83 3.50
Palladium 14.40 13.31 11.94 12.7 11.6
Other Countries 11.87 12.71 12.41 26.06 28.6
Source: 1. Indian Minerals Year Book, 2009
2. Mineral Commodities Summary, USGS, Jan.2011
* indicates production figures for Pt and Pd only
Demand and Supply The figures 6C. 2a, 3a, and 4a depict the annual (1976 to 2009) global demand by major applications for platinum (Pt), palladium (Pd), and rhodium (Rh). The corresponding figures, 6C.2b, 3b and 4b depict the annual supply position for the same period for the three PGEs respectively. It is apparent that while there has been a increase in demand for all three metals over the period, which has got accentuated during the last decade because of increased demand from the automobile industry, and that from the emerging Asian markets, specially China and India. Palladium is an aberration showing a sharp fall at the turn of the century probably on account of sudden decrease in its application in the electrical field. Surprisingly, there has been a decrease in the demand of platinum from the jewellery sector.
Price trends Table- P5 gives the price variations ($/ oz) of all the PGEs between 1999 and 2011, along with that of gold for the sake of comparison.
Price variations of PGMs & Gold from 1999 to 2011 Outlook The Kyoto protocol on exhaust emissions, and the commercial success of the fuel cell technology development on which sustained efforts are going on the world over, are the key drivers for the future demand of platinum, palladium and rhodium. With the increasing gold price, projected to be $3000/ oz in the near future, platinum is likely to become the choice for the jewellery sector. Platinum demand comes from industry, jewellery manufacturers and investors. However, platinum is losing market share to palladium in petrol-driven engines, and palladium has started to replace some platinum in diesel catalytic converters. The automobile sector plays a crucial role in the demand for platinum as is noticed in the auto sales fall in the USA and Europe. South African local issues, compounded by falling grades, deep mining etc are likely to determine whether sufficient platinum and rhodium supply can be foreseen, which in turn will dictate future prices. The major consumer of platinum is the jewellery sector. As the supply of all PGEs together is less than 600 tonnes with about 500 tonnes coming from mine production, the boom in the demand for platinum jewellery and also as an investment can be expected especially, with the projected yellow metal (gold) price of ~$2000/ oz in the near future compounded by the uncertainty in many industrialized economies and the prevailing high inflation rate. It has been noticed that the demand for platinum jewellery in USA has declined while in China the demand for jewellery started peaking, and is projected to increase further, as long as the price of platinum is around $1500/ oz . 6C. 3: INDIAN SCENARIO India is not a PGE producing country and is meeting its demand entirely by imports. In India, occurrences of PGE bearing minerals have been reported in the pre-cambrian mafic/ ultrmafic complexes of Baula-Naushahi Ultramafic Complex (BNUC) in Orissa, Hanumalpura in Karnataka, and Sittampundi and Mettupalaiyam complexes in Tamil Nadu. However, GSI has estimated resources (11 tonnes @ 1.0 g/t cut-off ) of PGEs only from BNUC as on 1.4.2010.
Year Rh Pt Pd Ir Ru Os Au 1999 920 377 372 415 39 425 255 2007 6130 1300 370 450 400 400 650 2009 2725 1466 370 425 115 400 1140 2010 2300 1682 590 725 175 NA 1300 2011 June 2225 1825 785 1500
Apart from these important prospects, there are reports of PGEs presence in many other parts of the country like Ikauna in UP, and Usagaon area in South Goa. In view of the increasing demand for PGEs the world over, there is an urgent need for identification of new resources in our country, and to convert these resources into reserves to meet at least partial requirement. Demand – Supply Outlook Platinum demand in India too is increasing steadily over the years (refer Table 6C.4 and Fig. 6C.6). India imports PGEs mainly from UAE (73%), South Africa (16%), UK (4%), Switzerland (3%), and Germany (2%).
TABLE 6C.4: Imports of Metals and Alloys, 2006-07 to 2008-09 (values in Rs. '000)
Metals & alloys Unit 2006-07 2007-08 2008-09
Qty ,kg
Value Qty,kg Value Qty. kg
Value
Platinum, alloys and related metals: Total
Kg 6063 2528583
6468 6247752 53967 136803700
Platinum (powder, unwrought & others)
Kg 881 1368874
1985 4774955 50835 135124436
Other metals of platinum group Kg 5182 1159709
4483 1472797 3132 1679264
Platinum-clad base/precious metals
Kg 41 7753 18 1478 361 905
Source: Indian Minerals Year Book, 2009 (based on DGCIS data). The demand for PGEs is expected to touch 80 tonnes by 2017 and may touch 120 tonnes by 2025. Assuming the success of sustained efforts directed towards mining of the known resources at BNUC (Orissa) and development of a beneficiation flow sheet during the 12th Plan, a plant of 2 tonnes/ annum capacity can be envisaged by the middle of the 13th Plan. The beneficiation feasibility report preparation in this regard may be assigned to any National Laboratory on priority basis. An additional 10-20 tonnes/ annum should be recovered from recycling by 2017. REVIEW OF PGE EXPLORATION IN INDIA PGE mineralization occurs in ultramafic-mafic suite of rocks such as pyroxenite, gabbronorite and chromitite at various stratigraphic levels in large layered intrusive. But, most of the economic PGE reefs are found in the lower part of the ultramafic-mafic layered intrusions as in Bushveld and Stillwater Complexes. In addition, PGEs are also reported from
the ultramafic-chromitite sequences of the Ophiolite suite e.g. Shetland Complex (Scotland), Leka Ohiolite Complex (Norway) and Troodos Complex (Cyprus). The Indian Peninsular Shield is made up of four major cratonic nucleii of Archaean age (Singhbhum, Bastar, Aravalli and Dharwar Cratons) surrounded by Meso- to Neo-Proterozoic mobile belts. Several layered ultramafic-mafic complexes with or without chromitite occur within the early-Archaean supracrustals of these cratons. In the Singhbhum Craton, ultramafic-mafic rocks with significant resources of chromite occur in Sukinda and in BNUC. In the Dharwar Craton, layered ultramafic complexes (±chromitite) are reported in Sargur, Holenarsipur, Nuggihalli and Shimoga Schist Belts of southern Karnataka. In the marginal zones of the Dharwar Craton, major layered complexes such as Sittampundi, Mettuppalaiyam, Bhavani, Torappadi, Manmalai - Tenmudiyanur ultramafic-mafic complexes occur in the granulite-gneiss terrain of central Tamil Nadu. These layered complexes are the potential host for PGE mineralisation. In addition, the ophiolite complexes of Manipur-Nagaland, Andaman and Ladakh regions also form potential target areas for PGE investigation. In view of the increasing demand for PGE, a massive exploration programme was launched by the Geological Survey of India (GSI), state DGMs and private entrepreneurs like Geomysore Services (India) Pvt. Ltd during the 11th Plan period and investigated some of the major ultramafic complexes in our country. The following ultramafic-mafic complexes occurring in the states of Orissa, Karnataka, Tamil Nadu, Kerala, Madhya Pradesh, U.P. and Manipur-Nagaland are investigated for PGE and nickel mineralization (Fig. 6C.7).
Fig. 6C.7. PGE occurrences under investigation in India
The exploration carried out so far by GSI and other agencies have resulted in identification of the following four major PGE prospects in our country. i)Baula – Nausahi Ultramafic Complex (BNUC), Orissa ii)Hanumalpura Ultramafic-mafic Complex, Karnataka iii)Sittampundi Ultramafic-Anorthosite Complex, Tamil Nadu iv)Mettuppalaiyam Ultramafic-mafic Complex, Tamil Nadu Among these, the BNUC has been explored in detail by GSI and BRGM (France) and PGE resource of about 11 million tonnes estimated grading 1.98 g/t. The Orissa Mining Corporation (OMC) has assigned further exploration of BNUC under their lease hold to GSI to estimate the potential of PGE so that the necessary follow up action for commercial
exploitation can be taken up. Investigation of the other prospects is in progress at various stages to evaluate their PGE potentiality. The status of the potential PGE deposits is provided in the Annexure-1. In addition to the PGE prospects described in Annexure-1, several occurrences of PGE mineralization have come to light in recent years and these areas are under investigation by GSI, State DGMs and private entrepreneurs. The promising among them are:
SATHYAMANGALAM - ATTAPPADI AREAS, TAMIL NADU & KERALA MANIPUR – NAGALAND OPHIOLITE COMPLEX POTENTIAL REGIONS FOR FUTURE EXPLORATION.
Since the ultramafic-mafic rocks of layered complex as well as those associated with the supracrustals in granite-greenstone terrains are the favorable host for PGE mineralisation, it has become necessary to study all the ultramafic rocks, especially those showing geochemical characters such as high Mg, Ni and Cr for PGE mineralisation in a phased manner. To start with, the following target areas, where positive indications are available, may be taken up for assessing their economic potentiality for PGE mineralisation. In view of the encouraging PGE values obtained from the Deccan Basalts, as reported by M/s. Premier Nickel Corporation Ltd., a systematic search has to be planned in the entire basaltic terrain of Central India to delineate high Mg basalts with high Cr and Ni to test for possible PGE mineralisation. i)Torappadi Ultrmafic-mafic Complex, Tamil Nadu ii)Kadavur Gabbro-anorthosite Complex, Tamil Nadu iii)Kondapalle Layered Ultramafic-mafic Complex, Andhra Pradesh iv)Ultramafic rocks of Ramagiri Schist Belt, Andhra Pradesh v)Ultramafics of Nuggihalli Schist Belt, Karnataka vi)Komatites of all the greenstone belts vii)Deccan Basalts of Central India
The above areas may be taken up initially on short-term basis simultaneously for a quick appraisal. Based on the results, detailed exploration projects can be mounted in promising areas on a long-term basis.
TECHNOLOGY UP-GRADATION/ NEW R&D INITIATIVE The economic viability of the PGE deposits depends largely on the amenability of the ores for beneficiation. In view of the marginal/ low-grade nature of the PGE resources identified so far in our country, the beneficiation aspects have to be given due importance for successfully recovering these precious metals from the ores. In the Boula-Nausahi prospect, the PGM phases occur either within the ferrit chromite or in sulphides whereas in the case of Hanumalapura they occur within the ferritchromite and silicates. In Sittampundi Complex of Tamil Nadu, the PGM phases are found within the chrome spinel and in close association with Ni-Cu sulphides. Hence there is a need to develop a suitable/tailor made flow sheet for the PGE bearing ores of Orissa, Karnataka and Tamil Nadu on priority by identifying a couple of national
laboratories/Institutes so that by 2017 a plant of 2 tonnes per annum can be envisaged to start indigenous production of these precious metals during 13th plan period. The need for developing the expertise for recycling of above ground resources for PGEs recovery appears to be the most prudent and pragmatic approach inview of their mounting demand and non availability of adequate deposit for commercial exploitation till date.
REVIEW OF XI PLAN STATUS Review of status of PGE exploration in our country during X and XI plan periods brings out a clear picture that by the end of XI plan period, only three PGE prospects (Baula-Nausahi, Hanumalapura and Sittampundi) could be identified for taking up detailed exploration to upgrade these resources into mineable reserves. Therefore, the major thrust / goal during XII Plan should be to augment the resource base by adopting intensive exploration strategies in all the known major ultramafic – mafic complexes in our country besides initiating the beneficiation studies on the samples from the identified prospects on priority.
SILVER INTRODUCTION
Silver is metal used both as precious metal for investment and Jewellary and has good industrial use also. India is the largest importer and largest consumer of silver in the world. The average domestic consumption of silver in the country on an average ~ 3000 tonnes per annum. The current pattern of utilization of silver in the country and bearing in mind the anticipated increase in the GDP, the future demand for silver in the country is likely to exceed 6000 tonnes per annum by 2017.The global production of silver is of the order of 1057 MOz (about 32,873 tonnes during 2010). Major portion of it is originating from lead, lead-zinc and copper mines as by product. Stand-alone silver mines are scarce and few mines are only in operation. India produced about 185 MT of Silver last year i.e around 6% of the current import of around 3000 tonnes and therefore there is a great need to significantly increase the domestic production to bridge the demand –supply gap. Out of the current production of silver [185 tonnes in 2010] around 139 tonnes is originating as byproduct of smelting of lead, zinc ores and a small quantity of 218 kg is being produced as a co-product of refining of gold from Hutti Gold Mines. The remaining quantity could be attributed to recovery of silver from the anode slimes of copper smelting by Hindalco – Birla Copper unit. Among the Indian states Rajasthan contributed the highest quantity of silver (138.55tonnes) in the country and Gujarat’s contribution is about 45 tonnes. The country has a resource base of 10,000 tonnes silver as of 1.4.2011. However, presence of an additional source of 10,000 tonnes is estimated in view of the reported 577 Million tonnes of lead-zinc ore resources by HZL. However all of this Silver is not recoverable, part of Silver is lost while processing the ore. Silver has been a multifaceted asset throughout history. Its traditional usage range from coinage, silver jewellery, silverware and table settings. Its usage in industrial sector in batteries, bearings, brazing and soldering, catalysts, and electronics. The emerging usage of silver is in medical applications, mirrors & coatings, solar energy and water purification. GLOBAL SCENARIO Distribution of global reserves The total silver metal reserves of the world are 510,000 Tonnes as given in Table S-6. Out of this, the major silver reserves are situated at Peru (120,000 tonnes metal),Chile
(70,000Tonnes), Australia (69,000 tonnes),Poland ( 69,000 Tonnes),China (43,000Tonnes,), Mexico (37,000Tonnes),USA (25,000 Tonnes) Canada (7000 Tonnes) while the rest of the countries together contained 50,000 Tonnes, as per the report of Mineral commodity summaries -2011. The mine production of silver during 2006, 2007 and 2008 is given in Table S1. Table S1: World Silver reserves Sl.no Country Tonnes 1 Peru 120,000 2 Chile 70,000 3 Australia 69,000 4 Poland 69,000 5 China 43,000 6 Mexico 37,000 7 USA 25,000 8 Canada 7,000 9 Rest of the
countries 50,000
Source: Mineral Commodity Summaries -2011 The total silver demand varied between 877 MOz [ 27,274 tonnes ] to 1056 MOz [32,841 tonnes] from 2001 to 2010.The demand for industrial applications has been in upswing during this period, barring in the year 2009, while the demand of silver has more or less remained constant for Jewellery. The demand of silver for photography has dropped down significantly in view of the upsurge in digital photography.The demand for the investment has been increasing during last two years primarily due to China and India.
Table : The Silver demand application wise from 2001 to 2010 Demand
Source: world Silver survey 2011 The figures are in Million troy oz[ 1 Troy Oz = 31.1 g].
Production over last few years The Table S3 indicates the list of top 20 countries & the quantity of silver produced by them in 2010 .
Table List of countries producing silver during 2010 Top 20 Silver Producing Countries
in 2010 (millions of ounces)
Top 20 Silver Producing Countries in 2010
(millions of ounces) 1. Mexico 128.6 [4000tonnes] 11. Canada 18.0 [560 tonnes] 2. Peru 116.1[3610.7 tonnes] 12. Kazakhstan 17.6 [547tonnes] 3. China 99.2 [3085 tonnes] 13. Turkey 12.3 [382.5tonnes]
4. Australia 59.9 [1862.9tonnes] 14. Morocco 9.7 [301.67 tonnes]
5. Chile 41.0 [1275 tonnes] 15. India 9.7 [301.67 tonnes]
6. Bolivia 41.0 [1275 tonnes] 16. Sweden 9.2 [286 tonnes] 7. United States 38.6 [1200 tonnes] 17. Indonesia 6.9 [214tonnes] 8. Poland 37.7 [1172.5tonnes] 18. Guatemala 6.3 [200tonnes] 9. Russia 36.8 [1144.5tonnes] 19. Iran 3.4 [106 tonnes] 10. Argentina 20.6 [640.6tonnes] 20. South Africa 2.8 [87tonnes] World silver survey-2011 The Table indicates the silver producing countries in the world with the production data from 2006 to 2008.
Table World mine production of Silver (In tones of metal content)
Country 2006 2007 2008 2009 2010 World : Total 20579 21104 21565 21800 22,200 Australia 1727 1880 1926 1630 1700 Canada 995 860 728 600 700 Chile 1607 1936 1405 1300 1500 China 2600* 2700* 2800* 2900 3000 Kazakhstan* 806 723 646 -- -- Mexico 3028 3135 3236 3500 3500 Peru 3471 3493 3686 3850 4000 Poland 1265 1199 1161 1200 1200 Russia* 1250* 1200* 1300* 1400 1400 USA 1140 1120 1260 1250 1300 Bolivia 1300 2600 Other countries 2690 2858 3417 2820 1300
Source : World Mineral Production, 2004-2008 Smelted and/or refinery production
The total supply figures of silver from mine production, net government sales etc during 2001-2010 are given in Table
The silver supply exclusively from mine production from 2001 to 2010 is given in Figure.
Fig.S5 : Global mine production of Silver from 2001 to 2010
Historical price change Silver is a commodity, which is traded 24 hours a day across the world, but the main trading centers are London, Zurich, New York, Chicago and Hong Kong . London is the main global trading center for silver in terms of physical delivery based trading and LBMA (London Bullion Market Association) price is the most authenticated price which is refered by all Silver dealers across the globe. A primary factor affecting the price of silver is the available supply versus fabrication demand. In recent years, fabrication demand has greatly outpaced mine production forcing market participants to rely upon existing stocks to meet demand. As the available sources for silver continue to decline, silver's fundamentals continue to strengthen. However, silver is a tangible asset and is also used as a storage of value, its price are influenced by changes in macro economic factors, such as inflation (real or perceived), changing values of paper currencies, fiscal deficits and fluctuation in interest rates, to name a few .List of major exporters and importers Peru, Chile, Mexico,Australia, Poland, are the major exporters while the principal importers are India,China,Japan,Korea FUTURE OUTLOOK The demand for lead, zinc and copper metals are the key drivers for the silver since most of the silver produced i.e from mine production, was as by-product of these metals.
Table S 5: World Silver Supply (in millions of ounces)
Mexico, Peru,China,Australia,Chile,Bolivia,US,Poland and Russia are the major silver producers during 2010.
The demand for silver in investment has been on the significant surge over the last two years which is attributed to the surge in gold price making the major strata of the middle and below middle class preferring to invest on silver. The fear of escalation of inflation and economic down slide in European countries like in Greece, driving people to invest on Silver, as it is being considered as a safe investment alongside gold as noticed in China and India . As per the Figure S11 below, the supply of silver[ mine supply+scrap] has been much less than the fabrication demand from 1990 to 2008. From 2009 onwards, the supply exceeded the demand yet the price of silver has been unbelievably high touching ~ 50$/Oz [Rs 73,000/kg] during end of April 2011.However, the silver price has been projected to be significantly high in couple of years although by end of 1st half of 2011 it is around $ US38/Oz. INDIAN SCENARIO Silver is recovered primarily as a by product in the country in addition to the recycled production as is the case with the silver production worldwide. Economically viable native silver deposits have not been reported in the country. It occurs in association with lead, lead-zinc, and copper ores (especially their sulphide ores) and is recovered as by-product. It is extracted as a by-product, either from electrolysis or by chemical methods. The current production of silver comes from Chanderia Pb-Zn smelter of HZL-Vedanta and also from Birla Copper of Hindalco as a by-product during smelting of their imported copper concentrates at Dahej in Gujarat. As per UNFC system, the total resources of silver ore in the country as on 1-4-2005 were estimated at about 244.633 million tonnes. Out of these, 115.91 million tonnes were placed under reserves category and 128.72 million tonnes under the resource category. The reserves were further divided into 55.75 million tonnes under proved and 59 million tonnes under probable category. The silver reserves and resource position of the country and its distribution statewise are given in the Table S7. Interms of metal content, the total resources are 10,212 tonnes comprising 6058 tonnes under reserves and 4154 tonnes under the remaining sources. The Installed capacity for silver recovery at various plants in the country are as given below.
a) HCL : 6.1 tonnes/year b) HZl : 500 tpy c) Hindalco: 150 tpy [HCL is currently not in operation of the silver recovery from their anode slimes].
Demand for last 5-10 years There is a rising demand for Silver in view of the significant consumer demand primarily for investment, Jewelry, followed by industrial, and to some extent on utensils during the last two years. The import of unwrought silver during 2007-08 to 20010-11 are given below Year MT 07-08 2232 08-09* 5298 09-10 1741 10-11** 960 Production for last 5-10 years The production of silver Statewise during 2006-07, 2007-08 and 2008-09 are given in Table S7a and sector wise in the Table S7b.
Table Silver production during 2006-07 to 2008-09 by States
(Quantity in kg/ value in Rs.’000)
Production of Silver sector wise during 2007-08 & 2008-09
(Quantity in kg/ value in Rs.’000) 2007-08 2008-09 (P) State/District Quantity Value Quantity Value India 80697 1521443 105301 2147578 Public
*Silver is a by-product (a) In Rajasthan it is recovered at Chanderiya lead-zinc smelter of HZL (b) In Karnataka, it is recovered at Raichur white refinery of gold The production of silver from 2009-10 and 2010-11 are 183 tonnes and 193 tonnes respectively. The contribution of HZL during this period was 138 tonnes and 148 tonnes.
The contribution of silver from Birla Copper and Sterlite Copper during the last 5 years are given in Table S9 although the silver and gold contents shown against Sterlite copper are the figures indicating the contained metal in their exported anode slimes.
Table Production of Silver in India (tonnes) The production of silver from the anode slimes of Hindalco’s copper smelter was around 45 tonnes during FY 11 which had also reported production of ~ 7 tonnes of gold, 77 tonnes of Selenium and 21 tonnes of Tellurium as per the data given in the Table S-10. This data indicates significant fluctuation in the silver metal recovery although the copper concentrate
2006-07 2007-08 2008-09 State Quantity Value Quantity Value Quantity Value India 53271 419262 80697 1521443 105301 2147578 Jharkhand 1708 28444 - - - - Karnataka 268 4310 294 5683 246 5216 Rajasthan 51295 386508 80403 1515760 105055 2142362
processed is more or less same during FY 08-11, primarily attributed to the variation of these metals in the imported copper concentrate. Future demand estimation for next 15 years
The demand is likely to exceed 6000 tonnes during XII plan period and may touch 10,000 tonnes by 2025 based on the pull this metal is likely to have towards investment, and jewellery and also for industrial applications. As major production of this metal comes as by product, speculation can only be made at this stage based on the trend. A new phenomena is also incurring is ETF i.e Exchange Traded funds. These funds on behalf on investors buy /sell precious commodity like Gold and Silver and keep with them. The fund issue units like mutual fund which can be traded in exchange like any other security. In India Gold ETF are allowed but Silver yet not allowed. Since the prices of Silver has also increased substantially it is the need of hour that Govt should allow ETF for Silver also. To partly address the above opportunity and gap National Spot Exchange Ltd a company engaged in trading of commodities on electronic plateform has started E silver.In 2010, NSEL has launched E Silver, which is a compulsory delivery based Exchange traded contract. Investors are able to buy silver in multiples of 100 grams and keep in their demat account. Later on, they can convert it in physical silver, if they so desire. Alternatively, they can sell it back on the electronic exchange and earn the price appreciation. Now, NSEL has also initiated a facility tpo convert it directly into jewellery with empanelled jewellars.
Projected production of silver in next 15 years Based on the reserves and resource position, the projected production during 12th plan period could be 800 -1000 tonnes and ~ 1600 tonnes by 2025. GOALS FOR 12th PLAN 6.1: Mineral output There is a great need for intensifying the exploration for identification of more silver bearing resources i.e the Pb, Pb-Zn and Cu sulphide ores from which silver is recovered as by products. Efforts are also needed for locating the stand-alone silver bearing ore reserves. Since the projected silver price is ~100 $/Oz in the very near future based on trends, even a deposit containing 30 g/t can be economically exploited . There are around 12 million tonnes of Cu-Pb-Zn complex sulphide ores in Ambamata [Gujarat], Deri [Rajasthan], Mamandur [Tamilnadu], and Askot [UP] which need to be exploited during 12th Plan in view of the significant demand for these metals. While recovering these metals, the silver can also be recovered as by product, in addition to gold. The production of silver to be augmented to ~ 800 T by 2017, and to ~ 1600 Tonnes by 2025. Policy issues As significant quantity of silver is recovered as byproduct by treating anode slimes resulting from imported Copper concentrates, the export of anode slimes from the country to be restricted by providing the needed policy amendments. Anode slimes from HCL: The anode slimes from Hindustan copper are reported to contain 0.3-1% Cu, 0.5-0.9% Au, 4-10% Ag, 0.4-0.8% Ni, 20-28% Selenium, 1-2% Tellurium. However, HCL has discontinued processing of the anode slimes since 2008. There is a need to provide the incentives that are required to facilitate recovery of silver indigenously in addition to the recovery of selenium and, tellurium which can add value and offshoot the production cost of silver from the anode slimes of the Sterlite industries who are currently exporting the anode slimes.
Encourage capacity expansion of the copper plants based on imported copper concentrates by giving the needed incentives for indigenous gold, silver, selenium, tellurium production. 6.3. Recycling : The demand for silver is generally built on three main pillars, viz, (1) industrial and decorative uses, (2) photography, and (3) jewellery & silver ware. Together these three categories represent more than 95% annual silver consumption. In 2007, 455 million ounce [14,150 tonnes] of silver was used for industrial application, while over 128 million Oz [3,980 tonnes] were consumed by photography. The share of jewellery and silver ware were 163 million Oz [5,069 tonnes], and 58.8 million Oz[1,828 tonnes] respectively in the world. As the mine production of silver is linked to the proportion of Pb, Pb-Zn and Cu metals production, there is a need to develop indigenous expertise to recover silver by recycling from variety of Industrial wastes as is the practice in the other parts of the world. The scrap receipts from industrial sector are envisaged to be high during 2011 with expected rise in supply of silver from recycling of Jewellery and silverware RECOMMENDATIONS GOLD SILVER and PGE:
1. A central coordinating agency to be identified for taking a mission approach on gold and precious metals and achieving the objectives set out in this document.
2. To accelerate the rate of exploration to tap the immense potential for Gold and precious metals in the country and to cover larger area through faster grants, seamless transition etc.
3. To support exploitation of available resources by accelerating production from HGML, recovery from KGF tailings, reviving abandoned mines and faster approvals of other primary producers.
4. Encouraging copper smelters for recovery of gold and silver from anode slimes, measures like removal of excise duty on finished gold, exemption from the countervailing duty and exemption of additional customs duty for gold contained in copper concentrate, are required.
5. To support development of suitable technology for various small deposits, there is a need for identification of a dedicated Centralised R&D institute/centre for process development of precious metals.
6. Ensuring availability of skilled/ trained manpower in geology, mining, processing of precious metals as well as tradesman partnership between industry, academic institutions and research labs
7. Boula Nuasahi Ultra Maffic Complex (BNUC), Orissa having 15 tonnes of PGEs at 1 g/t of Pt+Pd should be accorded priority in developing it into economically viable deposit by identifying National Institutes to carry out detailed feasibility studies & to set up 2 t/annum PGE recovery plant by end of 12th Plan.
8. Feasibility studies on Sittampundi & Hanumalpura deposits to be initiated simultaneously
9. Detailed exploration in the 10�12 areas identified by GSI needs a major thrust during 12th plan to identify more resources.
10. Recovery of Gold from KGF tailings, reviving abandoned mines of BGML. 11. Investing into R&D and to encourage recycling through technology mission approach
specific to PGEs by recycling the catalytic converters, E�waste and other PG bearing wastes and through project grants under S & T projects.
CHAPTER – 7
DIMENSIONAL AND DECORATIVE STONES 7.1 INTRODUCTION India is the largest producer of ‘Dimensional and Decorative Stones’ viz. marble, granite, sandstone, slate, flaggy limestone etc. which form a major component of the construction sector. This sector accounts for 6-8% of the country’s GDP and is the second highest employer after agriculture. Against the backdrop of 8-9% GDP growth leading to higher disposable incomes with larger sections of the population, coupled with increased spending by the Government on construction, housing, slum development, and infrastructure etc. the dimensional stone sector is thus favorably placed for a bright future. India possesses a wide spectrum of dimensional stones spread out all over the country. The quality of Indian stones conforms to the highest International Standards and provides excellent uniformity and consistency. Indian stones have been used in several well-known buildings all over the world. Dimensional Stones are the mainstay of the economy of states like Andhra Pradesh, Tamil Nadu, Karnataka and Rajasthan. India also has an indigenous resource of machinery and tool manufacturers. However, the sector is still dependent to a large extent on imported tools and machinery. Looking to the size of the dimensional stone sector, the tool and machine manufacturing industry has to adapt to global standards and practices to cater to future requirements. The Indian stone industry has evolved into production and manufacturing of blocks, flooring slabs, structural slabs, calibrated - ready to fix tiles, monuments, tomb stones, sculptures, artifacts, cobbles, cubes, kerbs, pebbles and landscape garden stones. While being one of the largest exporters of stones in the world, India is also amongst the largest consumers of stones and stone products. With a well-established distribution network within the country, the Indian stone industry caters well to the domestic demand and rising aspirations of the burgeoning middle class of India. 7.2.0 GLOBAL SCENARIO The global stone production is over 126 million tonnes in the year 2009, with India followed by China, Turkey and Italy being the leading producers.
TABLE – 7.1 WORLD PRODUCTION 2009
COUNTRY PRODUCTION IN
�000 Tonnes SHARE (%)
India 35,342 27.91 China 31,000 23.48 Turkey 8,500 6.44
Italy 7,500 5.68 Iran 6,800 5.15
Brazil 6,000 4.54 Spain 5,200 3.93
Portugal 2,450 1.86 USA 1,800 1.36
Greece 1,250 0.95 France 1,100 0.83
South Africa 800 0.61 Others 18,900 14.31 World 126,642 100
Source: World Marble & Stones, 21st report by Carlo Montani for figures other than India.
As per the ‘World Marble & Stones’, 21st report by Carlo Montani, the major exporters of stones and stone products in the world are China (25.3%), Italy (13.5%), India (9.7%), Turkey (8.7%), Spain (6.8%), and Brazil (5.1%). On the other hand, the total world stone imports during 2009 amounted to US$14081 million, with USA (14.6%), China (10.3%), South Korea (6.6%), Japan (6.2%), Germany (4.5%), France (3.7%), and Italy (3.5%) being the leading importing countries. 7.3.0 INDIAN SCENARIO India is endowed with vast resources of granite, marble, sandstone, flaggy limestone (kotastone), slate and quartzite. Some of the colours and designs/patterns of Indian granites are unique and consequently have regular flow of demand globally. Indian marble (especially green marble), sandstone and slate too have found acceptance the world-over. One can see these stones adorning the Taj Mahal, Ranakpur, Delwara Temple, Red Fort, Parliament building, Rashtrapati Bhawan and many other historic monuments in India besides many memorials and important buildings abroad. In the Gulf countries, Indian stones are preferred and used extensively. Total employment provided by the sector is estimated to be over 25 lakhs.
7.3.1 DIMENSIONAL STONE RESERVES IN THE COUNTRY
7.3.1.1 Granite - India possesses one of the best granite deposits in the world having excellent varieties comprising over 200 shades. India accounts for over 20% of the world resources in granite.
Splendid black and multicolour varieties of granite are available in the states of Karnataka, Andhra Pradesh, Tamil Nadu and Uttar Pradesh. Granite deposits are also widespread in the States of Rajasthan, Jharkhand, Madhya Pradesh, Bihar, West Bengal and Gujarat. India is the largest exporter of granite and granite products in the world.
TABLE – 7.2 GRANITE RESERVES IN INDIA (as per IBM)
State Total (In million cu. m.)
Karnataka 9740 Jharkhand 8847 Rajasthan 8479 Madhya Pradesh 6271 Andhra Pradesh 2788 Orissa 2135 Maharashtra 1159 Bihar 878 Tamil Nadu 713 Assam 584 Uttar Pradesh 495 Gujarat 420 Meghalaya 286 Chhattisgarh 50 Haryana 34 West Bengal 33 Kerala 4 Total 42,916
7.3.1.2 Marble – Marble deposits are widespread in India with deposits of economic importance being concentrated in the states of Rajasthan, Gujarat, Madhya Pradesh, Haryana and Andhra Pradesh. Newer varieties are gradually being developed for economic exploitation in the states of Bihar, Jammu & Kashmir, Maharashtra, Sikkim, Uttar Pradesh and West Bengal.
TABLE – 7.3 MARBLE DEPOSITS IN INDIA
State Total (In million tonnes)
Rajasthan 1144
Jammu & Kashmir 405
Madhya Pradesh (estimated) 400
Gujarat 95
Chhattisgarh 83
Maharashtra 59
Haryana 22
Uttarakhand 6
Sikkim 2
All India Total 2,216
7.3.1.3 Sandstone - Sandstone reserves in India are spread over the states of Andhra Pradesh, Assam, Bihar, Gujarat, Haryana, Madhya Pradesh, Meghalaya, Mizoram, Karnataka, Orissa, Punjab, Rajasthan, Uttar Pradesh, Tamil Nadu and West Bengal. Over 90% of the deposits of sandstone are in Rajasthan, spread over the districts of Bharatpur, Dholpur, Kota, Jodhpur, Sawai Madhopur, Bundi, Chittorgarh, Bikaner, Jhalawar, Pali and Jaisalmer.
7.3.1.4 Slate - Slate reserves in India are found in Rajasthan, Haryana, Himachal Pradesh, Andhra Pradesh and Madhya Pradesh. Deposits in Rajasthan are spread over the districts of Alwar, Ajmer, Bharatpur, Tonk, Sawai Madhopur, Pali, Udaipur, Churu & Chittorgarh. 7.3.1.5 Flaggy Limestone - 'Kotastone' of Kota district and 'Yellow Limestone' of Jaisalmer district of Rajasthan are the prime limestone occurrences in India. Other deposits are Shahabad Stone of Bijapur & Belgaum districts of Karnataka, 'Cuddapah Stone' of Kurnool, Anantpur and Guntur districts of Andhra Pradesh, 'Millolitic Limestone' from Saurashtra Region, Gujarat, 'Yellow Limestone' of Kuchch district of Gujarat, amongst others. 7.3.2 DIMENSIONAL STONE PRODUCTION
While the annual production figures (2005-06 to 2009-2010) are given in Table 7.4, in value terms, the estimated turnover of the Indian Dimensional Stone market in 2009-10 was of the order of Rs.30,000 crore out of which the southern states accounted for Rs.18,000 crore, Rajasthan Rs.7000 crore, and the rest of India Rs.5000 crore. Granite alone accounts for 2/3rd of the value of production. Karnataka, Tamil Nadu, Andhra Pradesh and Rajasthan are the major producers of granite and its products. Rajasthan accounts for over 85% of the country’s production of marble, sandstone, and flaggy limestone, besides slate. Andhra Pradesh and Haryana are the major producers of slate.
7.3.3 DIMENSIONAL STONE EXPORTS FROM THE COUNTRY India is amongst the leading exporter countries of stones in the world. Exports have shown steady growth over the years.
TABLE – 7.5 STONE EXPORTS FROM INDIA (in million Rupees)
Slate stone 1931.25 2107.40 2350.41 2110.10 2072.05
1980.7
9884
Grand Total 36461.20 45619.79 62024.01 60715.84 62291.01 62556.8 70180 Source: CAPEXIL
Indian Stone Exports comprise mainly Granite Cut Blocks, Slabs, Tiles, Marble (especially green marble), Slate, Sandstone, Monuments and Handicrafts. The major importers of Indian stones are USA, China, UK, Italy, Belgium, Germany, UAE, Hong Kong, Spain, Taiwan, Netherlands, Canada, Turkey, France, Russia and CIS countries.
Exports in the past three years have by and large been stagnant on account of the global economic slowdown. 7.3.4 PROJECTIONS FOR DOMESTIC CONSUMPTION AND EXPORTS Domestic consumption of dimensional stones has increased manifold in the past few years as a result of a booming construction industry, ever increasing demand in the housing sector, burgeoning population of urban middle class and faster urbanization, creation of social infrastructure and the policies of the government for inclusive growth. The growth is continuing and the demand for marble, granite, sandstone and other dimensional stones and stone products is anticipated to grow at around 15% CAGR. A similar rate of growth in exports can also be achieved provided necessary government support by way of favourable policy framework, infrastructure and other facilities are provided to the industry. While India has abundant resources, technical know-how, large quarrying and processing capacity, besides cheap manpower to sustain the anticipated growth, the industry is hampered by the absence of updated study/report or source of data with regard to the number of active mines, processing and handicraft units spread across the country, machinery, tools and consumable manufacturers, turnover of the sector, and existing and potential consumption in the country. Further, there seems to be no mechanism to periodically update the reserves position either by the state DMGs or by the IBM. Consequently, it is also not known how much of the proven reserves area is covered under forest/other eco zones, and will not be allowed for mining. In the above backdrop, the projections for the production, growth and consumption of the sector are based on extrapolated data of raw production of stones and on the feedback from the various producers and emerging trends of the construction industry. 7.3.5 PROJECTIONS FOR INVESTMENT IN DIMENSIONAL STONE INDUSTRY Present investment in dimensional stone industry in India is estimated at Rs.20,000 crore. It is expected that given the right policy support, the total turnover of the sector estimated to be around Rs. 30,000 crore in 2009-10 which will increase to over Rs. 40,000 crore by 2012-13, and thereafter double every five years, considering an estimated growth rate of 15%. To sustain this growth, it is estimated that investment in this sector will have to go up to about Rs. 1,07,500 crore by 2022 – 23 (including foreign investment). 7.3.4 INDIAN STONE INDUSTRY VIS-À-VIS GLOBAL COMPETITION
The opening up of the economy offers great opportunities as well as challenges, by way of competition from China, Italy, Brazil, Taiwan, Greece, South Korea, etc. To meet this challenge and make itself more competitive, the domestic industry will have to take various steps such as Technology Upgradation, Trade Promotion and Human Resource Development, besides building an effective brand image for Indian stones abroad. However, considering the fact that the Indian dimension stone industry is largely unorganized and falling predominantly in Cottage/Small Scale Sector, government support is inevitable for achieving the above objectives. Therefore, necessary support by way of corrective measures in removing bottlenecks, as outlined below, shall have to be provided in the 12th Five Year Plan to make the domestic industry globally competitive. 7.4 CORRECTIVE MEASURES, GOVERNMENT SUPPORT AND INCENTIVES RECOMMENDED FOR SUSTAINABLE DEVELOPMENT OF THE SECTOR 7.4.1 Mineral Royalty In countries such as China, Brazil etc quarry leases are given for extended periods (30 - 99 years) with fixed rate of nominal or no royalties. In India however, since dimensional stones are grouped under minor minerals, royalty is a state subject. Since royalty constitutes a major source of income for many states, the respective governments increase royalty drastically every two to three years. This creates problems for Indian exporters, as they are not able to take up long term international projects as their cost of production becomes uncompetitive. To make the Indian dimensional stone industry globally competitive and to achieve the envisaged rate of growth in the Twelfth Five Year Plan, there is a strong case for–
a. reduction and rationalization in the rates of royalty for different stones; b. ensuring uniformity of royalty in all the states; c. right sizing of mining leases commensurate with requirements of latest scientific
mining technologies. 7.4.2 Power, Fuel, Water, Road network Most of the quarries fall in remote areas that do not have proper infrastructure (power, water, road network) facilities. It is therefore essential that proper and adequate infrastructural network is created in stone producing areas. Till such time, essential inputs such as diesel, petrol, LPG, acetylene gas should be made available at subsidized rates. 7.4.3 Financial assistance
There is a strong need to provide long-term low interest finance to the industry and has emerged as an important foreign exchange commodity.
Granite and marble quarries have requested for being provided “Industry” status. Although stone quarries are recognized as industry for financial assistance under relevant statute, they have not been very successful in obtaining financial assistance, mainly because they could not offer any collateral by way of the quarry lease. State governments should amend their Minor Mineral Concession Rules to make hypothecation of quarry leases possible to enable availing of bank finances by offering them as collateral. Stone quarries should be provided the status of small-scale industry and all facilities available to other SMEs, should also be extended to them. 7.4.4 Provision for stockyards and separate railway sidings Separate stockyards and railway sidings are required to be provided in stone cluster areas in different states keeping in view, the high cost of road transportation and benefits of timely execution of export orders. 7.4.5 Port Infrastructure Suitable handling facilities should be provided at major ports like Chennai, Tuticorin, Cochin, Mangalore, Karwar, Kandla, Mumbai, JNPT near Mumbai, and Vishakhapatnam.
7.4.6 Aggressive Export Promotion Efforts and Establishing Brand Equity There is a strong need for well-planned, concerted and dedicated efforts towards export promotion of Indian stones. The emphasis needs to be on popularization of Indian stones in both the traditional markets and exploration of new avenues by strengthening the activities of the Centre for Development of Stones (C-DOS) in the following manner: Organizing International Stone Trade fairs and conferences/workshops at regular
intervals. Encouraging regular participation by Indian companies in major international fairs as
is being done successfully by Brazil, Greece and Turkey. This would encourage small entrepreneurs to venture into the international market and expand their horizons. Country pavilions in international trade fairs need to be organized regularly by the nodal stone agencies and associations in India.
Promoting group business meets in emerging and unexplored markets. This could include aggressive promotion through linkages with industry associations and through organization of buyer-seller meets.
Image promotion of Indian stones through distribution of literature in the international market, by creation of an interactive website of Indian stones.
Providing export trade consultancy, stone technology and trade information.
Establishing long-term relations with important global chambers of commerce, associations etc. in major markets.
Setting up dedicated industrial parks/areas where all stone processing and export oriented units could be established, which would help in aggressive promotion and export of stones.
Inter-Ministerial coordination for collective efforts and devising strategies for funding and programming market promotion projects.
7.4.7 HRD Promoting research on various topics of stone mining, processing, waste reduction
and utilization, characterization of stones, etc. for the benefit of industry and users alike.
Publishing technical literature on various aspects of stone industry. Introducing technical courses on stones with the assistance of NCERT in ITIs,
engineering and architectural colleges. Conducting training courses. 7.4.8 Incentives For sustained growth and to remain globally competitive, the industry needs to operate on a level playing field. This can be achieved by providing fiscal and other incentives and benefits in the form of duty drawbacks and exemption from direct and other commercial (sales) and local taxes. 7.4.9 Forest Areas
Industry perspective: The Supreme Court had taken a decision that all the State Governments should make a fresh mapping of the mineral bearing areas and exclude them if they are in forest zone. It is established however that geologically, if there is existence of hard stone like granite, marble etc. there cannot be growth of forest. Precisely for this reason, these mineral areas need to be excluded from maps of the Forest departments. Therefore, this calls for a comprehensive national policy incorporating the following: a) The potential mineral areas falling in reserved forest areas with no forest resource
should be identified, and opened up for commercial exploration/exploitation; b) If any quarry lease area falls within the area of a genuine forest, the concerned quarry
owners should be asked to plant trees in an area, at a place to be decided by the authority;
c) The barren areas where there is no forest growth, and yet have been classified as forest area, can be worked and, after removal of the mineral (dimension stones), the same can be filled up with earth, and trees can be grown.
7.4.10 Infrastructure Development around Stone quarries State governments should earmark at least 10% of the revenue from royalty towards infrastructure development in mining areas by establishing dedicated ‘Stone Development Fund’, possibly with contribution from the Government of India. As far as other utilities viz, water, power, road network are concerned, Central Government and the State Governments should take a conscious decision to ensure necessary infrastructure facilities in the mining areas under different schemes of the Central/State Governments. 7.4.11 Promotion of Stone Handicrafts and Artifacts Alternative option for exporting granite and marble in processed form to maximize export earnings is to be developed and promote artifacts and special decorative and ornamental items of high value addition may be promoted. There is a rich tradition of craftmanship, which can be explored and supported with special incentives, India can embark upon the world scene. This can certainly bring considerable amount of foreign exchange to the country, as well as create significant employment. This stone segment holds great potential, both for domestic consumption as well as exports. The traditional skill of the Indian artisans needs to be supported, motivated, preserved and developed. Suitable measures need to be taken as listed below: Provide uniform sales tax exemption to all stone craft items irrespective of their level
of mechanization. Allow tax free import of CNC and other handicraft machines and tools. Provide artisans refresher courses for skill upgradation and use of new tools and
machinery. Provide support to artisans for group participation in international fairs. Organise workshops to educate entrepreneurs about new technologies in stone-craft;
and their adaptability to Indian conditions. Adoption of best practices for production. Compilation and publication of technical manuals in the form of exhaustive reference
material. 7.4.12 Research & Development The present level of R & D in the domestic dimensional stone industry is negligible.
A beginning has been made by the Government of Rajasthan, which with the support of central Ministries of Commerce & Industry, and Mines, RIICO and UNIDO has established the Centre for Development of Stones (CDOS) - a Centre of Excellence, at the national level for the development of dimensional stone sector especially marble, sandstone, kotastone, slate and granite. The state-of-the-art facilities, including R & D for testing of all types of stones as per American, European and Indian standards are operational now, at Jaipur. There is a need to establish regional R & D centers through CDOS & NIRM at prominent stone production areas. AIGSA too has plans to have R & D facilities at Bangalore. While quarrying for marble and granite has developed on scientific lines, sandstone quarrying is generally undertaken manually, thereby resulting in excessive wastage. Suitable efforts should be made by CDOS jointly with the state DMG and UNIDO to develop and promote mechanized quarrying. 7.4.13 Testing and Quality Certification of Stones Testing of stones is essential for identifying the right stone for the right application worldwide. The architects if aware of the properties of stones would be able to use stones in structural applications in large complexes. The structural analysis of stones would also assist stones in competing with alternative materials like ceramics etc. Test Certification will be mandatory for exports to Europe in a couple of years. Suitable measures therefore need to be taken while there is still time. 7.4.14 Uniformity in Policies of State Governments In order to provide a level playing field, there should be uniform policies for minerals leasing, taxation, royalty, incentives etc. at the state level. 7.4.15 National Stone Technological Upgradation and Development Fund Industry perspective: The Ministry of Mines may consider setting up a National Stone Technological Upgradation and Development Fund with an initial grant of say, Rs.500 crore and thereafter by imposing a cess of 1% of the royalty. This fund could be utilized for taking initiatives in following key areas for development of the stone sector and Centre for Development of Stones (CDOS) could be nominated as the Nodal Implementing Agency for these initiatives:
Technological upgradation and modernization of mining/quarrying and processing for increasing the industry’s global competitiveness and indigenization of internationally accepted technologies.
Environmental protection and management through promotion of SDF and zero waste mining technologies.
Introducing stone specific courses in educational institutions. Human resource development for ensuring availability of a steady stream of skilled
and trained manpower. Organizing training programmes for skill upgradation in value addition, quality
management, productivity and safety. Operationalising and strengthening testing & standardization facilities, establishing
export inspection agency & quality certification services, technical consultancy, etc. Providing technology and design interventions for stone artifacts and other value
added products. Market development and increasing export competitiveness. Development support for stone clusters. Support for technological upgradation and modernization of technologies for stone
finishing, material handling, product packaging, stone installation & cladding etc. Study on national inventory of stones. Strengthening institutional development mechanism for stone sector. 7.4.16 Strengthening National Support Institutions In order to ensure sustainable development of Dimensional Stone sector in India, following recommendations are made for strengthening the national support mechanism:
Convert existing CDOS (Jaipur) as a National Centre of Excellence (N-CDOS) with adequate financial support from Government of India.
A similar National Centre of Excellence, especially for granite should be
established in South India.
Constitute a separate Export Promotion Council for dimensional stones.
To assist and strengthen existing/proposed organizations in developing permanent infrastructure for international exhibitions in South India and also to establish permanent infrastructure for testing of stones, imparting training and to conduct Research on stone related matter.
7.4.17 Policy for Development of Granite and Marble Industry Globally, countries with dimensional decorative block reserves have started processing the blocks and exporting the finished goods after ‘Value Addition’. India needs to aggressively take to ‘value addition’ to take on competition from China and other countries. Today, China is importing approximately 30% of our dimensional decorative rough blocks and after ‘value addition’ exports the same to USA, Europe and other parts of the world at a cheaper rate than India. Italy too imports rough dimensional blocks and re-exports, thus boosting their export performance. Detailed studies on the natural stones policies of other countries such as Italy
and China should be undertaken to make the Indian stone industry equally competitive. The import figures of dimensional decorative blocks of both Granite and Marble for the first nine months of 2010 prove that China is following open market policy to develop its industry. TABLE 7.6
CHINESE IMPORT OF GRANITE AND MARBLE FOR 9 MONTHS
Countries Import by September of 2010 Quantity (Tonnes) Amount(US $)
India should similarly allow import of dimensional blocks under Open General Licence (OGL) policy. 7.4.18 RESTRICTED EXPLOITATION OF NATURAL STONES
o Presently, about 40% of India’s internal demand of Granite finished goods is met from within due to limited resources for exploitation. The short supply of decorative dimensional rough blocks should be overcome by import for both domestic consumption and re-exports after value addition. There is huge potential to earn substantial export revenues.
o Today, the world is looking at various options for supply of Granite and Marble both finished slabs and rough dimensional blocks. India possesses exotic deposit of Granite in the country which is in great demand in International market. Similarly, huge deposits of Granite are spread across Norway, Finland, Brazil, Russia, and Madagascar for which there is a huge demand in India.
o In a global scenario, India should adopt a policy of exchange of material between countries, thereby increasing the processing capacity in the country and also offering the consumers a wide variety.
o Appropriate exim policy and duty structure should be framed accordingly to facilitate this.
TABLE 7.7 EXPORTS OF GRANITE & PRODUCTS FROM INDIA
DURING 2008-09 Value in Rs. Million
China 11285.50 USA 7996.50 Italy 2941.70 Germany 2613.90 UAE 2246.10 UK 1927.10 Belgium 1922.50 Hong Kong 1563.00 Turkey 1362.90 Netherlands 1227.70 Others 13062.30
(Source: CMIE / CAPEXIL)
7.4.19 MARBLE INDUSTRY
o India does not possess Beige colour material which is heavily used in the construction
industry and 80% of the demand is for Beige material both in Domestic and International market.
o Presently, under the Exim policy, marble comes under ‘licensing system’ with ‘eligible’ or ‘entitlement’ criteria. As there is restricted licensing system in India, about 25 per cent of the marble industries have gone sick or there is under utilization of capacity.
o China has been the beneficiary as it freely imports dimensional blocks and dumps in the world market, including India.
o The Indian marble industry requires policy support as well as technological up-gradation, barring few modern industries, to make them globally competitive.
o Presently, there is a demand for more than 10 lakh tonnes of Marble blocks within the country and further more for re-export after value addition. The country is importing only 3 lakh tonnes of Marble blocks through the licence.
TABLE 7.8 EXPORTS OF MARBLE & PRODUCTS FROM INDIA DURING 2008-09
D. Export Potential Minerals 20. Barytes 21. Bentonite 22 Fuller’s Earth 23 Mica 24 Talc, Soapstone and Steatite
8.2. Downstream Industries
These mineral are basic inputs for a number of industries like fertilizer, glass & ceramic, refractory, asbestos-cement products and chemical. The overall value of these industrial minerals during 2009-10 was about Rs. 1,399 crores. The present status of these industries is discussed below.
8.2.1 Glass Industry Glass industry in India remained in the form of cottage industry till the beginning of 20th century. First glass plant in India was set up in August 1908 by freedom fighter Lokmanya Bal Gangadhar Tilak at Talegaon in the State of Maharashtra. Glass industry in India has made a steady progress since then, particularly after independence. Firozabad, a glass city of India continues to be a place of master craftsmen and entrepreneurs, manufacturing a vast variety of glass items by the traditional process. Side by side, the country has the most modern plants producing glass containers; float glass etc. by the use of latest technology.
The per capita consumption of glass in India is about 0.4 kg compared to 3.5 kg in a country like Indonesia. Principal raw materials used in the manufacture of glass are silica sand, soda ash, calcite, dolomite, etc.
The glass industry comprises glass containers and hollowware, tableware, flat glass (including float, sheet, figured, wired and safety mirror glass), vacuum flasks, refills, laboratory glassware, fibre glass, hollowware containers etc. Glass industry is delicensed and manufacturing units are spread all over India. The large-scale producers are located mostly at Mumbai, Kolkata, Bangalore, Hyderabad and in Gujarat. They are equiped mostly with modern melting furnace technology, whereas the medium and small-scale industries including cottage industries are still using outdated technology. There is a considerable scope in demand for glass fibre products particularly due to growth in petrochemical sector and allied products. Glass Container and Hollow-ware Presently, 43 units in the organised sector are engaged in the manufacture of glass containers and hollow-wares, with an installed capacity of around 15 lakh tonnes per year. Glass containers are ideal packaging medium, but are being replaced by other packaging materials like plastic, PET, aluminium and tetrapack. Production of bottle and glassware was about 9 lakh tones during 2008-09. Laboratory Glassware
There were six units in this sector which comprises neutral glass tubing, laboratory glassware and chemical process equipment. The installed capacity of neutral glass tubing was 46,600 tpy. The data on production are not available. The demand for natural glass tubing has not picked up due to sizeable switch over from glass items to plastic items. Flat Glass
The term flat glass includes float glass, sheet glass, figured and wired glass. These are further processed into mirror, toughened glass, laminated glass, double glazing, etched glass, glass doors, etc. Thirteen units in flat glass sector had a total production capacity of 135 million sq m. Both, sheet and float glasses are being exported. Vacuum Flasks and Refills
There were eight units in the organised sector for the manufacture of vacuum flasks and refills, with an installed capacity of 36 million numbers per annum. However, data on production are not available. This product is facing survival problems due to competition from international market.
Fibre Glass
Fibre glass is highly capital and technology- intensive industry. The present demand is about 22,000 tonnes. Fibre glass is lighter than aluminium but stronger than steel. Moreover, being an inorganic material, it does not pose any health hazard. Five units had a production capacity of 55,000 tpy. However, data on production are not available. Presently ,India exports 80% glass fibre production.
Others Production of other glass items in 2008-09 was as follows (in numbers) : glass lamps -
427 million, fluorescent tubes – 195.5 million, autolamps - 73.9 million and television picture tubes - 6.8 million. 8.2.2 ASBESTOS-CEMENT PRODUCTS:-
The installed capacity of asbestos-cement pressure pipes in the organised sector was 212,000 tpy. Production capacity of asbestos cement sheets was not available. The production of asbestos-cement sheets and accessories in 2008-09 was about 2.2 million tonnes. The production of asbestos-cement pressure pipes was about 150 thousand tonnes during the same period. The operating units comprised four units of Everest Building Products Ltd. located at Kymore in Madhya Pradesh, Mulund in Maharashtra, Podanur in Tamil Nadu and Kolkata in West Bengal; three plants of Hyderabad Industries Ltd at Sanatnagar, Ranga Reddi district in Andhra Pradesh, Jasidih in Jharkhand and Ballabhgarh in Haryana; three units of Ramco Industries Ltd at rakkonam, North Arcot district, Tamil Nadu, Karur in Dharwad district, Karnataka and Maksi in Shajapur district, Madhya Pradesh; two units of Southern Asbestos Cement Ltd at Karur in Dharwad district, Karnataka and Arakkonam, North Arcot district in Tamil Nadu; Shree Pipes Ltd Hamirgarh, Bhilwara district, Rajasthan; Malabar Building Products Ltd, Malakunnathukavu, Trichur district, Kerala; Konark Cement and Asbestos Industries Ltd at Bhubaneswar in Orissa; Shri Digvijay Cement Co. Ltd, Digvijaynagar, Ahmedabad in Gujarat; Uttar Pradesh Asbestos Ltd, Mohanlalganj, Lucknow district, Uttar Pradesh; Assam Asbestos Ltd, Bonda, Narangi, Guwahati district, Assam; Utkal Asbestos Ltd, Dhenkanal in Orissa and Visaka Asbestos, Pattencheru (Medak) in Andhra Pradesh. Besides, Swastik Industries, Pune in Maharashtra; Kalani Asbestos, a Division of Kalani Industries Pvt. Ltd, Pitampur, Dhar district in Madhya Pradesh; Tamil Nadu Asbestos (Pipes), a unit of Tamil Nadu Cement Corp. Ltd, Mayanur, Tiruchirapalli district in Tamil Nadu and Ganga Asbestos Cement Ltd, Rae Bareli in Uttar Pradesh produced only asbestos pressure pipes. 8.2.3 REFRACTORY INDUSTRY :-
Steel industry comprises the biggest group of customers for this industry, which consumes about 70-80% of total refractory production, followed by aluminium, power and cement. Refractory units fall in medium and small-scale sectors. This industry has been facing recession mainly because of shift in demand from conventional refractories to sophisticated refractories. Bharat Refractories Ltd (BRL), a Govt. of India undertaking (incorporated on July 22nd, 1974), having four units and engaged in the manufacture & supply of various kinds of refractories not only to the integrated steel plants but also to the smaller steel plants is being merged with SAIL with some major relief and concessions. With the modernization and renovation of the steel plants, requirements for various types of refractories have undergone revolutionary changes. The stress is now on more sophisticated products like precast monoliths. The domestic refractory industry, anticipating this change, has obtained technical know-how for the production of sophisticated refractories, such as magnesia carbon bricks, new generation sliding-gate plate refractories, for ladles, gunning materials and castables. Manufacture of carbon bonded silicon carbide crucible and clay graphite foundry products continue to be further upgraded for improvement in the products. The use of these special refractories has brought down the consumption of refractories per tonne of steel production. However, the customers are benefitted by way of improved performance, lower shut down time and savings on energy. About 30 kg refractory was consumed per tonne of liquid steel a decade ago has now come down to around 7-8 kg per tonne of crude steel by some leading players. The specific consumption of refractories at present in integrated steel plants varies from 8 to 19 kg/tcs as compared to 6-8 kg/tcs in advanced countries. The total production of refractory items as per IRMA in 2007-08 and 2008-09 was 1.27 million and 1.26 million tonnes, respectively. Exports of refractories during the same period were 190 thousand and 333 thousand tonnes, respectively, while imports during the same period were placed at 519 thousand and 697 thousand tonnes, respectively. The estimated annual installed capacity of different kinds of refractories and production is given in Table-8.1. The increasing globalisation of refractories business could take an interesting turn in the coming years, as India emerges the most important market only next to China. Competition would intensify from lower end products like fire bricks to high end black refractories with overseas firms entering Indian market with advanced technologies and easier access to raw materials mainly from China. In the Indian context, to meet the present operating conditions of the steel plants and to produce cost-effective steel, refractory industries should also upgrade their plants and products to meet present demand. This can be achieved mainly by way of refractory management instead of sale of individual items of refractory.
Table – 8.1: Annual Installed Capacity and Production of Refractories (By Types)
(In Thousand tonnes) Production Refractory item Annual
Source: Indian Refractory Makers' Association (IRMA) Journal.
8.2.4 CERAMIC & GLASS INDUSTRY:- Ceramic Industry
Ceramic industry in India is about 50 years old. India ranks 5th in world in terms of production of ceramic tiles and produced 391 million sq metres of ceramic tilesOut of a global production of 9000 million sq. metre during 2010-11.There are 16 units in the organized sector with installed capacity of 2,100,000 metric tonnes. It comprises ceramic tiles, sanitaryware and crockery items. It has been growing at the rate of about 12% per annum. Ceramic products are made from clay and felspar and are manufactured in large and small-scale sectors with wide variations in type, range, quality and standard. Ceramic items have properties, such as glassy smooth finish, high thermal shock resistance, poor thermal and electrical conductivity, high abrasion resistance, acid resistance and weather resistance. During the last two decades, there has been a phenomenal growth in the field of ceramics to meet specific demands of industry, such as high alumina ceramics, cutting tools and other structural ceramics. The state-of-the-art ceramic goods are being manufactured in the country and the technology adopted is of international standard. The per capita consumption of ceramic tiles in the country was about 0.3 sq m compared to 2 sq m in China & 5-6 sq m in Europe. Ceramic Tiles
Ceramic tile is a common consumer item. Following the development and growth of the building industry, ceramic glazed tiles industry is on the threshold of rapid growth/expansion and ts demand has increased considerably during the last decade. India ranked seventh in the world in production of ceramic tiles. In terms of tonnage, India produced 1.38 million tonnes of glazed tiles/ceramic tiles in 2008-09. India produced 310 million sq m ceramic tiles out of global production of 6,900 million sq m in 2007-08. There were 16 units in the organised sector with an installed capacity of 21 lakhs metric tonnes accounting for about 2.5% world ceramic tile production and about 200 units in SSI sector. The domestic ceramic tile industry has been growing at about 12% per annum. Indian tiles are competitive in the international market and are being exported to East and West Asian countries. Production of ceramic tiles in 2008-09 was estimated to be 332.90 million square metres. Sanitaryware
Sanitaryware are ceramic products used for hygienic services, like wash basins. The basic raw materials for sanitaryware are felspar, ball clay, kaolin and quartz. There were 7 units having an installed capacity of 143 thousand tpy in the organised sector and over 210 plants covering a capacity of 53,000 tpy in small-scale sector. Some units have either been closed or merged with the existing units. This industry has been showing a growth rate of about 5% per annum. Annual production of sanitaryware in 2008-09 was about 400 thousand tonnes as against 366 thousand tonnes during 2007-08. In 2009-10 the export of saniteriware were of the range of Rs 15,776 crore Potteryware :-
Potteryware signifying crockery and tableware are produced both in the large-scale and the small-scale sectors. There were 16 units in the organised sector with a total installed capacity of about 43,000 tpy. In the small-scale sector, there were over 1,400 plants with a
capacity of 3 lakh tpy. Production of potteryware in 2008-09 was about 66 thousand tonnes in the organised sector as against 59 thousand tonnes during 2007-08. Others : Production of HT insulators during 2008-09 was about 56 thousand tonnes.
Potteryware signifying crockery and tableware are produced both in the large-scale and the small-scale sectors. There were 16 units in the organised sector with a total installed capacity of about 43,000 tpy. In the small-scale sector, there were over 1,200 plants with a capacity of 3 lakh tpy. Production of potteryware in 2008-09 was about 66 thousand tonnes in the organised sector as against 59 thousand tonnes during 2007-08. Others : Production of HT insulators during 2008-09 was about 56 thousand tonnes. 8.2.5 CHEMICALS :- Caustic Soda :-
Caustic soda is a basic inorganic chemical used in the manufacture of pulp and paper, viscose rayon, textile, vanaspati and other chemicals and aluminium extraction. A significant quantity of caustic soda is used in the manufacture of other inorganic chemicals and dyestuffs, in metallurgical operations and in petroleum refining. Capacity and production of caustic soda in 2008-09 was 2.65 million tonnes and 2.05 million tonnes, respectively.The production of caustic soda in 2009-10 was 2.09 million tones. Soda Ash :-
Soda ash is an important chemical used widely as a raw material in the manufacture of glass and glassware, sodium silicate, textile, paper and pulp and in the preparation of a host of chemicals. Washermen use it largely as a washing material in laundries as also in households. The manufacture of Soda Ash in India started in 1932 at Dhaarangadhra in Gujarat with installed capacity of 50 tpd. Installed capacity and production of soda ash in 2008-09 was 2.95 million tonnes and 1.99 million tonnes, respectively. Dhaarangadhra in Gujarat with installed capacity of 50 tpd. Installed capacity and production of soda ash in 2008-09 was 2.95 million tonnes and 1.99 million tonnes, respectively.The production of soda ash during 2009-10 was 2.04 million tonnes. Bleaching Powder :-
Seven units were engaged in producing stable bleaching powder. There were three units engaged in the manufacture of liquid bleaching powder. Calcium Carbide :-
The capacity and production of calcium carbide was reported at 142,350 tonnes and 66.6 thousand tonnes, respectively, in 2008-09. Calcium carbide is used in the manufacture of acetylene gas. It is also used as a raw material for manufacturing various rubber goods. It is self-reinforcing filler. The production of Calcium Carbide during 2009-10 was 23.025 thousand tonnes. Nickel Sulphate :-
Ghatsila copper smelter of HCL produces nickel sulphate as a by-product from electrolytic copper spent solutions. The annual capacity of HCL smelter for the production of nickel sulphate is 390 tonnes. In 2002-03 and 2003-04, HCL produced 75 tonnes and 10 tonnes nickel sulphate, respectively. Since then, no production has been reported. Other manufacturers were Phonics Chemicals Works (Pvt.) Ltd, Mumbai; Kesar Sugar Works,
Mumbai; Ronuk Industries, Mumbai; Sen & Pandit Industries, Kolkata; Arim Metals Industries Pvt. Ltd, Kolkata; and Shambhunath & Sons, Amritsar, Punjab. Jhagadia Copper Ltd (formerly SWIL Ltd) has plans to recover nickel sulphate at its copper metal plant at Jhagadia, Bharuch district, Gujarat. The copper metal plant has started operations. Synthetic Cryolite (Na3AlF6) :-
Navin Fluorine Industries, Bhestan, Gujarat, is an important producer of synthetic cryolite. Other producers are Tanfac Industries Ltd, Cuddalore, Tamil Nadu; Dharamsi Morarji Chemicals Co., Ambarnath, Mumbai; and Adarsh Chemicals and Fertilizers Ltd, Udhana, Gujarat. Aluminium Fluoride :-
Sterlite Industries (I) Ltd's copper division is in the process of setting up a 13,000 tpy aluminium fluoride plant through hydrofluorosilicic acid route with a joint venture partner, in and around Tuticorin, Tamil Nadu. Important units producing aluminium fluoride were Navin Fluorine Industries, Dharamsi Morarji Chemicals Ltd, Tanfac Industries Ltd, SPIC and Aegis Chemicals Industries Ltd. The total production of aluminium fluoride in 2008-09 was about 15 thousand tonnes against an installed capacity of 27 thousand tpy. Titanium Dioxide :-
Five plants with an installed capacity of 251.5 thousand tpy produce titanium dioxide. These are IREL, Ganjam district, Orissa (100,000 tpy); KMML, Chavara, Kerala (40,000 tpy); DCW Ltd, Sahupuram, Tamil Nadu (42,000 tpy); Cochin Minerals & Rutile Ltd, Kerala (45,000 tpy); and Travancore Titanium Products Ltd, Thiruvanantapuram, Kerala (24,500 tpy). The production of titanium dioxide in 2008-09 was about 105.4 thousand tonnes as against 118.5 thousand tonnes in 2007-08. IREL has not reported production in recent years. However, KMML has reported production of about 35,221 tonnes and 35,486 tonnes of pigment grade TiO2 in 2007-08 and 2008-09, respectively. CMRL (34,603 tonnes), DCW Ltd (27,566 tonnes) and TTPL (7,731 tonnes) were the other producers of titanium dioxide during 2008-09. IREL has now initiated process to set up a 10,000 tpy titanium sponge plant at OSCOM, Orissa. The production of titanium dioxide during 2009-10 was 62.34 thousand tonnes. Sulphuric Acid :-
There were 104 units with an annual capacity of more than 6 million tonnes per annum, manufacturing sulphuric acid in the organised sector based on sulphur as a raw material. In addition, it is also recovered during copper smelting by HCL, Hindalco and Sterlite and during lead-zinc smelting by HZL and BZL. The total production of sulphuric acid in 2007-08, 2008-09 & 2009-10 was 6.57 million tonnes, 6.39 million tonnes and 7.44 million tonnes respectively. Phosphoric Acid :-
Important units producing phosphoric acid of various grades such as pharma grade, food grade, technical grade, analytical reagent grade etc. were Coromandel Fertilizers Co. Ltd, Visakhapatnam, Andhra Pradesh; Gujarat State Fertilizer Company, Vadodara, Gujarat; Fertilizers and Chemicals Travancore Ltd (FACT), Udyogmandal, Kochi, Kerala; Albright Morarji and Pandit Ltd, Ambarnath, Maharashtra; Rashtriya Chemicals & Fertilizers Ltd (RCF), Trombay, Maharashtra; Fertilizer Corp. of India (FCI), Sindri, Jharkhand; HCL, Khetri, Rajasthan; HZL, Udaipur, Rajasthan; Southern Petrochemical Industries Corp. Ltd, Tuticorin, Tamil Nadu; EID Parry (India) Ltd, Ennore, Tamil Nadu; Star Chemical Ltd,
Used in steel, foundry products & as a brake liners with 23% min. phosphorus, 1% max. carbon. Red Phosphorus :-
Star Chemicals (Bombay) Pvt. Ltd and United Phosphorus Ltd, Gujarat are the leading manufacturers and suppliers of the red phosphorus in the country mainly consumed in the match industry. Besides, it has applications in agriculture industry as fumigant and also as flame retardant. The production was at 54,000 tonnes and 50,000 tonnes in 2007-08 and 2008-09 respectively. Borax :- Borax was manufactured by Borax Morarji Ltd, Ambarnath, Maharashtra. The plant has an installed capacity of 17,000 tpy borax and 6,000 tpy boric acid. The plant is based on imported crude sodium borate concentrates (rasorite) and crude calcium borate (colemanite) which are not available indigenously and hence imported. National Peroxide Ltd, Kalyan, Maharashtra, has 1,200 tpy combined installed capacity to produce other boron compounds; namely, sodiumperborate - tetrahydrate and monohydrate. As a thumb rule for one tonne production of boric acid, about 2 tonnes of boro-gypsum is produced. However, boro-gypsum requires market for its disposal. Besides the above listed chemicals, activated bleaching earth, fluorochemicals, alumina ferric and sodium silicofluoride were the other mineral-based products 8.2.6 CHEMICAL FERTILIZERS :-
There are 56 large size fertilizer units in the country manufacturing a wide range of nitrogenous, phosphatic and complex fertilizers. The Government of India has been consistently pursuing policies conducive to increase the availability and consumption of fertilizers in the country and, as a result, India became the third largest fertilizer producer in the world. The overall consumption of fertilizers in terms of nutrients (viz., N, P & K) is about 168 lakh tonnes per annum. Indigenous raw materials are available mainly for nitrogenous fertilizers in the country. Prior to 1980, nitrogenous fertilizer plants were based mainly on naptha as feedstock. During 1978 to 1982, a number of fuel oil/LSHS-based ammonia-urea plants were also set up. A number of gas-based ammonia-urea plants were set up in 1985. The natural gas was obtained from Bombay High and South Basain. Recently, a number of expansion projects have come up with dual feed facility using both naptha and gas. In case of phosphatic fertilizers, indigenous rock phosphate supplies meet only 5 to 10% of the total requirement of P2O5. The domestic requirement is therefore, supplemented by imported rock phosphate and sulphur, as also by imported intermediate products; viz, ammonia and phosphoric acid, and to some extent by finished fertilizers. In the absence of commercially exploitable resources of potash in the country, the entire demand of potassic fertilizers is met through imports. The fertilizer plant operators in the country have fully absorbed and assimilated the latest technological developments incorporating environment-friendly process technology and are in a position to operate and maintain the plants at their optimum levels on nternational standards in terms of capacity utilisation, specific energy consumption and pollution standards. The fertilizer industry is carrying out de-bottlenecking
and energy saving schemes in the existing plants to enhance capacity and to reduce specific energy consumption. Companies are also planning to convert existing naptha-based fertilizer plants to liquified natural gas (LNG)/natural gas (NG)-based ones. Out of the 56 large plants, 28 units produced urea, 21 units produced diammonium phosphate (DAP) and complex fertilizers, 9 units produced ammonium sulphate (AS) as by-product. Besides, 5 units produce calcium ammonium nitrate (CAN) and other low analysis straight nitrogenous fertilizers. Besides, there were 72 small and medium-scale units in operation, producing single superphosphate (SSP). The installed capacity of phosphatic nutrient was 53.59 lakh tonnes and that of nitrogenous fertilizer was 120.61 lakh tonnes of nitrogen as on 31.3.2009. (Tables - 8.2 and 8.3).
Table - 8.2: Capacity and Production of Nitrogenous and Phosphatic Fertilizers (By Sectors) (000 tonnes)
Ltd Kalol and Kandla (Gujarat), Aonla I & II, Phulpur I & II (Uttar Pradesh), Paradeep (Orissa)
28 Krishak Bharti Co-operative Ltd Hazira (Gujarat) The review of demand projection, production targets and actual demand & production during XIth Plan is given in Annexure-I. The salient features like resources, production, demand of these minerals during XIIth Plan is summarised in Annexure-II. The data on production, export, import and apparent consumption of these minerals for the period 2005-06 to 2009-10 is given in Annexure-III. The Actual and projected domestic production of these minerals with 8%, growth rate for the period 2008-09 to 2011-12 is given in Annexure-IV. The apparent consumption of these minerals by terminal year of XIth and XIIth plan with 8%, 9% and 10% growth rate is given Annexure-V. The life index of these minerals has been worked out considering 9% growth rate in production and is given in Annexure-VI.The production and values of these industrial minerals during 2008-09 & 2009-10(p) is given in Annexure-VII.
Mineral wise status is discussed below: 8.3.1 ROCK PHOSPHATE
The rock phosphate or phosphorite is mainly fossiliferrous calcareous sandstone exhibiting reddish-brown colour at places, being ferruginous. World Scenario: Table – 8.4 The world reserves of rock phosphate is given in a Table below:
(Million Tonnes)
Country Reserves United States 1,400 Algeria 2,200 Australia 82 Brazil 340 Canada 500 China 3,700 Egypt 100 India 53 Israel 180 Jordan 1,500 Morocco and Western Sahara 50,000 Russia 1,300 Senegal 180 South Africa 1,500 Syria 1,800 Togo 60 Tunisia 100 Other Countries 620 World Total (rounded) 65,000
Source: Mineral Commodity Summaries 2011
PRODUCTION World production of marketable phosphate rock was 176 million tonnes in 2010, a 6% increase compared with that of 2009. The United States with 26 million tonnes, China with 65 million tonnes and Morocco and Western Sahara with 26 million tonnes were the leading producing countries, accounting for 67% of the production. India’s production is a meager 1.55 million tonnes. As a result, India will continue to rely on imports to meet its demand. Indian Scenario
The total resources of rock phosphate as per UNFC system in the country as on 1.4.2005 are placed at 305 million tonnes. Out of these resources, the exploitable resources are only 53 million tonnes. Remaining 253 million tonnes are resources which cannot be mined and utilised under present conditions. Out of 53 million tonnes reserves, bulk; i.e. about 47% are located in Rajasthan, followed by Madhya Pradesh (36%). The remaining 17% reserves are available in Uttaranchal and Uttar Pradesh. Out of 53 million tonnes reserves, 13 million tonnes are of chemical and fertilizer grades (+30% P2O5 ), 14 million tonnes blendable grade (25-30% P2O5), 10.5 million tonnes soil reclamation grade (+16% P2O5) and 14 million tonnes beneficiable grade (+10% P2O5).
The total production of phosphorite at 1.55 million tonnes in 2009-10 decreased by about 14% from that in the previous year due to less lifting of ore at crushing plant of Jhamarkotra mine of RSMML, Rajasthan. There were 8 reporting mines in both the years. Rajasthan continued to be the principal producing State, contributing 88% to the production, followed by Madhya Pradesh (12%). About 90% production of phosphorite was of grade 30-35% P2O5, 3% of grade 25-30% P2O5, about 2% of grade 20-25% P2O5 and 5% of grade 15-20% P2O5.
The main producers of phosphorite are Rajasthan State Mines and Minerals Ltd.
(RSMML) in Rajasthan and Madhya Pradesh State Mining Corporation Ltd., Bhopal from Chhattarpur and Jhabua districts of Madhya Pradesh. The total production of phosphorite during the last five year is as follows:
Note: Figures rounded off Figures in parentheses denote the number of units in organised sector reporting consumption. Besides, rock phosphate, imported phosphoric acid is consumed for manufacturing phosphatic fertilizers. Apatite and rock phosphate in ground form are also used directly in acidic soil.
The apparent demand of apatite and rock phosphate was 7.23 million tonnes in 2009-10. The apparent consumption of apatite and rock phosphate is estimated at 8.59 million tonnes by 2011-12 and at 13.22 million tonnes by 2016-17 at 9% growth rate (Annexure V).
Only about 21% requirement of raw material for phosphate fertiliser production is met through indigenous sources. The remaining requirement is met through import in the form of rock phosphate, phosphoric acid and direct fertilizers. In India, the finely-ground rock phosphate containing 16% P2O5 is used directly on the soil for soil amendment.
Exports of rock phosphate to Malaysia, Kenya, China, Nepal, Germany and
Bangladesh in 2008-09 increased to 5,408 tonnes from 3,182 tonnes in the previous year whereas imports were at 5.0 million tonnes level both in 2007-08 and 2008-09. Imports were mainly from Jordan (41%), Morocco (16%), Togo (6%) and China (4%).
The reserves of chemical and fertilizer grades apatite and rock phosphate in India are very limited. Therefore, detailed exploration is necessary for conversion of remaining resources into reserves. Secondly, the search for apatite and rock phosphate may have to be intensified in Andhra Pradesh, Rajasthan, Madhya Pradesh, Jharkhand, Tamilnadu, Meghalaya, Gujarat, Uttar Pradesh, Uttaranchal, West Bengal etc. Till the domestic resources of these two minerals are improved, the country has no alternative but to depend on their imports.
Value Addition
In India, most of the existing phosphatic fertilizer and phosphoric acid plants have been designed for high-grade imported rock phosphate, mainly from Morocco and Jordan. The Indian deposits are of low grade. Therefore, the fertilizer and phosphoric acid plants that may be set up as replacement to the existing plants will have to be designed to accept indigenous ores as a feed. Beneficiation of domestic low-grade ores would-be a step in the right direction.
Demand of phosphatic fertilizer will continue to rise due to growth in population and
corresponding increase in food requirements. There is no substitute for phosphorus in agriculture. Recommendations: (i) Mining of rock phosphate may be opened for private sector. (ii)Cluster mining may be resorted to reduce the mine loss and degradation of environment to the extent possible. (iii) Environmental issues may be sought amicably to start mining operations in Aravali areas. (iv) Technology for extraction of low grade ores may be adopted. (v) Further exploration is needed in various parts of the country.
8.3.2 POTASH : Potash is an essential nutrient for protein synthesis and it aids plants to use water more efficiently.
World Scenario TABLE – 8.7
(Thousand Tonnes of K2O)
Country Reserves United States 130,000 Belarus 750,000 Brazil 300,000 Canada 4,400,000 Chile 70,000 China 210,000 Germany 1,500,000 Israel 40,000 Jordan 40,000 Russia 3,300,000 Spain 20,000
Ukraine 25,000 United Kingdom 22,000 Other countries 50,000 World total 9,500,000
Source: Mineral Commodity Summaries 2011 Production :
World production of potash was 33 million tonnes of K2O content in 2010. About 93% of the world potash production was consumed by the fertilizer industry. The principal producers were Canada, Russia, Germany, Belarus and Israel. The rising trend of potash consumption that began in 2010 is likely to continue in the future because of increased demand of fertilizers for crop production. About 93% of world potash production is used by the fertilizer industry to provide potassium which is essential plant nutrient. Potassium chloride (KCL) is the principal fertilizer product equivalent to 60-62% K2O. Other salts for fertilizer use are potassium sulphate, potassium magnesium sulphate & potassium nitrate. Potassium chloride & potassium nitrate are used in manufacture of glass, ceramic, soap, synthetic rubber and chemical industries. Potassium nitrate is used in explosive manufacture.
Indian Scenario Bedded marine evaporite deposits and surface & subsurface potash-rich brines are the principal sources of potash. The principal ore is sylvinite, a mixture of sylvite (KCL) and rock salt (NaCl). As per UNFC, the total resources of Potash as on 1.4.2010 are estimated at 21,815 million tonnes in the country. Rajasthan alone contributes 94% resources followed by Madhya Pradesh (5%) and Uttar Pradesh, a very negligible quantity. Any estimation of the reserves has not yet been made mainly because of lack of exploration in depth and high cost involved in this task. Presently there is no production of potash in the country. Reported consumption of potash during 2009-10 was around 9 lakh tonnes in fertilizer industry. Department of Fertilizers, Ministry of Chemicals and Fertilizers, has launched “Potash Promotion Project” on 1.4.2003 which was conceptualized after a MoU was entered into between International Potash Company (IPC), Moscow and Indian Potash Ltd. (IPL), New Delhi. The project comprises a comprehensive programme for increasing the consumption of potash in India to achieve N:K ratio of 4:1 in long run and at least 6:1 by the end of 2006-07. Recommendations: (i) Mining of potash may be opened up for private sector. (ii) Glauconitic sandstone may be substituted for potash. (iii) State Government should carry out further development in this regard.
8.3.3 SULPHUR AND PYRITES World Scenario Resources of elemental sulphur in evaporite and volcanic deposits and sulphur associated with natural gas, petroleum, tar sands and metal sulfides amount to about 5 billion tonnes. The sulphur in gypsum and anhydrite is almost limitless, and some 600 billion tonnes is contained in coal, oil shale and shale rich in organic matter, but low cost methods have not been developed to recover sulphur from these sources. Production: World production of sulphur and pyrites in 2010 was 68.0 million tonnes and 5.3 million tonnes, respectively. USA (9.9 million tonnes), Canada (7.0 million tonnes), Russia (7.0 million tonnes), China (9.4 million tonnes), Japan (3.4 million tonnes), Saudi Arabia (3.2 million tonnes) and Germany (3.8 million tones)were the principal producers of sulphur. Whereas China (4.95 million tonnes), Finland (0.15 million tonnes), Turkey(0.08 million tones) Russia (0.07 million tonnes) and South Africa (0.06 million tonnes) were the principal producers of pyrite in 2009.
Indian Scenario In India, there are no mineable elemental sulphur reserves. Pyrites was used as a
substitute for sulphur in the manufacture of sulphuric acid by M/s. Pyrites Phosphates and Chemicals Ltd. (PPCL). There has been no production of pyrite since 2003. The production of elemental sulphur is limited to by-product recoveries from petroleum refineries and fuel oil used as feedstock for manufacturing fertilizer. Sulphur is also obtained as by-product sulphuric acid during the manufacture of non-ferrous metals form sulphide minerals. The sulphuric acid is further used for manufacturing single superphosphate (SSP) from rock phosphate imported from Jordan, Senegal, South Africa and China.
Total resources of pyrites in the country as per UNFC system as on 1.4.2010 are placed at 1,674 million tonnes of which about 27 million tonnes are under proved category. Out of the total resources, soil reclamation grade are about 6 million tonnes, beneficiable grade 62 million tonnes and low grade 1,553 million tonnes. Major resources are located in Bihar.
The production of sulphur recovered as a by-product from fertilizer plants and oil refineries was at 263 thousand tonnes in 2009-10. Two fertilizer plants and seven oil refineries, all in public sector, reported production of sulphur in 2009-10. Of the total quanity produced in 2009-10, Haryana accounted for 48%, Tamilnadu 18%, Uttar Pradesh 16%, West Bengal 7%, Gujarat 5% and the remaining 6% was contributed by Assam, Bihar and Punjab.
The production activities of Amjhore Phosphate Fertilizer Project of PPCL had been suspended since May 1999. The company had been referred to Bureau of Industrial Finance and Reconstruction (BIFR) by the Government of India. However, this project used to produce three products namely Agriculture Grade Pyrite (AGP), Sulphuric Acid and Single Superphosphate (SSP).
The total consumption of elemental by-product sulphur in 2008-09 was 1.72 million tonnes. The main consumer of sulphur was fertilizer industry which accounted for about 73 percent. Chemical industry, the next important consuming industry, accounted for about 15% consumption for manufacturing carbon disulphide & dye-stuffs. Other industries like explosives, iron & steel, paint, paper, pesticides and sugar consumed about 12 percent. The apparent consumption and sulphur and pyrites is estimated at 1.93 million tonnes by 2010-11 and at 2.97 million tonnes by 2016-17 with 9% growth rate (Annexure -V). The country will continue to rely on imports to meet its domestic demand.
Recommendations: (i) Saladipura deposit may be re-opened. (ii) Amjhore pyrite may be re-opened for private sector. (iii) Incentives in the form of subsidy or as tax benefits may be given to Refinery & Petrochemical Industries engaged in the production of sulphur as a by-product. (iv) Coal fired boilers produce lot of sulphur in the form of FGD to the tune of 1.5 million tonnes which goes as waste and pollutes the air. Suitable measures should be initiated in this regard. 8.3.4 ASBESTOS
Asbestos is a group of fibrous minerals. The physical properties, besides fibrous characters, such as fineness, flexibility, tensile strength of fibres, infusibility, low heat conductivity and high resistance to electricity, sound and corrosion by acids, make asbestos commercially important. Commercial asbestos is classified into two main mineralogical groups: serpentine asbestos or chrysotile asbestos and amphibole asbestos. The latter group includes asbestos minerals, such as tremollite, actinolite, anthophyllite, amosite and crocidolite. World Scenario: The world has 200 million tonnes of identified resources. The important countries where resources of asbestos are available are United States, Brazil, Canada, China, Kazakistan and Russia. Production: The world production of asbestos was 2.0 million tonnes in 2010. The important producers were Russia (1000 thousand tonnes), China (350 thousand tonnes), Brazil (270 thousand tonnes) and Kazakistan (230 thousand tonnes). Canada and Zimbabwe are major producers of chrysotile variety. India’s production was 233 tonnes only.
Indian Scenario
As per United Nation’s Framework Classification (UNFC) system, total resources (reserves and remaining resources) of asbestos in the country as on 1.4.2005 are placed at 21.74 million tonnes. Of these, 6.04 million tonnes are reserves and 15.70 million tonnes are remaining resources. Out of total resources of 21.74 million tonnes, Rajasthan accounts for 61% and Karnataka 38%.
The production of asbestos at 233 tonnes in 2009-10 decreased by about 26% from that in the previous year. The decrease in production was due to closure of mines. The
production of amphibole variety of asbestos was not reported in both the years because of closure of mines in Rajasthan. The entire production of asbestos was of chrysotile variety and was reported from Andhra Pradesh. There were 4 reporting mines in 2009-10 as against 3 mines in the preceding year. The entire production of asbestos was from private sector.
The internal consumption of asbestos was about 109 thousand tonnes per annum, almost entirely in asbestos-cement and asbestos-based products manufacturing. Minor quantity was utilised for insulation purpose in some industries. The available consumption data relate almost entirely to imported chrysotile asbestos. Reliable data on consumption of amphibole asbestos were not available as the consuming industries were mostly in small-scale sector, producing low pressure asbestos-cement pipes used in construction industry as given under:
Table – 8.8 (In tonnes)
Industry 2006-07 2007-08 (R) 2008-09 (p)All Industries 104650 110050 108650Asbestos-cement and products
Figures in parentheses denote the number of units in organised sector reporting consumption. (Figures rounded off.)
The apparent consumption of asbestos during 2009-10 was about 331 thousand tonnes. The apparent demand of asbestos is estimated at 393 thousand tonnes by 2011-12 and at 605 thousand tonnes by 2016-17 at 9 % growth rate (Annexure- V).
There has been a concern about the role of asbestos causing lung diseases. Research
in this area has been hampered by the long period between asbestos exposure and symptoms, known as latency period which can exceed 30 years. Results obtained so far suggested that chrysotile, most widely used asbestos, was less dangerous than amphibole asbestos minerals.
There are no restriction on exports of asbestos in the Foreign Trade Policy, 2009-14
effective from 1 April, 2010. As per the new Foreign Trade Policy, asbestos under heading 2524 can be freely imported with exception of amosite which is restricted. However, the imports of crocidolite, actinolite, anthophyllite, amosite and tremolie are restricted in terms of Interim Prior Informed Consent(PIC) Procedure of Rotterdam Convention for Hazardous Chemicals and Pesticides. Ministry of Environment and Forest, vide notification dated 13.10.1998, under sections 3(1) and 6(2) (d) of Environment (Protection) Act, 1986 and Rule 13 of Environment (Protection) Rules, 1986, has prohibited the imports of waste asbestos (dust and fibre), being a hazardous waste detrimental to human health and environment. .
Exports of asbestos decreased to 918 tonnes in 2008-09 from 3,942 tonnes in previous year. Whereas imports decreased to 346,658 tonnes from 331,705 tonnes.
The resources of chrysotile variety of asbestos are very much limited in India. So, there is an urgent need to go for detailed exploration of chrysotile which is required mainly in
the manufacture of asbestos-cement products. To meet the domestic demand the country will continue to rely on imports. Recommendations: (i) The ban on mining of asbestos may be lifted. (ii) Several non-fibrous minerals or rocks such as perlite, serpentine, silica and talc are considered to be possible substitute for products in which reinforcement properties of fibers were not required. 8.3.5 DOLOMITE World Scenario: World resources of dolomite are large. Production:
The statistics on world production of dolomite is not available. Indian Scenario:
Iron and steel including mini-steel plants and ferro-alloys are the main-stay of dolomite mining. Other imortant consumers are - glass industry. Impure dolomite in powder form finds some applications as fertiliser carrier, for supression of dusts in coal mines and in making dry paints. The manufacturers of flooring tiles use it as chips as well as in powder form. However, over 95% of the total production find outlet mainly in iron and steel and allied industries. With the advent of LD process of steel making importance of high purity dead-burnt dolomite bricks for lining LD furnaces has gained ground. At the same time, a few of the steel plants have dispensed with the use of dolomite in blast furnace. Dolomite used in the preparation of self-fluxing sinters is found adequate for the blast furnace charge. Mini-steel plants generally require dolomite for fettling and refractory purposes only.
Dolomite occurrences are widespread in almost all parts of the country. As per UNFC, total reserves and resources of all grades of dolomite are placed at 7533 million tonnes, out of which total reserves are 985 million tonnes and the balance; i.e. 6548 million tonnes are the resources. The share of proved reserves is 5%, probable reserves 8% and remaining resources 87 percent. Of the total resources in India, the major share of 83% is distributed in seven States; namely, Madhya Pradesh (26%), Andhra Pradesh (15%), Chhattisgarh (11%), Orissa (11%), Gujarat (7.0%) Karnataka (8%), Maharashtra (5%) and balance, i.e; 17% in other States.
The production of dolomite at 5.2 million tonnes in 2009-10 decreased by 6% from that in the previous year. Share of public sector has been 57% whereas the leading producing state has been Andhra Pradesh accounting for 30% production followed by Chhattisgarh (23%), Orissa (18%) and remaining 29% was contributed by other six states.. The production and consumption of dolomite during the 11th plan is given in table below.
Table – 8.9 (Million tonnes)
Year Production Consumption 2005-06 4.75 4.5 2006-07 5.17 5.1 2007-08 5.85 6.1 2008-09 5.5 6.0
2009-10 5.2 6.0
In the above table reported consumption of dolomite is more than mine production. This is may be because many steel plants have captive mines and keep stocks of dolomite at the plant site.
The apparent domestic demand is estimated at 6.15 million tonnes by 2011-12 and at 9.46 million tonnes by 2016-17 at 9% growth rate (Annexure-V).
Exports of dolomite increased from 15,000 tonnes in 2007-08 to 19,000 tonnes in 2008-09 which were mainly to the neighboring countries i.e. Bangladesh Nepal and Saudi Arabia. Import of dolomite increased to 10,000 tonnes in 2008-09 from 8,000 tonnes in 2007-08. The major supplier were Turkey, China and Italy.
The resources of the refractory grade dolomite in the country are meager and this type
of material is in short supply but very much required for making tar-bonded dolomite bricks. Therefore, intensive search is needed in non-Himalayan regions for locating deposits of massive non-crystalline dolomite, containing less than 2.5% R2O3 for use in tar-dolomite bricks required for lining of LD steel furnaces.
Recommendations: Exploration of low silica dolomite in the states of Andhra Pradesh and Orissa may be initiated by State DGM’s.
8.3.6 FLUORSPAR
Fluorspar is an indispensable material to aluminium metallurgy. It is an important fluxing agent and a source of fluorine chemicals which in turn find a variety of application. The utility of fluorspar can be grouped under four heads: (I) as fluxing agent for iron and steel, ferro-alloys, foundries and in the manufacture of electrodes; (ii) as vitrifying agent in glass industry; (iii) as an additive to cryolite bath in aluminium metallurgy and (iv) in the manufacture of fluorine compounds and chemicals both inorganic and organic.
There are two primary grade of fluorspar which are defined based on the CaF2
contents of the material: metallurgical grade fluorspar is any material containing < 97 % CaF2 whereas which acid grade fluorspar is material containing >97 % CaF2. Metspar is sold primarily as a flux into markets for iron & steel casting. Acidspar is the primary source for hydrofluoric acid but is also an important feed stock for alluminium fluoride and other markets (such as welding rock)
Fig: Flow sheet of fluorine consumption
Fluorocarbons
Petroleum Alkylation
Iron and Steel casting Metal Metaspar (and other grades) <97% CaF2
Picking Steel making
Alluminium Glassmaking Fluoride(HF,Merchant) Other (Chemical derivatives, etc.)
Source: Adapted from Ray Will, SRI Consulting,2009.
World scenario: The world reserves of fluorspar are tabulated below.
Table – 8.10
(Thousand Tonnes)
Country Reserve United States N.A.Brazil N.A.China 24,000France 10,000Kenya 2,000Kazakhistan N.A.Mexico 32,000Mangolia 12,000Morocco N.A.Namibia 3,000Russia N.A.South Africa 41,000.Spain 6,000Other countries 110,000World total 230,000
Source: Mineral Commodity Summaries 2011. Production: World production of fluorspar was 5.4 million tonnes in 2010. China (3.0 million tonnes), Mexico (1.0 million tonnes), Mongolia (0.4 million tonnes), Russia (0.2 million
Acidspar .>97% CaF2
Hydrofluoric Acid (HF)
tones and South Africa (0.10 million tones) were the principal producers. India’s production is negligible in the world context. Indian Scenario
Production of fluorspar in the country is from Gujarat, Maharashtra and Rajasthan. In addition to the natural fluorspar production, synthetic fluorspar can be recovered as a by-product of uranium processing, petroleum alkylation and stainless pickling. By-product fluorosilicic acid obtained from phosphoric acid plants while processing phosphate rock also supplements fluorspar as a source of fluorine.
As per the UNFC, the total resources (reserves and remaining resources) of flluorite in the country as on 1.4.2005 were estimated at 20.16 million tonnes. Out of these, 9.21 million tonnes were placed under reserves category and 10.95 million tonnes under remaining resources category. The reserves were classified into 8.6 million tonnes under proved category and 0.61 million tonnes under probable category. By States, Gujarat having 13.92 million tonnes accounted for 69% of the total resources, followed by Rajasthan 5.24 million tonnes (26%), Chhattisgarh 0.54 million tonnes (2.67%) and Maharashtra 0.45 million tonnes (2.23%). Gradewise classification of the resources was done taking into consideration the grade of run-of-mine ore and beneficiated product. Accordingly, the resources were classified into three grades; namely, usable grade which accounted for 82.53% of the total resources, low grade (15.72%) and unclassified grade (1.74%).
Fluorite (graded) is reported from three States; viz., Gujarat, Maharashtra and concentrates from Gujarat. The total production is given below:-
The average total consumption of fluorspar by all industries has been around 72,000
tonne per annum. The exports of fluorspar has decreased to around 203 tonnes in 2008-09 from 467 in 2007-08 whereas imports have considerably decreased to 153,749 tonnes in 2008-09 from 162,110 tonnes in 2007-08. The apparent domestic demand of fluorspar is estimated at 185 thousand tonnes by 2011-12 and at 285 thousand tonnes by 2016-17 at 9% growth rate (Annexure-V).
The resources of fluorspar in India are limited and grades of the fluorspar produced do not meet the specifications of the chemical industry which is the bulk consumer of fluorspar. Ambadungar fluorspar mine of GMDC is the only domestic source of acid grade fluorspar, a slightly inferior quality with high phosphorus content. Hence, to meet the requirements of domestic chemical industry the country will have to depend both qualitatively and
quantitatively on imported fluorspar in the coming years, both for direct use and for blending with the domestic acid grade fluorspar.
Outlook
In 2008 the production of primary alluminium was 39.6 million tonnes requiring the consumption of 1.2 million tonnes of acidspar. The growth in world consumption of alluminium during 2000-08 has been recorded at 3.8%, per annum, and expected to continue the same trend. This would require additional production of 1.05 million tonnes of acidspar by 2030.
However production of aluminium fluorspar from fluoritic acid (FSA) which is a by
product of phosphate production and can affect the market for acidspar which is a mainsource for AlF3 particularily in new aluminium smelter using improved technology. Metspar
World production of EAF steel in 2008 totalled 409 million tonnes. Stainless steel production was to 30 million tonnes. These together required 1.68 million tonnes of metspar.
A growth of 3.1% per annum is predicted in world steel production requiring an additional 1.77 million tones of metspar by 2030.
Thus the fluorspar market as a whole will need to produce an additional 2.82 million
tones of material by 2030, just for metallurgical uses alone.
Alluminium fluoride or AlF3 is one of the largest end markets for acidspar production, be it through captive production or via the HF route of merchant production.
Recommendations: (i) There is a need for setting beneficiation facilities. (ii) Exploration, reassessment & re-evaluation of resources is necessary.
8.3.7 GYPSUM
Gypsum (CaSO4.2H2O) is a hydrated calcium sulphate used widely in industry
because of its special property of losing three-fourths the combined water of crystallization when moderately heated (calcined) to about 130oC. Besides, calcined gypsum when cooled, finely ground and made plastic with water can be spread out, cast or moulded to any desired surface or form. On drying, it resumes its original state and sets into a hard rock-like form. Raw uncalcined gypsum is used for controlling the setting time of Portland cement (i.e. as a retarder to prevent quick set). It is added to the clinker just before final grinding to finished cement. Ground pure white gypsum is also used as a filler in paper, paints and textile goods. Ground low grade gypsum is used in mine dustings, manufacture of blackboard chalks, as manure in agriculture mainly for correcting black alkali soils, and as a filler in insecticides. World Scenario: World resources of gypsum are large.
Production: World production of gypsum was 146 million tonnes in 2010. The major producers were China (45 million tones), Iran (13.0 million tonnes), Spain (11.5 million tonnes), USA (9.0 million tonnes), Thailand (8.5 million tonnes), Mexico (5.8 million tonnes), Japan (5.0 million tonnes), and Canada (3.5 million tonnes), India with a production of (3.4 million tonnes) ranked 11th position in world production.
As per UNFC, the total resources of mineral gypsum in India as on 1.4.2005 were estimated at 1,237 million tonnes. Of these resources, 69 million tonnes have been placed under ‘reserves’ and 1,168 million tonnes under ‘remaining resources’. Categorywise, 41 million tonnes were proved reserves and 28 million tonnes probable reserves. Of the total reserves, about 1.1 million tonnes were of surgical plaster grade, 22.1 million tonnes of fertilizer/pottery grade, 43.53 million tonnes of cement/paint grade, 1.81 million tonnes of soil reclamation grade and 0.06 million tonnes of unclassified grade.
The production of gypsum at 3.423 million tonnes in 2009-10 decreased by 12% from that in the previous year. There were 24 reporting mines in the country, two main principal producers accounting for around 99% production. These are Rajasthan State Mines and Minerals Ltd. and Fertilizer Corporation of India Ltd. Rajasthan continued to be the leading producing State.
The production and consumption performance of gypsum during the 11th Plan period is as follows:
Table – 8.12
(Qty: Million tonnes) Year Production Total Consumption
In the above table consumption is more than production because reported
consumption includes by-product gypsum also.
The exports and imports of gypsum have also shown a rising trend. The exports during 2008-09 were 209 thousand tonnes and imports at 891 thousand tonnes.
The apparent domestic demand of gypsum is estimated at 5.66 million tonnes by 2011-12 and at 8.71 million tonnes by 2016-17 at 9% growth rate (Annexure-V).
India’s main focus in near future is creation of more infrastructure with a view to
infuse momentum in its economy together with attracting foreign direct investment and participation in its industrial development. These activities will keep the cement industry to grow and accordingly, the consumption of gypsum will increase. India’s domestic resources of gypsum are large to meet increased demand. Steps would be necessary to find out suitable mining technology to exploit deep-seated gypsum resources in Bhadvasi deposit, Nagaur
district,Rajasthan. Production of gypsum wallboard in India is negligible. Because of its lightweight and many other characteristics, its domestic demand as lightweight and attractive partition designing material in high-rise buildings has to be explored. In view of the environmental problem arising from huge accumulation of phospho-gypsum at different fertilizer plants, increasing utilisation of phospho-gypsum is necessary. Low-grade mineral gypsum being cheaper should be utilised more as a soil conditioner in the reclamation of alkaline soils.
International Competitiveness India occupies a comfortable position as regards the resources of gypsum. However,
since gypsum is a low value high bulk mineral, there does not exist much prospects to increase exports of gypsum.
Value Addition Production of gypsum wallboard which is negligible in India should be increased so that gypsum is used in value added form. Recommendation: State-of-the-art technology to be adopted for the exploitation of deep-seated gypsum deposit. 8.3.8 WOLLASTONITE
Wollastonite, a metasilicate of calcium (CaSiO3), contains theoretically 48.3% CaO and 51.7% SiO2. It occurs as aggregates of bladed or needle-like crystals. Ceramic industry uses substantially domestic production of wollastonite as a filler. Some other uses of wollastonite are as a filler in ceramic floor and wall tiles, marine wallboard, paint, plastic and in refractory liners in steel mills, and as a partial replacement for short-fibre asbestos in certain applications, such as brake-lining. Technical improvements in filler properties in plastic and rubber have been made in recent years. A better compatibility between the polymer and the filler is achieved by chemical surface treatment of the mineral filler. Wollastonite, when treated in such a manner, results in improved flexural modules in polyprophylene and improved reinforcement in nylon.
World Scenario No authentic information on world resources of wollastonite is available. However India’s is a leading producer.
World production of wollastonite was 540 thousand tonnes in 2010. China (300
thousand tonnes) and India (132 thousand tonnes) were the major producers. Indian Scenario
Major deposits of wollastonite have been found in Sirohi and Dungarpur districts in Rajasthan. Besides, in Ghoda area, Banaskantha district in Gujarat and in Dharmapuri and Tirunelveli districts in Tamil Nadu, a few deposits occur. As on 1.4.2005, the resources of wollastonite in India as per UNFC system are placed at 20.24 million tonnes. Out of which
90% (18.24 million tonnes) are in Rajasthan and the remaining 10% in Gujarat (2.00 million tonnes). Meagre resources are located in Tamil Nadu(3,533 tonnes).
There are 2 reporting mines and the total production is at around 132 thousand tonnes in 2009-10, this has registered an increase of 16% over the previous year. The consumption at around 90 thousand tonnes per annum is also registering the marginal increase.
The apparent domestic demand of wollastonite is estimated at 132 thousand tonnes by 2011-12 and at 203 thousand tonnes by 2016-17 at 9% growth rate (Annexure-V).
Presently, the existing mines in the country are in a position to meet the domestic requirements of the industry as well as export demand. There is an increasing demand for wollastonite in the international markets, especially in ceramic and plastic industries and in construction activities. Since, wollastonite is mined and exported by only a few countries in the world, there is a scope for increasing the exports of this mineral from India in value-added form as coated powders, since Indian wollastonite is in tough competition from China and USA.
International Competitiveness The largest market for wollastonite in the world is ceramics followed by asbestos substitution, metallurgy and paints. Wollastonite is marketed under two grades viz. High aspect ratio wollastonite and powdered (milled) wollastonite. The former type relies mainly on physical accicularity while the later one depends on the chemical composition of the mineral. Exports of processed wollastonite with high aspect ratio and powdered wollastonite for better unit value realisation may be encouraged.
Recommendations: Further exploration is necessary in the States of Tamil Nadu and Gujarat. 8.3.9 Non-cement grade Limestone:
The principal use of limestone is in cement industry. Other important uses are as flux
in metallurgical processes; in glass, ceramic, paper, textile and tanning industries; for manufacture of calcium carbide, alkali and bleaching powder; for water purification and sugar refining; in fertilizer (calcium ammonium nitrate) and as soil conditioning agent in agriculture; crushed stone for ballast and filler in concrete and asphalt; as rectangular slab in lithography. Limestone is also used in underground mine dusting to prevent the propagation of explosions. The manufacture of metallic calcium is one of the latest uses of lime. Calcium is used in reducing organic compounds, de-sulphurising petroleum, de-bismuthising lead production of hard lead alloys and calcium-silicon alloys, and in the manufacture of calcium hydride which is further used as an efficient hydrogen carrier. Indian Scenario Resource : The total resources of limestone of all categories as per UNFC system as on 1.4.2005 are estimated at 175,345 million tonnes. Of which 104,580 million tonnes (60%) under limestone
in cement grade. The remaining 70,765 million tonnes (40%) in limestone of other than cement grade.
Reserve/Resources of Limestone as on 1.4.2005
Table - 8.13
Unit: ' 000 tonnes All India/Grades
Reserve
Remaining resources
Total Resource
All India (All Grades) 12715317 162629584 175344901 Limestone Cement Grade
9836838 (77%)
94742994 (58%)
104579832 (60%)
Limestone other than Cement Grades
2878479 (23%)
67886590 ( 42%)
70765069 (40%)
Figures rounded off; Source: National Mineral Inventory as on 1.4.2005. Production: The production of limestone of other than cement grade in 2008-09 was 14 million tonnes as against 9 million tonnes in the previous year. Madhya Pradesh was leading producing state account for about 39% of total production of limestone of other than cement grade followed by Gujarat (34%), Rajasthan (15%) and remaining 15% was contributed by other states. The State wise production of limestone of other than cement grade during 2007-08 & 2008-09 are as follow :
Production of Limestone of Other than Cement Grade 2007-08 & 2008-09
Consumption of Limestone in industries other than Cement Grade
Besides, cement, Limestone is also used in aluminium, alloy steel, chemical, fertilizer, ferro-alloys, foundry, glass, Iron & steel, metallurgy, paper, sugar etc. The reported consumption of limestone in organised sector in industries other than cement during 2008-09 was 11324 thousand tonnes as against 11659 thousand tonnes in previous year. The reported consumption of limestone in other than cement industries is given below :
Reported Consumption of Limestone in other than cement industries (2006-07 to 2008-09)
Table – 8.15
(Unit: In tonnes) Industry 2006-07(R) 2007-08(R) 2008-09(P)
All Industries 150031500 159369000 166847300Other than Cement Industries 10848500 11659200 11324000
The estimated production of limestone of other than cement grade is about 17 million tonnes by 2011-12 and 25 million tonnes by 2016-17 at 8% growth rate. The apparent consumption is estimate at 19 million tonnes by 2011-12 and 28 million tonnes by 2016-17 at 8% growth rate. The actual/estimated production and apparent consumption of limestone of other than cement grade during 11th plan and forecast for 12th plan are as follows:
Demand supply scenario of Limestone of Other than Cement Grade
(at 8% growth rate) Table – 8.16
Unit in thousand tonnes Year Production Apparent Demand
11th Five Year Plan 2007-08 9366 11780 2008-09 13695 15175 2009-10 (e) 14790 16389 2010-11 (e) 15973 17700 2011-12 (e) 17251 19116 12th Five Year Plan (e) 2012-13 18631 20645 2013-14 20121 22297 2014-15 21731 24081 2015-16 23470 26007 2016-17 25347 28087
(e) : estimated Recommendations 1. India has huge resources of limestone distributed over different parts of the country but SMS, BF and chemical- grade limestone occur in selective areas. Increase in steel production in the country has escalated the demand for SMS and BF grade limestone. Concerted efforts to locate SMS and BF-grade limestone along with cement- grade limestone are imperative to meet the growing demand.
2. Access to potential limestone deposits of hill states and north-eastern states for exploitation on selective basis needs to be pursued for the industrial development of the region. 8.3.10 QUARTZ AND OTHER SILICA MINERALS
Quartz, silica sand, moulding sand and quartzite are different forms of silica minerals
and differ from each other only in their physical characteristics. These group of minerals constitute the largest volume of all the minerals. These are used in several industries especially in glass, foundry, ferro-alloy, iron & steel, cement, refractory & ceramics and sodium silicate. World Scenario: Sand, and gravel resources of the world are large. However, because of their geographical distribution, environmental restrictions and quality requirements for some industries, extraction of these resources become sometimes un-economic. Quartz rich sand and sandstone, the main source of industrial silica sand occur throughout the world. Production:
World production of quartz is not available separately. But the world production of sand and gravel (industrial) during 2010 was 108 million tonnes. The major producers were USA (26.5 million tonnes), Italy (14 million tones), Germany (6.5 million tonnes), U.K. (5.6 million tones), Australia (5.2 million tones) and France and Spain (5 million tonnes each).
The important varieties of crystalline quartz are vein quartz (massive crystalline quartz); milky quartz (white, translucent to opaque); ferruginous quartz (containing brown limonite and red haematite and almost opaque); aventurine quartz (containing glistening flakes of mica or haematite); cat’s eye (opalescent greenish quartz with fibrous structure); rock crystal (clear, colourless, well-crystallised transparent quartz); amethyst (clear-purple or violet-blue), transparent quartz, rose quartz; smoky quartz; etc. Large occurrences of massive crystalline quartz in veins or pegmatite have been recorded in almost all the States.
As per the UNFC system of resource classification, the total resources of quartz and silica sand as on 1.4.2005 are estimated at 3,238 million tonnes, out of which 24%, i.e. 772 million tonnes are placed under reserves category while 76%; i.e. 2,466 million tonnes are placed under remaining resources category. Resources of foundry and moulding grades are 20%, glass grade 10% and ferro-silicon 6%, and ceramic and pottery grades 10%. More than 54% resources are of unclassified, others and not known grades. Haryana alone accounts for about 60% Indian resources, followed by Jharkhand(5%), Maharashtra (4.6), Tamil Nadu(5.3%) and Rajasthan (8%), Kerala (4%), Andhra Pradesh (4.7%), Uttar Pradesh(2.3%), Orissa (2% each) and others (3.55%). The total resources of quartzite as per the UNFC system in the country as on 1.4.2005 are estimated at 1,1145 million tonnes, of which reserves are about 98 million tonnes and remaining resources are 1046 million tonnes. Bulk resources of about 54% are located in Haryana followed by Bihar (24%), Punjab (7%), Jharkhand (3.5%), Orissa (5%) and others (6.4%). Resources of refractory grade are 26%, ceramic and pottery grade 19% and flux grade 6%. Remaining 49% resources are of unclassified, others and not known grades.
The production of quartz at about 507 thousand tonnes in 2009-10 showed a increase of 15% over the preceding year. Andhra Pradesh continued to be the major producing State of quartz accounting for 33% production followed by Rajasthan, Gujarat, Jharkhand, Maharashtra, West Bengal and Tamil Nadu.
The production of silica sand at 2.28 million tonnes in 2009-10 decreased by about 19% over the previous year due to closure of mines for want of environmental clearance and lack of demand. Andhra Pradesh and Gujarat accounted for 65% of the total production during 2009-10. The other leading producing States are Kerala, Rajasthan, Maharashtra, Uttar Pradesh, Karnataka and Jharkhand. About 66% production of silica sand was contributed by 14 mines, each producing more than 50 thousand tonnes annually.
Production of quartzite at 108 thousand tonnes in 2009-10 increased by about 10% from that in the previous year owing to favourable market conditions. Bihar was the leading producing State contributing about 50% to the total production followed by Orissa, Jharkhand, Karnataka, Rajasthan, Maharashtra and Andhra Pradesh. The production of sand (others) at 2.11 million tonnes in 2009-10 registered an increase of about 16% over the previous year. The production of agate at 11 tonnes was also reported in 2009-10.
In India, quartz, quartzite and silica sand are used mainly in glass, foundry, ferro-alloys, refractory industries and also as building materials. According to its suitability for different purposes, it may be named as building sand, paving sand, moulding or foundry sand, refractory sand or furnace sand and glass sand, etc. However, the main use of silica minerals is in the manufacture of different types of glasses, natural silica sand being preferred material in the glass industry.
The consumption of quartz and silica sand in the organised sector was estimated at 1.45 million tonnes in 2009-10. Major consuming industries were glass (37%), cement (19%), ferro-alloys (16%), foundry (9%) and fertilizer (7%). Other industries like iron and steel, ceramic, alloy steel, insecticide, refractory, abrasive, etc. consumed the remaining 12%. The consumption of quartzite in the organised sector was estimated at 278,800 tonnes out of which iron and steel industry consumed over 57%, followed by ferro-alloys (13%), refractory (22%) and cement (7%). Consumption of moulding sand in the organised sector in 2009-10 was estimated at 59,900 tonnes. Major industries were foundry (93%), followed by mining machinery (5.5%), iron and steel (1.4%) sugar and textile industries (0.14%). The total ferro-silicon consumed by various industries in 2008-09 was estimated at 45,800 tonnes. Major industries were iron and steel (81%), alloy steel (12%) and foundry (5%).
The domestic demand of quartz and silica minerals is estimated at 3.15 million tonnes by 2011-12 and at 4.85 million tonnes by 2016-17 at 9% growth rate (Annexure -V).
The demand for quartz, silica sand, moulding sand and quartzite is increasing over the
years to cater to the requirement of ferro-silicon, silico-manganese, silico-chrome, silica refractories, glass and for moulding and casting purposes. The requirements of these products are linked up directly with iron and steel industry including alloy steel production. Further, setting up foundries and enhancing their capacities are also linked with metallurgical industry.
International Competitiveness:
The total resources of quartz and other silica minerals are 4383 million tonnes. There are very good prospects of increasing the exports of quartz and silica minerals to the neighboring countries. Recommendations: In the state of Haryana silica sand is available but due to environmental constraints mining is stopped. Hence these constraints may be solved amicably in consultation with MOEF. 8.3.11 FIRECLAY
World Scenario The world resource of clay minerals including fireclay are large. However no
authentic data on world resources and production is available. Fireclay is one of the most important minerals used in the refractory industry. Almost
the entire production in the country is consumed in the manufacture of refractories and about 80% of these refractories are used by the iron and steel industry. India has huge reserves of this mineral and there does not seem to be any problem of supply to the refractory industry in the future. However, a serious dearth is being felt in the refractory industry with respect to availability of high grade clay analysing 37% and above Al2O3 and having Fe2O3 and fluxing impurities less than 2%.
In India, fireclay deposits are spread over many parts of the country. The best deposits occur in association with the coal seams in the Lower Gondwana coalfields of Andhra Pradesh, Jharkhand , West Bengal, Madhya Pradesh and Neyveli lignite fields in Tamil Nadu. Notable occurrences of fireclay, not associated with coal measures, are known in Gujarat, Jabalpur region, Madhya Pradesh and Belpahar-Sundergarh areas, Orissa. Reserves and resources of fireclay as per UNFC as on 1.4.2005 are estimated at 705 million tonnes. Out of these, 59 million tonnes are grouped under reserves category while bulk; i.e., 645 million tonnes are classified in resources category. Out of the total, 27 million tonnes are proved reserves and 32 million tonnes are probable reserves. The reserves of fireclay are substantial but reserves of high grade (non-plastic) fireclay containing more than 37% alumina are limited.
The production of fireclay at 410 thousand tonnes in 2009-10 decreased by 5% from that in the previous year due to stoppage of work by High Court order in Rajasthan. Rajasthan, the major producing State contributed 45% production followed by Orissa, Gujarat, Karnataka, Maharashtra, Madhya Pradesh, West Bengal, Tamil Nadu, Andhra Pradesh and Jharkhand.
The total consumption of fireclay in organised sector marginally decreased to around 538 thousand tonnes in 2008-09 from 537 thousand tonnes in 2007-08. Cement industry has emerged as a major consumer of fireclay accounting for 45% consumption followed by refractory and ceramic industries. The apparent domestic demand of fireclay is estimated at 480 thousand tonnes by 2011-12 and at 739 thousand tonnes by 2016-17 at 9% growth rate (Annexure-V). The exports of fireclay decreased to 5,590 tonnes in 2008-09 from 8,354 tonnes in the previous year. The exports were mainly to UAE, Norway, Nepal, Bangladesh,
USA, Saudi Arabia, etc. The exports of fire bricks also showed an increasing trend. The imports of fireclay increased to 121 tonnes in 2008-09 from just one tonne in 2007-08. International Competitiveness :
Since fireclay is low-value high bulk minerals, there does not appear much prospects for increasing the exports. Value Addition: Use of fireclay in fireclay bricks as an export commodity should be encouraged. 8.3.12 KAOLIN (CHINA CLAY) AND BALL CLAY
China clay, also known as Kaolin, is one of the most essential raw materials for the
manufacture of ceramic products, which accounts for about 50% of the total china clay consumption in the country. Refractory industry consumes another 25% of china clay, while the remainder is used in rubber, paper, cement, insecticides, textile etc. industries. All industries except refractory, cement and insecticide consume washed china clay.
Ball clay is a high plastic variety of china clay. It possesses high binding power tensile strength and considerable shrinkage, and is generally utilised after mixing with non-plastic clays to impart the desired plasticity. It is used for the same purposes as china clay, the main use being ceramic industry which consumes about 80% of total consumption. Ball clay and china clay are used for similar purposes. Ball clay and china clay differ only in the degree of plasticity. China clay is less plastic than ball clay. Ball clay is a highly plastic variety of kaolin having high binding power, tensile strength and shrinkage ability. It is utilised generally after mixing with non-plastic clay to impart the desired plasticity in pottery, porcelain and refractory materials. It also helps in the preparation of glaze, enamels and for imparting a dense vitrified body.
World Scenario: Resources: The world resources of all clays are extremely large. Production: Kaolin : The estimated world production of kaolin was 34 million tonnes in 2010. USA was the principal producer, contributing (17%), followed by Czech Rep (12%), Germany (9.6%), Brazil (8%), Uzbekistan (10%) and United Kingdom (5%). India’s production was of the order of 2,578,000 tonnes in 2009-10. Indian Scenario China clay resources in the country as per UNFC system as on 1.4.2005 have been placed at 2596 million tonnes, of which the reserves are only about 8% of the total resources at 222 million tonnes. Out of the total reserves, 45% (about 101 million tonnes) reserves are under proved category whereas 54% (about 121 million tonnes) reserves falls under ‘probable’ category. The resources are spread over in a number of States of which Kerala holds about 24% all India resources, followed by West Bengal (16%), Rajasthan (14%), Orissa (11%) and Karnataka (10%). The distribution of reserves do not correspond with the resource availability in various States. About 51% reserves
are confined to three States; namely, Rajasthan (19%), Orissa (18%) and Jharkhand 14%. The total resources of china clay have been classified into ten different grades. About 74% or 1923 million tonnes resources falls under mixed grade, others, unclassified, non-known categories and the remaining resources are classified under textile/paper coating, insecticide, chemical, ceramic/pottery, paper filler and rubber grades. There is an urgent need for classifying the resources into specific grade and bringing huge ‘resources’ into ‘reserve’ category.
The production of china clay at about 2.58 million tonnes in 2009-10 increased by 24% from the previous year. Five principal producers accounted for about 63% output, mainly from the private sector mines. The contribution of natural and processed china clay was 97% and 3%. Gujarat was the leading producing State of china clay, accounting for 49% production followed by Kerala (28%), Rajasthan(13%), West Bengal and Jharkhand (4%) each.
The consumption of china clay in organised sector increased to around 1.14 million tonnes in 2009-10 and cement was the major raw china clay consuming industry accounting for 47% followed by cement (27%), pesticides (2%), paint (11%), refractory (3%) and paper (2%).
The total resource of ball clay as on 1.4.2005 in the country are placed at 79.29 million tonnes. Out of these resources, the reserves are about 32.53 million tonnes and remaining resources are 46.76 million tonnes. More than 63% resources are in Andhra Pradesh, followed by Rajasthan 37% and negligible in Gujarat. Out of the total resources, ceramic/pottery grade constitute over 90%.
The production of ball clay at 898 thousand tonnes in 2009-10 decreased by 10% from the previous year. Rajasthan continued to be the leading producing State contributing 68% to the production followed by Andhra Pradesh 23%.
The consumption of ball clay in the organised sector increased to around 565 tonnes in 2009-10 from 545 thousand tonnes in 2008-09. About 98% consumption was accounted for by ceramic industry and the remaining by the refractory and abrasives industries. In 2008-09, exports increased to 23,228 tonnes from 12,456 tonnes in 2007-08, mainly due to increase in exports to Bangladesh whereas the imports of ball clay decreased from 122,026 tonnes in 2008-09 to 166,340 tonnes in 2007-08.
The apparent demand of china clay is estimated at 2.99 million tonnes by 2011-12 and
at 4.61 million thousand tonnes by 2016-17 and that of ball clay at 1.18 million tonnes by 2011-12 and 1.82 million tonnes by 2016-17 at 9% growth rate (Annexure-V).
International Competitiveness:
The resources of kaolin in India are abundant. With large resource base and limited domestic demand, there are prospects to increase exports of kaolin. The world markets are favourable for processed chinaclay in various industries like paper, plastic paints, rubbers, ceramics, etc. The paper industry continues to be the major market for processed chinaclay in the world. For this purpose the international market demand high quality standard market
especially that of paper coating grades. Efforts are to be made in future to capture the potential markets like Egypt, Zimbabwe, Iran and neighbouring countries. Value Addition:
India has abundant resources of china clay which can easily meet both internal and external demands. The future requirements of processed china clay in the domestic market is expected to grow substantially. Most of the processing of china clay in the country is done by conventional methods like levigation and washing. Hence hi-tech processing techniques will be necessary for generation of processed china clay in future. New practices for processing have to be established and existing capacities are to be augmented in the country to meet the increased requirement of processed china clay in the future. Efforts are to be made in future to capture the potential markets like Egypt, Zimbabwe, Iran, Malaysia, Jordan and Pakistan, besides increasing the exports to the traditional neighboring markets like Bangladesh, Sri Lanka and Nepal and other markets like Kenya, UAE, Saudi Arabia and Bahrain. Recommendations: Serious attention should be given for improvement in the quality of the clays. 8.3.13 MAGNESITE
Magnesite(MgCO3) is a very important mineral for the manufacture of basic refractories, which are largely used in the steel industry. World Scenario: Resources : The world resources of magnesite are 2400 million tonnes. The world reserves of magnesite is given below:
Table – 8.17
(Million Tonnes) Country Reserves
Australia 95 Austria 15 Brazil 45 China 550 Greece 30 India 6 Korea North 450 Russia 650 Slovakia 35 Spain 10 Turkey 49 U S A 10 Other Countries 390 World Total (Rounded) 2400
Source: Mineral Commodity Summaries, 2011.
Note: As per NMI, prepared by IBM, the resources are placed at 338 million tonnes. Production :
The world production of magnesite was 24.3 million tonnes in 2009, an decrease of about 5% compared with that of 2008. China was the principal producer, contributing about 62%, followed by Turkey (8%), Russia (11%),Korea RP(5%), Slovakia (2%) and Austria (2%). India’s production was of the order of 286 thousand tonnes in 2009-10. Indian Scenario The total reserves/resources of magnesite as per UNFC system as on 1.4.2005 are about 338 million tonnes of which reserves and remaining resources are 76 million tonne and 262 million tonnes, respectively. Substantial quantities of resources are established in Uttaranchal (68%), followed by Tamil Nadu (14%) and Rajasthan (16%). The remaining resources are in Andhra Pradesh, Himachal Pradesh, Jammu & Kashmir, Karnataka and Kerala. Magnesite of Tamil Nadu is low in lime and high in silica whereas that of Uttaranchal is high in lime and low in silica.
Production of magnesite in 2009-10 at 286,383 tonnes registered an increase of about 13% from that in the previous year. There were 8 reporting mines as against 16 in the previous year. Five principal producers accounted for 94% output in 2009-10. About 60% production of magnesite was contributed by public sector. Tamil Nadu continued to be the major producing State, having a maximum share of 78% output, followed by Uttaranchal 20% and Karnataka 3%.
The consumption of magnesite in the organised sector increased to 282 thousand tonnes in 2009-10 because of higher consumption reported by refractory industry. The apparent domestic demand of magnesite is estimated at 403 thousand tonnes by 2011-12 and at 622 thousand tonnes by 2016-17 at 9% growth rate (Annexure-V). The exports of magnesite increased to 12,000 tonnes in 2008-09 from 8,697 tonnes in the previous year. The imports also increased to 51,422 tonnes in 2008-09 from 76,287 tonnes in the previous year. Out of the total imports, magnesite (calcined) were 12,992 tonnes only. The imports were mainly from People’s Republic of China, Iceland, Australia, Nether land, Japan, and Slova Rep. India has large resources of magnesite. However, because of cheap imports the domestic resources are not being exploited optimally. There is a need to reduce imports of magnesite and encourage more use of domestic resources. Recommendations: Import duty may be increased to discourage imports. 8.3.14 GRAPHITE
Graphite is used as a raw material in a large number of industries such as crucible, foundry facing, dry cell battery, lubricants, pencils, paints, etc.
Natural graphite is devided into two commercial varieties: (i) crystalline graphite, and
(ii) amorphous graphite. Both flaky and amorphous varieties of graphite are produced in the country. Whereas synthetic graphite is manufactured on a large-scale in electric furnaces. World Scenario Resources : The world reserves are of the order of 71 million tonnes. The word reserves of Graphite are furnished in a Table below:
Table – 8.18
(Thousand Tonnes)
Country Reserves Brazil 360 China 55,000 India 800 Madagascar 940 Mexico 3,100 U S A - Other Countries 6,400 World Total (Rounded) 71,000
Source: Mineral Commodity Summaries, 2011. Note: As per NMI prepared by IBM, the total resources are 169 million tonnes.
Production :
The world production of graphite was 1,100 thousand tonnes in 2010. China was the principal producer contributing about 73% of the total production, followed by India (12%), Brazil (7%) and Korea Dem. Peoples Rep. (3%).
Indian Scenario As per the UNFC system, the total resources (reserve and remaining resources) of
graphite in the country as on 1.4.2005 are placed at about 169 million tonnes, comprising 11 million tonnes in the reserves category and remaining 158 million tonnes under resources category. The reserves are further classified into 5 million tonnes proved reserves and 6 million tonnes probable reserves. Of the total, resources containing +40% fixed carbon constitute about 01.11 million tonnes and resources analysing 10-40% fixed carbon 21.22 million tonnes. Graphite deposits of economic importance are located in Andhra Pradesh, Jharkhand, Karnataka, Kerala, Orissa, Rajasthan and Tamil Nadu.
The production of graphite at 109 thousand tonnes in 2009-10 decreased by 8% from the previous year. In 2008-09 about 83% production was accrued from seven mines, each
producing more than 5,000 tonnes and Tamil Nadu was in the leading position contributing about 46% output followed by Orissa and Jharkhand.
Consumption of various grades of graphite in the organised sector was in the range of 14 thousand tonnes during the last three years. Out of total consumption, the refractory 45% and crucible industries 30% accounted for 75% and foundry industry 7%. The apparent domestic demand of graphite r.o.m. is estimated at 135 thousand tonnes by 2011-12 and at 208 thousand tonnes by 2016-17at 9% growth rate (Annexure-V).The exports showed an increasing trend; the export being 1909 tonnes of natural graphite in 2008-09 as against 1420 tonnes in the previous year and the imports of 7309 tonnes from 11666 tonnes in 2007-08. However, exports and imports of graphite crucibles increased.
The graphite reserves having +40% fixed carbon are rather limited in the country. Detailed exploration of graphite deposits in Orissa, Jharkhand, Jammu & Kashmir and Kerala should be carried out.
Value Addition
Cost-effective beneficiation technologies for low-grade graphite ore need to be developed. Age-old application of graphite in clay-bonded graphite crucibles has to be substituted by silicon carbide-graphite crucibles to improve upon the use of inferior grade material with less quantity and at the same time ensuring longer life of crucible. Some important higher applications have emerged in exfoliated graphite which are for making sealings, gaskets, braids and brushed. New products by synthetic graphite are graphite fibres/ropes and graphite insulation blankets. Carbon-composite materials are used in very high technology areas, such as, aerospace and production of these advanced materials is done at Hyderabad in a pilot plant. On world scenario, a potential large-volume end-use for natural graphite has emerged in heat sinks also called spreader shield, which is a graphite foil material conducting heat only in two directions. It has thermal conductivity above aluminium and almost equal to copper. These are used for carrying away heat in laptop computers, flat-panel displays, wireless phones, digital video cameras, etc.
Recommendations: (i) Incentives for beneficiation of low grade ore having less than 10% FC are necessary. (ii) Emphasis should be given on exploration. 8.3.15 PYROPHYLLITE
Pyrophyllite is different in chemical composition from steatite but they resemble in many of their physical properties and are used more or less for the same purposes. Since pyophyllite is somewhat harder than steatite and does not flux when heated, it is also used in refractory industry. World Scenario : Resources : The world resources of pyrophyllite are large. Production : The whole production of pyrophyllite was 1.69 million tonnes. Korea Republic (893 thousand tonnes), Japan (330 thousand tonnes) were principal procedures. India occupied third position in world production of pyrophyllite.
Indian Scenario : Pyrophyllite occurs mainly in Chhatarpur, Sagar, Shivpuri and Tikamgarh districts of Madhya Pradesh; Bhandara district of Maharashtra; Keonjhar district of Orissa; Udaipur, Alwar, Jhunjhunu and Rajsamand districts of Rajasthan and Jhansi, Lalitpur and Hamirpur districts of Uttar Pradesh. The total resources of pyrophyllite in India as per UNFC system as on 1.4.2005 are placed at 33.69 million tonnes of which more than 58%; i.e. 19.49 million tonnes are in reserves category.
Production of pyrophyllite at 242 thousand tonnes in 2008-09 decreased by 5% from the previous year. Eight principal producers accounted for 75% production in 2008-09. The share of public sector in the total production was 8%. Madhya Pradesh continued to be the leading producing state accounting for 81% output, followed by Uttar Pradesh, Orissa and. Jharkhand.
The consumption of pyrophyllite in the organised sector was 29,000 tonnes and ceramic was the main consuming industry (7%) followed by refractory (93%).
The apparent domestic demand of pyrophyllite is estimated at around 288 thousand
tonnes by 2011-12 and at 442 thousand tonnes by 2016-17 at 9% growth rate (Annexure-V).
The use of pyrophyllite in ceramic industry seems to be static whereas that in the refractory applications is facing the problems like the most other refractory minerals due to change in technology and reduction of refractory consumption per tonne of metal. Pyrophyllite will continue to face competition from bentonite and atapulgite in carrier applications. However, use in filler applications appears to be stable. 8.3.16. KYANITE
Kyanite is known as `super-refractory’ in view of special refractory properties. World Scenario : Resources : The World resources of kyanite and related minerals are large. Production : The estimated world production in 2008-09 was 430,000 tonnes. The South Africa, USA, France, India, were the leading producers of kyanite. India’s production of kyanite was 5,553 tonnes in 2009-10 and ranked third. Indian Scenario :
The total resources of kyanite as per UNFC system in the country as on 1.4.2005 are placed at 103 million tonnes. Out of these resources, only 1.4 million tonnes are the reserves and 101.2 million tonnes are remaining resources. Out of 1.4 million tonnes reserves, gradewise, high and medium-grade reserves together are merely 20%; high and medium, mixed 11%; low grade, 15%; high, medium and low, mixed 8%, and others and not known 46 percent. The bulk reserves (over 66%) are located in Jharkhand , Karnataka (16%) and Maharashtra(17%). The remaining 1% reserves are accounted by Rajasthan and Andhra Pradesh.
Production of Kyanite at 5,553 tonnes in 2009-10, increased by 20% from the previous year. There were only 4 reporting mines. About 12% production was of grade above 40% Al2O3 . The consumption of Kyanite in organised sector is estimated at 8,400 tonnes in 2009-10 remains static. The apparent domestic demand is estimated at 6,575 tonnes by 2011-12 and 10,116 tonnes by 2016-17 at 9% growth rate.(Annexure-V).
Although India has substantial resources of kyanite, grade details of bulk of these are
not available. There is a need for systematic sampling of kyanite deposits for grade analysis.
8.3.17. SILLIMANITE World Scenario : World resources of silimanite are large. Production : Authentic data on world production is not available. However, Australia, China, India are the major producers of sillimanite. India’s production of sillimanite was 30,690 tonnes in 2009-10, and was leading producer in the world. Indian Scenario
The total resources of sillimanite as per UNFC system in the country as on 1.4.2005 are placed at 74 million tonnes. Out of these resources, the actual reserves are only 11.42 million tonnes. About 62.9 million tonnes are the remaining resources. Out of 11.42 million tonnes reserves 91% are granular high-grade while unclassified and not known grade are 7 percent. Reserves of massive sillimanite of all grades are less than 1 percent. The reserves are located mainly in Orissa (68%) and Kerala (23%). Tamilnadu and Maharashtra account for the remaining reserves.
The production of sillimanite at 30,690 tonnes in 2009-10 reported decrease by 9% from the previous year. There were 4 reporting mines only and 74% production was by the public sector. The Orissa is the main producing state followed by Maharashtra and Kerala.
The consumption of sillimanite in organised sector is around 6,000 tonnes, mainly consumed by the refractory industry. The apparent domestic demand of sillimanite is estimated at 37 thousand tonnes by 2011-12 and at 57 thousand tonnes by 2016-17 at 9% growth rate (Annexure-V). The exports of sillimanite increased to 2,013 tonnes in 2008-09 from 1,445 tonnes in the previous year. Recommendations: Exports of sillimanite may be encouraged. 8.3.18. VERMICULITE
Vermiculite is a term applied commercially to micaceous materials (essentially hydrated silicates of Al, Mg and Fe), usually alteration products of biotite or phlogopite mica formed by the removal of much alkalies and addition of water. Vermiculite differs from mica in its characteristic property of exfoliating. World Scenario : Resources: The world resources of vermiculite are not available. Reserves have been reported in Australia, Brazil, China, Russia, South Africa, Uganda, USA, Zimbabwe and some other countries.
Production : The world production of vermiculite was 530,000 tonnes in 2010, a 6% increase compared with that of 2009. South Africa is the principal producer, contributing about 40% of the total production, followed by China(25%) and USA (19%), Russia (5%), etc. India’s production of vermiculite was 12847 tonnes in 2009-10.
Indian Scenario
The reserves/resources of vermiculite in India as on 1.4.2005 as per UNFC system are placed at 2.4 million tonnes. Major deposits are located in Tamilnadu (77%), followed by Madhya Pradesh (11%), Andhra Pradesh (5%), Karnataka (3.7%), Jharkhand (1%) and Rajasthan (2%). The remaining reserves/resources are accounted by West Bengal and Gujarat.
Production of vermiculite at 12,847 tonnes in 2009-10 increased marginally form 12,647 tonnes in the previous year. There were 4 reporting mines only. One principal producer from Tamilnadu and two from Andhra Pradesh recorded 90% output in 2008-09. The remaining 31% production was contributed by mines for associated minerals. The share of public sector was 10%.
The reported consumption of vermiculite in the organised sector was 1,300 tonnes. The refractory and asbestos product industries were the main consumers of vermiculite. The apparent domestic demand for vermiculite is estimated at 14 thousand tonnes by 2011-12 and at 22 thousand tonnes by 2016-17 at 9 % growth rate (Annexure-V). Exports of vermiculite in 2008-09 decreased to 1,005 tonnes from 1,118 tonnes in the previous year whereas the imports increased to 305 tonnes from 34 tonnes.
International Competitiveness India’s resources of vermiculite are limited and need to be conserved. 8.3.19. Non-metallurgical grade Bauxite:
Bauxite is basically an aluminous rock containing hydrated aluminium oxide as the main constituent and iron oxide, silica and titania in varying proportions. Hydrated aluminium oxides present in the bauxite ore are diaspore and boehmite. Bauxite is the only raw material from which aluminium is extracted economically. Bauxite other than metallurgical grade is used in manufacture of refractory material, chemical and abrasive. Low grade bauxite find use in small proportion in cement industry and high grade bauxite used as fluxing material in steel melting shop ferro-alloy industries, petroleum refineries . The country has abundant resources of bauxite which can meet both domestic and export demands.
World Scenario: Reserves :
The total world reserves of bauxite is estimated at 28,000 million tonnes in 2010, located mainly in Guinea (26%), Australia (19%), Brazil(12%), Vietnam (8%), Jamaica (7% and India (3%). A country wise reserve of bauxite as as follows:
Table – 8.19 (In Million tonnes)
Country Reserves World Total(rounded) 28000 Australia 5400 Brazil 3400 China 750 Greece 600 Guinea 7400 Guyana 850 India * 900 Jamaica 2000 Kazakhstan 360 Russia 200 Suriname 580 USA 20 Venezuela 320 Vietnam 2100 Other Countries 3300
Source: Mineral Commodity Summaries, 2011. * - As per UNFC as on 1.4.2005 Indian resources was 3,290 million tonnes.
Production :
The total world production of bauxite was estimated at 199 million tonnes in 2009, decreased by 7.54% as compared to that in the previous year. Australia continued to be the major producer accounting for 33% share in total production, followed by China (15%), Brazil (13%), Indonesia (8%), Guinea & India (7% each) and Jamaica (4%). The country wise world production of bauxite for during 2005 to 2009 is given in below:
Table – 8.20
World Production of bauxite (2005 to 2009)
(In ‘000 tonnes)
Country 2005 2006 2007 2008 2009 World Total (rounded)
178000 194000 212000 214000 199000
Australia 59959 61781 62428 64038 65843 Brazil 22365 23236 25461 28098 26074 China 17408 18982 20446 25177 30000 Guinea 19237 18784 18519 17682 14774 India 12596 15733 22625 15554 14048 Indonesia 2700 9000 16000 18000 15000 Jamaica 14116 14865 14568 14636 7818
The total resources of bauxite in the country as on 1.4.2005, as per UNFC system, are placed at 3,290 million tonnes of which 3133 million tonnes (95%) under metallurgical grade. The remaining 157 million tonnes (5%) are of grade other than metallurgical. The grade wise resources of bauxite and bauxite other than metallurgical grades is as follows :
Reserves/Resources of bauxite as on 1.4.2005 Table – 8.21
Unit in '000 tonnes. All India/Grade Reserves Remaining
Resources Total Resources
All India (All grades) 899384 2390432 3289817Metallurgical Grade 837469 (93%) 2295065
(96%) 3132545
(95%)Other than Metallurgical grades 61915
(7%)95367 (4%)
157272(5%)
Production :
The production of bauxite other than Metallurgical grade in 2008-09 was 3.66 million tonnes as against 4.54 million tonnes in the previous year. Gujarat was leading producing state account for about 79% of total production of bauxite of other than metallurgical grade followed by Goa (14%) and remaining 7% was contributed by Madhya Pradesh and Maharashtra. The state wise production of bauxite of other than metallurgical grade during 2007-08 to 2008-09 is given below:
Production of Bauxite other than Metallurgical grades (2007-08 to 2008-09) Table – 8.22
Beside alumina (bauxite in metallurgical grade), bauxite is also used in abrasive, cement, ceramic, chemical, ferro-alloys, fertilizer, iron & steel, and refractory. The reported consumption of bauxite in organised sectors in industries other than metallurgical during 2008-09 was 1.38 million tonnes as against 0.95 million tonnes in the previous year. The reported consumption of bauxite other than metallurgical grade is as follows :
Reported consumption of bauxite in other than metallurgical grade (2006-07to 2008-09)
Table – 8.23
(In tonnes) Industry 2006-07® 2007-08® 2008-09(p)
All Industries 10316400 10599900 10942700Other than metallurgical 1011800 947400 1383400 Demand-supply of Indian scenario of bauxite
The estimated production of bauxite in other than metallurgical grade is about 4.61 million tonnes by 2011-12 and 6.77 million tonnes by 2016-17 at 8% growth rates. The apparent consumption is estimated at 2.52 million tonnes by 2011-12 and 3.99 million tonnes by 2016-17 at production and apparent consumption of bauxite in other than metallurgical grade during 11th Plan and forecast for 12th Plan are given below :
Demand-supply scenario of bauxite in other than metallurgical grade
(at 8% growth rate) Table – 8.24
(Unit in '000 tonnes)
Year Production Apparent consumption
11th five year plan 2007-08 4538 1838 2008-09 3660 1889 2009-10(e) 3953 2158 2010-11(e) 4269 2330 2011-12(e) 4610 2516 12th five year plan (e) 2012-13 4979 2935 2013-14 5377 3170 2014-15 5808 3424 2015-16 6272 3698 2016-17 6774 3994
(e) estimate
Recommendation: The country has large resources of bauxite, occupying the sixth place in the world total resources. The resources of metallurgical grade bauxite are quite adequate while those of the chemical and refractory grade bauxite are relatively limited considering the future requirements. The refractory and chemical grade bauxite can be preserved for future use. There is no substitute of bauxite for aluminium metal extraction on a large scale. However, calcined clay can be substituted for refractory bauxite but only with reduction in length of time and stock resistance. Silicon carbide and diamonds can substitute for fused aluminium oxide in abrasive use but again at higher cost. Synthetic mullite substitutes for bauxite-based abrasives.
8.3.20. Barytes
Barytes, as a high specific gravity mineral (weighting agent) finds use largely in oil and gas well drilling. It makes an ideal material for preparation of drilling mud in view of its properties mainly high specific gravity, low abrasiveness, insolubility in water, lack of magnetic property and high chemical stability. Next to oil drilling, the next important consumer of barytes is the chemical industry for manufacture of barium chemicals like carbonate, chloride, oxide, hydroxide, nitrate, peroxide and sulphate salts. Paint, rubber, asbestos products, glass and other like abrasives and as filler in heavy paper and card are the other industries consuming small quantities of barytes, in order of importance. Long term demands and production of barytes, however, depend solely on growth in oil well drilling. World Scenario: The reserves of barytes are given in table below:
Table – 8.25
(Thousand Tonnes) Country Reserves
United States 15,000 Algeria 29,000 China 100,000 Germany 1,000 India 34,000 Mexico 7,000 Morocco 10,000 Pakistan 1,000 Russia 12,000 Turkey 4,000 U.K. 100 Vietnam N.A. Iran NA Other countries 24,000 World total 240,000
Note: As per NMI, prepared by IBM, the total resources of India are 74.2 million tonnes. Source- Mineral Commodity Summaries January 2011. Production:
World production of barytes was 6.9 million tonnes in 2010. The important producers were China (3.6 million tonnes), India (1 million tonnes), USA (0.67 million tonnes), Morocco (0.46 million tonnes) and Mexico (0.4 million tonnes) were the principal producers. India occupies second position. Indian Scenario
The total resources of barytes in India as on 1.4.2005 as per UNFC are placed at 74.2 million tonnes constituting 46% reserves and 54% remaining or additional resources. Andhra Pradesh alone accounted for more than 99% country’s reserves as well as more than 94% country’s remaining resources of barytes.
The production of barytes at about 2.14 million tonnes in 2009-10 increased by about
27% from that in the previous year. Andhra Pradesh continued to be the premier State accounting for almost the entire production followed by Rajasthan and Himachal Pradesh with nominal production. Almost the entire production of barytes was of off-colour variety.
The domestic consumption of barytes in the organised sector increased to 141,300 tonnes in 2008-09 from 126,000 tonnes in 2007-08. Oil and gas drilling industry, the main consumer of barytes in India, accounted for 70% consumption followed by chemical industry (24%). The apparent domestic demand of barytes is estimated at 1.36 million tonnes by 2011-12 and at 2.09 million tonnes by 2016-17 at 9 % growth rate (Annexure-V). The exports of barytes increased to 843,789 tonnes in 2008-09 as against 564,800 tonnes in the previous year. Venezuala was the main buyer followed by Saudi Arabia,USA and UAE.. Imports were 1674 tonnes mainly from China.
India ranks second in the production of barytes in the world after China and is one of the important exporters in the world market. India has surplus resources of barytes and it can meet comfortably not only the needs of the domestic industry but also of the export market. Therefore, concerted efforts are necessary to boost up the export of barytes and its micronized products from the country. The world-wide demand for barytes may probably continue to grow till petroleum products endure to be the energy source of choice. Demand for oil and gas remained strong and the oil price remained high, encouraging exploration and development of wells that boost barytes consumption.
Value Addition The world barytes market mainly depends on oil/gas drilling activity which is influenced by the price of oil, the state of world economy and political factors. Approximately 85% of the world’s baryte is used in the petroleum industry as one of the key ingredients in drilling mud for oil and gas wells. Despite the growing use of non-hydrocarbon energy sources, the demand for
petroleum is expected to continue to be high and as a result the demand for barytes will continue. Although China produces more barytes than India, but all over the world, market has a preference for Indian barytes because of its high quality. The unit realisation from powder barytes is nearly twice that of lumpy barytes. Therefore, exports of powdery barytes be encouraged for better unit realisation. For this purpose, more processing plants are required to be set up near the mining areas. Recommendations: More exploration is necessary to locate new deposits in Rajasthan, Himachal Pradesh, etc..
8.3.21 BENTONITE
Bentonite is essentially high plastic clay containing not less than 85% clay mineral, montmorillonite. Bentonite is of a great commercial importance possessing inherent bleaching properties like fuller’s earth, hence, it is known as bleaching clay. There are two types of bentonites; namely, swelling-type or sodium bentonite and non-swelling-type or calcium bentonite. Sodium bentonite is usually referred to simply as bentonite whereas calcium bentonite is called Fuller’s earth. The commercial importance of bentonite depends more on its physico-chemical properties rather than its chemical composition. Excellent plasticity and lubricity, high dry-bonding strength, high shear and compressive strength, low permeability and low compressibility make bentonite important. Bentonite is valued in foundry and binding, drilling mud, iron ore pelletization and as waterproofing and sealing agent in civil engineering. Processing is a prerequisite for bentonite marketing. Bhavnagar and Kachchh districts of Gujarat and Barmer district of Rajasthan are the major producers of bentonite. Sporadic occurrences are reported in Jharkhand. Bentonite is a “minor mineral declared under Mines and Minerals (Development and Regulation) Act, 1957”. World Scenario : World resources of bentonite are extremely large. Production: The world production of bentonite was 14 million tonnes in 2009. USA was the main producer of bentonite accounting for about 29% of the world production. China (24%), Greece (7%) Turkey (5%) and Mexico (4%) were the other important producers. India’s production is not available. Indian Scenario
Total reserves and resources of bentonite in the country are about 530 million tonnes out of which large quantity, i.e. 423 million tonnes comprising 80% are in Rajasthan, 97 million tonnes (18%) in Gujarat and the remaining in Tamil Nadu, Jharkhand and Jammu & Kashmir. About 9 million tonnes,55 million tonnes and 19 million tonnes are placed under drilling fluid, foundry and poor/blendable grades, respectively. Substantial quantity (448 million tonnes or 85%) of reserves/resources are placed under ‘unclassified’ and ‘not known’ categories.
Quantitative data on production of bentonite is not available.
The value of bentonite produced in India in 2007-08 increased by 11% from the
previous year. Gujarat continued to be the leading producing State and accounted for 90% followed by Rajasthan. The total consumption of bentonite in 2008-09 decreased by 8% to
100,000 tonnes from that in the previous year because of less demand in pulverizing and oil well drilling. The consumption in other industries remained almost static. Foundry industry accounted for 51% consumption, followed by oil well drilling 17%, pelletization 11% and other industries 21%. India has entered the market with bentonite from Kuchchh in Gujarat. The Ashapura Minechem (P) Ltd., Kuchchh has commissioned a bentonite pulverizing plant of 60,000 tpy capacity near Bhuj. The company has also installed a new Pellet Strength Test (PST) grade bentonite plant of 100,000 tpy capacity. Ashapura Volclay, a joint venture company is the leading bentonite exporter and there were other 30 pulverizing units in Gujarat and 27 in Rajasthan. The exports of bentonite increased from 4,62,502 tonnes in 2007-08 to 566,890 tonnes in 2008-09. UAE, Indonesia, Brazil, UAE ,Malaysia, Netherland and Spain were the major buyers.
International Competitiveness The biggest market for bentonite in both North America and European countries are foundry, cat litter, iron ore pelletizing and drilling. Civil engineering and environmental applications, such as land fills, require bentonite for use as a sealant and lubricant. The global bleaching clay market is estimated at 860,000 tpy of which 700,000 tpy is used for bleaching edible oils, 150,000 tpy for petroleum and the remaining 10,000 tpy for clarifying beverages, such as wines and fruit juices. Ashapura Volclay produces and sells more than 20,000 tpy of bleaching clays which can be used for refining all kinds of vegetable oils, industrial oils, fats and waxes. The Indian bentonite industry is expected to get on well in the coming years because of emerging demand for oil clarification and cat litter. Value Addition
Bentonite is one of the exportable commodities in India. Bentonite is exported both in
unprocessed (crude) and processed (including activated) forms. Exports of crude bentonite account for the bulk quantity. But exports of processed bentonite fetch higher value than the crude bentonite. There is a pressing need to develop various processing techniques to suit our available resources for making the product to suit the international standards. There is scope to establish bentonite processing granulation and paint grade processed bentonite units in the country to meet the indigenous demand as well as in the international market. 8.3.22 FULLER’S EARTH:
Fuller’s earth, like bentonite, is also known as ‘bleaching clay’ due to its inherent
bleaching properties. It has great commercial importance like bentonite. Bentonite is a swelling-type clay but Fuller’s earth is a non-swelling-type clay. This property difference is because of their chemical composition. Bentonite contains sodium whereas fuller’s earth contains calcium. Calcium bentonite, sometimes called Fuller’s earth can be converted into sodium bentonite by cation exchange process or acid activation. Activated Fuller’s earth is used mainly in bleaching and refining of vegetable and mineral oils. Fuller’s earth is a “minor mineral declared under Mines and Minerals (Development and Regulation) Act, 1957”.
World Scenario: World resources of fuller’s earth are large. Production : The world production of fuller’s earth (including attapulgite and sepiolite) was 3,700 thousand tonnes in 2009, which decreased by 4,000 thousand tonnes compared to the previous year. The USA was the top producer accounting for about 64% of the world production. Other principal producers were Spain (16%), Senegal (5%), Morocco(4%) and Mexico (3%)
Indian Scenario
The reserves/resources of Fuller’s earth in India as per UNFC are placed at 256 million tonnes. Out of these, negligible reserves are placed under ‘probable’ category while about 99.98% are placed under ‘resources’ category. About 74% resources are located in Rajasthan. The remaining resources are in Andhra Pradesh, Arunachal Pradesh, Assam, Karnataka and Madhya Pradesh. Quantitative data on production of fuller’s earth is not available.
The value of Fuller’s earth produced in India in 2007-08 was Rs.9.4 crores and it was 3% higher than that in the previous year. Production was reported from Andhra Pradesh, Karnataka, Rajasthan and Madhya Pradesh with substantial production from Andhra Pradesh.
The consumption of Fuller’s earth in the organised sector was at 5,500 tonnes in 2008-09. Vanaspati industry, the largest consumer, accounted for about 92% consumption. A sizeable quantity is also consumed in rural/urban areas for non-industrial uses like plastering mud walls, washing of hair, etc. Exports of Fuller’s earth were 84,015 tonnes in 2007-08. Malaysia was the main buyer followed by UAE.
International Competitiveness India is one of the important exporter of fuller’s earth in the world and needs to maintain its leading position. 8.3.23. MICA
The mica group represents 34 phyllosilicate minerals that exhibit a layered or platy
structure. Commercially important mica minerals are muscovite and pholgopite. World Scenario: Resources: Large deposits of mica bearing rock are known to exist in countries such as Brazil, India and Madagascar, and some small resources of sheet mica in the USA . The reserves are given in Table, below:
Table - 8.26
(Thousand Tonnes)
Country Reserve India Very Large Russia Moderate USA Very small Other countries Moderate World Total Very large
Source: Mineral Commodity Summaries, 2011
Production: The World production of mica was 350,000 tonnes in 2010, about 3% increase compared with that of 2009. Russia was the principal producer contributing 29%, followed by Finland 19%,UAE 15% and Korea Rep.14%. India’s production of crude mica was 1,206 tonnes in 2008-09. Indian Scenario
Over hundred years, India has enjoyed the monopoly in the production and export of sheet mica in the world. But recently, production of mica has showed a continuous declining trend due to slow down in the demand of natural mica in the world market because of technological developments in use of mica and emergence of mica substitutes. However, there are sufficient resources in the country to meet the domestic requirement and export demand.
Most important mica-bearing pegmatites occur in Andhra Pradesh, Bihar, Jharkhand
and Rajasthan. Occurrences of mica pegmatites are also reported from Gujarat, Haryana, Karnataka, Kerala, Maharashtra, Orissa, Rajasthan, Tamilnadu and West Bengal. As per UNFC system, the total resources of mica in the country are estimated at 39,3857 tonnes out of which only 68,569 tonnes are placed under reserves category. Remaining resources are estimated at 325,285 tonnes Rajasthan accounts for about (51%) resources, followed by Bihar (28%), and Maharashtra (17%).
The production of mica (crude) at 1,206 tonnes in 2008-09 decreased by 74% from the previous year. However the production of mica(waste and scrap) at 4,792 tonnes in 2008-09 increased by 37% from the previous year. There were 36 reporting mines. Six mines, each producing above 100 tonnes annually accounting for 69% output. The entire production was in the private sector and Andhra Pradesh was the sole producing state.
Complete picture regarding the consumption of mica is not available. Sheet mica is
used mainly in electrical and micanite industries while scrap mica is used in the manufacture of mica paper .
Exports of mica increased to 1,91,037 tonnes in 2008-09 from 99,888 tonnes in the previous year. Exports were mainly to China, Japan, USA, Netherlands, Belgium, Germany and Finland etc. whereas imports of mica decreased to 2,332 tonnes in 2008-09 from 2,645 tonnes in the previous year.
International Competitiveness
World demand for sheet mica is expected to decline. This is, however, compensated by the growing demand for scrap mica and value-added mica-based products. Therefore, the world market conditions are expected to be favourable for mica exports but to take full advantage of situation for boosting exports, it would be necessary for Indian mica industry to manufacture and export fabricated and value-added mica-based products, such as mica paper, micanite sheets and mica-based paper.
Recommendations:
Some of the mica deposits in the country contain lithium mica and substantial concentration of rubidium and cesium. Process know-how needs to be developed for recovery of these values.
There appears to be good demand for wet ground mica especially in the manufacture of pearlescent pigments which are increasingly used in the automotive industry. Therefore, establishment of wet ground mica plants based on imported know-how in the country needs to be encouraged.
The quality of Indian ground mica powder is acceptable to foreign buyers. However, they prefer that the material should be free from iron and consistency in the mesh size in the powder. Efforts are necessary in this direction. 8.3.24 TALC, SOAPSTONE AND STEATITE
Talc is a hydrous magnesium silicate. In trade, talc often includes: (I) the mineral talc in the form of flakes and fibres; (ii) steatite, the massive compact cryptocrystalline variety of high-grade talc; and (iii) soapstone, the massive talcose rock containing variable talc (usually 50%), soft and soapy to feel. Commercial talc may contain other minerals like quartz, calcite, dolomite, magnesite, serpentine, chloride, tremolite and anthophyllite as impurities. The properties that give talc a wide variety of uses and markets are its extreme softness and smoothness, good lustre and sheen, high slip and lubricating property, low moisture content, ability to absorb oil and grease, chemical inertness, high fusion point, low electrical and heat conductivity, high dielectric strength, good retention for filler purposes, whiteness, good hiding power as pigment and high specific heat. In addition, it has the advantage of being relatively abundant. It can be mined and prepared easily for market.
World Scenario Resources: The world reserves of talc-steatite are large.
Table -8.27
(Thousand Tonnes)
Country Reserves Brazil 227,000 China Large Finland Large France Large
India 75,000 Japan 100,000 Korea Rep of 14,000 U S A 140,000 Other Countries Large World Total Large
Source: Mineral Commodity Summaries, 2011.
Production: World production of talc was about 7.45 million tonnes in 2010. Major producers
were China, USA, Brazil, Finland and France.
Indian Scenario
The total reserves/resources of talc/steatite/soapstone as on 1.4.2005 are assessed at 312 million tonnes of which reserves and remaining resources are 115million tonnes and 197 million tonnes, respectively. Substantial quantities of resources are established in Rajasthan (50%) and Uttaranchal (32%). The remaining 18% are in the States of Andhra Pradesh, Bihar, Chhattisgarh, Gujarat, Jharkhand, Karnataka, Kerala, Maharashtra, Madhya Pradesh, Orissa, Sikkim and Tamilnadu.
Production of steatite in 2009-10 at 835 thousand tonnes decreased by about 6% from the previous year. The entire production was from private sector mines. About 85% production was of grade other than insecticide and the remaining 15% was of insecticide/DDT grade. Rajasthan, the main producing state accounted for as much as 75% production followed by Uttaranchal (16%) and Andhra Pradesh(8%).
Talc/Soapstone is mainly used in pulverised form as a filler in various industries. The non-pulverised is used in refractory, sculpturing etc. The total consumption in the organidsed sector is around 270,000 tonnes per annum, of which 68% was in paper industry followed by pesticide (16%), paints (8%) and cosmetics (4%). The apparent domestic demand for talc-steatite is estimated at 879 thousand tonnes by 2011-12 and 1.35 million tonnes by 2016-17 at 9% growth rate (Annexure- V). The exports of steatite (total) is around 99,520 tonnes whereas imports were 5,218 tonnes in 2008-09.
International Competitiveness India is one of the principal source of sawn shaped talc and ‘lava’ grade of talc. The
lava grade is well suited for specialised purposes like low ceramic materials. In the world market, talc is free from grit, having high whiteness and high degree of soapy feeling are very much sought after for cosmetic, filler and weighting application. Indian talc minerals of good quality are comparable with the best quality available in other countries. Indian talc is considered to be the second best in the world next to ‘Italian talc’.
Value Addition
The world market conditions for talc minerals are steadily growing. Therefore, concerted efforts are necessary to increase exports by adopting modern pulverising techniques for Indian talc. In view of India’s large resource base, and well developed production facilities, there is considerable scope for boosting the exports of talc-steatite. 8.4.0 RECOMMENDATIONS
1. The reserves of chemical and fertilizer grades rock phosphate in India are very limited. Therefore detailed exploration is necessary for conversion of remaining resources into reserves. Also the search for new deposits of rock phosphate may have to be intensified in Andhra Pradesh, Rajasthan and Madhya Pradesh. Further, the Indian deposits are of low grades. Therefore, fertilizer and phosphoric acid plants that may be set up as replacement to the existing plants will have to be designed to accept indigenous ores as a feed. Beneficiation of domestic low-grade ores would need to be given a priority.
2. The resources of chrysotile variety of asbestos are very much limited in India.
So there is an urgent need to go for detailed exploration, as the internal demand for asbestos in the country can not be met from indigenous production.
3. The resources of the refractory grade dolomite in the country are meager and
is in short supply but very much required for making tar-bonded dolomite bricks for use in lining of LD steel furnaces. Intensive search is therefore needed in non-Himalayan regions for locating deposits of massive non-crystalline dolomite.
4. The grades of the fluorspar deposits other than Ambadungar in Gujarat do not
meet the specifications of the chemical industry which is the bulk consumer of fluorspar. Hence to meet the requirements, domestic chemical industry will have to depend on imported fluorspar in the coming years.
5. India’s domestic resources of gypsum are large to meet increased demand.
However, steps would be necessary to find out suitable mining technology to exploit deep-seated gypsum resources in Rajasthan. Besides, the production of gypsum wallboard need to be encouraged.
6. There is an increasing demand for wollastonite in the international markets
and therefore, there is scope for increasing the export of this mineral from India in value-added form as coated powders.
7. Though India has huge reserves of fireclay but a serious dearth is being felt in
the refractory industry with respect to availability of high grade clay analysing 37% and above Al2O3 and having Fe2O3 and flux impurities less than 2%. In view of this, deposits of high grade fireclay may be explored and delineated.
8. The graphite reserves having +40% fixed carbon are rather limited in the
country. Cost-effective beneficiation technologies for low grade graphite ore need to be developed along with new products by synthetic graphite.
9. India has surplus resources of barytes and it can meet comfortably not only the needs of the domestic industry but also the export market. Therefore, concerted efforts are necessary to boost up the export of barytes and its micronized products from the country, keeping in view the demand for exploration and development of oil wells that boost barytes consumption.
10. The Indian bentonite industry is expected to get on well in the coming years
because of emerging demand for oil clarification and cat litter. 11. World demand for sheet mica is expected to decline. This is, however,
compensated by the growing demand for scrap mica and value-added mica-based products. Therefore, the world market conditions are expected to be favourable for mica exports but to take full advantage of situation for boosting exports, it would be necessary for Indian mica industry to manufacture and export fabricated and value-added mica-based products, such as mica paper, micanite sheets and mica-based paper.
______
Annexure-8.1.
Review of actual/projected demand & production of industrial minerals during XIth Plan and XIIth Plan period (Thousand Tonnes)
Actual Demand Projected Demand Actual production Actual Demand-supply gap (2009-10)
10. Kaolin/Chinclay 1451 2026 2520 2722 2939 4319 1466 2084 2578 (-)5811. Ball clay 950 1097 997 1077 1163 1709 796 998 898 9912. Fireclay 537 490 404 436 471 692 545 496 410 (-)613. Magnesite 320 292 340 367 397 583 253 253 286 5414. Graphite 182 123 114 123 133 195 171 118 109 515. Pyrophylite 204 256 242 261 282 415 204 256 242 016. Kyanite 2.84 4.60 5.53 5.97 6.45 9.48 5.10 4.62 5.55 (-)0.0217. Sillimanite 39 34 31 34 37 54 41 34 31 018. Vermiculite 8 12 12 13 14 21 9 13 13 (-)119. Barytes 512 844 1141 1232 1331 1955 1076 1686 2138 (-)99720. Bentonite NA NA NA NA NA NA NA NA NA NA21. Fuller’s earth NA NA NA NA NA NA NA NA NA NA22. Mica 93 187 91 98 106 155 5 1 1 9023. Talc/Steatite 770 793 740 799 863 1268 923 888 835 (-)95
Annexure - 8.2 Salient features like resources, production & demand of these minerals during XIth Plan and XIIth Plan (Million Tonnes)
India
Estimated demand
S.No. Mineral World reserves
Indian Resources Present
production 2009-10
2011-12 2016-17
Recommendations
1. Rock Phosphate
65,000 305 1.547 8.434 12.393 -Open for Pvt. Sector. -Cluster Mining. -Technology for extraction of low grade ores may be adopted. -Further exploration in needed in various parts of the country.
2. Potash 9,500 21,815 - - - -Open for Pvt. Sector -Glauconitic sand stone as substitute. -State Govt. for further development.
3. Sulphur & Pyrites
Large 1,674 0.263 1.896 2.787 -Deposits may be re-opened for Private Sector. - Incentives for Refinery & Petro- Chemicals.
4. Asbestos (Th. Tonnes)
200,000 21,740 0.233 386 567 -Lift the ban on Asbestos mining with stringent constrains to present asbestos.
5. Dolomite Large 7,533 5.200 6.030 8.870 -Exploration for low silica. -Involvement of State DGM.
6. Fluorspar 23 20.166 0.014 0.182 0.267 -Sector wise consumption. -Need for beneficiation -Exploration & reassessment of reserves.
Annexure-8.2
Estimated demand S.No. Mineral World reserves
Indian Resources
Present production 2009-10
2011-12 2016-17 Recommendations
7. Gypsum Large 1,237 3.423 5.554 8.167 State-of-the-art technology to be adopted for the exploitation of deep-seated gypsum deposit.
8. Wollastonite NA 20.240 0.132 0.130 0.191 -Further exploration in Tamil Nadu & Gujarat.
9. Quartz & Silica Sand
Large 3,238 2.898 3.090 4.540 - Environmental constraints may be cleared for mining in Haryana.
10. Fireclay Large 705 0.410 0.471 0.692 Attention for quality improvement
11. Kaolin Large 2,596 2.578 2.939 4.319 Attention for quality improvement
12. Ball Clay Large 79.290 0.898 1.162 1.708 Attention for quality improvement
Annexure – 8.3 (Concld.) Mineral 2005-06 2006-07 2007-08 2008-09 2009-
10(P) Vermiculite(Tonnes) Production 6674 11827 8910 12647 12847 Import 182 106 34 305 305 e Export 1353 2351 1005 1118 1118 e Apparent consumption 5503 9582 7939 11834 12034 IV. Export Potential Minerals Barytes Production 1156 1681 1076 1686 2138 Import ++ 3 1 2 2 e Export 555 630 565 844 999 Apparent consumption 601 1054 512 844 1141 * Bentonite Production * NA NA NA NA NA Import 2 5 8 5 5 e Export 465 480 463 567 457 * Fuller’s Earth(Tonnes) Production * NA NA NA NA NA Import 2946 2696 NA NA NA Export 82351 39592 84015 NA NA Mica (crude)(Tonnes) Production 2116 1411 4578 1462 1213 Import 1135 1579 2645 2323 2323 e Export # 80173 80795 99888 191037 94216 Talc/steatite Production 682 740 923 888 835 Import 1 1 1 5 5 e Export 47 113 154 100 100 e Apparent consumption 636 628 770 793 740 Note: ++ - Negligible/less than one unit. NA – Not Available. e – Estimated & data repeated in 2008-09 # – Export of mica are from old mining scrap. * - Minor minerals.
Annexure-8.4
Actual domestic production for 2008-09 & 2009-10 and Projected production for 2010-11 & 2011-12 at 8% growth rate
(Unit: ‘000 tonnes unless otherwise specified) Mineral 2008-09
(Actual) 2009-10 (Actual)
2010-11 2011-12
I. Fertiliser Minerals Apatite & Rock phosphate
1810 1552 1676 1810
Potash 0 0 0 0 Sulphur 270 263 284 307 II. Flux & Construction Minerals Asbestos (Tonnes)
Talc/steatite 863 1268 879 1353 895 1442 # - Includes in Quartzite ** - It has not been possible to work out the life indices in respect of bentonite and fullers earth because the production figures are not available.
Annexure-8.6
Production and value of industrial minerals during 2009-09 & 2009-10 (Quantity In ‘000 tonnes and value in Rs. crore)
2008-09 2009-10(p) Mineral Quantity Value Quantity Value
(Concld.Annexure-8.7) Note: # - Includes in Quartzite. *** For calculating the life index, resources considered are proved(111), Probable (121+122),, Feasibility Resources (211), Pre-feasibility Resources (221+222), Measured Resources(331) and indicated resources(332).
1 2 3 4 5 6 7 III. Ceramic & Refractory Minerals Quartz & other silica minerals #
9.1.0 Introduction: Heavy mineral sands comprise of a group of seven minerals viz. ilmenite, leucoxene (brown Ilmenite), rutile, zircon, sillimanite, garnet (almandite) and monazite. Since these minerals are always found together in the beach sands of coastal stretches of peninsular India, they are classified as associate minerals and they are often synonymous with the term ‘Beach sand mineral’ as entire production of these minerals in India is from beach sands occurring on the coast. These minerals are also known as heavy minerals as they have density more than 3.1 gm/cm3 which is higher than that of quartz / silica (density 2.8 gm/cm3). Ilmenite, Leucoxene and Rutile are titaniferrous oxide minerals, serving as important source of titanium metal and high quality titanium dioxide pigment. Zircon is a silicate of zirconium and is used for manufacturing zirconium metal, zirconium dioxide which is a high technology ceramic material, and various zirconium chemicals. Sillimanite is a silicate of aluminium metal and mostly used for manufacture of high alumina refractories finding applications in various ferrous and non-ferrous metallurgical industries. Garnet is a silicate of iron and aluminium and has potential application as an abrasive which is increasingly replacing commonly used silica for sand blasting, owing to concerns of various occupational health related issues such as silicosis, etc. Monazite is a phosphate of thorium and rare earths and is the only source of rare earths in India. Zircon and monazite continue to be atomic minerals as zirconium, thorium and some of the rare earths available in monazite are essential for nuclear power programme implemented by India. The density and formula of each of these are given below:
Table - 9.1
Sr. No.
Mineral Density Formula
1 Ilmenite 4.75 FeO TiO2 2 Rutile 4.21 TiO2 3 Monazite 5.23 (Ce,La,Th)PO4 4 Zircon 4.69 Zr SiO4 5 Garnet 4.19 Fe Mg Ca Al Silicate 6 Sillimanite 3.26 Al2SiO5
9.1.1 Ilmenite Ilmenite is the largest mineral constituent of the beach sand minerals. Ilmenite, leucoxene and rutile contain TiO2 along with varying proportions of iron oxide both in ferric and ferrous forms. The content of iron in ilmenite is highest with lowest TiO2 content and the quantity of iron gradually reduces with accompanied increase in TiO2 content in leucoxene and rutile minerals. Ilmenite is the basic material to produce synthetic rutile or titanium slag, which are further processed to manufacture Titanium Dioxide (TiO2) pigment, both in anatase as well as rutile form. TiO2 is a white pigment which is a non-toxic with High Refractive Index or Opacity-
the ability to reflect and scatter all colors of light while absorbing ultra violet light is used more and more in paints as lead paint is discontinued due to health considerations. Because of its non-toxic nature, it is used in cosmetics, pharmaceuticals and even added to foodstuffs such as flour, icing sugar and sweets as well as toothpaste to improve their brightness. Titanium dioxide is used in the manufacture of many sunscreen lotions and creams because of it non-toxicity and UV absorption properties. In fact, the largest percentage (up to 95%) of world wide use for titanium mineral is for the production of this white pigment. Other Minor uses are Welding Rod Coating, furnace lining for the steel etc. Titanium metal is produced by reducing titanium tetra-chloride in the presence of magnesium metal. Synthetic rutile and / or titanium slag are used for making titanium tetra-chloride which is essential for manufacture of titanium sponge / metal. Titanium has been shown to be a strong aluminum-like metal; light weight, non-corrosive, able to withstand temperature extremes (especially its high melting point, 1800 degrees C) and it has good strength (as strong as steel and twice as strong as aluminum). Titanium alloys have found many applications in high tech airplanes, missiles, space vehicles and even in surgical implants. 9.1.2 Rutile Rutile mineral is the most common natural form of TiO2, though, its occurrence is about 1/20th of that of ilmenite in volume terms. Rutile has more than 92% TiO2 and very low content of iron. Hence, ilmenite is converted to synthetic rutile and titanium slag which contains higher amount of titanium dioxide with reduced level of iron thus rendering it suitable for further value addition to titanium dioxide pigment and titanium metal. 9.1.3 Zircon Zircon is a glassy mineral, which has found its place in many an industrial application worldwide. Zircon's exceptional qualities of hardness and durability makes it a must-use for the manufacture of ceramics and refractory tiles and also for a range of other high-tech applications such as armour plating on military aircraft, heat shield in space shuttles and potentially as solid oxide fuel cells in hydrogen powered vehicles in many industrial and chemical applications. The Industrial Zircon ceramics are extensively used as linings to protect furnaces and kilns for smelting of metals because they can retain their physical and chemical composition even when subjected to high temperatures. Zircon application is mainly confined to mould faces and cores, which directly come in contact with molten metal. Zircon sand helps in minimising the penetration of mould by the molten metal and thus ensures that the casting gets a good surface finish. 9.1.4 Sillimanite Sillimanite has the chemical composition of (Al2O3. SiO2) and mainly used in refractory, cement, ceramics, glass-making, metal smelting, refinery and treatment, tar distillation, coal carbonisation, chemicals manufacture, and iron foundries. 9.1.5 Garnet Garnet has the chemical composition of [Fe3Al2 (SiO4)3] It is mainly used in sand blasting and as an abrasive agent. Other uses are water jet cutting, filtration media etc..
9.1.6 Monazite The mineral ‘Monazite’ is radioactive as it contains thorium and uranium and requires special measures for production and storage for exclusive use by Department of Atomic Energy (DAE). Monazite is one of the principle sources of several Rare Earths Elements ( REE) mostly light rare earths. REE are a group of 17 elements i.e. elements having atomic no. 57 to 72 along with elements having atomic no. 27(Yttrium) and 39 (Scandium). The elements from atomic no. 57 to 61 i.e. lanthanum, cerium, neodymium, praseodymium are known as light rare earths whereas yttrium, scandium and rare earths of atomic no. greater than 61 are known as heavy rare earths,. Rare Earths have very specific uses in a multitude of markets. For example, neodymium is the core magnetic component of high-strength, high-temperature magnets used in electric car batteries, wind turbines and hard disk drives, and has no substitutes for many applications. Indian Rare Earths Ltd., (IREL) a Central Government Public Sector Undertaking under the administrative control of Department of Atomic Energy and Kerala Minerals & Metals Ltd.(KMML) a State Government of Kerala PSU are engaged in beach sand mining, mineral processing and value addition activities. 9.2.0 Brief on Development Of Beach Sand Mineral Industry: The beach sand mineral beneficiation started in India in the year 1910 at MK for separation of Monazite after discovery of the mineral by a German Chemist Herr Schomberg. Later he set another plant at Chavara. These Plants were later run by Hopkins & Williams (H&W) and the first export of Monazite dates back to the year 1922. These plants were subsequently acquired by IREL between the years 1965 to 1967. The beach sand minerals i.e. Rutile, Zircon, Monazite, Sillimanite & Garnet were listed under the prescribed substances under the Atomic Energy Act 1962. Policy of selective liberalization was introduced in the year 1989, wherein private players were allowed to produce Garnet & Sillimanite. Rutile, Monazite & Zircon continued to be prescribed substances. Subsequently on account of the low production to reserve ratio and need to get latest technology for value addition led to progressive liberalization of the beach mineral sector wherein in 1998 FDI was allowed for value addition projects with equity participation to the tune of 74% through JV with central/ state PSUs.. From 1998 onwards, this sector has been thrown open to Pvt. Entrepreneurs in the country as well as Foreign Direct Investment (FDI). To facilitate faster and full development of concerned minerals and after due consideration of all radiological, strategic and technical aspects, the Department of Atomic energy(DAE) in consultation with the Ministry of Mines, the concerned state Government and stake holders, has decided to remove Ilmenite, Rutile, Leucoxene and Zircon from the list of Prescribed Substance with effect from January 2007. All titaniferrous minerals will also cease to be Atomic Minerals under the MM(DR) Act,1956. 9.3.0 Review of XI Plan Considering the low exploitation ratio of the reserves, the need for faster economic development, the demand for the beach sand minerals and their value added products in the domestic as well as international market, high capital requirement for green field projects, etc, GOI liberalized the beach mineral sector in 1998 to motivate foreign direct investment through joint venture with central / state PSUs with a view to adopt advanced / latest technology both
in pure value addition projects & in integrated projects. Till date, however, only a couple of new players have or could enter the liberalized Regime. In the last 5 years, no new projects have taken off other than the Trimax project in Srikakullam, which is only for production of beach sand minerals without any value addition. Besides, major Garnet Producers like M/s V.V. Minerals, have started producing other beach sand minerals. Out of 7,000 kms of Indian coastline, about 2,500 kms has been explored and operations are on over an extent of only 100 kms. This gives a fair idea on how unexplored and unexploited the beach sand reserves are in the Country. As of now, India is contributing only 5% of the global production, even though it has about 16% of the global resources of these minerals.. The need of the hour is to take up substantive steps to develop the beach sand reserves of the Country to its full potential. The review of progress on each of the recommendations during XI Plan is presented below: 1. The envisaged schemes for exploration for ores like Zenotime, Bastnesite etc,
containingnaturally occurring rare earth elements in the XIth Plan could not be realized. Indian Rare Earth development continues to be Monazite centric.
2. India’s share in the world production of rare earth was estimated to be 2.6% along with the recommendation to create enabling environment for raising the same. However, no visible policy initiative was taken/or progressed.. The envisaged exploitation of full suite of rare earth elements did not take place, in view of Chinese domination. 3. Out of the long coastline of the Country, survey for limited area to the extent of 35% only could be taken up. No substantial progress in Exploration activities for Beach Minerals was witnessed during the XIth Plan. 4. There has been little progress in terms of value addition both on the front of Titanium bearing minerals and Rare Earth Compounds. While the market for the latter has improved only recently, making it attractive for adding new capacities now. The former has always been viable and continued to be so, though major up heavals were witnessed in demand supply position and Prices, consequent on the Global Financial Meltdown (GFM) 5a). The proposed MMDR Act 2010 has shifted Ilmenite, Rutile and Leocoxene from Part B: Atomic Minerals to Part C: Major Minerals 5b) No substantial progress regarding unified window for clearance and permissions could be realized. It is true that Monazite continues to be ‘Atomic Mineral’ as well as prescribed substance, while Zircon continues as an ‘Atomic Mineral’. But then, these substances occur in nature in association with each other and Radio active elements,i.e. Thorium and Uranium are there in Monazite. Presence of different nodal agenies for for development and regulation of these radio-active and strategic elements, and the need for obtaining NOC from the nominated Agency still remain and may have to be continued in future also. 5c) Thus,the recommendation of doing away the requirement of obtaining the licence from Atomic Energy Regulatory Board to deal with ilmenite tailings with the guidelines for handling storage and disposal do not align with the ground reality, owing to occurrence of beach minerals together alongwith atomic minerals.
5d) However, procedural requirement to obtain licence from DGFT for export of Ilmenite no longer exists.. 5e) In the absence of any objective policy and or incentivisation, as also other reasons stated elsewhwere in this Chapter, value addition industry could not make any headway during the XI Plan period. . 6. The production of beach sand minerals is greatly affected due to the problems associated with procurement/ acquisition of land in thickly populated areas where abundant reserves lie unexploited like in Kerala & TamilNadu, lack of support from State Governments, delays in obtaining statutory clearances, etc. During the XI Plan the issues could not be addressed adequately. An inevitable need is felt for GoI initiatives at policy level to make available such area for mineral exploitation. 7. Lessons learnt from review of XI plan: It has been observed that the mineral rich states have been insisting on value addition of minerals occurring in their jurisdiction and has been using setting up of value added industries in their respective states as a pre-condition for recommending grant of mining lease. Many state owned enterprises have cornered the mining leases and using grant of these leases as a bait for locating prospecting investors while seeking 26% share in such mining and mineral separation ventures. Further, this has acted as a possible impediment for attracting FDI in the Beach Sand Mineral Sector. Hence, it may be worthwhile to examine the mandatory provision of 26% equity participation with Public Sector for foreign companies to undertake mining and mineral separation. Similarly, though value addition of these minerals are the most preferred option for state governments insisting on the same as a pre-condition for granting mining lease should be discouraged as the economic consideration for setting up a value added industries are entirely different from those of successfully implementing mining and mineral separation projects with the objective of earning foreign exchange by way of export of minerals, It may be noted that value addition depends on a number of factors such as availability of state of the art technology, availability of infrastructure which inter alia includes electric power, roads and ports for transportation of minerals and development of demands for the value added products by the downstream processing industries. 9.4.0 Global Scenario and Outlook for Heavy Minerals As stated above, Beach Sand Minerals or the Heavy Minerals comprise of ilmenite, rutile, leucoxene, zircon, garnet, sillimanite and monazite. Of these minerals, ilmenite, rutile and leucoxene are titanium bearing minerals. The proportion of each of these mineral in the mineral assemblage varies from deposit to deposit. The major shore line placer deposits of the world are as follows:
Table - 9.2
Sr. No.
Place Country
1 Trial Ridge & Green Cove Springs USA 2 Cumberland Islands USA 3 Lakehurst & Manchester USA
4 Mataraca Brazil 5 Victoria Brazil 6 Vlogova-Sosesti Dist Romania 7 Dnepropetrovsk Ukraine 8 Vest Cape Coast South Africa 9 Transkel Coast South Africa 10 Richards Bay South Africa 11 Bothaville South Africa 12 Corridor Sands Mozambique 13 Tamatave Madagascar 14 Chavara India 15 Manavalakurichi India 16 Chatrapur India 17 Srikakulam, AP India 18 Tuticorin India 18 Cox’s Bazaar Bangladesh 19 Pulmoddai Sri Lanka 20 Zhanjiang China 21 Wuzhaung & Sai-Lao Dist China 22 Eneabba Australia 23 Capel Australia 24 Bridge Hill Ridge Australia 25 North Stradbroke Australia 26 Frascar Island Australia 27 Agnes Water Australia
9.4.1 World Reserves: The country-wise global reserves of these minerals are given in the following Tables: 9.4.1.1 World Reserves Of Heavy Minerals/ Beach Sand Minerals: The country-wise reserves of various heavy minerals are given in the Table below. As can be seen, China, Australia, India and South Africa are rich in reserves of these minerals as compared to other countries.
Table - 9.3
(Qty in million tonnes) COUNTRY Ilmenite Rutile Zircon Sillimanite Garnet RE
# AMDR estimates are significantly higher and are given in section 5 on Indian Scenario 9.4.2 Demand Supply Trend of Titanium Bearing Minerals: As titanium bearing minerals viz. ilmenite, rutile and leucoxene have almost identical end-uses, therefore they are analysed together. Australia, South Africa and Canada are major players in this field. The country-wise production figures for these minerals and their trade data for 5 years are given below: 9.4.2.1 ILMENITE: It may be noted that of the world production, the beach sand or the placer deposit account for over 55% while the rest is from hard rock. In contrast to the above, almost the entire production of Ilmenite in India is from placer deposits with only about 2% being from lake bed or riverine. The details of country-wise production and imports of ilmenite over the last five years are given in tables below:
Table - 9.4
WORLD ILMENITE `PRODUCTION
(Qty in '000 tonnes) COUNTRY 2005 2006 2007 2008 2009 AUSTRALIA 2011 2232 2218 2014 1550 BRAZIL 126 121 129 120 55 CANADA 2559 2787 2821 2588 1746 CHINA 1080 1275 1280 1086 910 CIS 470 520 585 630 545 INDIA 619 685 695 620 749 MALAYSIA 148 90 50 50 50 NORWAY 816 850 870 890 800 SOUTH AFRICA 2294 2384 2438 2315 2215 UNITED STATES 511 461 330 329 273 VIETNAM 360 350 480 375 392 OTHERS 5 19 21 23 20 TOTAL 10999 11774 11917 11040 9305
Source : TZMI 2010 Table - 9.5
COUNTRY-WISE IMPORT OF ILMENITE
(Qty in '000 tonnes) COUNTRY 2005 2006 2007 2008 2009 BELGIUM 29 0 0 0 0 CANADA 0 42 40 0 68 CHINA 200 289 1159 897 1062 EAST. EUROPE 168 177 187 205 195 FINLAND 273 250 245 220 0 FRANCE 60 83 61 42 18 GERMANY 296 388 248 169 196 JAPAN 272 199 235 247 143 MALAYSIA 101 134 85 64 31 MEXICO 167 176 150 96 10 NETHERLANDS 31 34 82 101 26 NORWAY 33 41 18 73 30 S. KOREA 97 120 97 109 100 SPAIN 121 134 122 106 26 U.K. 78 86 74 37 0 USA 156 209 292 384 354 ROW 0 51 17 33 97 TOTAL 2082 2413 3112 2783 2356
Source: TZMI 2010
From the above it is evident that South Africa and Canada are the largest producers of Ilmenite followed by Australia. The major production of the largest producers is mostly captively consumed for production of Titanium Slag. n the other hand, China imports Ilmenite in a big way. The major quantity imported is of sulphatable ilmenite. The Indian Scenario of supply-demand is dealt with in section 5.1., 4.2.2 RUTILE: The details of production of Rutile & Leucoxene (which is superior to Ilmenite but slightly inferior to natural rutile) are given in the table 9.6 & 9.7 below. As is evident from the same, Australia is major supplier of Rutile followed by South Africa. Also, the production of Leucoxene is only about 15% of that of Rutile. As regards consumption is concerned, USA is the highest net importer followed by Taiwan and UK with the consumption mainly meant for TiO2 production.
Table - 9.6
WORLD RUTILE PRODUCTION
(Qty in '000 tonnes) COUNTRY 2005 2006 2007 2008 2009 AUSTRALIA 178 228 308 318 288 INDIA 18 18 22 21 22 SOUTH AFRICA 123 132 126 133 136 SIERRA LEONE 0 74 74 74 74 UKRAINE 65 63 65 65 62 UNITED STATES 28 11 0 0 0 OTHERS 27 29 41 33 16 TOTAL 439 555 636 644 598
Source: TZMI 2010
Table - 9.7
WORLD LEUCOXENE PRODUCTION (Qty in '000 tonnes)
COUNTRY 2005 2006 2007 2008 2009 AUSTRALIA 65 78 114 89 73 UNITED STATES 45 32 15 12 11 OTHERS 1 1 1 1 1 TOTAL 111 111 130 102 85
Source: TZMI 2010
Table - 9.8
WORLD RUTILE/SYNTHETIC RUTILE IMPORTS (Qty in ‘000 tones)
TAIWAN 138 150 168 137 136 U K 105 145 119 111 104 USA 241 224 266 222 182 ROW 70 85 91 58 105
TOTAL 861 926 1020 853 926 Source: TZMI 2010
Ilmenite, rutile and leucoxene are major raw materials for production of TiO2 pigment, Titanium metal and other uses such as welding electrodes and ferroalloy manufacturing. The estimated consumption by these end use industries during the past few years is as follows:
Table - 9.9
Titanium Feedstock Demand During Last Few Years (Qty in ‘000 TiO2 units)
Estimated consumption
2007 2008 2009 2010e
TiO2 pigment 5635 5377 4680 5440 Ti Metal 318 318 223 233 Other uses 341 359 323 335 Total demand 6295 6054 5227 6007
Source: TZMI 2010 Details of major producers of heavy minerals in the World are given in Annexure – I. As can be seen from the above, the market that had nosedived in 2009 due to the Global Financial Meltdown (GFM) has rebounded and is expected to be buoyant in the near future. The prices too that had plummeted to a nadir during GFM have rebounded and have almost doubled. The outlook on the price front too looks bright. 9.4.3 Zircon: Zircon sand finds use mainly in Ceramics, Foundry and Refractory industries. Zircon production and consumption information is given in the Tables given below. It is apparent from the said Table that Australia and South Africa are major producers of this product. The major consumers are China and Europe.
Table - 9.10
WORLD ZIRCON PRODUCTION (Qty in '000 tonnes)
COUNTRY 2005 2006 2007 2008 2009 AUSTRALIA 429 476 586 500 415 INDIA 24 24 27 30 32 SOUTH AFRICA 399 407 375 398 352 CHINA 82 131 130 107 64 UNITED STATES 164 143 121 124 57 OTHERS 91 96 87 83 136 TOTAL 1189 1277 1326 1242 1056
Source: TZMI 2010
Table - 9.11
WORLD ZIRCON CONSUMPTION (Qty in '000 tonnes) COUNTRY 2007 2008 2009 EUROPE 381 300 229 NORTH AMERICA 147 121 86 JAPAN 57 45 37 CHINA 391 421 398 ROW 279 274 237 TOTAL 1254 1161 987
Source: TZMI 2010
Major producers of Zircon are Iluka (Australia), RBM (South Africa), Exxaro (South Africa), Tiwest & Bemax (Australia). Major producers of milled Zircon (ground) that is used in ceramics are Bitossi (Italy), Endeka (UK), Mario Pilato Blat (Spain), Trebol (Argentina) and Kreutz (Germany). On account of demand outstripping supply, Zircon prices that had been southbound during the GFM have seen handsome gains. In case of Zircon, the recent prices are higher by about 75% as against the prices obtainable in 2009. In the coming couple of years, the prices are likely to stay firm. The overall outlook for Zircon in the near future is positive.
9.4.4 SILLIMANITE: The anhydrous polymorphus aluminium silicate, such as Sillimanite, Andalusite and Kynaite are mainly used in refractories because of their ability to form mullite phase at high temperatures. This phase offers a high hot strength, low co-efficient of expansion and resistance to chemical and physical erosion. Sillimanite refractory bricks are extensively used in steel & glass industries and also in ceramics, cement kilns, heat treatment furnaces and petrochemical industries.
Table - 9.12 WORLD PRODUCTION OF SILLIMANITE CATEGORY PRODUCTS
(Qty in tonnes)
Country Andalusite Kyanite Sillimanite
USA Negligible 1,18,000
UK
UKRINE 25,000
CHINA 15,000
JAPAN
BRAZIL Captive prod.
FRANCE 65,000
HUNGARY
INDIA 42,000 35,000
PERU 40,000
SOUTH AFRICA 2,10,000
TOTAL 3,30,000 1,85,000 35,000 As can be seen from the above Sillimanite is only produced in India. Sillimanite and its related minerals are used by the refractory industry. However, about 20 – 25% of Sillimanite finds use in ceramics sector. The world market is back in the upswing anddemand for steel has increased significantly. Consequently, demand for refractories and in turn, that for Sillimanite and its related minerals has also increased. 9.4.5 GARNET: Garnet is used as an abrasives, and in water filtration, water jet cutting, blasting media, anti-skid agent for road surface for road & air strips, in preparation of artificial Granite tiles (Garnet tiles) and decorative wall plaster. While the major market for sand blasting is in the Gulf region, that for water jet cutting is in Europe and USA. Garnet is a family of minerals having similar physical and crystalline properties. They all have the same general chemical formula, A3B2 (SiO4)3 where A can be calcium, magnesium, ferrous iron or manganese and B can be aluminium, ferric iron, chromium or in rare instances, titanium. In India Almandite Fe3Al2Si3O12 is available. Garnet is mainly produced in Asia-Pacific region. China and India are the major players in this field. The details of Garnet supply are given in the table below:
Table - 9.13
World Garnet Supply (Qty in tonnes)
Country 2009 2010
CHINA 4,50,000 4,70,000
INDIA 7,00,000 7,00,000
AUSTRALIA 1,60,000 1, 50,000 USA 45,600 54,000
OTHERS 35,500 36,000
TOTAL 13,91,100 14,10,000 Source:USGS 2011
Garnet is mainly used in Sand Blasting as abrasive material (as replacement for Silica sand), Water jet cutting, Water filtration, Abrasive powder and to a small extent for polishing. Apart from above bulk industrial usage of garnet, small quantities have found application in manufacture of vitrified tiles, road building, construction of maintenence free building exterior, etc. Use of micronized garnet in fine ground form (1 ~ 5 microns particle size) for polishing of TV face plate glass has ceased to exist due to large scale introduction of LCD and plasma panels as replacement of the old Cathode Ray Tube display units. Major players in this field are V V Minerals (India), GMA Garnet (Australia), WGI Heavy Minerals Inc (USA/Canada) & Wuxi Ding Lang Co (China). As in case of other products, the demand for Garnet is likely to be good in the near future. 9.4.6 RE Compounds (Ore Monazite): Monazite which is one of the ores in the suite of beach sand minerals is also an ore of rare earths and thorium. Other major rare earth ores are Bastanaesite and Xenotime. Globally rare earths are produced from bastanaesite ore which is the floro-carbonate of rare earths. Apart from bastanaesite, rare earths are commercially exploited from loparite i.e. an oxide ore and ion exchange clay in which the rare earths (mostly heavy rare earths) occur in the form easily extractable by using the medium of electrolite solution. China currently caters to 60% of the global demand. China has reserves of both heavy rare earths as well as light rare earths in the form of ion exchange clay and bastanaesite respectively. It may be noted that rare earths from monazite source contribute a minor fraction of the global rare earths supply. However, monazite is the only mineral available in India from which rare earths could be obtained in a commercially viable manner. Over the last year the rare earths industry has been propelled from obscurity to the fore of international media, sparked by fears of a Chinese stranglehold on the supply of these strategic minerals. Rare earth elements (REE) have always been useful, and while the role they play has not changed, their importance has, driven by the rise of green technology and, crucially, China’s dominance of the supply chain. China began to take control of the industry in the late 1980s and early 1990s when its producers slashed prices, eventually driving out nearly all overseas competitors. At present China, which has emerged as the Asian powerhouse accounts for over 95% of production, but its export policy over the last 18 months has caused reason for alarm. Lanthanum is strategically important in its use as a catalyst for braking down crude oil to produce gasoline, diesel and jet fuel. To complicate things further, REE can be split into two groups: heavy and light.Light REE are easier to extract and are generally of lower value than the heavy elements, such as dysprosium and terbium, which require a higher level of expertise to separate. If the world outside China does not already have its work cut out with the simple issue of supply, new entrants to the market will have to focus on the most in-demand elements to achieve profitability.
Total rare earth oxide (REO) production was estimated at only 1,24,000 tonnes for 2008, dropping to 96,500 tonnes in 2009 as demand for hi-tech goods dived during the global recession. However, demand is expected to reach 1,97,000 tonnes REO in 2015, surging ahead of production capacity, driven by growth in clean technology end markets such as wind turbines and electric vehicles. Even with production exceeding demand by 2015, the supply of dysprosium, terbium and neodymium could still fall short, while europium, erbium and yttrium could also be tight. The shortfall of neodymium – used in permanent magnets – could be at least 4,000 tonnes, and even as high as 7,000 tonnes by 2014, according to the projections of UK-based consultancy group, Roskill information Services. One problem rare earth producers might face is an oversupply of lighter rare earths, specifically cerium and lanthanum, which tend to make up a large bulk of rare earth deposits. For example, 72% of Lynas Corp. Ltd’s Mount Weld deposit in Western Australia is composed of these two elements. An oversupply of cerium is widely expected by industry experts, but lanthanum could find an emerging end market in lanthanum-nickel-hydride car batteries, which could potentially rival the lithium-iron battery in powering the impending fleer of hybrid and electric vehicles. The world’s light rare earths supply is dominated by the Bayan Obo bastnasite deposit in Inner Mongolia, operated by Baotou Steel Rare Earth High-Tech Co., where they are extracted as a by-product of iron ore mining. The deposit produced about 66,000 tonnes REO in 2008, according to data from Roskill. Heavy rare earths and yttrium are largely extracted from iconic adsorption clays in Jiangxi and other southern provinces, which produced 36,000 tonnes REO (including light) in 2008. Together with production from bastnasite in Sichuan and some illegal mining, China’s production makes up an estimated 97% of global REO supply. While there is little reliable data on remaining production, it is thought that the remaining 3% comes from India, Russia, Malaysia and Brazil. The rush to secure rare earths supply from outside China was triggered by a gradual decrease in Chinese export quotas, which dropped from 65,609 tonnes in 2005 to 50,145 tonnes in 2009, according to IMCOA data. Rare earths are finding their increasing applications in various sectors. Some of the prominent applications are
Magnets – Neodymium, Samarium Magnets are the driving market for rare earth demand. Not only is it the dominant consumer by volume (32%) and value ($500-550m), but the applications of magnets are in critical environmental and defence technologies.
Phosphors – Yttrium, Eurpoium
Phosphorescent properties of rare earths – the ability to glow after exposure to energy – lights energy saving bulbs, gives mobile phones their colour and are central to plasma televisions and computer monitors.
Catalysts – Lanthanum Representing the 3rd largest market by volume with a 19% market share, but only 5% of the industry’s value, La is used as a fluid cracking catalyst to refine oil.
Metal alloys – Praseodymium, Scandium Metal alloys is a category which covers a wide variety of uses for metal products that contain a combination rare earths rather than specific elements. The uses range from Nickel-metal hydride (NiMH) rechargeab batteries for portable electronics, hybrid and electric cars.
Polishing – Cerium Representing 12% (15,000 tpa) of the volume market, rare earth polishing powders are used predominantly on high value glass such as flat glass, glass for CRT, LCD, TFT televisions.
Ceramics / Glass - Neodymium, Praseodymium, Erbium, Yttrium The application of rare earths in ceramic component is predominantly such as crucibles and pigments. The market accounts for 3%of the industry’s value and 6% of the volume and is a more recent development.
Lasers - Yttrium Yttrium crystals are core to lasers for communication systems, lanthanum’s phosphors are used in lasers that detect radiation in the medical sector, while Neodymium lasers are used in heavy industry like welding and also in MRI scanners.
Fibre optics - Erbium This has emerged in the last decade as a suitable communications technology through which to send high quality, rapid data in light pulses.
In case of India there is no development on the front of value added products of Rare Earths due to lack of availability of technology which is mostly patented by companies from Europe, Japan and USA.
Table - 9.14 World Demand And Supply Of Re Compounds
China is a dominant player accounting for over 95% of the total supply. Cheaper exports by China had elbowed out other players in this field and Indian Rare Earths Ltd too had to close the shop in 2004. However, the export restrictions imposed by the Chinese government coupled with increased demand from various sectors especially because of the environment friendly uses of rare earths resulted in change in market dynamics. The sector has once again become attractive with prices reaching all time high with no sign of retreating. Until new
capacities are added that would substantially enhance the supply side, the prices are expected to continue their northward movement. The demand that is of the order of 125,000 tpa in 2010 is expected to increase to about 197,000 tpa by 2015. Due to the flaring demand and controlled supplies, a lot of new projects are being commissioned in this field. If all these projects see the light of the daythen there is likelihood of supply surplus Forecast for global demand and supply for individual rare earths in 2015 (±15%)
5.0 Indian Scenario And Outlook For The Heavy Minerals It may be noted that of the world production, the beach sand or the placer deposit account for over 55% while the rest is from hard rock. In contrast to the above, almost the entire production of Ilmenite in India is from placer deposits with only about 2% being from lake bed or riverine sources. India has one of the largest resources of heavy minerals. The state-wise details of the same are given below:
Table - 9.16
HEAVY MINERAL RESOURCES OF INDIA (STATE-WISE) (As on August 2009)
As is evident from the above, Andhra Pradesh, Kerala, Tamil Nadu and Orissa are the major states endowed with heavy mineral resources. Of the total heavy mineral resources of 942.58 million tones, Andhra Pradesh, Orissa, Tamil Nadu and Kerala have a share of 35%, 24%, 21% and 19% respectively. Of India’s total coast line of 7,200 km, Main Land Coastline is about 6,000 km of which AMDR has surveyed a little over 2,000 km for exploration of beach sand /heavy minerals. The state-wise details of the same are given below:
Table - 9.17
STATUS OF BEACH SAND EXPLORATION
STATE COAST SURVEYED UNSURVEYED KM KM KM % WEST BENGAL 158 34 124 78.48% ORISSA 470 125 345 73.40% ANDHRA PRADESH 982 560 422 42.97% TAMIL NADU 860 760 100 11.63% KERALA 560 500 60 10.71% KARNATAKA 290 45 245 84.48% MAHARASHTRA 720 20 700 97.22% GOA 140 20 120 85.71% GUJARAT 1663 0 1663 100.00% TOTAL 5843 2064 3779 64.68%
Source: AMDR, Hyderabad
9.5.1 Ilmenite At the end of XI Plan, the reported production capacity of all the players in India is of the order of one million tonnes per annum. Ilmenite is classified as sulphate grade and chloride grade based on the TiO2 content in it. While chloride grade Ilmenite contains TiO2 > 55%, that with TiO2 upto 55% is sulphate grade. While sulphate grade Ilmenite is used for producing TiO2 through sulphate process, chloride grade Ilmenite is used for producing Synthetic Rutile and TiO2 through chloride process. In India major chunk is consumed for the production of Synthetic Rutile and TiO2 pigment. The downstream capacity for production of Synthetic Rutile and Titanium Pigment is as follows:
6 Kolmak, Kolkata TiO2 (sulphate process) 3,000* Some quantity – of the order of about 5,000 tpa is consumed by the ferroalloy manufactures and welding electrode industry. While the demand from Synthetic Rutile producers are of the order of 180,000 tpa, that from TiO2 producers is 150,000 tpa. Thus, the total demand for Ilmenite is of the order of about 3,35,000 tpa based on the current capacities. Against the above demand, the overall production of this product has been about 8,00,000 tpa mainly of sulphatable type whose domestic demand is limited to about 65,000 tpa and hence, a major chunk of produced in India by private sector players is exported. It may be noted that the sulphate grade Ilmenite cannot be used for manufacturing Synthetic Rutile and hence, the need for import would exist until production of Chloride grade increases to meet the demand even though excess Sulphate grade Ilmenite is available in the country. In keeping with the international market trend, the prices of throughputs have seen a rapid increase in the past couple of years and are in the range of Rs 6,000 to 8,000 per tonne depending upon the grade. While India exports about 5 to 5.5 Lakh tpa, there had been no imports until a couple of years back. The imports in the last year or so have been sporadic and limited to small parcels of the order of 10,000 to 25,000 tonnes. The demand is dependent on the demand for TiO2 pigment and is estimated to grow @ 3% pa to 3.5% for GDP growth rate of 8% pa to 10% pa. Thus demand at the end of 5 years is likely to be of the order of 3.19 lakh tpa, 3.27 lakh tpa and 3.35 lakh tpa for annual GDP growth rate of 8%, 9% and 10% respectively as given in the following table:
Table - 9.19 DEMAND ESTIMATES FOR VARIOUS GRADES OF ILMENITE IN INDIA (Qty in tonnes) Sulphate Chloride Sulphate Chloride Sulphate Chloride GDP growth rate 8% 9% 10% CAGR for industry 3% 3.50% 4% 2010-11 65000 210000 65000 210000 65000 210000 2011-12 66950 216300 67275 217350 67600 218400 2012-13 68959 222789 69630 224957 70304 227136 2013-14 71027 229473 72067 232831 73116 236221 2014-15 73158 236357 74589 240980 76041 245670 2015-16 75353 243448 77200 249414 79082 255497
It may be noted that while the demand for sulphate grade product can be met internally, the limited production of chloride grade ilmenite of the order of 1.3 ~ 1.5 lakh tonnes needs to be
ramped up by at least one lakh tonnes to meet the domestic demand supply gap. It would also be instrumental to meet import substitution requirement. At present, the international market is quite upbeat and hence, the outlook in the near future for this product that is mainly exported at present, is quite bright. 9.5.2 Rutile/Leucoxene: In India, Rutile and Leucoxene (to a small extent) are used for manufacturing welding electrodes. Demand of about 30,000 tpa in 2005-06 is expected to have increased to about 36,000 tpa in 2010-11. Domestic production of Rutile during the last five years has been less than 20,000 tpa. Almost the entire production is consumed by the welding electrode industry which meets the balance demand through imports. The production of Leucoxene is miniscule of the order of about 500 tpa. As a significant quantity is imported, prices of the product are mainly driven by international prices. At present the prices are on the rise due to tight supply position after the dip seen in the year 2009. Over the five year period, there has been no significant change in the price of Rutile. However, the same have seen a fluctuation in the range of +/- 10% within succeeding years in this period. It may be noted that the end use industry has been substituting Rutile with and Leucoxene which are cheaper than Rutile. The substitution is of the order of 10% mainly from Leucoxene imported from South Africa.
The demand for the next 5 years will grow @ 3% per annum to about 42,000 tpa if GDP grows at 8% p.a. The same is expected to be about 44,250 tpa and 45,550 tpa at GDP growth rate of 9% and 10% respectively. The details of this are given in the following table:
Table - 9.20
DEMAND ESTIMATES FOR RUTILE IN INDIA (Qty in tonnes)
It has been observed that the production of Rutile in India has stagnated for the past 5 years or so. During the next 5 years, the production at best is expected to be about 30,000 tpa with
addition in capacities by various players in this field. The GDP growth rate will have no significant impact on production increase/decrease. This would mean demand-supply gap of about 13 ~ 15,000 tonnes would remain. The thrust by Government of India to improve infrastructure is expected to have a positive impact on the end-use industry. In general, the end-use industry’s growth rate would depend on the overall increase in the economy. 9.5.3 Zircon: In India, Zircon is mainly used by ceramic industry which has been the driving force in the growth in demand of this product. Other end-uses are mainly in the field of Foundry and Refractories. While the demand in ceramic sector is expected to be 55% percent of the total consumption, the remaining 45% is from the other end-use industries viz. foundry, refractory, chemicals, TV faceplate, etc. While the domestic supply is of the order of 30,000 ~ 32,000 tonnes per annum, the demand exceeds 65,000 tonnes per annum. The last five years, the domestic supply has been in the range of 25,000 to 30,000 tpa. The private sector players have not been successful in adding major capacities commensurate with their production. The deficit of about 35,000 to 36,000 tpa is currently being met by imports mainly from Australia and South Africa – the two major producers of Zircon As against the above supply, the consumption is over 65,000 tpa. Demand from the ceramic industry that drives about 55% of this demand is expected to grow @ 8 ~ 10% pa in sync with the GDP growth rate of 8 ~ 10%. However, the demand from other sectors is likely to grow @ 3 ~ 4% p.a. with GDP growth rate of 8 ~ 10% p.a. In line with this assumption, the demand for Zircon is likely to be of the order of 86,000, 90,000 and 93,000 tpa after 5 years for sustained per annum GDP growth rate of 8%, 9% and 10% respectively. The details of the same are given in the table below:
Table - 9.21
DEMAND ESTIMATES FOR ZIRCON IN INDIA (Qty in tonnes)
Ceramics Others Ceramics Others Ceramics Others GDP growth rate 8% 9% 10% CAGR for industry 8% 3% 9.00% 3.50% 10% 4%
2010-11 35,750
29,250
35,750
29,250
35,750
29,250
2011-12 38,610
30,128
38,968
30,274
39,325
30,420
2012-13 41,699
31,031
42,475
31,333
43,258
31,637
2013-14 45,035
31,962
46,297
32,430
47,583
32,902
2014-15 48,637
32,921
50,464
33,565
52,342
34,218
2015-16 52,528
33,909
55,006
34,740
57,576
35,587
The domestic production is not likely to keep pace with the above increase and substantial quantity of Zircon would continue to be imported. In the current scenario, the production would increase to about 40,000 ~ 45000 tonnes in the next few years.
9.5.4 Garnet: Though USGS have estimated that the production of Garnet in India is of the order of 7,00,000 tonnes per annum, the actual figures are expected to be less by 1.5 to 2 lakh tonnes. Against this production, the demand for this product in India is limited. Hence, major quantity of the produce is exported mainly to the Gulf and European market. The domestic consumption is hardly a couple of thousand tonnes per annum and as such the change is GDP growth rate would make little impact on the same especially in the backdrop of very high production at present. 9.5.5 Sillimanite: In contrast to the above, in case of Sillimanite, major chunk of production of the order of 35,000 tpa is consumed in the domestic market. Exports are significantly less. Refractory makers are the main consumers of Sillimanite and account for 75% of the demand while ceramic and other industries account for the balance 25%. In the past few years, the domestic demand for Sillimanite is likely to have increased from about 25,000 tpa to about 30,000 tpa. Indian Rare Earths Ltd and Trimex Industries are producers of this product in India. The demand for Sillimanite in the next 5 years is likely to increase from the present level of 30,000 tpa to 38,000 tpa, 39,000 tpa and 40,000 tpa with the expected per annum GDP growth rate of 8%, 9% and 10% respectively. However, due to various inherent advantages that Sillimanite has vis-à-vis the substitutes (or product it can substitute), there is scope for higher demand. The details of the demand increase are given in the following table:
As against the above, looking at the projects in pipeline, the production of Sillimanite is likely to double in next couple of years. 9.5.6 Rare Earth Compounds (Monazite) IREL operated monazite processing plant from 1952 to 2004 at Rare Earths Division at Alua, near Kochi in Kerala. The plant had capacity to process about 4,500 tpa of Monazite. IREL was forced to suspend operation owing to unfavourable market condition due to availability of rare earth material from China at very competitive prices. Subsequently, the plant switched over to production of Ammonium Di Uranate (ADU).
IREL is in the process of setting up a Monazite Processing Plant (MOPP) at its OSCOM unit in Orissa. Initially, the plant will have capacity to process 10,000 tpa of Monazite and produce 11,000 tpa of Rare Earths Chloride that i.e. equivalent to about 5,000 tpa of Rare Earths Oxide (REO) that represents about 3 ~ 4% of World demand of about 1.25 ~ 1.5 lakh tonnes. Incidentally, only about 500 tpa is imported for domestic consumption of which over 90% is Cerium Oxide. As domestic market for RE compounds is limited at present, IREL shall have to export the high pure rare earths that it intends to produce. The plant would also produce Rare Elements which are essential for India’s nuclear energy programme. IREL’s three mineral processing units have capacity to produce about 16,000 tpa of Monazite at full capacity and can produce about 10,000 tpa to cater the raw material requirement of the MOPP. Other players in this field can also produce about the same quantity which IREL can use when the capacity of MOPP is doubled to processing of 20,000 tpa of Monazite. It may be noted that though the local market for Rare Earth compounds is limited, rare earth elements are finding applications in a big way in automobiles, wind mills and other green applications in the country which in turn drive the demand for rare earth compounds. With the increasing application of rare earths in aforementioned field the consumption pattern is expected to have a big leap forword. Moreover rare earths being used as input material for various industrial sectors, no scientific survey or study has been taken up to establish the domestic demand. It would be appropriate on the part of the Government to establish the domestic demand of rare earths for carving out the policy measures. Accordingly government / Ministry of Mines with assistance from Indian Rare Earths Ltd. may take initiative for conducting professional study to assess the demand for rare earths for meaningful production initiatives in this field. 9.6.0 Goals for XII Plan
9.6.1 Mineral Output: 2 PSU’s viz. IREL & KMML along with 2 leading private players i.e. M/s TRIMEX Sands Pvt. Ltd and M/s V.V. Minerals are engaged in beneficiation of beach sand minerals. While KMML uses their entire ilmenite production for its captive consumption to produce Synthetic Rutile. The installed capacity of the other three companies taken together is about 10 lakh tons of associated minerals. IREL has expanded its capacity in Chavara unit and is also planning to augment the capacity of its unit in OSCOM in the XII plan period. Private players are also on the look out to expand their capacity. Not withstanding the above and addition of new players in the market, Indian supply is expected to be to reach about 18 lakh tons per annum by the end of XII Plan. It is
worth mentioning that the share of Indian beach sand mineral production is limited to 5-7%, but tradable Indian share is around 15% due to limited level of value addition. 9.6.2 Revenue Targets: Ilmenite constituted major volume of Beach Sand and accounts to about 50% of the revenue earned from beach sand minerals. Rutile, Zircon, Sillimanite & Garnet which are produced along with even though in small quantifies, accounts for another 50% revenue from the beach sand minerals. Beach sand minerals in India are expected to generate a revenue of about Rs. Rs. 5,000 crore by the end of XII Plan period considering the present pricing trends 9.6.3 Contribution to GDP: Beach Sand minerals are used as input material for construction, infrastructure, refractory, foundry, aerospace, paint, polymer, nuclear and renewable energy. Multifarious usage of these mineral have been instrumental in growth of developed economy and are now key drivers for the growth of Asian-Pacific region. However, in India the growth of Beach Sand mineral is sluggish and registered meager contribution to GDP of country in plan economy in spite of its existence prior to independence. Since the growth and development of various sectors are associated with Beach Sand mineral industry, a modest growth to the extent of 4 ~ 5% (reckoning direct & indirect) would provide excellent impetus to Indian Beach Sand industry. 9.6.4 Employment Generation: For a plant of about 2 lakh tons capacity of and associated minerals, about 1200 manpower are required ideally which includes technical, administrative, marketing staff, etc. With augmentation of 8 lakh tons during the XII plan period, employment for about 5000 workmen will be generated during the period. Besides the industry has the capacity to generate indirect employment in terms of collecting of beach sand, loading/ unloading, transportation and other associated services. The stages of value addition to the feedstock would also generate additional employment besides reducing the dependence on import. 9.7.0 Priority areas for discussion: 9.7.1 Priority areas for the mineral – import substitution, value addition and export: Except for Sulphate grade Ilmenite, Sillimanite and Garnet, demand for other products viz. Chloride grade Ilmenite, Rutile and Zircon is higher than the domestic supply. The gap by end of XII plan for Ilmenite chloride grade, Rutile and Zircon is expected to be 1.5 Lakh tonne, 15 ~ 20,000 tonnes and 40 ~ 45,000 tonnes respectively. Hence, steps need to be taken for exploration and exploitation of beach sand minerals to meet the demand supply gap which would result in import substitution. The sulphatable ilmenite surplus is estimated to be of the order of 8 lakh tonnes since rutile and zircon production is linked with the production of Ilmenite and proven reserves of chlorinatable ilmenite containing higher than 55% TiO2 are getting depleted, the thrust should be in adopting technology to convert this low grade sulphatable ilmenite into Titanium Slag which can cater to the Chlorinatable feedstock market.
This may necessitate developing the technology of Slag making by indigenous R&D effort and will mostly depend on availability of quality electric power at reasonable rate. 9.7.2 Value addition: Value addition to the beach sand minerals is very low compared to the global scenario. KMML & CMRL in Kerala along with DCW in TN are engaged in production of synthetic Rutile. KMML, TTPL, Kolmark & Kilburn are engaged in production of titanium pigment of very low quantities. Defense Metallurgical Research Laboratory has developed technology for production of titanium sponge at pilot plant level, however commercial production facilities are yet to be set up. Mishra Dhatu Nigam Limited is the only establishment in India to have all the melting and fabrication facilities to produce mill products of titanium and its alloys. From the aforesaid, it can be seen that the value addition initiatives in India are limited. The impetus for value addition are further reduced due to closely guarded technology, high cost & quality of power and chemicals in India. The usual practice in beach mineral industry is to treat mining and mineral separation on one hand and value addition to minerals on the other as independent stand alone activities owned and operated by different entrepreneurs. At the most the first stage value addition to synthetic rutile or titania slag is integrated with mineral production and separation activity. Historically each stage of value addition correspond to a value of 3.5 to 3.75 in monetary terms having multiplier effect in the value chain. In the Indian context however, value addition seems to be an valued criterion for even grant of mining leases, and even the Business Houses find it preferable to go in for Integrated Projects. But it would be prudent not to carry the value addition pre-condition too far and experience in mining and the wherewithal, technology and investment levels required for value addition are quite different from each other and rarely gel to together. For another, the scale of operations has to remain at certain levels, restricting the mining choices to a few deposits only. The rest of the smaller deposits necessarily have to be operated by mineral producers and suppliers only. In any event, every Player in the value addition category, would be well equipped on the Technology front and hardly needs any support or guidance on Flowsheets and processes. IREL has necessary technical expertise to process Monazite (which is also produced along with the beach sand minerals) to produce value added products viz. tri-sodium phosphate, rare earth chloride, thorium oxalate, etc. However, state of art technology for further value addition of the rare earth chloride for down stream products like magnets, catalysts, etc are not available. In view of the above, it is essential to have tie up with suitable technology provider for the import of state of art technology. Hence, guidelines for fast implementation of the projects along with methodology for speedy disposal of statutory clearances in these cases need to be framed to implement projects with foreign collaborators within a short time frame. Besides, mandatory JVs with PSU participation and quantum of equity holdings by foreign share holders need to be framed to attact FDI which would ultimately result in inducting state of art technologies. Ilmenite is the principal beach sand mineral that is exported. It undergoes various stages of value addition which comprises of enriching TiO2 content and is then sold to the end users like pigment, paint, paper industries which constitute more than 60% of the market share. During the process of value addition, the impurities mainly in the form of FeO & Fe2O3 are removed. Strategies need to be developed stage wise value addition so that amount spent in
transportation/ logistics of the impurities can be done away leading to enhanced revenue generation. Steps were taken time and again to set up these value added units by IREL in the past, but due to global economic melt down, the projects were called off. Considering the power intensive process required for downstream value addition, proper guidelines to promote investor friendly approach in the form of permitting phased commitments need to be established, besides ensuring availability of quality power free of regulations. While it is desirable that the Beach Sand Mineral sector operates in a more liberalized manner with higher degree of Private Sector participation with FDI, wherever possible the interests of the few Government owned companies engaged in this operation should be protected by clearly segregating their area of operations from those of the Private enterprises. It may be noted that the main deterrent for value addition is the lack of availability of quality power, suitable reductant and the state of the art technology for producing the value added products. Similarly, in the field of Rare Earths we can learn lesson from China model. In the period of 10 ~ 15 years, China has transformed itself as a hub of value added products from rare earths. Increasing application of rare earth elements in the field of wind turbines, automobiles, consumer electronics, petroleum refining including clean and renewable energy provide ample opportunity for developing rare earth based value addition industry in the country. The proposed study in the field may encompass this aspect along with potential employment generation and import substitution. 9.8.0 Policy Issues (e.g. Environment issues, Rehabilitation, CRZ, etc.) 9.8.1 Legislative issues In order to have insight in to legislative issues it is better to understand the unique Features and Problem Areas. Unlike many other Mineral Sectors, Beach Sand Minerals have several features unique to them in respect of their formation, deposit sizes, geomorphology, hydrology, anthropogenic impacts, environment, natural hazards, mining methods, beneficiation techniques and so forth. Any regulatory or control measures have necessarily to accommodate these characteristics. In these characteristic features lie Strengths, Weaknesses, Opportunities and Threats of this under-developed Mineral Sector. A proper understanding of these unique features facilitate in formulating the ground rules for managing this Sector. Some of these are briefly touched upon below:
A. Depositional Characteristics: The beach placers are stationed just where the land ends and
sea begins. Their amphibian existence is manifest in their unique method of extraction by
dredging, which is neither open cast nor underground as mining is usually understood.
These high value minerals are widely scattered in a relatively thin layer, open to every one to
pick and carry. Lease boundaries do not bind the mineral. Even they are hard to be labeled
under UNFC Classification, as part of what is there today may recede or be taken away by
Nature tomorrow and some fresher mineral may be brought in, to be collected and used.
Reserve estimates are not all that definitive and production planning too has to be kept
flexible to an extent.
B. Environmental Concerns: Unlike most other Mineral Sectors, which have to deal with only
one water, here are two, one fresh and the other saline and the sea water has to be kept at
‘sea’ all the time. Coastal areas are highly eco‐sensitive in more respects than in any other
mining fields. Besides the fragile beaches, there are also numerous water streams, river
deltas estuaries, back waters, all prone to spread of any pollution from mining. Important
exclusion zones, such as coral reefs, mangroves, turtle breeding grounds etc. have to be kept
in view. The presence of radio‐active material monazite caps the environmental concerns, all
of which subject this Sector to three sets of scrutiny and prior clearances
C. Human Habitation: Out of all the mining sites, beach minerals are possibly co‐located with the
most densely populated areas with pressing claims for alternate land use. This poses by far
the greatest challenge and perhaps a good opportunity for socio‐economic upliftment.
Ingenious R&R policies, an inclusive approach and help from the Govt. are a must for survival
and healthy growth of this Sector. Though the deposits themselves may be continuous and
extensive, the large number of small homesteads, with equally tiny land holdings, often with
scanty ownership records and outdated revenue maps, create many a problem, taking lot of
time to acquire surface rights, that too assuming there is no other external obstacle or
outright refusal to part with surface rights (even on a temporary lease basis, which is all that
is required to take out the mineral and refill the void with more fertile loam with no
background radio activity). These mineral rich land holdings in patta dune lands or
otherwise, are so very vulnerable for unauthorized mining activities, (the high mineral values
are too tempting).
D. Exploitation and Value Addition: The sand form in which the minerals are found, lend
themselves to relatively easy and less expensive methods of producing large volumes. The
ROM yields multiple mineral products through straight forward mineral separation processes
each of the mineral products enjoys good demand and fetches high prices. The techno
economics of most of the Indian beach mineral deposits are quite attractive and the Industry
is well poised to discharge its social obligations and also share the returns with the stake
holders. The minerals produced can each sustain a chain of down stream value addition
activities benefiting the local people. Yet the present stale mate situation in land acquisition
defies logic and has become the single critical issue to be resolved.
E. Grant of Leases: The abundance of resources, world class deposits and willing entrepreneurs
on the one side and the dismal track record of granting optimum sized mining leases on the
other, has added one more unique feature to this Sector. It is not only a saga of lost
opportunities of industrial development, but also a direct loss of revenue earnings through
Royalties. The irreversible loss of prime mineral lands to alternative development projects is
also a price being paid for indefinite procrastinations in lease matters. Also, land transactions
for non mining purposes keep taking place among non lessees to the detriment of the actual
or potential lessees (i.e. P.License holders). In fact, it would be prudent to make it a
statutory requirement to insist on Mineral Exclusion Certificate (MEC) before considering
the land for any other purpose and also to provide first right of acquisition to a lessee to
mitigate speculative land grabbing in mineral bearing areas. . Keeping this in view, a GO
vide G.O.Ms No.74, dated 16/02/2002, issued by the Govt. of A.P. advising the Collectors not
to allow mineral bearing areas for non mining purposes seems to be in the right direction.
More importantly, the entry of a few large sized projects with state of art scientific mining and mineral processing, would have heralded the long overdue change over to healthy modern practices, thereby decreasing the proportion and leaving less room for illegal mining and other unsound practices in this Sector. Facilitating the entry of optimum sized players through appropriate policy package and facilitation in
acquisition of surface rights, would go a long way to provide a healthy foundation to this Sector.
9.8.1.1 Land Acquisition: The sources of beach sand minerals are co-located mostly in dense populated areas with pressing claims of alternate land use. This situation poses great challenge for land acquisition. The land owners expect, besides market driven compensation, employment, re-settlement in land ward side, water supply, health care, development of roads, etc. This situation has additional economic implication on the operations. A policy initiative from State Govt regarding securing mineral bearing land . could improve the situation which is expected to enhance the overall development of beach sand minerals in India. 9.8.1.2 CRZ Notification Beach sand minerals are a suite of seven minerals which occur in the beaches along the coast and are economically mined from the beaches. After separating the minerals from the beaches, the mined out areas are systematically refilled by gangue material such as quartz/ silica in a manner so as to restore the original topography of the coast line. The bulk of beach sand mineral production is not replenishable as the mines are exhausted after working. In certain parts of the Indian coast such as in Tamil Nadu & Kerala, minerals are continuously deposited between the LTL & HTL due to natural action of sea waves and winds and these constitute a replenishable source. Manual harvesting of these deposited minerals between HTL & LTL are absolutely vital for the beach sand industry as in the absence of such harvesting, these valuable minerals are lost for ever. It would result in a colossal waste of natural resources and would sound a death knell for the beach sand industry as a whole. In view of the above, following should be allowed for beach sand industries: Mining of rare minerals are allowed as per CRZ notification 2011. Even though alternate
sources of the beach sand minerals are available in inland deposits, the same are yet to be fully identified in India. Hence restrictions should not be imposed on mining of rare minerals in the CRZ area, however, the same may be regulated.
Expansion of beach sand separation plants in CRZ area may be allowed since chemicals are not used in the separation process.It makes for containment of radio-active throughput to the coastal stretches (which any way have their background radition levels) rather than spreading it to fresh areas beyond the CRZ boundaries.
Mining of frontal sand dunes containing beach sand minerals should be allowed, since after separation of heavy minerals, the original topography of the area is maintained by backfilling, thus keeping the beneficial aspects of frontal dunes in tact..
Beach washings are a perennial source of supply of beach sand minerals which if not exploited, will be lost for ever. In view of the above, operations between HTL & LTL for collection of beach washings should be allowed.
The 5 years validity period for CRZ clearance should be replaced by periodic reporting of routine compliance.
Capacity expansion of Beach Sand Mineral producing industries should be permitted in CRZ as most of these minerals occur in coastal stretches.
9.8.2 Non-legislative issues Monazite is found along with other beach sand minerals. With the liberalization of beach sand sector, many private players have entered into the business. Monazite being a prescribed
substance, the private players are not allowed to process them and keep the same in the form of concentrate. Indian Reserve of Monazite is about 10 million tonnes which has the potential to generate about 30,000 tonnes of uranium. Hence it is essential to frame a policy to compulsorily acquire the Monazite from these private players, which if processed can substantially contribute to about 15% strategic material to department of Atomic energy supply with that compared to the primary source. It would also enable production of mixed rare earths and its value chain products, which would be useful in supporting various technological sectors as a performance material. 9.9.0 Future Key Initiatives 9.9.1 Initiatives to Meet the Current and Future Demand Supply Gap. Indian reserves of the major beach sand mineral i.e. is approx 16% of the world reserves whereas the production accounts to only approx 6 – 7% of the world production. It is essential to set up joint venture projects in association with state governments to enhance beach mineral production with further down stream applications where the reserves have been established and economic beneficiation can be looked into:
Bramhagiri deposit of Orissa. Godavari, Krishna and Vishakapatnam districts of A.P. Allepey district in Kerala Villaithoppu-Rajakkamangalam in T.N. Puducherry U.T.
9.9.2 Investment in exploration projects Exploration of beach sand minerals in India is done by AMDER (and occasionally by the State Govt. DMGs) and as per AMDER’s latest report the following is the beach sand minerals reserve:
Garnet 154 The above list only accounts for part of the coast line where deposits have been explored. There are immense possibilities of the above quantities rising drastically after the balance coastline is explored. The offshore heavy mineral resources are also yet to be fully explored. Action plan for exploitation of Rock as well as Off Shore sources should be put in place in such a way that areas where PSUs are operating at present are reserved for them when granting Off Shore mining rights. 9.9.3 Technology Up-gradation / New R&D Initiatives Association with foreign partners will result in adopting state of art technology resulting in better economics in production in an environmental friendly manner.
Association with foreign partners in R&D activities to continually improve its flow sheets to attain higher recovery and reduce the loss in natural resources would also be instrumental in increasing the production. Besides, in the absence of suitable process know how, extensive test works are undertaken to set up pilot plant facilities to produce Nano titania, Nano Zirconia, Silica sand containing less than 0.02% Fe2O3 which finds use in glass industries, etc. Towards this goal, assistance of premier research laboratories like RRL, CSIR, etc are also being sought. 9.9.4 Mineral Conservation In view of low exploitation of beach sand minerals and associated materials of strategic importance, it is premature to address the minerals conservation issue other than attempting fuller tapping of replenishable beach washings. It would be advisable to prepare a detailed policy document incorporating these aspects commensurate with Indian and international scenario. Such a Policy Document is expected to be prepared based on detailed study of stake holder’s perception, sector specific growth and international market.
9.9.5 Sustainable Mining With the help of various methods of mining being followed all over the World and a couple of mines in India. Adopting modern technology for mining and mineral processing should have come on the scene since the Govt. opened this Sector to Pvt. Sector investments in 1998. However, more than a decade hence, it has not witnessed much progress. The possible reasons for the same have been indicated elsewhere in the document. Since any advancement in scientific mining is dependent on more such standard, modern Projects being commissioned, a hard look is required in to the policy dispensations and other inhibiting factors coming in the way of promoting scientific mining which should be the corner stone of sustainable mining.
Beach sand mining is environment friendly since it does not destroy the topography of the area mined
out as in other forms of mining. After recovery of the valuable minerals, the silica sand/ quartz is used
to back fill the mined out area, thereby restoring the topography close to the original. Further, water
used for the various operation, percolates back to the water table and hence there is no net drawl of
ground water. Besides plantation of trees are also carried out.
9.9.6 Others (Transportation) Beach sand minerals are voluminous in nature; therefore it needs efficient transport system for minerals. The transportation can be carried out by road, rail & sea. The industry requires good support mechanism by establishing ports and their connectivity by rail & road for efficient transportation. A serious view of transportation through sea would also be helpful for access to these minerals in the domestic market as well for export purpose. 10. RECOMMENDATIONS: 10.1Out of 7,000 kms of Indian coastline, about 2,500 kms has been explored and operations
are on over an extent of only 100 kms. No substantial progress in Exploration activities for Beach Minerals was witnessed during the XIth Plan. Substantive steps to develop the beach sand reserves of the Country to its full potential by adopting suitable exploration strategy with modern techniques.
10.2Grant of concessions and land acquisition to be simplified and facilitated in order to facilitate exploitation of all the minerals available in the Beach Sand Minerals, therefore strategy is need for full exploitation of all seven minerals.
10.3In order to have better synergy for promotion of beach sand minerals, mechanism for better coordination amongst AMD, IBM and State DGMs should be evolved, which may consists of specialists/ experts of institutions as well.
10.4To promote technology for Titanium sponge, Rare earths production and usage, policy on
value addition and technology transfer with appropriate guidelines in FDI need to be incorporated.
10.5Mineral Exclusion Certificates (MECs) in the areas where beach sands exists should be
insisted by the authorities before allotting land for other purposes in order to avoid wastage of precious minerals.
10.6Study to be conducted in order to have fair idea on the nature of replenishment of heavy
minerals by tidal wave action all along the east coast from Andhra to Tamil Nadu will be helpful to check the trend of production pattern and thus check illegal mining/collection of such minerals.
CHAPTER – 10 STRATEGIC MINERALS AND METALS
10.1 INTRODUCTION:
The Global trend on Minerals
Demand for minerals has grown strongly over recent years. This strong growth is forecast to continue over the coming years on the back of global economic growth and continued rapid industrialization and urbanization in many developing economies especially India and China. Looking forward, the aggregate level of demand for energy and minerals is set to rise significantly.
Economic growth, industrialization and urbanization of economies have been associated with the rising use of minerals. The global growth in last few years also reflects a shift in the location of manufacturing from mature economies to the developing economies. From the graph below it is clearly visible that after the melt down, as economies around the world picked up steam again, commodity prices increased led by demand from the developing countries.
Source: UNCTAD commodity price bulletin
The future supply of minerals requires significant investment to augment existing reserves and develop additional resources. While significant investment is already underway in mining, still more investment will be required, if global supply is to keep pace with anticipated global demand.
Developing countries now account for more than 50% of refined metals consumption. China has become a major producer as well as consumer of several major metals. The World Bank anticipates that continued global growth and economic development will underpin strong growth in demand for minerals in years to come. China has been a leading producer and consumer of many metals. Till some time back China was a net exporter of metals/minerals, but due to increase in demand from the domestic industry and few other factors related to the pricing of these minerals, China has implemented export quotas. Thus countries around the world have woken up to a scenario of unpredictable shortage of these minerals. These minerals are extremely important for new and existing technologies related to electronics, ceramics, defense and other such critical industries. Some of these minerals also find use in nuclear
applications, while others find use in the manufacture of super alloys, super magnets, flat panel televisions etc. Looking at the importance and usage pattern in various industries, it is clear that the demand of these minerals will continue to increase. However, on the other side the supply has struggled to keep pace. This in turn is being reflected in the significantly increased price levels of minerals and greater price sensitivity to unexpected production disruptions, natural disasters, and geopolitical events. Hence, many of the countries around the world have started securing supplies and developing their own resources to match their respective industry demand.. Given the importance of metal in the economies as they grow and modernize, securing mineral resources is becoming a matter of strategic importance.
10.2 SCOPE OF THE CURRENT PAPER:
This report initially covers the following metals to begin with. More metals/minerals can be added for this study in due course of time.
These items are considered strategic for following reasons:
6. Continued advances in technology development – there is a swift increase in demand for metal intensive technology such as LCD screens, hybrid cars, wind turbine magnets, hi-tech defense applications and various other applications in modern economy. Most of these scientific advances require key mineral inputs. These applications are critical to the end product.
7. Dependence on these technologies is increasing worldwide 8. Substitutes are limited or lead to a loss of properties and are often subject to the same
constraints (e.g. production is concentrated in a few geographies). 9. As many of these can only be produced as a by-product of base metals extraction,
potential for accelerating production / supply on standalone basis is very limited 5 The known resources of these minerals are concentrated in limited geographies 6 Even the mineral deposits which are accessible have challenge of economic extraction 7 Unstable / inconsistent political systems, mining regulations, legislative regimes and
environmental risks for many of these minerals
8 There exists a lag between exploration and production. 9 Resource nationalism is an increasing threat to global mineral flow
10.4 GROWING RISKS & CHALLENGES
Globally there is a surge in interest from stakeholders in such minerals as users are seeing increasing supply risks due to reasons such as:
1. China is a major producer of many of these minerals/metals. Recent restrictions on exports from China and fiscal measures have severely constrained the supply side globally.
2. China itself is now a net importer of many of these items due to its own burgeoning demand
3. New demand from emerging markets is growing 4. Recent economic crisis constrained the availability of funds (except for Chinese
sourced funding)required for the exploration & production of minerals 5. Changes in geo-political stability potentially disrupting supply 6. Evolving resource nationalism in several economic jurisdictions has led to
protectionism 7. New frontier of mining often in areas with poor infrastructure increases costs and
The following table provides a high level summary of certain characteristics of the subject minerals. For each of the minerals more details are provided in Annexure........
MINERAL SOURCE USER INDUSTRY / SECTORS
MAJOR PRODUCERS
INDIA’S PRODUCTION (TPY)
INDIA’S IMPORT (Tonnes)
GLOBAL DEMAND(2030 ESTIMATES) (TPY)
Tin Cassiterite Solder, Tin Plate, Chemicals
China, Indonesia, Peru
60 7,989 ( Indian bureau of Mines, 2008-09)
NA
Cobalt Produced as a by-product of Copper and Nickel mining
Defense, Chemicals, Paint and ceramic,
Congo, China, Zambia, Russia
1,560 (IBM)
9953 ( IBM) 240,000 (Formationmetals.com)
Lithium Electrolysis of a mixture of lithium Chloride and Potassium Chloride
Note: Availability of data and its authenticity has been a challenge. However an attempt has been made to assimilate from diverse sources, whatever is relevant in the current context. 10.6 CHALLENGES FOR INDIA From the above it is abundantly clear that as far as the minerals included in the study are concerned, India is dependent on imports to a large extent and is thus vulnerable to supply/price fluctuations. The reasons for their strategic importance and the recent enhanced risks & challenges have been summarized in the global context. In the context of India, these assume further importance due to the following additional reasons:
1. Growing industrialization of India would be increasingly dependent upon the use of technology.
2. India will move towards establishing and strengthening its own high-tech industry base.
3. Several important industries, critical to India’s national security, renewable energy mission, electronics, consumer durables, clean technology etc. are dependent on subject minerals / metals
Germanium Sphalerite, zinc and copper smelting process
Solar cells, Defense, Optical fiber
China, USA, Russia
NA NA 220 (European commission)
Gallium By-product of Alumina Production process
LED’s, Mobile Communication Industry, Integrated circuits
China, Germany, Japan, Kazakhstan, Ukraine
55kg(approx) NA 603 (European Commission)
Indium By-product of commercial extraction of Zinc, lead, copper and tin
Television Industry, Solder
China, Korea, Canada, Belgium, Japan
NA NA 1,911 (European commission)
Niobium Pyrochlore Magnets, Steel and Aerospace
Brazil, Canada NA NA NA
Beryllium Electrolysis of a mixture of Beryllium Fluoride and Sodium Fluoride
Bismuth By-product of extraction process of lead, tin, zinc
Pharmaceutical, Solder, Electronic circuits
China, Mexico, Peru
NA NA NA
Selenium Sulphide deposits
Glass industry, Agriculture and Dairy, Manufacture of Alloys
Japan, Belgium, Canada, Germany
( IBM) ( IBM) NA
4. The current understanding and knowledge of these minerals is limited and thereby India remains exposed to sub-optimal responses to the strategic risk
5. Even if there be an opportunity for India in these strategic minerals, it cannot be leveraged to advantage in the absence of sufficient clarity on the strengths & weakness of this subject,
Thus keeping the above points in mind, it becomes imperative that India develops a comprehensive policy with regard to the exploration, production, consumption and other issues associated with these minerals.
10.7 THE GLOBAL RESPONSE
Globally, governments, planners, law makers and corporate are increasingly aware of the emerging supply risks and seized of the matter of strategic importance. Most of these responses are evolving fast given the recently heightened risks. Some of the actions so far undertaken / contemplated are summarized below.
10.7.1 RESPONSE FROM EUROPEAN UNION (EU)
The EU has started to address this issue. In June 2010 the European Commission published a report ‘Critical raw materials for the EU’ on the essential minerals that the EU must address. Europe has taken a geopolitical approach by determining the necessary elements that it must secure and trying to secure contracts at a government level. EU has also started interactions with countries that it perceives as a viable alternative for imports. Also it is investing heavily into research and development to find replacements for these metals. It has also made its intention clear about stock piling these metals. Also the document indicates that EU will take strong measures against any country which tries to cut supply lines of these metals. The strongest response has come from Germany while France and England are looking to develop a policy. The UK Parliament has already rolled out a process to assess the current situation, invite recommendations from all stakeholders etc. for ‘Strategically Important Metals’
10.7.2 RESPONSE FROM USA In US there has been an ongoing effort to develop a critical materials strategy. This strategy involves focusing on four core technologies: batteries, photovoltaic thin films, permanent magnets and phosphors. In addition, it intends to facilitate the extraction, refining, and manufacturing of these elements in the U.S. and elsewhere, and to develop innovative technology to recycle, create, and reduce dependence on these materials.
10.7.3 RESPONSE FROM JAPAN Japan is a country totally dependent on import of materials. Its electronics, fine-chemicals and car industries rely on them. A disruption of supply could paralyze the Japanese economy as much as an oil embargo or food blockade. The big trading houses such as Sojitz, Sumitomo and Mitsubishi are securing alternative supplies, supported by state financing. Companies such as Toyota, Hitachi, Nidec and TDK are working to reduce or eliminate the various elements needed in devices. Recycling program is being studied. The government earmarked $1 billion from a stimulus package in November to
secure supplies, including funding university research and projects such as robotic deep-sea mining. A national stockpile of the kind that already exists for rice, cereals and petrol has been mooted. There is even discussion on creating a generously funded agency to acquire stakes in non-Chinese producers, possibly using the country’s vast foreign-exchange reserves. Japan’s prime minister has met his Vietnamese and Mongolian counterparts to discuss new production.
10.7.4 RESPONSE FROM CHINA China is a leading player in the mining and metals sector. In a bid to support its domestic electronic goods industry and curb illegal mining Chinese government has enforced a 35% export quota, which has resulted in a reduced export of 14,508 tons in the 1H2011 as against 22,282 tons in 1H2010. Moreover, to safeguard its strategic minerals, China is going a step forward and is limiting or forbidding foreign investment into the country e.g. in Tungsten, Chinese government has limited the number of exploration, mining and export licenses. It is also imposing constraints on mining and processing and is adjusting export quotas to favor value-added downstream material and products. In addition, the Chinese tungsten industry is investing in mining projects outside of China and increasing its use of Tungsten scrap.
10.7.5 RESPONSE FROM INDONESIA Indonesia in December 2009 issued the Domestic Market Obligation (DMO) regulation which prioritizes mineral and other resources for domestic usage. The policy aims at meeting the stated objectives by preferential allocation of resources to meet domestic needs and also through export restrictions. The regulation requires mineral producing companies to allocate a certain minimum percentage of its total production to the domestic market.
10.8 POTENTIAL APPROACH FOR INDIA India should gear up for the challenges ahead. India should develop its own policy response from amongst the following options and should craft an integrated roadmap for mining, production and usage of these minerals.
5. Access to raw materials in world markets: Entering into bilateral agreements with countries, to secure supply for both the short term and long term. Moreover, India can create a national body which is responsible for the national sourcing of raw materials similar to Jogmec.
6. The right framework to foster sustainable supply of raw materials from Indian sources: Creating an environment where the domestic producers are encouraged to produce these metals. Most of these metals can be produced as a by-product of the base metal production process, but it appears that the current quantities are low. Thus India should work to incentivize the production of these metals through fiscal measures.
7. Increase resource efficiency and promoting recycling: Investing in research so that substitutes can be found. Recycling is another important way to fulfill a part of the demand of these metals.
8. Build a national stockpile: Evaluating the option of building a national stock pile for identified materials. This will not only help to meet supply in case of exigencies but also keep prices under control.
10.9 ISSUES TO BE ADDRESSED In order to understand the scenario, various questions need to be addressed. Some of them are:
1. What are the possible risks of India not developing and implementing a strategic mineral policy?
2. Can India rely on the free global market place for access to strategic minerals?
3. Is the market and demand big enough for these minerals to undertake development of infrastructure to produce these minerals?
4. What is the resource/reserve base of these minerals in India?
5. Where are they located globally? 6. How geographically
concentrated are the reserves of these minerals? 7. Can these be economically
extracted? 8. What are the chances that these
minerals can be substituted by some other minerals? By when? 9. Where is the funding going to
come from private/public to develop and implement a strategic mineral strategy? 10. Is the industry ready to
undertake measures to overcome the supply chain problems? 11. Can the Indian mining industry
venture and find it viable to explore & develop the resources to cater to the Indian demand of these minerals?
12. What supporting environment would be required?
13. Will the resources required to develop these minerals be available in a world where mining services industry is already stretched to service bulk commodities?
10.10 THE WAY FORWARD The above questions can be addressed conclusively and a policy regarding the Strategic minerals can be developed if some specific studies are taken up. This report recommends comprehensive study on
1. Potential market size and demand; potential influence of substitution and price levels 2. Study regarding current exploration, production and availability of these minerals 3. Assessment of potential resource base and evaluation of economic feasibility of the
development of the resources 4. Assessment of existing Indian strategic minerals producers/explorers 5. Ways to incentivize base metal producers to produce these strategic minerals 6. Supply chain strategy to address supply chain disruptions and ways to build a national
stock pile for strategically critical input materials. 7. Areas of competitive advantage India may have (in case of surplus availability) and
how best to leverage it for long term advantage
8. Establishment of an Indian competence network on strategic minerals with all relevant stakeholders including recyclers, manufacturers, public authorities, government and researchers is essential for a successful implementation.
9. Regular assessment of which minerals should be included within strategic minerals.
The study will need collaborative approach between governments, mining and metals industry, diverse user industries, both in Public and private sectors. Understanding the approaches being developed by other developed and developing countries would be an imperative to be able to craft a set of solutions that will be of sustainable advantage to India.
ANNEXURES 10.1 TIN
Tin is a soft, ductile and malleable silvery white metal. An important tin mineral is cassiterite, which contains 78.6% tin. Its major properties includes low melting point, non-toxicity, resistance to corrosion, silvery appearance and the ability to readily form alloys with most metals.
10.1.1 RESERVES
China reserves stands at around 1.5 million tons of, the largest reserves of tin in the world for any single country. Indonesia, Brazil and Peru also have substantial quantity of tin reserves with 29%, 11% and 14% respectively.
10.1.2 AREAS OF CONSUMPTION
Source: London Metal Exchange
10.1.3 MAJOR PRODUCERS
Mine production of Tin (in tons) Countries 2009 2010China 115,000 115,000Indonesia 55,000 60,000Peru 37,500 38,000Bolivia 19,000 16,000Brazil 13,000 12,000Others 20,500 20,000Total 260,000 261,000
Source: United States Geological Survey
Top 10 companies refined tin Production (in tons) Company Country 2010 (in tons)Yunnan Tin China 59,180PT Timah Indonesia 40,413Malaysia Smelting Corp Malaysia 38,737Minsur Peru 36,052Thaisarco Thailand 23,505Guangxi China Tin China 14,300Yunnan Chengfeng China 14,155EM Vinto Bolivia 11,520Metallo Chimique Belgium 9,945Gejiu Zi-Li China 9,000
Source: International Tin Research Institute (ITRI)
China is the largest tin producing country with 45% share of the world mine production. Indonesia and Peru follows China in tin production with their respective tin production shares at 16.5% and 13.5% of the world production
10.1.4 TIN PRICE TRENDS:
Source: Thomson Datastream, Crisil Research
Global tin prices registered a modest recovery between January 2009 and January 2010. In 2010, prices witnessed short-term volatility until June 2010, when they reached their lowest levels in 2010. Prices increased steadily between June and October 2010 before once again witnessing volatility in November 2010. They resumed their upward trajectory in December 2010. Tin prices in March 2011 decreased because of the impact of the earthquake on Japan’s electronics industry. The prices of tin corrected in May 2011 to reflect the current one-year high inventories of the metal at LME.
10.1.5 THE MAJOR USES OF TIN ARE FOLLOWING:
1) Electro-plating is an important application of tin which is used to protect both ferrous and non-ferrous surfaces.
2) Also used in electronic components, integrated circuits, clips, pins and many other. As a pure metal, it can be used in storage tanks for pharmaceutical chemical solutions, in capacitors electrodes, fuse-wires, ammunitions, tinned iron sheets to protect victuals, sweets or tobacco etc.
Y-o-y growth June 2010–May 2011: up 67%
Y-o-y growth June 2010–May 2011: up 46%
3) Some of the tin organic compounds have several applications as fungicides and insecticides for the agriculture and still as wood, textile and paper preservers.
4.) Alloys of tin are also important, such as soft solder, pewter, bronze and phosphor bronze. The most important tin salt used is tin (II) chloride which is used as a reducing agent and as a mordant. Recently, a tin-niobium alloy that is superconductive at very low temperatures has attracted interest.
5.) It is also useful in the food-processing industry since it is non-toxic, ductile and corrosion resistant.
Recyclability- The tin recycling rate for scrap tin to be converted to refined pure tin is around 8%. Also, the main usage of the metal is in alloy form, which is estimated to be around 20% for brass and bronze alloys and 3–40% for solder alloys. 1
India Scenario: In 2006 India reportedly consumed at least 300,000 tons of tin plate of which nearly two third were imported. Major tin plate producers in the country are Tin Plate Company of India, GPI Steel Industries, SAIL (Rourkela tin mill). The occurrence of the minerals of strategic metals niobium and tantalum in cassiterite deposits brought cassiterite processing in the focus of Atomic Energy Research. A pyro-metallurgical route to recover all the three components from the tin mineral has been developed and a pilot plant was set up.
Tin reserves and resources in India as of 01.04.2005 are:
The total resources of tin in India are estimated to be around 86.6 million tons with metal content of around 101,237 tons. Indian tin resources are concentrated in Chhattisgarh, Haryana and Orissa.
India produced 59,776kgs of tin in FY09, all of which came from Dantewada district of Chhattisgarh. The primary consumers of the metal in India are the tin plate and solder industries.
1 ITRI website, http://www.itri.co.uk/POOLED/ARTICLES/BF_PARTART/VIEW.ASP?Q=BF_PARTART_307571, accessed 13 June 2011
10.1.6 TIN TRADE
10.2. COBALT
Cobalt is a lustrous, grayish silver, brittle metal. It is ferromagnetic in nature and forms alloys with many other metals. It is mainly produced as a by-product of Copper and Nickel production process.
The world cobalt resources were estimated at 13 million tons of metal content as of 2009. Cobalt resources are mainly in Democratic Rep. of Congo (DRC) which contributes 36% to the total reserve base. Besides, major resources are located in Australia, Cuba, New Caledonia, USA and Zambia. A majority of these resources are in nickel-bearing laterite deposits and rest in nickel-copper sulphide deposits hosted in mafic and ultramafic rocks in Australia, Canada and Russia and in sedimentary copper deposits of Congo (DRC) and Zambia
Mine production( in Tons) Reserves(in Tons) 2009 2010
United States – – 33,000Australia 4,600 4,600 1,400,000
Brazil 1,200 1,500 89,000Canada 4,100 2,500 150,000China 6,000 6,200 80,000
Russia 6,100 6,100 250,000Zambia 5,000 11,000 270,000
Other countries 3,700 4,700 740,000World total 72,300 88,000 7,300,000
Source: Adapted from USGS Data
10.2.1 AREAS OF CONSUMPTION
Source: Adapted from USGS Data
10.2.2 THE MAJOR USES OF COBALT ARE
1. It is used in the manufacture of super alloys, Batteries & Chemicals, Carbides. Super alloys improve strength, wear and corrosion resistance characteristics.
2. Cobalt catalyst mainly cobalt acetate is used in terephthalic acid (TPA) and dimethylterephthalate acetate(DMT)
3. Cobalt oxide is used extensively in the paint, glass and ceramic industry.
4. Cobalt is used in the manufacture of magnets, spacecraft alloys as it is known to retain its ferromagnetic properties even at 1100 C.
10.2.3 PRICING
After trading in a range of US$10–US$ 30 per pound during 1990–2007, Cobalt prices shot up in 2008 to touch a level of around US$ 50 per pound. However, prices crashed at the end of 2008, along with all other commodities and are again trading in a range of US$ 20-US$ 30 per pound.
10.2.4 INDIA SCENARIO
India has around 44.91 million ton of cobalt resource. Of this around 69% is in Orissa and the remaining 31% is in Nagaland (5 million tons) and Jharkhand (9 million tons). At present no production is done from the indigenous ores. Most of the cobalt refined in India is from imported ores.
The production of cobalt metal in India since 2005 is as shown below: Country 2005 2006 2007 2008 2009 India (metric tons) 1220 1184 980 858 1001
Source: “World Mineral Production 2005-09,” British Geological Survey, 2011
The following plants are involved in the production of cobalt in the country -
Plant Capacity (tones per year) Nicomet (Cuncolim, Goa) 1,000Rubamin (Vadodara, Gujarat) 500Others 60Total 1,560Source: “Indian Minerals Year Book 2008 -Cobalt,” Indian Bureau of Mines, 2009, part 25, p.2
10.2.5 COBALT CONSUMPTION IN INDIA
Source:“Cobalt News,” Cobalt Development Institute, July 2006
10.3. LITHIUM
10.3.1 RESERVES
Source: Adapted from USGS data
Chile has the largest lithium reserves, which stands at 7.5 million tons, in the world. Chile is the second most abundant, with lithium reserves at 3.5 million tons. Together these two countries account for 85% of the total lithium reserves.
10.3.2 AREAS OF CONSUMPTION
Source: Adapted from USGS Data
10.3.3 MAJOR PRODUCERS
Lithium mine production (tons) Countries 2009 2010
Argentina 2,220 2,900
Australia 6,280 8,500
Chile 5,620 8,800
China 3,760 4,500
World total 18,800 25,300
Source: Adapted from USGS Data
10.3.4 THE MAJOR USES OF LITHIUM ARE FOLLOWING
1. It is used extensively in the paint, grease, glass, ceramic and aluminum production industry.
2. Probably the biggest use of lithium is in the battery manufacturing industry, especially the rechargeable ones. All batteries used in mobile phones, hybrids cars etc use lithium.
3. Another usage of lithium is in the field of medicine, where it is used as a treatment of bipolar disorder, a condition of mental illness.
10.4. GERMANIUM
Germanium is mined primarily from sphalerite, though it is also recovered from silver, lead, and copper ores. It is mostly produced as a by-product of zinc and copper-zinc smelting.
Refinery production (in tons) Countries 2009 2010United States 4,600 4,600China 80,000 80,000Russia 5,000 5,000Other countries 30,000 30,000Total 120,000 120,000
Source: Adapted from USGS Data
10.4.3 THE MAJOR USES OF GERMANIUM ARE
1. Germanium is a semi-conductor and finds use in the electronic industry.
2. It is used in the production of fiber optic cables and polyethylene terephthalate (PET) bottles.
3. Germanium is used by the military in the manufacture of lenses and window blanks for infrared applications.
4. Used in the manufacture of photovoltaic solar cells in the satellite industry. Germanium substrates have the highest efficiency till date for conversion of solar energy into electricity.
10.4.4 RECYCLABILITY
Around 30% of the total germanium consumed is produced from recycling scrap.
Indian Scenario- N/A
10.5. GALLIUM
Gallium is recovered from sodium aluminate liquors obtained in Bayer’s alumina process during aluminum production. Traces of gallium are also found in zinc ores.
10.5.1 AREAS OF CONSUMPTION
Source: Adapted from USGS Data
10.5.2 MAJOR PRODUCERS
Gallium as a pure ore is rarely found and is produced as a by-product of the alumina production process. Gallium is mainly used as Gallium Arsenide (GaAs) or Gallium Nitride. Primary gallium production in terms of metal content was around 106 tons in 2010 and 79 tons in 2009. China, Germany, Kazakhstan and Ukraine were leading producers of gallium in 2010. Refined gallium production, which includes some scrap refining, was estimated to be about 161 tons in 2010.
In 2010, the world primary gallium production capacity was around 184 tons, refinery capacity was 177 tons.
The major uses of Gallium are
1. In the mobile communication industry 2. For the manufacture of LED’s, laser diodes, photo detectors and solar cells. 3. Gallium nitride devices is used in high density storage devices, laser printing. 4. It is also used in manufacturing mirrors, low melting alloys. 5. Gallium salts are used in medical imaging.
10.5.3 Recyclability- The world gallium recycling capacity is around 141 tons in 2010.
10.5.4 India Scenario- In India Gallium is not produced at all. Earlier attempts did not succeed due to low gallium content in Indian bauxites.
10.6 INDIUM
Indium is a very versatile metal and its concentration on earth is same as silver but it is not mined in its own right as it is rarely found in sufficient concentrations. It is thus mainly produced as a by-product of the commercial extraction of zinc, lead, copper and tin. Major producers of Indium are China, Canada, and Korea etc. It is mainly used in the form of Indium Tin Oxide. Japan is the largest consumer of Indium followed by China.
10.6.1 AREAS OF CONSUMPTION
Although Indium has many applications but the flat panel displays have grown to become the primary end user of world’s indium production.
Source: “Indium: Supply, Demand & Flat Panel Displays,” National Renewable Energy Laboratory website,
Department of Energy, Government of United States,
10.6.2 MAJOR PRODUCERS
Refinery production (in tons) Countries 2009 2010China 280 300South Korea 70 80Japan 67 70World total 546 574
Source: Adapted from USGS Data
10.6.3 THE MAJOR USES OF INDIUM ARE
1. It is used in the manufacture of flat panel television. Due to advent of the mass market of flat panel television sets, this metal has been shot to prominence.
2. It is also used in the manufacture of lead free solder which is the norm in many countries now.
3. Indium is also useful in making electrical components for infrared detectors, high speed transistors and photovoltaic devices.
10.7. NIOBIUM2
The primary mineral from which Niobium is obtained is pyrochlore. The world’s largest deposit is located in Araxa, Brazil and is owned by Companhia Brasileira de Metalurgia Mineracao (CBMM). Though, Niobium and Tantalum minerals often occur together but approximately 85%–90% of the niobium industry obtains its Niobium ores from sources other than those associated with the mining of tantalum containing ores.
10.7.1 AREAS OF CONSUMPTION
Source: Adapted from USGS Data
10.7.2 MAJOR PRODUCERS
Production of Niobium ( in tons) Year 2008 2009Brazil 58,000 57,000Canada 4,380 4,300Others 483 400Total 62,863 61,700
Source: Adapted from USGS Data
The top three reserves of pyrochlore (ore used in the production of Niobium) are
1) Araxa, Brazil, owned by Companhia Brasileira de Metalurgia Mineracao (CBMM) – 460 million tons (reserves)
2) Another pyrochlore mine in Brazil, owned and operated by Mineracao Catalao de Goias – 18 million tons (reserves)
3) Niobec Mine in Quebec, Canada owned by Camet Metallurgy – 18,000 tons (reserves)
2 Source: Tantalum-Niobium International Study Center
These three companies produce around 85% of the world’s demand for niobium products, with most of that output being in the form of ferro-niobium with a nominal 60% niobium oxide content for making high strength, low-alloy steel.
10.7.3 THE MAJOR USES OF NIOBIUM ARE
1. It is used as ferroniobium in the manufacture of special steel. 2. It is also used in the manufacture of alloys used in jets and rockets as such alloys can
withstand high temperatures. 3. Along with titanium and tin it is used in the manufacture of super magnets for MRI
scanners. 4. Niobium powder, in the form of niobium capacitors is used for electric segment. 5. Niobium oxide is used in the manufacturing of lithium niobate for surface acoustic
wave filters.
10.7.4 India Scenario- Very small quantities of columbite-tantalite minerals have been produced as by product of mica and cassiterite ore mining. Today comprehensive technology has been established for indigenous processing starting from the ore minerals through the separated pure oxide intermediates to high purity niobium and tantalum metals.
10.8 BERYLLIUM
The key markets for Beryllium are aerospace, automotive electronics, ceramics, computer and telecommunications.
10.8.1 WORLD MINE PRODUCTION AND RESERVES
Country Mine production(metric
tones)
Reserves
2009 2010
United States 120 170
China 20 20
Mozambique 2 2
Other countries 1 1
World total 144 190
The Spor mountain area in Utah contains a large
bentrandite resource which can be mined. It has
proven reserves of 15,000 tons. Except this
reserve, world beryllium reserves are not
sufficiently well delineated to report consistent
figures.
Source: Adapted from USGS Data
10.8.2 AREAS OF CONSUMPTION
Source: Adapted from USGS Data
10.8.3 THE MAJOR USES OF BERYLLIUM ARE
1. Beryllium is used in military and space applications due to the fact that its light weight, stiff and has a very high melting point.
2. Beryllium is also used in the nuclear reactors as neutron moderators. It has also been used in nuclear warheads as a triggering device.
3. Oxides of beryllium is used in the manufacture of circuits for high speed computers, laser and radar counter measure systems.
Recyclability- Beryllium was recycled mostly from new scrap generated during the manufacture of beryllium products. Detailed data on the quantities of beryllium recycled are not available but it approximately represents as much as 10% of apparant consumption.
India scenario- India has substantial deposits of beryl ore and the processing technologies for treating the indigenous resource have been comprehensively developed and a pilot plant is being operated by the Department of Atomic Energy.
10.9 TANTALUM3
Tantalum mineral concentrates may contain from two to more than five different tantalum-bearing minerals from the same mining area. Tantalum is sold in the market according to the tantalum oxide it contains. The concentrates have 20%–60% of Tantalum depending on the mine source. Resource base (approx)
3 Source: Tantalum-Niobium International Study Center
Source Million pounds (Mlb) Percentage
South America 285 40%
Australia 145 21%
China and Southeast Asia 73 10%
Russia and Middle East 69 10%
Central Africa 63 9%
Other Africa 47 7%
North America 12 2%
Europe 5 1%
Total 698 100%
Source: Tantalum-Niobium International Study Center
10.9.1 Major Producers-Tantalum is mainly found in the form of Tantalum oxide. An important source for tantalum has been releases from the US stockpile.
Production ( in tons) Year 2008Brazil 5,000Australia 940
China 350
Rwanda 298
Mozambique 396Total 8,992
Source: Adapted from British Geological Survey
In summary, at present, the global supply of Tantalum is as follows
1. It is mainly used in the manufacture of capacitors. Tantalum capacitors have very low series resistance thus helping batteries to provide longer power back up. Tantalum capacitors are a norm nowadays in laptops, multi function phones.
2. Tantalum is also used for stitching bones 3. Tantalum, in the form of tantalum oxide, is used in the lenses for spectacles, digital
cameras and mobile phones 4. It is also used in the manufacturing of high temperature furnace parts and high
temperature alloys for air and land based turbines. 5. Tantalum ingots are used in computer hard drive discs 6. Tantalum fabricated sheets and plates are used in chemical processes like lining
tanks, heat exchangers and providing cathodic protection for steel structures like bridges and water tanks
Indian Scenario- In India very small quantities of columbite-tantalite minerals have been recovered as by product of mica and cassiterite ore mining. However, a comprehensive technology base has been established for indigenous processing starting from the ore minerals through the separated pure oxide and halide intermediates to high purity tantalum metal. At present, there is no production of tantalum.
Pricing: Tantalum-bearing materials are not traded on any exchange and therefore, there are no published prices for tantalum, tantalum minerals or tantalum chemicals. The prices of tantalum raw materials are usually negotiated between miners and processors through long-term contracts.
10.10. TUNGSTEN
Tungsten is whitish grey metal finding its use largely as Tungsten carbide. 50% or more of tungsten is consumed in cemented carbide for cutting.It is a wear resistant material which is primarily used in construction, mining, Oil and Gas drilling. Remaining tungsten is used in alloys for appliances in filament wires, electrodes and super alloys.
10.10.1 RESERVES
Source: International Tungsten Industry Association (ITIA)
10.10.2 MAJOR PRODUCERS
Tungsten is mainly extracted from Ammonium paratungstate. China is the largest producer and exporter of Tungsten to US. The other major producers of tungsten are Russia and Austria.
Production (in tons) Year 2008 2009 China 43,500 47,000 Russia 3,000 2,400 Canada 2,300 2,000 Austria 1,100 1,000 Bolivia 1,100 900 Others 4,900 4,700 Total 55,900 58,000
Source: Adapted from USGS Data
The estimated global consumption of Tungsten (W) in 2008 was 85,000 tons including recycled material.
10.10.3 THE MAJOR USES OF TUNGSTEN ARE
1. Tungsten is mixed with carbon to make a very strong, very resistant material called tungsten carbide. Tungsten carbide is used to make cutting tools and wear-resistant tools for metalworking, drilling for oil and gas, mining, and construction.
2. Because it has a very high melting point and low vapor pressure, tungsten is used in high temperature situations. For instance, the filaments in light bulbs are made of tungsten. It is used in other applications of electronics as well.
3. Other alloys bearing tungsten are used for armaments, heat sinks, radiation shielding, weights and counterweights, wear-resistant parts and coatings.
India Scenario- In India the following states have resources of Tungsten:
The major ores of Bismuth are Bimuthinite and Bismite.Bismuth minerals rarely occur in sufficient quantities to be mined as principal products. World reserves of bismuth are usually based on bismuth content of lead resources because bismuth production is most often a by-product of processing lead ores.
World mine production and reserves (in metric tones) Country Mine Production
(2009) Mine Production
(2010) Reserves
United States - - - Bolivia 50 150 10,000 Canada 90 100 5,000 China 6,000 5,100 240,000
Kazakhstan 150 140 5,000 Mexico 900 1,000 10,000
Peru 1,000 1,100 11,000 Other countries 10 10 39,000
World total 8,200 7,600 320,000
Bismuth which is primarily produced as a by-product of metals like lead, tin, zinc etc has the following production statistics.
Production (in metric tones) Year 2008 2009China 5,000 4,500Mexico 1,170 1,200Peru 960 960Others 570 640Total 7,700 7,300
Source: Adapted from USGS Data
43%
24%
31%
2%
Bismuth consumption (2009)
Additives in metallurgy Fusible alloys,solders & ammunition
10.11.1 USES
It is extensively used in the pharmaceutical sector. It also finds use in the manufacture of low melting point solders and temperature sensitive electronic circuits apart from being used in free-machining steel. Low toxicity of Bismuth makes it a potential replacement of lead
10.11.2 PRICING
The price of Bismuth started 2010 at US$ 7.65 per pound and rose slightly throughout the year. In August 2010, Bismuth prices stood at US$ 8.40 per pound. The average price of Bismuth in 2010 was about 7% above that of 2009.
10.12. SELENIUM
Major Producers- Primary Selenium is recovered from anode slimes generated in the electrolytic refining of copper. Selenium metal is also produced as a by-product of lead, zinc, gold and platinum processing.
Reserves for selenium are based on identified copper deposits. Coal generally contains between 0.5 and 12 parts per million of selenium. Though, the recovery of selenium from coal is feasible but it does not appear likely in the foreseeable future.
World refined production and reserves (in metric tonnes) 2009 2010 ReservesUnited States W(withhold) W 10,000Belgium 200 200 -Canada 173 170 6,000Chile 70 70 20,000Finland 65 65 -Germany 700 700 -Japan 780 780 -Peru 45 45 9,000Phillippines 65 65 500Russia 140 140 20,000Other countries 43 43 23,000World total 2,280 2,260 88,000
Source: Adapted from USGS Data
10.12.1 THE MAJOR USES OF SELENIUM ARE
1. In glass manufacturing, selenium is used to decolorize the green tint caused by iron impurities in container glass and other soda-lime silica glass.
2. Used as a dietary supplement for livestock 3. It is also used as a fertilizer additive to enrich selenium-poor soils. 4. Selenium is used in thin-film photovoltaic copper indium gallium diselenide (CIGS)
solar cells. 5. Added to steel, copper and lead alloys to improve machinability.
India Scenario- In India Selenium is produced by Hindalco. It reported an annual production of about 36.810 tons in 2008-09. Selenium was also produced by Hindustan Copper Ltd (HCL) at its Ghatsila copper smelter but no production has been reported in the recent years. India imported around 164 tons of Selenium in 2008-09.
11A. 1 INTRODUCTION Iron is the most common and indispensable metal. Its applications over the years have broadened its realms to unimaginable proportions. Iron & steel are the crux for industrial development in the country. The vitality of the iron & steel industry largely influences the economic status of a country. Iron ore is the basic raw material used in the making of pig iron, sponge iron, steel and alloy steel. The iron & steel industry is the major consumer of iron ore in the country. This industry uses iron ore in lumps as well as fines after pelletization, sintering or briquetting. Sponge iron is another major consumer of iron ore. Sponge iron is used as a substitute in place of scrap in electric arc furnaces and in mini-steel plants. The other important iron ore consuming industries are cement, coal washeries and ferro-alloys industries. India has large reserves of good quality iron ore that can meet the growing demand of domestic iron and steel industry and can also sustain considerable exports. India is one of the leading iron ore exporters in the world. Next to processed diamond, Iron ore is the largest foreign exchange earner. Presently China is the largest importer of iron ore from India.
11A. 2 Global Scenario
11A. 2.1 Steel The global steel industry has been on a roller coaster since 2007. The booming market of 2004–07 rapidly declined during the global financial crisis. As a result, aggregate global demand from the key steel end-use markets — infrastructure, construction, and automotive — contracted by 7.4% year on year4 in 2009. The extreme lows of 2009 were followed by a steady recovery in demand and associated production as well as a re-stocking period. Indeed, during 2010, global demand for crude steel has rebounded to 2008 levels as investment in infrastructure and other steel-intensive projects increased. However, steel consumption in developed countries, such as European countries and the US, has not recovered to pre-crisis levels and the majority of the improvement in crude steel consumption emanates from emerging markets such as China and India. Demand for crude steel in Europe and the US is still 28% below what it was in 2008, and 33% and 43% lower respectively than in 20065.
Figure 11A.1: Global crude steel consumption trends
4 Apparent steel use (crude steel equivalent), Steel Sstatistical Yearbook, World Steel Association, 2010 5 World steel outlook, ABARE, September Quarter 2010
Source: ABARE — June quarter 2010, World Steel Association (World Steel), Ernst & Young analysis, 2010
On the other hand, crude steel consumption in China has grown considerably. In 2009, when consumption in every other country declined, China’s consumption still grew by 15% and has increased by a significant 48% since 2006. India, Brazil and Korea have all seen crude steel demand increase substantially since 2006 — India and Brazil by 24% each, and Korea by 12%.
The World Steel Association estimates that global steel consumption will grow by 5.3% in 2011. There is some debate amongst steel market analysts as to the extent of demand growth from China. Some foresee slower growth as the Chinese government tries to moderate its overheating economy, whereas others think it is just as likely that the Chinese government will keep its 8% GDP growth target in the medium term, which will mean that both investment in infrastructure projects and private spending will continue.
Figure 11A.2: Global crude steel production trends
Source: ABARE — June quarter 2010, World Steel Association (World Steel), Ernst & Young analysis
In the five years preceding the financial crisis, global steel production enjoyed a robust CAGR of 7% to reach 1,329 million tons in 2008. Steelmakers responded quickly to falling demand at the end of 2008 by cutting production. Global capacity utilization was cut from 86% in July 2008 to 58% by December 2008. For the first half of 2009, capacity utilization remained around 65% before rebounding to 70%–80% in the second half of 20096. In 2009, the US and the European Union suffered the sharpest drop in steel production, of 44% and 37% respectively7. The steady rise in steel demand in 2010 implies capacity utilization levels are back at around 77%. Steelmakers are predicting a more stable recovery of demand in 2011 and it is likely that global capacity utilization rates may inch back towards the highs of 2007 and early 2008.
6 JP Morgan estimates 7 ABARE, September 2010
Figure 11A. 3: Global capacity utilization trends
Source: Time to steel ahead — 2010, Ernst & Young, 2010
WORLD PRODUCTION TABLE 11A.1– Crude Steel Production (By countries)
RAW STEEL Country
2009 2010 United States 59 90
Brazil 34 33 China 568 630 France 13 16
Germany 33 44 India 57 67 Japan 88 110
Korea, Republic of 53 56 Russia 59 66
Ukraine 30 31 United Kingdom 10 10 Other Countries 236 250
World Total (rounded) 1240 1400
From USGS – MCS Jan 2011 Steel production has recovered in 2010 and crude steel production reached a record high of 1.4 billion tons. World pig iron production was 1032.6 MT in 2010, representing an increase of 13% over 2009 (913.9 MT). Comparatively, world production of Direct Reduced Iron (DRI) in 2010 was 70.4 MT, against 64.5 MT in 2009. India remains the leading producer of DRI with 23.4 MT in 2010. Iran, Qatar, Russia and Saudi Arabia were the other significant producers of DRI. The MIDREX process continues to be the most important for DRI production, accounting for 60% of the world total. Regional production A large proportion of global growth in crude steel production is from China. The World Steel Association recorded Chinese crude steel production of 568 million tons in 2009, a rise of 13.4% year on year. China produced 630 million tons in 2010, a rise of around 11% year on year. In early 2010, there were major concerns that since Chinese steel production was growing so rapidly, it would put pressure on international steel markets. However, the corresponding growth in Chinese domestic demand has alleviated some of that concern. In addition, the gap between international steel prices and Chinese prices has narrowed, reducing the attractiveness of importing Chinese steel. Chinese production has been cut in the second half of 2010 to
ensure the attainment of energy-efficiency targets under the Eleventh Five-year Plan and as the Government promotes consolidation in the sector.
Outlook for 2011 — cautiously optimistic for the global steel sector The outlook for 2011 is cautiously optimistic, as the likelihood of a double-dip recession has declined. According to Global Insight8, consumer spending and business investment are likely to become key drivers of economic growth, as support from inventory cycles and fiscal stimuli diminish. Strong growth in emerging economies is likely to pull global recovery along in the short term. In many emerging economies, it seems that the recovery has entered a self-sustaining phase, relying on consumption and fixed investment rather than restocking. The modest recovery in more advanced economies remains vulnerable to ongoing volatility, sovereign risk and financial uncertainty. It is, however, predicted that much of this volatility and uncertainty will ease in the beginning of 2011 and there should be an increase in industrial growth by the second half of the year. Overall, the International Monetary Fund (IMF) is predicting a growth of 4.2% in the world’s real GDP in 20119. Resource security remains a major concern for China, especially as it is the largest importer of iron ore in the world. It also imported 36 million tons of coking coal in 2009, up almost fivefold from 200810.
Figure 11A.4: Outlook for steel production and consumption to 2015
Source: ABARE, Ernst & Young analysis, September 2010
The emergence of China as a major commodity producer, as well as consumer, has led to a paradigm shifts in the iron ore market. Although China has around 20 billion tons of iron ore reserves, the quality of the ore is poor (~30% iron content). The country has used up almost all of its iron ore reserves with more than 50% iron content, making it dependent on Australia and Brazil to meet its requirements. Australia, which boasts of huge high quality iron ore reserves, is presently the dominant player in the global iron ore market, and its access to ports gives it the required edge over other exporting countries. In contrast, both Russia and Brazil struggle with the lack of sufficient infrastructure to get increasing amount of iron ore to market. Last year, more than 90% of the Brazilian exports exited through the ports owned by Vale and CSN, with small iron ore companies struggling due to a lack of infrastructure to support their exports. There was a structural change in the pricing of iron ore in early 2010, with steelmakers agreeing to the demand of mining majors to exchange the annual benchmark negotiations with quarterly contracts. The quarterly prices are determined such that upcoming quarterly prices are the average spot price for the previous quarter. Going forward, this volatility in quarterly pricing of raw materials might lead to convergence of quarterly contracts to monthly contracts, which ultimately may lead to spot pricing of iron ore. The move to quarterly contracts was driven by the current chronically tight supply of iron ore, which gave miners increased negotiating power. For March 2011, contract prices for 62% iron ore content (Free on Board, Australia) are estimated to be approximately US$ 137 per ton, which converts to an average price of US$ 132 per ton in Fiscal Year 2010, registering a rise of 119% Y-o-Y.
Figure 11A.5: 2008–09 iron ore production and reserves
Source: U.S Geological Survey, Mineral Commodities Survey, Raw Materials Group, Stockholm/ www.rmg.se, January 2010 This iron ore shortage and resultant high prices has led steel producers to increasingly seek captive iron ore supply to boost self-sufficiency and reduce volatility from their business. In the first 11 months of 2010, 16 of the 68 steel transactions were to secure iron ore and coal supplies. Over the next 5–10 years, ArcelorMittal, Usiminas and Gerdau plan to be self-sufficient and not rely on third-party iron ore. 11A.2.3Outlook for iron ore Based on current scenario for 2011, prices are likely to remain stable with an upward bias, while supply will still be tight. Beyond 2011, the market is expected to remain relatively tight and prices are likely to ease only in 2013 and 2014 when significant new production is due to come on stream.
Iron ore deposits are distributed in different parts of the world. The world reserve base of
crude iron ore is estimated to be around 800 billion tonnes containing more than 230 billion
tonnes of iron, and the reserves are estimated to be 180 billion tonnes containing 87 billion
tonnes of iron. The world reserves of iron ore by principal countries are given in Table 1
below.
There has been significant addition to the reserves, about 20 billion tones, in last one year, mainly in Australia (4 BT), Brazil (13 BT), Canada (4.6 BT), and China (1 BT). While Australia, Brazil, Sweden and India enjoy high-grade deposits, China, Canada, Kazakhastan, Russia, US and Ukraine have low-grade (30-35% Fe) deposits.
Table 11A.2. World (principal countries) Reserves of Iron Ore (Million Tonnes)
Country Reserves
Crude Iron
World: Total (rounded ) 6,900 2,100
Australia 24,000 15,000
Brazil 29,000 16,000
Canada 6,300 2,300
China 23,000 7,200
India 7,000 4,500
Iran 2,500 1,400
Kazakhstan 8,300 3,300
Mauritania 1,100 700
Mexico 700 400
Russia 25,000 14,000
South Africa 1,000 650
Sweden 3,500 2,200
Ukraine 30,000 9,000
USA 4,000 2,400
Venezuela 11,000 6,200
Other countries 180,000 87,000
(Source: Mineral Commodity Summaries, 2011) India’s resources of iron ore as per UNFC system as on 1.04.2010 are estimated at 28.52 (P) billion tonnes while reserves are estimated to be 8 billion tonnes. (IBM)
The gross production figures of China, as reported in Table 2 should be understood based on the grade – the production equivalent to world average grade being only 222.7 and 315.4 million tonnes during 2009 and 2010 respectively. The corresponding world total production of equivalent grades would thus be about 1550 and 1827 million tonnes respectively.
The major importers of iron ore are China, Japan, Korea and Germany, accounting for about 80% of world trade in iron ore, China itself accounting for 60% of world imports.
Table 11A.3. World Production of Iron ore
(By principal countries) (In ‘000 Tonnes)
Country 2005 2006 2007 2008 2009 2010
World (Total) 1567000 1831000 2052000 2214000 2248000 2576400
Australia 261796 275042 299038 32435? 394069 432800
Russia 95100 102000 105000 99900 92000 101000South Africa 39642 41326 42101 48983 55313 56900Sweden 23255 23302 24714 23888 17677 25300
Ukraine 69456 74000 77930 72688 66452 79900
USA 54300 52700 52500 53600 26000 49500Venezuela 21179 22100 20650 21500 21000 14000Other Countries
61029 62976 67139 378570 62767 78100
Table 11A.4. World Iron Ore Export
(In ‘000 tonnes) Country 2005 2006 2007 2008 2009 2010
Australia 240,057 247,415 266,884 309,300 363,327 402900
Brazil 224,162 242,527 269,448 281,683 266,040 310900
India 89,585 93,000 104,270 105,865 117,000 95900
South Africa 25,818 26,161 30,336 32,800 44,561 48000
Ukraine 19,473 20,218 20,748 22,800 27,622 32700
Sweden 17,799 18,248 19,379 17,800 15,783 20900
Russia 25,502 22,522 11,167 9,184 20,351 22300
Others 15,604 49,909 58,768 60,568 50,316 60900
World Total 658,000 720,000 781,000 840,000 905,000 1070700
(Source : World Mineral Production 2005-09, USGS, MCS, Jan 2011and UNCTAD Iron ore report 2010-2012))
Price trends – The prices of iron ore internationally have firmed up in last 2-3 years and are currently ruling at $ 140-150 per tonne. Future outlook for prices is also robust though in the medium term these may slightly soften.
11A.3 Indian Scenario The Indian steel industry has witnessed robust growth during 2005–10, with production (crude steel) and consumption (finished steel) registering a CAGR of 7.05% and 8.5%, respectively. India was the world’s fifth largest producer of crude steel in 2009, growing to become the 4th largest producer during 2010. This growth has been driven by capacity expansion coupled with improved utilization. Even in 2011,35.64 million tonnes has been produced in the first 6 months which, when annualized, translates to about 71 million tonnes for 2011.. Over the past few years, consumption has been primarily driven by continuous increase in infrastructure-related investment, leading to higher demand for steel. During the recent financial crisis, the Indian steel sector remained resilient due to strong domestic demand from Indian end users. Consequently, in 2009, when global steel consumption witnessed a year on year decline of 8.5%, steel consumption in India remained flat. However, the country’s per capita consumption is still one of the lowest in the world, presently standing at around 51.7kg per capita vs. 427.4kg for China and a global average of approximately 202.7kg.
Source: Annual report 2009–10, Ministry of Steel, Government of India Data annualized until December 2009
11A.3.1 Capacity additions not keeping pace with rising demand The Indian steel industry faces a supply deficiency as capacity increase has lagged behind increase in consumption. Large greenfield projects have not been set up in India over the past few years due to regulatory, social and infrastructural bottlenecks. Capacity additions in the short term are primarily brownfield projects by existing players. Figure11A.7: Capacity, production and utilization numbers (2005 – 2010) for crude steel
11 In India, the financial year (FY) runs from 1 April to 31 March
Source: Annual report 2009–10, Ministry of Steel, Government of India *Data annualized until December 2009
11A.3.2 India imports steel as supply lags demand India has been a net importer of steel since 2007 and the demand/supply gap is expected to widen over the next five years. India imported 2.1 million tonnes of steel during the April-June 2010 period, giving an indication that imports during 2010 may be higher than the last year. Over the next three years, around 20 million tonnes of brownfield expansions are expected to become operational, which may reduce steel imports in the medium term. In the long term, due to the difference between demand and supply, India may still remain a net importer of steel as most of the planned greenfield expansions have been delayed due to land allotment laws and environmental clearances issues.
Table-11A.5: India and International Trade Total Exports Total Imports Net Imports India 5.6 8.3 2.7 World 326.3 326.3 - India’s Global Rank 18th 12th 11th India’s Share in trade 1.7% 2.5% -
Figure 11A.8: Net export/import for finished steel
Source: Annual report 2009–10, Ministry of Steel, Government of India *Data available for April—December 2009
The major players in the industry, such as Tata Steel and SAIL, have vertically integrated to secure raw materials. For example, Tata Steel is self-sufficient in iron ore and coking coal supply, and SAIL is self-sufficient in iron ore but imports most of its coking coal requirement.
The rest of the players in the Indian steel industry have varying degrees of self-sufficiency and depend on raw material suppliers to meet their requirements. Iron ore miners, such as NMDC and Sesa Goa, represent around 35% of the iron ore production in India. Though iron ore production exceeds domestic demand, its pricing is impacted by influential global majors. On the other hand, coking coal suppliers have considerable influence on the steel industry as India has a shortfall of coking coal and imports more than 70% of its requirement. The cyclical and volatile nature of prices for both commodities is a major risk to non-integrated steel players.
11A.3.3 Strong domestic demand drivers
The key variables for steel consumption in any country are the growth rates of sectors such as manufacturing, consumer durables, construction, capital goods and services. The demand drivers in India continue to be strong and indicate far higher consumption of steel in coming years. 11A.3.4 Infrastructure: the key driver of steel consumption in India The construction and infrastructure sector is the largest consumer of steel in India, accounting for 61% of total steel consumption in 2008–09. According to Planning Commission projections, total investment in the infrastructure sector in the Eleventh Five-year Plan (2007–12) is around US$450 billion and the Twelfth Five-year Plan (2012–17) expects investment of approximately US$1 trillion, indicating that demand for steel from the sector will remain strong. In FY10, an expenditure of around 7.2% of GDP was spent on infrastructure and the Government aims to increase this to around 9% of GDP by 2014.
Figure 11A.9: Steel consumption
Source: Steel products, Opinion, Crisil research, July 2009
Table – 11A.6: Producer Group Wise Production of Crude Steel, 2006-07 to 2010-11 PRODUCER PRODUCTION OF CRUDE STEEL (Million Tonnes) 2006-07 2007-08 2008-09 2009-10 2010-11 P SAIL 13.51 13.96 13.41 13.51 13.76 RINL 3.50 3.13 2.96 3.21 3.24 TATA STEEL 5.17 5.01 5.65 6.56 6.86 MAIN PRODUCERS TOTAL
GAS BASED 4545 5265 5845 5516 6148 5642COAL BASED 10280 13080 14531 15575 18178 21067% Share Coal based 69.3% 71.3% 71.3% 73.8% 74.7% 78.9%
TOTAL 14825 18345 20376 21091 24326 26709 11A.3.5 Steel The growth of steel is expected in 3 major areas, viz (i) construction and Infrastructure; (ii) automobile production; and (iii) manufacturing of steel container for food and preservation sectors. Demand for steel, as measured by apparent consumption (Production + imports – Exports) increased by 8.8% during the first four years of 11th plan period (2007-11), with significant variations in yearly growth rates (Table 29A). This growth in demand was especially sluggish during 2008-09 as a result of the global meltdown leading to a sharp decline in demand. Despite this adverse market conditions, the Indian Steel Industry managed to exhibit a high degree of resilience and did well to the counter-cyclical measures adopted by Government and was able to make a recovery in 2009-10 and 2010-11.
Source :JPC Some of the other significant features of the growth pattern / performance of Indian Steel industry during the first four years of the 11th plan included the following:-
Additions to steel capacity during the 11th plan have primarily come from brown-field expansions. Green field steel projects in India have been facing various implementation constraints such as delays in land acquisition, environment and forest clearances, and allocation of raw material linkages.
The private sector continued to play an important role in bridging the demand-supply gap during the 11th plan. The share of the private sector in total crude steel production increased from 66.54% in 2006-07 to 75.57% in 2010-11. The share of the secondary sector has also increased from 56.36% in 2006-07 to 65.72% in 2010-11.
As regards the coal based sponge iron industry, it showed significant slowdown in growth rates during the 11th plan period vis-à-vis the 10th plan (2002-07) period. Non-coking coal is also increasingly becoming difficult to procure for sponge iron production due to inadequate supplies from Coal India Limited (CIL). One important reason for this inadequate supply has been CIL’s compulsion to cater to the demand from designated priority sectors like power generation. While coal production in the country has been sluggish, the availability of sized iron ore (5-18mm) used in sponge iron production too has moved from abundance to shortage.
Despite various constraints, the overall capacity utilization of the domestic steel industry has remained high during the 11th plan i.e. around 88-90%
11A.3.6 Steel Demand during 12th Plan Period Demand for steel is closely linked with the production activities in various sectors of the economy. Being the basic material for development of economic and social infrastructure, it is used for producing capital goods as well as the final consumption goods. As a result one may find a direct relationship between economic growth as measured by Gross Domestic Product (GDP) and the demand for steel. This same methodology to correlate GDP and steel demand was adopted while making the projections of steel demand for the 11th Plan period, and it gave fairly accurate estimates with an error of only 4% which can be explained by a lower actual GDP growth of 8.2% during the first four years of the plan against an assumed growth rate of 9%. Similarly, for 12th Plan, a steel consumption growth rate of 10.3% has been assumed based on a GDP growth rate of 9%. Corresponding steel consumption and production projections for the 12th Plan are tabulated below.
Table 11A.9– : Projected demand vs production/capacity for the 12th Plan (2012-17) (Figures in million tonnes)
The total installed capacity for crude steel in the country was 78 million tonnes during 2011
and therefore the incremental capacity required by the terminal year of 12th plan (i.e. by 2016-
17) is 64.3 million tonnes implying an annual average increase of 10.7 million tonnes.
The comparison of crude steel requirement and build up of crude steel capacities suggest that if the implementation of firm projects is on expected lines, the country will be able to meet its domestic demand comfortably. However, the country will not have sufficient surplus capacity to enable it to export finished steel in a substantial manner. If some of the projects get delayed, demand-supply situation will be tightly balanced.
11A.3.7 Resources India has substantial resources of iron ore, both in terms of quantity and quality,. concentrated in five different zones, spread over the states of Andhra Pradesh, Assam, Bihar, Chhattisgarh, Goa, Jharkhand, Karnataka, Kerala, Madhya Pradesh, Maharashtra, Orissa, Rajasthan and Tamil Nadu.. IBM has provisionally placed the total resources of iron ore, both hematite and magnetite, as on 1.4.2010 28,526 million tonnes. Of these, resources of Hematite, which is predominantly used for iron and steel making, are placed at 17,882 million tonnes comprising 8093 million tonnes (45.3%) under reserve category, and the balance 9299 million tonnes (54.7%) under resources category.
Table 11A.10 Reserves/Resources of Hematite (1.4.2010) by States (In ‘000 tonnes)
State Reserves Remaining resources
Total (as on 01-04-2010
As on 01-04-2005
Difference
All India (Total) 8,093,546 9,788,551 17,882,098 14630387 +3251711
(P) : Provisional Figure rounded off (Source: National Mineral Inventory as on 1.4.2010) Similarly, the total resources of magnetite are estimated to be 10,644 million tonnes. Magnetite resources of metallurgical grade (+38% Fe) and coal washery grade (64% Fe min.) are placed at 2,187.6 million tonnes (20.5%) and 8.5 million tonnes (0.08 %) respectively. Country’s 96.6% magnetite resources are located in four states namely, Karnataka credited with 7,812 million tonnes (74%) followed by Andhra Pradesh 1,464 million tonnes (14%), Rajasthan 527 million tonnes (5%) and Tamil Nadu 482 million tonnes (4%). The remaining 3.4% resources have been estimated in Goa, Kerala, Assam, Jharkhand, Nagaland, Meghalaya, Bihar and Maharashtra.
The following observations are made on the reserves and resources of iron ores:
1. In the last 5 years (from 01.04.05 to 01.04.10) hematite resources have increased by 3,252 million tonnes (1,089 million tonnes reserves and 2,162 million tonnes resources) despite a production of almost one billion tonnes. On the other hand, magnetite resources have remained largely static. Although IBM does not separately report magnetite production, it is believd to be negligiblel.
2. While 45% of hematite resources in 2005 were in lump form and 33% in fines form, in 2010 lumps increased to 55% while fines reduced to 21%. Similarly, high-grade (+ 65% Fe) hematite resources increased by 549 MT in 2010, medium-grade (< 65% >62%Fe) by 2,583 million tonnes in 2010, and low grade (<62%Fe) and unclassified resources of hematite increased by 118 and 239 million tonnes respectively. On the other hand, metallurgical grade magnetite, which is ~20% of the overall resources, increased by only 2 million tonnes in the 5 years period, while unclassified resources continue to be ~80% of the overall resources
3. Among the hematite rich states, Odisha contains the best quality deposits in terms of proportion of lumps as well as grade, followed by Jharkhand and Chhattisgarh, while Goa has poor quality (low grade as well as high proportion of fines), with low amenability to beneficiation.
4. Most of the iron ore deposits occur in hilly areas with significant proportion in tribal and forest areas. Almost the entire resources of magnetite occur in the ecologically sensitive Western Ghats.
5. The resources as per IBM as on 01.04.2010 are based on the threshold grade of 55% Fe. These will get significantly augmented once these are reassessed at the revised threshold of 45% Fe. The impact of this revision is that the miners are required to
separately stock the ore having less than 55% and more that 45% Fe ore and beneficiate and/or sell it at appropriate time.
6. With adoption of appropriate processing technology, BIF which was hitherto considered as waste will become an important source of iron ore. In addition exploration in hitherto unexplored areas will significantly augment resources.
11A 3.8 Major Iron ore deposits in different zones: Bara-Jamda sector in Jharkhand, Bailadila-Rowghat Hills range in Chhattisgarh and Bellary-Hospet in Karnataka are considered the biggest Hematite fields in the country. Major quantum of the resources of Magnetite is located in the southern sector, mainly in Karnataka. ZONE A: Bonai Iron Ore Ranges in Jharkhand and Orissa and in the adjoining areas in Eastern India with important deposits such as Chiria, Noamundi, Kiriburu, Bolani, Meghahataburu, Thakurani, Gua, Banspani, Baraiburu, Daitari, Gandhamardan and Malangtoli.
ZONE B: The north-south belt in Central India covering Chhattisgarh, Madhya Pradesh
and east Maharashtra localizing rich iron ore deposits such as Bailadila, Dalli-Rajhara, Mahamaya, Aridongri , Rowghat, and Surajgarh.
ZONE C: The Bellary-Hospet region of Karnataka where Donimalai, Ramandurg,
Kumarraswamy, NEB range, Ettinahatti, Belagal are the major deposits. ZONE D: Iron ores of Goa and Maharashtra (West) with North Goa, South Goa and Redi
deposits. ZONE E: Rich magnetite deposits such as Bababudan,Kudremukh and Kodachadri in
Karnataka. In addition, magnetite rich Banded-Magnetite Quartzite (BMQ) deposits also occur in parts of Andhra Pradesh and Tamil Nadu in South India.
Figure 11A.10 Location of Major Iron ore deposits in different zones
11A 3.9 Production India is among the leading producers of iron ore in the world. Indian production of iron ore constitutes around 10% of the world iron ore output. The production of iron ore constituting lumps, fines and concentrates was estimated at 218.64 million tonnes in the year 2009-10, and 208.11 million tonnes during 2010 -11.
Figure rounded off. (P) – Provisional (Source : IBM) The following observations are made on the production of iron ore in the country:
1. Major producing States are Odisha, Karnataka, Goa, Chhattisgarh and Jharkhand accounting for 98% of the country’s production.
2. Public sector mines (like SAIL, NMDC etc.) now account for only 29% of total iron ore production, while 71% is from private sector (including Sesa Goa, Tata Steel, Essel Mining etc). Till 2002-03, publicsector used to be predominant producer, when it was overtaken by private miners. Production from Chhattisgarh is predominantly from PSUs while A.P., Goa, Madhya Pradesh have 100% private sector mines and states like Karnataka, Jharkhand are having majority production from private sector mines but with significant PSU mines also.
3. Almost the entire iron ore production is attributable to hematite.
4. In 2009-10, 319 iron ore mines were reported to be in operation, with an estimated cumulative production capacity of 350MT per annum. Many of the mines, particularly the public sector mines and large private sector mines are in various stages of significant capacity expansion. It is estimated that the gross mining capacity of iron ore will grow to approximately 500MT by the end of twelfth five year plan.
5. The figures relating to captive v/s non-captive production indicate that major proportion of iron ore production comes from non captive mines. The largest of these is National Mineral Development Corporation (NMDC).
6. Table 13 indicates that proportion of lumps in the production increased to a maximum of 47% during 2006 – 07 and has been reducing since then, coming down to 39% during the year 2010 – 11.
7. Goa produces very low proportion of lumps and high grade ore, and with practically no steel production capacity, almost the entire production of iron ore from this state has to get exported.
8. Other states produce varying amounts of fine low grade iron ore during the process of mining which can not be consumed by the steel producing units because of technological constraints. The only outlet for these fines is through exports for which China provides a ready market.
9. Some of the mines, particularly the large ones (like Tata Steel, NMDC, SAIL etc.) have their own beneficiation facility for upgrading fines to suit the requirements of steel plants.
10. While most of the steel plants have sintering facility to utilize some of the fines produced in their mines, some others have started installing pelletisation plants to be able to utilize more fines which are not suitable for sintering.
11. Notwithstanding the above, there is a large surplus of iron ore produced in the country (over and above the consumption by the steel sector) which is exported.
11A.3.10 EXPORT / IMPORT India has huge and good quality of iron ore that can meet the demand of domestic iron and steel industry and can also sustain considerable exports. India is one of the leading iron ore exporters in the world , with China being the largest importer. Iron ore is the largest foreign exchange earner in India among all other minerals.
Table 11A.11 Indian Export of Iron Ore from 2005- 2010 (Country wise)
(Million tonnes)
Country 2005-06 2006-07 2007-08 2008-09 2009-10 2010 – 11
China 74.13 80.16 91.98 97.85 109.3 89.726
Japan 10.33 8.63 7.70 5.43 5.87 5.446
S. Korea 1.32 1.91 1.76 0.99 1.32 1.513
Europe 2.10 2.07 1.62 0.76 0.72 0 .670
Others 1.25 1.02 1.21 0.84 0.17 0.305
Total 89.27 93.79 104.27 105.87 117.38 97.660
(Source : IBM) Table 11A.12 Indian Export of Iron Ore from 2005- 2010 (Port-wise)
The export duty (20%) for iron ore is maximum when compared to other major iron ore producing countries and the same is shown in the figure given below:
Figure 11A.10 Comparison Royalty Rates and Export duties for iron ore
As of now, approximately more than 70% of export realization is being incurred on various heads by the miners. 11A.3.12 Import of iron Ore Import of iron ore is negligible. The imports in 2007-08 and 2008-09 comprised mostly (99%) iron ore pellets from Bahrain and very small amounts (<1%) of Pyrites from Finland and Germany. The total import of iron ore during 2009-10 was 8.97 lakh tonnes.
Table 11A.14 Export and Import of Iron Ore 2000-01 to 2009-10(P)
(in '000 Tonnes) Year Export Import
2000-01 20162 487
2001-02 23086 395
2002-03 57094 520
2003-04 51498 1587
2004-05 87285 485
2005-06 84046 611
2006-07 91423 483
2007-08 104502 293
2008-09 105980 69
2009-10 (P) 101531 897
2010 – 11
Note: figures are rounded off (P) – Provisional (Source : IBM)
The following observations are made on the export/ import production of iron ore in the country:
1. India has been exporting significant tonnage of iron ore (predominantly low grade fines) in the last five – six years reaching a peak of 117 MT in 2009 – 10 but dropping sharply to 97 MT in 2010 – 11.
2. During the year 2010 – 11, the exports dropped by 20 MT resulting from the ban on exports imposed from July 2010 by the state of Karnataka and subsequently imposition of uniform 20% export duty on high grade as well as low grade fines with effect from March 01, 2011. The full impact of these measures is expected to be felt during the year 2011 – 12 when both the production and exports are expected to fall drastically.
3. While there was a ban on exports in Karnataka, mines continued to produce iron ore. The lumps were sold to the domestic steel producers but only limited amount of fines could be sold, resulting in accumulation of huge stocks of fines in almost all the mines.
4. On the other hand, in the sate of Goa, booming demand from China resulted in evacuation of fines, and even old stocks of low grade fines, thus reducing significantly environmental threats as well as earning foreign exchange for the country from an otherwise unusable resource.
5. Since generation of iron ore fines is an integral part of the process of iron ore mining, it is imperative that fines are either consumed by the domestic steel users (after beneficiation and agglomeration) or sold in the export market. The domestic market is unable to consume significant quantities of these fines since iron ore production is more than double of the requirement of steel industry and also since beneficiation and agglomeration facilities are not available. Therefore, the steel producers are not in a position to consume the entire indigenous iron ore production including development of necessary beneficiation and agglomeration facilities. The exports, particularly of low grade fines, are essential to sustain the production of lumps and other high grade ores.
6. There is a significant pelletisation capacity meant for exports since export of pellets has been exempted from the export duty.
7. India is the only country which has imposed 20% export duty on iron ore. This needs reviewing particularly for low grade fines which needs to be exported for reasons mentioned above. With 20% export duty, the export of low grade fines may become unviable.
11A 3.13 CONSUMPTION
Table 11A.15 Reported Consumption of Iron Ore ( ‘000 tonnes)
Industry 2004-05 2005-06 2006-07 2007-08 2008-09 2009-10
(P) All Industries 55348 60518 78601 85278 87412 90617
Alloy steel 418 418 291 291 291 291
Cement 985 950 928 1022 1069 1166
Coal washery 48 48 44 43 34 34
Ferro-alloy 5 5 5 5 8 8
Iron and steel 37766 40166 47978 51306 52262 53067
Sponge iron 16125 18928 29352 32608 33744 36048
Others 1 3 3 3 3 3
Note : Figures rounded off. Source : Indian Bureau of Mines
11A 3.14 Assessment of Iron Ore demand during 12th Five year plan period: About 98 per cent of the iron ore globally is estimated to be consumed in the production of
iron and steel. This is most likely to be true for India as well. Therefore, the iron ore demand
will largely be based on the production of iron and steel within the country. The estimates are
also for the iron and steel industry only. The likely production of crude steel by the end of
the terminal year of the 12th Five year plan ( 2016‐17) may touch 131.9 million tonnes. The
steel industry capacity is likely to rise to 146.6 million tonnes from the existing level of 78
million tonnes ( March 31, 2010‐11). The year wise capacity vis‐à‐vis production of crude steel
as estimated are as under:
Table 11A.16 Estimation of Crude Steel Capacity and Production during
12th FY Plan Period
Million tonnes
Year Crude Steel Capacity Crude Steel Production
2011‐12 84.38 75.94
2012‐13 95.80 86.2
2013‐14 107.4 96.70
2014‐15 119.7 107.70
2015‐16 133.4 120.10
2016‐17 146.6 131.9
Source: based on estimated production of iron and steel. In addition, the country will produce pig iron on standalone basis largely for use in the
foundries. The country is expected also to produce pellets for exports. The total iron ore
consumption within the country will depend on the total of crude steel production, pig
iron for merchant sales and pellets for exports.
Table 11A.17 Estimation of Demand for Iron Ore during 12th FY Plan Period
(Qty in Million tonnes) 2011-
12 2012-13 2013-14 2014-15 2015-16 2016-17
Crude Steel Production
75.94 86.2 96.7 107.7 120.1 131.9
Pig Iron Production 9.3 10.4 11.6 12.9 14.2 15.1Total Iron Ore Requirement
11A 3.15 Railway Freight Despite the immense opportunity offered, the tariff policies of the Indian Railways towards the iron and steel and more particularly iron ore miners has been highly skewed and discriminatory.While the iron ore constituted just 7.4% (net tonne-km) of total freight movement, in terms of revenue it contributed 13.5% of the total in FY2011 . This implies that freight charges for iron ore are almost (x1.80) double that for other commodities. A closer analysis reveals that this primarily on account of the railways charging penal rates (x 3 to 8) for export consignments as compared to domestic freight. 11A 3.16 Price trend of Iron Ore As mentioned earlier, iron ore is consumed domestically in steel production or exported mainly to China. For the purpose of exports, the international prices govern the trade.For domestic consumption, there is a significant chunk of iron ore being produced and consumed by captive mines owned by steel companies. For non-integrated steel plants, the prices are governed by the grade, lead distance from mines to steel plant, and the tax/duty structures and other non-monetary factors e.g. lumps verses fines. However, domestic trade is increasingly getting aligned to international prices of iron ore
There should be a free market system for Iron ore pricing – currently a large contribution is made to the government via royalties/taxes
SOURCE: India Stat, RBI, NCAER draft report “A study of Contribution of Goan Iron Ore Mining Industry”, June 2010
Contribution to State government Contribution to Central government
9,572
20,362 260 30,194
Port charges
Export duty
TotalCorporate tax
+3,770
357
1,804 5,950
VAT/ CST TotalRoad tax and cess
Royalty Barge tax
19
FY 09‐10, INR crore FY 09‐10, INR croreIn addition `15,400 crores is the contribution to railways revenues
Figure 11A.11 Contribution to the government via royalty/taxes
11A 3.17 Pellets & Sinter Plants: Pellets along with sinters have resulted in growth in utilization of iron ore fines and blue dust. Information on capacity and production of pellets and sintering plants is given below:
Table 11A.18 Installed Capacity of Pellet/ Sinter Plants
(Source : IBM) 11A 3.18 Pig Iron: Pig iron is one of the basic raw materials required by foundry and casting industry for manufacturing various types of castings for the engineering sector. The post-liberalisation regime has witnessed expressions of interest from a large number of entrepreneurs for setting up mini-blast furnaces for production of hot metal/pig iron. Total production of pig iron in the country in 2008-09 was 6.21 million tonnes. The contribution of private sector units in the
overall production of pig iron in the country continued to increase and accounted for about 91% production in 2008-09. 11A 3.19 Sponge Iron: India is the largest producer of sponge iron in the world. The growth of sponge iron industry during the last few years in terms of capacity and production has been substantial. The installed capacity of sponge iron increased from 1.52 million tonnes per annum in 1990-91 to around 30.9 million tonnes in 2008-09. Production has increased from 0.9 million tonnes in 1990-91 to 21.09 million tonnes in 2008-09. There were 324 sponge iron units in the country. Out of these, 3 gas-based units had a capacity of about 8 million tonnes per annum and the rest were coal-based units. Sponge iron is a good substitute for scrap which is required by the electric arc furnaces and induction furnaces or mini-steel plants in the country. The indigenous availability of metal scrap is not sufficient to meet the domestic demand. Therefore, scrap has to be imported. Sponge iron is produced by direct reduction of high-grade iron ore or pellets to metallic iron ore in solid state by using coal or natural gas as reductant. It is also known as Direct Reduced Iron (DRI) or Hot Briquetted Iron (HBI). Specifications of iron ore consumed by major sponge iron plants are as follows: 11A 3.20 Iron & Steel Scrap
Iron & Steel scrap is one of the essential requirements for manufacture of steel in mini-steel industry. It is also consumed by some major steel plants. Scrap-especially from the ship breaking industry-supplies substantial quantity of re-roll able steel and steel scrap for the iron & steel industry. Iron scrap is available in the country in the form of pressed bundles, a mixture of used steel components (called as a commercial scrap), turnings and borings and heavy melting scrap. These are generated by industries of all sectors like automobiles, railways and engineering workshops. The collection and processing of scrap in an organised manner is undertaken by a few units in the country. In the local market, scrap is supplied by dealers who in turn arrange to have scrap collected manually or through sub-dealers. The consumption of scrap is mainly reported by Induction Furnace and Electric Arc Furnace units, integrated steel plants and alloy steel & foundry industries. Scraps are used in the steel sector after recycling. Recycling scrap helps in conservation of energy as re-melting of scrap requires much less energy than production of iron or steel from iron ore. Also, the consumption of iron and scrap by re-melting reduces the burden on land fill disposal facilities and prevents the accumulation of abandoned steel products in the environment. It increases the availability of semi-finished material which otherwise would have to be produced using the ore. Thus, it helps in conservation of natural resources.
11A 3.21 Demand supply scenario:
India has a substantial resource of iron ore to meet the domestic demand. There is an increase in demand due to substantial increase in the export market. The country has planned for capacity expansion on a large scale from its existing mines and development of new mines. Apart from expansion plans of present iron ore mines in all the sectors, development of newly identified Hematite and Magnetite deposits/mines are envisaged for further exploration wherever required and exploitation. However, iron ore is consumed more than 98% mainly in iron & steel and sponge iron industries. Ministry of Steel had constituted committee for projection of steel vis- a-vis iron ore by 2020. As per National Steel Policy 2005 (NSP), the domestic finished steel production was projected at 110 million tonnes by 2019-2020. The projection was based on the projected
Compounded Annual Growth Rate (CAGR) of 7.3% per annum in India which compares well with the projected national income growth rate of 7.8% per annum. As per the NSP, the projected demand of finished steel was 110 million tonnes. To meet the projected tonnage of the steel, the requirement of iron ore will be 190 million tonnes by 2020. For exports, additional 100 million tonnes of iron ore will be required. In all 290 million tonnes of iron ore will be required by 2020. The estimated production of iron ore would be about 255 million tonnes by 2011-12 and 374 million tonnes by 2016-17 at 8% growth rate. The apparent consumption is estimated at 138 million tonnes by 2011-12 and 218 million tonnes by 2016-17 at 8% growth rate. 11A 3.22 Exploration Requirement India is comfortably placed with regards to iron ore. However the relatively low per capity steel consumption figures offer ample scope for increase in steel production, and in turn of iron ore. Coupled with rapid urbanization (expected to exceed 500 million by 2025), and rising income levels on account of economic development, steel demand is expected to boost sharply in the country. This warrants additional domestic resources to be established through continued exploration efforts. With lowering of threshold value of iron ore to 45 % Fe, re-assessment of resource becomes imperitive to identify the quantum of increase, which is expected to be substantial. Simaltaneously the resource category (hematite and magnetite) needs to be upgraded to reserves.
11A 3.23 PRIORITY FOR DEVELOPMENT 11A 3.23.1 Technology Presently India requires contemporary technologies for:
‐ Exploration, ‐ Beneficiation and utilization of low grade resources, ‐ Framework to produce and utilize the substantial untapped magnetite resources
available. 11A 3.23.2 Value Addition Value addition is required for low grade ores. Low grade ore deposits that require beneficiation studies after mining could be granted to big companies who have already developed flow sheet for beneficiation/value addition. Govt. can encourage value addition products like ultra pure ferric oxide (UPFO) from blue dust iron ore. This UPFO is useful in electronic industry. Govt. can introduce some credit in the form of subsidies for encouraging the companies for research and production of these high values addition products. There are many titaniferous, vanadiferous magnetite deposits that are present in the country. Companies which come out with proposals for exploration technologies for such deposits should be encouraged. Low grade slimes accumulated in the tailing-dams could be beneficiated and utilized for making pellets. Therefore there should be zero waste concepts. 11A 3.23.3 Strategic Raw Material Security Most of the major steel plants in India are having captive Iron ore mines to feed to their plant and some of them are trying to get captive mines like RINL, JSW etc to meet their expanded steel capacity. The captive mines will provide raw material security to the steel plants for a particular period for a particular rated capacity but how long this will sustain and what benefit it brings to the primary users of steel in terms of price subsidy. The captive mine concept will
deprive world class mining companies of sustainable development of iron ore resources, development infrastructure and socio economic growth of tribals and backward areas. 11A 3.23.4 Acquisitions Abroad Many mining companies are going for acquisition of foreign properties. Govt. to Govt. dialogues can help public-public / public-private participation for acquisition of raw materials/ mines through bidding. There is competition among Govt. companies for the same property. Govt. should interfere in this area. Govt. to encourage PSU or major Indian companies for acquiring advanced mineral processing technologies abroad. Subsidies/tax benefits to the consortium that comes out with such proposal to the Govt. to be encouraged. 11A 3.23.5 Regulatory Issues Land Acquisition is a major problem. There is long delay in grant of PL and ML (3-7 years), cumbersome process involving movement of files in different ministries. Delayed grant of environmental/ forest clearances. Delay in notification by state governments sometimes take 2-4 years to identify the areas and tax related problems 11A 3.23.6 Social / Political issues This comprises of motivated campaigns by vested interest people, extremist activities and Illegal mining activities. 11A 3.23.7 Infrastructural Issues 11A 3.23.7 (a) Railways The constraints in this sector are lack of proper rail connectivity to ports , delays in completion of rail projects, Inadequate rail capacity for both domestic steel plants from and Iron ore mining areas, lower haulage capacity leading to higher lead time, frequent changes in rail freight, length of rake is small compared to other countries and most Indian operations still have manual loading systems. Mines being site specific and generally located in remote areas, evacuation of the mine produce involves transportation to nearest consuming centres/ ports. In the absence of widespread inland waterways, rail transport is the best option. However the railway network is not only saturated but grossly outdated. This is best illustrated by the following matrix. Particular/ Item Country Australia Brazil India Wagons/ Rake (Nos.) 682 210 68 Capacity/ Rake (Tonnes) 82,262 40,000 3840 Hauling speed (kmph) 225 120 60 Thus not only is there tremendous scope for improvement, but this is essential if the country is to achieve the targeted rate of growth. In the financial year 2011, the iron and steel industry provided a traffic movement of over 560 million tonnes for the Indian Railways, of which over 60% was in the eastern sector. It is projected that during the XIIth Plan period, the traffic opportunity would be 912 and 562 million tonnes per annum respectively on ‘all India basis’ and for the eastern sector, implying a growth of 60-65%.
Augmentation of rail infrastructure in the eastern region of the country is vital as most of the mines and steel plants are located in this area. The substantial growth in the rail traffic cannot be taken care with the existing rail network as the rail traffic density in eastern area is already high. SAIL has already taken up with the railways for construction of new rail lines as well as augmentation of existing railway lines for its expansion requirements. During 2010-11, total rail traffic of SAIL both inward and outward was about 61 millon tonnes and It is estimated that it will reach to a level of about 98 million tonnes at the end of XII five year plan period. 11A 3.23.7 (b) Road ways Most of the highways are narrow and congested. Some areas do not have even two lane roads. Road quality is poor (easily damaged due to heavy loads and high traffic).Road condition is poor due to paucity of funds. Lack of organized fleet owners is leading to lower professionalism. There is no access to low interest rate funds for investment in transportation sector. Low speed (average 30 - 40 KMPH) will bring down the high turnaround time. At present, most of the roads in the mining areas, both in the West Singhbhum district of Jharkhand, as well as Keonjhar and Sundergarh districts of Orissa are in dilapidated condition and are a major cause of hardship. It is very difficult to transport machineries and other materials like explosives, liquid fuels, spares to the mines. This delays the supplies of machineries and spares. For timely expansion and development of mines the road connecting to mines from the National Highways/major towns needs to be improved. 11A 3.23.7 (c) Ports In majority of ports handling iron ore, the loading is a mixture of mechanical and manual. (Visakhapatnam and Mumbai ports are fully mechanized). The mechanical iron ore loading plants are available only in Mormugoa, Chennai, and Vishakhapatnam. Some of these systems are old and do not operate at full capacity .Only few ports have the capacity of loading cape size vessels (more than 1,50,000 DWT) 11A 3.24 Recommendations
1. Railway freight should be consistent for commodities – both for exports or for domestic use
2. New mining Leases to be given through a time bound and transparent process – A single
window clearance and also for operation of existing projects
3. All lease holders must be required to explore their lease and declare the reserves according
to norms like UNFC norms every year
4. Experienced Mining corporates to be promoted in order to achieve conservation of mineral
and sustainable mining practice
5. Additional exploration is to be taken to convert resource in to reserve, for which necessary
statutory clearance, grant of PL on time bound basis is required.
6. Exploration is minimum, as grant of concessions is negligible, renewal/grants are pending.
Investment in mining industry is less. Speedy grant of concessions / renewals are essential.
7. Cluster mining concept to be adapted to exploit small deposits.
8. Development of infrastructure is required.
9. Investment to be encouraged for beneficiation of low grade ore for value addition.
10. Employment oriented investment to be encouraged like Value addition etc.
11. All our operations shall have to be cost competitive.
12. Govt. can encourage value addition products like ultra pure ferric oxide (UPFO) from blue
dust iron ore. This UPFO useful in electronic industry. Govt. can introduce some credit in the
form of subsidies for encouraging the companies for research and production of these high
values addition products.
MANGANESE ORE 11B. 1 INTRODUCTION Manganese ore is an indispensable raw material in manufacture of steel where it is used in the form of ferro-manganese and also as a direct feed to the blast furnace. The important non-metallurgical uses of manganese ore are in the manufacture of dry battery and chemicals. In agriculture, it is used as a micro-nutrient for the plants. Manganese is also used in the manufacture of drier for paints and varnishes. It has important application in ceramic and glass industry as colouring agent. About 90 to 95% world production of manganese ore is used in metallurgy of iron and steel. Manganese has no satisfactory substitute in its major applications. For use in ferro-manganese industry, besides manganese content, other important considerations are high manganese to iron ratio and a very low content of deleterious phosphorus. Carbon steel is the principal market accounting for 65 to 70% manganese consumption Manganese ores of major commercial importance are (i) pyrolusite (MnO2, Mn 63.2%); (ii) psilomelane (manganese oxide, containing water and varying amounts of oxides of Ba, K and Na as impurities; Mn commonly 45-60%); (iii) manganite (Mn2O3. H2O, Mn 62.4%); and (iv) braunite (3Mn2O3, MnSiO3, Mn about 62% and SiO2 about 10%). 11B. 2 World Scenario 11B. 2.1 Reserves The total world reserves are approximately 5200 million tonnes in 2009. The land- based manganese resources are large but irregularly distributed. The largest manganese reserves are in South Africa which account for 77% of world reserves. 96% of global production of manganese today is from barely 7 countries viz. CIS, RSA, Brazil, Gabon, Australia, China and India in decreasing order of tonnages raised annually. The global resource base is close to 12 billion tonnes. The world reserves of manganese ore are given in below: (Table 31)
Table 11B.1 World Reserves of Manganese ore (By Principal Country)
(Million tonnes)
Country Reserves Base
Australia 160
Brazil 57
China 100
Gabon 90
India 138
Mexico 8
South Africa 4000
Ukraine 520
USA -
Other Countries Small
World Total 5200
(Source: Mineral Commodity Summaries, 2009 & IBM) Note: * - As per UNFC Indian resource as on 1.4.2005 was 379 million tonnes As per the USGS Mineral Commodity Summaries 2011 the Reserves were 630 Million Tonnes. 11B.2.2 World Production: World production of manganese ore was 33.4 million tonnes in 2009, a 12.56% decrease as compared with that of 2008. China is the leading producer at 12 million tonnes, accounting for about 36% of the total world production. India’s production was about 2.44 million tonnes in 2009-10. The world mine production of manganese ore for last five years is given below:
Table 11B.2 World Production of Manganese ore (By Principal Country)
(in ‘000 tonnes) Country 2005 2006 2007 2008 2009
Australia 3829 4567 5289 4819 4444
China 7500 8000 10000 11000 12000
Gabon 2753 2979 3334 3250 2000
India 1906 2116 2697 2829 2396
Kazakhstan 2208 2531 2482 2485 2457
South Africa 4612 5213 5995 6808 4576
Other Countries 8292 7394 6103 7009 5527
World Total 31100 32800 35900 38200 33400
(Source: World Mineral Production, 2005-2009) 11B.2.3 Indian Scenario 11B.2.3.1 Resources Indian manganese ore deposits occur mainly as metamorphosed bedded sedimentary deposits associated with Gondite Series (Archeans) of Madhya Pradesh (Balaghat, Chhindwara & Jhabua districts), Maharashtra (Bhandara & Nagpur districts), Gujarat (Panchmahal district),
Orissa (Sundergarh district) and with Kodurite Series (Archeans) of Orissa (Ganjam & Koraput districts) and Andhra Pradesh (Srikakulam &Visakhapatnam districts).
Table 11B.3 State wise Principal Districts where Manganese ore resources are available. State Districts
Andhra Pradesh Adilabad, Srikakulam and Vizianagaram.
Goa North Goa, South Goa.
Gujarat Panchmahals and Vadodara.
Jharkhand Singhbhum (East) and Singhbhum (West).
Karnataka Belgaum, Bellary, Chikmagalur, Chitradurga, Dawangere, North Kanara, Shimoga and Tumkur.
Madhya Pradesh Balaghat and Jhabua.
Maharashtra Bhandara and Nagpur.
Orissa Bolangir, Keonjhar, Koraput, Rayagada, Sambalpur and Sundergarh.
Rajasthan Banswara
West Bengal Midnapur
Fig. 11B.1 Map of India showing Important Manganese occurrences
Indian manganese ores are preferred by many as they are generally hard, lumpy and amenable to easy reduction. In the Indian continent, the deposition of manganese must have taken place in varying environmental settings and by different geological processes but the sedimentary mode of formation far outweighed other methods such as supergene enrichment etc. These manganese ores have been selectively exploited either for direct use or for sweetening the otherwise available phosphor-rich ores. Favourable geological and geomorphological settings, existing well connected rail and road links, easy amenability of ores to beneficiation and liberal Government policies make the exploitation of Indian manganese deposits practically a no risk proposition
The total resources of manganese ore in the country as per UNFC system as on 1.4.2005 are placed at 378.57 million tonnes. Out of these, 138.15 million tonnes are categorized as reserves and the balance 240.42 million tonnes are in the remaining resources category. Gradewise, ferro-manganese grade accounts for only 7%, medium grade 8%, BF grade 34% and the remaining 51% are of mixed, low, others, unclassified, and not known grades including 0.5 million tonnes of battery/chemical grade. Manganese is a vital component of steel and over 90% of manganese produced world over is used for metallurgical purpose. Ore utilization mode and smelting practice vary from operator to operator but the general world-wide preference is to produce high-carbon ferro-manganese. Manganese ore is an important material required in Iron and Steel industry. Although India has substantial amount of metallurgical grade manganese ore but chemical grade and battery grade ores are rare. State-wise, Orissa tops the total resources with 40% share followed by Karnataka 22%, Madhya Pradesh 16%, Maharashtra 8%, Goa 5% and Andhra Pradesh 4%. Rajasthan, Gujarat, Jharkhand and West Bengal together shared about 5% of the total resources. Grade wise reserves/ resources and state reserves/resources of manganese ore in India as on 1.4.2005 are as follows :
Table 11B.4 Grade wise Resources of Manganese ore As on 1.4.2005 (By Grade)
(in ‘000 tonnes)
Grades 1.4.2005
All India (All Grades) 378569
Battery/Chemical 529
Ferro‐manganese 26619
Medium 31619
BF 130231
Mixed 10299
Medium and BF mixed 46918
Ferro‐manganese, Medium and Mixed 75064
Ferro‐manganese and BF 16681
Low (‐)25% Mn. 5171
Others 4091
Unclassified 24935
Not known 7010
Figures rounded off. (P): Provisional
Note: Updation of National Mineral Inventory as on 1.4.2010 is in under Progress. (Source: National Mineral Inventory)
Table 11B.5 Reserves/Resources of Manganese ore
As on 1.4.2005 (By Grade)
(in '000 tonnes)
Grades Reserves Remaining Resources
Total Resources
%
All India (All Grades) 138151 240418 378569 100.00
Battery/Chemical 55 474 529 0.14
Ferro‐manganese 8277 18342 26619 7.03
Medium 11631 19988 31619 8.35
BF 51787 78444 130231 34.40
Mixed 137 10162 10299 2.72
Medium & BF mixed 17286 29632 46918 12.39
Ferro‐manganese & BF 7481 8600 16081 4.25
Low (‐)25% Mn. 1572 3599 5171 1.37
Others 2250 1841 4091 1.08
Unclassified 6296 18639 24935 6.59
Not known 2258 4752 7010 1.85
Figures rounded off
(Source: National Mineral Inventory as on 1.4.2005)
Table 11B.6 Grade Classification of Manganese ore 1. Battery / Chemical grade Mn02 : 72% (min), Cu, Pb, Cr and Ni : in traces
Note : Updation of National Mineral Inventory as on 1.4.2010 is in under Progress. (Source : National Mineral Inventory)
11B.2.4 PRESENT MINING SCENARIO Manganese ore mining in India is carried out by open cast as well as underground methods.
The workings vary from shallow depth in lateritoid type deposits in Orissa, Karnataka, Goa
and Bihar to underground operations in deposits of a more regular nature found in Madhya
Pradesh, Maharashtra and Andhra Pradesh. The production of manganese ore at 3.62 lakh
tonnes during 2008‐09 increased by 35% as compared to that in the previous year owing to
increase in market demand.
There were 144 reporting mines during the year 2008‐09 as against 126 in the previous year.
Five principal producers (MOIL, Tata Steel, Orissa Manganese and Minerals Ltd, Sandur
Manganese and Iron ore Ltd and S.R. Ferro Alloys Ltd.) operating 25 mines contributed 78% of
the production. About 71% of the total production was reported by 14 mines, each producing
more than 50,000 tonnes per annum, while 13% was contributed by 10 mines being covered
in the production range of 20,000 to 50,000 tonnes. The remaining 16% was covered by 97
mines in the production range up to 20,000 tonnes.
As regards grade wise composition of production in 2007‐08, 54% of the total production was
of low grade (below 35% Mn) including ‘others’ category covering dust (fines: medium/high),
30% of medium grade (35‐46% Mn) and 13% was of high grade (46% Mn and above)
excluding dioxide. Production of manganese dioxide was 90868 tonnes during the year as
against 80659 tonnes in the previous year.
11B.2.5 Production The production of Manganese ore in 2009-10 was 2.44 million tonnes as against 3.62 million tonnes in the previous year. Madhya Pradesh and Orissa were the leading producing states accounting for about 25% each of the total production in 2009-10. Next in the order of production were Maharashtra (24%), Karnataka (13%) and Andhra Pradesh 10%. The remaining 3% of total production was reported from Goa, Gujarat, Jharkhand, and Rajasthan. As on 2008-09, there are 293 Mining leases with 21037.55 ha of land available for mining. The state wise production of manganese ore from 2005-06 to 2009-10 is given below:
Table 11B.8 State wise Production of Manganese ore (2000-01 to 2009-10)
(in ‘000 Tonnes)
State 2000‐01
2001‐02
2002‐03
2003‐04
2004‐05
2005‐06
2006‐07
2007‐08
2008‐09
2009‐10
All India 1595 1587 1678 1776 2386 1906 2115 2697 3620 2440
++ - Negligible/less than one thousand tonnes (Source: IBM)
Table 11B.9 Sector–wise Production of Manganese Ore
2000-01 to 2009-10(P) (In ‘000 tonnes)
Year Public Sector Private Sector Total
2000-01 949 646 1595
2001-02 880 707 1587
2002-03 931 747 1678
2003-04 948 828 1776
2004-05 1087 1299 2386
2005-06 989 917 1906
2006-07 1059 1056 2115
2007-08 1410 1287 2697
2008-09 1987 1633 3620
2009-10 (P) 1127 1313 2440
Figures rounded off
(P) : Provisional (Source: IBM)
11B.2.6 EXPORT OF MANGANESE ORE During 2008-09, India exported 2.05 lakh tonnes of Manganese ore. This quantity increased to 2.89 lakh tonnes during 2009-10(P). Exports were mainly to China, Bhutan and Japan. 11B.2.7 IMPORT OF MANGANESE ORE During the last five years i.e., 2005-06 to 2009-2010 import of manganese ore increased from 3000 tonnes to 7.98 lakh tonnes. South Africa (42%), Australia (41%), Gabon (5%) and Ivory Coast (3%) were the main suppliers of manganese ore.
Table 11B.10 Export and Import of Manganese Ore 2000-01 to 2009-10
(in '000 Tonnes) Year Export Import
2000-01 265 3
2001-02 248 8
2002-03 336 8
2003-04 240 6
2004-05 318 241
2005-06 237 13
2006-07 157 284
2007-08 208 686
2008-09 205 852
2009-10 (P) 289 798
Figures are rounded off. (Source: DGCI&S, Kolkata)
Table 11B.11 User’s Specifications of Manganese Ore in different Ferro-
manganese/Silico-manganese Name and location of plant Specifications of ore consumed
Tata Steel Ltd., Joda, Dist. Keonjhar. Mn : 43%, min. (for FeMn) 36% min. (for SiMn), Size : 10-75 mm (for FeMn & SiMn)
Tamil Nadu Silcal Metallurgical Ltd, Mn : 35-40% & above
Ramanujanagar, Coimbatore Size : 35 mm West Bengal Cosmic Ferro Alloys Ltd, Bankura.
Size : 75 mm
(Source : IBM) 11B.2.8 Consumption: The reported consumption of manganese in all industries during 2000-01 at 9.13 lakhs has increased over the years. In the year 2009-10 it has touched 30.25 lakhs. Silico-manganese (62%) and ferro-alloys (31%) industries together accounted for about 93% consumption followed by iron & steel (5.2%). The remaining was shared by battery, chemical, zinc smelter, alloy steel, glass, ceramic and abrasive industries.
Table 11B.12 Reported Consumption of Manganese Ore (2000-01 to 2009-10)
Data collected on non-statutory basis. ++ - Negligible/less than one thousand tonne (Source : IBM) The reported consumption of ferro-manganese in 2008-09 increased to 1.26 lakh tonnes from 1.21 lakh tonnes in the previous year. Iron & steel industry was the bulk consumer of ferro-manganese accounting for about 91% consumption in 2008-09. The remaining 9% was consumed in alloy steel, foundry and electrode industries. The consumption of ferro-manganese and silico-manganese are given below :
Table 11B.13 Reported Consumption of Ferro-manganese, 2006-07 to 2008-09 (By Industries)
(In tonnes) Industry 2006‐07(R) 2007‐08(R) 2008‐09(p)
All Industries 104000 121000 126000
Alloy steel 9600 9600 9600
Electrode 500 500 500
Foundry 1100 1100 1100
Iron & steel 92800 109800 114800
Sponge iron ++ ++ ++
Figures rounded off. Data collected on non-statutory basis. Includes actual reported consumption and/or estimates made wherever required. (Source : IBM)
Table 11B.14 Reported Consumption of Silico-manganese, 2006-07 to 2008-09 (By Industries)
(In tonnes)
Industry 2006‐07(R) 2007‐08(R) 2008‐09(p)
All Industries 178600 190500 189500
Alloy steel 3800 3900 3800
Foundry 100 100 100
Iron & steel 172400 184100) 183700
Sponge iron 2300 2400 1900
Figures rounded off. Data collected on non-statutory basis Includes actual reported consumption and/or estimates made wherever required. (Source : IBM)
Table 11B.15 End-use Grade Classification:
Battery Grade MnO2 (dry basis) Fe (dry basis) Cu, Pb, Cr and Ni Form of Ore
72% min. 7% max. Trace Gamma
Chemical Grade MnO2 Fe Cu
75% 1.5 max. Traces
Ferromanganese Grade
Mn Mn : Fe ratio P
46% min 4.6:1 min 0.2% max
Blast Furnace Grade
Mn P Al2O3 SiO2 Size
25-35% 0.2% max. 7.5% max. 13% max 10-40 mm
Medium Grade Mn 35-45% Conditional Ore Mn less than 25%
(Source : IBM) 11B.2.9 Industry Specifications of manganese ore for different consuming industries vary considerably from
dioxide to low grade ore. Manganese specifications primarily take into account the maximum
or minimum limits for manganese, phosphorus, Mn/Fe ratio, silica, alumina and permissible
limits for fines.
11B.2.9.1 Ferro-manganese The total production of various types of manganese alloys (high carbon ferro-manganese, medium carbon ferro-manganese and low carbon ferro-manganese) in 2008-09, as per Indian Ferro Alloys Producers' Association (IFAPA) was about 3.85 lakh tonnes 11B.2.9.2 Silico-manganese Silico-manganese is a combination of 60-70% Mn, 10-20% silica and about 20% carbon. As per the IFAPA, production of silico-manganese decreased to 8.91 lakh tonnes in 2008-09 from 9.11 lakh tonnes in 2007-08. MOIL is contemplating to set up two furnaces of 16.5 MVA capacity each, one for ferro-manganese and other for silico-manganese plant at Balaghat mine.
The major factor driving the production of manganese alloys is high production growth of low nickel austenitic stainless steel with India emerging as the largest producer of this steel where manganese is added substituting the expensive nickel.
11B.2.9.3 Iron & Steel Iron & steel industry was the second major consumer of manganese ore wherein manganese ore is used directly as a blast furnace feed. Details on consumption, specifications of manganese ore to major iron & steel plants in the country are as follows:
Table 11B.15 Consumption, Specifications of Manganese Ore In Different Iron and Steel Plants,
Size : 10 to 75 mm Mn : 31.25% Fe : 25.01% SiO2 : 4.62% Al2O3 : 6.62%
(Source : IBM) 11B.2.9.4 Dry Battery Consumption of manganese dioxide ore was reported about 29,700 tonnes in 2008-09, (excluding Electrolytic Manganese Dioxide). The demand was met through imports, supported by indigenous production of manganese dioxide and EMD. Dry battery industry also consumes EMD along with natural manganese dioxide ore. There are two plants producing EMD; one owned by MOIL in Bhandara district with 1,300 tpy capacity (under expansion to 1,500 tpy capacity) and the other of Union Carbide Ltd at Thane, Maharashtra, with 2,500 tpy capacity.
Table 11B.16 Indian Consumption vs Production of Manganese (Excess or shortfall) (Million tonnes)
2006-07 2007-08 2008-09
Production 2.12 2.69 3.62
Consumption 2.31 2.50 2.41
Excess/Short fall - 0.19 +0.19 +1.21
(Source : IBM) India imported high grade Manganese with low phosphorous from South Africa because of low price an te same was used for blending.Tonnage wise India is self sufficient but quality wise the country was not self sufficient 11B.2.10 Demand-Supply of Manganese ore: The estimated production is about 4.56 million tonnes by 2011-12 and 6.700 million tonnes by 2016-17 at 8% growth rate. The apparent consumption is estimated at 4.98 million tonnes by 2011-12 and 7.31 million tonnes by 2016-17 at 8% growth rate. The actual/estimate production and apparent consumption of manganese ore during 11th plan is presented below:
Table 11B.17 Demand-supply scenario of Manganese ore during 11th five year plan
(at 8% Growth rate) ( in ‘000 tonnes)
Year Production Apparent consumption2007-08 2697 3175 2008-09 3620 4267 2009-10(e) 3910 Actual – 3 MT (Table 42)2010-11(e) 4222 4608 2011-12(e) 4560 4977
11B.2.11 Substitute: Cost and technology mitigate substitution in major applications. However, for economic reasons, there is only limited substitution in minor applications in chemical and battery industries. The steel industry has, however, made great strides in economizing the use of manganese, largely through changes in steel-making techniques. 11B.2.12 Technology adopted: The deep-sea nodules can be a potential resource of manganese in the next century. There is a trend towards using lower grades of ores in ferro-manganese production. New steel-making practices and techniques are reducing the amount of manganese consumed in the process. However, counter balancing this to some extent is a trend towards higher manganese specifications for modern steels. 11B.2.13 RECOMMENDATIONS 1. Mn production in the country needs to be increased from the present level of about 3.0
MT to about 4.0MT/year in the 12th Plan.
2. The Manganese Ore resources are distributed over many states, of which the important
are Orissa, MP, Maharashtra and Karnataka. As per UNF Classification, the above
mentioned states have potential reserves of manganese ore. Presently only 36% of the
resources are in the mineable range, in reserves category and the remaining i.e. 64% are
in resources category, which needs suitable techno‐economic measures or additional
exploration to convert into reserves. It is the demand of time, (for proper assessment of
investment and schedule of production) to exploit the resources in tune with projected
demand of steel. Priority needs be given to convert resources in to reserves prior to
depletion of present reserves. Pockets of scattered deposits are uncertain in nature and
therefore many a time mining strategies fail if they are not scientifically investigated.
3. The National Steel Policy highlighted the growth of steel production by 2020. Though the
manganese consumption has drastically reduced from 45 kg. per tonne of steel to 30 kg.
per tonne of steel, its vital role in steel making is co‐status, as there is no substitute for
manganese. The current market or technology trend speaks; the medium grade
manganese is being consumed more as compared to high grade manganese ore. The
requirement of manganese ore to cope up with envisaged steel production trend reflects
the demand gap, which has to be resolved by enhancing the production of existing mines
and by opening additional virgin deposits including the acquisition of mines abroad.
4. There is a need to increase the availability of manganese ore commensurate with
projected steel production in India.
5. Improvement of quality and recovery of manganese ore by beneficiation and sintering
processes is required. Import of low Phosphorous and high Mn could be considered for
blending as the Mn ore in India has high Phosphorous.
6. Exploration efforts to find new or upgrade reserves of high grade low phosphorus
manganese ore and thrust on increasing proven reserves.
7. From the geological mapping and exploration, it is observed that the exploration work
needs to be taken up in a systematic manner in the states of Orissa and Karnataka to
explore the possibility of enhancing the reserves as these states contributes around 60%,
of the total resources. Extensive drilling by National Agencies to be taken for identifying
potential blocks in the deeper levels.
8. Improvement in infrastructure such as roads, railways and ports to decrease the
distribution cost needs attention.
9. The existing reserves of 138 Million tones fetch only about 58 million tones of saleable ore
after considering statutory mining regulations towards safety blocks and recovery
percentage of saleable ore. This 58 million tones can last up to 20 years if the production
rate of 3 million tonnes per year achieved. As South Africa has 4000 million tones of
resource base of manganese ore which constitutes about 80% of the world reserves but
accounts for only 20% of world's production and hence, has huge potential to source the
requirement of manganese ore in future. Efforts should also be made towards acquisition
of Manganese Ore deposits in South Africa or elsewhere to supplement the demand gap.
10. The possibility of import of high grade low phosphorous MANGANESE ORE INTO India by
centralized agency can be looked at in view of limited high grade manganese ore reserves
in the country to specifically cater to the need of small consumers.
CHROMITE Chromite is an oxide of chromium and iron (FeO, Cr2O3 or FeCr2O4). It belongs to the spinel group. Chromite is an important commercial chromium bearing mineral. It has got its critical importance in the steel industry because it imparts unique qualities to the products to which it is added like production of stainless steel, high temperature alloys, ferro-chrome, charge-chrome, refractories etc. and have numerous industrial and defense applications. In its purest form the chromite ore contains 68% chromium oxide and Cr:Fe ratio is 1.8:1. For ferro-chrome Cr: Fe should be 2.8:1; Cr2O3=48% (min) and for charge chrome Cr: Fe should be 1.6: 1; Cr2O3 = 44% (min.). 11C.1 Global Scenario 11C.1.1 Reserves Global reserves of shipping-grade chromite are more than 350 million tonnes, sufficient to meet conceivable demand for countries. About 88% of world's chromium resources are concentrated in Kazakhstan and South Africa. These two countries are the major sources for chromite ore globally. United States chromium resources are mostly in Stillwater complex in Montana. Other countries which possess sizeable quantities of resources are Finland, India, Russia, Turkey, Brazil and Albania. Internationally about 79% of chromite is consumed in the metallurgical industry, 13% in chemical industry and 8% in refractory industry. In the metallurgical industry, 60% is consumed for stainless steel production. World reserves of chromite by principal countries are given below:
Table 11 C.1 World Reserves of Chromium (By Principal Countries)
(Shipping Grade) (In '000 tonnes)
Country Reserves
World : T t l( d d)
>350,000
India* 44,000
Kazakhstan 180,000
South Africa 130,000
USA 620
Other countries NA
*India's total resources of chromite as per IBM as on 1.4.2010(P) is 203 million tonnes of which 53.9 million tonnes is under reserves category. (Source: Mineral Commodity Summaries, 2010)
11C.1.2 World Production:
The world production of chromite decreased to 18.7 million tonnes in 2009 from 23.6 million tonnes in 2008. South Africa was the leading producer, followed by India and Kazakhstan. Other significant producers were Turkey, Russia, Brazil, Finland and Zimbabwe.
China's role as a consumer of chromite grew along with its stainless steel industry. China was a prominent consumer of raw materials used in stainless steel as a result of its strong economic growth and expansion of stainless steel industry. China's stainless steel production surpassed that of USA in 2004 and was more than four times that of USA in 2008. World production of chromite from 2005 to 2009 is as follows:
Table 11 C.2 World Production of Chromite (By Principal Countries)
(in tonnes)
Country 2005 2006 2007 2008 2009 2010
World Total 19200000 21200000 23900000 23600000 18700000 22,000,0000
South Africa 7502762 7418326 9646958 9682640 6864938 8,500,000
Turkey 858729 1059901 1678932 1885712 1770029 NA
Zimbabwe 667199 700001 614559 442584 193674 NA
Other countries 915250 2151804 1439051 2529782 2602968 6,300,000
* Production of Chromite in India in 2006-07, 2007-08 and 2008-09 was 5.3 million tonnes, 4.9 million tonnes and 4.0 million tonnes, respectively. (Source : IBM)
11C.2. Indian Scenario
11C..2.1 Geology and Distribution: Chromite deposits of Sukinda and Nausahi ultramafic belt of Orissa constitutes 95% of the
country’s chromite resources. Here chromite occurs as concentration and disseminations in
the ultramafic rocks, in the form of lenses, pockets, thin seams and stringers. Other states
contributing to the country’s resources of chromite are Manipur, Karnataka, Jharkhand,
Maharashtra, Tamil Nadu and Andhra Pradesh. In Manipur, chromite is associated with
serpentine.
In Karnataka, the ultramafic rocks bearing chromite occur in two belts; viz Nuggehalli,
Arsikhera and Nanjangud in Mysore district. In Maharashtra, it occurs in altered ultramafic
rocks. In Andhra Pradesh, it occurs in Eastern Ghat group of rocks in Khammam and Krishna
district. In Tamil Nadu, chromite associated with amphibolites bands are found in Sitampundi
complex of anorthosites. In Nagaland, nickeliferous chromite has been located in ultramafic
belt. Small resources have been established in Karnataka, Maharashtra and Jharkhand.
Nearly 2500 sq km area is the potential geological domain of which 85 sq km is leased out.
Table 11 C.3 State wise principal districts where chromite resources are available
State Districts
Andhra Pradesh Khammam and Krishna
Jharkhand Singhbhum (East)
Karnataka Chikmagalur, Hassan and Mysore
Maharashtra Bhandara, Chandrapur, Nagpur and Sindhudurg
Manipur Chandel and Urhrul
Nagaland Tuensang
Orissa Balasore, Cuttack, Dhenkanal, Jajpur and K jhTamil Nadu Coimbatore and Salem
(Source : IBM)
Fig.11C.1 Map showing Chromite occurrences in India
Blocks etc. Andhra Pradesh 7 Namakhal & Thiruchengoddu
As per UNFC system, total resources of chromite in the country as on 1.4.2010(P) are estimated at 203.3 million tonnes, comprising 53.9 million tonnes reserves (26.5%) and 149.4 million tonnes remaining resources (73.5%). More than 95% resources of chromite are located in Orissa, mostly in the Sukinda valley in Cuttack and Jajpur districts. Minor deposits are scattered over Manipur, Karnataka, Jharkhand, Maharashtra, Tamil Nadu and Andhra Pradesh. Grade wise, charge-chrome grade accounts for 26% resources followed by ferro-chrome grade and beneficiable grade (20% each) and refractory grade 2%. Low, others, unclassified and not known grades together account for 32%. Grade wise resources of chromite and state wise resource of chromite as on 1.4.2010(P) are as follows:
Table 11 C.4 Reserves/Resources of Chromite As on 1.4.2010 (P)
(By Grade) (in ‘000 Tonnes)
Grade Reserves Remaining
resources
Total
Resources All India (All Grade) : Total 53,970 149,376 203,346
Refractory 5,701 4,064 9,765
Beneficiable 13824 21154 34978
Charge-chrome 21418 50961 72379
Ferro-chrome 9346 29061 38407
Low 52 3713 3765
Others 921 183 1104
Unclassified 2707 40062 42769
Not know 0 179 179
(P) : Provisional Figure rounded off (Source: National Mineral Inventory as on 1.4.2010)
Table 11 C.5 Reserves/Resources of Chromite
As on 1.4.2010 (P) (By State)
(in ‘000 Tonnes) State Reserves Remaining
resources Total
Resources
All India (Total) 53,970 149,376 203,346
Andhra Pradesh 0 187 187
Jharkhand 0 736 736
Karnataka 745 887 1632
Maharashtra 76 556 632
Manipur 76 6581 6657
Nagaland 0 3200 3200
Orissa 53073 136948 190021
Tamil Nadu 0 282 282
(P) : Provisional Figure rounded off (Source: National Mineral Inventory as on 1.4.2010)
11C.2.3 Indian Production: The production of chromite at 3.41 million tonnes during 2009-10 decreased by 16% as compared to the previous year owing to decrease in market condition and demand. Orissa continued to be the major producing state of chromite, accounting for almost entire production during 2009-10. Karnataka reported nominal production. As in 2008-09, there are 30 Mining leases with 8859.01 ha of land are available for mining.
Table 11 C.6 Production of Chromite 2000-01 to 2009-10
(By States) (in ‘000 tonnes)
Year ALL India (T t l)
Karnataka Orissa Maharashtra
2000-01 1971 15 1956 1
2001-02 1549 18 1531 ++
2002-03 3069 19 3049 ++
2003-04 2904 12 2892 ++
2004-05 3621 11 3610 ++
2005-06 3714 9 3705 -
2006-07 5296 8 5288 -
2007-08 4873 10 4863 -
2008-09 4073 4 4069 -
2009-10 (P) 3413 6 3406 ++
Figures rounded off.
(P : Provisional ++ ‐ Negligible/less than one thousand tonne (Source : IBM) 11C.2.4 Export of Chromite ore During 2009-10, India Exported 6.89 lakh tonnes of Chromite ore and bulk share of about 82% was of chromite concentrate while chromite lumps and other Chromite together accounted for 18%. Exports were mainly to China (77%) and Japan (22%).
11C.2.5 Import of Chromite ore During 2009-10, India Imported 0.96 lakh tonnes of Chromite ore. Lumpy chromite accounted for 55% while concentrate and other forms accounted for remaining 45%. Imports were mainly from Oman (75%), UAE (9%), South Africa and Turkey (7% each).
Table 11 C.7 Export and Import of Chromite
(2000-01 to 2009-10) (in '000 tonnes)
Year Export Import
2000-01 660 55
2001-02 1182 1
2002-03 1098 2
2003-04 745 2
2004-05 1117 3
2005-06 693 5
2006-07 1203 5
2007-08 907 121
2008-09 1899 94
2009-10 (P) 689 96
Figures rounded off. (P): Provisional (Source: DGCI & S, Kolkata) India is importing about 96000 tonnes of chromite ore for internal consumption. Zimbabwe which is enforcing a ban on export of chromite ore may lift the export ban likely this year which may result in more import from this country.
11C.2.6 Industry: Chromite is used chiefly in metallurgical industry for manufacture of ferro‐alloys; e.g., ferro‐chrome, charge‐chrome and silico‐chrome which are used as additives in making stainless steel and special alloy steel. Ferro‐alloys are the essential ingredients for the production of high quality special alloy steel as well as mild steel. The demand for ferro‐alloys is associated with the production of alloy steel. Specification of chromite in major consuming industries in the country is given below:
Table 11 C.8 General Specification of Chromite ore for various products 1. Ferro-Chrome Cr2 03 48% (min), Cr: Fe ration 2.8:1 (min).
6. Low Chemical and physical properties fall below the specifications of the different grades mentioned above.
7. Others Estimation for marketable grades which could not be classified into above grades.
8. Unclassified Minimum and maximum ranges of chemical constituents are too wide.
9. Not known Information on chemical constituents either not available or potential/actual use is not reported.
(Source : IBM)
11C.2.7 Consumption of Chromite The reported consumption of chromite in the organized sector was mostly in ferro-alloys/charge-chrome industry. In addition to above, chromite in substantial quantities is also consumed in small-scale ferro-chrome units for which information is lacking. Data on consumption of chromite and ferro-chrome from 2009-10(P) is given below:
Table 11 C.9 Reported Consumption of Chromite
2000-01 to 2009-10(p) (By Industries)
(in ‘000 tonnes) All Industries Year
Chemical Ferro- Refractory Others Total
2000-01 22 617 25 ++ 664
2001-02 23 479 22 ++ 524
2002-03 23 491 22 ++ 536
2003-04 5 714 13 ++ 732
2004-05 5 880 21 ++ 906
2005-06 5 1319 21 ++ 1345
2006-07 5 1757 23 1 1786
2007-08 5 2470 23 1 2499
2008-09 5 2132 24 1 2162
2009-10 (P) 5 2314 24 1 2344
Figures rounded off. (P) : Provisional (Source : Data collected on non-statutory basis)
The estimated production of chromite is about 5.01 million tonnes by 2011-12 and 7.37 million tonnes by 2016-17 at 8% growth rate. The apparent consumption is estimated at 2.74 million tonnes by 2011-12 and 4.35 million tonnes by 2016-17 at 8% growth rate. The actual/estimate production and apparent consumption of chromite during 11th plan are as follow:
Table 11 C.10 Demand Supply Scenario of Chromite at 8 % growth during 11th Five year plan
(in ‘000 tonnes) Year Production Apparent consumption
2007-08 4873 4087
2008-09 4073 2176
2009-10 3413 2350
2010-11(e) 3865 2538
2011-12(e) 4174 2741
(e) estimated (Source : IBM)
11C.2.8 Status of Chromite exploration in India (CGPB Sub Committee II Base Document on Chromite – 2010) Total potential area is approximately 2720 sq km which includes 2690 sq km in Peninsular
India and 306 sq km in Extra Peninsular India. Total explored area is 604 sq km which includes
88.7 sq km lease hold areas. Free hold un‐explored area is around 2116 sq km. Free hold
explored area for reassessment is around 515.3 sq km.
The chrome ore is being mined by open-cast method in Sukinda area (Odisha) which is the most important area for chromite. For mining one tonne of chrome ore, 15 tonnes of OB is mined. The accumulated OB at the site will create environmental problem. The problem of Sukinda is the occurrence of friable ore at deeper levels. Only 24% of the chrome ore resources are developed into reserve and lot of deep seated drilling is required for converting balance resources to reserves.
11C.3 Recommendations
1. Chrome is a scarce mineral in India - India has only about 1% of the total Chromite Ore reserves of the world whereas the exports are 30 to 35% of the world share. Although India has about 213 MT Chrome ore Resource, it has only 66 MT of Reserves. 90% of this is in Sukinda and the ore is friable at depths between 100-300 m. The resources would last for only 20 years given the requirement by the existing alloys and stainless steel capacity and therefore there is an urgent need to ban the export of chrome ore to conserve this critical input for the growth of domestic industry.
2. Development of Chrome Ore Resources: Only about 26% of the Chrome ore Resource are developed into Reserves and the remaining 74% Resource of ore are still to be explored & developed fully to convert into Reserves as most of these are deep seated these are friable.
Following suggestions are made to achieve this: a) Exploration of Deep seated ore bodies to be carried out both by the Central Govt. &
State Govt. Agencies.
3. Addition to the Chrome Ore Resources: a) R & D to be carried out for using low grade with or without blending in the Ferro
Alloys Industry for overall increase in the resource.
4. Sustainable Development and Conservation of Chrome Ore 5. For mining 1 tonne of chromite, 15 tonnes of overburden (OB) is mined. Already 60-80
meters of OB is lying in Sukinda. For exporting 1 tonne of chromite, such a huge quantity of OB is mined and the waste is still lying which may also create environmental pollution. This is also one of the reason for suggesting for ban on chromite export.
7. The proven reserve of Chromite in India is 54 MT and Sukinda is the only major area for this reserve. Existing Ferro chrome is required for the steel industry & this also indicates that export of chromite should be banned at least till the XII plan period. UG mining to be promoted to solve this problem. Companies which are interested can be promoted.
8. Orissa is having huge reserve of Chromite and potential areas but leases are not being granted. So grant of lease to be ensured.
9. Development of suitable beneficiation methodology to make effective use of low grade, friable chromite ore (less than 30% Cr2O3 ) fines, which are available in sizeable quantity in India.
10. Development of Technologies for production of ferro alloys using alternate technologies, viz., smelting reduction of Manganese ore, soliostate reduction of chromite ore fines / concentrates in fluidized bed reactor using natural gas.
2. GENERAL STRATEGIES 1. The need of a comprehensive database involving the exploration activity by all the
agencies is of primary importance. The detailed results of the areas being worked along
with the status of the freehold & leasehold areas is of primary importance, which has to
be superimposed on the mineral belt maps, to facilitate future planning and monitoring.
2. Sharing of data generated by various agencies is of prime importance for maintaining and
updating a comprehensive Data base on Exploration. This will help in identification of gap
areas, building up of a comprehensive picture of the regional set up and prognostication
of target areas.
3. Five Year Plan proposals can help in coordination and avoiding any overlap of
programmes. Annual proposals should also be submitted by member organizations in
time for planning and coordination. Coordinates of explored areas should also be supplied
in order to build up database and prepare a comprehensive status map.
4. The problem of getting forest clearance for work in mineral exploration is another major
hindrance, though this has been addressed to some extent in the meeting by Ministry of
Mines with the concerned ministries. In recent relaxation of the Forest Clearance norm in
RF areas by the MoEF permitting 20‐25 boreholes for 10 sq km area is not adequate to
estimate the resources (UNFC‐ G3) by the exploration norm practiced in GSI. The MoEF
may be requested to permit to drill adequate number of boreholes in the RF areas for
exploration to get a comprehensive picture of reserve calculation with particular
reference of iron ore.
5. The Ministry of Mines may thus be requested to take up these issues with the MoEF for
ensuring smooth progress of work and creating of proper working environment in the RF
areas as far as possible.
6. Environmental pollution in mining areas is another burning issue which needs to be
resolved by the miners/ industrialists through proper precautions and scientific way of
mining. In this case, the need of the hour is a ‘zero waste mining’ may be the prime goal
in the nation’s mining sector including Public Sector and Private Sector along with the
Govt. Sector and Multinational Companies.
3. TECHNOLOGY UPGRADATION
1. Most of the present exploration efforts are restricted to areas near ancient mine workings
or near surface deposits by conventional exploration techniques.
2. Advanced integrated exploration techniques are needed to thoroughly explore deeper
deposits or deposits in complex geological environment.
3. State‐of‐the–art drilling techniques with sophisticated rigs (such as RC) for three
dimensional sub‐surface delineation of ore body as well as for directional drilling and
underground exploratory drilling are needed to be employed.
4. Human resource development needs a lot of stress to fulfill the future requirements of
the coming green field as well as brown field mines with state‐of‐the‐art technologies.