90
Report of the 2013 SURVEY OF VETERAN ENROLLEES’ HEALTH AND RELIANCE UPON VA Prepared by ICF International 126 College Street Burlington, VT 05401
Report of the 2013 SURVEY OF VETERAN ENROLLEES’
HEALTH AND RELIANCE UPON VA
Prepared by
ICF International
126 College Street
Burlington, VT 05401

ICF International 2013 Survey of Enrollees Report
Prologue
Veterans have many health care options in America and the recent implementation of the Patient Protection and Affordable Care Act, commonly known as the Affordable Care Act or ACA, has expanded the universe of health care coverage options for Veterans. For those Veterans enrolled in health care through the Department of Veterans Affairs (VA), the choice to use VA services is driven by many factors, including ease of access, available health coverage, perception of quality, understanding of benefits, and overall wellness.
Understanding these factors, as well as the overall needs, values, and expectations of Veterans is important to the Veterans Health Administration (VHA). The heart of VHA’s strategic vision is to build a health care partnership with Veterans and their families. This partnership is vital to creating a shift that puts the Veterans we serve at the center of a personalized, proactive, and patient-driven system focused on health and wellness.
The Survey of Veteran Enrollees’ Health and Reliance upon VA (Survey of Enrollees) provides a critical benchmark for VHA’s understanding of enrolled Veterans’ experiences of VA health care and of their health service preferences. It provides demographic information about the Veterans enrolled in VA health care that cannot be obtained elsewhere; this includes employment status, marital status, income, service era, race, and ethnicity. It also provides data on types of health insurance coverage, or lack of health insurance. Perhaps most importantly, the survey illuminates Veterans’ responses to questions that have been shown to relate to utilization, such as self-reported health status, planned future use of VA services, satisfaction with the quality of VA health care, understanding of health care benefits, perceptions of availability and accessibility of VA health care, and access to non-VA health care alternatives. The 2013 survey also sought to estimate Veterans’ understanding and the potential impact of the ACA. Furthermore, questions relating to travel issues and internet access were asked to help determine whether those factor into health care decisions of enrolled Veterans.
This report provides survey response data calculated as weighted estimates; the data are presented in an array of tables designed to allow comparisons with previous years as well as among key variables such as age, income, and enrollee priority category.
/s/
Patricia Vandenberg, MHA Assistant Deputy Under Secretary for Health for Policy and Planning
ICF International 2013 Survey of Enrollees Report
TABLE OF CONTENTS EXECUTIVE SUMMARY ........................................................................................................... 1
Introduction ............................................................................................................................. 1
Survey Methodology ............................................................................................................... 1
Select Findings ......................................................................................................................... 1
FULL FINDINGS ...................................................................................................................... 4
PURPOSE OF THE SURVEY OF ENROLLEES ............................................................................................... 4
BRIEF HISTORY OF THE SURVEY OF ENROLLEES ....................................................................................... 4
DATA PRESENTATION ........................................................................................................................ 5
DEMOGRAPHIC CHARACTERISTICS AND SOCIOECONOMIC STATUS OF 2013 ENROLLEES ................................. 5
Ethnicity and Race ................................................................................................................... 7
Marital Status ......................................................................................................................... 8
Employment Status ................................................................................................................. 8
Female Enrollee Population .................................................................................................. 11
Number of Dependents ......................................................................................................... 12
Terms of Active Duty ............................................................................................................. 12
Combat Duty ......................................................................................................................... 13
HEALTH STATUS, KEY DRIVERS OF ENROLLEES’ HEALTH CARE DECISION-MAKING, AND PLANNED USE OF VHA SERVICES ...................................................................................................................................... 14
Health Status ......................................................................................................................... 14
Use of VA to Meet Health Care Needs .................................................................................. 14
Key Drivers ............................................................................................................................. 15
Future Use ............................................................................................................................. 25
PUBLIC AND PRIVATE HEALTH INSURANCE COVERAGE ........................................................................... 26
VA Health Care ...................................................................................................................... 26
Insurance Status .................................................................................................................... 27
Medicare Coverage ............................................................................................................... 28
Medicaid Coverage ............................................................................................................... 30
TRICARE or TRICARE For Life Coverage ................................................................................. 31
Additional Health Coverage .................................................................................................. 31
PHARMACEUTICAL USE .................................................................................................................... 33
Prescription Drug Coverage Through VA .............................................................................. 33
Over-the-Counter (OTC) Medications ................................................................................... 34
Prescription Medications ...................................................................................................... 35
LONG-TERM CARE USE AND BENEFITS ............................................................................................... 36
ICF International 2013 Survey of Enrollees Report
TRAVEL FACTORS ........................................................................................................................... 40
INTERNET ACCESS ........................................................................................................................... 42
PATIENT PROTECTION AND AFFORDABLE CARE ACT .............................................................................. 43
APPENDIX A – CONDENSED DESCRIPTION OF THE METHODOLOGY ...................................... 45
Sample Design ....................................................................................................................... 45
Multimode Survey ................................................................................................................. 45
Design Weights ..................................................................................................................... 47
Weighting .............................................................................................................................. 47
Non-Response Adjustment .................................................................................................... 47
Data Collection ...................................................................................................................... 49
APPENDIX B – CATI SURVEY INSTRUMENT ........................................................................... 51
ICF International 2013 Survey of Enrollees Report 1
EXECUTIVE SUMMARY
Introduction
The Survey of Enrollees is an annual survey of over 40,000 Veterans enrolled in the VA’s health care system. These Veterans are referred to as enrollees in this document. The survey is designed to provide VHA an in-depth understanding of enrollee demographics, available health care options, and self-reported health status.
The Survey of Enrollees was developed in 1999 to support VHA’s planning efforts and to inform the VA Enrollee Health Care Projection Model (EHCPM), VHA’s tool for projecting enrollment, utilization, and expenditures. Over the years, data from the survey also have been used to analyze policy decisions, to provide insights into specific populations, and to inform management decisions affecting VHA’s delivery of care. This report is intended to provide a user-friendly synopsis of all information collected by the 2013 Survey of Enrollees.
Survey Methodology
For 2013, the survey was administered using a multimode (telephone, mail, and Web) approach. All sampled Veterans received a pre-survey notification letter informing them that they would receive a telephone call or a mailed survey. All sampled Veterans had the option to self-select into a Web administered survey, as the web link was provided in the pre-notification letter.
The 2013 survey data collection began April 13, and concluded August 1 (total of 14 weeks). There were 164,740 surveys distributed, of which 42,046 were completed. The average completion time for the telephone survey was 17.2 minutes. The overall telephone cooperation rate was 77 percent, with cooperation rate defined as the percentage of contacted, eligible respondents (47,231) who completed the survey. Further detail on survey methodology can be found in Appendix A.
Select Findings
Survey results are weighted to represent the population of Veterans enrolled in the VA health care system. The enrollee population at the time of the survey weighting (September 30, 2012) was 8,303,957 (Note: this does not include enrollees who live outside of the United States or its territories). In 2013, the largest proportion of enrollees (40%) was enrolled in Priority Groups

ICF International 2013 Survey of Enrollees Report 2
1–3. The largest group of Veterans indicated they were 65 or older (47%). The median age was 64. The median reported income was $33,5001.
Demographic and Socioeconomic Characteristics of the Enrollee Population
The typical enrollee continues to be male, married, and White. However, the female enrollee population continued to grow in 2013 (6.8% in 2013 as compared to 6.6% in 2012, a statistically significant increase), and the overall enrollee population is becoming more racially diverse.
Almost half of enrollees (47%) report an income of $36,000 or less.
The unemployment rate for enrolled Veterans decreased to 16 percent in 2013 from 18 percent in 2012. More than half of enrollees (59%) stated that they were not actively seeking employment (i.e., retired, a homemaker, or a student). This is a significant increase over the 57 percent of enrollees reporting the same in 2012.
Veterans who served in Operation Enduring Freedom/Operation Iraqi Freedom/Operation New Dawn (OEF/OIF/OND) had a lower unemployment rate (12%) than those who did not (17%).
In 2013, the majority of enrolled Veterans indicated that they had served one term of active duty (80%).
Over half a million enrollees have served three or more terms of active duty.
The largest percentage of enrollees indicated that they had served during the Vietnam Era (41%). However, enrollees from current conflicts (i.e., served since 2001), were the fastest growing population. The percentage of enrollees from current conflicts rose from 14 percent in 2012 to 16 percent in 2013, a statistically significant increase.
Health Status, Key Drivers of Enrollees’ Health Care Decision Making, and Planned Future Use of VHA Services
Overall, 68 percent of enrollees stated that their health was “Excellent”, “Very Good”, or “Good” as compared to other people their age.
Seventy-nine percent of enrollees concurred with the statement that “VA healthcare providers treat their patients with respect.”
1 Enrollees reported income either via a specific income value or via an income range. If an enrollee reported an income range the range midpoint was assigned as the enrollee’s income. Median income was then calculated for all enrollees with an income value. Don’t know/Refusal responses are not included in this calculation.
ICF International 2013 Survey of Enrollees Report 3
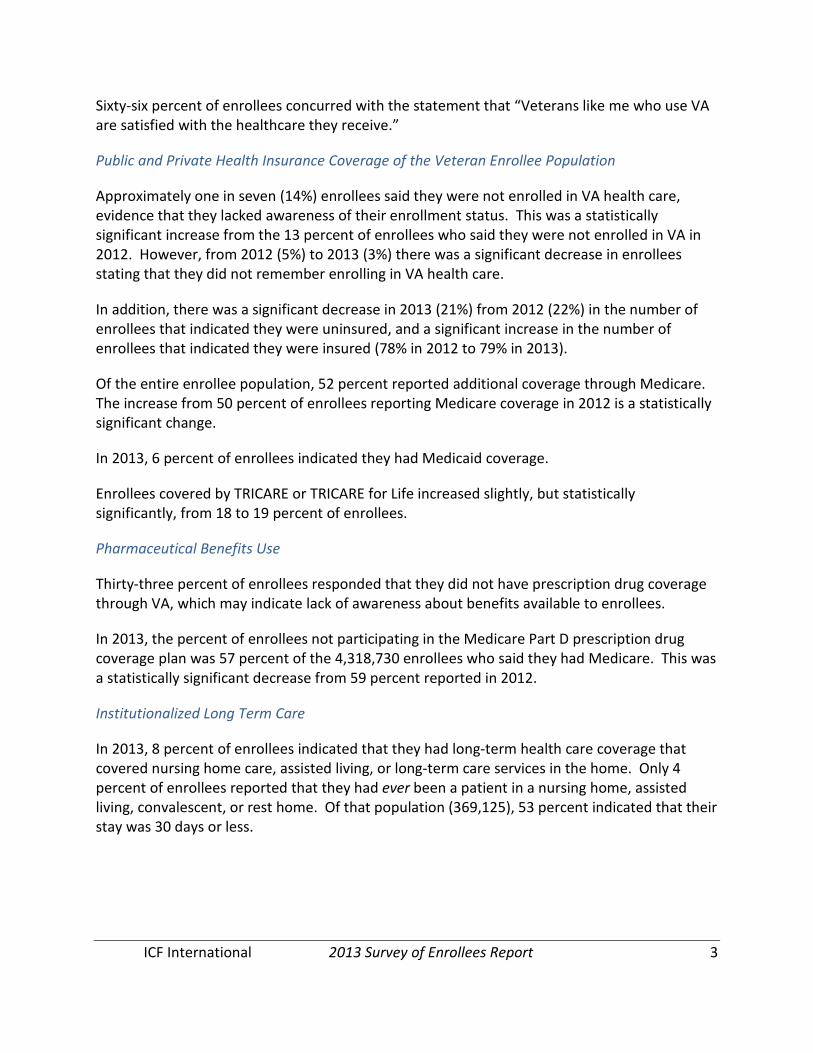
Sixty-six percent of enrollees concurred with the statement that “Veterans like me who use VA are satisfied with the healthcare they receive.”
Public and Private Health Insurance Coverage of the Veteran Enrollee Population
Approximately one in seven (14%) enrollees said they were not enrolled in VA health care, evidence that they lacked awareness of their enrollment status. This was a statistically significant increase from the 13 percent of enrollees who said they were not enrolled in VA in 2012. However, from 2012 (5%) to 2013 (3%) there was a significant decrease in enrollees stating that they did not remember enrolling in VA health care.
In addition, there was a significant decrease in 2013 (21%) from 2012 (22%) in the number of enrollees that indicated they were uninsured, and a significant increase in the number of enrollees that indicated they were insured (78% in 2012 to 79% in 2013).
Of the entire enrollee population, 52 percent reported additional coverage through Medicare. The increase from 50 percent of enrollees reporting Medicare coverage in 2012 is a statistically significant change.
In 2013, 6 percent of enrollees indicated they had Medicaid coverage.
Enrollees covered by TRICARE or TRICARE for Life increased slightly, but statistically significantly, from 18 to 19 percent of enrollees.
Pharmaceutical Benefits Use
Thirty-three percent of enrollees responded that they did not have prescription drug coverage through VA, which may indicate lack of awareness about benefits available to enrollees.
In 2013, the percent of enrollees not participating in the Medicare Part D prescription drug coverage plan was 57 percent of the 4,318,730 enrollees who said they had Medicare. This was a statistically significant decrease from 59 percent reported in 2012.
Institutionalized Long Term Care
In 2013, 8 percent of enrollees indicated that they had long-term health care coverage that covered nursing home care, assisted living, or long-term care services in the home. Only 4 percent of enrollees reported that they had ever been a patient in a nursing home, assisted living, convalescent, or rest home. Of that population (369,125), 53 percent indicated that their stay was 30 days or less.
ICF International 2013 Survey of Enrollees Report 4
Access to Care
In 2013, three questions were asked regarding travel and barriers to accessing health care. Results showed that 44 percent of enrollees indicated that travel never impacted their decision to access health care. When asked how many minutes, one way, they would be willing to travel for primary health care, 48 percent of enrollees reported that they would travel between zero and 30 minutes. The majority of respondents (54%) indicated that they had no problems accessing primary health care.
As virtual modalities can enhance access to care, in 2013, enrollees were asked about their ability to access the internet. Just under 30 percent of enrollees responded that they did not access the internet.
Awareness of Health Care Reform Law
The ACA was signed into law on March 23, 2010, with the majority of provisions to be phased in by January 2014. In order to gauge enrollee understanding of the ACA and the act’s potential impact on enrollees’ use of VHA, the survey asked how well enrollees understood the act, and how it would change their use of the VA Health Care System. Almost 65 percent of respondents indicated that they did not understand the ACA, while 52 percent of respondents indicated that the new law would not change their use of the VA Health Care System.
FULL FINDINGS
Purpose of the Survey of Enrollees
The annual Survey of Enrollees queries over 40,000 Veterans enrolled in VHA in order to gain an in-depth understanding of enrollee demographics, available health care options, and perceptions and usage of VA health care services. This report is intended to provide a user-friendly synopsis of all information collected by the 2013 Survey.
Brief History of the Survey of Enrollees
In October 1996, Congress enacted the Veterans’ Health Care Eligibility Reform Act of 1996 (Public Law 104-262). Among other requirements, this law required that VHA implement a priority-based enrollment system for Veterans who wished to use the VA health care system to give VHA the ability to plan to meet both immediate and future needs of Veterans enrolled in the VA health care system. The enrollment requirement became effective on October 1, 1998, which was the beginning of Fiscal Year (FY) 1999. A full description of priority levels can be found at the following website: http://www.va.gov/healthbenefits/resources/priority_groups.asp
ICF International 2013 Survey of Enrollees Report 5
The Survey of Enrollees was developed in 1999 to support VHA’s planning efforts and to inform the VA EHCPM, VHA’s tool for projecting enrollment, utilization, and expenditures. Over the years, data from the survey also have been used to analyze policy decisions, to provide insights into specific populations, and to inform management decisions affecting VHA’s delivery of care.
In addition to collecting basic demographic information about enrollees, the survey explores enrollees’ insurance coverage, health care use (VA and non-VA), pharmaceutical use, attitudes and perceptions about VHA services (i.e., Key Drivers), perceived health status, as well as barriers to accessing health care, and understanding of the new health care law.
Data Presentation
The majority of tables throughout this report provide three year trended data, displaying both the weighted percent and weighted population counts. Percentage and population counts are rounded. Where applicable, the 2013 columns also contain a denotation if there is a statistically significant difference in response data compared to 2012. This significance is indicated by an asterisk (“*”). Statistical significance was set at the 95 percent confidence level.
Due to rounding, totals may not always sum to 100%. Don’t Know and Refused responses are presented as DK and REF, respectively. A narrative summary of each data table identifies results of interest and significant changes in 2013 as compared to 2012.
When reviewing the data, it should be noted that the change in data collection format from a single mode (telephone) to a multimode (telephone, mail, and Web) survey began in 2012 and was continued in 2013. This change was made to better represent the enrollee population, including enrollees who prefer not to respond to or who are not available for telephone surveys, as well as enrollees for whom VHA does not have a current telephone number. While the 2012 and 2013 data better represent VHA’s enrolled population, comparisons with 2011 data should be considered with this format change in mind. Some differences may be an effect of the survey mode change rather than an actual change in enrollee responses.
Demographic Characteristics and Socioeconomic Status of 2013 Enrollees
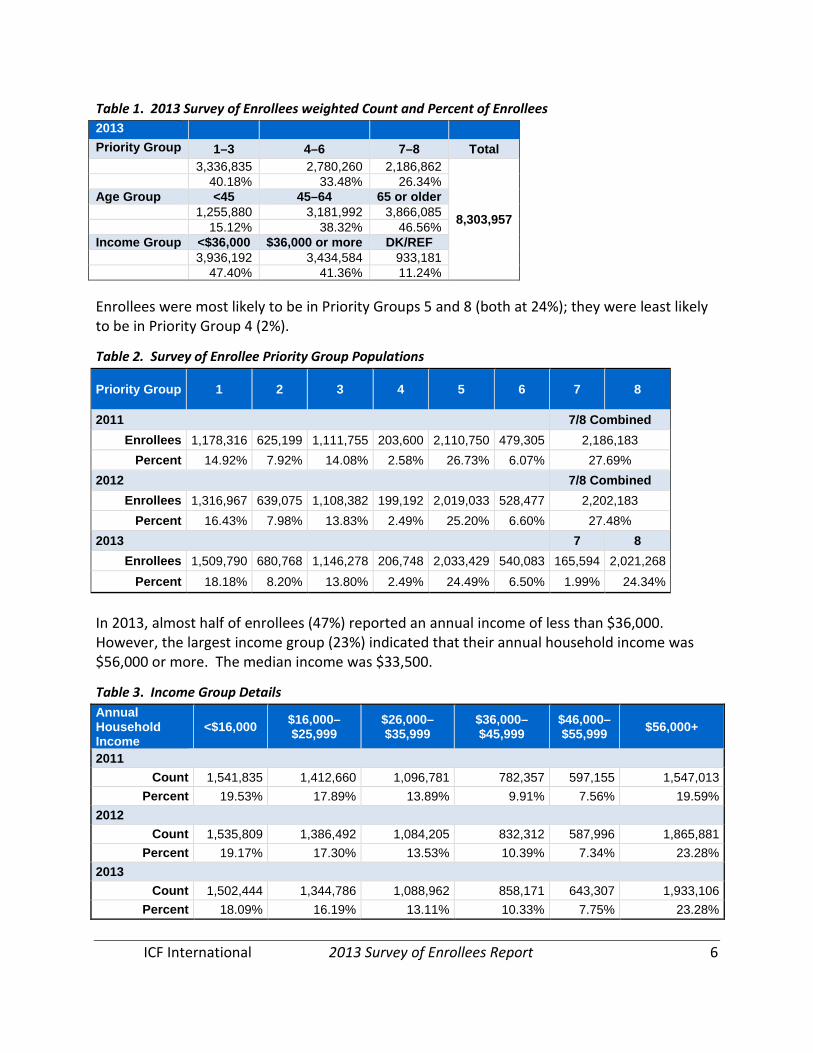
In 2013, the largest proportion of enrollees (40%) was in Priority Groups 1–3. Most enrollees were aged 65 or older (47%). Almost half of enrollees (47%) reported household incomes of less than $36,000 a year.
ICF International 2013 Survey of Enrollees Report 6
Table 1. 2013 Survey of Enrollees weighted Count and Percent of Enrollees 2013 Priority Group 1–3 4–6 7–8 Total 3,336,835 2,780,260 2,186,862
8,303,957
40.18% 33.48% 26.34% Age Group <45 45–64 65 or older 1,255,880 3,181,992 3,866,085 15.12% 38.32% 46.56% Income Group <$36,000 $36,000 or more DK/REF 3,936,192 3,434,584 933,181 47.40% 41.36% 11.24%
Enrollees were most likely to be in Priority Groups 5 and 8 (both at 24%); they were least likely to be in Priority Group 4 (2%).
Table 2. Survey of Enrollee Priority Group Populations
Priority Group 1 2 3 4 5 6 7 8
2011 7/8 Combined Enrollees 1,178,316 625,199 1,111,755 203,600 2,110,750 479,305 2,186,183
Percent 14.92% 7.92% 14.08% 2.58% 26.73% 6.07% 27.69% 2012 7/8 Combined
Enrollees 1,316,967 639,075 1,108,382 199,192 2,019,033 528,477 2,202,183 Percent 16.43% 7.98% 13.83% 2.49% 25.20% 6.60% 27.48%
2013 7 8 Enrollees 1,509,790 680,768 1,146,278 206,748 2,033,429 540,083 165,594 2,021,268
Percent 18.18% 8.20% 13.80% 2.49% 24.49% 6.50% 1.99% 24.34%
In 2013, almost half of enrollees (47%) reported an annual income of less than $36,000. However, the largest income group (23%) indicated that their annual household income was $56,000 or more. The median income was $33,500.
Table 3. Income Group Details Annual Household Income
<$16,000 $16,000–$25,999
$26,000–$35,999
$36,000–$45,999
$46,000–$55,999 $56,000+
2011 Count 1,541,835 1,412,660 1,096,781 782,357 597,155 1,547,013
Percent 19.53% 17.89% 13.89% 9.91% 7.56% 19.59% 2012
Count 1,535,809 1,386,492 1,084,205 832,312 587,996 1,865,881 Percent 19.17% 17.30% 13.53% 10.39% 7.34% 23.28%
2013 Count 1,502,444 1,344,786 1,088,962 858,171 643,307 1,933,106
Percent 18.09% 16.19% 13.11% 10.33% 7.75% 23.28%

ICF International 2013 Survey of Enrollees Report 7
Ethnicity and Race
Through a series of questions, the 2013 survey asked enrollees to describe their ethnicity and race. In 2013, six percent of enrollees reported that they are of Hispanic or Latino ethnicity.
Table 4. Would you describe yourself as Hispanic or Latino?
2011 2012 2013
Weighted Percent
Population Estimate
Weighted Percent
Population Estimate
Weighted Percent
Population Estimate
Yes 6.25% 493,768 5.67% 453,969 6.06% . 502,808
No 92.26% 7,283,914 91.96% 7,368,685 91.81% . 7,623,658
DK/REF 1.49% 117,426 2.38% 190,653 2.14% . 177,490
Total 100.00% 7,895,108 100.00% 8,013,308 100.00% - 8,303,957 - Not tested, not applicable
In 2013, the largest proportion of enrollees (79%) described their race as White; this was followed by enrollees who described themselves as Black/African American (12%). The least commonly selected racial group was Native Hawaiian/Other Pacific Islander (1%). There was a statistically significant decrease from 2012 in the number of enrollees that indicated they were White (80% to 79%), and a statistically significant increase from 2012 in the number of enrollees that indicated they were Asian (1.1% to 1.4%).
Table 5. Enrollee Populations by Race Categories (not mutually exclusive)
2011 2012 2013
Weighted Percent
Population Estimate
Weighted Percent
Population Estimate
Weighted Percent
Population Estimate
White 80.85% 6,383,099 80.25% 6,430,720 79.10% * 6,568,617
Black/African American 11.74% 926,598 12.39% 993,157 12.37% 1,027,174
Native American/ Alaska Native 4.23% 334,217 4.09% 327,716 4.19% 348,050
Asian 0.95% 74,754 1.08% 86,631 1.37% * 113,736
Native Hawaiian or Other Pacific
Islander 0.72% 56,832 0.63% 50,617 0.74% 61,341
Enrollees who chose >1 race 2.69% 212,736 2.94% 235,865 2.93% 243,259
DK/REF 4.40% 347,471 3.24% 259,782 3.86% 320,423
Denominator 7,895,108 8,013,308 - 8,303,957 * Tested, significant; 95% confidence level; 5% significance level - Not tested, not applicable Respondents indicating more than one race were counted in each race category indicated, plus the > 1 race category
ICF International 2013 Survey of Enrollees Report 8
Marital Status
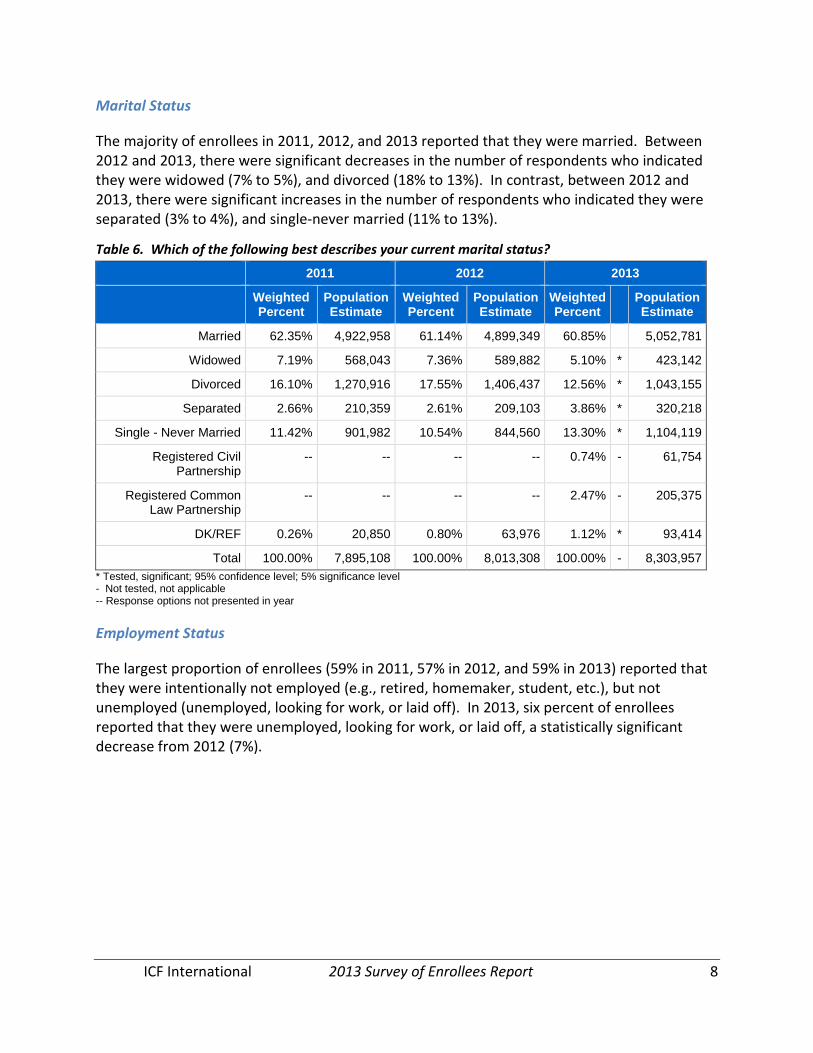
The majority of enrollees in 2011, 2012, and 2013 reported that they were married. Between 2012 and 2013, there were significant decreases in the number of respondents who indicated they were widowed (7% to 5%), and divorced (18% to 13%). In contrast, between 2012 and 2013, there were significant increases in the number of respondents who indicated they were separated (3% to 4%), and single-never married (11% to 13%).
Table 6. Which of the following best describes your current marital status?
2011 2012 2013
Weighted Percent
Population Estimate
Weighted Percent
Population Estimate
Weighted Percent
Population Estimate
Married 62.35% 4,922,958 61.14% 4,899,349 60.85% . 5,052,781
Widowed 7.19% 568,043 7.36% 589,882 5.10% * 423,142
Divorced 16.10% 1,270,916 17.55% 1,406,437 12.56% * 1,043,155
Separated 2.66% 210,359 2.61% 209,103 3.86% * 320,218
Single - Never Married 11.42% 901,982 10.54% 844,560 13.30% * 1,104,119
Registered Civil Partnership
-- -- -- -- 0.74% - 61,754
Registered Common Law Partnership
-- -- -- -- 2.47% - 205,375
DK/REF 0.26% 20,850 0.80% 63,976 1.12% * 93,414
Total 100.00% 7,895,108 100.00% 8,013,308 100.00% - 8,303,957 * Tested, significant; 95% confidence level; 5% significance level - Not tested, not applicable -- Response options not presented in year
Employment Status
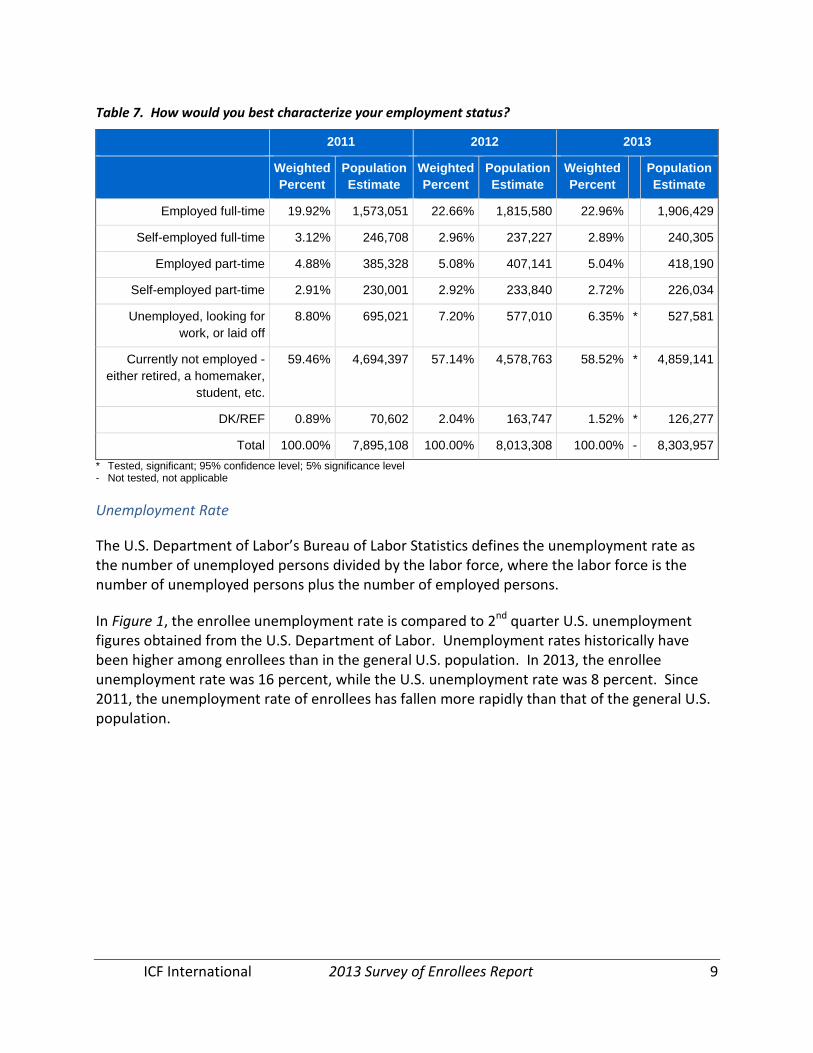
The largest proportion of enrollees (59% in 2011, 57% in 2012, and 59% in 2013) reported that they were intentionally not employed (e.g., retired, homemaker, student, etc.), but not unemployed (unemployed, looking for work, or laid off). In 2013, six percent of enrollees reported that they were unemployed, looking for work, or laid off, a statistically significant decrease from 2012 (7%).
ICF International 2013 Survey of Enrollees Report 9
Table 7. How would you best characterize your employment status?
2011 2012 2013
Weighted Percent
Population Estimate
Weighted Percent
Population Estimate
Weighted Percent
Population Estimate
Employed full-time 19.92% 1,573,051 22.66% 1,815,580 22.96% . 1,906,429
Self-employed full-time 3.12% 246,708 2.96% 237,227 2.89% . 240,305
Employed part-time 4.88% 385,328 5.08% 407,141 5.04% . 418,190
Self-employed part-time 2.91% 230,001 2.92% 233,840 2.72% . 226,034
Unemployed, looking for work, or laid off
8.80% 695,021 7.20% 577,010 6.35% * 527,581
Currently not employed - either retired, a homemaker,
student, etc.
59.46% 4,694,397 57.14% 4,578,763 58.52% * 4,859,141
DK/REF 0.89% 70,602 2.04% 163,747 1.52% * 126,277
Total 100.00% 7,895,108 100.00% 8,013,308 100.00% - 8,303,957 * Tested, significant; 95% confidence level; 5% significance level - Not tested, not applicable
Unemployment Rate
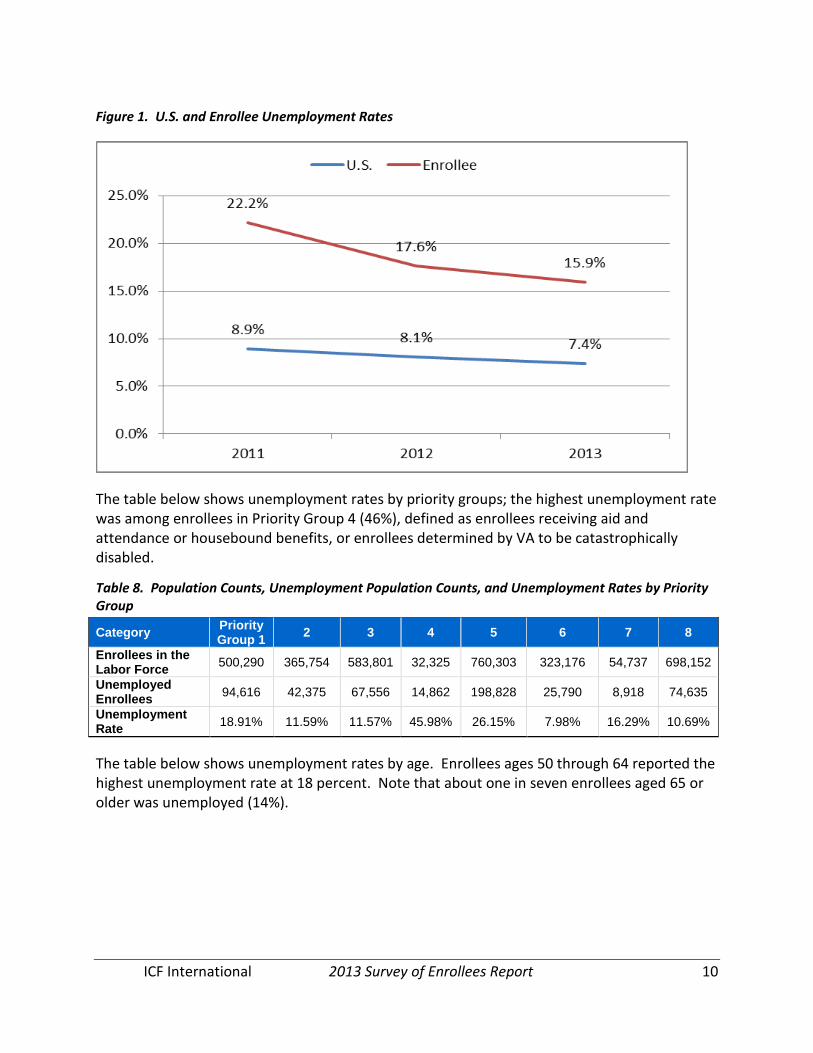
The U.S. Department of Labor’s Bureau of Labor Statistics defines the unemployment rate as the number of unemployed persons divided by the labor force, where the labor force is the number of unemployed persons plus the number of employed persons. In Figure 1, the enrollee unemployment rate is compared to 2nd quarter U.S. unemployment figures obtained from the U.S. Department of Labor. Unemployment rates historically have been higher among enrollees than in the general U.S. population. In 2013, the enrollee unemployment rate was 16 percent, while the U.S. unemployment rate was 8 percent. Since 2011, the unemployment rate of enrollees has fallen more rapidly than that of the general U.S. population.
ICF International 2013 Survey of Enrollees Report 10
Figure 1. U.S. and Enrollee Unemployment Rates
The table below shows unemployment rates by priority groups; the highest unemployment rate was among enrollees in Priority Group 4 (46%), defined as enrollees receiving aid and attendance or housebound benefits, or enrollees determined by VA to be catastrophically disabled.
Table 8. Population Counts, Unemployment Population Counts, and Unemployment Rates by Priority Group
Category Priority Group 1 2 3 4 5 6 7 8
Enrollees in the Labor Force 500,290 365,754 583,801 32,325 760,303 323,176 54,737 698,152
Unemployed Enrollees 94,616 42,375 67,556 14,862 198,828 25,790 8,918 74,635
Unemployment Rate 18.91% 11.59% 11.57% 45.98% 26.15% 7.98% 16.29% 10.69%
The table below shows unemployment rates by age. Enrollees ages 50 through 64 reported the highest unemployment rate at 18 percent. Note that about one in seven enrollees aged 65 or older was unemployed (14%).

ICF International 2013 Survey of Enrollees Report 11
Table 9. Population Counts, Unemployed Population Counts, and Unemployment Rates by Age
Category Aged <30 Aged 30–49 Aged 50–64 Aged 65 or Older 2011 Enrollees in the Labor Force 270,388 909,325 1,485,663 464,734 Unemployed Enrollees 65,518 174,786 377,812 76,906 Unemployment Rate 24.23% 19.22% 25.43% 16.55% 2012 Enrollees in the Labor Force 246,423 1,070,816 1,465,958 487,601 Unemployed Enrollees 50,879 175,321 292,978 57,833 Unemployment Rate 20.65% 16.37% 19.99% 11.86% 2013 Enrollees in the Labor Force 275,367 1,110,466 1,384,670 548,035 Unemployed Enrollees 41,645 151,660 255,759 78,517 Unemployment Rate 15.12% 13.66% 18.47% 14.33%
The table below shows unemployment rates by OEF/OIF/OND status. Enrollees who did not serve in OEF/OIF/OND reported the highest unemployment rate at 17 percent. Over the past three years, enrollees who served in OEF/OIF/OND have consistently reported a lower unemployment rate.
Table 10. Population Counts, Unemployed Population Counts, and Unemployment Rates by OEF/OIF/OND Category OEF/OIF/OND Not OEF/OIF/OND 2011 Enrollees in the Labor Force 536,630 2,593,480 Unemployed Enrollees 83,481 611,540 Unemployment Rate 15.56% 23.58% 2012 Enrollees in the Labor Force 640,092 2,630,706 Unemployed Enrollees 92,023 484,987 Unemployment Rate 14.38% 18.44% 2013 Enrollees in the Labor Force 755,232 2,563,307 Unemployed Enrollees 91,030 436,550 Unemployment Rate 12.05% 17.03%
Female Enrollee Population
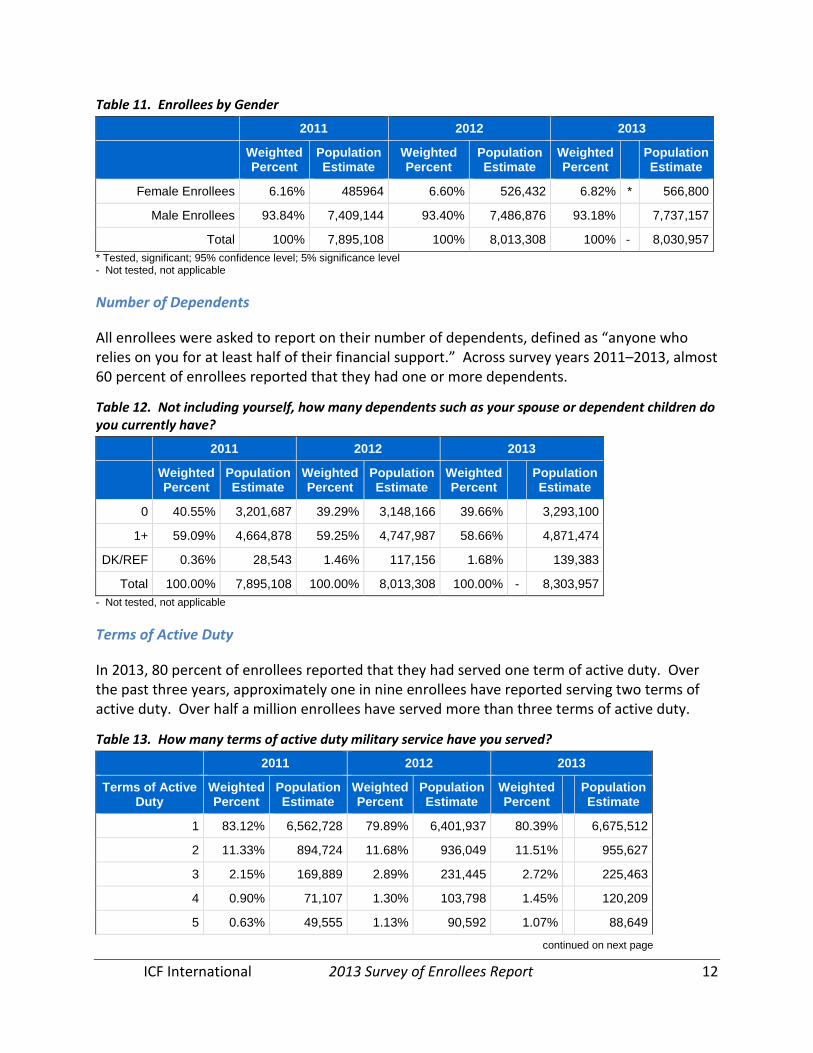
There has been a steady increase in female enrollees over the past three years, with a statistically significant increase from 2012 to 2013 (6.6% to 6.8%).
ICF International 2013 Survey of Enrollees Report 12
Table 11. Enrollees by Gender
2011 2012 2013
Weighted Percent
Population Estimate
Weighted Percent
Population Estimate
Weighted Percent
Population Estimate
Female Enrollees 6.16% 485964 6.60% 526,432 6.82% * 566,800
Male Enrollees 93.84% 7,409,144 93.40% 7,486,876 93.18% 7,737,157
Total 100% 7,895,108 100% 8,013,308 100% -. 8,030,957 * Tested, significant; 95% confidence level; 5% significance level - Not tested, not applicable
Number of Dependents
All enrollees were asked to report on their number of dependents, defined as “anyone who relies on you for at least half of their financial support.” Across survey years 2011–2013, almost 60 percent of enrollees reported that they had one or more dependents.
Table 12. Not including yourself, how many dependents such as your spouse or dependent children do you currently have?
2011 2012 2013
Weighted Percent
Population Estimate
Weighted Percent
Population Estimate
Weighted Percent
Population Estimate
0 40.55% 3,201,687 39.29% 3,148,166 39.66% . 3,293,100
1+ 59.09% 4,664,878 59.25% 4,747,987 58.66% . 4,871,474
DK/REF 0.36% 28,543 1.46% 117,156 1.68% . 139,383
Total 100.00% 7,895,108 100.00% 8,013,308 100.00% - 8,303,957 - Not tested, not applicable
Terms of Active Duty
In 2013, 80 percent of enrollees reported that they had served one term of active duty. Over the past three years, approximately one in nine enrollees have reported serving two terms of active duty. Over half a million enrollees have served more than three terms of active duty.
Table 13. How many terms of active duty military service have you served?
2011 2012 2013
Terms of Active Duty
Weighted Percent
Population Estimate
Weighted Percent
Population Estimate
Weighted Percent
Population Estimate
1 83.12% 6,562,728 79.89% 6,401,937 80.39% . 6,675,512
2 11.33% 894,724 11.68% 936,049 11.51% . 955,627
3 2.15% 169,889 2.89% 231,445 2.72% . 225,463
4 0.90% 71,107 1.30% 103,798 1.45% . 120,209
5 0.63% 49,555 1.13% 90,592 1.07% . 88,649
continued on next page
ICF International 2013 Survey of Enrollees Report 13
2011 2012 2013
Terms of Active Duty
Weighted Percent
Population Estimate
Weighted Percent
Population Estimate
Weighted Percent
Population Estimate
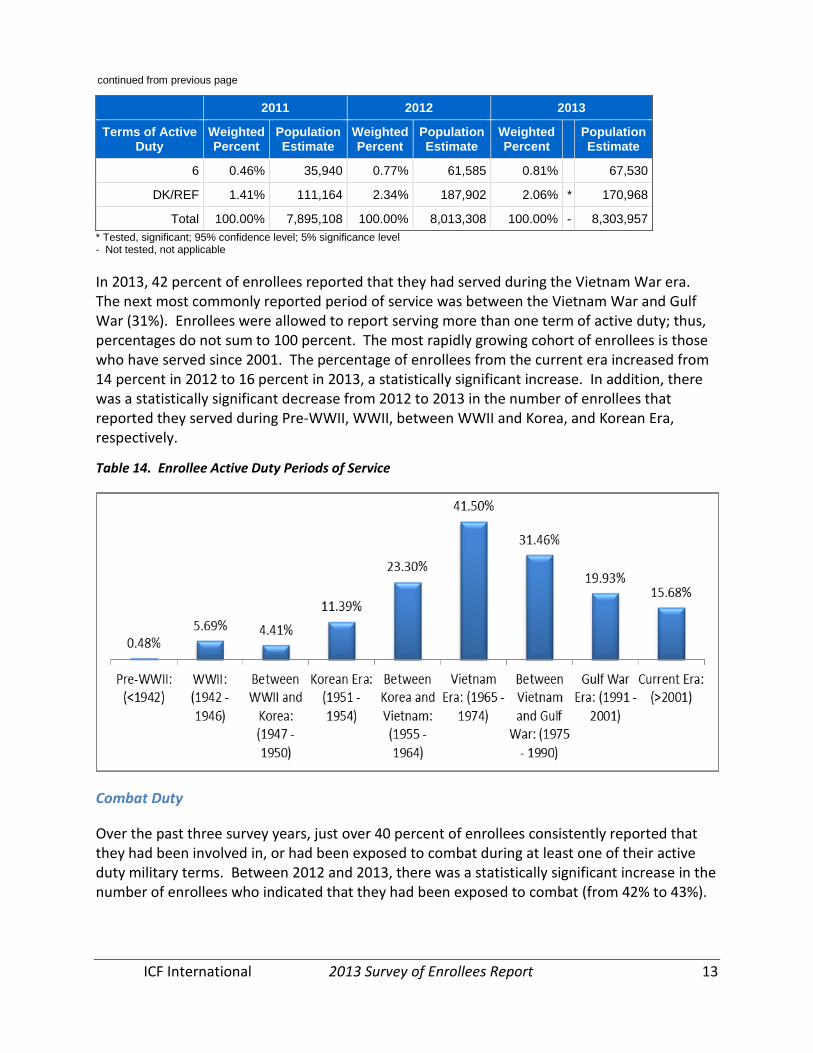
6 0.46% 35,940 0.77% 61,585 0.81% . 67,530
DK/REF 1.41% 111,164 2.34% 187,902 2.06% * 170,968
Total 100.00% 7,895,108 100.00% 8,013,308 100.00% - 8,303,957 * Tested, significant; 95% confidence level; 5% significance level - Not tested, not applicable
In 2013, 42 percent of enrollees reported that they had served during the Vietnam War era. The next most commonly reported period of service was between the Vietnam War and Gulf War (31%). Enrollees were allowed to report serving more than one term of active duty; thus, percentages do not sum to 100 percent. The most rapidly growing cohort of enrollees is those who have served since 2001. The percentage of enrollees from the current era increased from 14 percent in 2012 to 16 percent in 2013, a statistically significant increase. In addition, there was a statistically significant decrease from 2012 to 2013 in the number of enrollees that reported they served during Pre-WWII, WWII, between WWII and Korea, and Korean Era, respectively.
Table 14. Enrollee Active Duty Periods of Service
Combat Duty
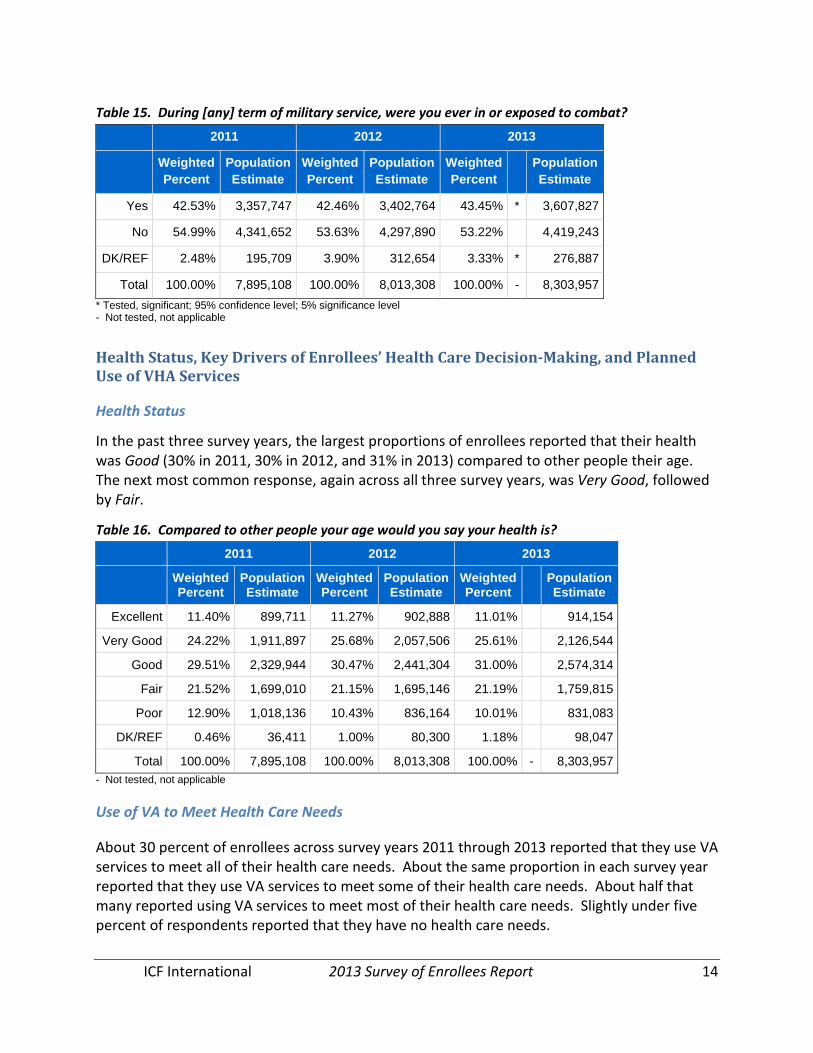
Over the past three survey years, just over 40 percent of enrollees consistently reported that they had been involved in, or had been exposed to combat during at least one of their active duty military terms. Between 2012 and 2013, there was a statistically significant increase in the number of enrollees who indicated that they had been exposed to combat (from 42% to 43%).
continued from previous page
ICF International 2013 Survey of Enrollees Report 14
Table 15. During [any] term of military service, were you ever in or exposed to combat?
2011 2012 2013
Weighted Percent
Population Estimate
Weighted Percent
Population Estimate
Weighted Percent
Population Estimate
Yes 42.53% 3,357,747 42.46% 3,402,764 43.45% * 3,607,827
No 54.99% 4,341,652 53.63% 4,297,890 53.22% . 4,419,243
DK/REF 2.48% 195,709 3.90% 312,654 3.33% * 276,887
Total 100.00% 7,895,108 100.00% 8,013,308 100.00% - 8,303,957 * Tested, significant; 95% confidence level; 5% significance level - Not tested, not applicable
Health Status, Key Drivers of Enrollees’ Health Care Decision-Making, and Planned Use of VHA Services
Health Status
In the past three survey years, the largest proportions of enrollees reported that their health was Good (30% in 2011, 30% in 2012, and 31% in 2013) compared to other people their age. The next most common response, again across all three survey years, was Very Good, followed by Fair.
Table 16. Compared to other people your age would you say your health is?
2011 2012 2013
Weighted Percent
Population Estimate
Weighted Percent
Population Estimate
Weighted Percent
Population Estimate
Excellent 11.40% 899,711 11.27% 902,888 11.01% . 914,154
Very Good 24.22% 1,911,897 25.68% 2,057,506 25.61% . 2,126,544
Good 29.51% 2,329,944 30.47% 2,441,304 31.00% . 2,574,314
Fair 21.52% 1,699,010 21.15% 1,695,146 21.19% . 1,759,815
Poor 12.90% 1,018,136 10.43% 836,164 10.01% . 831,083
DK/REF 0.46% 36,411 1.00% 80,300 1.18% . 98,047
Total 100.00% 7,895,108 100.00% 8,013,308 100.00% - 8,303,957 - Not tested, not applicable
Use of VA to Meet Health Care Needs
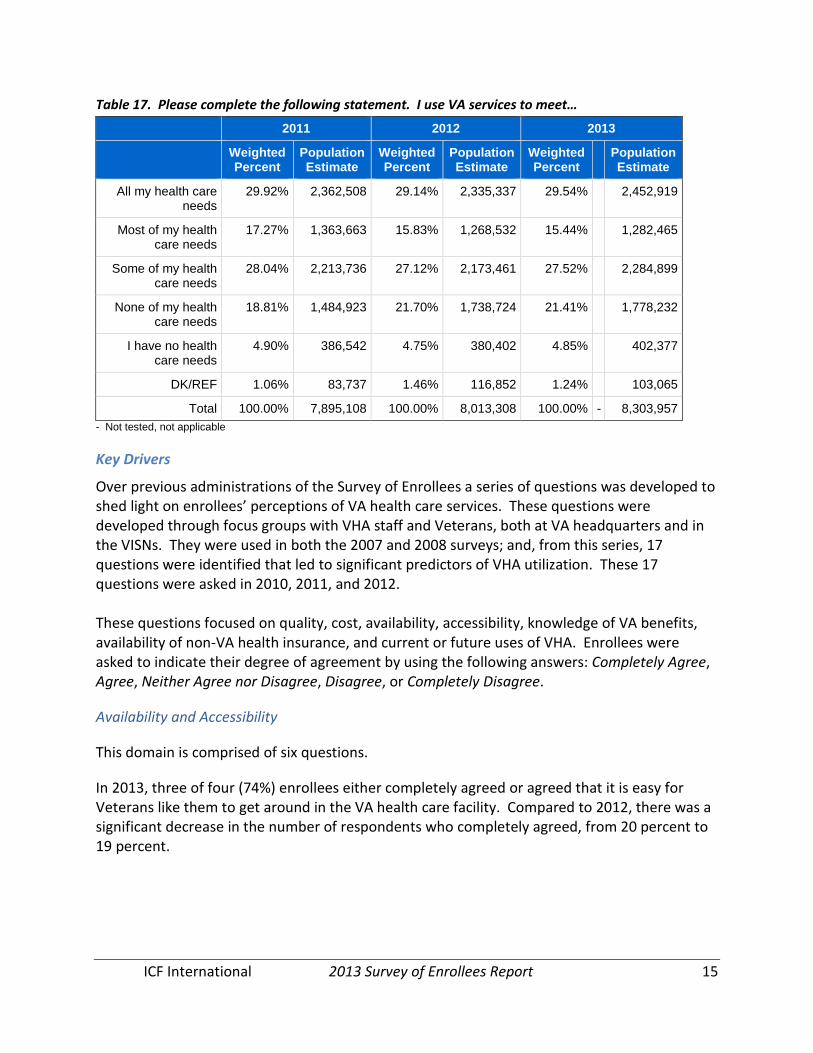
About 30 percent of enrollees across survey years 2011 through 2013 reported that they use VA services to meet all of their health care needs. About the same proportion in each survey year reported that they use VA services to meet some of their health care needs. About half that many reported using VA services to meet most of their health care needs. Slightly under five percent of respondents reported that they have no health care needs.
ICF International 2013 Survey of Enrollees Report 15
Table 17. Please complete the following statement. I use VA services to meet…
2011 2012 2013
Weighted Percent
Population Estimate
Weighted Percent
Population Estimate
Weighted Percent
Population Estimate
All my health care needs
29.92% 2,362,508 29.14% 2,335,337 29.54% . 2,452,919
Most of my health care needs
17.27% 1,363,663 15.83% 1,268,532 15.44% . 1,282,465
Some of my health care needs
28.04% 2,213,736 27.12% 2,173,461 27.52% . 2,284,899
None of my health care needs
18.81% 1,484,923 21.70% 1,738,724 21.41% . 1,778,232
I have no health care needs
4.90% 386,542 4.75% 380,402 4.85% . 402,377
DK/REF 1.06% 83,737 1.46% 116,852 1.24% . 103,065
Total 100.00% 7,895,108 100.00% 8,013,308 100.00% - 8,303,957 - Not tested, not applicable
Key Drivers
Over previous administrations of the Survey of Enrollees a series of questions was developed to shed light on enrollees’ perceptions of VA health care services. These questions were developed through focus groups with VHA staff and Veterans, both at VA headquarters and in the VISNs. They were used in both the 2007 and 2008 surveys; and, from this series, 17 questions were identified that led to significant predictors of VHA utilization. These 17 questions were asked in 2010, 2011, and 2012. These questions focused on quality, cost, availability, accessibility, knowledge of VA benefits, availability of non-VA health insurance, and current or future uses of VHA. Enrollees were asked to indicate their degree of agreement by using the following answers: Completely Agree, Agree, Neither Agree nor Disagree, Disagree, or Completely Disagree.
Availability and Accessibility
This domain is comprised of six questions.
In 2013, three of four (74%) enrollees either completely agreed or agreed that it is easy for Veterans like them to get around in the VA health care facility. Compared to 2012, there was a significant decrease in the number of respondents who completely agreed, from 20 percent to 19 percent.

ICF International 2013 Survey of Enrollees Report 16
Table 18. It is easy for Veterans like me to get around in the VA healthcare facility
2011 2012 2013
Weighted Percent
Population Estimate
Weighted Percent
Population Estimate
Weighted Percent
Population Estimate
Completely Agree 14.79% 1,167,736 19.79% 1,585,670 19.03% * 1,579,871
Agree 64.86% 5,120,587 54.47% 4,365,227 55.40% . 4,600,042
Neither Agree Nor Disagree 6.67% 526,625 13.69% 1,097,255 13.45% . 1,116,842
Disagree 8.02% 633,274 6.37% 510,088 6.15% . 510,616
Completely Disagree 1.40% 110,778 1.35% 108,419 1.36% . 113,108
DK/REF 4.26% 336,107 4.33% 346,649 4.62% . 383,478
Total 100.00% 7,895,108 100.00% 8,013,308 100.00% - 8,303,957 * Tested, significant; 95% confidence level; 5% significance level - Not tested, not applicable
In 2013, three of four (74%) enrollees either completely agreed or agreed that it is easy to get to their local VA facility. Additionally, as seen in the results below, the proportion reporting that they agreed increased significantly (from 52% in 2012 to 54% in 2013).
Table 19. It is easy to get to my local VA facility
2011 2012 2013
Weighted Percent
Population Estimate
Weighted Percent
Population Estimate
Weighted Percent
Population Estimate
Completely Agree 15.24% 1,203,138 20.57% 1,648,204 19.87% . 1,649,629
Agree 61.42% 4,848,823 52.46% 4,203,457 54.00% * 4,483,734
Neither Agree Nor Disagree 4.68% 369,666 9.01% 721,832 8.69% . 721,518
Disagree 14.43% 1,138,884 12.31% 986,285 11.77% . 977,436
Completely Disagree 2.59% 204,255 2.86% 229,347 2.70% . 223,930
DK/REF 1.65% 130,341 2.80% 224,183 2.98% . 247,710
Total 100.00% 7,895,108 100.00% 8,013,308 100.00% - 8,303,957 * Tested, significant; 95% confidence level; 5% significance level - Not tested, not applicable
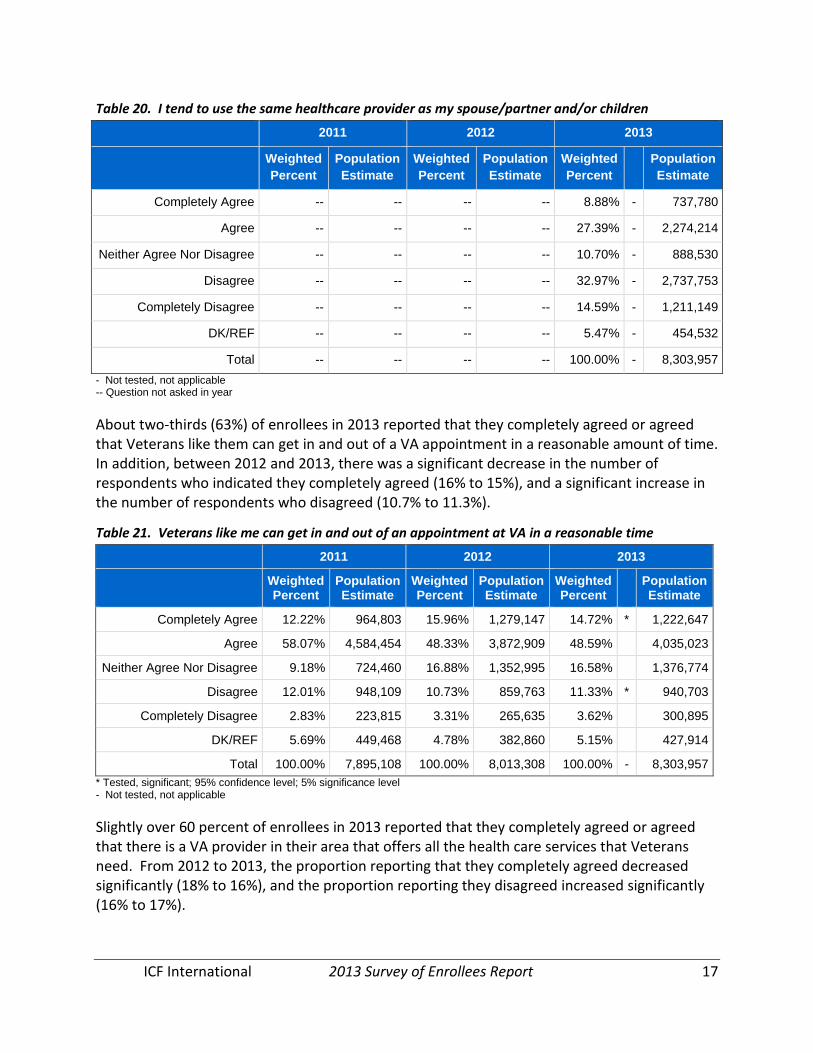
Starting in 2013, enrollees were asked if they tend to use the same health care providers as their spouse/partner and/or children. Almost 33 percent disagreed with this statement, while 27 percent agreed with it.
ICF International 2013 Survey of Enrollees Report 17
Table 20. I tend to use the same healthcare provider as my spouse/partner and/or children
2011 2012 2013
Weighted Percent
Population Estimate
Weighted Percent
Population Estimate
Weighted Percent
Population Estimate
Completely Agree -- -- -- -- 8.88% - 737,780
Agree -- -- -- -- 27.39% - 2,274,214
Neither Agree Nor Disagree -- -- -- -- 10.70% - 888,530
Disagree -- -- -- -- 32.97% - 2,737,753
Completely Disagree -- -- -- -- 14.59% - 1,211,149
DK/REF -- -- -- -- 5.47% - 454,532
Total -- -- -- -- 100.00% - 8,303,957 - Not tested, not applicable -- Question not asked in year
About two-thirds (63%) of enrollees in 2013 reported that they completely agreed or agreed that Veterans like them can get in and out of a VA appointment in a reasonable amount of time. In addition, between 2012 and 2013, there was a significant decrease in the number of respondents who indicated they completely agreed (16% to 15%), and a significant increase in the number of respondents who disagreed (10.7% to 11.3%).
Table 21. Veterans like me can get in and out of an appointment at VA in a reasonable time
2011 2012 2013
Weighted Percent
Population Estimate
Weighted Percent
Population Estimate
Weighted Percent
Population Estimate
Completely Agree 12.22% 964,803 15.96% 1,279,147 14.72% * 1,222,647
Agree 58.07% 4,584,454 48.33% 3,872,909 48.59% . 4,035,023
Neither Agree Nor Disagree 9.18% 724,460 16.88% 1,352,995 16.58% . 1,376,774
Disagree 12.01% 948,109 10.73% 859,763 11.33% * 940,703
Completely Disagree 2.83% 223,815 3.31% 265,635 3.62% . 300,895
DK/REF 5.69% 449,468 4.78% 382,860 5.15% . 427,914
Total 100.00% 7,895,108 100.00% 8,013,308 100.00% - 8,303,957 * Tested, significant; 95% confidence level; 5% significance level - Not tested, not applicable
Slightly over 60 percent of enrollees in 2013 reported that they completely agreed or agreed that there is a VA provider in their area that offers all the health care services that Veterans need. From 2012 to 2013, the proportion reporting that they completely agreed decreased significantly (18% to 16%), and the proportion reporting they disagreed increased significantly (16% to 17%).

ICF International 2013 Survey of Enrollees Report 18
Table 22. There is a VA provider in my area that offers all of the healthcare services that Veterans like me need
2011 2012 2013
Weighted Percent
Population Estimate
Weighted Percent
Population Estimate
Weighted Percent
Population Estimate
Completely Agree 13.38% 1,056,013 17.72% 1,420,029 15.89% * 1,319,893
Agree 53.84% 4,250,907 45.67% 3,659,840 45.23% . 3,756,287
Neither Agree Nor Disagree 6.52% 514,763 12.49% 1,000,532 12.93% . 1,073,747
Disagree 18.71% 1,477,008 15.86% 1,271,219 17.17% * 1,425,394
Completely Disagree 3.11% 245,623 3.72% 298,380 3.92% . 325,144
DK/REF 4.44% 350,794 4.53% 363,308 4.86% . 403,491
Total 100.00% 7,895,108 100.00% 8,013,308 100.00% - 8,303,957 * Tested, significant; 95% confidence level; 5% significance level - Not tested, not applicable
In 2013, 13 percent of respondents completely agreed that Veterans do not wait a long time to see the doctor, which was a significant decrease from 2012 (14%). However, 46 percent agreed with this statement. In addition, compared to 2012, there was a significant increase in the number of respondents indicating they didn’t know or refused to answer (4.9% to 5.5%).
Table 23. When Veterans like me go to VA for an appointment, they do not wait a long time to see the doctor
2011 2012 2013
Weighted Percent
Population Estimate
Weighted Percent
Population Estimate
Weighted Percent
Population Estimate
Completely Agree 11.00% 868,676 14.20% 1,137,626 13.03% * 1,081,633
Agree 53.69% 4,238,572 45.61% 3,655,003 45.67% . 3,792,139
Neither Agree Nor Disagree 11.19% 883,466 18.80% 1,506,501 18.61% . 1,545,140
Disagree 14.88% 1,174,557 13.00% 1,042,063 13.58% . 1,128,082
Completely Disagree 3.20% 252,680 3.54% 283,801 3.63% . 301,523
DK/REF 6.04% 477,157 4.85% 388,315 5.48% * 455,439
Total 100.00% 7,895,108 100.00% 8,013,308 100.00% - 8,303,957 * Tested, significant; 95% confidence level; 5% significance level - Not tested, not applicable
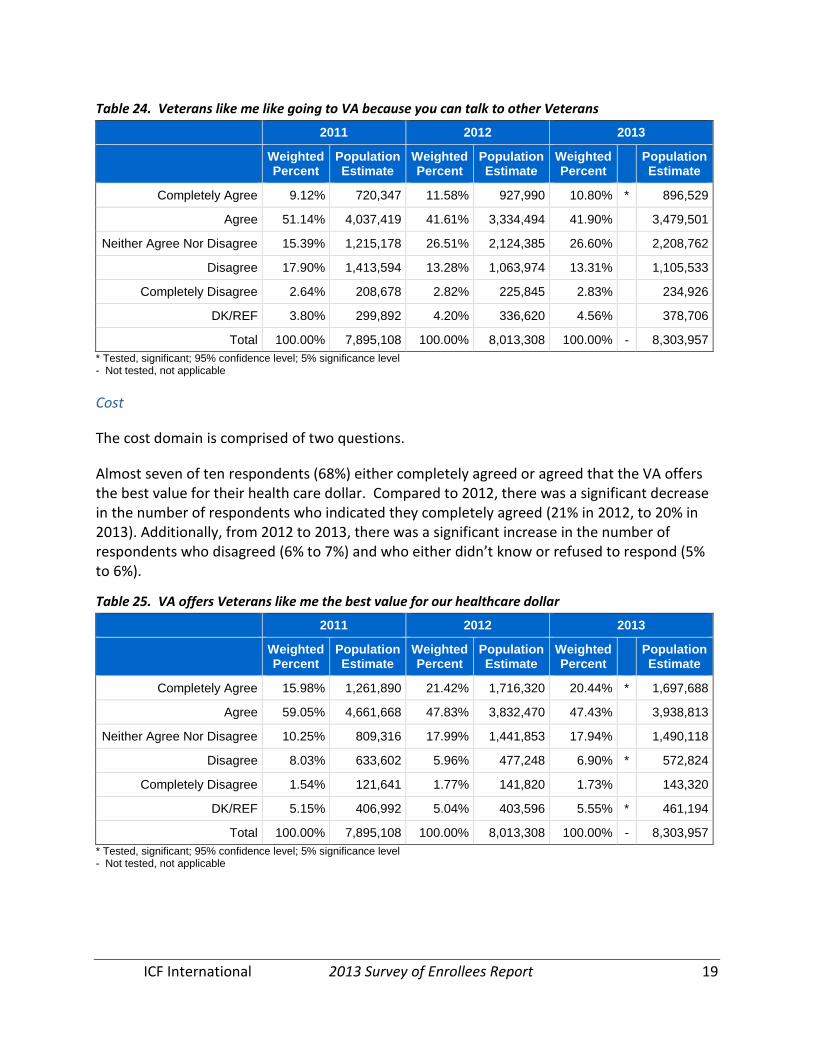
The last question in this domain asked how strongly respondents agreed or disagreed that Veterans like going to VA because they can talk to other Veterans. In all, 53 percent either completely agreed or agreed with this statement. Compared to 2012, there was a significant decrease in the number of respondents who indicated they completely agreed.
ICF International 2013 Survey of Enrollees Report 19
Table 24. Veterans like me like going to VA because you can talk to other Veterans
2011 2012 2013
Weighted Percent
Population Estimate
Weighted Percent
Population Estimate
Weighted Percent
Population Estimate
Completely Agree 9.12% 720,347 11.58% 927,990 10.80% * 896,529
Agree 51.14% 4,037,419 41.61% 3,334,494 41.90% . 3,479,501
Neither Agree Nor Disagree 15.39% 1,215,178 26.51% 2,124,385 26.60% . 2,208,762
Disagree 17.90% 1,413,594 13.28% 1,063,974 13.31% . 1,105,533
Completely Disagree 2.64% 208,678 2.82% 225,845 2.83% . 234,926
DK/REF 3.80% 299,892 4.20% 336,620 4.56% . 378,706
Total 100.00% 7,895,108 100.00% 8,013,308 100.00% - 8,303,957 * Tested, significant; 95% confidence level; 5% significance level - Not tested, not applicable
Cost
The cost domain is comprised of two questions.
Almost seven of ten respondents (68%) either completely agreed or agreed that the VA offers the best value for their health care dollar. Compared to 2012, there was a significant decrease in the number of respondents who indicated they completely agreed (21% in 2012, to 20% in 2013). Additionally, from 2012 to 2013, there was a significant increase in the number of respondents who disagreed (6% to 7%) and who either didn’t know or refused to respond (5% to 6%).
Table 25. VA offers Veterans like me the best value for our healthcare dollar
2011 2012 2013
Weighted Percent
Population Estimate
Weighted Percent
Population Estimate
Weighted Percent
Population Estimate
Completely Agree 15.98% 1,261,890 21.42% 1,716,320 20.44% * 1,697,688
Agree 59.05% 4,661,668 47.83% 3,832,470 47.43% . 3,938,813
Neither Agree Nor Disagree 10.25% 809,316 17.99% 1,441,853 17.94% . 1,490,118
Disagree 8.03% 633,602 5.96% 477,248 6.90% * 572,824
Completely Disagree 1.54% 121,641 1.77% 141,820 1.73% . 143,320
DK/REF 5.15% 406,992 5.04% 403,596 5.55% * 461,194
Total 100.00% 7,895,108 100.00% 8,013,308 100.00% - 8,303,957 * Tested, significant; 95% confidence level; 5% significance level - Not tested, not applicable
ICF International 2013 Survey of Enrollees Report 20
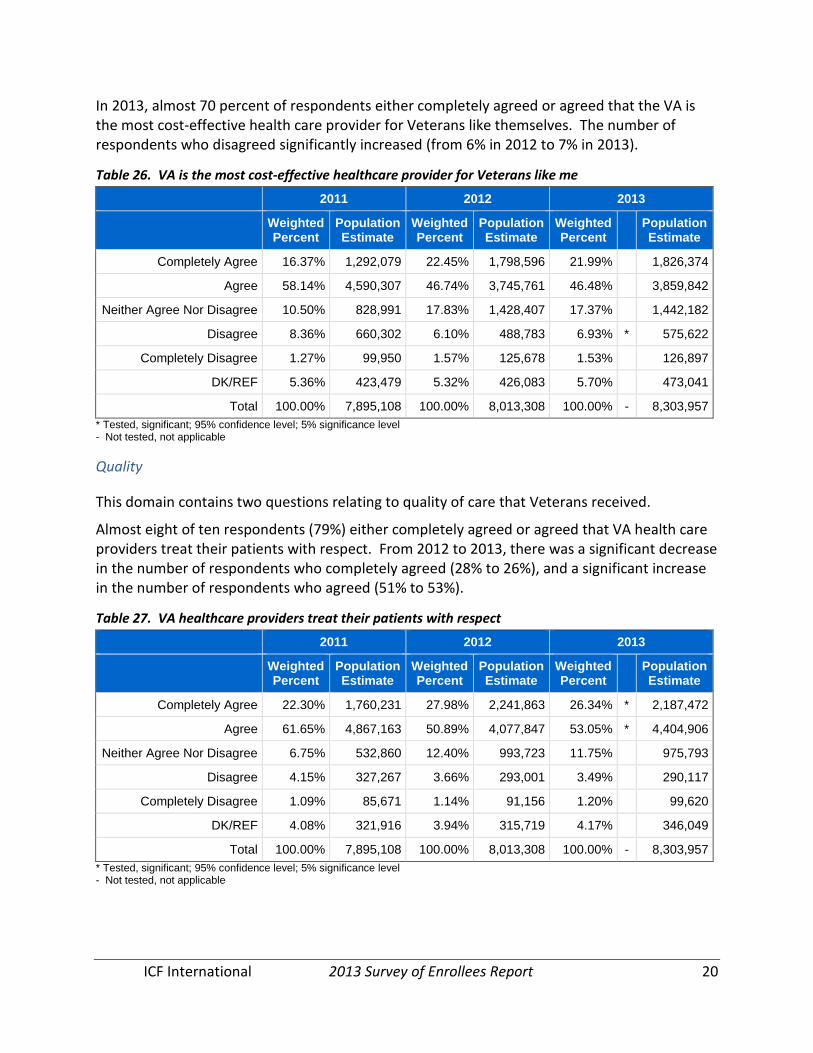
In 2013, almost 70 percent of respondents either completely agreed or agreed that the VA is the most cost-effective health care provider for Veterans like themselves. The number of respondents who disagreed significantly increased (from 6% in 2012 to 7% in 2013).
Table 26. VA is the most cost-effective healthcare provider for Veterans like me
2011 2012 2013
Weighted Percent
Population Estimate
Weighted Percent
Population Estimate
Weighted Percent
Population Estimate
Completely Agree 16.37% 1,292,079 22.45% 1,798,596 21.99% . 1,826,374
Agree 58.14% 4,590,307 46.74% 3,745,761 46.48% . 3,859,842
Neither Agree Nor Disagree 10.50% 828,991 17.83% 1,428,407 17.37% . 1,442,182
Disagree 8.36% 660,302 6.10% 488,783 6.93% * 575,622
Completely Disagree 1.27% 99,950 1.57% 125,678 1.53% . 126,897
DK/REF 5.36% 423,479 5.32% 426,083 5.70% . 473,041
Total 100.00% 7,895,108 100.00% 8,013,308 100.00% - 8,303,957 * Tested, significant; 95% confidence level; 5% significance level - Not tested, not applicable
Quality
This domain contains two questions relating to quality of care that Veterans received.
Almost eight of ten respondents (79%) either completely agreed or agreed that VA health care providers treat their patients with respect. From 2012 to 2013, there was a significant decrease in the number of respondents who completely agreed (28% to 26%), and a significant increase in the number of respondents who agreed (51% to 53%).
Table 27. VA healthcare providers treat their patients with respect
2011 2012 2013
Weighted Percent
Population Estimate
Weighted Percent
Population Estimate
Weighted Percent
Population Estimate
Completely Agree 22.30% 1,760,231 27.98% 2,241,863 26.34% * 2,187,472
Agree 61.65% 4,867,163 50.89% 4,077,847 53.05% * 4,404,906
Neither Agree Nor Disagree 6.75% 532,860 12.40% 993,723 11.75% . 975,793
Disagree 4.15% 327,267 3.66% 293,001 3.49% . 290,117
Completely Disagree 1.09% 85,671 1.14% 91,156 1.20% . 99,620
DK/REF 4.08% 321,916 3.94% 315,719 4.17% . 346,049
Total 100.00% 7,895,108 100.00% 8,013,308 100.00% - 8,303,957 * Tested, significant; 95% confidence level; 5% significance level - Not tested, not applicable

ICF International 2013 Survey of Enrollees Report 21
Approximately half (50%) of 2013 respondents agreed that Veterans who use VA are satisfied with the health care they receive; 17 percent completely agreed with this statement, a significant decrease from 2012. In addition, compared to 2012, there was a significant increase in the number of respondents who indicated they disagreed (7% to 8%).
Table 28. Veterans like me who use VA are satisfied with the healthcare they receive
2011 2012 2013
Weighted Percent
Population Estimate
Weighted Percent
Population Estimate
Weighted Percent
Population Estimate
Completely Agree 14.80% 1,168,538 18.26% 1,463,579 16.67% * 1,384,653
Agree 58.25% 4,599,119 49.28% 3,948,809 49.57% . 4,116,029
Neither Agree Nor Disagree 10.81% 853,680 18.34% 1,469,924 18.51% . 1,537,067
Disagree 8.92% 704,144 7.17% 574,713 8.06% * 669,325
Completely Disagree 1.86% 147,088 2.01% 161,378 2.11% . 174,867
DK/REF 5.35% 422,540 4.93% 394,905 5.08% . 422,017
Total 100.00% 7,895,108 100.00% 8,013,308 100.00% - 8,303,957 * Tested, significant; 95% confidence level; 5% significance level - Not tested, not applicable
Knowledge of VA Benefits
This domain contains two questions.
Veterans were asked to indicate how much they agreed or disagreed that they know what is available to them through their VA benefits. Consistently across the previous three survey years, one in 10 enrollees completely agreed with this statement. In 2013, 61 percent of enrollees either completely agreed (11%) or agreed (51%).
Table 29. I feel I know what is available to me through my VA benefits
2011 2012 2013
Weighted Percent
Population Estimate
Weighted Percent
Population Estimate
Weighted Percent
Population Estimate
Completely Agree 9.31% 735,160 10.89% 872,758 10.65% . 884,494
Agree 59.62% 4,706,849 50.91% 4,079,663 50.64% . 4,205,259
Neither Agree Nor Disagree 8.02% 633,196 13.77% 1,103,781 13.91% . 1,154,710
Disagree 17.06% 1,347,183 16.59% 1,329,149 16.94% . 1,407,077
Completely Disagree 2.60% 204,898 4.20% 336,943 3.86% . 320,777
DK/REF 3.39% 267,821 3.63% 291,015 3.99% . 331,640
Total 100.00% 7,895,108 100.00% 8,013,308 100.00% - 8,303,957 - Not tested, not applicable

ICF International 2013 Survey of Enrollees Report 22
The second question in this domain indicates how much enrollees agree or disagree that they understand how their VA benefits work. Approximately 60 percent either completely agreed or agreed with this statement. One in five respondents in 2013 (20%) either disagreed or completely disagreed, indicating that they do not understand how their VA health benefits work.
Table 30. I understand how my VA health benefits work
2011 2012 2013
Weighted Percent
Population Estimate
Weighted Percent
Population Estimate
Weighted Percent
Population Estimate
Completely Agree 9.50% 750,404 10.28% 823,523 10.04% . 833,783
Agree 60.15% 4,748,931 50.67% 4,060,315 50.70% . 4,210,367
Neither Agree Nor Disagree 8.81% 695,771 14.91% 1,194,850 15.00% . 1,245,263
Disagree 15.99% 1,262,038 16.44% 1,317,090 16.64% . 1,381,546
Completely Disagree 2.49% 196,615 3.98% 318,895 3.75% . 311,447
DK/REF 3.06% 241,349 3.73% 298,635 3.87% . 321,551
Total 100.00% 7,895,108 100.00% 8,013,308 100.00% - 8,303,957 - Not tested, not applicable
Availability of Non-VA Benefits
This domain is comprised of two questions.
In 2013, 16 percent of respondents completely agreed that they have a doctor outside the VA that they really like and trust, a significant increase from 2012. There were significant decreases in the number of respondents who completely disagreed (11% in 2012 to 10% in 2013) and didn’t know or refused to respond (4% in 2012 to 3% in 2013).
Table 31. I have a doctor outside VA who I really like and trust
2011 2012 2013
Weighted Percent
Population Estimate
Weighted Percent
Population Estimate
Weighted Percent
Population Estimate
Completely Agree 11.69% 923,281 15.38% 1,232,625 16.45% * 1,365,900
Agree 44.83% 3,539,752 36.23% 2,903,046 37.02% . 3,074,326
Neither Agree Nor Disagree 5.88% 464,012 11.35% 909,870 11.04% . 916,533
Disagree 27.41% 2,164,418 22.51% 1,804,079 22.80% . 1,893,250
Completely Disagree 8.09% 638,480 11.02% 882,850 9.54% * 792,205
DK/REF 2.09% 165,165 3.50% 280,839 3.15% * 261,744
Total 100.00% 7,895,108 100.00% 8,013,308 100.00% - 8,303,957 * Tested, significant; 95% confidence level; 5% significance level - Not tested, not applicable
ICF International 2013 Survey of Enrollees Report 23
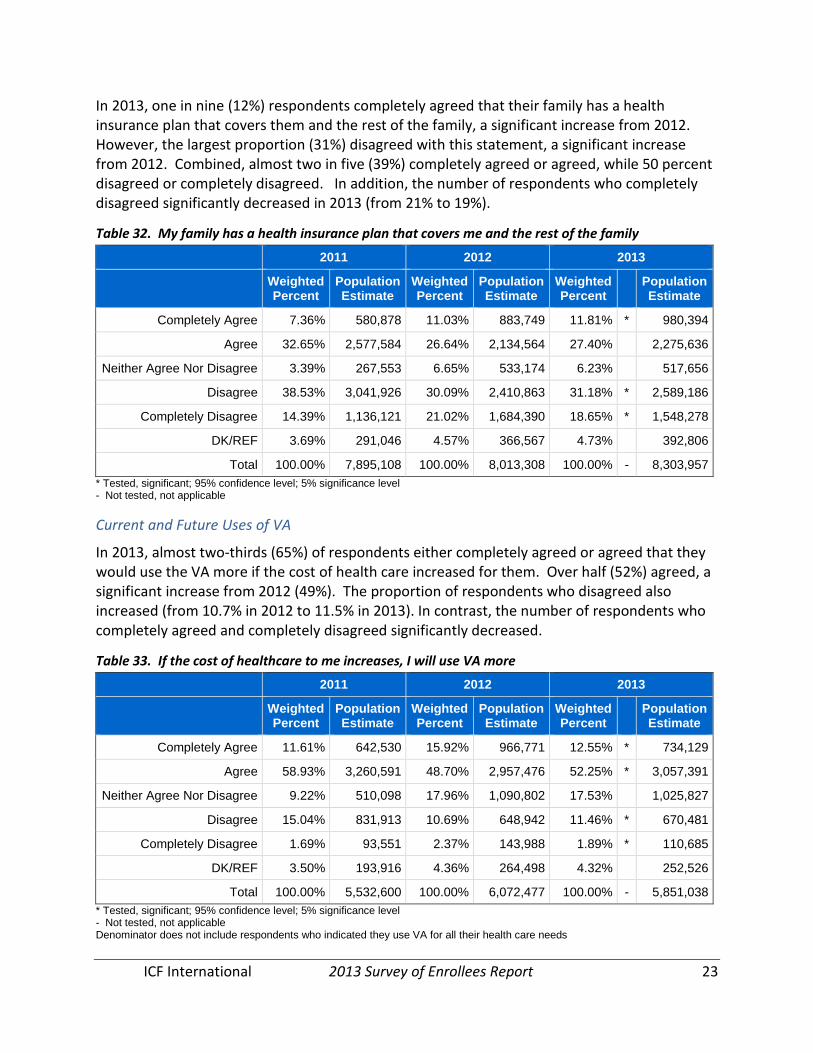
In 2013, one in nine (12%) respondents completely agreed that their family has a health insurance plan that covers them and the rest of the family, a significant increase from 2012. However, the largest proportion (31%) disagreed with this statement, a significant increase from 2012. Combined, almost two in five (39%) completely agreed or agreed, while 50 percent disagreed or completely disagreed. In addition, the number of respondents who completely disagreed significantly decreased in 2013 (from 21% to 19%).
Table 32. My family has a health insurance plan that covers me and the rest of the family
2011 2012 2013
Weighted Percent
Population Estimate
Weighted Percent
Population Estimate
Weighted Percent
Population Estimate
Completely Agree 7.36% 580,878 11.03% 883,749 11.81% * 980,394
Agree 32.65% 2,577,584 26.64% 2,134,564 27.40% . 2,275,636
Neither Agree Nor Disagree 3.39% 267,553 6.65% 533,174 6.23% . 517,656
Disagree 38.53% 3,041,926 30.09% 2,410,863 31.18% * 2,589,186
Completely Disagree 14.39% 1,136,121 21.02% 1,684,390 18.65% * 1,548,278
DK/REF 3.69% 291,046 4.57% 366,567 4.73% . 392,806
Total 100.00% 7,895,108 100.00% 8,013,308 100.00% - 8,303,957 * Tested, significant; 95% confidence level; 5% significance level - Not tested, not applicable
Current and Future Uses of VA
In 2013, almost two-thirds (65%) of respondents either completely agreed or agreed that they would use the VA more if the cost of health care increased for them. Over half (52%) agreed, a significant increase from 2012 (49%). The proportion of respondents who disagreed also increased (from 10.7% in 2012 to 11.5% in 2013). In contrast, the number of respondents who completely agreed and completely disagreed significantly decreased.
Table 33. If the cost of healthcare to me increases, I will use VA more
2011 2012 2013
Weighted Percent
Population Estimate
Weighted Percent
Population Estimate
Weighted Percent
Population Estimate
Completely Agree 11.61% 642,530 15.92% 966,771 12.55% * 734,129
Agree 58.93% 3,260,591 48.70% 2,957,476 52.25% * 3,057,391
Neither Agree Nor Disagree 9.22% 510,098 17.96% 1,090,802 17.53% . 1,025,827
Disagree 15.04% 831,913 10.69% 648,942 11.46% * 670,481
Completely Disagree 1.69% 93,551 2.37% 143,988 1.89% * 110,685
DK/REF 3.50% 193,916 4.36% 264,498 4.32% . 252,526
Total 100.00% 5,532,600 100.00% 6,072,477 100.00% - 5,851,038 * Tested, significant; 95% confidence level; 5% significance level - Not tested, not applicable Denominator does not include respondents who indicated they use VA for all their health care needs
ICF International 2013 Survey of Enrollees Report 24
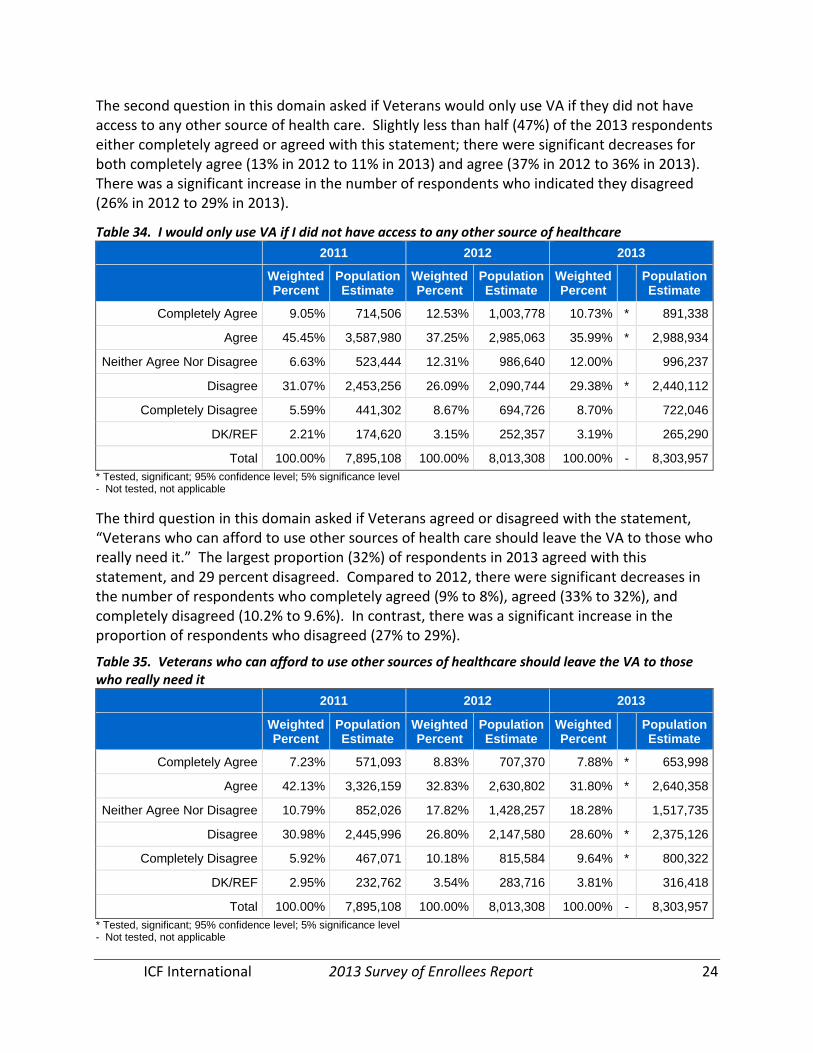
The second question in this domain asked if Veterans would only use VA if they did not have access to any other source of health care. Slightly less than half (47%) of the 2013 respondents either completely agreed or agreed with this statement; there were significant decreases for both completely agree (13% in 2012 to 11% in 2013) and agree (37% in 2012 to 36% in 2013). There was a significant increase in the number of respondents who indicated they disagreed (26% in 2012 to 29% in 2013).
Table 34. I would only use VA if I did not have access to any other source of healthcare 2011 2012 2013
Weighted Percent
Population Estimate
Weighted Percent
Population Estimate
Weighted Percent
Population Estimate
Completely Agree 9.05% 714,506 12.53% 1,003,778 10.73% * 891,338
Agree 45.45% 3,587,980 37.25% 2,985,063 35.99% * 2,988,934
Neither Agree Nor Disagree 6.63% 523,444 12.31% 986,640 12.00% . 996,237
Disagree 31.07% 2,453,256 26.09% 2,090,744 29.38% * 2,440,112
Completely Disagree 5.59% 441,302 8.67% 694,726 8.70% . 722,046
DK/REF 2.21% 174,620 3.15% 252,357 3.19% . 265,290
Total 100.00% 7,895,108 100.00% 8,013,308 100.00% - 8,303,957 * Tested, significant; 95% confidence level; 5% significance level - Not tested, not applicable
The third question in this domain asked if Veterans agreed or disagreed with the statement, “Veterans who can afford to use other sources of health care should leave the VA to those who really need it.” The largest proportion (32%) of respondents in 2013 agreed with this statement, and 29 percent disagreed. Compared to 2012, there were significant decreases in the number of respondents who completely agreed (9% to 8%), agreed (33% to 32%), and completely disagreed (10.2% to 9.6%). In contrast, there was a significant increase in the proportion of respondents who disagreed (27% to 29%).
Table 35. Veterans who can afford to use other sources of healthcare should leave the VA to those who really need it
2011 2012 2013
Weighted Percent
Population Estimate
Weighted Percent
Population Estimate
Weighted Percent
Population Estimate
Completely Agree 7.23% 571,093 8.83% 707,370 7.88% * 653,998
Agree 42.13% 3,326,159 32.83% 2,630,802 31.80% * 2,640,358
Neither Agree Nor Disagree 10.79% 852,026 17.82% 1,428,257 18.28% . 1,517,735
Disagree 30.98% 2,445,996 26.80% 2,147,580 28.60% * 2,375,126
Completely Disagree 5.92% 467,071 10.18% 815,584 9.64% * 800,322
DK/REF 2.95% 232,762 3.54% 283,716 3.81% . 316,418
Total 100.00% 7,895,108 100.00% 8,013,308 100.00% - 8,303,957 * Tested, significant; 95% confidence level; 5% significance level - Not tested, not applicable
ICF International 2013 Survey of Enrollees Report 25
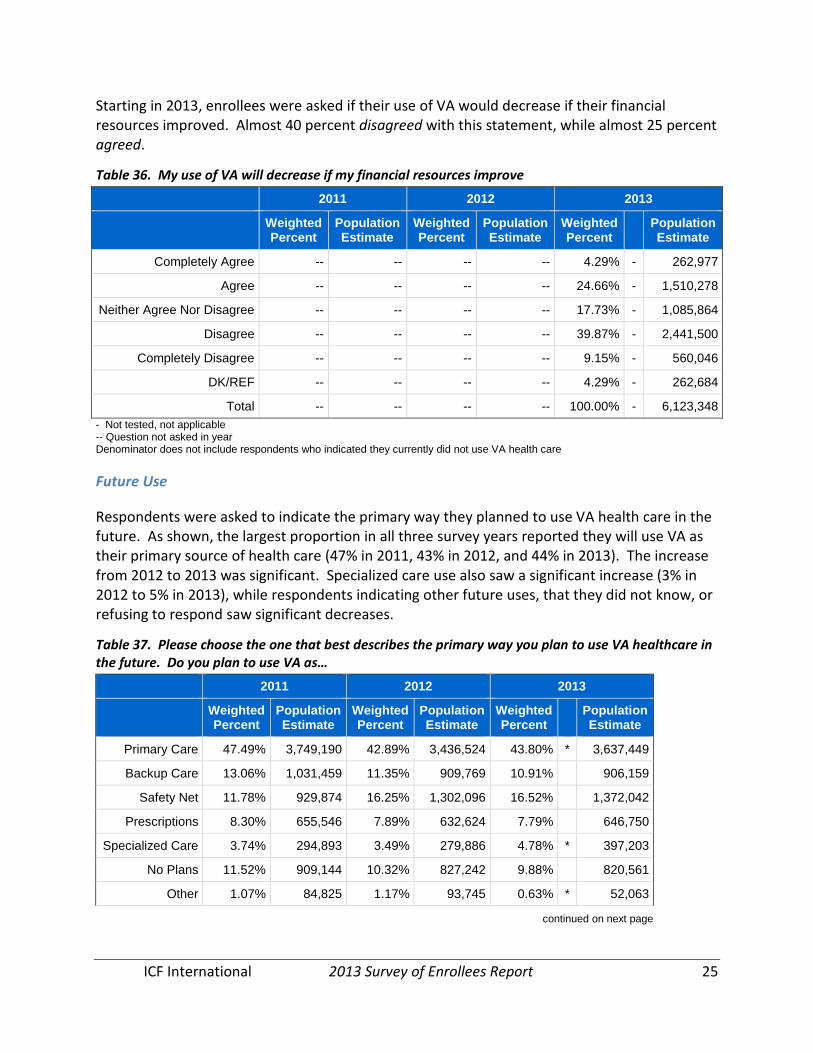
Starting in 2013, enrollees were asked if their use of VA would decrease if their financial resources improved. Almost 40 percent disagreed with this statement, while almost 25 percent agreed.
Table 36. My use of VA will decrease if my financial resources improve
2011 2012 2013
Weighted Percent
Population Estimate
Weighted Percent
Population Estimate
Weighted Percent
Population Estimate
Completely Agree -- -- -- -- 4.29% - 262,977
Agree -- -- -- -- 24.66% - 1,510,278
Neither Agree Nor Disagree -- -- -- -- 17.73% - 1,085,864
Disagree -- -- -- -- 39.87% - 2,441,500
Completely Disagree -- -- -- -- 9.15% - 560,046
DK/REF -- -- -- -- 4.29% - 262,684
Total -- -- -- -- 100.00% - 6,123,348 - Not tested, not applicable -- Question not asked in year Denominator does not include respondents who indicated they currently did not use VA health care
Future Use
Respondents were asked to indicate the primary way they planned to use VA health care in the future. As shown, the largest proportion in all three survey years reported they will use VA as their primary source of health care (47% in 2011, 43% in 2012, and 44% in 2013). The increase from 2012 to 2013 was significant. Specialized care use also saw a significant increase (3% in 2012 to 5% in 2013), while respondents indicating other future uses, that they did not know, or refusing to respond saw significant decreases.
Table 37. Please choose the one that best describes the primary way you plan to use VA healthcare in the future. Do you plan to use VA as…
2011 2012 2013
Weighted Percent
Population Estimate
Weighted Percent
Population Estimate
Weighted Percent
Population Estimate
Primary Care 47.49% 3,749,190 42.89% 3,436,524 43.80% * 3,637,449
Backup Care 13.06% 1,031,459 11.35% 909,769 10.91% . 906,159
Safety Net 11.78% 929,874 16.25% 1,302,096 16.52% . 1,372,042
Prescriptions 8.30% 655,546 7.89% 632,624 7.79% . 646,750
Specialized Care 3.74% 294,893 3.49% 279,886 4.78% * 397,203
No Plans 11.52% 909,144 10.32% 827,242 9.88% . 820,561
Other 1.07% 84,825 1.17% 93,745 0.63% * 52,063
continued on next page

ICF International 2013 Survey of Enrollees Report 26
2011 2012 2013
Weighted Percent
Population Estimate
Weighted Percent
Population Estimate
Weighted Percent
Population Estimate
DK/REF 3.04% 240,176 6.63% 531,424 5.68% * 471,730
Total 100.00% 7,895,108 100.00% 8,013,308 100.00% - 8,303,957 * Tested, significant; 95% confidence level; 5% significance level - Not tested, not applicable
Public and Private Health Insurance Coverage
VA Health Care
All sampled Veterans were VA enrollees. However, the survey asks each enrollee whether they are enrolled in VA health care. From 2012 to 2013, there was a significant increase in the number of respondents who reported that they were not enrolled (13% to 14%), which may indicate a lack of awareness of their VA health care benefits. In contrast, there was a significant decrease in the number of respondents who reported that they did not remember enrolling (5% to 3%).
Table 38. Are you enrolled in VA healthcare?
2011 2012 2013
Weighted Percent
Population Estimate
Weighted Percent
Population Estimate
Weighted Percent
Population Estimate
Yes 81.03% 6,397,153 78.79% 6,313,371 78.80% . 6,543,916
No 14.79% 1,167,646 13.37% 1,071,635 14.32% * 1,189,197
I do not remember enrolling 0.52% 41,326 4.60% 368,486 3.47% * 288,211
DK/REF 3.66% 288,984 3.24% 259,816 3.40% . 282,634
Total 100.00% 7,895,108 100.00% 8,013,308 100.00% - 8,303,957 * Tested, significant; 95% confidence level; 5% significance level - Not tested, not applicable
In 2013, enrollees were asked whether they had enrolled in VA for health care within the last five years. There was a nearly even split between enrollees who responded yes and no (47% and 49%, respectively).
Table 39. Did you enroll in VA for health care within the last five years?
2011 2012 2013
Weighted Percent
Population Estimate
Weighted Percent
Population Estimate
Weighted Percent
Population Estimate
Yes -- -- -- -- 46.80% - 3,062,227
No -- -- -- -- 49.32% - 3,227,280
continued from previous page
continued on next page
ICF International 2013 Survey of Enrollees Report 27
2011 2012 2013
Weighted Percent
Population Estimate
Weighted Percent
Population Estimate
Weighted Percent
Population Estimate
DK/REF -- -- -- -- 3.89% - 254,409
Total -- -- -- -- 100.00% - 6,543,916 - Not tested, not applicable -- Question not asked in year
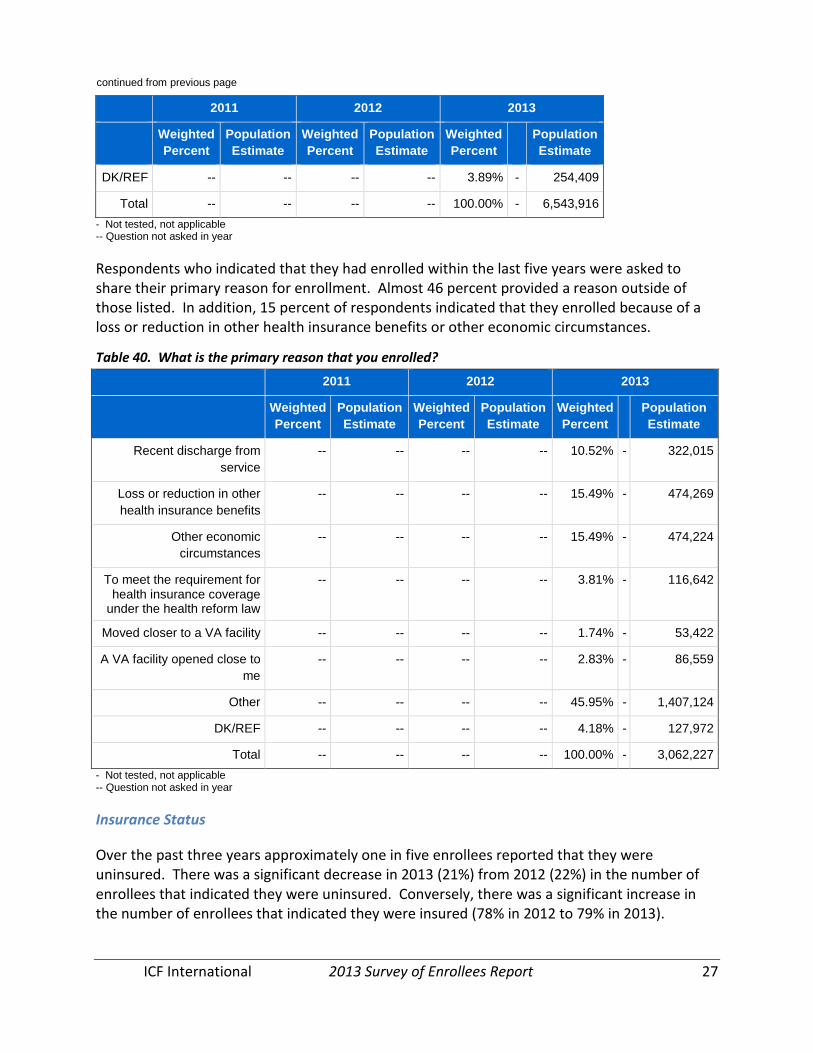
Respondents who indicated that they had enrolled within the last five years were asked to share their primary reason for enrollment. Almost 46 percent provided a reason outside of those listed. In addition, 15 percent of respondents indicated that they enrolled because of a loss or reduction in other health insurance benefits or other economic circumstances.
Table 40. What is the primary reason that you enrolled?
2011 2012 2013
Weighted Percent
Population Estimate
Weighted Percent
Population Estimate
Weighted Percent
Population Estimate
Recent discharge from service
-- -- -- -- 10.52% - 322,015
Loss or reduction in other health insurance benefits
-- -- -- -- 15.49% - 474,269
Other economic circumstances
-- -- -- -- 15.49% - 474,224
To meet the requirement for health insurance coverage
under the health reform law
-- -- -- -- 3.81% - 116,642
Moved closer to a VA facility -- -- -- -- 1.74% - 53,422
A VA facility opened close to me
-- -- -- -- 2.83% - 86,559
Other -- -- -- -- 45.95% - 1,407,124
DK/REF -- -- -- -- 4.18% - 127,972
Total -- -- -- -- 100.00% - 3,062,227 - Not tested, not applicable -- Question not asked in year
Insurance Status
Over the past three years approximately one in five enrollees reported that they were uninsured. There was a significant decrease in 2013 (21%) from 2012 (22%) in the number of enrollees that indicated they were uninsured. Conversely, there was a significant increase in the number of enrollees that indicated they were insured (78% in 2012 to 79% in 2013).
continued from previous page

ICF International 2013 Survey of Enrollees Report 28
Table 41. Insurance Status
2011 2012 2013
Weighted Percent
Population Estimate
Weighted Percent
Population Estimate
Weighted Percent
Population Estimate
Insured 77.05% 6,083,150 77.53% 6,212,444 78.85% * 6,547,399
Uninsured 22.95% 1,811,958 22.47% 1,800,864 21.15% * 1,756,558
Total 100.00% 7,895,108 100.00% 8,013,308 100.00% - 8,303,957 * Tested, significant; 95% confidence level; 5% significance level - Not tested, not applicable
Medicare Coverage
All enrollees reported on whether they were covered by Medicare. In 2013, slightly more than half (52%) of enrollees reported that they were covered. This was similar to the proportions seen in 2012 (50%) and 2011 (51%), though the increase from 2012 to 2013 was significant. Mirroring this change, from 2012 to 2013, the proportion of enrollees without Medicare coverage decreased significantly (48% to 47%).
Table 42. Are you covered by Medicare?
2011 2012 2013
Weighted Percent
Population Estimate
Weighted Percent
Population Estimate
Weighted Percent
Population Estimate
Yes 50.97% 4,024,036 49.93% 4,001,098 52.01% * 4,318,730
No 47.43% 3,744,888 48.48% 3,884,769 46.52% * 3,862,768
DK/REF 1.60% 126,184 1.59% 127,441 1.47% . 122,459
Total 100.00% 7,895,108 100.00% 8,013,308 100.00% - 8,303,957 * Tested, significant; 95% confidence level; 5% significance level - Not tested, not applicable
Respondents with Medicare were asked to report whether they chose to obtain Medicare coverage through a Medicare Advantage Plan (yes in the table below). In each survey year, about one in five respondents chose this option, while the majority obtained their Medicare coverage through the Original Medicare Plan (no in the table below).
Table 43. Did you choose to receive your Medicare coverage through a Medicare Advantage Plan and not through the Original Medicare Plan?
2011 2012 2013
Weighted Percent
Population Estimate
Weighted Percent
Population Estimate
Weighted Percent
Population Estimate
Yes 21.19% 852,736 21.12% 845,016 20.75% . 896,281
No 58.26% 2,344,480 61.82% 2,473,281 61.85% . 2,671,099
continued on next page
ICF International 2013 Survey of Enrollees Report 29
2011 2012 2013
Weighted Percent
Population Estimate
Weighted Percent
Population Estimate
Weighted Percent
Population Estimate
DK/REF 20.55% 826,820 17.07% 682,802 17.40% . 751,351
Total 100.00% 4,024,036 100.00% 4,001,098 100.00% - 4,318,730 - Not tested, not applicable
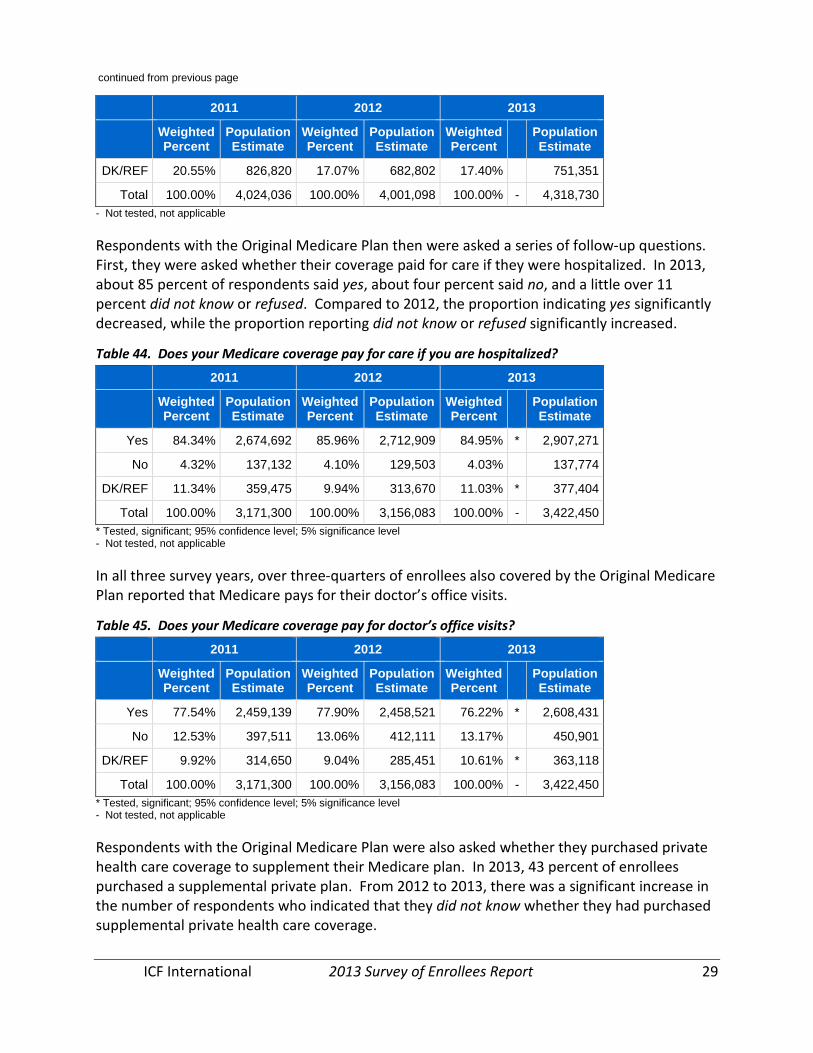
Respondents with the Original Medicare Plan then were asked a series of follow-up questions. First, they were asked whether their coverage paid for care if they were hospitalized. In 2013, about 85 percent of respondents said yes, about four percent said no, and a little over 11 percent did not know or refused. Compared to 2012, the proportion indicating yes significantly decreased, while the proportion reporting did not know or refused significantly increased.
Table 44. Does your Medicare coverage pay for care if you are hospitalized?
2011 2012 2013
Weighted Percent
Population Estimate
Weighted Percent
Population Estimate
Weighted Percent
Population Estimate
Yes 84.34% 2,674,692 85.96% 2,712,909 84.95% * 2,907,271
No 4.32% 137,132 4.10% 129,503 4.03% . 137,774
DK/REF 11.34% 359,475 9.94% 313,670 11.03% * 377,404
Total 100.00% 3,171,300 100.00% 3,156,083 100.00% - 3,422,450 * Tested, significant; 95% confidence level; 5% significance level - Not tested, not applicable
In all three survey years, over three-quarters of enrollees also covered by the Original Medicare Plan reported that Medicare pays for their doctor’s office visits.
Table 45. Does your Medicare coverage pay for doctor’s office visits?
2011 2012 2013
Weighted Percent
Population Estimate
Weighted Percent
Population Estimate
Weighted Percent
Population Estimate
Yes 77.54% 2,459,139 77.90% 2,458,521 76.22% * 2,608,431
No 12.53% 397,511 13.06% 412,111 13.17% . 450,901
DK/REF 9.92% 314,650 9.04% 285,451 10.61% * 363,118
Total 100.00% 3,171,300 100.00% 3,156,083 100.00% - 3,422,450 * Tested, significant; 95% confidence level; 5% significance level - Not tested, not applicable
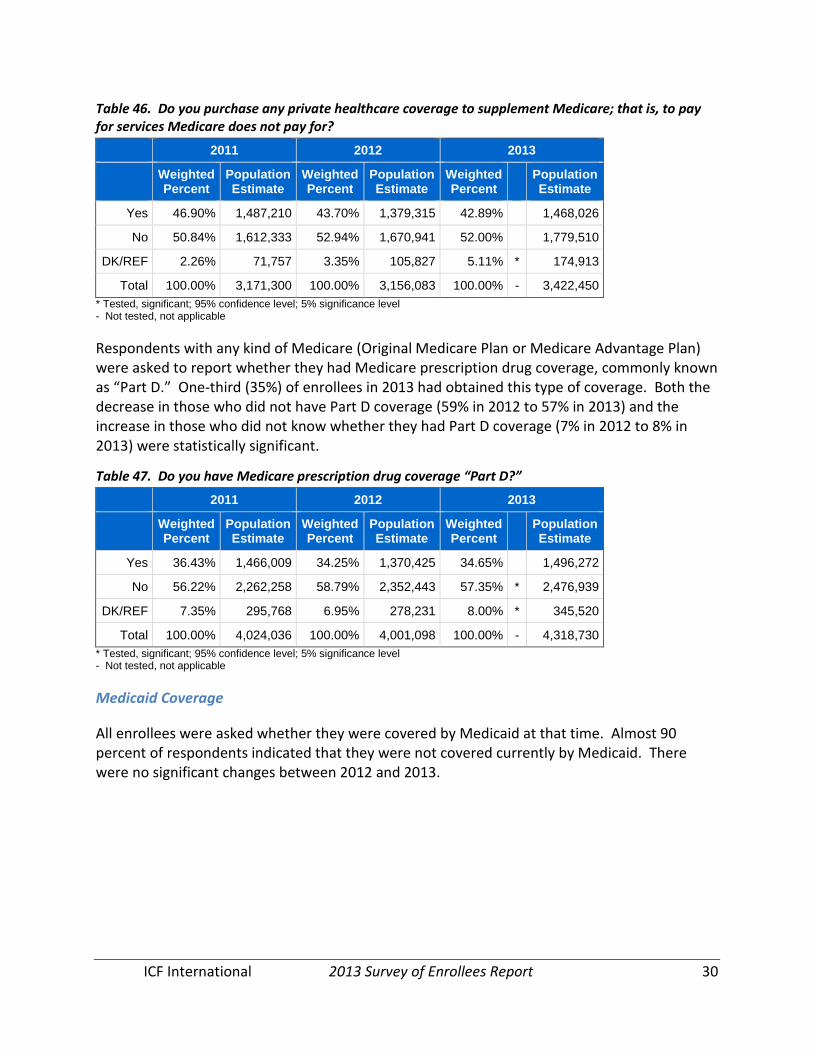
Respondents with the Original Medicare Plan were also asked whether they purchased private health care coverage to supplement their Medicare plan. In 2013, 43 percent of enrollees purchased a supplemental private plan. From 2012 to 2013, there was a significant increase in the number of respondents who indicated that they did not know whether they had purchased supplemental private health care coverage.
continued from previous page
ICF International 2013 Survey of Enrollees Report 30
Table 46. Do you purchase any private healthcare coverage to supplement Medicare; that is, to pay for services Medicare does not pay for?
2011 2012 2013
Weighted Percent
Population Estimate
Weighted Percent
Population Estimate
Weighted Percent
Population Estimate
Yes 46.90% 1,487,210 43.70% 1,379,315 42.89% . 1,468,026
No 50.84% 1,612,333 52.94% 1,670,941 52.00% . 1,779,510
DK/REF 2.26% 71,757 3.35% 105,827 5.11% * 174,913
Total 100.00% 3,171,300 100.00% 3,156,083 100.00% - 3,422,450 * Tested, significant; 95% confidence level; 5% significance level - Not tested, not applicable
Respondents with any kind of Medicare (Original Medicare Plan or Medicare Advantage Plan) were asked to report whether they had Medicare prescription drug coverage, commonly known as “Part D.” One-third (35%) of enrollees in 2013 had obtained this type of coverage. Both the decrease in those who did not have Part D coverage (59% in 2012 to 57% in 2013) and the increase in those who did not know whether they had Part D coverage (7% in 2012 to 8% in 2013) were statistically significant.
Table 47. Do you have Medicare prescription drug coverage “Part D?”
2011 2012 2013
Weighted Percent
Population Estimate
Weighted Percent
Population Estimate
Weighted Percent
Population Estimate
Yes 36.43% 1,466,009 34.25% 1,370,425 34.65% . 1,496,272
No 56.22% 2,262,258 58.79% 2,352,443 57.35% * 2,476,939
DK/REF 7.35% 295,768 6.95% 278,231 8.00% * 345,520
Total 100.00% 4,024,036 100.00% 4,001,098 100.00% - 4,318,730 * Tested, significant; 95% confidence level; 5% significance level - Not tested, not applicable
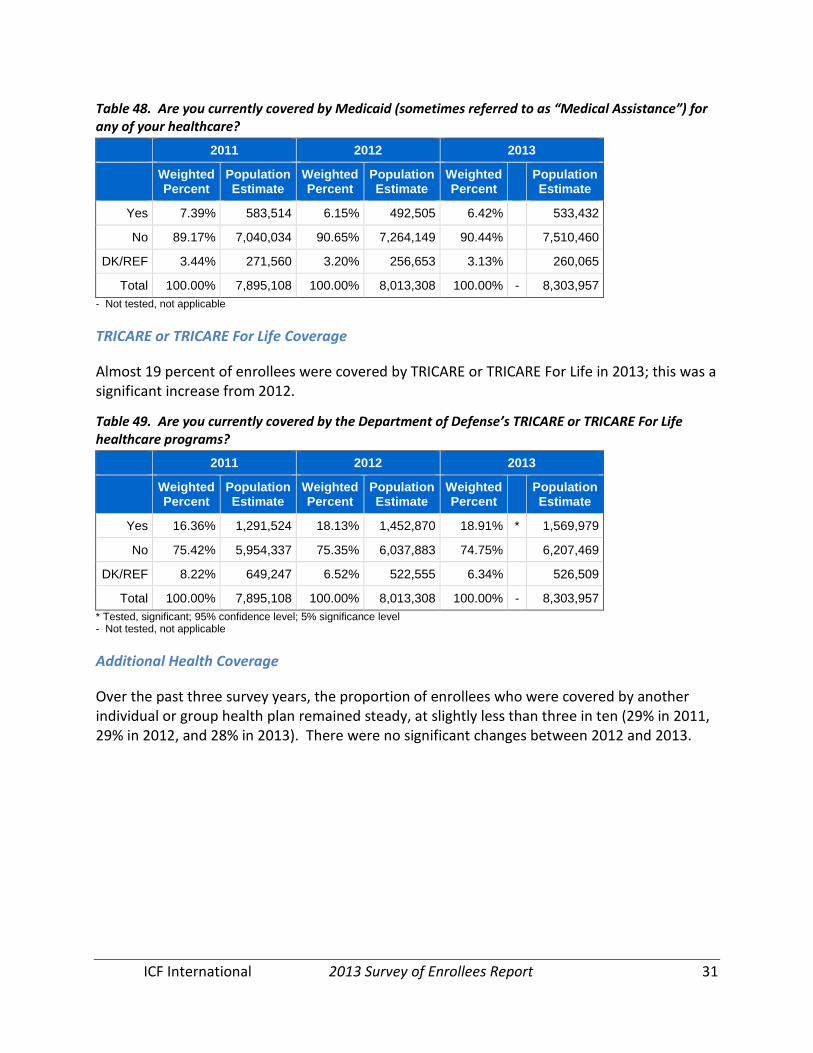
Medicaid Coverage
All enrollees were asked whether they were covered by Medicaid at that time. Almost 90 percent of respondents indicated that they were not covered currently by Medicaid. There were no significant changes between 2012 and 2013.
ICF International 2013 Survey of Enrollees Report 31
Table 48. Are you currently covered by Medicaid (sometimes referred to as “Medical Assistance”) for any of your healthcare?
2011 2012 2013
Weighted Percent
Population Estimate
Weighted Percent
Population Estimate
Weighted Percent
Population Estimate
Yes 7.39% 583,514 6.15% 492,505 6.42% . 533,432
No 89.17% 7,040,034 90.65% 7,264,149 90.44% . 7,510,460
DK/REF 3.44% 271,560 3.20% 256,653 3.13% . 260,065
Total 100.00% 7,895,108 100.00% 8,013,308 100.00% - 8,303,957 - Not tested, not applicable
TRICARE or TRICARE For Life Coverage
Almost 19 percent of enrollees were covered by TRICARE or TRICARE For Life in 2013; this was a significant increase from 2012.
Table 49. Are you currently covered by the Department of Defense’s TRICARE or TRICARE For Life healthcare programs?
2011 2012 2013
Weighted Percent
Population Estimate
Weighted Percent
Population Estimate
Weighted Percent
Population Estimate
Yes 16.36% 1,291,524 18.13% 1,452,870 18.91% * 1,569,979
No 75.42% 5,954,337 75.35% 6,037,883 74.75% . 6,207,469
DK/REF 8.22% 649,247 6.52% 522,555 6.34% . 526,509
Total 100.00% 7,895,108 100.00% 8,013,308 100.00% - 8,303,957 * Tested, significant; 95% confidence level; 5% significance level - Not tested, not applicable
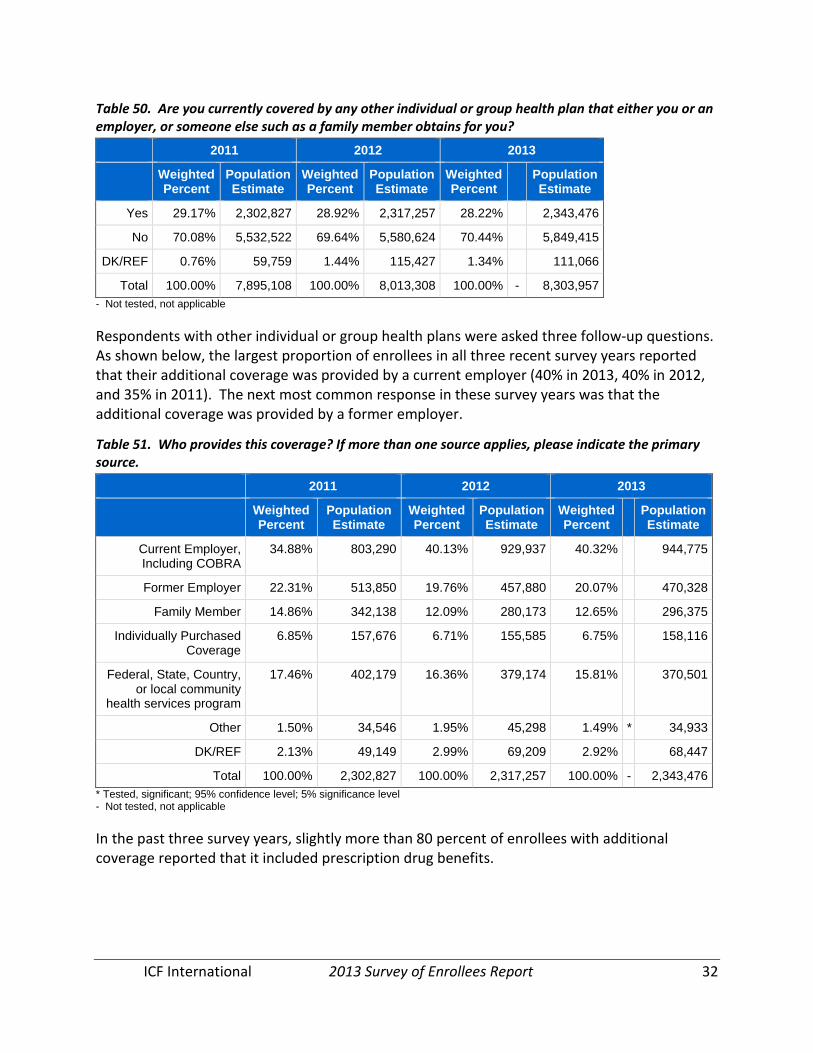
Additional Health Coverage
Over the past three survey years, the proportion of enrollees who were covered by another individual or group health plan remained steady, at slightly less than three in ten (29% in 2011, 29% in 2012, and 28% in 2013). There were no significant changes between 2012 and 2013.
ICF International 2013 Survey of Enrollees Report 32
Table 50. Are you currently covered by any other individual or group health plan that either you or an employer, or someone else such as a family member obtains for you?
2011 2012 2013
Weighted Percent
Population Estimate
Weighted Percent
Population Estimate
Weighted Percent
Population Estimate
Yes 29.17% 2,302,827 28.92% 2,317,257 28.22% . 2,343,476
No 70.08% 5,532,522 69.64% 5,580,624 70.44% . 5,849,415
DK/REF 0.76% 59,759 1.44% 115,427 1.34% . 111,066
Total 100.00% 7,895,108 100.00% 8,013,308 100.00% - 8,303,957 - Not tested, not applicable
Respondents with other individual or group health plans were asked three follow-up questions. As shown below, the largest proportion of enrollees in all three recent survey years reported that their additional coverage was provided by a current employer (40% in 2013, 40% in 2012, and 35% in 2011). The next most common response in these survey years was that the additional coverage was provided by a former employer.
Table 51. Who provides this coverage? If more than one source applies, please indicate the primary source.
2011 2012 2013
Weighted Percent
Population Estimate
Weighted Percent
Population Estimate
Weighted Percent
Population Estimate
Current Employer, Including COBRA
34.88% 803,290 40.13% 929,937 40.32% . 944,775
Former Employer 22.31% 513,850 19.76% 457,880 20.07% . 470,328
Family Member 14.86% 342,138 12.09% 280,173 12.65% . 296,375
Individually Purchased Coverage
6.85% 157,676 6.71% 155,585 6.75% . 158,116
Federal, State, Country, or local community
health services program
17.46% 402,179 16.36% 379,174 15.81% . 370,501
Other 1.50% 34,546 1.95% 45,298 1.49% * 34,933
DK/REF 2.13% 49,149 2.99% 69,209 2.92% . 68,447
Total 100.00% 2,302,827 100.00% 2,317,257 100.00% - 2,343,476 * Tested, significant; 95% confidence level; 5% significance level - Not tested, not applicable
In the past three survey years, slightly more than 80 percent of enrollees with additional coverage reported that it included prescription drug benefits.
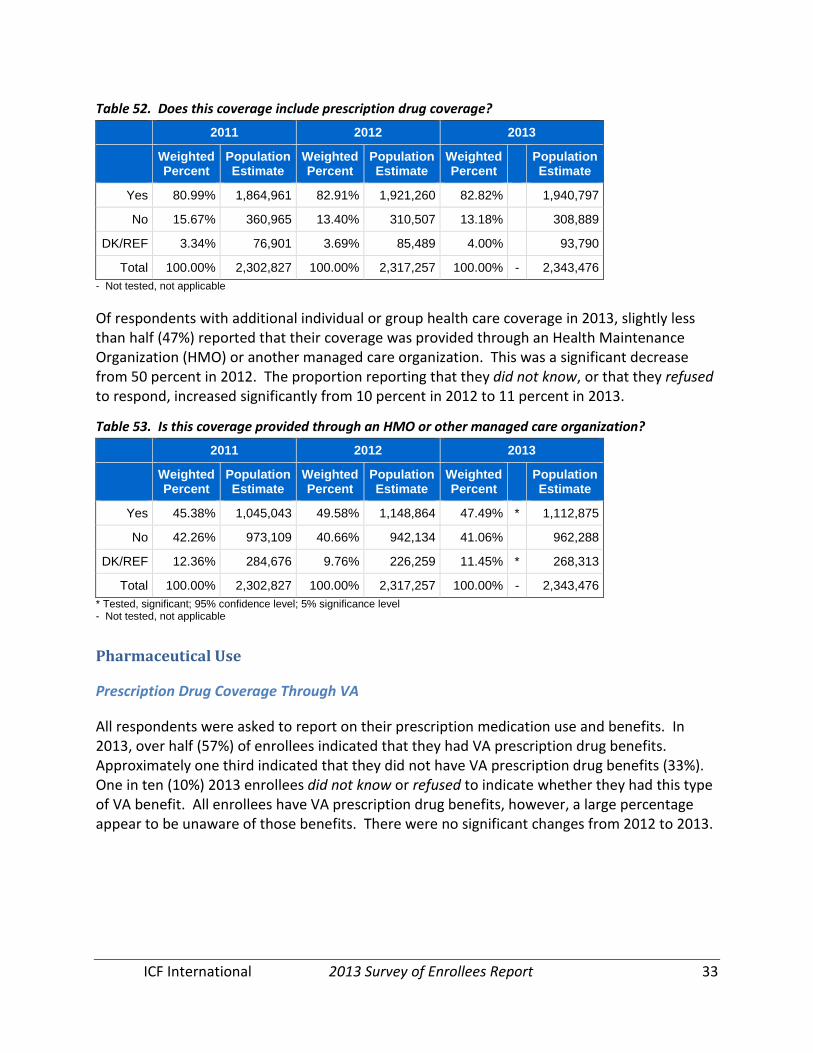
ICF International 2013 Survey of Enrollees Report 33
Table 52. Does this coverage include prescription drug coverage?
2011 2012 2013
Weighted Percent
Population Estimate
Weighted Percent
Population Estimate
Weighted Percent
Population Estimate
Yes 80.99% 1,864,961 82.91% 1,921,260 82.82% . 1,940,797
No 15.67% 360,965 13.40% 310,507 13.18% . 308,889
DK/REF 3.34% 76,901 3.69% 85,489 4.00% . 93,790
Total 100.00% 2,302,827 100.00% 2,317,257 100.00% - 2,343,476 - Not tested, not applicable
Of respondents with additional individual or group health care coverage in 2013, slightly less than half (47%) reported that their coverage was provided through an Health Maintenance Organization (HMO) or another managed care organization. This was a significant decrease from 50 percent in 2012. The proportion reporting that they did not know, or that they refused to respond, increased significantly from 10 percent in 2012 to 11 percent in 2013.
Table 53. Is this coverage provided through an HMO or other managed care organization?
2011 2012 2013
Weighted Percent
Population Estimate
Weighted Percent
Population Estimate
Weighted Percent
Population Estimate
Yes 45.38% 1,045,043 49.58% 1,148,864 47.49% * 1,112,875
No 42.26% 973,109 40.66% 942,134 41.06% . 962,288
DK/REF 12.36% 284,676 9.76% 226,259 11.45% * 268,313
Total 100.00% 2,302,827 100.00% 2,317,257 100.00% - 2,343,476 * Tested, significant; 95% confidence level; 5% significance level - Not tested, not applicable
Pharmaceutical Use
Prescription Drug Coverage Through VA
All respondents were asked to report on their prescription medication use and benefits. In 2013, over half (57%) of enrollees indicated that they had VA prescription drug benefits. Approximately one third indicated that they did not have VA prescription drug benefits (33%). One in ten (10%) 2013 enrollees did not know or refused to indicate whether they had this type of VA benefit. All enrollees have VA prescription drug benefits, however, a large percentage appear to be unaware of those benefits. There were no significant changes from 2012 to 2013.
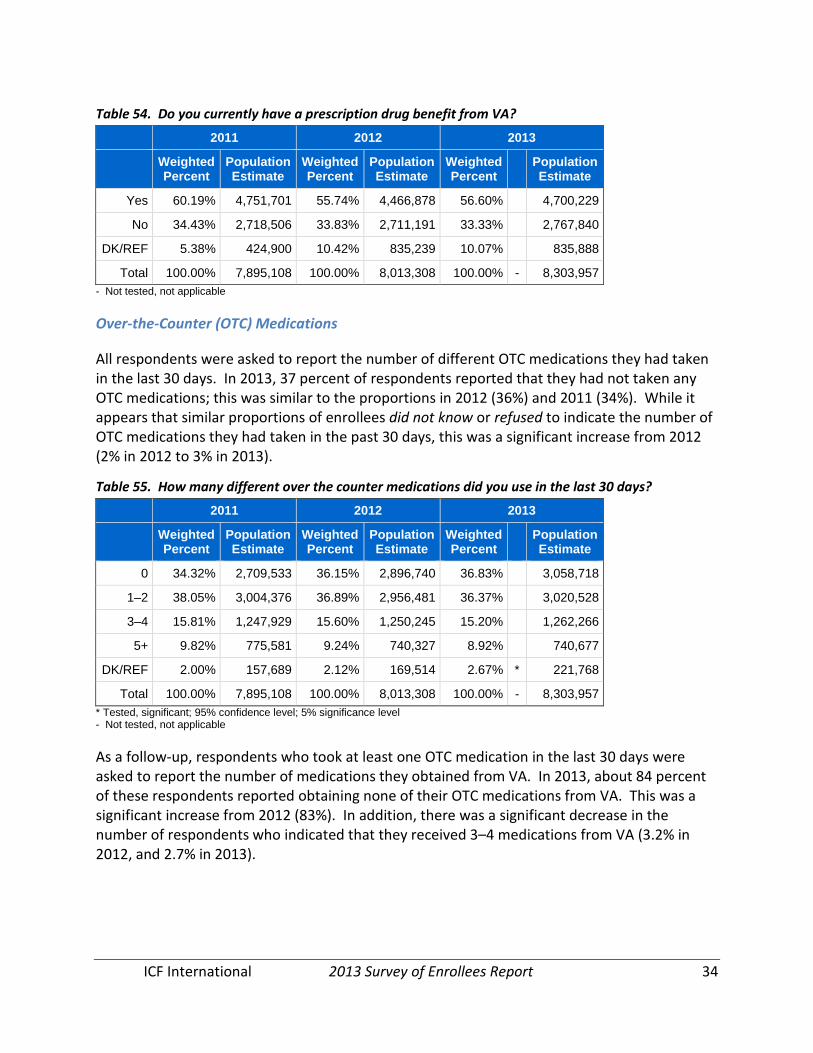
ICF International 2013 Survey of Enrollees Report 34
Table 54. Do you currently have a prescription drug benefit from VA?
2011 2012 2013
Weighted Percent
Population Estimate
Weighted Percent
Population Estimate
Weighted Percent
Population Estimate
Yes 60.19% 4,751,701 55.74% 4,466,878 56.60% . 4,700,229
No 34.43% 2,718,506 33.83% 2,711,191 33.33% . 2,767,840
DK/REF 5.38% 424,900 10.42% 835,239 10.07% . 835,888
Total 100.00% 7,895,108 100.00% 8,013,308 100.00% - 8,303,957 - Not tested, not applicable
Over-the-Counter (OTC) Medications
All respondents were asked to report the number of different OTC medications they had taken in the last 30 days. In 2013, 37 percent of respondents reported that they had not taken any OTC medications; this was similar to the proportions in 2012 (36%) and 2011 (34%). While it appears that similar proportions of enrollees did not know or refused to indicate the number of OTC medications they had taken in the past 30 days, this was a significant increase from 2012 (2% in 2012 to 3% in 2013).
Table 55. How many different over the counter medications did you use in the last 30 days?
2011 2012 2013
Weighted Percent
Population Estimate
Weighted Percent
Population Estimate
Weighted Percent
Population Estimate
0 34.32% 2,709,533 36.15% 2,896,740 36.83% . 3,058,718
1–2 38.05% 3,004,376 36.89% 2,956,481 36.37% . 3,020,528
3–4 15.81% 1,247,929 15.60% 1,250,245 15.20% . 1,262,266
5+ 9.82% 775,581 9.24% 740,327 8.92% . 740,677
DK/REF 2.00% 157,689 2.12% 169,514 2.67% * 221,768
Total 100.00% 7,895,108 100.00% 8,013,308 100.00% - 8,303,957 * Tested, significant; 95% confidence level; 5% significance level - Not tested, not applicable
As a follow-up, respondents who took at least one OTC medication in the last 30 days were asked to report the number of medications they obtained from VA. In 2013, about 84 percent of these respondents reported obtaining none of their OTC medications from VA. This was a significant increase from 2012 (83%). In addition, there was a significant decrease in the number of respondents who indicated that they received 3–4 medications from VA (3.2% in 2012, and 2.7% in 2013).
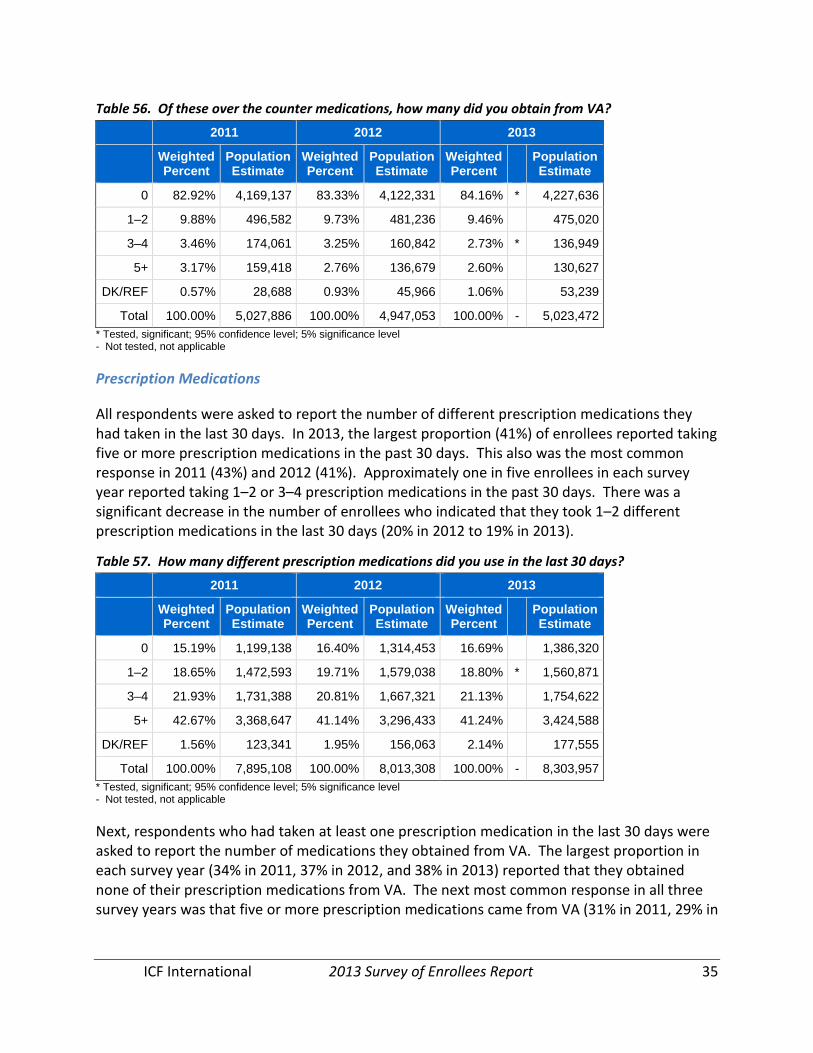
ICF International 2013 Survey of Enrollees Report 35
Table 56. Of these over the counter medications, how many did you obtain from VA?
2011 2012 2013
Weighted Percent
Population Estimate
Weighted Percent
Population Estimate
Weighted Percent
Population Estimate
0 82.92% 4,169,137 83.33% 4,122,331 84.16% * 4,227,636
1–2 9.88% 496,582 9.73% 481,236 9.46% . 475,020
3–4 3.46% 174,061 3.25% 160,842 2.73% * 136,949
5+ 3.17% 159,418 2.76% 136,679 2.60% . 130,627
DK/REF 0.57% 28,688 0.93% 45,966 1.06% . 53,239
Total 100.00% 5,027,886 100.00% 4,947,053 100.00% - 5,023,472 * Tested, significant; 95% confidence level; 5% significance level - Not tested, not applicable
Prescription Medications
All respondents were asked to report the number of different prescription medications they had taken in the last 30 days. In 2013, the largest proportion (41%) of enrollees reported taking five or more prescription medications in the past 30 days. This also was the most common response in 2011 (43%) and 2012 (41%). Approximately one in five enrollees in each survey year reported taking 1–2 or 3–4 prescription medications in the past 30 days. There was a significant decrease in the number of enrollees who indicated that they took 1–2 different prescription medications in the last 30 days (20% in 2012 to 19% in 2013).
Table 57. How many different prescription medications did you use in the last 30 days?
2011 2012 2013
Weighted Percent
Population Estimate
Weighted Percent
Population Estimate
Weighted Percent
Population Estimate
0 15.19% 1,199,138 16.40% 1,314,453 16.69% . 1,386,320
1–2 18.65% 1,472,593 19.71% 1,579,038 18.80% * 1,560,871
3–4 21.93% 1,731,388 20.81% 1,667,321 21.13% . 1,754,622
5+ 42.67% 3,368,647 41.14% 3,296,433 41.24% . 3,424,588
DK/REF 1.56% 123,341 1.95% 156,063 2.14% . 177,555
Total 100.00% 7,895,108 100.00% 8,013,308 100.00% - 8,303,957 * Tested, significant; 95% confidence level; 5% significance level - Not tested, not applicable
Next, respondents who had taken at least one prescription medication in the last 30 days were asked to report the number of medications they obtained from VA. The largest proportion in each survey year (34% in 2011, 37% in 2012, and 38% in 2013) reported that they obtained none of their prescription medications from VA. The next most common response in all three survey years was that five or more prescription medications came from VA (31% in 2011, 29% in

ICF International 2013 Survey of Enrollees Report 36
2012, and 29% in 2013). The proportion of enrollees indicating that they did not know or refused to answer significantly increased from 0.8 percent in 2012 to 1.1 percent in 2013.
Table 58. Of these prescription medications, how many did you obtain from VA?
2011 2012 2013
Weighted Percent
Population Estimate
Weighted Percent
Population Estimate
Weighted Percent
Population Estimate
0 34.38% 2,259,879 37.44% 2,449,660 37.68% . 2,539,331
1–2 16.88% 1,109,749 16.87% 1,103,963 16.67% . 1,123,522
3–4 17.25% 1,133,479 15.86% 1,037,831 15.59% . 1,050,888
5+ 31.07% 2,042,066 29.04% 1,899,833 28.92% . 1,949,321
DK/REF 0.42% 27,455 0.79% 51,504 1.14% * 77,020
Total 100.00% 6,572,628 100.00% 6,542,792 100.00% - 6,740,082 * Tested, significant; 95% confidence level; 5% significance level - Not tested, not applicable
Long-Term Care Use and Benefits
In 2012 and 2013, but not in prior years, enrollees were asked a series of questions about long-term health care and coverage.
Among the 2013 enrollees, eight percent reported that they had a long-term care policy that covered nursing home care, assisted living, or long-term home care services (excluding Medicare Supplemental policies, covered in another series of questions).
Table 59. Excluding any Medicare Supplement Policy, do you have a long-term care policy that covers nursing home care, assisted living, or long-term care services in the home?
2011 2012 2013
Weighted Percent
Population Estimate
Weighted Percent
Population Estimate
Weighted Percent
Population Estimate
Yes -- -- 7.82% 626,954 8.28% . 687,566
No -- -- 88.57% 7,097,617 88.22% . 7,326,063
DK/REF -- -- 3.60% 288,738 3.50% . 290,328
Total -- -- 100.00% 8,013,308 100.00% - 8,303,957 - Not tested, not applicable
Among the 2013 enrollees, four percent reported that they had been a patient in a nursing home, assisted living, convalescent, or rest home one or more times in their lives.
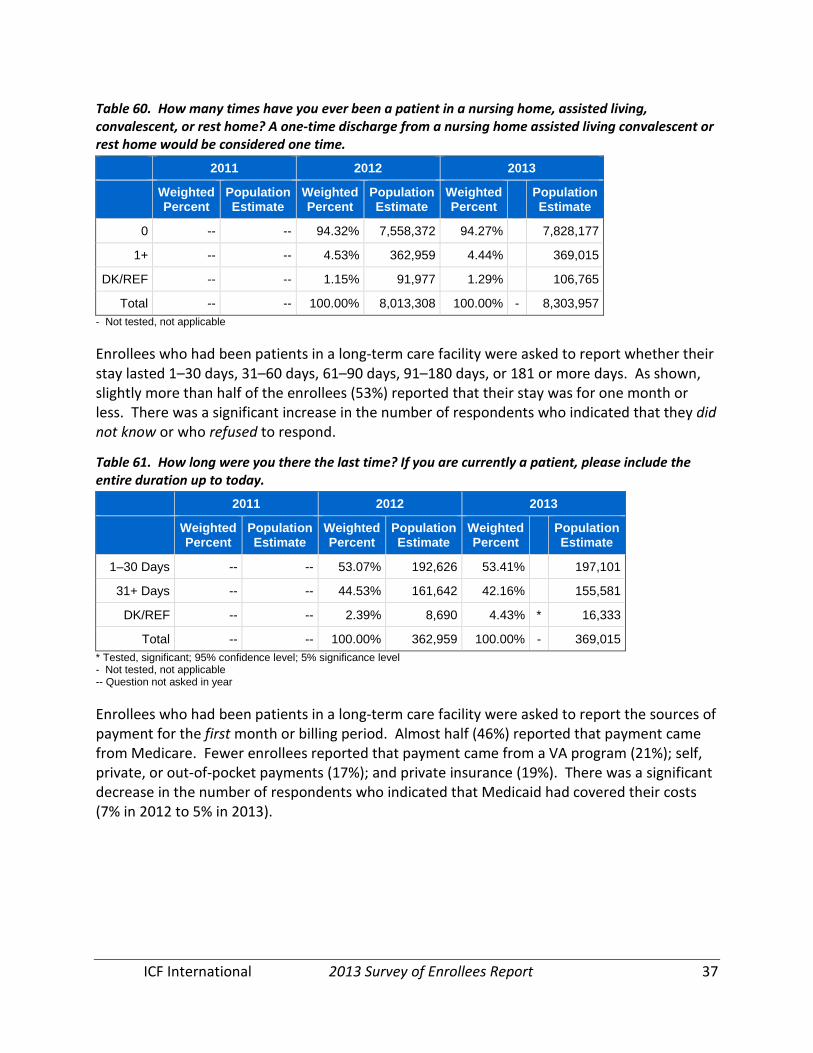
ICF International 2013 Survey of Enrollees Report 37
Table 60. How many times have you ever been a patient in a nursing home, assisted living, convalescent, or rest home? A one-time discharge from a nursing home assisted living convalescent or rest home would be considered one time.
2011 2012 2013
Weighted Percent
Population Estimate
Weighted Percent
Population Estimate
Weighted Percent
Population Estimate
0 -- -- 94.32% 7,558,372 94.27% . 7,828,177
1+ -- -- 4.53% 362,959 4.44% . 369,015
DK/REF -- -- 1.15% 91,977 1.29% . 106,765
Total -- -- 100.00% 8,013,308 100.00% - 8,303,957 - Not tested, not applicable
Enrollees who had been patients in a long-term care facility were asked to report whether their stay lasted 1–30 days, 31–60 days, 61–90 days, 91–180 days, or 181 or more days. As shown, slightly more than half of the enrollees (53%) reported that their stay was for one month or less. There was a significant increase in the number of respondents who indicated that they did not know or who refused to respond.
Table 61. How long were you there the last time? If you are currently a patient, please include the entire duration up to today.
2011 2012 2013
Weighted Percent
Population Estimate
Weighted Percent
Population Estimate
Weighted Percent
Population Estimate
1–30 Days -- -- 53.07% 192,626 53.41% . 197,101
31+ Days -- -- 44.53% 161,642 42.16% . 155,581
DK/REF -- -- 2.39% 8,690 4.43% * 16,333
Total -- -- 100.00% 362,959 100.00% - 369,015 * Tested, significant; 95% confidence level; 5% significance level - Not tested, not applicable -- Question not asked in year
Enrollees who had been patients in a long-term care facility were asked to report the sources of payment for the first month or billing period. Almost half (46%) reported that payment came from Medicare. Fewer enrollees reported that payment came from a VA program (21%); self, private, or out-of-pocket payments (17%); and private insurance (19%). There was a significant decrease in the number of respondents who indicated that Medicaid had covered their costs (7% in 2012 to 5% in 2013).
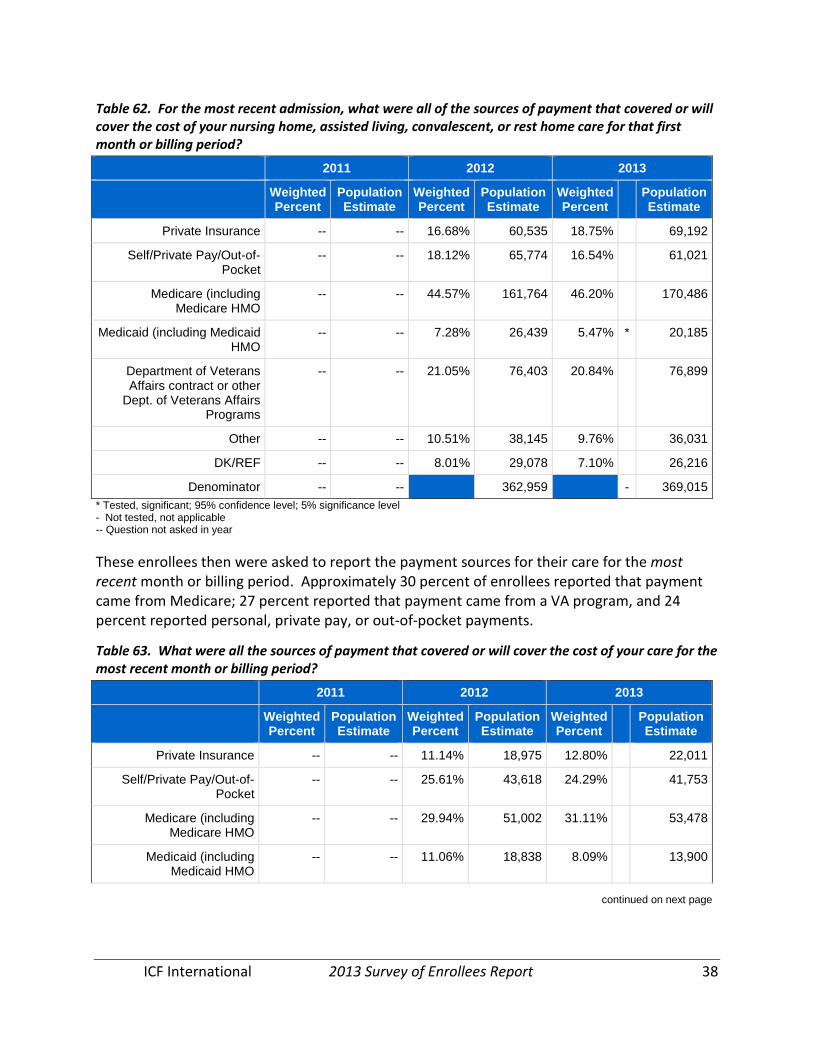
ICF International 2013 Survey of Enrollees Report 38
Table 62. For the most recent admission, what were all of the sources of payment that covered or will cover the cost of your nursing home, assisted living, convalescent, or rest home care for that first month or billing period?
2011 2012 2013
Weighted Percent
Population Estimate
Weighted Percent
Population Estimate
Weighted Percent
Population Estimate
Private Insurance -- -- 16.68% 60,535 18.75% . 69,192
Self/Private Pay/Out-of-Pocket
-- -- 18.12% 65,774 16.54% . 61,021
Medicare (including Medicare HMO
-- -- 44.57% 161,764 46.20% . 170,486
Medicaid (including Medicaid HMO
-- -- 7.28% 26,439 5.47% * 20,185
Department of Veterans Affairs contract or other
Dept. of Veterans Affairs Programs
-- -- 21.05% 76,403 20.84% . 76,899
Other -- -- 10.51% 38,145 9.76% . 36,031
DK/REF -- -- 8.01% 29,078 7.10% . 26,216
Denominator -- -- 362,959 - 369,015 * Tested, significant; 95% confidence level; 5% significance level - Not tested, not applicable -- Question not asked in year
These enrollees then were asked to report the payment sources for their care for the most recent month or billing period. Approximately 30 percent of enrollees reported that payment came from Medicare; 27 percent reported that payment came from a VA program, and 24 percent reported personal, private pay, or out-of-pocket payments.
Table 63. What were all the sources of payment that covered or will cover the cost of your care for the most recent month or billing period?
2011 2012 2013
Weighted Percent
Population Estimate
Weighted Percent
Population Estimate
Weighted Percent
Population Estimate
Private Insurance -- -- 11.14% 18,975 12.80% . 22,011
Self/Private Pay/Out-of-Pocket
-- -- 25.61% 43,618 24.29% . 41,753
Medicare (including Medicare HMO
-- -- 29.94% 51,002 31.11% . 53,478
Medicaid (including Medicaid HMO
-- -- 11.06% 18,838 8.09% . 13,900
continued on next page
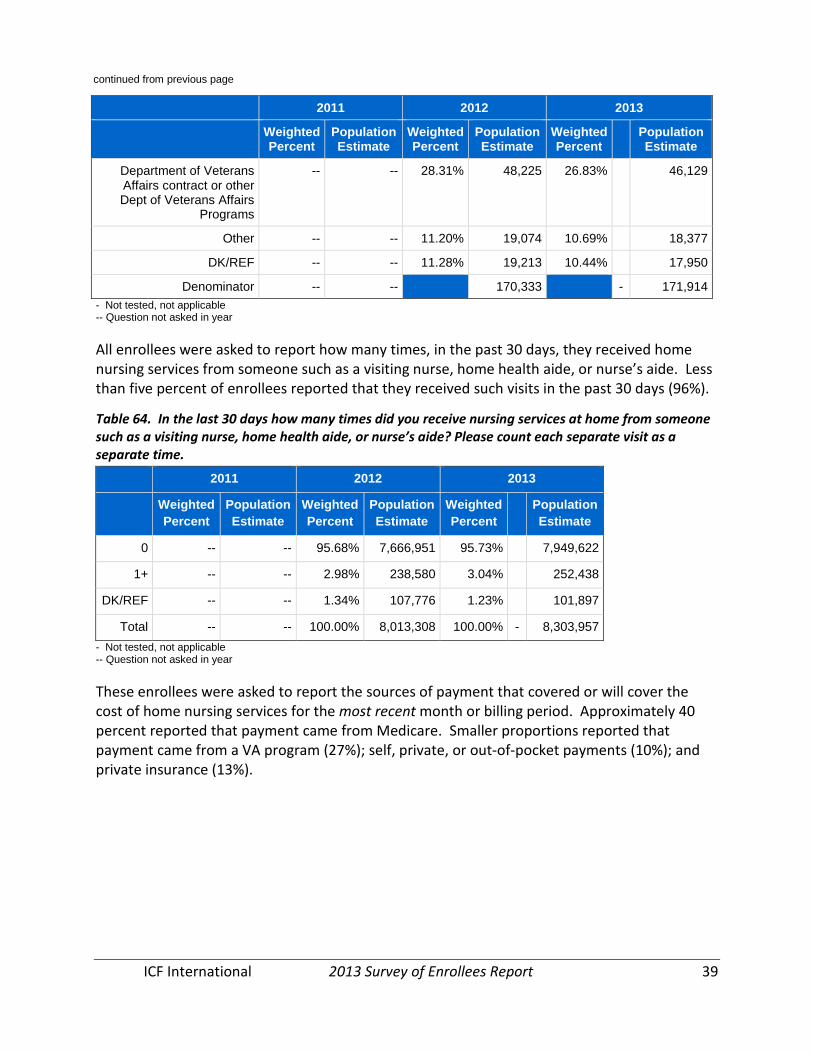
ICF International 2013 Survey of Enrollees Report 39
2011 2012 2013
Weighted Percent
Population Estimate
Weighted Percent
Population Estimate
Weighted Percent
Population Estimate
Department of Veterans Affairs contract or other Dept of Veterans Affairs
Programs
-- -- 28.31% 48,225 26.83% . 46,129
Other -- -- 11.20% 19,074 10.69% . 18,377
DK/REF -- -- 11.28% 19,213 10.44% . 17,950
Denominator -- -- 170,333 - 171,914 - Not tested, not applicable -- Question not asked in year
All enrollees were asked to report how many times, in the past 30 days, they received home nursing services from someone such as a visiting nurse, home health aide, or nurse’s aide. Less than five percent of enrollees reported that they received such visits in the past 30 days (96%).
Table 64. In the last 30 days how many times did you receive nursing services at home from someone such as a visiting nurse, home health aide, or nurse’s aide? Please count each separate visit as a separate time.
2011 2012 2013
Weighted Percent
Population Estimate
Weighted Percent
Population Estimate
Weighted Percent
Population Estimate
0 -- -- 95.68% 7,666,951 95.73% . 7,949,622
1+ -- -- 2.98% 238,580 3.04% . 252,438
DK/REF -- -- 1.34% 107,776 1.23% . 101,897
Total -- -- 100.00% 8,013,308 100.00% - 8,303,957 - Not tested, not applicable -- Question not asked in year
These enrollees were asked to report the sources of payment that covered or will cover the cost of home nursing services for the most recent month or billing period. Approximately 40 percent reported that payment came from Medicare. Smaller proportions reported that payment came from a VA program (27%); self, private, or out-of-pocket payments (10%); and private insurance (13%).
continued from previous page

ICF International 2013 Survey of Enrollees Report 40
Table 65. What were all the sources of payment that covered or will cover the cost of your nursing services at home care for the most recent month or billing period?
2011 2012 2013
Weighted Percent
Population Estimate
Weighted Percent
Population Estimate
Weighted Percent
Population Estimate
Private Insurance -- -- 11.40% 27,203 12.65% . 31,925
Self/Private Pay/Out-of-Pocket
-- -- 12.68% 30,261 10.42% . 26,304
Medicare (including Medicare HMO
-- -- 40.31% 96,173 40.66% . 102,640
Medicaid (including Medicaid HMO
-- -- 6.24% 14,890 5.11% . 12,902
Department of Veterans Affairs contract or other
Dept. of Veterans Affairs Programs
-- -- 30.23% 72,118 27.47% . 69,352
Non-Paid/Family/Volunteer -- -- 2.66% 6,356 2.34% . 5,916
Other -- -- 5.69% 13,567 5.83% . 14,719
DK/REF -- -- 8.56% 20,424 9.81% . 24,767
Denominator -- -- 238,580 - 252,438 - Not tested, not applicable -- Question not asked in year
Travel Factors
In 2013, enrollees were asked how much travel time affected their choice of preferred health care provider. Almost 45 percent of enrollees indicated that travel time never affected their decision to access care at their nearest preferred health care provider.
Table 66. How much does travel time or distance impact your decision to access care at your nearest preferred health care provider? Would you say…
2011 2012 2013
Weighted Percent
Population Estimate
Weighted Percent
Population Estimate
Weighted Percent
Population Estimate
Always -- -- -- -- 18.18% - 1,509,729
Often -- -- -- -- 11.48% - 953,556
Sometimes -- -- -- -- 23.30% - 1,935,028
Never -- -- -- -- 44.08% - 3,660,099
DK/REF -- -- -- -- 2.96% - 245,545
Total -- -- -- -- 100.00% - 8,303,957 - Not tested, not applicable -- Question not asked in year
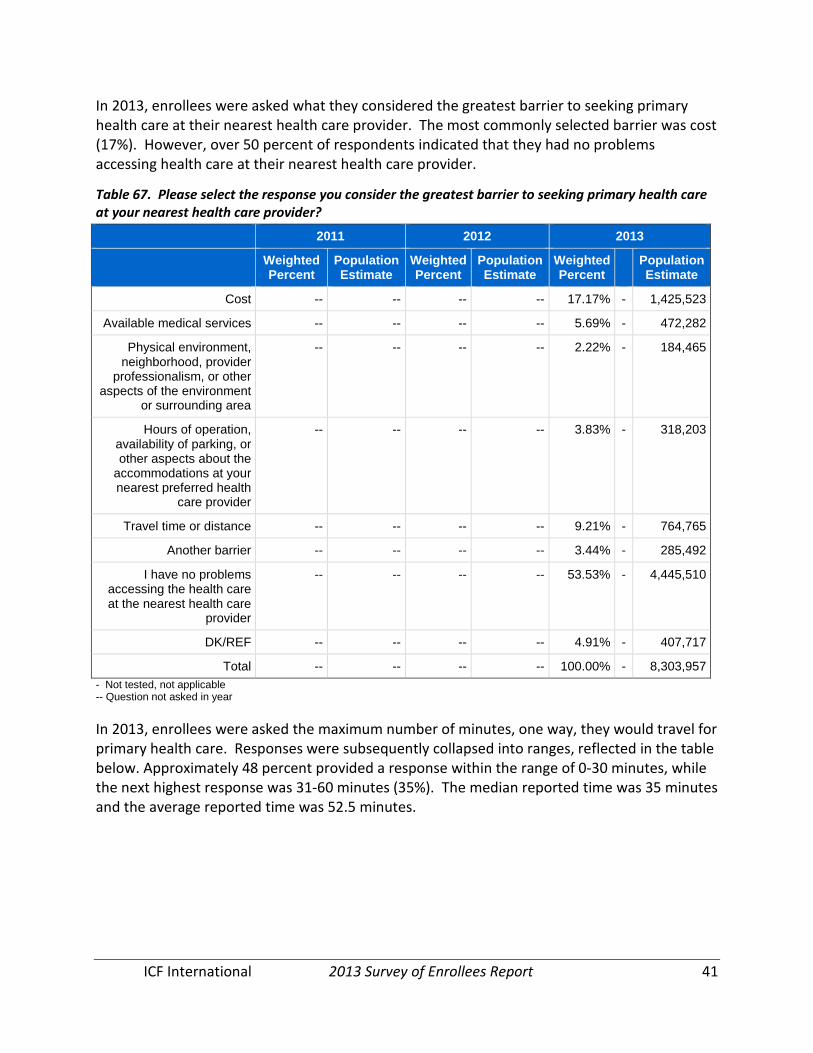
ICF International 2013 Survey of Enrollees Report 41
In 2013, enrollees were asked what they considered the greatest barrier to seeking primary health care at their nearest health care provider. The most commonly selected barrier was cost (17%). However, over 50 percent of respondents indicated that they had no problems accessing health care at their nearest health care provider.
Table 67. Please select the response you consider the greatest barrier to seeking primary health care at your nearest health care provider?
2011 2012 2013
Weighted Percent
Population Estimate
Weighted Percent
Population Estimate
Weighted Percent
Population Estimate
Cost -- -- -- -- 17.17% - 1,425,523
Available medical services -- -- -- -- 5.69% - 472,282
Physical environment, neighborhood, provider
professionalism, or other aspects of the environment
or surrounding area
-- -- -- -- 2.22% - 184,465
Hours of operation, availability of parking, or other aspects about the
accommodations at your nearest preferred health
care provider
-- -- -- -- 3.83% - 318,203
Travel time or distance -- -- -- -- 9.21% - 764,765
Another barrier -- -- -- -- 3.44% - 285,492
I have no problems accessing the health care at the nearest health care
provider
-- -- -- -- 53.53% - 4,445,510
DK/REF -- -- -- -- 4.91% - 407,717
Total -- -- -- -- 100.00% - 8,303,957 - Not tested, not applicable -- Question not asked in year
In 2013, enrollees were asked the maximum number of minutes, one way, they would travel for primary health care. Responses were subsequently collapsed into ranges, reflected in the table below. Approximately 48 percent provided a response within the range of 0-30 minutes, while the next highest response was 31-60 minutes (35%). The median reported time was 35 minutes and the average reported time was 52.5 minutes.
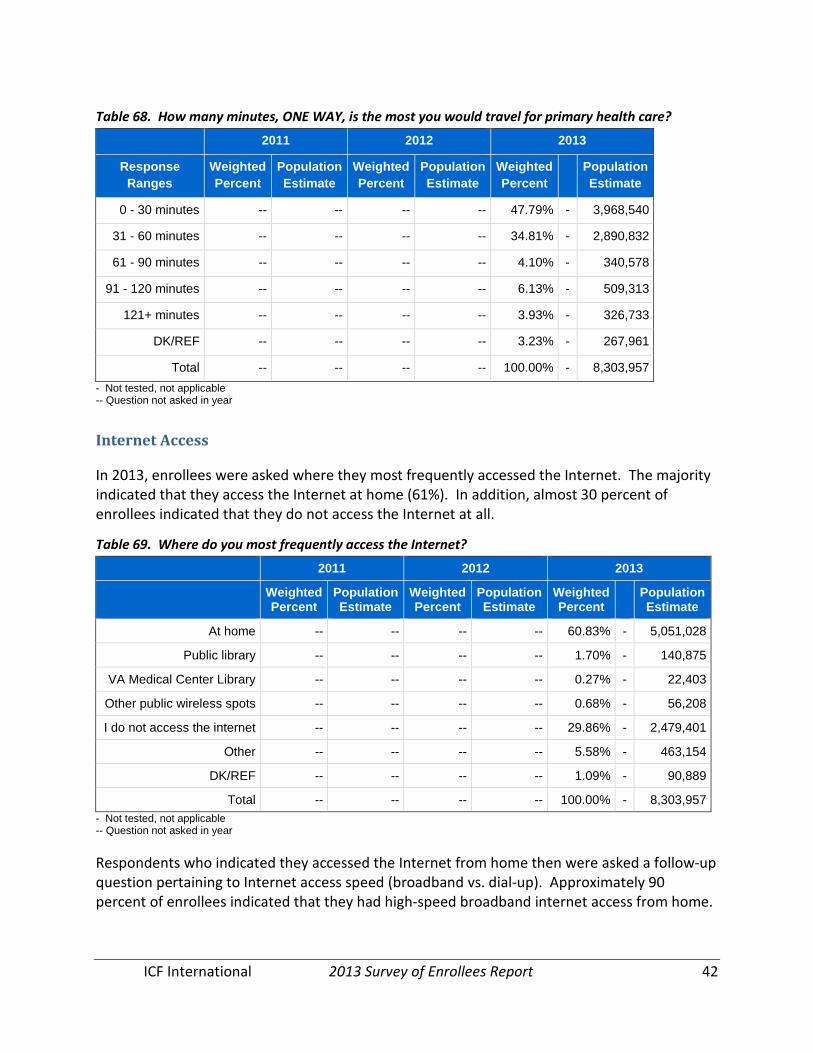
ICF International 2013 Survey of Enrollees Report 42
Table 68. How many minutes, ONE WAY, is the most you would travel for primary health care?
2011 2012 2013
Response Ranges
Weighted Percent
Population Estimate
Weighted Percent
Population Estimate
Weighted Percent
Population Estimate
0 - 30 minutes -- -- -- -- 47.79% - 3,968,540
31 - 60 minutes -- -- -- -- 34.81% - 2,890,832
61 - 90 minutes -- -- -- -- 4.10% - 340,578
91 - 120 minutes -- -- -- -- 6.13% - 509,313
121+ minutes -- -- -- -- 3.93% - 326,733
DK/REF -- -- -- -- 3.23% - 267,961
Total -- -- -- -- 100.00% - 8,303,957 - Not tested, not applicable -- Question not asked in year
Internet Access
In 2013, enrollees were asked where they most frequently accessed the Internet. The majority indicated that they access the Internet at home (61%). In addition, almost 30 percent of enrollees indicated that they do not access the Internet at all.
Table 69. Where do you most frequently access the Internet?
2011 2012 2013
Weighted Percent
Population Estimate
Weighted Percent
Population Estimate
Weighted Percent
Population Estimate
At home -- -- -- -- 60.83% - 5,051,028
Public library -- -- -- -- 1.70% - 140,875
VA Medical Center Library -- -- -- -- 0.27% - 22,403
Other public wireless spots -- -- -- -- 0.68% - 56,208
I do not access the internet -- -- -- -- 29.86% - 2,479,401
Other -- -- -- -- 5.58% - 463,154
DK/REF -- -- -- -- 1.09% - 90,889
Total -- -- -- -- 100.00% - 8,303,957 - Not tested, not applicable -- Question not asked in year
Respondents who indicated they accessed the Internet from home then were asked a follow-up question pertaining to Internet access speed (broadband vs. dial-up). Approximately 90 percent of enrollees indicated that they had high-speed broadband internet access from home.
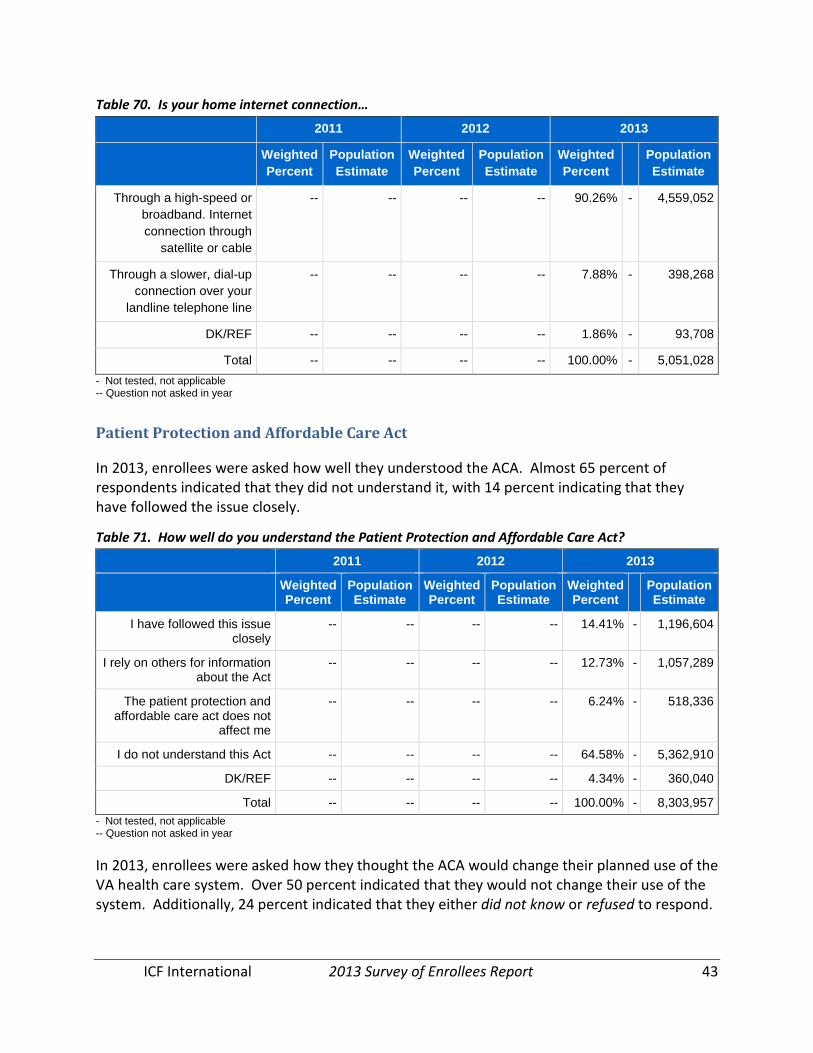
ICF International 2013 Survey of Enrollees Report 43
Table 70. Is your home internet connection…
2011 2012 2013
Weighted Percent
Population Estimate
Weighted Percent
Population Estimate
Weighted Percent
Population Estimate
Through a high-speed or broadband. Internet connection through
satellite or cable
-- -- -- -- 90.26% - 4,559,052
Through a slower, dial-up connection over your
landline telephone line
-- -- -- -- 7.88% - 398,268
DK/REF -- -- -- -- 1.86% - 93,708
Total -- -- -- -- 100.00% - 5,051,028 - Not tested, not applicable -- Question not asked in year
Patient Protection and Affordable Care Act
In 2013, enrollees were asked how well they understood the ACA. Almost 65 percent of respondents indicated that they did not understand it, with 14 percent indicating that they have followed the issue closely.
Table 71. How well do you understand the Patient Protection and Affordable Care Act?
2011 2012 2013
Weighted Percent
Population Estimate
Weighted Percent
Population Estimate
Weighted Percent
Population Estimate
I have followed this issue closely
-- -- -- -- 14.41% - 1,196,604
I rely on others for information about the Act
-- -- -- -- 12.73% - 1,057,289
The patient protection and affordable care act does not
affect me
-- -- -- -- 6.24% - 518,336
I do not understand this Act -- -- -- -- 64.58% - 5,362,910
DK/REF -- -- -- -- 4.34% - 360,040
Total -- -- -- -- 100.00% - 8,303,957 - Not tested, not applicable -- Question not asked in year
In 2013, enrollees were asked how they thought the ACA would change their planned use of the VA health care system. Over 50 percent indicated that they would not change their use of the system. Additionally, 24 percent indicated that they either did not know or refused to respond.
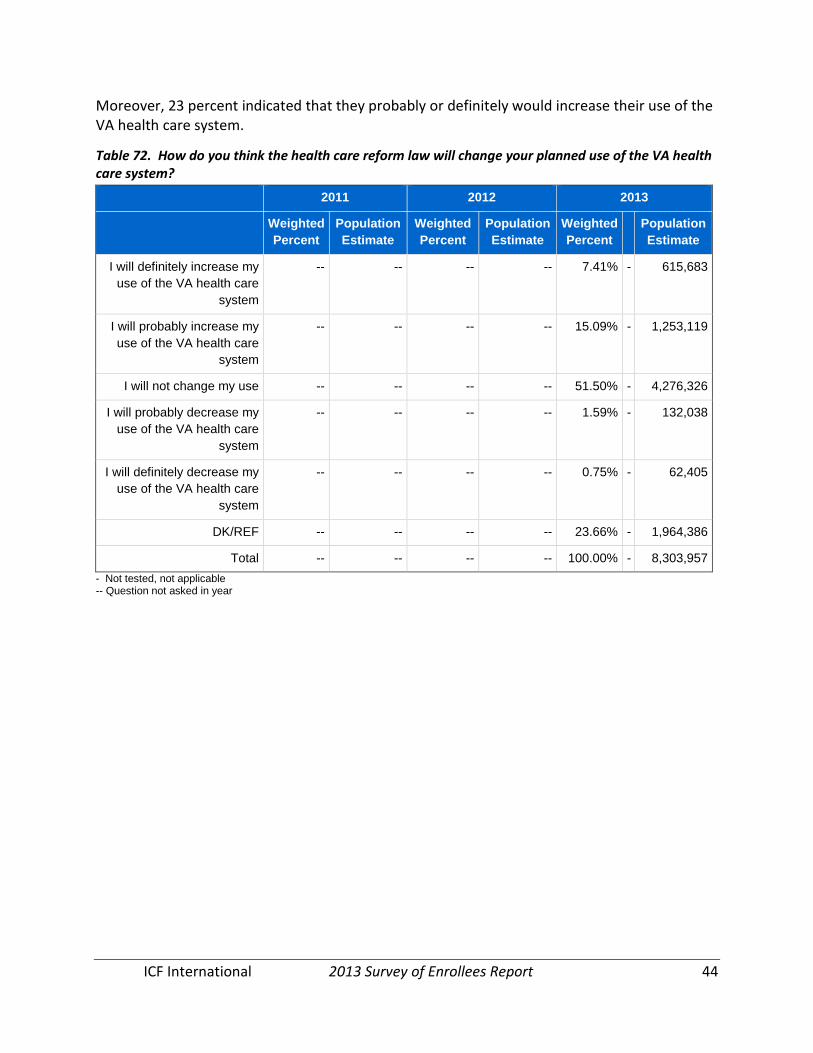
ICF International 2013 Survey of Enrollees Report 44
Moreover, 23 percent indicated that they probably or definitely would increase their use of the VA health care system.
Table 72. How do you think the health care reform law will change your planned use of the VA health care system?
2011 2012 2013
Weighted Percent
Population Estimate
Weighted Percent
Population Estimate
Weighted Percent
Population Estimate
I will definitely increase my use of the VA health care
system
-- -- -- -- 7.41% - 615,683
I will probably increase my use of the VA health care
system
-- -- -- -- 15.09% - 1,253,119
I will not change my use -- -- -- -- 51.50% - 4,276,326
I will probably decrease my use of the VA health care
system
-- -- -- -- 1.59% - 132,038
I will definitely decrease my use of the VA health care
system
-- -- -- -- 0.75% - 62,405
DK/REF -- -- -- -- 23.66% - 1,964,386
Total -- -- -- -- 100.00% - 8,303,957 - Not tested, not applicable -- Question not asked in year
APPENDIX A – CONDENSED DESCRIPTION OF THE METHODOLOGY
Below is a condensed overview of the 2013 Survey of Enrollees methodology.
Sample Design
A sample of 164,740 enrollees was drawn from the population of enrolled Veterans as of September 30, 2012. Enrollees were excluded if they lived outside of the United States or Puerto Rico. In addition, the enrollment file was compared to key VA Veteran data files to exclude any enrollee who declined enrollment, did not have a valid address, or whose file indicated they were deceased. The remaining population (8,303,957) was stratified into 504 cells based on combinations of VISN (21), enrollee type (2: pre- or post-enrollment), priority group (7: 1–6, and 7/8), and Operating Enduring Freedom/Operation Iraqi Freedom/Operation New Dawn (OEF/OIF/OND) status (2: Yes/No). The OEF/OIF/OND stratum was added in 2008 because analyses in 2005 and 2007 showed that this cohort of Veterans was under-represented. Veterans of these conflicts have been oversampled in the 2008, 2010, 2011, 2012, and 2013 surveys.
Multimode Survey
The Survey of Enrollees is a multimode survey offered via Computer Assisted Telephone Interview (CATI), self-administered mail, or Computer Assisted Web Interview (CAWI). Sampled enrollees with missing or invalid telephone numbers were assigned to the mail treatment. The remaining enrollees—those with a known telephone number—were assigned to either the CATI control group or the mail experimental treatment group. Both CATI and mail treatments included an option for enrollees to complete the survey via CAWI.
The 2013 Survey of Enrollees included two experiments:
1. Mode Effects (ME): To test for mode effects in the CATI-eligible population, ICF randomly assigned CATI-eligible enrollees to one of two modes, CATI or mail.
2. Second Survey Mailing (SSM): To test the effect of one vs. multiple CATI non-responder follow-up contacts, ICF sent either one or two follow-up surveys to CATI non-responders assigned to CATI mode in the ME experiment. The key difference is that non-responders assigned to the short protocol received one mail survey and a reminder postcard; while non-responders assigned to the long protocol also received a second mail survey following non-response.
Some CATI treatment Veterans were given the opportunity to complete the Survey of Enrollees via mail if their telephone number was non-working, if they specifically requested a mail survey, or if they still had not completed the CATI survey after ICF completed the calling protocol.
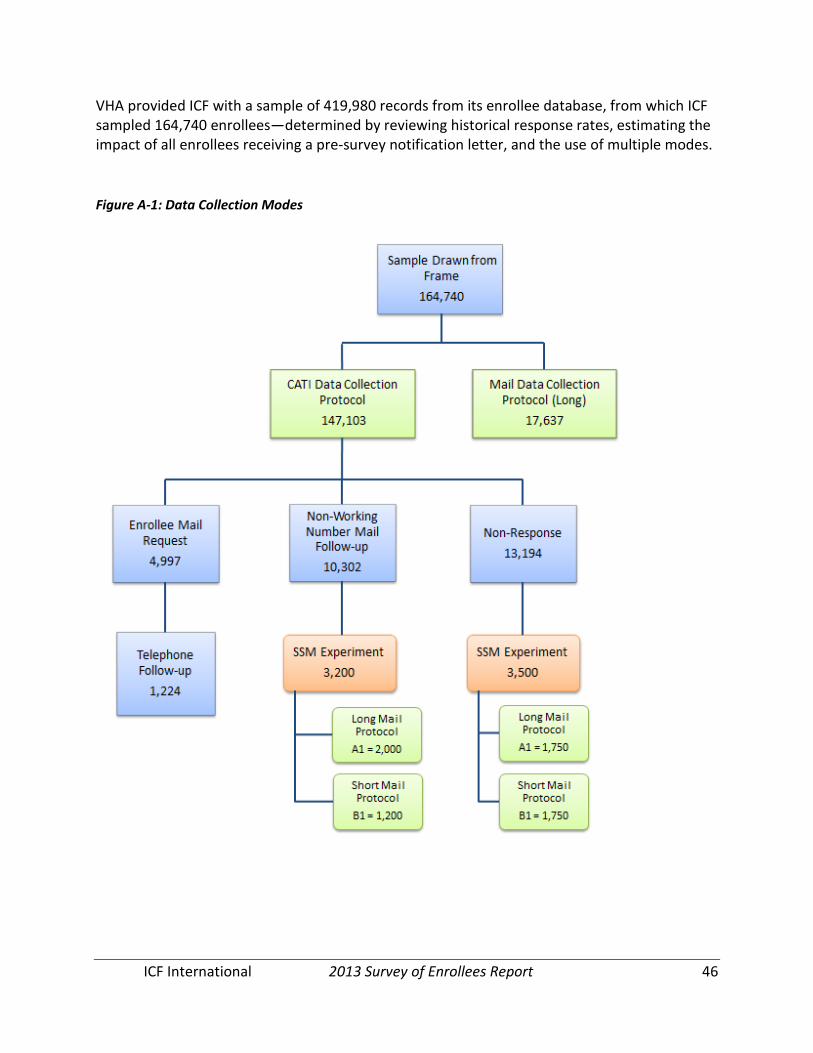
ICF International 2013 Survey of Enrollees Report 46
VHA provided ICF with a sample of 419,980 records from its enrollee database, from which ICF sampled 164,740 enrollees—determined by reviewing historical response rates, estimating the impact of all enrollees receiving a pre-survey notification letter, and the use of multiple modes.
Figure A-1: Data Collection Modes
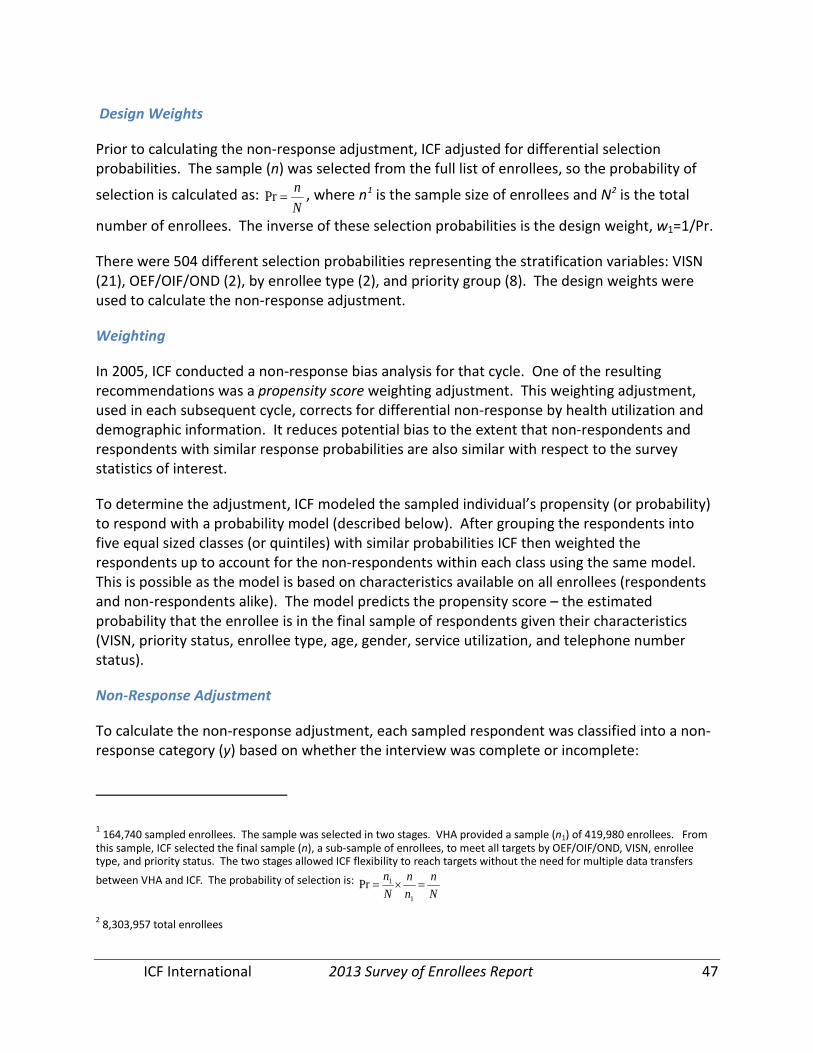
ICF International 2013 Survey of Enrollees Report 47
Design Weights
Prior to calculating the non-response adjustment, ICF adjusted for differential selection probabilities. The sample (n) was selected from the full list of enrollees, so the probability of
selection is calculated as: Nn
=Pr , where n1 is the sample size of enrollees and N2 is the total
number of enrollees. The inverse of these selection probabilities is the design weight, w1=1/Pr.
There were 504 different selection probabilities representing the stratification variables: VISN (21), OEF/OIF/OND (2), by enrollee type (2), and priority group (8). The design weights were used to calculate the non-response adjustment.
Weighting
In 2005, ICF conducted a non-response bias analysis for that cycle. One of the resulting recommendations was a propensity score weighting adjustment. This weighting adjustment, used in each subsequent cycle, corrects for differential non-response by health utilization and demographic information. It reduces potential bias to the extent that non-respondents and respondents with similar response probabilities are also similar with respect to the survey statistics of interest.
To determine the adjustment, ICF modeled the sampled individual’s propensity (or probability) to respond with a probability model (described below). After grouping the respondents into five equal sized classes (or quintiles) with similar probabilities ICF then weighted the respondents up to account for the non-respondents within each class using the same model. This is possible as the model is based on characteristics available on all enrollees (respondents and non-respondents alike). The model predicts the propensity score – the estimated probability that the enrollee is in the final sample of respondents given their characteristics (VISN, priority status, enrollee type, age, gender, service utilization, and telephone number status).
Non-Response Adjustment
To calculate the non-response adjustment, each sampled respondent was classified into a non-response category (y) based on whether the interview was complete or incomplete:
1 164,740 sampled enrollees. The sample was selected in two stages. VHA provided a sample (n1) of 419,980 enrollees. From this sample, ICF selected the final sample (n), a sub-sample of enrollees, to meet all targets by OEF/OIF/OND, VISN, enrollee type, and priority status. The two stages allowed ICF flexibility to reach targets without the need for multiple data transfers
between VHA and ICF. The probability of selection is: Nn
nn
Nn
=×=1
1Pr
2 8,303,957 total enrollees
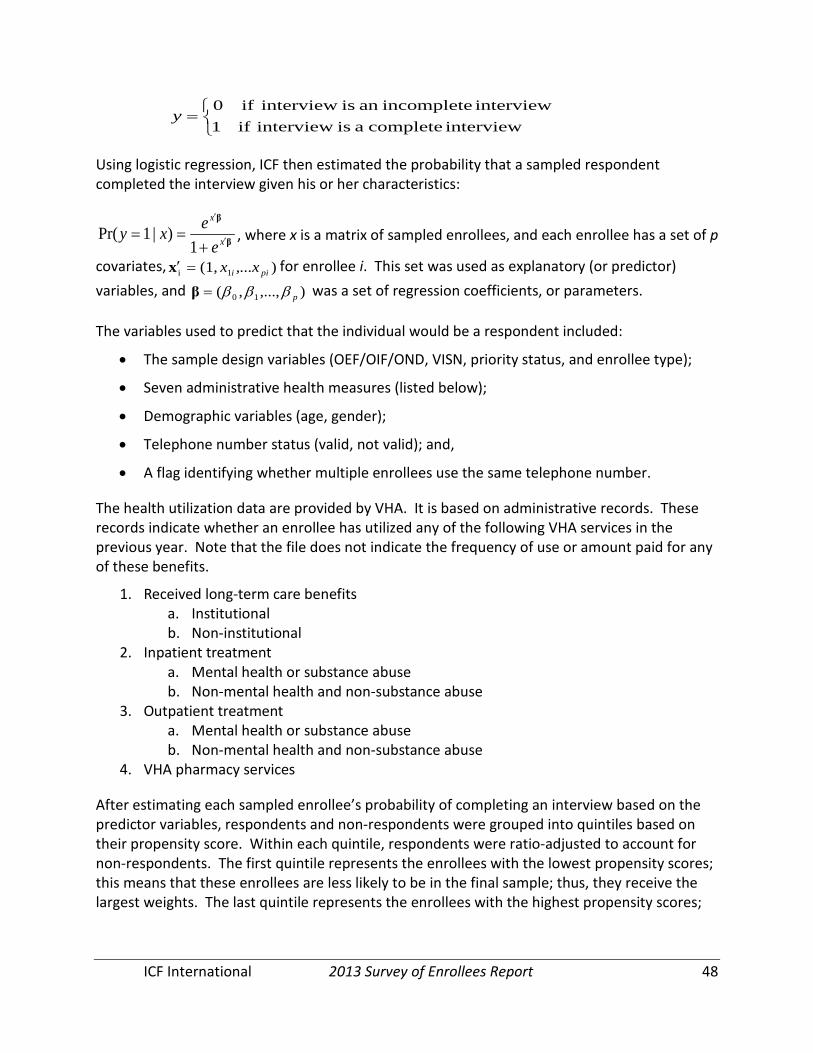
ICF International 2013 Survey of Enrollees Report 48
=interview complete a is interview if1
interview incompletean is interviewif0y
Using logistic regression, ICF then estimated the probability that a sampled respondent completed the interview given his or her characteristics:
β
β
x
x
eexy ′
′
+==
1)|1Pr( , where x is a matrix of sampled enrollees, and each enrollee has a set of p
covariates, )(1, 1i pii ,...xx=′x for enrollee i. This set was used as explanatory (or predictor) variables, and ),...,,( 10 pβββ=β was a set of regression coefficients, or parameters.
The variables used to predict that the individual would be a respondent included:
• The sample design variables (OEF/OIF/OND, VISN, priority status, and enrollee type);
• Seven administrative health measures (listed below);
• Demographic variables (age, gender);
• Telephone number status (valid, not valid); and,
• A flag identifying whether multiple enrollees use the same telephone number.
The health utilization data are provided by VHA. It is based on administrative records. These records indicate whether an enrollee has utilized any of the following VHA services in the previous year. Note that the file does not indicate the frequency of use or amount paid for any of these benefits.
1. Received long-term care benefits a. Institutional b. Non-institutional
2. Inpatient treatment a. Mental health or substance abuse b. Non-mental health and non-substance abuse
3. Outpatient treatment a. Mental health or substance abuse b. Non-mental health and non-substance abuse
4. VHA pharmacy services
After estimating each sampled enrollee’s probability of completing an interview based on the predictor variables, respondents and non-respondents were grouped into quintiles based on their propensity score. Within each quintile, respondents were ratio-adjusted to account for non-respondents. The first quintile represents the enrollees with the lowest propensity scores; this means that these enrollees are less likely to be in the final sample; thus, they receive the largest weights. The last quintile represents the enrollees with the highest propensity scores;
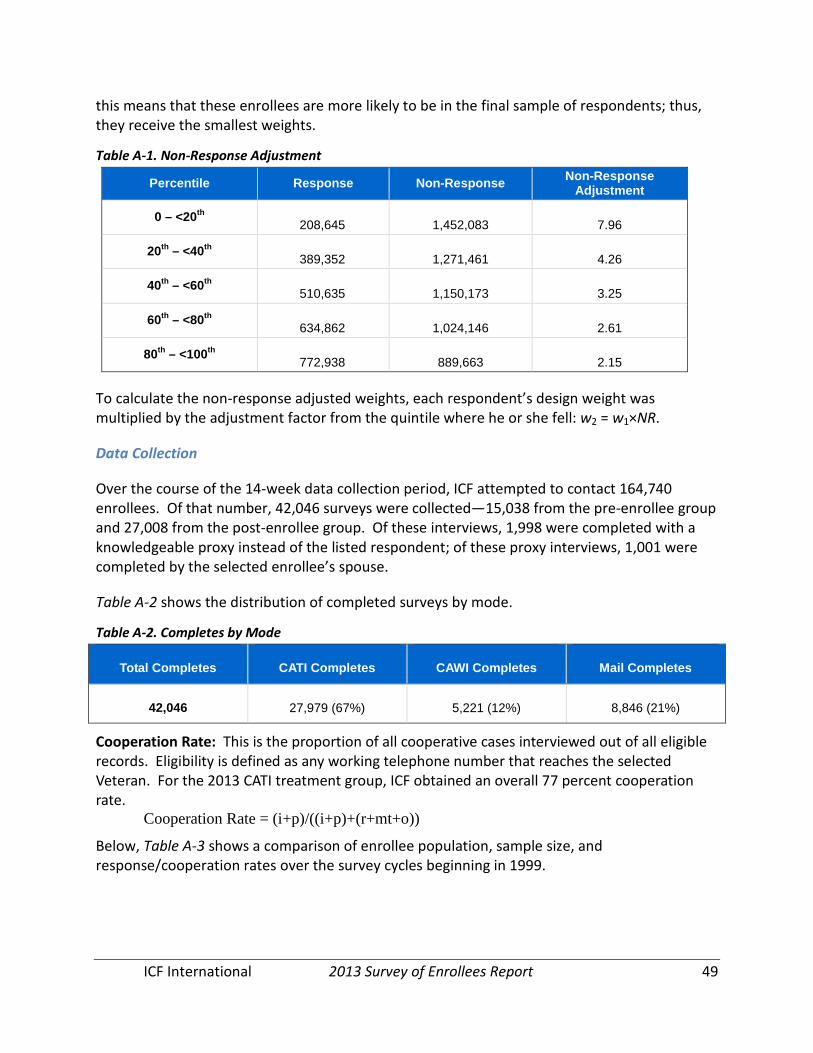
ICF International 2013 Survey of Enrollees Report 49
this means that these enrollees are more likely to be in the final sample of respondents; thus, they receive the smallest weights.
Table A-1. Non-Response Adjustment
Percentile Response Non-Response Non-Response Adjustment
0 – <20th 208,645 1,452,083 7.96
20th – <40th 389,352 1,271,461 4.26
40th – <60th 510,635 1,150,173 3.25
60th – <80th 634,862 1,024,146 2.61
80th – <100th 772,938 889,663 2.15
To calculate the non-response adjusted weights, each respondent’s design weight was multiplied by the adjustment factor from the quintile where he or she fell: w2 = w1×NR.
Data Collection
Over the course of the 14-week data collection period, ICF attempted to contact 164,740 enrollees. Of that number, 42,046 surveys were collected—15,038 from the pre-enrollee group and 27,008 from the post-enrollee group. Of these interviews, 1,998 were completed with a knowledgeable proxy instead of the listed respondent; of these proxy interviews, 1,001 were completed by the selected enrollee’s spouse.
Table A-2 shows the distribution of completed surveys by mode.
Table A-2. Completes by Mode
Total Completes CATI Completes CAWI Completes Mail Completes
42,046 27,979 (67%) 5,221 (12%) 8,846 (21%)
Cooperation Rate: This is the proportion of all cooperative cases interviewed out of all eligible records. Eligibility is defined as any working telephone number that reaches the selected Veteran. For the 2013 CATI treatment group, ICF obtained an overall 77 percent cooperation rate.
Cooperation Rate = (i+p)/((i+p)+(r+mt+o))
Below, Table A-3 shows a comparison of enrollee population, sample size, and response/cooperation rates over the survey cycles beginning in 1999.

ICF International 2013 Survey of Enrollees Report 50
Table A-3. 1999–Present: VHA Survey of Enrollees Key Methodological Data 1999 2002 2003 2005 2007
Enrollees Represented 3,642,537 6,175,694 6,742,676 6,704,149 7,186,950
Enrolled Population as of: 2/3/1999 12/31/2001 12/31/2002 12/31/2004 9/30/2006
Eligible Contacts 27,000 63,126 65,472 57,870 85,307
Completed Interviews 19,686 37,528 41,704 42,094 42,587
Cooperation Rate N/A 59.4% 63.7% 72.7% 49.9%
Fielding Period March 1999
Apr–May 2002
Aug–Sep 2003
Sep–Dec 2005
Jul–Sep 2007
2008** 2010 2011 2012 2013
Enrollees Represented 7,339,531 7,804,639 7,895,108 8,013,308 8,303,957
Enrolled Population as of: 4/30/2008 9/30/2009 9/30/2010 9/30/2011 9/30/2012
Eligible Contacts 72,716 71,808 57,820 53,073 47,231
Completed Interviews 42,460 42,920 43,633 49,115 42,046
Cooperation Rate* 58.4% 59.8% 75.0% 85.0% 77.0%
Fielding Period Sep–Dec 2008
May–Aug 2010
Mar–May 2011
Mar–Jun 2012
Apr–Aug 2013
**In 2008, an additional stratum was added based on OEF/OIF/OND status *Based on the American Association for Public Opinion Research cooperation rates as defined in
the section above Source: 1999, 2002, 2004, 2005, 2007, 2008, 2010, and 2012 VHA Survey of Enrollees
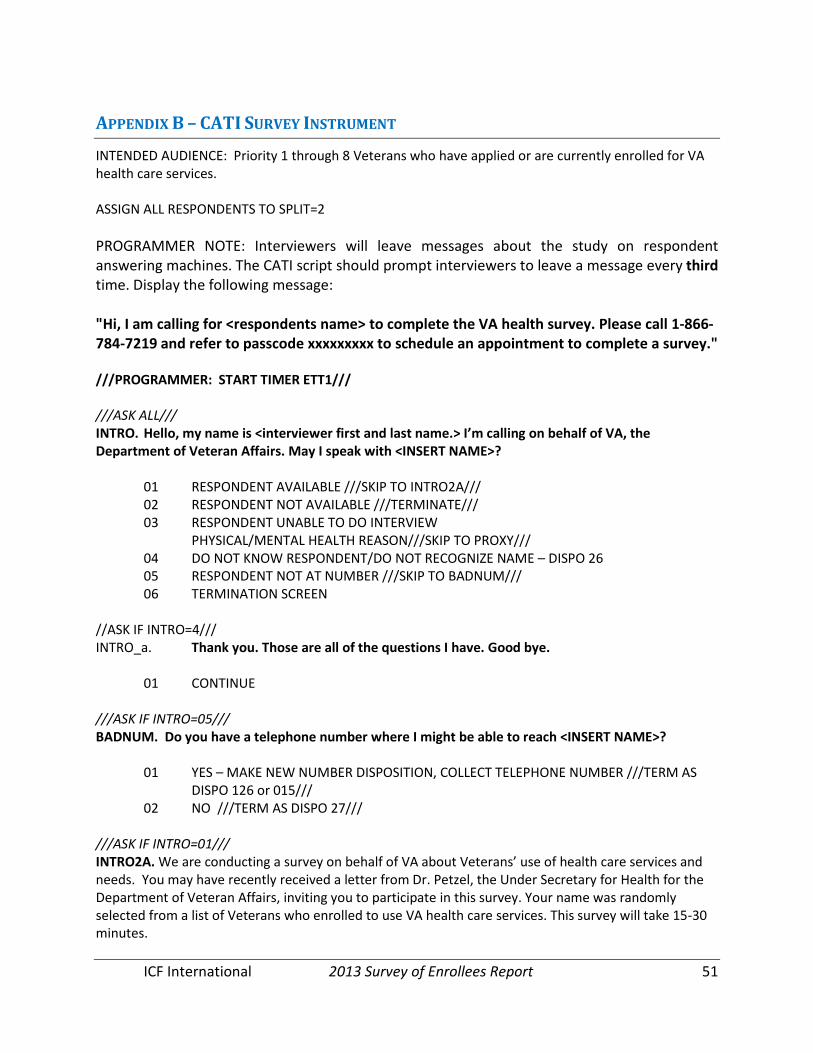
ICF International 2013 Survey of Enrollees Report 51
APPENDIX B – CATI SURVEY INSTRUMENT
INTENDED AUDIENCE: Priority 1 through 8 Veterans who have applied or are currently enrolled for VA health care services. ASSIGN ALL RESPONDENTS TO SPLIT=2 PROGRAMMER NOTE: Interviewers will leave messages about the study on respondent answering machines. The CATI script should prompt interviewers to leave a message every third time. Display the following message: "Hi, I am calling for <respondents name> to complete the VA health survey. Please call 1-866-784-7219 and refer to passcode xxxxxxxxx to schedule an appointment to complete a survey." ///PROGRAMMER: START TIMER ETT1/// ///ASK ALL/// INTRO. Hello, my name is <interviewer first and last name.> I’m calling on behalf of VA, the Department of Veteran Affairs. May I speak with <INSERT NAME>?
01 RESPONDENT AVAILABLE ///SKIP TO INTRO2A/// 02 RESPONDENT NOT AVAILABLE ///TERMINATE/// 03 RESPONDENT UNABLE TO DO INTERVIEW
PHYSICAL/MENTAL HEALTH REASON///SKIP TO PROXY/// 04 DO NOT KNOW RESPONDENT/DO NOT RECOGNIZE NAME – DISPO 26 05 RESPONDENT NOT AT NUMBER ///SKIP TO BADNUM/// 06 TERMINATION SCREEN
//ASK IF INTRO=4/// INTRO_a. Thank you. Those are all of the questions I have. Good bye. 01 CONTINUE ///ASK IF INTRO=05/// BADNUM. Do you have a telephone number where I might be able to reach <INSERT NAME>?
01 YES – MAKE NEW NUMBER DISPOSITION, COLLECT TELEPHONE NUMBER ///TERM AS DISPO 126 or 015///
02 NO ///TERM AS DISPO 27/// ///ASK IF INTRO=01/// INTRO2A. We are conducting a survey on behalf of VA about Veterans’ use of health care services and needs. You may have recently received a letter from Dr. Petzel, the Under Secretary for Health for the Department of Veteran Affairs, inviting you to participate in this survey. Your name was randomly selected from a list of Veterans who enrolled to use VA health care services. This survey will take 15-30 minutes.

ICF International 2013 Survey of Enrollees Report 52
01 YES, CONTINUE //GO TO INTRO2AA// 02 REQUESTED CALLBACK ///TERMINATE/// 03 RESPONDENT HESITATES/NEED MORE INFORMATION ///CONTINUE TO INTRO2B/// 04 RESPONDENT DID NOT RECEIVE LETTER //RESPONDENT HESITATES/NEEDS MORE
INFORMATION //CONTINUE TO INTRO2B//
INTRODUCTION ///ASK IF INTRO2A IN (03,04)/// INTRO2B. IF NECESSARY MORE INFORMATION: This survey is about how many Veterans use VA services and what types of services they do or do not use. IF NECESSARY CONFIDENTIALITY: Your name and answers will be linked. However, VA will protect your identity and answers to the extent allowed under the law. Your answers will in no way affect your benefits. No information that you provide will be released to the general public in a way that can be traced back to you. ONLY IF LEGITIMACY IS QUESTIONED READ: This survey has been reviewed and approved by the VHA Office of the Assistant Deputy Under Secretary for Health for Policy and Planning and the Office of Management and Budget. If you have any questions regarding the legitimacy of this survey, you may call the Department of Veterans Affairs in Washington, D.C. at 1-877-222-8387.
01 YES, CONTINUE 02 REQUESTED CALLBACK ///TERMINATE///
///ASK IF INTRO2A=01 OR INTRO2B=01/// INTRO2AA. Everything we talk about will be confidential, although this call may be monitored for quality assurance. Your participation is voluntary – you can choose not to answer any question or end the survey at anytime without an explanation. Your benefits will not change as a result of your answering any questions. If you choose not to participate, or answer a question, your benefits will also not be affected. However, your participation is important for this survey’s success – we need to talk to Veterans like you. Would now be a good time?
01 YES, CONTINUE //GO TO SECTION A// 02 REQUESTED CALLBACK
///ASK IF INTRO=03/// PROXY We are conducting a survey about Veterans’ use of health care services and needs. <INSERT NAME> may have recently received a letter from Dr. Petzel, the Under Secretary for Health for the Department of Veteran Affairs, inviting <INSERT NAME> to participate in this survey. <INSERT NAME> was randomly selected from a list of Veterans who enrolled to use VA health care services. This is an important survey, would you be able to answer questions about <INSERT NAME>’s health care, health benefits and health status? IF NECESSARY MORE INFORMATION: This survey is about how many Veterans use VA services and what types of services they do or do not use.
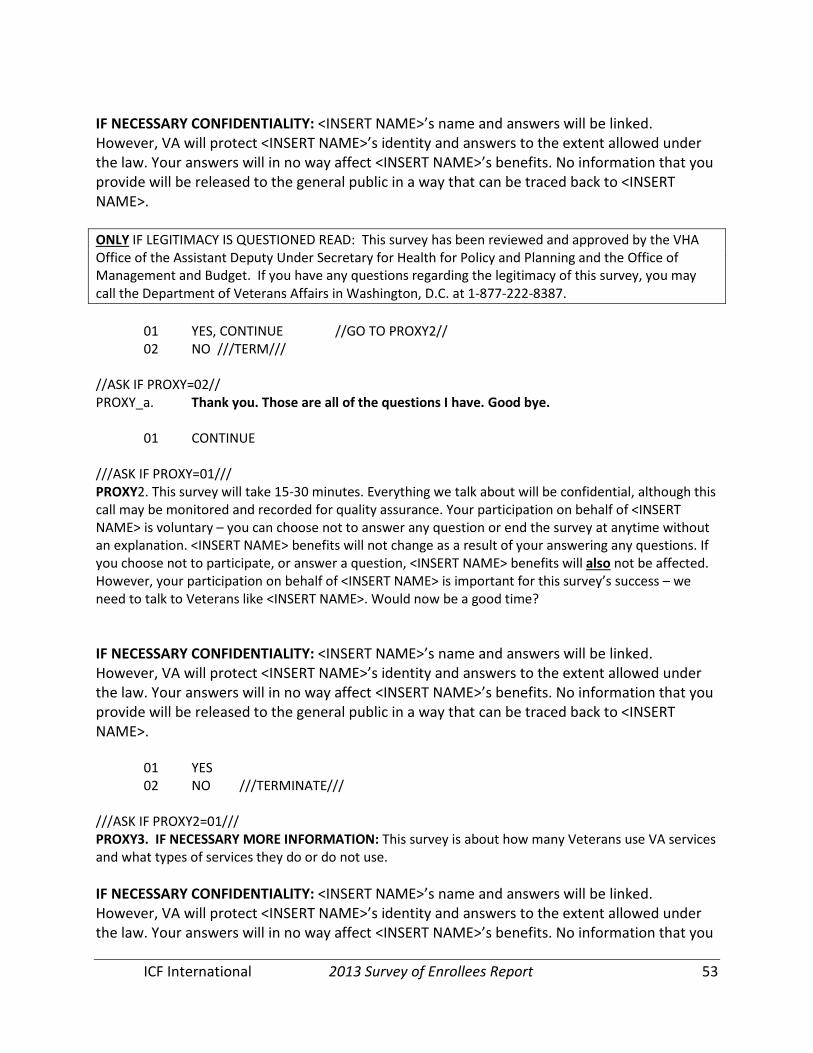
ICF International 2013 Survey of Enrollees Report 53
IF NECESSARY CONFIDENTIALITY: <INSERT NAME>’s name and answers will be linked. However, VA will protect <INSERT NAME>’s identity and answers to the extent allowed under the law. Your answers will in no way affect <INSERT NAME>’s benefits. No information that you provide will be released to the general public in a way that can be traced back to <INSERT NAME>. ONLY IF LEGITIMACY IS QUESTIONED READ: This survey has been reviewed and approved by the VHA Office of the Assistant Deputy Under Secretary for Health for Policy and Planning and the Office of Management and Budget. If you have any questions regarding the legitimacy of this survey, you may call the Department of Veterans Affairs in Washington, D.C. at 1-877-222-8387.
01 YES, CONTINUE //GO TO PROXY2// 02 NO ///TERM///
//ASK IF PROXY=02// PROXY_a. Thank you. Those are all of the questions I have. Good bye. 01 CONTINUE ///ASK IF PROXY=01/// PROXY2. This survey will take 15-30 minutes. Everything we talk about will be confidential, although this call may be monitored and recorded for quality assurance. Your participation on behalf of <INSERT NAME> is voluntary – you can choose not to answer any question or end the survey at anytime without an explanation. <INSERT NAME> benefits will not change as a result of your answering any questions. If you choose not to participate, or answer a question, <INSERT NAME> benefits will also not be affected. However, your participation on behalf of <INSERT NAME> is important for this survey’s success – we need to talk to Veterans like <INSERT NAME>. Would now be a good time? IF NECESSARY CONFIDENTIALITY: <INSERT NAME>’s name and answers will be linked. However, VA will protect <INSERT NAME>’s identity and answers to the extent allowed under the law. Your answers will in no way affect <INSERT NAME>’s benefits. No information that you provide will be released to the general public in a way that can be traced back to <INSERT NAME>.
01 YES 02 NO ///TERMINATE///
///ASK IF PROXY2=01/// PROXY3. IF NECESSARY MORE INFORMATION: This survey is about how many Veterans use VA services and what types of services they do or do not use. IF NECESSARY CONFIDENTIALITY: <INSERT NAME>’s name and answers will be linked. However, VA will protect <INSERT NAME>’s identity and answers to the extent allowed under the law. Your answers will in no way affect <INSERT NAME>’s benefits. No information that you
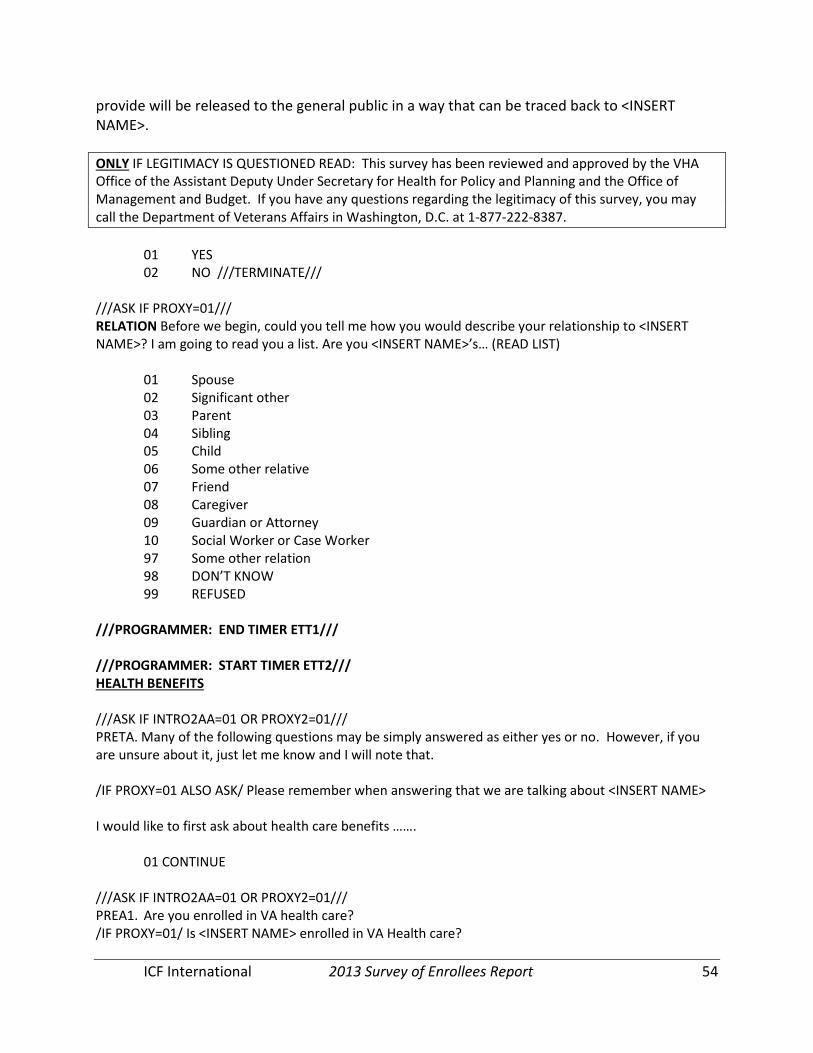
ICF International 2013 Survey of Enrollees Report 54
provide will be released to the general public in a way that can be traced back to <INSERT NAME>. ONLY IF LEGITIMACY IS QUESTIONED READ: This survey has been reviewed and approved by the VHA Office of the Assistant Deputy Under Secretary for Health for Policy and Planning and the Office of Management and Budget. If you have any questions regarding the legitimacy of this survey, you may call the Department of Veterans Affairs in Washington, D.C. at 1-877-222-8387.
01 YES 02 NO ///TERMINATE///
///ASK IF PROXY=01/// RELATION Before we begin, could you tell me how you would describe your relationship to <INSERT NAME>? I am going to read you a list. Are you <INSERT NAME>’s… (READ LIST)
01 Spouse 02 Significant other 03 Parent 04 Sibling 05 Child 06 Some other relative 07 Friend 08 Caregiver 09 Guardian or Attorney 10 Social Worker or Case Worker 97 Some other relation 98 DON’T KNOW 99 REFUSED
///PROGRAMMER: END TIMER ETT1/// ///PROGRAMMER: START TIMER ETT2/// HEALTH BENEFITS ///ASK IF INTRO2AA=01 OR PROXY2=01/// PRETA. Many of the following questions may be simply answered as either yes or no. However, if you are unsure about it, just let me know and I will note that. /IF PROXY=01 ALSO ASK/ Please remember when answering that we are talking about <INSERT NAME> I would like to first ask about health care benefits …….
01 CONTINUE ///ASK IF INTRO2AA=01 OR PROXY2=01/// PREA1. Are you enrolled in VA health care? /IF PROXY=01/ Is <INSERT NAME> enrolled in VA Health care?

ICF International 2013 Survey of Enrollees Report 55
01 YES 02 NO 03 I DON’T REMEMBER ENROLLING 98 DON’T KNOW 99 REFUSED
//If PREA1=01// PREA1a: Did you enroll in VA for health care within the last five years? /IF PROXY=01/ Did <INSERT NAME> enroll in VA for health care within the last five years?
01. YES 02. NO 98. DON’T KNOW 99. REFUSED
//IF PREA1a=01// //single response// PREA1b What is the primary reason that you enrolled?
[INTERVIEWER: DO NOT READ] [SINGLE RESPONSE] 01 RECENT DISCHARGE FROM SERVICE 02 LOSS OF OR REDUCTION IN OTHER HEALTH INSURANCE BENEFITS 03 OTHER ECONOMIC CIRCUMSTANCES 04 To meet the requirement for health insurance coverage under the health reform law05 MOVED CLOSER TO A VA FACILITY 06 A VA FACILITY OPENED CLOSE TO ME 07 OTHER (PLEASE SPECIFY) 98 DON’T KNOW 99 REFUSED
/IF PROXY=01/ What is the primary reason <INSERT NAME> enrolled?
[INTERVIEWER: DO NOT READ] [SINGLE RESPONSE] 01 RECENT DISCHARGE FROM SERVICE 02 LOSS OF OR REDUCTION IN OTHER HEALTH INSURANCE BENEFITS 03 OTHER ECONOMIC CIRCUMSTANCES 04 TO MEET THE REQUIREMENT UNDER THE NEW HEALTH CARE REFORM LAWS 05 MOVED CLOSER TO A VA FACILITY 06 A VA FACILITY OPENED CLOSE TO <INSERT NAME> 07 OTHER (PLEASE SPECIFY) 98 DON’T KNOW 99 REFUSED
ICF International 2013 Survey of Enrollees Report 56
//IFPREA1b=07 PREA1b_O. Enter Response ///ASK IF INTRO2AA=01 OR PROXY2=01/// A1. Are you covered by Medicare? /IF PROXY=01ASK/ Is <INSERT NAME> covered by Medicare?
01 YES 02 //SKIP TO A7// NO 98 //SKIP TO A7// DON’T KNOW 99 //SKIP TO A7// REFUSED
///ASK IF A1=01/// A2. Did you choose to receive your Medicare coverage through a Medicare Advantage Plan and not
through the Original Medicare Plan? Medicare Advantage Plans include Medicare HMOs (Health Maintenance Organizations), Medicare PPOs (Preferred Provider Organizations), Medicare Special Needs Plans, and Medicare Private Fee-for-Service Plans.
//IF PROXY=01ASK// Did <INSERT NAME> choose to receive Medicare coverage through a Medicare Advantage Plan and not through the Original Medicare Plan? Medicare Advantage Plans include Medicare HMOs (Health Maintenance Organizations), Medicare PPOs (Preferred Provider Organizations), Medicare Special Needs Plans, and Medicare Private Fee-for-Service Plans. 01 //SKIP TO A6// YES 02 NO 98 DON’T KNOW 99 REFUSED
///ASK IF A2 IN (02,98,99) A3. Does your Medicare coverage pay for care if you are hospitalized?
//IF PROXY=01ASK// Does <INSERT NAME>’s Medicare coverage pay for care if hospitalized?
[INTERVIEWER NOTE: This type of Medicare is also sometimes called "Part A;" if they have it, there is generally no monthly fee or premium because they or a spouse paid for it through payroll taxes while they were working.]
01 YES 02 NO 98 DON’T KNOW 99 REFUSED
///ASK IF A2 IN (02,98,99) A4. Does your Medicare coverage pay for doctor's office visits?
//IF PROXY=01ASK// Does <INSERT NAME>’s Medicare coverage pay for doctor’s office visits?

ICF International 2013 Survey of Enrollees Report 57
[INTERVIEWER NOTE: This type of Medicare is also sometimes called "Part B;" if they have it, they generally pay a monthly fee or premium which may be directly deducted from their Social Security check.] 01 YES 02 NO 98 DON’T KNOW 99 REFUSED
///ASK IF A2 IN (02,98,99) A5. Do you purchase any private health care coverage to supplement Medicare; that is to pay for
services Medicare does not pay for? //IF PROXY=01ASK// Does <INSERT NAME> purchase any private health care coverage to
supplement Medicare; that is to pay for services Medicare does not pay for? [INTERVIEWER NOTE DO NOT READ: "YES" - TYPES OF PRIVATE INSURANCE A PERSON CAN
PURCHASE TO SUPPLEMENT MEDICARE INCLUDE MEDIGAP OR MEDICARE SUPPLEMENT. DOES NOT INCLUDE MEDICARE ADVANTAGE OR MEDICARE + CHOICE.]
[INTERVIEWER NOTE DO NOT READ: "NO" - A TYPE OF INSURANCE THAT DOES NOT COUNT IS
THE DEPARTMENT OF DEFENSE'S TRICARE FOR LIFE PLAN FOR MEDICARE ELIGIBLE MILITARY RETIREES.] 01 YES 02 NO 98 DON’T KNOW 99 REFUSED
///ASK IF A1=01/// A6. Do you have Medicare prescription drug coverage, "Part D"? //IF PROXY=01ASK// Does <INSERT NAME> have Medicare prescription drug coverage, "Part D?”
01 YES 02 NO 98 DON’T KNOW 99 REFUSED
///ASK IF INTRO2AA=01 OR PROXY2=01/// A7. Are you currently covered by Medicaid for any of your health care? //IF PROXY=01ASK// Is <INSERT NAME> currently covered by Medicaid for any of his or her
health care? In //DISPLAY STATE FROM SAMPLE// you may know it as //DISPLAY STATE MEDICAID PLAN
NAME-- RECALL LIST FROM 2005 FOR STATE MEDICAID PLAN NAME // //ONLY DISPLAY IF STATE MEDICAID PLAN NAME IS NOT “MEDICAID”//
ICF International 2013 Survey of Enrollees Report 58
[IF NECESSARY: Medicaid is a program that pays for Medical Assistance for certain individuals with low incomes and resources and is provided by your State government’s social services department.] [INTERVIEWER NOTE: "Medical Assistance" = "Medicaid" in some States.]
01 YES 02 NO 98 DON’T KNOW 99 REFUSED
///ASK IF INTRO2AA=01 OR PROXY2=01/// A8. Are you currently covered by the Department of Defense's TRICARE or TRICARE For Life health
care programs? //IF PROXY=01ASK// Is <INSERT NAME> covered by the Department of Defense's TRICARE or
TRICARE for Life health care programs? 01 YES 02 NO 98 DON’T KNOW 99 REFUSED
///ASK IF INTRO2AA=01 OR PROXY2=01/// A9. Are you currently covered by any other individual or group health plan, that either you, or an
employer, or someone else, such as a family member obtains for you? //IF PROXY=01ASK// Is <INSERT NAME> currently covered by any other individual or group
health plan that either <INSERT NAME>, or an employer, or someone else, such as a family member obtains for <INSERT NAME>?
[INTERVIEWER NOTE DO NOT READ: "YES" - DO COUNT ANY PRIVATE RETIREE HEALTH
INSURANCE PLAN.] [INTERVIEWER NOTE DO NOT READ: "NO" - DO NOT COUNT PRIVATE MEDIGAP, MEDICARE
SUPPLEMENT, MEDICARE ADVANTAGE, OR MEDICARE + CHOICE PLANS.] 01 YES
02 // NO 98 DON’T KNOW 99 REFUSED
///ASK IF A9=01/// A10. Who provides this coverage? If more than one source applies, please indicate the primary
source.
[INTERVIEWER: READ LIST CAN ONLY SELECT ONE]
ICF International 2013 Survey of Enrollees Report 59
01 Current employer, including COBRA coverage 02 Former employer 03 Individually purchased coverage 04 Federal, State, County, or local community health services program 05 Family member, such as a spouse, parent, etc. 97 Or from somewhere else? (SPECIFY) 98 DON’T KNOW 99 REFUSED
///ASK IF A10=97/ // A10_O. Who provides this coverage?
//TEXT RANGE 1-500//
///ASK IF A10 =97/// A10_V [INTERVIEWER: CAN YOUR SPECIFY RESPONSE BE CODED USING THE LIST BELOW IF YES, SELECT NOW. 01 Current employer, including COBRA coverage 02 Former employer 03 Individually purchased coverage 04 Federal, State, County, or local community health services program 05 Family member, such as a spouse, parent, etc. 96 NO, UNIQUE RESPONSE ///ASK IF A9=01/// A11. Does this coverage include prescription drug coverage?
01 YES 02 NO 98 DON’T KNOW 99 REFUSED
///ASK IF A9=01/// A12. Is this coverage provided through an HMO or other managed care organization?
[IF NECESSARY: An HMO or Health Maintenance Organization or other managed care coverage requires you to use certain doctors, hospitals, and other providers. If you use health care services or providers who are not in the plan, you pay more, or all of the cost for that health care.]
01 YES 02 NO 98 DON’T KNOW 99 REFUSED
ICF International 2013 Survey of Enrollees Report 60
///PROGRAMMER: END TIMER ETT2/// ///PROGRAMMER: END TIMER ETT3/// LONG-TERM CARE USE AND BENEFITS ///ASK IF INTRO2AA=01 OR PROXY2=01/// L1. Excluding any Medicare Supplement Policy, do you have a long-term care policy that covers
nursing home care, assisted living, or long-term care services in the home?
//IF PROXY=01 ASK// Excluding any Medicare Supplement Policy, does <INSERT NAME> have a long-term care policy that covers nursing home care, assisted living, or long-term care services in the home?
01 Yes 02 No 98 DON’T KNOW 99 REFUSED
///ASK IF INTRO2AA=01 OR PROXY2=01/// Pre_L2. How many times have you ever been a patient in a nursing home, assisted living, convalescent,
or rest home? A one-time discharge from a nursing home, assisted living. convalescent, or rest home would be considered one time.
//IF PROXY=01 ASK// How many times has <INSERT NAME> ever been a patient in a nursing home, assisted living, convalescent, or rest home?
01 GAVE RESPONSE 98 DON’T KNOW 99 REFUSED
//ASK IF Pre_L2=01 L2. How many times have you ever been a patient in a nursing home, assisted living, convalescent,
or rest home? A one-time discharge from a nursing home, assisted living. convalescent, or rest home would be considered one time.
//IF PROXY=01 ASK// How many times has <INSERT NAME> ever been a patient in a nursing home, assisted living, convalescent, or rest home?
RECORD RESPONSE /RANGE 0-99/
//ASK IF Pre_L2=01 AND L2<>0// L2am. When were you admitted the last time? (month, year) //IF PROXY=01 ASK// When was <INSERT NAME> admitted the last time? (month, year) [INTERVIEWER: PROBE FOR MONTH AND YEAR ]
ICF International 2013 Survey of Enrollees Report 61
01 January 02 February 03 March 04 April 05 May 06 June 07 July 08 August 09 September 10 October 11 November 12 December [98 DON’T KNOW] [99 REFUSED]
//ASK IF Pre_L2=01 AND L2<>0// L2ay. ENTER YEAR
/RANGE 1900-2013,9998,9999/ [9998 DON’T KNOW] [9999 REFUSED]
//ASK IF Pre_L2=01 AND L2<>0// L2b. How long were you there the last time? If you are currently a patient, please include the entire duration up to today. //IF PROXY=01 ASK// How long was <INSERT NAME>] there the last time? If <INSERT NAME> is currently a patient, please include the entire duration up to today.
01 1-30 days 02 31-60 days 03 61-90 days 04 91 to 180 days 05 181+ days 98 DON’T KNOW 99 REFUSED If L2am,l2ay is… L2B allowed… Future date none, it's an obvious error Current month, this year 1 (or 2 if current day is 31) or 98 or 99 Last Month, this year 1 or 2 (or 3 if current day is 30 or 31) or 98 or 99 2 Months ago, this year 1 or 2 or 3 (or 4 if current day is 30 or 31) or 98 or 99 3 Months ago, this year 1 or 2 or 3 or 4 or 98 or 99 4 or more months ago Any Don't Know/Refused Any
ICF International 2013 Survey of Enrollees Report 62
// If future date in l2am/l2ay or unacceptable response in l2b based on above chart// L2_conf. I apologize, but the time period I have recorded is invalid. I’d like to ask you about your most recent admission again so that I can be sure to record your answers correctly. 01 CONTINUE ///LOOP BACK TO L2AM/// //ASKIF Pre_L2=01 AND L2<>0// L2c. For the most recent admission, what were all of the sources of payment that covered or will
cover the cost of your nursing home, assisted living, convalescent, or rest home care for that first month or billing period?
//IF PROXY=01 ASK// For the most recent admission, what were all of the sources of payment that covered or will cover the cost of <INSERT NAME>’s nursing home, assisted living, convalescent, or rest home care for that first month or billing period?
/MUL=6/ [INTERVIEWER: SELECT ALL THAT APPLY.]
01 Private insurance 02 Self/private pay/out-of-pocket 03 Medicare (including Medicare HMO) 04 Medicaid (including Medicaid HMO) 05 Department of Veterans Affairs Contract or other Department of Veterans Affairs
Programs 06 Other 98 DON’T KNOW 99 REFUSED
//ASK IF Pre_L2=01 AND L2b in (02, 03, 04, 05, 98, 99)// L2d. What were all the sources of payment that covered or will cover the cost of your care for the
most recent month or billing period?
//IF PROXY=01 ASK// What were all the sources of payment that covered or will cover the cost of <INSERT NAME>’s care for the most recent month or billing period?
/MUL=6/ [INTERVIEWER: SELECT ALL THAT APPLY.] 01 Private insurance 02 Self/private pay/out-of-pocket 03 Medicare (including Medicare HMO) 04 Medicaid (including Medicaid HMO) 05 Department of Veterans Affairs Contract or other Department of Veterans Affairs
Programs
ICF International 2013 Survey of Enrollees Report 63
06 Other 98 DON’T KNOW 99 REFUSED
///ASK IF INTRO2AA=01 OR PROXY2=01/// Pre_L3. In the last 30 days how many times did you receive nursing services at home from someone
such as a visiting nurse, home health aide, or nurse's aide? Please count each separate visit as a separate time.
//IF PROXY=01 ASK// In the last 30 days how many times did <INSERT NAME> receive nursing services at home from someone such as a visiting nurse, home health aide, or nurse's aide?
01 GAVE RESPONSE 98 DON’T KNOW 99 REFUSED
//ASK IF Pre_L3=01// L3. In the last 30 days how many times did you receive nursing services at home from someone
such as a visiting nurse, home health aide, or nurse's aide? Please count each separate visit as a separate time.
//IF PROXY=01 ASK// In the last 30 days how many times did <INSERT NAME> receive nursing services at home from someone such as a visiting nurse, home health aide, or nurse's aide?
RECORD RESPONSE /RANGE 0-30/
//ASK IF Pre_L3=01 AND L3<>0// L3a. What were all the sources of payment that covered or will cover the cost of your nursing
services at home care for the most recent month or billing period?
//IF PROXY=01 ASK// What were all the sources of payment that covered or will cover the cost of <INSERT NAME>’s nursing services at home care for the most recent month or billing period?
/MUL=7/ [INTERVIEWER: SELECT ALL THAT APPLY.]
01 Private insurance 02 Self/private pay/out-of-pocket 03 Medicare (including Medicare HMO) 04 Medicaid (including Medicaid HMO) 05 Department of Veterans Affairs Contract or other Department of Veterans Affairs
Programs 06 Non-Paid/Family/Volunteer 07 Other 98 DON’T KNOW 99 REFUSED
ICF International 2013 Survey of Enrollees Report 64
///PROGRAMMER: END TIMER ETT3/// ///PROGRAMMER: START TIMER ETT4/// MEDICATION USE AND BENEFITS ///ASK IF INTRO2AA=01 OR PROXY2=01/// A13. Do you currently have a prescription drug benefit from VA? //IF PROXY=01ASK// Does <INSERT NAME> currently have a have prescription drug benefit from
VA?
01 YES 02 NO 98 DON’T KNOW 99 REFUSED
///ASK IF INTRO2AA=01 OR PROXY2=01/// A14A. How many different over the counter medications did you use in the last 30 days?
//IF PROXY=01ASK// How many different over the counter medications did <INSERT NAME> use in the last 30 days?
[IF NECESSARY: Your best guess is fine.]
________ [0 – 50] 98 DON’T KNOW 99 REFUSED
///ASK IF A14A NOT IN (0, 98, 99) /// A14B. Of these over the counter medications, how many did you obtain from VA?
//IF PROXY=01ASK// Of these over the counter medications, how many did <INSERT NAME> obtain from VA?
[INTERVIEWER NOTE: THESE MEDICATIONS COME FROM SOME VA FACILITY OR THROUGH THE MAIL FROM VA. DOES NOT REFER TO MEDICATIONS WHERE A RESPONDENT IS REIMBURSED FOR THE OUT OF POCKET COSTS.]
[IF NECESSARY: Your best guess is fine.] ________ [0 – A141A]
98 DON’T KNOW 99 REFUSED
///ASK IF INTRO2AA=01 OR PROXY2=01/// A15A. How many different prescription medications did you use in the last 30 days?

ICF International 2013 Survey of Enrollees Report 65
//IF PROXY=01ASK// How many different prescription medications did <INSERT NAME> use in the last 30 days?
[IF NECESSARY: Your best guess is fine.] ________ [0 – 50]
98 DON’T KNOW 99 REFUSED
///ASK IF A15A NOT IN (0, 98, 99)/// A15B. Of these prescription medications, how many did you obtain from VA?
//IF PROXY=01ASK// Of these prescription medications, how many did <INSERT NAME> obtain from VA?
[INTERVIEWER NOTE: THESE MEDICATIONS COME FROM SOME VA FACILITY OR THROUGH THE MAIL FROM VA. DOES NOT REFER TO MEDICATIONS WHERE A RESPONDENT IS REIMBURSED FOR THE OUT OF POCKET COSTS.]
[IF NECESSARY: Your best guess is fine.] ________ [0 – A15A]
98 DON’T KNOW 99 REFUSED
///ASK IF INTRO2AA=01 OR PROXY2=01/// PA16. On average, how much do you spend out-of-pocket for all your over the counter and
prescription medications on a monthly basis, not including any health insurance premiums you may pay?
//IF PROXY=01ASK// On average, how much does <INSERT NAME> spend out-of-pocket for all <INSERT NAME>’s over the counter and prescription medications on a monthly basis, not including any health insurance premiums <INSERT NAME> may pay? [IF NECESSARY: Your best guess is fine.]
01 GAVE RESPONSE 98 DON’T KNOW 99 REFUSED ///ASK IF PA16=01/// A16. On average, how much do you spend out-of-pocket for all your over the counter and
prescription medications on a monthly basis, not including any health insurance premiums you may pay?
//IF PROXY=01ASK// On average, how much does <INSERT NAME> spend out-of-pocket for all <INSERT NAME>’s over the counter and prescription medications on a monthly basis, not including any health insurance premiums <INSERT NAME> may pay?
ICF International 2013 Survey of Enrollees Report 66
[IF NECESSARY: Your best guess is fine.] ________ ENTER NUMBER [0 – 9999]
///PROGRAMMER: END TIMER ETT4/// ///PROGRAMMER: START TIMER ETT5/// VA HEALTH CARE SERVICES USE ///ASK IF INTRO2AA=01 OR PROXY2=01/// PREB1. Next, I will be asking you about use of medical health services in 2012 from both Non-VA sources, as well as from VA. First, my question is about Non-VA provided Health Care Services.
/IF PROXY=01/ Next, I will be asking you about <INSERT NAME>’s use of medical services in 2012 from both Non-VA sources, as well as from VA. First, my question is about Non-VA provided Health Care Services.
01 Continue ///ASK IF SPLIT=2, ELSE SKIP TO PREB22/// B11B. From October 2012 through December 2012, how many outpatient visits or trips, did you make
to any Non-VA doctor’s office, hospital, or outpatient clinic? Please do not count dental, mental health, substance abuse visits or any visits paid for by VA?
/IF PROXY=01/ From October 2012 through December 2012, how many outpatient visits or
trips, did <INSERT NAME> make to any Non-VA doctor’s office, hospital, or outpatient clinic? Please do not count dental, mental health, substance abuse visits or any visits paid for by VA? [IF NECESSARY: Your best guess is fine.]
[INTERVIEWER NOTE: PAID FOR INCLUDES ANY PART/PORTION OF.]
[INTERVIEWER ENTER 998-DON’T KNOW; 999=REFUSED]
ENTER NUMBER [RANGE=0- 366, 998, 999] ///ASK IF INTRO2AA=01 OR PROXY2=01/// PREB22 Now, the next few questions are in regards to any VA provided Health care. 01 Continue ///ASK IF SPLIT=2, ELSE SKIP TO B25/// B22B. From October 2012 through December 2012, how many outpatient visits or trips did you make
that were paid for by VA? That would include the number of times you went to a VA doctor, hospital or clinic for medical care or received medical care somewhere else that was paid for by VA. Do not count dental or mental health visits or trips to a pharmacy. [IF NECESSARY: Your best guess is fine.]
ICF International 2013 Survey of Enrollees Report 67
/IF PROXY=01/ From October 2012 through December 2012, how many outpatient visits or trips did <INSERT NAME> make that were paid for by VA? That would include the number of times <INSERT NAME> went to a VA doctor, hospital or clinic for medical care or received medical care somewhere else that was paid for by VA. Do not count dental or mental health visits or trips to a pharmacy. [INTERVIEWER NOTE: PAID FOR INCLUDES ANY PART/PORTION OF.] [INTERVIEWER ENTER 998-DON’T KNOW; 999=REFUSED] ENTER NUMBER [RANGE=0-366, 998, 999]
///ASK IF INTRO2AA=01 OR PROXY2=01/// B25. I am going to read you a list of possible ways you could use VA for your health care in the future.
Please listen to them all, and then tell me the one that best describes the primary way you plan to use VA health care in the future. Do you plan to use VA as….
/IF PROXY=01/ I am going to read you a list of possible ways <INSERT NAME> could use VA for health care in the future. Please listen to them all, and then tell me the one that best describes the primary way <INSERT NAME> plans to use VA health care in the future. Does <INSERT NAME> plan to use VA as [INTERVIEWER: PLEASE READ ENTIRE LIST. CHOOSE ONLY ONE. IF RESPONDENT WILL NOT PICK ONE, ENTER INTO “Some other way” BOTH RESPONSES]
01 Your primary source of health care; /IF PROXY=01/ a primary source of health care 02 Backup to non-VA care for some minor services 03 A “safety net” to use only if needed 04 For prescriptions; 05 For specialized care 06 Some other way; 07 Or do you have No plans to use VA for health care
/IF PROXY=01/ Or does <INSERT NAME> have no plans to use VA for health care? 98 DON’T KNOW 99 REFUSED
///ASK IF B25=06/// B25_O. Could you please tell me how you primarily plan to use VA for health care in the future?
/IF PROXY=01/ Could you please tell me how <INSERT NAME> primarily plans to use VA for health care in the future?
//TEXT RANGE 1-500//
///ASK IF B25 =06///
ICF International 2013 Survey of Enrollees Report 68
B25_V. [INTERVIEWER: CAN YOUR SPECIFY RESPONSE BE CODED USING THE LIST BELOW IF YES, SELECT NOW. 01 Your primary source of health care;
/IF PROXY=01/ a primary source of health care 02 Backup to non-VA care for some minor services
/IF PROXY=01/ As backup to non-VA care for some minor services 03 A “safety net” to use only if needed 04 For prescriptions; 05 For specialized care 96 NO, UNIQUE RESPONSE ///PROGRAMMER: END TIMER ETT5/// /// PROGRAMMER: START TIMER ETT6/// ///ASK IF INTRO2AA=01 OR PROXY2=01/// C1. Please tell me how you would complete the following statement…. I use VA services to meet…. ///IF PROXY=01/// Please tell me how <INSERT NAME> would complete the following statement… [INTERVIEWER PLEASE READ LIST]
01 All of my health care needs 02 Most of my health care needs 03 Some of my health care needs 04 None of my health care needs 05 I have no health care needs 98 DON’T KNOW 99 REFUSED
///ASK IF INTRO2AA=01 OR PROXY2=01/// PreC2. The following questions are about access to primary health care, whether at the VA or at another health care provider. Primary health care refers to physicals, immunizations, or routine care for illnesses such as the flu.
01 CONTINUE ///ASK IF INTRO2AA=01 OR PROXY2=01/// C2. How much does travel time or distance impact your decision to access care at your nearest
preferred health care provider? Would you say that it… 01. always impacts my decision to seek care when I need it? 02. often impacts my decision to seek care when I need it? 03. sometimes impacts my decision to seek care when I need it? 04. never impacts my decision to seek care when I need it? 98 DON’T KNOW 99 REFUSED
ICF International 2013 Survey of Enrollees Report 69
/IF PROXY=01/ How much does travel time or distance impact <INSERT NAME>’s decision to access care at their nearest preferred health care provider? Would <INSERT NAME> say that it…? 01. always impacts their decision to seek care when they need it? 02. often impacts their decision to seek care when they need it? 03. sometimes impacts their decision to seek care when they need it? 04. never impacts their decision to seek care when they need it? 98 DON’T KNOW 99 REFUSED ///ASK IF INTRO2AA=01 OR PROXY2=01/// C3. I will read you a list of potential barriers to seeking primary health care. Please tell me which you consider the greatest barrier to seeking primary health care at your nearest health care provider? (Choose one.) 01 Cost 02 Available medical services 03 Physical environment, neighborhood, provider professionalism, or other aspects of the
environment or surrounding area 04 Hours of operation, availability of parking, or other aspects about the accommodations at your
nearest preferred health care provider. 05 Travel Time or distance 06 Another barrier I haven’t mentioned 07 I have no problems accessing health care at the nearest health care provider 98 DON’T KNOW 99 REFUSED /IF PROXY=01/ I will read you a list of potential barriers to seeking primary health care. Please tell me which <INSERT NAME> considers the greatest barrier to seeking primary health care at their nearest health care provider? (Choose one.) 01 Cost 02 Available medical services 03 Physical environment, neighborhood, provider professionalism, or other aspects of the
environment or surrounding area 04 Hours of operation, availability of parking, or other aspects about the accommodations at
<INSERT NAME>’s nearest preferred health care provider. 05 Travel Time or distance 06 Another barrier I haven’t mentioned 07 <INSERT NAME> has no problems accessing health care at the nearest health care provider 98 DON’T KNOW 99 REFUSED ///ASK IF INTRO2AA=01 OR PROXY2=01/// C4. How many minutes, ONE WAY, is the most you would travel for primary health care? INTERVIEWER: 1 hour=60 minutes; 2 hours=120 minutes; 3 hours=240 minutes /IF PROXY=01/ How many minutes, ONE WAY, is the most <INSERT NAME> would travel for primary health care?
ICF International 2013 Survey of Enrollees Report 70
01 ENTER RESPONSE 98 DON’T KNOW 99 REFUSED
//IF C4=01// C4_M. How many minutes, ONE WAY, is the most you would travel for primary health care? INTERVIEWER: 1 hour=60 minutes; 2 hours=120 minutes; 3 hours=240 minutes /IF PROXY=01/ How many minutes, ONE WAY, is the most <INSERT NAME> would travel for primary health care? ENTER RESPONSE /RANGE 0-999/ ///ASK IF INTRO2AA=01 OR PROXY2=01/// PREC6. New technologies can help healthcare systems like the VA provide more convenient and timely healthcare to Veterans like you. In order to assess how these technologies might benefit Veterans, we would like to ask about your internet accessibility. /IF PROXY=01/ New technologies can help healthcare systems like the VA provide more convenient and timely healthcare to Veterans like <INSERT NAME>. In order to assess how these technologies might benefit Veterans, we would like to ask about <INSERT NAME>’s internet accessibility.
01 CONTINUE ///ASK IF INTRO2AA=01 OR PROXY2=01/// C6. Where do you most frequently access the Internet? (Choose one)
01 At home 02 Public Library 03 VA Medical Center Library 04 Other Public Wireless Spots (for example, internet cafes) 05 I don’t access the internet 06 Other 98 DON’T KNOW 99 REFUSED
/IF PROXY=01/ Where does <INSERT NAME> most frequently access the internet? 01 At home 02 Public Library 03 VA Medical Center Library 04 Other Public Wireless Spots (for example, internet cafes) 05 <INSERT NAME> doesn’t access the internet 06 Other 98 DON’T KNOW 99 REFUSED
ICF International 2013 Survey of Enrollees Report 71
///ASK IF C6 = 01/// C6a. Is your home internet connection…
01 Through a high-speed or “broadband” Internet connection through satellite or cable, or 02 Through a slower, dial-up connection over your landline telephone line 98 DON’T KNOW 99 REFUSED
/IF PROXY=01/ Is <INSERT NAME>’s home internet connection…
01 Through a high-speed or “broadband” Internet connection through satellite or cable, or 02 Through a slower, dial-up connection over the landline telephone line 98 DON’T KNOW 99 REFUSED
///PROGRAMMER: END TIMER ETT6/// ///PROGRAMMER: START TIMER ETT7/// VA HEALTH CARE SERVICES USE ///ASK IF INTRO2AA=01 OR PROXY2=01/// PRED5 I am now going to read you a list of statements and I would like you to tell me for each statement
if you completely agree, agree, neither agree nor disagree, disagree, or completely disagree. /IF PROXY=01/ I’m going to read you a list of statements and I would like you to tell me for each
statement if <INSERT NAME> completely agrees, agrees, neither agrees nor disagrees, disagrees, or completely disagrees.
01 CONTINUE
///ASK D12B:D12G IF INTRO2AA=01 OR PROXY2=01/// //PROGRAMMER: ROTATE KEY DRIVER SUBSECTIONS (E.G. Quality, Cost) AND THE ITEMS WITHIN EACH SUBSECTION. ALWAYS ASK “OTHER ISSUES” SECTION LAST.// Quality //ROTATE// D12b Veterans like me who use VA are satisfied with the health care they receive. D12g VA health care providers treat their patients with respect. Would you… (READ LIST)? /IF PROXY=01/ Would <INSERT NAME>…
01 Completely Agree 02 Agree 03 Neither agree nor disagree 04 Disagree 05 Completely Disagree 98 DON’T KNOW 99 REFUSED

ICF International 2013 Survey of Enrollees Report 72
//END ROTATE// ///ASK D11A:D11C IF INTRO2AA=01 OR PROXY2=01/// Cost //ROTATE// D11a VA is the most cost-effective health care provider for Veterans like me. D11c VA offers Veterans like me the best value for our health care dollar. Would you… (READ LIST)? /IF PROXY=01/ Would <INSERT NAME>…
01 Completely Agree 02 Agree 03 Neither agree nor disagree 04 Disagree 05 Completely Disagree 98 DON’T KNOW 99 REFUSED
//END ROTATE// ///ASK D13B:D13C IF INTRO2AA=01 OR PROXY2=01/// Availability and Accessibility of Services //ROTATE// D13b Veterans like me can get in and out of an appointment at VA in a reasonable time. D13c When Veterans like me go to VA for an appointment; they do not wait a long time to see the
doctor. Would you… (READ LIST)? /IF PROXY=01/ Would <INSERT NAME>…
01 Completely Agree 02 Agree 03 Neither agree nor disagree 04 Disagree 05 Completely Disagree 98 DON’T KNOW 99 REFUSED
//END ROTATE// ///ASK D13E:D13F IF INTRO2AA=01 OR PROXY2=01/// Convenience of Location //ROTATE// D13e There is a VA provider in my area that offers all of the health care services that Veterans like
me need.
ICF International 2013 Survey of Enrollees Report 73
D14a It is easy for Veterans like me to get around in the VA health care facility. D15f It is easy to get to my local VA facility. Would you… (READ LIST)? /IF PROXY=01/ Would <INSERT NAME>…
01 Completely Agree 02 Agree 03 Neither agree nor disagree 04 Disagree 05 Completely Disagree 98 DON’T KNOW 99 REFUSED
//END ROTATE// ///ASK D10C IF INTRO2AA=01 OR PROXY2=01/// Other Factors: Friends Using VA Services //ROTATE// D10c Veterans like me like going to VA because you can talk to other Veterans. Would you… (READ LIST)? /IF PROXY=01/ Would <INSERT NAME>…
01 Completely Agree 02 Agree 03 Neither agree nor disagree 04 Disagree 05 Completely Disagree 98 DON’T KNOW 99 REFUSED
//END ROTATE// ///ASK D14C:D14D IF INTRO2AA=01 OR PROXY2=01/// Knowledge of VA Health Benefits //ROTATE// D14c I feel I know what is available to me through my VA benefits. D14d I understand how my VA health benefits work. Would you… (READ LIST)? /IF PROXY=01/ Would <INSERT NAME>…
01 Completely Agree 02 Agree 03 Neither agree nor disagree 04 Disagree
ICF International 2013 Survey of Enrollees Report 74
05 Completely Disagree 98 DON’T KNOW 99 REFUSED
///ASK D16D:D16h IF INTRO2AA=01 OR PROXY2=01/// Availability of NON-VA Health Care Alternatives //ROTATE// D16d I have a doctor outside VA who I really like and trust. D16e My family has a health insurance plan that covers me and the rest of the family. D16h I tend to use the same healthcare providers as my spouse/partner and/or children Would you… (READ LIST)? /IF PROXY=01/ Would <INSERT NAME>…
01 Completely Agree 02 Agree 03 Neither agree nor disagree 04 Disagree 05 Completely Disagree 98 DON’T KNOW 99 REFUSED
//END ROTATE// ///ASK D16C AND D16F IF INTRO2AA=01 OR PROXY2=01/// Other Issues //ROTATE// D16c I would only use VA if I did not have access to any other source of health care. D16f Veterans who can afford to use other sources of health care should leave the VA to those who
really need it. ///ASK IF C1 NE 01/// D16b If the cost of health care to me increases, I will use VA more. ///ASK IF C1 NE 04,05/// D16g My use of VA will decrease if my financial resources improve. Would you… (READ LIST)? /IF PROXY=01/ Would <INSERT NAME>…
01 Completely Agree 02 Agree 03 Neither agree nor disagree 04 Disagree 05 Completely Disagree 98 DON’T KNOW 99 REFUSED
ICF International 2013 Survey of Enrollees Report 75
//END ROTATE// ///PROGRAMMER: END TIMER ETT7/// ///PROGRAMMER: START TIMER ETT8/// HEALTH AND LIFESTYLE ///ASK IF INTRO2AA=01 OR PROXY2=01/// PREE1. The next question is about your current health.
/IF PROXY=01/ The next question is about <INSERT NAME>’s current health.
01 CONTINUE ///ASK IF INTRO2AA=01 OR PROXY2=01/// E1. Compared to other people your age, would you say your health is:
/IF PROXY=01/ Compared to other people <INSERT NAME>’s age, would they say their health is:
[INTERVIEWER PLEASE READ LIST]
01 Excellent 02 Very good 03 Good 04 Fair, or 05 Poor
98 DON’T KNOW 99 REFUSED
///ASK IF INTRO2AA=01 OR PROXY2=01/// PREE5 We are almost finished. The next questions are for demographic purposes only.
01 CONTINUE ///ASK IF INTRO2AA=01 OR PROXY2=01/// E5. Which of the following best describes your current marital status?
/IF PROXY=01/ Which of the following best describes <INSERT NAME>’s current marital status?
[INTERVIEWER READ LIST.]
01 Married 06 Registered Civil Partnership 07 Registered Common Law Partnership 02 Widowed 03 Divorced 04 Separated
ICF International 2013 Survey of Enrollees Report 76
05 Single – Never Married
98 DON’T KNOW 99 REFUSED
///ASK IF INTRO2AA=01 OR PROXY2=01/// E6.
///IF E5 IN (01,04, 06, 07)/// Not including yourself, how many dependents, such as your spouse or dependent children do you currently have? /IF E5 NE (01,04,06,07) ASK/ Not including yourself, how many dependents, such as dependent children, do you currently have? /IF PROXY=01AND E5 IN (01,04,06,07) ASK/ Not including <INSERT NAME>, how many dependents, such as a spouse or dependent children does <INSERT NAME> currently have? /IF PROXY=01 AND E5 NE (01,04,06,07) ASK/ Not including <INSERT NAME>, how many dependents, such as dependent children, does <INSERT NAME> currently have? [INTERVIEWER NOTE: “DEPENDENT” IS ANYONE WHO RELIES ON THE RESPONDENT FOR AT LEAST HALF OF THAT PERSON’S FINANCIAL SUPPORT.] [INTERVIEWER: ENTER 98-DON’T KNOW; 99-REFUSED ENTER NUMBER [RANGE=0-97, 98, 99]
//If E6 #1-97 ASK// E7a. How many of these dependents are under the age of 18 (0 to 17 years of age)?
ENTER NUMBER [RANGE=0-E6, 98, 99]
//IF E6#1-97 and E7a ne E6 ASK// E8a. How many of these dependents are between the age of 18 and 26?
ENTER NUMBER [RANGE=0-E6, 98, 99] //IF SUM E7a+E8a(excluding 98,99) > E6 [multiple responses allowed] [if after responding to E6_1, the sum of E7a and E8a is still greater than E6, proceed to next question] E6_1. I’m sorry, earlier I have you recorded as saying you currently have //FILL_E6// total dependents. For dependents under the age of 18 I have you recorded as saying //FILL_E7a//. For dependents 18 to 26 I have you recorded as saying //FILL_E8a//, for a total of //FILL SUM OF E7a+E8a// which is greater than the original number of dependents. Could you please tell me if the total number of dependents is incorrect, or do I have the wrong number of dependents under the age of 18 or between the ages of 18 and 26? //IF PROXY=1// I’m sorry, earlier I have you recorded as saying <INSERT NAME> currently has //FILL_E6// total dependents. For dependents under the age of 18 I have you recorded as saying //FILL_E7a//. For dependents 18 to 26 I have you recorded as saying //FILL_E8a//, for a total of //FILL
ICF International 2013 Survey of Enrollees Report 77
SUM OF E7a+E8a// which is greater than the original number of dependents. Could you please tell me if the total number of dependents is incorrect, or do I have the wrong number of dependents under the age of 18 or between the ages of 18 and 26?
01 CHANGE DEPENDENT TOTAL 02 CHANGE DEPENDENT UNDER AGE 18 03 CHANGE DEPENDENT BETWEEN AGE 18-26 99 REFUSED
PERIOD OF MILITARY SERVICE ///ASK IF INTRO2AA=01 OR PROXY2=01/// PREE6A. In the following, we would like to obtain information on your active duty military
history. Most Veterans have served only one continuous tour of duty, with no breaks in service; this is one term of service. Some Veterans have experienced breaks in service and had more than one tour of duty, and thus have served multiple terms of service. /IF PROXY=01/ In the following, we would like to obtain information on <INSERT NAME>’s active duty military history. Most Veterans have served only one continuous tour of duty, with no breaks in service; this is one term of service. Some Veterans have experienced breaks in service and had more than one tour of duty, and thus have served multiple terms of service. 01 CONTINUE
///ASK IF INTRO2AA=01 OR PROXY2=01/// E6A. How many terms of active duty military service have you served? Please do not include Reserve
or National Guard training or drill periods unless “activated” at the time.
/IF PROXY=01/ How many terms of active duty military service has <INSERT NAME> served? Please do not include Reserve or National Guard training or drill periods unless “activated” at the time. [INTERVIEWER NOTE: WE ARE ONLY RECORDING THE FIRST SIX PERIODS.] ENTER NUMBER [1-6] 98 (SKIP TO E8) DON’T KNOW 99 (SKIP TO E8) REFUSED
///ASK IF E6A NOT IN (98,99)/// E6AT. /IFE6A >1/I would like to ask you the year you started and ended each of these terms of active
duty military service. Starting with your first term…
/IF E6A=1/ I would like to ask you the year you started and ended this term of active duty military service.

ICF International 2013 Survey of Enrollees Report 78
/IF PROXY=01/I would like to ask you the year <INSERT NAME> started and ended each of these terms of active duty military service. Starting with <INSERT NAME’s> first term… /IF PROXY=01 and E6=1/I would like to ask you the year <INSERT NAME> started and ended this term of active duty military service. 01 CONTINUE
/START LOOP EQUAL TO E6A/ ///ASK E6B_1, E6C_1, E7_1 IF E6A=1-6/// ///ASK E6B_2, E6C_2, E7_2 IF E6A=2-6/// ///ASK E6B_3, E6C_3, E7_3 IF E6A=3-6/// ///ASK E6B_4, E6C_4, E7_4 IF E6A=4-6/// ///ASK E6B_5, E6C_5, E7_5 IF E6A=5-6/// ///ASK E6B_6, E6C_6, E7_6 IF E6A=6/// ///ASK IF E6A NOT IN (98,99)/// //E6B_1=1ST PERIOD; E6B_2=2ND PERIOD; E6B_3=3RD PERIOD…UP TO E6B_6=6TH PERIOD// E6B_1. What year did your <first> term of active duty military service start?
/IF E6A=1/ What year did your term of active duty military service start? /IF PROXY=01/ What year did <INSERT NAME>’s <first> term of active duty military service start? /IF PROXY=01 and E6A=1/ What year did <INSERT NAME>’s term of active duty military service start? [INTERVIEWER: ENTER 9998-DON’T KNOW; 9999-REFUSED]
ENTER YEAR [RANGE: 1918-2013, 9998, 9999] ///ASK IF E6A NOT IN (98,99)/// //E6C_1=1ST PERIOD; E6C_2=2ND PERIOD; E6C_3=3RD PERIOD…UP TO E6C_6=6TH PERIOD// E6C_1. What year did your <first> term of active duty military service end?
/IF E6A=1/ What year did your term of active duty military service end? /IF PROXY=01/ What year did <INSERT NAME>’s <first> term of active duty military service end? /IF PROXY=01 and E6A=1/ What year did <INSERT NAME>’s term of active duty military service end? [INTERVIEWER: ENTER 9998-DON’T KNOW; 9999-REFUSED]
ENTER YEAR [RANGE: 1918-2013, 9998, 9999]

ICF International 2013 Survey of Enrollees Report 79
//PROGRAMMER: COMPARE START AND END DATE FROM E6B_1-E6B_6 TO E6C_1-E6C_6. IF E6C_N DATE < E6B_N DATE PROMPT INTERVIEWER: INTERVIEWER, THE END DATE MUST BE LATER THAN THE START DATE. VERIFY THAT THE ACTIVE DUTY MILITARY SERVICE END DATE IS GREATER THAN OR EQUAL TO THE ACTIVE DUTY MILITARY SERVICE START DATE// ///ASK IF E6A NOT IN (98,99)/// //E7_1=1ST PERIOD; E7_2=2ND PERIOD; E7_3=3RD PERIOD…UP TO E7_6=6TH PERIOD// E7_1. During this term of military service were you ever in or exposed to combat?
/IF PROXY=01/ During this term of military service was <INSERT NAME> ever in or exposed to combat?
01 YES 02 NO
98 DON’T KNOW 99 REFUSED
/END LOOP/ ///ASK IF E6A IN (98,99)/// E7. During this term of military service were you ever in or exposed to combat?
/IF PROXY=01/ During this term of military service was <INSERT NAME> ever in or exposed to combat?
01 YES 02 NO
98 DON’T KNOW 99 REFUSED
ABOUT YOU ///ASK IF INTRO2AA=01 OR PROXY2=01/// E8. How would you best characterize your employment status? I am going to read you a list. Please listen to all of the choices and then tell me which best describes you. Are you … /IF PROXY=01/ How would you describe <INSERT NAME>’s employment status? I am going to read you a list. Please listen to all of the choices and then tell me which best describes <INSERT NAME>. Is <INSERT NAME>… [INTERVIEWERNOTE: IF RESPONDENT IS ON VACATION OR LEAVE, PLEASE ASK HOW THE RESPONDENT WOULD NORMALLY DESCRIBE HIS/HER EMPLOYMENT STATUS.]
ICF International 2013 Survey of Enrollees Report 80
01 Employed Full-time 02 Self-employed full-time 03 Employed part-time 04 Self employed part-time 05 Unemployed, looking for work, or laid off 06 Currently not employed – either retired, a homemaker, student, etc.
98 DON’T KNOW 99 REFUSED
///ASK IF INTRO2AA=01 OR PROXY2=01/// E9. Would you describe yourself as Hispanic or Latino? /IF PROXY=01/ Would you describe <INSERT NAME> as Hispanic, or Latino?
01 YES 02 NO
98 DON’T KNOW 99 REFUSED
///ASK IF INTRO2AA=01 OR PROXY2=01/// E10. I am going to read you a list, please tell me which of the following describes your race. You can
choose more than one. Are you …
/IF PROXY=01/ I am going to read you a list, please tell me which of the following describes <INSERT NAME>’s race. You can choose more than one. Is <INSERT NAME>… [INTERVIEWER NOTE: PLEASE READ LIST, SELECT ALL THAT APPLY.]
/MUL=5/
01 American Indian or Alaska Native 02 Asian 03 Black or African-American 04 Native Hawaiian or Other Pacific Islander 05 White 98 DON’T KNOW 99 REFUSED
///ASK IF INTRO2AA=01 OR PROXY2=01/// PE11. Could you please tell me what your total annual household income was from all sources in 2012?
ICF International 2013 Survey of Enrollees Report 81
/IF PROXY=01/ Could you please tell me what <INSERT NAME>’s total annual household income was from all sources in 2012? [IF NECESSARY: I would like to remind you that everything we discuss is confidential, and that your answer to this question will not affect your benefits.] [IF NECESSARY: Your best guess or estimate is fine.]
01 GAVE RESPONSE (ANNUALLY) ///GO TO E11Y/// 02 GAVE RESPONSE (MONTHLY) ///GO TO E11M/// 98 DON’T KNOW 99 REFUSED
///ASK IF PE11=01/// E11Y. Could you please tell me what your total annual household income was from all sources in 2012.
/IF PROXY=01/ Could you please tell me what was <INSERT NAME>’s total annual household income was from all sources in 2011. [IF NECESSARY: I would like to remind you that everything we discuss is confidential, and that your answer to this question will not affect your benefits.] [IF NECESSARY: Your best guess or estimate is fine.]
[RANGE=$1 - $999,999] ///SKIP TO E11c./// ///ASK IF PE11=02/// E11M. Could you please tell me what your total annual household income was from all sources in 2012.
/IF PROXY=01/ Could you please tell me what was <INSERT NAME>’s total annual household income was from all sources in 2011. [IF NECESSARY: I would like to remind you that everything we discuss is confidential, and that your answer to this question will not affect your benefits.] [IF NECESSARY: Your best guess or estimate is fine.]
[RANGE=1-83,333] ///SKIP TO E11c./// ///CALCULATE VARIABLE E11MTOT. E11MTOT= E11M * 12/// ///ASK IF PE11 IN (98,99)/// E11a. This information is critical for VA for planning purposes. Could you please tell me which of the
following best describes your 2012 total annual household income from all sources. Would you say it is…..
ICF International 2013 Survey of Enrollees Report 82
/IF PROXY=01/ This information is critical for VA for planning purposes. Could you please tell me which of the following best describes <INSERT NAME>’s 2012 total annual household income from all sources. Would you say it is…..
(READ LIST [ROUND UP “999], THEN FOLLOW-UP AS INDICATED)
01 Less than $16,000 02 $16,000 - $25,999, 03 $26,000 - $35,999, 04 $36,000 - $45,999, 05 $46,000 - $55,999, OR 06 $56,000 or over? 98 DON’T KNOW 99 REFUSED
///ASK IF E11A=01 E11B1. Is it…?
01 Under $11,000, or 02 $11,000 - $15,999? 98 DON’T KNOW 99 REFUSED
///ASK IF E11A=02 E11B2. Is it…?
03 $16,000 – $20,999 04 $21,000 - $25,999? 98 DON’T KNOW 99 REFUSED
///ASK IF E11A=03 E11B3. Is it…?
05 $26,000 – $30,999 06 $31,000 - $35,999? 98 DON’T KNOW 99 REFUSED
///ASK IF E11A=04 E11B4. Is it…?
07 $36,000 – $40,999 08 $41,000 - $45,999? 98 DON’T KNOW 99 REFUSED
ICF International 2013 Survey of Enrollees Report 83
///ASK IF E11A=05 E11B5. Is it…?
09 $46,000 – $50,999 10 $51,000 - $55,999? 98 DON’T KNOW 99 REFUSED
///ASK IF INTRO2AA=01 OR PROXY2=01/// E11c. Can you please tell me which state you are in?
//National list of two letter abbreviations and PR for Puerto Rico//
/IF PROXY=01/ Can you please tell me which state <INSERT NAME> is in?
95 OTHER 98 DON’T KNOW 99 REFUSED
///PROGRAMMER: END TIMER ETT8/// ///PROGRAMMER: END TIMER ETT9/// ///ASK IF INTRO2AA=01 OR PROXY2=01/// Section F. Awareness of Health Care Reform Law PREF1. VA is interested in understanding Veterans awareness of the health care reform law, which is officially called the Patient Protection and Affordable Care Act.
01 Continue F1. How well do you understand the Patient Protection and Affordable Care Act? [SELECT ALL THAT APPLY] [INTERVIEWER NOTE: If respondent asks whether this is “Obamacare” you may respond “yes”] 01 I’ve followed this issue closely 02 I rely on others for information about the Act 03 The Patient Protection and Affordable Care Act does not affect me 04 I don’t understand this Act 98 DON’T KNOW 99 REFUSED /IF PROXY=01/ How well does <INSERT NAME> understand the Patient Protection and Affordable Care Act? [SELECT ALL THAT APPLY] 01 They’ve followed this issue closely 02 They rely on others for information about the Act
ICF International 2013 Survey of Enrollees Report 84
03 The Patient Protection and Affordable Care Act does not affect them 04 They don’t understand this Act 98 DON’T KNOW 99 REFUSED ///ASK IF INTRO2AA=01 OR PROXY2=01/// F2. How do you think the health care reform law will change your planned use of the VA health care system? [INTERVIEWER NOTE: If respondent asks whether this is “Obamacare” you may respond “yes”] 01 I will definitely increase my use of the VA health care system 02 I will probably increase my use of the VA health care system 03 I will not change my use 04 I will probably decrease my use of the VA health care system 05 I will definitely decrease my use of the VA health care system 98 DON’T KNOW 99 REFUSED /IF PROXY=01/ How does <INSERT NAME> think the health care reform law will change their planned use of the VA health care system? [SELECT ALL THAT APPLY] 01 They will definitely increase their use of the VA health care system 02 They will probably increase their use of the VA health care system 03 They will not change their use 04 They will probably decrease their use of the VA health care system 05 They will definitely decrease their use of the VA health care system 98 DON’T KNOW 99 REFUSED ///PROGRAMMER: END TIMER ETT9/// THANKS. That’s all I have. Thank you for your participation. The information you have provided will
help VA to better serve all Veterans in the future. Thank you and goodbye.
01 CONTINUE //ASK IF OUTCOME5=9 SEND MAIL SURVEY// CONFRM. A survey information packet will be mailed to you shortly. Let me confirm that I
have the correct address for you. Is your mailing address: //DISPLAY FROM SAMPLE//?
01 Yes 02 No 97 DON’T KNOW 99 REFUSED
ICF International 2013 Survey of Enrollees Report 85
//ASK IF CONFRM = 02// NUAD. NAMEGIVN: FIRST NAME //LENGTH = 40// NAMEFAMN: LAST NAME //LENGTH = 40// ADDR_1: ADDRESS1 //LENGTH = 40// ADDR_2: ADDRESS2 // LENGTH = 40// ///MAY BE BLANK/// CITY_1: CITY //LENGTH = 20// STATE_1: STATE //LENGTH = 2// ZIP_1: ZIP //LENGTH=5// 01 ALL CORRECT 02 CORRECT FIRST NAME 03 CORRECT LAST NAME 04 CORRECT ADDRESS 05 CORRECT CITY 06 CORRECT STATE 07 CORRECT ZIP CODE 97 DON’T KNOW 99 REFUSED //ASK IF CONFRM=01 OR NUAD =01// THANK. Thank you. A survey information packet will be sent and will take up to one week for arrival. 01 CONTINUE //DISPO = 127 “SEND MAIL SURVEY”// //ASK IF CONFRM IN (97,99) OR NUAD IN (97,99)// RTHNK. Thank you for your time. I have no further questions.
01 CONTINUE //TERMINATE// //DISPO = 31 “ADDRESS REFUSAL// ///PROGRAMMER: IF OUTCOME5=9 SET INTERVIEWER TYPE 5/// ///PROGRAMMER: IF OUTCOME5=10 SET INTERVIEWER TYPE 5/// Appendix 1. AL Medicaid AK Medicaid or Medical Assistance AZ Medicaid or Arizona Health care Cost Containment AR Medicaid CA Medicaid or Medi-Cal CO Medicaid CT Medicaid DE Medicaid or Diamond State Health Plan DC Medicaid or Medical Assistance
ICF International 2013 Survey of Enrollees Report 86
FL Medicaid GA Medicaid or Medical Assitance HI Medicaid or Quest/Medical Assistance ID Medicaid or Healthy Connections IL Medicaid IN Medicaid or Hoosier Healthwise IA Medicaid or Medical Assistance KS Medicaid KY Medicaid, Medical Assistance, or KenPAC LA Medicaid ME Medicaid or PrimeCare MD Medicaid or HealthChoice MA Medicaid or MassHealth MI Medicaid or Medical Assistance MN Medicaid MS Medicaid or HealthMACS MO Medicaid MT Medicaid or Passport NE Medicaid, Medical Assistance, or Nebraska Health Connection NV Medicaid NH Medicaid NJ Medicaid or New Jersey Care 2000 NM Medicaid or SALUD! NY Medicaid NC Medicaid, Carolina, ACCESS, ACCESS II or ACESS III, or Health care Connection ND Medicaid OH Medicaid OK Medicaid, SoonerCare Plus, or SoonerCare Choice OR Medicaid or the Oregon Health Plan PA Medicaid, Medical Assistance, or HealthChoices RI Medicaid, Medical Assistance, or RiteCare SC Medicaid SD Medicaid TN TennCare TX Medicaid or STAR UT Medicaid VT Medicaid VA Medicaid, Medical Assistance, Medallion, Options, or Medallion II WA N/A WI Medicaid WV N/A WY Medicaid


