18 The directors of GP Industries Limited present their report together with the audited consolidated financial statements of the Group and the statement of financial position and statement of changes in equity of the Company for the financial year ended 31 March 2011. 1. Directors The directors of the Company in office at the date of this report are: Executive: Victor Lo Chung Wing, Chairman Leung Pak Chuen, Executive Vice Chairman Brian Li Yiu Cheung, Managing Director Andrew Chuang Siu Leung Wong Man Kit Eric Ng Siu Kai (appointed on 1 April 2010) Non-executive: Lim Ah Doo Phua Bah Lee Lim Hock Beng 2. Arrangements to enable directors to acquire benefits by means of acquisition of shares or debentures Neither at the end of the financial year nor at any time during the financial year did there subsist any arrangement, to which the Company is a party, the objective of which is to enable the directors of the Company to acquire benefits by means of the acquisition of shares in, or debentures of, the Company or any other body corporate except for the Share Option Scheme 1999 set out in paragraphs 3 and 5 of this report. REPORT OF THE DIRECTORS
Transcript
18
The directors of GP Industries Limited present their report together with the audited consolidated financial statements of the Group
and the statement of financial position and statement of changes in equity of the Company for the financial year ended 31 March
2011.
1. Directors
The directors of the Company in office at the date of this report are:
Executive:
Victor Lo Chung Wing, Chairman
Leung Pak Chuen, Executive Vice Chairman
Brian Li Yiu Cheung, Managing Director
Andrew Chuang Siu Leung
Wong Man Kit
Eric Ng Siu Kai (appointed on 1 April 2010)
Non-executive:
Lim Ah Doo
Phua Bah Lee
Lim Hock Beng
2. Arrangements to enable directors to acquire benefits
by means of acquisition of shares or debentures
Neither at the end of the financial year nor at any time during the financial year did there subsist any arrangement, to which
the Company is a party, the objective of which is to enable the directors of the Company to acquire benefits by means of the
acquisition of shares in, or debentures of, the Company or any other body corporate except for the Share Option Scheme
1999 set out in paragraphs 3 and 5 of this report.
RepoRt of the DiRectoRs GP Industries Limited Annual Report 2010-11
19
RepoRt of the DiRectoRs GP Industries Limited Annual Report 2010-11
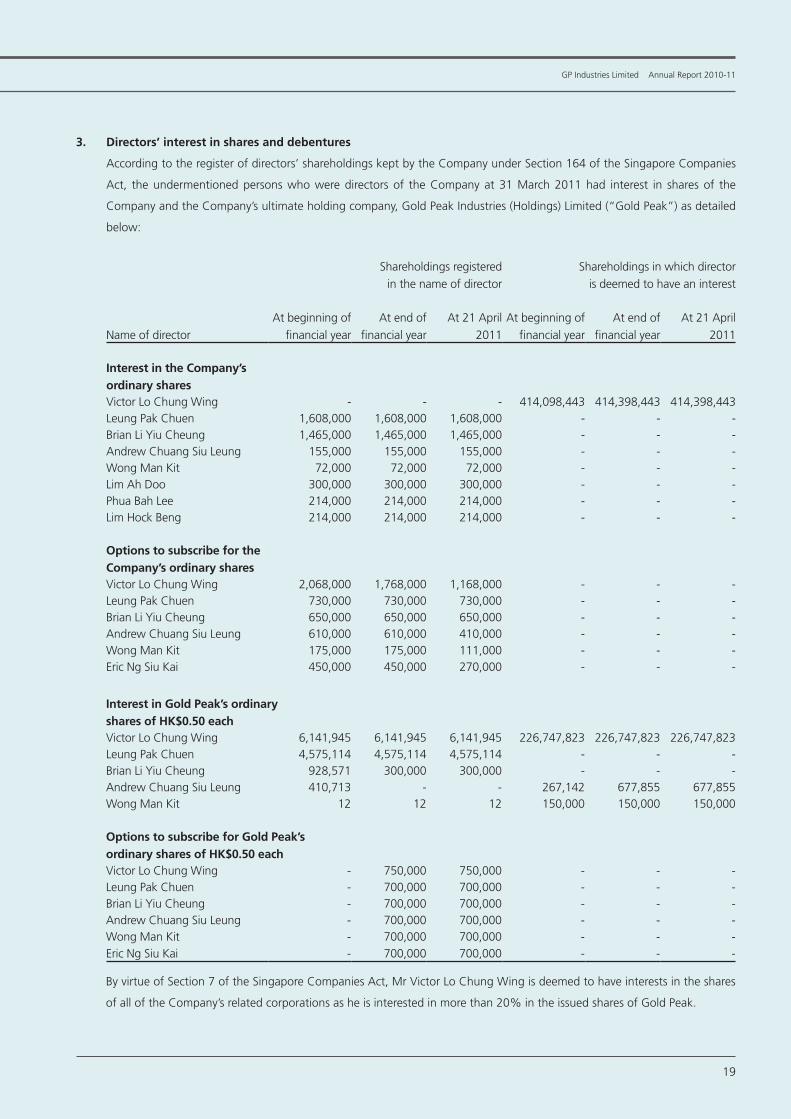
3. Directors’ interest in shares and debentures
According to the register of directors’ shareholdings kept by the Company under Section 164 of the Singapore Companies
Act, the undermentioned persons who were directors of the Company at 31 March 2011 had interest in shares of the
Company and the Company’s ultimate holding company, Gold Peak Industries (Holdings) Limited (“Gold Peak”) as detailed
below:
Shareholdings registeredin the name of director
Shareholdings in which director is deemed to have an interest
Name of directorAt beginning of
financial year At end of
financial yearAt 21 April
2011At beginning of
financial year At end of
financial yearAt 21 April
2011
Interest in the Company’s ordinary shares Victor Lo Chung Wing - - - 414,098,443 414,398,443 414,398,443Leung Pak Chuen 1,608,000 1,608,000 1,608,000 - - -Brian Li Yiu Cheung 1,465,000 1,465,000 1,465,000 - - -Andrew Chuang Siu Leung 155,000 155,000 155,000 - - -Wong Man Kit 72,000 72,000 72,000 - - -Lim Ah Doo 300,000 300,000 300,000 - - -Phua Bah Lee 214,000 214,000 214,000 - - -Lim Hock Beng 214,000 214,000 214,000 - - -
Options to subscribe for the Company’s ordinary sharesVictor Lo Chung Wing 2,068,000 1,768,000 1,168,000 - - - Leung Pak Chuen 730,000 730,000 730,000 - - - Brian Li Yiu Cheung 650,000 650,000 650,000 - - - Andrew Chuang Siu Leung 610,000 610,000 410,000 - - - Wong Man Kit 175,000 175,000 111,000 - - - Eric Ng Siu Kai 450,000 450,000 270,000 - - -
Interest in Gold Peak’s ordinaryshares of HK$0.50 each Victor Lo Chung Wing 6,141,945 6,141,945 6,141,945 226,747,823 226,747,823 226,747,823Leung Pak Chuen 4,575,114 4,575,114 4,575,114 - - - Brian Li Yiu Cheung 928,571 300,000 300,000 - - - Andrew Chuang Siu Leung 410,713 - - 267,142 677,855 677,855Wong Man Kit 12 12 12 150,000 150,000 150,000
Options to subscribe for Gold Peak’s ordinary shares of HK$0.50 each Victor Lo Chung Wing - 750,000 750,000 - - -Leung Pak Chuen - 700,000 700,000 - - -Brian Li Yiu Cheung - 700,000 700,000 - - -Andrew Chuang Siu Leung - 700,000 700,000 - - -Wong Man Kit - 700,000 700,000 - - -Eric Ng Siu Kai - 700,000 700,000 - - -
By virtue of Section 7 of the Singapore Companies Act, Mr Victor Lo Chung Wing is deemed to have interests in the shares
of all of the Company’s related corporations as he is interested in more than 20% in the issued shares of Gold Peak.
20
4. Directors’ receipt and entitlement to contractual benefits
Since the beginning of the financial year, no director has received or become entitled to receive a benefit which is required
to be disclosed under Section 201(8) of the Singapore Companies Act, by reason of a contract made by the Company or a
related corporation with the director or with a firm of which he is a member, or with a company in which he has a substantial
financial interest except as disclosed in paragraph 5 of this report and in the financial statements.
Certain directors have received remuneration from related corporations in their capacities as directors and/or executives of
those related corporations.
5. Share option schemes
a) Option schemes of the Company
i) The Company’s Executives’ Share Option Scheme adopted at an extraordinary general meeting held on 19
September 1996 (the “1996 Scheme”) was discontinued and replaced by Share Option Scheme 1999 (the “1999
Scheme”), which was adopted at an extraordinary general meeting held on 19 November 1999. All unexercised
options under the 1996 Scheme had expired by 1 August 2004. The duration of the 1999 Scheme had also
reached its maximum period of ten years on 31 March 2010 and ceased to operate accordingly. As a result, no
options could be granted subsequent to 31 March 2010. However, options previously granted under the 1999
Scheme continue to be exercisable in accordance with the regulations of the 1999 Scheme.
ii) The 1999 Scheme is administered by the Remuneration Committee, comprised Messrs Phua Bah Lee, Lim Ah Doo
and Lim Hock Beng during the financial year.
iii) Movements of the options granted under the 1999 Scheme to subscribe for the Company’s ordinary shares are
as follows:
Offer date Expiry dateExercise price
Number outstanding
at 1 April2010
Number exercised
Number cancelled/
lapsed
Number outstanding
at 31 March2011
No. 1 14 April 2000 13 April 2010 S$0.456 532,000 (328,000) (204,000) -
No. 2 4 April 2001 3 April 2011 S$0.620 1,622,000 - - 1,622,000
No. 3 14 August 2002 13 August 2012 S$0.550 919,000 - (13,000) 906,000
No. 4 15 September 2003 14 September 2013 S$0.880 2,937,000 - (20,000) 2,917,000
No. 5 5 July 2004 4 July 2014 S$1.030 3,677,000 - (155,000) 3,522,000
9,687,000 (328,000) (392,000) 8,967,000
iv) During the financial year, no option to take up unissued shares of the Company was granted.
RepoRt of the DiRectoRs (cont’d) GP Industries Limited Annual Report 2010-11
21
5. Share option schemes (cont’d)
v) 1) Details of the options granted under the 1996 Scheme to persons who were directors during the financial
year are as follows:
Name of director
Aggregate options
granted since commencement
of scheme to19 November 1999
Aggregate options
exercised since commencement
of scheme to31 March 2011
Aggregate options
lapsed since commencement
of scheme to31 March 2011
Aggregate options
outstanding at31 March 2011
Leung Pak Chuen 540,000 (420,000) (120,000) -
Brian Li Yiu Cheung 420,000 (320,000) (100,000) -
Andrew Chuang Siu Leung 290,000 (210,000) (80,000) -
Wong Man Kit 120,000 (65,000) (55,000) -
Eric Ng Siu Kai 240,000 (180,000) (60,000) -
2) Details of the options granted under the 1999 Scheme to persons who were directors during the financial
year are as follows:
Name of director
Aggregateoptions
granted sincecommencement
of scheme to31 March 2011
Aggregateoptions
exercised sincecommencement
of scheme to31 March 2011
Aggregateoptions
lapsed since commencement
of scheme to31 March 2011
Aggregateoptions
outstanding at31 March 2011
Victor Lo Chung Wing 2,068,000 (300,000) - 1,768,000
Leung Pak Chuen 1,790,000 (1,060,000) - 730,000
Brian Li Yiu Cheung 1,485,000 (835,000) - 650,000
Andrew Chuang Siu Leung 720,000 (110,000) - 610,000
Wong Man Kit 207,000 (32,000) - 175,000
Eric Ng Siu Kai 715,000 (265,000) - 450,000
Lim Ah Doo 490,000 (300,000) (190,000) -
Phua Bah Lee 374,000 (214,000) (160,000) -
Lim Hock Beng 374,000 (214,000) (160,000) -
vi) No options were granted to controlling shareholders of the Company and their associates. The options granted
to Mr Victor Lo Chung Wing, a controlling shareholder of the Company by virtue of his interest in Gold Peak, was
before 24 January 2008, when his interest in the issued shares of Gold Peak exceeded 20%.
vii) No director or employee has received five percent or more of the total number of options available under the
1999 Scheme.
RepoRt of the DiRectoRs (cont’d) GP Industries Limited Annual Report 2010-11
22
5. Share option schemes (cont’d)
viii) No options under the 1999 Scheme were granted to the Gold Peak Group Executive Directors, Non-executive
Directors and Executives (the “parent group employees”, which excludes the directors and executives of the
Company and its subsidiaries as defined in the 1999 Scheme) since the commencement of the 1999 Scheme to
31 March 2011.
ix) The options granted by the Company do not entitle the holders of such options, by virtue of such holding, to any
rights to participate in any share issue of any other company.
b) No option to take up unissued shares of subsidiaries has been granted during the financial year.
c) Save as aforesaid, during the financial year, there were no shares of the Company or any corporation in the Group
issued by virtue of the exercise of an option to take up unissued shares.
d) At the end of the financial year, there were no unissued shares of subsidiaries under option.
6. Audit committee
The Audit Committee carried out its functions in accordance with Section 201B(5) of the Singapore Companies Act, including
a review of the financial statements of the Company and of the Group for the financial year and the auditors’ report thereon
before their submission to the directors of the Company.
At the date of this report, the Audit Committee comprises the following members, all of whom are independent non-
executive directors:
Lim Ah Doo
Phua Bah Lee
Lim Hock Beng
The Audit Committee met five times since the last Annual General Meeting. The Audit Committee has reviewed the following:
a) the annual audit plan of the external auditors;
b) the results of the internal auditors’ examination of the Group’s systems of internal accounting controls;
c) the internal audit plans and results of internal audits as well as management’s responses to the recommendations of
the internal auditors;
d) the Group’s financial results and accounting policies;
e) the Group’s quarterly, half-yearly and full year results, the statement of financial position of the Company and
the consolidated financial statements of the Group before their submission to the Board for approval for public
announcements in respect of such results and related results announcement;
RepoRt of the DiRectoRs (cont’d) GP Industries Limited Annual Report 2010-11
23
RepoRt of the DiRectoRs (cont’d) GP Industries Limited Annual Report 2010-11
6. Audit committee (cont’d)
f) the Group’s interested person transactions;
g) non-audit services performed by the external auditors to ensure that the nature and extent of such services will not
prejudice the independence and objectivity of the external auditors before recommending to the Board, subject to
shareholders’ approval, the re-appointment of the Company’s external auditors; and
h) the co-operation and assistance given by the management to the internal and external auditors.
The Audit Committee has full access to and co-operation by management and full discretion to invite any director or executive
officer to attend its meetings, and reasonable resources to enable it to discharge its functions properly. The external and
internal auditors have unrestricted access to the Audit Committee.
The Audit Committee meetings are held with the internal and external auditors and by invitation, representatives from
management.
The Audit Committee has recommended to the Board of Directors that Deloitte & Touche LLP be nominated for re-appointment
as external auditors of the Group at the forthcoming Annual General Meeting of the Company.
7. Auditors
The auditors, Deloitte & Touche LLP, have expressed their willingness to accept re-appointment.
On behalf of the Board of Directors
Victor Lo Chung Wing
Chairman
Leung Pak Chuen
Executive Vice Chairman
27 June 2011
24
In the opinion of the directors, the consolidated financial statements of the Group and the statement of financial position and
statement of changes in equity of the Company as set out on pages 27 to 105 are drawn up so as to give a true and fair view of
the state of affairs of the Group and of the Company as at 31 March 2011, and of the results, changes in equity and cash flows
of the Group and changes in equity of the Company for the financial year then ended and at the date of this statement, there are
reasonable grounds to believe that the Company will be able to pay its debts as and when they fall due.
On behalf of the Board of Directors
Victor Lo Chung Wing
Chairman
Leung Pak Chuen
Executive Vice Chairman
27 June 2011
statement of DiRectoRs
25
To the members of GP Industries Limited
Report on the Financial Statements
We have audited the accompanying financial statements of GP Industries Limited (the “Company”) and its subsidiaries (the
“Group”) which comprise the statements of financial position of the Group and the Company as at 31 March 2011, and the
income statement, the statement of comprehensive income, statement of changes in equity and statement of cash flows of the
Group and the statement of changes in equity of the Company for the year then ended, and a summary of significant accounting
policies and other explanatory notes, as set out on pages 27 to 105.
Management’s Responsibility for the Financial Statements
Management is responsible for the preparation of financial statements that give a true and fair view in accordance with the provisions
of the Singapore Companies Act (the “Act”) and Singapore Financial Reporting Standards and for devising and maintaining a
system of internal accounting controls sufficient to provide reasonable assurance that assets are safeguarded against loss from
unauthorised use or disposition; and transactions are properly authorised and that they are recorded as necessary to permit the
preparation of true and fair profit and loss accounts and balance sheets and to maintain accountability of assets.
Auditors’ Responsibility
Our responsibility is to express an opinion on these financial statements based on our audit. We conducted our audit in accordance
with Singapore Standards on Auditing. Those standards require that we comply with ethical requirements and plan and perform
the audit to obtain reasonable assurance about whether the financial statements are free from material misstatement.
An audit involves performing procedures to obtain audit evidence about the amounts and disclosures in the financial statements.
The procedures selected depend on the auditor’s judgement, including the assessment of the risks of material misstatement of
the financial statements, whether due to fraud or error. In making those risk assessments, the auditor considers internal control
relevant to the entity’s preparation of financial statements that give a true and fair view in order to design audit procedures that
are appropriate in the circumstances, but not for the purpose of expressing an opinion on the effectiveness of the entity’s internal
control. An audit also includes evaluating the appropriateness of accounting policies used and the reasonableness of accounting
estimates made by management, as well as evaluating the overall presentation of the financial statements. We believe that the
audit evidence we have obtained is sufficient and appropriate to provide a basis for our audit opinion.
inDepenDent auDitoRs’ RepoRt GP Industries Limited Annual Report 2010-11
26
Opinion
In our opinion, the consolidated financial statements of the Group and the statement of financial position and statement of changes
in equity of the Company are properly drawn up in accordance with the provisions of the Act and Singapore Financial Reporting
Standards so as to give a true and fair view of the state of affairs of the Group and of the Company as at 31 March 2011 and of
the results, changes in equity and cash flows of the Group and changes in equity of the Company for the year ended on that date.
Report on Other Legal and Regulatory Requirements
In our opinion, the accounting and other records required by the Act to be kept by the Company and by those subsidiaries
incorporated in Singapore of which we are the auditors have been properly kept in accordance with the provisions of the Act.
Deloitte & Touche LLP
Public Accountants and
Certified Public Accountants
Loi Chee Keong
Partner
Appointed on 30 July 2010
Singapore
27 June 2011
inDepenDent auDitoRs’ RepoRt (cont’d)
27
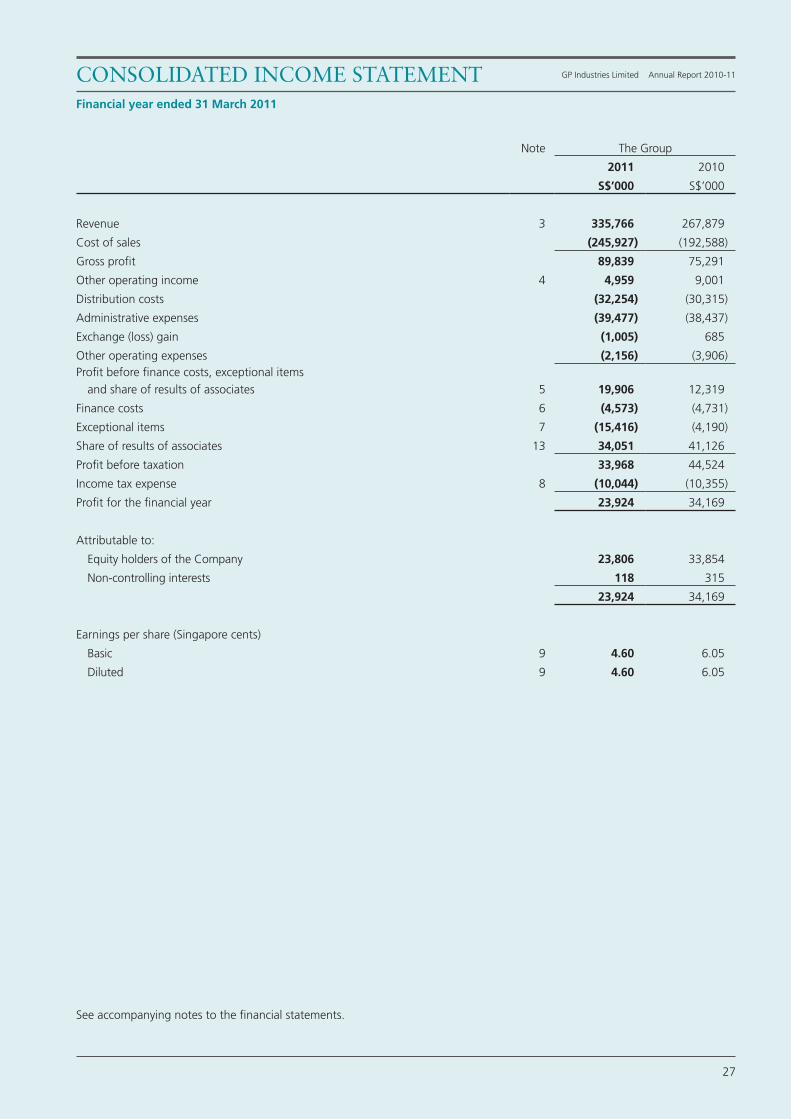
Note The Group
2011 2010
S$’000 S$’000
Revenue 3 335,766 267,879
Cost of sales (245,927) (192,588)
Gross profit 89,839 75,291
Other operating income 4 4,959 9,001
Distribution costs (32,254) (30,315)
Administrative expenses (39,477) (38,437)
Exchange (loss) gain (1,005) 685
Other operating expenses (2,156) (3,906)Profit before finance costs, exceptional items
and share of results of associates 5 19,906 12,319
Finance costs 6 (4,573) (4,731)
Exceptional items 7 (15,416) (4,190)
Share of results of associates 13 34,051 41,126
Profit before taxation 33,968 44,524
Income tax expense 8 (10,044) (10,355)
Profit for the financial year 23,924 34,169
Attributable to:
Equity holders of the Company 23,806 33,854
Non-controlling interests 118 315
23,924 34,169
Earnings per share (Singapore cents)
Basic 9 4.60 6.05
Diluted 9 4.60 6.05
consoliDateD income statement GP Industries Limited Annual Report 2010-11
Financial year ended 31 March 2011
See accompanying notes to the financial statements.
28
The Group
2011 2010
S$’000 S$’000
Profit for the financial year 23,924 34,169
Other comprehensive income (loss):
Exchange translation (deficit) surplus (7,386) 13,638Exchange translation surplus recognised in income
statement upon liquidation / de-registration of subsidiaries (44) (3,734)
Net exchange translation deficit and capital reservesurplus recognised in income statement upondisposal / liquidation of associates 2,195 372
Available-for-sale financial assets surplus recognised inincome statement upon disposal of other investments - (496)
Share of other comprehensive loss of associates (25,568) (25,833)
Other comprehensive loss for the financial year (30,803) (16,053)
Total comprehensive (loss) income for the financial year (6,879) 18,116
Attributable to:
Equity holders of the Company (6,885) 17,923
Non-controlling interests 6 193
(6,879) 18,116
See accompanying notes to the financial statements.
Balance at 31 March 2010 286,157 - - 506 56,322 342,985
Legal reserve represents that part of the profit after taxation of certain subsidiaries in the People’s Republic of China (“PRC”)
transferred in accordance with local requirements. The legal reserve cannot be distributed or reduced except where approval is
obtained from the relevant PRC authority to apply the amount either in setting off accumulated losses or increasing capital.
statements of changes in equity (cont’d)Financial year ended 31 March 2011
See accompanying notes to the financial statements.
33
2011 2010
S$’000 S$’000
Operating activities
Profit before taxation 33,968 44,524
Adjustments for:
Share of results of associates (34,051) (41,126)
Amortisation of intangible assets - 507
Depreciation of property, plant and equipment 5,646 5,529
Finance costs 4,573 4,731
Interest income (1,618) (4,960)
(Gain on disposal) Loss on disposal and write-off of property, plant and equipment, net (500) 59
Dividend income from other investments - (915)
Share-based payment expenses on share options granted by ultimate holding company 614 -
Allowance for impairment loss on intangible assets 18 24
Loss on dilution of interest in associates 103 2,079
Loss (Gain) on disposal / de-registration / liquidation of associates, net 619 (83)
Gain on de-registration / liquidation / disposal of subsidiaries (Note 39) (46) (41)
Allowance for impairment loss on investment in unquoted equity shares 10,218 8,815
Allowance for impairment loss on other investments 3,379 4,486
Allowance for doubtful non-current receivables 626 -
Loss in fair value of investment properties 620 -Excess of share of fair value of identifiable net tangible assets of a joint venture
acquired over consideration paid - (10,074)Excess of share of fair value of identifiable net tangible assets of additional interest
in an associate acquired over consideration paid - (890)Cumulative exchange translation surplus realised as income upon de-registration
of a subsidiary - (3,735)
Gain on disposal of other investments - (1,092)
Expenses incurred for selective capital reduction - 1,132
Additional provision for warranty cost in respect of CIH Limited’s divestment in 2003 - 2,519
Restructuring costs - 1,074
Operating profit before movements in working capital 24,169 12,563
Inventories 34 8,521
Receivables and prepayments (7,334) 25,848
Trade and other payables 1,569 10,555
Provisions (4) (1)
Amount due to ultimate holding company 396 814
Translation of foreign subsidiaries (3,898) (5,458)
Cash generated from operations 14,932 52,842
Income tax paid (5,969) (2,153)
Interest paid (4,575) (4,746)
Interest received 948 695
Net cash generated from operating activities 5,336 46,638
consoliDateD statement of cash flows GP Industries Limited Annual Report 2010-11
Financial year ended 31 March 2011
See accompanying notes to the financial statements.
34
2011 2010
S$’000 S$’000
Investing activities
Purchase of property, plant and equipment (note a) (4,557) (4,418)
Proceeds from amount retained for CIH Limited’s divestment in 2003, net 9,117 1,050
Dividends received from associates 14,289 7,953
Dividend received from other investments 520 475
Proceeds from disposal of property, plant and equipment 716 614Proceeds from CIH Limited’s divestment of interest in unquoted equity shares
in 2003 and 2005 26,219 12,200
Proceeds from disposal of associates 8,707 8,971Share of a joint venture’s uplift (placement) of fixed deposit with original maturity period
over three months 476 (492)
Proceeds from de-registration / return of surplus capital of associates 688 -
Payment in relation to acquisition of investment properties (715) -
Cash outflow from disposal of a subsidiary, net of proceeds received (Note 39) - (368)
Acquisition of interest in a joint venture, net of share of cash acquired (Note 38) - (3,019)
Additional investment in associates - (1,470)
Proceeds from disposal of other investments - 12,762
Net cash generated from investing activities 55,460 34,258
Financing activities
Drawdown of long-term bank loans 84,428 9,190
Repayment of long-term bank loans (102,675) (39,794)
Repayment of short-term bank loans, net (6,838) (16,758)
Obligations under finance leases (167) (157)
Dividends paid (18,171) (10,975)
Proceeds from issue of new shares 150 50
Dividend paid to non-controlling interests (86) -
Purchase of treasury shares (6,159) -
Payment for additional interest in a subsidiary (519) -
Net cash used in financing activities (50,037) (58,444)
Net increase in cash and cash equivalents 10,759 22,452
Cash and cash equivalents at beginning of the financial year 61,869 42,033
Effects of exchange rate changes on the balance of cash held in foreign currencies (4,226) (2,616)
Cash and cash equivalents at end of the financial year 68,402 61,869
Cash and cash equivalents at end of the financial year comprised:
Bank balances, deposits and cash (Note 20) 68,402 62,361
Less: Share of a joint venture’s fixed deposit with original maturity period over three months - (492)
68,402 61,869
Note (a) :
During the financial year ended 31 March 2010, the Group acquired property, plant and equipment with an aggregate cost of
S$4,532,000 of which S$114,000 were acquired under finance leases.
See accompanying notes to the financial statements.
Financial year ended 31 March 2011
consoliDateD statement of cash flows (cont’d)
35
1. General
The Company (Registration No. 199502128C) is incorporated in the Republic of Singapore and is listed on the Mainboard
of the Singapore Exchange Securities Trading Limited (“SGX-ST”). The Company’s registered office and principal place of
business is at 97 Pioneer Road, Singapore 639579. The financial statements are expressed in Singapore dollars (“S$”).
The principal activities of the Company comprise those of an investment holding company and regional headquarters of the
Group.
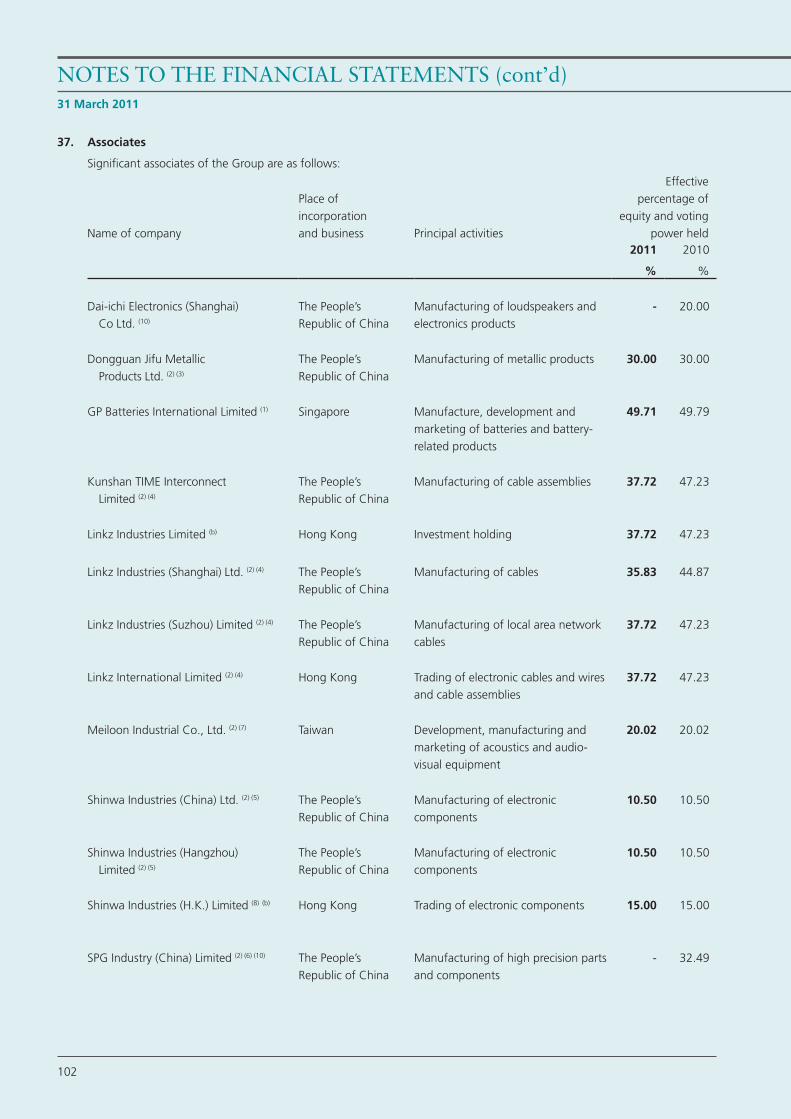
The principal activities of the Group’s significant subsidiaries, significant associates and joint venture are disclosed in Notes
36, 37 and 38 to the financial statements, respectively.
The consolidated financial statements of the Group and statement of financial position and statement of changes in equity of
the Company for the financial year ended 31 March 2011 were authorised for issue by the Board of Directors on 27 June 2011.
2. Summary of significant accounting policies
Basis of Accounting
The financial statements are prepared in accordance with the historical cost convention, except as disclosed in the accounting
policies below, and are drawn up in accordance with the provisions of the Singapore Companies Act and Singapore Financial
Reporting Standards (“FRS”).
Adoption of New and Revised Standards
During the financial year, the Group has adopted all the new and revised FRSs and Interpretations of FRS (“INT FRS”) that are
relevant to its operations and effective for annual periods beginning on or after 1 April 2010. The adoption of these new/
revised FRSs and INT FRSs does not result in any substantial change to the Group’s and Company’s accounting policies and
has no material effect on the amounts reported for the current and prior financial years.
The changes to certain relevant FRSs are described below:
The Group has adopted FRS 27 Consolidated and Separate Financial Statements (Revised 2009) in accounting for transaction
with non-controlling interests (see below - basis of consolidation for subsidiaries). Changes in the Group’s interest in
subsidiaries that do not result in a loss of control are accounted for as equity transactions. When the Group loses control
of a subsidiary, any interest retained in the former subsidiary will be recorded at fair value with the remeasurement gain or
loss recognised in the profit or loss. The change in the accounting policy has been applied prospectively and has no material
impact on the financial statements and earnings per share.
notes to the financial statements GP Industries Limited Annual Report 2010-11
31 March 2011
36
31 March 2011
notes to the financial statements (cont’d) GP Industries Limited Annual Report 2010-11
2. Summary of significant accounting policies (cont’d)
The Group has adopted FRS 103 Business Combinations (Revised 2009) in accounting for business combinations. Business
combinations are now accounted for using the acquisition method as at the acquisition date (see below - business
combinations). Previously, business combinations were accounted for under the purchase method. Pursuant to the purchase
method, the cost of an acquisition was measured at the fair value of the assets given, equity instruments issued and liabilities
incurred or assumed at the date of exchange, plus costs directly attributable to the acquisition. The excess of the Group’s
interest in the net fair value of the identifiable assets, liabilities and contingent liabilities over the cost of acquisition was
credited to profit or loss in the period of acquisition. For business acquisitions that were achieved in stages, any existing equity
interests in the acquiree were not remeasured to their fair value. Contingent consideration was recognised as an adjustment
to the cost of acquisition only when it was probable and can be measured reliably. The change in accounting policy has been
applied prospectively and has no impact on the financial statements.
Basis of Consolidation
Subsidiaries
The consolidated financial statements incorporate the financial statements of the Company and its subsidiaries made up to
31 March each year. Subsidiaries are entities controlled by the Company. Control is achieved when the Company has the
power to govern the financial and operating policies of an entity so as to obtain benefits from its activities.
The results of subsidiaries acquired or disposed of during the financial year are included in the consolidated income statement
from the effective date of acquisition or up to the effective date of disposal, as appropriate.
Where necessary, adjustments are made to the financial statements of subsidiaries to bring their accounting policies used in
line with those used by other members of the Group.
All inter-company transactions, balances, income and expenses are eliminated on consolidation.
Non-controlling interests in subsidiaries are identified separately from the Group’s equity therein. The interest of non-
controlling shareholders may be initially measured (at date of original business combination) either at fair value or at the non-
controlling interests’ proportionate share of the fair value of the acquiree’s identifiable net assets. The choice of measurement
basis is made on an acquisition-by-acquisition basis. Subsequent to acquisition, the carrying amount of non-controlling
interests is the amount of those interests at initial recognition plus the non-controlling interests’ share of subsequent changes
in equity. Total comprehensive income is attributed to non-controlling interests even if this results in the non-controlling
interests having a deficit balance.
Changes in the Group’s interest in a subsidiary that do not result in a loss of control are accounted for as equity transactions.
The carrying amounts of the Group’s interests and the non-controlling interests are adjusted to reflect the changes in their
relative interests in the subsidiary. Any difference between the amount by which the non-controlling interests are adjusted
and the fair value of the consideration paid or received is recognised directly in equity and attributed to owners of the
Company.
37
notes to the financial statements (cont’d) GP Industries Limited Annual Report 2010-11
2. Summary of significant accounting policies (cont’d)
When the Group loses control of a subsidiary, the profit or loss on disposal is calculated as the difference between (i) the
aggregate of the fair value of the consideration received and the fair value of any retained interest and (ii) the previous
carrying amount of the assets (including goodwill), and liabilities of the subsidiary and any non-controlling interests. Amounts
previously recognised in other comprehensive income in relation to the subsidiary are accounted for (i.e. reclassified to
profit or loss or transferred directly to retained earnings) in the same manner as would be required if the relevant assets or
liabilities were disposed of. The fair value of any investment retained in the former subsidiary at the date when control is lost
is regarded as the fair value on initial recognition for subsequent accounting under FRS 39 Financial Instruments: Recognition
and Measurement or, when applicable, the cost on initial recognition of an investment in an associate or jointly controlled
entity.
In the Company’s financial statements, investments in subsidiaries are carried at cost less any impairment in net recoverable
value that has been recognised in profit or loss.
Interest in Joint Venture
A joint venture is a contractual arrangement whereby the Group and other parties undertake an economic activity that is
subject to joint control, that is when the strategic financial and operating policy decisions relating to the activities require the
unanimous consent of the parties sharing control.
The Group’s joint venture arrangements involve the establishment of a separate entity in which each venturer has an interest.
The Group reports its interest in joint venture using proportionate consolidation. The Group’s share of the assets, liabilities,
income and expenses of joint venture are combined with the equivalent items in the consolidated financial statements on a
line-by-line basis.
Any goodwill arising on the acquisition of the Group’s interest in a joint venture is accounted for in accordance with the
Group’s accounting policy for goodwill arising on the acquisition of a subsidiary.
Where the Group transacts with its joint venture, unrealised profits and losses are eliminated to the extent of the Group’s
interest in the joint venture.
Where necessary, adjustments are made to the financial statements of joint venture to bring its accounting policies used in
line with those used by other members of the Group.
Interest in Associates
An associate is an entity over which the Group has significant influence and that is neither a subsidiary nor an interest in a
joint venture. Significant influence is the power to participate in the financial and operating policy decisions of the investee
but is not control or joint control over those policies.
38
31 March 2011
notes to the financial statements (cont’d) GP Industries Limited Annual Report 2010-11
2. Summary of significant accounting policies (cont’d)
The results and assets and liabilities of associates are incorporated in these financial statements using the equity method
of accounting. Under the equity method, investments in associates are carried in the consolidated statement of financial
position at cost as adjusted for post-acquisition changes in the Group’s share of the net assets of the associate, less any
impairment in the value of individual investments. Losses of an associate in excess of the Group’s interest in that associate
(which includes any long-term interests that, in substance, form part of the Group’s net investment in the associate) are not
recognised, unless the Group has incurred legal or constructive obligations or made payments on behalf of the associate.
Any excess of the cost of acquisition over the Group’s share of the net fair value of the identifiable assets, liabilities and
contingent liabilities of the associate recognised at the date of acquisition is recognised as goodwill. The goodwill is included
within the carrying amount of the investment and is assessed for impairment as part of the investment. Any excess of the
Group’s share of the net fair value of the identifiable assets, liabilities and contingent liabilities over the cost of acquisition,
after reassessment, is recognised immediately in profit or loss.
Where a Group entity transacts with an associate of the Group, profits and losses are eliminated to the extent of the Group’s
interest in the associate.
Where necessary, adjustments are made to the financial statements of associates to bring the accounting policies used in line
with those used by other members of the Group.
In the Company’s financial statements, investments in associates are carried at cost less any impairment in net recoverable
value that has been recognised in profit or loss.
Business Combinations
Acquisitions of subsidiaries and businesses are accounted for using the acquisition method. The consideration for each
acquisition is measured, on the acquisition date, at the aggregate fair values of assets given, liabilities incurred by the Group
to the former owners of the acquiree, and equity interests issued by the Group in exchange for control of the acquiree.
Acquisition-related costs are recognised in profit or loss as incurred.
Where applicable, the consideration for the acquisition includes any asset or liability resulting from a contingent consideration
arrangement, measured at its acquisition-date fair value. Subsequent changes in such fair values are adjusted against the cost
of acquisition where they qualify as measurement period adjustments (see below). The subsequent accounting for changes in
the fair value of the contingent consideration that do not qualify as measurement period adjustments depends on how the
contingent consideration is classified. Contingent consideration that is classified as equity is not remeasured at subsequent
reporting dates and its subsequent settlement is accounted for within equity. Contingent consideration that is classified as an
asset or a liability is remeasured at subsequent reporting dates in accordance with FRS 39 Financial Instruments: Recognition
and Measurement, or FRS 37 Provisions, Contingent Liabilities and Contingent Assets, as appropriate, with the corresponding
gain or loss being recognised in profit or loss.
39
notes to the financial statements (cont’d) GP Industries Limited Annual Report 2010-11
2. Summary of significant accounting policies (cont’d)
Where a business combination is achieved in stages, the Group’s previously held interests in the acquired entity are remeasured
to fair value at the acquisition date (i.e. the date the Group attains control) and the resulting gain or loss, if any, is recognised
in profit or loss. Amounts arising from interests in the acquiree prior to the acquisition date that have previously been
recognised in other comprehensive income are reclassified to profit or loss, where such treatment would be appropriate if
that interest were disposed of.
The acquiree’s identifiable assets, liabilities and contingent liabilities that meet the conditions for recognition under the FRS
are recognised at their fair value at the acquisition date, except that:
• deferred tax assets or liabilities and liabilities or assets related to employee benefit arrangements are recognised and
measured in accordance with FRS 12 Income Taxes and FRS 19 Employee Benefits respectively;
• liabilities or equity instruments related to the replacement by the Group of an acquiree’s share-based payment awards
are measured in accordance with FRS 102 Share-based Payment; and
• assets (or disposal groups) that are classified as held for sale in accordance with FRS 105 Non-current Assets Held for
Sale and Discontinued Operations are measured in accordance with FRS 105.
If the initial accounting for a business combination is incomplete by the end of the reporting period in which the combination
occurs, the Group reports provisional amounts for the items for which the accounting is incomplete. Those provisional
amounts are adjusted during the measurement period (see below), or additional assets or liabilities are recognised, to reflect
new information obtained about facts and circumstances that existed as of the acquisition date that, if known, would have
affected the amounts recognised as of that date.
The measurement period is the period from the date of acquisition to the date the Group obtains complete information about
facts and circumstances that existed as of the acquisition date and is subject to a maximum of one year from acquisition date.
The accounting policy for initial measurement of non-controlling interests is described above.
Foreign Currency Transactions
The individual financial statements of each Group entity are presented in the currency of the primary economic environment
in which the entity operates (its functional currency). The consolidated financial statements of the Group and the statement
of financial position and statement of changes in equity of the Company are presented in Singapore dollars, which is the
functional currency of the Company, and the presentation currency for the consolidated financial statements.
In preparing the financial statements of the individual entities, transactions in currencies other than the entity’s functional
currency are recorded at the rate of exchange prevailing on the date of the transaction. At the end of each reporting period,
monetary items denominated in foreign currencies are retranslated at the rates prevailing at the end of the reporting period.
Non-monetary items carried at fair value that are denominated in foreign currencies are retranslated at the rates prevailing on
the date when the fair value was determined. Non-monetary items that are measured in terms of historical cost in a foreign
currency are not retranslated.
40
31 March 2011
notes to the financial statements (cont’d) GP Industries Limited Annual Report 2010-11
2. Summary of significant accounting policies (cont’d)
Exchange differences arising on the settlement of monetary items, and on retranslation of monetary items are included in
profit or loss for the period. Exchange differences arising on the retranslation of non-monetary items carried at fair value are
included in profit or loss for the period except for differences arising on the retranslation of non-monetary items in respect
of which gains and losses are recognised in other comprehensive income. For such non-monetary items, any exchange
component of that gain or loss is also recognised in other comprehensive income.
Foreign Currency Translation
For the purpose of presenting consolidated financial statements, the assets and liabilities of the Group’s foreign operations
(including comparatives) are expressed in Singapore dollars using exchange rates prevailing at the end of the reporting
period. Income and expense items (including comparatives) are translated at the average exchange rates for the period,
unless exchange rates fluctuated significantly during that period, in which case the exchange rates at the dates of the
transactions are used. Exchange differences arising, if any, are recognised in other comprehensive income and accumulated
in the Group’s exchange translation reserve.
On the disposal of a foreign operation (i.e. a disposal of the Group’s entire interest in a foreign operation, or a disposal
involving loss of control over a subsidiary that includes a foreign operation, loss of joint control over a jointly controlled entity
that includes a foreign operation, or loss of significant influence over an associate that includes a foreign operation), all of
the accumulated exchange differences in respect of that operation attributable to the Group are reclassified to profit or loss.
Any exchange differences that have previously been attributed to non-controlling interests are derecognised, but they are
not reclassified to profit or loss.
In the case of a partial disposal (i.e. no loss of control) of a subsidiary that includes a foreign operation, the proportionate
share of accumulated exchange differences are re-attributed to non-controlling interests and are not recognised in profit or
loss. For all other partial disposals (i.e. of associates or jointly controlled entities not involving a change of accounting basis),
the proportionate share of the accumulated exchange differences is reclassified to profit or loss.
On consolidation, exchange differences arising from the translation of the net investment in foreign entities (including
monetary items that, in substance, form part of the net investment in foreign entities), and of borrowings and other currency
instruments designated as hedges of such investments, are recognised in other comprehensive income and accumulated in
exchange translation reserve.
Goodwill and fair value adjustments arising on the acquisition of a foreign operation are treated as assets and liabilities of the
foreign operation and translated at the closing rate.
41
notes to the financial statements (cont’d) GP Industries Limited Annual Report 2010-11
2. Summary of significant accounting policies (cont’d)
Revenue Recognition
Revenue is measured at the fair value of the consideration received or receivable and represents amounts receivable for goods
and services provided in the normal course of business, net of discounts and sales related taxes.
Revenue from the sale of goods is recognised when all the following conditions are satisfied:
• the Group has transferred to the buyer the significant risks and rewards of ownership of the goods;
• the Group retains neither continuing managerial involvement to the degree usually associated with ownership nor
effective control over the goods sold;
• the amount of revenue can be measured reliably;
• it is probable that the economic benefits associated with the transaction will flow to the entity; and
• the costs incurred or to be incurred in respect of the transaction can be measured reliably.
Management fee income is recognised when services are rendered.
Engineering development fee income is recognised when development services are rendered.
Interest income is accrued on a time basis, by reference to the principal outstanding and at the effective interest rate
applicable.
Dividend income from investments is recognised when the shareholders’ rights to receive payment have been established.
Rental income from investment properties is recognised on a straight-line basis over the term of the relevant lease.
Research Expenditure
Research expenditure is charged to profit or loss in the year in which it is incurred.
Retirement Benefit Costs
Payments to defined contribution retirement benefit plans are charged as an expense as they fall due. Payments to state-
managed retirement benefit schemes, such as the Singapore Central Provident Fund, are dealt with as payments to defined
contribution plans where the Group’s obligations under the plans are equivalent to those arising in a defined contribution
retirement benefit plan.
Employee Leave Entitlement
Employee entitlements to annual leave are recognised when they accrue to employees. A provision is made for the estimated
liability for annual leave as a result of services rendered by employees up to the end of the reporting period.
42
31 March 2011
notes to the financial statements (cont’d) GP Industries Limited Annual Report 2010-11
2. Summary of significant accounting policies (cont’d)
Borrowing Costs
Borrowing costs directly attributable to the acquisition, construction or production of qualifying assets, which are assets
that necessarily take a substantial period of time to get ready for their intended use or sale, are added to the cost of those
assets, until such time as the assets are substantially ready for their intended use or sale. Investment income earned on the
temporary investment of specific borrowings pending their expenditure on qualifying assets is deducted from the borrowing
costs eligible for capitalisation.
All other borrowing costs are recognised in profit or loss in the period in which they are incurred.
Income Tax
Income tax expense represents the sum of the tax currently payable and deferred tax.
The tax currently payable is based on taxable profit for the year. Taxable profit differs from profit as reported in the income
statement because it excludes items of income or expense that are taxable or deductible in other years and it further excludes
items that are not taxable or tax deductible. The Group’s liability for current tax is calculated using tax rates (and tax laws)
enacted or substantively enacted in countries where the Group’s entities operate by the end of the reporting period, and any
adjustment to tax payable in respect of previous years.
Deferred tax is recognised on differences between the carrying amounts of assets and liabilities in the financial statements
and the corresponding tax bases used in the computation of taxable profit, and is accounted for using the balance sheet
liability method. Deferred tax liabilities are generally recognised for all taxable temporary differences and deferred tax assets
are recognised to the extent that it is probable that taxable profits will be available against which deductible temporary
differences can be utilised. Such assets and liabilities are not recognised if the temporary difference arises from goodwill or
from the initial recognition (other than in a business combination) of other assets and liabilities in a transaction that affects
neither the taxable profit nor the accounting profit.
Deferred tax liabilities are recognised for taxable temporary differences arising on investments in subsidiaries and associates,
and interest in joint venture, except where the Group is able to control the reversal of the temporary difference and it is
probable that the temporary difference will not reverse in the foreseeable future. Deferred tax assets arising from deductible
temporary differences associated with such investments and interests are only recognised to the extent that it is probable that
there will be sufficient taxable profits against which to utilise the benefits of the temporary differences and they are expected
to reverse in the foreseeable future.
The carrying amount of deferred tax assets is reviewed at the end of each reporting period and reduced to the extent that it
is no longer probable that sufficient taxable profits will be available to allow all or part of the asset to be recovered.
43
notes to the financial statements (cont’d) GP Industries Limited Annual Report 2010-11
2. Summary of significant accounting policies (cont’d)
Deferred tax is calculated at the tax rates that are expected to apply in the period when the liability is settled or the asset
realised based on the tax rates (and tax laws) that have been enacted or substantively enacted by the end of the reporting
period. Deferred tax is charged or credited to profit or loss, except when it relates to items charged or credited outside
profit or loss (either in other comprehensive income or directly in equity), in which case the deferred tax is also recognised
outside profit or loss (either in other comprehensive income or directly in equity, respectively), or where they arise from the
initial accounting for a business combination. In the case of a business combination, the tax effect is taken into account in
calculating goodwill or determining the excess of the acquirer’s interest in the net fair value of the acquiree’s identifiable
assets, liabilities and contingent liabilities over cost.
Deferred tax assets and liabilities are offset when there is a legally enforceable right to set-off current tax assets against
current tax liabilities and when they relate to income taxes levied by the same taxation authority and the Group intends to
settle its current tax assets and liabilities on a net basis.
Financial Instruments
Financial assets and financial liabilities are recognised on the Group’s statement of financial position when the Group becomes
a party to the contractual provisions of the instrument.
Effective Interest Method
The effective interest method is a method of calculating the amortised cost of a financial instrument and of allocating interest
income or expense over the relevant period. The effective interest rate is the rate that exactly discounts estimated future cash
receipts or payments through the expected life of the financial instrument, or where appropriate, a shorter period.
Financial Assets
Investment in unquoted equity shares and other investments
The classification of investments is dependant on the purpose of holding the investments. The Group’s investment in
unquoted equity shares and other investments have been designated as available-for-sale financial assets with effect from 1
April 2005 (Notes 14 and 16).
Investments are recognised and derecognised on a trade date where the purchase or sale of an investment is under a contract
whose terms require delivery of the investment within the timeframe established by the market concerned, and are initially
measured at fair value, net of transaction costs.
Available-for-sale financial assets are measured at subsequent reporting dates at fair value. Gains and losses arising from
changes in fair value are recognised directly in other comprehensive income, until such investments are disposed of or are
determined to be impaired, at which time the cumulative gain or loss previously recognised in other comprehensive income
is included in the profit or loss for the period. Impairment losses recognised in profit or loss for equity investments classified
as available-for-sale are not subsequently reversed through profit or loss. The fair values of the available-for-sale financial
assets that are quoted in an active market are determined based on the published price quotations at the end of the reporting
period. The fair values of the available-for-sale financial assets that are not quoted in an active market and whose fair values
cannot be reliably measured are carried at cost less impairment.
44
31 March 2011
notes to the financial statements (cont’d) GP Industries Limited Annual Report 2010-11
2. Summary of significant accounting policies (cont’d)
Non-current receivables, trade and other receivables
Non-current receivables, trade and other receivables that have fixed or determinable payments that are not quoted in an
active market are accounted for as “loans and receivables”. Loans and receivables are measured at amortised cost using the
effective interest method less impairment. Interest income is recognised by applying the effective interest method, except for
short-term receivables when the recognition of interest would be immaterial.
Cash and cash equivalents in the consolidated statement of cash flows
Cash and cash equivalents in the consolidated statement of cash flows comprise cash on hand and at bank and short-term,
highly liquid investments that are readily convertible to known amounts of cash and which are subject to an insignificant risk
of changes in value, such as fixed deposit with an original maturity period of three months or less, and exclude cash at bank,
fixed deposit or highly liquid investments which are pledged as security. For the purpose of the consolidated statement of
cash flows, cash and cash equivalents are presented net of bank overdrafts which are repayable on demand.
Impairment of financial assets
Financial assets are assessed for indicators of impairment at the end of each reporting period. Financial assets are impaired
where there is objective evidence that, as a result of one or more events that occurred after the initial recognition of the
financial asset, the estimated future cash flows of the investment have been impacted.
For available-for-sale equity instruments, a significant or prolonged decline in the fair value of the investment below its cost
is considered to be objective evidence of impairment.
For all other financial assets, objective evidence of impairment could include:
• significant financial difficulty of the issuer or counterparty; or
• default or delinquency in interest or principal payments; or
• it becoming probable that the borrower will enter bankruptcy or financial re-organisation.
For certain categories of financial asset, such as trade receivables, assets that are assessed not to be impaired individually
are, in addition, assessed for impairment on a collective basis. Objective evidence of impairment for a portfolio of receivables
could include the Group’s past experience of collecting payments, an increase in the number of delayed payments in the
portfolio past the average credit period, as well as observable changes in national or local economic conditions that correlate
with default on receivables.
For financial assets carried at amortised cost, the amount of the impairment is the difference between the asset’s carrying
amount and the present value of estimated future cash flows, discounted at the original effective interest rate.
The carrying amount of the financial asset is reduced by the impairment loss charged directly to profit or loss for all financial
assets with the exception of trade receivables and other receivables where the carrying amount is reduced through the use
of an allowance account. When trade receivables and other receivables are uncollectible, they are written-off against the
allowance account. Subsequent recoveries of amounts previously written-off are credited to the profit or loss. Changes in the
carrying amount of the allowance account are recognised in profit or loss.
45
notes to the financial statements (cont’d) GP Industries Limited Annual Report 2010-11
2. Summary of significant accounting policies (cont’d)
When an available-for-sale financial asset is considered to be impaired, cumulative gains or losses previously recognised in
other comprehensive income are reclassified to profit or loss.
With the exception of available-for-sale equity instruments, if, in a subsequent period, the amount of the impairment loss
decreases and the decrease can be related objectively to an event occurring after the impairment loss was recognised, the
previously recognised impairment loss is reversed through profit or loss to the extent the carrying amount of the investment
at the date the impairment is reversed does not exceed what the amortised cost would have been had the impairment not
been recognised.
In respect of available-for-sale equity instruments, impairment losses previously recognised in profit or loss are not reversed
through profit or loss. In respect of available-for-sale equity instruments carried at fair value, any subsequent increase in fair
value after an impairment loss is recognised in other comprehensive income.
Derecognition of financial assets
The Group derecognises a financial asset only when the contractual rights to the cash flows from the asset expire, or it
transfers the financial asset and substantially all the risks and rewards of ownership of the asset to another entity. If the Group
neither transfers nor retains substantially all the risks and rewards of ownership and continues to control the transferred
asset, the Group recognises its retained interest in the asset and an associated liability for amounts it may have to pay. If the
Group retains substantially all the risks and rewards of ownership of a transferred financial asset, the Group continues to
recognise the financial asset and also recognises a collateralised borrowing for the proceeds received.
Financial Liabilities and Equity Instruments
Financial liabilities and equity instruments are classified according to the substance of the contractual arrangements entered
into and the definitions of a financial liability and an equity instrument.
Trade and other payables
Trade and other payables are initially measured at fair value, net of transaction costs, and are subsequently measured at
amortised cost, using the effective interest method. Interest expense is recognised on an effective yield basis, except for short-
term payables when the recognition of interest would be immaterial.
Bank borrowings
Interest-bearing bank loans and bank overdrafts are initially measured at fair value, and are subsequently measured at
amortised cost, using the effective interest method. Any difference between the proceeds (net of transaction costs) and
the settlement or redemption of borrowings is recognised over the term of the borrowings in accordance with the Group’s
accounting policy for borrowing costs.
Equity instruments
An equity instrument is any contract that evidences a residual interest in the assets of the Group after deducting all of its
liabilities. Equity instruments issued are recorded at the proceeds received, net of direct issue costs.
46
31 March 2011
notes to the financial statements (cont’d) GP Industries Limited Annual Report 2010-11
2. Summary of significant accounting policies (cont’d)
Treasury shares
When the Company purchases its own equity share capital, the consideration paid, including any directly attributable costs,
is taken against “Treasury Shares” within equity. When the shares are subsequently disposed of, the realised gains or losses
on disposal of the treasury shares are recognised in equity.
Derecognition of financial liabilities
The Group derecognises financial liabilities when, and only when, the Group’s obligations are discharged, cancelled or they
expire.
Derivative Financial Instruments
The Group’s activities expose it primarily to the financial risks of changes in foreign exchange rates and interest rates. The
Group uses derivative financial instruments to mitigate the financial impact associated with foreign currency and interest rate
fluctuations relating to certain forecasted transactions.
Derivative financial instruments are initially measured at fair value on the contract date, and are remeasured to fair value at
subsequent reporting dates.
Changes in the fair value of derivative financial instruments that are not designated and not effective as hedges of future cash
flows are recognised immediately in profit or loss.
Investment Properties
Investment property, which is property held to earn rentals and/or for capital appreciation, is measured initially at its cost,
including transaction costs. Subsequent to initial recognition, investment property is measured at fair value. Gains or losses
arising from changes in the fair value of investment property are included in profit or loss for the period in which they arise.
Property, Plant and Equipment
Property, plant and equipment are carried at cost less accumulated depreciation and any accumulated impairment loss where
the recoverable amount of the asset is estimated to be lower than its carrying amount.
Depreciation
Depreciation is charged to write-off the cost of property, plant and equipment over their estimated useful lives using the
straight-line method as follows:
Category of property, plant and equipment Depreciation rates per annumLeasehold improvements - 10% to 331/3%Furniture, fixtures and equipment - 5% to 25%Machinery and equipment - 10% to 331/3%Motor vehicles - 10% to 331/3%Moulds and tools - 10% to 50%
47
notes to the financial statements (cont’d) GP Industries Limited Annual Report 2010-11
2. Summary of significant accounting policies (cont’d)
Freehold land is not depreciated.
Leasehold land is depreciated over the period of the leases using the straight-line method.
Freehold buildings are depreciated over their estimated useful lives at 2% per annum using the straight-line method.
Leasehold buildings are depreciated over their estimated useful lives at 2% to 5% per annum using the straight-line method.
Fully depreciated assets still in use are retained in the financial statements.
The estimated useful lives, residual values and depreciation method are reviewed at each year end, with the effect of any
changes in estimate accounted for on a prospective basis.
Assets held under finance leases are depreciated over their expected useful lives on the same basis as owned assets.
The gain or loss on disposal or retirement of an item of property, plant and equipment is determined as the difference
between the sales proceeds and the carrying amount of the asset and is recognised in profit or loss.
Intangible Assets
Goodwill
Goodwill arising in a business combination is recognised as an asset at the date that control is acquired (the acquisition date).
Goodwill is measured as the excess of the sum of the consideration transferred, the amount of any non-controlling interest in
the acquiree and the fair value of the acquirer’s previously held equity interest (if any) in the entity over net of the acquisition-
date amounts of the identifiable assets acquired and the liabilities assumed.
If, after reassessment, the Group’s interest in the fair value of the acquiree’s identifiable net assets exceeds the sum of the
consideration transferred, the amount of any non-controlling interest in the acquiree and the fair value of the acquirer’s
previously held equity interest in the acquiree (if any), the excess is recognised immediately in profit or loss as a bargain
purchase gain.
Goodwill is not amortised but is reviewed for impairment at least annually. For the purpose of impairment testing, goodwill
is allocated to each of the Group’s cash-generating units expected to benefit from the synergies of the combination. Cash-
generating units to which goodwill has been allocated are tested for impairment annually, or more frequently when there is
an indication that the unit may be impaired. If the recoverable amount of the cash-generating unit is less than the carrying
amount of the unit, the impairment loss is allocated first to reduce the carrying amount of any goodwill allocated to the unit
and then to the other assets of the unit pro-rata on the basis of the carrying amount of each asset in the unit. An impairment
loss recognised for goodwill is not reversed in a subsequent period.
On disposal of a subsidiary or joint venture, the attributable amount of goodwill is included in the determination of the profit
or loss on disposal.
48
31 March 2011
notes to the financial statements (cont’d) GP Industries Limited Annual Report 2010-11
2. Summary of significant accounting policies (cont’d)
The Group’s policy for goodwill arising on the acquisition of an associate is described under “Interest in Associates” above.
Deferred Expenditure
Deferred expenditure represents the cost of acquiring the right of technical know-how for the production of new products
and expenditure incurred on the development of new products the commercial value of which is reasonably certain. The cost
is amortised, using the straight-line method, over a period of five years from the date of acquisition.
Trademark
The cost of acquiring rights to a trademark licence for the marketing and manufacturing of new products is amortised, using
the straight-line method, over the shorter of the period of the licence and twenty years.
Patent Rights
Patent rights are measured initially at purchase cost and are amortised, using the straight-line method, over their estimated
useful lives.
Corporate Club Membership
Investment in corporate club membership is held for long-term and is stated at cost less any impairment in net recoverable
value.
Inventories
Inventories are stated at the lower of cost and net realisable value. Cost comprises direct materials and where applicable,
direct labour costs and overheads that have been incurred in bringing the inventories to their present location and condition
calculated using the first-in, first-out method. Net realisable value is calculated as the actual or estimated selling price less all
further costs of production and the related costs of marketing, selling and distribution.
Leases
Leases are classified as finance leases whenever the terms of the lease transfer substantially all the risks and rewards of
ownership to the lessee. All other leases are classified as operating leases.
The Group as Lessor
Rental income from operating leases is recognised on a straight-line basis over the term of the relevant lease. Initial direct
costs incurred in negotiating and arranging an operating lease are added to the carrying amount of the leased asset and
recognised in profit or loss on a straight-line basis over the lease term.
The Group as Lessee
Assets held under finance leases are recognised as assets of the Group at their fair values at the inception of the lease. The
corresponding liability to the lessor is included in the statement of financial position as a finance lease obligation. Lease
payments are apportioned between finance charges and reduction of the lease obligation so as to achieve a constant rate
of interest on the remaining balance of the liability. The finance charges are recognised directly in profit or loss. Contingent
rentals are recognised as expenses in the periods in which they are incurred.
49
notes to the financial statements (cont’d) GP Industries Limited Annual Report 2010-11
2. Summary of significant accounting policies (cont’d)
Rentals payable under operating leases are recognised in profit or loss on a straight-line basis over the term of the relevant
leases. Contingent rentals arising under operating leases are recognised as expenses in the periods in which they are incurred.
In the event that lease incentives are received to enter into operating leases, such incentives are recognised as a liability. The
aggregate benefit of incentives is recognised as a reduction of rental expense on a straight-line basis, except where another
systematic basis is more representative of the time pattern in which economic benefits from the leased asset are consumed.
Impairment of Tangible and Intangible Assets Excluding Goodwill
At the end of each reporting period, the Group reviews the carrying amounts of its tangible and intangible assets to
determine whether there is any indication that those assets have suffered an impairment loss. If any such indication exists,
the recoverable amount of the asset is estimated in order to determine the extent of the impairment loss, if any. Where it is
not possible to estimate the recoverable amount of an individual asset, the Group estimates the recoverable amount of the
cash-generating unit to which the asset belongs.
Intangible assets with indefinite useful lives and intangible assets not yet available for use are tested for impairment annually,
and whenever there is an indication that the asset may be impaired.
Recoverable amount is the higher of fair value less costs to sell and value in use. In assessing value in use, the estimated future
cash flows are discounted to their present value using a pre-tax discount rate that reflects current market assessments of the
time value of money and the risks specific to the asset.
The extent of impairment was based on the net realisable value for those assets which are not expected to be further
deployed in operational use, while the estimates of value in use calculation for those assets which remain in operational use
have been adjusted to reflect the current level of business activities.
If the recoverable amount of an asset (or cash-generating unit) is estimated to be less than its carrying amount, the carrying
amount of the asset (or cash-generating unit) is reduced to its recoverable amount. An impairment loss is recognised as an
expense immediately.
Where an impairment loss subsequently reverses, the carrying amount of the asset (or cash-generating unit) is increased
to the revised estimate of its recoverable amount, but so that the increased carrying amount does not exceed the carrying
amount that would have been determined had no impairment loss been recognised for the asset (or cash-generating unit) in
prior years. A reversal of an impairment loss is recognised as income immediately.
50
31 March 2011
notes to the financial statements (cont’d) GP Industries Limited Annual Report 2010-11
2. Summary of significant accounting policies (cont’d)
Provisions
Provisions are recognised when the Group has a present obligation (legal or constructive) as a result of a past event, it is
probable that the Group will be required to settle the obligation, and a reliable estimate can be made of the amount of the
obligation.
The amount recognised as a provision is the best estimate of the consideration required to settle the present obligation at the
end of the reporting period, taking into account the risks and uncertainties surrounding the obligation. Where a provision is
measured using the cash flows estimated to settle the present obligation, its carrying amount is the present value of those
cash flows.
When some or all of the economic benefits required to settle a provision are expected to be recovered from a third party,
the receivable is recognised as an asset if it is virtually certain that reimbursement will be received and the amount of the
receivable can be measured reliably.
Share-based Payments
Equity-settled Share-based Payments
The fair value of the employee services received in exchange for the grant of options or shares is recognised as an expense
in the profit or loss with a corresponding increase in share-based payment reserve, or capital reserve in respect of options
granted by the Company’s ultimate holding company, over the vesting period.
Options granted by a Group entity pursuant to schemes approved by its respective shareholders were measured at fair value
(excluding the effect of non market-based vesting conditions) at the date of offer using the Black-Scholes pricing model. The
fair value determined at the offer date of the options is expensed on a straight-line basis over the vesting period, based on
the estimated number of shares that will eventually vest and adjusted for the effect of non market-based vesting conditions.
The expected life used in the model has been adjusted for the estimated effects of non-transferability, exercise restrictions
and behavioural considerations.
Certain directors and employees of the Group are also entitled to options to subscribe for the ordinary shares in the ultimate
holding company of the Company. The fair value of such options is determined by the ultimate holding company. The Group’s
attributable share of the fair value of such options is expensed on a straight-line basis over the vesting period.
The policy described above is applied to all equity-settled share-based payments that were granted after 22 November 2002
and vested after 1 January 2005. No amount has been recognised in the financial statements in respect of other equity-
settled share-based payments.
3. Revenue
The Group
2011 2010
S$’000 S$’000
Product sales 335,766 267,879
51
notes to the financial statements (cont’d) GP Industries Limited Annual Report 2010-11
4. Other operating income
The Group
2011 2010
S$’000 S$’000
Commission income - 155
Dividend income from other investments - 915
Engineering development and design fee income 696 731
Interest income:
An associate - 4
Banks 570 136
Third parties 1,048 4,820
Gain on disposal of property, plant and equipment, net 530 30
Management fee income from associates 260 479
Operating lease income 160 80
Tooling income 516 255
Others 1,179 1,396
4,959 9,001
5. Profit before finance costs, exceptional items and share of results of associates
Profit before finance costs, exceptional items and share of results of associates is arrived at after charging (crediting) the following:
The Group
2011 2010
S$’000 S$’000
Amortisation of intangible assets - 507
Depreciation of property, plant and equipment 5,646 5,529
Directors’ remuneration:
Fees 170 155
Other emoluments 3,126 2,521
Employee benefits expense (excluding directors’ remuneration) 63,334 54,487Cost of defined contribution plans included in employee
benefits expense and directors’ remuneration 3,791 3,344
Allowance and write-off for inventories, net of write-back 2,966 3,258
Cost of inventories recognised as expense 237,880 182,060
Property, plant and equipment written-off 30 89
Research expenditure 8,855 9,308
52
31 March 2011
notes to the financial statements (cont’d) GP Industries Limited Annual Report 2010-11
6. Finance costs
The Group
2011 2010
S$’000 S$’000
Interests on:
Bank loans, overdrafts and bills payable 4,567 4,726
Finance leases 6 5
4,573 4,731
7. Exceptional items
The Group
2011 2010
S$’000 S$’000
(Loss) Gain on disposal / de-registration / liquidation of associates, net (619) 83
Gain on de-registration / liquidation / disposal of subsidiaries 46 41
Allowance for impairment loss on investment in unquoted equity shares (10,218) (8,815)
Allowance for impairment loss on other investments (3,379) (4,486)
Allowance for doubtful non-current receivables (626) -
Loss in fair value of investment properties (620) -
Loss on dilution of interest in an associate - (2,079)Excess of share of fair value of identifiable net tangible assets
of a joint venture acquired over consideration paid - 10,074Excess of share of fair value of identifiable net tangible assets
of additional interest in an associate acquired over consideration paid - 890Cumulative exchange translation surplus realised as income
upon de-registration of a subsidiary - 3,735
Gain on disposal of other investments - 1,092
Expenses incurred for selective capital reduction - (1,132)Additional provision for warranty cost in respect of CIH Limited’s (“CIH”)
divestment in 2003 - (2,519)
Restructuring costs (note a) - (1,074)
(15,416) (4,190)
There is no income tax effect on exceptional items.
Note:
a) Restructuring costs relating to other investments comprised:
The Group
2011 2010
S$’000 S$’000
Allowance for doubtful receivables - (522)
Allowance for inventory - (596)
Write-back of costs and expenses on liquidation of subsidiaries - 44
- (1,074)
53
notes to the financial statements (cont’d) GP Industries Limited Annual Report 2010-11
8. Income tax expense
The Group
2011 2010
S$’000 S$’000
Current taxation:
Provision for Singapore taxation in respect of profit for the financial year 169 43
Foreign tax charged on profits arising outside Singapore 4,092 2,309
Over-provision in respect of prior years (1,805) (29)
Withholding tax on overseas income 863 562
Deferred taxation expense 938 499
Share of taxation of associates (Note 13) 5,787 6,971
10,044 10,355
The income tax expense varied from the amount of income tax expense determined by applying the Singapore income tax
rate of 17% (2010 : 17%) to profit before taxation as a result of the following differences:
The Group
2011 2010
S$’000 S$’000
Profit before taxation 33,968 44,524
Income tax expense at statutory tax rate 5,775 7,569
Effect of different tax rate of overseas operations 779 1,115
Effect of changes in tax rates (182) (3)
Income not subject to tax (2,877) (6,340)
Expenses not deductible for tax purposes 5,758 5,526
Deferred tax assets not recognised 2,016 4,171
Recognition of previously unrecognised deferred tax assets (1,414) (2,724)
Over-provision in prior years, including those of associates (1,577) (433)
Withholding tax, including those of associates 1,571 911
Others 195 563
Total income tax expense at effective rates 10,044 10,355
54
31 March 2011
notes to the financial statements (cont’d) GP Industries Limited Annual Report 2010-11
9. Earnings per share
The following data are used in computing basic and fully diluted earnings per share disclosed in the income statement:
a) Earnings
The Group
2011 2010
S$’000 S$’000
Profit attributable to equity holders of the Company 23,806 33,854
b) Number of shares
Group and Company
2011 2010
Weighted average number of ordinary shares used in calculating basic earnings per share 517,605,256 559,669,267
Adjustment for dilutive potential ordinary shares - -Weighted average number of ordinary shares used in
calculating diluted earnings per share, adjusted for the effects of all dilutive potential ordinary shares 517,605,256 559,669,267
There are no dilutive effects for 2011 and 2010 as the share options are out-of-money.
10. Investment properties
The Group
2011 2010
S$’000 S$’000
Balance at beginning of the financial year - -
Additions 12,434 -
Fair value loss (620) -
Currency realignment 388 -
Balance at end of the financial year 12,202 -
During the financial year, the Group acquired the investment properties, all situated in Australia, as part of the settlement
of the outstanding amounts due under the Tarway Loan (Note 19 c). The fair value of respective investment property at
31 March 2011 has been arrived at on the basis of valuation at 31 March 2011 or 15 April 2011 carried out by Lindsay
Wapper & Associates Valuation Services (“Lindsay”) or Jones Lang LaSalle Limited (“JLL”), independent property valuers.
Lindsay and JLL have appropriate qualifications and recent experience in the valuation of similar properties in the relevant
locations. The valuation of the respective property was arrived at by reference to market evidence of transaction prices for
similar properties in the same locations and conditions.
All of the Group’s investment properties are leased out under operating leases. During the financial year, rental income
amounted to S$89,000. Direct operating expenses arising from the investment properties amounted to S$84,000.
55
notes to the financial statements (cont’d) GP Industries Limited Annual Report 2010-11
Balance at 31 March 2010 669 7,405 3,709 12,615 22,366 1,342 9,528 57,634
Accumulated impairment loss:
Balance at 1 April 2009 - 78 251 272 810 49 667 2,127
Currency realignment - (5) (19) (22) (66) (4) (53) (169)Eliminated on disposals and
write-offs - (73) (104) - - - - (177)Eliminated on disposal of a
subsidiary - - (55) (35) (455) (45) (548) (1,138)
Balance at 31 March 2010 - - 73 215 289 - 66 643
Net book value:
Balance at 31 March 2010 2,472 20,746 2,688 2,303 10,900 657 2,386 42,152
57
notes to the financial statements (cont’d) GP Industries Limited Annual Report 2010-11
11. Property, plant and equipment (cont’d)
The Company
Leasehold improvements
Furniture, fixtures and equipment
Motor vehicles Total
S$’000 S$’000 S$’000 S$’000
Cost:
Balance at 1 April 2010 67 1,410 340 1,817
Additions - 1 - 1
Disposals and write-offs - (2) - (2)
Balance at 31 March 2011 67 1,409 340 1,816
Accumulated depreciation:
Balance at 1 April 2010 10 1,377 125 1,512
Charge for the financial year 13 14 34 61
Eliminated on disposals and write-offs - (1) - (1)
Balance at 31 March 2011 23 1,390 159 1,572
Net book value:
Balance at 31 March 2011 44 19 181 244
Cost:
Balance at 1 April 2009 159 1,496 379 2,034
Additions 67 21 197 285
Disposals and write-offs (159) (107) (236) (502)
Balance at 31 March 2010 67 1,410 340 1,817
Accumulated depreciation:
Balance at 1 April 2009 159 1,427 307 1,893
Charge for the financial year 10 46 9 65
Eliminated on disposals and write-offs (159) (96) (191) (446)
Balance at 31 March 2010 10 1,377 125 1,512
Net book value:
Balance at 31 March 2010 57 33 215 305
The Group The Company
2011 2010 2011 2010
S$’000 S$’000 S$’000 S$’000
Net book value of leasehold improvements held under finance leases 4 99 - -
Net book value of motor vehicles held under finance leases 154 188 154 188
58
31 March 2011
notes to the financial statements (cont’d) GP Industries Limited Annual Report 2010-11
11. Property, plant and equipment (cont’d)
Details of the properties owned by the Company’s subsidiaries and joint venture included in land and buildings are as follows:
Location Description Tenure
Hong Kong
Unit 2, 18/F,Wah Sing Industrial Building,12-14 Wah Sing Street,Kwai Chung, New Territories, Hong Kong
A 344-square metre warehouse 50 years from 1997
China
No. 76, Hui Feng Si Road,Zhongkai Hi-Tech IndustrialDevelopment Zone, HuizhouCity, Guangdong, China
Factory building for manufacturing plant, warehouse and office with built-in area of 41,770 square metres built on a 147,266-square metre industrial land
50 years from 2003
Block A and B, 28 DalingRoad, Shang Pai, HuizhouCity, Guangdong, China
Two residential buildings with total built-in area of 7,305 square metres
70 years from 2006
Flat 1207 and 1208, Tien Di Building,3046 Bao An South Road, Shenzhen, China
Two residential flats of approximately 190 square metres
Factory buildings for manufacturing plant, warehouse and office with built-in area of 25,361 square metres built on an approximately 34,000-square metreindustrial land
50 years from 2000
United KingdomEcclestone Road, Tovil,Maidstone,Kent ME15 6QP, England
Factory building for manufacturing plant, warehouse and office with built-in area of 3,090 square metres
Freehold
59
notes to the financial statements (cont’d) GP Industries Limited Annual Report 2010-11
12. Interest in subsidiaries
The Company
2011 2010
S$’000 S$’000
Unquoted equity shares, at cost 392,590 392,807
Allowance for impairment loss (70,863) (10,900)
321,727 381,907
Loans to subsidiaries 18,287 20,272
Allowance for impairment loss (816) (770)
17,471 19,502
339,198 401,409
Details of the significant subsidiaries are set out in Note 36 to the financial statements.
During the financial year, the Company carried out a review of the recoverable amount of its investment in subsidiaries. The
Company estimated that the recoverable amount of certain subsidiaries were below its carrying value and accordingly the
Company recognised an allowance for impairment loss of S$60,409,000 (2010 : S$10,000,000) in these subsidiaries. The
estimated recoverable amount of these subsidiaries were based on fair value less cost to sell, which were determined with
reference to their respective net asset value.
Loans to subsidiaries form part of the Company’s net investment in the subsidiaries. Interest-free loans amount to S$2,352,000
(2010 : S$2,619,000). The remaining loans of S$15,935,000 (2010 : S$17,653,000) are interest bearing at interest rates
ranging from 3.40% to 4.53% (2010 : 3.38% to 6.66%) per annum. These amounts are unsecured and settlement is neither
planned nor likely to occur in the foreseeable future.
Amount due to a subsidiary
During the financial year, the Company entered into agreements pursuant to which an unsecured and non-interest bearing
amount of S$150,000,000 due to CIH is subordinated to the Company’s payment obligations under certain term loan
agreements (the “Subordinated Loan”). As a result, the earliest date for the Company to settle the Subordinated Loan is 20
July 2013. As at 31 March 2011, the carrying value of the Subordinated Loan of S$139,619,000, which also approximates
its fair value, represents the present value of the Subordinated Loan discounted at a rate of 3.30% per annum from 20 July
2013.
60
31 March 2011
notes to the financial statements (cont’d) GP Industries Limited Annual Report 2010-11
13. Interest in associates
The Group The Company
2011 2010 2011 2010
S$’000 S$’000 S$’000 S$’000
Quoted equity shares, at cost 167,130 167,377 140,085 140,085
Unquoted equity shares, at cost 23,783 34,545 28,438 36,859
190,913 201,922 168,523 176,944
Share of post-acquisition reserves 92,805 104,056 - -
Allowance for impairment loss (594) (1,126) (150) (565)
283,124 304,852 168,373 176,379
Market value of quoted equity shares at 31 March 109,297 129,686 75,916 97,217
Details of the significant associates are set out in Note 37 to the financial statements.
The issued shares of two of the Group’s associates are quoted. The shares of GP Batteries International Limited (“GP
Batteries”) are quoted on the SGX-ST and the shares of Meiloon Industrial Co., Ltd. (“Meiloon”) are quoted on the Taiwan
Stock Exchange Corporation.
The market value of the Group’s and the Company’s investment in GP Batteries was lower than its corresponding carrying
value in the Group’s and the Company’s financial statements as at 31 March 2011 and 2010. Management considered that
such market values did not reflect GP Batteries’ fair value to the Group and the Company, but instead the Group’s share
of GP Batteries’ net asset value represented a fairer reflection of the recoverable amount. Accordingly, no impairment loss
allowance was required as at 31 March 2011 and 2010.
The market value of the Group’s investment in Meiloon was lower than the corresponding carrying value in the Group’s
financial statements as at 31 March 2011 and 2010. As at 31 March 2011, management performed a recoverability analysis
on the carrying amount of the Group’s investment in Meiloon. After considering the transacted prices of the Meiloon shares
during the financial year ended 31 March 2011, the improvement in Meiloon’s results of operations and the potential
revaluation surplus on Meiloon’s land and building, management concluded no impairment loss allowance was required as
at 31 March 2011. As at 31 March 2010, the recoverable amount was determined based on the value in use calculations
using the cashflow projections based on financial budget approved by management, past performance and future market
development. A discount rate of 11.8%, based on an independent professional valuer’s assessment, was applied. Based on
the estimated recoverable amount, no impairment loss allowance was required as at 31 March 2010.
61
notes to the financial statements (cont’d) GP Industries Limited Annual Report 2010-11
13. Interest in associates (cont’d)
The Group
2011 2010
S$’000 S$’000
a) The Group’s share of attributable profit of associates for the financial year is as follows:
Share of results 34,051 41,126
Share of taxation (Note 8) (5,787) (6,971)
Share of attributable profit 28,264 34,155
b) Summarised financial information in respect of the Group’s associates is set out below:
Total assets 1,607,043 1,651,011
Total liabilities (750,412) (768,227)
Net assets 856,631 882,784
Revenue 2,008,103 1,700,061
Profit for the financial year 100,097 98,302
During the financial year, the Group recognised all losses of its associates. During the financial year ended 31 March 2010,
the Group did not recognise losses of an associate, in which the Group’s share of losses exceeded its interest therein, of
S$6,000. As at 31 March 2011, there were no accumulated unrecognised losses of associates (2010 : S$62,000).
62
31 March 2011
notes to the financial statements (cont’d) GP Industries Limited Annual Report 2010-11
14. Investment in unquoted equity shares
The Group
2011 2010
S$’000 S$’000
Unquoted equity shares, at cost 41,093 36,568
Shareholder’s loans 22,097 25,662
63,190 62,230
Allowance for impairment loss (50,943) (39,776)
12,247 22,454
The investment represents CIH’s 19% interest in Gerard Corporation Pty Ltd (“Gerard Corporation”). Gerard Corporation is
incorporated in Australia. Currently, the principal activities of the Gerard Corporation group of companies include trading
in cookware and kitchen equipment, packaging, freight forwarding, commercial property ownership and rural interests in
forestry and agriculture.
The shareholder’s loans form part of the Group’s net investment in Gerard Corporation. These loans are unsecured and are
not repayable within the next twelve months.
Movements in the allowance for impairment loss during the financial year are as follows:
The Group
2011 2010
S$’000 S$’000
Balance at beginning of the financial year 39,776 24,879
Charge for the financial year 10,218 8,815
Currency realignment 949 6,082
Balance at end of the financial year 50,943 39,776
As at 31 March 2011 and 2010, the estimated recoverable amount of the investment in Gerard Corporation was determined
with reference to the financial position of Gerard Corporation, and adjusted for certain discount factors. Allowance for
impairment loss for investment in unquoted equity shares for the financial year of S$10,218,000 (2010 : S$8,815,000) is
included in exceptional items (Note 7).
63
notes to the financial statements (cont’d) GP Industries Limited Annual Report 2010-11
15. Non-current receivables
The Group
2011 2010
S$’000 S$’000
Unsecured non-current receivables:
Amount due from an associate of Gerard Corporation (note a) - 12,306
Amounts due from GSM (Holdings) Limited (note b) 18,013 -
Amounts due from Gerard Corporation and its subsidiary (note c) 4,528 -
Others 822 809
Allowance for doubtful non-current receivables (3,115) (1,909)
20,248 11,206
Secured non-current receivables (note d) 916 -
21,164 11,206
Movements in the allowance for doubtful non-current receivables are as follows:
The Group
2011 2010
S$’000 S$’000
Balance at beginning of the financial year 1,909 -
Charge for the financial year 1,380 781
Reclassification from current receivables - 1,081
Currency realignment (174) 47
Balance at end of the financial year 3,115 1,909
Note:
a) Being CIH’s amount due from an associate of Gerard Corporation. During the financial year, as a result of restructuring,
GSM (Holdings) Limited (“GSMH”) assumed the liabilities from the associate (note b). Certain amount bears interest at
interest rates ranging from 5.25% to 6.66% per annum during the financial year ended 31 March 2010.
b) As at 31 March 2011, amount outstanding comprised (i) a non-trade receivable with principal sum of S$10,988,000
assumed from an associate of Gerard Corporation (note a) and accrued interest of S$606,000. The amount was
interest bearing at interest rates ranging from 5.25% to 6.66% per annum; and (ii) trade and other receivables of
S$6,419,000 (2010 : S$8,205,000) reclassified from receivables and prepayments. Certain amount bears interest at
5.25% (2010 : 5.25%) per annum.
Subsequent to 31 March 2011, the Group subscribed for a convertible note issued by GSMH, satisfied with the
principal sum of the non-trade receivable (Note 40).
64
31 March 2011
notes to the financial statements (cont’d) GP Industries Limited Annual Report 2010-11
15. Non-current receivables (cont’d)
c) CIH advanced certain sums to Gerard Corporation and a subsidiary of Gerard Corporation (the “Non-Tarway Loan”).
As at 31 March 2011, total principal sum and interest receivable of the Non-Tarway Loan amounted to S$15,123,000
(2010 : S$14,216,000) (Note 19 d i).
During the financial year, the Group negotiated with Gerard Corporation on a repayment plan. A formal loan settlement
agreement was reached subsequent to 31 March 2011 pursuant to which an amount of A$7,750,000 (equivalent to
S$10,098,000) will be repaid before 31 March 2012 by instalments (the “Current portion of Non-Tarway Loan”,
(Note 19 d i)) and A$3,857,000 (equivalent to S$5,025,000) will be repaid during the financial year ending 31 March
2013 by instalments (the “Non-current portion of Non-Tarway Loan”).
Pursuant to the loan settlement agreement reached subsequent to 31 March 2011, the Non-Tarway Loan will be
interest free. Accordingly, the Non-current portion of Non-Tarway Loan was stated at its fair value of S$4,528,000 as
at 31 March 2011. During the financial year, the principal sum of the Non-Tarway Loan was interest bearing at interest
rates ranging from 6.75% to 6.83% (2010 : 6.75% to 6.83%) per annum.
d) In 2008, CIH granted a loan to a business partner to enable him to subscribe for new shares in a company. The loan
was due in January 2011 and part of the amount due was settled. The Group agreed with the debtor to repay the
remaining balance by instalments with the final instalment due on 31 March 2014. As at 31 March 2011, the amount
due before 31 March 2012 was included under receivables and prepayments (Note 19 d ii). During the financial year,
the loan was interest bearing at interest rates ranging from 4.50% to 5.53% (2010 : 5.18% to 6.02%) per annum.
The loan is secured by shares in the afore-mentioned company.
16. Other investments
The Group
2011 2010
S$’000 S$’000
Unquoted equity shares, at cost 15,150 15,763
Allowance for impairment loss (12,254) (10,655)
2,896 5,108
Movements in the allowance for impairment loss during the financial year are as follows:
The Group
2011 2010
S$’000 S$’000
Balance at beginning of the financial year 10,655 6,854
Charge for the financial year 3,379 4,486
Amount written-off during the financial year - (894)
Currency realignment (1,780) 209
Balance at end of the financial year 12,254 10,655
65
notes to the financial statements (cont’d) GP Industries Limited Annual Report 2010-11
16. Other investments (cont’d)
The estimated recoverable amount of other investments was determined with reference to the respective financial position
of the investments and adjusted for certain discount factors. During the financial year, the Group recognised an allowance
for impairment loss of S$3,379,000 (2010 : S$4,486,000). Such allowance for impairment loss is included in exceptional
items (Note 7).
17. Intangible assets
The Group
2011 2010
S$’000 S$’000
Goodwill 4,823 4,906
Other intangible assets 103 121
4,926 5,027
Movements of these intangible assets are as follows:
Goodwill
The Group
2011 2010
S$’000 S$’000
Cost:
Balance at beginning of the financial year 11,073 11,651
Amount written-off during the financial year (214) -
Currency realignment (654) (578)
Balance at end of the financial year 10,205 11,073
Accumulated impairment loss:
Balance at beginning of the financial year 6,167 6,674
Amount written-off during the financial year (214) -
Currency realignment (571) (507)
Balance at end of the financial year 5,382 6,167
Net book value:
Balance at end of the financial year 4,823 4,906
66
31 March 2011
notes to the financial statements (cont’d) GP Industries Limited Annual Report 2010-11
17. Intangible assets (cont’d)
The recoverable amount of goodwill is determined based on value in use calculations. The key assumptions for value in use
calculations are those regarding the discount rates, growth rates and expected changes to selling prices and direct costs.
Management estimates discount rates using pre-tax rates that reflect current market assessments of the time value of
money and risks specific to the business unit. Growth rate and changes in selling prices and direct costs are based on past
performance of the business unit and expected market development.
The recoverable amount of goodwill allocated to other investments of S$4,092,000 (2010 : S$4,092,000) is determined
based on the value in use calculation using cash flow projections derived from most recent financial budget approved
by management for the next five years using a discount rate of 15.00% (2010 : 15.00%). Growth rates of up to 5.00%
(2010 : 5.00%) are used during the five-year period to extrapolate cash flows. Cash flows beyond the five-year period are
extrapolated using a 1.00% (2010 : 1.00%) growth rate.
The recoverable amount of goodwill allocated to the electronics and acoustics business of S$475,000 (2010 : S$529,000)
is determined based on the value in use calculation using cash flow projections derived from most recent financial budget
approved by management for the next three years using a discount rate of 7.89% (2010 : 7.89%). Growth rates of up to
5.00% (2010 : 15.00%) are used during the three-year period to extrapolate cash flows. Cash flows beyond the three-year
period are extrapolated using a 3.00% (2010 : 3.00%) growth rate.
The amount of goodwill allocated to the automotive wire harness business of S$256,000 (2010 : S$285,000) is insignificant.
67
notes to the financial statements (cont’d) GP Industries Limited Annual Report 2010-11
17. Intangible assets (cont’d)
Other Intangible Assets
The GroupDeferred
expenditure Trademark Patent rights Corporate club
membership Total
S$’000 S$’000 S$’000 S$’000 S$’000
Cost:
Balance at 1 April 2010 7,490 426 6,830 194 14,940
Currency realignment (764) (44) (697) - (1,505)
Balance at 31 March 2011 6,726 382 6,133 194 13,435
Accumulated amortisation:
Balance at 1 April 2010 6,724 341 2,596 - 9,661
Currency realignment (686) (35) (265) - (986)
Balance at 31 March 2011 6,038 306 2,331 - 8,675
Accumulated impairment loss:
Balance at 1 April 2010 766 85 4,234 73 5,158
Charge for the financial year - - - 18 18
Currency realignment (78) (9) (432) - (519)
Balance at 31 March 2011 688 76 3,802 91 4,657
Net book value:
Balance at 31 March 2011 - - - 103 103
Cost:
Balance at 1 April 2009 8,149 464 7,432 194 16,239
Currency realignment (659) (38) (602) - (1,299)
Balance at 31 March 2010 7,490 426 6,830 194 14,940
Accumulated amortisation:
Balance at 1 April 2009 7,316 371 2,283 - 9,970
Amortisation for the financial year - - 507 - 507
Currency realignment (592) (30) (194) - (816)
Balance at 31 March 2010 6,724 341 2,596 - 9,661
Accumulated impairment loss:
Balance at 1 April 2009 833 93 4,607 49 5,582
Charge for the financial year - - - 24 24
Currency realignment (67) (8) (373) - (448)
Balance at 31 March 2010 766 85 4,234 73 5,158
Net book value:
Balance at 31 March 2010 - - - 121 121
The amortisation expense has been included in administrative expenses.
68
31 March 2011
notes to the financial statements (cont’d) GP Industries Limited Annual Report 2010-11
18. Inventories
The Group
2011 2010
S$’000 S$’000
Raw materials 19,604 20,825
Work-in-progress 3,500 3,624
Finished goods 28,843 27,532
51,947 51,981
19. Receivables and prepayments
The Group The Company
2011 2010 2011 2010
S$’000 S$’000 S$’000 S$’000
Trade receivables from third parties 40,985 40,554 - -
Less: Allowance for doubtful trade receivables (1,279) (2,048) - -
39,706 38,506 - -
Deposits and prepayments 5,382 5,163 1,384 133
Due from related parties – trade (note a, Note 32) 850 326 - -
Due from associates – trade (note a) 476 413 - -
Due from associates – non-trade (note a) 35 1 - -
Amount retained for CIH’s divestment in 2003 (note b) - 7,332 - -Amount receivable relating to divestment of
interest in Gerard Corporation (note c) 9,576 47,589 - -
16,319 60,824 1,384 133
Other receivables (note d) 18,720 30,028 16 50
Less: Allowance for doubtful other receivables (5,362) (4,722) - -
13,358 25,306 16 50
69,383 124,636 1,400 183
69
notes to the financial statements (cont’d) GP Industries Limited Annual Report 2010-11
19. Receivables and prepayments (cont’d)
The Group
2011 2010
S$’000 S$’000
Movements in the allowance for doubtful receivables are as follows:
Balance at beginning of the financial year 6,770 22,922
Charge for the financial year, net 433 3,464
Amount utilised (186) (17,228)
Acquisition of a joint venture - 96
Reclassification to non-current receivables - (1,081)
Currency realignment (376) (1,403)
Balance at end of the financial year 6,641 6,770
Allowance for doubtful receivables at end of the financial year comprises:
Doubtful trade receivables 1,279 2,048
Doubtful other receivables 5,362 4,722
6,641 6,770
Included in allowance for doubtful receivables were specific allowance against trade receivables and other receivables of
S$916,000 and S$5,339,000 respectively (2010 : S$1,005,000 and S$4,165,000 respectively). The allowance for doubtful
debts recognised represented the difference between the carrying amount of the related receivables and the present value
of the collectible amount. Such receivables were individually impaired either because a debt was significantly past due and
the debtor did not respond to repayment demands, or there were circumstances that indicate a debtor may not be able to
honour its obligations when the debt is due. The Group does not hold any collateral over these receivables.
Note:
a) The amounts due from associates and related parties are unsecured, non-interest bearing and repayable on demand.
b) In 2003, CIH and certain members of the Gerard family (the “Gerard Vendors”) disposed of their respective share of the
electrical wiring devices and installation systems (“EWDIS”) business in Australia to Schneider Electric SA (“Schneider”).
Part of the proceeds from disposal and the related interest receivable are retained to cover warranty claims for a period
of four years from 22 December 2003 (the “Retention Money”). As at 31 March 2011, the warranty claim issue
remained unresolved.
During the financial year ended 31 March 2010, CIH’s and the Gerard Vendors’ respective Retention Money were
pooled together (the “Pooled Retention Money”). On 11 June 2010, the Gerard Vendors executed an irrevocable
direction to Schneider (the “Irrevocable Direction”) to pay the entire Pooled Retention Money to the Group upon
resolution of the warranty claim issue. Hence, Gerard Vendors’ entitlement of approximately A$5.8 million as at 31
March 2011 will be used to settle part of the Tarway Loan outstanding (note c).
70
31 March 2011
notes to the financial statements (cont’d) GP Industries Limited Annual Report 2010-11
19. Receivables and prepayments (cont’d)
During the financial year, A$7.0 million was released from the Pooled Retention Money to the Group, following the
provision by the Group of a A$7.0 million (equivalent to S$9,120,000) letter of credit in favour of Schneider (Note 30).
As at 31 March 2010, the Group’s entitlement to the Pooled Retention Money of approximately A$7.5 million was
stated net of provision against warranty claims. The amount is non-interest bearing.
The key sources of estimation uncertainty relating to the settlement of the warranty claims are discussed in Note 34 to
the financial statements.
c) The amount receivable (the “Tarway Loan”) arose from CIH’s divestment of a 33.39% interest in Gerard Corporation to
certain Gerard family members (the “Gerard Family”) in 2003 and 2005. As at 31 March 2011, the outstanding Tarway
Loan amounted to S$9,576,000 (equivalent to approximately A$7,350,000). Pursuant to a Deed of Settlement dated
2 November 2010, A$850,000 will be settled in cash in July 2011 and A$6,500,000 will be settled with the Gerard
Vendor’s entitlement to the Pooled Retention Money upon its release (note b) and cash.
As at 31 March 2010, total outstanding Tarway Loan amounted to S$47,589,000 (equivalent to approximately
A$37,089,000). During the financial year, the Gerard Family settled approximately A$30.2 million, of which
approximately A$20.9 million was in cash and A$9.3 million was with properties at market value (Note 10).
The Tarway Loan is secured by way of a charge over 34.33% of the issued shares in Gerard Corporation.
Principal sum of the Tarway Loan was interest bearing at 5.85% to 8.38% (2010 : 4.60% to 8.88%) per annum.
Subsequent to 30 June 2010, all amounts outstanding under the Tarway Loan had become interest free. The key
sources of estimation uncertainty relating to the settlement of the outstanding Tarway Loan are discussed in Note 34
to the financial statements.
d) Other receivables of the Group, net of allowance for doubtful debts, comprised mainly:
i) The Current portion of Non-Tarway Loan of S$10,098,000 (2010 : S$14,216,000) (Note 15 c);
ii) Portion of CIH’s loan to a business partner which is due for repayment before 31 March 2012 of S$101,000
(2010 : S$1,198,000) (Note 15 d); and
iii) CIH’s amounts due from its trade associates totalling S$79,000 (2010 : S$6,150,000). These advances are
unsecured and repayable on demand. Certain amount bears interest at 5.40% (2010 : 5.25% to 6.25%) per
annum.
Trade receivables are generally non-interest bearing with credit terms of up to 90 days (2010 : 90 days). The Group closely
monitors the credit quality of its trade receivables. For receivables that are not past due, they are considered collectible and
accordingly not impaired. Interest may be charged on past due trade receivables.
71
notes to the financial statements (cont’d) GP Industries Limited Annual Report 2010-11
19. Receivables and prepayments (cont’d)
The age analysis of trade receivables that are past due but not impaired is as follows:
The Group
2011 2010
S$’000 S$’000
Past due 1 to 60 days 1,980 2,162
Past due 61 to 90 days 173 177
Past due 91 to 120 days 107 109
Past due more than 120 days 67 169
2,327 2,617
The Group has not provided for any impairment loss allowance in respect of the above-mentioned receivables as there has
not been a significant change in credit quality and the amounts are still considered recoverable. The Group does not hold any
collateral over these balances.
The age analysis of non-trade related receivables that are past due but not impaired is as follows:
The Group
2011 2010
S$’000 S$’000
Past due 1 to 60 days (note e) - 6,583
Past due 61 to 90 days - 57
Past due 91 to 120 days - -
Past due more than 120 days (note f) 1 11,176
1 17,816
Note:
e) Amount as at 31 March 2010 included a S$6,416,000 (equivalent to A$5,000,000) Tarway Loan instalment due on 31
March 2010 according to a repayment plan, which was settled subsequent to 31 March 2010. As at 31 March 2011,
there was no overdue amount under the Tarway Loan.
f) Amount as at 31 March 2010 comprised mainly part of the Non-Tarway Loan due from Gerard Corporation which
was due during the financial year ended 31 March 2010 and was not repaid. Subsequent to 31 March 2011, a loan
settlement agreement was reached pursuant to which such amount will be repaid by instalments during the financial
year ending 31 March 2012 and 2013 (Note 15 c).
The Group has not provided for any impairment loss allowance in respect of the above-mentioned receivables as the amounts
are still considered recoverable. Save for the amounts due under the Tarway Loan (note c), the Group does not hold any
collateral over these receivables.
72
31 March 2011
notes to the financial statements (cont’d) GP Industries Limited Annual Report 2010-11
20. Bank balances, deposits and cash
The Group The Company
2011 2010 2011 2010
S$’000 S$’000 S$’000 S$’000
Cash and bank balances 42,699 57,927 8,609 10,061
Fixed deposits 25,703 4,434 9,715 1,934
68,402 62,361 18,324 11,995
The carrying amounts of these assets approximate their fair values. Fixed deposits generally comprise deposits with an original
maturity period of three months or less. As at 31 March 2010, fixed deposits included share of a joint venture’s deposit
amounted to S$492,000 with an original maturity period over three months and was pledged to a bank for a short-term loan
granted to the joint venture (Note 25).
Fixed deposits bear interest rates ranging from 0.06% to 4.69% (2010 : 0.01% to 3.50%) per annum.
21. Trade and other payables
The Group The Company
2011 2010 2011 2010
S$’000 S$’000 S$’000 S$’000
Trade payables:
Third parties 37,965 38,817 - -
Associates 605 563 - -
Other payables:
Third parties 5,932 6,261 109 714
Associates 985 2,199 950 1,159
Due to subsidiaries – non-trade, net (note a) - - 2,658 151,194
Accrued charges 15,886 15,104 1,313 1,045
61,373 62,944 5,030 154,112
Note:
a) The amount due to and from subsidiaries are presented on a net basis as the Company has the right to set-off the
amount due to and from subsidiaries within the Group. During the financial year, an amount of S$150,000,000 due by
the Company to CIH was reclassified to non-current liabilities (Note 12).
Trade payables have credit terms of up to 90 days (2010 : 120 days).
73
notes to the financial statements (cont’d) GP Industries Limited Annual Report 2010-11
22. Provisions
The Group
2011 2010
S$’000 S$’000
Balance at beginning of the financial year 756 900
Amount utilised - (1)
Amount written-back (4) (134)
Currency realignment - (9)
Balance at end of the financial year 752 756
Provision was mainly for cost expected to be incurred by CIH in completing the disposal of the EWDIS business in 2003.
23. Obligations under finance leases
Minimum lease paymentsPresent value of
minimum lease payments
2011 2010 2011 2010
S$’000 S$’000 S$’000 S$’000
The Group
Amounts payable under finance leases:
Within one year 84 174 81 170
Within two to five years 54 148 52 143
138 322 133 313
Less: Future finance lease charges (5) (9) - -
Present value of finance lease obligations 133 313 133 313
Less: Amount due within twelve months as shown under current liabilities (81) (170)
Amount due for settlement after twelve months 52 143
74
31 March 2011
notes to the financial statements (cont’d) GP Industries Limited Annual Report 2010-11
23. Obligations under finance leases (cont’d)
Minimum lease paymentsPresent value of
minimum lease payments
2011 2010 2011 2010
S$’000 S$’000 S$’000 S$’000
The Company
Amounts payable under finance leases:
Within one year 31 31 28 27
Within two to five years 54 86 52 81
85 117 80 108
Less: Future finance lease charges (5) (9) - -
Present value of finance lease obligations 80 108 80 108
Less: Amount due within twelve months as shown under current liabilities (28) (27)
Amount due for settlement after twelve months 52 81
Certain finance leases of the Group bear interest on a floating interest rate basis. The initial lease terms are between three
to four years (2010 : three to five years).
Interest rates on finance leases range from 1.21% to 4.20% (2010 : 1.20% to 10.79%) per annum.
The fair value of the Group’s lease obligations approximates their carrying amount.
24. Amount due to ultimate holding company
The Company’s immediate and ultimate holding company is Gold Peak Industries (Holdings) Limited (“Gold Peak”), a
company incorporated in Hong Kong and listed on The Stock Exchange of Hong Kong Limited. The amounts due to Gold
Peak are non-trade in nature, unsecured, non-interest bearing and repayable on demand.
75
notes to the financial statements (cont’d) GP Industries Limited Annual Report 2010-11
25. Bank loans
The Group The Company
2011 2010 2011 2010
S$’000 S$’000 S$’000 S$’000
Current liabilities
Current portion of long-term bank loans 24,091 96,081 20,260 89,186
Short-term bank loans 38,954 49,509 11,253 14,935
Import loans 3,130 2,378 - -
66,175 147,968 31,513 104,121
Non-current liabilities
Long-term bank loans due after one year 60,694 10,413 52,260 2,500
Total borrowings 126,869 158,381 83,773 106,621
Of which:
Secured - 514 - -
Unsecured 126,869 157,867 83,773 106,621
126,869 158,381 83,773 106,621
As at 31 March 2010, included in short-term bank loans was the share of a joint venture’s bank loan amounted to S$514,000
which was secured by the joint venture’s fixed deposit (Note 20).
As at 31 March 2011, bank loans of the Company amounting to S$70,020,000 are guaranteed by certain subsidiaries of the
Company.
Interest rates on secured short-term bank loan range from 1.15% to 1.79% (2010 : 1.15%) per annum. Interest rates on
other short-term bank loans and import loans range from 1.25% to 7.00% (2010 : 1.25% to 12.20%) per annum. Interest
rates on long-term bank loans range from 1.05% to 5.40% (2010 : 1.05% to 11.73%) per annum.
76
31 March 2011
notes to the financial statements (cont’d) GP Industries Limited Annual Report 2010-11
26. Deferred tax assets and liabilities
Movements in the deferred tax assets and liabilities recognised by the Group are as follows:
Revaluation of investment
properties
Acceleratedtax
depreciationTax
losses
Other temporary
differences, net Total
S$’000 S$’000 S$’000 S$’000 S$’000
The Group
Deferred tax assets
Balance at 1 April 2010 - - - - -
Credit for the financial year 186 - - - 186
Currency realignment 6 - - - 6
Balance at 31 March 2011 192 - - - 192
Deferred tax liabilities
Balance at 1 April 2009 - 208 (54) 1,219 1,373
Acquisition of a joint venture - - - 1,497 1,497
(Credit) Charge for the financial year - (61) 50 510 499
Transfer to current tax payable - - - (626) (626)
Currency realignment - (14) 4 (36) (46)
Balance at 31 March 2010 - 133 - 2,564 2,697
Charge for the financial year - 58 - 1,066 1,124
Currency realignment - (16) - (185) (201)
Balance at 31 March 2011 - 175 - 3,445 3,620
Movements in the deferred tax liabilities recognised by the Company are as follows:
Accelerated tax
depreciation
Other temporary
differences, net Total
S$’000 S$’000 S$’000
The Company
Deferred tax liabilities
Balance at 1 April 2009 12 67 79
(Credit) Charge for the financial year (1) 124 123
Balance at 31 March 2010 11 191 202
Credit for the financial year (3) (120) (123)
Balance at 31 March 2011 8 71 79
As at 31 March 2011, subsidiaries of the Group have potential tax benefits of approximately S$4,971,000 (2010 :
S$9,884,000) arising from unutilised tax losses, unabsorbed wear and tear allowances and other temporary differences,
which are available for set-off against future taxable profits. These potential tax benefits have not been recognised in the
financial statements due to the uncertainty of its recoverability. The use of these potential tax benefits is subject to the
agreement of the tax authorities and compliance with certain provisions of the tax legislation of the respective countries in
which the subsidiaries operate.
77
notes to the financial statements (cont’d) GP Industries Limited Annual Report 2010-11
26. Deferred tax assets and liabilities (cont’d)
As at 31 March 2011, the aggregate amount of temporary differences associated with undistributed earnings of subsidiaries
for which deferred tax liabilities have not been recognised is S$7,021,000 (2010 : S$3,886,000). No liability has been
recognised in respect of these differences because the Group is in a position to control the timing of the reversal of the
temporary differences and it is probable that such differences will not reverse in the foreseeable future.
27. Issued capital, treasury shares, share-based payments and dividends
a) Issued capital
Group and Company
Number of ordinary shares Issued capital
2011 2010 2011 2010
S$’000 S$’000
Issued and fully paid up:
At beginning of the financial year 521,030,482 576,601,925 286,157 304,371Cancellation of issued shares pursuant to a
selective capital reduction - (55,681,443) - (18,264)Issue of shares under the Company’s Share
Option Scheme 1999 (the “1999 Scheme”) 328,000 110,000 150 50
At end of the financial year 521,358,482 521,030,482 286,307 286,157
Fully paid ordinary shares, other than those held by the Company as treasury shares, carry one vote per share and carry
a right to dividends as and when declared by the Company.
During the financial year ended 31 March 2010, the Company and its indirect wholly owned subsidiary, Tarway Two
Pty Ltd (“Tarway”), entered into a conditional agreement (the “Share Cancellation Agreement”) with Belvedire Pty Ltd
(“Belvedire”) and various parties representing the Gerard Vendors on 9 July 2009 to:
i) cancel 55,681,443 ordinary shares (the “Relevant Shares”) in the capital of the Company, representing
approximately 9.66% of the ordinary shares in the then issued capital of the Company, held by Belvedire by way
of a selective capital reduction (the “SCR”); and
ii) to make a cash distribution of S$0.328 for each Relevant Share, or approximately S$18,264,000 in aggregate
(the “Cancellation Monies”) to Belvedire, to be satisfied by the Company setting off the Cancellation Monies due
to Belvedire against the principal amounts outstanding under the Tarway Loan.
The Company obtained approval of the SCR and the Share Cancellation Agreement by its shareholders at a shareholders’
meeting held on 19 November 2009, and the sanction of the SCR by the High Court of Singapore on 3 December
2009. The SCR had become effective on 11 December 2009 under Section 78G of the Companies Act, Chapter 50 of
Singapore. Accordingly, the number of issued ordinary shares was reduced by 55,681,443 and the amount of issued
capital was reduced by approximately S$18,264,000.
78
31 March 2011
notes to the financial statements (cont’d) GP Industries Limited Annual Report 2010-11
27. Issued capital, treasury shares, share-based payments and dividends (cont’d)
b) Treasury shares
Group and Company
2011 2010 2011 2010
Number of ordinary shares S$’000 S$’000
At beginning of the financial year - - - -
On-market purchases 10,892,000 - 6,159 -
At end of the financial year 10,892,000 - 6,159 -
Treasury shares relate to ordinary shares of the Company that are held by the Company.
During the financial year, the Company purchased 10,892,000 of its ordinary shares by way of on-market purchases at
share prices ranging from S$0.435 to S$0.595.
c) Share-based payments
i) Equity-settled share option scheme of the Company
The Company offered options to eligible grantees to subscribe for the ordinary shares in the Company under the
1999 Scheme. The duration of the 1999 Scheme reached its maximum period of ten years on 31 March 2010
and ceased to operate accordingly. However, options previously granted under the 1999 Scheme continue to be
exercisable in accordance with the regulations of the 1999 Scheme.
The 1999 Scheme is administered by the Remuneration Committee. Exercise price of options equals to the
average of the last dealt prices for the shares of the Company on the SGX-ST for the last three market days for
which there was trading in the Company’s shares, immediately preceding the date of offer. The Remuneration
Committee had discretion to fix the exercise price at a discount not exceeding 20% to the above price. The
vesting period was one year from the date of offer for options granted without discount, or two years for options
granted at a discount. The expiry date for options offered to eligible grantees that hold executive positions,
including the executive directors, is ten years from the date of offer, or five years for other eligible grantees.
Unexercised options are cancelled upon occurrence of certain events, including when the option holder ceases
to be employed by the Group.
79
notes to the financial statements (cont’d) GP Industries Limited Annual Report 2010-11
27. Issued capital, treasury shares, share-based payments and dividends (cont’d)
Details of the Company’s options outstanding during the financial year are as follows:
2011 2010
Number of options
Weightedaverage
exercise priceNumber of
options
Weightedaverage
exercise price
‘000 S$ ‘000 S$
Outstanding at beginning of the financial year 9,687 0.839 10,332 0.838
Cancelled (392) 0.707 (535) 0.896
Exercised (328) 0.456 (110) 0.456
Outstanding at end of the financial year 8,967 0.859 9,687 0.839
Exercisable at end of the financial year 8,967 0.859 9,687 0.839
The weighted average share price at the date of exercise for options exercised during the financial year was
S$0.51 (2010 : S$0.50). The options outstanding at the end of the financial year have a weighted average
remaining contractual life of 2.2 years (2010 : 3.1 years). The 1999 Scheme ceased to operate on 31 March 2010.
No options were offered during the financial year ended 31 March 2010.
ii) During the financial year, Gold Peak granted options to its directors and executives, including directors and
executives of the Company and its subsidiaries, to subscribe for ordinary shares of Gold Peak. As a result, the
Group and the Company recognised S$614,000 and S$40,000 as expenses relating to equity-settled share-
based payment transactions respectively (2010 : S$Nil and S$Nil respectively) and are included in administrative
expenses.
d) Dividends
Group and Company
2011 2010
S$’000 S$’000
i) Dividends paid during the financial year are as follows:
Final tax-exempt (1-tier) dividend of 2.00 Singapore cents (“S cents”) per ordinary share for the financial year ended 31 March 2010 10,427 -
Final tax-exempt (1-tier) dividend of 1.00 S cent per ordinary share for the financial year ended 31 March 2009 - 5,766
Interim tax-exempt (1-tier) dividend of 1.50 S cents per ordinary share for the financial year ended 31 March 2011 7,744 -
Interim tax-exempt (1-tier) dividend of 1.00 S cent per ordinary share for the financial year ended 31 March 2010 - 5,209
18,171 10,975
80
31 March 2011
notes to the financial statements (cont’d) GP Industries Limited Annual Report 2010-11
27. Issued capital, treasury shares, share-based payments and dividends (cont’d)
Group and Company
2011 2010
S$’000 S$’000
ii) Dividends proposed before these financial statements were authorised and not included as liabilities in these financial statements are as follows:
Final tax-exempt (1-tier) dividend of 1.50 S cents (2010 : 2.00 S cents) per ordinary share 7,657 10,427
Special tax-exempt (1-tier) dividend of 1.50 S cents (2010 : Nil S cent) per ordinary share 7,657 -
15,314 10,427
The proposed dividend amount in respect of the financial year ended 31 March 2011 of S$15,314,000 is based
on 510,466,482 issued shares as at 30 May 2011. The proposed dividends are subject to shareholders’ approval
at the forthcoming annual general meeting of the Company.
The proposed dividend amount in respect of the financial year ended 31 March 2010 of S$10,427,000 was based
on 521,358,482 issued shares as at 29 May 2010. The said dividend was approved by the shareholders at the
annual general meeting of the Company held on 30 July 2010 and was paid in September 2010.
28. Lease commitments
The Group as lessee
The Group The Company
2011 2010 2011 2010
S$’000 S$’000 S$’000 S$’000
Minimum lease payments paid under operating leases recognised as an expense 4,873 5,199 50 203
The Group and the Company have outstanding commitments under non-cancellable operating leases, which fall due as
follows:
The Group The Company
2011 2010 2011 2010
S$’000 S$’000 S$’000 S$’000
Within one year 3,019 3,398 13 50
Within two to five years 2,874 4,005 - 13
After five years 33 254 - -
5,926 7,657 13 63
Operating lease payments represent rentals payable by the Group for rental of office and factory premises, motor vehicles
and plant and machinery. Leases are negotiated for lease terms of between three months to ten years except for factory
premises, the lease terms of which are twenty years.
81
notes to the financial statements (cont’d) GP Industries Limited Annual Report 2010-11
28. Lease commitments (cont’d)
The Group as lessor
The Group rents outs its investment properties under operating leases. As at 31 March 2011, the leases have unexpired terms
of approximately three months to thirty-three months. The leases have renewal options and escalation clauses included in
the contracts.
The Group has contracted with tenants for the following future minimum lease payments:
The Group
2011 2010
S$’000 S$’000
Within one year 248 -
Within two to five years 275 -
523 -
29. Capital commitments
The Group The Company
2011 2010 2011 2010
S$’000 S$’000 S$’000 S$’000
Capital expenditure:Commitments for the acquisition of
property, plant and equipment 174 321 15 -
30. Contingent liabilities (unsecured)
The Group The Company
2011 2010 2011 2010
S$’000 S$’000 S$’000 S$’000
Export bills discounted with recourse 765 624 - -
Outstanding letter of credit (Note 19 b) 9,120 - - -
Guarantees given to certain banks in respect of banking facilities utilised by:
Subsidiaries - - 40,273 40,928
Associates 756 14,355 756 13,592
The maximum amount the Group and the Company could become liable is as shown above.
The financial effects relating to financial guarantee contracts issued by the Company are insignificant to the financial
statements of the Company and therefore are not recognised.
82
31 March 2011
notes to the financial statements (cont’d) GP Industries Limited Annual Report 2010-11
31. Segment information
The Group’s businesses are organised into four segments based on the types of products that they provide, as follows:
Electronics and acoustics
The Group designs, manufactures and sells professional audio products and “KEF” brand loudspeakers. Associates of this
business segment are mainly engaged in the manufacturing of high precision parts and components used in electronics
products.
Automotive wire harness
The Group supplies automotive wire harness to automotive manufacturers.
Batteries
The Group’s associate, GP Batteries, manufactures, develops and markets batteries and battery-related products.
Other investments
Comprises the Group’s non-core investments and assets, including CIH’s investment in unquoted equity shares and other
investments and the Group’s associates, Linkz Industries Limited and Meiloon. During the financial year ended 31 March
2010, this business segment also included CIH’s light fittings business. The Group exited from the light fittings business by
31 March 2010.
The executive directors of the Company and management monitor the results of these business segments for the purpose of
making decisions about resource allocation and performance assessment. Segment performance is evaluated based on the
Group’s share of profit before taxation contributed by each business segment. Investment related finance cost and income
taxes, which are managed on a group basis, are not allocated to the business segments.
Information regarding the Group’s operating segments is presented below.
83
notes to the financial statements (cont’d) GP Industries Limited Annual Report 2010-11
31. Segment information (cont’d)
a) Operating segments
Electronics and acoustics
Automotive wire harness Batteries
Other investments Elimination Consolidated
S$’000 S$’000 S$’000 S$’000 S$’000 S$’000
2011
Revenue
External revenue 242,303 93,463 - - - 335,766
Inter-segment revenue - - - - - -
Total revenue 242,303 93,463 - - - 335,766
ResultsContribution before
exceptional items and taxation 23,350 14,438 12,795 1,706 - 52,289
Liabilities pertaining to financial guarantee contracts are the Group’s and the Company’s contingent liabilities arising
from guarantees given to banks (Note 30).
g) Capital risk management
The Group manages its capital to ensure that entities in the Group will be able to continue as a going concern while
maximising the return to its stakeholders through the optimisation of the debt and equity balance.
The capital structure of the Group consists of debt, which includes the borrowings disclosed in Note 25, and equity
attributable to the equity holders of the Company.
Management reviews the Group’s capital structure from time to time and recommends to the Board of Directors
appropriate actions such as payment of dividend, new share issues, share buy-back and utilisation of available banking
facilities.
The Group’s overall strategy remains unchanged from the financial year ended 31 March 2010. The Group and the
Company are in compliance with externally imposed capital requirements which include PRC legal requirement to set
aside a legal reserve and financial covenants to maintain certain financial ratios required by the financial institutions for
the facilities granted as at 31 March 2011 and 2010.
97
notes to the financial statements (cont’d) GP Industries Limited Annual Report 2010-11
35. Financial instruments, financial risk and capital risk management (cont’d)
h) Fair values of financial assets and financial liabilities
The fair values of financial assets and financial liabilities approximate their respective carrying amounts recorded in
the financial statements, determined in accordance with the accounting policies disclosed in Note 2 to the financial
statements except for available-for-sale financial assets carried at cost less impairment.
The Group classifies fair value measurements using a fair value hierarchy that reflects the significance of the inputs used
in making the measurements. The fair value hierarchy has the following levels:
i) quoted prices (unadjusted) in active markets for identical assets or liabilities (Level 1);
ii) inputs other than quoted prices included within Level 1 that are observable for the asset or liability, either directly
(i.e. as prices) or indirectly (i.e. derived from prices) (Level 2); and
iii) inputs for the asset or liability that are not based on observable market data (unobservable inputs) (Level 3).
The financial instruments carried at fair value, analysed by valuation method is as follows:
The Group
Level 1 Level 2 Level 3 Total
S$’000 S$’000 S$’000 S$’000
2011
Available-for-sale financial assets - - - -
2010
Available-for-sale financial assets - - - -
As at 31 March 2011, the Group’s available-for-sale financial assets comprising investment in unquoted equity shares
and other investments with a total net carrying value of S$15,143,000 (2010 : S$27,562,000) are measured at cost less
impairment as the fair values cannot be determined reliably as the variability in the range of reasonable fair value estimates
derived from valuation techniques can vary significantly.
Impairment losses on available-for-sale financial assets are recognised when there is a significant or prolonged decline in the
fair value of such investments below their cost.
98
31 March 2011
notes to the financial statements (cont’d) GP Industries Limited Annual Report 2010-11
36. Subsidiaries
Significant subsidiaries of the Group are as follows:
Name of company
Place of incorporationand business Principal activities
Effective percentage of
equity and voting power held
2011 2010% %
Bowden Industries (China) Limited (1) (d) Hong Kong Investment holding 100 100
Bowden Industries Limited (1) (b) Hong Kong Investment holding, manufacturing and trading of electrical wiring accessories, electronic control devices and related products
100 100
Celestion International Limited (1) (c) England and Wales Design and trading of loudspeakers 100 100
CIH Limited (a) Singapore Investment holding 100 100
Star Bright Technology Limited (1) (d) Hong Kong Investment holding 100 100
Tarway Two Pty Ltd (1) (3) Australia Investment holding 100 100
Whitehill Industries Limited (1) (b) Hong Kong Investment holding 100 100
101
notes to the financial statements (cont’d) GP Industries Limited Annual Report 2010-11
36. Subsidiaries (cont’d)
Note:(1) Equity interest is held by subsidiaries of the Company.(2) These subsidiaries, in compliance with their local statutory requirement, adopt 31 December as their financial year
end. Such financial year end is not co-terminous with that of the Company. Adjustments are made for the effect of any significant transactions that occur between 1 January and 31 March. A member firm of Deloitte Touche Tohmatsu Limited has audited the financial statements of these subsidiaries, with the exception of GP Acoustics (China) Limited and GP Electronics (SZ) Limited, for the purposes of the Group’s consolidated financial statements for the financial year ended and as at 31 March 2011 (“2011 Consolidated Financial Statements”).
(3) The financial statements of these subsidiaries are not audited as there are no statutory audit requirements in its country of incorporation. The financial statements have been audited by Deloitte & Touche LLP, Singapore or a member firm of Deloitte Touche Tohmatsu Limited for the purposes of the 2011 Consolidated Financial Statements of the Group.
(4) For identification purpose, the translated name for this subsidiary is “GP Acoustics (China) Limited”.(5) Incorporated during the financial year.(6) Incorporated during the financial year and commenced operations subsequent to 31 March 2011.
(a) Audited by Deloitte & Touche LLP, Singapore, which are the auditors of all Singapore incorporated subsidiaries.(b) Audited by member firms of Deloitte Touche Tohmatsu Limited.(c) Subsidiary of GP Acoustics (UK) Limited. The consolidated financial statements of GP Acoustics (UK) Limited are
audited by a member firm of Deloitte Touche Tohmatsu Limited.(d) Subsidiary of Bowden Industries Limited. The consolidated financial statements of Bowden Industries Limited have
been audited by a member firm of Deloitte Touche Tohmatsu Limited for the purpose of the 2011 Consolidated Financial Statements of the Group.
(e) Subsidiary of Maxson Industries Limited. The local statutory consolidated financial statements of Maxson Industries Limited are audited by Au Choi Yuen & Co.
(f) Local statutory audit performed by Au Choi Yuen & Co.(g) Local statutory audit performed by Shu Lun Pan Yangcheng Certified Public Accountants Co., Limited Huizhou Branch.(h) Local statutory audit performed by Huizhou East Certified Public Accountants.(i) Local statutory audit performed by Shenzhen Zheng Feng Li Fu Certified Public Accountants.
102
31 March 2011
notes to the financial statements (cont’d) GP Industries Limited Annual Report 2010-11
37. Associates
Significant associates of the Group are as follows:
Name of company
Place of incorporationand business Principal activities
Effective percentage of
equity and voting power held
2011 2010
% %
Dai-ichi Electronics (Shanghai) Co Ltd. (10)
The People’sRepublic of China
Manufacturing of loudspeakers and electronics products
- 20.00
Dongguan Jifu MetallicProducts Ltd. (2) (3)
The People’sRepublic of China
Manufacturing of metallic products 30.00 30.00
GP Batteries International Limited (1) Singapore Manufacture, development and marketing of batteries and battery-related products
49.71 49.79
Kunshan TIME InterconnectLimited (2) (4)
The People’sRepublic of China
Manufacturing of cable assemblies 37.72 47.23
Linkz Industries Limited (b) Hong Kong Investment holding 37.72 47.23
Linkz Industries (Shanghai) Ltd. (2) (4) The People’sRepublic of China
Manufacturing of cables 35.83 44.87
Linkz Industries (Suzhou) Limited (2) (4) The People’sRepublic of China
Manufacturing of local area network cables
37.72 47.23
Linkz International Limited (2) (4) Hong Kong Trading of electronic cables and wires and cable assemblies
37.72 47.23
Meiloon Industrial Co., Ltd. (2) (7) Taiwan Development, manufacturing and marketing of acoustics and audio-visual equipment
20.02 20.02
Shinwa Industries (China) Ltd. (2) (5) The People’sRepublic of China
Manufacturing of electronic components
10.50 10.50
Shinwa Industries (Hangzhou) Limited (2) (5)
The People’sRepublic of China
Manufacturing of electronic components
10.50 10.50
Shinwa Industries (H.K.) Limited (8) (b) Hong Kong Trading of electronic components 15.00 15.00
SPG Industry (China) Limited (2) (6) (10) The People’sRepublic of China
Manufacturing of high precision parts and components
- 32.49
103
notes to the financial statements (cont’d) GP Industries Limited Annual Report 2010-11
37. Associates (cont’d)
Name of company
Place of incorporationand business Principal activities
Effective percentage of
equity and voting power held
2011 2010
% %
SPG Industry (H.K.) Limited (10) Hong Kong Trading of high precision parts and components
- 46.41
SPG Tech (China) Ltd. (2) (6) (10) The People’sRepublic of China
Manufacturing of tooling and moulds - 46.41
Suzhou Bordnetze Electrical Systems Ltd (9) (a)
The People’sRepublic of China
Manufacturing of automotive wire harness
20.00 20.00
Time Interconnect, Inc. (2) (4) United Statesof America
Trading of electronic cables and wires and cable assemblies
37.72 47.23
Wisefull Technology Limited (2) (b) Hong Kong Investment holding and trading of metallic products
30.00 30.00
Note:(1) GP Batteries is listed on the Mainboard of SGX-ST. The consolidated financial statements of GP Batteries are audited
by Deloitte & Touche LLP, Singapore. Significant subsidiaries and associates of GP Batteries are listed in the financial statements of GP Batteries.
(2) Equity interest is held by subsidiaries or associates of the Company.(3) Subsidiary of Wisefull Technology Limited.(4) Subsidiary of Linkz Industries Limited.(5) Subsidiary of Shinwa Industries (H.K.) Limited.(6) Subsidiary of SPG Industry (H.K.) Limited.(7) Meiloon is listed on the Taiwan Stock Exchange Corporation. The consolidated financial statements of Meiloon are
audited by PKF Taiwan. Meiloon has been equity accounted for in the consolidated financial statements based on results ended, or as at, 31 December, the financial year end of Meiloon.
(8) The Group has significant influence in Shinwa Industries (H.K.) Limited (“Shinwa”) through the Company’s representation on Shinwa’s board of directors.
(9) Associate of Shanghai Jinting Automobile Harness Limited.(10) Disposed of during the financial year ended 31 March 2011.
(a) Local statutory audit performed by KPMG Huazhen Shanghai Branch.(b) These associates adopt a different financial year end from that of the Group. For the purposes of applying the
equity method of accounting, the financial statements of these associates for the twelve months period ended 31 March have been used, which have been reviewed by a member firm of Deloitte Touche Tohmatsu Limited. The local statutory consolidated financial statements of Linkz Industries Limited, Shinwa Industries (H.K.) Limited and Wisefull Technology Limited are audited by a member firm of Deloitte Touche Tohmatsu Limited, PricewaterhouseCoopers Ltd. and Au Choi Yuen & Co., respectively.
104
31 March 2011
notes to the financial statements (cont’d) GP Industries Limited Annual Report 2010-11
38. Joint venture
During the financial year ended 31 March 2010, the Company’s wholly owned subsidiary, GP Auto Parts Limited, acquired a
50% equity interest in Shanghai Jinting Automobile Harness Limited (“Jinting”) for a cash consideration of S$17,874,000.
Jinting is incorporated in The People’s Republic of China and its principal business is the manufacture and supply of automotive
wire harness. The consolidated financial statements of GP Auto Parts Limited have been audited by a member firm of Deloitte
Touche Tohmatsu Limited for the purpose of the 2011 Consolidated Financial Statements of the Group. The local statutory
financial statements of Jinting are audited by Shanghai Zhonghui Certified Public Accountants Co., Ltd.
The following amounts are included in the Group’s financial statements as a result of the proportionate consolidation of
The fair values of identifiable assets and liabilities as at the effective date of acquisition, during the financial year ended 31
March 2010, were as follows:
2010 S$’000
Property, plant and equipment 8,029Interest in associates 5,052Inventories 11,097Receivables and prepayments 10,905Bank balances, deposits and cash 14,855Trade and other payables (13,824)Income tax payable (165)Bank loans - current (5,130)Bank loans - non-current (1,539)Deferred tax liabilities (1,497)Net identifiable assets acquired 27,783Excess of share of fair value of identifiable net tangible assets acquired over consideration paid (10,074)Adjustment to exchange translation reserve 165Total cash paid on acquisition 17,874Less: Bank balances, deposits and cash acquired (14,855)Cash outflow from acquisition of a joint venture, net of cash acquired 3,019
Had the acquisition been completed on 1 April 2009, the Group’s revenue and Group’s profit attributable to the equity
holders of the Company for the financial year ended 31 March 2010 would have been S$310,918,000 and S$42,263,000
respectively.
105
notes to the financial statements (cont’d) GP Industries Limited Annual Report 2010-11
39. De-registration, liquidation and disposal of subsidiaries
During the financial year ended 31 March 2011, the Group de-registered / liquidated its interest in certain inactive subsidiaries
and recognised a net gain on de-registration / liquidation of subsidiaries of S$46,000, comprising a cumulative exchange
translation surplus of S$44,000, as an exceptional item (Note 7).
During the financial year ended 31 March 2010, the Group deregistered an inactive wholly owned subsidiary and recognised
a cumulative exchange translation surplus of S$3,735,000 as an exceptional item (Note 7).
During the financial year ended 31 March 2010, the Group disposed of its entire 100% equity interest in GP Lighting
Technology (Huizhou) Limited (“GP Lighting”). GP Lighting incurred net losses of S$2,000,000 for the financial year ended
31 March 2009 and S$1,863,000 for the period from 1 April 2009 to the date of disposal.
The assets and liabilities as at the date of disposal were as follows:
2010 S$’000
Bank balances, deposits and cash 729Trade and other payables (536)Net identifiable assets disposed 193Provision for warranty 216Adjustment to exchange translation reserve 1Gain on disposal of subsidiary 41Total consideration 451Less: Bank balances, deposits and cash disposed (729)
Proceeds receivable on 31 December 2010 (90)Cash outflow from disposal of a subsidiary, net of proceeds received (368)
40. Subsequent event
Subsequent to the financial year end, the Group entered into an agreement (the “Subscription Agreement”) to subscribe for
a convertible note in the principal amount of approximately HK$68,019,000 (equivalent to S$10,988,000) issued by GSMH
(the “Convertible Note”). The Group satisfied the consideration for the Convertible Note by discharging and releasing GSMH
from an amount due to the Group (Note 15). The Convertible Note has a final maturity date of 21 April 2016 and is interest
bearing at 2.00% per annum. Unless previously converted into new shares of GSMH or repaid in accordance with the terms
of the Convertible Note, GSMH shall redeem the Convertible Note on 21 April 2016 the outstanding principal together with
interest accrued thereon. The Group can convert the Convertible Note in whole or in part into new shares to be issued by
GSMH during the period from 21 April 2012 to 21 April 2016, according to the basis of conversion set out in the Subscription
Agreement.
106
Introduction
This Statement describes how GP Industries Limited (the “Company”) applied the principles of the Code of Corporate Governance
introduced in 2001 and amended in 2005 (the “Code”) to its corporate governance processes and activities with specific reference
to the Code and any deviations from the Code are explained.
Board Matters
Principle 1: The Board’s Conduct of Affairs
The principal functions of the Board are:
(i) supervising the overall management of the business and affairs of the Group;
(ii) approving the Group’s strategic plans, significant investment and divestment proposals and funding decisions;
(iii) reviewing the Group’s financial performance and key operational initiatives;
(iv) implementing risk management policies and practices;
(v) approving nominations to the Board of Directors;
(vi) reviewing and endorsing the recommended framework of remuneration for the Board and key executives by the Remuneration
Committee; and
(vii) assuming responsibility for corporate governance.
The Board conducts regular meetings on a quarterly basis and ad hoc meetings as and when required. Article 100(2) of the
Company’s Articles of Association allows Board meetings to be conducted by way of telephone or video conferencing or by
other audio or audio-visual communications equipment. The attendance of the Directors at meetings of the Board and Board
Committees, as well as the frequency of such meetings, are disclosed in this Statement. The Company, however, believes that the
contributions of the Directors can be reflected in means other than by the attendance at such meetings. A Director is appointed on
the strength of his calibre, experience and his potential to contribute to the proper guidance of the Company and its businesses in
forms such as management’s access to him for guidance or exchange of views outside the formal environment of Board meetings
and also his ability to bring relations which are strategic to the interests of the Group.
Matters that are specifically reserved for the Board’s decision include material acquisitions and disposal of assets, corporate or
financial restructuring, share issuance and dividend payment to shareholders, and other transactions of a material nature requiring
announcement under the listing rules of the Singapore Exchange Securities Trading Limited (“SGX-ST”).
The Company provides facilities for new Directors to meet their relevant training needs and also orientation programmes to
familiarise them with the business of the Company and its subsidiaries (the “Group”) and governance practices. All Directors are
routinely updated on developments in the operating environment, particularly on relevant new laws and regulations.
Principle 2: Board Composition and Guidance
Presently, the Board consists of nine Directors, of whom three are Independent (as defined in the Code) Non-Executive Directors.
During the financial year, Mr Eric Ng Siu Kai was appointed an Executive Director of the Company on 1 April 2010. Key information
regarding the Directors is provided under the “Board of Directors and Senior Management” section of the annual report.
coRpoRate goveRnance statement GP Industries Limited Annual Report 2010-11
107
coRpoRate goveRnance statement GP Industries Limited Annual Report 2010-11
Principle 2: Board Composition and Guidance (cont’d)
The Nominating Committee is of the view that the current Board comprises persons who, as a group, provides core competencies
necessary to meet the Company’s objectives.
The Board has reviewed its composition of Directors and is satisfied that such composition is appropriate for the nature and scope
of the Group’s operations and facilitates effective decision-making. The Board will constantly examine its size with a view to
determining its impact upon its effectiveness.
Principle 3: Chairman, Executive Vice Chairman and Managing Director
The Chairman of the Company bears responsibility for the overall functioning of the Board. The Executive Vice Chairman and the
Managing Director are responsible for the daily running of the Group’s business. The Chairman, the Executive Vice Chairman and
the Managing Director are not related.
Principle 6: Access to Information
Management provides the Board and its various sub-committees with relevant information and reports prior to their respective
meetings. In addition, Management also provides the Board with further information or ad hoc reports as and when required.
Board members are also consulted or updated with latest developments of the Group with regular management meetings,
circulation of discussion papers and informal meetings such as discussions via tele-communications. Directors have separate and
independent access to the Company’s senior management and the Company Secretaries for additional information. In addition,
should Directors, whether as a group or individually, need independent professional advice, Management will, upon direction by
the Board, appoint a professional advisor selected by the group or the individual, to render the advice. The cost of such professional
advice will be borne by the Company.
At least one of the Company Secretaries attends Board meetings, particularly the meetings for reviewing the draft announcements
of the Group’s quarterly and full year results, and is responsible for ensuring that Board procedures are followed. It is the Company
Secretary’s responsibility to ensure that the Company complies with the requirements of the Singapore Companies Act. Together
with the management staff of the Company, the Company Secretary is also responsible for compliance with all SGX-ST rules and
regulations, which are applicable to the Company.
Please refer to the “Corporate Information” section of the annual report for the composition of the Company’s Board of Directors
and Board Committees.
Board Committees
Nominating Committee
Principle 4: Board Membership
The Nominating Committee (“NC”) currently consists of five Directors, three of whom, including the Chairman of the NC, are
Independent Non-Executive Directors.
The NC is guided by its Terms of Reference that set out its responsibilities, which includes consideration of salient factors for the
purposes of Directors’ re-nomination and determination of independence.
108
Principle 4: Board Membership (cont’d)
The duties and responsibilities of the NC are to:
(i) make recommendations to the Board on the appointment of new Executive and Non-Executive Directors, including making
recommendations to the composition of the Board generally and the balance between Executive and Non-Executive Directors
appointed to the Board;
(ii) regularly review the Board structure, size and composition and make recommendations to the Board with regards to any
adjustments that are deemed necessary;
(iii) determine the suitability and eligibility of nominated candidates for the approval of the Board, determining annually whether
or not a Director is independent, to fill Board vacancies as and when they arise as well as put in place plans for succession.
If the NC determines that a Director, who has one or more of the relationships that could interfere with his exercise of
independent business relationship judgement, is in fact independent, it would disclose the full nature of the Director’s
relationship and bear responsibility for explaining why he should be considered independent. Conversely, the NC has the
discretion to determine that a Director is non-independent even if the circumstances set forth in the Code are not applicable;
(iv) make recommendations to the Board for the continuation (or not) in services of any Director who has reached the age of 70;
(v) recommend Directors who are retiring by rotation to be put forward for re-election. All Directors are required to submit
themselves for re-nomination and re-election at regular intervals and at least once every three years;
(vi) assess the effectiveness of the Board as a whole and assess the contribution by each individual Director to the effectiveness
of the Board. Although the Directors are not evaluated individually, the factors taken into consideration for the re-nomination
of the Directors for the year are based on the contribution of each individual Director to the effectiveness of the Board and
whether each Director continues to demonstrate his commitment to the role (including commitment of time for Board and
Committee meetings, and any other duties) particularly when a Director has multiple board representations; and
(vii) have due regard to the principles of the Code and Code of Best Practices on Securities Transactions.
Principle 5: Board Performance
The Board, through the delegation of its authority to the NC, has used its best efforts to ensure that Directors appointed to the
Board possess the background, experience and knowledge in technology, business, finance and management skills critical to the
Group’s business and that each Director, through his unique contributions, brings to the Board an independent and objective
perspective to enable balanced and well-considered decisions to be made. In the event that the appointment of a new Board
member is required, the criteria for the appointment will be driven by the need to position and shape the Board in line with the
medium-term needs of the Company and its business.
The NC has decided, in consultation with the Board, on how the Board should be evaluated and has selected a set of performance
criteria that is linked to long-term shareholders’ value, for evaluation of the Board’s performance. The NC has set up a formal
assessment process to evaluate the effectiveness of the Board as a whole. Although the Directors are not evaluated individually, the
factors taken into consideration for the re-nomination or re-appointment of the Directors are, inter alia, contributions made by the
Directors at the meetings and attendance at meetings.
The Board is of the view that the financial parameters recommended by the Code as performance criteria for the evaluation of
Directors’ performance may not fully measure the long-term success of the Company and is less appropriate for the Non-Executive
Directors and the Board’s performance as a whole.
coRpoRate goveRnance statement (cont’d) GP Industries Limited Annual Report 2010-11
109
coRpoRate goveRnance statement (cont’d) GP Industries Limited Annual Report 2010-11
Accountability and Audit
Principle 10: Accountability
The Board is accountable to the shareholders. It is the aim of the Board to provide shareholders with a balanced and understandable
assessment of the Company’s performance, position and prospects when presenting the annual financial statements, announcement
of the Group’s financial results and price sensitive public reports.
Management is accountable to the Board. Management prepares balanced and understandable monthly management accounts.
Principle 11: Audit Committee
Currently the Audit Committee (“AC”) comprises three members who are Independent Non-Executive Directors. Members of the
AC are experienced professionals and businessmen. They are knowledgeable in accounting, banking and financial management
matters and possess extensive general business knowledge. The AC is of the view that its members have sufficient financial
management expertise and experience to discharge the AC’s functions.
The AC is guided by its Terms of Reference, which set out its duties and responsibilities. The principal duties of the AC include:
(i) reviewing external auditors’ audit plan;
(ii) reviewing the results of internal auditors’ examination of the systems of internal accounting controls;
(iii) reviewing the significant financial reporting issues and judgements so as to ensure the integrity of the financial statements of
the Group and any formal announcements relating to the Group’s financial performance;
(iv) reviewing the adequacy of the Group’s financial controls, operational and compliance controls, and risk management policies
and systems;
(v) ensuring the internal audit function is independent of the activities it audits, has sufficient resources to perform its duties,
and has appropriate standing within the Company;
(vi) reviewing the scope and results of the audit and its cost effectiveness and the independence and objectivity of the external
auditors annually;
(vii) recommending to the Board on the appointment/re-appointment of the external auditors, the audit fee and matters related
to the resignation and dismissal of the auditors;
(viii) reviewing the Group’s quarterly and full year results before their submission to the Board for approval for public announcements;
(ix) approving the internal audit plans and reviewing results of internal audits as well as management’s responses to the
recommendations of the auditors;
(x) reviewing the Group’s interested person transactions; and
(xi) investigating any matter within its Terms of Reference and conducting other reviews as required by the Listing Manual of
SGX-ST.
The AC has full access to and co-operation by Management and reasonable resources to enable it to discharge its functions
properly. The AC meetings are held with the internal and external auditors and by invitation, any Director and representatives from
Management. The AC also meets with the external and internal auditors, without the presence of Management, at least once a
year.
110
Principle 11: Audit Committee (cont’d)
The AC has undertaken a review of all non-audit services provided by the external auditors and is of the opinion that the provision
of such services would not affect the independence of the external auditors. During the financial year ended 31 March 2011, fees
for non-audit services paid to auditors of the Company and other auditors amounted to S$26,000 and S$206,000 respectively
(2010 : S$26,000 and S$200,000 respectively).
The AC and the Board are satisfied that the appointment of different auditors for its subsidiaries or associates would not compromise
the standard and effectiveness of the audit of the Group.
The AC has also put in place a policy, whereby staff of the Group may raise concerns about possible improprieties in matters of
financial reporting, fraudulent acts and other matters and ensure that arrangements are in place for independent investigations of
such matters and appropriate follow up actions.
Principle 12: Internal Controls
The Company’s Internal Audit Department (“IAD”) carries out a review of the effectiveness of the Group’s material internal
controls, including financial, operational and compliance controls, and risk management policies and systems, to the extent of
their scope as laid out in their internal audit plan. In addition, material non-compliance and internal control weaknesses, if any,
noted by the Company’s external auditors, Deloitte & Touche LLP (“DT”), during their statutory audit, and the external auditors’
recommendations to address such non-compliance and weaknesses, are reported to the AC.
Management with the assistance of the IAD follows up on DT’s recommendations as part of its role in the review of the Company’s
internal control systems.
Based on the information and reports provided by the IAD and DT, nothing has come to the AC’s attention that suggests internal
control processes are not satisfactory for the nature and volume of business conducted.
Principle 13: Internal Audit
The IAD is staffed by four people, and supervised by a Senior Manager. The IAD is independent from the activities it audits. It reports
directly to the Chairman of the AC, and to the Managing Director administratively.
Reports from the IAD are tabled at each of the AC’s regular meetings, which are held on a quarterly basis. The AC also reviews
and approves the IAD annual audit plans and resources to ensure that it has the capabilities to adequately perform its functions.
The IAD has adopted the Standards for Professional Practice of Internal Auditing set by the Institute of Internal Auditors in carrying
out its duties.
coRpoRate goveRnance statement (cont’d) GP Industries Limited Annual Report 2010-11
111
coRpoRate goveRnance statement (cont’d) GP Industries Limited Annual Report 2010-11
Remuneration Committee
Principle 7: Procedures for Developing Remuneration Policies
Principle 8: Level and Mix of Remuneration
Principle 9: Disclosure on Remuneration
The Remuneration Committee (“RC”) currently consists of three Independent Non-Executive Directors. The Committee is
knowledgeable with executive compensation.
The RC’s Terms of Reference are primarily to:
(i) review and recommend to the Board in consultation with Management and the Chairman of the Board, a framework of
remuneration and to determine the specific remuneration packages and terms of employment for each of the Executive
Directors and senior executives/divisional directors (those reporting directly to the Chairman of the Board) of the Group
including those employees related to the Executive Directors and controlling shareholders of the Group;
(ii) recommend to the Board in consultation with Management and the Chairman of the Board, the Company’s share option or
any long-term incentive schemes which may be set up from time to time and to do all acts necessary in connection therewith;
and
(iii) carry out its duties in the manner that it deemed expedient, subject always to any regulations or restrictions that may be
imposed upon the RC by the Board of Directors from time to time.
In reviewing the remuneration of Directors, the RC considers the employment conditions within the industry of comparable
companies, as well as the Company’s performance and the performance of Directors.
1. Table shows breakdown of Directors’ remuneration for the financial year ended 31 March 2011 (in percentage terms):
Name of Director (1) Salary (2) Bonus (2) FeesOther
benefits Total
% % % % %
S$750,000 to below S$1,000,000
Brian Li Yiu Cheung 61 35 - 4 100
S$500,000 to below S$750,000
Leung Pak Chuen 65 32 - 3 100
Victor Lo Chung Wing 63 35 - 2 100
S$250,000 to below S$500,000
Andrew Chuang Siu Leung 83 10 - 7 100
Eric Ng Siu Kai 81 12 - 7 100
Below S$250,000
Lim Ah Doo - - 100 - 100
Lim Hock Beng - - 100 - 100
Phua Bah Lee - - 100 - 100
Wong Man Kit - - - - -
112
Principle 7: Procedures for Developing Remuneration Policies (cont’d)
Principle 8: Level and Mix of Remuneration (cont’d)
Principle 9: Disclosure on Remuneration (cont’d)
2. Table shows breakdown of top five key executives’ remuneration, which are within the S$300,000 to S$550,000 band, for
the financial year ended 31 March 2011 (in percentage terms):
Name of key executive (1) Salary (2) Bonus (2) FeesOther
benefits Total
% % % % %
Alec Malcolm Chanin 82 - - 18 100
John Simon Davies 86 6 - 8 100
Stephen John Halsall 77 10 - 13 100
Martin Klaassen 81 6 - 13 100
Nigel Wood 58 29 - 13 100
Note:(1) In alphabetical order of the Directors’ or key executives’ last names.(2) Include contribution to post-retirement benefits.
During the financial year, an employee who is the daughter of Mr Victor Lo Chung Wing, received a remuneration which was
more than S$150,000 but less than S$250,000. Save as aforementioned, no employee of the Company and its subsidiaries was an
immediate family member of a Director and whose remuneration exceeded S$150,000 during the financial year ended 31 March
2011. “Immediate family” means, in relation to a person, the person’s spouse, child, adopted child, stepchild, brother, sister and
parent.
The remuneration policy for staff adopted by the Company comprises a base salary and a variable bonus that is linked to the
performance of the Company and individual staff. In addition, options offered pursuant to the Company’s Share Option Scheme
1999 (the “1999 Scheme”) also provided incentives to the staff to excel in their performance. The duration of the 1999 Scheme
reached its maximum period of ten years on 31 March 2010 and ceased to operate accordingly. However, options previously
granted under the 1999 Scheme continue to be exercisable in accordance with the regulations of the 1999 Scheme.
Information regarding the 1999 Scheme is disclosed in the Directors’ Report.
Communication with Shareholders
Principle 14: Communication with Shareholders
Principle 15: Promoting Greater Participation by Shareholders
Announcements of results are released through the SGXNET. The Company also updates such information on the Company’s
website.
coRpoRate goveRnance statement (cont’d) GP Industries Limited Annual Report 2010-11
113
coRpoRate goveRnance statement (cont’d) GP Industries Limited Annual Report 2010-11
Principle 14: Communication with Shareholders (cont’d)
Principle 15: Promoting Greater Participation by Shareholders (cont’d)
The Company does not practise selective disclosure. Price sensitive information is first publicly released, either before the Company
meets with any group of investors or investment analysts or simultaneously with such meetings, if necessary. Results and annual
reports are announced or issued within the mandatory period and are available on the Company’s website.
The Company communicates with its investors on a regular basis and attends to their queries. All shareholders of the Company
receive a copy of the annual report and notice of Annual General Meeting (“AGM”). The notice of the AGM is also advertised in
a newspaper.
At AGMs, shareholders are given the opportunity to communicate their views and ask questions regarding the Group. Board
members, Chairmen of the AC, NC and RC and the external auditors are also available to address questions raised at the AGM.
The Company’s Articles of Association allows a shareholder of the Company to appoint one or two proxies to attend and vote at
all general meetings on his/her behalf.
Dealing in Securities
The Group has adopted a Code of Best Practices on Securities Transactions with respect to dealings in securities by Directors and
officers of the Group.
Directors and officers are prohibited from dealing in the Company’s securities two weeks before the announcement of the
Company’s first three quarters’ results, and one month before the announcement of the Company’s full year results, ending on
the date of the relevant announcement of the results. Directors and officers are also prohibited from dealing in the Company’s
securities when they are in possession of potentially price sensitive information.
Directors and officers are also not expected to deal in the Company’s securities on considerations of a short-term nature.
The Company has complied with its Code of Best Practices on Securities Transactions.
Risk Management Policies and Processes
Management is in charge of the Group’s risk management policies and processes and reports to the Board in respect of significant
risks to the Group’s operations.
Material Contracts
Save as disclosed under the section on Interested Person Transactions below, there is no material contract entered into by the
Company and its subsidiaries involving the interests of the Chairman, Executive Vice Chairman, Managing Director, Directors or the
controlling shareholders, either still subsisting at the end of the financial year or if not then subsisting, entered into since the end
of the previous financial year.
114
Interested Person Transactions
The Company has adopted an internal policy in respect of any transaction with interested persons and has set out the procedures
for review and approval of the Company’s interested person transactions. The Company’s disclosure in accordance with Rule 907
of the SGX-ST Listing Manual in respect of interested person transactions for the financial year ended 31 March 2011 is as follows:
Name of interested person
Aggregate value of all interested person transactions during the
financial year under review (excluding transactions less than
S$100,000 and transactions conducted under shareholders’ mandate pursuant to Rule 920)
Aggregate value of all interested person transactions conducted
under shareholders’ mandate pursuant to Rule 920 during
the financial year under review (excluding transactions less than
S$100,000)
2011 2010 2011 2010
S$’000 S$’000 S$’000 S$’000
Licence fee expense:
KH Technology Corporation (1) 1,025 1,011 - -
Sales:
Light Engine Ltd - - 2,941 432
Lighthouse Technologies Limited and subsidiaries - - 640 46