72
Report of the Tax Forecasting Methodology Review Group February 2008

Report of the Tax Forecasting Methodology Review Group
February 2008
2
Contents
Page
Executive Summary 3
1. Introduction 9
2. Main Developments in Tax Revenue 1999 – 2006 11
3. Tax Revenue Forecasting Process 17
4. Tax Revenue Forecasting Performance 31
5. Controlling for Economic Forecasting Errors 40
6. Retrospective Forecasting using Alternative Methodologies 47
- Incorporates Controlling for the Impact of the Property Market
7. Conclusions 60
Appendices 62
- Long-run Aggregate Tax Elasticity 63
- Composition of the Forecasting Errors 66
- An Examination of Data Revisions in the Quarterly National Accounts 68
- ESRI QEC Tax Revenue Forecasting Model 72

3
Executive Summary
Objective
The primary objective of this report is to examine the tax revenue forecasting
methodology currently employed by the Department of Finance in light of the actual
experience over the period 1999 - 2006. The motivation for conducting a review is
two-fold. Firstly, a considerable period of time has lapsed since the last review was
undertaken, and an update is therefore timely. Secondly, on a headline basis, there has
been considerable overshooting of tax revenue over the last three years. A detailed
analysis of the tax forecasting performance over a longer timeframe is therefore
required.
Aggregate Performance
At an aggregate level, the analysis finds that, on a headline basis, there has been a
significant divergence between forecast tax revenue and the actual outturn over the
period 1999 – 2006; the overall root mean squared (forecast) error (RMSE) is found
to be 6.1 per cent of the actual tax revenue outturn.
Developments on a purely headline basis are subject to a number of important
caveats. For instance, various one-off factors (both positive and negative) which are
difficult to quantify ex ante will impact on the accuracy or otherwise of the tax
forecasts. In addition, forecasts of macro-economic variables are a key input into the
tax forecasting process, and economic forecasting ‘errors’ will contribute to
inaccuracies in the tax revenue projections.
Therefore, in order to quantify the underlying tax forecasting error, the analysis
controls for these factors. This is undertaken through retrospectively forecasting tax
revenue on the basis of actual economic developments and by applying the actual
revenue generated from the various one-off factors over this period. The result is a
decline in the RMSE to 4.0 per cent, suggesting that economic forecasting errors and
one-off factors had some impact on the accuracy of the tax forecasts.
In terms of the direction of error, tax revenue has, for the most part, tended to exceed
forecasts, possibly suggesting a prudent bias in the forecasts. In terms of comparison
with the previous report, the scale of the error is larger over the later period,
4
suggesting a deterioration in the forecasting performance in more recent years. The
direction of the error is unchanged vis-à-vis the earlier report.
Performance of Individual Tax Heads
Developments for the individual tax heads are also analysed. On average over the
period, the four largest tax heads accounted for almost 90 per cent of total tax
revenue, so that developments in these deserve special mention. On an underlying
basis (i.e. having controlled for economic forecasting errors and one-off factors), the
following results emerge:
the average error for income tax over the period was found to be 3.9 per cent,
with revenue from this source undershooting forecasts in five of the last six years.
However, there were fundamental changes to the income tax system over this
period, namely the introduction of tax credits and partial individualisation.
VAT forecasts were found to be the most accurate of all the tax heads, with a
RMSE of 3.3 per cent. Revenues have overshot forecasts in each of the last three
years.
Corporation tax receipts recorded the largest error of the four largest tax heads,
with an error of 7.5 per cent over the period. Given the scale of multinational
operations relative to the size of the domestic economy together with a number of
important changes to the corporation tax regime in recent years it is perhaps not
surprising that this tax head has proved to be difficult to forecast with any degree
of accuracy. Moreover, Ireland is not unique in recording significant forecasting
error for this tax head; broadly similar developments have been evident in the UK
for instance.
The RMSE of the excise duty forecasts over the period was 3.8 per cent.
However, this is due in large part to the scale of the error in 2001, when excise
duties were 18 per cent below target. Excluding this one year from the analysis
reduces the RMSE to 2.8 per cent.
Considered in aggregate, the underlying forecast error of the four largest tax heads is
3.2 per cent. This suggests that smaller tax heads have had an important role in the
divergence between forecasts and outturn.
5
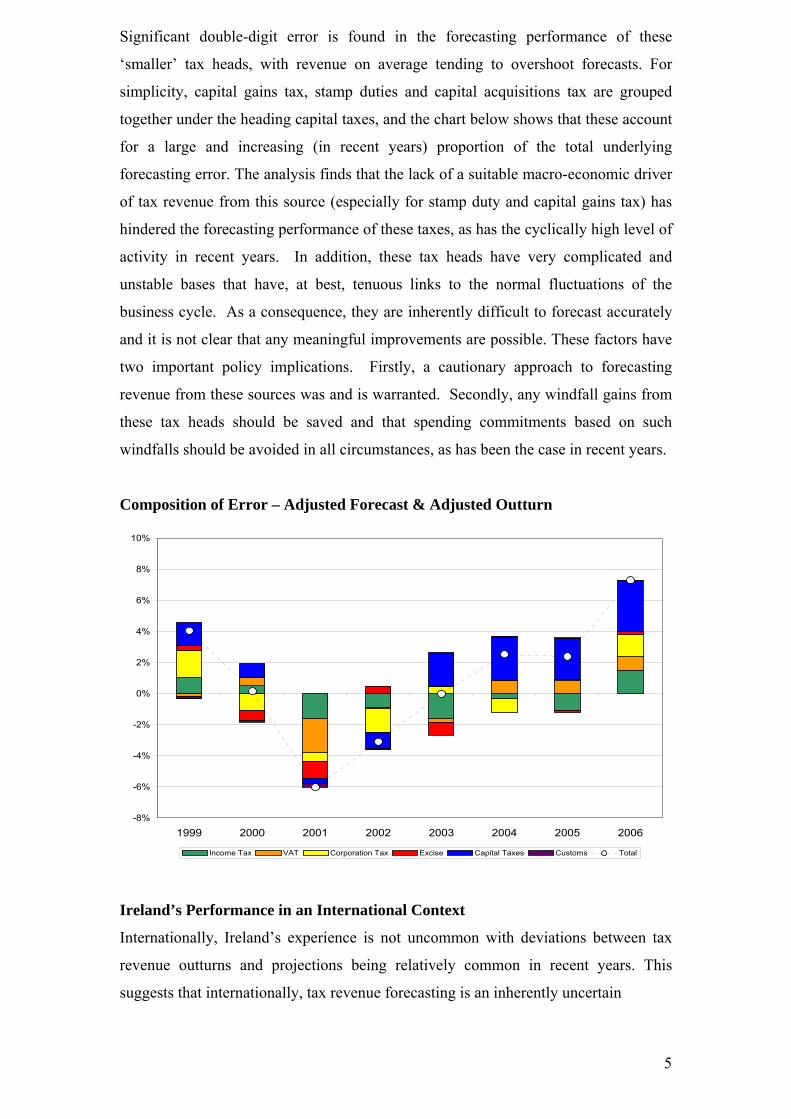
Significant double-digit error is found in the forecasting performance of these
‘smaller’ tax heads, with revenue on average tending to overshoot forecasts. For
simplicity, capital gains tax, stamp duties and capital acquisitions tax are grouped
together under the heading capital taxes, and the chart below shows that these account
for a large and increasing (in recent years) proportion of the total underlying
forecasting error. The analysis finds that the lack of a suitable macro-economic driver
of tax revenue from this source (especially for stamp duty and capital gains tax) has
hindered the forecasting performance of these taxes, as has the cyclically high level of
activity in recent years. In addition, these tax heads have very complicated and
unstable bases that have, at best, tenuous links to the normal fluctuations of the
business cycle. As a consequence, they are inherently difficult to forecast accurately
and it is not clear that any meaningful improvements are possible. These factors have
two important policy implications. Firstly, a cautionary approach to forecasting
revenue from these sources was and is warranted. Secondly, any windfall gains from
these tax heads should be saved and that spending commitments based on such
windfalls should be avoided in all circumstances, as has been the case in recent years.
Composition of Error – Adjusted Forecast & Adjusted Outturn
-8%
-6%
-4%
-2%
0%
2%
4%
6%
8%
10%
1999 2000 2001 2002 2003 2004 2005 2006
Income Tax VAT Corporation Tax Excise Capital Taxes Customs Total
Ireland’s Performance in an International Context
Internationally, Ireland’s experience is not uncommon with deviations between tax
revenue outturns and projections being relatively common in recent years. This
suggests that internationally, tax revenue forecasting is an inherently uncertain

6
process, and some error is inevitable. The international approach to forecasting tax
revenue is generally similar to that in Ireland, namely a “bottom-up” disaggregated
tax head approach supplemented by a “top-down” check.
The scale of deviation in Ireland is nevertheless found to be high by international
standards. There are a number of exceptional factors, however, that have contributed
to this. Firstly, the period dealt with in this report (1999 – 2006) was a transitional one
for the Irish economy. Substantial structural changes within the economy and within
the tax system meant that the relationship between the relevant tax bases and their
economic drivers may have changed over time. Unfortunately, pinning down a
steady-state relationship during a transitional period of deep structural change is
highly problematic. The residential property market is perhaps the most obvious
example. In Ireland, the residential property market has been among the most
dynamic in the OECD, with significant increases in both prices and turnover. As a
result, it is estimated that housing-related tax revenue has risen from around 3½ per
cent of total tax revenue in 1999 to 9 per cent in 2006. It is also worth noting that
stamp duty and capital gains tax receipts emanating from activity in the non-
residential/commercial property market have contributed significantly to the excesses
over target in tax revenues in recent years
Secondly, the Irish economy remains amongst the smallest and most open within the
OECD, with output concentrated in a relatively small number of sectors. As a result,
overall economic activity – and the tax revenue that this generates – is potentially
more volatile than in larger, more sectorally-diversified countries. For instance, the
global ICT shock in 2000/01 had a very sharp, almost instantaneous impact on
economic activity in Ireland, with noticeable tax revenue undershooting occurring as a
consequence. This experience illustrates the volatility of tax revenue in Ireland to
extraneous factors and provides a strong justification for a cautionary approach.
Tax-GDP Elasticity
Over the 1996-2006 period, the implied aggregate tax-to-GDP elasticity was found to
average 1.11. This figure must be interpreted with caution however. There has been
considerable year-to-year variance, with, for instance, an implied elasticity of around
0.3 in 2002, while in 2006 the implied elasticity was almost 2.0.
1 In simple terms, this means that for every 1 per cent rise in GDP, tax revenues rise by 1.1 per cent. See Appendix 1 for details of elasticity calculations.

7
Recommendations
On the basis of the analysis contained in the report, the following recommendations
are made under three main headings; namely methodological refinements, data
improvements and transparency.
Methodological Refinements
Maintain an aggregate tax-to-GDP elasticity of 1.0 as a “top-down” check on the
“bottom-up” approach. This recommendation was put forward in the previous
report of the Tax Forecasting Methodology Review Group. Despite the short-
term variance evident at the aggregate level in recent years, the tax-to-GDP
elasticity should still be viewed as an important check of the overall tax forecast.
The current approach to forecasting VAT receipts should be complemented by
an alternative approach which projects VAT receipts from new housing
separately from other VAT receipts. In theory, the alternative approach would
appear to be a more methodologically robust approach. However, retrospective
analysis shows no improvement over the entire period in question, although
significant improvements are evident in later years. Hence, there is a need for
the two approaches to be undertaken in tandem and for the relative merits of
both to be examined on an ongoing basis. This, of course injects an element of
subjectivity into the forecasts, although this is not seen as a major issue.
Using the macro-economic variable Gross Operating Surplus (defined as GDP
minus compensation of employees) as a driver of corporation tax receipts could
be considered. For most years the use of this variable leads to an improvement
in the tax forecasting performance. However, because there is a deterioration in
two of the years considered, it is recommended that this approach be used in
conjunction with the current approach.
Maintain the disaggregated approach to forecasting stamp duty that was first
used in Budget 2006, namely using forecasts of new housing output and prices
as a loose proxy to project receipts from residential property and using the
nominal increase in other building and construction investment excluding roads
to project receipts from non-residential property.

8
Given that the excess property-related tax revenue in recent years would appear
to be cyclical rather than structural, a cautious approach to forecasting property-
related tax revenue is prudent and should be continued.
Improved Data
Given the increased importance of receipts emanating from the housing market
in recent years, a more detailed breakdown of the actual VAT yield is desirable.
This would allow the actual receipts from new housing to be identified. At
present only estimates of the VAT yield from this sector can be obtained,
through the Post-Budget VAT base. While a breakdown of actual receipts is
desirable, it must be recognised that obtaining such data would involve drawing
on significant resources of the Revenue Commissioners. Therefore it is
recommended that this issue be investigated further.
More timely data on the nature of property market transactions giving rise to
stamp duty and capital gains tax receipts would also be useful although there
must be acknowledgement of the recent improvements in this area and
acceptance of the structural difficulties involved in going further.
Transparency
In light of the fact that the Irish economy has effectively been in a transitional
phase over the period in which this analysis was undertaken, it is recommended
to undertake more regular analysis of the tax forecasting performance. The
results of such analysis could be published by the Department of Finance on an
annual basis. This could also contain analysis of significant one-off factors
which are considered important.

9
1. Introduction
1.1 The last full review of the Department of Finance’s tax forecasting methodology
was carried out in 1998.
1.2 In light of the increasingly large variations which have arisen between tax
revenue forecasts and outturns in recent years in particular, it was decided to
carry out a further review of the tax forecasting methodology.
1.3 The Tax Forecasting Methodology Review Group (TFMRG) was established in
December 2006. The focus of the Group’s work was to carry out an evaluation
of the tax forecast methodologies currently used by the Department of Finance.
1.4 The formal terms of the reference for the Group were as follows:
To review the existing tax forecasting methodologies;
To examine the reason for divergences between tax revenue outturns and
forecasts;
To analyse the information bases on which forecasts are made;
To review the structural parameters of tax elasticities;
To look at the tax forecasting experience in other relevant jurisdictions;
To make recommendations for methodological changes, where
appropriate.
1.5 The Group was chaired by a Senior Economist on secondment to the
Department of Finance from the Central Bank and was comprised of other
representatives from the Department, the Revenue Commissioners, the Central
Bank, the Economic and Social Research Institute and the European
Commission.
1.6 The following were the members of the working group:

10
John McCarthy (Department of Finance, on secondment from the Central
Bank) – Chairperson
Paddy Molloy and Gerard Moran (Revenue Commissioners)
Ide Kearney and Adele Bergin (ESRI)
Diarmaid Smyth (Central Bank)
Brian Finn, Emma Cunningham and Aideen Foley (Department of Finance)
Martin Larch (European Commission) – participated fully by e-mail and
provided useful analysis and insight in relation to the international
experience in the tax forecasting area.
Alan Mahon (Department of Finance) – Secretariat

11
2. Main Developments in Tax Revenue: 1999 - 2006
2.1 This section of the report details the changing composition of tax revenue since
1999. The main developments in relation to the tax forecasting process since the
previous report of the TFMRG are also outlined.
Structure of Tax Revenue
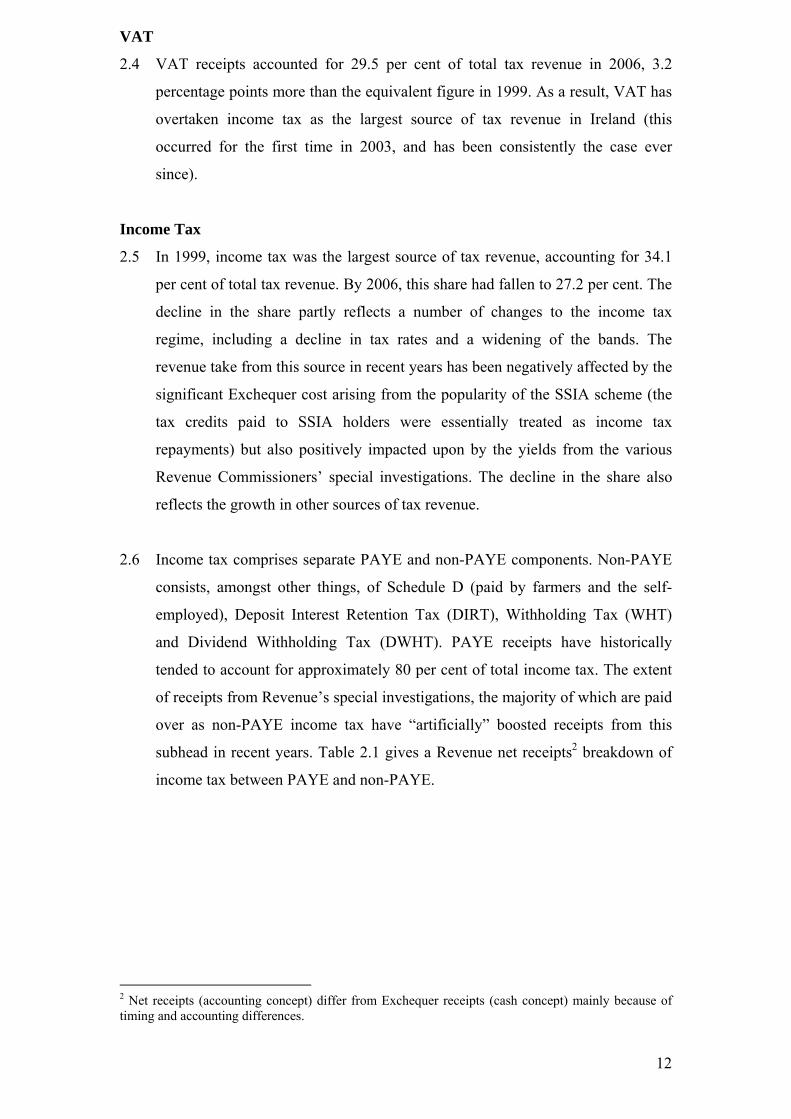
2.2 Chart 2.1 shows the share of Exchequer tax revenue accounted for by each tax
head in 1999 and in 2006.
2.3 The tax heads are ranked in descending order according to their respective share
of total revenue in 2006. The data illustrate that in 1999, aggregate tax revenue
was concentrated in the four largest tax heads – VAT, income tax, corporation
tax and excise duties – which together accounted for €21.7 billion or 92 per cent
of total tax revenue. This concentration has declined over the period, with the
proportion accounted for by these tax heads falling to 84 per cent in 2006 -
€38.1 billion of a total €45.5 billion. This reflects the growth of stamp duties and
capital gains tax (CGT) over this period. When these two latter tax heads are
included, the six largest tax heads account for 99 per cent of total tax revenue. It
is clear, therefore, that in terms of forecasting tax revenue, focusing on these
particular tax heads is sufficient.
Chart 2.1: Tax Receipts - % of Total in 1999 and 2006
1999
■ VAT ■ Income tax ■ Corporation tax ■ Excise duty ■ Stamp duty ■ CGT ■ CAT ■ Customs
2006
12
VAT
2.4 VAT receipts accounted for 29.5 per cent of total tax revenue in 2006, 3.2
percentage points more than the equivalent figure in 1999. As a result, VAT has
overtaken income tax as the largest source of tax revenue in Ireland (this
occurred for the first time in 2003, and has been consistently the case ever
since).
Income Tax
2.5 In 1999, income tax was the largest source of tax revenue, accounting for 34.1
per cent of total tax revenue. By 2006, this share had fallen to 27.2 per cent. The
decline in the share partly reflects a number of changes to the income tax
regime, including a decline in tax rates and a widening of the bands. The
revenue take from this source in recent years has been negatively affected by the
significant Exchequer cost arising from the popularity of the SSIA scheme (the
tax credits paid to SSIA holders were essentially treated as income tax
repayments) but also positively impacted upon by the yields from the various
Revenue Commissioners’ special investigations. The decline in the share also
reflects the growth in other sources of tax revenue.
2.6 Income tax comprises separate PAYE and non-PAYE components. Non-PAYE
consists, amongst other things, of Schedule D (paid by farmers and the self-
employed), Deposit Interest Retention Tax (DIRT), Withholding Tax (WHT)
and Dividend Withholding Tax (DWHT). PAYE receipts have historically
tended to account for approximately 80 per cent of total income tax. The extent
of receipts from Revenue’s special investigations, the majority of which are paid
over as non-PAYE income tax have “artificially” boosted receipts from this
subhead in recent years. Table 2.1 gives a Revenue net receipts2 breakdown of
income tax between PAYE and non-PAYE.
2 Net receipts (accounting concept) differ from Exchequer receipts (cash concept) mainly because of timing and accounting differences.

13
Table 2.1: Income Tax – Revenue Net Receipts Breakdown 1999-2006
Income Tax €m PAYE % Non-PAYE %
1999 8,028 83 17
2000 9,113 78 22
2001 9,347 78 22
2002 9,063 74 26
2003 9,162 79 21
2004 10,651 76 24
2005 11,266 77 23
2006 12,390 76 24
Corporation Tax
2.7 Corporation tax, as a share of total tax revenue has remained relatively constant
over the period, rising slightly from 14.6 per cent to 14.7 per cent over the
period, although it did reach a peak of 16.4 per cent in 2002. There have been a
number of important changes to the corporation tax regime over this period,
most notably the phased reduction to a standard 12½ per cent tax rate for trading
income generally but also the decision to bring forward the payment date for
preliminary corporation tax by seven months, effectively to a current year
payment basis.
2.8 The 5 year transition period for the gradual move to a current year payment
basis for corporation tax ended in 2006. The transition arrangements – whereby
1/5th of the amount due was brought forward in each year – generated cash-flow
gains in each of the transitional years but from 2007 this cash-flow gain is lost.
This cash-flow loss broadly offsets the benefit to the Exchequer arising from the
ending of the SSIA scheme.
Excise Duty
2.9 Excise duties as a percentage of total tax revenue have declined from 17.2 per
cent in 1999 to 12.3 per cent in 2006.
Stamp Duty
2.10 Stamp duty as a percentage of total tax revenue has more than doubled since
1999, rising from 3.9 per cent to 8.2 per cent in 2006. Stamp duty receipts are
mainly levied upon equity and property (residential and commercial)

14
transactions. The large increase in property prices – together with the high level
of activity in the market – is primarily responsible for the increase in the share
of revenue attributable to this source.
Capital Gains Tax (CGT)
2.11 Receipts from CGT have increased significantly since 1999, from 1.9 per cent of
total receipts to 6.8 per cent in 2006. While the yields from residential and
commercial property transactions have undoubtedly played an important role in
driving the increase in revenues from this tax head since 1999, other sources of
CGT such as from the disposal of quoted and unquoted shares and agricultural
and development land have also contributed significantly (see table 2.2 below).
Table 2.2: CGT by Consideration Value of Asset Type Disposal3
% of Total 2002 2003 2004 2005
Quoted Shares 21 23 26 20
Unquoted Shares 15 15 14 13
Residential Property 19 19 18 18
Commercial Property 13 12 15 17
Agricultural Land 13 13 11 12
Development Land 11 12 11 16
Other 8 6 6 5
Total 100 100 100 100
*Figures may not add to 100 per cent due to rounding of individual categories.
Other Tax Receipts
2.12 The data also illustrate that the revenue from other tax heads (capital
acquisitions tax, customs and levies) are relatively small. In aggregate terms,
receipts under these tax heads totalled to 1.3 per cent of total tax revenue in
2006, a decline from the 2.1 per cent share in 1999.
3 Table 2.2 contains details of CGT by consideration value of disposals by asset type and as such is no more than indicative of the actual CGT yield. The 2002 – 2004 figures are derived from CGT returns filed via the Revenue Online System (ROS) version and the paper version of Form 11 (the Pay & File tax return form). The 2005 figures are derived from CGT returns filed to early January 2007 via the ROS version of the Form 11 only. CGT returns can be made via other Forms but these figures capture the majority of returns.

15
Main Developments since the 1998 TFMRG Report
(i) Direct Tax Base Working Group
2.13 The Direct Tax Base Working Group (DTBWG) is an informal group set up
with the approval of the Minister for Finance in mid-2002 and is made up of
officials of the Department of Finance and the Revenue Commissioners. It was
established in order to analyse the reasons for the shortfall in direct taxes around
2001/2002 and to examine issues which may have had an impact on the tax
yield from direct taxes, including income tax, for the purpose of improving the
tax forecasting methodology. While the work of this Group is ongoing, the
Group has identified a number of areas where improvements can be made.
2.14 The Group examined issues related to the sampling of the Revenue
Commissioners income tax data files with a view to using more up-to-date but
not fully complete information to improve the forecasting of income tax (in
particular PAYE) receipts. The aim would be to cross-check and verify
employment and earnings elasticity coefficients calculated on the existing
historical basis using more up-to-date though partially incomplete Revenue
taxpayer data. In a rapidly changing economy such as Ireland the hope would be
to use a more up-to-date representative though incomplete sample rather than
using an older although more complete sample.
2.15 The Group has also considered ways to improve the forecasting of stamp duties
and CGT. In the area of stamp duty, a difficulty is the absence of timely data on
the underlying transactions giving rise to stamp duty yields. Detailed current
data (details of the residential and non-residential stamp duty tax yield for a
particular month available by the middle of the following month) on the
numbers and values of transactions in the residential and non-residential
property area, from which the majority of the stamp duty yield is derived, has
not been available. Similarly for CGT, the legislative processes operating mean
that it is systematically not possible to obtain relevant information on the
underlying transactions giving rise to current tax yields. For example, while the
payment of CGT on transactions giving rise to liability in the first 9 months of
2006 was due on 31 October 2006, details of the transactions themselves are not
required to be returned until one year later at end-October 2007. Some progress
has been made on this issue (see Table 3.2 for details of CGT by consideration
value of disposal by asset type for the years 2002-2005).

16
2.16 The work of the DTBWG is still ongoing and it would be unwise to draw any
conclusions at this time regarding the possible usefulness of its work for
forecasting purposes.
(ii) IMF Article on Ireland’s Fiscal Forecasting Record
2.17 In October 2005, the International Monetary Fund (IMF) published an analysis
of Ireland’s track record on forecasting the fiscal balance.4 On the revenue side
(which is of most importance in the context of this Report), the research found
that stronger-than-expected economic growth and buoyant asset price
developments were the main reasons for the overshooting of tax revenue. In
terms of economic growth forecasts, Department of Finance forecasts were
found to be similar to those of other institutions, and the difficulty in forecasting
economic growth in a period of strong economic growth was highlighted.
4 Favourable Fiscal Outturns: Is It Just the Luck of the Irish? – IMF Country Report No. 05/370

17
3. Tax Revenue Forecasting Process
3.1 Tax revenues are forecast by the Department of Finance on a disaggregated
individual tax head basis using relevant macroeconomic drivers supplied by the
Economic Forecasting Unit of the Department of Finance and, where
appropriate, certain elasticity factors.
3.2 There are eight main individual taxes, namely:
VAT
Income tax
Corporation tax
Excise duties
Stamp duties
CGT
Capital acquisitions tax
Customs duties – forecast by the Revenue Commissioners
The Department of Finance forecasts all of the taxes bar customs duties, which
are forecast by the Revenue Commissioners, on the basis of the available macros
provided by Department of Finance. In addition, in some instances (e.g., most of
the non-PAYE income tax) the Revenue forecast figures are used.
3.3 As the first six of these tax heads are forecast to account for 99 per cent of total
tax revenue in 2007, this Report focuses on them. The methodologies for
forecasting capital acquisitions tax (CAT) and customs duties are not discussed
in detail.
3.4 There are three tax forecasting rounds each year:
May/June for the Budget Strategy Memorandum (BSM). This is for the
information of the Government only and the forecasts are not made available
publicly.

18
September/October for the Pre Budget Outlook (PBO).5 An estimate of the
aggregate tax revenue outturn for the current year6 together with forecasts
for the following two years is provided in the PBO.
November/December for the Budget. An estimate of the tax revenue outturn,
on a disaggregated basis, for the current year together with forecasts for the
following three years is provided at Budget time.
3.5 As a “top-down” check on the validity of the overall tax forecast, in line with
the key recommendation in the 1998 Report of the TFMRG, the forecast change
in the level of nominal GDP is compared to the total tax revenue forecast growth
rate constructed on an individual tax head or “bottom-up” basis, i.e. the
elasticity of overall tax revenue growth with respect to nominal economic
growth is checked. In general, this particular elasticity factor is likely to be close
to one (see Appendix 1). However, this one to one relationship need not hold
from year to year and can be influenced by factors such as the composition of
economic growth and the impact of Budget changes.
3.6 There are a number of factors that effect tax forecasts:
Budget tax forecasts are made at a time when final economic data for the
current or forecast year are not available. In addition, most economic data
published by the CSO are subject to revision. A recent Central Bank
technical paper7 examining national accounts data published by the CSO
shows how initial estimates of GDP and its components can differ quite
significantly from final estimates, which creates problems for economic
forecasting purposes and hence for tax forecasting purposes. The paper
found that the final revision to the growth rate of GDP was 1½ per cent,
almost 20 per cent of average GDP growth over the sample. The average
5 This was first published in October 2006. 6 The Department of Finance constantly monitors in-year tax revenue performance and has often given estimates of the current year aggregate tax revenue outturn at its end-Q2 and end-Q3 Exchequer Returns Press Conferences. 7 Research Technical Paper 10/RT/06 by Colin Bermingham. This paper is summarised in Appendix 3.
19
revision was positive indicating that initial estimates of GDP tend to be too
low.
The composition of economic growth has a significant bearing on the actual
tax yield. This has been particularly applicable in recent years when the
composition of growth in Ireland has been heavily driven by domestic
demand.
At Budget time, the base year actual tax outturn is not known and therefore
the outturn is merely an estimate.
The impact of “one-off” or extraneous factors from year to year can be
significant. In recent years, the impact of Revenue’s special investigations
receipts has far exceeded expectations. These receipts cannot, by their
nature, be forecast with any degree of certainty.
The effect of structural changes (e.g. changes in the due date for payment) in
the tax system can sometimes impact on taxpayer behaviour with
unforeseeable results on tax revenues in the short term.
Receipts from some taxes such as CGT and stamp duties, which have
become increasingly significant in recent years, do not have as consistent a
relationship with economic growth as, say, income tax or VAT, and are
more difficult to forecast. These particular taxes are more dependent on
activity in the asset markets (property and shares). Activity in asset markets
is prone to more pronounced movements in volume and price than in the
wider economy and is therefore less predictable.
Corporation tax receipts from export profits are affected by international
trading conditions and are known to be highly volatile, particularly in small
open economies such as Ireland.

20
3.7 For all tax heads, the estimated impact of one-off or other factors expected to
affect tax collection in the forecast year is added to or subtracted from the
forecast.
Value Added Tax (VAT)
3.8 VAT is forecast by reference to growth in the nominal level of personal
consumption expenditure (PCE) including cars.
An estimate of the base year outturn for VAT is made.
This projected outturn is adjusted to take account of any known one-off
factors, both negative and positive, likely to impact on the yield in the
forecast year and also the effects of previous Budgets, which have been
carried forward.
This adjusted outturn figure is then grown by the forecast rate of increase in
nominal PCE, i.e. PCE (including cars) volume multiplied by a PCE deflator
and an elasticity factor, which has been 1 in recent years.
The figures are then refined to take account of the impact of Budget
measures, if any.
3.9 The bulk of VAT is due for payment in January and every second month
thereafter on the basis of trading turnover in the two months prior to each due
month.
Income Tax
3.10 Although income tax appears as a single tax head in the Budget Booklet, it
actually comprises separate PAYE and non-PAYE components. PAYE
represents around 80% of income tax and is forecast by the Department of
Finance. Non-PAYE consists mainly of Schedule D (paid by farmers and the

21
self-employed), Professional Services Withholding Tax (PSWT), Deposit
Interest Retention Tax (DIRT), Back Duty (special investigations monies) and
Dividend Withholding Tax (DWHT). With the exception of DIRT, which is
forecast by the Department of Finance, the other non-PAYE income tax
elements are forecast by the Revenue Commissioners.
3.11 There has been a major programme of structural reform to the income tax
regime in recent years. The standard and marginal tax rates have both been cut,
the standard rate band has been widened significantly, a system of tax credits
has replaced the tax free allowances and an element of individualisation has
been introduced. All of these changes coupled with the huge surge in
employment and the composition of employment have made the job of
forecasting income tax more difficult.
PAYE
3.12 To produce the PAYE forecast:
An estimate of the base year outturn for PAYE is made.
The projected outturn is adjusted to take account of any known one-off
factors, both negative and positive, likely to impact on the yield in the
forecast year and also the effects of previous Budgets, which have been
carried forward (in recent years relevant “one-off” factors have included the
impact of the SSIA scheme).
The adjusted outturn figure is then multiplied by an aggregate multiplier.
This multiplier is a combination of the forecast increase in non-agricultural
earnings together with an earnings elasticity factor and the forecast increase
in non-agricultural employment together with an employment elasticity
factor. The earnings and employment elasticity factors estimate the
sensitivity of PAYE taxes to changes in numbers employed and in the level
of earnings. For the Budget 2007 income tax forecasts, the elasticity factors
used for non-agricultural employment and non-agricultural earnings were
1.0 and 2.1 respectively. The aggregate multiplier is calculated by applying

22
the earnings elasticity to the earnings macro and the employment elasticity to
the employment macro. This is then applied to the cleaned PAYE base.
The figures are then refined to take account of the impact of Budget
measures, if any.
Calculation of Elasticity Factors
3.13 The elasticity factors take account of the fact that new and existing employees
are likely to pay tax at different marginal tax rates. In effect, the elasticity is a
measure of the tax increase arising from the shift of taxpayers from a lower to a
higher tax rate in the event of an income increase. The lower employment
elasticity factor represents the understanding that new jobs do not initially
generate as much in tax revenue as increases in the earnings of existing
employees. This is because the employment elasticity relates to new employees
and as the question of moving from one tax rate to another does not generally
apply in the first year of employment, a “flat” increase in tax equal to the
projected growth in numbers employed is therefore assumed.
3.14 The elasticity factors for any tax year t are derived from a projected taxpayer
income and tax model for the tax year t based on historical Revenue taxpayer
data for the tax year t-4. While “lookback” revisions of the elasticity factors tend
to confirm the projected versions of the elasticity factors first used (see 3.15
below), it is now considered appropriate that future projections be supported by
more recent information. An examination is underway to explore ways of basing
future forecasts on more up-to-date but less complete sample data for the year t-
2 (see work of Direct Tax Base Working Group in Chapter 3 for more detail).
3.15 A retrospective look back at the actual 2003 non-agricultural earnings elasticity
factor, carried out by the Revenue Commissioners, gave a figure of 2.0. The
figure used in the Budget 2003 PAYE income tax forecast, which was based on
1999 data was also 2.0, meaning that using more up-to-date information may not
necessarily prove more accurate. The analysis was carried out for one year only
and caution must be taken when drawing conclusions for other years.
Theoretically however, it would make more sense to use the most up-to-date

23
data available, provided of course it is fully representative of the complete data
series.
Non-PAYE Income Tax
3.16 Revenue’s forecast process for the main component of non-PAYE income tax,
Schedule D/Farmers, follows the same principles as PAYE but with some
differences such as:
estimating preliminary tax separately from “balances”. Preliminary tax for
the current tax year must be paid on or before the 31 October each year and
must be at least 90 per cent of the final taxable liability for that year (or
alternatively 100 per cent of the previous year’s liability). Any balance of
tax due for the previous tax year must also be paid on or before 31 October.
computing Revenue’s own income growth “macro” using historical trends of
tax yields.
adding in a separate estimate for the yield from normal audit activity. In
recent years, estimates of receipts from Revenue’s special investigations
would also have been included.
adjusting downwards to offset for higher withholding tax credits that arise
from an increase in that tax.
using a lower elasticity factor than is used for PAYE (income increases are
less likely to be reflected in tax payments).
monitoring trends of take-up on tax reliefs in case Revenue need to provide
for higher tax repayments.
3.17 Forecasting non-PAYE income taxes has proven difficult in recent times. [There
is no appropriate macroeconomic driver available to use in the forecasting of
these taxes and so Revenue compute their estimates using a growth “macro”
based on historical trends of tax yields]. Other issues such as the popularity of
24
tax incentives, most notably property based incentives which act as a legal tax
shelter but the take-up of which is difficult to predict and compliance issues on
foot of Revenue’s special investigations have also added to the difficulty in
forecasting non-PAYE income taxes.
Corporation Tax
3.18 Budget 2002 began the process, on a 5 year transitional basis, of bringing
forward the payment date for preliminary corporation tax by seven months,
effectively to a current from a preceding year basis. Therefore, with the payment
arrangements for corporation tax having undergone significant changes over the
last five years coupled with the phased reduction to a standard 12½ per cent tax
rate for trading income generally, the methodology for forecasting corporation
tax was made more difficult during this period.
3.19 The 5 year transition period for the gradual move to a current year payment
basis for corporation tax ended in 2006. The transition arrangements – where
1/5th of the amount due was brought forward in each year – generated cash-flow
gains in each of the transitional years but from 2007 this cash-flow gain will be
lost. It is estimated that corporation tax revenues in 2007 will be approximately
€700 million - €800 million less than they would otherwise have been as a result
of this cash-flow reduction.
3.20 In an effort to improve forecasting methods, the top 50 companies have been
contacted by way of a questionnaire from Revenue’s Large Cases Division
(LCD) in each of the last two years to see if they could forecast the expected
growth in the corporation tax they were likely to pay in year t+1.
3.21 Corporation tax is forecast in the following way:
An estimate of the base year outturn is made.
This projected outturn is then adjusted to take account of any known one-off
factors (LCD survey based or other known factors) likely to impact on the

25
yield in the forecast year and also the effects of changes in previous Budgets
which have been carried forward.
This figure is then multiplied by the growth in nominal GDP in the forecast
year and an elasticity factor, which has tended to be 1 in recent years.
A particular problem with corporation tax however is that just over half of
all corporation tax is due for payment in November. Collection performance
in the preceding months of the year is thus not a reliable guide on the
November outcome.
The figures are then refined to take account of the impact of Budget
measures, if any.
3.22 For the Budget 2007 forecasting round, approximately 25 of the top corporation
tax paying companies made an estimate in mid to late 2006 in relation to their
2007 profits with some of these indicating expected negative growth in their
2007 tax (most of these as a result of once-off factors). In the 2005 survey for
use in Budget 2006 forecasts, those companies that did respond forecast zero
growth in tax payments in 2006 which obviously did not happen. Nevertheless,
the results of the 2006 survey were found useful in helping to determine the tax
forecast for 2007 and were used to enhance Revenue’s forecast methodology,
largely by increasing their knowledge of one-off factors.
Excise Duty
3.23 Vehicle Registration Tax (VRT) is included in excise duty. However, this
component of excise duty is forecast separately. The process involved in
forecasting these separate components is outlined below:
Estimates of the base year outturns for excise duties (less VRT) and for VRT
itself are made.
26
These projected outturns are then adjusted to take account of any known
one-off factors likely to impact on the yield in the forecast year and also the
effects of previous Budgets which have been carried forward.
The base year outturn for excises (excluding VRT but including the €168
million Health Tobacco Levy paid to the Department of Health and
Children) is then multiplied by the forecast increase in the volume of PCE
(excluding cars). The €168m Health Tobacco Levy payment is then stripped
out as it is not classified as an Exchequer tax receipt.
The Revenue Commissioners favour a different approach in respect of
excises other than VRT. Their estimates are usually compiled on the basis of
expected trends in the consumption of goods liable to excise. The
Department of Finance also analyses the Revenue’s trend based excise duty
forecasts thoroughly and has been known to adopt a combination of both
methodologies if it feels it will produce the most reliable forecast.
For VRT, the expected base year outturn is multiplied by the forecast
increase in the price and volume of new car sales.
Both the VRT and excise less VRT figures are then refined to take account
of the impact of any Budget measures.
Stamp Duty
3.24 Stamp duties are charged in respect of legal and financial transactions for which
there is a corresponding document. Most stamp duties are charged ad valorem
(at a certain percentage) of the value underlying the transaction in question.
Where it is not feasible to determine a value on which to base an ad valorem
charge, for example in the case of cheques, drafts and ATM cards, a fixed duty
is levied.
3.25 Table 3.1 shows the percentage breakdown of stamp duty receipts for each of
the years 1999-2006, using Revenue net receipts as the basis for calculation. It is

27
worth noting the increasing percentage of total stamp duty receipts accounted
for by property and within property related transactions, the increasing
importance of receipts from non-residential property transactions.
Table 3.1: Stamp Duty – Percentage Breakdown of Receipts 1999-2006
% of Total Stamp Duty From: 1999 2000 2001 2002 2003 2004 2005 2006
Land & Property
- Residential Property
- Non-Residential Property
60
29
31
62
26
36
55
22
33
58
31
27
65
32
33
71
36
35
75
35
40
82
36
46
Stocks & Shares 25 21 28 27 15 13 12 11
Companies Capital Duty 2 4 6 2 1 1 1 -
Cheques/Bills of Exchange etc 4 4 4 4 6 5 4 3
Insurance & Miscellaneous 9 9 7 8 7 5 4 3
Levy on Financial Institutions - - - - 6 5 4 -
Total 100 100 100 100 100 100 100 100
3.26 For the forecasting exercise, stamp duties are broken down into the following
sub-heads:
Residential Property
Non-Residential/Commercial Property
Stocks and Shares
Insurance Levy
Others (including non-life insurance levy, credit etc. cards & cheques)
3.27 Forecasts of stamp duty receipts attempt primarily to model movements in the
value and turnover of residential and non-residential property market
transactions. However, the available economic indicators are not entirely
satisfactory for predicting movements in property prices and turnover in the
second-hand market, from which the majority of residential property market
stamp duty receipts are derived.

28
3.28 Therefore, the following methodology is used to produce the stamp duty
forecast:
Estimates of the base year outturns for each component are made.
These projected outturns are then adjusted to take account of any known
one-off factors likely to impact on the yield in the forecast year and also the
impact of changes in previous Budgets which have been carried forward.
For residential property, the estimated change for the forecast year in the
volume and price of new house activity is used as a loose proxy for the
change in the level and value of stamp duty-liable transactions; this is
augmented by an (upward) adjustment for the consequential movement into
higher stamp duty bands brought about by the projected increase in house
prices.
On the non-residential8 side the nominal growth in investment in non-
residential construction excluding roads is used to forecast the increase in
yield from this source.
The shares category9 is increased in line with nominal GDP in the forecast
year.
The insurance levy is assumed to remain at the base year level (unless where
otherwise indicated by Revenue).
The others category is grown in line with projected consumer price inflation.
The figures are then refined to take account of the impact of Budget
measures, if any.
8 Revenue use an average growth rate derived from Stamp duty receipts from non-residential property over the past 5 years. 9 Consumer Price Index used by Revenue.

29
Capital Gains Tax (CGT)
3.29 CGT is chargeable on the gains arising from the disposal of assets. Any form of
property, including an interest in a property (lease) is an asset for CGT purposes.
The tax payment is liable once the asset is disposed of. Liabilities arising in the
first 9 months of the year are payable by the end of October that year. Liabilities
arising in the last three months of the year are payable by the end of the
following January.
3.30 There is no agreed methodology for forecasting receipts from CGT. The forecast
difficulties are compounded by the administrative structures under which the tax
operates and under which tax receipts are received at two points in the year
followed significantly later by the returns detailing the reasons for the
underlying liabilities.
3.31 The following approach to forecasting CGT is currently undertaken:
An estimate of the base year outturn for CGT is made.
This projected outturn is then adjusted to take account of any known one-off
factors likely to impact on the yield in the forecast year and also the impact
of changes in previous Budgets which have been carried forward.
This figure is then grown by the forecast rate of increase in nominal GNP in
the forecast year.
The figures are then refined to take account of the impact of Budget
measures, if any.
Capital Acquisitions Tax (CAT)
3.32 CAT comprises gift tax, inheritance tax, discretionary trust tax and probate tax
and very minor amounts in respect of residential property tax and is forecast
using the rate of increase in nominal GNP in the forecast year. In years prior to
Budget 2007, the CPI was used as the multiplier but the Department of Finance
considers that GNP is now a more appropriate growth factor.

30
Customs Duty
3.33 Customs duties are collected on a wide range of goods imported from non-EU
countries. While all customs duties collected are paid into the Exchequer, 75 per
cent of the amount collected is subsequently paid out of non-voted central fund
expenditure to the EU as part of Ireland’s EU budget contribution known as
‘traditional own resources’. The remaining 25 per cent is retained as collection
expenses.
3.34 The forecasting of this tax head is undertaken by the Revenue Commissioners,
with the Department of Finance generally accepting Revenue’s estimate.
However, the Department supplies Revenue with a macro-economic forecast of
the nominal (value) increase in merchandise imports. Forecasting customs duties
has become more difficult in recent years with the introduction of Single
European Authorisation (SEA) arrangements. This allows a company with
branches in different Member States to transact all of their customs business in
one Member State. The Member State which issues the SEA acts as the
Supervising Customs Authority for all Member States in respect of that
authorisation and collects the customs duties in respect of imports into the
various Member States. It then pays over an agreed amount of collection costs
(up to 25 per cent) to the various Member States into which non-EU goods have
been imported. For example, included in the customs receipts figure for 2006
was an amount of €44 million (around 17 per cent of total customs duties
collected in 2006) under an SEA collected on behalf of another Member State.

31
4. Tax Revenue Forecasting Performance
4.1 This section of the report analyses the tax revenue forecasts produced by the
Department of Finance over the period 1999 – 2006. The tax revenue forecasts
are the Budget day projections produced in December of each year for the
following year.
4.2 While tax revenue has outperformed Budget day projections in six of the last
eight years – significantly so in each of the last three years – it is clear that a
number of extraneous factors have had a sometimes significant impact on tax
revenue collection during that time. Such factors are often difficult – if not
impossible – to forecast with any degree of accuracy. In the analysis below,
therefore, the forecasting performance is shown, firstly, on an unadjusted basis
(i.e. no allowance is made for extraneous factors) and secondly, on an adjusted
basis (i.e. after making allowance for exceptional factors). This approach
enables a broad quantification of forecast errors.
Methodology
4.3 In terms of assessing the forecast performance, the approach taken below is to
formally examine the Budget day one-year ahead tax revenue forecasting
accuracy over the 1999 – 2006 period using the following statistical tools:
Mean (forecast) error, where: ME = 1/T*(Σet)
Root mean squared (forecast) error, where: RMSE = [1/T*(Σet2)]½
4.4 The error term for each year is defined as the difference between the outturn and
the forecast, expressed as a percentage of the actual outturn. The ME is the
simple average of forecast errors over the period. This provides an indication of
the direction of forecast errors. However, because but it is affected by both
positive and negative errors, it is not an appropriate tool to quantify the
magnitude of errors. On the other hand, the RMSE – defined as the square root
of the mean of the errors squared – is independent of the error sign and can
therefore be used to quantify the magnitude of the forecast errors. In line with
most of the recent international literature, the analysis below concentrates on the
RMSE measure.
32
Unadjusted Analysis
- Aggregate Tax Revenue
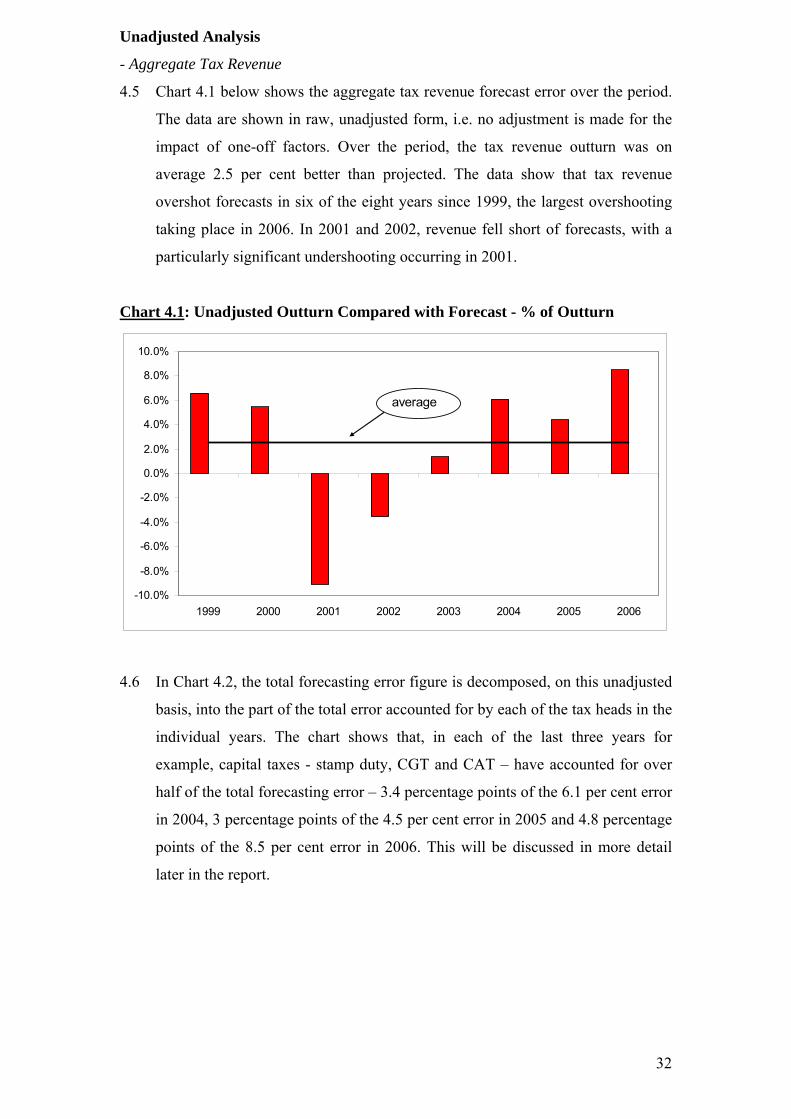
4.5 Chart 4.1 below shows the aggregate tax revenue forecast error over the period.
The data are shown in raw, unadjusted form, i.e. no adjustment is made for the
impact of one-off factors. Over the period, the tax revenue outturn was on
average 2.5 per cent better than projected. The data show that tax revenue
overshot forecasts in six of the eight years since 1999, the largest overshooting
taking place in 2006. In 2001 and 2002, revenue fell short of forecasts, with a
particularly significant undershooting occurring in 2001.
Chart 4.1: Unadjusted Outturn Compared with Forecast - % of Outturn
-10.0%
-8.0%
-6.0%
-4.0%
-2.0%
0.0%
2.0%
4.0%
6.0%
8.0%
10.0%
1999 2000 2001 2002 2003 2004 2005 2006
average
4.6 In Chart 4.2, the total forecasting error figure is decomposed, on this unadjusted
basis, into the part of the total error accounted for by each of the tax heads in the
individual years. The chart shows that, in each of the last three years for
example, capital taxes - stamp duty, CGT and CAT – have accounted for over
half of the total forecasting error – 3.4 percentage points of the 6.1 per cent error
in 2004, 3 percentage points of the 4.5 per cent error in 2005 and 4.8 percentage
points of the 8.5 per cent error in 2006. This will be discussed in more detail
later in the report.

33
Chart 4.2: Composition of Forecast Error – Unadjusted Outturn & Forecast
-10%
-8%
-6%
-4%
-2%
0%
2%
4%
6%
8%
10%
1999 2000 2001 2002 2003 2004 2005 2006
Income Tax VAT Corporation Tax Excise Capital Taxes Customs Total
4.7 The forecasting error, as measured by the RMSE, was 6.1 per cent of the actual
outturn on this unadjusted basis. To put that 6.1 per cent overall RMSE in
context, a paper10 comparing Canadian Budget forecasts with those of other
industrial countries shows that the overall RMSE for tax revenues in Canada
over the nine year period 1995-2003 was 5.7 per cent. In the Netherlands, the
RMSE was 5.4 per cent while in Germany it was 5.1 per cent.
4.8 As mentioned above, capital taxes have become increasingly significant. This is
evidenced by the fact that the RMSE falls to 4.3 per cent, if it is assumed that
capital taxes were on target each year over the period.
4.9 The previous report of the TFMRG showed an average (mean) error of 3.3 per
cent of forecast tax revenue over the 10 year period 1988 – 1997.11
Significantly, tax revenues outperformed their targets in nine of those ten years
while in 1991 tax revenues were exactly on target. This is somewhat at odds
with the period since 1999. The extent of the overall average (mean) errors in
more recent years has generally been greater than over the 1988 – 1997 period
10 IMF Working Paper 05/66 - How do Canadian Budget forecasts compare with those of other Industrial countries? 11 Whereas the previous TFMRG report expressed errors as a percentage of the tax forecasts, this report expresses the errors as a percentage of the actual tax revenue outturns.

34
while tax revenues came in below target in 2001 and 2002, by 9.1 per cent and
3.5 per cent respectively.
- Disaggregate Tax Revenue
4.10 The forecasting performance of each of the individual tax heads over the period
is illustrated in table 4.1. With the exception of PAYE income tax, excise duties
and customs duties, tax revenues from all tax heads have exceeded forecasts.
The largest overshooting occurred in the CGT, stamp duty and non-PAYE
income tax heads (CAT and customs also recorded significant overshooting but
as outlined earlier, these are relatively insignificant in terms of overall tax
revenue).
Table 4.1: Individual Tax Head Percentage Errors (Unadjusted) 1999 – 2006
ME RMSE
Income Tax 1.9 5.4
- PAYE -1.5 5.7
- non PAYE 12.9 17.2
VAT 0.5 4.7
Corporation Tax 0.5 8.1
Excise Duty -1.6 6.8
Stamp Duty 12.6 17.5
CGT 23.3 33.5
CAT 15.3 22.0
Customs Duty -2.5 21.2
Total 2.5 6.1
Total excluding Capital12 Taxes 0.6 4.3
4.11 Ireland is not alone in having such large forecasting errors. For example, in the
case of Canada13, in seven of the eight years from 1996-97 to 2003-04, total
revenues came in ahead of projections, significantly so in the years 1997-98,
1999-00 and 2000-01. The errors – surplus tax revenue as a percentage of actual
tax revenue – in each of those years was 10.1 per cent, 5.4 per cent and 9.3 per
cent respectively and of the main components of total revenue in Canada, both
12 Assuming zero forecast error for CGT, CAT and stamp duty i.e. receipts from these tax heads were on target. 13 Review of Canadian Federal Fiscal Forecasting – Processes and Systems, June 2005
35
personal income tax and corporate tax revenues came in ahead of target in six of
the eight years.
Adjusted Analysis
4.12 The raw data presented above do not take into account extraneous factors which
can impact on tax collection and contribute ex post to a divergence between
forecast and outturn. Over the period concerned, such one-off factors have, in
general, tended to ‘surprise’ on the upside, imparting an upward bias to forecast
errors. The analysis below sets out the main identifiable one-off factors. It
should be noted, of course, that the classification of some factors as one-offs can
be somewhat arbitrary.
4.13 It is worth noting also that there have been significant payment date changes for
a number of tax heads, which have also impacted on tax revenues in recent
years.
4.14 On the basis of best judgement, table 4.2 sets out the main one-off factors
which, when excluded, enable a more accurate like-for-like comparison between
forecast revenue and outturn over the period 2000 – 2006. There were no major
one-off items in 1999.

36
Table 4.2: Total One-off Adjustments One-Off Factors €m
Income tax
Unadjusted
Outturn
€m PAYE Non-
PAYE CT VAT CAT
Stamp
Duty CGT Customs
Adjusted
Outturn
€m
2000 27,072 216 26,856
2001 27,925 227 27,698
2002 29,294 -133 69 38 29,320
2003 32,103 238 63 28 15 31,759
2004 35,581 523 98 21 11 7 76 34,845
2005 39,254 313 -196 16 38 33 39,050
2006 45,539 -66 -37 63 22 52 45,505
*A positive one-off figure in table 4.2 indicates an unexpected or one-off yield which is subtracted
from the unadjusted outturn to get the adjusted outturn figure. Likewise a negative (-) figure indicates
an unexpected loss which is added back to the unadjusted outturn to get the adjusted outturn figure.
4.15 It should be noted that no allowance is made in the analysis below for ongoing
improvements in compliance or for stronger than expected take-up of various
legal tax shelters (such as in property) that pertained over the period. These
factors are difficult to quantify ex ante and have undoubtedly had an impact on
the revenue outturn over the period in question (ceteris paribus contributing to
overshooting in the case of improved compliance and to undershooting in the
case of increased take-up of legitimate tax shelters).
- Aggregate Tax Revenue
4.16 Chart 4.3 below shows the forecast and outturn once the identifiable one-off
factors are taken into account. The mean error declines to 1.9 per cent while the
RMSE declines to 5.9 per cent of actual tax revenue, suggesting some marginal
improvement in the forecasting accuracy.

37
Chart 4.3: Forecast Compared with Adjusted Outturn - % of Outturn
-10.0%
-8.0%
-6.0%
-4.0%
-2.0%
0.0%
2.0%
4.0%
6.0%
8.0%
10.0%
1999 2000 2001 2002 2003 2004 2005 2006
average
4.17 Chart 4.4 combines charts 4.1 and 4.3 so that the improvement in the RMSE,
arising from the factoring in of the adjusted outturn figures, can be easily seen.
The blue bars represent the unadjusted outturns while the red bars represent the
adjusted outturns. 2001 is the only year in which adjusting for one-off factors
worsens the RMSE.
Chart 4.4: Improvement in RMSE with Adjusted Outturn
-10.0%
-8.0%
-6.0%
-4.0%
-2.0%
0.0%
2.0%
4.0%
6.0%
8.0%
10.0%
1999 2000 2001 2002 2003 2004 2005 2006
unadjustedaverage
adjusted average
Blue = Unadjusted Red = Adjusted

38
- Disaggregate Tax Revenue
4.18 The forecasting performance of each of the individual tax heads on the adjusted
basis is illustrated in table 4.3. The results show that even allowing for one-off
factors, there was still overshooting for most tax heads. Of the larger tax heads,
the most noticeable improvement (i.e. lowering of the RMSE) occurs in non-
PAYE income tax, owing to the exclusion of special investigations receipts.
Table 4.3: Individual Tax Head Percentage Errors (Adjusted Outturn) 1999 – 2006
ME RMSE
Income Tax 0.2 5.2
- PAYE -1.2 5.2
- non PAYE 4.4 15.5
VAT 0.4 4.6
Corporation Tax 0.8 8.1
Excise Duty -1.6 6.8
Stamp Duty 11.7 17.1
CGT 22.8 32.9
CAT 9.9 16.9
Customs Duty -4.1 19.8
Total 1.9 5.9
Total excluding Capital Taxes 0.0 4.3
4.19 In summary, there has been a significant overshooting of revenue vis-à-vis
forecasts over the period 1999 – 2006. On an unadjusted basis, the aggregate
forecasting error as measured by the RMSE was 6.1%. This period has seen a
substantial number of exceptional factors which have impacted on tax revenue.
Controlling for these factors – which itself is subject to considerable uncertainty
– results in a slight improvement in the overall forecasting accuracy, with the
RMSE declining to 5.9%. Other factors, such as improved compliance, would
also appear to have had an impact on revenue but these are difficult to quantify.
Chart 1 in Appendix 2 provides details of the composition of the forecast error
on this adjusted outturn basis.
4.20 The 1998 report of the TFMRG concluded that the main reason for the
divergence of the actual tax revenue outturns from the Budget day forecasts was

39
the stronger than expected economic performance. Given the continued strength
of the economy in the years since the 1998 report, controlling for economic
factors was viewed as the next step in attempting to explain the divergence of
tax revenues from forecast in recent years.

40
5. Controlling for Economic Forecasting Errors
5.1 Projections for key macro-economic variables are a key input into the tax
forecasting process (VAT is a function of the nominal growth of consumption;
income tax is a function of employment and earnings growth, etc). Therefore,
economic forecasting errors will have a knock-on impact on the tax forecasts.
5.2 In order to analyse the accuracy of tax forecasting, therefore, it is important to
isolate the impact of economic forecasting errors. This is done through
producing retrospective tax forecasts by application of the most up-to-date
macroeconomic data.14
5.3 A priori it is to be expected that these revised tax forecasts would be closer to
the adjusted outturns for each of the tax heads than the original Budget day
forecasts, i.e. the gap between forecast and outturn would be narrowed and a
proportion of the forecast error could be explained.
5.4 The reasons underlying economic forecasting error, can in broad terms, be
categorised under the following headings:
Changes in Key Exogenous Variables
Economic developments in Ireland are heavily dependent on developments
elsewhere in the global economy (particularly on developments in the OECD
area). Thus, in preparing national economic forecasts key assumptions are made
in relation to key external developments, such as economic growth and trade in
our major trading partners. In Ireland, these assumptions are based on the
forecasts of various international institutions such as the European Commission,
the OECD and the IMF. In framing the Budget forecasts, the assumptions of the
European Commission are particularly important. In these circumstances,
forecasting errors in key exogenous variables will generate errors in the
domestic economic forecasts. As Ireland has become more globally integrated
in recent years, these exogenous variables have become relatively more
important in explaining growth developments in Ireland.
14 It should be noted that further revisions to the currently available economic data are possible.

41
Domestic Policy Assumptions
In Ireland, the Department’s economic forecasts are underpinned by the
conventional no policy change assumptions in relation to a broad range of
economic and social policies. To the extent that actual policies diverge from the
no policy change benchmark, the divergence in the national forecast will be
greater.
Model Error
Medium-term economic forecasting requires assumptions to be made regarding
the economy’s estimated trend or potential growth rate. In other words, once
short-term demand-side fluctuations evaporate, an economy is assumed to grow
in line with its potential, which in turn is determined by assumed increases in the
factors of production together with assumptions regarding the efficiency with
which these factors are used in the production process (total factor productivity).
In these circumstances, an important source of the forecast error relates to
assumptions regarding the economy’s trend or potential rate of growth which
have been incorrect. In an Irish context, there is considerably uncertainty
regarding the potential growth rate of the economy, mainly related to the
openness of the economy together with the extent of structural change that has
occurred over the last decade or so.
Economic Shocks
Economic shocks – both internally and externally generated – can affect the
forecasting performance. Given the size of the Irish economy, together with
fairly concentrated sectoral economic activity (somewhat inevitable for a small
economy), shocks can have a significant impact on overall activity. For
example, the global ICT shock in 2000/2001 had a large unforeseen impact on
the economic performance of the Irish economy over this period, with growth in
2001 being 3.0 percentage points below that forecast in the December 2000
Budget.
Data Revisions
Very often economic forecasts are based on preliminary estimates of macro-
economic variables which are subsequently subject to – in some cases –
significant revisions.

42
5.5 Budget 2006 presented a review of the track record of the Department of
Finance’s Budget economic forecasts against those of other forecasting
agencies. In late 2005 both the IMF and the ESRI15 concluded that all
forecasters of the Irish economy have, particularly in the 1990’s, consistently
underestimated economic growth, mainly due to upside growth surprises. This
was most clearly the case for external demand, which is particularly difficult to
forecast in a globally-integrated economy like Ireland.
Table 5.1 shows the average divergence between the outturn as measured by the
CSO and the annual forecasts for the 1997 to 2004 period produced by a number
of agencies, including the Department of Finance. The results, as measured by
the error level across the different agencies, are very similar. The spread may
well be explained, at least in part, by the timing of publication and the
availability of up-to-date information. Information availability constrains all
forecasts, particularly as short-term forecasting does not readily lend itself to the
application of econometric or model-based analysis. The main conclusion from
this analysis is that performance of the official Department of Finance forecasts
published on Budget day compare well against those of other forecasting
institutions.
Table 5.1 – Economic Forecast Performance 1997-2004
Forecaster Publication Divergence from Outturn16
Central Bank
ESRI
EU Commission
IMF
OECD
Winter Bulletin
Winter QEC
Autumn Forecast
WEO – Sept/Oct
Outlook – Nov/Dec
2.66%
2.92%
2.57%
2.80%
2.62%
Dept. of Finance Budget 2.59%
Methodology
5.6 In order to produce revised tax forecasts for the period 1999-2006, based on the
most up-to-date macroeconomic data available; the following approach was
taken for each of the individual tax heads. 15 The Quarterly Economic Commentary Forecasting Record 1994 to 2004, QEC Autumn 2005. Ireland: Selected Issues, IMF Country Report No. 05/370, October 2005 16 Divergence from the CSO outturn is measured using Root Mean Squared Forecast Error.

43
5.7 When producing the Budget year tax forecasts in December of each year, the
base year outturn – essentially the starting point for the forecast – is not known
and must therefore be estimated. In producing the revised tax forecasts, the
actual base year outturn is used as the starting point.
5.8 The Budget year tax forecasts are based on projections of macroeconomic
activity or what are known as “tax macros” for the forthcoming year. Economic
data can be subject to regular revision for a number of years after the end of the
forecast year and the revised tax forecasts are based on the most recently
available estimates of the actual outturns for these tax macros. A recent Central
Bank technical paper17 shows how initial estimates of GDP and its components
can differ quite significantly from final estimates. The paper found that the final
revision to the growth rate of GDP was 1.5 per cent, almost 20 per cent of
average GDP growth over the sample. The average revision was positive
indicating that initial estimates of GDP tend to be too low. Such revisions create
problems for economic forecasting purposes and hence for tax forecasting
purposes.
5.9 The actual base year outturns and the revised tax macros were then inserted into
the Budget tax forecasting spreadsheets for each of the years to produce revised
tax forecasts.
5.10 The actual base year outturns and the revised tax macros were the only variables
that were updated in the context of producing these revised tax forecasts. Other
issues which may have had an impact on the accuracy of the Budget day tax
forecasts such as the employment and elasticity factors for income tax and the
cost of the Budget day tax packages were not updated. This is because the aim
of the process is simply to control for the base year outturn and the latest
available macroeconomic data to see the impact this would have on the tax
forecasts.
Results
5.11 The results are set out in the table 5.2, which shows the RMSE for each tax head
and for overall tax revenue. These figures include adjustments for once-off
17 Research Technical Paper 10/RT/06 by Colin Bermingham – see Appendix 2 for summary of this paper.
44
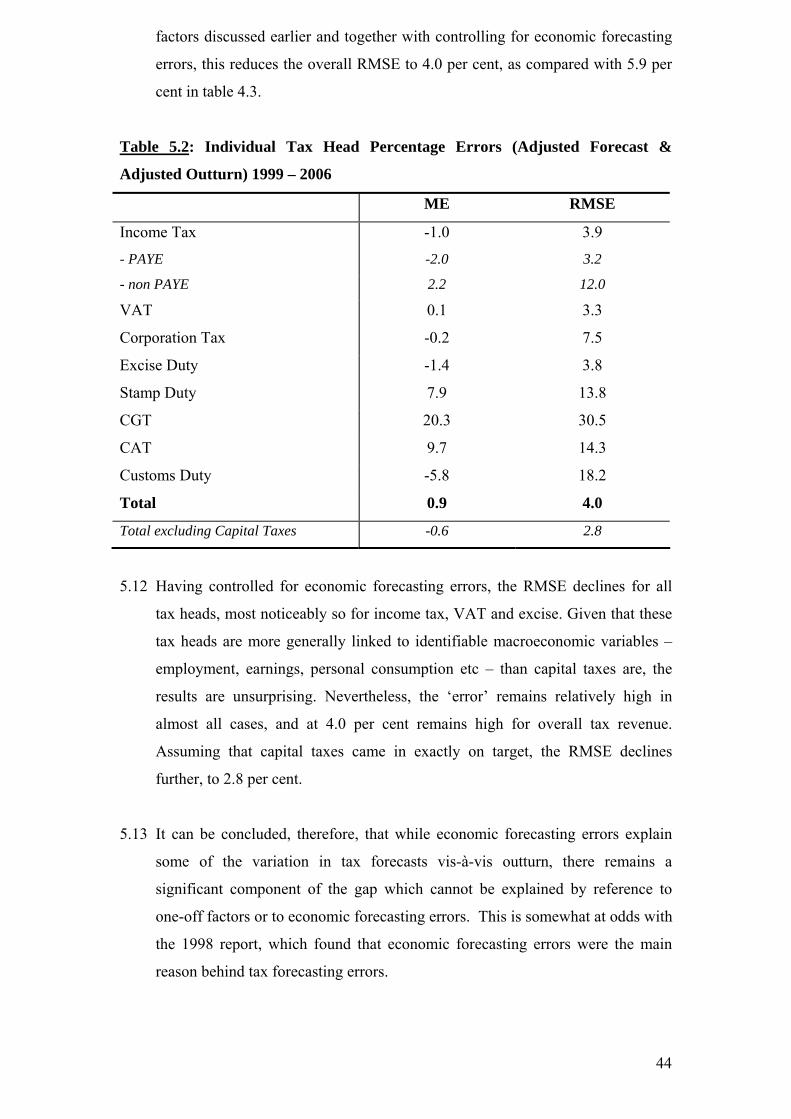
factors discussed earlier and together with controlling for economic forecasting
errors, this reduces the overall RMSE to 4.0 per cent, as compared with 5.9 per
cent in table 4.3.
Table 5.2: Individual Tax Head Percentage Errors (Adjusted Forecast &
Adjusted Outturn) 1999 – 2006
ME RMSE
Income Tax -1.0 3.9
- PAYE -2.0 3.2
- non PAYE 2.2 12.0
VAT 0.1 3.3
Corporation Tax -0.2 7.5
Excise Duty -1.4 3.8
Stamp Duty 7.9 13.8
CGT 20.3 30.5
CAT 9.7 14.3
Customs Duty -5.8 18.2
Total 0.9 4.0
Total excluding Capital Taxes -0.6 2.8
5.12 Having controlled for economic forecasting errors, the RMSE declines for all
tax heads, most noticeably so for income tax, VAT and excise. Given that these
tax heads are more generally linked to identifiable macroeconomic variables –
employment, earnings, personal consumption etc – than capital taxes are, the
results are unsurprising. Nevertheless, the ‘error’ remains relatively high in
almost all cases, and at 4.0 per cent remains high for overall tax revenue.
Assuming that capital taxes came in exactly on target, the RMSE declines
further, to 2.8 per cent.
5.13 It can be concluded, therefore, that while economic forecasting errors explain
some of the variation in tax forecasts vis-à-vis outturn, there remains a
significant component of the gap which cannot be explained by reference to
one-off factors or to economic forecasting errors. This is somewhat at odds with
the 1998 report, which found that economic forecasting errors were the main
reason behind tax forecasting errors.

45
5.14 Of the main tax heads, the largest errors – in RMSE terms – are to be found in
CGT and stamp duty. Even after controlling for one-off factors and stronger
than expected economic performance, the respective RMSEs are 30.5 per cent
and 13.8 per cent. In the previous report of the TFMRG, which covered the
period from the late 1980s to 1997, the performance of CGT and stamp duty was
not analysed to any great extent, given the share of total tax revenue each
accounted for and the fact that any divergence from accuracy in the forecasting
of these tax heads was minor in overall terms. In 1999, for example, these two
tax heads combined accounted for less than 6 per cent of total tax revenue. In
2006 that figure was 15 per cent. One possible reason for the larger errors in
these particular tax heads is the performance of the property market in recent
years and the large increase in tax revenues attributable to that particular sector
of economic activity. Chart 5.1 below shows the composition of the forecast
error on this adjusted forecast and adjusted outturn basis. The chart highlights
the fact that capital taxes account for a large and rising (in recent years)
proportion of the total forecasting error.
Chart 5.1: Composition of Error – Adjusted Forecast & Adjusted Outturn
-8%
-6%
-4%
-2%
0%
2%
4%
6%
8%
10%
1999 2000 2001 2002 2003 2004 2005 2006
Income Tax VAT Corporation Tax Excise Capital Taxes Customs Total
5.15 It is worth noting that the Irish economy has gone through a period of significant
structural change in the last decade. Up until the early years of this decade,
economic growth was characterised by large increases in manufacturing output
46
and employment as well as by a large contribution from net exports. However,
more recently, labour intensive domestic demand has become the main driver of
economic growth. Construction has become much more important to the
economy; its contribution as a percentage of GDP is now two and a half times
greater than it was ten years ago and this has obviously impacted to a great
degree on the sources of tax revenue.
5.16 There has also been a strong surge in the numbers of people employed. A large
increase in labour supply has been driven by three main factors:
the natural increase in the population entering the working-age cohort;
increased labour force participation rates, particularly for females; and
considerable inward migration.
This shift in the demographic profile has been a positive contributor towards
economic growth but also to tax revenue growth. However, these demographic
factors have been explicitly controlled for in the forecasts of economic activity
and hence in the tax forecasts. For example, income tax is partly driven by
increases in employment which is impacted upon by, among other things, the
three variables mentioned above: natural increase, increased participation and
migration. In recent years our Budget forecasts for employment have tended to
underestimate the numbers in work but by retrospectively applying revised
macroeconomic variables, including revised employment figures, the impact of
this increased employment is controlled for.

47
6. Retrospective Forecasting using Alternative Methodologies
6.1 This section of the report gives consideration to the impact of using alternative
forecasting methodologies for the following tax heads: stamp duty, VAT, CGT
and corporation tax, three of which account for the largest errors in terms of the
six main tax heads.
6.2 The buoyancy of the property market including both residential and non-
residential elements has undoubtedly had a positive impact on tax receipts in
recent years. From a forecasting point of view it has contributed in large part to
the excesses over target of stamp duty and to a lesser extent CGT. Ireland is not
alone in this regard. Internationally, buoyant revenues associated with a strong
residential property market performance (output and price) in many countries
have driven a wedge between overall revenue and the economic cycle.18
Ireland, where activity in the housing market has been especially buoyant over
the period covered by this report, is a case in point. As outlined earlier, stamp
duty and CGT receipts together have risen from less than 6 per cent of total tax
revenue in 1999 to 15 per cent in 2006 (not all of these developments relate to
housing market developments – the strength of the commercial property market
has also been a large contributory factor). Earlier analysis showed that the
RMSE for these tax heads is high and these have contributed – in no small part –
to the overshooting of overall tax revenue in recent years.
6.3 Therefore one of the aims of this chapter is to try to account for the strong
property market performance, particularly in the housing sector and adjust for it
in the tax forecasts.
Housing Market Developments in Ireland (1999 – 2006)
6.4 The housing market in Ireland has been particularly buoyant over the period in
question. Table 6.1 shows for each year the number of new house completions
as well as the annual rate of inflation in the new and existing homes sectors.
18 See, for instance, Richard Morris and Ludger Schuknecht Structural balances and revenue windfalls: the role of asset prices revisited, ECB Working Paper 737.

48
Table 6.1 – House Completions/Price Developments 1999-2006
Completions Price Inflation
New Houses New Houses Existing Houses
1999 46,512 18.5 21.4
2000 49,812 13.9 16.7
2001 52,602 8.1 8.2
2002 57,695 8.3 10.5
2003 68,819 13.4 16.3
2004 76,954 11.0 11.2
2005 * 80,957 10.8 12.1
2006 * 93,419 10.6 12.4
Source: Department of Environment, Heritage and Local Government.
* For technical reasons, around 5,000 units attributed to 2006 were actually completed in 2005.
6.5 In terms of activity, well over half a million houses have been built over the
period, a gross increase of around one-third in the housing stock. While less
information is available regarding activity in the existing homes market, other
available evidence suggests strong activity in this segment of the market over
the period.
6.6 In relation to price trends, house price inflation was particularly dynamic over
the period. For new houses, the national average price rose from €125,302 in
1998 to €305,637 last year, resulting in an annual average inflation rate of just
under 12 per cent. The national average price of an existing house rose from
€134,529 in 1998 to €353,104 last year, resulting in an annual average inflation
rate of over 13 per cent.
Revenue from the Housing Market
6.7 Developments in the housing market affect tax revenue both directly and
indirectly.
6.8 In terms of the direct channels:
VAT at the reduced rate (13.5 per cent) is payable on new housing output;
Stamp duty is payable on:

49
new houses in certain circumstances, for example, when purchased by
investors and by the owner-occupiers of large houses;
sales of existing homes/second-hand homes. There were exemptions for
first-time buyers where the value of the house was below a certain price
level and reduced rates for houses above this threshold but the
introduction of recent legislation means that first-time buyers no longer
pay stamp duty on the purchase of second-hand homes, no matter what
the cost. However this is not relevant to the forecasting performance
between 1999 and 2006;
CGT is payable on disposals of properties, other than principal private
residences.
6.9 In terms of indirect effects, new housing output generates labour and investment
income (i.e. wages and profits) upon which taxes are levied. The spending of
this income generates further tax revenue as well as multiplier effects. In
addition, wealth effects arising from higher property prices can affect the
consumption patterns of existing homeowners, although evidence of this is
limited in Ireland.19 Furthermore, the savings ratio in Ireland has remained
relatively stable in recent years, which lends support to the hypothesis that there
has been no real wealth effect. Of course, construction sector companies will
also pay corporation tax. In light of the difficulty in estimating indirect effects
(as well as their likely magnitude) our analysis concentrates on the direct
revenue sources.
Stamp Duty
- Current Forecasting Approach
6.10 Stamp duty is payable on transactions for which a document is ‘stamped’.
Receipts emanate predominantly from residential and non-residential property
market transactions and equity market transactions also. Other items liable to
stamp duty include financial cards such as ATM cards, debit and credit cards
and some insurance policies.
19 See, for instance, Nuala O’Donnell Housing Wealth and Consumption in Ireland, Central Bank Quarterly Bulletin Number 1, 2007

50
6.11 A priori, in the absence of changes to the regime, stamp duty revenue from
residential properties in a particular period should reflect:
number and price of new houses sold to investors. Generally, first-time
buyers will not pay stamp duty on a new home, where it will be their
principal private residence; owner-occupiers will not pay stamp duty if there
is a floor certificate and if there is no floor certificate stamp duty will be
charged on either the value of the site or on 25 per cent of the price less
VAT (whichever is greater).
volume of turnover of second-hand homes.
price of second-hand homes
rate drift.
6.12 GDP is a value added concept – the sale of an existing house does not generate
value added, with the exception of the solicitor/estate agent fees generated by
the sale. This means that it is simply a transfer of ownership of an existing asset.
Hence, macro-economic forecasts make no allowance for sales of existing
homes. In terms of stamp duty, this lack of a macro-economic driver hampers
forecasts of this tax head.
6.13 At present, in the absence of any suitable alternative, the forecast change in the
volume and price of new house activity is used as a loose proxy for the change
in the level and value of stamp duty liable transactions in the residential property
market (both new and existing houses). This is augmented by an (upward)
adjustment for the consequential movement into the higher stamp duty bands
brought about by the projected increase in house prices, known as “rate drift”.
6.14 To estimate the impact of "rate drift", details of house purchase transactions
which are recorded on Revenue’s SDAS20 computer system for stamp duties are
used. The relevant details are the consideration (price), the rate of stamp duty
and the amount of stamp duty. Transactions are identified from the most recent 20 The SDAS computer system consists of information obtained on the day a document is presented for stamping. It consists, in effect, of details of the consideration or value of the underlying stamping transaction, whether exemption applies and otherwise the stamp duty amount.

51
complete year in a set of price ranges where the consideration lies between the
value of each rate threshold and a specific point below the threshold. That point
is a consideration value which, if increased by the projected percentage price
increase in the macro for new housing, would bring it up to the level of the rate
threshold value. The difference between the total stamp duty at the existing rate
and the total stamp duty at the new higher rate on these transactions is then
calculated. The average rate of stamp duty paid by buyers under existing prices
is first established. Then, after increasing these prices by applying the projected
macro price increase for the forecast year, the same average rate of stamp duty is
applied and the result is scaled up by the ratio of the new higher duty rate
(exceeding the threshold) to the existing rate. The difference between the two
amounts of stamp duty is the additional yield of stamp duty attributable to "rate
drift" at that particular rate threshold. In effect, this is an estimate of an elasticity
factor for stamp duty, where price increases drive transactions into different
bands.
6.15 For non-residential property, the forecasts are based on the change in the
nominal level of other building and construction investment excluding roads.
6.16 These methodologies were used for the first time in the Budget 2006 forecasts.
While there was no improvement to the forecasts in 2006 in terms of the
forecast error, theoretically, it would appear to make more sense to use this
disaggregated approach rather than using nominal GDP as the sole driver of
aggregate stamp duty receipts (as had been used up to Budget 2005).
- Alternative Forecasting Approach
6.17 The alternative forecasting approach applied in order to retrospectively forecast
residential and non-residential stamp duty receipts from 1999 onwards is to use
the methodology first adopted in the Budget 2006 forecasts. The results are
shown in table 6.2. The analysis shows a significant improvement in the
forecasting performance over the period, with the overall RMSE almost halving.
Nevertheless, the error remains significant in some years, most notably 2003 and
2006.
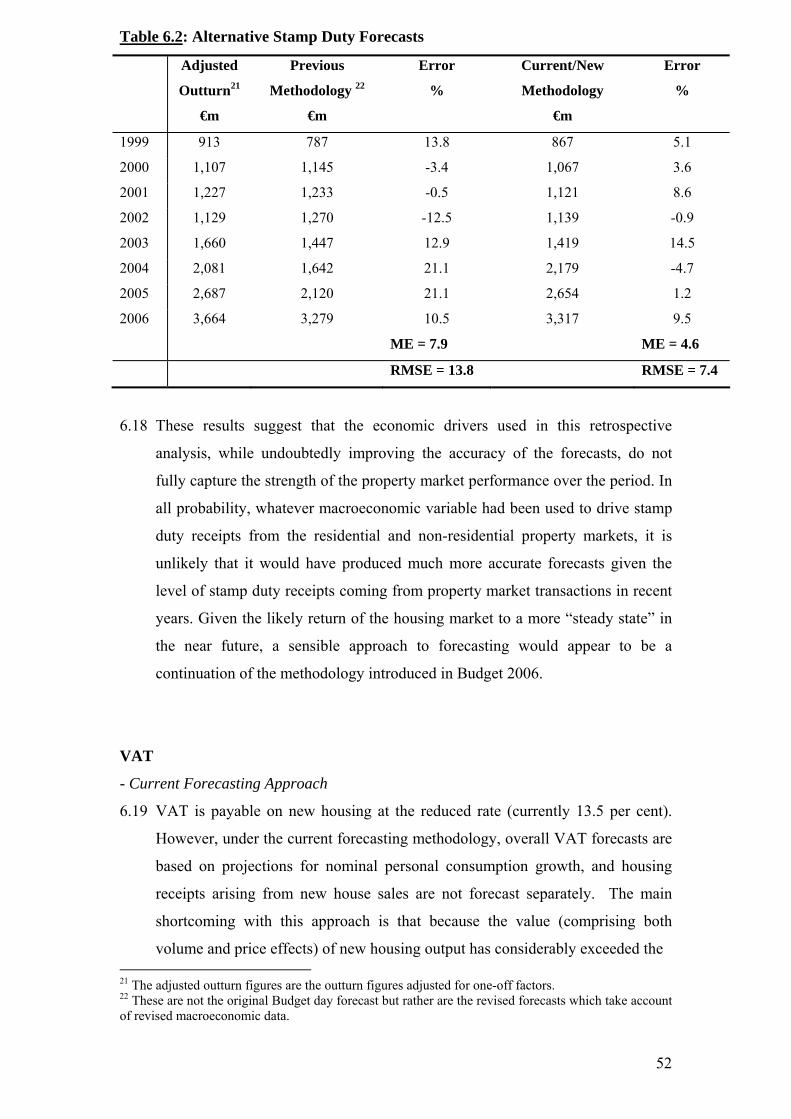
52
Table 6.2: Alternative Stamp Duty Forecasts
Adjusted
Outturn21
€m
Previous
Methodology 22
€m
Error
%
Current/New
Methodology
€m
Error
%
1999 913 787 13.8 867 5.1
2000 1,107 1,145 -3.4 1,067 3.6
2001 1,227 1,233 -0.5 1,121 8.6
2002 1,129 1,270 -12.5 1,139 -0.9
2003 1,660 1,447 12.9 1,419 14.5
2004 2,081 1,642 21.1 2,179 -4.7
2005 2,687 2,120 21.1 2,654 1.2
2006 3,664 3,279 10.5 3,317 9.5
ME = 7.9 ME = 4.6
RMSE = 13.8 RMSE = 7.4
6.18 These results suggest that the economic drivers used in this retrospective
analysis, while undoubtedly improving the accuracy of the forecasts, do not
fully capture the strength of the property market performance over the period. In
all probability, whatever macroeconomic variable had been used to drive stamp
duty receipts from the residential and non-residential property markets, it is
unlikely that it would have produced much more accurate forecasts given the
level of stamp duty receipts coming from property market transactions in recent
years. Given the likely return of the housing market to a more “steady state” in
the near future, a sensible approach to forecasting would appear to be a
continuation of the methodology introduced in Budget 2006.
VAT
- Current Forecasting Approach
6.19 VAT is payable on new housing at the reduced rate (currently 13.5 per cent).
However, under the current forecasting methodology, overall VAT forecasts are
based on projections for nominal personal consumption growth, and housing
receipts arising from new house sales are not forecast separately. The main
shortcoming with this approach is that because the value (comprising both
volume and price effects) of new housing output has considerably exceeded the 21 The adjusted outturn figures are the outturn figures adjusted for one-off factors. 22 These are not the original Budget day forecast but rather are the revised forecasts which take account of revised macroeconomic data.

53
growth in nominal consumption over the period 1999-2006, ceteris paribus this
approach will tend to result in an undershooting of overall VAT receipts.
- Alternative Forecasting Approach
6.20 In an attempt to overcome the main short-coming with the current approach to
VAT forecasting, the following alternative approach is used. Firstly, the VAT
base was separated into new housing and non-housing components. However,
this was not straightforward. The 1998 post-Budget VAT base contained an
estimate of the VAT yield likely to come from “building”. It was only in 2001
that the post-Budget VAT base was broken further into separate components of
“building” and estimates of the receipts likely to come from new housing were
given. As a result estimates of the likely yield from new housing had to be
constructed for the years prior to 2001 using the 2001 proportionate figures. It
was then assumed that the outturn for VAT receipts was broken down in the
same proportion as it was in the post-Budget VAT base estimates.
6.21 This approach highlights the difficulties involved in getting data on the amount
of VAT coming from new housing. While the Post-Budget VAT base supplied
by Revenue breaks down the overall Budget target for VAT into yields likely to
come from goods subject to the zero, lower (13.5 per cent) and standard (21 per
cent) rates, there is no breakdown of actual VAT coming from different sectors
of the economy (new housing etc). A detailed breakdown of the actual VAT
yield would be most useful in forecasting VAT receipts from new housing.
6.22 New housing VAT is then retrospectively forecast by applying the new house
volume and price data from The Department of the Environment, Heritage and
Local Government to the previous years estimated VAT receipts from new
housing. The non-new housing VAT is retrospectively forecast using nominal
consumption as before. The two retrospective figures are then amalgamated to
form the overall retrospective VAT forecast which is then compared with the
adjusted VAT outturn.
6.23 The results are shown in table 6.3. The results indicate that this alternative
forecasting methodology is no better than the current forecasting methodology
insofar as the RMSE, at 3.3 per cent, remains the same. The mean error becomes
more negative under the alternative methodology, suggesting that had this

54
methodology been used, VAT would have undershot (i.e. overly-optimistic
forecasts) in four of the eight years in the period.
Table 6.3: Alternative VAT Forecasts
Adjusted
Outturn23
€m
Current
Methodology24
€m
Error
%
Alternative
Methodology
€m
Error
%
1999 6,194 6,236 -0.7 6,309 -1.9
2000 7,470 7,321 2.0 7,361 1.5
2001 7,920 8,526 -7.6 8,556 -8.0
2002 8,885 8,905 -0.2 8,985 -1.1
2003 9,721 9,809 -0.9 10,081 -3.7
2004 10,672 10,384 2.7 10,580 0.9
2005 12,089 11,757 2.7 12,021 0.6
2006 13,385 12,986 3.0 13,169 1.6
ME = 0.1 ME = -1.3
RMSE = 3.3 RMSE = 3.3
6.24 While theoretically it would appear to make more sense to forecast VAT from
new house purchases separately, particularly with the housing market likely to
reach a more “steady-state” level in the near future, retrospective analysis shows
no improvement in terms of lowering the RMSE. However it is worth noting the
improvement in the RMSE in the last three years.
6.25 Therefore the current approach to forecasting VAT receipts should be
complemented by this alternative approach whereby the new housing element of
VAT is forecast separately. The relative merits of both approaches should be
examined on an ongoing basis.
Capital Gains Tax
6.26 A priori, CGT revenue from property transactions should reflect:
the number of investment properties disposed of over the period in question.
23 The adjusted outturn figures are the outturn figures adjusted for one-off factors 24 These are not the original Budget day forecast but rather are the revised forecasts which take account of revised macroeconomic data.

55
the extent of capital appreciation over the period in which the asset was held.
6.27 In terms of CGT, as already mentioned, a number of institutional features make
this a particularly difficult tax head to forecast. As with stamp duty receipts,
revenue will be affected by the degree of turnover, which is not possible to
forecast with accuracy. Moreover, as the actual capital gain is a function of price
developments in the period between when the asset is purchased and when it is
disposed of; disposals in any particular period will reflect a mix of properties
each with different capital gains.
6.28 In the absence of a suitable alternative, receipts from this tax head have been
forecast to grow more or less in line with nominal economic growth in recent
years with compensating downward adjustments for potential cooling in the
property markets.
6.29 CGT receipts do not have as consistent a relationship with economic growth as,
for example, income tax or VAT. They are affected by movements in the asset
markets (property and shares mostly). Activity in these markets is prone to more
pronounced movements in volumes/prices than in the wider economy and is
therefore less predictable. Receipts are dependent on the one-off decisions from
year to year of numerous individuals and institutions in relation to their
investments. The behaviour of these individuals is difficult to predict.
6.30 Even if had been possible to overcome these various difficulties and come up
with a methodology which would have forecast the significant year-on-year
increases in CGT receipts seen in recent years, it is questionable whether such a
technical forecast would have been considered credible. In light of this, no
change to the current forecasting methodology is proposed at this time.
Corporation Tax
- Current Forecasting Approach
6.31 Corporation tax is currently forecast to grow in line with nominal GDP and an
elasticity factor which has been 1.0 in recent years. In some of the years prior to
2003, the elasticity factor used was 2.0. There have been a number of important
changes to the corporation tax regime over this period, most notably the phased

56
reduction to a standard 12½ per cent tax rate for trading income generally but
also the decision to bring forward the payment date for preliminary corporation
tax by seven months, effectively to a current year payment basis. These changes
have made the job of forecasting receipts much more difficult. This is reflected
in the large errors for this tax head.
However, Ireland is not alone in having difficulties accurately forecasting
corporation tax receipts. In the UK25 for example, the average absolute error of
the forecasts made over the 1993 – 2003 period was 7.5 per cent of total
corporation tax receipts, a substantial error as noted by the Institute for Fiscal
Studies (IFS). Even if growth in corporate profits (the macroeconomic variable
used to drive corporation tax in the UK) had been forecast correctly the average
absolute error over the period would have been 6.4 per cent of actual
corporation tax revenues.
- Alternative Forecasting Approach
6.32 As noted above, the proxy used for the corporate tax base in the UK is corporate
profits, and so the forecast growth in corporate profits is the input to their
model. Therefore it was decided to look at this approach to forecasting
corporation tax in an Irish context, using gross operating surplus growth rates
from the CSO National Accounts rather than nominal GDP in order to re-
forecast.
25 Institute for Fiscal Studies (IFS) Working Paper 03/21.

57
Table 6.4: Alternative Corporation Tax Forecasts
Outturn
€m
Current
Methodology
€m
Error
%
Alternative
Methodology
€m
Error
%
1999 3,441 3,027 12.0 2,909 15.5
2000 3,887 4,184 -7.6 3,874 0.3
2001 4,156 4,322 -4.0 4,072 2.0
2002 4,803 5,257 -9.5 4,795 0.2
2003 5,161 5,007 3.0 5,113 0.9
2004 5,234 5,538 -5.8 5,487 -4.8
2005 5,688 5,675 0.2 5,612 1.3
2006 6,720 6,070 9.7 6,013 10.5
ME = -0.2 ME = 3.2
RMSE = 7.5 RMSE = 6.9
6.33 The results in table 6.4 show only a slight improvement in the overall level of
forecasting accuracy with the RMSE decreasing to 6.9 per cent from 7.5 per
cent. However there are some significant improvements for individual years,
most notably in each of the years 2000 to 2003.
6.34 It should be noted that when preparing the Budget forecasts using nominal GDP
growth for the years 200026-2002, the elasticity factor used with respect to
nominal GDP was 2.0, meaning that for every 1 per cent growth in the level of
nominal GDP, it was estimated that receipts from corporation tax would grow
by 2 per cent. Under the new methodology where we retrospectively apply gross
operating surplus as the driver of receipts, the elasticity factor we used was 1, on
the basis that for every 1 per cent growth in profits, corporation tax receipts
would increase by 1 per cent. This seems a reasonable assumption in the
circumstances, given that corporation tax receipts are based on the profits of
companies and not the nominal growth in GDP per se.
6.35 While this approach would have produced more accurate forecasts, particularly
in the years 2000-2003, it would be unwise to draw any definitive conclusions
regarding the future approach to forecasting corporation tax receipts on the basis
26 The elasticity factor used in the 1999 Budget corporation tax forecast was 1.5.

58
of an analysis covering a period in which there have been a number of important
changes to the corporation tax regime.
6.36 Therefore, similar to the recommendation made with regard to the VAT
forecasting methodology, it is recommended that this alternative corporation tax
forecasting approach, based on the use of gross operating surplus growth rates as
the driver of receipts should be used in conjunction with the current
methodology.
Summary
6.37 The buoyancy of the property market, particularly the housing market has been
partly responsible for the de-coupling of tax revenue growth from nominal GDP
growth in Ireland in recent years. This is similar to the experience in some other
countries that have also experienced strong housing market dynamics.
6.38 In this analysis, we have considered alternative approaches for forecasting
property-related tax revenue and corporation tax revenue also. Purchases of new
houses are liable for VAT, and hence developments in new housing output and
price should, in principle, affect VAT payments. While the incorporation of
these variables into the analysis does not improve the forecast performance and
VAT forecasts are subject to the lowest error, once economic errors are
controlled for, theoretically it would appear to make more sense to forecast the
new housing element of VAT separately. Therefore a complementary approach
to VAT forecasting is suggested.
6.39 In terms of stamp duty forecasts, we recommend a continuation of the new
approach introduced in Budget 2006, namely the incorporation of new housing
output and price forecasts as a loose proxy for developments in the second-hand
housing market and the use of projected growth in other building and
construction investment excluding roads as the driver of non-residential property
market receipts.
6.40 On a cautionary note, it is clear that the property market has been in a transition
phase in recent years, with prices and volumes adapting to new equilibrium
conditions. Continued double-digit growth in prices and volumes is not
sustainable, and the forecasting of revenues from this market warrants a prudent

59
approach, as has been implemented in recent years. We are also conscious of
recent developments in the property market, where activity appears to have
slowed somewhat and prices seem to have stabilised. These developments
support the continuation of a cautious approach. Finally, we feel it would be
worthwhile to conduct further analysis on these property-related tax heads in the
near future, as the market appears to be entering a more equilibrium phase.
6.41 With regard to corporation tax, while the retrospective use of gross operating
surplus rather than nominal GDP growth as the driver of corporation tax gave
more accurate forecasts, the analysis was confined to a period in which
significant structural changes to the corporation tax system have taken place.
Therefore, it would be unwise to draw any definite conclusions on the basis of
this analysis and so, as with VAT, a complementary approach to the current
methodology is suggested.
6.42 Table 6.5 shows the overall results based on these alternative forecasting
methodologies for stamp duty, VAT and corporation tax. The overall RMSE
declines further, from 4.0 per cent to 3.4 per cent. Chart 2 in Appendix 2
decomposes the forecast error based these alternative forecasting methodologies,
into the proportion of the error accounted for by each tax head.
Table 6.5: Individual Tax Head Percentage Errors (Alternative Forecasting
Methodologies) 1999 – 2006
ME RMSE
Income Tax -1.0 3.9 - PAYE -2.0 3.2
- non PAYE 2.2 12.0
VAT -1.3 3.3
Corporation Tax 3.2 6.9
Excise Duty -1.4 3.8
Stamp Duty 4.6 7.4
CGT 20.3 30.5
CAT 9.7 14.3
Customs Duty -5.8 18.2
Total 0.8 3.4
Total excluding Capital Taxes -0.4 2.7

60
7. Conclusions 7.1 There has been a significant divergence between forecast tax revenue and the
actual tax revenue outturn over the period 1999 – 2006. The overall RMSE is
found to be 6.1 per cent of the actual tax revenue outturn over this period.
7.2 Controlling for one-off factors reduces the RMSE slightly, to 5.9 per cent.
Controlling further, for economic forecasting error, the underlying RMSE
declines to 4.0 per cent. While this is an improvement, the overall error can still
be deemed significant. The previous report of the TFMRG found that economic
forecasting errors were primarily responsible for the divergence of tax revenues
from forecast, however, this conclusion cannot be reached in this report.
7.3 In terms of the main taxes, the largest forecasting errors are to be found in CGT,
stamp duty and corporation tax. Even after controlling for once-offs and
economic forecast errors, the RMSE for these tax heads remains large, at 30.5
per cent, 13.8 per cent and 7.5 per cent respectively. Retrospective forecasting
of VAT, stamp duty and corporation tax using alternative methodologies further
reduces the overall RMSE to 3.4 per cent.
7.4 The lack of appropriate economic drivers for stamp duty and CGT coupled with
the exceptionally strong performance of the property market in recent years have
been large contributory factors in the excess over target of revenue from these
sources.
7.5 Attempting to control for the property market performance in producing
retrospective forecasts of stamp duty improves the forecast error significantly
and so the current approach to forecasting stamp duty, introduced in Budget
2006, is one which should be maintained, particularly as the property market
heads towards a more “steady-state”.
7.6 While VAT has been the best performer in terms of forecast accuracy over the
period and while the retrospective use of a disaggregated forecasting approach
did not improve the forecasting accuracy, projecting VAT from new housing
separately should be done in tandem with the current aggregate forecasting
approach going forward.

61
7.7 Corporation tax has proved a difficult tax to forecast, not just in Ireland but in
other jurisdictions too. In the Irish context, the significant structural changes to
the corporation tax regime which have taken place in recent years – rate
decreases, payment date changes etc – have undoubtedly made the task of
forecasting more difficult. Retrospectively forecasting corporation tax using
gross operating surplus growth rates rather than nominal GDP growth improved
the forecasting accuracy slightly. However, as this analysis was carried out over
a timeframe in which there have been significant structural changes to this tax
head, it is recommended that this approach be used in conjunction with the
current methodology.
Table 7.1: RMSE under 4 Scenarios
Unadjusted
Forecast &
Outturn
Adjusted
Outturn
Adjusted
Forecast &
Outturn
Retrospective
Forecasts
Income Tax 5.4 5.2 3.9 3.9 - PAYE 5.7 5.2 3.2 3.2
- non PAYE 17.2 15.5 12.0 12.0
VAT 4.7 4.6 3.3 3.3
Corporation Tax 8.1 8.1 7.5 6.9
Excise Duty 6.8 6.8 3.8 3.8
Stamp Duty 17.5 17.1 13.8 7.4
CGT 33.5 32.9 30.5 30.5
CAT 22.0 16.9 14.3 14.3
Customs Duty 21.2 19.8 18.2 18.2
Total 6.1 5.9 4.0 3.4 Total excluding Capital Taxes 4.3 4.3 2.8 [2.7]

62
Appendices

63
Appendix 1: Long-Run Aggregate Tax Elasticity In the 1998 report of the TFMRG, an econometric evaluation of the relationship
between aggregate tax revenue growth and economic growth confirmed the existence
of a long-run relationship between GDP and total tax revenue and suggested an
elasticity of 1.127. This means that for every 1 per cent increase in the nominal level of
GDP, tax revenues increase by 1.1 per cent.
A similar, further econometric evaluation has been carried out by the ESRI in order to
ascertain whether the previous estimate of 1.1 is still appropriate.
The results of a simple equation regressing total tax revenue on nominal GDP are
given below.28 The equation is estimated over the thirty year period, 1976 to 2006. It
should be noted that changes in the tax rates that have taken place over the period are
not controlled for in the equation. The results imply a long run tax to GDP elasticity
of 0.9, which is significantly lower than the European Commission estimate.
Estimate of the Aggregate Tax-GDP Elasticity: 1976 - 200629
LOG(Tax) = A1+A2*Log(GDP_Nom) NOB = 30 NOVAR = 3 NCOEF = 3 RANGE: 1976A to 2006A RSQ = 0.997844 CRSQ = 0.997685 F(1/0) = 6248.909666 PROB>F = 0 SER = 0.042193 SSR = 0.048067 DW(0) = 1.620536 COND = 28.926771 MAX:HAT = 0.113921 RSTUDENT = 1.925863 DFFITS = 0.690543 COEF ESTIMATE STER TSTAT PROB>|T| A1 -0.281507 0.823672 -0.34177 0.73517 A2 0.908583 0.07233 12.561687 0 AR1.1 0.86701 0.055515 15.617612 0
However estimating this as a single equation over this thirty year period is
problematic. The results of a Chow test indicate that there was a break in the
relationship around 1988/1989. Furthermore sub-sample estimation indicates that this
estimate of 0.9 is biased downwards. Chart 1 shows the share of total tax revenue to
27 This econometric evaluation confirmed the European Commission estimate of 1.1 produced around the time of the 1998 Tax Forecasting Methodology Group Report. 28 The data for total tax revenue are taken from successive Finance Accounts and the GDP data come from the CSO with the estimate for 2006 from the Spring 2007 Quarterly Economic Commentary. 29 The statistical results can be read as follows: RSQ and CRSQ are the R-squared and the corrected R-squared statistics, F(/) is the F-test for the regression and PROB>F is the significance of the F-test, SER gives the standard error of the equation, and DW (O) is the Durban-Watson statistic.
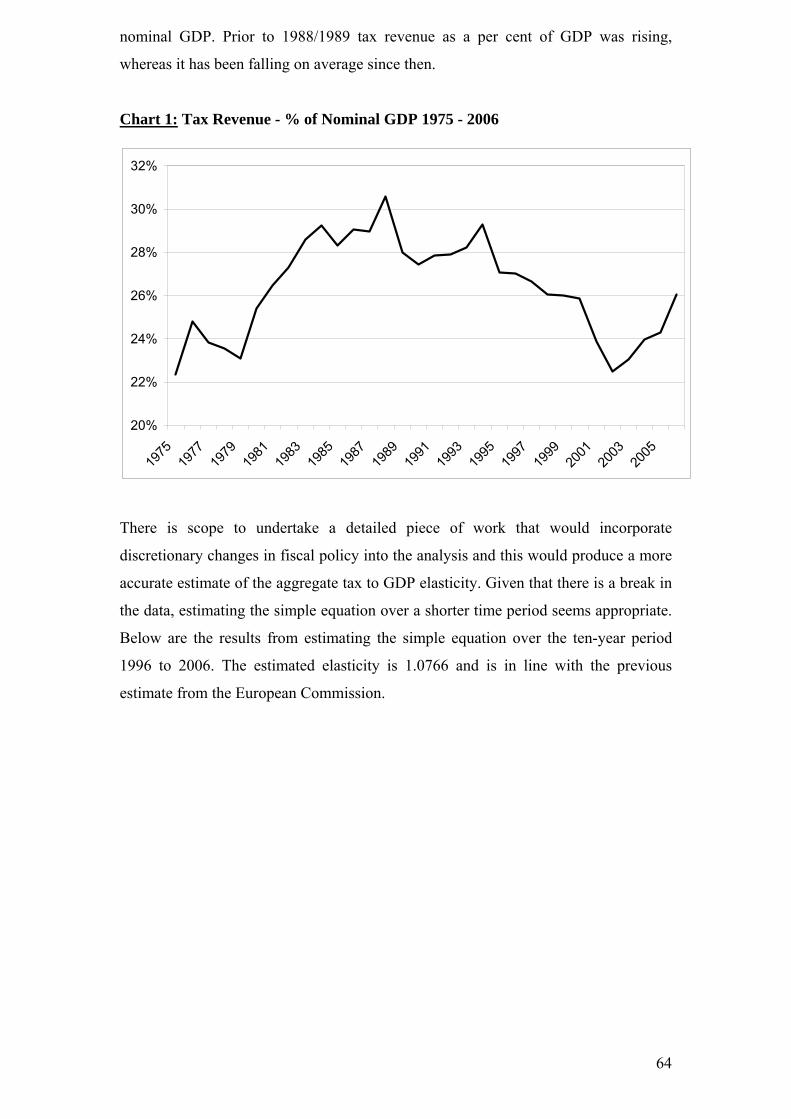
64
nominal GDP. Prior to 1988/1989 tax revenue as a per cent of GDP was rising,
whereas it has been falling on average since then.
Chart 1: Tax Revenue - % of Nominal GDP 1975 - 2006
There is scope to undertake a detailed piece of work that would incorporate
discretionary changes in fiscal policy into the analysis and this would produce a more
accurate estimate of the aggregate tax to GDP elasticity. Given that there is a break in
the data, estimating the simple equation over a shorter time period seems appropriate.
Below are the results from estimating the simple equation over the ten-year period
1996 to 2006. The estimated elasticity is 1.0766 and is in line with the previous
estimate from the European Commission.
20%
22%
24%
26%
28%
30%
32%
1975
1977
1979
1981
1983
1985
1987
1989
1991
1993
1995
1997
1999
2001
2003
2005

65
Estimate of the Aggregate Tax-GDP Elasticity: 1996 - 2006
LOG(Tax) = A1+A2*Log(GDP_Nom) NOB = 10 NOVAR = 3 NCOEF = 3 RANGE: 1996A to 2006A RSQ = 0.980887 CRSQ = 0.975427 F(1/0) = 179.624651 PROB>F = 0 SER = 0.044923 SSR = 0.014126 DW(0) = 1.085181 COND = 109.958117 MAX:HAT = 0.478842 RSTUDENT = -2.026944 DFFITS = 1.232151 COEF ESTIMATE STER TSTAT PROB>|T| A1 -0.281507 0.823672 -0.34177 0.73517 A2 0.908583 0.07233 12.561687 0 AR1.1 0.86701 0.055515 15.617612 0
Chart 2: Actual Aggregate Tax to GDP Elasticity
Chart 2 plots the actual annual aggregate tax to GDP elasticity. Over the medium term
the elasticity average is 1.1. However it is clear from the graph that the elasticity can
deviate significantly from this average in individual years and indeed for periods of
years. From the graph, we can see that between 1996 and 2003 the actual elasticity
was below the average, while in more recent years it has been above.
0.00
0.20
0.40
0.60
0.80
1.00
1.20
1.40
1.60
1.80
2.00
2.20
1976
1978
1980
1982
1984
1986
1988
1990
1992
1994
1996
1998
2000
2002
2004
2006

66
Appendix 2: Composition of Forecasting Errors The tables and charts below show the composition of the forecast error, on:
an unadjusted basis;
an adjusted outturn basis;
an adjusted forecast and adjusted outturn basis; and
using the alternative forecasting methodologies
It is clear that capital taxes account for a large and, in recent years in particular growing share of the total error. Chart 1: Composition of Forecast Error – Adjusted Outturn
-15%
-10%
-5%
0%
5%
10%
1999 2000 2001 2002 2003 2004 2005 2006
Income Tax VAT Corporation Tax Excise Capital Taxes Customs Total

67
Chart 2: Composition of Forecast Error – Alternative Forecasting Methodologies
-15%
-10%
-5%
0%
5%
10%
1999 2000 2001 2002 2003 2004 2005 2006
Income Tax VAT Corporation Tax Excise Capital Taxes Customs Total
68
Appendix 3: An Examination of Data Revisions in the Quarterly National Accounts
Introduction
A recent Central Bank technical paper30 examined data revisions to the Irish Quarterly
National Accounts (QNA) that are produced by the Central Statistics Office (CSO).
This is relevant for the work of the Tax Forecasting Methodology Group, as tax
forecasts are based in large part on forecasts of macro-economic variables.
The QNA are revised as more information becomes available, most notably on
publication of the annual National Income and Expenditure accounts. Such revisions
mean that initial estimates of GDP and its components can differ quite significantly
from final estimates, which creates problems for economic forecasting purposes – and
hence for tax forecasting purposes. In order to measure and analyse the extent of
revisions, a “real-time database” was constructed. This database is a snapshot of
official data for every period.
Data Revisions
Data are revised for two reasons – if more information becomes available (an
“informative” revision) and/or if there are changes in methodology (an
“uninformative” revision). The former is of most concern as these types of revisions
may be predictable. In preparing the QNAs, the CSO rely on a series of monthly and
quarterly surveys. The delay or lagged responses to these surveys are partly to blame
for subsequent data revisions. Furthermore, the CSO also use annual surveys
(Services and Industry), which have considerable lags. Once the results from these
surveys are analysed, the QNA are revised.
Each QNA contains revisions to the data for the current year (usually the previous
three quarters). Once per year, on publication of the NIE, the QNA may be revised for
several years into the past. GDP and its expenditure components are subject to the
most frequent and largest revisions and are the main focus of the paper.
One way to look at data revisions is to compare the initial estimate with its current
estimate. A problem with this approach is that the difference between the final and
30 Research Technical Paper 10/RT/06 by Colin Bermingham.

69
initial estimate may be small, when positive and negative revisions to the data offset
each other. It is more useful, however, to look at the difference between data points in
successive releases and calculate the absolute cumulative change. The main statistic
used in the paper in examining revisions to GDP growth rate is the final Mean
Absolute Revision.
Growth Rate Revisions – GDP and its components
Revisions to growth rates are of most interest, as GDP in nominal terms and hence
revisions, increase over time. The paper examines year-on-year growth rates
calculated with quarterly data.
Table 1: Revisions to Real GDP Growth Rates
Revisions
Q1 ’97 – Q4 ’04
Frequency Average Mean Absolute Revision
(relative to growth)
Range
1 Qtr Horizon 0.95 0.178% 0.558% (7.4%) -0.91% – 2.39%
8 Qtr Horizon 0.26 -0.067% 0.149% (2%) -0.90% – 0.77%
Final Revision 1.00 0.268% 1.48% (19.7%) -3.63% – 3.17%
The first row in Table 1 shows revisions at the one quarter horizon, i.e. how the
growth rate in GDP is revised in the quarter following its initial release.
Frequency: 0.95 for Q1 - growth rate of GDP is revised in the quarter following its
release 95 per cent of the time. Similarly, for Q8, the growth rate is revised 8 quarters
following its release 26 per cent of the time. Revisions become less probable through
time as expected. The last row shows that all GDP growth rates considered were
revised at some point in time.
Average: this is the average revision. At Q1 horizon, initial GDP was revised upwards
by 0.178 per cent on average in the quarter following its release. The average revision
was found to be positive at most time horizons.
Mean Absolute Revision (MAR): the average revision incorporates positive and
negative errors, which may offset one another. The MAR overcomes this and is a
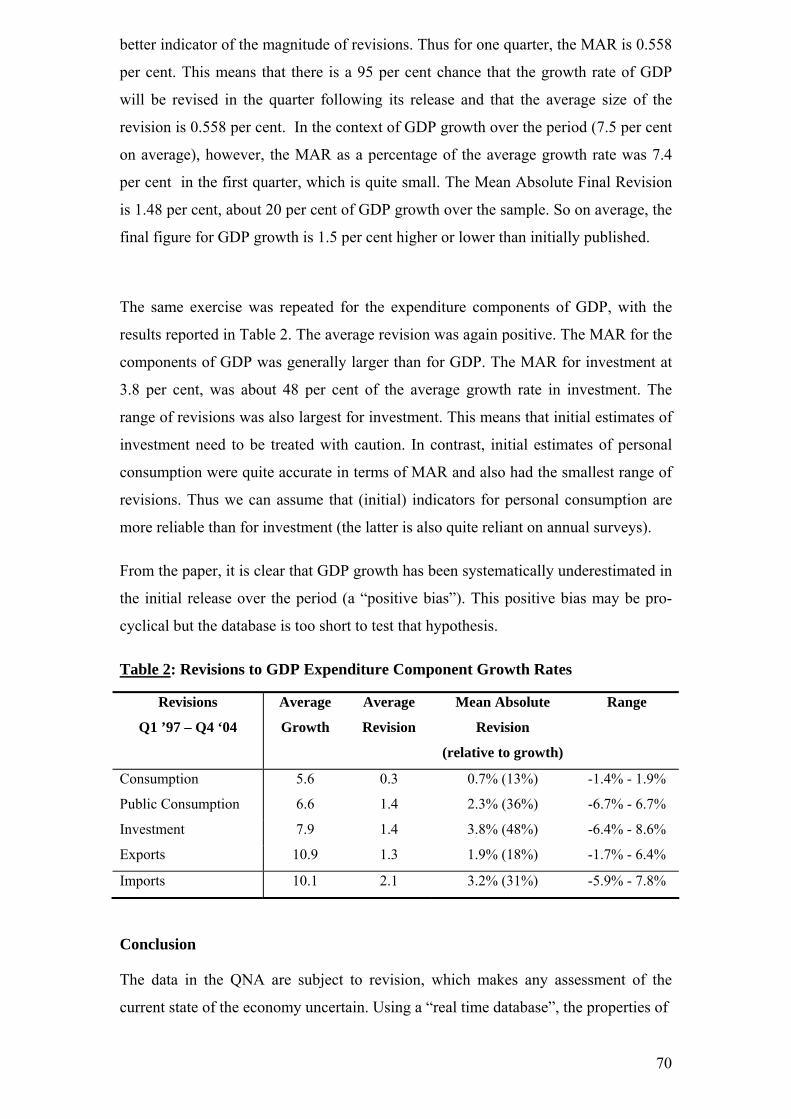
70
better indicator of the magnitude of revisions. Thus for one quarter, the MAR is 0.558
per cent. This means that there is a 95 per cent chance that the growth rate of GDP
will be revised in the quarter following its release and that the average size of the
revision is 0.558 per cent. In the context of GDP growth over the period (7.5 per cent
on average), however, the MAR as a percentage of the average growth rate was 7.4
per cent in the first quarter, which is quite small. The Mean Absolute Final Revision
is 1.48 per cent, about 20 per cent of GDP growth over the sample. So on average, the
final figure for GDP growth is 1.5 per cent higher or lower than initially published.
The same exercise was repeated for the expenditure components of GDP, with the
results reported in Table 2. The average revision was again positive. The MAR for the
components of GDP was generally larger than for GDP. The MAR for investment at
3.8 per cent, was about 48 per cent of the average growth rate in investment. The
range of revisions was also largest for investment. This means that initial estimates of
investment need to be treated with caution. In contrast, initial estimates of personal
consumption were quite accurate in terms of MAR and also had the smallest range of
revisions. Thus we can assume that (initial) indicators for personal consumption are
more reliable than for investment (the latter is also quite reliant on annual surveys).
From the paper, it is clear that GDP growth has been systematically underestimated in
the initial release over the period (a “positive bias”). This positive bias may be pro-
cyclical but the database is too short to test that hypothesis.
Table 2: Revisions to GDP Expenditure Component Growth Rates
Revisions
Q1 ’97 – Q4 ‘04
Average
Growth
Average
Revision
Mean Absolute
Revision
(relative to growth)
Range
Consumption 5.6 0.3 0.7% (13%) -1.4% - 1.9%
Public Consumption 6.6 1.4 2.3% (36%) -6.7% - 6.7%
Investment 7.9 1.4 3.8% (48%) -6.4% - 8.6%
Exports 10.9 1.3 1.9% (18%) -1.7% - 6.4%
Imports 10.1 2.1 3.2% (31%) -5.9% - 7.8%
Conclusion
The data in the QNA are subject to revision, which makes any assessment of the
current state of the economy uncertain. Using a “real time database”, the properties of

71
GDP and its components were analysed. The final revision to the growth rate of GDP
was 1.5 per cent, almost 20 per cent of average GDP growth over the sample. The
average revision was positive indicating that initial estimates of GDP tend to be too
low.
As estimates of tax revenue are primarily based on estimates of economic activity, the
fact that economic variables are subject to such large and regular revision adds to the
difficulties involved in accurately forecasting tax revenue.

72
Appendix 4: ESRI QEC: Tax Revenue Forecasting Model
In early 2006 the ESRIs Quarterly Economic Commentary (QEC) team developed a
new tax forecasting model for the major tax revenue items31. The simple model links
individual tax revenues to endogenous macroeconomic activity variables via a series
of elasticities as follows:
Corporation tax is driven by nominal GDP. For 2007 a downward adjustment
was made to the forecast due to once-off effects of changes in payment schedules.
Income tax is driven by non-agricultural incomes. Income tax data is first
adjusted to take account of special investigations receipts and SSIA contributions.
Customs are driven by the value of merchandise imports.
Excise taxes are driven by volume personal consumption.
Stamp duties are sub-divided:
Stamp duty from residential property is driven by the value of investment
in housing (an indicator of activity in the property market).
Stamp duty from non-residential property is driven by the value of
investment in building and construction excluding roads.
Non-property related stamp duties are driven by the value of personal
consumption.
VAT is driven by the value of personal consumption.
CGT is driven by the nominal value of investment in building and construction.
CAT is driven by the value of personal consumption.
31 This was developed with the benefit of expert advice from the Department of Finance.


