81
Report of the Voluntary Industry Resilience Group Version 1.0 December 2017
Report of the Voluntary Industry
Resilience Group
Version 1.0
December 2017
Report of the Voluntary Industry Resilience Group, v1.0, December 2017 2
Table of contents
Table of contents .................................................................................................................. 2
1 Executive Summary ....................................................................................................... 6
2 Introduction .................................................................................................................... 7
2.1 General ................................................................................................................... 7
2.2 Objective of the Voluntary Industry Resilience Group ............................................. 8
2.3 Objectives of this report .......................................................................................... 9
2.4 Responding to traffic growth ................................................................................. 10
2.5 Existing improvements to address resilience ......................................................... 10
Heathrow ..................................................................................................................... 10
Gatwick ........................................................................................................................ 11
Stansted ...................................................................................................................... 11
Airlines ......................................................................................................................... 11
Overall improvements .................................................................................................. 11
2.6 Economic and consumer drivers to improve resilience .......................................... 12
Delays – all causes ...................................................................................................... 12
Delays – air traffic control ............................................................................................. 13
Cancellations ............................................................................................................... 13
3 Group findings and observations .................................................................................. 14
3.1 Realistic Planning ................................................................................................. 14
Schedule realism ......................................................................................................... 14
Building on existing improvements ............................................................................... 16
Integrating schedules and verifying airspace capacity .................................................. 17
Shared business continuity and contingency planning ................................................. 18
Other industry practices (Network Rail) ........................................................................ 18
3.2 Flying to plan ........................................................................................................ 19
Consistent metrics ....................................................................................................... 19
Shared visibility of operational performance and situational awareness ....................... 19
Readily available operational data ............................................................................... 20
Airport Collaborative Decision Making (A-CDM) ........................................................... 20
FAA Collaborative Decision Making processes. ........................................................... 22
3.3 Serving the plan .................................................................................................... 23
Report of the Voluntary Industry Resilience Group, v1.0, December 2017 3
Contemporary technology and operating practices ...................................................... 23
Behaviours and training ............................................................................................... 24
3.4 Policing the plan ................................................................................................... 25
Authority to manage demand ....................................................................................... 25
Authority and processes for alleviation of restrictions in disruption ............................... 26
3.5 Network coordination ............................................................................................ 26
4 High-level recommendations ........................................................................................ 27
4.1 Overview ............................................................................................................... 27
4.2 Operations Director Liaison Group ........................................................................ 27
4.3 Realistic planning .................................................................................................. 28
4.4 Flying to plan: Shared situational awareness and collaboration processes ........... 28
4.5 Serving the plan: Contemporary technology.......................................................... 28
4.6 Serving the plan: Behaviours and training ............................................................. 28
4.7 Policing the plan: Clarity on current requirements ................................................. 29
4.8 Network coordination ............................................................................................ 29
5 Detailed recommendations .......................................................................................... 29
5.1 Overview and ODLG roadmap .............................................................................. 29
5.2 Realistic planning: Contingency planning .............................................................. 30
5.3 Flying to plan: Industry communications ............................................................... 30
5.4 Flying the Plan: Common Analytical Framework ................................................... 32
5.5 Serving the plan: Ensuring full use of existing technologies (aircraft, planning and
ground processes) ........................................................................................................... 35
Optimisation of departure routeings ............................................................................. 35
Consistent speed control on departures and arrivals .................................................... 36
Reduce radar separation to 2.5nm on approach to all airports ..................................... 36
Runway inspections ..................................................................................................... 36
5.6 Serving the plan: Behavioural and cultural change ............................................... 37
5.7 Policing the plan: A new set of rules ..................................................................... 37
6 Summary and next steps ............................................................................................. 38
7 Acknowledgements ...................................................................................................... 39
8 Appendix 1: VIRG participants, OG participants and Terms of Reference .................... 40
8.1 VIRG participants .................................................................................................. 40
Report of the Voluntary Industry Resilience Group, v1.0, December 2017 4
8.2 Oversight Group (OG) participants ........................................................................ 41
8.3 Terms of Reference .............................................................................................. 41
9 Appendix 2: References ............................................................................................... 46
9.1 Previous studies and recommendations ................................................................ 46
9.2 FAA documents .................................................................................................... 46
9.3 EuroControl documents ........................................................................................ 46
9.4 VIRG member presentations ................................................................................. 47
9.5 Network Rail documents ....................................................................................... 47
9.6 Third party presentations ...................................................................................... 47
10 Appendix 3: Other industry activities ............................................................................ 47
10.1 SESAR ................................................................................................................. 47
10.2 The A4 Alliance ..................................................................................................... 48
10.3 The A6 Alliance ..................................................................................................... 48
10.4 Future Airspace Strategy Industry Implementation Group (FASIIG) ...................... 49
10.5 IATA Worldwide Slot Guidelines (WSG) ................................................................ 49
10.6 European Airport Punctuality Network (EAPN) ...................................................... 50
10.7 The European Airport Coordinators Association (EUACA) .................................... 50
10.8 UK Operations Managers Association (UKOMA) .................................................. 50
10.9 Network Directors of Operations (NDOP) Group Airport Integration (APTI)
Taskforce (TF) ................................................................................................................. 51
10.10 Airport Operators Association (AOA) ................................................................. 51
11 Appendix 4: Demand versus capacity management ..................................................... 51
11.1 Background........................................................................................................... 51
11.2 HAL voluntary capacity process ............................................................................ 51
11.3 French DGAC (French Civil Aviation Authority) ..................................................... 52
11.4 UK versus French legislation ................................................................................ 53
EC Regulation 1008 / 2008 Article 21 “Emergency Measures” ..................................... 54
EC 95/93 (as amended) on common rules for the allocation of slots at Community
airports – Article 14 ...................................................................................................... 54
French Civil Aviation Code Article R221-3 .................................................................... 54
UK SI 2009 No 41 PART 3 Access to routes ................................................................ 54
11.5 EuroControl Network Manager .............................................................................. 54
11.6 Recommendations ................................................................................................ 55
Report of the Voluntary Industry Resilience Group, v1.0, December 2017 5
12 Appendix 5: Shared industry contingency planning roadmap ....................................... 55
13 Appendix 6: VIRG scheduling process and data .......................................................... 56
13.1 Scheduling process overview ................................................................................ 56
13.2 Legislative framework ........................................................................................... 56
Scheduling cycle .......................................................................................................... 56
Data cycle .................................................................................................................... 58
Data availability ............................................................................................................ 58
13.3 Schedule reliability/quality of data ......................................................................... 59
13.4 Capacity declarations process .............................................................................. 62
13.5 Recommendations ................................................................................................ 63
14 Appendix 7: Common analytical framework ................................................................. 64
14.1 Overview ............................................................................................................... 64
14.2 Punctuality Performance ....................................................................................... 64
14.3 Airspace & Aerodrome Regulation ........................................................................ 66
14.4 Turn Performance ................................................................................................. 70
14.5 Block Performance ................................................................................................ 74
14.6 Airfield Performance ............................................................................................. 77
15 Appendix 8: Abbreviations ........................................................................................... 79
Report of the Voluntary Industry Resilience Group, v1.0, December 2017 6
1 Executive Summary 1.1 The UK system of open air transport competition operates without central control or
coordination. This has served passengers and industry well to date and remains the
industry’s preferred environment. However, as demand approaches current network
capacity in the south east of the UK, the performance and resilience of the air
transport network is increasingly challenging.
1.2 This results in reduced punctuality or significant flight disruption in peak traffic
periods, adverse weather or in the event of a failure of any element of the network.
There is often the need to apply tactical (i.e. on the day) ATC regulations or local
measures, to manage congestion, local weather, or factors external to the UK
network.
1.3 Many studies have recommended strategic redesign of UK airspace and additional
strategic infrastructure, especially in the UK south east. However, strategic change
has faced pressures from local communities and political challenges.
1.4 The Voluntary Industry Resilience Group (VIRG) consists of senior leaders in the
CAA, NATS, Airports Coordination Limited (ACL), airlines and airports. It is led by an
independent chairman, Garry Copeland, and supported by the CEOs of those
companies. Opportunities for improvement have been identified and
recommendations are made in this report that are within the control of industry to
implement. To ensure these recommendations progress forward and to address new
resilience challenges as they emerge, the VIRG will continue in existence, known
simply as the Industry Resilience Group (IRG).
1.5 The recommendations are grouped into ‘Realistic Planning’, ‘Flying to Plan’,
‘Serving the Plan’, ‘Policing the Plan’ and ‘Network Coordination’. They include:
• The establishment of an ongoing senior industry body focused on network
resilience;
• The development of an integrated network planning process to ensure seasonal
schedules are robust and resilient, including considerations of airspace capacity;
• The development of integrated network business continuity/contingency planning
for network disruption causes;
• The development of a common analytical framework, and continuous
improvement processes (e.g. shared situational awareness, network
performance visibility, shared tools/processes);
• The development of a ‘baseline’ training standard based on a review of culture
and behaviour across the industry that underpins operational staff collaborative
working, to enable full use of the tools and processes of the common analytical
framework;
• A CAA and industry commitment to fully exploit available technologies to improve
resilience amongst other government priorities; and
• A commitment from government and the CAA to provide clarity and operationally
viable processes for alleviation of restrictions in the event of network disruption.

Report of the Voluntary Industry Resilience Group, v1.0, December 2017 7
1.6 The VIRG, with the support of the Oversight Group (OG)1, has initiated some of
these recommendations, including the formation of an Operations Director Liaison
Group (ODLG) as the on-going senior industry body that is to focus on resilience.
The VIRG has also initiated network contingency planning for the NATS ExCDS
project (which is introducing new electronic flight strip technology into the south east
terminal control environment in 2017 and 2018) and an integrated planning process
for network schedules. Further details on VIRG and OG participants, along with the
Terms of Reference, can be found in Appendix 1 (section 8)
1.7 It is considered by the VIRG that the recommendations would not require a
significant investment from stakeholders2. However, they require a strong
commitment and active participation from industry representatives at a senior level to
deliver the expected results.
2 Introduction
2.1 General
2.2 The UK system of open air transport competition has served passengers and
industry well to date and remains the industry’s preferred environment. However, as
demand approaches current network capacity in the south east of the UK, the
performance and resilience of the air transport network is becoming increasingly
challenging.
2.3 The UK’s airport and airspace capacity is constrained, with no new significant airport
runway capacity expected until at least 2025. In 2016, NATS predicted a further 9 per
cent increase in aircraft movements at the five major London airports between then
and 20223. EuroControl Network Manager4 also reported that traffic in October 2017
increased by 5 per cent compared with October 2016, as demonstrated in Figure 1,
and was above the high forecast.
1 Sponsoring group of CEOs 2 With the exception of airports that have not already implemented A-CDM, since to
achieve this, there are often links to other investment needs such as automation. 3 http://nats.aero/blog/2016/02/record-demand-will-put-pressure-on-airspace-
capacity10605/ 4 EuroControl Monthly Network Operations Report, Overview – October 2017, Network
Manager

Report of the Voluntary Industry Resilience Group, v1.0, December 2017 8
Figure 1: Average Network Manager traffic for last 5 years, October 20174
2.4 Such capacity constraints manifest in the need for tactical ATC regulations or local
measures being applied to manage:
• Peak traffic periods;
• Congestion in arrival or departure sectors or routes;
• Local weather events;
• Failure of any element of the UK network;
• Factors external to the UK network, such as European industrial action or
weather.
2.5 The tactical regulations or local measures are usually applied during the operating
day, giving little notice to allow airlines and airports to minimise impact to
passengers. This can result in reduced punctuality or significant flight disruption to
the extent of cancellations having to be made.
2.6 Strategic developments have been identified by previous studies, such as
infrastructure and airspace design. However, these have proven to be very difficult to
implement due to pressures from local community and political challenges.
2.7 Many previous recommendations have been implemented where they have been
within the control of specific entities, such as airports, and have delivered useful
improvements. Although primarily aimed at individual companies and entities, many
of these recommendations could offer greater benefits when applied at network level,
and are consistent with the findings of this study.
2.2 Objective of the Voluntary Industry Resilience Group
2.8 For the purposes of the VIRG work, resilience is considered to be the ‘ the ability of
the UK South East air transport system to operate broadly to plan despite variances
Report of the Voluntary Industry Resilience Group, v1.0, December 2017 9
that arise during the operational day, to effectively handle disruptive forces when they
arise, and to recover rapidly and robustly in the event of disruption’5.
2.9 It is noted that resilience is sometimes taken to mean the ability to recover efficiently
from a significant disruptive incident, such as a runway closure. However, for the
avoidance of doubt, this has not been the focus of the VIRG work.
2.10 The Voluntary Industry Resilience Group (VIRG) was set up, at the request of the
CAA Chief Executive Officer (CEO), to investigate ways of maintaining and improving
network resilience. The Group’s objective is therefore to improve in a systemised
manner the way in which the UK’s aviation network is planned and operated to
enhance its day-to-day operating resilience, reduce delays and reduce the
associated costs to both industry and passengers.
2.11 It should be noted that the CAA and industry groups remain determined to improve
resilience through the delivery of existing airspace developments, which should still
be pursued.
2.3 Objectives of this report
2.12 The VIRG consists of senior leaders in the participating companies listed in Appendix
1 (section 8). It is led by an independent chairman, Garry Copeland, and supported
by the CEOs of those companies. The objective of the report is to make
recommendations that will improve resilience and are within the control of industry to
implement voluntarily. To ensure these recommendations progress forward and to
address new resilience challenges as they emerge, the VIRG will continue in
existence, known simply as the Industry Resilience Group (IRG).
2.13 To this end, the VIRG has undertaken the following activities to form the
recommendations in this report:
• Reviewed previous studies and recommendations dating back to 2008, including
their implementation success;
• Reviewed economic impacts and drivers associated with improved resilience;
• Reviewed planning and operational control processes of participating companies
and wider industry;
• Engaged with EuroControl Network Manager to understand their developments
on network resilience;
• Engaged with the EuroControl Central Office for Delay Analysis (CODA) to
understand their data gathering and analysis activities and the potential for
information sharing applications;
• Engaged with the FAA Air Traffic Control Command Center, Washington, to
understand their well-established collaborative air traffic management and
communications process; and
• Engaged with UK Network Rail to explore lessons and developments on
resilience external to the air transport industry.
5 Industry Resilience Group brainstorming RC v4, 26 April 2017
Report of the Voluntary Industry Resilience Group, v1.0, December 2017 10
2.14 The report starts by providing details of the group’s findings and observations
(section 3) before detailing the high-level recommendations (section 4) and more
detailed recommendations (roadmap) for implementation (section 5). Details on wider
industry activities can be found in Appendix 2 (section 9), Appendix 3 (section 10)
and Appendix 4 (section 11).
2.4 Responding to traffic growth
2.15 A lack of available capacity (both infrastructure and resources) and prolonged high
utilisation leads to increasing delays, reduced punctuality6 and difficulties in recovery.
2.16 Between 2012 and 2016, there has been a general reduction in punctuality
performance at the UK’s busiest airports (Heathrow, Gatwick, Stansted, Manchester,
Luton, London City), with delays increasing7. With the exception of Heathrow and
Manchester, all the listed airports have experienced significant increases in traffic
over that period.
2.17 UK traffic is now at record levels, with NATS reporting a near 10 per cent increase
over the two years up to 2017, which is above the expected level. The 2017 network
performance has been better than previous years due to a number of factors,
including:
• Relatively benign weather;
• Minimal major system changes;
• Relatively stable European industrial relations environments;
• Benefits of industry investment and focus on resilience measures; and
• ATC procedural changes, such as Time Based Separation (TBS) at Heathrow.
2.18 However, large shifts in the distribution of flights have occurred recently, causing
congestion on certain routes and revealing the disparities between schedule
coordination of airlines, airports and NATS.
2.5 Existing improvements to address resilience
2.19 The following airports and airlines are already investing in improvements:
Heathrow 2.20 Heathrow is currently investing £37 million in resilience related projects. The ‘Strive
For Five’ programme, which is focused on delivering a 5 per cent improvement in
punctuality, is investing in a series of activities including:
• Wake vortex spacing efficiencies;
• Demand-capacity balancing;
• Aircraft turnaround effectiveness;
6 The proportion of flights considered to be no more than 15 minutes later than their
scheduled on/off stand time 7 CAA CAP 1515: Operating Resilience of the UK’s aviation infrastructure and the
consumer interest, July 2017
Report of the Voluntary Industry Resilience Group, v1.0, December 2017 11
• Airport Collaborative Decision Making (A-CDM) optimisation; and
• Other airline and airport efficiency projects.
2.21 As a result, departure punctuality at Heathrow to date in 2017 is 81 per cent, which is
2 per cent higher than the same period in 20168.
Gatwick 2.22 Gatwick has continued to invest heavily in seeking to deliver improved resilience.
This summer, initiatives have included:
• The introduction of various turn incentive schemes for airlines and ground
handlers with a total potential pay-out of £19 million;
• Investment in a dedicated airline performance team to support ground handling
activities, including the recovery of late inbound aircraft; and
• Operational initiatives, such as the planned use of alternating SIDs to improve
departure flow rates.
2.23 These initiatives, together with the measures taken by airline customers, have helped
to deliver a 6 per cent increase in departure punctuality performance in summer
20178.
Stansted 2.24 Stansted Airport does not have the capacity constraints experienced at Heathrow
and Gatwick. However, at peak times, forecasting indicates that this will be an
increasing factor. In anticipation of this, a series of four new remote holding stands
are to be constructed by Summer 2020 at a cost of £12 million.
Airlines 2.25 BA, easyJet, Ryanair and Virgin Atlantic have reported significant investment in
resilience measures, including additional spare aircraft capacity and crews, schedule
adjustments, improved gate technology and ground handling activity improvements.
Airlines are also continuously monitoring block times and, where slot constraints
permit, seeking to make adjustments (including within the season). However,
networked carriers report this is very difficult to correct in-season due to the large
percentage of connecting customers affected.
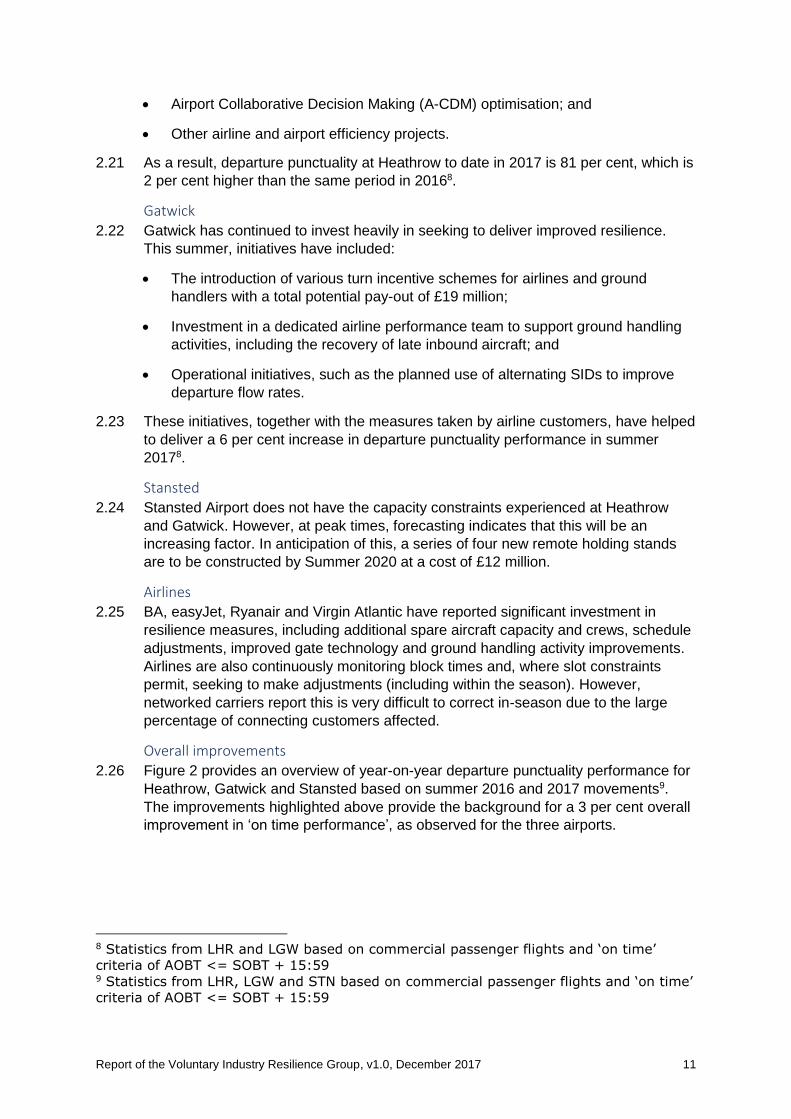
Overall improvements 2.26 Figure 2 provides an overview of year-on-year departure punctuality performance for
Heathrow, Gatwick and Stansted based on summer 2016 and 2017 movements9.
The improvements highlighted above provide the background for a 3 per cent overall
improvement in ‘on time performance’, as observed for the three airports.
8 Statistics from LHR and LGW based on commercial passenger flights and ‘on time’
criteria of AOBT <= SOBT + 15:59 9 Statistics from LHR, LGW and STN based on commercial passenger flights and ‘on time’
criteria of AOBT <= SOBT + 15:59
Report of the Voluntary Industry Resilience Group, v1.0, December 2017 12
Figure 2: Year-on-Year Headline Departure Punctuality Performance: total Heathrow, Gatwick, Stansted
2.6 Economic and consumer drivers to improve resilience
2.27 Delays and cancellations associated with increasing congestion and inefficiencies
impacts the industry through increased fuel costs, crew costs, airport charges and
passenger care and compensation costs. Whilst passengers may be financially
compensated for delays, airlines may choose to increase ticket prices to remain
profitable and avoid detrimental cost-cutting measures. In addition, delays and
cancellations cost passengers in time, which can be converted into an equivalent
monetary value.
2.28 Data from EuroControl10 has been analysed to estimate the scale of the costs
associated with delays and cancellations at the six main London airports11. The
‘average’ cost of delays, cancellations, diversions etc has been determined by
EuroControl based on a study of European airlines. Passenger values of time have
been taken from the Airports Commission appraisal methodology12. Such costs have
been adjusted to 2016 prices.
Delays – all causes 2.29 Average delay is currently measured by the CAA13 as the expected time versus
actual time on/off runway using an assumption for taxi times. It also considers flights
that arrived early to be on time (i.e. they had zero delay).
2.30 Based on the EuroControl and Airports Commission data, the additional cost of these
delays (i.e. above that which was already planned for in airline schedules) to airlines
and passengers operating to/from the six London airports is estimated at around £1.8
billion per annum.
10 EUROCONTROL: standard input data for cost benefit analyses V7.0 November 2015 11 Heathrow, Gatwick, Stansted, Luton, London City and Southend 12 AIRPORTS COMMISSION: Economy: Delay Impacts Assessment Methodology Paper
November 2014 13 Source: CAA punctuality statistics
Report of the Voluntary Industry Resilience Group, v1.0, December 2017 13
2.31 Not all delay minutes are within the UK industry control. For example, delays
originating at the other end of routes or due to ATC strikes on the European
continent. Nonetheless, where such delays have knock-on effects to other flights, the
size and significance of such effects may still be within UK industry control, either
wholly or partially.
2.32 Delays that are within UK industry control can occur due to different root causes,
depending on the circumstances or the airport / airline business model. Contributing
causes include:
• Inaccurate block times;
• Inadequate resourcing;
• Airfield congestion;
• Airport flow regulations due to congestion / weather etc.
Delays – air traffic control 2.33 NATS En-Route Limited (NERL) reports its attributable delays14 as part of its licence
conditions. Incentives and penalties are determined based on this performance.
NERL’s en-route attributable delay due to capacity/staff and en-route weather is
approximately 250,000 minutes per annum15. This delay figure is significantly below
the Reporting Period 2 (RP2) penalty levels set in 2014.
2.34 This equates to approximately £13.4 million in airline costs per annum16, excluding
the reduced en-route ATC charges agreed as part of the NATS RP2 settlement. This
also equates to a passenger value of time cost of about £10 million per annum
assuming an average load factor of 150 passengers per aircraft. This may not
necessarily manifest itself in aircraft delay compared to the schedule (as per ‘Delays
– all causes’ above), but is nonetheless a delay and an opportunity cost.
2.35 There may be opportunities to improve the balance between demand and capacity
for different airspace sectors. For example, if ground delays are expected it may be
more beneficial for an airline to plan for a re-route option, flying additional track miles.
EuroControl data suggests that it may be more beneficial for an airline operator to fly
an additional 80 track miles than incur a ground delay of more than 5 minutes.
However, the ultimate decision on whether to incur additional cost in flying longer
routes versus accepting delays on the ground should be taken by the airline that
incurs the cost.
Cancellations 2.36 EuroControl17 estimates that the average cancellation rate for European carriers is
1.5 per cent, with a peak of 8 per cent during significant events. BA, easyJet and
14 NERL attributable delays are extra calculated as avoidable delays suffered by aircraft
due to NERL’s operation. Such flights may or may not be delayed in terms of their
scheduled take-off and landing times. 15 Estimate based on 2015 figures from CAP 1578 Investigation Under Section 34 of the
Transport Act 2000: Project Oberon, Final Report 16 Assuming a EuroControl average cost of euros €59 per minute 17 EuroControl: standard input data for cost benefit analyses V7.0 November 2015
Report of the Voluntary Industry Resilience Group, v1.0, December 2017 14
Ryanair18 have lower average cancellation rates of 1 per cent, 0.6 per cent and 0.5
per cent respectively.
2.37 At the six main London airports, departure cancellations would equate to
approximately 5,865 per annum based on a 1 per cent cancellation rate, costing17
between £103m and £400m per annum19.
2.38 Not all cancellations are avoidable in the context of network resilience, for example
due to aircraft damage or crew shortage. However, BA and easyJet estimate that
approximately 20 per cent of cancellations could be classed as unavoidable.
2.39 In the case of BA and easyJet, there is an opportunity to consider better planning
and/or operational procedures to reduce the 80 per cent of cancellations that are
potentially avoidable, depending on the circumstances. For example, at Heathrow,
TBS procedures have improved arrival rates by around 2 movements per hour during
high wind conditions and 1 movement per hour during low wind conditions, which
equates to protecting approximately 30 movements on a windy day.
2.40 There may be similar opportunities to consider for departures that could reduce
delays and cancellations. A 10 per cent improvement in potentially avoidable
cancellations could benefit airlines between £8m-£32m per annum.
3 Group findings and observations
3.1 Realistic Planning
Schedule realism 3.2 Many parameters are used to plan airline schedules and to integrate them into airport
capacity limitations. NATS also has a planning process to support schedules in the
local airspace. However, experience indicates that the airline, airport and NATS
processes are not integrated, affecting the extent to which processes are effective at
a network level for continued resilient and optimised operations.
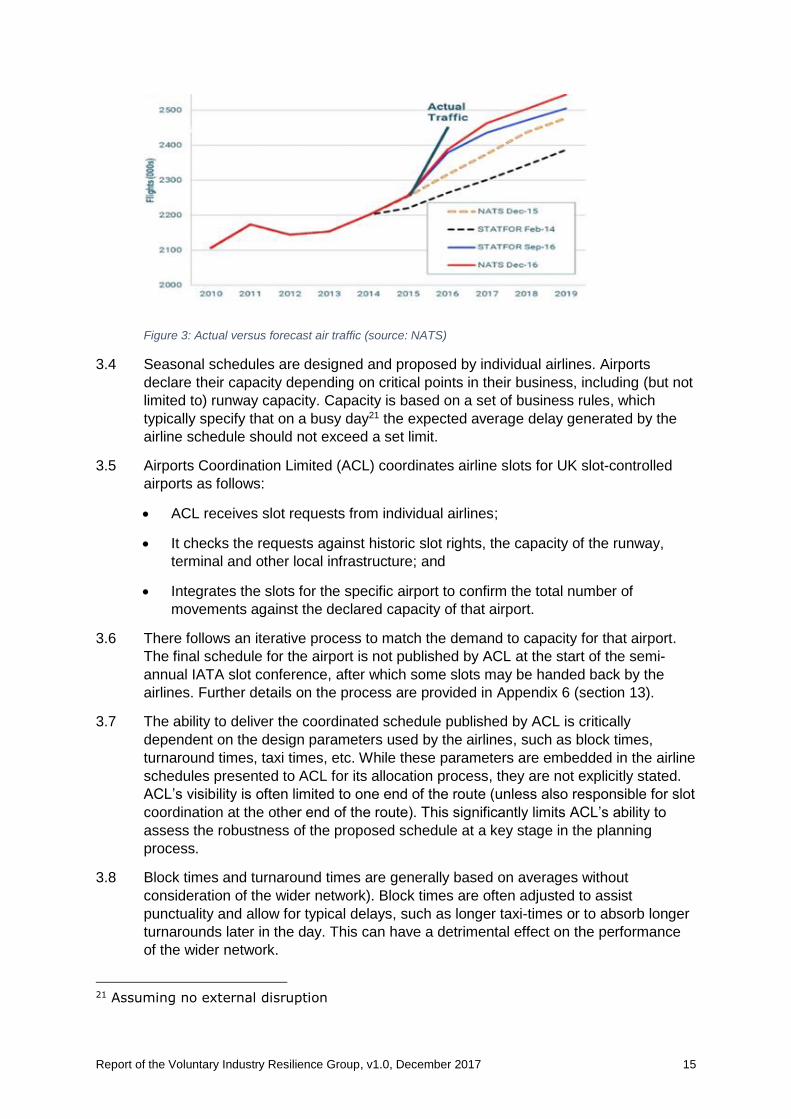
3.3 At the schedule planning stage, history indicates that network or system forecasts
are consistently inaccurate. Figure 3 provides an example of this situation, whereby
actual traffic has far exceeded predicted traffic levels at NATS centres. EuroControl
Network Manager20 also reported that traffic in October 2017 compared with the
same month in 2016 was above the high forecast.
18 Ryanair’s cancellation rate prior to the 2017 rostering issue was consistently below
0.5% 19 Based on EuroControl costs of €18,400 for low cost carriers 189 seats and €78,400
network carriers 250 seats. Prices uplifted from 2014 and assuming a Euro : Pound
exchange rate of 1.1 : 1. 20 EuroControl Monthly Network Operations Report, Overview – October 2017, Network
Manager
Report of the Voluntary Industry Resilience Group, v1.0, December 2017 15
Figure 3: Actual versus forecast air traffic (source: NATS)
3.4 Seasonal schedules are designed and proposed by individual airlines. Airports
declare their capacity depending on critical points in their business, including (but not
limited to) runway capacity. Capacity is based on a set of business rules, which
typically specify that on a busy day21 the expected average delay generated by the
airline schedule should not exceed a set limit.
3.5 Airports Coordination Limited (ACL) coordinates airline slots for UK slot-controlled
airports as follows:
• ACL receives slot requests from individual airlines;
• It checks the requests against historic slot rights, the capacity of the runway,
terminal and other local infrastructure; and
• Integrates the slots for the specific airport to confirm the total number of
movements against the declared capacity of that airport.
3.6 There follows an iterative process to match the demand to capacity for that airport.
The final schedule for the airport is not published by ACL at the start of the semi-
annual IATA slot conference, after which some slots may be handed back by the
airlines. Further details on the process are provided in Appendix 6 (section 13).
3.7 The ability to deliver the coordinated schedule published by ACL is critically
dependent on the design parameters used by the airlines, such as block times,
turnaround times, taxi times, etc. While these parameters are embedded in the airline
schedules presented to ACL for its allocation process, they are not explicitly stated.
ACL’s visibility is often limited to one end of the route (unless also responsible for slot
coordination at the other end of the route). This significantly limits ACL’s ability to
assess the robustness of the proposed schedule at a key stage in the planning
process.
3.8 Block times and turnaround times are generally based on averages without
consideration of the wider network). Block times are often adjusted to assist
punctuality and allow for typical delays, such as longer taxi-times or to absorb longer
turnarounds later in the day. This can have a detrimental effect on the performance
of the wider network.
21 Assuming no external disruption
Report of the Voluntary Industry Resilience Group, v1.0, December 2017 16
3.9 Turnaround times have a powerful influence on an airline’s schedule and on the
airport’s performance. The combination of tight turnaround times, the pressure on
ground handling agents to deliver the contracted level of performance and airlines
having to balance other issues (such as slot availability, weekly/seasonal variance)
has contributed to significant difficulties at several airports, absorbing considerable
management attention to improve in 2017.
3.10 There are concerns about the accuracy of planning parameters and the ‘deliverability’
of airline schedules. The schedules provided to ACL are expected to be based on
realistic planning parameters and deliver flight punctuality (to within +/-15 minutes for
short-haul flights). However, based on ACL’s monitoring of flight completion and
punctuality, the planning parameters used by airlines are generally best-fit/seasonal
variation on long-haul flights, and there is limited available evidence of effective
monitoring of the actual performance versus the plan.
3.11 ACL’s powers to address airlines’ inaccurate planning or unrealistic schedules are
limited to revealing those that are demonstrably ‘repeated and intentional’, and are
used only infrequently. This can lead to punctuality impacts being unresolved
throughout a full operating season. The nature of ACL’s powers is such that it tends
to focus on retrospective slot performance reviews, requiring a portion of the
scheduling season to have taken place before it can identify slot performance issues.
Due to the lead time associated with implementing schedule changes (e.g. notifying
passengers, changes to crew rosters), there is limited scope to resolve slot
performance issues within the scheduling season.
3.12 The schedules for individual airports are produced to great detail and should provide
airport schedules that are compliant with the airport capacity declaration. However,
the runway scheduling process for future seasons is based on the performance of the
previous season where performance may have been sub-optimal. The modelling
supporting the capacity declaration is often based on an assumption that runway
demand will be delivered in line with the schedule, with limited consideration given to
the impact of a material shift in the schedule on resilience.
3.13 Overall, there is limited evidence of cyclical continuous improvement across a range
of planning parameters.
Building on existing improvements 3.14 As demand approaches capacity, some airlines are reacting to reduce trends in poor
performance. Airlines, including BA, easyJet, Ryanair and Virgin Atlantic, are
adjusting planning parameters to improve schedule realism. They are also investing
in additional aircraft capacity, crews and resources to provide contingency
arrangements to improve punctuality, prevent cancellation and therefore improve
overall resilience (for example where an aircraft has a technical fault or a schedule is
disrupted).
3.15 Similarly, some airports have introduced active processes to monitor and improve
schedules. All airports represented at the VIRG have active methods of monitoring
slot performance as a means of supporting adherence to slot allocations, and
Gatwick has invested in operational supervision to improve schedule adherence.
However, there is no provision of a similar arrangement at the network level.

Report of the Voluntary Industry Resilience Group, v1.0, December 2017 17
3.16 There is a need and scope for individual airlines and airports to more consistently
verify and adjust planning parameters subject to runway slots constraints, based on
their operational performance. Agreeing a consistent set of operating metrics and
monitoring them at a network level would facilitate a continuous improvement cycle
and should help to support a significantly improved planning process.
Integrating schedules and verifying airspace capacity 3.17 At the airspace network level, there is no formal process to integrate the schedules of
airports in the region and to check or validate them against the local London TMA
airspace constraints. There is therefore no mechanism to include airspace capacity
parameters into the planning process and evaluate the impact of the season’s
schedule on the airspace network.
3.18 Similarly, there is no structured process to use network operational performance data
to monitor the network performance. This in turn significantly reduces the ability to
make planning parameter adjustments or otherwise apply continuous improvement
processes to the network.
3.19 NATS does not have a formal process to take account of changes in the schedule
details in its resource planning. Instead, it relies on adjusted STATFOR predictions,
network intelligence and historical data. Detailed data on city pairs, preferred
Standard Instrument Departures (SIDs), routeing, etc is available at the seasonal
planning stage, but currently none of this data is used to predict and mitigate any
issues arising in advance.
3.20 By default, therefore, any network capacity conflicts on routes or through sectors are
resolved by reactive tactical on-the-day regulation or local measures. The existing
process does not allow proactive adjustments based on integration at the network
level and instead relies on airline adjustments in real time, with few options to limit
disrupted flights and passengers.
3.21 While NATS’ reliance on historic performance data ensures that the schedule shift
typically experienced is incorporated within its planning process, it would be
beneficial for this data to be supplemented with an assessment of the proposed
airport schedules on the airspace network. This would allow improved planning and
allow conflict resolution in the planning stages.
3.22 Similarly, airports and airlines now have sophisticated processes to predict peak
demand days, such as school holidays, major sporting or cultural events. Bi-lateral
planning has also improved in recent years. Although there are examples where
integrated planning has proven successful for individual events, such as the London
Olympics in 2012, there remains no effective process for evaluating the impact of
predictable events at network level.
3.23 The VIRG agreed the need for objective measurement and feedback of schedule
planning parameters. The group also recognised that more effective integrated
processes are required to monitor and encourage accurate planning, scheduling and
operational performance delivery. The group also notes that it is essential for the
industry to work together to share and interpret schedule data in a collaborative
manner to accommodate growth of airports, airlines and route connections by
identifying and managing hotspots at the strategic planning phase rather than the
tactical phase.
Report of the Voluntary Industry Resilience Group, v1.0, December 2017 18
Shared business continuity and contingency planning 3.24 Individual air transport entities generally have strong contingency plans in place,
though recent experience of virtually all VIRG companies indicates that there is no
room for complacency in planning for and managing disruption. Furthermore, society
and political expectations, reduced tolerance of poor performance, and the rising cost
of recovery and compensation after disruptive events demand that planning
processes are continuously reviewed and improved.
3.25 In recent years, the scale and cost of potential disruption events has encouraged
adjacent businesses to share contingency planning. Bi-lateral contingency planning
continues to be developed between airports and the airlines operating there.
However, there is very little shared and coordinated UK south east network-wide
contingency planning. The network performance during disruptive scenarios largely
depends on the working mechanisms of individual company contingency plans and
on the experience of individuals in key operational control roles. The results are often
incomplete or inconsistent from event to event, or even day to day.
3.26 This inconsistency is also evident during ‘routine’ events, such as inconsistency in
tactical regulation during traffic congestion. This is even more evident during more
significant disruption, whereby the situation can rapidly deteriorate in the absence of
good plans and firm control.
3.27 Opportunities to develop shared contingency planning have been identified by the
VIRG, which could mitigate disruption or improve recovery. These include industry-
wide planning for the NATS ExCDS programme (which is introducing new electronic
flight strip technology into the south east terminal control environment in 2017 and
2018) and sharing of data on thunderstorms and other scenarios within the London
TMA. Lessons from the approach adopted by the FAA (see section 3.2) should also
be considered.
3.28 A draft roadmap of actions has been drafted and included in Appendix 5 (section 12).
Other industry practices (Network Rail) 3.29 The VIRG engaged with Network Rail to understand and compare the planning and
control processes used by another complex, high density, safety critical network
industry.
3.30 It was observed that the railway industry has a very different regulatory and
ownership environment compared with the air transport industry. Network Rail is the
sole entity that ‘owns’ most of the operating rail network in the UK, which centrally
controls the network. Operators wishing to operate on the network must contract to a
strict ‘network code’ and ‘rail operating code’, which govern their access and
operating procedures.
3.31 Like the air transport industry, operators do bid for their schedules on a seasonal
basis, but within the bounds of the network code and rail operating code. Network
Rail must also confirm that the schedules are compatible and within the capabilities
of the infrastructure capacity.
3.32 Competition for scheduled passenger operations takes place at the franchise bidding
stage, rather than at the seasonal or daily level. Franchise requirements dictate the
services that are to be operated, often specify the schedule to be adopted, and
maintain stable seasonal schedules.
Report of the Voluntary Industry Resilience Group, v1.0, December 2017 19
3.33 While there are differences in the regulatory basis for the two industries, there is
relevance to understand the operational planning processes further. There is also
scope to understand the benefits of visibility and coordination over both ends or a
service route and integration with other routes.
3.34 It is recommended that the rail industry’s lessons on schedule planning, operational
control and coordination are considered as part of the development of UK network-
wide planning, control and coordination processes.
3.2 Flying to plan
Consistent metrics 3.35 The VIRG reviewed the metrics used by industry, such as IATA data, to characterise,
monitor and report on operations. While the aviation industry generates an extensive
range of data, there can be different interpretations. In addition, some significant
operational performance indicators are not monitored consistently or at all. There
needs to be an improved understanding of the drivers of punctuality performance and
consistency in the data used and monitored.
3.36 NATS experience indicates that aircraft arriving earlier than the airlines’ published
schedule times are potentially disruptive, generating congestion and causing on-
schedule traffic to hold. More commonly associated with long-haul routes, this
impacts punctuality and can involve substantial variation in landing time. This also
impacts on airport stand planning and congestion, which can be a challenge for
airline and ground handler resources. However, few entities measure early arrivals
as a prompt to investigate the causes (e.g. where schedules are adjusted for delay)
to reduce this impact. It is of note that CAA and other statistics include early arrivals
in the ‘on time’ category.
3.37 The VIRG recognises that a common analytical framework would improve the
industry ability to comprehensively determine and monitor network behavior. This
would facilitate continuous improvement by collaboratively focusing attention on
those issues that could improve network performance and resilience.
3.38 A review of data systems used at each participating VIRG company indicates similar
metrics and data used at a high level. This may provide a good basis to develop a
shared set of data systems and common metrics.
Shared visibility of operational performance and situational awareness 3.39 Most participants in the air transport network, including each of the VIRG
participants, have tools to monitor the performance and provide overall situational
awareness of their individual operations. The sophistication of such tools varies
widely to enable monitoring and awareness for maximised operational performance.
3.40 However, there is no agreed shared visibility of performance or situational awareness
for the UK south east network. Information about on-the-day performance and any
early warning of developing disruption is therefore held in company-specific systems,
such as the NATS radar system or airport and airline operations control systems.
There are few agreed and consistent processes that would allow network participants
to comprehensively detect a developing disruption, exchange information and
provide an industry response to maximise operational resilience.
Report of the Voluntary Industry Resilience Group, v1.0, December 2017 20
Readily available operational data 3.41 Vast quantities of shared data are available to all network participants, but
experience suggests that little is used collaboratively to enhance network
performance or resilience.
3.42 Each company provides operational information to various entities, some of whom
repackage the information to sell to consumers or other companies. For example,
airlines provide operations data to airports, which contribute to Flight Information
Display System (FIDS) screens (arrivals and departures information). FIDS data is
either distributed or screen-scraped by various commercial companies, then
repackaged and sold, etc. Other companies, such as those providing web-based
flight tracking service, gather information from ATC communications systems and sell
that data to app consumers. The VIRG noted that FlightRadar24, FlightAware, Flight
Track and other data aggregators provide extensive industry data to the public, often
enabling passengers to be better informed than the air transport network.
3.43 Increasingly, these data-providing apps are now used by airlines and airports to
supplement their situational awareness. In some cases, the apps effectively provide
the most comprehensive network situational awareness available. It is noteworthy
that of the ten companies participating in the VIRG, seven reported that they use
FlightRadar24 or FlightSentry systems as situational awareness tools.
3.44 The following EuroControl data could also provide an available source of operational
data across Europe:
• The EuroControl Central Office for Delay Allocation (CODA) has collected airline
data since 2003 and airport data since 2007, covering around 170 airlines and
capturing approximately 80 per cent of commercial operations22;
• EuroControl is developing Fleetwatch, which can:
• visualise schedules;
• visualise the operating lines of individual aircraft;
• provide a measure of the quality of planning parameters; and
• help to assess the impact of schedule shift on airspace flows.
3.45 The EuroControl database and visualisation products are understood by the VIRG
participants to provide opportunities to improve the availability and quality of planning
data and schedules. They may also provide opportunities to develop collaborative
situational awareness tools that could assist tactical management in congested and
disrupted traffic situations.
Airport Collaborative Decision Making (A-CDM) 3.46 A-CDM is a EuroControl sponsored process to gather and share flight departure
information, improve situational awareness across the European network and provide
operationally critical movement data for airlines, ANS Providers (ANSPs) and
airports. It was initially specified for the exchange of data, but to date has been
22 CODA has published several reports that have been reviewed during the VIRG review.
Report of the Voluntary Industry Resilience Group, v1.0, December 2017 21
implemented independently at European airports and airport groups to allow industry
maximum flexibility.
3.47 A-CDM is also an enabler for the Single European Sky ATM Research (SESAR)
deployment of the collaborative Airport Operations Plan (AOP) and Network
Operations Plan (NOP). In turn, NOP deployment is an enabler for operational
stakeholders and the European Network Manager to operate Network Collaborative
Management (NCM) by 1 Jan 2022. A-CDM implementation for airports identified by
the European Commission falls under the SESAR Deployment Manager (SDM) Pilot
Common Project (PCP) ATM Function (AF) 4 (NCM) requirements. This affects 4 UK
airports: Heathrow, Gatwick, Stansted and Manchester.
3.48 In the meantime, there is no ‘standard’ A-CDM implementation or stable end-to-end
testing platform, which has resulted in fragmented or incomplete implementations
across Europe. This situation continues to place pressure on airports, airlines and
ground handlers to deliver real time information on departures for the anticipated
performance benefits, but independent of the wider network.
3.49 Heathrow airport was an early adopter of A-CDM in the UK. Heathrow learning
centred around the challenge that cultural/behavioural change was on a par with the
challenge of system connectivity into the Network Manager. Accurate A-CDM data
input is critically dependent on local ground handlers, and its use is critically
dependent on the behaviours of pilots and local air traffic controllers. However, the
Heathrow community persevered so that the benefits of an accurate and shared flow
of information are now proving invaluable.
3.50 Other London area airports are yet to fully implement A-CDM, along with NATS for its
ability to use CDM messaging for its current systems. Both Gatwick and Stansted
have committed to implementing A-CDM and Heathrow has shared its experiences
through expert workshops.
3.51 Gatwick achieved EuroControl accreditation in Dec 2014, but the pre-production
environment set-up by EuroControl for system testing did not reflect the live
operational environment. As a result, Gatwick is currently operating in local mode,
but committed to re-enter network mode pending completed satisfactory testing.
3.52 Stansted is at the start of the journey, but committed to implementing A-CDM..
3.53 A fully functioning and harmonised A-CDM platform across the major airports in the
south east and wider UK could present a fundamental opportunity for improved
situational awareness and collaborative planning.
3.54 At the tactical level, the following inaccuracies can occur:
• Inaccurate ‘Off-block’ times;
• ‘Ghost’ flight plans; and
• Flights that do not turn up in a sector at the expected times.
3.55 Network Manager has suggested that such inaccuracies can result in up to 20 per
cent23 of unused available network capacity as a result of aircraft not operating in a
sector when they were indicated to be there. Indeed a sector could indicate ‘over
23 Data from EuroControl Network Manager (sector capacity versus actual utilisation)
Report of the Voluntary Industry Resilience Group, v1.0, December 2017 22
demand’, based on inaccurate data, that triggers a regulation when the aircraft were
not intending to operate there. This unnecessary ‘on the day’ regulation challenges
the consistency and accuracy of various elements of air traffic management. The
slow and uneven implementation of A-CDM has in turn resulted in a slow progression
to the expected improvements for stable and accurate data flow. Improvements in
off-block time information would result in a significant improvement in airspace
management.
FAA Collaborative Decision Making processes. 3.56 The VIRG engaged with the FAA Air Traffic Control System Command Centre
(ATCSCC) to understand the well-developed US air transport collaborative process
for integrating network control and dealing with operational disruption.
3.57 The US National Airspace System is large and complex, with over 5000 paved
airports, of which more than 500 are tower controlled. The FAA is both the regulator
and the ANS provider. The FAA system prioritises the top 30 airports in times of
disruption for recovery management.
3.58 The FAA has a long-established process for working with industry to develop the
network schedule and control continent-wide operations, with parts often subject to
extreme weather. Although US airspace is not uniformly congested, it contains
regions of extreme congestion, especially in the following areas:
• Washington, New York, Boston;
• Northern Midwest; and
• South west.
3.59 Similar to the UK, the USA is characterised by an open air transport market.
However, some of the FAA principles and tools to manage network congestion and
disruption are different to the UK/European context. In conjunction with the industry
network, it has developed a ‘playbook’ of air traffic management contingency plans,
which is constantly evolved. The playbook is publicly available on the FAA website
and contains plans for various weather scenarios, peak travel periods and other
foreseeable events.
3.60 Most of the system management plans in the playbook address domestic traffic and
therefore largely US airlines, though the FAA report a strong collaborative
relationship with Canada and Caribbean ANSPs and carriers.
3.61 The Command Center uses a well-established schedule of conference calls with FAA
regional units (airports, airlines) and industry bodies to consider factors affecting the
National Airspace System, define system management plans for the following day
and then tactical calls through the day to review and adjust progress. The playbook is
a key resource for these calls. There is also a daily review process (completed before
1100 eastern time) to review the previous day’s operation and consider any lessons
learned.
3.62 The FAA allows sharing of information and industry input through the calls where
appropriate, whilst retaining the deciding vote on final operational decisions.
However, the FAA reports that it is rarely necessary to use the deciding vote, as the
processes are widely understood and valued for their transparency by airspace users
and service providers.
Report of the Voluntary Industry Resilience Group, v1.0, December 2017 23
3.63 Following the industry calls (and at other times as necessary), the FAA issues
advisories to communicate the decisions. The advisories can be classified as follows:
• ‘Information’;
• ‘Recommended’; and
• ‘Required’.
3.64 Unlike UK Notices to Airmen (NOTAMs) for capacity management in disruption,
compliance with ‘Required’ advisories are mandatory.
3.65 The FAA continues to evolve processes for network control and coordination. In the
last year it has evolved a formal closed-loop process for collaborative tactical
management of the National Airspace System (NAS). It is developing an effective
process for system management through the PERTI process (i.e. Plan, Execute,
Review, Train and Improve). The process sets daily and monthly goals to drive
performance improvements and set expectations.
3.66 The VIRG observed that a similar information-sharing and review process could be
appropriate for the UK environment. Based on an adapted PERTI process for the UK
environment and hosted by NATS, it would be a useful contribution to stability and
resilience.
3.3 Serving the plan
Contemporary technology and operating practices 3.67 The current network is supported by varying levels of technology and processes that
could enhance performance and resilience, including:
• High performance navigation and communications on all modern transport
aircraft;
• Ground communication capabilities; and
• Situational awareness and decision support tools.
3.68 Full use of installed navigation and communications technology on contemporary
aircraft can be enabled through operating principles, practices and safety
interpretation changes. If used to the full extent possible in terms of aircraft
navigation capability and communications within the network, the technology would
contribute to improved resilience.
3.69 As demonstrated through the introduction of TBS at Heathrow, a relatively modest
change in operating process can provide significant benefits in capacity and
resilience. Heathrow Airport Limited (HAL) reports that TBS protects an average of
one movement per hour on normal days, and over 2 movements per hour on windy
days. This is a significant improvement in resilience.
3.70 Some examples of technology and operating principal opportunities include:
• Full use of current aircraft navigation and control systems to give precise
control in four dimensions (4D trajectory sharing), including speed and time. This
would require a review of NATS processes, CAA safety assessment guidance
and the flexibility to make operating changes within the existing Noise
Report of the Voluntary Industry Resilience Group, v1.0, December 2017 24
Preferential Routeing (NPR) structure. 4D trajectory sharing may facilitate a
reduction in current Time Based Departure Separations and should be
investigated. This implementation in Europe aligns with the SESAR Deployment
Manager PCP AF 6 requirements.
• Full implementation of A-CDM and the continued refinement of departure
sequencing algorithms could deliver Runway and Network efficiency. A-CDM
implementation in Europe falls under the SESAR Deployment Manager PCP AF
2 and 4 requirements.
• Enhanced arrival efficiency could be enhanced by using ‘required time of
arrival’ instructions. This will require development of the current ‘first come, first
served’ ATC principles and industry behaviours. The UK industry should quickly
adopt these principles and behaviours, interfacing appropriately with the
supporting SESAR deployment (implementation in Europe falls under the
SESAR PCP AF 4 requirements).
• Controller-pilot data link communications (CPDLC) is a data-based
communication technology, which is used for oceanic air traffic management and
by Maastricht for some European operations. Departure Clearances via Data link
(CDL) is also available at Heathrow and Gatwick for clearance delivery. Data link
significantly reduces VHF frequency voice communications and reduces human
errors, and supports more efficient departure clearances. The EC has mandated
airlines to equip all aircraft flying above 28,500 feet in European airspace by
February 2020 and for States to implement the ground equipment by February
2018.
Behaviours and training 3.71 With the increased use of sophisticated tools and growing volumes of data to
manage operations, it is increasingly important to ensure that operational staff are
supported by appropriate training.
3.72 In some cases, the competitive environment has encouraged individuals to seek
outcomes that are successful for their own organisations, but without consideration of
the interface with the overall network performance outcome.
3.73 Many organisations have competent and experienced personnel to support their
functions. Often levels of capability are achieved through experience rather than
competency based training focused on necessary skills, such as decision-making or
workload management. A common qualification and training standard is required to
achieve the following:
• Capability and currency of people engaged in scheduling and operational control
processes;
• Ability to effectively use the increasingly complex and sophisticated tools on
which the densely packed operation now relies; and
• Working in multi company teams.
3.74 In the UK, airports can propose capacity reductions to protect overall performance in
poor forecast weather. Several airports, including Heathrow and Gatwick, have
developed capable processes for this, advising the reductions via NOTAMs, but
Report of the Voluntary Industry Resilience Group, v1.0, December 2017 25
compliance is voluntary. Frequently, capacity freed through based carrier
cancellations is taken by non-based carriers that do not cancel their flights, in turn
exposing the based carriers to public criticism.
3.75 Several other factors point to the need for increased focus on training and behaviours
in managing a congested network. The inconsistent responses by different
operational leaders in similar circumstances may be a consequence of the lack of a
consistent approach to training. It is also often evident in disruption events, which can
be compounded by poor communications, confusion about management and
recovery options, and inefficient use of available resources. These issues are
manifested both within a company and between companies.
3.76 It’s worthwhile to note that similar concerns in flight operations prompted the
development of Cockpit Resource Management (CRM) philosophies and training.
Many CRM concepts and benefits are equally applicable to the operational control
environment.
3.4 Policing the plan
Authority to manage demand 3.77 As described in section 3.2, in the US the FAA uses ‘Required’ advisories to mandate
any required capacity reductions. In France, national law empowers airports to issue
mandatory NOTAMs. In the UK, the authority to manage capacity, either in normal or
disrupted operations, is less clear. Airport NOTAMs can only ‘request’ capacity
reductions, rather than ‘require’ or ‘mandate’ them.
3.78 Without the authority to reduce capacity (when required), short-term tactical
management and regulation may be required where airlines do not respond to a
NOTAM. Regulation during the operational day leaves little time for airlines and
airports to manage operations for minimum passenger impact.
3.79 The US experience, based on the long existing FAA coordination processes,
suggests that the air transport community recognises that occasional reductions and
other measures are necessary to mitigate disruption and expedite recovery. They
also recognise that a transparent, robust process, which can be enforced if
necessary, encourages all operators to participate fairly.
3.80 Despite the FAA’s ability to enforce a deciding vote in their coordination calls, the
FAA report that they need to rarely use that vote.
3.81 A similar demand versus capacity management process for the UK, with the ability to
mandate compliance when required, could significantly improve resilience on
forecast disruption days. Such a process should be collaborative, with a focused
review and improve element. It should also maintain choice for operators to retain
responsibility for their own operation.
3.82 Appendix 4 (section 11) provides further background information on the HAL
voluntary capacity process and the French, UK and EuroControl Network Manager
legislation differences.
Report of the Voluntary Industry Resilience Group, v1.0, December 2017 26
Authority and processes for alleviation of restrictions in disruption 3.83 Airport operations are bounded by many constraints beyond their physical capacities.
These constraints can include curfews, night jet ban measures, noise preferred
routes, and many more.
3.84 In a capacity constrained environment, coupled with these restrictions, there is often
little or no capacity for recovery after even brief disruptions. For example, weather in
the middle of the day or a brief runway blockage by an aircraft with a technical issue
can require a flow-rate restriction. On a peak day at Heathrow or Gatwick, this can
severely restrict the departure of all scheduled flights by the end of the day, with a
high probability of flight cancellations. Both airports can operate at 40 to 5524
movements per hour, so even short disruptions can affect large numbers of flights
and passengers.
3.85 During peak travel periods at Heathrow and Gatwick, a minor disruption in the
operation can result in a major disruption for passengers, airlines and airports. There
can be very few options to re-book passengers of cancelled flights onto subsequent
flights.
3.86 In these circumstances, clarity on the options available to potentially alleviate normal
constraints is necessary at the earliest possible opportunity. Clear and early
knowledge about the options available to complete the schedule within the
operational day (or not) is critical to maximise resilience. During such periods, it
would be helpful if EuroControl/NATS could:
• Offer greater volume of route alternatives during periods of high regulation; and
• Simplify the transaction process for airlines to accept and file revised flight plans,
in the event they wish to accept alternative routeings.
3.87 The ability to fly beyond the normal curfew of 2330L at Heathrow can be granted by
the Airport Operations Duty Manager, who will make the decision after assessing the
specific disruption conditions. However, granting of this alleviation can sometimes
only be confirmed late in the operational day, which can lead to additional stress on
the operation. All dispensations are granted after the event, when appropriate
evidence is available, and then submitted to the Department for Transport (DfT) for
their records. Consistent and timely processes for approving operational alleviations
is required.
3.5 Network coordination
3.88 As demand approaches capacity, the consequences of over demand appear only
during the operational day, and are then managed by ad-hoc regulation or local
measures on the day. Improved planning at a network level could identify issues at a
much earlier stage, thereby offering more options for alleviation. There needs to be a
mechanism to integrate the airport schedules and evaluate demand versus capacity
for SIDs, routes or sectors, and resolve conflicts. Similarly, in case of disruption on
the day, airport capacity limitations may be necessary.
3.89 The voluntary mechanisms for integrating the network schedule, as recommended by
this report, are necessary to deliver the necessary capacity, stability and predictability
24 Stansted can operate up 50 movements per hour.
Report of the Voluntary Industry Resilience Group, v1.0, December 2017 27
in the network. If such mechanisms are not adopted throughout the network, then
further solutions may be necessary to resolve conflicts.
3.90 In all cases, VIRG participants prefer to avoid imposed solutions and maintain as
much freedom as possible for individual entities to make the best possible business
decisions. Improved voluntary coordination, situational awareness, and cooperative
problem resolution would minimise the need for imposed limitations.
3.91 However, as demand approaches capacity limits, the responsibilities, process and
scope of powers for making final decisions need to be transparent and well-
understood by all stakeholders25.
4 High-level recommendations
4.1 Overview
4.1 Recommendations are made to reflect the opportunities identified in this report and
which are within the control of industry to implement voluntarily. The
recommendations are grouped into ‘Realistic Planning’, ‘Flying to Plan’, ‘Serving
the Plan’, ‘Policing the Plan’ and ‘Network Coordination’. These high-level
recommendations therefore act as a link between the opportunities identified in
section 3 and the more detailed recommendations described in section 5 for the
working groups’ progression.
4.2 Operations Director Liaison Group
4.2 Industry and the CAA should establish a high-level voluntary forum, to be known as
the Operations Director Liaison Group, to drive timely and effective operational
resilience improvements based on the detailed recommendations of this report. Other
emerging operational resilience issues and their resolutions should also be tracked.
The set-up should be modelled on the successful Flight Ops Liaison Group process.
4.3 The IRG will continue to request practical on-going support and sponsorship from the
Operations Directors or Chief Operating Officers of the IRG companies, including to
progress the recommendations and address new resilience challenges as they
emerge.
25 Ryanair fully supports initiatives to improve cooperation and collaboration with
industry partners to resolve conflicts in the event of disruption in the UK SE transport
system. However, Ryanair is opposed to any recommendations that impose limitations
on its decision to operate flights. As a last resort, if voluntary actions do not resolve
over-demand, Ryanair considers that the current use of ATFCM regulations provides a
transparent and equitable process to restrict traffic into airspace. It is then the airline’s
decision to cancel or delay.
Report of the Voluntary Industry Resilience Group, v1.0, December 2017 28
4.3 Realistic planning
4.4 Industry (NATS, ACL, airlines and airports) should work together to achieve
considerably improved ’network level’ coordination to enable enhanced planning,
enable timely conflict resolution and support continuous improvement reviews
including:
• A complete evaluation of proposed seasonal schedules, including their impact on
airspace management;
• Developing network level business continuity/contingency planning for network
disruption (including proactive mitigation of disruption causes and recovery
management); and
• Developing shared operational policies to mitigate disruption, such as non-
emergency diversions.
4.4 Flying to plan: Shared situational awareness and collaboration
processes
4.5 Industry should develop shared situational awareness and collaborative decision-
making processes:
• To share operational information on season, including pre-tactical and tactical
operations as necessary for resilient operations, within both the ‘letter’ and ‘spirit’
of competition law;
• To use a common analytical framework to inform and improve operations;
• To develop collaborative processes between airport, airline and NATS control
centres as necessary to support resilient network operations; and
• To develop network operational information sharing processes (between NATS
and industry) similar to the FAA ATCSCC PERTI model, appropriate for the UK
environment
4.5 Serving the plan: Contemporary technology
4.6 DfT, CAA, NATS and industry should establish a joint and timely commitment to
maximise and exploit contemporary technologies and related processes to maximise
resilience, including:
• Latest aircraft precision navigation technology and supporting ground systems;
• Shared data sources;
• Coordinated operational control;
• Full use of existing airspace; and
• Responsive safety regulation based on contemporary aircraft and systems.
4.6 Serving the plan: Behaviours and training
4.7 Industry should address behaviour and culture change required for collaborative
working, establishing a consistent level of training and capability to use and, where
Report of the Voluntary Industry Resilience Group, v1.0, December 2017 29
appropriate, enhance advanced operations control and network coordination
information tools.
4.7 Policing the plan: Clarity on current requirements
4.8 Industry, CAA and DfT should achieve clarity on rules to manage demand during
limited capacity and disruption.
4.8 Network coordination
4.9 Network resilience performance should be monitored by the ODLG and reviewed
annually to confirm that voluntary industry coordination remains sufficient to protect
network performance.
4.10 As network demand approaches or exceeds capacity, experience in other regions
and industries indicates that central coordination or control becomes necessary.
However, the industry prefers to use all possible voluntary processes before then.
The DfT and CAA should consider the level to which reduction in resilience
performance would require the establishment of a centralised network coordination.
5 Detailed recommendations
5.1 Overview and ODLG roadmap
5.2 Where possible, the VIRG has sought to advance thinking on the high-level
recommendations to ensure timely implementation. This section expands on those
recommendations in further detail, which will allow tangible actions associated with
planned and existing workstreams.
5.3 The recommendations may need further progression within the ODLG/IRG
framework to design and agree next steps and actions.
5.4 The VIRG provides the following general recommendation:
• Recommendation 1: Develop, with the ODLG, a roadmap of the detailed
recommendations, recognising that the continued rapid growth in the European
Network will require ongoing focus and industry innovation to maintain and
improve resilience:
• Develop a one-page summary for industrywide circulation that will articulate
the UK NAS Collaborative Decision Making (CDM) recommendations
delivery plan and roadmap, including a set of common themes/activities,
ensuring consistent language across the industry.
• Ensure engagement with the DfT, so that the recommendations align with
the development of the Aviation Strategy.
• Establish a means by which industry partners that do not meet the
membership criteria for IRG/ODLG remain informed of and engaged with the
resilience activity. For example, interface with other industry activities to
develop a communication relationship with the organisations identified.
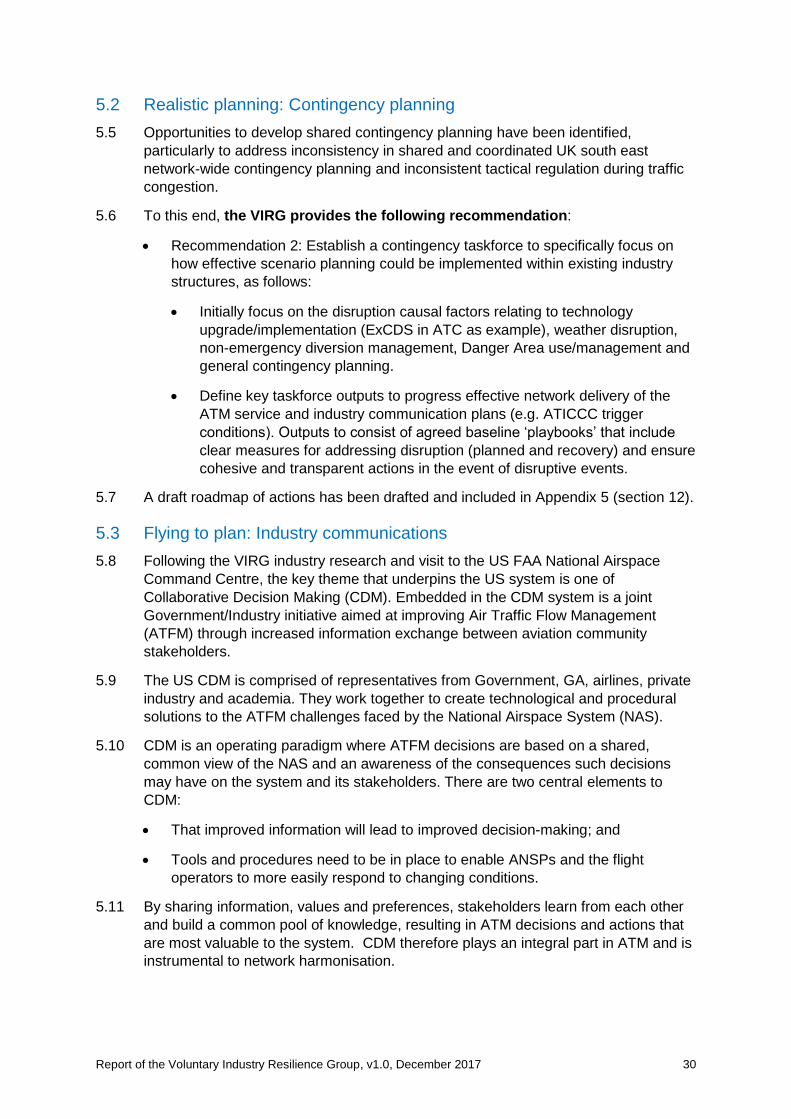
Report of the Voluntary Industry Resilience Group, v1.0, December 2017 30
5.2 Realistic planning: Contingency planning
5.5 Opportunities to develop shared contingency planning have been identified,
particularly to address inconsistency in shared and coordinated UK south east
network-wide contingency planning and inconsistent tactical regulation during traffic
congestion.
5.6 To this end, the VIRG provides the following recommendation:
• Recommendation 2: Establish a contingency taskforce to specifically focus on
how effective scenario planning could be implemented within existing industry
structures, as follows:
• Initially focus on the disruption causal factors relating to technology
upgrade/implementation (ExCDS in ATC as example), weather disruption,
non-emergency diversion management, Danger Area use/management and
general contingency planning.
• Define key taskforce outputs to progress effective network delivery of the
ATM service and industry communication plans (e.g. ATICCC trigger
conditions). Outputs to consist of agreed baseline ‘playbooks’ that include
clear measures for addressing disruption (planned and recovery) and ensure
cohesive and transparent actions in the event of disruptive events.
5.7 A draft roadmap of actions has been drafted and included in Appendix 5 (section 12).
5.3 Flying to plan: Industry communications
5.8 Following the VIRG industry research and visit to the US FAA National Airspace
Command Centre, the key theme that underpins the US system is one of
Collaborative Decision Making (CDM). Embedded in the CDM system is a joint
Government/Industry initiative aimed at improving Air Traffic Flow Management
(ATFM) through increased information exchange between aviation community
stakeholders.
5.9 The US CDM is comprised of representatives from Government, GA, airlines, private
industry and academia. They work together to create technological and procedural
solutions to the ATFM challenges faced by the National Airspace System (NAS).
5.10 CDM is an operating paradigm where ATFM decisions are based on a shared,
common view of the NAS and an awareness of the consequences such decisions
may have on the system and its stakeholders. There are two central elements to
CDM:
• That improved information will lead to improved decision-making; and
• Tools and procedures need to be in place to enable ANSPs and the flight
operators to more easily respond to changing conditions.
5.11 By sharing information, values and preferences, stakeholders learn from each other
and build a common pool of knowledge, resulting in ATM decisions and actions that
are most valuable to the system. CDM therefore plays an integral part in ATM and is
instrumental to network harmonisation.
Report of the Voluntary Industry Resilience Group, v1.0, December 2017 31
5.12 The VIRG recognises that the US model is very different to the UK/European
Network (Figure 4 provides an overview of the Network Management structure in
Europe). However, the core principles of collaboration and operating to plan are
aligned to with the SESAR A-CDM model26. Consideration must be given to suitably
scaled and designed collaborative processes that could be implemented in the UK,
using mainly existing processes and without significant financial investment.
Figure 4: Overview of European Network Management structure
5.13 To this end, the VIRG provides the following recommendations:
• Recommendation 3: Design the UK network communication structure as
follows:
• Undertake a detailed study of the FAA NAS CDM model to further
understand those elements that could be adopted and adapted into the UK
operation.
• Develop and execute a deployment plan, along with stakeholder
engagement, to adapt the existing NATS Airport Capacity Management
(ACM) model to a UK NAS CDM. Include a comprehensive review of the
NATS Air Traffic Incident Coordination and Communication Cell (ATICCC)
process to develop and deliver a Network Operations Cell (Command
Centre) concept, with NATS taking the lead on embedding FAA NAS
principles into a UK NAS model.
• Include a comprehensive closed loop review cycle that will support a
Daily/Monthly/Seasonal PERTI Plan (Plan, Execute, Review, Train, Improve)
with supporting stakeholder communications/engagement aligned with the
proven FAA model and ensuring the structure enables lesson-learning.
• Expedite initially the deployment of A-CDM across South East Airports via a
UK A-CDM working Group.
26 SESAR DM PCP AF4 requirements
Report of the Voluntary Industry Resilience Group, v1.0, December 2017 32
• Develop the Network Communications cell operating methodology that
prioritises a 5-airports South East network, engaging with the DfT and CAA
to underpin the activity.
• Interface with the Network Manager and representatives of the SDM PCP
AF4 to ensure that the developing UK NAS CDM process influences and is
influenced by SESAR Network Management and the development of airport
operations centre (APOC) / operations control (OCC) communication
protocols.
5.4 Flying the Plan: Common Analytical Framework
5.14 While the aviation industry generates an extensive range of data, a key finding of the
VIRG is that more could and should be done with the data that is available to better
understand the drivers of punctuality performance. The key challenges that the
industry has faced to date include:
• Difficulties in establishing a common data set, including a reluctance to share
insightful performance data across stakeholder groups;
• A lack of consistency in how performance is measured and interpreted; and
• The absence of an established forum to support a continuous improvement
cycle, particularly at the network level.
5.15 These challenges are not new to the industry, as demonstrated by the following
industry outcomes:
UK CAA Runway Resilience Study – Final Report, XPX Consulting and SH&E
Limited, December 2008
‘The quickest form of performance improvement may come from extension of CDM
and the data measurement and “Dashboard” opportunities which come from it.
Although not directly influencing capacity or demand, the improved knowledge and
ability to track more granular levels of process adherence may both improve
discipline and lead to better quantification of root cause problems.’
Delays to air transport in Europe: Methods of measuring, reporting and analysing –
European Observatory on Airport Capacity & Quality – Final Report of TASK
FORCE, May 2015
‘Availability of high quality data on the delays from all causes is an important
contributor to overall network performance. Europe is already well served with delay
data reported by airlines and airports, though the framework for analysing
understanding and responding is not fully harmonised, hindering the ability to fully
exploit its value, in particular the ability to evaluate the true causes of delay in detail.’
Gatwick Delay Root Cause Analysis – Final Report, PA Consulting, 21 May 2017
‘It was the foremost challenge of the study to obtain an agreed common data set
which has resulted in the absence of data from airlines and the wider system (e.g.
Eurocontrol) as well as the restriction of its use and publication within the final report.
This has been the rate limiting step in reaching stronger and statistically robust
insights on root causes and advancing beyond the initial signals from the exploratory
analysis undertaken.’
Report of the Voluntary Industry Resilience Group, v1.0, December 2017 33
5.16 The objective of developing a common analytical framework is therefore to ensure
that there is an agreed set of performance metrics that support an understanding of
network punctuality performance at both the strategic and tactical levels. The
framework is not intended to replace but rather to supplement the detailed
performance monitoring and root cause analysis undertaken by individual
organisations.
5.17 The development of a common analytical framework may also help to enhance the
punctuality performance reporting currently published by the CAA.
5.18 The key principles that have been adopted by the VIRG in developing an analytical
framework are as follows:
• A simple but informative set of metrics;
• Clear, unambiguous definitions and criteria;
• Readily available and repeatable data sets / analysis; and
• Representative set of performance metrics covering key performance drivers
(scheduling, airspace regulation and ground performance) across key
stakeholder groups (airlines, airports and ANSPs).
5.19 A key aspect of the approach has been to focus on objective outcomes rather than
subjective delay reporting. While a substantial body of delay reporting exists, the
industry has struggled in the past to agree on the accuracy and meaningfulness of
this data.
5.20 The following approach was adopted in developing the analytical framework:
• Review the performance metrics currently used across the industry including
within the various VIRG organisations and by recognised industry organisations
such as EuroControl’s CODA unit;
• Develop a shortlist of metrics for consideration by industry experts across all
stakeholder groups represented on VIRG and engage with those experts to
ensure that the framework adequately covers key performance drivers; and
• Seek formal support from the VIRG representatives for the proposed framework
and a willingness to share the data necessary to develop performance reports
under this framework.
5.21 15 metrics are proposed, covering a range of key performance drivers. These include
overall punctuality performance, airspace and aerodrome regulation, turn
performance, block performance and airfield performance as shown in Table 1.
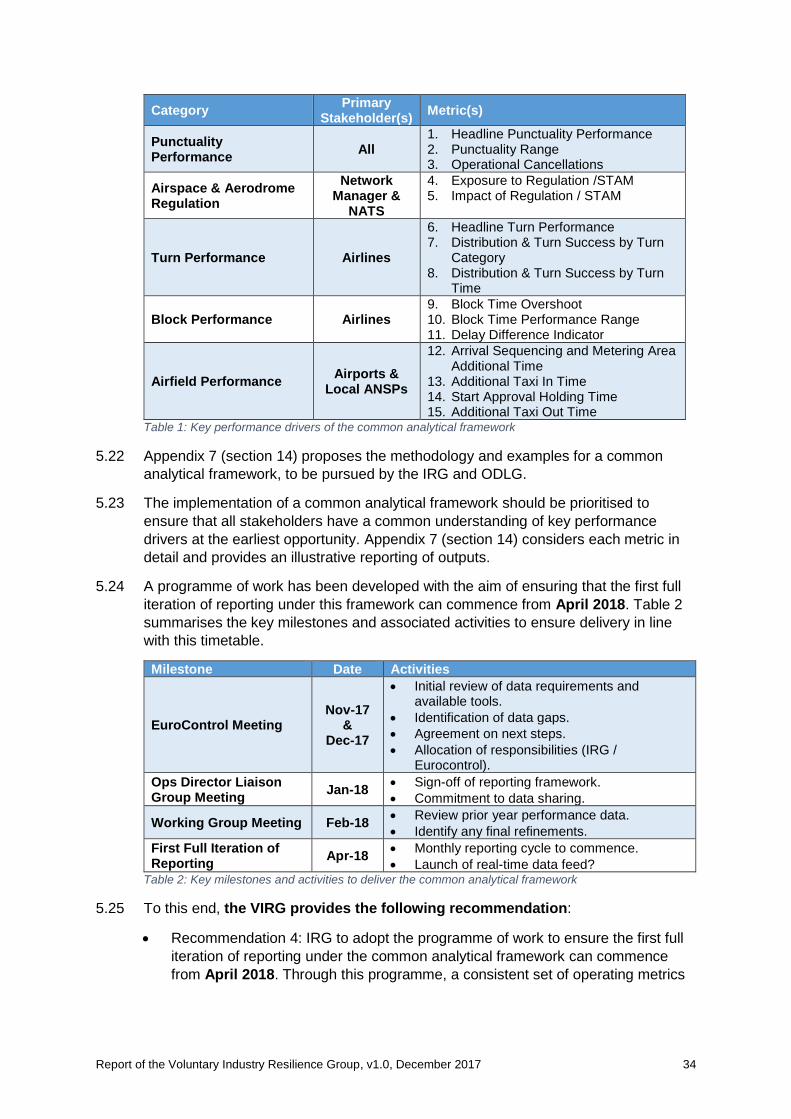
Report of the Voluntary Industry Resilience Group, v1.0, December 2017 34
Category Primary
Stakeholder(s) Metric(s)
Punctuality Performance
All 1. Headline Punctuality Performance 2. Punctuality Range 3. Operational Cancellations
Airspace & Aerodrome Regulation
Network Manager &
NATS
4. Exposure to Regulation /STAM 5. Impact of Regulation / STAM
Turn Performance Airlines
6. Headline Turn Performance 7. Distribution & Turn Success by Turn
Category 8. Distribution & Turn Success by Turn
Time
Block Performance Airlines 9. Block Time Overshoot 10. Block Time Performance Range 11. Delay Difference Indicator
Airfield Performance Airports &
Local ANSPs
12. Arrival Sequencing and Metering Area Additional Time
13. Additional Taxi In Time 14. Start Approval Holding Time 15. Additional Taxi Out Time
Table 1: Key performance drivers of the common analytical framework
5.22 Appendix 7 (section 14) proposes the methodology and examples for a common
analytical framework, to be pursued by the IRG and ODLG.
5.23 The implementation of a common analytical framework should be prioritised to
ensure that all stakeholders have a common understanding of key performance
drivers at the earliest opportunity. Appendix 7 (section 14) considers each metric in
detail and provides an illustrative reporting of outputs.
5.24 A programme of work has been developed with the aim of ensuring that the first full
iteration of reporting under this framework can commence from April 2018. Table 2
summarises the key milestones and associated activities to ensure delivery in line
with this timetable.
Milestone Date Activities
EuroControl Meeting Nov-17
& Dec-17
• Initial review of data requirements and available tools.
• Identification of data gaps.
• Agreement on next steps.
• Allocation of responsibilities (IRG / Eurocontrol).
Ops Director Liaison Group Meeting
Jan-18 • Sign-off of reporting framework.
• Commitment to data sharing.
Working Group Meeting Feb-18 • Review prior year performance data.
• Identify any final refinements.
First Full Iteration of Reporting
Apr-18 • Monthly reporting cycle to commence.
• Launch of real-time data feed? Table 2: Key milestones and activities to deliver the common analytical framework
5.25 To this end, the VIRG provides the following recommendation:
• Recommendation 4: IRG to adopt the programme of work to ensure the first full
iteration of reporting under the common analytical framework can commence
from April 2018. Through this programme, a consistent set of operating metrics
Report of the Voluntary Industry Resilience Group, v1.0, December 2017 35
can be developed and monitored at a network level to facilitate a continuous
improvement cycle and improved planning process.
5.5 Serving the plan: Ensuring full use of existing technologies (aircraft,
planning and ground processes)
5.26 Opportunities exist to exploit available technologies to improve capacity and deliver
greater resilience. These exist at:
• The airline schedule planning phase, to more collaboratively and dynamically
utilise the current SID structure, and on the day of operation to improve efficiency
through pre-tactical and tactical SID-balancing.
• An airport level, where A-CDM technology can be utilised to enhance the
coordination of aircraft and manage data flow prior to departure to optimise
runway capacity.
• At an airport level, introduced GPS-guided performance based navigation (PBN)
approaches, along with improved control of departure routes and aircraft speeds,
can safely introduce closer spacing through predictability of aircraft navigation
once airborne.
5.27 NATS and airlines explored the ideas generated by the VIRG to identify specific
workstreams that will address the fundamental issue of congested airspace through
existing technologies. The workstreams are defined based on those areas that will
provide the greatest efficiency gain or require ease of deliverability.
Recommendations are made that, if progressed in a coordinated manner, the sum of
incremental gains will deliver a significant improvement in network resilience.
Optimisation of departure routeings 5.28 The selection of the Standard Instrument Departure (SID) to be flown by an aircraft is
made by flight planners based on the principle of minimum track miles to be flown,
thereby minimising fuel burn and emissions per aircraft. There is a concentration of
routes that are flown to destinations south of the UK during peak summer months,
leading to a disproportionate loading in the related sectors and the consequent
application of flow controls. Mitigations have partially addressed this issue through
the use of alternative, longer SID routes to provide pre-planned alleviation to those
sectors, thereby avoiding the imposition of flow controls. However, this process
requires further measures to formalise the approach between airlines and NATS.
5.29 To this end, the VIRG provides the following recommendations:
• Recommendation 5: The Industry Resilience Group to consider pre-tactical and
tactical opportunities for sector offloads via alternative SID routes within set
windows prior to departure, enabling safe and efficient fuel planning. The
subsequent network wide benefit of such intervention would reduce both ground
and air delays, offsetting any increased fuel burn due to track extensions to
individual aircraft.
• Recommendation 6: With reference to the SDM PCP AF2 and AF4 respectively,
the IRG to consider how Airports can ensure flights are presented to the holding
area in an optimised sequence, supporting the optimum split of departure SIDs.
An efficient departure sequence could increase the departure rate, enable a
Report of the Voluntary Industry Resilience Group, v1.0, December 2017 36
quicker recovery from disruption and minimise the risk of night jet movements.
For example, the Departure Manager tool (DMAN) and A-CDM can manipulate
Target Start-up Approval Time (TSAT) algorithms to drive a more efficient
delivery at the runway holding area. A review should be conducted at each of the
5 large London Airports, with A-CDM best practice identified and then delivered
across the industry.
Consistent speed control on departures and arrivals 5.30 At present the variability of aircraft speed and acceleration profiles on departure and
arrival is accommodated through larger gaps between traffic. The separation of
arrivals based on ‘time’ rather than ‘distance’ has delivered proven benefits.
5.31 Control of aircraft separation by ‘time’ during windy conditions is already a proven
method for increasing resilience. For example, the introduction of TBS at London
Heathrow (LHR) in 2015 has resulted in an increase of 13 movements per day in all
wind conditions, rising to 44 per day in strong winds. LHR is currently working on the
optimisation of wake turbulence separation through utilisation of European Wake
Turbulence Categorisation (RECAT-EU), Optimised Runway Delivery (ORD) and
TBS Pair Wise.
5.32 To this end, the VIRG provides the following recommendations:
• Recommendation 7: The IRG to liaise with LHR and NATS and explore how the
use of TBS procedures at other UK airports could benefit the network through
improved resilience.
• Recommendation 8: The IRG to explore with NATS the implementation of tighter
measures and controls within current SID routes to reduce the time interval
between departing aircraft on similar SIDs and deliver a predictable rate of
aircraft to area controllers. The group should be cognisant of noise abatement
departure procedure (NADP) guidance, common aircraft capability and the
effects on CO2 emissions.
Reduce radar separation to 2.5nm on approach to all airports 5.33 Reducing the minimum separation on final approach could be used in suitable
weather to increase the tactically declared landing rate. This will minimise the
adverse effect of strong final approach headwinds on runway capacity and reduce
delays. Experience and procedures at airfields in the UK that currently utilise this
procedure will be invaluable in providing confidence and accelerating the
introduction.
5.34 To this end, the VIRG provides the following recommendation:
• Recommendation 9: The IRG to liaise with airfields that have already
implemented reduced final approach separation to consider how reducing the
minimum separation on final approach across all UK airfields would improve
runway throughput.
Runway inspections 5.35 Cognisant of the published guidance in the European Action Plan for the Prevention
of Runway Incursions, a review should consider the timing of inspections and how
technology should support the inspection process, potentially reducing the need to
enter the runway on every occasion. This could deliver a predictable inspection
Report of the Voluntary Industry Resilience Group, v1.0, December 2017 37
regime that minimises the impact to service delivery whilst managing runway safety
risk.
5.36 To this end, the VIRG provides the following recommendation:
• Recommendation 10: The IRG to support a review of Runway Inspection
procedures at each of the 5 London airports. This to include how practices and
technology in use at non-UK airports – e.g. foreign object debris (FOD) radar or
drone technology – could be applied to safely improve the timing of inspections
for minimising disruption of arrivals and departures.
5.6 Serving the plan: Behavioural and cultural change
5.37 Individual organisations should continue to support and enhance use of advanced
operations and network coordination information tools through changes to behaviours
and collaborative working.
5.38 To this end, the VIRG provides the following recommendation:
• Recommendation 11: Plan and execute the support required to deliver the
behavioural and cultural change across the industry that underpins collaborative
working:
• Ensure a comprehensive review of current operational communications to
understand the activities that remain relevant and will be required within a
refreshed UK NAS CDM structure.
• Ensure CDM training on the UK NAS CDM, aligned with the FAA model;
5.7 Policing the plan: A new set of rules
5.39 A new set of rules is required to manage demand in a fair, transparent and equitable
manner during limited capacity and disruption.
5.40 To this end, the VIRG provides the following recommendation:
• Recommendation 12: Establish a new set of rules that enhance the delivery of
current policy in Demand versus Capacity planning and management of
disruption, including:
• Authority to manage demand (route, sector, airport) during limited capacity
conditions or disruption;
• Triggering conditions for operational restriction alleviations during disruption;
• The flexibility available to make changes to operational procedures within
‘planned and permanent’ limitation; and
• Clear rules that treat operational stakeholders in a fair, transparent and
equitable manner.
Report of the Voluntary Industry Resilience Group, v1.0, December 2017 38
6 Summary and next steps 6.1 The VIRG was formed to make practical recommendations that could be
implemented voluntarily by industry to improve and maintain resilience of the UK
south east air transport network.
6.2 This report summarises the group’s work, observations and recommendations. The
group has also, with the encouragement of the Oversight Group (OG), begun to
implement some of the recommendations to prove their validity and to address
urgent issues. These include industry planning for the execution of the NATS ExCDS
programme and other network contingencies.
6.3 To ensure these recommendations progress forward and to address new resilience
challenges as they emerge, the VIRG will continue in existence, known simply as the
Industry Resilience Group (IRG). The IRG will continue to request practical on-going
support and sponsorship from the Operations Directors or Chief Operating Officers of
the VIRG companies.
6.4 With the encouragement from the OG, this Ops Directors Group has already
convened, demonstrating industry’s commitment to operational resilience. Known as
the Ops Directors Liaison Group (ODLG) and modelled on the long-standing and
successful Flight Operations Liaison Group (FOLG), the group has endorsed the
VIRG recommendations and committed to support their implementation.
6.5 Both the ODLG and IRG will be resourced and chaired by industry. The CAA have
also agreed to co-chair the ODLG, following the FOLG model.
6.6 The VIRG has developed detailed workplans for some of the recommendations, to
provide early benefits. It has also laid the groundwork for developing the design and
implementation plans for the rest of the recommendations.
6.7 The VIRG’s engagement with the FAA and EuroControl Network Manager and
CODA has already established links that will allow the development of the VIRG
recommendations to integrate with similar initiatives in those areas. The
recommendations will also initiate links with the SESAR Deployment Manager,
particularly PCP AF4 Network Collaborative Management (specifically A-CDM) and
PCP AF2 Airport Integration and Throughput (specifically DMAN and TBS).
6.8 The VIRG finishes the initial recommendation phase of its work confident that there is
scope, and industry commitment, to maintain and improve resilience by voluntary
means. However, it is also very clear that this voluntary effort does not eliminate the
need for urgent strategic development of airspace and infrastructure to support the
growth and long-term resilience of the vital UK South East air transport network.
Report of the Voluntary Industry Resilience Group, v1.0, December 2017 39
7 Acknowledgements 7.1 The VIRG members wish to acknowledge:
• The support and guidance of CAA CEO, Andrew Haines, and other members of
the Oversight Group.
• The support of the leadership of the VIRG participating companies.
7.2 They wish to also acknowledge the expert input and advice of the following
presenters to the VIRG:
• ACL: Peter Robinson
• American Airlines: Tobin Miller
• BA: Neil Cottrell
• DfT: Ian Elston, Nishan Shah
• EuroControl: Joe Sultana, Kazan Bucuroiu, Yves de Wandeler, David Marsh
• FAA: Greg Byus, Tom Nielson, Jim Linney
• GAL: Neil Harvey, Liz Townsend, Goran Jovanovic
• HAL: Alison Bates
• MAG: Louis Chemont, Andy Wright
• NATS: Wendy Howard-Allen
7.3 The VIRG team wishes to thank Glen Smith and Chris Barnes of Trax International
for their assistance in compiling this final report.
7.4 The chairman wishes to thank the VIRG members for their enthusiastic participation,
spirit of openness and robust debate.
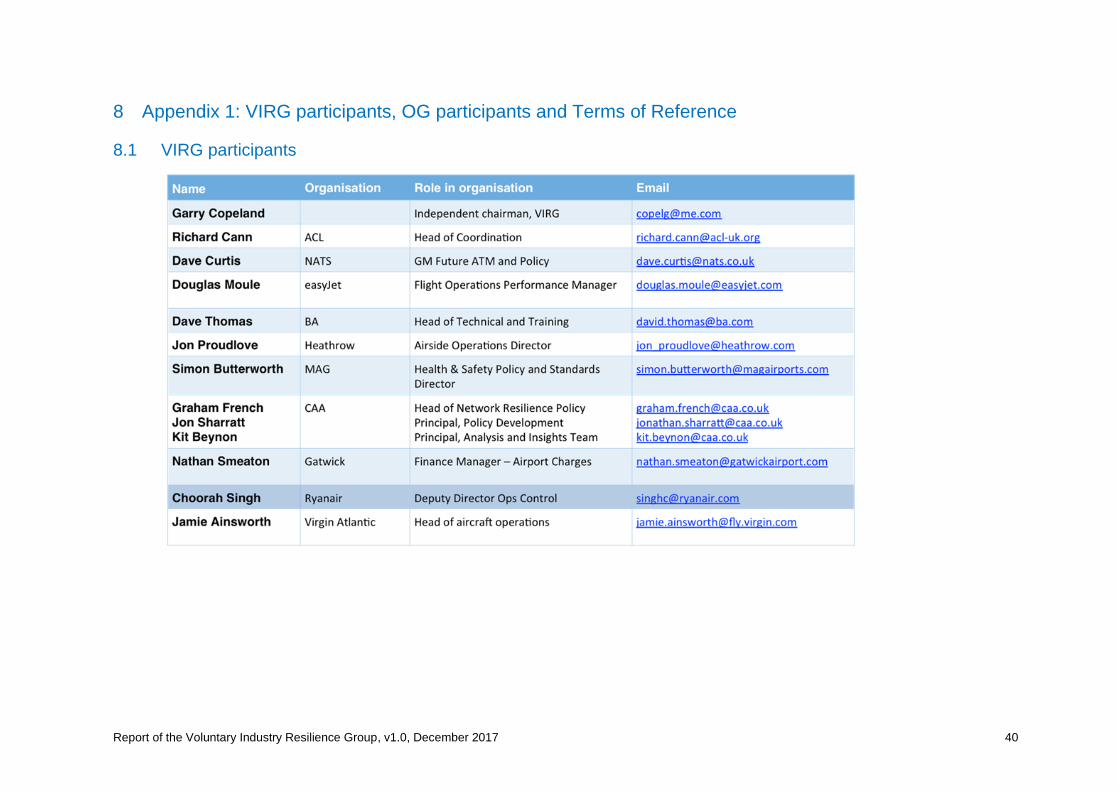
Report of the Voluntary Industry Resilience Group, v1.0, December 2017 40
8 Appendix 1: VIRG participants, OG participants and Terms of Reference
8.1 VIRG participants
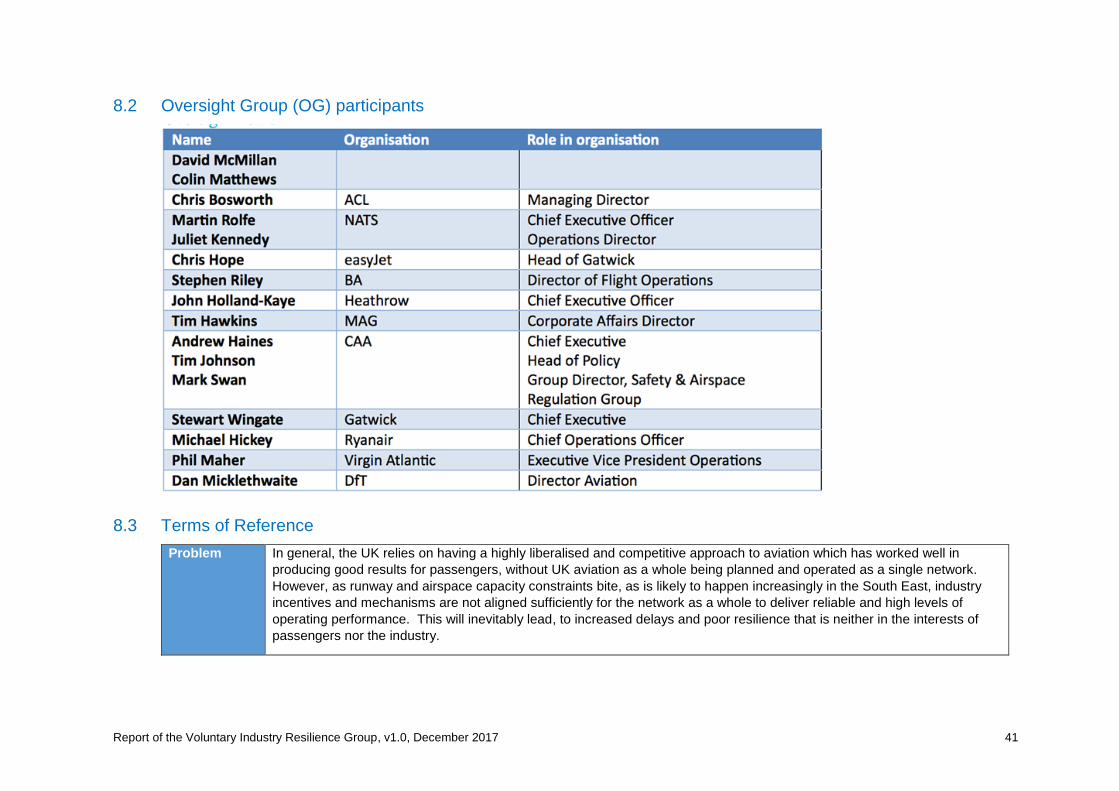
Report of the Voluntary Industry Resilience Group, v1.0, December 2017 41
8.2 Oversight Group (OG) participants
8.3 Terms of Reference
Problem In general, the UK relies on having a highly liberalised and competitive approach to aviation which has worked well in
producing good results for passengers, without UK aviation as a whole being planned and operated as a single network.
However, as runway and airspace capacity constraints bite, as is likely to happen increasingly in the South East, industry
incentives and mechanisms are not aligned sufficiently for the network as a whole to deliver reliable and high levels of
operating performance. This will inevitably lead, to increased delays and poor resilience that is neither in the interests of
passengers nor the industry.
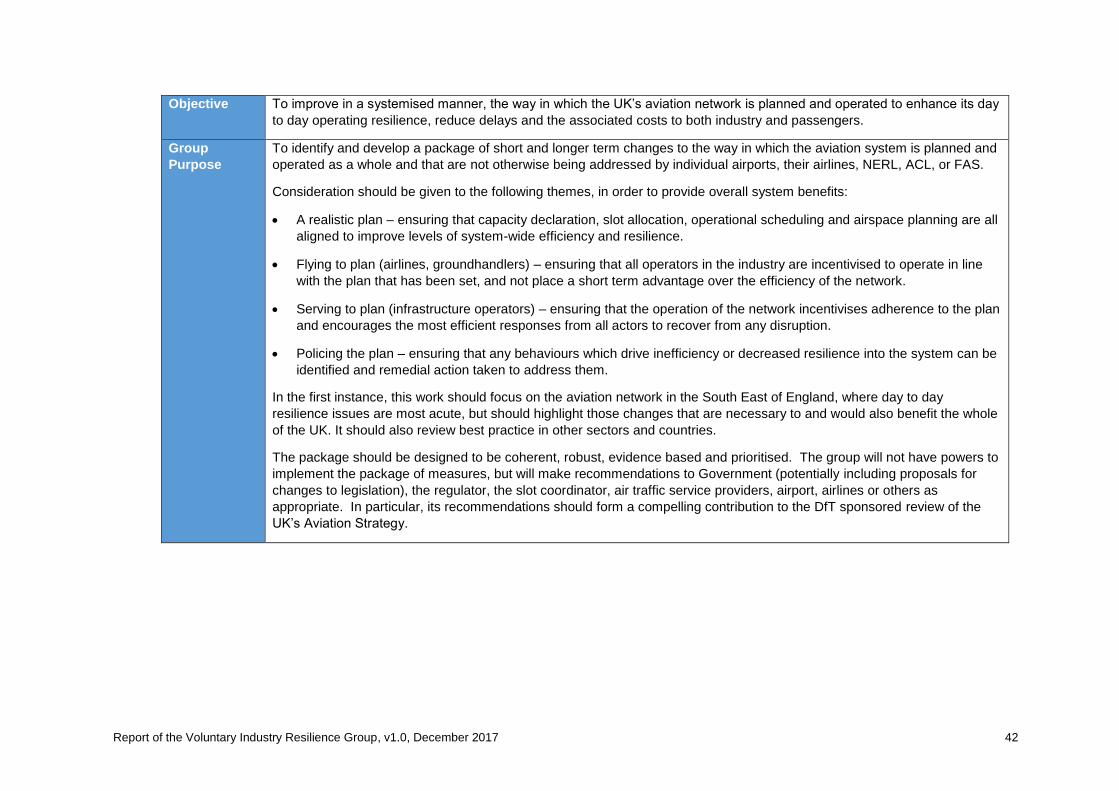
Report of the Voluntary Industry Resilience Group, v1.0, December 2017 42
Objective To improve in a systemised manner, the way in which the UK’s aviation network is planned and operated to enhance its day
to day operating resilience, reduce delays and the associated costs to both industry and passengers.
Group
Purpose
To identify and develop a package of short and longer term changes to the way in which the aviation system is planned and
operated as a whole and that are not otherwise being addressed by individual airports, their airlines, NERL, ACL, or FAS.
Consideration should be given to the following themes, in order to provide overall system benefits:
• A realistic plan – ensuring that capacity declaration, slot allocation, operational scheduling and airspace planning are all
aligned to improve levels of system-wide efficiency and resilience.
• Flying to plan (airlines, groundhandlers) – ensuring that all operators in the industry are incentivised to operate in line
with the plan that has been set, and not place a short term advantage over the efficiency of the network.
• Serving to plan (infrastructure operators) – ensuring that the operation of the network incentivises adherence to the plan
and encourages the most efficient responses from all actors to recover from any disruption.
• Policing the plan – ensuring that any behaviours which drive inefficiency or decreased resilience into the system can be
identified and remedial action taken to address them.
In the first instance, this work should focus on the aviation network in the South East of England, where day to day
resilience issues are most acute, but should highlight those changes that are necessary to and would also benefit the whole
of the UK. It should also review best practice in other sectors and countries.
The package should be designed to be coherent, robust, evidence based and prioritised. The group will not have powers to
implement the package of measures, but will make recommendations to Government (potentially including proposals for
changes to legislation), the regulator, the slot coordinator, air traffic service providers, airport, airlines or others as
appropriate. In particular, its recommendations should form a compelling contribution to the DfT sponsored review of the
UK’s Aviation Strategy.
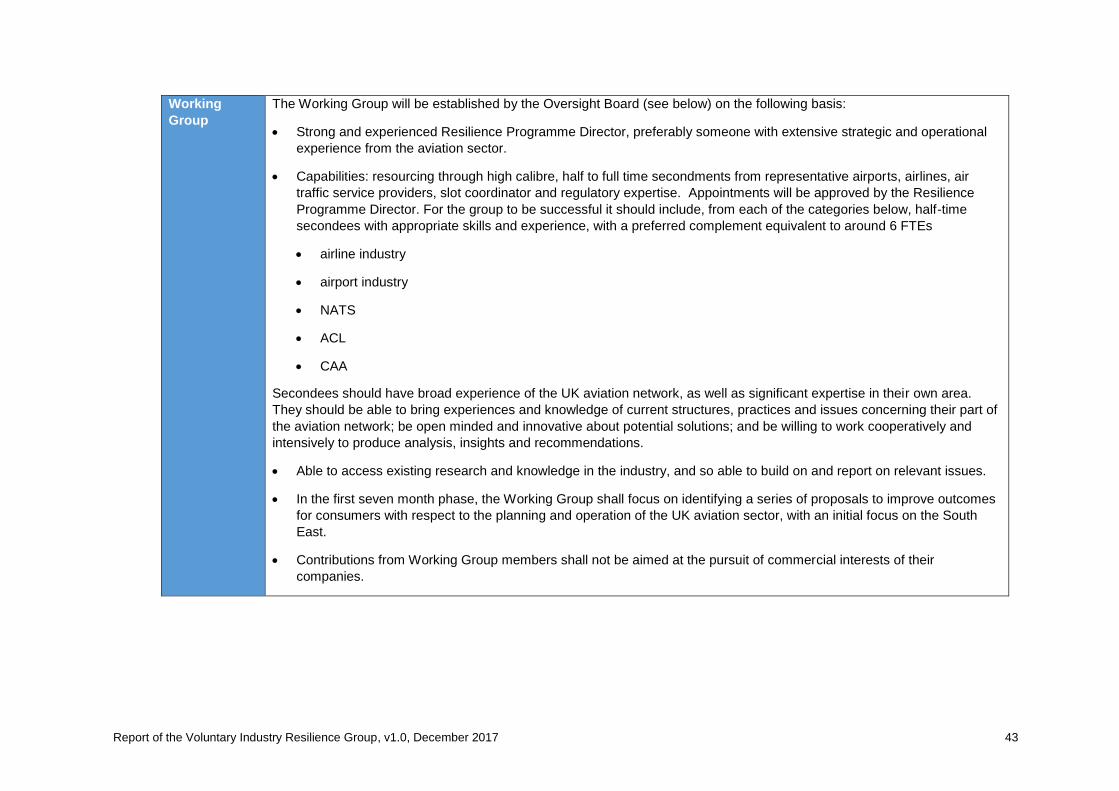
Report of the Voluntary Industry Resilience Group, v1.0, December 2017 43
Working
Group
The Working Group will be established by the Oversight Board (see below) on the following basis:
• Strong and experienced Resilience Programme Director, preferably someone with extensive strategic and operational
experience from the aviation sector.
• Capabilities: resourcing through high calibre, half to full time secondments from representative airports, airlines, air
traffic service providers, slot coordinator and regulatory expertise. Appointments will be approved by the Resilience
Programme Director. For the group to be successful it should include, from each of the categories below, half-time
secondees with appropriate skills and experience, with a preferred complement equivalent to around 6 FTEs
• airline industry
• airport industry
• NATS
• ACL
• CAA
Secondees should have broad experience of the UK aviation network, as well as significant expertise in their own area.
They should be able to bring experiences and knowledge of current structures, practices and issues concerning their part of
the aviation network; be open minded and innovative about potential solutions; and be willing to work cooperatively and
intensively to produce analysis, insights and recommendations.
• Able to access existing research and knowledge in the industry, and so able to build on and report on relevant issues.
• In the first seven month phase, the Working Group shall focus on identifying a series of proposals to improve outcomes
for consumers with respect to the planning and operation of the UK aviation sector, with an initial focus on the South
East.
• Contributions from Working Group members shall not be aimed at the pursuit of commercial interests of their
companies.
Report of the Voluntary Industry Resilience Group, v1.0, December 2017 44
Oversight An Oversight Board, which the CAA, DfT or an independent 3rd party would chair, and with CEO level membership drawn
from a number of airlines, airports, air traffic service providers, the slot coordinator, CAA, the DfT and some independent 3rd
parties.
The Oversight Board will establish a Working Group under the leadership of a Resilience Programme Director, and then
meet quarterly to review the progress of the Working Group and assess how best to implement its recommendations.
Oversight Board membership will be no more than 13, who will be drawn from those organisations that provide secondees
to the Working Group as well as two to three non-executive advisors.
Funding of the Working Group arrangements will be agreed by the Oversight Board (consultancy and legal advice where
required, not yet estimated but could require a budget of between £250k - £750k depending on level of active industry
participation). The CAA will fund the appointment of the Programme Director and provide some office accommodation for
the Working Group.
The Oversight Board will facilitate access to existing research and knowledge across the industry.
Recognising the wider stakeholder interest, the Oversight Board will establish communications with a wider stakeholder
group of airlines serving the UK, airports, air traffic service providers, trade associations, etc. in order to share progress.
Deliverables By 31 November 2017: Working Group to deliver to Oversight Board a recommended package of changes to deliver
improved overall operating resilience for the aviation network in the South East as a whole. The recommendations shall be
evidence based, highlight trade-off decisions required and shall be prioritised based on positive resilience impact, and the
cost and ease of implementation. This may include submitting relevant recommendations into the DfT’s review of the UK’s
Aviation Strategy.
From 1 December 2017: Oversight Board to assess how to proceed given the recommendations of the Working Group.
Subsequent phases of work are scoped, which may include direct implementation, engagement in the Government Aviation
Strategy, or the re-establishment of the Working Group.
Subsequent phases of work will be agreed by the Oversight Board.
Report of the Voluntary Industry Resilience Group, v1.0, December 2017 45
Inputs The Working Group will be able to draw on a number of previous pieces of work on delay and resilience, as well as
information from the members of the Oversight Board:
• The CAA’s current study on resilience (expected to be published in April 2017)
• The CAA commissioned consultancy report on delay at Gatwick Airport (expected to be completed in March 2017)
• The 2011 Begg report on snow disruption at LHR, and the 2014 McMillan report on flooding at Gatwick
• The 2011 reports of the Punctuality, Delay and Resilience subgroup of the South East Airports Taskforce
• The 2008 UK CAA Runway Resilience Report (prepared by Helios, XPX Consulting and SH&E Ltd).
• Data from members of the Working Group on, for example, planning assumptions, processes and procedures, actual
operational data, supplier relationships and resourcing, and performance incentives.
The Oversight Board and Working Group shall protect commercially sensitive information where required. Furthermore it is
for each individual participant in the Resilience Group to ensure that it is complying with competition law (where appropriate
seeking specialist advice).
Report of the Voluntary Industry Resilience Group, v1.0, December 2017 46
9 Appendix 2: References
9.1 Previous studies and recommendations
1. Report of the Heathrow Winter Resilience Enquiry (Begg report), March 2011
2. Airport Performance Facilitation Group, November 2012
3. CAA runway resilience final report, 2008
4. South East Airports Taskforce (SEAT) report, April 2011
5. 2014 airports commission operational efficiency, airspace
6. 2014 SDG for CAA – workstream 3 Final Report – Resilience at LHR and LGW
7. DfT Transport Resilience Report. July 2014
8. 2015 NATS for Airports Commission, operational risk, airspace resilience
9. CAA CAP 1515: Operating Resilience and the consumer interest
10. CAA CAP 1516: Gatwick delay causation study
11. CAA CAP 1420: CAP1420: Operating resilience of the UK’s aviation infrastructure: A
request for information
12. The Recommendations of the South East Airports Task Force (2017 01 05 SEAT
recommendations – Action 24)
13. House of Commons briefing paper on airport slots, 12 June 2017
9.2 FAA documents
14. NextGen Operator and Airport Enablers, Supplement to NextGen Investment for
Operators and Airports, FAA’s NextGen Implementation Plan, March 2012
15. FAA ATO Operational Contingency to NATS UK, Sept 2017
16. FAA TFM in the NAS booklet, 20 Sept 2017
9.3 EuroControl documents
17. EuroControl Trends in Air Traffic Volume 7 - Planning for Delay: influence of flight
scheduling on airline punctuality
18. EuroControl: standard input data for cost benefit analyses V7.0 November 2015
19. A-CDM impact assessment, 2016
20. CODA network performance – VIRG meeting 06 Jul 2017 -11-09
21. Demand Data Repository (DDR) 2 Strategic Forecast
22. Airport Operator Data Flow - IR390 Performance Data Specification for CODA, Edition
00-11 (04-09-2014)
Report of the Voluntary Industry Resilience Group, v1.0, December 2017 47
9.4 VIRG member presentations
23. ACL presentation to CAA Resilience Group, June 2017
24. BA schedule planning presentation, 2017
25. easyJet operational Performance management
26. HAL Beyond the Horizon, October 2017
27. MAG Operations performance for VIRG, 19 July 2017
28. NATS data brief for VIRG, 19 June 2017
29. NATS presentation for Swanwick Industry Resilience meeting, 14/06/2017
30. RYR CODA report, Ryanair, 01 02 2017
31. VIRG GAL presentation, 6 July 2017
32. Schedule Balancing Act presentation, Ryanair, 9 August 2017
33. VIRG presentation, Virgin Atlantic, October 2017
9.5 Network Rail documents
34. The Network Code
35. Rail Operators Code – Section 3: adverse and extreme weather
9.6 Third party presentations
36. ACI presentation, Network Directors of Operations (NDOP) – 16, Nicosia, 2017-03-23
37. NDOP-16 Airport Integration NM strategy v1, 2017-03-23
38. VIRG presentation of Munich Airport (EDDM) adverse weather, DFS
39. IATA LCAM sub group, EAPM, March 2017
40. USA Comms, Tobin Miller, 26 July 2017
10 Appendix 3: Other industry activities 10.1 It is recommended that the Industry Resilience Group (IRG) continue to monitor and
influence the activity and output from the industry activities below, exchanging
progress updates and collaborating where necessary.
10.1 SESAR
10.2 The Single European Sky (SES) is an ambitious initiative that was launched by the
European Commission in 1999 and now provides the overarching framework to
upgrade the airspace and air transport network across Europe.
10.3 The SESAR Programmes are the technological pillar of the SES, the objective of
which is to modernise European ATM by defining, developing and delivering new or
improved technologies and procedures. SESAR programmes have been delivering
on implementation projects since 2015 based on the regulation about the
implementation of the Pilot Common Project (PCP - EU 716/2014).
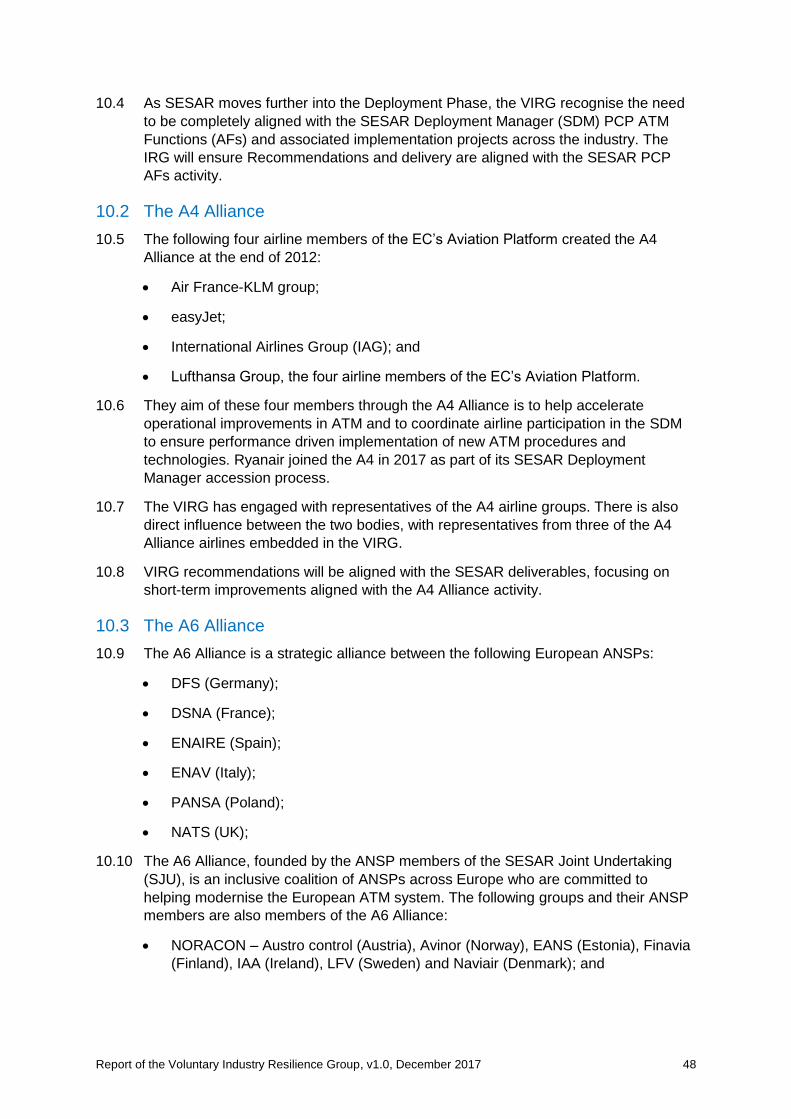
Report of the Voluntary Industry Resilience Group, v1.0, December 2017 48
10.4 As SESAR moves further into the Deployment Phase, the VIRG recognise the need
to be completely aligned with the SESAR Deployment Manager (SDM) PCP ATM
Functions (AFs) and associated implementation projects across the industry. The
IRG will ensure Recommendations and delivery are aligned with the SESAR PCP
AFs activity.
10.2 The A4 Alliance
10.5 The following four airline members of the EC’s Aviation Platform created the A4
Alliance at the end of 2012:
• Air France-KLM group;
• easyJet;
• International Airlines Group (IAG); and
• Lufthansa Group, the four airline members of the EC’s Aviation Platform.
10.6 They aim of these four members through the A4 Alliance is to help accelerate
operational improvements in ATM and to coordinate airline participation in the SDM
to ensure performance driven implementation of new ATM procedures and
technologies. Ryanair joined the A4 in 2017 as part of its SESAR Deployment
Manager accession process.
10.7 The VIRG has engaged with representatives of the A4 airline groups. There is also
direct influence between the two bodies, with representatives from three of the A4
Alliance airlines embedded in the VIRG.
10.8 VIRG recommendations will be aligned with the SESAR deliverables, focusing on
short-term improvements aligned with the A4 Alliance activity.
10.3 The A6 Alliance
10.9 The A6 Alliance is a strategic alliance between the following European ANSPs:
• DFS (Germany);
• DSNA (France);
• ENAIRE (Spain);
• ENAV (Italy);
• PANSA (Poland);
• NATS (UK);
10.10 The A6 Alliance, founded by the ANSP members of the SESAR Joint Undertaking
(SJU), is an inclusive coalition of ANSPs across Europe who are committed to
helping modernise the European ATM system. The following groups and their ANSP
members are also members of the A6 Alliance:
• NORACON – Austro control (Austria), Avinor (Norway), EANS (Estonia), Finavia
(Finland), IAA (Ireland), LFV (Sweden) and Naviair (Denmark); and
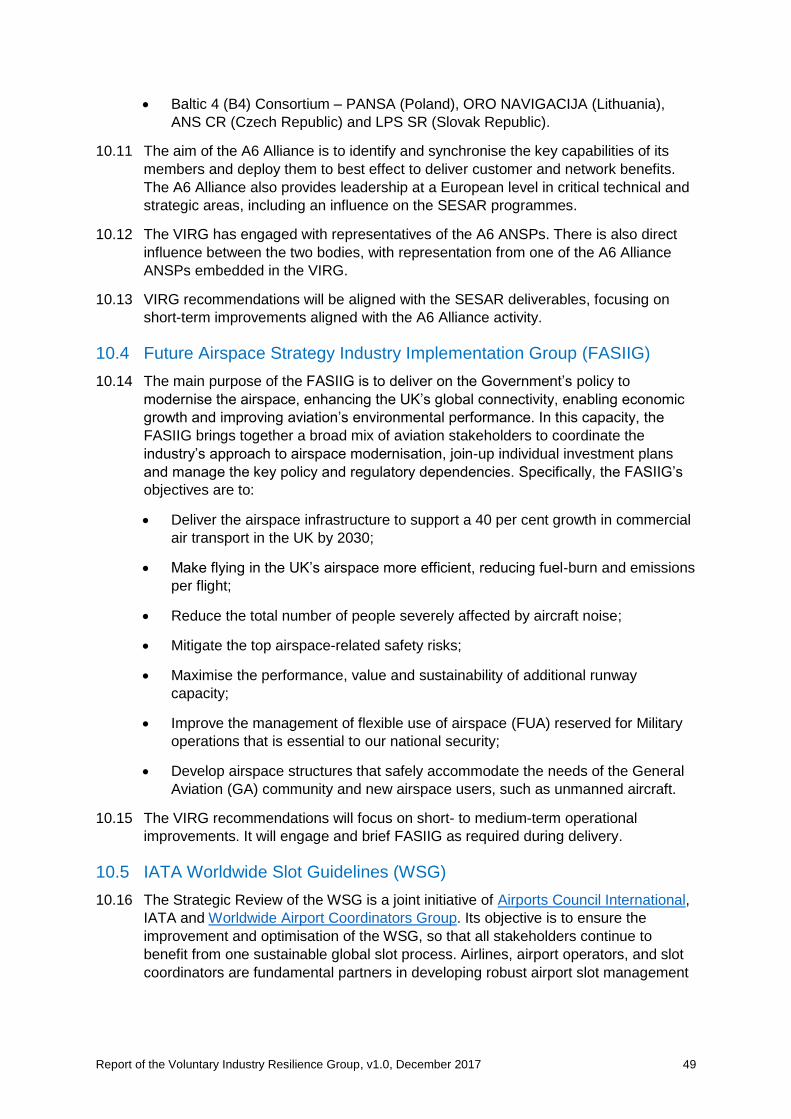
Report of the Voluntary Industry Resilience Group, v1.0, December 2017 49
• Baltic 4 (B4) Consortium – PANSA (Poland), ORO NAVIGACIJA (Lithuania),
ANS CR (Czech Republic) and LPS SR (Slovak Republic).
10.11 The aim of the A6 Alliance is to identify and synchronise the key capabilities of its
members and deploy them to best effect to deliver customer and network benefits.
The A6 Alliance also provides leadership at a European level in critical technical and
strategic areas, including an influence on the SESAR programmes.
10.12 The VIRG has engaged with representatives of the A6 ANSPs. There is also direct
influence between the two bodies, with representation from one of the A6 Alliance
ANSPs embedded in the VIRG.
10.13 VIRG recommendations will be aligned with the SESAR deliverables, focusing on
short-term improvements aligned with the A6 Alliance activity.
10.4 Future Airspace Strategy Industry Implementation Group (FASIIG)
10.14 The main purpose of the FASIIG is to deliver on the Government’s policy to
modernise the airspace, enhancing the UK’s global connectivity, enabling economic
growth and improving aviation’s environmental performance. In this capacity, the
FASIIG brings together a broad mix of aviation stakeholders to coordinate the
industry’s approach to airspace modernisation, join-up individual investment plans
and manage the key policy and regulatory dependencies. Specifically, the FASIIG’s
objectives are to:
• Deliver the airspace infrastructure to support a 40 per cent growth in commercial
air transport in the UK by 2030;
• Make flying in the UK’s airspace more efficient, reducing fuel-burn and emissions
per flight;
• Reduce the total number of people severely affected by aircraft noise;
• Mitigate the top airspace-related safety risks;
• Maximise the performance, value and sustainability of additional runway
capacity;
• Improve the management of flexible use of airspace (FUA) reserved for Military
operations that is essential to our national security;
• Develop airspace structures that safely accommodate the needs of the General
Aviation (GA) community and new airspace users, such as unmanned aircraft.
10.15 The VIRG recommendations will focus on short- to medium-term operational
improvements. It will engage and brief FASIIG as required during delivery.
10.5 IATA Worldwide Slot Guidelines (WSG)
10.16 The Strategic Review of the WSG is a joint initiative of Airports Council International,
IATA and Worldwide Airport Coordinators Group. Its objective is to ensure the
improvement and optimisation of the WSG, so that all stakeholders continue to
benefit from one sustainable global slot process. Airlines, airport operators, and slot
coordinators are fundamental partners in developing robust airport slot management
Report of the Voluntary Industry Resilience Group, v1.0, December 2017 50
policies. The review is based on the WSG principles of transparency, flexibility,
sustainability, certainty, and consistency. Its working groups include:
• Airport Levels;
• Historic Determination;
• Slot Performance Monitoring; and
• Access to congested Airports.
10.17 The VIRG will continue to monitor activity within the working groups, the most
relevant being ‘Slot Performance Monitoring’, which looks at enhancing the
application of performance monitoring and how the planning process can better
support performance on the day. VIRG participants have representatives on this
group.
10.6 European Airport Punctuality Network (EAPN)
10.18 The EAPN is an official working group affiliated to the Airports Council International
(ACI) EUROPE Technical and Operational Safety Committee (TOSC). It was set up
in January 2009 with the objective to exchange consistent data and best practices
concerning punctuality among European airports.
10.19 The initial focus of the EAPN will be around the standardisation of Delay Coding to
support improved airport delay analysis. The VIRG will monitor activity and subsume
the output of the EAPN.
10.7 The European Airport Coordinators Association (EUACA)
10.20 EUACA is the trade association of airport coordinators and schedule facilitators. Its
mission is to deliver a professional, neutral, transparent, non-discriminatory service to
the aviation industry through contributing to efficient solutions to optimise capacity at
European airports.
10.21 The VIRG will maintain a relationship with the EUACA through ACL, which is a
member.
10.8 UK Operations Managers Association (UKOMA)
10.22 UKOMA is a non-commercial, non-profit organisation that allows the operations
managers from the UK’s leading airlines and aircraft operators to cooperate and
share mutual experiences without commercial gain.
10.23 The VIRG has presented to the UKOMA on its research and recommendations and
will continue to inform the Association in the future.
Report of the Voluntary Industry Resilience Group, v1.0, December 2017 51
10.9 Network Directors of Operations (NDOP) Group Airport Integration
(APTI) Taskforce (TF)
10.24 The NDOP APTI TF is required to:
• Identify and document changes in processes related to Air Traffic Flow and
Capacity Management (ATFCM) that will support the better integration of airports
with the network; and
• Assess and outline the changes that are required in terms of roles and
responsibilities between the main partners, defined as:
• the ANSP flow management positions (FMPs);
• local ATC (as an integral part of the Airport Operations Centre (APOC)
concept);
• Airport Operators (as the driver for the APOC implementations); and
• the Network Manager Operations Centre (NMOC).
10.25 As far as possible, the Task Force assesses where existing rules and regulations
might be affected by the changes. The VIRG will track activity of this group through
the VIRG representative organisations that are part of the Task Force.
10.10 Airport Operators Association (AOA)
10.26 The AOA is the national voice of UK Airports. It is a trade association representing
the interests of UK airports, engaging with the UK Government and regulatory
authorities on airport matters.
10.27 The VIRG has plans in place to present an activity update to the AOA Operations
Meeting and will seek AOA support for an appropriate engagement strategy for non-
member organisations.
11 Appendix 4: Demand versus capacity management
11.1 Background
11.2 Several UK airports, including Heathrow and Gatwick, currently operate at (or near
to) their maximum capacity for large parts of the day. Consequently, when an event
causes disruption, the time required for the airport to recover can be significant.
11.2 HAL voluntary capacity process
11.3 HAL operates a voluntary capacity reduction process to reduce the number of flights
operating. The primary objective of this Capacity Constraints Policy is to ensure
optimal resilience for all Heathrow operations during events that cause disruption.
This involves the airport consulting, deciding and requesting that airlines reduce their
flights by a percentage for a certain period. For some situations, this may require
airlines to re-schedule outside the disrupted period to reduce delays and congestion
and for the airport operation to recover as quickly as possible.
11.4 Sometimes it is difficult for airlines with low frequency operations to reduce flights
and re-book passengers, which is taken into account in the policy guidance produced
Report of the Voluntary Industry Resilience Group, v1.0, December 2017 52
by HAL. For example, a carrier with four flights a day would not be expected to take
one flight out of the schedule with a 10 per cent reduction request.
11.5 As the airport process is voluntary it can lead to some airlines not acting on the
request, whether for operational or compensation reasons. It may be unclear to
airlines being asked to cancel whether the situation is considered an ‘exceptional
circumstance’. The effects on recovery can also be disproportionate for airlines
operating higher volumes of flights in the schedule.
11.3 French DGAC (French Civil Aviation Authority)
11.6 In contrast, France operates a non-voluntary scheme for capacity issues, including
due to extreme weather.
11.7 DGAC relies on EC regulation 1008/2008 Article 21 to exercise a Member State’s
right to limit capacity, and Article 14(1) of EC 95/93 ATM authorities that flight plans
could be rejected where there are no slots allocated by the coordinator.
11.8 French Civil Aviation Code Article R221-3 also supports the above. This code states
that capacity reduction decisions will be set out in a NOTAM. An example of a
NOTAM issued by DGAC is included at the end of this Appendix. The NOTAMs
issued by the DGAC state:
“AIRCRAFT OPERATORS ARE REQUESTED TO REDUCE THEIR SCHEDULED
FLIGHTS BY 25 PER CENT” and that
“FPL (flight plans) NOT RESPECTING THESE RESTRICTIONS COULD BE
REJECTED”.
11.9 Based on provided French examples of issuing a capacity reduction, airlines
generally appear to comply with the NOTAM rather than risk having their flight plan
rejected shortly before departure. DGAC have issued warning letters to carriers who
do not comply.
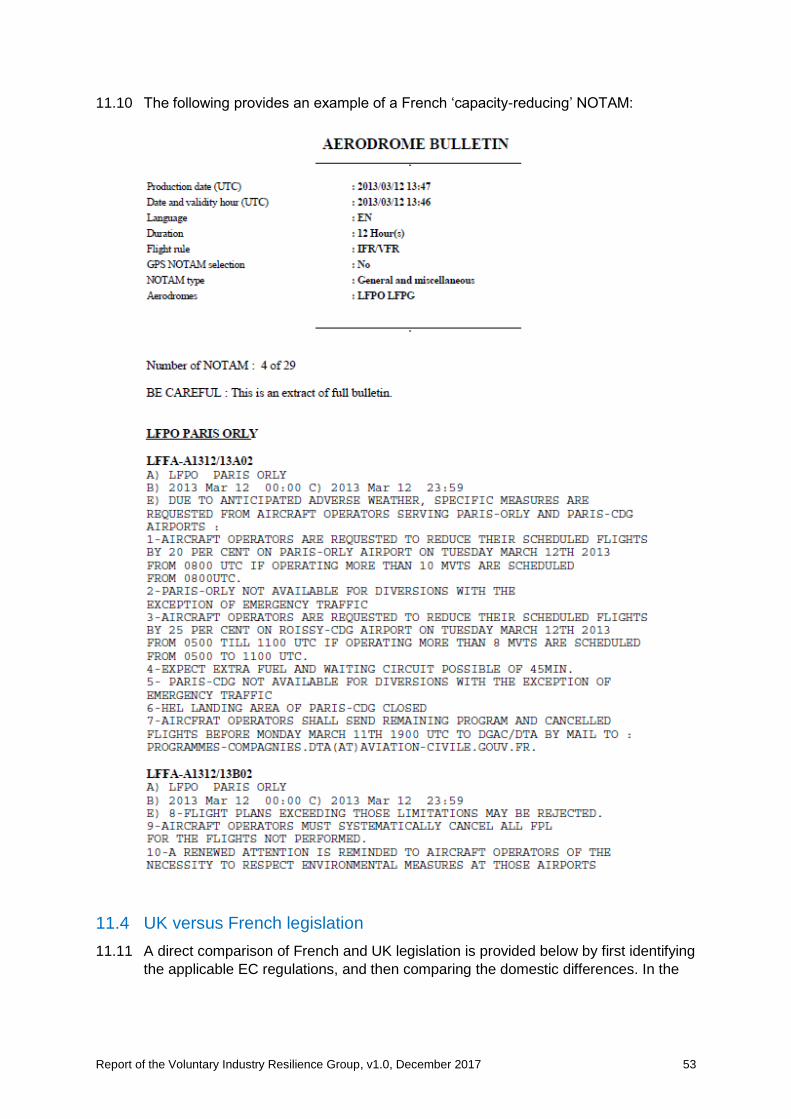
Report of the Voluntary Industry Resilience Group, v1.0, December 2017 53
11.10 The following provides an example of a French ‘capacity-reducing’ NOTAM:
11.4 UK versus French legislation
11.11 A direct comparison of French and UK legislation is provided below by first identifying
the applicable EC regulations, and then comparing the domestic differences. In the
Report of the Voluntary Industry Resilience Group, v1.0, December 2017 54
UK the Secretary of State is the competent authority for the purposes of Article 21 of
EC 1008/2008, but there is no further detail set out (as seen below).
EC Regulation 1008 / 2008 Article 21 “Emergency Measures”
(1) A Member State may refuse, limit or impose conditions on the exercise of traffic
rights to deal with sudden problems of short duration resulting from
unforeseeable and unavoidable circumstances. Such action shall respect the
principles of proportionality and transparency and shall be based on objective
and non-discriminatory criteria.
The Commission and the other Member States shall be informed without delay of
such action with its adequate justification. If the problems necessitating such
action continue to exist for more than 14 days, the Member State shall inform the
Commission and the other Member States accordingly and may, with the
agreement of the Commission, prolong the action for further periods of up to 14
days.
(2) At the request of the Member State(s) involved or on its own initiative, the
Commission may suspend this action if it does not meet the requirements of
paragraph 1 or is otherwise contrary to Community law.
EC 95/93 (as amended) on common rules for the allocation of slots at
Community airports – Article 14
(1) An air carrier's flight plan may be rejected by the competent Air Traffic
Management authorities if the air carrier intends to land or take off at a
coordinated airport, during the periods for which it is coordinated, without having
a slot allocated by the coordinator.
French Civil Aviation Code Article R221-3
The use of an aerodrome open to public air traffic may at any time be subject to
certain restrictions or temporarily prohibited if the conditions of air traffic on the
aerodrome or in the surrounding airspace or reasons justify it. These decisions are
the subject of notices to air navigators.
UK SI 2009 No 41 PART 3 Access to routes
22. The Secretary of State is the competent authority for the purposes of Articles 16
to 21 of the EC Regulation. [EC Regulation 1008 / 2008]
11.5 EuroControl Network Manager
11.12 In pursuit of improving general flight plan and slow consistency, EuroControl
published ‘Eurocontrol Centralised Service on Flight Plan and Airport Slot
Consistency (FAS) Concept of Operations (CONOPS) 04 October 2013’. This refers
to Article 14(1), which suggests that the Member State has a right to mandate the
Network Manager with rejecting flight plans as follows:
“Based on Regulation (EEC) 95/93, article 14(1), a EuroControl Member State may
want to exercise its right, to mandate the Network Manager (NM) with rejecting a
flight plan, if no correct match with an Airport Slot (APSL) is possible. In such cases
NM would request from the Member State a specific instruction in writing, as it also
was already possible in the past.”
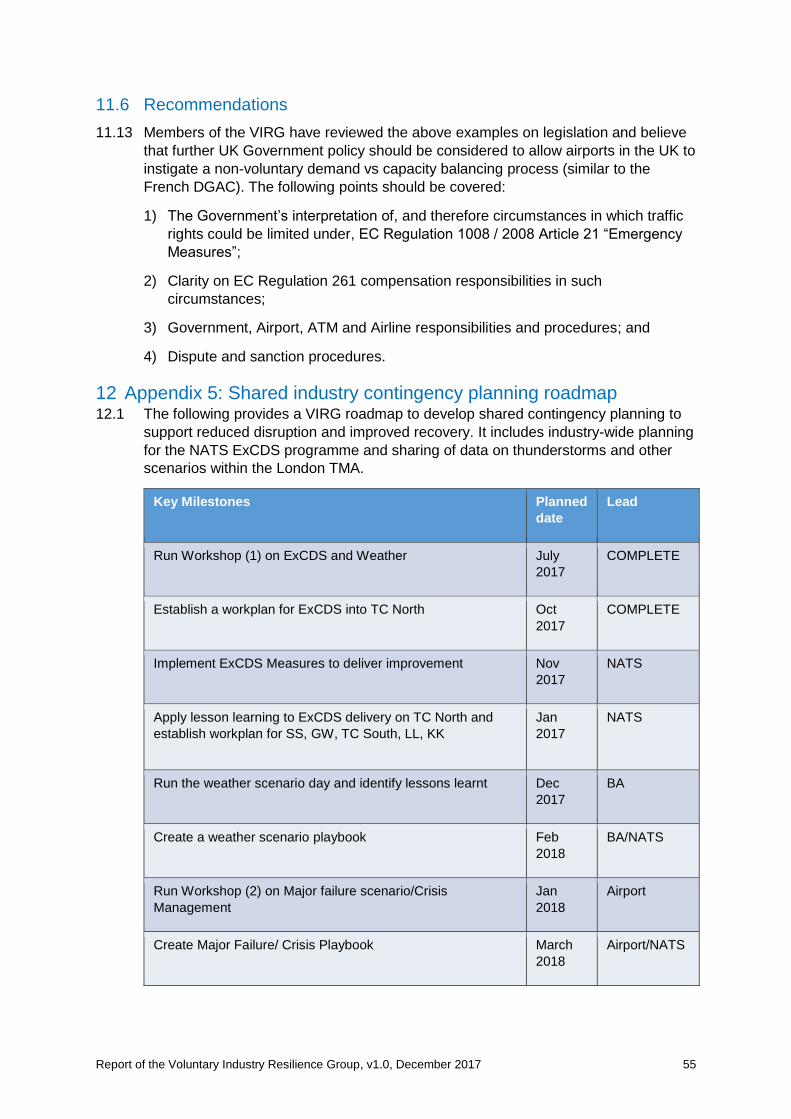
Report of the Voluntary Industry Resilience Group, v1.0, December 2017 55
11.6 Recommendations
11.13 Members of the VIRG have reviewed the above examples on legislation and believe
that further UK Government policy should be considered to allow airports in the UK to
instigate a non-voluntary demand vs capacity balancing process (similar to the
French DGAC). The following points should be covered:
1) The Government’s interpretation of, and therefore circumstances in which traffic
rights could be limited under, EC Regulation 1008 / 2008 Article 21 “Emergency
Measures”;
2) Clarity on EC Regulation 261 compensation responsibilities in such
circumstances;
3) Government, Airport, ATM and Airline responsibilities and procedures; and
4) Dispute and sanction procedures.
12 Appendix 5: Shared industry contingency planning roadmap 12.1 The following provides a VIRG roadmap to develop shared contingency planning to
support reduced disruption and improved recovery. It includes industry-wide planning
for the NATS ExCDS programme and sharing of data on thunderstorms and other
scenarios within the London TMA.
Key Milestones Planned
date
Lead
Run Workshop (1) on ExCDS and Weather July
2017
COMPLETE
Establish a workplan for ExCDS into TC North Oct
2017
COMPLETE
Implement ExCDS Measures to deliver improvement Nov
2017
NATS
Apply lesson learning to ExCDS delivery on TC North and
establish workplan for SS, GW, TC South, LL, KK
Jan
2017
NATS
Run the weather scenario day and identify lessons learnt Dec
2017
BA
Create a weather scenario playbook Feb
2018
BA/NATS
Run Workshop (2) on Major failure scenario/Crisis
Management
Jan
2018
Airport
Create Major Failure/ Crisis Playbook March
2018
Airport/NATS
Report of the Voluntary Industry Resilience Group, v1.0, December 2017 56
Run Workshop (3) on Major Diversion scenario and
Management of Technical Diversions
March
2018
Easyjet
Create Major Diversion and Technical Diversion Playbook May
2018
Easyjet/NATS
Understand Major Military Exercise planning and ability to
influence or mitigate Network impact.
March
2018
NATS
Contingency Plans – understand and align
Airport/Airline/ANSP contingenecy plans (high level overview)
Mar 18 NATS
13 Appendix 6: VIRG scheduling process and data
13.1 Scheduling process overview
13.2 Legislative framework
13.1 The scheduling process for UK airports is governed by the EU Slot Regulation27 and
the IATA Worldwide Scheduling Guidelines (WSG)28. The former is the European
legislative framework that was adopted by the UK in the form of The Airports Slot
Allocation Regulations 200629 and sets out the policy whereas the WSG provides
additional guidance in the application of the policy and sets industry best practice.
ACL is required to account for the guidance given in the WSG under Article 8(5) of
the EU Slot Regulation.
Scheduling cycle 13.2 The scheduling cycle is determined by the WSG and takes place twice per year in
preparation for the IATA Scheduling Seasons. The Calendar of Coordination
Activities is published in the WSG on an annual basis and sets the milestones for
airlines, coordinators and facilitators so that the entire industry works to the same
timetable. It is these dates that trigger the associated processes that deliver the
schedules that will operate in the corresponding season. Figure 5 shows the cycle of
coordination activities, and Table 3 demonstrates the time of year they take place
based on the IATA WSG Calendar of Coordination Activities30.
27 European Regulation 95/93/EEC (‘the EU Slot Allocation Regulation’), as amended by
Regulation 894/2002/EC and 793/2004/EC 28 IATA Worldwide Scheduling Guidelines 8th Edition effective 1st January 2017 29 The Airports Slot Allocation Regulation 2006 (SI 2006 No. 2665) 30 Page 3 of the 8th Editiion
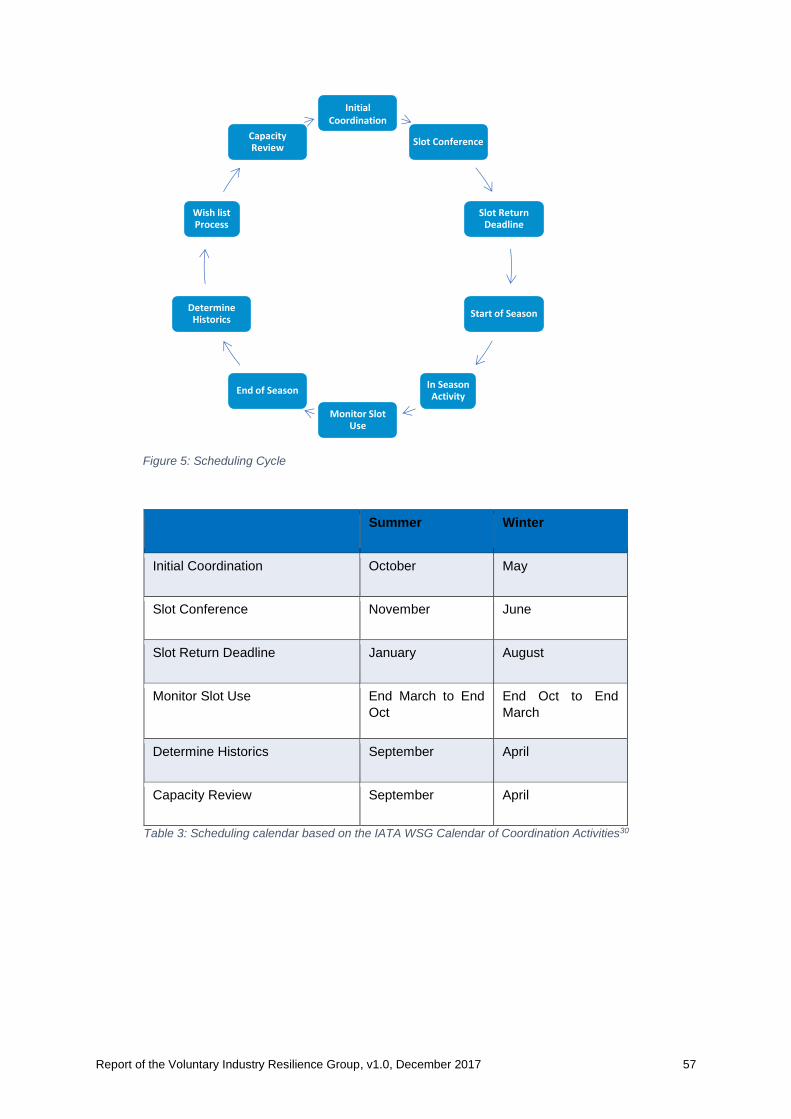
Report of the Voluntary Industry Resilience Group, v1.0, December 2017 57
Figure 5: Scheduling Cycle
Summer Winter
Initial Coordination October May
Slot Conference November June
Slot Return Deadline January August
Monitor Slot Use End March to End
Oct
End Oct to End
March
Determine Historics September April
Capacity Review September April
Table 3: Scheduling calendar based on the IATA WSG Calendar of Coordination Activities30
InitialCoordination
Slot Conference
Slot Return Deadline
Start of Season
In Season Activity
Monitor Slot Use
End of Season
Determine Historics
Wish list Process
Capacity Review
Report of the Voluntary Industry Resilience Group, v1.0, December 2017 58
Data cycle 13.3 The key airline schedule milestone is ‘initial coordination’, as this is the first time in
the process that the Coordinator will see the schedules that the airline intends to
operate. It is also at this point that the airline will receive the initial allocation of slots
to facilitate operational plans. From initial coordination through to the date at which
the flight is scheduled to operate, schedules will change based on factors, including
(but not limited to) the following:
• Schedule feasibility;
• Commercial;
• Political; and
• Security.
13.4 Article 8a of the EU Slot Regulation31 allows slot mobility and permits airlines to move
slots from one route or type of service to another route or type of service. This gives
those holding slots the ability to use the pool of slots allocated to them as they wish.
There is no timeframe for finalising a schedule apart from the commercial pressure
that it needs to be offered and sold to the public. The holder of the slots may make
changes up to the point of departure, but the opportunity for changes naturally
reduces.
13.5 The scheduling cycle also includes the Handback Deadline (HBD). It is at this point
that the “use it or lose it” targets are set for a holder of slots to achieve historic status
in a subsequent season. Any cancellations after this point would count towards this
target and therefore this acts as an incentive for operators to finalise schedules at
this point. Any slots handed back at this stage are then recycled and can be
reallocated to those on the waiting list or for ad-hoc operations.
Data availability 13.6 ACL collects data at 24 airports32 in the UK including all of those that are currently
designated by the Secretary of State as IATA Level 2 (Schedules facilitated) and
IATA Level 3 (Coordinated). In the South East this includes Heathrow, Gatwick,
London City, Stansted and Luton. The data that ACL collects does not cover smaller
undesignated airports such as Biggin Hill, Farnborough and Northolt, which tend to
cater for general and business aviation. During the Olympics these airports were
designated as Level 3 for the duration of the games. This experience demonstrated
that the application for slots for this market tended to be close to the point of
departure rather than in line with the IATA planning cycle.
13.7 The data that ACL collects is determined by the IATA scheduling process.33 This
information includes details of the flight associated to the slot, including time and date
as well as aircraft type and destination airport. From this data ACL uses its
31 European Regulation 95/93/EEC (‘the EU Slot Allocation Regulation’), as amended by
Regulation 894/2002/EC and 793/2004/EC 32 Full list of airports that ACL collects data can be found at https://www.acl-
uk.org/airport-info/ 33 IATA Standard Schedules Information Manual, 27th Edition issued March 2017

Report of the Voluntary Industry Resilience Group, v1.0, December 2017 59
coordination system to derive additional data fields by using data tables. The
information held is consistent across all airports at which ACL operates.
13.8 The accuracy of the data is dependent on the time at which it is taken and analysed.
At the initial coordination stage, the coordinator receives the airlines’ requests for
slots. Airlines will tend to overbid at this stage in the process. Their plans are not firm
and therefore they request to cover different scenarios or they bid in the hope of
gaining capacity. There is less overbidding at airports that are at or close to
saturation. The amount of overbidding results in the coordinator being unable to
allocate slots to all that were requested, which results in the total allocated
movements being less that those requested (Demand).
13.9 The Slot Return Deadline is the point at which the full season slots that are not
required are returned to the slot pool for reallocation. Some of these returned slots
will not be utilised as they tend to be in off-peak months. The reduced held slots
caused by these cancelations are mitigated by ad-hoc flights that are subsequently
requested during the season. For example, during summer 2017, Luton and Stansted
operated higher movements compared with what was planned at the start of the
season by 22.7 per cent (16,364 movements) and 7.3 per cent (8,269 movements)
respectively. In summer 2017, the volume of slots was driven by those operations
serving Western Europe34, which also demonstrated the most volatility (planned
versus actual).
13.10 The versatility of the ACL data allows further manipulation of the data and can be
used to provide granular analysis down to individual destination, by day and by time.
13.11 As part of the IATA Strategic Review the coordination calendar is currently under
review. One proposal under consideration is re-timing the HBD to be earlier in the
process. There is an opportunity to gain more accurate information earlier in the
planning cycle through improved consistency in airline behaviour.
13.3 Schedule reliability/quality of data
13.12 The quality and reliability of the data that ACL holds is dependent on the information
provided by the airline. Once the season commences, the Enforcement Code35
provides the mechanism for ensuring that the slots held are accurate. However, prior
to that period the airlines are not required to keep the schedules held by the
coordinator in line with their planned schedule (although it is best practice to do so).
13.13 The scheduling process does not require the coordinator to complete feasibility
checks of the proposed schedule submitted by the operator. To do so would be
complex and require additional resource and expertise; this would also assume that
the operators would be willing for such a practice to take place. Table 4
demonstrates the complexity of the schedule build process to build the schedule and
factors that may need to be considered to assess its feasibility. These factors
exclude the commercial considerations that different airlines in different markets may
also need to include in the decision-making process. As such, although the data that
34 Western Europe – includes Portugal, Gibraltar, Spain, Austria, Belgium, France,
Germany, Luxembourg, Monaco, Netherlands and Switzerland 35 CONTROLLING THE MISUSE OF SLOTS AT COORDINATED AIRPORTS IN THE UK -
MISUSE OF SLOTS ENFORCEMENT CODE, made by the Coordinator under Regulation 18
of The Airports Slot Allocation Regulations 2006 (SI 2006 No 2665) 15 June 2015
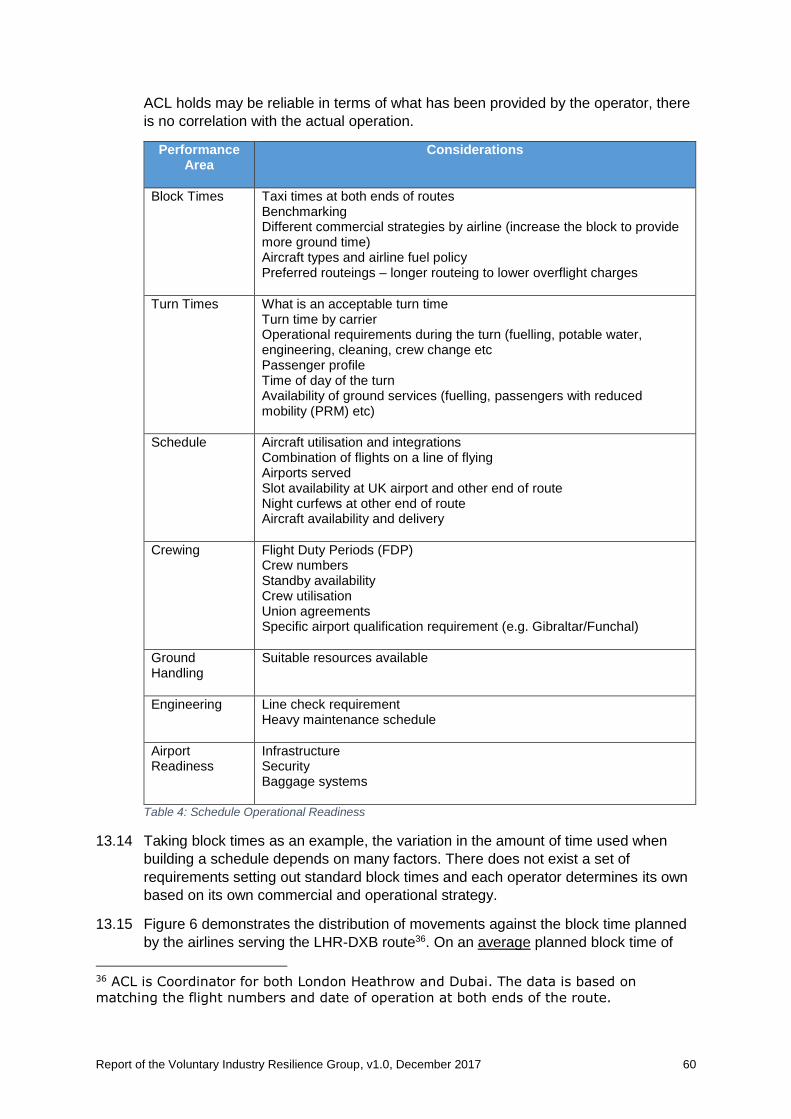
Report of the Voluntary Industry Resilience Group, v1.0, December 2017 60
ACL holds may be reliable in terms of what has been provided by the operator, there
is no correlation with the actual operation.
Performance Area
Considerations
Block Times Taxi times at both ends of routes Benchmarking Different commercial strategies by airline (increase the block to provide more ground time) Aircraft types and airline fuel policy Preferred routeings – longer routeing to lower overflight charges
Turn Times What is an acceptable turn time Turn time by carrier Operational requirements during the turn (fuelling, potable water, engineering, cleaning, crew change etc Passenger profile Time of day of the turn Availability of ground services (fuelling, passengers with reduced mobility (PRM) etc)
Schedule Aircraft utilisation and integrations Combination of flights on a line of flying Airports served Slot availability at UK airport and other end of route Night curfews at other end of route Aircraft availability and delivery
Crewing Flight Duty Periods (FDP) Crew numbers Standby availability Crew utilisation Union agreements Specific airport qualification requirement (e.g. Gibraltar/Funchal)
Ground Handling
Suitable resources available
Engineering Line check requirement Heavy maintenance schedule
Airport Readiness
Infrastructure Security Baggage systems
Table 4: Schedule Operational Readiness
13.14 Taking block times as an example, the variation in the amount of time used when
building a schedule depends on many factors. There does not exist a set of
requirements setting out standard block times and each operator determines its own
based on its own commercial and operational strategy.
13.15 Figure 6 demonstrates the distribution of movements against the block time planned
by the airlines serving the LHR-DXB route36. On an average planned block time of
36 ACL is Coordinator for both London Heathrow and Dubai. The data is based on
matching the flight numbers and date of operation at both ends of the route.
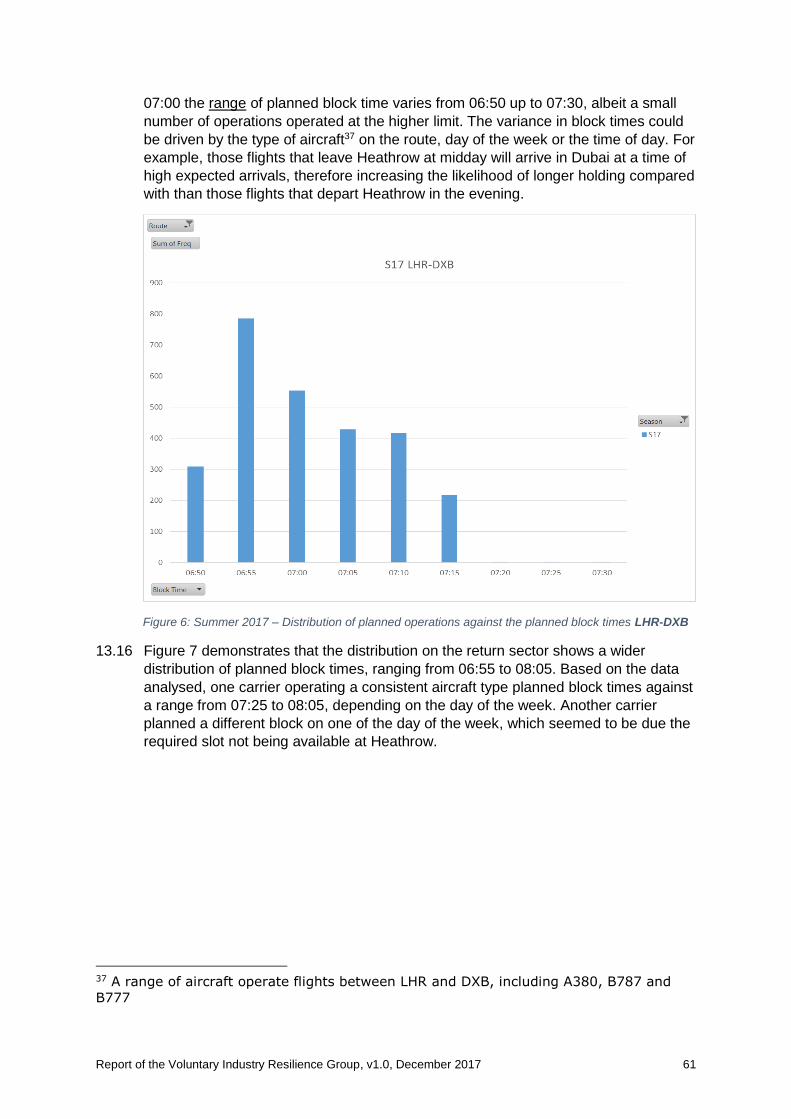
Report of the Voluntary Industry Resilience Group, v1.0, December 2017 61
07:00 the range of planned block time varies from 06:50 up to 07:30, albeit a small
number of operations operated at the higher limit. The variance in block times could
be driven by the type of aircraft37 on the route, day of the week or the time of day. For
example, those flights that leave Heathrow at midday will arrive in Dubai at a time of
high expected arrivals, therefore increasing the likelihood of longer holding compared
with than those flights that depart Heathrow in the evening.
Figure 6: Summer 2017 – Distribution of planned operations against the planned block times LHR-DXB
13.16 Figure 7 demonstrates that the distribution on the return sector shows a wider
distribution of planned block times, ranging from 06:55 to 08:05. Based on the data
analysed, one carrier operating a consistent aircraft type planned block times against
a range from 07:25 to 08:05, depending on the day of the week. Another carrier
planned a different block on one of the day of the week, which seemed to be due the
required slot not being available at Heathrow.
37 A range of aircraft operate flights between LHR and DXB, including A380, B787 and
B777
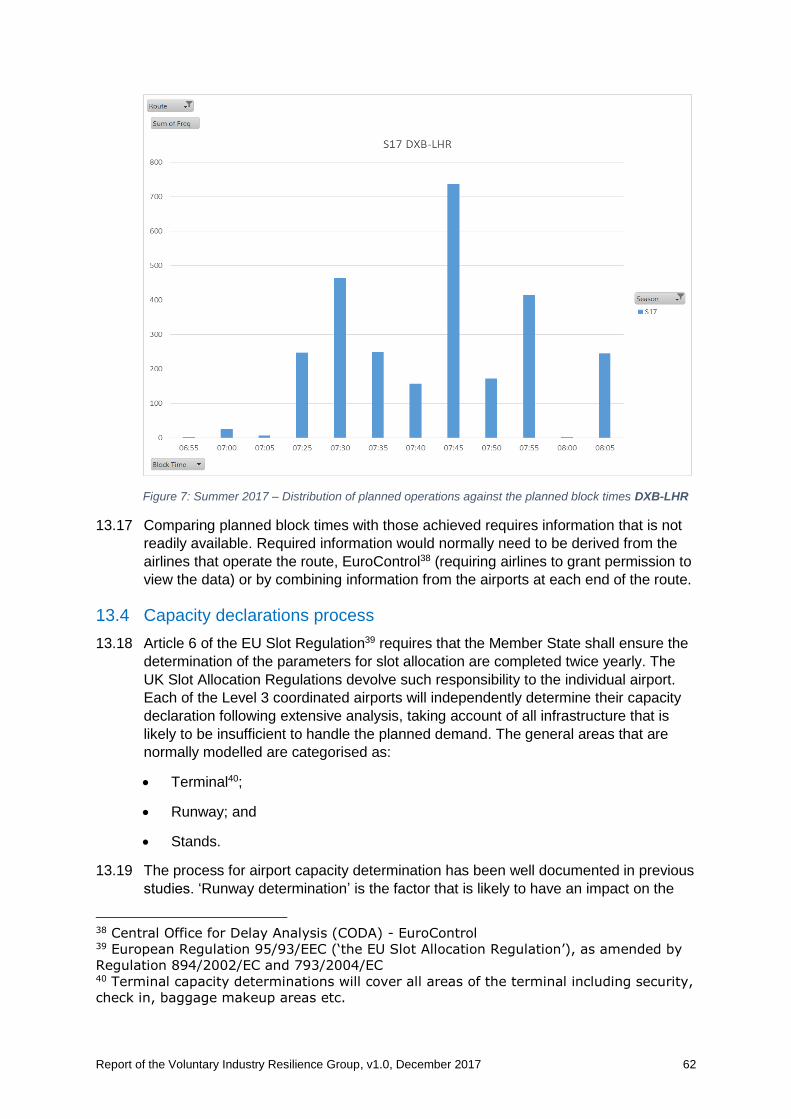
Report of the Voluntary Industry Resilience Group, v1.0, December 2017 62
Figure 7: Summer 2017 – Distribution of planned operations against the planned block times DXB-LHR
13.17 Comparing planned block times with those achieved requires information that is not
readily available. Required information would normally need to be derived from the
airlines that operate the route, EuroControl38 (requiring airlines to grant permission to
view the data) or by combining information from the airports at each end of the route.
13.4 Capacity declarations process
13.18 Article 6 of the EU Slot Regulation39 requires that the Member State shall ensure the
determination of the parameters for slot allocation are completed twice yearly. The
UK Slot Allocation Regulations devolve such responsibility to the individual airport.
Each of the Level 3 coordinated airports will independently determine their capacity
declaration following extensive analysis, taking account of all infrastructure that is
likely to be insufficient to handle the planned demand. The general areas that are
normally modelled are categorised as:
• Terminal40;
• Runway; and
• Stands.
13.19 The process for airport capacity determination has been well documented in previous
studies. ‘Runway determination’ is the factor that is likely to have an impact on the
38 Central Office for Delay Analysis (CODA) - EuroControl 39 European Regulation 95/93/EEC (‘the EU Slot Allocation Regulation’), as amended by
Regulation 894/2002/EC and 793/2004/EC 40 Terminal capacity determinations will cover all areas of the terminal including security,
check in, baggage makeup areas etc.
Report of the Voluntary Industry Resilience Group, v1.0, December 2017 63
wider network. The immediate impact on runway delivery carries more weight
compared with the delivery into the immediate network and the subsequent impact
further down route.
13.20 As the wider network becomes more of a constraining factor, managed through
temporary flow restrictions where demand exceeds capacity, the impact of individual
capacity declarations become more critical. ACL holds data for the major airports in
the UK, however this data is not aggregated at any point in the planning process to
determine the overall system demand. At the point that this information is analysed,
slots will have been issued and the permission to operate at those times granted.
13.21 Although the coordination function is focused on the immediate airport infrastructure,
such infrastructure is not modelled. For example, if the runway declares 30
departures there is nothing preventing all 30 from planning to use the same SID and
head in the same direction. Analysis of this data may identify areas of the network
where the available capacity is insufficient. At that point, further consideration would
be required to establish how the demand can be spread to periods where capacity is
available. Currently there is no mechanism for managing this, and it therefore
becomes the responsibility of the controller on the day. In future, capacity smoothing
could be best achieved through an overlying system capacity constraint that allows
the smoothing during the planning phase rather than waiting until the plans are set.
13.5 Recommendations
13.22 Members of the VIRG have reviewed the existing scheduling process and the current
related issues to make the following recommendations:
• ACL & NATS should work on developing a data set that will allow greater
planning;
• The IATA Strategic Review should be supporting in achieving an earlier planning
window to provide earlier accurate information;
• There needs to be further analysis on managing the network to spread capacity
demand; and
• Enhancements to the scheduling system should include parameters that fall
outside the immediate airport infrastructure, firstly considering ‘directional slots’.
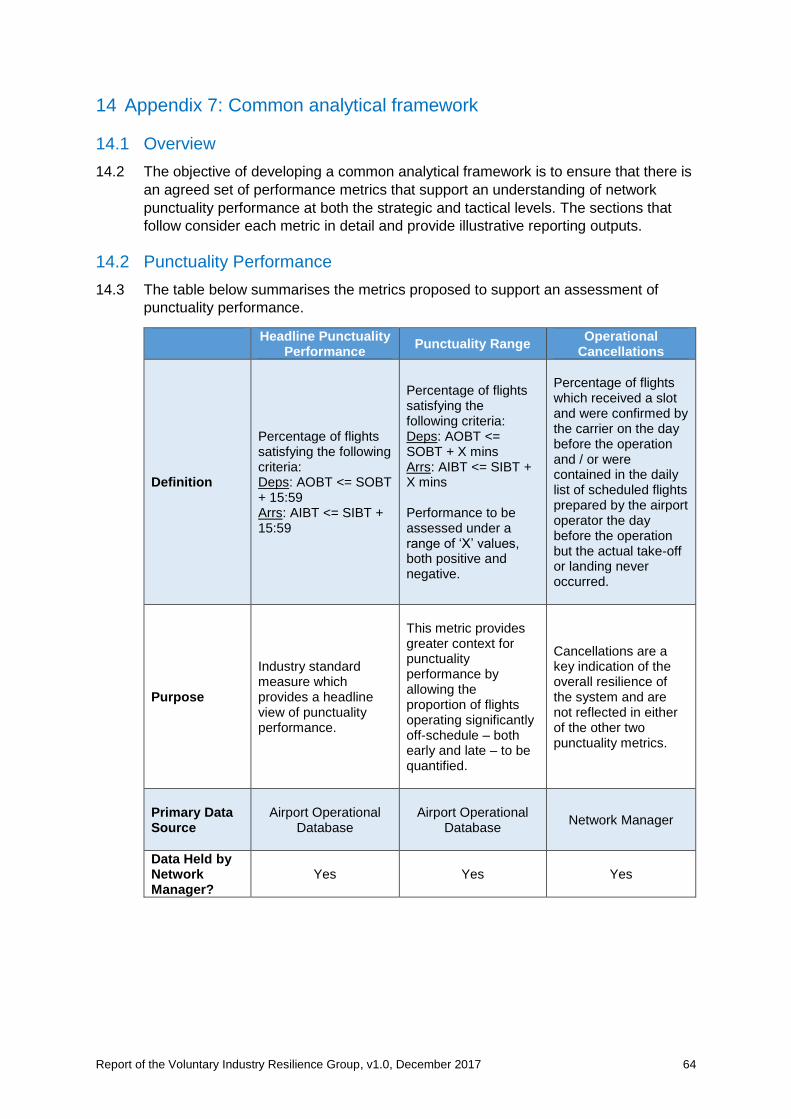
Report of the Voluntary Industry Resilience Group, v1.0, December 2017 64
14 Appendix 7: Common analytical framework
14.1 Overview
14.2 The objective of developing a common analytical framework is to ensure that there is
an agreed set of performance metrics that support an understanding of network
punctuality performance at both the strategic and tactical levels. The sections that
follow consider each metric in detail and provide illustrative reporting outputs.
14.2 Punctuality Performance
14.3 The table below summarises the metrics proposed to support an assessment of
punctuality performance.
Headline Punctuality Performance
Punctuality Range Operational
Cancellations
Definition
Percentage of flights satisfying the following criteria: Deps: AOBT <= SOBT + 15:59 Arrs: AIBT <= SIBT + 15:59
Percentage of flights satisfying the following criteria: Deps: AOBT <= SOBT + X mins Arrs: AIBT <= SIBT + X mins Performance to be assessed under a range of ‘X’ values, both positive and negative.
Percentage of flights which received a slot and were confirmed by the carrier on the day before the operation and / or were contained in the daily list of scheduled flights prepared by the airport operator the day before the operation but the actual take-off or landing never occurred.
Purpose
Industry standard measure which provides a headline view of punctuality performance.
This metric provides greater context for punctuality performance by allowing the proportion of flights operating significantly off-schedule – both early and late – to be quantified.
Cancellations are a key indication of the overall resilience of the system and are not reflected in either of the other two punctuality metrics.
Primary Data Source
Airport Operational
Database
Airport Operational Database
Network Manager
Data Held by Network Manager?
Yes
Yes Yes
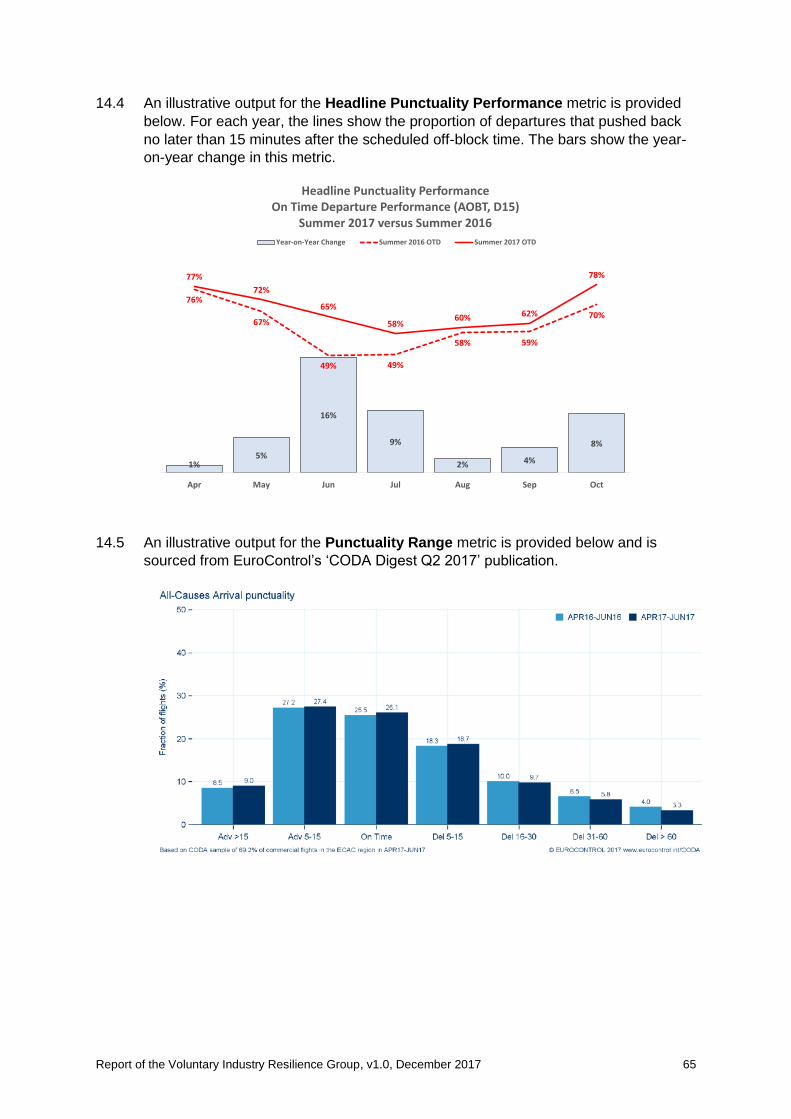
Report of the Voluntary Industry Resilience Group, v1.0, December 2017 65
14.4 An illustrative output for the Headline Punctuality Performance metric is provided
below. For each year, the lines show the proportion of departures that pushed back
no later than 15 minutes after the scheduled off-block time. The bars show the year-
on-year change in this metric.
14.5 An illustrative output for the Punctuality Range metric is provided below and is
sourced from EuroControl’s ‘CODA Digest Q2 2017’ publication.
1%5%
16%
9%
2% 4%
8%
76%
67%
49% 49%
58% 59%
70%
77%
72%
65%
58%60% 62%
78%
Apr May Jun Jul Aug Sep Oct
Headline Punctuality PerformanceOn Time Departure Performance (AOBT, D15)
Summer 2017 versus Summer 2016
Year-on-Year Change Summer 2016 OTD Summer 2017 OTD
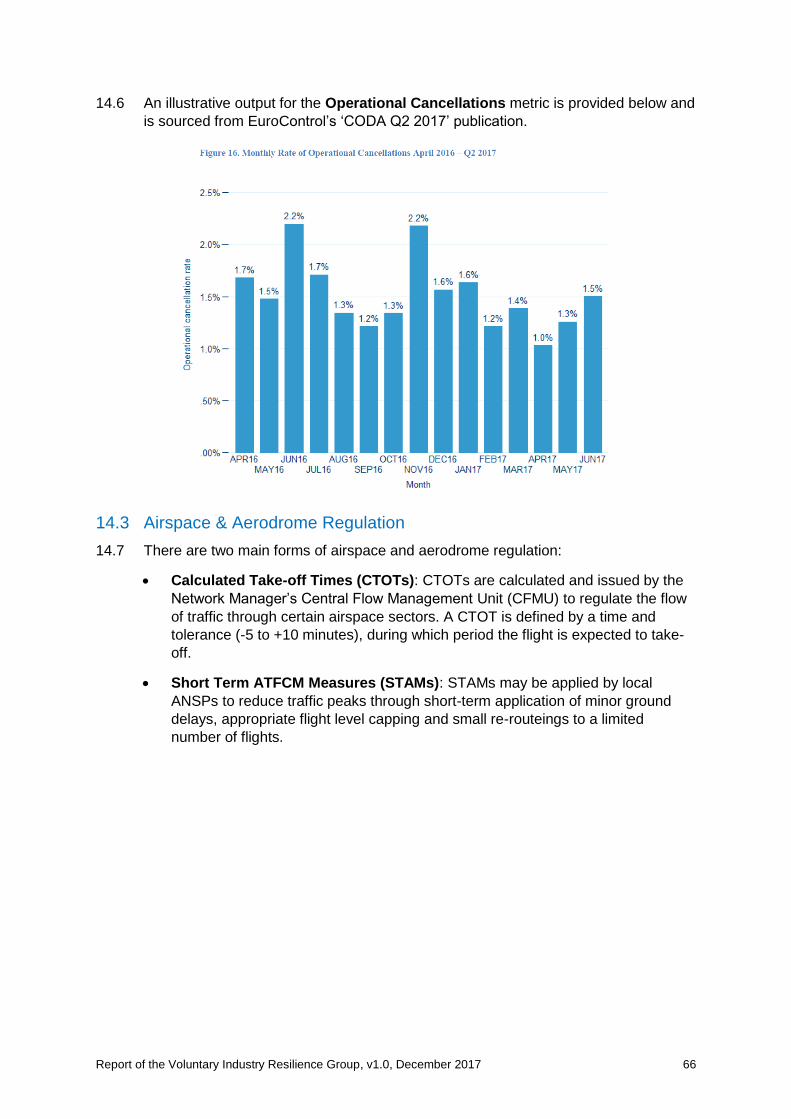
Report of the Voluntary Industry Resilience Group, v1.0, December 2017 66
14.6 An illustrative output for the Operational Cancellations metric is provided below and
is sourced from EuroControl’s ‘CODA Q2 2017’ publication.
14.3 Airspace & Aerodrome Regulation
14.7 There are two main forms of airspace and aerodrome regulation:
• Calculated Take-off Times (CTOTs): CTOTs are calculated and issued by the
Network Manager’s Central Flow Management Unit (CFMU) to regulate the flow
of traffic through certain airspace sectors. A CTOT is defined by a time and
tolerance (-5 to +10 minutes), during which period the flight is expected to take-
off.
• Short Term ATFCM Measures (STAMs): STAMs may be applied by local
ANSPs to reduce traffic peaks through short-term application of minor ground
delays, appropriate flight level capping and small re-routeings to a limited
number of flights.
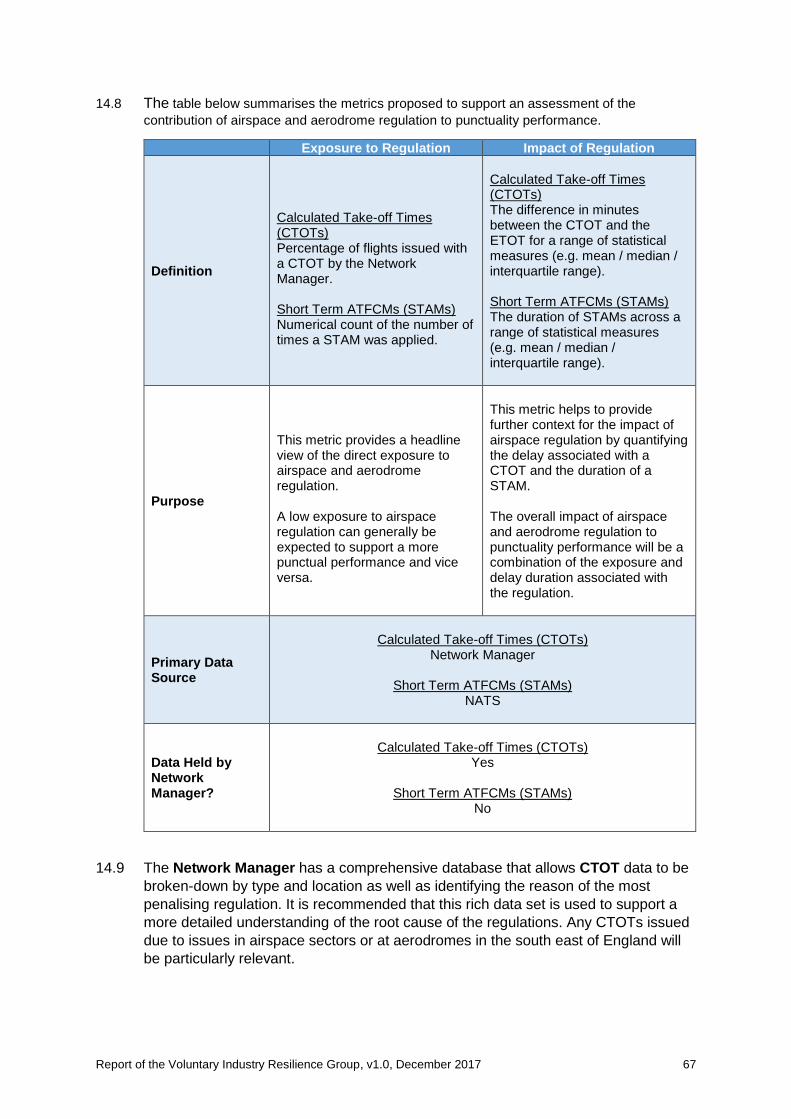
Report of the Voluntary Industry Resilience Group, v1.0, December 2017 67
14.8 The table below summarises the metrics proposed to support an assessment of the
contribution of airspace and aerodrome regulation to punctuality performance.
Exposure to Regulation Impact of Regulation
Definition
Calculated Take-off Times (CTOTs) Percentage of flights issued with a CTOT by the Network Manager. Short Term ATFCMs (STAMs) Numerical count of the number of times a STAM was applied.
Calculated Take-off Times (CTOTs) The difference in minutes between the CTOT and the ETOT for a range of statistical measures (e.g. mean / median / interquartile range). Short Term ATFCMs (STAMs) The duration of STAMs across a range of statistical measures (e.g. mean / median / interquartile range).
Purpose
This metric provides a headline view of the direct exposure to airspace and aerodrome regulation. A low exposure to airspace regulation can generally be expected to support a more punctual performance and vice versa.
This metric helps to provide further context for the impact of airspace regulation by quantifying the delay associated with a CTOT and the duration of a STAM. The overall impact of airspace and aerodrome regulation to punctuality performance will be a combination of the exposure and delay duration associated with the regulation.
Primary Data Source
Calculated Take-off Times (CTOTs)
Network Manager
Short Term ATFCMs (STAMs) NATS
Data Held by Network Manager?
Calculated Take-off Times (CTOTs)
Yes
Short Term ATFCMs (STAMs) No
14.9 The Network Manager has a comprehensive database that allows CTOT data to be
broken-down by type and location as well as identifying the reason of the most
penalising regulation. It is recommended that this rich data set is used to support a
more detailed understanding of the root cause of the regulations. Any CTOTs issued
due to issues in airspace sectors or at aerodromes in the south east of England will
be particularly relevant.
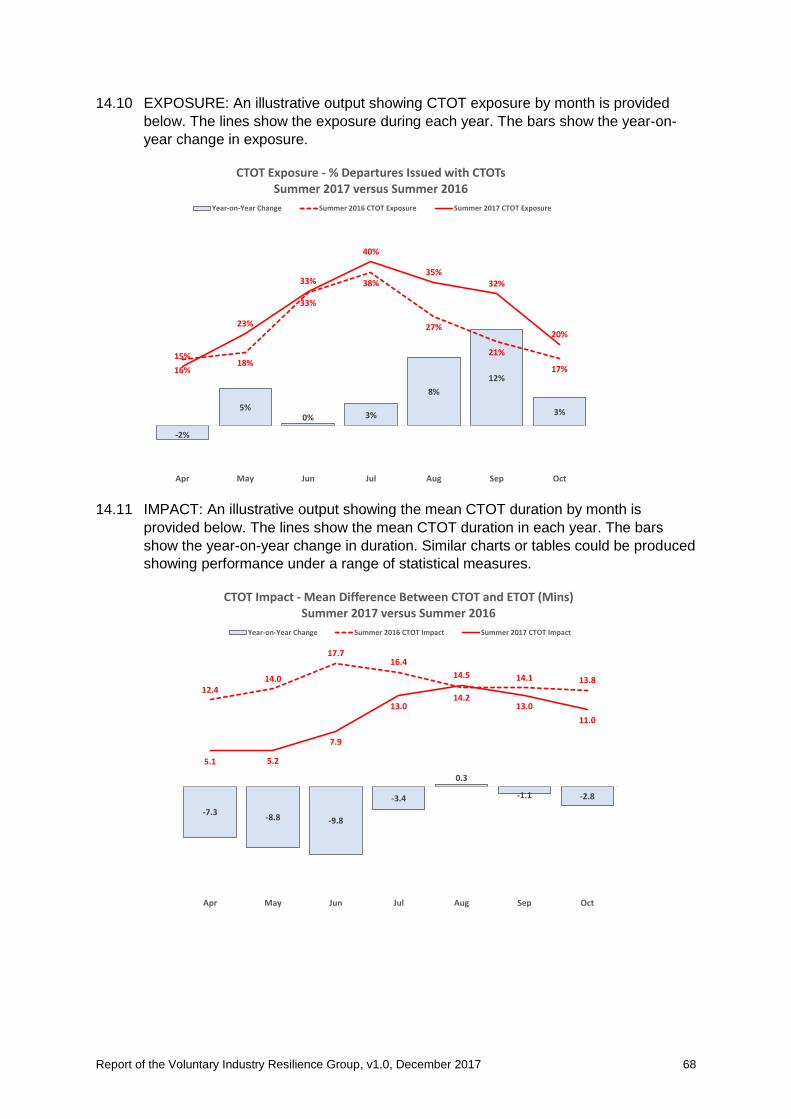
Report of the Voluntary Industry Resilience Group, v1.0, December 2017 68
14.10 EXPOSURE: An illustrative output showing CTOT exposure by month is provided
below. The lines show the exposure during each year. The bars show the year-on-
year change in exposure.
14.11 IMPACT: An illustrative output showing the mean CTOT duration by month is
provided below. The lines show the mean CTOT duration in each year. The bars
show the year-on-year change in duration. Similar charts or tables could be produced
showing performance under a range of statistical measures.
-2%
5%0% 3%
8%
12%
3%
16%18%
33%
38%
27%
21%
17%
15%
23%
33%
40%
35%32%
20%
Apr May Jun Jul Aug Sep Oct
CTOT Exposure - % Departures Issued with CTOTsSummer 2017 versus Summer 2016
Year-on-Year Change Summer 2016 CTOT Exposure Summer 2017 CTOT Exposure
-7.3-8.8 -9.8
-3.4
0.3
-1.1 -2.8
12.414.0
17.716.4
14.2
14.1 13.8
5.1 5.2
7.9
13.0
14.5
13.0
11.0
Apr May Jun Jul Aug Sep Oct
CTOT Impact - Mean Difference Between CTOT and ETOT (Mins)Summer 2017 versus Summer 2016
Year-on-Year Change Summer 2016 CTOT Impact Summer 2017 CTOT Impact
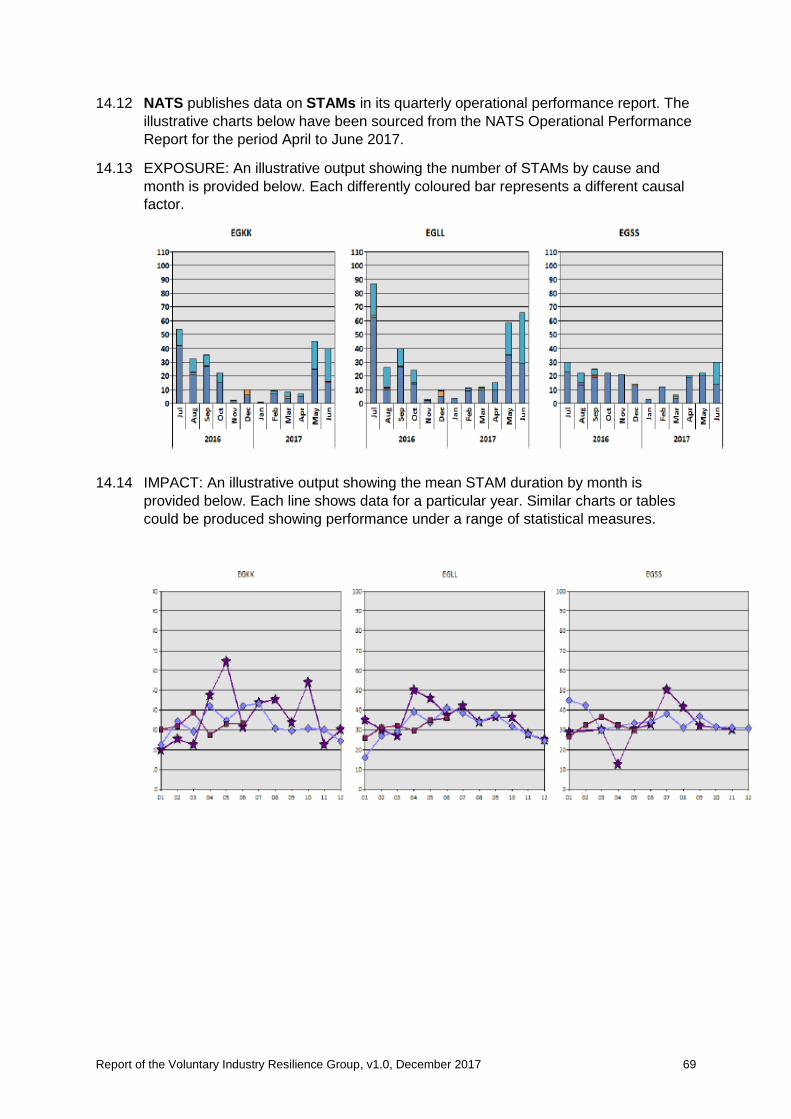
Report of the Voluntary Industry Resilience Group, v1.0, December 2017 69
14.12 NATS publishes data on STAMs in its quarterly operational performance report. The
illustrative charts below have been sourced from the NATS Operational Performance
Report for the period April to June 2017.
14.13 EXPOSURE: An illustrative output showing the number of STAMs by cause and
month is provided below. Each differently coloured bar represents a different causal
factor.
14.14 IMPACT: An illustrative output showing the mean STAM duration by month is
provided below. Each line shows data for a particular year. Similar charts or tables
could be produced showing performance under a range of statistical measures.
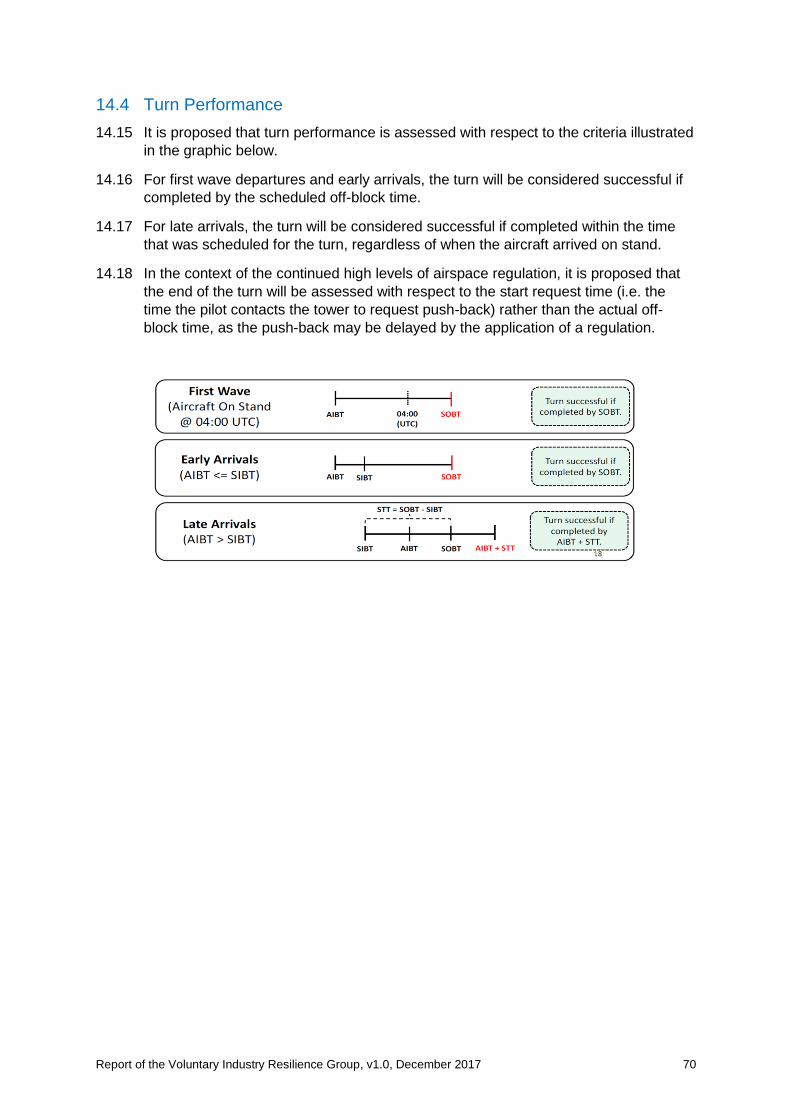
Report of the Voluntary Industry Resilience Group, v1.0, December 2017 70
14.4 Turn Performance
14.15 It is proposed that turn performance is assessed with respect to the criteria illustrated
in the graphic below.
14.16 For first wave departures and early arrivals, the turn will be considered successful if
completed by the scheduled off-block time.
14.17 For late arrivals, the turn will be considered successful if completed within the time
that was scheduled for the turn, regardless of when the aircraft arrived on stand.
14.18 In the context of the continued high levels of airspace regulation, it is proposed that
the end of the turn will be assessed with respect to the start request time (i.e. the
time the pilot contacts the tower to request push-back) rather than the actual off-
block time, as the push-back may be delayed by the application of a regulation.
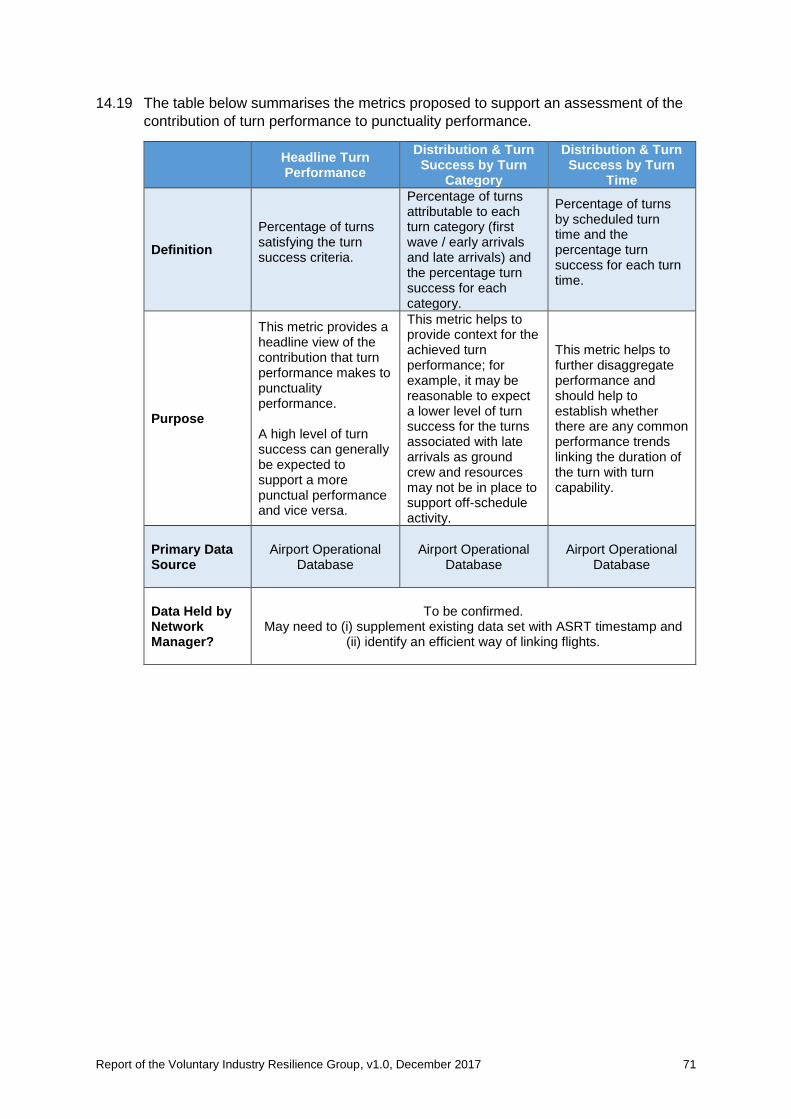
Report of the Voluntary Industry Resilience Group, v1.0, December 2017 71
14.19 The table below summarises the metrics proposed to support an assessment of the
contribution of turn performance to punctuality performance.
Headline Turn Performance
Distribution & Turn Success by Turn
Category
Distribution & Turn Success by Turn
Time
Definition
Percentage of turns satisfying the turn success criteria.
Percentage of turns attributable to each turn category (first wave / early arrivals and late arrivals) and the percentage turn success for each category.
Percentage of turns by scheduled turn time and the percentage turn success for each turn time.
Purpose
This metric provides a headline view of the contribution that turn performance makes to punctuality performance. A high level of turn success can generally be expected to support a more punctual performance and vice versa.
This metric helps to provide context for the achieved turn performance; for example, it may be reasonable to expect a lower level of turn success for the turns associated with late arrivals as ground crew and resources may not be in place to support off-schedule activity.
This metric helps to further disaggregate performance and should help to establish whether there are any common performance trends linking the duration of the turn with turn capability.
Primary Data Source
Airport Operational
Database
Airport Operational Database
Airport Operational Database
Data Held by Network Manager?
To be confirmed.
May need to (i) supplement existing data set with ASRT timestamp and (ii) identify an efficient way of linking flights.
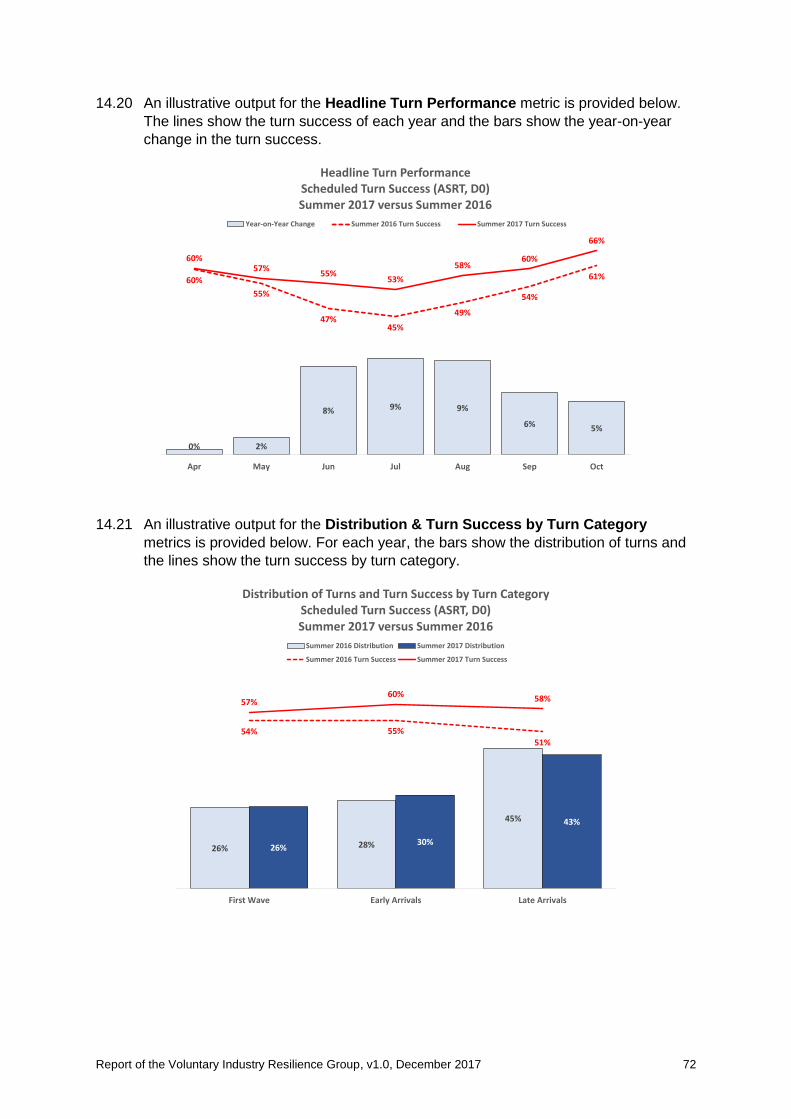
Report of the Voluntary Industry Resilience Group, v1.0, December 2017 72
14.20 An illustrative output for the Headline Turn Performance metric is provided below.
The lines show the turn success of each year and the bars show the year-on-year
change in the turn success.
14.21 An illustrative output for the Distribution & Turn Success by Turn Category
metrics is provided below. For each year, the bars show the distribution of turns and
the lines show the turn success by turn category.
0% 2%
8% 9% 9%
6% 5%
60%
55%
47%45%
49%
54%
61%
60%57%
55%53%
58%60%
66%
Apr May Jun Jul Aug Sep Oct
Headline Turn PerformanceScheduled Turn Success (ASRT, D0)Summer 2017 versus Summer 2016
Year-on-Year Change Summer 2016 Turn Success Summer 2017 Turn Success
26% 28%
45%
26%30%
43%
54% 55%51%
57%60% 58%
First Wave Early Arrivals Late Arrivals
Distribution of Turns and Turn Success by Turn CategoryScheduled Turn Success (ASRT, D0)Summer 2017 versus Summer 2016
Summer 2016 Distribution Summer 2017 Distribution
Summer 2016 Turn Success Summer 2017 Turn Success
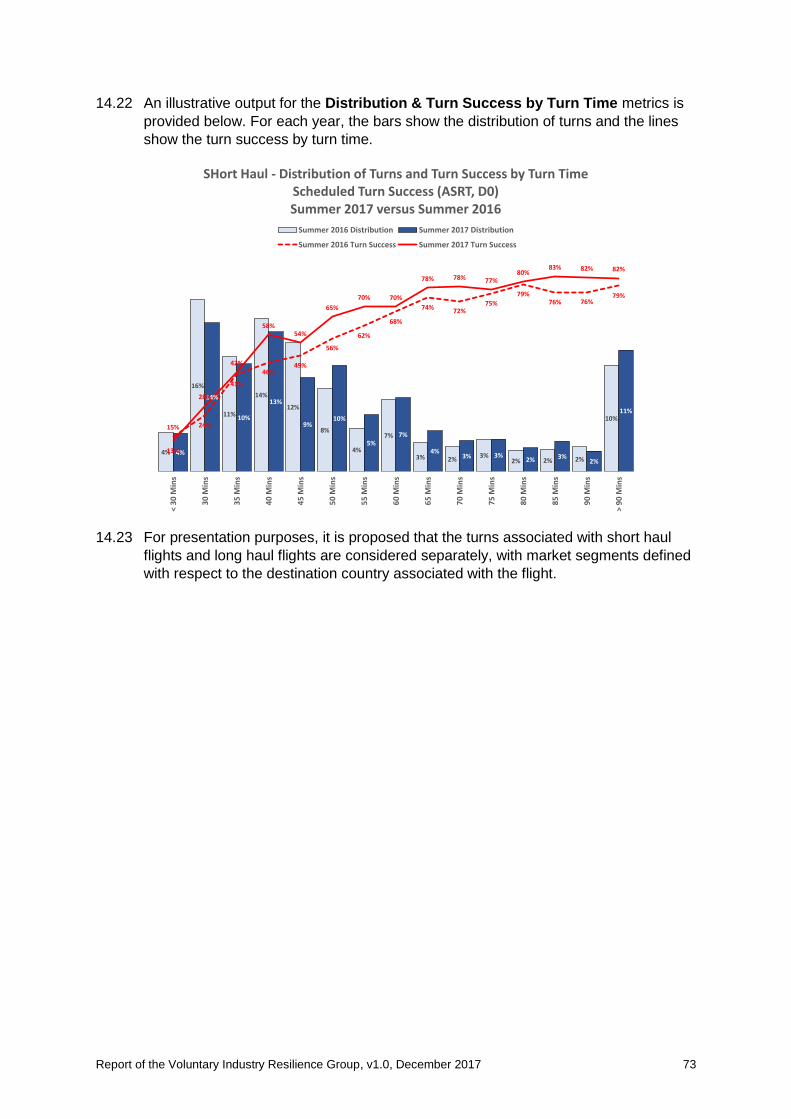
Report of the Voluntary Industry Resilience Group, v1.0, December 2017 73
14.22 An illustrative output for the Distribution & Turn Success by Turn Time metrics is
provided below. For each year, the bars show the distribution of turns and the lines
show the turn success by turn time.
14.23 For presentation purposes, it is proposed that the turns associated with short haul
flights and long haul flights are considered separately, with market segments defined
with respect to the destination country associated with the flight.
4%
16%
11%
14%
12%
8%
4%
7%
3% 2%3%
2% 2% 2%
10%
4%
14%
10%
13%
9%10%
5%7%
4%3% 3%
2% 3%2%
11%
15% 24%
41%
46%49%
56%
62%
68%
74% 72%75%
79%76% 76%
79%
13%
28%
42%
58%54%
65%
70% 70%
78% 78% 77%80%
83% 82% 82%
< 3
0 M
ins
30
Min
s
35
Min
s
40
Min
s
45
Min
s
50
Min
s
55
Min
s
60
Min
s
65
Min
s
70
Min
s
75
Min
s
80
Min
s
85
Min
s
90
Min
s
> 9
0 M
ins
SHort Haul - Distribution of Turns and Turn Success by Turn TimeScheduled Turn Success (ASRT, D0)Summer 2017 versus Summer 2016
Summer 2016 Distribution Summer 2017 Distribution
Summer 2016 Turn Success Summer 2017 Turn Success
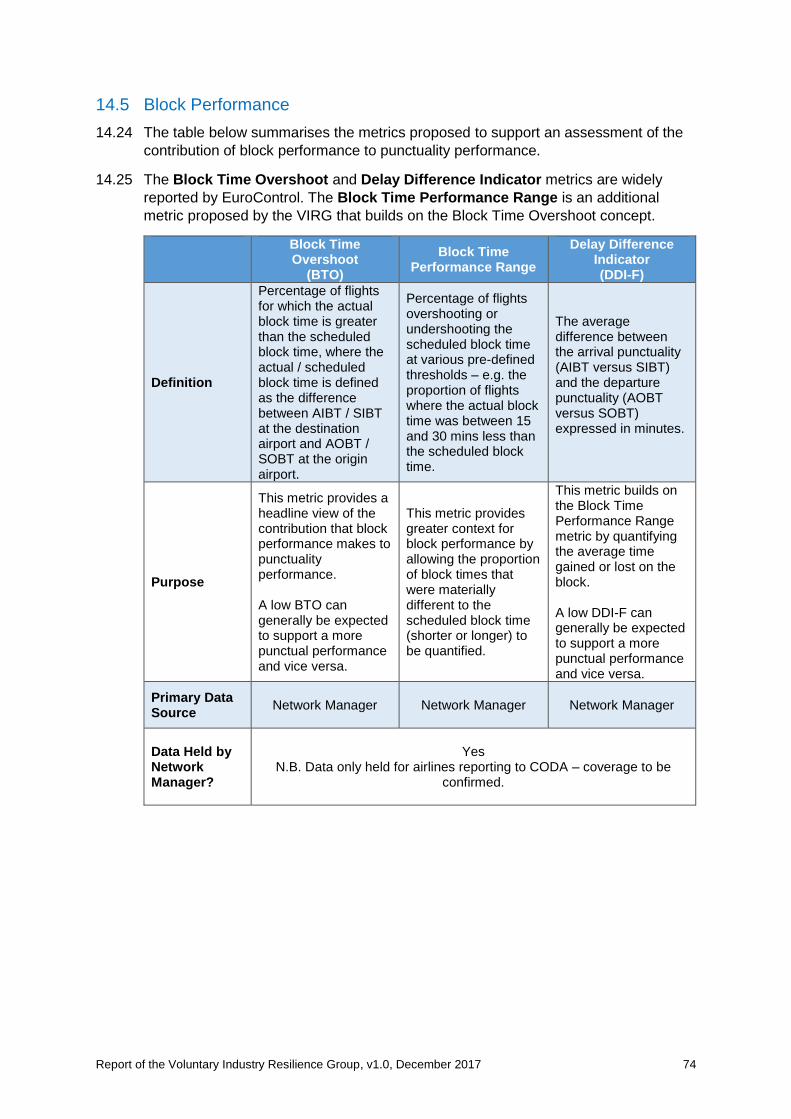
Report of the Voluntary Industry Resilience Group, v1.0, December 2017 74
14.5 Block Performance
14.24 The table below summarises the metrics proposed to support an assessment of the
contribution of block performance to punctuality performance.
14.25 The Block Time Overshoot and Delay Difference Indicator metrics are widely
reported by EuroControl. The Block Time Performance Range is an additional
metric proposed by the VIRG that builds on the Block Time Overshoot concept.
Block Time Overshoot
(BTO)
Block Time Performance Range
Delay Difference Indicator (DDI-F)
Definition
Percentage of flights for which the actual block time is greater than the scheduled block time, where the actual / scheduled block time is defined as the difference between AIBT / SIBT at the destination airport and AOBT / SOBT at the origin airport.
Percentage of flights overshooting or undershooting the scheduled block time at various pre-defined thresholds – e.g. the proportion of flights where the actual block time was between 15 and 30 mins less than the scheduled block time.
The average difference between the arrival punctuality (AIBT versus SIBT) and the departure punctuality (AOBT versus SOBT) expressed in minutes.
Purpose
This metric provides a headline view of the contribution that block performance makes to punctuality performance. A low BTO can generally be expected to support a more punctual performance and vice versa.
This metric provides greater context for block performance by allowing the proportion of block times that were materially different to the scheduled block time (shorter or longer) to be quantified.
This metric builds on the Block Time Performance Range metric by quantifying the average time gained or lost on the block. A low DDI-F can generally be expected to support a more punctual performance and vice versa.
Primary Data Source
Network Manager
Network Manager Network Manager
Data Held by Network Manager?
Yes
N.B. Data only held for airlines reporting to CODA – coverage to be confirmed.
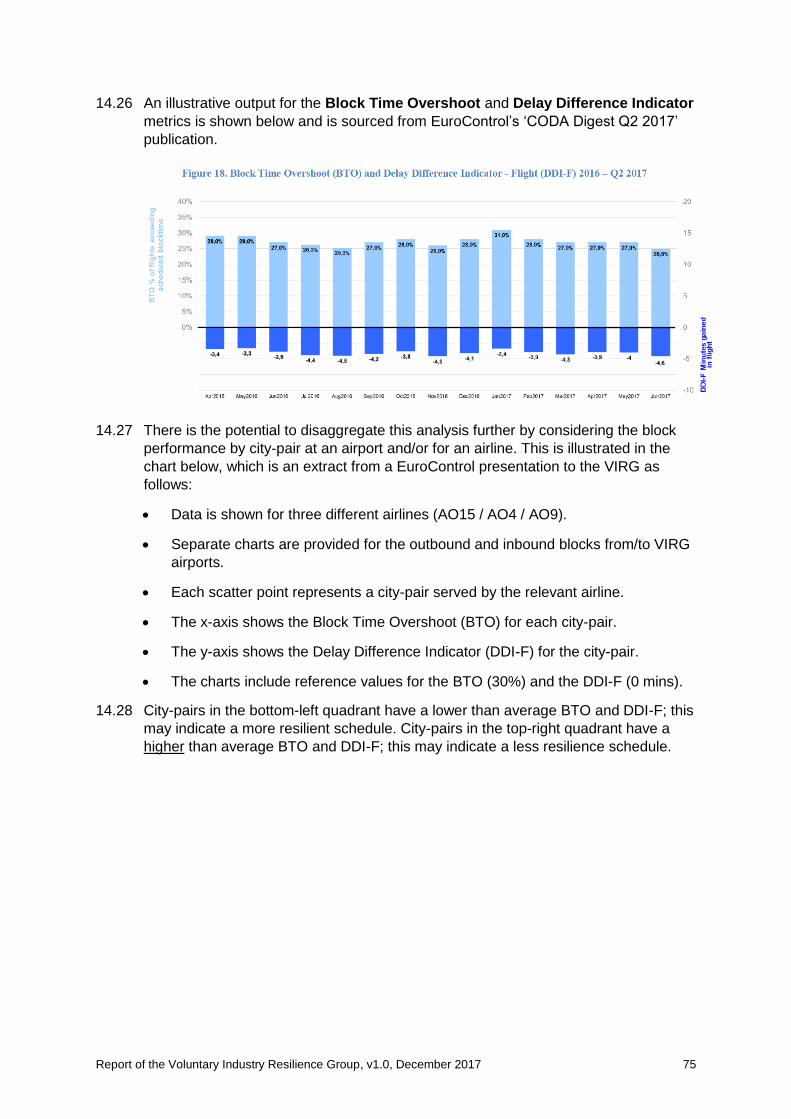
Report of the Voluntary Industry Resilience Group, v1.0, December 2017 75
14.26 An illustrative output for the Block Time Overshoot and Delay Difference Indicator
metrics is shown below and is sourced from EuroControl’s ‘CODA Digest Q2 2017’
publication.
14.27 There is the potential to disaggregate this analysis further by considering the block
performance by city-pair at an airport and/or for an airline. This is illustrated in the
chart below, which is an extract from a EuroControl presentation to the VIRG as
follows:
• Data is shown for three different airlines (AO15 / AO4 / AO9).
• Separate charts are provided for the outbound and inbound blocks from/to VIRG
airports.
• Each scatter point represents a city-pair served by the relevant airline.
• The x-axis shows the Block Time Overshoot (BTO) for each city-pair.
• The y-axis shows the Delay Difference Indicator (DDI-F) for the city-pair.
• The charts include reference values for the BTO (30%) and the DDI-F (0 mins).
14.28 City-pairs in the bottom-left quadrant have a lower than average BTO and DDI-F; this
may indicate a more resilient schedule. City-pairs in the top-right quadrant have a
higher than average BTO and DDI-F; this may indicate a less resilience schedule.
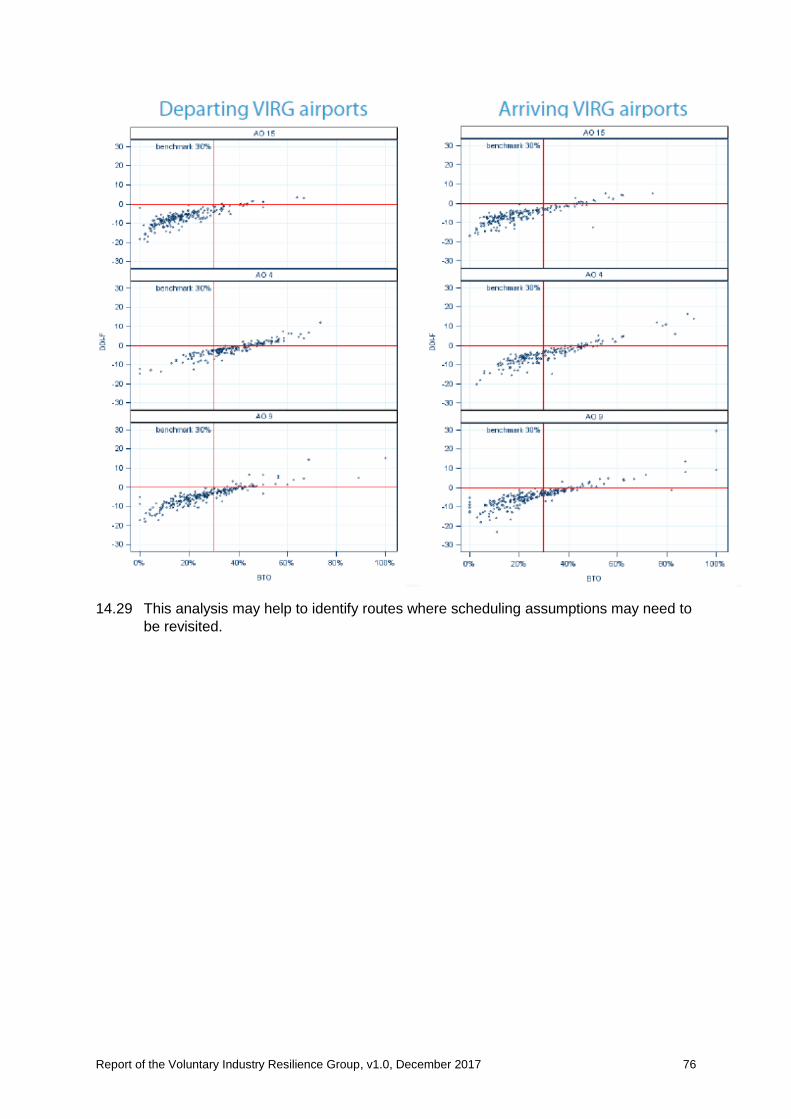
Report of the Voluntary Industry Resilience Group, v1.0, December 2017 76
14.29 This analysis may help to identify routes where scheduling assumptions may need to
be revisited.
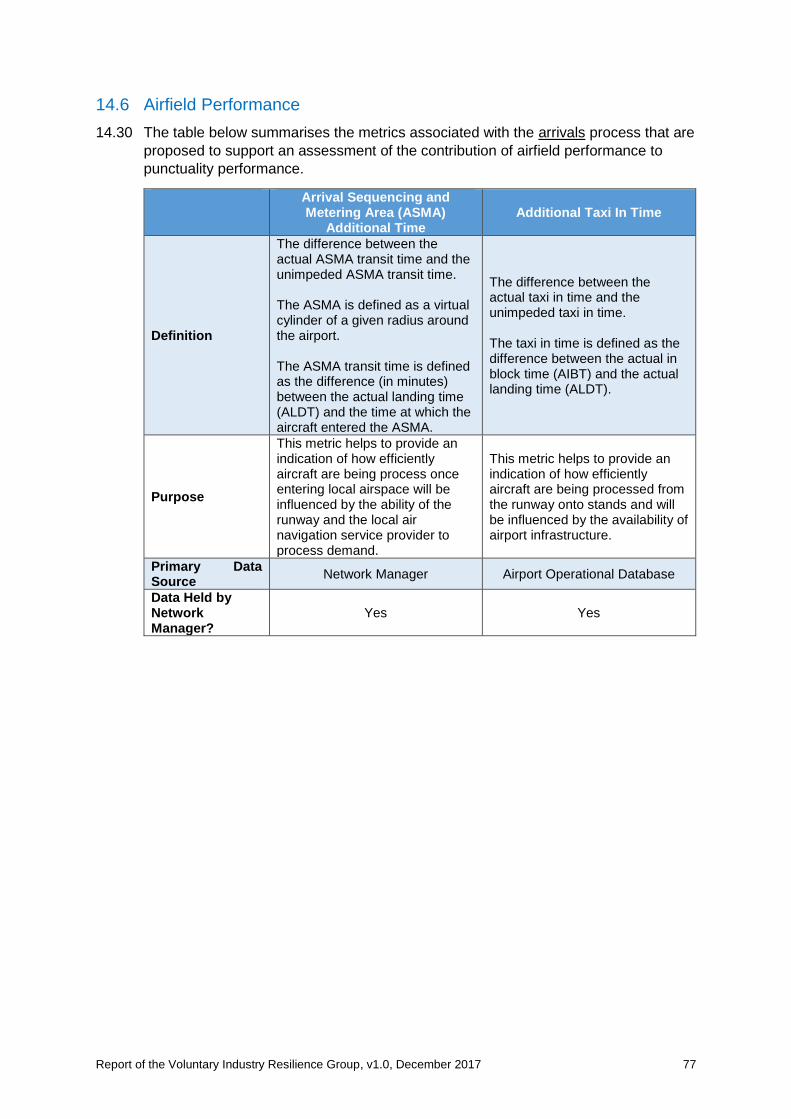
Report of the Voluntary Industry Resilience Group, v1.0, December 2017 77
14.6 Airfield Performance
14.30 The table below summarises the metrics associated with the arrivals process that are
proposed to support an assessment of the contribution of airfield performance to
punctuality performance.
Arrival Sequencing and Metering Area (ASMA)
Additional Time Additional Taxi In Time
Definition
The difference between the actual ASMA transit time and the unimpeded ASMA transit time. The ASMA is defined as a virtual cylinder of a given radius around the airport. The ASMA transit time is defined as the difference (in minutes) between the actual landing time (ALDT) and the time at which the aircraft entered the ASMA.
The difference between the actual taxi in time and the unimpeded taxi in time. The taxi in time is defined as the difference between the actual in block time (AIBT) and the actual landing time (ALDT).
Purpose
This metric helps to provide an indication of how efficiently aircraft are being process once entering local airspace will be influenced by the ability of the runway and the local air navigation service provider to process demand.
This metric helps to provide an indication of how efficiently aircraft are being processed from the runway onto stands and will be influenced by the availability of airport infrastructure.
Primary Data Source
Network Manager Airport Operational Database
Data Held by Network Manager?
Yes Yes
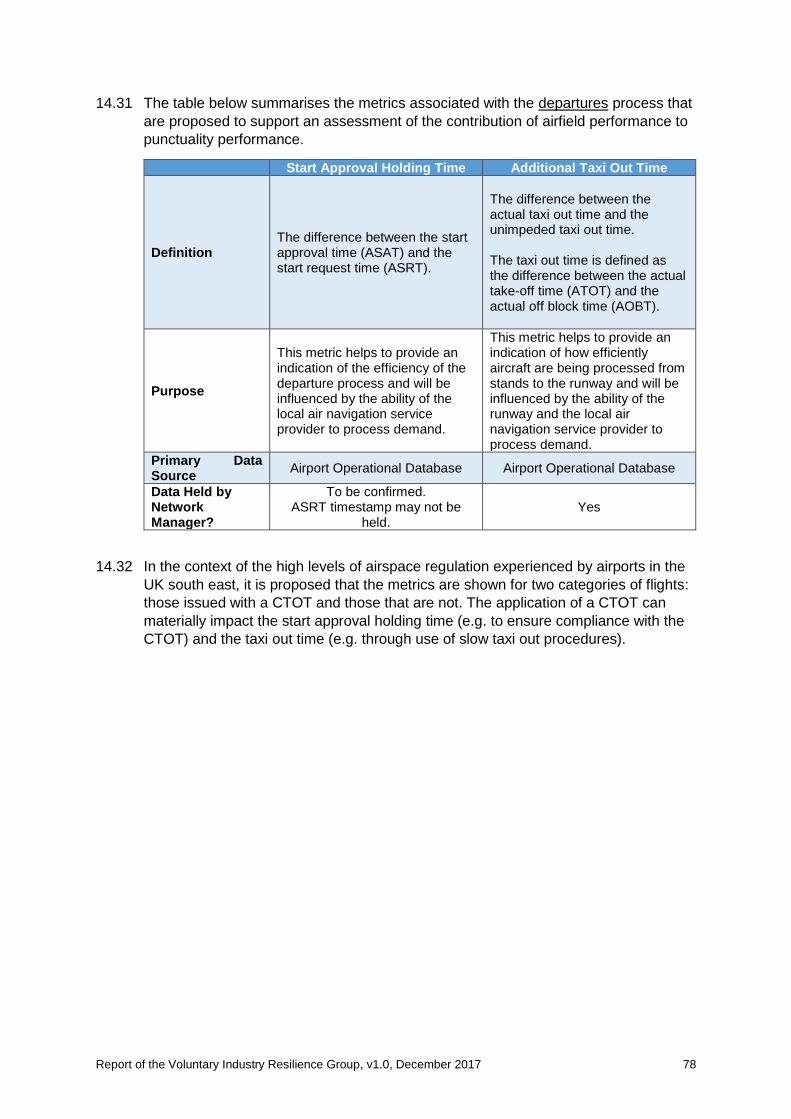
Report of the Voluntary Industry Resilience Group, v1.0, December 2017 78
14.31 The table below summarises the metrics associated with the departures process that
are proposed to support an assessment of the contribution of airfield performance to
punctuality performance.
Start Approval Holding Time Additional Taxi Out Time
Definition The difference between the start approval time (ASAT) and the start request time (ASRT).
The difference between the actual taxi out time and the unimpeded taxi out time. The taxi out time is defined as the difference between the actual take-off time (ATOT) and the actual off block time (AOBT).
Purpose
This metric helps to provide an indication of the efficiency of the departure process and will be influenced by the ability of the local air navigation service provider to process demand.
This metric helps to provide an indication of how efficiently aircraft are being processed from stands to the runway and will be influenced by the ability of the runway and the local air navigation service provider to process demand.
Primary Data Source
Airport Operational Database Airport Operational Database
Data Held by Network Manager?
To be confirmed. ASRT timestamp may not be
held. Yes
14.32 In the context of the high levels of airspace regulation experienced by airports in the
UK south east, it is proposed that the metrics are shown for two categories of flights:
those issued with a CTOT and those that are not. The application of a CTOT can
materially impact the start approval holding time (e.g. to ensure compliance with the
CTOT) and the taxi out time (e.g. through use of slow taxi out procedures).
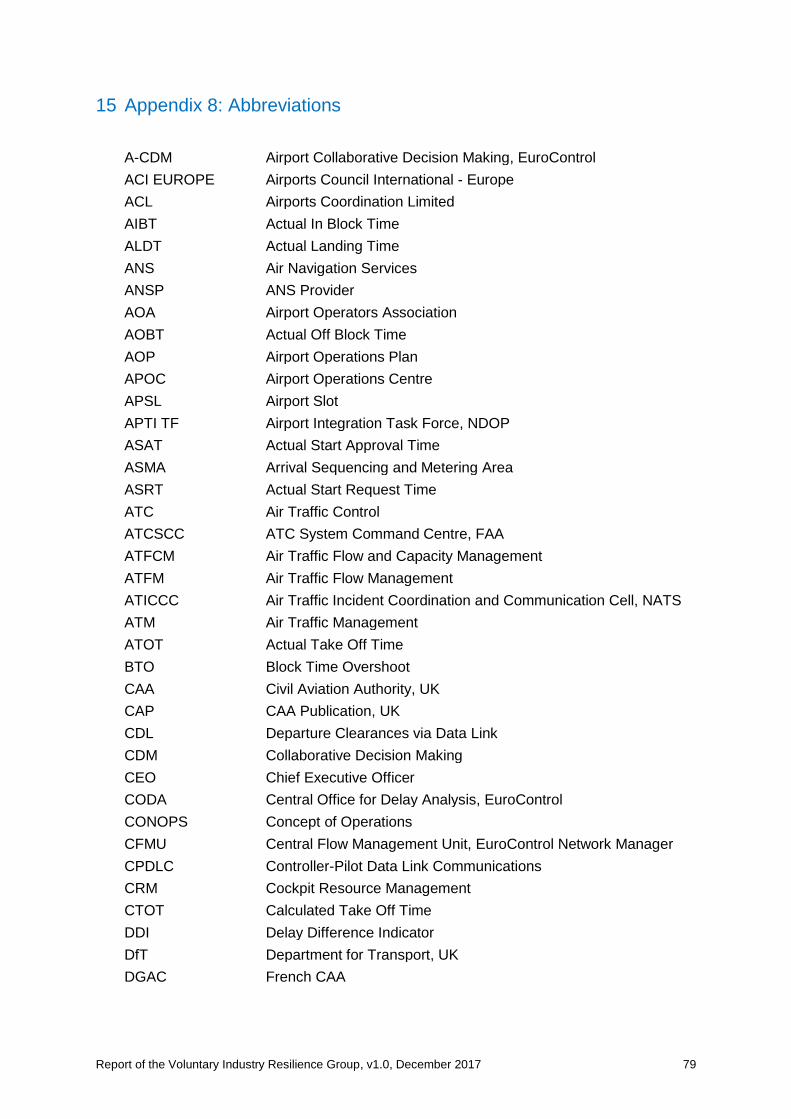
Report of the Voluntary Industry Resilience Group, v1.0, December 2017 79
15 Appendix 8: Abbreviations
A-CDM Airport Collaborative Decision Making, EuroControl
ACI EUROPE Airports Council International - Europe
ACL Airports Coordination Limited
AIBT Actual In Block Time
ALDT Actual Landing Time
ANS Air Navigation Services
ANSP ANS Provider
AOA Airport Operators Association
AOBT Actual Off Block Time
AOP Airport Operations Plan
APOC Airport Operations Centre
APSL Airport Slot
APTI TF Airport Integration Task Force, NDOP
ASAT Actual Start Approval Time
ASMA Arrival Sequencing and Metering Area
ASRT Actual Start Request Time
ATC Air Traffic Control
ATCSCC ATC System Command Centre, FAA
ATFCM Air Traffic Flow and Capacity Management
ATFM Air Traffic Flow Management
ATICCC Air Traffic Incident Coordination and Communication Cell, NATS
ATM Air Traffic Management
ATOT Actual Take Off Time
BTO Block Time Overshoot
CAA Civil Aviation Authority, UK
CAP CAA Publication, UK
CDL Departure Clearances via Data Link
CDM Collaborative Decision Making
CEO Chief Executive Officer
CODA Central Office for Delay Analysis, EuroControl
CONOPS Concept of Operations
CFMU Central Flow Management Unit, EuroControl Network Manager
CPDLC Controller-Pilot Data Link Communications
CRM Cockpit Resource Management
CTOT Calculated Take Off Time
DDI Delay Difference Indicator
DfT Department for Transport, UK
DGAC French CAA
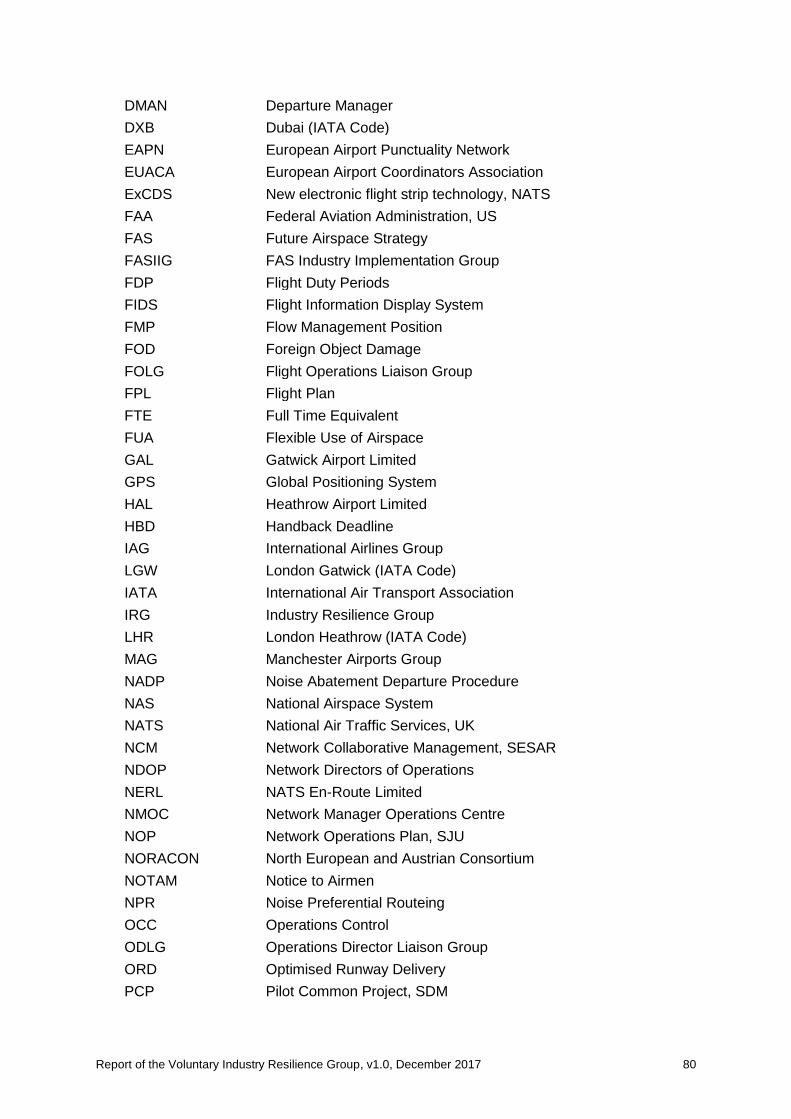
Report of the Voluntary Industry Resilience Group, v1.0, December 2017 80
DMAN Departure Manager
DXB Dubai (IATA Code)
EAPN European Airport Punctuality Network
EUACA European Airport Coordinators Association
ExCDS New electronic flight strip technology, NATS
FAA Federal Aviation Administration, US
FAS Future Airspace Strategy
FASIIG FAS Industry Implementation Group
FDP Flight Duty Periods
FIDS Flight Information Display System
FMP Flow Management Position
FOD Foreign Object Damage
FOLG Flight Operations Liaison Group
FPL Flight Plan
FTE Full Time Equivalent
FUA Flexible Use of Airspace
GAL Gatwick Airport Limited
GPS Global Positioning System
HAL Heathrow Airport Limited
HBD Handback Deadline
IAG International Airlines Group
LGW London Gatwick (IATA Code)
IATA International Air Transport Association
IRG Industry Resilience Group
LHR London Heathrow (IATA Code)
MAG Manchester Airports Group
NADP Noise Abatement Departure Procedure
NAS National Airspace System
NATS National Air Traffic Services, UK
NCM Network Collaborative Management, SESAR
NDOP Network Directors of Operations
NERL NATS En-Route Limited
NMOC Network Manager Operations Centre
NOP Network Operations Plan, SJU
NORACON North European and Austrian Consortium
NOTAM Notice to Airmen
NPR Noise Preferential Routeing
OCC Operations Control
ODLG Operations Director Liaison Group
ORD Optimised Runway Delivery
PCP Pilot Common Project, SDM
Report of the Voluntary Industry Resilience Group, v1.0, December 2017 81
PCP AF PCP ATM Function, SDM
PERTI Plan, Execute, Review, Train and Improve (FAA process)
PRM Passengers with Reduced Mobility
RP2 Reporting Period 2, Single European Sky
RECAT European Wake Turbulence Categorisation
SDM SESAR Deployment Manager
SEAT South East Airports Taskforce
SES Single European Sky
SESAR SES ATM Research
SIBT Scheduled In Block Time
SID Standard Instrument Departure
SJU SESAR Joint Undertaking
SOBT Scheduled Off Block Time
STAM Short Term ATFCM Measure
STATFOR Statistics and Forecasts, EuroControl
STN London Stansted (IATA Code)
TMA Terminal Manoeuvring Area
TOSC Technical and Operational Safety Committee, ACI EUROPE
TSAT Target Start-up Approval Time
UKOMA UK Operations Managers Association
VHF Very High Frequency
VIRG Voluntary Industry Resilience Group
TBS Time Based Separation
WSG Worldwide Slot Guidelines


