+ All Categories
Home > Documents > Report ofthe National Research Center for Disaster...

Report ofthe National Research Center for Disaster...

Date post: 06-May-2018
Category:
Upload: hoangcong
View: 215 times
Download: 2 times
Share this document with a friend
19
Report ofthe National Research Center for Disaster Prevention.No.44,Octob 511,501.7: 551,515.4: 578.45 The Dopp1er Radar of NRCDP amd Observ Meso・S㎝1e Weather Systems by Masayuki Maki‡,Tsumhei Yagi串and Sento Nakaiホ M肋〃地∫鮒肋α肋γ〃〃∫α∫〃肋閉fゴo〃,切伽 Abstract The Doppler radar of the Nationa1Research Center for was comp1eted in March,1988.The main characteristics of antema with rapid scanning abi1ities,(2)various antema s contro11ed,(3)a real time color display of rainfal1intensit Doppler spectrum width,and(4)portabi1ity.NRCDP’s Dopp1er study three-dimensiona1structures of meso-sca1e seve Several examples of the Doppler radar observations precipitation in the Baiu season,a thunderstorm whose1ifet it could not be detected by the existing weather observatio associated with a monsoon burst in winter,and an orogr enhanced snowfa1l in the in1and area of the Tohoku Dis scanning modes appropriate for three-dimensiona1o phenomena are also discussed herein. Key words:Dapp1er radar,meso-sca1e,thunderstorm,sn 1. ImtrOdl1ctiOn Various weather phenomena which we experience every severa1c1asses according to their typica1horizonta1sca1e 1.Some of these weather phenomena are disastrous and oft pub1ic property and our dai1y lives(Oyagiθ左α1.,1984;Kinosi αZ.,1988).To predict the occurrence of meteoro1ogical di recognize the horizonta1sca1e and1ifetime of the weathe observation methods and instruments. At present,there are various types of weather observa examp1e,the Japan Meteorologica1Agency(JMA)has18up which measure the atmospheric pressure,air temperat as we11as the wind speed and wind direction every6hours. of20stations of conventiona1weather radars and ‡Atmospheric Disaster Laboratory,First Research Division 一61一
Transcript

Report ofthe National Research Center for Disaster Prevention.No.44,October.1989

511,501.7: 551,515.4: 578.45

The Dopp1er Radar of NRCDP amd Observations of

            Meso・S㎝1e Weather Systems

                      by

Masayuki Maki‡,Tsumhei Yagi串and Sento Nakaiホ

M肋〃地∫鮒肋α肋γ〃〃∫α∫〃肋閉fゴo〃,切伽

Abstract

   The Doppler radar of the Nationa1Research Center for Disaster Prevention

was comp1eted in March,1988.The main characteristics of the radar are(1)an

antema with rapid scanning abi1ities,(2)various antema scan modes computer-

contro11ed,(3)a real time color display of rainfal1intensity,Dopp1er ve1ocity and

Doppler spectrum width,and(4)portabi1ity.NRCDP’s Dopp1er radar is useful to

study three-dimensiona1structures of meso-sca1e severe weather phenomena.

Several examples of the Doppler radar observations are shown:stratiform

precipitation in the Baiu season,a thunderstorm whose1ifetime was so short that

it could not be detected by the existing weather observation systems,a snowstorm

associated with a monsoon burst in winter,and an orographica11y induced or

enhanced snowfa1l in the in1and area of the Tohoku District. The antenna

scanning modes appropriate for three-dimensiona1observations of these

phenomena are also discussed herein.

  Key words:Dapp1er radar,meso-sca1e,thunderstorm,snow stom

1. ImtrOdl1ctiOn

    Various weather phenomena which we experience every day may be grouped into

severa1c1asses according to their typica1horizonta1sca1es and1ifetimes,as shown in Fig.

1.Some of these weather phenomena are disastrous and often do serious damage to the

pub1ic property and our dai1y lives(Oyagiθ左α1.,1984;Kinositaθτα1.,1987;Tanakaθオ

αZ.,1988).To predict the occurrence of meteoro1ogical disasters it is essentia1to

recognize the horizonta1sca1e and1ifetime of the weather systems and se1ect adequate

observation methods and instruments.

    At present,there are various types of weather observation systems in Japan.For

examp1e,the Japan Meteorologica1Agency(JMA)has18upPer air observation stations

which measure the atmospheric pressure,air temperature and humidity every12hours

as we11as the wind speed and wind direction every6hours.JMA a1so has a distribution

of20stations of conventiona1weather radars and about1300AMeDAS(Automated

‡Atmospheric Disaster Laboratory,First Research Division

一61一

Report ofthe National ResearchCenter forDisaster Prevention,No,44,October.1989

百11 曽

1・刈1 …≡

1l・・俳、

1婁2。。l11

      ㎞ 曇帥

舅葦9111

隻よ/1l

/        COLD WAVE          /

   DROUG町        ■

ANTICYCLONE’CYCLONE

       /

   BAIU FRONT

/㎜NSEVERE RA工N STORM      ■

THUNDERSTORM

/TORNADO

/CUMULUSCONVECTI ON

1昌・・帖/胃 8   { DUST㎜IRL口  oo     2

11・1/N            TURBULENCE

1⊥

  TIME

1MIN. 1 HOU R    l DAY     l MONTH   l YEAR

        H   H  SHORT-RANGE  H   LONG-RANGE  FORECAST            FORECAST             ONE WEEK

             FORECAST

Fig.1 Horizontal sca1e and lifetime of various weather phenomena.

Meteorologica1Data Acquisition System)stations throughout Japan.Meteoro1ogica1

e1ements near the surface are measured at AMeDAS stations and the co11ected data are

sent to the computer center of JMA through the pub1ic te1ephone1ines.The radar-

AMeDAS composite weather map can be seen dai1y on TV programs throughout Japan.

In addition,c1oud pictures over Japan provided by the GMS(Geostationary Meteo-

ro1ogical Sate11ite)which is a part of the g1oba1sateuite system in the wor1d,can be seen.

A1though some attempts are made to forecast meso-sca1e weather using some of the

weather obser▽ation systems mentioned above(Browning,1982),there is no estab1ished

method or system for forecasting the meso-scale phenomena yet.The reason is because

the existing weather observation systems are designed main1y for short-range(about2

days),one week,and1ong-range(about6months)forecasts.A1so the systems are usefu1

一62一

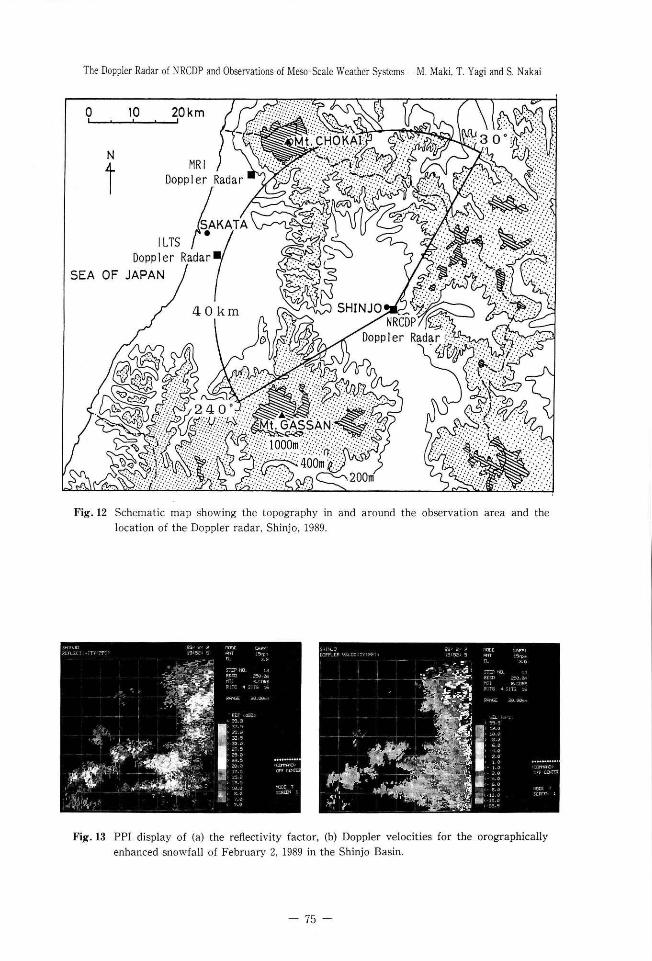
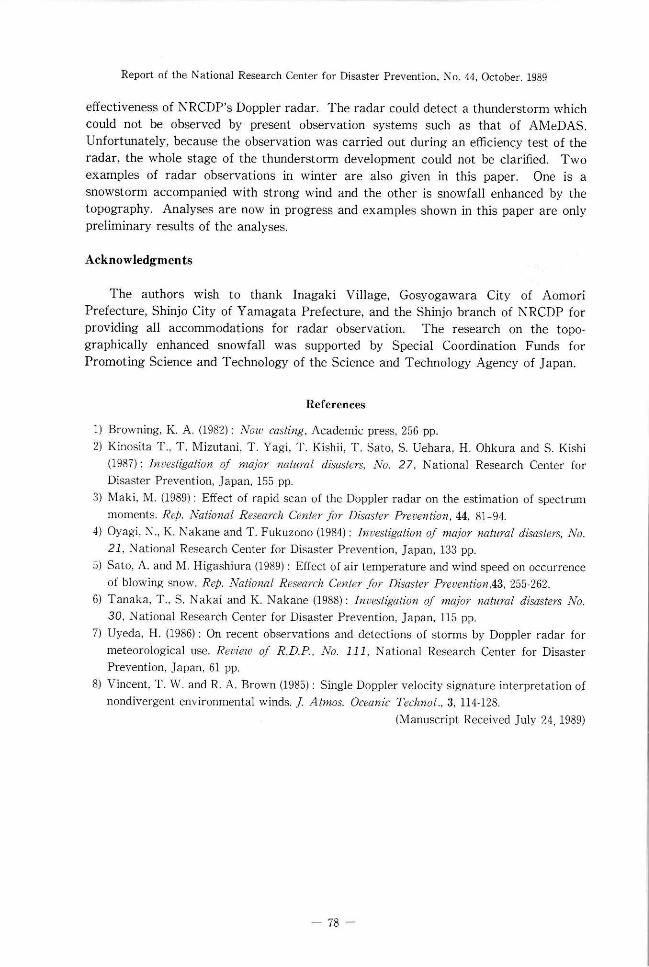
The Dopp1er Radar of NRCDP and Obsemations of Meso-Scale Weather System←M.Maki,T.Yagi and S.Nakai

to forecast intermediate-sca1e weather phenomena such as anticyc1ones,cyc1ones,as we11

as typhoons and macro-scale weather phenomena. On the other hand,meso-sca1e

phenomena such as severe rain storms,thmderstorms,and tomadoes are often

over1ooked in the present weather observation systems because of their sma1l horizonta1

scale(from about a few hundred meters to severa1hmdred ki1ometers)and their short

1ifetimes(from a few ten minutes to a day).

   To overcome these d冊culties and to study meso-sca1e severe weather phenomena

which cause disasters,the use of the Dopp1er weather radar was proposed.The Dopp1er

radar can detect the presence of disturbances,determine their direction and range,and

clarify their three-dimensional structure in a few minutes.It can a1so measure the wind

丘e1d in a disturbance using the Doppler effect.Recent applications of the Dopp1er radar

for storm observations were reviewed by Uyeda(1986).

   Severa1kinds of Doppler radars are used in the fie1d of meteorology in Japan:a5-

cm wave1ength Dopp1er radar of the Meteoro1ogica1Research Institute(MRI)for

observations of typhoons and cyclones;a3-cm wave1ength portab1e Doppler radar of

MRI forsevere rainfa11observations;athree-dimensiona1scamingDopp1erradaroftheInstitute of Low Temperature Science of Hokkaido University for studies of c1oud

physics;and a dua1polarization Dopp1er radar of the Pub1ic Works Research Institute.

In this paper,the main characteristics and the performance of NRCDP’s Dopp1erweather

radar which was comp1eted in March,1988aredescribed,and some examp1es ofDopp1er

radar observations are shown. Suitab1e antema scan modes for Dopp1er radar

observations of meso-sca1e weather phemmena are a1so discussed.

2.Performame of the Dopp1er mdar of Nationa1Research Cemter for Disaster

   Prevemtion(NRCDP)

   NRCDP’s Doppler weather radar was designed to study meso-sca1e severe weather

phenomena such as snowstorms,1ocal severe rain,thunderstorms,strong wind,and other

loca1terrain-induced phenomena.The main characteristics of the radar are:

1) various antenna scan modes contro11ed by a computer;

2) high antema rotation speed(max.15rpm.);

Fig.2 ExteriorofNRCDP’sDoppler      radar.

一63’

Report of the Nationa1Research Center for Disaster Prevention,No・44,October・1989

3) rea1time co1or disp1ay of rainfa11intensity,Dopp1er ve1ocity,and Dopp1er spectrum

   width・

4)  Portabi1ity.

The exterior of the radar and the interior of the radar she1ter are shown in Fig,2and

Fig.3,respective1y.

   NRCDP’s radar consists of severa1units as shown in Fig.4.The teansmitter

producespower at the radar frequency of9415MHz,which ismodulated inthe form of

pu1ses of radio waves of O.5μsec and sent to the antenna at a“pu1se-repetition

Fig.4 Constituentsof NRCDP’sDopplerradar.

1. ANTENN^

「L■一

■        2

9  P^NEL BO^D

l lAVR〕

L____

 {W^VEGUIDE〕

   L1         5・           4. SIGNALSCANNER             PROCESSOR

SYSTEH          6.CONTROLLER

DATA PROCESSOR    フ. D^T^

Fig.3 Interior of NRCDP’sDopplerradar.

  1O. SHELTER  一一’■一1■「

RECORDER          -

 1        1

   {SIGN^L GENERATOR〕

     h  一   {OSC工LLOGRAP目〕     ]  ■

_一__一一一一一一

一64一

The Dopp1er Radar of NRCDP and Obsemations of Meso-Scale Weather Systems一一M・Makil T・Yagi and S・Nakai

frequency”of2000Hz.The transmitted peak power is40kW.The antema,which is

a parabo1ic-shaped reHector and2m in diameter radiates this pu1se-shaped power

through the air in the form of a sharp penci1beam of1.2degrees in width.These va1ues

of radar speciications,which were determined by the radar equation,were selected

                Table1

1.Antema Assemb1y

     Reflector

     Beam-width・…………・

     Gain

     Polarization……

2.Scanner

     Azimuth ang1e………・・

     E1evation angle

     Scan rate

     Scan control・・・・・・・・・・・…

SpecificationsofNRCOP’sDopp1erradar

3.Transmitter-Receiver

   Transmitter Aspect

     Radar frequency……………・

     Transmitted peak power…・

     Transmitted pu1se-width-

     PRF

     Transmitting tube・…………

   Receiver Aspect

     Noise figure…・・

     Minimum detectab1e signal・

     Intermediate frequency一…

     Bandwidth

4.Signal Processor

   Reflectivity Mode

     Range correction

     Ground c1utter e1imination・

     Averaging……………・・

     Detectab1e intensity

     Range…………・

   Dopp1er Mode

     Method……………・…

     Processed data

     Velocity range………………・

     Reso1ution……………………・

     Range………………・・………・・

・2maperture,circularparabola・1.2古or less in horizontal and vertical

・42dB

・Horizontal

・36ぴaround

 -5。~ユ85o

・・15rpm(max.)

・・Manual・mode

CPU-mode:PPI,RHI,CAPPI,SPPI,SRHI

Program-mode(Combination of CPU-modes)

・9,415MHz

・40kW・・O.5μsec

・・2,000Hz

・Magnetron

≦5dB・≦ 一110dBm

・30MHz

・2,0MHz±0.5MHz

・Subtraction method

・MTI method

・Weighted moving average

・0.1mm/h~100mm/h

・64km

・Pulse pair processing

・Doppler velocity,spectrum width

・±16m/sec

・12.5cm/sec

・64km

一65一

Report of the National Research Center for Disaster Prevention,No.44,October.!989

5.System Contro11er and Indicator

     Control pane1

Indicator

6.Data Processor

     Computer・

System console

Termina1

Software

7.Data Recorder

     Magnetic disc unit・

FlopPy disc unit・

Magnetic tape unit

8.Data Visual Disp1ay

     CRT

     Image memOry

     Color…・・…

9.Panel Boad

     Automated voltage regulator(AVR)

     Input voltage

     Output vo1tage

     Consumption power

10.She1ter

     Alumimm,Air-conditiohed

     Portable

・・Power supPly contro1

Transmitter control

Antema scan control(mama1)

・・20-inch type CRT,7colors

A-Scope,3channe1s

PPI,RHI(Intensity,Doppler ve1ocity,

Spectrum width)

・JAC150,32・bit

Max.memory capacity,16MB

Cycle time,500nsec or less

Computing speed,1.25μsec or less

・14-inch type CRT,character(ASCII)

・Microcomputer

・Application program schedu1er

Radar system control

Data collection and playback

Image data processing

・Memory capacity,60MB

Transfer rate,806kB/sec or1ess

・8-inch,2DD,1MB

Transfer rate,2MB/sec(read)

・Transport,2

Record density,1600/6250BPI

Tape speed,100IPS or more

g track,2400feet,1/2inch

・20・inch type,high reso1ution

Zooming,Scroning

2048×1024×4・RGB,16/4096color

・AC200V(three phase)

・AC1OOV(single phase)

・10kVA(max.)

under the constraints of portabi1ity and observations of meso-sca1e weather phenomena.

Aportionofthisradiatedpowerisinterceptedandre・radiatedinal1directionsby”targets”which are renecting objects such as rain drops and showiakes.The antenna

co11ects the returned weak energy and de1ivers it to the receiver,where it is detected,

一66一

The Doppler Radar of NRCDP and Observations of Meso-Scale Weather Systems__M.Maki,T.Yagi and S.Nakai

(a)PP1-MODE (b)RH1-1)lODE

(c)CAPP1-MODE (d)SPP1-MODE (e)SRH1■MODE

         θel           O≦θal〈θa・<360                                         0≦θe1≦θe2≦180

Fig.5 Schematic pictures of various antema scan modes.PPI:P1an position indicator I RHI:

      Range height indicator;CAPPI:Constant a1titude PPI;SPPI:Sector PPI;SRHI:

      Sector RHI.

amp1i丘ed,and transformed into video form.This video signa1is processed to detect the

presence of the target and to extract its1ocation and re1ative ve1ocity.The processed

data are recorded on the magnetic tape of the data recorder while they are indicated on

the co1or disp1ay at rea1-time.More detai1ed speciications of the radar are shown in

Tab1e1.

   Among the characteristics of the radar mentioned previous1y,the most unique is the

computer contro1of the antema movement.The antema is moved mechanica11y to scan

the beam with various modes shown in Fig.5.In the PPI(Plan-Position Indicator)scan

mode,the beam revo1ves aromd a vertica1axis at any constant e1evation ang1e,θ、.In

the RHI(Range-Height Indicator)scan mode,the beam scans in an e1evation at any

constant azimuth ang1e,θ、.The CAPPI(Constant-A1titude P1an-Position Indicator)scan

mode is a set of PPI scans and used to obtain the three-dimensiona1data of the weather

phenomena.The SPPI(Sector-PPI)scan is a modification of the PPI scan in which the

beam scan is restricted within the1imits of any azimuth ang1e.The SRHI(Sector-RHI)

scan is a1so a modiication of the RHI scan in which the beam scan is restricted w1thin

the1imits of any e1evation ang1e.These antema scan modes are a1so usefu1in obser▽ing

the three-dimensiona1structre of meso-scale weather phenomena.A more detai1ed

一67一

Report ofthe Nationa1Research Center forDisaster Prevention,No・44,October・1989

ANTENNA

r…     一 一 一・一…

TRANSM工TTER - RECE工VER

DOPPLER RADAR SHELTER

SIGNALPROCESSOR

REAL T工ME DISPLAY

DATAPROCESSOR

COLORMON工TOR

ON L工NECOLOR GD

DATARECORDER OFF L工NE

(r。θ)

DATA一」

OFF LINE

(6250BPI)

;Ref1ectivi七y’ Doppler velocity’Spectrum width

:CAPP I’ Cros s sec tion’

 Wind profi1e

1■

(X.y)

DATAQU工CK LOOK

ANALYS工S

L工ST

COMPUTERACOS・650

L工NEPR工NTER

M工N工一

COMPUTERNED工PS

COMPUTER ROOM  l

COLOR GD       l

PREVIEV3-DIMENS工ONAL    MOV工E

X・YPLOTTER COLOR GD HARD COPY

I一一一・・●一■一■・ ・…    一・.・‘・…    . ・・一…    i.一・…     一 ・I・一一・一一・一 …    I ・ ・一 一 一. 一・ …     一・ .・一  一一 一 ・…  」

Fig.6 F1ow of data and data analysis procedure.

一68一

The Doppler Radar of NRCDP and Observations of Meso-Sca1e Weather System←M.Maki,T.Yagi and S.Nakai

discussion about the optimum scan mode for the three-dimensiona1observation wi11

fo11ow later.

  The radar has another unique characteristic,rapid scanning of the antenna. The

maximun antema rotation speed is15rpm.This performance is also required for meso-

scaleweatherobservations.Adetaileddiscussionregardingitseffectonthesignalprocessing was comp1eted by Maki(1989).

   As the co11ected data are extensive,ski11fu1ana1yses of the data inc1uding data

transformation and data me management are required.The now of data and the

procedure of data analyses are shown in Fig.6.The process of data ana1yses are grouped

into two stages:The irst process is the basic analysis in the radar sheIter and the second

is the advanced ana1ysis in the computer room of NRCDP.The radar re刊ectivity factor,

Dopp1er velocity and Dopp1er spectrum width which are processed by the signal

processor,are sent to the data processor and recorded on magnetic tapes in6250BPI.

The data collected on magnetic tapes are analyzed by a32-bit minicomputer(JAC-150)

in the radar shelter and various kinds of image data are reproduced on the color graphic

display.Basic structures of the observed weather phenomena are inferred from pictures

shch as PPI,RHI,CAPPI images and time-height cross sections of the radar re刊ectivity

factor and DoppIer velocity.In addition to this,co11ected data can be a1so ana1yzed

quantitative1y by the genera1purpose computer,ACOS-650,when a more advanced

ana1ysis of the data or long ca1cu1ation time is required.A three-dimensional disp1ay of

the co1lected data and an echo picture which changes every second are made in the

computer room.

3.Examp1es of weather phenomema observed with the Dopp1er mdar

   Some examples of weather phenomena observed with NRCDP’s Dopp1er radar are

shown in this section.The irst examp1e is stratiform precipitation observed during the

Baiu season and the second is a thunderstorm observed in summer,whose scale and

lifetime were so sma11that it could not be detected by the existing weather observation

system such as AMeDAS of JMA.In both observations,the Doppler radar was1ocated

at NRCDP in Tsukuba City of Ibaraki Prefecture.The third example is a band・shaped

snowfall accompanied by strong winds observed in the Tsugaru p1ain in the Tohoku

District ofJapan,which is associatedwith a monsoonburst overtheJapanSea inwinter.

The last example is an orographica11y induced or enhanced snowfa11observed in the

Shinjo basin which is also1ocated in the Tohoku District.

∫τRλτZFOR〃PREClP∫Tλτ10.V   Weak rain from a thick stratiform cloud was observed on May12.1988by NRCDP’

s Dopp1er radar.Fig.7(a)is the rea1-time PPI disp1ay of the reHectivity obtained from

a360degree scanning with the e1evation ang1e of10.5degrees.The concentric circ1es

show each5km radius from the radar sitel The leve1s of renectivity intensity1,2,3,4,

5,6correspond to the rainfal1intensity of O.1,O.2,O.7,3,12,50mm/hr respective1y,when

the empirica1Z-R re1ationship,Z=200R1・6,is used;where Z it the ref1ectivity factor and

R the rainfa1l intensity.The concetric circular pattem of the radar echo in Fig.7(a)

represents the mu1ti-1ayeエed structure of the prとcipitation system.This is seen more

一69一

Report of the National Research Center for Disaster Prevention,No.44,October.1989

Fig.7 PPI display of(a)the reHectivity factor,(b)Dopp1ervelocities,and RHI display of(c)the

      reHectivity factor,(d)Doppler velocities for stratiform precipitation of Mayユ2.1988.

c1ear1y in the RHI disp1ay.Fig.7(a)shows a vertica1cross section of the re刊ectivity,the

azimuth of which is80.!degrees.The horizontal and vertica1grid interva1is5and lkm,

respectively,and the radar1ocation is at the center of the base.From Fig.7(c),it is c1ear

that4weak precipitating1ayers existed and that the echo top of the highest1ayer was

about4km.   If re1ative motion exists between a target and the radar,the carrier frequency of the

renected wave is shifted,i.e.,Doppler ve1ocities can be observed.A PPI disp1ay of

Dopp1er ve1ocities at the same e1evation ang1e as in Fig,7(a)is shown in Fig.7(b)and a

RHI disp1ay of Dopp1er ve1ocities in the same vertica1cross section as in Fig.7(c)is

shown in Fig.7(d).Interpretation of the Dopp1er velocity ie1d requires experienced

know1edge because a sing1e Dopp1er radar maps a丘e1d of velocities that are directed

一70一

The Dopp1er Radar of NRCDP and Obsemations of Meso-Sca1e Weather System←M.Maki,T.Yagi and S.Nakai

湾,’・

Fig.8 CAPPI disp1ay of(a)the re刊ectivity factor,(b)Dopp1er ve1ocities,and(c)the spectrum

      width for the thmdbrstorm of September3.1988.

either toward or away from the radar site.However,several major features in the wind

丘eld can be drawn from a Dopp1er ve1ocity pattern(Vincent and Brown,1985).The zero

velocity band bisecting the ve1ocity ie1d in Fig.7(b)is S・shaped within about a20km

range and the direction of the band changes from northwest to west at about the20km

range(a height of4km).Because the wind direction at the zero velocity point is norma1

to the radar,this means that a southeast wind near the surface veers with a height up to

about4km(20km range)and then back above.The RHI image of the Dopp1er velocities

(Fig.7(d))also conirms the above mentioned wind ield.

τHωVZ)ER∫TOR〃   A thunderstorm which cou1d not be detected by the existing surface observation

network was observed by NRCDP’s Dopp1er radar on September3.1988.Unfortunate1y,

一71一

Report of the Nationa1Research Center for Disaster Prevention,No.44,October.1989

秤口」36.N

140.E

       ・

       .       ■       ・

       ・     ■.            .

AbuHi

ku皿a11s….

.1.ザ.

     ■

. ●

一・Q鮮 ■

1“・

            ノ・曹.

        ./.ニ

     グv

     Mt.TSukub .ノ

        ■

\   NR  ’へ

     \・  十

   (36.N,140o

         ’\

            ’\

・  2mm

ン・・ノ.

T■

ura

/‘

RAINFALL14~15JST、

[コO~200mI:三:≡:≡11200~400

昌≡…1400~600

■600~

O 30km AMOuNTSEP3.1988

Fig.9 Composite map showing the1ocation of a thunderstom]and the rainfall amount at the

surface measured by AMeDAS.Topography and the radar obsemation area are also

shown.Contour lines of the thunderstorm at14:43JST are drawn at1O dBZ intervals and

the b1ack part shows the area whose intensity is larger than30dBZ、

as the observation was carried out during the test operating period of the radar,the

who1e stage of the thunderstorm deve1opment cou1d not be observed.However,a three-

dimensionaI observation was conducted at14:30,14:43and15:0!JST,respective1y,

and the fo11owing example shows the effectiveness of the NRCDP’s rapid scan Doppler

radar for1oca1severe weather phenomena.

   Fig.8(a)is the CAPPI image of the re刊ectivity factor for the thmderstom,which is

indicated on the high reso1ution co1or display.The height of the CAPPI is3km and the

grid interva1is5km.The1ocation of the radar is at the center ofthe picture.In contrast

to the irst examp1e,the reHectivity of the thmderstorm is50dBZ or more.This va1ue

corresponds to a rainfaH intensity of50mm/h.Another typica1characteristic of the

72

The Doppler Radar of NRCDP and Obsemations of Meso-Scale Weather System←M.Maki,T.Yagi and S,Nakai

thmderstorm is sharp gradients of intensity.Fig.8(b)is a CAPPI disp1ay of Doppler

velocities.It is di蘭cu1t to estimate the wind ie1d from the igure because a zero Doppler

ve1ocity band is not distinct in this case.Fig.8(c)is a CAPPI display of the spectrum

width which is an indicator of turbu1ence or a1arge wind shear.It is evident that a1arge

wind shear zone exists in the thunderstorm and that it corresponds to a large renectivity

part of the storm.

   It was inferred from the Dopp1er radar observation and the surface rain gauge data

of AMeDAS(Fig.9)that this thunderstorm occurred and deve1oped rapid1y after14JST.

The storm stagnated at the same p1ace about15km south to the radar site and it became

extinct after15JST.According to Fig.9,the size of the storm was so sma1l that it could

not be detected by the surface rain gauge measurements by AMeDAS.

SN0肌Sτ0R〃   One of the disastrous meteorological phenomena in the northern part of Japan is a

snowstorm accompanied with strong wind which can be a major obstac1e for tra箭cs and

cause serious damage to the environment.The Shinjo branch of NRCDP has been

studying snowstorms from the standpoint of g1acio1ogy(Sato and Higashiura,1989),but

theobservationhasbeenrestrictedinthesurfaceboundary1ayerwhichisabout1Omin

野 141E

・1燃・

.造鰍阜

         ■       41N

      OMOR!

o141E

9

〔コ〈 200m

区ヨ≧200匿ヨ≧600■≧1000

コ1・

撃・GOSYOGAWARA

.蟻

さI ?・1・

・.玲’1

ガ:’

駕・、護郷0        40km

Fig.10 Schematic map showing the topography in and around the obseπation ares and the

location of the Doppler radar,Tsugaru,1989.The cross mark shows the1ocation of the

radar and the circle shows the radar observation range.

一73一

Report ofthe National Research Center for Disaster Prevention,No.44,October.1989

Fig.11PPI display of(a)the reHectivity factor,(b)Doppler velocities for the snowstorm of

      January28.1989in the Tsugaru plain一

height,To overcome this restriction and carry out a more extensive observation of this

type of snowstorm,the use of the Dopp1er radar was proposed.A comprehensive study

using a Dopp1er radar,radiosonde measurements,and surface layer measurements began

in January ofユ989.Fig.10shows the observation area and the1ocation of the Dopp1er

radar.The purpose of the Doppler radar observation is to c1arify the area and the

duration time of the snowstorm and to deve1op a method predicting the occurrence of the

StOrm.

    One example of the snowstorms observed with the Doppler radar is shown in the PPI

disp1ay in Fig.11.The storm formed over the Japan Sea under a strong winter monsoon

burst and drifted eastward.The band-shaped snowstorm in Fig.11(a)passed over the

radar site,which is the center of the picture,and it dissipated over the Tsugaru Peninsu1a

after about one hour.The storm was associated with the strong wind shown in the PPI

disp1ay of Dopp1er ve1ocities in Fig.11(b).Because the e1evation ang1e is sma1l(0.6

degree),the pattem of Dopp1er ve1ocities gives information about the wind ie1d near the

surface.It can be seen that the wind direction was from the northwest to the sontheast

and the maximum wind speed was over20m/s.

0ROGRλP㎜Cλ五ムγE㎜NCED SN0㎜エム    The research project for investigating the actua1conditions of snow c1ounds over the

Japan Sea in the winter and studying the possibi1ity of artiicia1snowfa11contro1was

started in February,!989. The NRCDP participated in the research program and

observed snowfa1l in the in1and areas in the Tohoku District of Japan.The main purpose

of the pro駅am was to c1arify the effect of topography on snowfa11and to give the basic

information about the change of snowfa11mder natura1conditions when a quantitative

estimation of artiicial contro1of snowfal1is required.A schematic map showing the

topography in and around the observation area and the1ocations of the Dopp1er radars

are shown in Fig.12.Three Dopp1er radars were used in the project.Dopp1er radars

from the Institute of Low Temperature Science(ILTS)of Hokkaido University and the

NRCDP were arranged to observe the change in the snow c1ouds over the Dewa hi1ls,

一74一

The Doppler Radar of NRCDP and Obsemations of Meso-Scale Weather System←M.Maki,T.Yagi and S,Nakai

O lO 20km

N

†   湘1

Doppler Radar ㌶“:

例TA

           lLTS

        DoPPlerR

SEA OF JAPAN

1氏

    禽

簸 や   醐

禦雛 、

40kmo

400m

SHINJO      N繭P

   DoPPlerRada{二

一・..

、∵∴一一1。.

200㎜

Fig.12Schematic map showing the topography in and aromd the obser▽ation area and the

     location of the DoppIer radar,Shinjo,1989.

Fig・13 PPI display of(a)the re月ectivity factor,(b)Doppler velocities for the orographically

     enhanced snowfa11of Februa町2.1989in the Shinjo Basin.

一75一

Report of the National Research Center for Disaster Prevention,No.44,October.1989

located between two radars,whi1e the radars of ILTS and MRI(Meteoro1ogica1

Research Institute)of JMA were used to observe the snow clouds over the Sea of Japan

by dua1measuring modes.

    One example of orographically enhanced snow which was observed February2.!989

is shown in Fig.13.The1ocation of the radar is in the1ower right hand comer of the

rectang1e and the grid interva1is5km.The PPI picture of the radar reflectivity factor

(Fig.13(a))shows a topographical1y enhanced snowfa11echo about20km northwest of

the radar site.This area is over the east side of the Dewa hills and corresponds to the

downind s1opes of the hi11s.It is also interesting to note that there is a strange pattem

of the Dopp1er ve1ocity in the area which corresponds to the area of the enhanced

snowfa11(Fig.13(b)).

4.Concluding remarks

    The Dopp1er radar of the Nationa1Research Center for Disaster Prevention was

comp1eted in March,1988.The main characteristics of the radar are rapid scaming of

the radar antema and various scan modes contro11ed by a computer. These per-

formances are usefu1to observe severe weather phenomena whose horizontal sca1es are

smaIl and1ifetimes are short.

    The antema scan mode,which is appropriate to observe a weather phenomenon

three-dimensiona11y,depends on the horizonta1and vertical dimension of the pheno一

40K固

40KM

1o K固

20KH

5RM

SCAN 岬ODE SPEED OBSERV^TION TIHE SC^N HODE SPEED ○日SERV^TIO刊 丁工ME

CムPP工

SPPI

SRHI

Fig.14

    90deq/seo115rp皿〕   ~4I40II

    18deg/sec      ~4150II    18deg/sec      ~4■101I

Schematic pictures of vertica11y

extended phenomena and observation

time of various scan modes requied for

the three-dimensiona1measurement of

the phenomena.

CAPP工

SPPI

SRH工

Fig.15

   90 deg/sec (15rp皿〕      ~  21 401.

   18 deg/seo             ~ 41  011

   18 deg/昌eo             ~101 501■

As in Fig.14except for horizontany

extended phenomena.

一76一

The Dopp1er Radar of NRCDP and Obs細ations of Meso-Scale Weather System←M.Maki,T.Yagi and S,Nakai

menon. Two cases of the pheno-

mena were considered・one is a

phenomenon which extens vertically

but w二th a small horizonta1sca1e

(Fig114)and the other is a pheno-

menon which extends horizonta11y

but with a sha11ow depth(Fig.15).A

typica1examp1e of the former case is

a convective storm and that of the

latter case is the precipitation from

a stratiform c1oud or snowfa1l in the

Tohoku District in winter. The

observation time required for a

three-dimensiona1scan of the pheno-

mena is ca1cu1ated and listed in the

tables in Fig.14 and Fig.15 for

CAPPI,SPPI and SRHI scan modes.

It can be seen that the CAPPI scan

mode is the most suitable antema

operation mode for the observation

of horizonta11y extended phenomena.

Onthe otherhand,thesethreemodescan hard1y be compared in the case

of vertica11y extended phenomena as

far as observation time is consider-

ed.  However,considering theamount of data,the SPPI or SRHI

mode may be the suitab1e scan mode.

    In the observation of the snow-

storms at the Tsugaru p1ain,a set of

antema scan modes shown in Fig.16

was p1anned and used.The irst scan

mode,CAPPI,which consists of19

PPI modes(e1evation angle from O to

START

CAPPI15rpm

PP I  2rpm

RH I  3rpm

P PI  6rpm

PPI  6rpm

NO     STOP?

Fig.16

YE S

E N D

OBS.TlME

1一ぺ

二1二 、5011     1

ガ・…

、4-301I

Flow chart of antema scan modes

used in snowstorm observations at

Tsugaru.

20.4degrees),is for three-dimensiona1data acquisition of the snowstorms.The second

mode,PPI(the e1evation angle is20degrees),is for VAD(Ve1ocity Azimuth Disp1ay)and

used to obtain the vertica1wind proile at the radar site.The third mode,RHI,is for the

observation of the vertical structure of the snowstorm.The azimuth ang1e was usua11y

set to the wind direction,The remaining PPI modes(the e1evation angIe is0.6degrees)

are for the monitoring of the occurrence and movement of the snowstorm.Observation

times required for CAPPI(15rpm),PPI(2rpm),PHI(3rpm)are about4minutes,50

seconds,and40seconds,respective1y.The period of the monitoring mode(PPI modes)

is about4minutes and30seconds,and the tota1observation time for a set of scan modes

shown in Fig.16is about lO minutes.

    The thmderstorm observed in summer of1988is a good examp1e which shows the

一77一

Report ofthe Nationa1ResearchCenterforDisaster Prevention,No.44,October.1989

effectiveness of NRCDP’s Dopp1er radar.The radar could detect a thunderstorm which

cou1d not be observed by present observation systems such as that of AMeDAS.

Unfortunate1y,because the observation was carried out during an e伍ciency test of the

radar,the who1e stage of the thunderstorm deve1opment cou1d not be c1ari丘ed.Two

examp1es of radar observations in winter are a1so given in this paper. One is a

snowstorm accompanied with strong wind and the other is snowfal1enhanced by the

topography.Analyses are now in pro距ess and examples shown in this paper are on1y

preliminary resu1ts of the ana1yses.

Ackmwledgments

    The authors wish to thank Inagaki Vil1age,Gosyogawara City of Aomori

Prefecture,Shinjo City of Yamagata Prefecture,and the Shinjo branch of NRCDP for

providing a11accommodations for radar observation. The research on the topo-

graphica11y enhanced snowfa11was supported by Specia1Coordination Funds for

Promoting Science and Techno1ogy of the Science and Techno1ogy Agency of Japan.

I{efere]nces

1)Browning,K,A.(1982)=No〃6α∫〃〃g,Academic press,256pp.

2)Kinosita T.,T.Mizutani,T.Yagi,T.Kishii,T.Sato,S.Uehara,H.Ohkura and S.Kishi

  (1987):1舳θ∫だ8αチゴoηoグ〃φoγ〃α肋〃/〃∫ω加プ∫,No.27,National Research Center for

  Disaster Prevention,Japan,155pP.

3)Maki,M.(1989):Effect of rapid scan of the Doppler radar on the estimation of spectrum

  moments.Rψ。Nα肋〃α/地∫ωκ乃C舳〃力γ1泌α∫〃〃ωθ〃ゴo〃,44,81-94.

4)Oyagi,N、,K.Nakane and T.Fukuzono(1984):1舳θ∫〃幽加〃ぴ舳勿oγフっα〃〃1励∫α∫加π∫,No.

  21,National Research Center for Disaster Prevention,Japan,133pp.

5)Sato,A.andM,Higashiura(1989):E伍ectofairtemperatureandwindspeedonoccurrence

  of b1owing snow.Rψ.Nα伽ηα/地∫ωκんCθ〃θ7力1・1)主∫α∫τ〃Pκoθ〃肋〃,43,255-262.

6)Tanaka,T。,S.Nakai and K,Nakane(1988):1舳θ∫ガgα肋〃げ〃〃ブoプ〃α伽〃1”∫ω乏θκs lVo.

  30,National Research Center for Disaster Prevention,Japan,115pp.

7)Uyeda,H、(1986):On recent observations and detections of storms by Dopp1er radar for

  meteoro1ogica1use.肋伽〃oグR.D.P.,No.111,National Research Center for Disaster

  Prevention,Japan,6!pp.

8)Vincent,T.W.and R.A.Brown(1985):Si㎎1e Doppler ve1ocity signature interpretation of

  nondivergent environmenta1winds.∫.λ肋一〇∫.06〃〃oτκ伽o/.,3,114-128.

                                                (Manuscript Received July24.1989)

一78一

The Doppler Radar of NRCDP and Obsemations of Meso-Scale Weather Systems一一M.Maki,T.Yagi and S,Nakai

国立防災センターのドップラーレーダーの特徴と

  メソスケールの大気現象の観測について

真木雅之非・八木鶴平*・中井専人*

   国立防災科学技術センター

要 旨

 メソスケールの大気現象を研究するためのドップラーレーダーが1988年3月に完成した.

本ドップラーレーダーの主な特徴として

 1)様々な空中線スキャンモードを有し,コンピュータにより制御される.

 2)空中線の高速回転(最大15rpm).

 3) レーダー反射強度,ドップラー速度,ドップラースペクトル幅のオンラインカラー表

   示.

 4)可搬型.

が挙げられる.本ドップラーレーダーによる観測例として梅雨期の層状性降水・夏期の雷雨・

津軽平野での吹雪,新庄での地形により強化された降雪現象を紹介し,最後に現象の3次元的

な観測のための空中線最適スキャンモードについて議論した.

‡第1研究部,広域防災研究室

一79一


Recommended