ANNUAL SURVEY OF INDUSTRIES 2008-09 Vol. II REPORT ON ABSENTEEISM, LABOUR TURNOVER, EMPLOYMENT & LABOUR COST GOVERNMENT OF INDIA MINISTRY OF LABOUR & EMPLOYMENT LABOUR BUREAU CHANDIGARH/SHIMLA
Transcript
ANNUAL SURVEY OF INDUSTRIES 2008-09 Vol. II
REPORT
ON
ABSENTEEISM, LABOUR TURNOVER, EMPLOYMENT & LABOUR COST
GOVERNMENT OF INDIA
MINISTRY OF LABOUR & EMPLOYMENT LABOUR BUREAU
CHANDIGARH/SHIMLA
i
PREFACE
The Annual Survey of Industries (ASI) is conducted annually under the Collection of Statistics Act, 1953 and the Rules framed thereunder in 1959. ASI Part-II Schedule, which contained labour statistics on Absenteeism, Labour Turnover, Earnings, Employment and Labour Cost, was canvassed with effect from the ASI 1961 Round. With effect from ASI 1999-2000, however, Block-4 and Block-5 of ASI Part-II Schedule containing data on Employment and Labour Cost and with effect from ASI 2002-03, Block-3 of ASI Part-II Schedule was also discontinued and Block-E of the ASI Part-I Schedule was further modified by inserting a column on mandays paid for.
The present Report presents statistics on Absenteeism, Labour Turnover, Employment, Labour Cost and Earnings for the year 2008-09 and is based on Block-E of Part-I and Block-2 of Part-II of the ASI Schedule. Processed raw data based on ASI Block-E of Part-I received from the Central Statistical Organisation (CSO), Industrial Statistics Wing (IS Wing), Kolkata and the data in schedule form under ASI Block-2 of Part-II received from Field Operations Division (FOD) of National Sample Survey Organisation (NSSO), were processed by the Labour Bureau and are being presented by States and Sectors at 3-digit and 4-digit level of the NIC-2008. Statistics on Total Cost of Production and percentage share of Labour Cost on workers to Total Cost of Production are also being included in this Report. The Report partly meets the statutory obligation pertaining to Article 11 of Part-II of the ILO Convention No. 160 on Labour Statistics, which was ratified by India on 01.04.1992. I hope that the data presented in this Report would be immensely useful to the users and the policy makers.
I take this opportunity to thank the officers of the CSO (IS Wing), Kolkata, not only for providing the raw data in time but also for their cooperation in further processing of data by the Bureau. The Officers and other officials of the FOD also deserve Bureau’s appreciation for timely canvassing of the ASI Schedules. The Officers and staff of the ASI Section, MTU and Printing Unit of Labour Bureau, whose names are given in Annexure-IV, deserve appreciation for their sincere efforts for processing the data and bringing out the Report in quickest possible time.
The views expressed in this Report are not necessarily those of the Government of India, Ministry of Labour & Employment.
I urge the readers to send their suggestions for further
1.1 Historical Background 4 - 5 1.2 Objectives of ASI 5 1.3 Scope and Coverage 5 – 6 1.4 Unit of Enumeration 6 1.5 ASI Frame 6 1.6 Classification of Factories 6 – 7 1.7 Sampling Design and Sample
Allocation 7 -8
1.8 Estimation Procedure 8 1.9 Schedule used for Enquiry 8 – 9 1.10 Reference Period 9 1.11 Period of Survey 9 1.12 Concepts and Definitions 9 – 12 1.13 Classification of Industries 12 1.14 Processing and Tabulation of Data 12 1.15 Presentation of Data 12 -13 Chapter-II Absenteeism 14 - 24
2.1 Absenteeism in States 14 2.2 Absenteeism in Industries 15 2.3 Absenteeism in States by Sectors 15 2.4 Absenteeism in Industries by Sectors 16 Tables: 2.1.1 to 2.2.2 17 - 24 Chapter-III Labour Turnover 25 - 35
3.1 Labour Turnover in States 25 - 26 3.2 Labour Turnover in Industries 26 3.3 Labour Turnover in States by Sectors 26 - 27 3.4 Labour Turnover in Industries by
6.1 Average Daily Employment 100 6.2 Trend in Average Labour Cost 100 6.3 Wage/Salary Rates 100 6.4 Percentage of Labour Cost to Total
Cost of Production 100 - 101
6.5 Number of Reporting Factories 101 6.6
Percentage of Absenteeism and Labour 101
Tables: 6.1 to 6.6 102 - 128
ANNEXURE-I Facsimile of Block-A, Block-B, Block-E, Block-F, Block-H and Block-I of Part-I and Block-1 and Block-2 of Part-II of ASI Schedule
129 - 131
ANNEXURE-II National Industrial Classification-
2008 132 - 137
ANNEXURE-III List of Reports/Publications brought
out by the Labour Bureau on Annual Survey of Industries(ASI)
138 - 144
ANNEXURE-IV List of Officers/Officials
associated with the Report 145
1
MAIN FINDINGS
The important findings of the Annual Survey of Industries for
the year 2008-09, are given below. ABSENTEEISM 1. The rate of absenteeism among directly employed regular
workers, at all India level, increased to 8.65 per cent during 2008 from 8.34 per cent during 2007.
2. The absenteeism rate was reported to be more than 10 per cent
in Andaman & Nicobar Islands, Kerala, Delhi, Himachal Pradesh, Haryana, Punjab, Chandigarh, Maharashtra and Rajasthan, whereas it was recorded at less than 2 per cent only in one State, viz. Manipur.
3. Industry-wise, the absenteeism rate was highest in the
industry group ‘323-Manufacture of sports goods’ (16.40 per cent) and lowest in ‘089-Mining and quarrying n.e.c.’ with 4.48 per cent.
LABOUR TURNOVER 4. Overall accession rate at all India level during the year
2008-09 declined to 17.56 per cent as compared to 20.94 per cent during the year 2007-08, whereas, the overall separation rate during the year 2008-09 also declined to 17.00 per cent from 18.11 per cent during the previous year.
5. Lowest rates of accession (2.50 per cent) and separation
(2.88 per cent) were observed in Assam, whereas the highest rates of accession (31.31 per cent) and separation (30.42 per cent) were recorded in Uttaranchal and Delhi, respectively.
6. The highest rates of accession (44.67 per cent) and
separation (60.25 per cent) were recorded in the industry group ‘291-Manufaccture of motor vehicles’, whereas the industry group, ‘370-Sewerage’ registered the lowest rate of accession at 3.77 per cent and the lowest separation rate was recorded at 4.13 per cent in the industry group ‘161-Sawmilling and planing of wood’.
2
EMPLOYMENT
7. In the Employment scenario, the total labour force in the
manufacturing sector has risen from 8.20 million in 2007-08 to 8.77 million in 2008-09.
8. Majority of the workers {93.82%} were employed in private sector which was a decline from the previous years’ ratio of 97.77%.
9. Around 62% of the total workers were employed in just 6 States, namely T.N., Maharashtra, A.P., Gujarat, Karnataka and U.P.
10. Similarly, 10 industry groups accounts for the 52% of the total workforce.
11. Around 31.90% of the total workers were employed through contract, out of which 95.06% were employed in Private Sector.
12. During 2007-08, the total number of manufacturing units was reported about 1.46 lakh units which in 2008-09 rose to around 1.55 lakh units.
LABOUR COST
13. The Average Labour Cost per manday worked in respect of all employees has risen in the year 2008-09 to Rs. 410.41 from the previous year’s Rs. 397.55;
14. The Average Labour Cost per manday worked in the Public Sector was Rs. 606.43 as compared to Rs. 468.88 in the Joint Sector and Rs. 349.98 in the Private Sector;
15. The highest Average Labour Cost per manday worked in respect of all employees was reported at Rs. 783.23 in Jharkhand State and in the industry group, the same was reported at Rs. 882.67 in the industry group ‘203-Manufacture of Man-made fibre’.
16. The share of different components of labour cost to total labour cost was 80.49% on wages/salary, 8.43% on PF & other funds, 6.60% on staff welfare expenses and 4.48% on bonus;
3
17. Labour Cost constituted 5.56% of the total cost of production which was a high from the previous years’ share of 5.41%.
16. The average labour cost was reported to be highest at Rs.
882.67 in industry group ‘203-Manufacture of manmade fibres’ and lowest at Rs. 110.96 in industry group ‘120-Manufacture of tobacco products’.
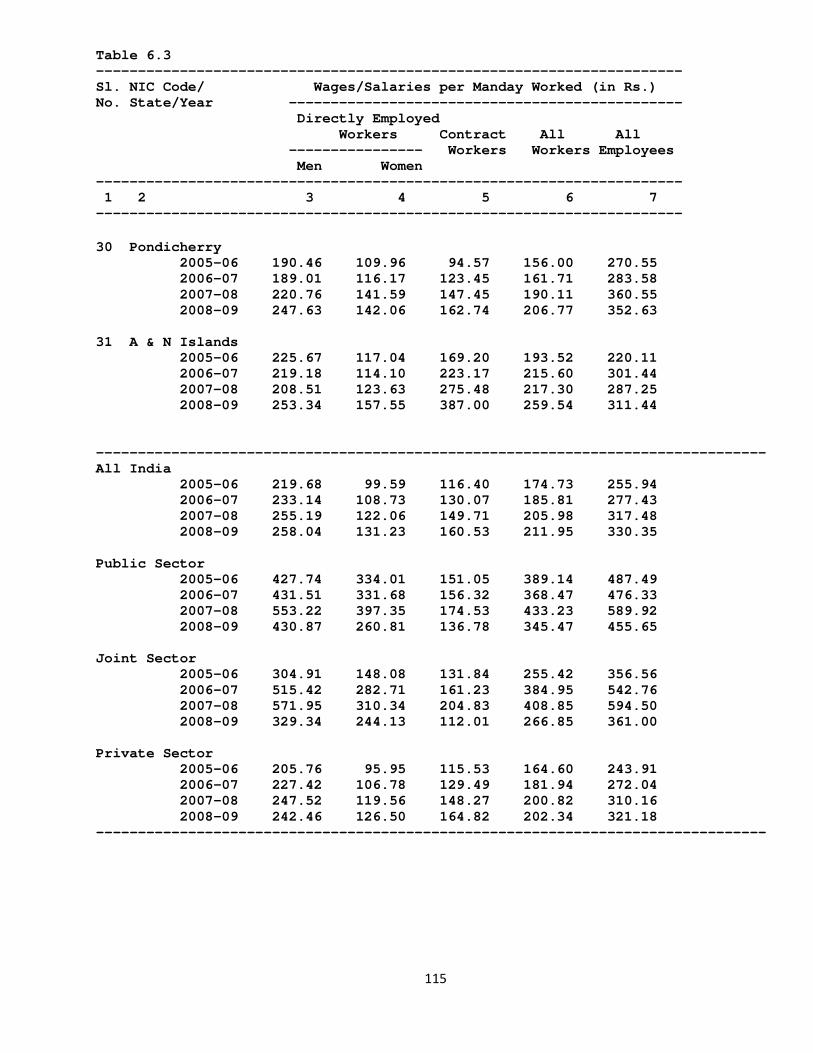
19. The highest wages/salaries per manday paid to all workers was
reported in Jharkhand at Rs. 409.30, followed by Maharashtra at Rs. 292.71 and Goa at Rs. 288.37.
20. It has been observed that the wages/salaries per manday
worked was generally recorded to be the lowest in all the North-Eastern States/Union Territories for all categories of employees.
4
CHAPTER-I INTRODUCTION
The Annual Survey of Industries (ASI) is the principal source of industrial statistics in India. It provides statistical information to assess and evaluate, objectively and realistically, the changes in growth, composition and structure of organized manufacturing sector comprising activities related to manufacturing process, repair services, gas and water supply and cold storage. Industrial sector occupies an important position in the Indian economy and has a pivotal role to play in the rapid and balanced economic development. Viewed in this context, the collection and dissemination of ASI data on a regular basis are of vital importance. The survey is conducted annually under the statutory provisions of the Collection of Statistics Act, 1953 and the Rules framed thereunder in 1959, except in the State of Jammu & Kashmir, where it is conducted under the State Collection of Statistics Act, 1961 and the Rules framed thereunder in 1964. 1.1 Historical Background
Understanding the importance of collection and compilation of data relating to industrial sector of the country, the Government of India, after 1930, launched a voluntary scheme for collection of detailed data from important industries in India. During the Second World War, in order to cater the specific requirement of war management, each government department created its own statistical section. In 1942, Industrial Statistics Act was enacted on the recommendation of the Royal Commission on Labour. The Directorate of Industrial Statistics (DIS) under the Ministry of Commerce was setup in 1945 to enforce the Industrial Statistics Act, 1942. The Directorate of Industrial Statistics launched the first Census of Manufacturing Industries (CMI) in 1946 with the objective of studying the structure of the Indian industry and estimating its contribution to the national economy. Because of practical difficulties, the CMI could cover only 29 of the 63 industry groups specified in the Industrial Statistics Act and extended only to 11 States of the Indian Union. It was conducted annually up to 1958. By 1958, the geographical coverage of the CMI extended to 13 States and 2 Union Territories.
Following the recommendation of the National Income Committee
(1949), the Directorate of Industrial Statistics conducted the first Sample Survey of Manufacturing Industries (SSMI) in 1949 for collecting data from factories falling under 34 industry groups left out by the CMI and defined under the Factories Act, 1934. The technical work including the survey design, sample selection, and preparation of schedules was undertaken by the Directorate of Industrial Statistics while the tabulation and analysis of data, report writing, etc. was carried out by the Indian Statistical Institute, Calcutta. The SSMI was conducted annually up to 1958 by the then Directorate of National Sample Survey now known as National Sample Surveys of Organisation (NSSO).
After independence, the Central Statistical Organisaton (CSO) was setup under the Cabinet Secretariat by the Government of India in 1951 as an apex statistical body for coordinating the large variety of data collection by various agencies which was necessitated for adoption of planned economy by the government. In 1956, the Industrial Statistics Act, 1942 was repealed by the Collection of Statistics Act, 1953 and
5
Rules framed thereunder in 1959 regarding the Statistical Authority and procedure for collection of data. Subsequently, the DIS was transferred to the Cabinet Secretariat in 1959 and was attached to the CSO as Industrial Statistics Wing.
The Collection of Statistics (Central) Rules, 1959 framed under the Collection of Statistics Act, 1953 provided a comprehensive Annual Survey of Industries (ASI) in India. The survey replaced both the CMI and SSMI. The ASI was launched in 1960 with 1959 as the reference year and is continuing since then annually except for 1972. The labour part of the ASI Schedule (Part-II), which contained statistics on Absenteeism, Labour Turnover, Earnings, Employment and Labour Costs, was launched with effect from the ASI-1961. During that year, the Schedule was canvassed in respect of both the Census and the Sample Sectors. However, due to non-availability of detailed statistics in respect of the units in the Sample Sector, it was decided to canvass Part-II Schedule only for the Census Sector in subsequent years. The ASI in Sample Sector was, however, reintroduced with effect from ASI 1976-77.
Under the Collection of Statistics Act, 1953, the field survey for the ASI is conducted by the Field Operations Division (FOD) of the NSSO through its network of zonal, regional and sub-regional offices located all over the country. The Deputy Director General, FOD, is the Statistics Authority appointed under the Act for successful execution of the survey programme. The Central Statistics Organisation (CSO) is responsible for the processing and dissemination of data collected through Part-I of the ASI Schedule. Labour Bureau, likewise, is responsible for processing and dissemination of data on employment, mandays worked, social security benefits, labour cost and cost of production collected through Block-E of Part-I and; absenteeism, labour turnover and earnings collected through Part-II of the ASI schedule. The Standing Committee on Industrial Statistics provides guidance in this regard and suggests improvements from time to time in the sampling design, sample size, and techniques of data collection, processing and tabulation of data. The Committee has been constituted by the Ministry of Statistics & Programme Implementation and is represented by the CSO, NSSO, Labour Bureau, Ministry of Industry, State Governments, Reserve Bank of India, FICCI, CII, ASSOCHAM, research institutions, eminent scholars and other central Ministries. 1.2 Objectives of the ASI
The main objectives of the Annual Survey of Industries (Labour Part) are:
a. To build a systematic database on Absenteeism; Labour Turnover;
Earnings; Employment, and Labour Cost in Manufacturing Industries, and
b. To analyse various components of Labour Costs such as
Wage/Salary; Bonus; Provident Funds; Welfare Expenses, etc. in Manufacturing Industries.
1.3 Scope and Coverage
The scope of the ASI extends to the entire country except the
States of Arunachal Pradesh, Mizoram, Sikkim and the Union Territory (UT) of Lakshadweep. The coverage of ASI is extended to:
6
a. All factories registered under sections 2m(i) and 2m(ii) of the
Factories Act, 1948 which refer to the establishments using power and employing 10 or more workers and those not using power and employing 20 or more workers on any day of the preceding 12 months, and
b. Bidi and cigar manufacturing establishments registered under the
Bidi and Cigar Workers (Condition of Employment) Act, 1966. With effect from ASI 1998-99, all electricity undertakings engaged
in the generation, transmission and distribution of electricity, and registered with the Central Electricity Authority other than captive units are being kept outside the purview of the survey. Similarly, with effect from ASI 1999-2000, the departmental units such as Railway workshops, Road Transport Corporation workshops, Government mints, sanitary, water supply, gas, storage, etc. are also being kept outside its purview. Also, the defence factories, technical training institutions, jail factories, units engaged in storage and distribution of oil, restaurants, cafes and computer services are excluded from the scope of the survey. However, certain activities like cold storage, water supply, gas production & distribution, motion picture production, laundry services, repair of motor vehicles and of other consumer durable are covered under the survey. 1.4 Unit of Enumeration
The primary unit of ASI is a factory in the case of manufacturing industries; a workshop in the case of repair services; an undertaking or a licensee in the case of electricity, gas and water supply undertakings; and an establishment in the case of bidi and cigar industries. The owner of two or more establishments located in the same State and pertaining to the same industry group and belonging to same scheme (census or sample) is, however, permitted to furnish a single consolidated return. Such consolidated returns are common feature in the case of bidi and cigar establishments, electricity and certain public sector undertakings. 1.5 ASI Frame
The ASI frame is based on the lists of registered factories/units maintained by the Chief Inspector of Factories (CIF) in each State/Union Territory and those maintained by the licensing authorities in respect of the bidi and cigar establishments and electricity undertakings. The Regional Offices of FOD maintain close liaison with CIF and update the frame every year by adding the names of the newly registered units/establishments. The frame is revised once in three years by removing the names of the de-registered units from the ASI frame and adding those of newly registered units to the frame. 1.6 Classification of Factories
The ASI adopted from the beginning a very simple design. All the workers with 50 or more workers operating with power, and units having 100 or more workers operating without power were covered under the Census Sector. Also 12 States/UTs, namely, Himachal Pradesh, Jammu & Kashmir, Manipur, Meghalaya, Nagaland, Tripura, Pondicherry, A & N Islands, Chandigarh, Goa, Daman & Diu and Dadra & Nagar Haveli, which
7
were industrially backward, were covered under Census Sector to take complete stock of their manufacturing activities. Even the Sample Sector which comprised of units employing less than 50/100 workers (operating with or without power) in the major States were covered fully over a span of two years. This procedure continued till 1986-87 by which time the total number of factories in the country grew enormously. Accordingly, the definition of the Census Sector was changed from ASI 1987-88 to units having 100 or more workers irrespective of their operation with or without power. All the units in the frame of 12 less industrially developed States/UTs were surveyed on complete enumeration basis. The rest of the universe was covered on sampling basis through an efficient sampling design adopting State x 3-digit industry group as stratum so as to cover all the units in a span of three years. The design continued till ASI 1996-97.
Before launching of ASI 1997-98 due to constraints of resources in
covering a large number of units in the survey and generating the results of the survey in time bound manner, a review of the earlier design was made and a revised design was adopted in ASI 1997-98. The Census Sector was defined to include units having 200 or more workers and also some significant units identified from the databases of ASI 1993-94 to ASI 1995-96. These significant units although employed less than 200 workers, but contributed significantly to the Value of Output in these ASI years. The complete coverage of all units in 12 less industrially developed States/UTs was continued. Also all Public Sector Undertakings (PSU) were included in the Census Sector. The rest of the universe was covered in the Sample Sector by usual formula of determination of sample size at a given value of precision of the estimates with at least 99 per cent chance. The sampling design adopted State x 4-digit industry group as stratum.
With effect from ASI 2000-01, the coverage of the Census Sector was
modified to include units employing 100 or more workers and only 5 industrially backward States/Union Territories. For ASI 2008-09, the Census Sector consists of the following categories:-
a. All factories in five less industrially developed States/Union
b. All factories employing 100 or more workers for rest of the States/Union Territories.
c. All factories declared as submitting 'Joint Returns' as identified by FOD, NSSO.
The units not covered under the Census Sector are covered under
Sample Sector. 1.7 Sampling Design and Sample Allocation
The sampling design recommended by the Technical Committee headed by Prof. Arijit Chowdhury, ISI, Kolkata for ASI 1997-98 has been followed for ASI 2008-09 also, with stratum as state x NIC-2008 (4-digit level).
The sample size n for any industry at all India level is determined
first by assuming the Central Limit Theorem applicable to the large population. For any suitable characteristics X, say GVA, for 100p% variation in the estimates, the probability
8
_ _ _ P[ |x - X| ≤ p.X ] = 0.99 is ensured. Accordingly, it follows that n = (2.58/p)².(C.V.)² Assuming p=0.10 and calculating C.V. from ASI 2006-07, the sample
size n for each industry at NIC-2008 4-digit level is determined. The total sample size ni for ith state/Union Territory is then allotted in proportion to the number of units in the state.
N’i ni = n.----, where N’ N’ = Total number of units in the sample sector at all India
Level
N’i = Total number of units in the sample sector in the ith state/UT
1.8 Estimation Procedure
Let Nj = Number of units considered for selection from the jth
stratum
nj = Number of sample units selected from the jth stratum N’j = Number of units reported to exist in the frame in jth
stratum
n’j = Number of sample units reported in the jth stratum
T = Aggregate of a characteristics in a State/Union Territory
Tj = Aggregate of a characteristics in jth stratum
Mj = N’j/n’j, the multiplier for the jth stratum
Then, for any characteristics, its estimate T is given by T = ∑ Mj.Tj In case N’j and n’j are not known, Mj can be estimated, by using the
formula Mj = Nj/nj with the assumption that Nj/N’j = nj/n’j. 1.9 Schedule used for Enquiry
Data for the ASI are collected through a comprehensive schedule. In the initial rounds, the schedule sought particulars relating to manufacturing activity only. Over the years, alterations were made to meet the specific data requirements of various organizations. By 1973-74, the schedule consisted of five parts, viz., Part-I on manufacturing, Part-II on absenteeism, labour turnover, employment and labour cost, Part-III on stocks & consumption of components and accessories in small scale sector, Part-IV on construction expenditure and Part-V on indirect
9
taxes, sales, subsidies and capacity of power equipments installed in the establishments. It was felt that the ASI schedule had become too unwieldy and complicated. So a modified schedule with only three parts on manufacturing, labour and construction was adopted with effect from ASI 1974-75.
The ASI schedule was further modified in 1987-88 and 1997-98. With
effect from ASI 1998-99, only Part-I and Part-II of the ASI Schedule are being canvassed and Part-III schedule relating to construction has been discontinued.
From ASI 1999-2000 onwards, Block-IV and Block-V of Part-II of the
schedule, which contained statistics on employment, mandays worked, labour cost on wages/salaries, bonus, provident funds and welfare expenses and total cost of production, have been merged with Block-E of Part-I of the ASI schedule. With effect from ASI 2002-03, Block-3 of Part-II of the ASI schedule was discontinued and Block-E of Part-I was modified by including a column on mandays paid for all categories of employees. A facsimile of Block-A, Block-B, Block-E, Block-F, Block-H and Block-I of Part-I and Block-1 and Block-2 of Part-II of the ASI schedule is enclosed at Annexure-I. 1.10 Reference Period
Reference period for 2008-09 round of Annual Survey of Industries was the accounting year of the factory, ending on any day during the fiscal year 2008-09. In ASI 2008-09, data collected from the respective units, thus, relates to their accounting year ending on any day between April 1, 2008 and March 31, 2009. 1.11 Period of Survey
The total survey period for ASI 2008-09 has been from September, 2009 to April, 2010. 1.12 Concepts and Definitions
The concepts and definitions followed in the survey and used in the present Report are given below:
a. Workers are defined to include all persons employed directly or through any agency, whether for wages or not, in any manufacturing process or in cleaning any part of machinery or premises used for manufacturing process or in any other kind of work, incidental to, or connected with the manufacturing process or the subject of manufacturing process. Labour engaged in repair and maintenance or production of fixed assets for factory’s own use or labour employed for generating electricity, etc. is also included.
b. Contract Workers are defined as all persons who were not
employed directly by an employer but through the contractor. These workers may be employed with or without the knowledge of the principal employer.
c. Supervisory & Managerial Staff include persons in supervisory
and managerial positions employed by the factory, whether
10
covered by the definition of the term ‘workers’ under the Factory Act, 1948 or not.
d. Other Employees are the remaining employees employed by the
factory not included in the category of ‘workers’ and ‘supervisory & managerial staff’.
e. Employees include all workers and persons receiving
wage/salary and holding supervisory or managerial positions engaged in administrative office, store keeping and welfare sections, sales department as also those engaged in purchase of raw materials, etc or purchase of fixed assets for the factory and watch and ward staff.
f. Mandays worked is obtained by summing up the number of
mandays worked by persons working in each shift over all the shifts worked on all days.
g. Mandays paid for is arrived at by summing up the number of
employees paid each shift during the reference period. This also includes all mandays on weekly off-days and scheduled holidays, if paid for, and other absences with pay, as also mandays lost through lay-off/strike for which compensation is payable.
h. Wages/salaries are defined to include all remuneration in
monetary terms and also payable more or less regularly in each pay period to workers as compensation for the work done during the accounting year. It includes:
i) Wages and salaries including paid for leave period
and holidays; ii) Payment for dearness, overtime, compensatory,
house rent and other allowances; iii) Production bonus, good attendance bonus, incentive
bonus, etc. which are paid more or less regularly for each pay period; and
iv) Lay-off payments and compensation for unemployment
except where such payments are made from trust or other social funds set up especially for this purpose.
The amount of wages/salaries payable during the
accounting year are expressed in terms of gross value i.e. before deductions for fines, damages, taxes, provident fund, employees’ state insurance contribution, etc. For workers employed through contractors, payment made to these workers and not the payment made to the contractors are recorded. Benefits in kind (perquisites) of individual nature are only included. It excludes employer’s imputed value of group benefits in kind and travelling and other expenditures incurred for business purposes and reimbursed by the employer.
11
i. Bonus includes profit sharing bonus, festival bonus, year-end and other bonuses and ex-gratia payments paid at less frequently intervals (i.e. other than bonuses paid more or less regularly for each pay period).
j. Provident and other funds include employers’ contribution to
old age benefits like provident fund, pension, gratuity etc. and contributions to other social security benefits such as the Employees’ State Insurance (ESI), compensation for work injuries and occupational diseases, provident fund linked insurance, retrenchment and lay-off benefits.
k. Workmen and Staff welfare expenses include expenditures
incurred by employer on maternity benefits; crèches and other benefits such as supply of food, beverages, tobacco, clothing and group lodging at concessional rates; educational, cultural and recreational facilities and services; and grants to trade unions and co-operative stores meant for the employees. All group benefits were also included.
l. Public Sector covers the establishments, which are
i) Wholly owned by Central Government; ii) Wholly owned by State and/or Local Government; and iii) Wholly owned by Central Government and State and/or
Local Government jointly.
m. Joint Sector covers the following type of ownership:
i) Central Government and private enterprise jointly; ii) State Government/Local Government and private enterprise
jointly; and iii) Central, State/Local Government and private enterprise
jointly.
n. Private Sector covered establishments wholly owned by any private person or persons.
o. Absenteeism is defined as the failure of a worker to report
for work when he is scheduled to work. A worker is considered scheduled to work when the employer has work available for him and the worker is aware of it. Authorised absence is also treated as absence while presence even for a part of the shift is treated as presence for whole shift. Absence on account of strikes, lockout, layoff, weekly rests or suspension is not taken into account. Thus, it relates to only voluntary absence due to personal reasons of the individual concerned. Absenteeism rates given in the report represent percentage of mandays lost due to absence to the corresponding total mandays scheduled to work. The mandays scheduled to work is arrived at by adding the mandays actually worked and the mandays lost on account of absence of the workers due to some reason or the other.
p. Labour Turnover measures the extent of change in the working
force due to accession and separation during the reference period. The term ‘accession’ is defined as the total number of workers added to the employment during the period, whether
12
new or re-employed or transferred from other establishments or units under the same management. Inter-departmental transfers within the same establishment are, however, ignored. The term ‘separation’ implies severance of employment at the instance of workers or employer. It includes termination of service due to death or retirement, retrenchment as a result of rationalization or modernization or other reasons. The annual accession or separation rate is calculated as percentage of total accession or separation during the year to the average of number of workers in employment during the year.
q. The Average Number of Workers in employment during a year has
been derived by dividing the total number of workers in employment on the first and the last day of all the twelve months, by twice the total number of months actually worked during the reference period.
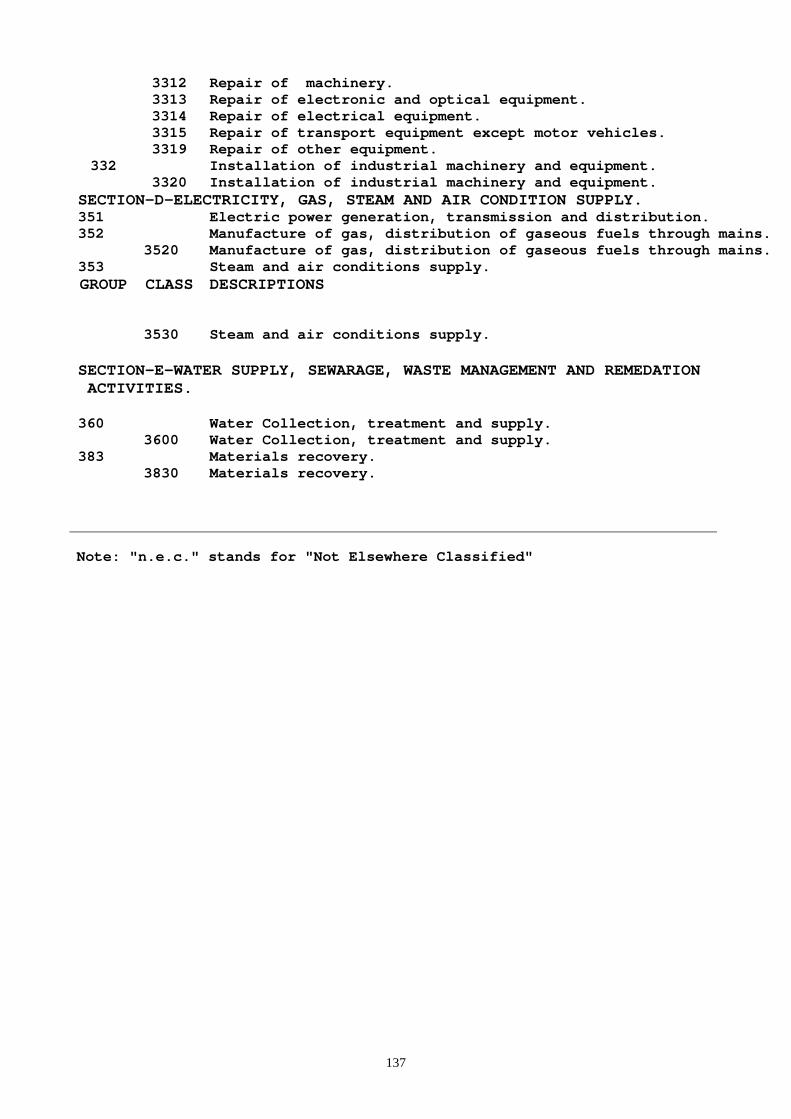
1.13 Classification of Industries
The new series of industrial classification (NIC-2008) was introduced with effect from the ASI 2008-09. All the industrial units in the ASI frame were accordingly classified in their appropriate industry groups on the basis of the value of the principle product manufactured by them. The unit, thus, got classified in one and only one industry group even though it might be manufacturing products belonging to different industries. The different aggregates are presented at 3-digit and 4-digit level corresponding to this classification. An extract from this classification showing industry groups along with their descriptions and codes used in this publication is reproduced at Annexure-II. 1.14 Processing and Tabulation of Data
The data on CD, corresponding to the employment, mandays, labour cost and total cost of production under Block-A, Block-B and Block-E of Part-I of the ASI schedule, were received from the CSO, IS Wing, Kolkata, as per the directive of the Standing Committee on Industrial Statistics. The Machine Tabulation Unit (MTU) of Labour Bureau processed the data on absenteeism and labour turnover based on Block-2 of Part-II of the ASI Schedule. ASI Section of Labour Bureau further validated and cleaned the Block-2 data submitted by the MTU. Final processing and tabulation of the data under Block-E and Block-2 were undertaken by the ASI Section and Tables were generated for drafting the report. 1.15 Presentation of Data
The ASI results presented in this report relate to factory sector i.e. industrial units covered under the Census and sample Sectors of the ASI. The total of any characteristics was obtained by adding the figures of the Census Sector and estimates of the Sample Sector. The report contains data on Absenteeism; Labour Turnover; Employment; Mandays Worked and Paid for; Labour Cost; and total Cost of Production by States, Sectors and Industries at 3-digit and 4-digit level of NIC-2008.
The data relating to Mandays Worked, Mandays Paid for, Labour Cost and Cost of Production are rounded off to thousands separately at
13
different aggregate levels of all India, States, Industries and Sectors. Therefore, these figures at higher level aggregates may not tally with the lower level aggregates due to rounding off errors, if any.
As per the tabulation policy, it has been decided to publish the detailed information corresponding to industry codes 014 to 372 at 3-digit level and 0140 to 3720 at 4-digit level following NIC-2008. For industry codes equal to and greater than 400 at 3-digit level and 4000 at 4-digit level, the units have been clubbed and shown under a common industry code 400 and 4000, respectively, in different tables.
The rounded off figures of mandays, labour cost and cost of production to thousands, have been shown by ‘0’, wherever these figures were found to be negligible (less than 500). The figures found to be nil or not applicable have been indicated by a dash (-).
Data for the cases, where the number of factories is less than 3, have not been published in the Tables presented at 4-digit level of NIC-2008.
-0-0-0-
14
CHAPTER - II ABSENTEEISM
Information regarding absenteeism amongst workers in an industry or an industrial establishment on account of reasons other than strikes, lockouts, lay-off, weekly rest or suspension, provide a sound database for gauging the employee’s morale, commitment and level of job satisfaction which have a direct bearing on productivity. The effects of high levels of absenteeism are wide ranging and affect everyone in the organisation. It cannot be purely regarded as a management problem. Employers, workers and their representatives have an obligation towards the organisation in ensuring that absence of workers do not jeopardise their prosperity or job satisfaction and or committed level of output.
Absenteeism is also one of the indicators to evaluate and monitor various employees’ welfare programmes and labour policies. With this aim in view, statistics on absenteeism amongst the directly employed regular workers are being collected on a regular basis as a part of the Annual Survey of Industries. Absenteeism rate amongst these workers in an industry or a State are worked out as percentages of mandays lost on account of absence to the mandays scheduled to work in the respective industry or State. Statistics on number of factories reporting absenteeism, percentage of such factories, mandays scheduled to work, mandays lost due to absence and percentage of absenteeism by States, Industries and Sectors during the year 2008, are presented in Tables 2.1.1, 2.1.2, 2.2.1 and 2.2.2, respectively. 2.1 Absenteeism in States State-wise absenteeism rate amongst the directly employed regular workers during the year 2008 is given in Table 2.1.1. It is observed that the rate of absenteeism at all India level increased to 8.65 per cent during 2008 from 8.34 per cent during 2007. Out of 31 States/Union Territories, the rate of absenteeism was higher in 12 States than the absenteeism rate at all-India level during 2008. The highest absenteeism rate of 14.01 per cent was reported in Andaman & Nicobar Islands followed by Delhi (13.21 per cent), Himachal Pradesh (12.29 per cent), Kerala (12.21 per cent), Haryana (11.83 per cent) and Maharashtra (11.69 per cent). The lowest absenteeism rate was recorded at 1.34 per cent in Manipur followed by Nagaland (2.23 per cent), Orissa (2.74 per cent) and Tripura (3.05 per cent) also recorded low rates of absenteeism.
An increase in absenteeism rate during 2008 as compared to that in 2007 was recorded in 15 States/Union Territories. As
15
compared to 2007, there has been a sharp decline in the absenteeism rate in the State of Orissa, whereas there has been a significant increase in the State of Gujarat.
2.2 Absenteeism in Industries Industry-wise absenteeism rate amongst the directly employed regular workers during 2008 is depicted in Table 2.1.2. It reveals that during 2008, the highest rate of absenteeism was reported at 16.40 per cent in the industry group ‘323-Manufacture of Sports goods’ followed by industry groups ‘182-Reproduction of recorded media’ (16.26 per cent), ‘120-Manufacture of tobacco products’ (13.51 per cent), ’203-Manufacture of man-made fibres’ (12.40 per cent), ‘291- Manufacture of motor vehicles’ (12.27 per cent) and ‘262-Manufacture of computers and peripheral equipment’(11.38 per cent).
The lowest rate of absenteeism was reported at 4.48 per cent in industry group ‘089-Mining and quarrying n.e.c.’. The industry groups ‘370-Sewerage’ (5.49 per cent) and ‘241-Manufacturing basic iron and steel’ (5.57 per cent) also reported low rates of absenteeism.
Out of 79 industry groups, absenteeism rate was higher than
that at the all-India level in 39 industry groups. 2.3 Absenteeism in States by Sectors Table 2.2.1 shows the State-wise and Sector-wise absenteeism rates during 2008. Among the three sectors viz. Public, Joint and Private Sectors, the highest rate of absenteeism at all India level was reported at 9.24 per cent in Public Sector, followed by Joint Sector (9.19 per cent) and Private Sector (8.63 per cent).
The rate of absenteeism in Public Sector was highest at 14.63 per cent in Delhi, followed by Uttar Pradesh (12.32 per cent) and Gujarat (12.31 per cent). The absenteeism rate was recorded lowest in the Public Sector at 4.77 per cent in Dadra & Nagar Haveli followed by Jammu & Kashmir (5.16 per cent), Puducherry (5.19 per cent), Orissa (5.33 per cent) and Andhra Pradesh (5.66 per cent). In the Joint Sector, the absenteeism rate was highest at 28.99 per cent in Himachal Pradesh, followed by Delhi (23.83 per cent) and Dadra & Nagar Haveli (18.39 per cent), whereas the lowest rate of absenteeism was recorded at 0.70 per cent in Meghalaya, followed by 2.77 per cent in Uttaranchal. In Private Sector, 4 States/Union Territories, viz. Delhi (13.20 per cent), Himachal Pradesh (12.29 per cent), Kerala (12.22 per cent) and Andaman & Nicobar Islands (12.15 per cent) recorded absenteeism rates of more than 12 per cent. The absenteeism rate was less than 5 per cent in Manipur (1.34 per cent), Nagaland (2.23 per cent) and Tripura (3.05 per cent).
16
2.4 Absenteeism in Industries by Sectors Industry-wise and Sector-wise absenteeism rate for the year 2008 is given in Table 2.2.2. In the Public Sector, the rate of absenteeism was recorded highest in industry group ‘108-Manufacture of prepared animal feeds’ (19.52 per cent). The lowest rate of absenteeism was recorded in industry group ‘161-Saw milling and planing of wood’ (0.43 per cent), followed by ‘264-Manufacture of consumer electronics’ (1.61 per cent) and ‘106-Manufacture of grain mill products, starches and starch products’ (3.21 per cent). In the Joint Sector, the highest rate of absenteeism at 25.45 per cent was reported in industry group ‘279-Manufacture of other electrical equipment’, whereas the lowest rate of 0.22 per cent was reported in the industry group ‘243-Casting of metals’. In the Private Sector, the highest rate of absenteeism at 16.40 per cent was recorded in industry group ‘323-Manufacture of sports goods’, whereas the lowest rate of 4.48 per cent was reported in industry group ‘089-Mining and quarrying n.e.c.’.
Table 2.1.2 -------------------------------------------------------------------------------- Sl. NIC Code No. of Percentage Mandays Mandays Percentage of No. Factories of Scheduled Lost Absenteeism Reporting Factories to Due to During the Year Directly Reporting Work Absence Employed Absenteeism ('000) ('000) 2008 Regular Workers -------------------------------------------------------------------------------- 1 2 3 4 5 6 7 --------------------------------------------------------------------------------
Table 2.1.2 -------------------------------------------------------------------------------- Sl. NIC Code No. of Percentage Mandays Mandays Percentage of No. Factories of Scheduled Lost Absenteeism Reporting Factories to Due to During the Year Directly Reporting Work Absence Employed Absenteeism ('000) ('000) 2008 Regular Workers -------------------------------------------------------------------------------- 1 2 3 4 5 6 7 --------------------------------------------------------------------------------
Labour turnover is an important parameter indicating
overall health of an industry or an establishment in terms of wages, industrial relations, working conditions and other welfare facilities provided by the employers to the workers. Labour Turnover measures the extent of change in the work force due to accession or separation during a particular period of time. Higher rate of Labour Turnover indicates lack of stability in the labour force, which is not conducive to the productivity.
High Labour Turnover may adversely affect a business. Not only it is expensive, but lowers productivity and morale also and tends to get worse if not maneuvered properly. Simultaneously looking at it from a different angle, Labour Turnover to a certain extent helps to infuse new ideas, skills and enthusiasm to the labour force. A natural level of Labour Turnover can be a way in which a business can slowly reduce its workforce without having to resort to redundancies.
Generally, following factors could be the cause of a high level of Labour Turnover;
a) Dissatisfaction on account of insufficient wages leading to
employees moving to competitors, b) Low level of motivation from employers’ side and poor morale
within the workforce in a specific industry, c) Recruiting and misplacement of employees resulting in their
mobility in search of suitable employment, and d) A buoyant local labour market offering better and more
attractive opportunities to employees.
Comparative statistics relating to the rate of accession and separation in respect of directly employed regular workers during the year 2008 vis-à-vis 2007, their average employment and the percentage of factories reporting labour turnover by States, Industries and Sectors have been presented in Tables 3.1.1. 3.1.2, 3.2.1 and 3.2.2. 3.1 Labour Turnover by States
State-wise Labour Turnover among directly employed regular workers is presented in Table 3.1.1. It may be seen from the Table that at all India level, the rate of accession, during the year 2008, was 17.56 per cent as compared to 20.94 per cent during the year 2007. The overall separation rate during the year 2008 was 17.00 per cent as compared to 18.11 per cent during the year 2007. Thus, there was about 0.56 per cent increase in overall employment during the year 2008 as compared to 2.83 per cent increase during the year 2007. At all India level, 65.26 per cent factories reported Labour Turnover in their units during the year 2008.
The lowest rate of accession during the year 2008 was recorded in Assam at 2.50 per cent followed by Tripura (3.08 per cent), Jharkhand (5.74 per cent) and Nagaland (6.02 per cent). The highest rate of accession during the year 2008 was observed
26
in Uttaranchal at 31.31 per cent followed by Himachal Pradesh (29.28 per cent) and Haryana (28.28 per cent).
The lowest rate of separation during the year was recorded in Assam at 2.88 per cent, followed by Orissa (5.80 per cent), Chhattisgarh (6.46 per cent), Puducherry (7.44 per cent), Kerala (8.03 per cent) and Jharkhand (9.31 per cent). The highest rate of separation during the year was reported in Delhi at 30.42 per cent, followed by Haryana (28.52 per cent), Uttar Pradesh (27.82 per cent), Punjab (24.68 per cent) and Himachal Pradesh (23.91 per cent).
The total Labour Turnover was recorded highest in Andaman &
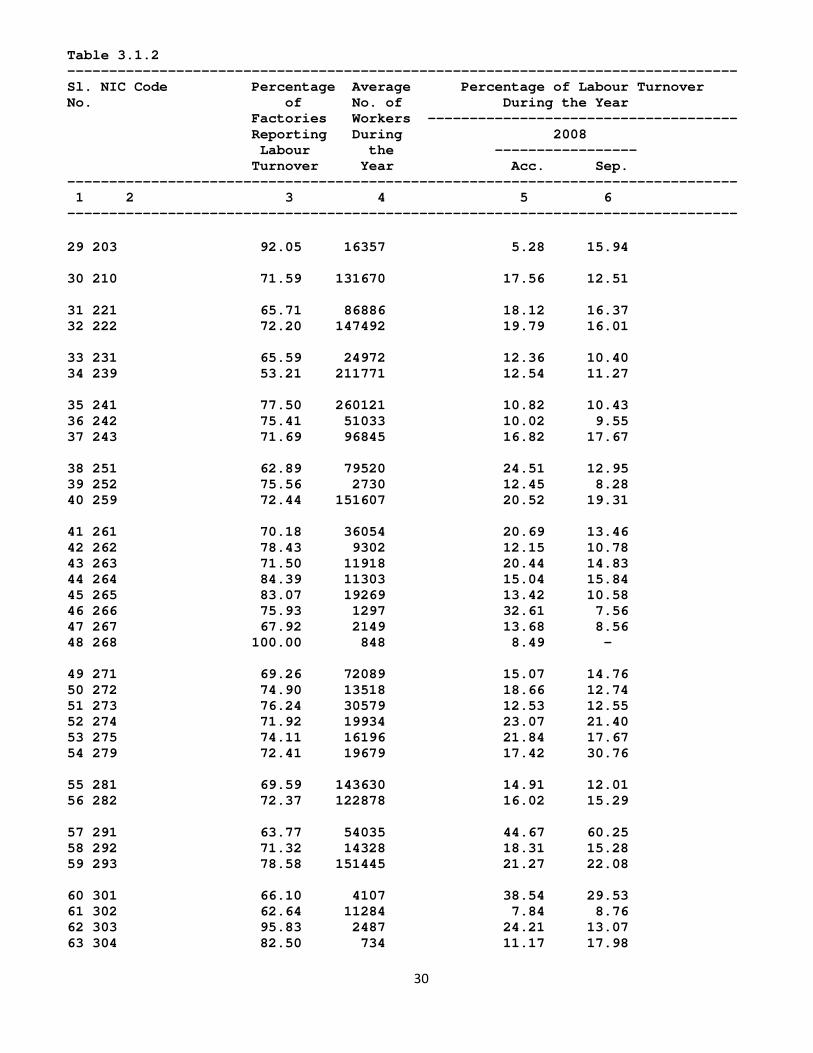
Nicobar Islands (100.00 per cent) and the lowest recorded in Nagaland (16.98 per cent). 3.2 Labour Turnover by Industries Industry-wise Labour Turnover among directly employed regular workers during the year 2008 is given in Table 3.1.2. The highest rate of accession was recorded in the industry group ‘291-Manufacture of motor vehicles’ (44.67 per cent) followed by industry groups, ‘142-Manufacture of articles of fur’ (41.66 per cent), ‘301-Building of ships and boats’ (38.54 per cent), ‘152-Manufacture of footwear’ (38.52 per cent), ‘182-Reproduction of recorded media’ (32.62 per cent) and ‘266-Manufacture of irradiation, electromedical and electrotherapeutic equipment’ (32.61 per cent). The lowest rate of accession at 3.77 per cent was recorded in the industry group ‘370-Sewerage’ followed by industry groups ‘360- Water collection, treatment and supply’ (4.64 per cent), ‘192-Manufacture of refined petroleum products’ (4.85 per cent), ‘352-Manufacture of gas; distribution of gaseous fuels through mains’ (5.10 per cent) and ‘161-Sawmilling and planning of wood’ (5.20 per cent).
On the other hand, the highest rate of separation at 60.25 per cent was recorded in the industry group ‘291- Manufacture of motor vehicles’. It was followed by industry groups ‘279-Manufacture of other electrical equipment’ (30.76 per cent) and ‘107-Manufacture of other food products’ (30.30 per cent). The lowest rate of separation, however, was recorded at 4.13 per cent in industry group, ‘161- Sawmilling and planning of wood’ followed by industry groups ‘192-Manufacture of refined petroleum products’ (6.25 per cent), ‘266- Manufacture of irradiation, electromedical and electrotherapeutic equipment’ (7.56 per cent) and ‘252-Manufacture of weapons and ammunition’ (8.28 percent).
The total labour turnover was cent percent in industry group ‘142- Manufacture of articles of fur’ and ‘268-Mnufacture of magnetic and optical media’. It was lowest in industry group ’089-Mining and quarrying n.e.c.’ (13.79 per cent) followed by 17.78 per cent in industry group ‘360-Water collection, treatment and supply’. 3.3 Labour Turnover in States by Sectors
Table 3.2.1 depicts State-wise and Sector-wise Labour Turnover among directly employed regular workers. It has been
27
observed that at all India level, accession rate was the highest in Private Sector at 17.82 per cent followed by Public Sector at 12.96 per cent and Joint Sector at 9.69 per cent. Separation rate was also highest at 17.13 per cent in Private Sector, followed by Public Sector at 13.86 per cent and Joint Sector at 13.42 per cent. The highest rate of accession in Public Sector was recorded in Bihar at 94.97 per cent followed by Uttaranchal (70.63 per cent) and lowest in Puducherry at 0.38 per cent. In Joint Sector, the highest rate of accession was reported in Bihar at 76.97 per cent and lowest in Orissa at 2.47 per cent. In Private Sector, Uttaranchal reported the highest rate of accession at 31.23 per cent whereas Assam reported lowest rate of accession at 2.50 per cent.
The highest rate of separation in Public Sector was observed in Uttaranchal at 94.29 per cent and was lowest in Chhattisgarh at 4.02 per cent. In Joint Sector, the highest rate of separation was reported in Bihar at 76.54 per cent and lowest in Andaman & Nicobar Islands at 0.99 per cent, whereas in Private Sector, the highest rate of separation was reported in Delhi at 30.47 per cent and lowest in Tripura at 1.63 per cent. 3.4 Labour Turnover in Industries by Sectors Industry-wise and Sector-wise Labour Turnover amongst directly employed regular workers is given in Table 3.2.2. It may be seen from the Table that in Public Sector, the highest rate of accession was recorded at 78.00 per cent in the industry group ‘102-Processsing and preserving of fish, crustaceans and molluses’ and the highest rate of separation at 73.35 per cent was observed in ‘210-Manufacture of pharmaceuticals, medicinal chemical and botanical products’. In private sector, the highest rate of accession was recorded at 52.29 per cent in the industry group ‘301-Building of ships and boats’ and the highest rate of separation was recorded in industry group ‘182-Reproduction of recorded media’. In Joint Sector, the highest rate of accession was reported in the industry group ‘141-Manufacture of wearing apparel, except fur apparel’ at 86.67 per cent, whereas highest rate of separation was reported in the industry group ‘107-Manufacture of other food products’ at 79.83 per cent.
Sector-wise lowest rate of accession of 1.05 per cent in the industry group ‘271-Manufacture of electric motors, generators, transformers and electricity distribution and control apparatus’ in Public Sector, 0.37 per cent in industry group ‘243-Casting of metals’ in Joint Sector and 4.00 per cent in industry group ‘370-Sewerage’ in Private Sector. In Public Sector, the industry group ‘329-Other manufacturing n.e.c.’ recorded lowest separation rate of 1.35 per cent. In Joint Sector, the separation rate was lowest at 1.12 per cent in the industry ‘191-Manufacture of coke oven products’, whereas in Private Sector, it was lowest at 2.32 per cent in industry group ‘268-Manufacture of magnetic and optical media’.
Table 3.1.2 -------------------------------------------------------------------------------- Sl. NIC Code Percentage Average Percentage of Labour Turnover No. of No. of During the Year Factories Workers ------------------------------------- Reporting During 2008 Labour the ----------------- Turnover Year Acc. Sep. -------------------------------------------------------------------------------- 1 2 3 4 5 6 --------------------------------------------------------------------------------
Table 3.1.2 -------------------------------------------------------------------------------- Sl. NIC Code Percentage Average Percentage of Labour Turnover No. of No. of During the Year Factories Workers ------------------------------------- Reporting During 2008 Labour the ----------------- Turnover Year Acc. Sep. -------------------------------------------------------------------------------- 1 2 3 4 5 6 --------------------------------------------------------------------------------
Data on salient features of labour force deployed in the
organised manufacturing industries during the year 2008-09 has been presented in this chapter. These include presentation of employment by industries, States, category of workers, sex and age, establishment size, employment through contractors and mandays worked in the Public sector, Joint sector and Private sector.
4.1 Total Work Force The State-wise and industry-wise break-up of employment during the year 2008-09 has been presented in the Tables 4.1.1 and 4.1.2, respectively. Total employment includes workers employed directly by the employers in addition to those engaged through contractors. The average daily employment of the workers has been worked out as the ratio of mandays worked to the number of working days at the unit level. During the year 2008-09, the total labour force in the manufacturing establishments has been estimated to be about 8.77 million, of which the proportion of directly employed female workers was 13.65 per cent. 4.2 Employment by States It may be seen from the Table 4.1.1 that six States, viz. Tamil Nadu, Maharashtra, Andhra Pradesh, Gujarat, Karnataka and Uttar Pradesh taken together accounted for about 62 per cent of the total employment during the year 2008-09. Tamil Nadu recorded the highest employment share of 16.59 per cent followed by Maharashtra (11.78 per cent), Andhra Pradesh (10.36 per cent), Gujarat (9.92 per cent), Karnataka (6.81 per cent)and Uttar Pradesh (6.54 per cent) respectively. On the other hand, proportion of workers in three States/Union Territories, viz. Andaman & Nicobar Islands, Manipur and Nagaland taken together was less than 0.05 per cent.
In terms of sectors, majority of workers i.e. 93.82 per cent were employed in Private Sector followed by Joint Sector with 3.65 per cent and Public Sector with 2.53 per cent respectively. At the State level, Private Sector was the major source of employment of workers in all the States. The contribution of the Private Sector in employment of workers was highest at 100 per cent in Nagaland, followed by 99.56 per cent in Delhi and 99.42 per cent in Dadra & Nagar Haveli, whereas it was lowest at 55.24 per cent in Jharkhand. The contribution of Private Sector to the total employment was more than 90 per cent in 21 States/Union Territories. The contribution of the Public Sector in employment of workers was highest at 12.44 per cent in Puducherry followed by Meghalaya (11.35 per cent) whereas it was less than 1 per cent in seven states. The share of the Joint Sector in total employment of workers was recorded highest at 39.13 per cent in Andaman & Nicobar Islands followed by Jharkhand (37.91 per cent), whereas it was less than 1 per cent in Jammu & Kashmir, Daman & Diu, Dadra & Nagar Haveli and Delhi.
37
The maximum proportion of directly employed women workers
was reported at 53.63 per cent in Kerala followed by Manipur (38.43 per cent), Tamil Nadu (35.28 per cent) and Karnataka (34.17 per cent). Interestingly, Kerala is the only State, where the share of the women workforce is significantly higher than that of their male counterparts. Out of 31 States/Union Territories, only five States/Union Territories reported percentage of women workers more than that at the All India level (13.65 per cent).
4.3 Employment by Industries
On perusal of Table 4.1.2, it is observed that out of 83 industry groups, 10 industry groups taken together accounted for more than 52 per cent of the employment in the Manufacturing industries. The maximum contribution to the total employment was 10.68 per cent in the industry group ‘131–Spinning, weaving and finishing of textiles’ followed by industry groups ‘107–Manufacture of other food products’ (7.03 per cent), ‘239-Manufacture of non-metallic mineral products n.e.c.’ (6.71 per cent), ‘141–Manufacture of wearing apparel, except fur apparel’ (6.04 per cent), ‘241-Manufacture of basic iron and steel’ (5.31 per cent), ‘120-Manufacture of tobacco products’ (4.89 per cent), ‘293-Manufacture of parts and accessories for motor vehicles’ (3.16 per cent) and ‘106-Manufacture of grain mill products, starches and starch products’ (3.02 per cent). Four industry groups, viz. ‘390-Remediation activities and other waste management services’, ‘182-Reproduction of recorded media’, ‘322-Manufacture of musical instruments’ and ‘360-Water collection, treatment and supply’ together contributed a meagre 0.01 per cent employment in the manufacturing establishments.
The maximum proportion of directly employed women workers
was reported at 63.52 per cent in industry group ‘142-Manufacture of articles of fur’. Other significant contribution in employment of women workers was seen in industry groups ‘141- Manufacture of wearing apparel, except fur apparel’ (48.29 per cent). ‘143-Manufacture of knitted and crocheted apparel’ (36.09 per cent) and ‘107-Manufacture of other food products’ (36.02 per cent).
Out of a total of 83 industry groups, Private Sector made a significant contribution by providing more than 90 per cent employment opportunities to workers in 66 industry groups. Of these, it was hundred per cent in 14 industry groups. The lowest contribution of the Private Sector in providing employment of workers was reported at 57.77 per cent in industry group ‘192-Manufacture of refined petroleum products’.
The contribution of Public Sector in employment generation was highest at 29.63 per cent in industry group ‘301- Building of ships and boats’, followed by industry groups ‘352-Manufacture of gas; distribution of gaseous fuels through mains’ (28.20 percent), ‘360-Water collection, treatment and supply’ (27.11 percent) and ‘303-Manufacture of air and spacecraft and related machinery’ (23.10 per cent), whereas it was less than 1 per cent in 20 industry groups.
38
The contribution of Joint Sector in employment generation
among industries was highest at 26.29 per cent in industry group ‘192-Manufacture of refined petroleum products’, followed by 20.48 per cent in the industry group ‘291-Manufacture of Motor Vehicles’ whereas it was less than 1 per cent in 12 industry groups. 4.4 Employment of Contract Workers by States
Sector-wise employment of contract workers in different States is given in Table 4.2.1. It is observed that at all India level, about 31.90 per cent of the total workers were employed through contractors. The practice of employing workers through contractors was more prevalent in the Private Sector, where 32.32 per cent of the workers were employed through contractors. The percentage of contract workers was 28.51 per cent and 21.17 per cent in Joint and Public Sectors, respectively.
Among States, out of the total work force in the respective State/Union Territories, Tripura employed highest percentage of contract workers at 84.08 per cent, followed by Bihar (60.60 per cent), Nagaland (58.91 per cent) and Andhra Pradesh (52.12 per cent). The lowest percentage of contract workers was employed in Delhi (10.73 per cent) followed by Manipur (10.89 per cent), Andaman & Nicobar Islands (11.37 per cent) and Tamil Nadu (14.88 per cent).
It is further observed that out of total contract workers, 95.06 per cent were employed in the Private Sector alone. Joint Sector and Public Sector employed 3.26 per cent and 1.68 per cent of the contract workers, respectively. 4.5 Employment of Contract Workers by Industries
Industry-wise employment of contract workers is depicted in Table 4.2.2. The proportion of contract workers to total workers in respective industry groups was maximum at 100.00 per cent in the industry group 390-Remediation activities and other waste management services’ followed by industry groups ‘, ’089- Mining and quarrying n.e.c.’ (86.19 per cent) ‘381-Waste collection’ (84.22 per cent) and ‘301-Building of ships and boats’ (73.17 per cent). The minimum proportion of contract workers was reported at 3.20 per cent in industry group ‘268-Manufacture of magnetic and optical media’.
4.6 Mandays Worked by Sectors, Industries and States State-wise and industry-wise data on total number of mandays worked during the year 2008-09 by sectors and category of workers are presented in Tables 4.3.1 and 4.3.2 respectively. The mandays worked have been obtained by summing up the attendance of all workers working in each shift on all working days for both manufacturing and non-manufacturing working days.
All the workers together were reported to have worked a total of 2820.10 million mandays during the year 2008-09. At All India level, mandays worked in the Private Sector accounted for 89.12 per cent of the total mandays worked by workers. In Joint
39
Sector this proportion was 7.58 per cent whereas it was 3.30 per cent in Public Sector.
Among States, Tamil Nadu accounted for the highest share (17.01 per cent) of total mandays worked by workers in manufacturing industries followed by Maharashtra (11.78 per cent), Andhra Pradesh (10.55 per cent) and Gujarat (10.42 per cent). Nagaland, Manipur, Meghalaya and Andaman & Nicobar Islands together reported about 0.09 per cent mandays worked to total mandays worked by workers in the manufacturing industries. Among Industries, the industry group ‘131-Spinning, weaving and finishing of textiles’ accounted for the highest share of 11.00 per cent mandays worked to the total mandays worked in the manufacturing industries. Other major contributing industry groups in mandays worked were ‘107-Manufacture of other food products’ (6.13 per cent) and ‘241-Manufacture of basic iron and steel’ (5.67 per cent). Seven industry groups, viz. ‘182-Reproduction of recorded media’, ‘322-Manufacture of musical instruments’, ‘353-Steam and air conditioning supply’, ‘360-Water collection, treatment and supply’, ‘381-Waste Collection’, ‘382-Waste treatment and disposal, and ‘390-Remediation activities and other waste management services’ accounted for about 0.03 per cent of the total mandays worked in the Manufacturing industries. 4.7 Mandays Worked by Contract Workers
Table 4.4.1 and 4.4.2 give details of mandays worked by contract workers by States and industries respectively. The contract workers worked a total of 877 million mandays out of 2820.10 million mandays worked by all workers. 4.8 Mandays Paid For
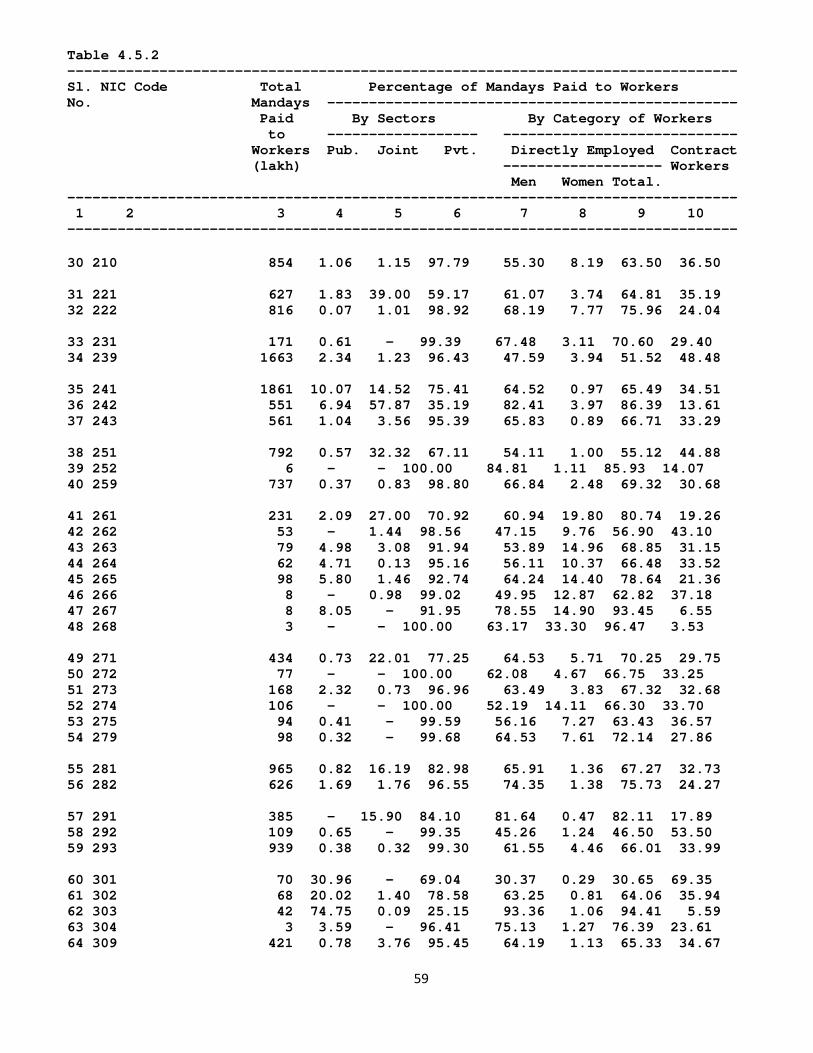
Details of mandays paid for by State and industries are furnished in Table 4.5.1 and 4.5.2, respectively. The employers paid for about 3124.90 million mandays as against 2820.10 mandays actually worked by workers in the manufacturing industries. 4.9 Factories employing contract workers
Details of number of reporting factories, factories employing contract workers, etc., by States and industries are furnished in Tables 4.6.1 and 4.6.2 respectively. A total of about 1.55 lakh units were reported under the manufacturing industries. Out of these, 25.90 per cent factories were reported to have employed contract workers. The percentage of factories employing contract workers was reported at 36.55 per cent in Public Sector, 40.67 per cent in Joint Sector and 25.63 per cent in Private Sector.
At the State level, 68.04 per cent factories in Tripura,
52.25 per cent in Bihar, 43.96 per cent factories in Nagaland and 43.41 per cent factories in Goa reported to have employed contract workers. Under Joint Sector, cent per cent factories in Dadra & Nagar Haveli, 78.95 per cent factories in Uttar Pradesh and 75.00 per cent factories in Punjab reported to have employed the contract workers. Under Public Sector, cent per cent factories in Chandigarh, 81.71 per cent factories in Chhattisgarh
40
and 64.06 per cent factories in Rajasthan reported to have employed the contract workers. Under Private Sector, 68.35 per cent factories in Tripura, 52.11 per cent in Bihar, 43.96 per cent factories in Nagaland and 43.52 per cent factories in Goa reported to have employed the contract workers.
At the industry level, under Public Sector, cent per cent
factories in three industry groups, viz.‘242-Manufacture of basic precious and non-ferrous metals’, ‘304-Manufacture of military fighting vehicles’ and ‘382- Waste treatment and disposal’ reported to have employed the contract workers. Under Joint Sector, cent percent factories in 5 industry groups viz. ‘101-Processing and preserving of meat’, ‘203-Manufacture of man-made fibre’, ‘303-Manufacture of air and spacecraft and related machinery’, ‘310-Manufacture of furniture’ and ‘351-Electric power generation, transmission and distribution’ reported to have employed the contract workers. Under private sector, only one industry group, ‘390-Remediation activities and other waste management services’ reported to have employed cent percent contract workers.
41
CHAPTER-IV EMPLOYMENT
Table 4.1.1
Percentage of Workers Employed in States by Sectors and Category of Workers during the Year 2008-09
Table 4.1.2 -------------------------------------------------------------------------------- Sl. NIC Code Total Percentage of Workers to Total Workers No. Number -------------------------------------------------- of By Sectors By Category of Workers Workers ------------------- ---------------------------- Pub. Joint Pvt. Directly Employed Contract ------------------- Workers Men Women Total. -------------------------------------------------------------------------------- 1 2 3 4 5 6 7 8 9 10 --------------------------------------------------------------------------------
Table 4.1.2 -------------------------------------------------------------------------------- Sl. NIC Code Total Percentage of Workers to Total Workers No. Number -------------------------------------------------- of By Sectors By Category of Workers Workers ------------------- ---------------------------- Pub. Joint Pvt. Directly Employed Contract ------------------- Workers Men Women Total. -------------------------------------------------------------------------------- 1 2 3 4 5 6 7 8 9 10 --------------------------------------------------------------------------------
Table 4.2.2 -------------------------------------------------------------------------------- Sl. NIC Code Total Percentage of Percentage of Contract No. Number Contract Workers Workers to Total Workers of to Total Contract by Sectors Contract Workers by Sectors --------------------------- Workers ------------------- Pub. Joint Pvt. Overall Pub. Joint Pvt. -------------------------------------------------------------------------------- 1 2 3 4 5 6 7 8 9 10 --------------------------------------------------------------------------------
Table 4.2.2 -------------------------------------------------------------------------------- Sl. NIC Code Total Percentage of Percentage of Contract No. Number Contract Workers Workers to Total Workers of to Total Contract by Sectors Contract Workers by Sectors --------------------------- Workers ------------------- Pub. Joint Pvt. Overall Pub. Joint Pvt. -------------------------------------------------------------------------------- 1 2 3 4 5 6 7 8 9 10 --------------------------------------------------------------------------------
Table 4.3.2 -------------------------------------------------------------------------------- Sl. NIC Code Total Percentage of Mandays Worked by Workers No. Mandays -------------------------------------------------- Worked By Sectors By Category of Workers by ------------------- ---------------------------- Workers Pub. Joint Pvt. Directly Employed Contract (lakh) ------------------- Workers Men Women Total. -------------------------------------------------------------------------------- 1 2 3 4 5 6 7 8 9 10 --------------------------------------------------------------------------------
Table 4.3.2 -------------------------------------------------------------------------------- Sl. NIC Code Total Percentage of Mandays Worked by Workers No. Mandays -------------------------------------------------- Worked By Sectors By Category of Workers by ------------------- ---------------------------- Workers Pub. Joint Pvt. Directly Employed Contract (lakh) ------------------- Workers Men Women Total. -------------------------------------------------------------------------------- 1 2 3 4 5 6 7 8 9 10 --------------------------------------------------------------------------------
Table 4.4.2 -------------------------------------------------------------------------------- Sl. NIC Code Total Percentage of Percentage of Mandays No. Mandays Mandays Worked by Worked by Contract Workers Worked Contract Workers to to Total Mandays Workers by Total Mandays by All Workers by Sectors Contract Worked by Contract ---------------------------- Workers Workers by Sectors Pub. Joint Pvt. Overall (lakh) ------------------- Pub. Joint Pvt. -------------------------------------------------------------------------------- 1 2 3 4 5 6 7 8 9 10 --------------------------------------------------------------------------------
Table 4.4.2 -------------------------------------------------------------------------------- Sl. NIC Code Total Percentage of Percentage of Mandays No. Mandays Mandays Worked by Worked by Contract Workers Worked Contract Workers to to Total Mandays Workers by Total Mandays by All Workers by Sectors Contract Worked by Contract ---------------------------- Workers Workers by Sectors Pub. Joint Pvt. Overall (lakh) ------------------- Pub. Joint Pvt. -------------------------------------------------------------------------------- 1 2 3 4 5 6 7 8 9 10 --------------------------------------------------------------------------------
Table 4.5.2 -------------------------------------------------------------------------------- Sl. NIC Code Total Percentage of Mandays Paid to Workers No. Mandays ------------------------------------------------- Paid By Sectors By Category of Workers to ------------------ ---------------------------- Workers Pub. Joint Pvt. Directly Employed Contract (lakh) ------------------- Workers Men Women Total. -------------------------------------------------------------------------------- 1 2 3 4 5 6 7 8 9 10 --------------------------------------------------------------------------------
Table 4.5.2 -------------------------------------------------------------------------------- Sl. NIC Code Total Percentage of Mandays Paid to Workers No. Mandays ------------------------------------------------- Paid By Sectors By Category of Workers to ------------------ ---------------------------- Workers Pub. Joint Pvt. Directly Employed Contract (lakh) ------------------- Workers Men Women Total. -------------------------------------------------------------------------------- 1 2 3 4 5 6 7 8 9 10 --------------------------------------------------------------------------------
Labour cost is one of the most significant instruments for
assessing the economic viability of any industrial activity for an entrepreneur before venturing into the industrial field. It provides vital information in regard to the extent of expenditure incurred by entrepreneurs on labour welfare and social security aspects, in addition to wages/salaries paid to them which adequately equips the fresher in choosing the suitable field and proper area as also in planning the industrial project and its proper manoeuvreance. Further, it also helps in (a) reliable costing, (b) wage fixation on a realistic basis, (c) logical collective bargaining, (d) evolving, implementation and evaluation of welfare measures, (e) study of trends over a period of time, (f) location of industry and the like. Labour Cost data are also important for policy formulation at the national and regional levels. With this end in view, data on various aspects of labour cost are collected every year which, inter-alia, include the expenses incurred by the industrial establishments on account of wages/salaries to their employees, bonus (profit sharing bonus, festival bonus, etc.), contributions to provident and other funds and workmen and staff welfare expenses in respect of all employees employed directly or through contractors. The aggregate of these components add up to the labour cost. When used in conjunction with the number of mandays worked, this gives the average labour cost per manday worked.
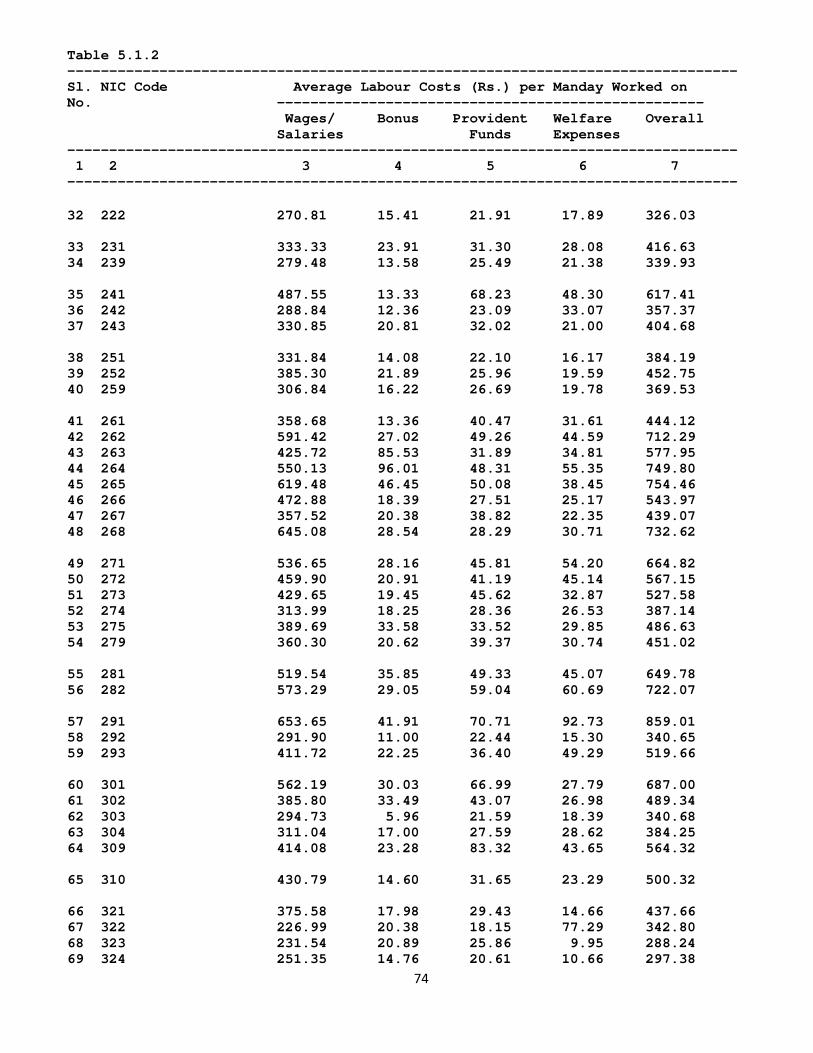
5.1 Average Labour Cost State-wise and Industry-wise data on average Labour Cost per manday worked for all employees during the year 2008-09 are given in Tables 5.1.1 and 5.1.2, respectively. The Tables reveals that at All India level, the average labour cost per manday worked in respect of all employees was recorded at Rs. 410.41. Component wise, the employers, on an average for each manday worked by an average employee, spent Rs. 330.35 on wages/salaries, Rs. 18.37 on bonus, Rs. 34.59 as a contribution towards the employees’ provident and other funds and Rs. 27.09 towards workmen and staff welfare expenses. The average labour cost per manday worked in manufacturing industries belonging to the Public Sector was Rs. 606.43 as compared to Rs. 468.88 in the Joint Sector and Rs. 349.98 in the Private Sector.
5.2 Average Labour Cost by States
Table 5.1.1 reveals that the highest average labour cost per manday worked in respect of all employees was reported at Rs. 783.23 in Jharkhand, followed by Rs. 626.83 in Maharashtra and Rs. 553.58 in Goa. The lowest average labour cost per manday worked in respect of all employees was reported at Rs. 101.42 in Nagaland, followed by Rs. 107.90 in Manipur and Rs. 195.67 in Tripura.
66
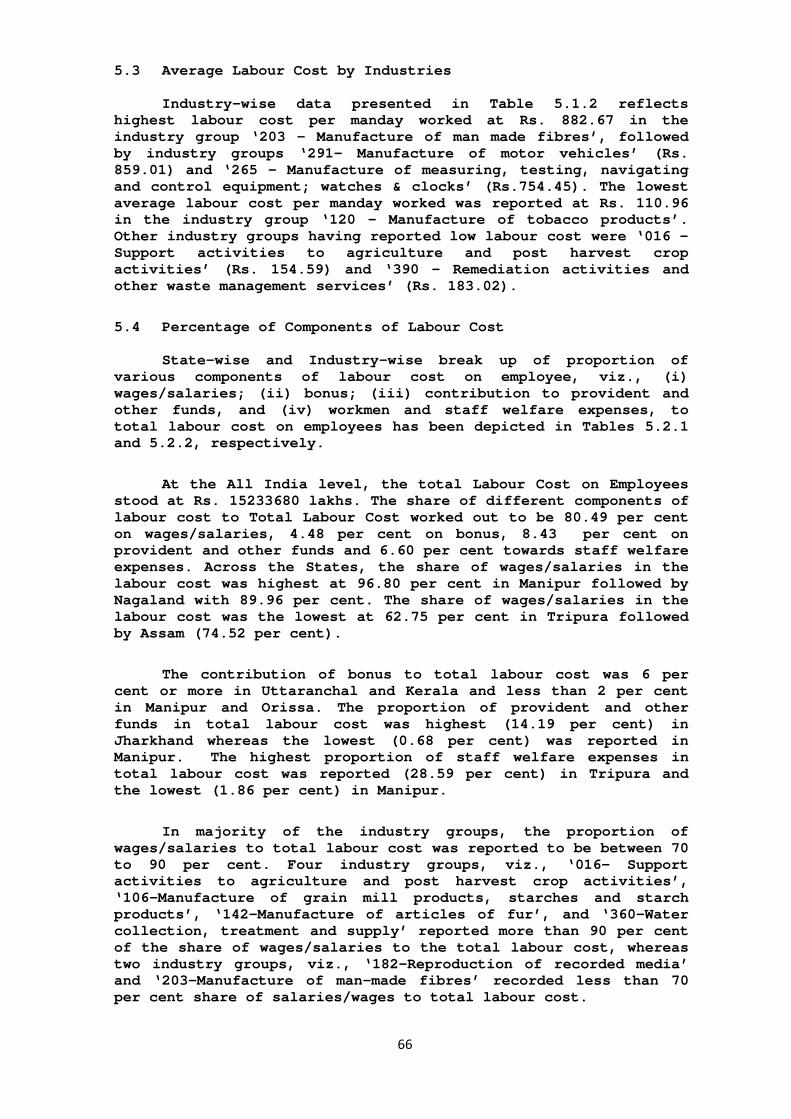
5.3 Average Labour Cost by Industries Industry-wise data presented in Table 5.1.2 reflects highest labour cost per manday worked at Rs. 882.67 in the industry group ‘203 - Manufacture of man made fibres’, followed by industry groups ‘291- Manufacture of motor vehicles’ (Rs. 859.01) and ‘265 - Manufacture of measuring, testing, navigating and control equipment; watches & clocks’ (Rs.754.45). The lowest average labour cost per manday worked was reported at Rs. 110.96 in the industry group ‘120 - Manufacture of tobacco products’. Other industry groups having reported low labour cost were ‘016 – Support activities to agriculture and post harvest crop activities’ (Rs. 154.59) and ‘390 – Remediation activities and other waste management services’ (Rs. 183.02).
5.4 Percentage of Components of Labour Cost
State-wise and Industry-wise break up of proportion of
various components of labour cost on employee, viz., (i) wages/salaries; (ii) bonus; (iii) contribution to provident and other funds, and (iv) workmen and staff welfare expenses, to total labour cost on employees has been depicted in Tables 5.2.1 and 5.2.2, respectively.
At the All India level, the total Labour Cost on Employees
stood at Rs. 15233680 lakhs. The share of different components of labour cost to Total Labour Cost worked out to be 80.49 per cent on wages/salaries, 4.48 per cent on bonus, 8.43 per cent on provident and other funds and 6.60 per cent towards staff welfare expenses. Across the States, the share of wages/salaries in the labour cost was highest at 96.80 per cent in Manipur followed by Nagaland with 89.96 per cent. The share of wages/salaries in the labour cost was the lowest at 62.75 per cent in Tripura followed by Assam (74.52 per cent).
The contribution of bonus to total labour cost was 6 per
cent or more in Uttaranchal and Kerala and less than 2 per cent in Manipur and Orissa. The proportion of provident and other funds in total labour cost was highest (14.19 per cent) in Jharkhand whereas the lowest (0.68 per cent) was reported in Manipur. The highest proportion of staff welfare expenses in total labour cost was reported (28.59 per cent) in Tripura and the lowest (1.86 per cent) in Manipur.
In majority of the industry groups, the proportion of
wages/salaries to total labour cost was reported to be between 70 to 90 per cent. Four industry groups, viz., ‘016- Support activities to agriculture and post harvest crop activities’, ‘106-Manufacture of grain mill products, starches and starch products’, ‘142-Manufacture of articles of fur’, and ‘360-Water collection, treatment and supply’ reported more than 90 per cent of the share of wages/salaries to the total labour cost, whereas two industry groups, viz., ‘182-Reproduction of recorded media’ and ‘203-Manufacture of man-made fibres’ recorded less than 70 per cent share of salaries/wages to total labour cost.
67
The contribution of bonus in the total labour cost was highest at 14.80 per cent in the industry group ‘263–Manufacture of communication equipment’ and the lowest share of 1.48 per cent was recorded in industry group ‘142-Manufacture of articles of fur’. The percentage contribution of provident and other funds to total labour cost was highest at 26.01 per cent in industry group ‘182–Reproduction of recorded media’ and the lowest at 0.00 per cent in industry group ‘390-Remediation activities and other waste management services’. The share of staff welfare expenses in total labour cost was highest at 22.55 per cent in industry group ‘322-Manufacture of musical instruments’ and the lowest at 1.62 per cent in industry group '016- Support activities to agriculture and post harvest crop activities’.
5.5 Percentage of Labour Cost to Total Cost of Production
Labour cost is one of the important components of the total cost of production in any industrial establishment. The percentage of labour cost on employees to total cost of production indicates the contribution made by labour in the economy of the country. In rapidly changing scenario of world economy in terms of liberalisation, privatisation, globalisation and modernisation, the percentage share of labour cost to total cost of production is bound to change unambiguously over a period of time. The time series data on the percentage of labour cost to total cost of production may be of immense use in overall economic planning, adoption of labour policies and programmes. With this end in view, State-wise and Industry-wise data on percentage share of labour cost to total cost of production in different sectors have been collected and presented in Tables 5.3.1 and 5.3.2, respectively.
Table 5.3.1 reveals that at all India level, labour cost
constituted 5.56 per cent of the total cost of production during the year 2008-09. The proportion of labour cost to total cost of production was 5.49 per cent in the Public Sector, 4.38 per cent in the Joint Sector and 5.76 per cent in the Private Sector.
Among States, the highest proportion of labour cost on
employees to total cost of production was reported in Tripura at 17.14 per cent followed by Manipur at 12.68 per cent, Uttaranchal at 9.43 per cent, Jharkhand at 8.65 per cent and Chandigarh at 8.42 per cent. On the other hand, the lowest percentage of labour cost to total cost of production was reported in Bihar (2.04 per cent).
In the Public Sector, the percentage of labour cost to
total cost of production was more than 10 per cent in 15 States/Union Territories, whereas it was less than 5 per cent in only 6 States/UTs. In the Joint Sector, the percentage of labour cost was recorded to be more than 10 per cent in 9 States/Union Territories, whereas it was less than 5 per cent in 13 States/Union Territories. In the Private Sector, the percentage of labour cost was recorded more than 10 per cent in only 2 States/Union Territories, whereas it was less than 5 per cent in 12 States/Union Territories.
68
Industry-wise and Sector-wise percentage of labour cost to total cost of production is presented in Table 5.3.2. The proportion of labour cost to total cost of production was recorded to be highest at 31.00 per cent in industry group ‘304-Manufacture of military fighting vehicles’ followed by ‘331-Repair of fabricated metal products, machinery and equipment’ with 28.99per cent. The lowest proportion of 0.76 per cent was reported in industry group ‘390- Remediation activities and other waste management services’ followed by the industry groups, ‘104-Manufacture of vegetable and animal oils and fats’ and ‘192-Manufacture of refined petroleum products’ (0.82 per cent). The percentage of labour cost to total cost of production was reported to be more than 20 per cent in four industry group, between 10 to 20 per cent in 23 industry groups, between 5 to 10 per cent in 34 industry groups and less than 5 per cent in 22 industry groups.
In the Public Sector, the percentage of labour cost to
total cost of production was more than 20 per cent in 24 industry groups, whereas it was less than 5 per cent in 5 industry groups. In the Joint Sector, the percentage of labour cost was recorded to be more than 20 per cent in 13 industry groups whereas it was less than 5 per cent in 13 industry groups. In the Private Sector, the percentage of labour cost was recorded less than 5 per cent in 22 industry groups, between 5 to 10 per cent in 35 industry groups, between 10 to 20 per cent in 23 industry groups and more than 20 per cent in only 3 industry group. It has been observed that the percentage of labour cost to total cost of production was on the higher side in the Public and the Joint Sectors, whereas it was on the lower side in the Private Sector establishments in majority of the industry groups.
5.6 Wages/Salaries
State-wise and Industry-wise data on wages/salaries component of labour cost per manday worked are presented in Tables 5.4.1 and 5.4.2, respectively. The Tables reveal that at all India level, labour cost on account of the wages/salaries per manday worked were Rs. 211.95 for all workers and Rs. 330.35 for all employees taken together, Rs. 258.04 for men, Rs. 131.23 for women, and Rs. 160.53 for contract workers, The wages/salaries per manday worked for all employees was the highest at Rs. 455.65 in the Public Sector followed by Rs. 361.00 in the Joint Sector and Rs. 321.18 in the Private Sector.
The States/Union Territories, wherein wages/salaries paid
to its employees was more than Rs. 400, were Jharkhand, Maharashtra, Goa, Chandigarh and Haryana. The highest wages/salaries per manday paid to all workers was reported in Jharkhand at Rs. 409.30, followed by Maharashtra (Rs. 292.71) and Goa (Rs. 288.37). Among male workers, the highest wages/salaries per manday worked was reported at Rs. 464.02 in Jharkhand and the lowest at Rs. 84.08 in Nagaland. Among women workers, the highest and lowest wages/salaries per manday worked was reported at Rs. 352.44 in Jharkhand and Rs. 72.23 in Nagaland, respectively. For contract workers, wages/salaries per manday worked was found to be highest at Rs. 387.00 in Andaman & Nicobar Islands and lowest at Rs. 78.21 in Nagaland.
69
It has been observed that the wages/salaries per manday
worked was generally recorded to be the lowest in the North-Eastern States/Union Territories for all categories of employees. Under the category of directly employed workers, the wages/salaries per mandays worked of women workers was reported to be more than that of their male counterparts in Chandigarh, West Bengal and Meghalaya.
Among Industries, the main components of labour cost viz.
wages/ salaries paid per manday worked to all workers was reported to be the highest at Rs. 456.75 in industry group ‘203–Manufacture of man-made fibres’ followed by industry groups ‘291-Manufacture of motor vehicles’ (Rs. 442.98) and ‘301-Building of ships and boats’ (Rs. 411.79), whereas it was lowest at Rs. 76.05 in industry group ‘120-Manufacture of tobacco products’, followed by industry groups ‘016- Support activities to agriculture and post harvest crop activities’ (Rs.124.41) and ‘102-Processing and preserving of fish, crustaceans and molluscs’ (Rs. 131.92).
The highest wages/salaries paid per manday worked to women
workers was reported at Rs. 557.54 in industry group ‘291-Manufacture of motor vehicles’ followed by industry groups, ‘241–Manufacture of basic iron and steel’ (Rs.545.52) and ‘331-Repair of fabricated metal products, machinery and equipment’ (Rs. 498.92), whereas it was lowest at Rs. 58.95 in industry group ‘382-Waste treatment and disposal’ followed by industry groups ‘120-Manufacture of tobacco products’ (Rs. 70.92), ‘360-Water collection, treatment and supply’ (Rs. 77.33) and ‘202-Manufacture of other chemical products’ (Rs. 79.91).
The average wages/salaries paid per mandays worked to women
workers was higher than that of their male counterparts in 11 industries groups.
5.7 Average Daily Earnings
The average daily earnings have been defined as the wages/salaries per manday paid for. State-wise and industry-wise statistics on average daily earnings of workers during the year 2008-09 are presented in Tables 5.5.1 and 5.5.2, respectively. The Tables show that at all India level, the average daily earnings were recorded to be Rs. 223.38 for men, Rs. 118.37 for women, Rs. 157.02 for contract workers, Rs. 191.28 for all workers and Rs. 290.60 for all employees. At all India level, the average daily earnings by workers were reported at Rs. 393.78 in the Public Sector, Rs. 308.02 in the Joint Sector and Rs. 283.68 in the Private Sector.
The highest amount of average daily earnings for male
workers was reported at Rs. 414.38 in Jharkhand and the lowest at Rs. 80.16 in Nagaland. The average daily earnings for women workers were the highest at Rs. 342.45 in Jharkhand, whereas it was reported to be lowest at Rs. 65.84 in Assam. Among all the State/Union Territories, the average daily earnings of contract workers were reported to be the highest at Rs. 387.00 in Andaman & Nicobar Islands, followed by Uttaranchal (Rs. 241.08) and the
70
lowest at Rs. 82.88 in Nagaland followed by Tripura (Rs. 86.23) and Manipur (Rs. 96.76). It has further been observed that the average daily earnings were recorded more or less the lowest in the North-Eastern States/Union Territories except Meghalaya.
Directly employed women workers were reported to be earning
more than their male counterparts in the states of West Bengal and Meghalaya.
At the industry level, the highest average daily earnings for all workers was reported at Rs. 405.77 in industry group ‘203-Manufacture of man-made fibres’ followed by industry groups ‘291-Manufacture of motor vehicles’ (Rs. 384.00) and ‘265-Manufacture of measuring, testing, navigating and control equipment; watches and clocks’ (Rs.301.15) and lowest at Rs. 74.24 in industry group ‘120-Manufacture of tobacco products’. For contract workers, the highest average daily earnings was reported at Rs. 332.90 in industry group ‘301-Building of ships & boats’ and lowest at Rs. 59.03 in industry group ‘120-Manufacture of tobacco products’. For women workers, however, the highest average daily earnings was reported at Rs. 583.43 in the industry group ‘291- Manufacture of motor vehicles’ and the lowest in industry group ‘382-Waste treatment and disposal’ (Rs. 51.82).
The average daily earnings of women workers were higher
than that of their male counterparts in 10 industries groups.
Average daily earnings of employees by State and industry
have been presented in Tables 5.6.1 and 5.6.2, respectively. At all India level, the average daily earnings were Rs. 818.33 for supervisory & managerial staff, Rs. 344.13 for other staff as compared to Rs. 205.06 for directly employed workers, Rs. 157.02 for contract workers, Rs. 191.28 for all workers and Rs. 290.60 for all employees.
For supervisory and managerial staff, the average daily
earnings was highest in the Private Sector at Rs. 922.04, followed by the Public Sector (Rs. 575.05) and the Joint Sector (Rs. 496.38). At the State level, the highest average daily earnings for supervisory and managerial staff was reported at Rs. 1371.28 in Jharkhand and the lowest at Rs. 209.61 in Nagaland.
For other staff, the highest average earnings was reported
at Rs. 405.48 in the Public Sector, followed by the Private Sector (Rs. 341.55) and the Joint Sector (Rs. 339.25). At State level, the highest and lowest average daily earnings for other staff were reported at Rs. 667.87 in Jharkhand and Rs. 106.43 in Nagaland, respectively.
For the directly employed workers, the highest and lowest
average daily earnings were reported at Rs. 410.73 in Jharkhand and Rs. 78.93 in Nagaland, respectively.
For all categories of employees, the highest average daily
earnings were reported in the Public Sector (Rs.393.78), followed
71
by the Joint Sector (Rs.308.02) and the Private Sector (Rs.283.68).
At the industry level, the highest average daily earnings
were reported in the industry group ‘301-Building of ships and boats’ at Rs. 506.27 for Directly employed workers, Rs.3008.00 for supervisory and managerial staff and Rs. 604.82 for all Employees in industry group ‘268-Manufacture of magnetic and optical media’, Rs.405.77 for all workers in industry group ‘203-Manufacture of man-made fibres’, Rs. 2218.81 for other staff in industry group ‘142-Manufacture of articles of fur’. The lowest average daily earnings for directly employed workers, Contract workers, All Workers and All Employees were Rs. 107.73, Rs. 59.03, Rs. 74.24 and Rs. 87.82 respectively for industry group ‘120-Manufacture of tobacco products’. For Supervisory and Managerial Staff and Other Staff, the same was Rs. 114.57 and Rs. 76.78 for industry group ‘390-Remediation activities and other waste management services’.
5.8 Percentage of Factories paying/incurring Expenses on Bonus, Provident Funds and Welfare Funds
State-wise and industries-wise data on percentage of factories paying/incurring expenses on bonus, provident funds and welfare funds are given in Tables 5.7.1 and 5.7.2, respectively. The Tables reveal that at the all India level, the percentage of factories incurring expenditure on bonus, provident funds and welfare funds was recorded at 65.42 per cent, 71.10 per cent and 70.74 per cent, respectively. The percentage of factories paying bonus was recorded at 69.63 per cent in the Public Sector, 70.37 per cent in the Joint Sector and 65.32 per cent in the Private Sector. The percentage of factories contributing towards the provident and other funds was recorded at 84.12 per cent in the Public Sector, 79.09 per cent in the Joint Sector and 70.87 per cent in the Private Sector. The percentage of factories incurring expenditure on welfare of their workers was recorded at 77.42 per cent in the Public Sector, 76.01 per cent in the Joint Sector and 70.61 per cent the Private Sector.
At the State level, the percentage of factories paying
bonus to its workers was recorded lowest at 13.19 per cent in Nagaland, followed by 18.09 per cent in Bihar. The percentage of factories contributing to the provident and other funds was recorded lowest at 5.71 per cent in Manipur, followed by 9.89 per cent in Nagaland. The percentage of factories incurring expenditure on welfare of its workers was lowest at 41.72 per cent in Chhattisgarh, followed by 43.37 per cent in Andhra Pradesh.
Table 5.7.2 shows that the percentage of factories
incurring expenses on bonus was the lowest at 35.04 per cent in industry group ‘016-Support activities to agriculture and post-harvest crop activities’, on provident and other funds at 21.43 per cent in industry group ‘353-Steam and air conditioning supply’ and on welfare funds at 35.21 per cent in industry group ‘106-Manufacture of grain mill products, starches and starch products’.
Table 5.1.2 -------------------------------------------------------------------------------- Sl. NIC Code Average Labour Costs (Rs.) per Manday Worked on No. --------------------------------------------------- Wages/ Bonus Provident Welfare Overall Salaries Funds Expenses -------------------------------------------------------------------------------- 1 2 3 4 5 6 7 --------------------------------------------------------------------------------
Table 5.1.2 -------------------------------------------------------------------------------- Sl. NIC Code Average Labour Costs (Rs.) per Manday Worked on No. --------------------------------------------------- Wages/ Bonus Provident Welfare Overall Salaries Funds Expenses -------------------------------------------------------------------------------- 1 2 3 4 5 6 7 --------------------------------------------------------------------------------
Table 5.2.2 -------------------------------------------------------------------------------- Sl. NIC Code Total Average Percentage of Components of Labour No. Labour Labour Cost to Total Labour Cost Cost Cost per ----------------------------------- on Manday Wages/ Bonus Provident Welfare Employees Worked Salaries Funds Expenses (Rs. lakh) (Rs.) -------------------------------------------------------------------------------- 1 2 3 4 5 6 7 8 --------------------------------------------------------------------------------
Table 5.2.2 -------------------------------------------------------------------------------- Sl. NIC Code Total Average Percentage of Components of Labour No. Labour Labour Cost to Total Labour Cost Cost Cost per ----------------------------------- on Manday Wages/ Bonus Provident Welfare Employees Worked Salaries Funds Expenses (Rs. lakh) (Rs.) -------------------------------------------------------------------------------- 1 2 3 4 5 6 7 8 --------------------------------------------------------------------------------
Table 5.3.2 -------------------------------------------------------------------------------- Sl. NIC Code Total Total Percentage of Total Labour Cost on No. Cost of Labour Employees to Total Cost of Production Cost on Production by Sectors (Rs. lakh) Employees ---------------------------------- (Rs. lakh) Pub. Joint Pvt. Overall -------------------------------------------------------------------------------- 1 2 3 4 5 6 7 8 --------------------------------------------------------------------------------
Table 5.3.2 -------------------------------------------------------------------------------- Sl. NIC Code Total Total Percentage of Total Labour Cost on No. Cost of Labour Employees to Total Cost of Production Cost on Production by Sectors (Rs. lakh) Employees ---------------------------------- (Rs. lakh) Pub. Joint Pvt. Overall -------------------------------------------------------------------------------- 1 2 3 4 5 6 7 8 --------------------------------------------------------------------------------
Table 5.4.2 -------------------------------------------------------------------------------- Sl. NIC Code Labour Costs per Manday Worked on Wages/Salaries on No. ------------------------------------------------------- Directly Employed Workers Contract All All --------------------------- Workers Workers Employees Men Women Total. -------------------------------------------------------------------------------- 1 2 3 4 5 6 7 8 --------------------------------------------------------------------------------
Table 5.4.2 -------------------------------------------------------------------------------- Sl. NIC Code Labour Costs per Manday Worked on Wages/Salaries on No. ------------------------------------------------------- Directly Employed Workers Contract All All --------------------------- Workers Workers Employees Men Women Total. -------------------------------------------------------------------------------- 1 2 3 4 5 6 7 8 --------------------------------------------------------------------------------
Table 5.5.2 -------------------------------------------------------------------------------- Sl. NIC Code Average Daily Earnings by No. ------------------------------------------------------- Directly Employed Workers Contract All All --------------------------- Workers Workers Employees Men Women Total. -------------------------------------------------------------------------------- 1 2 3 4 5 6 7 8 --------------------------------------------------------------------------------
Table 5.5.2 -------------------------------------------------------------------------------- Sl. NIC Code Average Daily Earnings by No. ------------------------------------------------------- Directly Employed Workers Contract All All --------------------------- Workers Workers Employees Men Women Total. -------------------------------------------------------------------------------- 1 2 3 4 5 6 7 8 --------------------------------------------------------------------------------
Table 5.6.2 -------------------------------------------------------------------------------- Sl. NIC Code Average Daily Earnings by Employees No. --------------------------------------------------------- Directly Contract All Supervisory Other All Employed Workers Workers and Staff Employees Workers Managerial -------------------------------------------------------------------------------- 1 2 3 4 5 6 7 8 --------------------------------------------------------------------------------
Table 5.6.2 -------------------------------------------------------------------------------- Sl. NIC Code Average Daily Earnings by Employees No. --------------------------------------------------------- Directly Contract All Supervisory Other All Employed Workers Workers and Staff Employees Workers Managerial -------------------------------------------------------------------------------- 1 2 3 4 5 6 7 8 --------------------------------------------------------------------------------
Table 5.7.2 Percentage of Factories Paying/Incurring Expenses on Bonus, Provident Funds and Welfare Funds in Industries (3-Digit Level of NIC-2008) during the Year 2008-09
Table 5.7.2 -------------------------------------------------------------------------------- Sl. NIC Code Total Number of Factories Percentage of Factories No. Number Incurring Expenses on Incurring Expenses on of ---------------------- ---------------------- Reporting Bonus PF and Welfare Bonus PF and Welfare Factories Others Funds Others Funds -------------------------------------------------------------------------------- 1 2 3 4 5 6 7 8 9 --------------------------------------------------------------------------------
Table 5.7.2 -------------------------------------------------------------------------------- Sl. NIC Code Total Number of Factories Percentage of Factories No. Number Incurring Expenses on Incurring Expenses on of ---------------------- ---------------------- Reporting Bonus PF and Welfare Bonus PF and Welfare Factories Others Funds Others Funds -------------------------------------------------------------------------------- 1 2 3 4 5 6 7 8 9 --------------------------------------------------------------------------------
Sector-wise and state-wise trends in respect of various
characteristics viz. average daily employment; wages/salaries per mandays worked; average labour cost; proportion of labour cost to total cost of production; absenteeism and labour turnover have been presented in Tables 6.1 to 6.6. A brief analysis of these data has been presented in the succeeding paragraphs. 6.1 Average Daily Employment
Table 6.1 depicts the trend in average daily employment of different categories of workers as well as all employees. At All India level, the average daily employment of all employees, all workers, directly employed men, women and contract workers generally increased over the preceding four years from 2005-06 to 2008-09. The average daily employment of contract workers was reported to have gone up steadily. The average daily employment of all employees in respect of the Private Sector has gone up to 82.3 lakh during 2008-09 from 66.5 lakh during 2005-06 and the same in the case of Public and Joint Sectors has also exhibited an increasing trend and stood at 2.2 lakh and 3.2 lakh, respectively in 2008-09 as compared to 1.7 lakh and 2.8 lakh, respectively in 2005-06.
6.2 Average Labour Cost
Table 6.2 gives trend in average labour cost per manday
worked by employees by States and Sectors. The average labour cost per manday worked by all employees at an all India level worked out to be Rs. 410.41 in 2008-09 as compared to Rs. 323.64 in 2005-06. It is observed that there has been an increase in average labour cost in more or less all States. The average labour cost has registered an increasing trend in the Private sector, decreasing trend in Public Sector and remained almost constant in Joint Sector.
6.3 Wage/Salaries Rates
Table 6.3 presents trend in wages/salaries per manday worked by all categories of employees by States and Sectors. It is observed that there has been an increase in wage rates of all categories of employees in almost all States over the years. The wage rates of all employees increased by 1.2 per cent and 24.0 per cent in the Joint and Private Sectors, respectively, from the year 2005-06 whereas, the wage rate of all employees declined by 6.9 per cent in Public Sector. 6.4 Percentage of Labour Cost on Employees to Total Cost
of production
Table 6.4 presents trend in the percentage of labour cost to total cost of production by States and Sectors. At all India
101
level, labour cost to total cost of production declined from 2005-06 (5.75 per cent) to 2008-09 (5.56 per cent). At the sector level too, a similar pattern is witnessed in all the three sectors.
6.5 Number of Reporting factories
Table 6.5 presents data depicting trends on number of reporting factories, percentage of factories employing contract workers and percentage of factories paying or incurring expenses on bonus, provident funds and welfare fund.
The number of reporting factories increased from 1.40 lakh
in 2005-06 to 1.55 lakh in 2008-09. An increase in the percentage of factories employing Contract workers has been noticed at all India level and also in Joint and Private Sectors over the years. It is observed that the percentage of factories paying bonus is decreasing at all India level and also, in Private sector. It is further seen that the percentage of factories paying or incurring expenses on Provident Fund and welfare expenses is increasing at All India level and in Private Sector, but decreasing in Public and Joint Sectors. 6.6 Percentage of Absenteeism and Labour Turnover
Table 6.6 depicts trend in the percentage of absenteeism and labour turnover by States and Sectors. At all India level, the absenteeism rate increased from 2005-06’s level of 8.10 per cent to 8.65 per cent in 2008-09. However, accession and separation rates decreased from 18.25 per cent and 22.37 per cent in 2005-06 to 17.56 per cent and 17.00 per cent in 2008-09. In the Public and Joint Sectors, an increasing trend is witnessed in absenteeism rate, accession rate and separation rate. In Public sector, absenteeism rate, accession rate and separation rate increased from 8.91 per cent, 7.96 per cent and 13.83 per cent in 2005-06 to 9.24 per cent, 12.96 per cent and 13.86 per cent respectively. Similarly, in the Joint Sector, absenteeism rate, accession rate and separation rate increased from 6.74 per cent, 9.31 per cent and 9.07 per cent in 2005-06 to 9.19 per cent, 9.69 per cent and 13.42 per cent respectively. However, in Private sector, increasing trend was seen only in absenteeism rate where it rose from 8.14 per cent in 2005-06 to 8.63 per cent in 2008-09. Both Accession and separation rates were on a decreasing trend from 19.59 per cent and 23.98 per cent in 2005-06 to 17.82 per cent and 17.13 per cent in 2008-09 in the private sector.
102
Table 6.1 Trend in Average Daily Employment in States by Category of Workers
Table 6.1 ---------------------------------------------------------------------- Sl. NIC Code/ Average Daily Employment No. State/Year ----------------------------------------------- Directly Employed Workers Contract All All ---------------- Workers Workers Employees Men Women ---------------------------------------------------------------------- 1 2 3 4 5 6 7 ----------------------------------------------------------------------
Table 6.1 ---------------------------------------------------------------------- Sl. NIC Code/ Average Daily Employment No. State/Year ----------------------------------------------- Directly Employed Workers Contract All All ---------------- Workers Workers Employees Men Women ---------------------------------------------------------------------- 1 2 3 4 5 6 7 ----------------------------------------------------------------------
Table 6.1 ---------------------------------------------------------------------- Sl. NIC Code/ Average Daily Employment No. State/Year ----------------------------------------------- Directly Employed Workers Contract All All ---------------- Workers Workers Employees Men Women ---------------------------------------------------------------------- 1 2 3 4 5 6 7 ----------------------------------------------------------------------
Table 6.1 ---------------------------------------------------------------------- Sl. NIC Code/ Average Daily Employment No. State/Year ----------------------------------------------- Directly Employed Workers Contract All All ---------------- Workers Workers Employees Men Women ---------------------------------------------------------------------- 1 2 3 4 5 6 7 ----------------------------------------------------------------------
Table 6.2 -------------------------------------------------------------------------------- Sl. NIC Code/State Year Average Labour Cost per Manday Worked on No. ----------------------------------------------- Wages/ Bonus Provident Welfare Overall Salaries Fund Expenses -------------------------------------------------------------------------------- 1 2 3 4 5 6 7 8 --------------------------------------------------------------------------------
Table 6.2 -------------------------------------------------------------------------------- Sl. NIC Code/State Year Average Labour Cost per Manday Worked on No. ----------------------------------------------- Wages/ Bonus Provident Welfare Overall Salaries Fund Expenses -------------------------------------------------------------------------------- 1 2 3 4 5 6 7 8 --------------------------------------------------------------------------------
Table 6.2 -------------------------------------------------------------------------------- Sl. NIC Code/State Year Average Labour Cost per Manday Worked on No. ----------------------------------------------- Wages/ Bonus Provident Welfare Overall Salaries Fund Expenses -------------------------------------------------------------------------------- 1 2 3 4 5 6 7 8 --------------------------------------------------------------------------------
Table 6.3 ---------------------------------------------------------------------- Sl. NIC Code/ Wages/Salaries per Manday Worked (in Rs.) No. State/Year ----------------------------------------------- Directly Employed Workers Contract All All ---------------- Workers Workers Employees Men Women ---------------------------------------------------------------------- 1 2 3 4 5 6 7 ----------------------------------------------------------------------
Table 6.3 ---------------------------------------------------------------------- Sl. NIC Code/ Wages/Salaries per Manday Worked (in Rs.) No. State/Year ----------------------------------------------- Directly Employed Workers Contract All All ---------------- Workers Workers Employees Men Women ---------------------------------------------------------------------- 1 2 3 4 5 6 7 ----------------------------------------------------------------------
Table 6.3 ---------------------------------------------------------------------- Sl. NIC Code/ Wages/Salaries per Manday Worked (in Rs.) No. State/Year ----------------------------------------------- Directly Employed Workers Contract All All ---------------- Workers Workers Employees Men Women ---------------------------------------------------------------------- 1 2 3 4 5 6 7 ----------------------------------------------------------------------
Table 6.3 ---------------------------------------------------------------------- Sl. NIC Code/ Wages/Salaries per Manday Worked (in Rs.) No. State/Year ----------------------------------------------- Directly Employed Workers Contract All All ---------------- Workers Workers Employees Men Women ---------------------------------------------------------------------- 1 2 3 4 5 6 7 ----------------------------------------------------------------------
Table 6.4 -------------------------------------------------------------------------------- Sl. NIC Code/State Year Labour Cost Wages/Salaries Percentage of No. per Manday per Manday Labour Cost Worked Worked to Total Cost (Rs.) (Rs.) of Production -------------------------------------------------------------------------------- 1 2 3 4 5 6 --------------------------------------------------------------------------------
Table 6.4 -------------------------------------------------------------------------------- Sl. NIC Code/State Year Labour Cost Wages/Salaries Percentage of No. per Manday per Manday Labour Cost Worked Worked to Total Cost (Rs.) (Rs.) of Production -------------------------------------------------------------------------------- 1 2 3 4 5 6 --------------------------------------------------------------------------------
Table 6.4 -------------------------------------------------------------------------------- Sl. NIC Code/State Year Labour Cost Wages/Salaries Percentage of No. per Manday per Manday Labour Cost Worked Worked to Total Cost (Rs.) (Rs.) of Production -------------------------------------------------------------------------------- 1 2 3 4 5 6 --------------------------------------------------------------------------------
Table 6.5 ------------------------------------------------------------------------------- Sl. NIC Code/ Number Percentage of Percentage of Factories No. State/Year of Factories Paying or Incurring Reporting Employing Expenses on Factories --------------------------- Contract Bonus PF and Welfare Workers Others Funds ------------------------------------------------------------------------------- 1 2 3 4 6 7 8 -------------------------------------------------------------------------------
Table 6.5 ------------------------------------------------------------------------------- Sl. NIC Code/ Number Percentage of Percentage of Factories No. State/Year of Factories Paying or Incurring Reporting Employing Expenses on Factories --------------------------- Contract Bonus PF and Welfare Workers Others Funds ------------------------------------------------------------------------------- 1 2 3 4 6 7 8 -------------------------------------------------------------------------------
Table 6.5 ------------------------------------------------------------------------------- Sl. NIC Code/ Number Percentage of Percentage of Factories No. State/Year of Factories Paying or Incurring Reporting Employing Expenses on Factories --------------------------- Contract Bonus PF and Welfare Workers Others Funds ------------------------------------------------------------------------------- 1 2 3 4 6 7 8 -------------------------------------------------------------------------------
Table 6.5 ------------------------------------------------------------------------------- Sl. NIC Code/ Number Percentage of Percentage of Factories No. State/Year of Factories Paying or Incurring Reporting Employing Expenses on Factories --------------------------- Contract Bonus PF and Welfare Workers Others Funds ------------------------------------------------------------------------------- 1 2 3 4 6 7 8 -------------------------------------------------------------------------------
Table 6.6 -------------------------------------------------------------------------------- Sl. NIC Code/State Year Percentage Percentage of Labour Turnover No. of ----------------------------- Absenteeism Accession Separation -------------------------------------------------------------------------------- 1 2 3 4 5 6 --------------------------------------------------------------------------------
Table 6.6 -------------------------------------------------------------------------------- Sl. NIC Code/State Year Percentage Percentage of Labour Turnover No. of ----------------------------- Absenteeism Accession Separation -------------------------------------------------------------------------------- 1 2 3 4 5 6 --------------------------------------------------------------------------------
Table 6.6 -------------------------------------------------------------------------------- Sl. NIC Code/State Year Percentage Percentage of Labour Turnover No. of ----------------------------- Absenteeism Accession Separation -------------------------------------------------------------------------------- 1 2 3 4 5 6 --------------------------------------------------------------------------------
Government of India Ministry of Statistics & Programme Implementation
Return under rules 3 and 4 of the Collection of Statistics(Central Rules), 1959 Annual Survey of Industries 2008-09 (Part-I)
(Please read the instructions before filling the return) A.Identification Particulars (for official use)
B. Particulars of the Factory (to be filled by owner of the factory)
1. Schedule Despatch No. 1. Name & address of the industrial undertaking
Vill/Town: District: State: PIN Code:
2. PSL No. 2 Type of organisation(code)
3. Scheme Code (Census-1, Sample-2) 4. Industry Code as per frame (4-digit level of NIC-2008)
3. Type of ownership(code)
5. Industry Code as per Return (5-digit level of NIC-2008)
6. Description of Industry
4. If code is 4 or 5 in item 2 and code 6 in item 3, how many total number of units the company has
7. State Code 5. Original Value of investment in P & M (range codes) 8. District Code 6. Whether the unit has ISO certification, 14000 series (yes-
1, no-2)
9. Sector Code(Rural-1, Urban-2) 7. Year of initial Production 10. RO/SRO Code
8. Accounting year (---- to ----) 9. Number of months of operation 10. Does your unit have computerized accounting system? (Yes-1,
No-2)
11. No. of Units 11. Can you supply ASI data in computer media? (Yes-1, No-2) 12. Status of Unit(code) 12. Detail of
contact person Name & designation of contact person
Tele (with STD code): Fax No.: E-mail :
* Less than equal to one crore-1, more than one crore but less than or equal to 5 crore-2, more than 5 crore but less than or equal to 10 crore-3, more than 10 crore-4.
DECLARATION
I hereby declare that information furnished in this return is correct and complete to the best of my knowledge and belief. Date: Place: (Name and Signature of owner with stamp)
130
BLOCK E: EMPLOYMENT AND LABOUR COST SL No./PSL No. ____________
Sl. No.
Category of staff
Man-days worked Average Number of Persons worked
No. of Mandays paid
for
Wages/ salaries (in Rs.)
Manufac-turing
Non Manufac-turing
Total
1 2 3 4 5 6 7 8 1 Male Workers
employed directly
2 Female Workers employed directly
3 Sub-Total(1+2) 4 Workers employed
through contractors
5 Total Workers (3+4)
6 Supervisory & managerial staff
7 Other employees
8 Unpaid family members/ proprietor/ Coop. members
9 Total employees (6+7+8+9)
10 Bonus (in Rs) 11 Contribution to
Provident Fund and Other funds(in Rs)
12 Workmen & Staff welfare expenses
13 Number of working Days
i. Manufacturing days ii. Non-maufacturing days iii. Total (i+ii)
14 Entry in Col. 8 of item 9, 10, 11& 12 of Bl.E (+) entry in Col. 3 of item 7,8,9 & 10 of Bl. F(+) entry in Col. 6 of item 23 of Bl. H(+) entry in Col. 6 of item 7 of Bl. I
131
CONFIDENTIAL
ANNUAL SURVEY OF INDUSTRIES 2008-09 PART-II MANDAYS WORKED, ABSENTEEISM & LABOUR TURNOVER
Block 1 - Identification and other Particulars 1. Schedule Despatch No. 10. Type of Organisation
(code) 16. Signature
2. Permanent Sl. No. 11. Type ownership (code) 17. Name of Supdt.
3. Scheme Code (Census-1, Sample-2)
4. Industry Code as per Frame (4-digit level of NIC-2008)
12. Accounting Year 18. Personnel Code
5. Industry Code as per Return (5-digit level of NIC-2008)
13. Name of Asstt. Supdt.
6. Description of Industry
19. Head Quarters
14. Personnel Code
7. State Code
8. District Code 15. Head Quarter 20. Signature
9. RO/SRO Code
Name and address of the Industrial Undertaking
City/Town/Village Tehsil/Taluk District State
Block-2 Mandays worked, absenteeism, labour turnover for regular workers
directly employed for each month of the year Sl. No.
Month Scheduled Working days for Workers
No. of Mandays Worked
No. of Mandays lost due to absence
No. of Workers in Employment
on
Accession during
the month
Separation during the month due to
First day of month
Last day of month
Death or Retirement
Other causes
0 1 2 3 4 5 6 7 8 9
1 Jan, 2008
2 Feb, 2008
3 Mar, 2008
4 Apr, 2008
5 May, 2008
6 Jun, 2008
7 Jul, 2008
8 Aug, 2008
9 Sep, 2008
10 Oct, 2008
11 Nov, 2008
12 Dec, 2008
132
ANNEXURE-II
NATIONAL INDUSTRIAL CLASSIFICATION-2008 GROUP CLASS DESCRIPTIONS
SECTION A: AGRICULTURE, HUNTING AND FORESTRY
DIVISION 01: AGRICULTURE, HUNTING AND RELATED SERVICE ACTIVITIES
016
0161 0162 0163 0164
Support activities to agriculture and post-harvest crop activities Support activities for crop production. Support activities for animal production. Post harvest crop activities Seed processing for propogation
SECTION C: MINING AND QUARRYING
DIVISION 14: OTHER MINING AND QUARRYING
089 Mining and quarrying, n.e.c. 0891 Mining of chemical and fertilizer minerals 0893 Extraction of salt 099
0899 0990
Other mining and quarrying n.e.c. Support activities for other mining and quarrying. Support activities for other mining and quarrying.
SECTION D: MANUFACTURING
DIVISION 15: MANUFACTURE OF FOOD PRODUCTS AND BEVERAGES
101
102
1010
1020
Processing and preservation of meat. Processing and preservation of meat. Processing and preserving of fish, crustaceans and molluscs and products thereof. Processing and preserving of fish, crustaceans and molluscs and products thereof.
103 Processing and preserving of fruit and vegetables.
1030 Manufacture of vegetable and animal oils and fats.
104 Manufacture of vegetable and animal oils and fats. 1040 Manufacture of vegetable and animal oils and fats.
105 Manufacture of dairy products.
1050 Manufacture of dairy products.
106 Manufacture of grain mill products, starches and starch products. 1061 Manufacture of grain mill products.
133
GROUP CLASS DESCRIPTIONS
107 Manufacture of other food products. 1071 Manufacture of bakery products. 1072 Manufacture of sugar. 1073 Manufacture of Cocoa, Chocolate and sugar confectionery.
1074 Manufacture of macaroni, noodles, couscous and similar farinaceous products.
1075 Manufacture of prepared meal and dishes. 1079 Manufacture of other food products n.e.c.
108
Manufacture of prepared animal feeds. 1080 Manufacture of prepared animal feeds.
110
1101 Manufacture of beverages. Distilling, rectifying and blending of spirits, ethyl alcohol
1102
Production from fermented materials. Manufacture of wines.
1103 Manufacture of malt liquors and malt.
1104 Manufacture of soft drinks; production of mineral waters and other bottled waters.
120 Manufacture of tobacco products.
1200 Manufacture of tobacco products. 131 Spinning, weaving and finishing of textiles.
1311 Preparation and spinning of textile fibres. 1312 Weaving of textiles. 1313 Finishing of textiles. 139 Manufacture of other textiles. 1391 Manufacture of knitted and crocheted fabrics. 1392 Manufacture of made-up textile articles, except apparel. 1393 Manufacture of carpets and rugs. 1394 Manufacture of cordage, rope, twine and netting. 1399 Manufacture of other textiles n.e.c
141 Manufacture of wearing apparel, except fur apparel. 1410 Manufacture of wearing apparel, except fur apparel. 142 Manufacture of articles of fur.
1420 Manufacture of articles of fur. 143 Manufacture of knitted and crocheted apparel.
1430 Manufacture of knitted and crocheted apparel. 151
Tanning and dressing of leather; Manufacture of luggage, handbags, saddlery and harness; dressing and dyeing of fur.
1511
Tanning and dressing of leather; dressing and dyeing of fur.
1512
Manufacture of luggage, handbags and the like saddlery and harness.
152 Manufacture of footwear. 1520 Manufacture of footwear. 161 Saw milling and planing of wood.
1610 Saw milling and planing of wood. 162
Manufacture of products of wood, cork, straw and plaiting materials.
1621 Manufacture of veneer sheets; manufacture of Plywood, Laminboard, particle board and other panels and board.
1622 Manufacture of builders’ carpentry and joinery.
134
1623 Manufacture of wooden containers.
1629 Manufacture of other products of wood; manufacture of articles of cork, straw and plaiting materials.
170 Manufacture of paper and paper products. 1701 Manufacture of pulp, paper and paper board.
1702 Manufacture of corrugated paper and paperboard and containers of paper and paperboard.
1709 Manufacture of other articles of paper and paper board. 181 Printing and service activities relating to printing.
1811 Printing. 1812 Service activities related to printing. 182 Reproduction of recorded media.
GROUP CLASS DESCRIPTIONS 1820 Reproduction of recorded media.
191 Manufacture of coke oven products. 1910 Manufacture of coke oven products. 192 Manufacture of refined petroleum products.
1920 Manufacture of refined petroleum products. 201
Manufacture of basic chemicals, fertilizer and nitrogen compounds, plastics and synthetic rubber in primary forms.
2011 Manufacture of basic chemicals. 2012 Manufacture of fertilizers and nitrogen compounds.
2013 Manufacture of plastics and synthetic rubber in primary forms.
202 Manufacture of other chemical products.
2021 Manufacture of pesticides and other agrochemical products.
2022
Manufacture of paints, varnishes and similar coatings, printing ink and mastics.
2023 Manufacture of soap and detergents, cleaning, polishing preparations, perfumes and Toilet preparations.
2029 Manufacture of other chemical products n.e.c. 203 Manufacture of man-made fibres.
2030 Manufacture of man-made fibres. 210
Manufacture of pharmaceuticals, medicinal chemical and botanical products.
2100
Manufacture of pharmaceuticals, medicinal chemical and botanical products.
221 Manufacture of rubber products.
2211 Manufacture of rubber tyres and tubes, retreading and rebuilding of rubber tyres.
222 Manufacture of plastic products. 2220 Manufacture of plastics products. 231 Manufacture of glass and glass products.
2310 Manufacture of glass and glass products. 239 Manufacture of non-metallic mineral products n.e.c.
2391 Manufacture of refractory products. 2392 Manufacture of clay building materials. 2393 Manufacture of other porcelain and ceramic products. 2394 Manufacture of cement, lime and plaster. 241 Manufacture of basic iron and steel.
2410 Manufacture of basic iron and steel. 242
Manufacture of basic precious and other non-ferrous metals.
2420
Manufacture of basic precious and other non-ferrous metals.
135
243 Casting of metals. 2431 Casting of iron and steel. 2432 Casting of non-ferrous metals. 251
Manufacture of structural metal products, tanks, reservoirs and steam generators.
2511 Manufacture of structural metal products. 2512 Manufacture of tanks reservoirs and containers of metal.
2513 Manufacture of steam generators, except central heating hot water.
252 Manufacture of weapons and ammunition 2520 Manufacture of weapons and ammunition.
GROUP CLASS DESCRIPTIONS
259
Manufacture of other fabricated metal products; metalworking service/ activities.
2591
Forging, pressing, stamping and roll-forming of metal, power metallurgy.
2592 Machining, treatment and coating of metals. 2593 Manufacture of cutlery, hand tools and general hardware. 2599 Manufacture of other fabricated metal product n.e.c. 261 Manufacture of electronic components.
2610 Manufacture of electronic components. 262 Manufacture of computers and peripheral equipment.
2620 Manufacture of computers and peripheral equipment. 263 Manufacture of communication equipment.
2630 Manufacture of communication equipment. 264 Manufacture of consumer electronics.
2640 Manufacture of consumer electronics. 265
Manufacture of measuring, testing, navigating and control equipment; watches & clocks.
2651
Manufacture of measuring, testing, navigating and control equipment.
266
Manufacture of irradiation, electro medical and electrotherapeutic equipment.
2660
Manufacture of irradiation, electro medical and electrotherapeutic equipment.
267 Manufacture of optical instruments and equipment. 2670 Manufacture of optical instruments and equipment. 268 Manufacture of magnetic and optical media.
2680 Manufacture of magnetic and optical media. 271
Manufacture of electric motors, generators, transformers and electricity distribution and control apparatus.
2710
Manufacture of electric motors, generators, transformers and electricity distribution and control apparatus.
272 Manufacture of batteries and accumulators. 2720 Manufacture of batteries and accumulators. 273 Manufacture of wiring and wiring devices.
2731
Manufacture of fibre optic cables for data transmission or live transmission of image.
2732 Manufacture of other electronic and electric wires and cables. 2733 Manufacture of wiring devices. 274 Manufacture of electric lighting equipment.
2740 Manufacture of electric lighting equipment. 275 Manufacture of domestic appliances.
2750 Manufacture of domestic appliances. 279 Manufacture of other electrical equipment.
2790 Manufacture of other electrical equipment.
136
281 Manufacture of general purpose machinery.
2811 Manufacture of engines and turbines, except aircraft, vehicle and cycle engines.
2812 Manufacture of fluid power equipment. 2813 Manufacture of mechanical transmission equipment. 2814 Manufacture of bearings, gears, gearing and driving elements. 2815 Manufacture of ovens, furnaces and furnace burners. 2816 Manufacture of lifting and handling equipment. 2817 Manufacture of office machinery and equipment. 2818 Manufacture of power-driven hand tools. 2819 Manufacture of other general-purpose machinery.
GROUP CLASS DESCRIPTIONS
282 Manufacture of special-purpose machinery.
2821 Manufacture of agricultural and forestry machinery. 2822 Manufacture of metal-forming machinery and machine tools.
2823 Manufacture of machinery for metallurgy. 2824 Manufacture of machinery for mining, quarrying and construction. 2825 Manufacture of machinery for food, beverage and tobacco processing. 2829 Manufacture of other special-purpose machinery. 291 Manufacture of motor vehicles.
2910 Manufacture of motor vehicles. 292
Manufacture of bodies (coach-work) for motor vehicles; manufacture of trailers and semi-trailers.
2920 Manufacture of bodies (coach-work) for motor vehicles. 293 Manufacture of parts and accessories for motor vehicles.
2930 Manufacture of parts and accessories for motor vehicles. 301 Building of ships and boats.
3011 Building of ships and floating structures. 3012 Building of pleasure and sporting boats. 302 Manufacture of railway locomotives and rolling stock.
3020 Manufacture of railway locomotives and rolling stock. 303 Manufacture of air and spacecraft and related machinery.
3030 Manufacture of air and spacecraft and related machinery. 304 Manufacture of weapons and ammunition.
3040 Manufacture of weapons and ammunition. 309 Manufacture of transport equipment n.e.c.
3091 Manufacture of motorcycles 3092 Manufacture of bicycles and invalid carriages. 3099 Manufacture of other transport equipment. 310 Manufacture of furniture 17
3100 Manufacture of furniture. 321 Manufacture of jewellery, bijouterie and related articles.
3211 Manufacture of jewellery, bijouterie and related articles. 3212 Manufacture of imitation jewellery and related articles. 322 Manufacture of musical instruments.
3220 Manufacture of musical instruments. 323 Manufacture of sports goods.
3230 Manufacture of sports goods. 324 Manufacture of games and toys.
3240 Manufacture of games and toys. 325 Manufacture of medical and dental instruments and supplies.
3250 Manufacture of medical and dental instruments and supplies. 329 Other manufacturing n.e.c.
3290 Other manufacturing n.e.c. 331 Repair of fabricated metal products, machinery and equipment.
3311 Repair of fabricated metal products.
137
3312 Repair of machinery. 3313 Repair of electronic and optical equipment. 3314 Repair of electrical equipment. 3315 Repair of transport equipment except motor vehicles. 3319 Repair of other equipment. 332 Installation of industrial machinery and equipment.
3320 Installation of industrial machinery and equipment. SECTION-D-ELECTRICITY, GAS, STEAM AND AIR CONDITION SUPPLY. 351 Electric power generation, transmission and distribution. 352 Manufacture of gas, distribution of gaseous fuels through mains. 3520 Manufacture of gas, distribution of gaseous fuels through mains. 353 Steam and air conditions supply. GROUP CLASS DESCRIPTIONS 3530 Steam and air conditions supply. SECTION-E-WATER SUPPLY, SEWARAGE, WASTE MANAGEMENT AND REMEDATION ACTIVITIES. 360 Water Collection, treatment and supply. 3600 Water Collection, treatment and supply. 383 Materials recovery. 3830 Materials recovery. Note: "n.e.c." stands for "Not Elsewhere Classified"
138
ANNEXURE-III List of Reports/Publications brought out by the Labour Bureau on
Annual Survey of Industries (ASI)
Year of Publication
Symbol No. Title of Report/Publication Price (Rs.)
1981 PDLB-212-III(NIC) Detailed State-wise Report on
Food, Beverage and Tobacco Industries, 1971, Vol. II (NIC)
156.00
PDLB-215-VI(NIC) Detailed State-wise Report on Rubber, Petroleum, Coal, Chemicals and Non-Metallic Mineral Products Industries, 1971, Vol. V (NIC)
206.00
1982 PDLB-227-1(I) 750-1982(DSK-II)
Labour Statistics under ASI, 1973-74, Summary Report, Vol.I, Part-I
14.00
1983 PDLB-213-III (NIC) Detailed State-wise Report on Textiles, Footwear, Wearing Apparel and made-up Textile Goods Industries, 1971, Vol.III(NIC)
136.00
PDLB-214-IV (NIC) Detailed State-wise Report on Wood, Cork, Furniture, Paper, Printing and Leather Industries, 1971, Vol.IV(NIC)
114.00
PDLB-215-VI (NIC) Detailed State-wise Report on Basic Metal and Machinery Manufacturing Industries, 1971, Vol.VI(NIC)
169.00
PDLB-217-VII (NIC) Detailed State-wise Report on Transport Equipment Manufacturing Industries, 1971, Vol.VII(NIC)
69.00
PDLB-218-VIII (NIC)
Detailed State-wise Report on Miscellaneous Industries, 1971, Vol. VIII(NIC)
ASI, 2004-05, Vol.I, Statistics on Employment and Labour Cost
160.00
PCSO.33.2004-2005(Detail)Vol.II 120-2007(DSK-III)
ASI, 2004-05, Vol.II, Report on Absenteeism, Labour Turnover, Employment and Labour Cost
150.00
2008 PDLB-633 (Vol.I) 120-2008(DSK-II)
ASI, 2005-06, Vol.I, Statistics on Employment and Labour Cost
160.00
PDLB-634 (Vol.II) 120-2008(DSK-II)
ASI, 2005-06, Vol.II, Statistics on Employment and Labour Cost
160.00
2009 PDLB-636 (Vol.I) 120-2010(DSK-II)
ASI, 2006-07, Vol.I, Statistics on Employment and Labour Cost
180.00
PDLB-636 (Vol.II) 120-2010(DSK-II)
ASI, 2006-07, Vol.II, Statistics on Employment and Labour Cost
180.00
2011 PDLB-641 (Vol.I)
120-2010(DSK-II)
PDLB-641 (Vol.II) 120-2010(DSK-II)
ASI, 2007-08, Vol.I, Statistics on Employment and Labour Cost ASI 2007-08, Vol.II, Report on Absenteeism, Labour Turnover, Employment and Labour Cost
190.00
190.00
144
2012 PDLB-649 (Vol.I) 120-2011(DSK-II)
PDLB-649 (Vol.II) 120-2011(DSK-II)
ASI, 2008-09, Vol.I, Statistics on Employment and Labour Cost ASI 2008-09, Vol.II, Report on Absenteeism, Labour Turnover, Employment and Labour Cost
210.00
190.00
NS = Not for Sale.
Priced publications can be obtained from the Controller of Publication, Civil Lines, Delhi-110054 by remitting the price in advance and by quoting the Symbol Number of the publication to facilitate its immediate delivery.
145
ANNEXURE-IV
LIST OF OFFICERS AND OFFICIALS ASSOCIATED WITH THE REPORT