Commission européenne/Europese Commissie, 1049 Bruxelles/Brussel, BELGIQUE/BELGIË - Tel. +32 22991111 Office: B232 6/29 - Tel. direct line +32 229-50201 EUROPEAN COMMISSION HEALTH AND CONSUMERS DIRECTORATE-GENERAL Consumer Affairs ENTERPRISE AND INDUSTRY DIRECTORATE-GENERAL Industrial policy and Economic analysis Functioning of the market for electric and electronic consumer goods Report based on findings of: • Study on "Comparing electric appliances prices across the European Community" by GfK Retail and Technology on behalf of the European Commission, Directorate General for Health and Consumers, 2009 • "Study on the Competitiveness of EU electrical and electronics goods markets with a focus on pricing and pricing strategies" by Ecorys on behalf of the European Commission, Directorate General for Enterprise and Industry, 2011 February 2012
Transcript
Commission européenne/Europese Commissie, 1049 Bruxelles/Brussel, BELGIQUE/BELGIË - Tel. +32 22991111 Office: B232 6/29 - Tel. direct line +32 229-50201
EUROPEAN COMMISSION HEALTH AND CONSUMERS DIRECTORATE-GENERAL Consumer Affairs ENTERPRISE AND INDUSTRY DIRECTORATE-GENERAL Industrial policy and Economic analysis
Functioning of the market for electric and electronic consumer goods
Report based on findings of:
• Study on "Comparing electric appliances prices across the European Community" by GfK Retail and Technology on behalf of the European Commission, Directorate General for Health and Consumers, 2009
• "Study on the Competitiveness of EU electrical and electronics goods markets with a focus on pricing and pricing strategies" by Ecorys on behalf of the European Commission, Directorate General for Enterprise and Industry, 2011
2. THE ROLE OF ELECTRICAL AND ELECTRONICS INDUSTRY ....................... 5
3. PRODUCTION OF ELECTRICAL AND ELECTRONIC GOODS.......................... 5 3.1. EU industrial competitiveness.............................................................................. 5 3.2. Electrical goods ................................................................................................. 6 3.3. Electronics ......................................................................................................... 7 3.4. Environmental regulations ................................................................................ 7
4. FUNCTIONING OF THE MARKET......................................................................... 8
5. IMPORTANCE OF THE MARKET FOR CONSUMERS ........................................ 9
6. FUNCTIONING OF THE SINGLE MARKET FOR THE ELECTRIC AND ELECTRONIC PRODUCTS FOR CONSUMERS .................................................. 11 6.1. Consumer satisfaction with the functioning of the market.............................. 11 6.2. Problems experienced by consumers............................................................... 16 6.3. Differences in consumption patterns between countries ................................. 17 6.4. Differences in price levels between countries ................................................. 20 6.5. Relation of prices to income............................................................................ 22 6.6. Choice of comparable products across countries ............................................ 23 6.7. Convergence of prices across countries .......................................................... 25 6.8. Link between prices and concentration in retail and production .................... 27
7. E-COMMERCE AND CROSS-BORDER SALES .................................................. 28 7.1. Choice of products online and offline ............................................................. 29 7.2. Comparison of prices for online and offline sales channels and impact
of online sales on price dispersion across countries........................................ 30 7.3. Pan-EU products and possible microeconomic gains for consumers.............. 31 7.4. Internet potential and functioning of websites selling consumer
8. SUSTAINABILITY .................................................................................................. 32 8.1. Energy efficiency information (online and offline) and regulatory
environment..................................................................................................... 32 8.2. Uptake of energy efficient products in the EU and across countries .............. 33 8.3. Relation between prices of particular energy classes and across
countries .......................................................................................................... 35 8.4. Role of online sales in the sales of appliances with higher energy
SUMMARY This text draws largely on the "Study on the Competitiveness of EU electrical and electronics goods markets with a focus on pricing and pricing strategies", which was finalized for DG Enterprise and Industry in early 2011. The Study on the Competitiveness is based on outcomes of the study on "Comparing electric appliances prices across the European Community" carried out on behalf of the Directorate General for Health and Consumers in 2009.
The scope of both studies and the additional analysis presented in this paper was price differences between countries, differences in consumer choice of products in national markets and also prices and availability of products in the Internet sales. They do not address other important issues such as enforcement of guarantees, provision of after sale services, cost of transport and delivery or the actual possibility for consumers to order goods from foreign online traders.
EU consumers are fairly satisfied with functioning of the markets for electric and electronic goods in terms of choice of products or retailers. Purchases of these products account for 1.7% of household expenditure (around € 400-500 per household in EU-27). Consumption patterns differ significantly across the EU. However, the average amount a consumer spends on a product is strongly correlated with the national average income.
The single market offers thousands of models to consumers but the actual offer and price range is very different across Member States. Consumers in some countries would be able to save up to 35% of the product price when buying products abroad. There is higher price convergence across countries where there is a higher share of pan-EU products (products that are broadly available across MS). Interestingly, a higher level of concentration of retailers is linked with a lower price level of electrical and electronic products. This could indicate the positive effects of economies of scale. However, in Denmark and Slovakia, retail concentration ratios and domestic price levels are both particularly high.
For product categories where the share of Internet as a sales channel is higher, the prices usually converge more across the EU. However, online sales are a small proportion of total sales. The vast majority of online sales are generated by products that are also present in traditional stores. When buying online in their country, consumers can pay on average some 5% less than offline. When consumers buy a pan-EU model online, they can save relatively more than when buying a local model.
Energy-labelling plays an important role in informing consumer purchases. The vast majority of refrigerators and washing machines sold represent a high energy efficiency class. At the same time, the share of sales of A+ products does not seem to be correlated with higher average income levels. Consumers pay up to 35% more for a refrigerator and up to 18% more for a washing machine with a higher energy class.
In terms of production, European firms are the leading global players in the electrical goods sector, with a stable revealed competitive advantage. EU value added in this sector increased between 2000 and 2008, in contrast to US and Japanese competitors. In the electronics goods sector, EU total output is lower than in both Japan and the US and EU output decreased between 2000 and 2008. Nevertheless, some of the countries that joined the EU recently have seen a steady increase in output in the electronics sector.
4
2. THE ROLE OF ELECTRICAL AND ELECTRONICS INDUSTRY
An analysis of consumer electronic and electrical goods was carried out in the Study on the Competitiveness of EU electrical and electronics goods markets with a focus on pricing and pricing strategies, which was finalized for DG Enterprise and Industry in early 2011.
Ten categories of consumer electronic and electrical goods have been analysed: the 4 first product categories belong to the electronics sector, whereas the other 6 would be categorized as electrical goods:
Electronic goods
• Flat screen televisions
• Digital cameras
• Media players
• PC notebooks
Electrical goods
• Refrigerators
• Washing machines
• Microwave ovens
• Vacuum cleaners
• Coffee makers
• Irons
The characteristics of those two sectors differ, not least as concerns product life cycles and replacement rates. The role of European industry is clearly different in the two sectors.
3. PRODUCTION OF ELECTRICAL AND ELECTRONIC GOODS
3.1. EU industrial competitiveness
The electrical and electronics goods industry is a major segment of the European economy, both in terms of production and retail sector. According to figures from 2008/2009 the employment in these sectors was over 4.3 Million, with a value added of more than 220 Billion €. EU exports amounted to over 210 Billion €. The picture is quite
different between the electrical and electronic goods sectors as concerns the role of EU
industry. EU industry has a strong position in the electrical goods sector, but less so in the sector for electronics goods.
5
Europe is the leading global player in the electrical goods sector. In contrast to US and Japanese competitors, EU value added in this sector increased between 2000 and 2008. In the electronics goods sector, however, EU total output is well behind both Japan and the US. Furthermore, European value added in the electronics sector decreased between 2000 and 2008. It may be noted that in terms of consumption, electronics products generally have higher sales per person (though more volatile), and higher growth predictions, than electrical goods.
A closer look at European comparative advantage indicates that at a global level EU Member States are the most important exporters for electrical and electronics goods combined (this includes intra EU trade). However, China has been catching up over the last decade, to reach the same level and may very soon overtake European exports in these sectors. In particular, an analysis of revealed comparative advantage1 shows that for the two sectors combined, Europe has a comparative disadvantage, whereas China, Japan and, in particular, South Korea have clear revealed comparative advantages.
When the electrical goods sector is studied separately, however, the EU has a stable revealed competitive advantage. The EU has a relatively weaker position for electronic goods.
As concerns individual Member States, Germany and Italy have the largest market shares in terms of production, with Poland having an increasingly strong position for electrical goods. The market share of producers for electrical home appliances is rather regionalized, with most national markets showing a preference for one or two, usually domestic or neighbouring, manufacturers.
3.2. Electrical goods
As in many other sectors, the supply and value chain in electrical goods has been characterized by globalisation in the last few decades. For the electrical goods sector, such international shifts are driven mainly by cost and market access factors. In this sector, EU companies still tend to keep the more innovative elements of the value chain in Europe, with manufacturing of the final product shifting abroad. With more specialisation, it is increasingly the case that some specialised components are only found outside Europe, often in clusters developing on the emerging markets.
In addition, some emerging markets have value chains forming that do not at all include European (or other Western) producers, a development often driven my consumer preferences for local brands. This is part of a very recent trend of emerging multinational enterprises. Nevertheless, there is a clear pattern that particular European manufacturers dominate specific regions, typically their home country and a neighbouring market. The degree of market concentration varies between countries.
The electrical goods sector is less spectacularly innovative than the electronics sector. This makes the product cycle considerably shorter in the electrical goods sector. Early replacement is more seldom due to new innovative functionality features, but may relate
1 Measured as the relative export share in a country's total exports divided by the relative share in the total
exports of the rest of the world.
6
to innovative energy efficiency aspects. Government subsidies in the form of rebates for replacements could have an effect on replacement rates for electrical goods.
3.3. Electronics
The electronics industry, on the other hand, has a less hierarchical, more flexible (and less stable) innovation chain, with more of a two-way creativity relationship between multinationals and global suppliers. The electronics sector - at least parts of it, such as computing and imaging devices – may be characterised as more innovative, with more rapid change in product functionality, than the electrical goods sector. In this industry, the relationships usually change depending on the needs of the individual product development cycles. Manufacturers come and go, depending on product development.
Electronics usually show higher sales per person than electrical goods. Growth is generally higher in this sector, which is largely due to high replacement rates emanating from short innovation cycles. In particular, according to predictions from Euromonitor growth is expected to be higher in the electronics industry than for electrical goods over the next few years.
Innovative and fast-developing products (such as electronic goods) often require a more flexible value-chain. This is influenced by factors such as maturity of products, degree of standardisation, appropriability (IPR framework), complementarity between products, and length of life-cycle.
OEMs (Original Equipment Manufacturers) tend to play a larger role in the electronics sector than in the sector for electrical goods. Hence, not only production, but also some development and design often takes place in another country, and the product is then rebranded.
The more dynamic nature of the electronics sector is reflected in clear differences in market concentration between different product categories of electronic products, with only major global players, such as Sony, present across more than one of the product categories. Market concentration by a few actors is therefore a more obvious feature of the electronics sector. In contrast to the electrical goods sector, energy efficiency is not a driver for electronics products. Factors such as functionality and degree of innovation are more important. In this context, avoiding competition between standards is an important factor.
In the electronics sector, rapid innovations have brought with them a trend of partnerships between manufacturers, and sharing brands on the same package. This is largely due to the multi-functionality of new products.
3.4. Environmental regulations
Energy-labelling plays an important role in informing consumer purchases. The EuP Directive (Eco-design for Energy using Products) provides for voluntary agreements on energy-efficiency of electronics and electrical products. It establishes a framework under which manufacturers of energy-using products will, already at the design stage, have to reduce the energy consumption and negative environmental impacts that occur during the product’s life cycle. Thus, the scope of the Directive is much wider than the WEEE or RoHS directives in that it requires eco-design to be an integral part of business practice and CE marking. The Directive is meant to be used in consistency with other EU policy tools such as labelling (Energy Label and Ecolabel), green public procurement and
7
targeted incentives to reach full effect. The effectiveness of the Ecodesign Directive and its implementing measures will be reviewed by the European Commission no later than 2012.
For electrical goods, environmental regulation and standards are also important drivers of consumer choice. In particular, products with a higher energy efficiency rating can be sold with a price premium. In addition to product safety regulations and standards, there are environmental regulations which have clear implications on the value chains. The major Eco-labelling tool for electronics goods is the Energy Star initiative, which has developed into a worldwide standard. For electrical goods, the ECO energy label is usually the benchmark for energy efficiency.
Other relevant environmental regulations include the WEEE Directive (Waste Electrical and Electronic Equipment, its recast is being currently discussed2), which means that producers are responsible for their products at the end of life. This may include recycling of some spare parts.
In addition, the RoHS Directive (Restriction of Hazardous Substances) restricts the use of mercury, lead and other hazardous substances in electrical and electronic devices. This is important for the value chain of production of electrical machinery products.
4. FUNCTIONING OF THE MARKET
The retail market decreased for both sectors around 2009, with the downturn setting in earlier in the sector for electrical goods, which decreased between 2007 and 2009. The electronics goods market turned did not turn negative until 2009.
The vast majority of sales is done in specialist retail stores, but the share of non-store retail increased over the period 2004-2009. This was particularly the case for electronics goods, where the share of non-store retail is higher, at around 10%. Of course, the majority of non-store retail is done over the Internet, which reached over 70% of non-store retail in 2009. As concerns grocery retail, its share is typically around 20% for electrical goods, and lower (around 10%) for electronics. The differences between Member states are considerable, with non-store sales channels representing around 1/3 of sales in the UK.
As to concentration on the retail market, there are clear differences between Member States. All in all, the retail market for the electrical and electronics sectors employ over half a Million people in the EU. Employment has remained fairly stable, though the number of retail companies decreased by almost 10% between 2004 and 2009.
Market concentration increased in most Member States over 2004-2009, together with the average scale of operations. It is not always multinational chains that have
2 Proposal for a Directive of the European Parliament and of the Council on waste electrical and electronic
contributed to increased concentration, but rather national or local retail chains in some Member States.
5. IMPORTANCE OF THE MARKET FOR CONSUMERS
The market for electric and electronic goods comprises numerous product categories, without which it would be hard to imagine the life of a contemporary EU consumer. Products range from appliances whose role is to facilitate the household maintenance (e.g. vacuum cleaners, irons, dishwashers or washing machines) and food storage or preparation of meals (refrigerators, freezers, microwave ovens, coffee machines or toasters) up to devices which are used for work or entertainment and leisure activities, such as PC notebooks, televisions, DVD players, cameras, media players or smart phones.
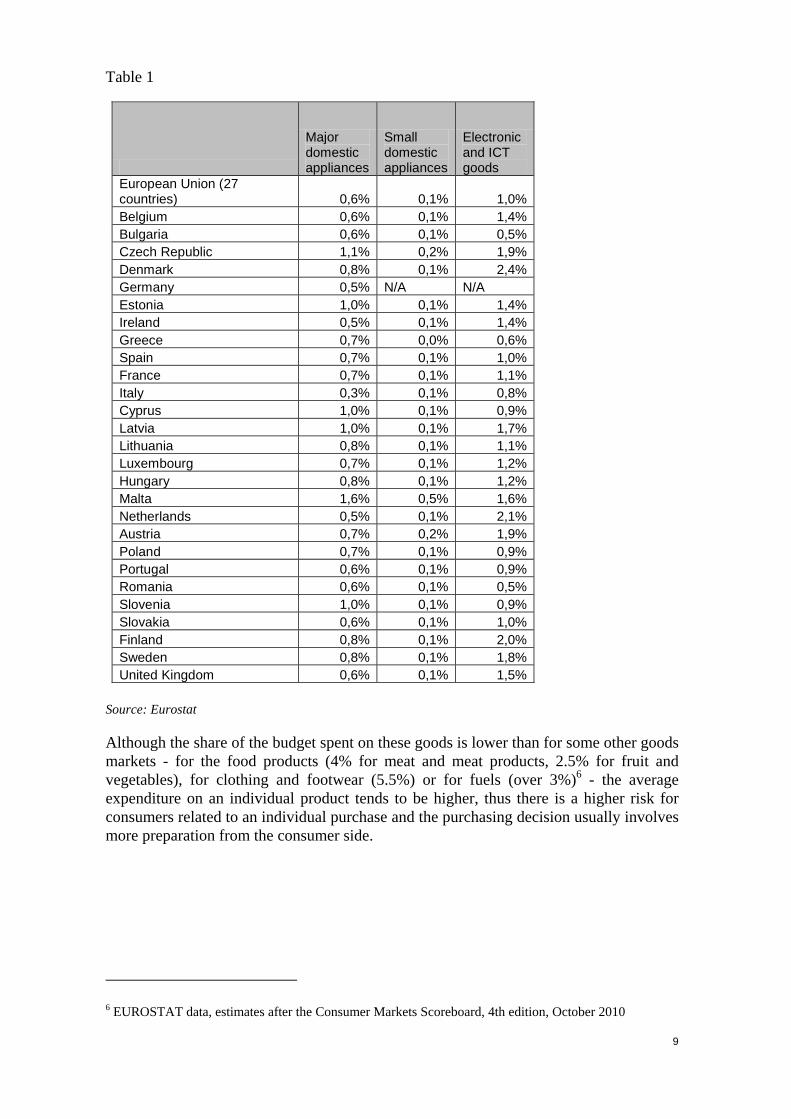
European households spend on average 1,7 % of their overall consumption on buying electric and electronic goods3. The shares differ for particular countries and for particular product markets. Usually, the share of household budget spent on large or small domestic appliances is slightly higher in the countries that joined the EU recently (EU124, e.g. Malta, the Czech Republic, Latvia, Estonia, Cyprus), whereas households in the other countries (EU155, e.g. Denmark, Finland, the Netherlands, Austria) tend to spend a higher proportion of their consumption on buying electronic and ICT goods. Table 1 presents the average shares of consumption spent on household appliances, electronic and ICT goods for the particular EU countries.
3 According to the COICOP classification, the following markets are taken into account: Large domestic
appliances (Electronic cookers Fridges and freezers Washing machines Tumble dryers Dishwashers Space heaters Fixed heaters Vaccum cleaners Microwave ovens Sewing machines Portable heating appliances Other), Electronic goods (non ICT/recreational, such as DVD players-recorders VCRs TVs CD HI-FI media players non-portable CD, HI-FI, media players portable Radios Cameras Video cameras Photographic equipment CDs (blank) DVDs (blank) Audio and video tapes (blank) Other), ICT goods (such as Information Communication Technology Goods (ICT) Personal computers Self-built computers Computer accessories Printers and scanners Games consoles Portable Games players Computer software Computer software upgrades Laptops, notebooks and tablet PCs, PDA's and smart phones Mobile phone devices Fixed phone devices Moderns Decoders Other) and Small domestic appliances (such as Small domestic household appliances Food-processing appliances Coffee machines Irons Toasters Grills Other). The EU average includes estimates for the Member States for which the data was not available.
Data for 2005
4 EU12: Bulgaria, the Czech Republic, Estonia, Cyprus, Latvia, Lithuania, Hungary, Malta, Poland, Romania, Slovakia, Slovenia,
5 EU15: Austria, Belgium, Denmark, Finland, France, Germany, Greece, Ireland, Italy, Luxemburg, Netherlands, Portugal, Spain, Sweden, the United Kingdom
Although the share of the budget spent on these goods is lower than for some other goods markets - for the food products (4% for meat and meat products, 2.5% for fruit and vegetables), for clothing and footwear (5.5%) or for fuels (over 3%)6 - the average expenditure on an individual product tends to be higher, thus there is a higher risk for consumers related to an individual purchase and the purchasing decision usually involves more preparation from the consumer side.
6 EUROSTAT data, estimates after the Consumer Markets Scoreboard, 4th edition, October 2010
10
6. FUNCTIONING OF THE SINGLE MARKET FOR THE ELECTRIC AND ELECTRONIC PRODUCTS FOR CONSUMERS
6.1. Consumer satisfaction with the functioning of the market
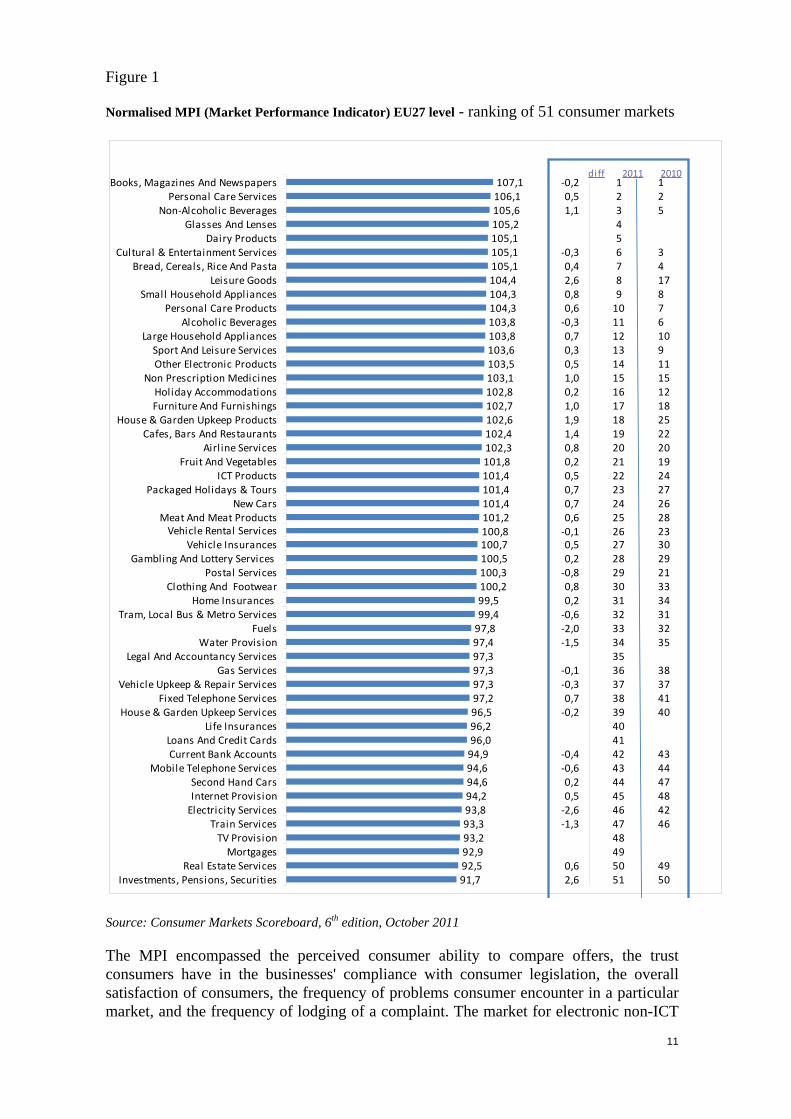
A recent Market Monitoring Survey, in which 51 consumer markets were evaluated by consumers and then ranked according to their Market Performance Indicator (MPI, a combined result based on replies to four key aspects) showed that the EU consumers are usually satisfied with the conditions they experience in the markets for the electric and electronic goods – Figure 1. Small and large domestic appliances markets received the highest scores (9th and 12th position in the ranking), the market for electronic goods such as DVDs, CDs, TVs, media players, cameras and other was placed 14th. The relatively worst result of the screening was achieved by the ICT goods market, which ranked 22nd of the 51 consumer markets7.
7 Consumer Markets Scoreboard, 6th edition, October 2011; data from the Market monitoring survey,
carried out in 2011 by GfK Belgium on behalf of the European Commission on a representative sample of consumers across 27 Member States, who had recent experience in a particular market.
Market definitions: Electronic goods (non ICT/recreational): DVD playersrecorders, VCRs, TVs, CD, HI-FI, media players, non- portable CD, HI-FI, media players, portable Radios, Cameras, Video cameras, Photographic equipment, CDs (blank), DVDs (blank), Audio and video tapes (blank), Other; Large domestic appliances: Electronic cookers, Fridges and freezers, Washing machines, Tumble dryers, Washer-dryers (combined), Dishwashers, Space heaters, Fixed heaters, Vaccum cleaners, Microwave ovens, Sewing machines, Portable heating appliances, Other; Small domestic appliances: Food-processing appliances, Coffee machines, Irons, Toasters, Grills, Other ICT goods: personal computers, Self-built computers, Computer accessories, Printers and scanners, Games consoles, Portable Games players, Computer software, Computer software upgrades, Laptops, notebooks and tablet PCs, PDA's and smart phones, Mobile phone devices, Fixed phone devices, Modems, Decoders, Other http://ec.europa.eu/consumers/consumer_research/editions/cms6_en.htm
House & Garden Upkeep ProductsFurniture And FurnishingsHoliday Accommodations
Non Prescription MedicinesOther Electronic ProductsSport And Leisure Services
Large Household AppliancesAlcoholic Beverages
Personal Care ProductsSmall Household Appliances
Leisure GoodsBread, Cereals, Rice And Pasta
Cultural & Entertainment ServicesDairy Products
Glasses And LensesNon-Alcoholic Beverages
Personal Care ServicesBooks, Magazines And Newspapers
di ff 2011 2010
Source: Consumer Markets Scoreboard, 6th edition, October 2011
The MPI encompassed the perceived consumer ability to compare offers, the trust consumers have in the businesses' compliance with consumer legislation, the overall satisfaction of consumers, the frequency of problems consumer encounter in a particular market, and the frequency of lodging of a complaint. The market for electronic non-ICT
12
goods was perceived slightly worse in terms of comparability of products (which can indicate the relative complexity of these products) and in the small household appliances market consumers tended to complain less even if they encountered a problem (which could be linked to a low relative cost of purchasing of such a product). The lower score of the ICT goods market in particular resulted from a higher number of generally dissatisfied consumers.
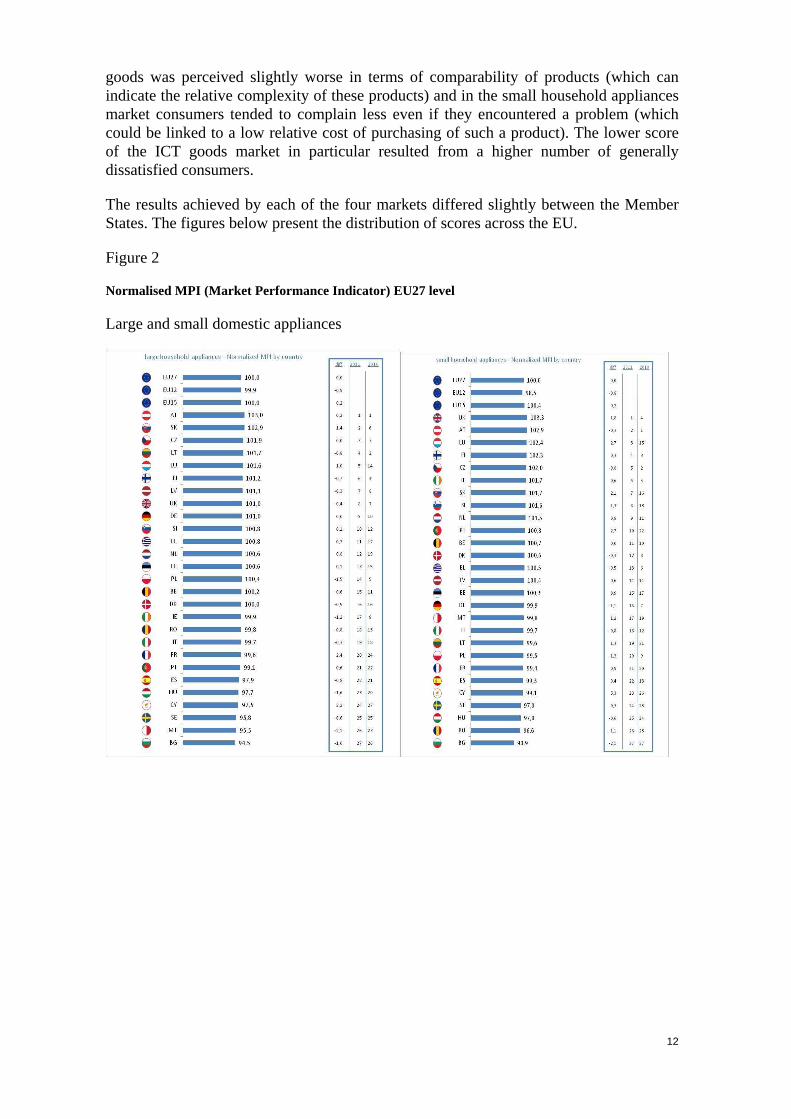
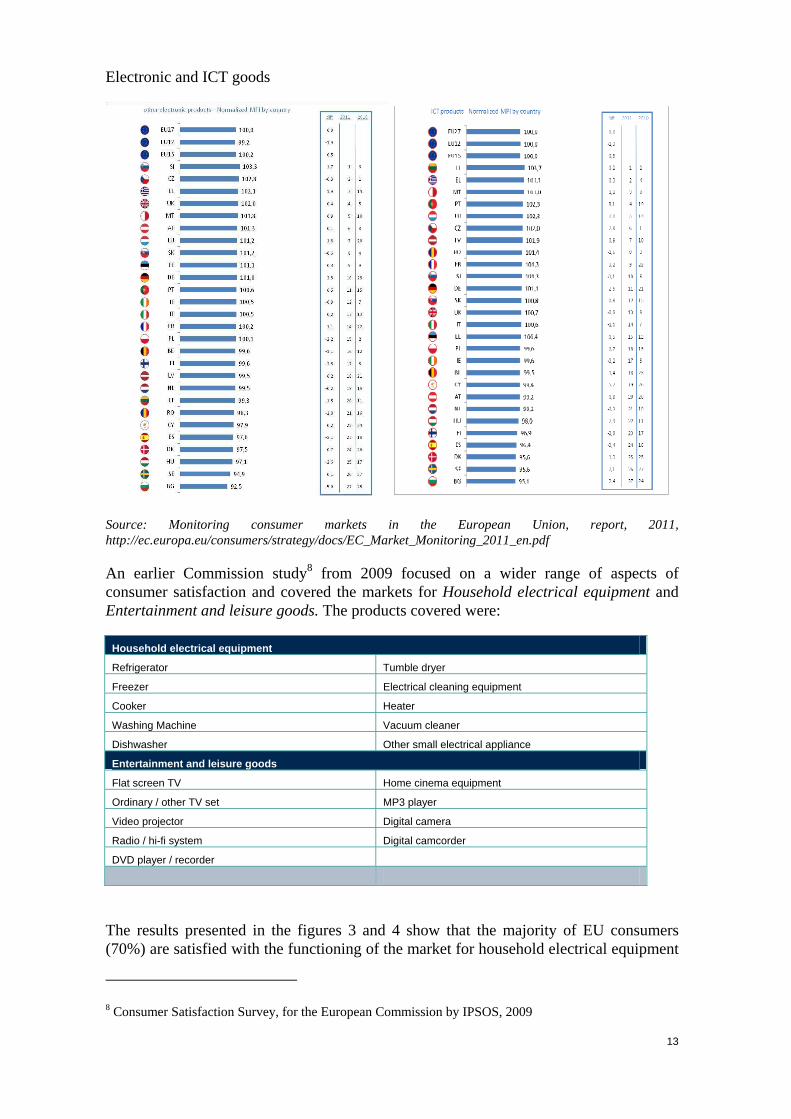
The results achieved by each of the four markets differed slightly between the Member States. The figures below present the distribution of scores across the EU.
Source: Monitoring consumer markets in the European Union, report, 2011, http://ec.europa.eu/consumers/strategy/docs/EC_Market_Monitoring_2011_en.pdf
An earlier Commission study8 from 2009 focused on a wider range of aspects of consumer satisfaction and covered the markets for Household electrical equipment and Entertainment and leisure goods. The products covered were:
Household electrical equipment
Refrigerator Tumble dryer
Freezer Electrical cleaning equipment
Cooker Heater
Washing Machine Vacuum cleaner
Dishwasher Other small electrical appliance
Entertainment and leisure goods
Flat screen TV Home cinema equipment
Ordinary / other TV set MP3 player
Video projector Digital camera
Radio / hi-fi system Digital camcorder
DVD player / recorder
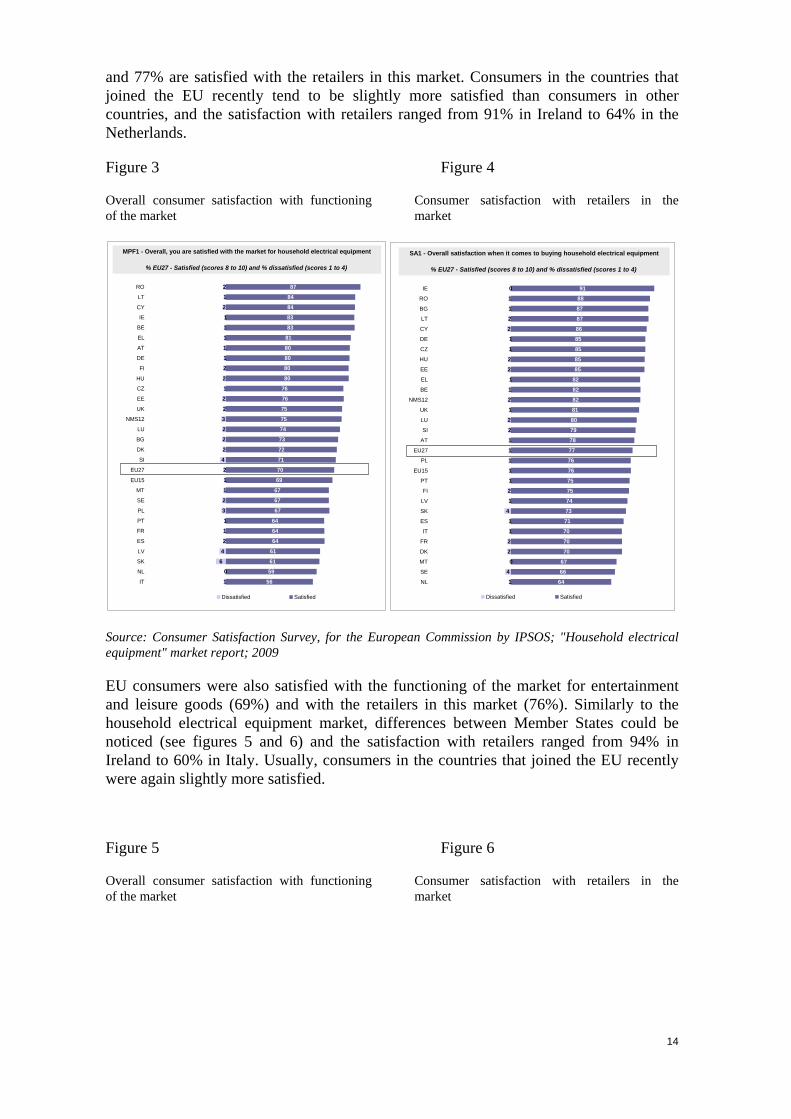
The results presented in the figures 3 and 4 show that the majority of EU consumers (70%) are satisfied with the functioning of the market for household electrical equipment
8 Consumer Satisfaction Survey, for the European Commission by IPSOS, 2009
14
and 77% are satisfied with the retailers in this market. Consumers in the countries that joined the EU recently tend to be slightly more satisfied than consumers in other countries, and the satisfaction with retailers ranged from 91% in Ireland to 64% in the Netherlands.
Figure 3 Figure 4
Overall consumer satisfaction with functioning of the market
Consumer satisfaction with retailers in the market
2
1
2
1
1
1
1
1
2
2
1
2
2
3
2
2
2
4
2
1
1
2
3
1
1
2
4
6
0
1
87
84
84
83
83
81
80
80
80
80
76
76
75
75
74
73
72
71
70
69
67
67
67
64
64
64
61
61
59
56
RO
LT
CY
IE
BE
EL
AT
DE
FI
HU
CZ
EE
UK
NMS12
LU
BG
DK
SI
EU27
EU15
MT
SE
PL
PT
FR
ES
LV
SK
NL
IT
Dissatisfied Satisfied
MPF1 - Overall, you are satisfied with the market for household electrical equipment
% EU27 - Satisfied (scores 8 to 10) and % dissatisfied (scores 1 to 4)
0
1
1
2
2
1
1
2
2
1
1
2
1
2
2
1
1
1
1
1
2
1
4
1
1
2
2
0
4
1
91
88
87
87
86
85
85
85
85
82
82
82
81
80
79
78
77
76
76
75
75
74
73
71
70
70
70
67
66
64
IE
RO
BG
LT
CY
DE
CZ
HU
EE
EL
BE
NMS12
UK
LU
SI
AT
EU27
PL
EU15
PT
FI
LV
SK
ES
IT
FR
DK
MT
SE
NL
Dissatisfied Satisfied
SA1 - Overall satisfaction when it comes to buying household electrical equipment
% EU27 - Satisfied (scores 8 to 10) and % dissatisfied (scores 1 to 4)
Source: Consumer Satisfaction Survey, for the European Commission by IPSOS; "Household electrical equipment" market report; 2009
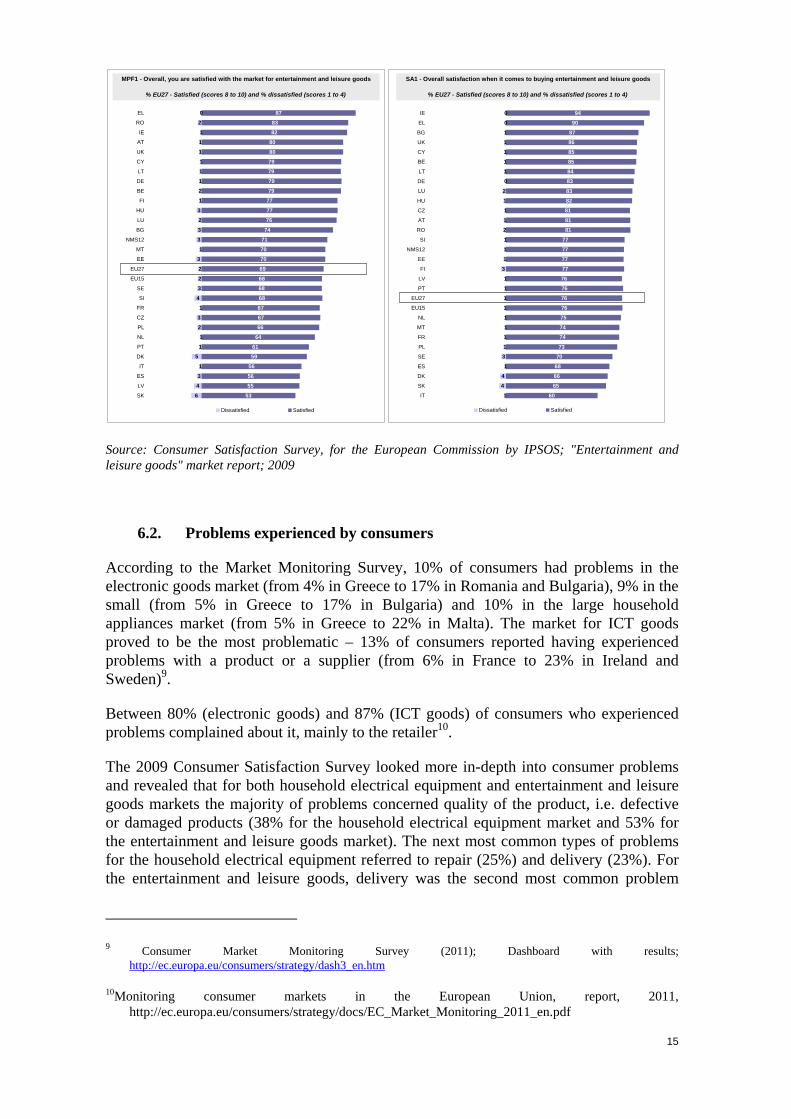
EU consumers were also satisfied with the functioning of the market for entertainment and leisure goods (69%) and with the retailers in this market (76%). Similarly to the household electrical equipment market, differences between Member States could be noticed (see figures 5 and 6) and the satisfaction with retailers ranged from 94% in Ireland to 60% in Italy. Usually, consumers in the countries that joined the EU recently were again slightly more satisfied.
Figure 5 Figure 6
Overall consumer satisfaction with functioning of the market
Consumer satisfaction with retailers in the market
15
0
2
1
1
1
1
1
1
2
1
3
2
3
3
1
3
2
2
3
4
1
3
2
1
1
5
1
3
4
6
87
83
82
80
80
79
79
79
79
77
77
76
74
71
70
70
69
68
68
68
67
67
66
64
61
59
56
56
55
53
EL
RO
IE
AT
UK
CY
LT
DE
BE
FI
HU
LU
BG
NMS12
MT
EE
EU27
EU15
SE
SI
FR
CZ
PL
NL
PT
DK
IT
ES
LV
SK
Dissatisfied Satisfied
MPF1 - Overall, you are satisfied with the market for entertainment and leisure goods
% EU27 - Satisfied (scores 8 to 10) and % dissatisfied (scores 1 to 4)
0
0
1
1
1
1
1
0
2
1
1
1
2
1
1
1
3
1
1
1
1
1
1
1
1
3
1
4
4
1
94
90
87
86
85
85
84
83
83
82
81
81
81
77
77
77
77
76
76
76
76
75
74
74
73
70
68
66
65
60
IE
EL
BG
UK
CY
BE
LT
DE
LU
HU
CZ
AT
RO
SI
NMS12
EE
FI
LV
PT
EU27
EU15
NL
MT
FR
PL
SE
ES
DK
SK
IT
Dissatisfied Satisfied
SA1 - Overall satisfaction when it comes to buying entertainment and leisure goods
% EU27 - Satisfied (scores 8 to 10) and % dissatisfied (scores 1 to 4)
Source: Consumer Satisfaction Survey, for the European Commission by IPSOS; "Entertainment and leisure goods" market report; 2009
6.2. Problems experienced by consumers
According to the Market Monitoring Survey, 10% of consumers had problems in the electronic goods market (from 4% in Greece to 17% in Romania and Bulgaria), 9% in the small (from 5% in Greece to 17% in Bulgaria) and 10% in the large household appliances market (from 5% in Greece to 22% in Malta). The market for ICT goods proved to be the most problematic – 13% of consumers reported having experienced problems with a product or a supplier (from 6% in France to 23% in Ireland and Sweden)9.
Between 80% (electronic goods) and 87% (ICT goods) of consumers who experienced problems complained about it, mainly to the retailer10.
The 2009 Consumer Satisfaction Survey looked more in-depth into consumer problems and revealed that for both household electrical equipment and entertainment and leisure goods markets the majority of problems concerned quality of the product, i.e. defective or damaged products (38% for the household electrical equipment market and 53% for the entertainment and leisure goods market). The next most common types of problems for the household electrical equipment referred to repair (25%) and delivery (23%). For the entertainment and leisure goods, delivery was the second most common problem
9 Consumer Market Monitoring Survey (2011); Dashboard with results;
(13%) and each of the following types: quality of the service, repairs and claims under guarantee, were reported by 10% of consumers11.
6.3. Differences in consumption patterns between countries
An analysis of prices of electric and electronic goods revealed significant differences in consumer preferences across the Member States. The "Study of the Competitiveness of the EU electrical and electronic goods markets with a focus on pricing and pricing strategies" looked into prices (excluding VAT) of over 91 thousand individual models which were sold in 21 Member States12 from March 2008 to February 2009. The data analysed covered 10 product categories: digital cameras, flat screen TVs, digital portable media players, refrigerators, microwave ovens, washing machines, coffee makers, irons, vacuum cleaners and mobile computers13. The products chosen for the analysis had to be comparable across countries and representative for the EU market. Due to product differentiation, only for digital cameras, flat screen TVs and digital portable media players was it possible to create a sample of individual comparable and representative products. For the other categories, the sample consisted of comparable and representative sub-categories (technical segments).
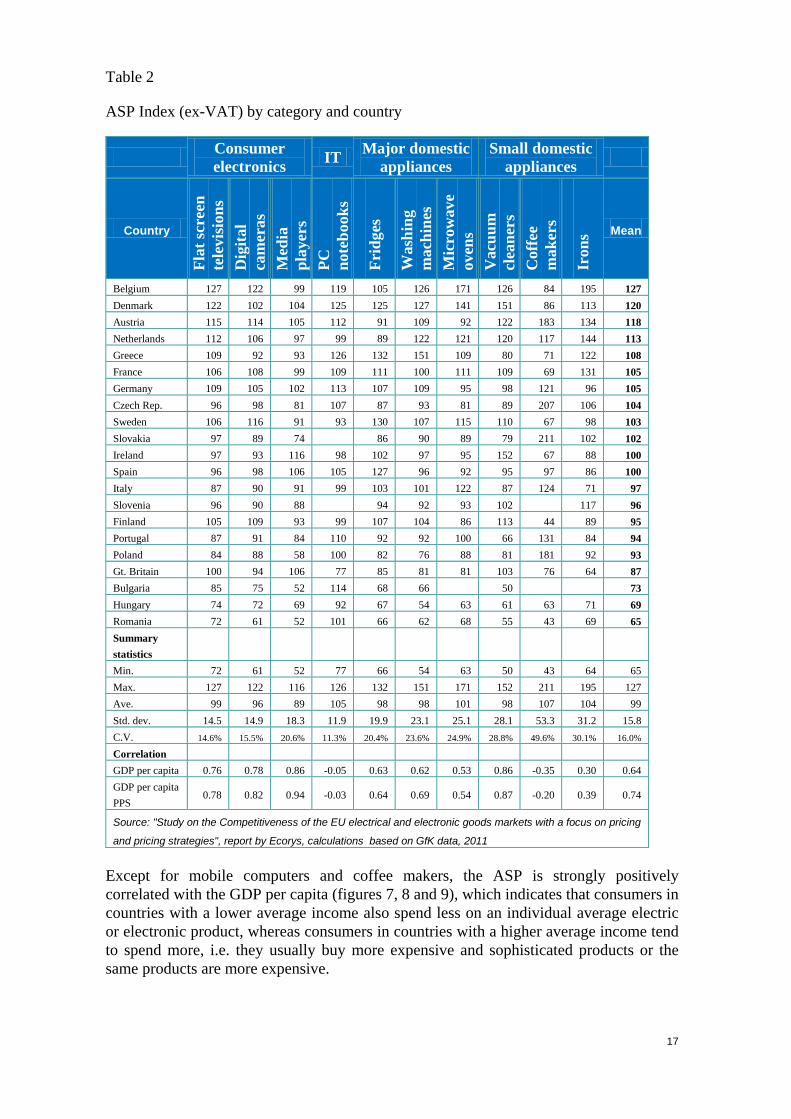
Average Selling Price is an indicator which reflects consumer preferences. It shows the average amount spent by consumers on a unit of a particular category in a country, thus reflecting the structure of sales for a product category in a country. The ASP Index presented in table 2 compares the ASP per category per country to the EU average (average for 21 MS). The index shows that, for example, consumers in Belgium spent 71% more on a microwave oven, or consumers in Poland spent 16% less on a flat screen TV than on average in the EU.
11 Consumer Satisfaction Survey, for the European Commission by IPSOS; "Household electrical equipment"
market report; 2009
Consumer Satisfaction Survey, for the European Commission by IPSOS; "Entertainment and leisure goods" market report; 2009
12 AT, BE, BG, CZ, DE, DK, EL, ES, FI, FR, HU, IE, IT, NL, PL, PT, RO, SE, SI, SK, UK
The number of countries was limited due to data availability in the syndicated tracking of retail channel sales, performed by the GfK Retail and Technology
13 The underlying data is based on an extract from the syndicated tracking of retail channel sales, performed by the GfK Retail and Technology
Source: "Study on the Competitiveness of the EU electrical and electronic goods markets with a focus on pricing
and pricing strategies", report by Ecorys, calculations based on GfK data, 2011
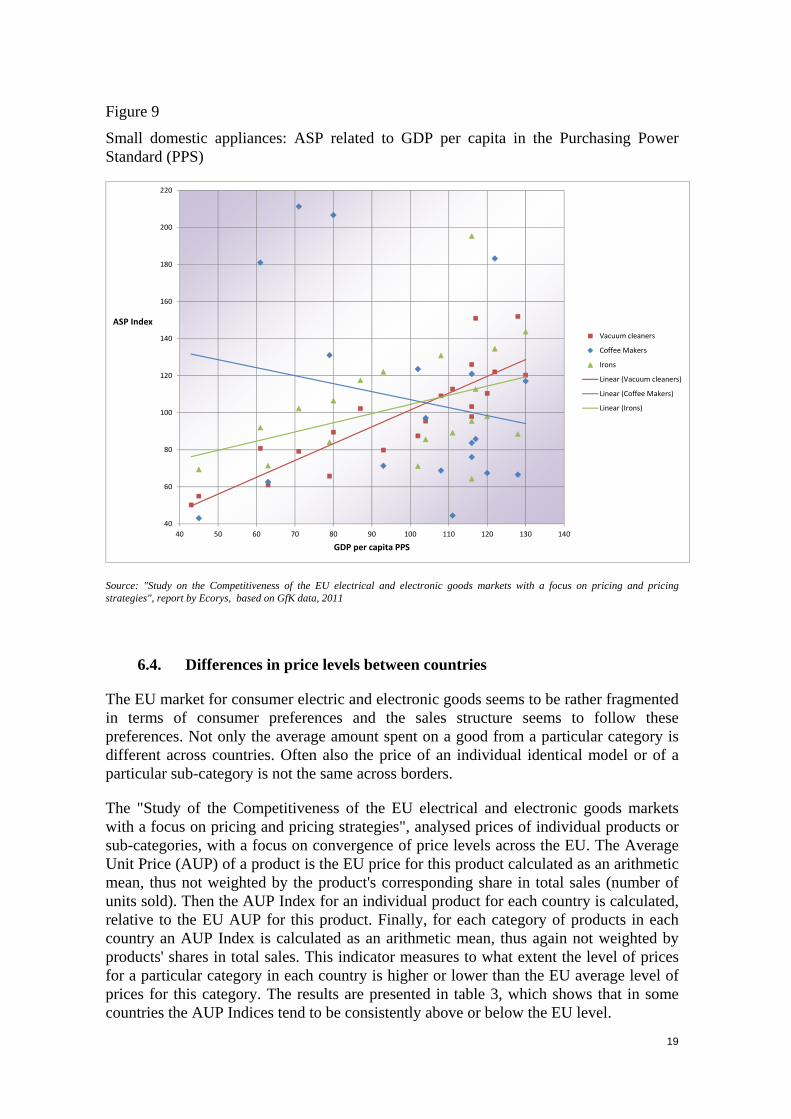
Except for mobile computers and coffee makers, the ASP is strongly positively correlated with the GDP per capita (figures 7, 8 and 9), which indicates that consumers in countries with a lower average income also spend less on an individual average electric or electronic product, whereas consumers in countries with a higher average income tend to spend more, i.e. they usually buy more expensive and sophisticated products or the same products are more expensive.
18
Figure 7
Consumer electronics and PCs: ASP related to GDP per capita in the Purchasing Power Standard (PPS)
40
50
60
70
80
90
100
110
120
130
140
40 50 60 70 80 90 100 110 120 130 140
ASP Index
GDP per capita PPS
Televisions
Digital Cameras
Media Players
PC Notebook
Linear (Televisions)
Linear (Digital Cameras)
Linear (Media Players)
Linear (PC Notebook)
Source: "Study on the Competitiveness of the EU electrical and electronic goods markets with a focus on pricing and pricing strategies", report by Ecorys, based on GfK data, 2011
Figure 8
Major domestic appliances: ASP related to GDP per capita in the Purchasing Power Standard (PPS)
40
60
80
100
120
140
160
180
40 50 60 70 80 90 100 110 120 130 140
ASP Index
GDP per capita PPS
Refrigerators
Washing Machines
Microwave Ovens
Linear (Refrigerators)
Linear (Washing Machines)
Linear (Microwave Ovens)
Source: "Study on the Competitiveness of the EU electrical and electronic goods markets with a focus on pricing and pricing strategies", report by Ecorys, based on GfK data, 2011
19
Figure 9
Small domestic appliances: ASP related to GDP per capita in the Purchasing Power Standard (PPS)
40
60
80
100
120
140
160
180
200
220
40 50 60 70 80 90 100 110 120 130 140
ASP Index
GDP per capita PPS
Vacuum cleaners
Coffee Makers
Irons
Linear (Vacuum cleaners)
Linear (Coffee Makers)
Linear (Irons)
Source: "Study on the Competitiveness of the EU electrical and electronic goods markets with a focus on pricing and pricing strategies", report by Ecorys, based on GfK data, 2011
6.4. Differences in price levels between countries
The EU market for consumer electric and electronic goods seems to be rather fragmented in terms of consumer preferences and the sales structure seems to follow these preferences. Not only the average amount spent on a good from a particular category is different across countries. Often also the price of an individual identical model or of a particular sub-category is not the same across borders.
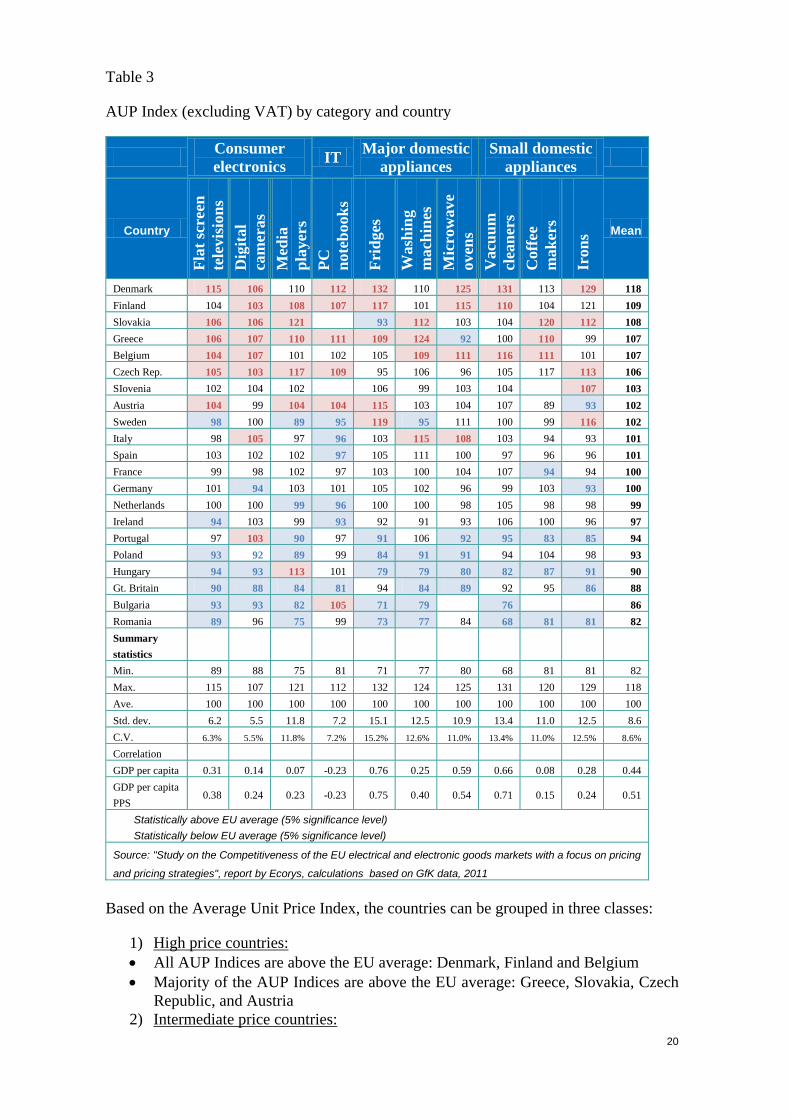
The "Study of the Competitiveness of the EU electrical and electronic goods markets with a focus on pricing and pricing strategies", analysed prices of individual products or sub-categories, with a focus on convergence of price levels across the EU. The Average Unit Price (AUP) of a product is the EU price for this product calculated as an arithmetic mean, thus not weighted by the product's corresponding share in total sales (number of units sold). Then the AUP Index for an individual product for each country is calculated, relative to the EU AUP for this product. Finally, for each category of products in each country an AUP Index is calculated as an arithmetic mean, thus again not weighted by products' shares in total sales. This indicator measures to what extent the level of prices for a particular category in each country is higher or lower than the EU average level of prices for this category. The results are presented in table 3, which shows that in some countries the AUP Indices tend to be consistently above or below the EU level.
Statistically above EU average (5% significance level) Statistically below EU average (5% significance level)
Source: "Study on the Competitiveness of the EU electrical and electronic goods markets with a focus on pricing
and pricing strategies", report by Ecorys, calculations based on GfK data, 2011
Based on the Average Unit Price Index, the countries can be grouped in three classes:
1) High price countries: • All AUP Indices are above the EU average: Denmark, Finland and Belgium • Majority of the AUP Indices are above the EU average: Greece, Slovakia, Czech
Republic, and Austria 2) Intermediate price countries:
21
• Majority of the AUP Indices are not statistically different from the EU average: France, Germany, Spain and the Netherlands
3) Low price countries: • All AUP Indices are below the EU average: the united Kingdom and Romania • Majority of the AUP Indices are below the EU average: Bulgaria, Hungary,
Poland and Portugal.
It is important to note that the results are not directly influenced by the size of the national markets as they are not weighted by the total sales in each country.
6.5. Relation of prices to income
The differences in national price levels (AUP) seem to be less correlated with income levels (measured in the GDP per capita) than the differences in the ASP levels (described in section 6.3). The strongest positive correlation can be observed for refrigerators, vacuum cleaners and microwave ovens. This means that the price levels in a particular country are not a simple outcome of the purchasing power of consumers in that country or, going further, of the underlying costs in a national market.
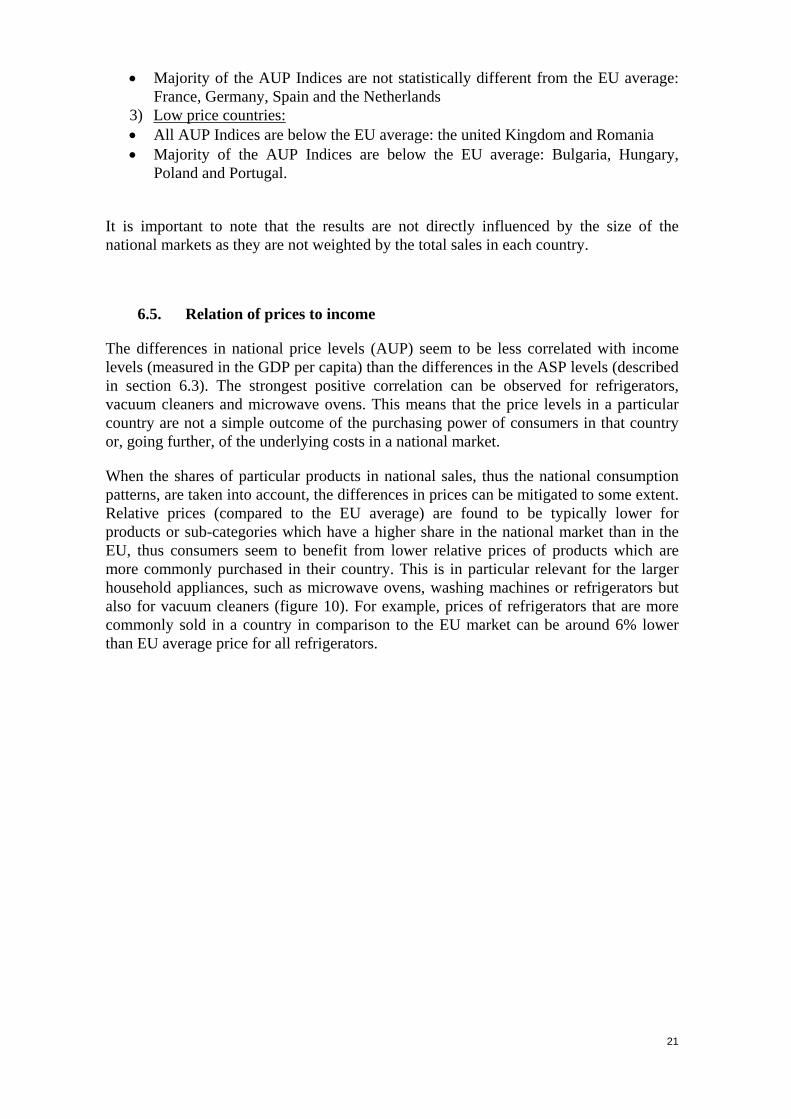
When the shares of particular products in national sales, thus the national consumption patterns, are taken into account, the differences in prices can be mitigated to some extent. Relative prices (compared to the EU average) are found to be typically lower for products or sub-categories which have a higher share in the national market than in the EU, thus consumers seem to benefit from lower relative prices of products which are more commonly purchased in their country. This is in particular relevant for the larger household appliances, such as microwave ovens, washing machines or refrigerators but also for vacuum cleaners (figure 10). For example, prices of refrigerators that are more commonly sold in a country in comparison to the EU market can be around 6% lower than EU average price for all refrigerators.
22
Figure 10
Average difference between AUP indices for high and low market share products (or sub-categories) compared to overall AUP index
Source: "Study on the Competitiveness of the EU electrical and electronic goods markets with a focus on pricing and pricing strategies", report by Ecorys, calculations based on GfK data, 2011
6.6. Choice of comparable products across countries
The 2009 Consumer Satisfaction Survey looked into consumer satisfaction with aspects of choice in household electrical equipment and entertainment and leisure goods. Consumers who bought household electrical equipment were more satisfied with choice of goods at different prices and different qualities, as well as with the retailers' offer of innovative products (respectively 71%, 71% and 72% for the EU27 average) than with choice of products that would be environment-friendly (59%). Consumers satisfaction with the choice in the entertainment and leisure goods market was similar: on the average around 70% of the EU consumers were satisfied with the choice of goods at different prices and different qualities, as well as with the choice of technologically advanced products, whereas 52% were satisfied with the retailers' offer of products produced in an environmentally friendly way. Typically, the choice of products was evaluated better by consumers in the countries that joined the EU recently. This could be explained by different experiences and expectations of consumers across the EU14.
The fact that the GfK data analysed in the Study on Competitiveness contained information on prices of 91 thousand individual models sold across Europe, including 21
thousand PC notebooks and 17 thousand refrigerators indicates itself the vast number of products offered by the EU market. Thus, actually, consumers might even be overwhelmed by this choice. The analysis of data also shows that the offer varies significantly between countries, which may suggest on one hand that producers or retailers try to respond to different national consumer preferences but on the other hand it contributes to the fragmentation of the Single Market. Also the consumer ability to compare products in such a complex market might be limited, which may indirectly lead to taking sub-optimal purchasing decisions or impede cross-border shopping. Although consumers were satisfied with their ability to compare prices and quality of products at a retailer (66%-72%), cross-border comparability of products was found much more problematic: almost 40% were dissatisfied and only around 20% said they could easily compare prices and quality of household appliances or entertainment and leisure goods between national and foreign retailers15.
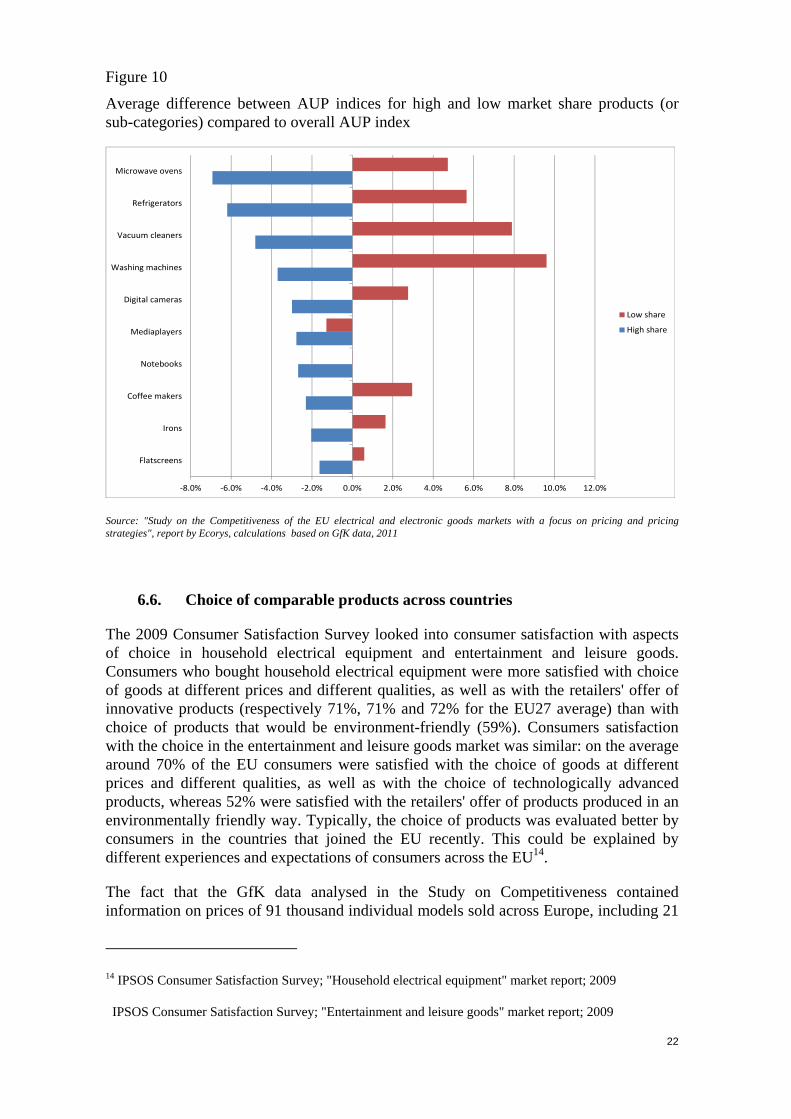
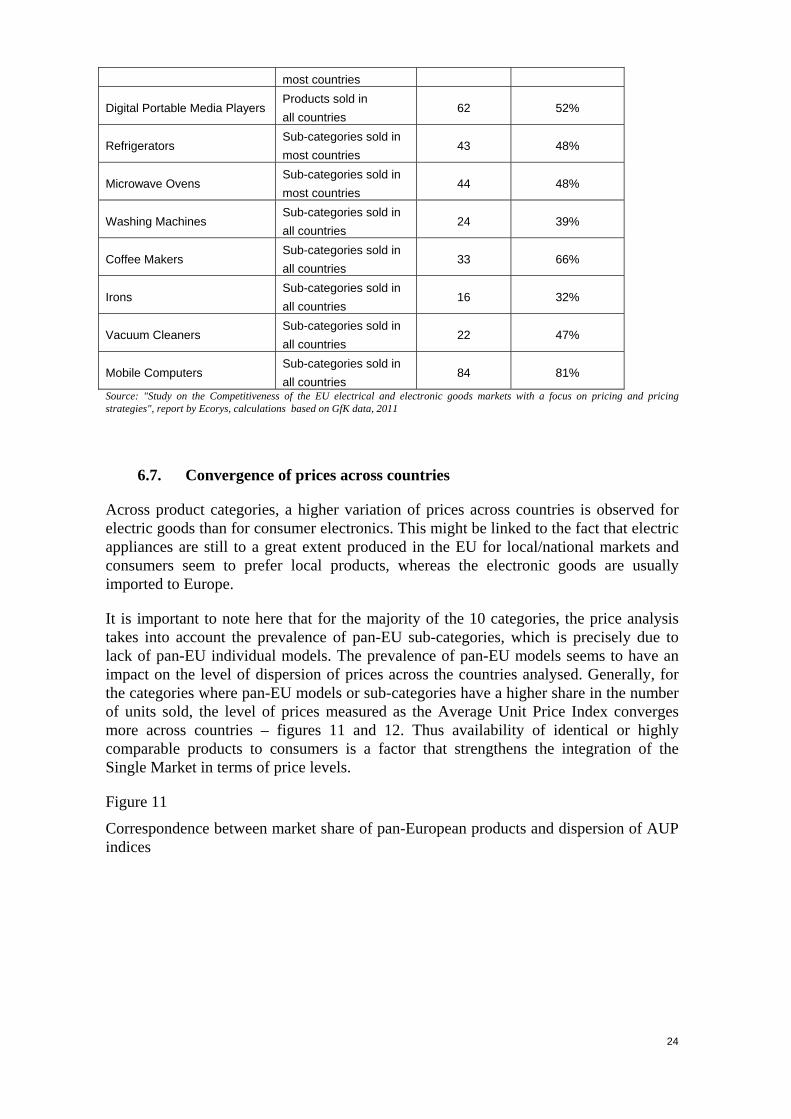
In order to find out to what extent comparable products are available to consumers across countries, the price analysis in the Study on Competitiveness looked into the occurrence of identical models across national markets. The results show that only for digital still cameras and portable media players was it possible to identify products that were sold in all 21 countries analysed (pan-EU products) and which accounted for 47% and 52% of units sold for these categories respectively – table 4. In the case of flat screen TVs it was possible to extract a sample of products that were sold in most of the countries analysed and which covered 36% of the units sold. For the other categories, it was impossible to construct a sample of products that would be identical across the countries and also representative for the EU market in terms of number of units sold. This already shows that the EU market is more fragmented for the electric than for the electronic goods, where still a substantial share of sales in generated by models available in all or most of the countries16. For the needs of the analysis, the categories where a sample of pan-EU products could not be extracted were divided into sub-categories (technical segments), which then could be compared across countries. The sub-categories comprise products that have specified technical characteristics.
Table 4
Overview of characteristics of representative products and sub-categories
Category Retained sample of representative products or sub-categories
Number of products or sub-categories retained
Share of the market covered by selection group (% of units sold)
Digital Still Cameras Products sold in all countries
111 47%
Flatscreen TVs Products sold in 256 36% 15 Ibidem
16 Based on the GfK data, digital cameras has the highest market share (79% of units sold) of models sold in all or most of the countries covered by the database; for portable media players the share is 59% and for flat screen televisions 36%. For large domestic appliances (refrigerators, washing machines and microwave ovens) the share models sold in all or most countries is less than 1% of units sold. For small domestic appliances (vacuum cleaners, irons and coffee makers) and notebook computers the shares are between 3% and 9%.
24
most countries
Digital Portable Media Players Products sold in all countries
62 52%
Refrigerators Sub-categories sold in most countries
43 48%
Microwave Ovens Sub-categories sold in most countries
44 48%
Washing Machines Sub-categories sold in all countries
24 39%
Coffee Makers Sub-categories sold in all countries
33 66%
Irons Sub-categories sold in all countries
16 32%
Vacuum Cleaners Sub-categories sold in all countries
22 47%
Mobile Computers Sub-categories sold in all countries
84 81%
Source: "Study on the Competitiveness of the EU electrical and electronic goods markets with a focus on pricing and pricing strategies", report by Ecorys, calculations based on GfK data, 2011
6.7. Convergence of prices across countries
Across product categories, a higher variation of prices across countries is observed for electric goods than for consumer electronics. This might be linked to the fact that electric appliances are still to a great extent produced in the EU for local/national markets and consumers seem to prefer local products, whereas the electronic goods are usually imported to Europe.
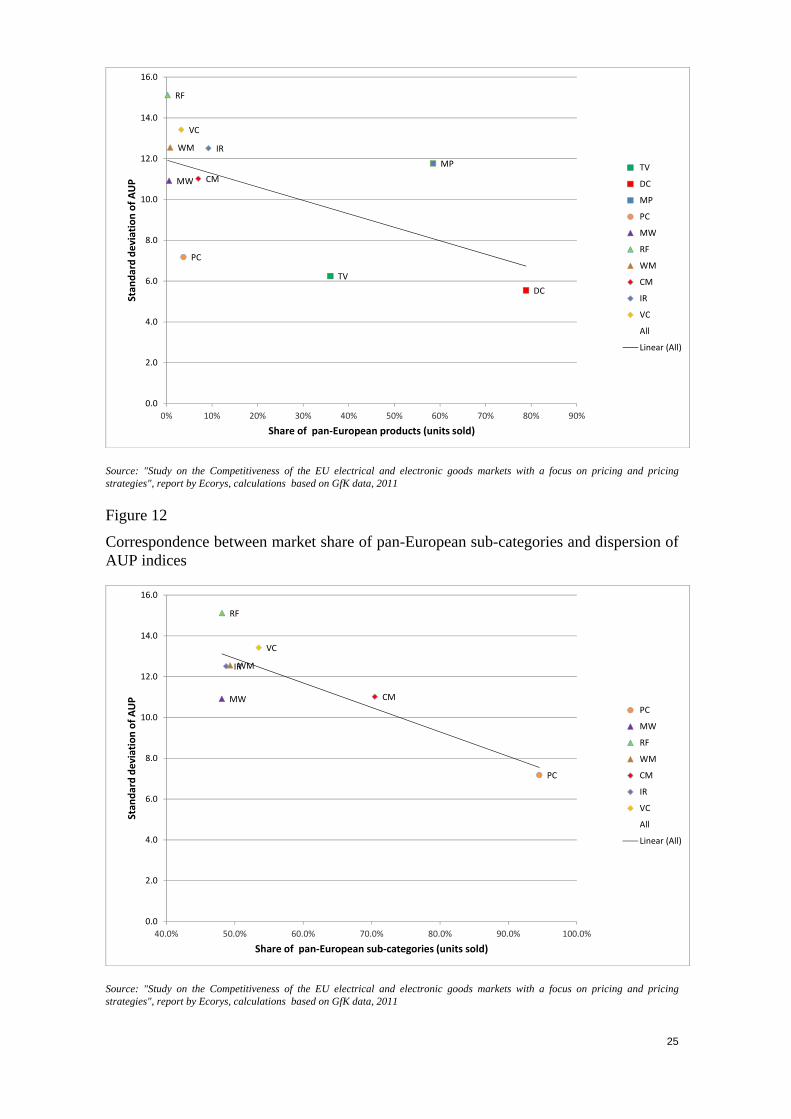
It is important to note here that for the majority of the 10 categories, the price analysis takes into account the prevalence of pan-EU sub-categories, which is precisely due to lack of pan-EU individual models. The prevalence of pan-EU models seems to have an impact on the level of dispersion of prices across the countries analysed. Generally, for the categories where pan-EU models or sub-categories have a higher share in the number of units sold, the level of prices measured as the Average Unit Price Index converges more across countries – figures 11 and 12. Thus availability of identical or highly comparable products to consumers is a factor that strengthens the integration of the Single Market in terms of price levels.
Figure 11
Correspondence between market share of pan-European products and dispersion of AUP indices
25
TVDC
MP
PC
MW
RF
WM
CM
IR
VC
0.0
2.0
4.0
6.0
8.0
10.0
12.0
14.0
16.0
0% 10% 20% 30% 40% 50% 60% 70% 80% 90%
Stan
dard
dev
iatio
n of
AU
P
Share of pan-European products (units sold)
TV
DC
MP
PC
MW
RF
WM
CM
IR
VC
All
Linear (All)
Source: "Study on the Competitiveness of the EU electrical and electronic goods markets with a focus on pricing and pricing strategies", report by Ecorys, calculations based on GfK data, 2011
Figure 12
Correspondence between market share of pan-European sub-categories and dispersion of AUP indices
PC
MW
RF
WM
CM
IR
VC
0.0
2.0
4.0
6.0
8.0
10.0
12.0
14.0
16.0
40.0% 50.0% 60.0% 70.0% 80.0% 90.0% 100.0%
Stan
dard
dev
iatio
n of
AU
P
Share of pan-European sub-categories (units sold)
PC
MW
RF
WM
CM
IR
VC
All
Linear (All)
Source: "Study on the Competitiveness of the EU electrical and electronic goods markets with a focus on pricing and pricing strategies", report by Ecorys, calculations based on GfK data, 2011
26
The results however do not indicate whether the actual prevalence of pan-EU products in particular categories within particular Member States leads to weaker price dispersion for a category within a national market. Only for washing machines and coffee makers a higher share of pan-EU products seems to go in hand with less dispersed prices within particular countries. Neither can it be observed that the prevalence of pan-EU products would have an impact on the country price levels for particular categories. Analysis of data for digital cameras and vacuum cleaners suggests that prices (measured in the AUP Index) may actually be higher in countries where pan-EU products account for a higher share of units sold.
6.8. Link between prices and concentration in retail and production
The structure of the retail market of electric and electronic appliances varies between countries, however a general trend of growing concentration can be observed (as described in the Study on the Competitiveness of the EU electrical and electronic goods markets). Although the concentration level is not a direct measure of the functioning of competition in a given market, these two issues can be often related. Higher concentration often also means bigger companies, which can benefit from economies of scale and higher efficiency.
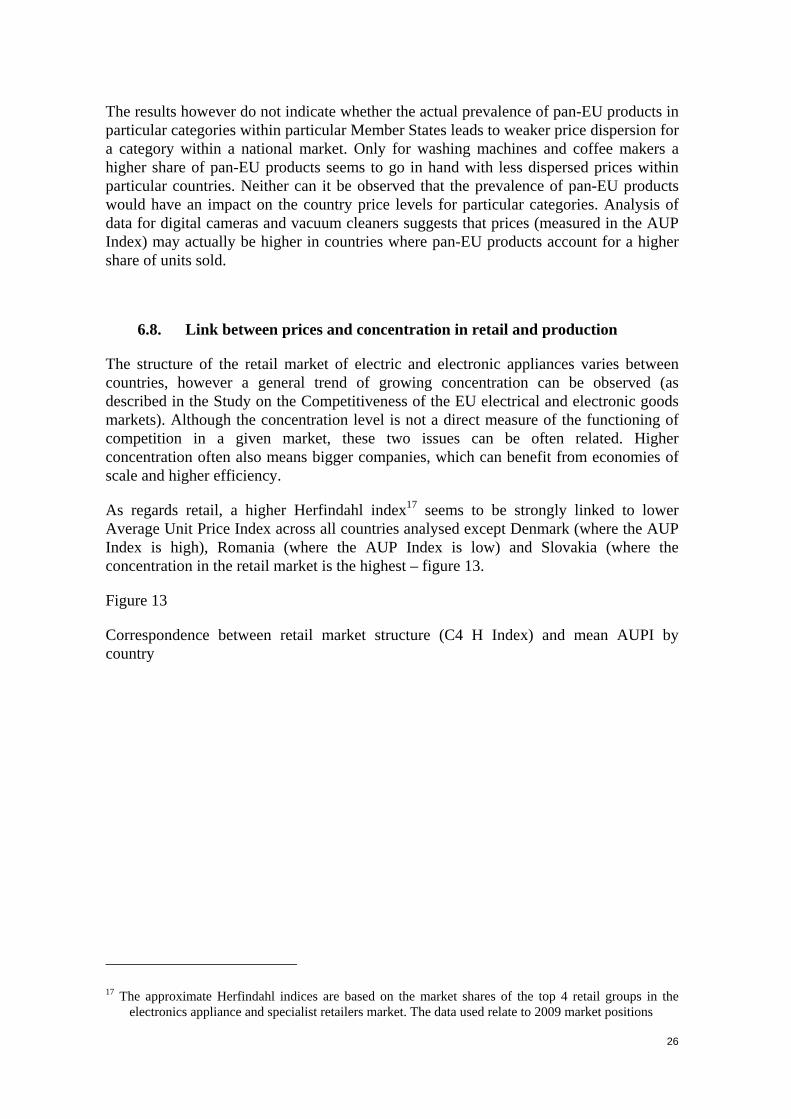
As regards retail, a higher Herfindahl index17 seems to be strongly linked to lower Average Unit Price Index across all countries analysed except Denmark (where the AUP Index is high), Romania (where the AUP Index is low) and Slovakia (where the concentration in the retail market is the highest – figure 13.
Figure 13
Correspondence between retail market structure (C4 H Index) and mean AUPI by country
17 The approximate Herfindahl indices are based on the market shares of the top 4 retail groups in the
electronics appliance and specialist retailers market. The data used relate to 2009 market positions
27
DK
FI SKBE CZ
ATSE
ITES
FR DENL
IE
PTPL
HU
GB BG
RO
70
80
90
100
110
120
130
5 5.5 6 6.5 7 7.5 8 8.5 9
AUP Index
Retail Market Concentration - HH Index (loge)
Linear (ALL)
Linear (ExclDK, SK, RO)
Source: "Study on the Competitiveness of the EU electrical and electronic goods markets with a focus on pricing and pricing strategies", report by Ecorys, calculations based on GfK data, 2011
Similarly to the relationship between the retail market concentration and level of prices, also the average retail firm size measured by the number of persons employed is negatively correlated with the level of prices, however this relation is weaker.
Generally, data suggests that retailers with higher market shares benefit from economies of scale or/and companies that employ a higher number of persons achieve some efficiency gains. Also a higher concentration might mean stronger competition in the national retail markets. All of these factors might contribute to lower average prices for consumers. A further analysis does not show however any meaningful correlation between the concentration of producers of electric and electronic goods or of brand owners and the level of prices in EU countries.
7. E-COMMERCE AND CROSS-BORDER SALES
According to recent survey data18, 46% of consumers shopped online in the EU Single Market, compared to 37% in 2010 and 33% in 2008. The internet is the most popular distance sales channel. Despite the positive development in e-commerce use by
18 Flash EB 332: "Cross-border trade and consumer protection", TNS Opinion & Social at the request of
Directorate-General for Health and Consumers; to be published
28
consumers, the proportion of retailers using e-commerce (selling products via the internet) dropped between 2010 and 2011, from 53% to 41%19.
Whilst e-commerce is becoming more widespread, the cross-border part is not developing as quickly at the domestic one. The number of consumers shopping cross-border over the internet was stable between 2008 and 2010, around 7%, however increased in 2011 to 10%. Majority of retailers (65%) only sell to consumers in their own country (74% in 2010), however, more retailers were selling cross-border in 2011 than in 2010 (27% vs. 21%). In 2011, consumers reported making cross-border purchases worth on average €381, compared to €653 in 2010 and €785 in 2009. An increasing number of consumers feel confident about shopping cross-border.
Nevertheless, a mystery shopping survey carried out by the Commission in 2009 revealed that in 6 out of 10 cases consumers could not finalise their purchase when trying to order a good from an online trader located in another EU country. In comparison to books, films and music or clothes, it was for electrical household appliances and electronic equipment where placing a successful cross-border order was most difficult20.
Electronic equipment is most popular amongst product categories bought online – it accounted for 18% of consumers' last purchases in comparison to clothes, shoes and jewellery (17%) or books (10%). Electric household appliances constitute 6% of online purchases21.
7.1. Choice of products online and offline
In general, online sales seem to play a complementary role to offline sales. The models available on the Internet are most often the more popular models in the brick and mortar shops – over 95% of models available online are also present offline. There is a group of models that are rather exclusive for online sales (e.g. some niche products), but these are responsible for only a small proportion of sales.
As mentioned in section 6.6, the Study on Competitiveness shows that much more products are available in the brick-and-mortar stores than on the Internet. However, from a perspective of an individual consumer, who can have access to only a limited number of local shops in his or her range of convenient shopping, the access to online shops is much wider, even at a country-level, not to mention cross-border purchases. This also means access to a much wider choice of products that can be purchased. A recently finalised study on the functioning of the e-commerce in the EU showed that the choice of 19 Flash EB 331: "Business attitudes towards cross-border trade and consumer protection ", TNS Opinion
& Social at the request of Directorate-General for Health and Consumers; to be published
20 Mystery Shopping Evaluation of Cross-Border E-Commerce in the EU, Conducted on behalf of the European Commission, 2009; http://ec.europa.eu/consumers/consumer_research/market_studies/docs/mystery_shopping_eval_en.pdf
21 "Consumer market study on the functioning of e-commerce and Internet marketing and selling techniques in the retail of goods", conducted by Civic Consulting on behalf of the European Commission; 2011 ;
products for some product categories for an individual consumer can be twice as broad online than offline when shopping domestically, e.g. for mobile phones or portable media players. If consumers shop online across the EU they can have up to 16 times more products to choose from22.
7.2. Comparison of prices for online and offline sales channels and impact of online sales on price dispersion across countries
Possibility of finding cheaper products online is the most important reason for consumers to buy products online, before the possibility to save time. The perceived easiness to compare prices online is the third reason23.
Within national markets, prices for particular models analysed in the Study on the Competitiveness of the EU electrical and electronic goods markets were on average significantly lower online than offline. Excluding delivery costs24, a typical saving for individual models from buying online would be 5% of the online price. Then, if the structure of online sales is taken into account, thus the price data is weighted by the sales, it can be noticed that the difference in prices can be greater as the actual online sales are dominated by products significantly cheaper online than offline. However, there is a substantial number of models which are more expensive online than offline.
Online prices seem to be less differentiated than offline prices. Generally, for the product categories for which the Internet sales represent a higher share of units sold, the average prices converge more across countries. This might be partly explained by the fact that online sales are more prevalent for the electronic than for the electrical goods, and the electronic goods are on average to a larger extent more homogeneous in terms of identical models available across countries than the electrical goods, where usually models differ a lot across local markets. The online sales seem however to play a role in
22 "Consumer market study on the functioning of e-commerce and Internet marketing and selling
techniques in the retail of goods", conducted by Civic Consulting on behalf of the European Commission; 2011 http://ec.europa.eu/consumers/consumer_research/market_studies/e_commerce_study_en.htm
This estimation does not cover the whole retail market. In the whole retail market there is more choice offline, since there are far more businesses selling offline than online. However, a consumer is not likely to visit or have information from all online and offline shops before making a purchase. A consumer is more likely to make a limited number of visits to online and offline shops
23 "Consumer market study on the functioning of e-commerce and Internet marketing and selling techniques in the retail of goods", conducted by Civic Consulting on behalf of the European Commission; 2011; http://ec.europa.eu/consumers/consumer_research/market_studies/e_commerce_study_en.htm
24 The delivery costs for electronic goods might range from 2 EUR to over 30 EUR, depending on the country and also on the size of the parcel and delivery conditions; "Consumer market study on the functioning of e-commerce and Internet marketing and selling techniques in the retail of goods", conducted by Civic Consulting on behalf of the European Commission; 2011
increasing the across country price convergence also for the "pan-European" models25. Prices of these are more differentiated offline than online.
There is however no strong or systematic evidence that a higher share of Internet sales leads to a higher convergence of prices between online and offline markets within a country, which might suggest that at this stage of the development of different sales channels, the fact that prices are often lower online does not make the offline sellers inclined to decrease their prices.
The online market for the electric and electronic goods is not at the same stage of development across countries and across product categories. The Study on Competitiveness data analysis for online sales of six product categories26 and six countries27 shows that 18% of notebooks, whereas only 3% of irons are sold online in the EU6. Usually, these shares are the highest in the UK and the lowest in Italy and Poland.
7.3. Pan-EU products and possible microeconomic gains for consumers
The Study on Competitiveness has revealed that if consumers could hypothetically compare the prices across the EU and buy products in the country where they would find the cheapest offer, they would often be able to save money. For example, given that the VAT rate is the same across Member States, a German or a Dutch consumer could save on average over 150 EUR when buying a flat screen TV in a shop in a country with the lowest prices for TVs, and a French consumer could save over 120 EUR when buying a notebook offline and up to 110 EUR when buying a refrigerator online in a country with the lowest prices for relevant products28. In percentage terms, the most significant savings could potentially be obtained by German, French and Dutch consumers buying an MP3 media player offline (they would pay respectively 35%, 24% and 23% less than the average price in their home country). VAT rates for the products analysed range from 17.5% to 22% across the six countries.
Savings for consumers buying online within their country might slightly differ depending on whether the product is a local one or is available across the countries analysed (pan-EU product)29. Although the situation might still be different for particular product categories or countries, the overall tendency indicates that if consumers buy online a pan-EU model they can save on average ca. 3pp. more than when buying a local one. However, as mentioned before, the share of pan-EU models in sales is still low for 25 "Pan-European" in the analysis of the Internet sales is actually limited to 6 countries: FR, DE, UK, IT,
NL, PL
26 6 product categories: notebooks, MP3 players, digital cameras, flat screen TVs, refrigerators and irons
27 The countries included in the analysis of the online and offline sales are: FR, DE, UK, IT, NL, PL. For other countries the data was not available.
28 This comparison is performed for a limited number of countries: Germany, France, the Netherlands, Italy, Poland and the United Kingdom, and for products available across these 6 countries within the following product categories: flat screen TVs, digital cameras, MP3 media players, PC notebooks, refrigerators and irons.
29 Again, the number of countries is limited to the six mentioned earlier.
31
appliances such as refrigerators and irons. Such models are more common among televisions, digital cameras and media players.
7.4. Internet potential and functioning of websites selling consumer electronics
In terms of choice of products available to consumers as well as differences in prices, there is a significant potential for the development of online sales in many Member States. There are however still a number of obstacles that consumers face while buying on the Internet. The study of the functioning of e-commerce in the EU shows that many consumers still want to see the product before they buy it or they want to take it home immediately. These concerns are rather hard to address by the e-traders at the moment, although this might change with a further development of the technology. A substantial number of consumers is also afraid of unfair or fraudulent commercial practices30.
An "EU sweep"31 carried out in 2009 targeted websites selling electronic goods, such as mobile phones, digital cameras and personal music players. It revealed that only 44% of websites checked actually complied with EU laws. A second phase of the investigation conducted in 2010 showed a significant improvement of the situation as 84% of websites checked for breach of EU consumer rules were functioning properly. The problems identified included misleading information on consumer rights, incorrect prices and missing contact details of the trader.
8. SUSTAINABILITY
8.1. Energy efficiency information (online and offline) and regulatory environment
Producers of household equipment, in particular of larger electrical appliances, are obliged to provide consumers with information about the energy consumption of the product.
A recent update of the EU legislation (Directive on the indication by labelling and standard product information of the consumption of energy and other resources by
30 "Consumer market study on the functioning of e-commerce and Internet marketing and selling
techniques in the retail of goods", conducted by Civic Consulting on behalf of the European Commission; 2011; http://ec.europa.eu/consumers/consumer_research/market_studies/e_commerce_study_en.htm
31 An "EU sweep" is a joint EU investigation and enforcement action to check for compliance with consumer laws on a particular market in order to see where consumer rights are being compromised or denied.
energy-related products)32 regards the range of products covered (e.g. by including televisions) and the scope of the information provided, by including the average annual electricity and water consumption for washing machines or dishwashers or volume of the appliance for refrigerators. It also presents the design of the updated energy class labels. The provisions of the directive oblige the producer to supply a label on a product and the trader to always pass the information on the energy efficiency of the appliance to the consumer, regardless of sales channel used. Thus such information has to be available also to consumers purchasing such products online.
8.2. Uptake of energy efficient products in the EU and across countries
The information on the energy usage of electrical or electronic goods is gaining on significance for consumer purchasing decisions. The energy class labels, which refer mainly to large electrical appliances, provide consumers with an easy to access and understand information with which they should be able to compare different products on offer. On the other hand, it is an incentive for producers, who want to remain competitive, to develop and offer products with a higher energy class.
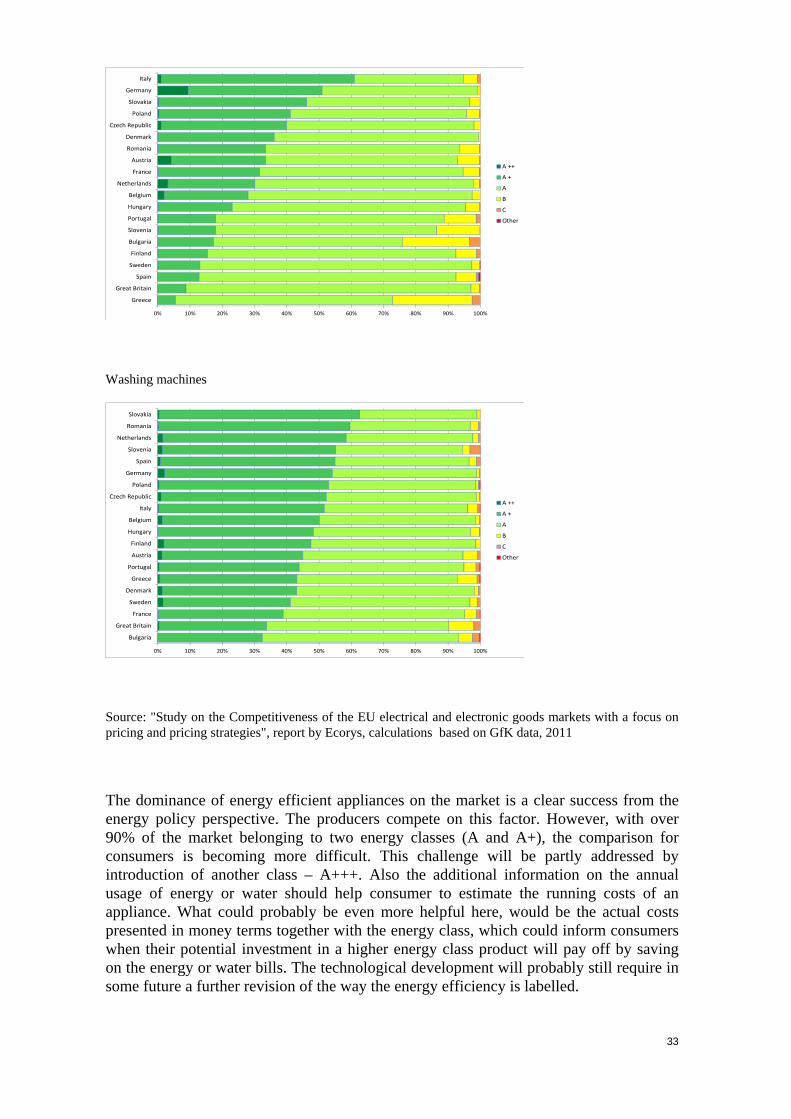
The Study on the Competitiveness of EU electrical and electronics goods markets with a focus on pricing and pricing strategies looked into the energy classes of refrigerators and washing machines which were sold in the EU in 2008 – figure 14. The analysis showed that the uptake of higher energy class appliances is very high in the EU: generally over 90% belong to high energy efficiency classes (A and A+). The share of sales of A+ products does not seem to be correlated with higher average income levels. Such products are also common in the countries that joined the EU recently, e.g. class A+ refrigerators represent over 40% of units sold in Slovakia, Poland and the Czech Republic, and A+ washing machines account for 60% of units sold in Slovakia and Romania, and over 50 % in Slovenia, Poland and the Czech Republic. A relatively high uptake (from 3% to 9% of units sold) of products with the highest energy class (A++) could be observed in Germany, Austria, the Netherlands, Finland, Sweden, Denmark and Belgium.
Figure 14
Share of sales (units sold) by energy efficiency factor
Refrigerators
32 Directive 2010/30/EU of the European Parliament and of the Council of 19 May 2010 on the indication
by labelling and standard product information of the consumption of energy and other resources by energy-related products
Source: "Study on the Competitiveness of the EU electrical and electronic goods markets with a focus on pricing and pricing strategies", report by Ecorys, calculations based on GfK data, 2011
The dominance of energy efficient appliances on the market is a clear success from the energy policy perspective. The producers compete on this factor. However, with over 90% of the market belonging to two energy classes (A and A+), the comparison for consumers is becoming more difficult. This challenge will be partly addressed by introduction of another class – A+++. Also the additional information on the annual usage of energy or water should help consumer to estimate the running costs of an appliance. What could probably be even more helpful here, would be the actual costs presented in money terms together with the energy class, which could inform consumers when their potential investment in a higher energy class product will pay off by saving on the energy or water bills. The technological development will probably still require in some future a further revision of the way the energy efficiency is labelled.
0% 10% 20% 30% 40% 50% 60% 70% 80% 90% 100%
Slovakia
Romania
Netherlands
Slovenia
Spain
Germany
Poland
Czech Republic
Italy
Belgium
Hungary
Finland
Austria
Portugal
Greece
Denmark
Sweden
France
Great Britain
Bulgaria
A ++
A +
A
B
C
Other
0% 10% 20% 30% 40% 50% 60% 70% 80% 90% 100%
Italy
Germany
Slovakia
Poland
Czech Republic
Denmark
Romania
Austria
France
Netherlands
Belgium
Hungary
Portugal
Slovenia
Bulgaria
Finland
Sweden
Spain
Great Britain
Greece
A ++
A +
A
B
C
Other
34
8.3. Relation between prices of particular energy classes and across countries
Comparison of prices for the particular energy classes across countries shows that class A refrigerators are on average most expensive in Denmark, Sweden, Finland, Belgium and Austria, whereas in the UK, Portugal and the countries that joined the EU in and after 2004 the average unit price indices for these products appear to be below the EU average. This generally reflects the overall pattern of relative prices across countries. As regards washing machines, the countries which stand out in terms of relatively high prices of products of classes A and A+ are Denmark and the southern Member States – Italy, Greece and Spain.
For refrigerators, in countries where the price difference between A+ and A is smaller, the market share of products of class A+ is higher. For washing machines, a contrary relation can be observed. Generally, A+ refrigerators are from 10% to 35% more expensive than A models, and for washing machines the price might be up to 18% higher. The difference in energy consumption is respectively 20% and 10% for these two product categories.
8.4. Role of online sales in the sales of appliances with higher energy classes
For both, refrigerators and washing machines the Internet generates only a modest share of sales – e.g. 8% for refrigerators in the EU633. Additionally, not for all products sold online the information on the energy class was available. With regard to these limitations, the analysis shows that consumers tend to purchase A+ and A++ products to a similar extent online and offline. Only in Germany a clearly higher proportion of sales of higher energy class refrigerators is accounted for in online shops, and in Poland and the Czech Republic proportionally more higher energy class washing machines are sold on the Internet.
9. CONCLUSIONS
• Continued monitoring competition in these markets is important both for the businesses as well as for consumers as an increased competition at the national or EU level can lead to potential savings for consumers.
• Improved consumer information can help consumers make better choices. The Commission will work closely with product testing and other organisations providing information on product quality comparisons/price/best value for money, to see how to make results more available and comparable across the EU. Also, it will engage closely with information intermediaries in order to: a) ensure that they respect EU
33 As mentioned before, this comparison is performed for a limited number of countries: Germany, France,
the Netherlands, Italy, Poland and the United Kingdom, and for products available across these 6 countries.
35
consumer legislation, and b) encourage them to include cross-border offers on price and quality in a way that unlocks the potential of the Single Market34.
• Further development of online sales can help consumers to obtain savings and have access to an additional choice of products, including offers from online retailers from abroad.
• Resource efficiency should be further promoted, taking into account the role of the energy efficiency factor in competition, as well as consumer needs and preferences.
• Clarity and user-friendliness of energy efficiency information should be promoted, including energy class labels in online sales. This requires monitoring compliance of online traders with the requirement to provide consumers with information on the energy class and also resource efficiency of a product in their Internet offers.
34 Commission Communication A coherent framework for building trust in the Digital Single Market for e-commerce and online services, January 2012; http://ec.europa.eu/consumers/consumer_research/market_studies/docs/communication_digital_single_market_ecommerce_en.pdf
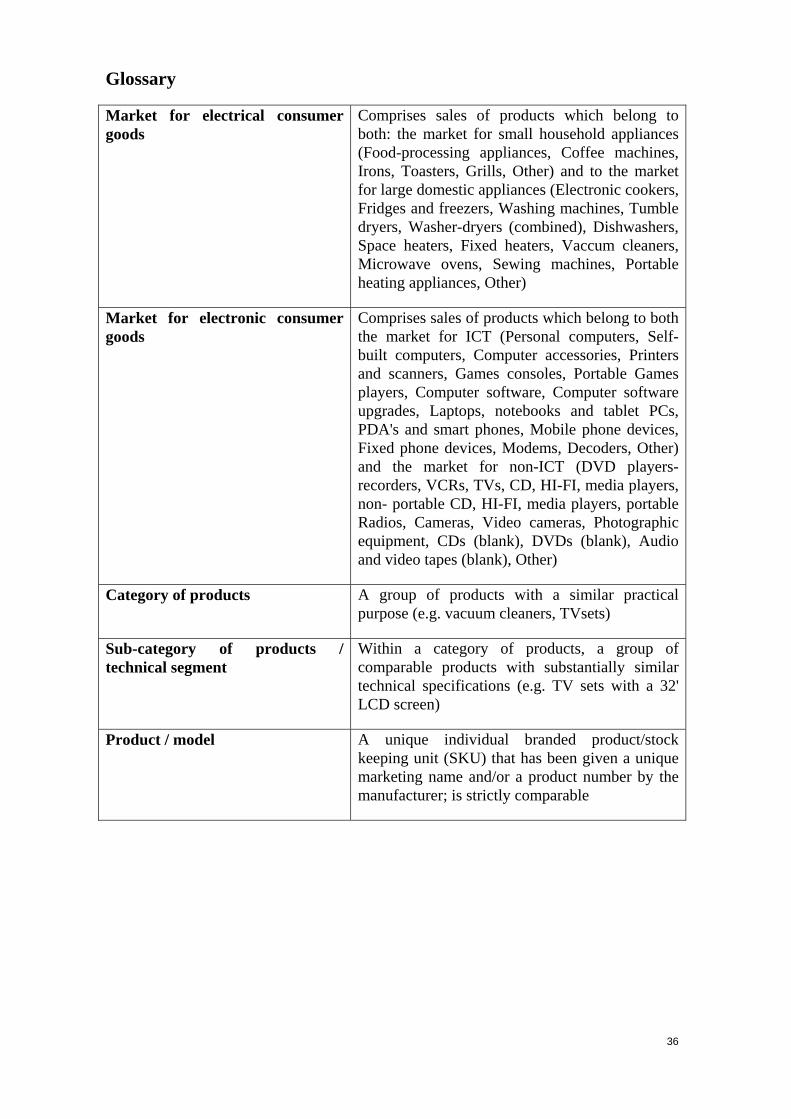
Comprises sales of products which belong to both: the market for small household appliances (Food-processing appliances, Coffee machines, Irons, Toasters, Grills, Other) and to the market for large domestic appliances (Electronic cookers, Fridges and freezers, Washing machines, Tumble dryers, Washer-dryers (combined), Dishwashers, Space heaters, Fixed heaters, Vaccum cleaners, Microwave ovens, Sewing machines, Portable heating appliances, Other)
Market for electronic consumer goods
Comprises sales of products which belong to both the market for ICT (Personal computers, Self-built computers, Computer accessories, Printers and scanners, Games consoles, Portable Games players, Computer software, Computer software upgrades, Laptops, notebooks and tablet PCs, PDA's and smart phones, Mobile phone devices, Fixed phone devices, Modems, Decoders, Other) and the market for non-ICT (DVD players-recorders, VCRs, TVs, CD, HI-FI, media players, non- portable CD, HI-FI, media players, portable Radios, Cameras, Video cameras, Photographic equipment, CDs (blank), DVDs (blank), Audio and video tapes (blank), Other)
Category of products A group of products with a similar practical purpose (e.g. vacuum cleaners, TVsets)
Sub-category of products / technical segment
Within a category of products, a group of comparable products with substantially similar technical specifications (e.g. TV sets with a 32' LCD screen)
Product / model A unique individual branded product/stock keeping unit (SKU) that has been given a unique marketing name and/or a product number by the manufacturer; is strictly comparable