GfK MODE PIDDC Report Jan, 2013 i Incredible ! ndia Government of India Ministry of Tourism (Market Research Division) Report on EVALUATION OF THE PLAN SCHEME - PRODUCT INFRASTRUCTURE DEVELOPMENT AT DESTINATIONS AND CIRCUITS (PIDDC) Prepared By: GfK MODE
Transcript
GfK MODE
PIDDC Report Jan, 2013
i
Incredible !ndia
Government of India Ministry of Tourism
(Market Research Division)
Report on
EVALUATION OF THE PLAN SCHEME - PRODUCT INFRASTRUCTURE
DEVELOPMENT AT DESTINATIONS AND CIRCUITS (PIDDC)
Prepared By:
GfK MODE
GfK MODE
PIDDC Report Jan, 2013
i
REPORT ON
EVALUATION OF THE PLAN SCHEME
PRODUCT INFRASTRUCTURE DEVELOPMENT AT DESTINATIONS AND
CIRCUITS (PIDDC)
Submitted to
Government of India
Ministry of Tourism, Market Research division C-1 Hutments, Dalhousie Road
5.2 EVALUATION OF PIDDC SCHEME - IMPORTANT FINDINGS........................................................44
5.3 RECOMMENDATIONS FOR PIDDC SCHEME..............................................................................48
5.4 EVALUATION OF FAIRS AND FESTIVALS—IMPORTANT FINDINGS ..............................................50
5.5 RECOMMENDATIONS FOR GREATER EFFECTIVENESS OF THE FAIRS AND FESTIVALS ...................52
ANNEXURE I – STATE WISE LIST OF SAMPLE SELECTED FOR THE STUDY ..........................................55
ANNEXURE II – QUESTIONNAIRES ................................................................................................74
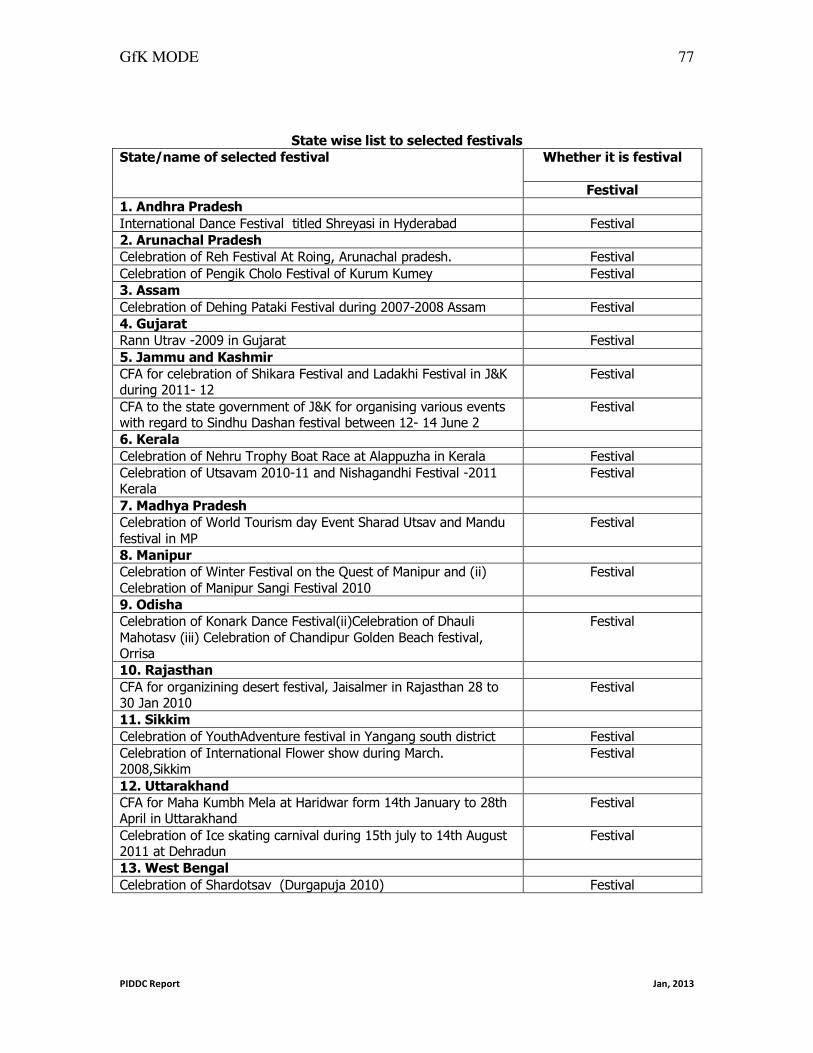
ANNEXURE III– STATE WISE LIST TO SELECTED FAIRS / FESTIVALS .................................................75
GfK MODE
PIDDC Report Jan, 2013
iii
PREFACE
The Ministry of Tourism (MOT), Government of India has been funding the states to build and strengthen the existing infrastructure at the tourist sites to make the destinations more attractive
for tourism. Such efforts have been continuing since ninth five year plan in different and
progressively more integrated fashion.. This centrally sponsored scheme focuses on integrated infrastructure development of tourism circuits/ destinations and also on the improvement of the
existing products as well as development of new tourist products (PIDDC). In addition, the
Ministry of Tourism also funds fairs/festivals as a step to promote tourism. The 11th five year
plan made further efforts to strengthen this scheme so as to harness full potential of tourism sector by improving infrastructure.
These schemes have been very useful in increasing tourism in the country and in enhancing the contribution of tourism in the development of the country. It was therefore important to know
how these schemes had performed in the 11th five year plan and whether they need to continue in
future, in the same format or strengthened format, for better results.
We, at GfK MODE, feel privileged to have been entrusted responsibility to undertake a
comprehensive evaluation of the scheme and make necessary recommendation to further
strengthen it for their better impact on tourism and in the development of the country.
We will like to express our sincere thanks to the Department of Tourism, Government of India for
all the support, both technical and logistical, they provided to us in the execution of this study. In the initial stages of its execution, support came from Dr R.N. Pandey, Addl. Director General
(MR); Shri Ajay K. Gupta , Addl. Director General, Ms. Sandhya Singh and Ms. Neha
Srivastava, both Deputy Directors (MR); we express thanks to them. In the report writing stage,
useful comments came from Shri Parvez Dewan, Union Secretary of Tourism, Ministry of Tourism, Government of India, Shri C. Vishwanath, Additional Secretary and Financial Advisor
(Tourism), and Shri R.K.Bhatnagar, ADG (MR) on the draft report. These comments helped us
in finalization of the report. We express thanks to them. We also thank Mr. S.K Mohanta, DPA GR “B” (MR), Ministry of Tourism for extending his support from time to time. Without their
support, it would not have been easy for us to complete the study.
We, at GfK MODE hope that the Ministry of Tourism, Government of India, finds the findings
and recommendations useful for strengthening the scheme PIDDC. We feel that utilization of the
recommendations will help it to further strengthen the scheme to promote tourism in India and
achieve the ultimate goal of the Ministry of Tourism and increase satisfaction of the tourists during their visit to “Incredible India” of the first phase and “Find What You Seek” and “Go
Beyond” of the second phase of campaign. If this study achieves these objectives, even partly, we
will feel rewarded for the hard work of our team of people at GfK MODE . We will consider this as our small contribution in the development of our country.
Team of Social Division, GfK MODE
N–161A, 1st Floor, Yusuf Sarai, Gulmohar Enclave
Commercial Centre, Gautam Nagar
GfK MODE
PIDDC Report Jan, 2013
iv
New Delhi-110049
ABBREVIATIONS
DOT Department of Tourism, State level
MOT Ministry of Tourism, Central Government level
PIDDC Product Infrastructure Development at Destinations and Circuits
TOR Terms of Reference
UC Utilization Certificate
UT Union Territories
GfK MODE
PIDDC Report Jan, 2013
i
EXECUTIVE SUMMARY
1. Background
The Ministry of Tourism (MOT), Government of India has been funding the states to
build and strengthen the existing infrastructure at the tourist sites to make them more
attractive for tourism. Such efforts started in the ninth Five year plan in the form of
financial assistance for specific activities like construction of budget accommodation, tourist complexes etc. These individual activities were pooled into full-fledged scheme in
the 10th five year plan so that the states could request funds for building/improvement of
the tourist sites in more integrated/comprehensive fashion. This scheme of the 10th five year plan was further streamlined in the 11th five year plan. This plan made further
efforts to harness full potential of tourism sector by improving infrastructure. This
Centrally- sponsored scheme focuses on integrated infrastructure development of tourism circuits/destinations and also on the improvement of the existing products of the Ministry
as well as development of new tourist products (PIDDC).
The states could also get funds if they organize fairs/festivals to invite the tourists. This scheme aims at promoting tourism –people will come to enjoy fairs/festivals and will
ultimately convert to be tourists.
The Ministry of Tourism, Government of India is interested in evaluation of the scheme
(Product Infrastructure Development for Destinations and Circuits) of the 11th five year
plan so as to (i) assess impact of the scheme, and (ii) learn lessons to further
strengthen/modify the scheme in the next plan periods for improved impact on tourism.
The agency, GfK MODE, was selected, after due tendering process, to undertake this
evaluation in 16 states and two UTs; all the mega projects funded in the 11th five year
plan were also to be evaluated. This report presents findings of this evaluation.
2. Data & Methods
2.1 Objectives of the Evaluation
The objectives of the study, listed in the Terms of Reference (TOR) document of the Ministry of Tourism, are.
1. To evaluate the impact and effectiveness of the scheme in terms of the following
parameters:
• Tourist arrival
• Creation of infrastructure like accommodation units, travel agencies, guides
services etc.
• Employment generation
• Income creation, socio-economic upliftment of local people
• Overall development of the area
GfK MODE
PIDDC Report Jan, 2013
ii
2. To evaluate the system of maintenance of various facilities created at the circuits/
destinations, and its sustainability 3. To get perceptions, experience and expectations of tourists, both foreign and
domestic, about the circuit/destination, and the facilities
4. To make recommendations, in the context of the findings that flow from the study for making modifications in the scheme guidelines
5. To assess the awareness about the scheme amongst tourists/tour operators/travel
agents/tourist guides etc.
2.2 Selection of the projects for evaluation
2.2.1 Number of the projects for evaluation
The Terms of Reference of the Ministry of Tourism had specified the following coverage
of the projects:
Projects supported in 11th
five year plan Required Coverage
Mega projects All in India
Circuits 3 in each of the 16 states and 1 each in two UTs
Destinations 2 in each of the 16 states and 1 each in
two UTs
Fairs/festivals/tourism related events 2 in each of the 16 states
In all, 151 projects, spread over 35 Mega projects, 50 Circuits, 34 Destinations and 32
Fairs/festivals were covered in the impact evaluation.
2.2.2 Selection of the projects
Two criteria were specified for the selection of the projects for evaluation:
• Completed projects should be the first priority; if the required number is not
available, then the ongoing ones will be selected
• Selection should be done by order of sanctioned amount.
The website of the MOT was searched for developing three sampling frames of all the three categories of the projects, circuits, destinations and fairs & festivals, sanctioned
under PIDDC and tourism related events during the 11th five year plan. The required
number of projects were selected on the basis of criteria listed in the document of the MOT.
GfK MODE
PIDDC Report Jan, 2013
iii
2.3 Questionnaires for collection of data
The following questionnaires were developed for interviews: (1) For evaluation of the impact of Mega projects, Circuits and Destinations
• Questionnaire for district level officer
• Questionnaire for Tourist Office/Reception Office at the site
• Questionnaire for Tourist Guides
• Questionnaires for Hotels/Guest Houses
• Questionnaire for Travel Agents/ Tour Operators
• Questionnaire for Bus/Taxi Operators
• Questionnaire for Restaurants
• Questionnaire for Gift/Souvenir Shops
• Questionnaire for Tourists
(2) For evaluation of the impact of Fairs/Festivals
• Questionnaire for Officers responsible for organization/coordination of Fairs/Festivals
• Questionnaire for Hotels/Guest Houses near the place of Fairs/festivals
2.4 Approach adopted in impact evaluation of the PIDDC scheme
In view of the large number of projects and the stated objectives of the study “Impact
Evaluation of the scheme PIDDC”, it was decided that the evaluation will be for PIDDC
scheme (by pooling data collected for all the three categories of projects-Mega, Circuits and Destinations) and for the fairs and festivals separately. This decision of combining
three categories of projects was taken in view of the fact that objective of the study was to
evaluate the PIDDC scheme and from the fact that combining all the projects will have
sample size large, with the result that the computed indicators will have more reliable and stable estimates of parameters.
2.5 Selection of the respondents from different categories of stakeholders
While looking at the project proposals for which assistance was given, it was found that
some circuits and mega circuits were spread over several districts and there were several
tourist sites covered within the districts covered by the selected projects. In view of the time limit and budget resources, all the districts in which a particular project was spread
were covered but only two major (where fund commitment was the highest) sites within
each district were covered. All efforts were made to select 10 stakeholders of each category and cover in a project, if more than 10 stakeholders existed within a radius of 10
Kms of the selected tourist circuit/destination. In case, their number was less than 10, they
all were covered.
If the number of stakeholders were more than 10 in a parameter of 10 Kms, then 10 were
selected with a statistically valid technique so that results of these questionnaires were
representative of the category of the stakeholders. For this selection, the field teams made a listing of all the stakeholders within a radius of 10 Kms and sent to the research team in
Delhi. The research team adopted a stratified random sampling to select the sample of
stakeholder and the list was sent to the field teams for data collection.
GfK MODE
PIDDC Report Jan, 2013
iv
2.6 Report writing
The report consisted of the following chapters and, Executive Summary, preceding them
• Chapter I: Introduction
• Chapter II: Data & Methods
• Chapter III. Evaluation of PIDDC scheme
• Chapter IV. Evaluation of Fairs and Festivals
• Chapter V: Summary Findings and Recommendations
III. Results
3. 1 Evaluation of PIDDC—Important findings
The evaluation of the PIDDC scheme is based on the study of all the 35 mega projects, selected 50 Circuits and 34 Destinations supported by the Ministry of Tourism,
Government of India in the 11th Five Year Plan. They were spread over 24 states and two
UTs. The data was collected from all the stakeholders at the selected tourist sites where
the sampled projects were located. These stakeholders were:
Department of Tourism
• State/District Tourist Officers responsible for implementation or coordination/
monitoring the progress of work of the selected projects
• Reception offices/Ticket offices located at the site of the selected projects
Other Stakeholders
• Tourist Guides
• Hotels/Guest Houses
• Tour Operators/ Travel Agents
• Bus/ Taxi Operators
• Restaurants
• Souvenir shops
• Tourists
This section discusses the findings based on the data collected from all the stakeholders
of these projects. The findings are presented in the following sections:
• Awareness of the PIDDC scheme and their sources
• Measures taken for maintenance and sustainability of the assets created
• Process of development of project proposal
• Experiences of the implementation of the project and its current status
• Impact of the PIDDC scheme
• Current status of tourism infrastructure in districts/where tourist sites were located,
and
• Suggestions for strengthening the PIDDC scheme
GfK MODE
PIDDC Report Jan, 2013
v
3.1.1 Awareness of the PIDDC scheme
• Only 65 percent of the district/state tourism officers were aware of the PIDDC
scheme. This percent looks to be too low, particularly as the projects sanctioned
under the scheme were supposed to be implemented by them (District/State Tourist
officer) or at least under their supervision though some of the officers might be new
since projects being evaluated here might have been initiated in the beginning years
of the 11th
five year plan.
• The level of awareness of PIDDC was lower (45%) among the staff manning the
Reception Centres/Ticket counters of the tourist sites being evaluated.
• This awareness was still lower among other stakeholders
• Regarding the source of awareness of the PIDDC scheme, district/state tourist
officers got to know about the scheme from the government circulars; most of the
other stakeholders learnt about it from newspaper advertisements.
3.1.2 Measures taken for maintenance and sustainability of the assets created
• About 12 to 22 percent employees of the Department of Tourism could not report the
arrangements for maintenance of the tourist destinations. Another 12-21 percent
reported that no specific arrangements for maintenance existed.
• Those who knew the maintenance arrangements, reported responsibilities of three
types of agencies, in decreasing percentage: Division of Department of Tourism,
Local Committees with membership of Department of Tourism, Village Pradhan and
temples, and local Government Departments like PWD etc.
• Only 60 to 65 percent personnel of the Department of Tourism were satisfied with
the maintenance arrangements.
• Obviously, there was need to streamline arrangements of maintenance of the tourist
sites though they are being maintained periodically and on-call basis..
• One important suggestion was that strong monitoring system for maintenance needs
to be created—one senior officer should be given such responsibility and he/she be made accountable for quality of maintenance.
3.1.3 Process of development of proposal
• Important tourist sites, selected on the basis of flow of tourists and infrastructure
needs, are selected for the support under PIDDC.
• Though responsibility of preparation of proposal is that of the Director of Tourism,
he/she has been using different modes for its preparation in different states. The
important modes are: (i) A committee of the officers of Department of Tourism, (ii) Hiring of a Consultant, and (iii) giving responsibility to a local team consisting of
District Tourist Officer and District Collector.
• No study is generally undertaken to determine the infrastructure needs of the site. But
inputs of the stakeholders is taken to identify the infrastructure for support from PIDDC
GfK MODE
PIDDC Report Jan, 2013
vi
• It takes about three to four weeks to write proposal and the cost comes to about Rs.
50,000.
• Some District Tourist Officers reported that the proposals submitted for support were
not comprehensive; they suggested need for a quick study.
3.1.4 Experiences of implementation of the project and its current status
• The execution of the project is undertaken differently in different states. In some
states, a unit is created to execute the activities. In some other states, the district
collector is given responsibility to implement it.
• In most of the states, a board is put up at the site to give details of the work being
undertaken, including source of its funding which is Ministry of Tourism,
Government of India.
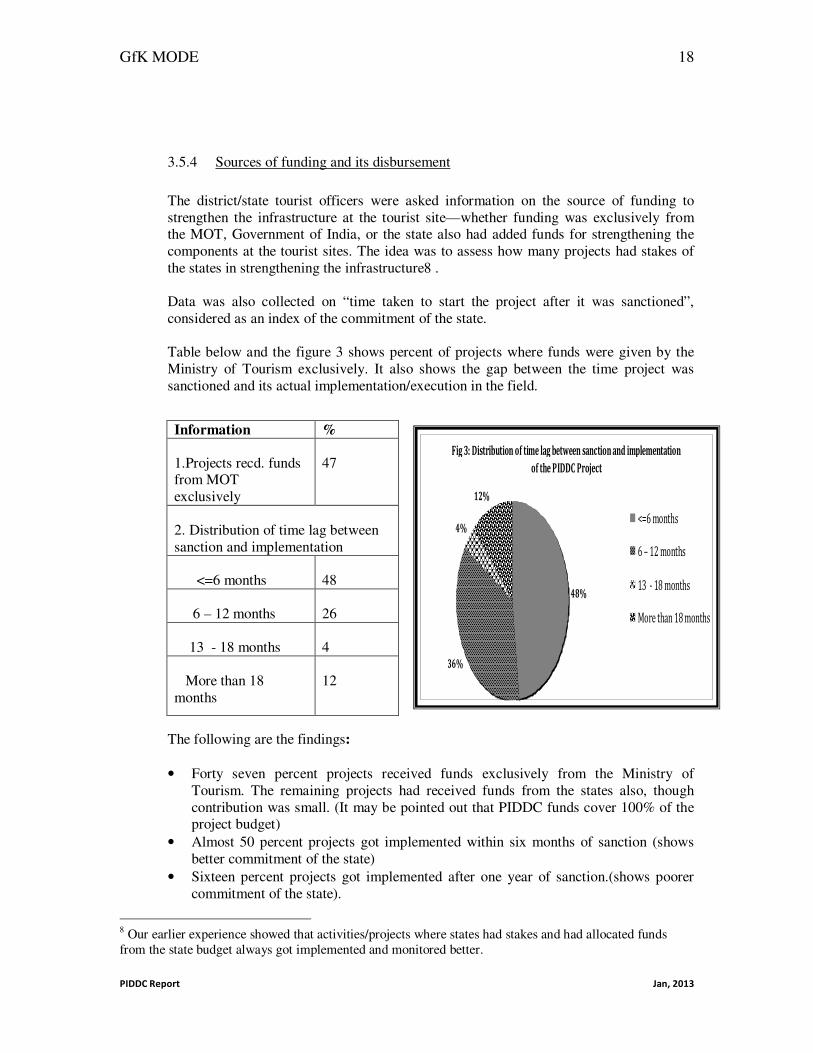
• Forty seven percent projects exclusively used funds received from the Ministry of
Tourism to execute the strengthening activities. Other projects had some small share of the state governments, supplementing the MOT grant.
• Only 50 percent projects got implemented within six months of their sanction. On the
other extreme, 16 percent projects got implemented after one year of the sanction.
Major reason cited for this delay was either “do not know” (58%) or “delay in
inviting or approval of the tenders” (35%)
• Only 34 percent projects sanctioned in the 11th five year plan got completed during
the plan period. Others got delayed; major reported reasons for the delay were:
“delay in the tendering process”, “cost exceeded the budget”, and “delay in the
execution of the project by contractor”
• About two-fifths of the projects did not face any problem in its execution.
3.1.5 Impact of PIDDC scheme
The impact of the projects was measured by three types of indicators: “thoughtful
perception” of district/state tourist officers of the impact, increase/change in the number
of tourists visited the project sites during different years of 11th five year plan, and
increase/change in employment of the manpower in the tourism related industry in different years of 11
th plan period. It may be pointed out that the impact, here, has
been assessed on the basis of one indicator of perception and two quantitative
indicators. Even indicator of perception was more than perception since the respondents were asked, following their reported perception, why they thought so; they were asked to
give reasons for the response they had given. Thus, perception related response was
based on their assessment of the ground situation and therefore, it was not mere perception but a “thoughtful perception”.
These findings have been discussed in this section.
• More than about two-thirds of the stakeholders perceived (thoughtfully perceived)
increase (“Substantial increase” or “Somewhat increase”) in the attractiveness of the
tourist sites as well as increase in the number of tourists who visited the site.
• About 50 percent stakeholders perceived increase in the employment opportunities,
increase in the income, increase in the living pattern of the residents of the area and overall development of the area.(Thoughtful perception).
GfK MODE
PIDDC Report Jan, 2013
vii
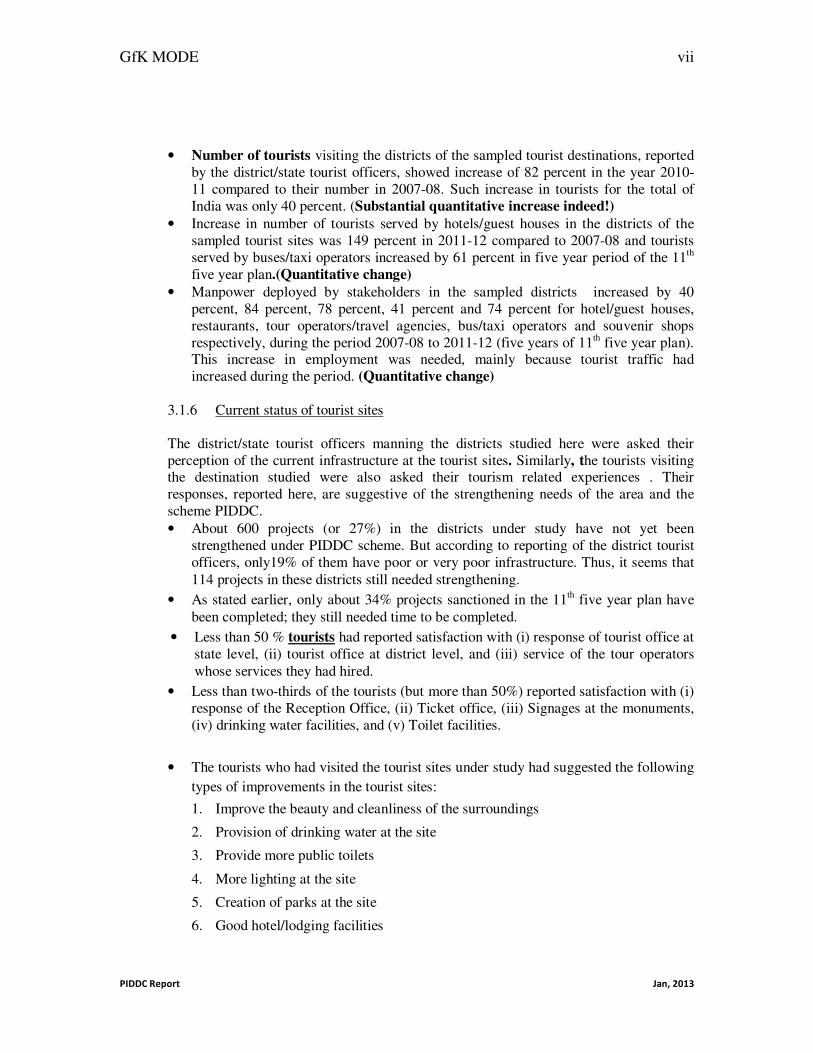
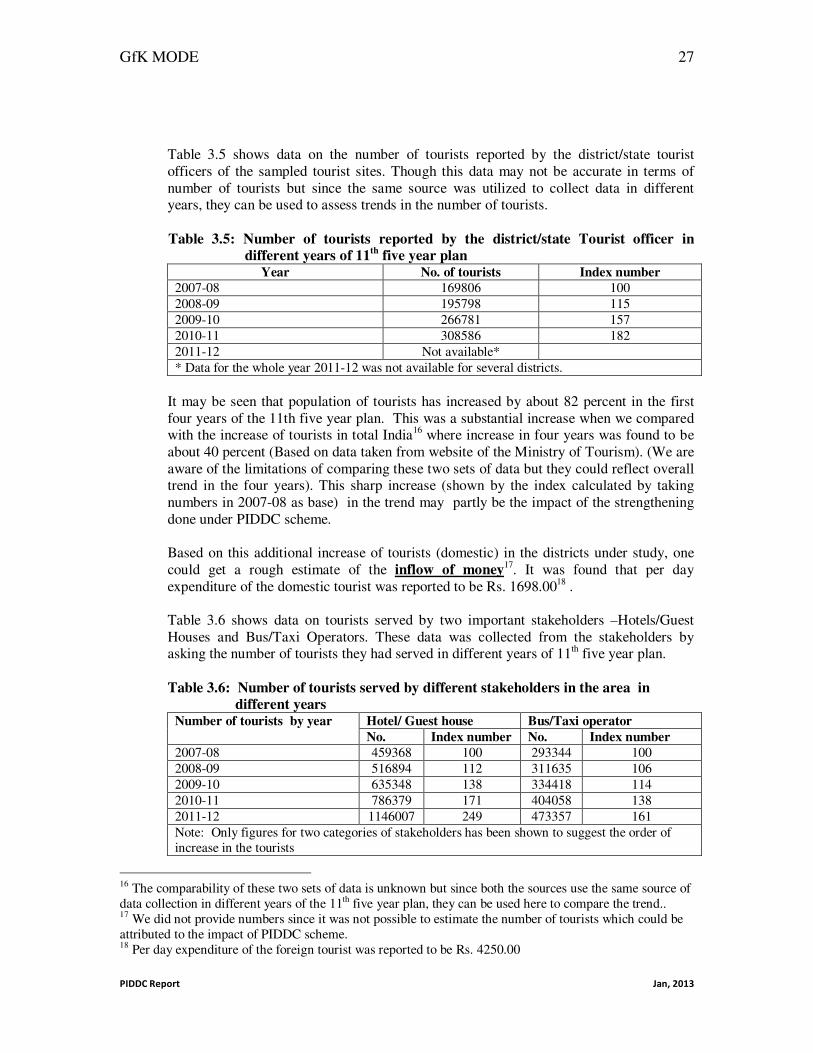
• Number of tourists visiting the districts of the sampled tourist destinations, reported
by the district/state tourist officers, showed increase of 82 percent in the year 2010-
11 compared to their number in 2007-08. Such increase in tourists for the total of
India was only 40 percent. (Substantial quantitative increase indeed!)
• Increase in number of tourists served by hotels/guest houses in the districts of the
sampled tourist sites was 149 percent in 2011-12 compared to 2007-08 and tourists
served by buses/taxi operators increased by 61 percent in five year period of the 11th
five year plan.(Quantitative change)
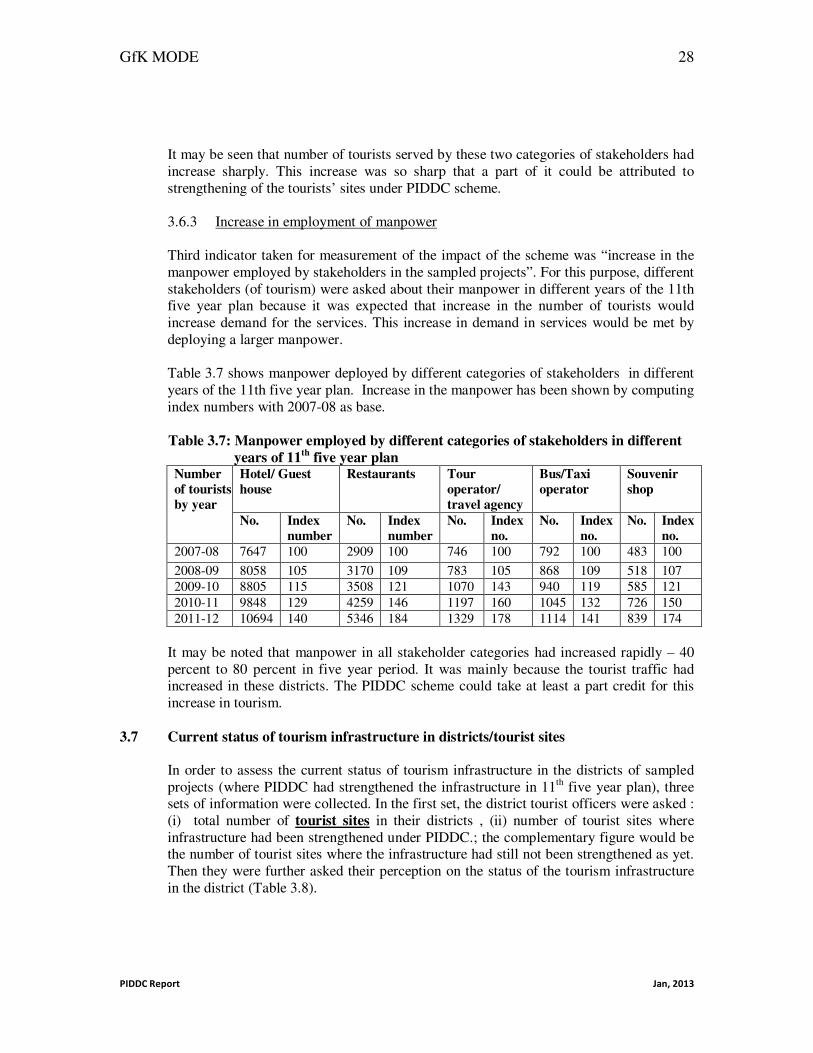
• Manpower deployed by stakeholders in the sampled districts increased by 40
percent, 84 percent, 78 percent, 41 percent and 74 percent for hotel/guest houses,
restaurants, tour operators/travel agencies, bus/taxi operators and souvenir shops
respectively, during the period 2007-08 to 2011-12 (five years of 11th
five year plan). This increase in employment was needed, mainly because tourist traffic had
increased during the period. (Quantitative change)
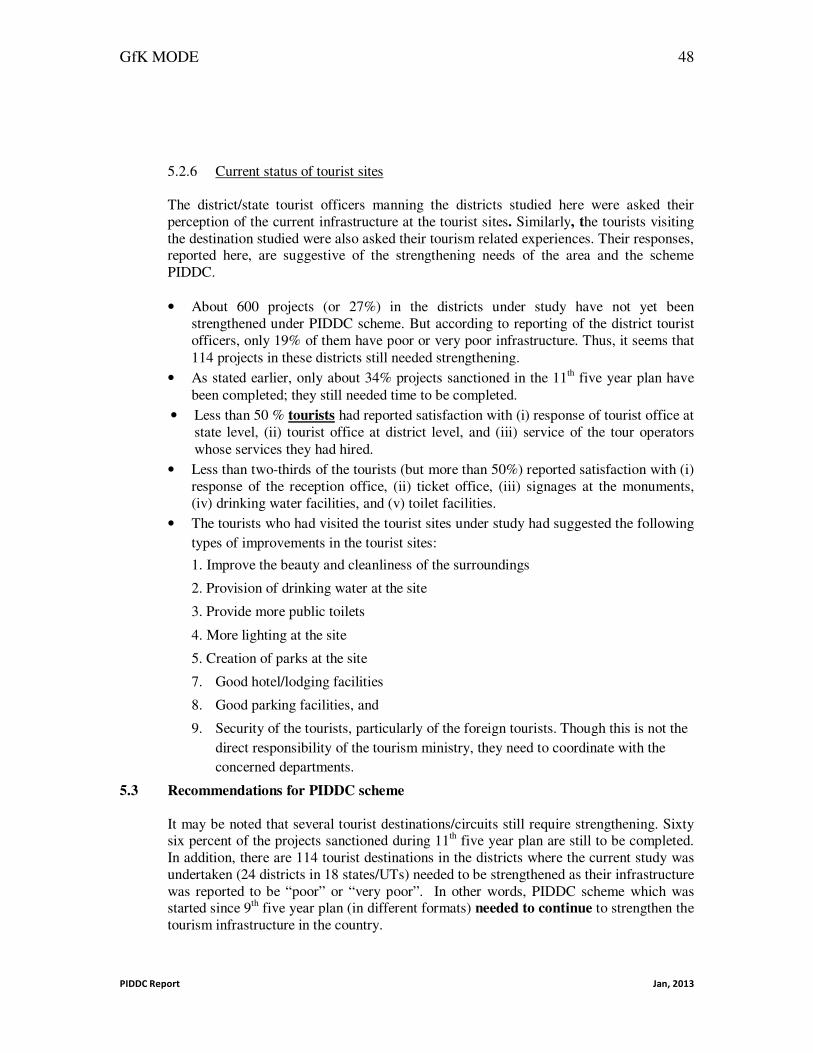
3.1.6 Current status of tourist sites
The district/state tourist officers manning the districts studied here were asked their
perception of the current infrastructure at the tourist sites. Similarly, the tourists visiting the destination studied were also asked their tourism related experiences . Their
responses, reported here, are suggestive of the strengthening needs of the area and the
scheme PIDDC.
• About 600 projects (or 27%) in the districts under study have not yet been
strengthened under PIDDC scheme. But according to reporting of the district tourist
officers, only19% of them have poor or very poor infrastructure. Thus, it seems that
114 projects in these districts still needed strengthening.
• As stated earlier, only about 34% projects sanctioned in the 11th five year plan have
been completed; they still needed time to be completed.
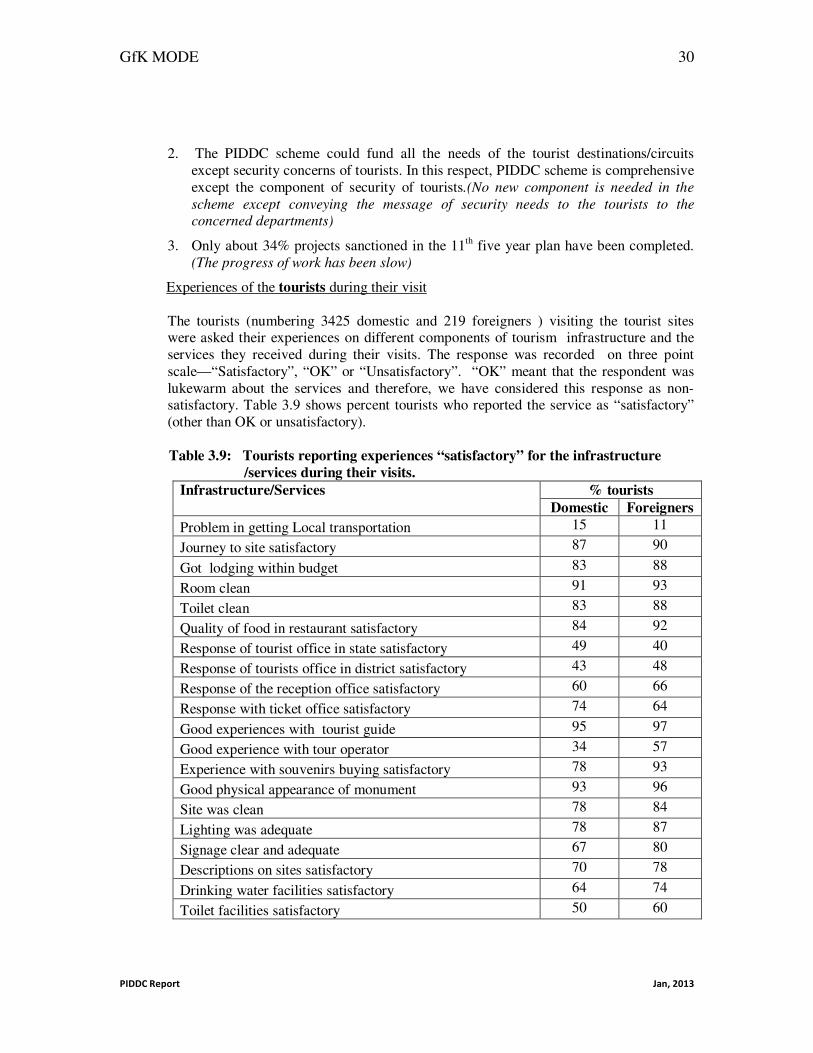
• Less than 50 % tourists had reported satisfaction with (i) response of tourist office at
state level, (ii) tourist office at district level, and (iii) service of the tour operators
whose services they had hired.
• Less than two-thirds of the tourists (but more than 50%) reported satisfaction with (i)
response of the Reception Office, (ii) Ticket office, (iii) Signages at the monuments,
(iv) drinking water facilities, and (v) Toilet facilities.
• The tourists who had visited the tourist sites under study had suggested the following
types of improvements in the tourist sites:
1. Improve the beauty and cleanliness of the surroundings
2. Provision of drinking water at the site
3. Provide more public toilets
4. More lighting at the site
5. Creation of parks at the site
6. Good hotel/lodging facilities
GfK MODE
PIDDC Report Jan, 2013
viii
7. Good parking facilities, and
8. Security of the tourists, particularly of the foreign tourists. Though this is not the
direct responsibility of the tourism ministry, they need to coordinate with the
concerned departments.
3.2 Recommendations for PIDDC scheme
It may be noted that several tourist destinations/circuits still require strengthening. Sixty
six percent of the projects sanctioned during 11th five year plan are still to be completed.
In addition, there are 114 tourist destinations in the districts where the current study was undertaken (24 districts in 18 states/UTs) needed to be strengthened as their infrastructure
was reported to be “poor” or “very poor”. In other words, PIDDC scheme which was
started since 9th
five year plan (in different formats) needed to continue to strengthen the tourism infrastructure in the country.
Regarding the PIDDC scheme, the district/state tourist officers expressed great
appreciation for the scheme. They felt that such support from the MOT, Government of India was the only way in which tourism in the country could improve. It is, therefore
strongly recommended that this scheme should continue as Centrally sponsored
scheme. Such schemes of the MOT should get more funds from the Planning Commission as projects strengthened under such schemes could greatly help not only to
increase tourism in the country and earn foreign exchange but would improve lives of the
residents of the area by giving them more income and other facilities which make quality of life better. Tourism also gives opportunity to the states/country to showcase its culture,
art, music, handicrafts etc, in addition to generating employment and better earnings of
the people. According to them, there is direct relationship in the increased flow of tourists
and development of the area and its residents. It was also suggested that such schemes of Government of India should get more publicity so that more and more states and districts
could benefit from such schemes.
As far as PIDDC scheme is concerned, it was found to be comprehensive and it could
fund all the needs of the tourist destinations/circuits except (i) security concerns of
tourists, and (ii) behavioral issues of the tourist staff (reported by tourists) at the state, district and reception centres of the Department of Tourism and the employees of the
tourism industry..The earlier component suggests need for MOT to coordinate with
concerned Departments for the security of the tourists. The latter component
suggests need for some periodic orientation and sensitization of the staff of the
department of tourism and others who deal with tourists.
Thus, the PIDDC scheme as such needs to be continued with some additionalities
(indicated above), but need was expressed to strengthen its implementation and
improve its impact by streamlining the process of proposal writing, implementation
and monitoring. (Recommendations in these regards have been later in the section).
GfK MODE
PIDDC Report Jan, 2013
ix
A few suggestions to streamline functioning and actual implementation of the PIDDC
scheme (given by the district/state tourist officers and emerged from the findings of the study) were the following:
• It seems that the district/state tourist officers and persons in-charge of the Reception
centres of the tourist sites were not involved in development of the proposal. This had affected their commitments towards execution of the PIDDC supported activities.. It is
therefore recommended that these officers should get involved in preparation of the
proposal and then in its execution.
• The proposals submitted for funding from PIDDC were reported to be not fully
comprehensive. It was therefore suggested that PIDDC should provide some funding
for pre-proposal stage so that the state could undertake a quick study to assess
“strengthening needs of the tourist destination/circuit”. This small fund could help in
ensuring that the proposal submitted was comprehensive where views of all stakeholders including that of the tourists were taken and included in the proposals.
• The maintenance of the assets created under the scheme did not get enough emphasis.
Therefore, it was suggested that one pre-requisite for acceptance of the proposal should
be that the state sends maintenance plan after strengthening was done by PIDDC. The Ministry of Tourism, Government of India should insist to receive a plan of
maintenance as a part of the proposal. In this way, commitment of the state would be
ensured in long term maintenance of the tourist site.
• Many states expressed need for technical guidance/support to develop a comprehensive
proposal and optimally utilize funding received to achieve the project goals. It is,
therefore, recommended that the Ministry of Tourism should have a technical
committee attached to PIDDC to scrutinize the proposal received from the states. This
scrutiny should involve site visits to ensure that all the needs of the area were included in the proposal as well as a sound maintenance plan is set up. This approach could
make the proposal more comprehensive and will help improve the tourist sites in the
country.. This committee should also be made responsible for monitoring the execution of the project by periodic visits to the sites. In other words, it is suggested that
MOT should undertake greater role in making proposal better and improving
implementation of the proposal when funded. A group should be formed at MOT
level for review of the proposals, technical guidance in its implementation and
continuous monitoring of the progress of the project. This type of support will
have very high cost-effectiveness of the PIDDC scheme supported projects.
• The limits of funding put in the scheme should be flexible. A review of the needs of
the tourist sites should allow justifying higher level of funding and recommending relaxation of the financial limits. Even changes in the funding lines may be allowed.
• The PIDDC scheme provided 100% funding from the Central government. On the
basis of our (GfK MODE’s) earlier experience with other such schemes, we
recommend that states might be asked to contribute a small part of the funding for the project submitted for PIDDC support (say 10%). This will improve the quality of
execution as states would have more commitment and better monitoring.
GfK MODE
PIDDC Report Jan, 2013
x
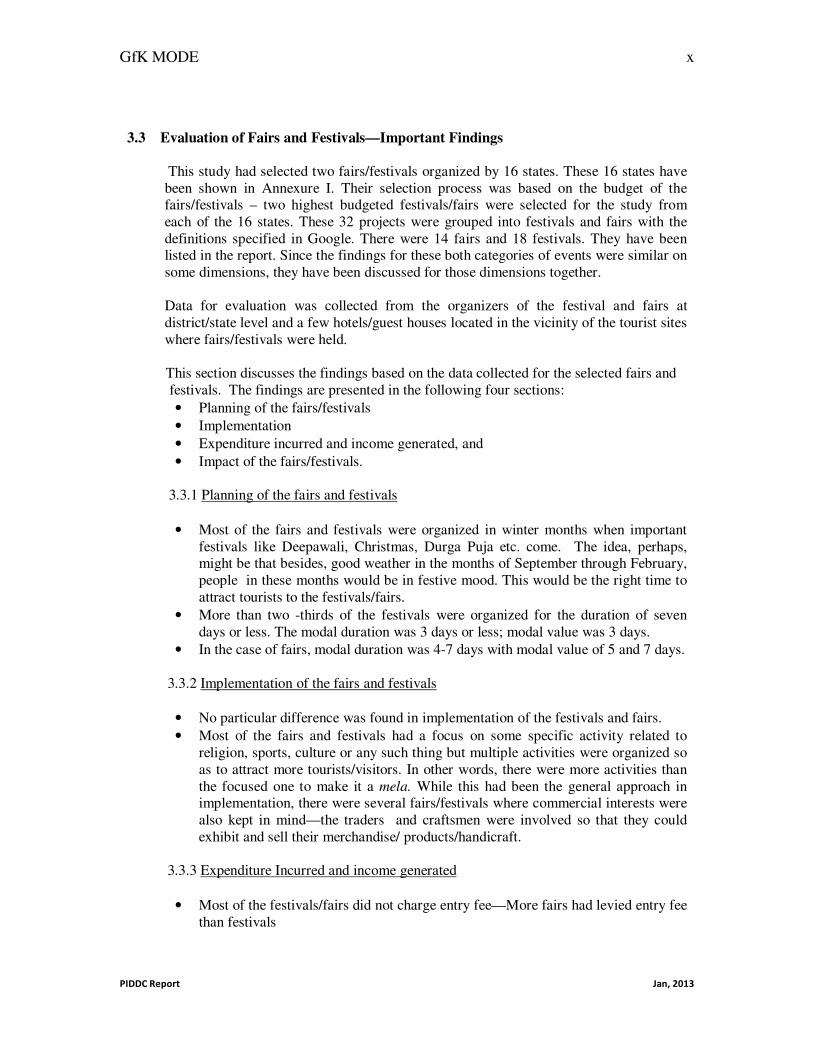
3.3 Evaluation of Fairs and Festivals—Important Findings
This study had selected two fairs/festivals organized by 16 states. These 16 states have
been shown in Annexure I. Their selection process was based on the budget of the fairs/festivals – two highest budgeted festivals/fairs were selected for the study from
each of the 16 states. These 32 projects were grouped into festivals and fairs with the
definitions specified in Google. There were 14 fairs and 18 festivals. They have been listed in the report. Since the findings for these both categories of events were similar on
some dimensions, they have been discussed for those dimensions together.
Data for evaluation was collected from the organizers of the festival and fairs at
district/state level and a few hotels/guest houses located in the vicinity of the tourist sites
where fairs/festivals were held.
This section discusses the findings based on the data collected for the selected fairs and
festivals. The findings are presented in the following four sections:
• Planning of the fairs/festivals
• Implementation
• Expenditure incurred and income generated, and
• Impact of the fairs/festivals.
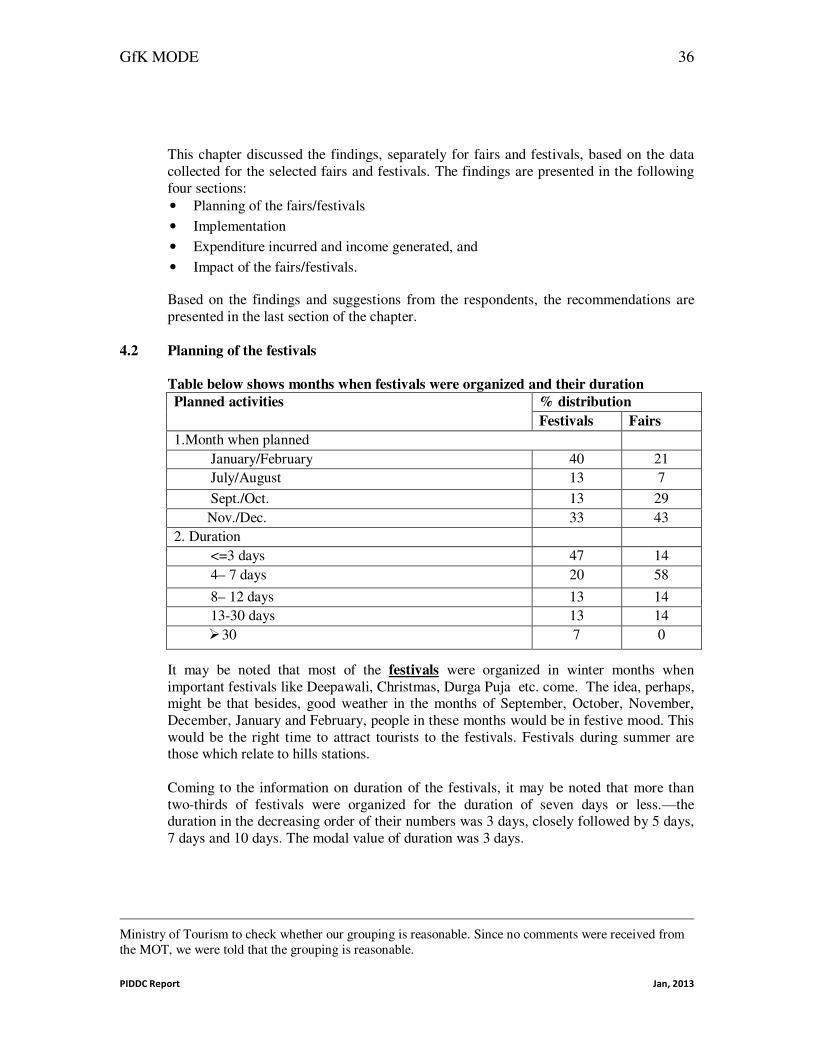
3.3.1 Planning of the fairs and festivals
• Most of the fairs and festivals were organized in winter months when important
festivals like Deepawali, Christmas, Durga Puja etc. come. The idea, perhaps, might be that besides, good weather in the months of September through February,
people in these months would be in festive mood. This would be the right time to
attract tourists to the festivals/fairs.
• More than two -thirds of the festivals were organized for the duration of seven
days or less. The modal duration was 3 days or less; modal value was 3 days.
• In the case of fairs, modal duration was 4-7 days with modal value of 5 and 7 days.
3.3.2 Implementation of the fairs and festivals
• No particular difference was found in implementation of the festivals and fairs.
• Most of the fairs and festivals had a focus on some specific activity related to
religion, sports, culture or any such thing but multiple activities were organized so
as to attract more tourists/visitors. In other words, there were more activities than
the focused one to make it a mela. While this had been the general approach in implementation, there were several fairs/festivals where commercial interests were
also kept in mind—the traders and craftsmen were involved so that they could
exhibit and sell their merchandise/ products/handicraft.
3.3.3 Expenditure Incurred and income generated
• Most of the festivals/fairs did not charge entry fee—More fairs had levied entry fee
than festivals
GfK MODE
PIDDC Report Jan, 2013
xi
• Thus, most of the festivals had no income from this (entry fee) important source.
Therefore, most of the festivals depended on the grants they had received from the
governments, both Central and the State. Only thirty three percent festivals and 64
percent fairs had generated some income..
• Though fairs/festivals were organized by sharing the cost between the Centre and
the States, many festivals mentioned need of small additional grant from the state – as cost over-ran the initial estimates. This happened in the case of both fairs and
festivals --57 percent of them.
3.3.4 Impact of the festival
Three questions related to the impact were asked from both categories of respondents (organizers of the festivals and hoteliers/guest house operators) for both categories of
events. These questions were:
1. Attendance at the festival,
2. Impact of the festival on number of tourists in the area during festival days and after, and
3. Role of festivals in increasing tourism.
Findings from these questions have been given below.
• There was a large variation in the reported number of the attendees in the festivals.
This was so as there was no data collected/maintained on the numbers who actually attended the festival/fairs; every respondent to the question had his/her
own guess on the numbers who attended the fairs or festivals. In the case of
ticketed festivals (which was only a small percent) the number of attendees
reported were quite encouraging.
• In the case of ticketed fairs, attendance reported varied between 100,000 to
150,000.
• All organizers of the fairs/festivals reported increasing trend in tourism by about 5
to 10 percent per year after the event. The hoteliers located around the festival
sites also reported (a) about 100% occupancy of their rooms during the festival days, and (b) increase in occupancy of about 2 to 5 percent per year after the
festival.
• In order to attract more tourists, both categories of respondents pointed out need
for improvement in the infrastructure and quality of services at the tourist sites where fairs/festivals were held. Particular needs were pointed out for the toilets,
drinking water, parking lots and the food courts.
• The fairs/festivals promoted tourism in two ways--by increasing the number of
tourists during the festival days and by changing the mindset of people who
became favourable to tourism, in general. That is, fairs/festivals, in the long run, tended to increase tourism
• The festivals/fairs also helped in spreading awareness of the local culture, art,
handloom, handicraft and industry. These products got boost.
• It was pointed out that the fairs/ festivals also have commercial value as festivals/fairs increased interest in local items and handicrafts. It ultimately
increased demand for these items, leading to more varied production and better income for the local traders.
GfK MODE
PIDDC Report Jan, 2013
xii
• Such fairs/festivals created more self-employment opportunities. Local people
could get short and long term employment.
3.4 Recommendations for greater effectiveness of the Fairs and Festivals
Based on the ideas of the local organizers of the festivals and the results of this
evaluation study, its impact and the role it played or could play, the following recommendations are made:
1. Every district should organize such fairs/festivals, at least once a year, to cultivate
tourism in the country which has several benefits. In the initial stages, such
festivals/fairs would attract local visitors and families who would start enjoying such visits and ultimately become tourists. In order to make the visits more
attractive and enjoyable, the tourist/festival sites should have all or most of the
civic amenities (more details have been discussed in point 10 later, in this section).
2. It was suggested that such festivals should be held at most of the important tourist
sites in every state and in districts even if they did not have tourist site as such.
This was only possible if such festivals could be made “almost” self-supporting. For this purpose, organizers had suggested need for exploring the following
possible sources of revenue:
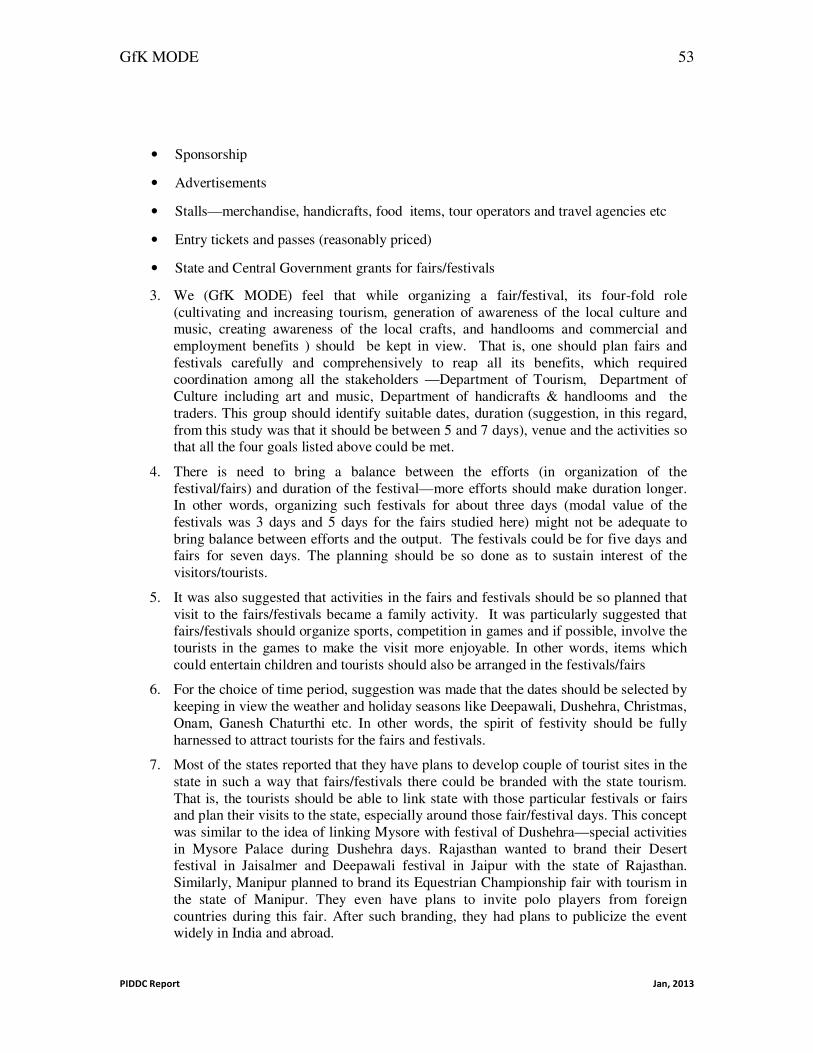
• Sponsorship
• Advertisements
• Stalls—merchandise, handicrafts, food items, tour operators and travel
agencies etc
• Entry tickets and passes (Reasonably priced)
• State and Central Government Grants for fairs/festivals
3. We (GfK MODE) feel that while organizing a fair/festival, its four-fold role (cultivating and increasing tourism, generation of awareness of the local culture
and music, creating awareness of the local crafts, and handlooms and commercial
and employment benefits ) should be kept in view. That is, one should plan fairs
and festivals carefully and comprehensively to reap all its benefits, which required coordination among all the stakeholders —Department of Tourism, Department of
Culture including art and music, Department of handicrafts & handlooms and the
Traders. This group should identify suitable dates, duration (suggestion, in this regard, from this study was that it should be between 5 and 7 days), venue and the
activities so that all the four goals listed above could be met.
4. There is need to bring a balance between the efforts (in organization of the festival/fairs) and duration of the festival—more efforts should make duration
longer. In other words, organizing such festivals for about three days (modal value
of the festivals was 3 days and 5 days for the fairs studied here) might not be
adequate to bring balance between efforts and the output. The festivals could be
for five days and fairs for seven days. The planning should be so done as to
sustain interest of the visitors/tourists.
GfK MODE
PIDDC Report Jan, 2013
xiii
5. It was also suggested that activities in the fairs and festivals should be so planned
that visit to the fairs/festivals became a family activity. It was particularly
suggested that fairs/festivals should organize sports, competition in games and if possible, involve the tourists in the games to make the visit more enjoyable. In
other words, items which could entertain children and tourists should also be
arranged in the festivals/fairs
6. For the choice of time period, suggestion was made that the dates should be
selected by keeping in view the weather and holiday seasons like Deepawali,
Dushehra, Christmas, Onam, Ganesh Chaturthi etc. In other words, the spirit of festivity should be fully harnessed to attract tourists for the fairs and festivals.
7. Most of the states reported that they have plans to develop couple of tourist sites in
the state in such a way that fairs/festivals there could be branded with the state
tourism. That is, the tourists should be able to link state with those particular festivals or fairs and plan their visits to the state, especially around those
fair/festival days. This concept was similar to the idea of linking Mysore with
festival of Dushehra—special activities in Mysore Palace during Dushehra days. Rajasthan wanted to brand their Desert festival in Jaisalmer and Deepawali festival
in Jaipur with the state of Rajasthan. Similarly, Manipur planned to brand its
Equestrian Championship fair with tourism in the state of Manipur. They even have plans to invite polo players from foreign countries during this fair. After such
branding, they had plans to publicize the event widely in India and abroad. The
Ministry of Tourism could use its cultural attaches in Indian embassies and its own
tourism departments to publicize these fairs/festivals well in advance so that tour operators could plan their packaged tours and foreign tourists could plan their
visits during these festivals/fairs. In this publicity of the fairs/festivals, interests of
tourism, culture, handicrafts and shopping should be highlighted so that these festivals could appeal to all groups of people with varied interests.
8. Keeping this view in mind, it is recommended that each state should have at least
one important festival/fair as its brand festival/fair for the state. It should be
celebrated at some important and interesting tourist site on a grand scale so as to attract tourists to the state. As far as possible, dates and periodicity of such a
festival should be so fixed that tourists could plan well in advance to visit the
fair/festival. The Ministry of Tourism, Government of India, could help the states to coordinate the dates of such brand festivals/fairs so as to avoid overlap and
enable tourists, particularly foreign tourists, to visit more than one such
festivals/fairs ( in more than one state) during their trip.
9. As far as the states are concerned, they should capitalize on the visit of the tourists to the brand festival/fair. Make it a show case to show all their art, music, culture,
food, dressing/textile, and other tourist sites in the neighbourhood. In other words,
careful planning should be done to show tourists all the important things of the
state by organizing at the site being visited and/or by taking them for short
packaged trips. This would make stay in the state longer.
GfK MODE
PIDDC Report Jan, 2013
xiv
10. Suggestions were made for strengthening the infrastructure at the tourist sites
where fairs/festivals were held so that the visits could be made more attractive and
satisfying during the festivities. The following needs of the tourist sites were
particularly highlighted by the organizers of the festivals:
• Sanitation services and facilities
• Drinking water facilities
• Good transportation facilities
• Parking facilities
• Construction of approach roads
• Development of picnic spots
• Lodging facilities to meet needs of all categories of tourists
For this purpose, states should utilize the funding of the Ministry of Tourism,
Government of India, under the PIDDC scheme, to develop necessary infrastructure
and services needed by the tourists.
GfK MODE
PIDDC Report Jan, 2013
1
CHAPTER I
INTRODUCTION
1.1 Background
Tourism is one of the largest sectors of the service industry in India. It is capable of
providing employment to a wide spectrum of job seekers from unskilled to the
specialized one. Therefore, the Planning Commission has identified tourism as the second largest sector in the country in providing employment opportunities for low-skilled and
semi-skilled workers. In addition, tourism sector creates more employment opportunities
(jobs and petty trade) for women compared to other modern sectors. Thus, healthy growth of tourism sector is one sure way of bringing about inclusive growth in the
country. Despite its great relevance and importance, the potential of tourism sector of
India has not been adequately harnessed because of poor infrastructure-- the tourists who
visit India are generally reported to be not fully happy and satisfied. They point out several gaps which need to be filled.
The overall resource constraint of the country in the initial years after Independence had resulted in lower allocation to this sector. Over the years, with improvement of country’s
resources, the Planning Commission, Government of India and its counterpart at state
level have been increasing allocation to this sector. In other words, more resources, greater commitment to exploit potential of tourism sector and more efforts to use the
resources effectively are some of the factors being adopted to improve tourism in the
country.
The Ministry of Tourism, Government of India and the corresponding Departments of
Tourism in the states, with increased financial resources, have been taking up steps to
increase and harness tourism potential for the country and the states at faster pace. The first obvious step in this endeavor has been to build and improve infrastructure at the
tourist sites in the country/states so that tourists go back with happy and fruitful
experience from their tourism related visits. Their satisfaction with the visit can be an
important step and will go a long way to add force to the message of “Incredible India” and attract more and more tourists.
In this effort, the Ministry of Tourism (MOT), Government of India has been funding the states to build and strengthen the existing infrastructure at the tourist sites to make the
destination more attractive for tourism and consequently for job opportunities of the
people. Such efforts started in the ninth Five year plan in the form of financial assistance for specific activities like construction of budget accommodation, tourist complexes etc.
These individual activities were pooled into full-fledged schemes in the 10th Five Year
plan so that the states could request funds for building/improvement of the sites in more
integrated/comprehensive fashion. This scheme of the 10th five year plan was further streamlined in the 11th five year plan.
The eleventh five year plan document of the Planning Commission states:
“Tourism is the largest service industry in the country. Its importance lies in being
instruments for economic development and employment generation”.
GfK MODE
PIDDC Report Jan, 2013
2
Therefore, this plan made further efforts to harness full potential of tourism sector by
improving infrastructure. This centrally sponsored scheme focuses on integrated
infrastructure development of tourism circuits/destinations and also on the improvement of the existing products as well as development of new tourist products (PIDDC).
In order to attract tourists there is one more scheme where states would be funded if they organize fairs/festivals to invite the tourists. This scheme aims at promoting tourism –
people will come to enjoy fairs/festivals and will ultimately convert to be tourists.
1.2 Product/Infrastructure Development for Destinations and Circuits (PIDDC) Scheme
The focus under this revised/streamlined scheme (in 11th five year plan) is on
improvement of existing products and development of new tourism products, meeting the world standards. It also focused on integrated infrastructure development of the tourist
sites. The Ministry of Tourism extends 100% Central Financial Assistance to the State
Governments/Union Territory Administrations for tourism projects identified in consultation with them. This assistance is up to Rs. 5.00 crore for the development of
Destinations and Rs. 8.00 crore for Circuits. Several mega tourist destinations and
circuits with maximum cost of 25 to 50 crores were also sanctioned under the scheme.
The aim was to develop the circuits and destinations in integrated holistic manner so as to
provide all infrastructure facilities required by the tourists. The assistance under this
scheme was provided for the following:
• Improvement of the surroundings of the destination
• Illumination of the tourist destination and area around
• Providing for improvement in solid waste management and sewerage management,
public conveniences
• Improvement of road connectivity leading to tourist sites, especially from national
highways/state highways and other entry points
• Construction of wayside public conveniences
• Construction of budget accommodation, restaurants and wayside amenities
• Procurement of equipments directly related to tourism like water sports, adventure
sports and eco-friendly modes of transportation
• Construction of public buildings which are required to be demolished because of
implementation of the Master Plan
• Refurbishment of monuments
• Signages and display boards showing tourist area maps and documentation on places
of interest
• Tourist Arrival Centres, Reception Centres and Interpretation Centres
• Improvement of municipal services directly related to Tourism, and
• Other work/activities directly related to tourism
It should be obvious that these areas of infrastructure strengthening clearly cover
comprehensive and integrated strengthening/improvement of the sites. Such
strengthening is expected to make the tourist sites more interesting and thus improve
satisfaction of the tourists. This will be the step to ensure that more tourists visit the site.
GfK MODE
PIDDC Report Jan, 2013
3
1.3 Assistance for organizing Fairs, Festivals and Tourism related Events
In addition to strengthening the tourism infrastructure, supported under the above listed scheme, the Ministry of Tourism (MOT) also provided financial assistance for organizing
fairs, festivals and tourism related events like seminars, conclaves, conventions etc. for
promotion of tourism. Under this scheme, the assistance was being provided for the following items:
• Creation of semi-permanent structures
• Production of posters, pamphlets, advertisements in newspaper and production of
film
• Remuneration of artists, and
• Sitting arrangements, lighting, sound, lodging and boarding, transportation, hiring of
space and other similar activities.
1.4 Evaluation of the schemes undertaken in 11th five year plan
The Ministry of Tourism, Government of India is interested in evaluation of these two schemes (Product Infrastructure Development for Destinations and Circuits and
Organizing Fairs, Festivals and Tourism related Events) of the 11th five year plan so as
to (i) assess impact of the schemes, and (ii) learn lessons to further strengthen/modify the schemes in next plan periods for improved impact on tourism.
The agency GfK MODE was selected, after due tendering process, to undertake this evaluation in 16 states and two UTs; all the mega projects funded in the 11th five year
plan were also to be evaluated. This report presents findings of this evaluation.
GfK MODE
PIDDC Report Jan, 2013
4
CHAPTER II
DATA AND METHODS
This chapter presents the details of the projects which were evaluated and their method of
selection. It also presents methods/approach adopted for the collection of data, its analysis and writing of the report.
2.1 Objectives of the evaluation
The objectives of the study, listed in the Terms of Reference document of the Ministry of
Tourism, are.
1. To evaluate the impact and effectiveness of the schemes in terms of the following parameters:
• Tourist arrivals
• Creation of infrastructure like accommodation units, travel agencies, guides
services etc
• Employment generation
• Income creation, socio-economic upliftment of local people
• Overall development of the area
2. To evaluate the system of maintenance of various facilities created at the circuits/ destinations, and its sustainability
3. To get perceptions, experience and expectations of tourists, both foreign and
domestic, about the circuit/destination, and the facilities
4. To make recommendations, in the context of the findings that flow from the study for making modifications in the scheme guidelines
5. To assess the awareness about the scheme amongst tourists/tour operators/travel
agents/tourist guides etc.
2.2 Selection of the projects for evaluation
2.2.1. Number of the projects for evaluation
The Terms of Reference of the Ministry of Tourism had specified the following
coverage of the projects:
Projects supported in 11th
five year plan Required Coverage
Mega projects All in India
Circuits 3 each in 16 states and 1each in two UTs
Destinations 2 each in 16 states and 1each in two
UTs
Fairs/festivals/Tourism related Events 2 each in 16 states
In all, 151 projects, spread over 35 Mega projects, 50 Circuits, 34 Destinations and 32
Fairs/festivals were covered.
2.2.2. Selection of the projects
Two criteria were specified for the selection of the projects for evaluation:
• Completed projects should be the first priority; if required number is not available,
then the ongoing ones will be selected
• Selection should be done by order of sanctioned amount.
The website of the MOT was searched for developing three sampling frames of all the
projects, namely, circuits, destinations and fairs/festivals sanctioned under PIDDC
during the 11th five year plan. It was found (in website link) that there were 117 Circuits,
337 Destinations and 155 Fairs/Festivals/ Events supported by MOT in 11th five year plan1. Three sampling frames were formed for selection of (i) Circuits, (ii) Destinations,
and (iii) Fairs/Festivals/Events. The following method was adopted:
• Sampling frame of circuits/destinations was first arranged in completed and ongoing
projects categories. (This was done on the basis of information on the amount
sanctioned and amount pending utilization certificate (UC) on Feb., 2012. If
difference between the two was zero, it was assumed that project is completed).
• The list of the completed projects was arranged by decreasing sanctioned amount and
the required number (3 circuits and 2 destinations from each state) of projects were
selected from the top.
• The remaining numbers of projects were selected from the list of ongoing projects by
arranging them according to decreasing sanctioned amount and the required number
was selected from the top.
• In the case of Fairs/Festivals/Events, the list was arranged by the decreasing
sanctioned amount of budget and required number was selected from the top.
• All the mega projects were covered for evaluation.
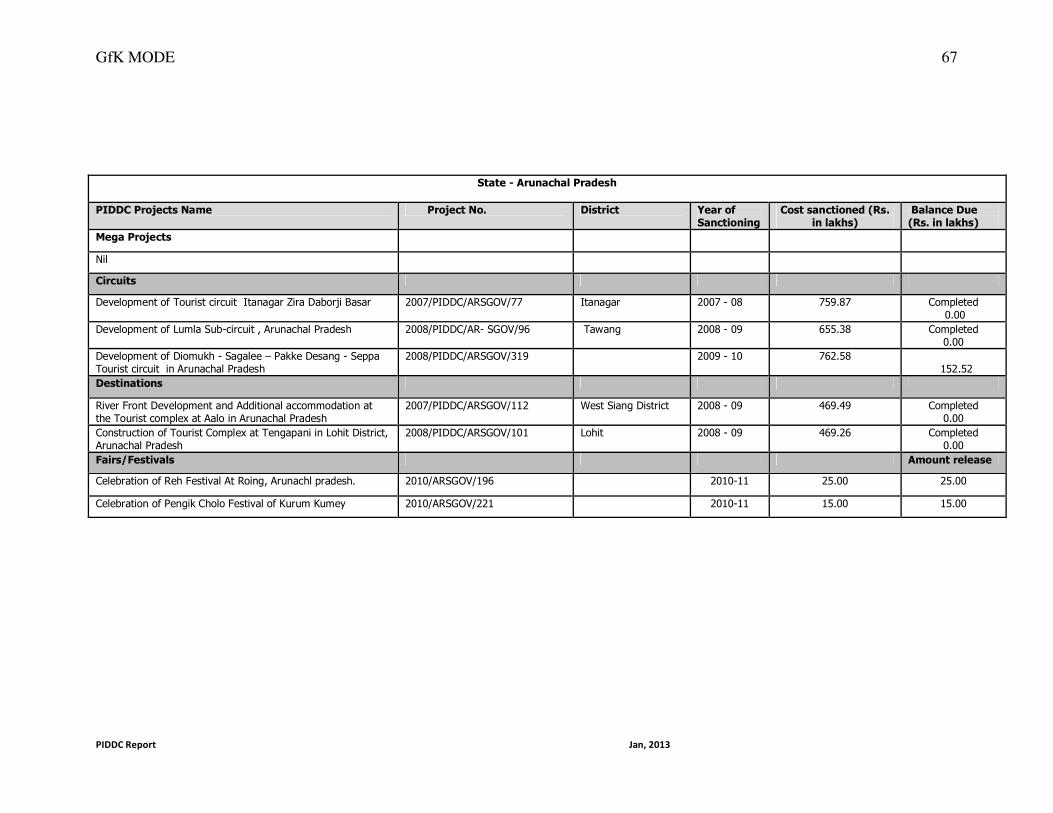
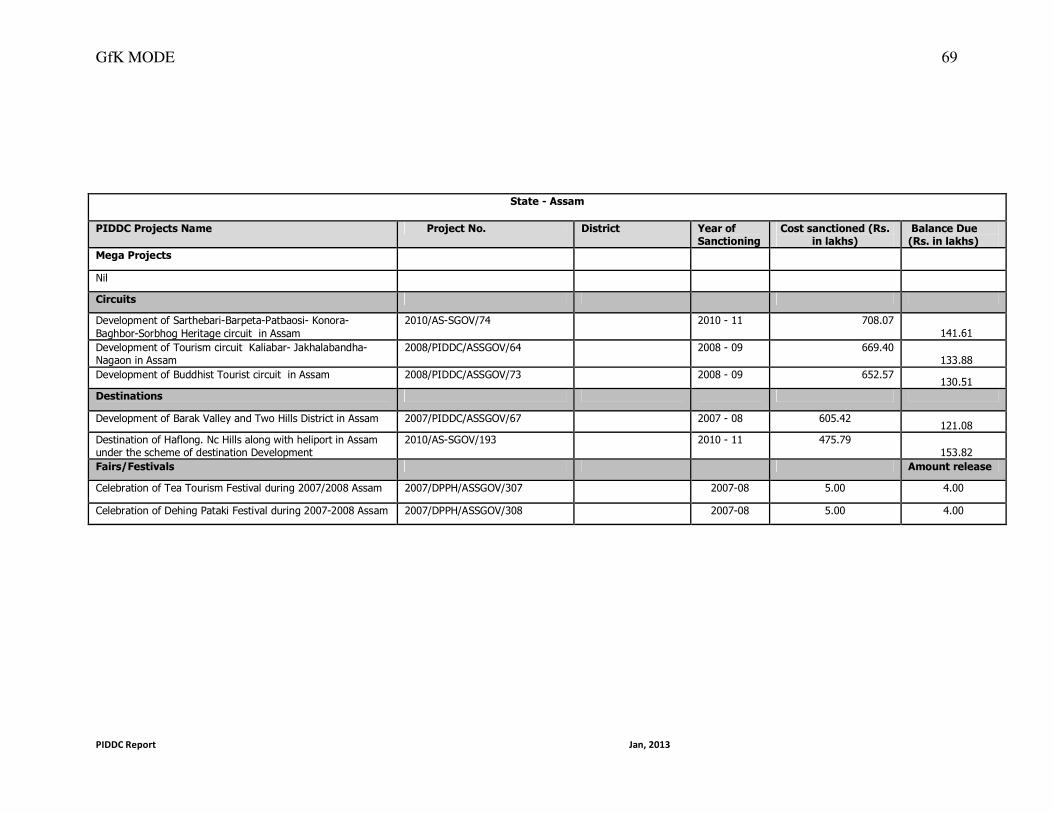
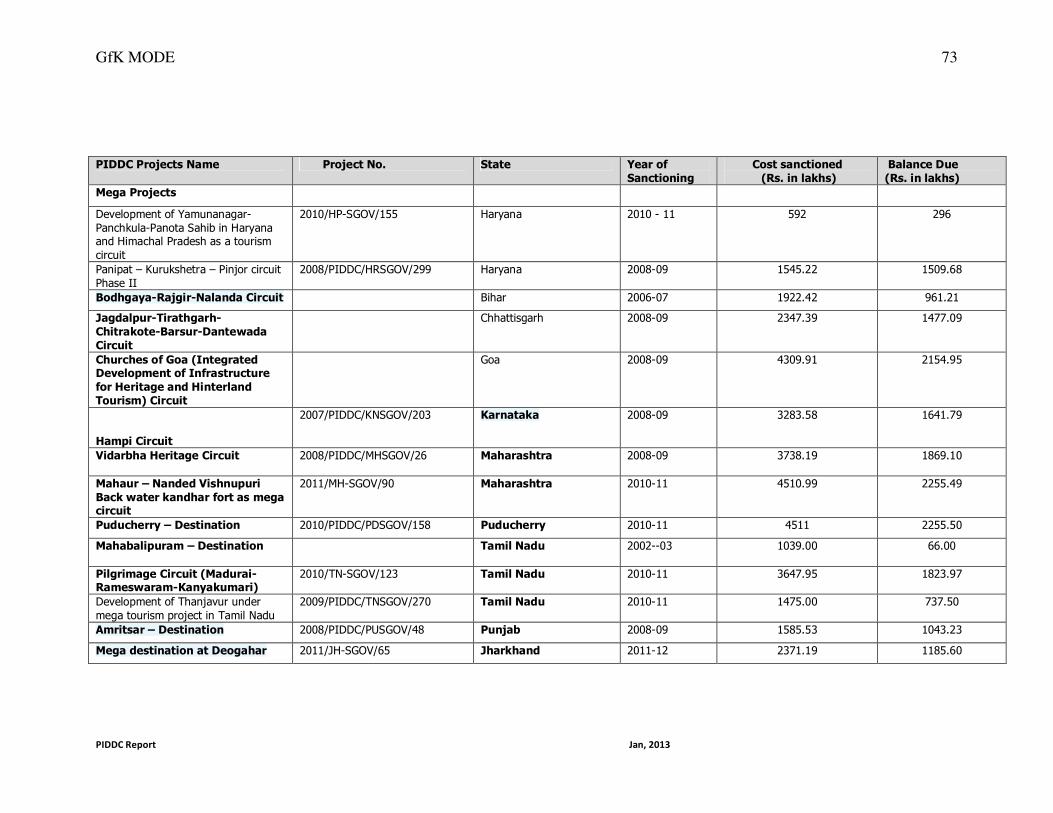
Following this method, projects selected for evaluation, state-wise, are shown in Annexure I.
Three important objectives of the study were to assess increase in tourist traffic, increase in employment and increase in income of the local people. While the former set of data
should be available from secondary sources if such data were maintained, the latter set of
data had to be collected by interviewing the stakeholders at the destinations/circuits which had been strengthened. Therefore, it became necessary to interview all the
stakeholders who were servicing the needs of the tourists (or were affected by tourists) at
the tourist sites under study.
The following questionnaires were developed for such interviews:
(1) For evaluation of the impact of Mega projects, Circuits and Destinations
• Questionnaire for district level officer
• Questionnaire for Tourist Office/Reception Office at the site
• Questionnaire for Tourist guides
• Questionnaires for Hotels/Guest Houses
• Questionnaire for Travel agents/ Tour Operators
• Questionnaire for Bus/Taxi Operators
• Questionnaire for Restaurants
• Questionnaire for Gift/Souvenir Shops
• Questionnaire for Tourists
(2) For evaluation of the impact of Fairs/Festivals
• Questionnaire for Officers responsible for organization/coordination of
Fairs/Festivals
• Questionnaire for Hotels/Guest Houses near the place of Fairs/festivals
Thus, nine questionnaires were developed for impact evaluation of the
mega/circuits/destinations and two for the fairs/festivals. They are attached in Annexure
II. These questionnaires had most of the information required to meet the objectives of
the evaluation. It may be stated that information collected was factual as well as the
perception of the respondents. In order to make sure that the perceptions are given
after careful thinking, the respondents were asked justification of their perception.
In other words, reporting on perception was based on the respondents’ well-
considered views, “thoughtful perception” and not just “some answers’ to the
perception question.
2.4 Approach adopted in impact evaluation of the PIDDC scheme
In view of the large number of projects and the stated objectives of the study “Impact
Evaluation of the PIDDC scheme”, it was decided that the evaluation will be for PIDDC scheme (by pooling data collected for all the three categories of projects-Mega, Circuits
and Destinations) and for the fairs/festivals separately.
GfK MODE
PIDDC Report Jan, 2013
7
This decision for combining three categories of projects was taken in view of the fact
that objective of the study was to evaluate the PIDDC scheme and from the fact that
combining all the projects will have sample size large, with the result that the computed indicators will have more reliable and stable estimates of parameters.
2.5 Selection of the respondents from different categories of stakeholders
While looking at the project proposals for which assistance was received under PIDDC
scheme, it was found that some circuits and mega circuits were spread over several districts and there were several tourists sites covered within the districts covered by the
selected projects. In view of the time limit and budget resources, it was decided to cover
all the districts in which a particular project was spread but cover only two major (where
fund commitment was the highest) project sites within a district. A sample of stakeholders (for whom questionnaires were developed --listed in the section 2.3 above)
was taken from these selected sites. All efforts were made to select 10 stakeholders if
more than 10 existed within a radius of 10 Kms of the selected tourist circuit/destination. In case, their number was less than 10, they all were covered. Thus, the expected
coverage of different stakeholders for each project was the following:
Stakeholder No.
District/state tourist officer of the project 1
Reception officer of the site 1
Hotels 10
2
Guest houses 10
Taxi operator 10
Bus operators 10
Restaurants 10
Souvenir shops 10
Tourists 50 or all available during three days’ of field work
No. of tour operators, travel agents,
Tourist Guides
All available, during visit
This number was to be selected by statistically valid sampling technique, if the available
number at the site was larger than the number decided to be covered. For this selection,
the field teams were to make a listing of all the stakeholders within a radius of 10 Kms and send to the research team in Delhi. The research team adopted a stratified random
sampling technique and selected the stakeholders and sent the list to the field teams for
data collection.
2 The number was 10 stakeholders if more than 10 existed. All stakeholders were covered if their number
was less than 10 stakeholders in the radius of 10 Kms.
GfK MODE
PIDDC Report Jan, 2013
8
2.6 Training for the field work
The Field Executives for all the states where projects were located were called for two-day training in Delhi on July 20-21, 2012. They were given training on the study design,
questionnaires and had mock interviews to ensure understanding of all the questions;
they were also handed out a list of the selected projects and the selected project sites (for each project that was spread over several sites) where field work was to be undertaken.
They were instructed to hold a meeting with the tourist officers responsible for
implementation of the selected projects to understand the projects before sending the field teams for data collection.
All Field Executives met the Tourist officers responsible for the selected projects,
understood the implementation of the projects and decided the field strategy (in consultation with the research team in Delhi). Once these details were worked out and
decided, three two-member field teams were trained for each state. They were taken to
the field for practicing data collection work. Once the Field Executive was sure that the field teams had understood the logistics of the field work and could start field work
independently, they were sent for data collection. Most of the field work was completed
in the month of August 2012 except a few gaps for different stakeholders, particularly for district/state tourist officers for PIDDC and organizers of fairs/festivals. The month
of September was utilized to fill these gaps.
2.7 Data quality assurance
The following steps were taken to ensure quality of data collected:
• The study design was prepared in view of the experiences GfK MODE had in a
similar project in Odisha
• The questionnaires prepared, particularly for the district/state tourist officer was
field tested. All questions related to perception were followed by “give justification of the response on perception”. .
• A field manual was prepared for the field teams as a ready reference.
• The Field Executives had understood all the sampled projects before training the field teams so that the field teams were given all the necessary instructions for
collection of data from the stakeholders for the individual projects.
• The field teams were continuously in touch with the researchers in Delhi by mobile
for any clarifications needed.
• The researchers were continuously in touch with the field teams by phones and
personal visit to ensure that field work was being done as per instructions.
• The data was being scrutinized in the field and then by the researcher continuously
and regularly
GfK MODE
PIDDC Report Jan, 2013
9
2.8 Analysis of data
Since quite a few questionnaires were open-ended, our first step was to code the open-
ended questions. The codes were developed by manual tabulations of the questions for a
few questionnaires. Since the number of questionnaires of most of the stakeholders and projects were small in number, the tabulation was done manually and by computerizing
them.
2.9 Report writing
The report consisted of the following chapters:
• Chapter I: Introduction
• Chapter II: Data & Methods
• Chapter III. Evaluation of PIDDC scheme
• Chapter IV. Evaluation of Fairs/Festivals
• Chapter V: Summary Findings and Recommendations
A draft report was prepared and presentation was made to the Officers of the Ministry of
Tourism. The final report was prepared by incorporating the comments received during the presentation of the draft report. The final report is preceded by a chapter “Executive
Summary” in the format of stand-alone chapter.
GfK MODE
PIDDC Report Jan, 2013
10
CHAPTER III
EVALUATION OF PIDDC SCHEME
3.1 Background
The evaluation of the PIDDC scheme is based on the study of all the 35 mega projects,
selected 50 Circuits and 34 Destinations supported by the Ministry of Tourism,
Government of India in the 11th Five Year Plan. They were spread over 24 states and
UTs. The method of selection has been discussed in second chapter of the report. The data was collected from all the stakeholders at the selected tourist
sites/destinations/circuits where the selected projects were located. These stakeholders
were:
Department of Tourism
• State/District Tourist Officer responsible for implementation of the selected project
• Reception office/Ticket office located at the site of the selected project
Other Stakeholders
• Tourist Guides
• Hotels/Guest Houses
• Tour Operators/ Travel Agents
• Bus/ Taxi Operators
• Restaurants
• Souvenir shops
• Tourists
This chapter discusses the findings based on the data collected from all the stakeholders
of the selected projects. Names of the selected projects, Mega, Circuits and Destinations, state/UTs wise, are shown in Annexure I.
The evaluation findings are presented in the following sections:
• Awareness of the PIDDC scheme and their sources
• Measures taken for maintenance and sustainability of the assets created
• Process of development of the project proposal
• Experiences of implementation of the project and its current status
• Impact of the PIDDC scheme
• Current status of tourism infrastructure at the tourist sites in the districts covered, and
• Suggestions for strengthening the PIDDC scheme
3.2 Awareness of the PIDDC scheme and their sources
All the stakeholders covered in the study were asked whether they were aware of PIDDC,
and its different components. If they had reported awareness of the scheme, they were
further asked about the sources of their awareness. The following Table 3.1 and the figure 1 give information on the awareness of the PIDDC scheme and its different components
and sources of their information.
GfK MODE
PIDDC Report Jan, 2013
11
Table 3.1: Awareness of the scheme, its different components and the sources of information
Information District/
State
Officer
Reception
Centre/
Ticket
office
Tourist
Guide
Hotel/Guest
house
Restau
rants
Tour
operator/
Travel
agency
Bus/Taxi
operator
Souvenir
Shop
1. % aware of
PIDDC
65 45 33 11 15 5 27 21
2. Sources of awareness (%)
MOT Website 29 13 3 11 3 2 3 1
Circular /letter 91 35 13 7 11 13 4 4
Newspaper
adv.
5 52 37 79 86 88 82 74
Other agencies/
beneficiaries
4 9 17 16 16 4 14 28
3. Awareness of components (%)
Construction of
budget
accommodation
45 13 13 30 21 25 14 25
Tourist
complexes
77 52 7 36 41 42 49 45
Wayside
amenities
58 56 23 34 39 42 47 41
Tourist
reception
centres
57 43 17 27 34 40 38 30
Refurbishment
of monuments
54 30 17 36 37 25 29 32
Special tourism
projects
45 35 17 21 18 27 30 7
Adventure and
sports facilities
38 13 7 29 26 31 25 25
Sound and light
shows and
illumination of
monuments
58 48 33 23 28 27 37 26
GfK MODE
PIDDC Report Jan, 2013
12
Fig1: Awareness of the PIDDC Scheme among stakeholders
(%)
65
4533
11 155
2721
0
10
20
30
40
50
60
70
District/
State
Officer
Reception
Centre/
Ticket office
Tourist
Guide
Hotel/Guest
house
Restaurants Tour
operator/
Travel
agency
Bus/Taxi
operator
Souvenir
Shop
The following are the findings:
• Only 65 percent of the district/state tourism officers were aware of the PIDDC
scheme. This percent looks to be too low, particularly as the projects sanctioned
under the scheme were supposed to be implemented by them or at least under their
supervision though some of them may be new since the projects being evaluated here
may have been initiated in the beginning years of the 11th five year plan.
• The awareness of PIDDC was lower (45%) in the staff manning the Reception
Centres/Ticket counters at the tourist sites being evaluated.
• This awareness was still lower among the other stakeholders
• Regarding the source of awareness of the PIDDC scheme, district/state tourist
officers got to know about the scheme from the government circulars; other
stakeholders learnt about it from the newspaper advertisements.
• When the respondents (stakeholders) were asked about awareness of the components
of the scheme, 50 % or more tourist officers (who were aware of the scheme)
reported awareness of the components: “tourist complexes”, “wayside amenities”,
“Tourist Reception Centres” and “”Sound and light shows and illumination of
monuments”. The awareness of components reported by other stakeholders was still
lower. It may be so because the question had recorded their spontaneous responses on
awareness of the components without any probe of the individual components.
3.3 Measures taken for maintenance and sustainability of the assets created
All the stakeholders were asked about the mode adopted/measures taken and quality of
maintenance of the assets created under PIDDC.
GfK MODE
PIDDC Report Jan, 2013
13
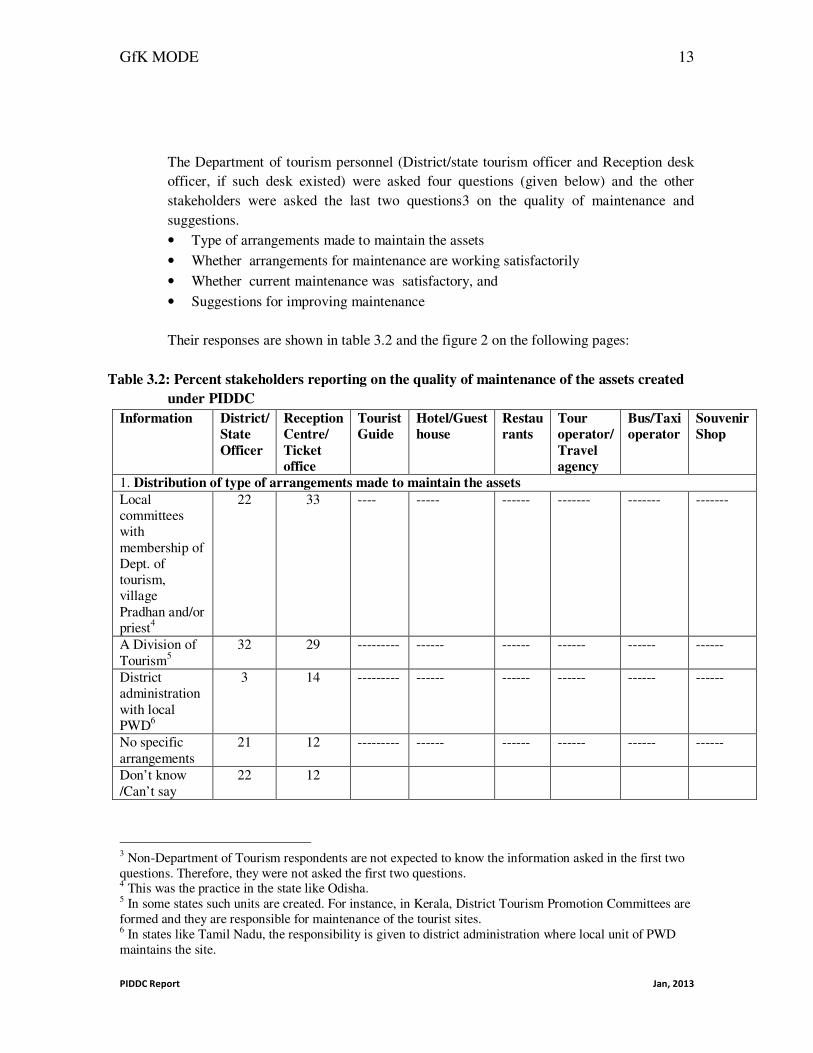
The Department of tourism personnel (District/state tourism officer and Reception desk
officer, if such desk existed) were asked four questions (given below) and the other
stakeholders were asked the last two questions3 on the quality of maintenance and
suggestions.
• Type of arrangements made to maintain the assets
• Whether arrangements for maintenance are working satisfactorily
• Whether current maintenance was satisfactory, and
• Suggestions for improving maintenance
Their responses are shown in table 3.2 and the figure 2 on the following pages:
Table 3.2: Percent stakeholders reporting on the quality of maintenance of the assets created
under PIDDC
Information District/
State
Officer
Reception
Centre/
Ticket
office
Tourist
Guide
Hotel/Guest
house
Restau
rants
Tour
operator/
Travel
agency
Bus/Taxi
operator
Souvenir
Shop
1. Distribution of type of arrangements made to maintain the assets
3 Non-Department of Tourism respondents are not expected to know the information asked in the first two
questions. Therefore, they were not asked the first two questions. 4 This was the practice in the state like Odisha. 5 In some states such units are created. For instance, in Kerala, District Tourism Promotion Committees are
formed and they are responsible for maintenance of the tourist sites. 6 In states like Tamil Nadu, the responsibility is given to district administration where local unit of PWD
maintains the site.
GfK MODE
PIDDC Report Jan, 2013
14
Table 3.2: Percent stakeholders reporting on the quality of maintenance of the assets created
under PIDDC (Contd..)
Information District/
State
Officer
Reception
Centre/
Ticket
office
Tourist
Guide
Hotel/Guest
house
Restau
rants
Tour
operator/
Travel
agency
Bus/
Taxi
operator
Souvenir
Shop
2. Arrangements
are satisfactory
58 65
3.Current
maintenance
satisfactory
59 67 55 37 38 43 49 57
4.Distribution of the suggestions for improved maintenance (%)
Local
Committees with
adequate budget
and monitoring
by the
Department of
Tourism (DOT)
18 47 -- -- -- -- -- --
Tourism
Department
create separate
unit with
monitoring from
DOT
57 43 -- -- -- -- -- ---
No suggestion 25 10 - - - - - -
Note 1: Dash ( --) stands for “information is not applicable as question was not asked to that specific category of
stakeholder
Fig 2: Distribution of type of arrangements made to maintain
the assets reported by district / state tourist officer
22%
32%
3%
21%
22%Local committees like
village Pradhan or priest
A Division of Tourism
Other Govt. Departments
No specific arrangements
Don’t know /Can’t say
GfK MODE
PIDDC Report Jan, 2013
15
It may be noted that 12 to 22 percent employees of the Department of Tourism7 could not
report on the arrangements made for the maintenance of the tourist sites. Another 12 to
21 percent reported that no specific arrangements had been made. Among those who knew the arrangements, the reported (by the district/state tourist officer) maintenance
agency, in the order of decreasing percentage was
• A Division of the Department of Tourism
• Local committees with membership of Department of Tourism, village pradhan and
temple priest etc, and
• Other government departments like district administration including local PWD
It may also be noted that 50 to 60 percent Department of Tourism personnel were
satisfied with the current arrangements for maintenance. Obviously, something more is needed to be done to increase satisfaction with the maintenance quality.
The respondents were further asked whether they could suggest how the quality of maintenance could be improved/ strengthened to make the assets more sustainable. It was
reported that though the maintenance was being done periodically and on-call basis but
there was a need to improve the quality of maintenance because this aspect got very low priority. Suggestions to improve the quality of maintenance were the following:
• Maintenance responsibility could be given to a division in the Department of
Tourism or the local committee with specific responsibility. But the important need
reported was availability of enough budget allocation so that the needed expenses on
maintenance could be met.
• Annual Maintenance Contract (AMC) could be given
• Another important suggestion, repeatedly made, was that some monitoring system
should be set up to make sure that maintenance of the tourist site is continuously
monitored. A senior officer is given responsibility for monitoring the maintenance
and he/ she is held responsible for it.
3.4 Process of development of the project proposal
The proposal for PIDDC support comes from the state tourism department to the Ministry of Tourism, Government of India. The state follows the following steps to prepare the
proposal:
• It identifies tourist sites in the state where infrastructure requires improvement to
attract more tourists. This identification of the tourist site is based on its potential to
invite more tourists (measured by the trend in the number of tourists visiting the site)
and the gaps in the existing infrastructure reported by local office of tourism. In other
words, importance of the tourist site by flow of tourists and infrastructure needs of
the site are the criteria for selection for the PIDDC support.
7 This category includes district/state tourism officers and reception Centre/Ticket offices at the tourist
sites.
GfK MODE
PIDDC Report Jan, 2013
16
• Responsibility of preparation of the proposal for funding is with the Directors of
Tourism of the state. They have been using different modes of preparing the
proposals. In some states, they form committees of the department personnel which
are responsible for preparing the proposal. In some other states, consultants are hired to prepare the proposal. In still other states, district tourist officers and even District
Collectors are given responsibility of preparation of the proposal.
• These identified individuals/groups prepare the proposals, mostly through the process
of consultation with the stakeholders. No special study is undertaken. But Kerala reported undertaking a quick study on tourist traffic, land availability and
available/required infrastructure for the proposal. Emphasis in the proposal is to
build enough quality in the services at the tourist sites. Thus the proposal adds all
those aspects which can improve attractiveness of the site so as to attract more tourists. Here, too, emphasis in the PIDDC proposal is to get support for the
infrastructure which is high-cost.
• It was reported that the proposal is “comprehensive’ in the sense that it has inputs
from all the stakeholders.
• The reported time for preparation of the proposal was 21 days to a month.
• The cost of the preparation has been reported to be about Rs. 50,000. 00
3.5 Experiences of implementation of the project and its current status
Since only Department of Tourism personnel, over-seeing the tourist site, could respond to the experiences of implementation of the project supported under the PIDDC scheme,
six types of information were collected from the District/state Tourist officers
• Process of implementation of the project
• Monitoring the progress
• Type of strengthening done in the tourist destination
• Source of funding and its disbursement for the work to start
• Completion status of the project and its timeliness, and
• Problems faced in its execution
These aspects of implementation have been discussed below in six separate sections.
3.5.1 Process of implementation of the project
The task of implementation of the work was undertaken differently in different states. For
instance, in the state of Kerala, this task was assigned to District Tourism Promotion
Committee; in Odisha, this work was given to Engineering Department of tourism, in UP
it was taken up by UP Nirman Nigam and in Tamil Nadu, responsibility was given to the
District Collector who deployed local wing of PWD . They had to go through all the
formalities like seeking clearance of various concerned departments (like Defence,
and/or Gram Secretary—the situations varied from one site to other), invite and approve
tenders etc to undertake the work.
GfK MODE
PIDDC Report Jan, 2013
17
The respondents were particularly asked whether any board was put up at the project site.
It was reported that most of the states had put up a board with information like name of the project, cost estimates, completion period, name of the implementing agency and the
source of funding as Ministry of Tourism, Government of India.
3.5.2 Monitoring the progress of work
Responsibility of monitoring of the progress was also assigned to different agencies..
They were to send the reports to the Directorate of Tourism of the state who would
monitor the progress through periodic meetings. Though monitoring was being always
done but all the respondents were of the view that there was need to strengthen the monitoring system – it should involve the field visit of a senior officer who should
monitor the progress on the basis of a checklist developed for this purpose.
3.5.3 Type of strengthening done in the 11th Five Year Plan
143 District/State officers (covered in the study) were asked about the infrastructure
which was strengthened in their projects. Their answers have been reported in Table 3.3.
Table 3.3: Percent personnel of the Department of Tourism reported components
strengthened in the sampled projects
Components strengthened District/State officer
Construction of budget accommodation 7
Tourist complexes 8
Wayside amenities 20
Tourist Reception Centres 7
Refurbishment of monuments 38
Special tourism projects 20
Adventure and sports facilities 6
Sound and light shows and illumination of monuments 6
Do not know 30
It may be noted that about 30 percent respondents were not able to answer the question
on type of strengthening done in their projects. It might be because our sample included
all the projects undertaken since 2007-08 (11th five year plan) and many of the officers
interviewed could be new in the position and work might have been completed before
they joined the position.
As per the reported list of the assets created, relatively large percent of the projects (more
than 20%) had strengthened the following components of the project:
• Refurbishment of the monument
• Wayside amenities, and
• Special tourism projects created to make the tourist site more attractive
GfK MODE
PIDDC Report Jan, 2013
18
Fig 3: Distribution of time lag between sanction and implementation
of the PIDDC Project
48%
36%
4%
12%
<=6 months
6 – 12 months
13 - 18 months
More than 18 months
3.5.4 Sources of funding and its disbursement
The district/state tourist officers were asked information on the source of funding to
strengthen the infrastructure at the tourist site—whether funding was exclusively from the MOT, Government of India, or the state also had added funds for strengthening the
components at the tourist sites. The idea was to assess how many projects had stakes of
the states in strengthening the infrastructure8 .
Data was also collected on “time taken to start the project after it was sanctioned”,
considered as an index of the commitment of the state.
Table below and the figure 3 shows percent of projects where funds were given by the
Ministry of Tourism exclusively. It also shows the gap between the time project was
sanctioned and its actual implementation/execution in the field.
The following are the findings:
• Forty seven percent projects received funds exclusively from the Ministry of
Tourism. The remaining projects had received funds from the states also, though
contribution was small. (It may be pointed out that PIDDC funds cover 100% of the project budget)
• Almost 50 percent projects got implemented within six months of sanction (shows
better commitment of the state)
• Sixteen percent projects got implemented after one year of sanction.(shows poorer
commitment of the state).
8 Our earlier experience showed that activities/projects where states had stakes and had allocated funds
from the state budget always got implemented and monitored better.
Information %
1.Projects recd. funds from MOT
exclusively
47
2. Distribution of time lag between
sanction and implementation
<=6 months 48
6 – 12 months 26
13 - 18 months 4
More than 18
months
12
GfK MODE
PIDDC Report Jan, 2013
19
When asked about the reasons for delay in implementation (after the sanction was
received), the district/state Tourist officers gave the following reasons:
Reasons for delay in implementation %
Money received. late 2
Delay in inviting tender and its sanction 35
Delay by the contractor 6
Don’t know 58
It may be noted that majority of the respondents reported that they did not know the
reasons for delay in implementation of the project. It could be due to: (i) no specific
reason for the delay, (ii) non or low priority to the project activities, or (iii) the Tourist
officers were new to the position. The reason stated in (ii) above stood validated when
we found that about 35% projects were delayed because no urgency was shown in
inviting tenders and its scrutiny.
It was reported that the Central Government give about 80% of the funding as advance in
2 to 4 installments. Rest of it was received as reimbursement. No state complained
about the funds; they were received in time and never created any problem which
could delay the completion of the project.
In most of the cases, funds from the Ministry of Tourism, Government of India came to
the state or sometimes directly to the Directorate of Tourism. These funds were
transferred to the executing agency.
3.5.5 Completion status of the project activities
The District/State tourist officers were asked about the completion status of the projects
he/she was implementing. Distribution of their completion status is shown in table given
below. It may be noted that most of the projects were reported to be continuing because
there was still time left for its completion (perhaps time extension has been taken from
the competent authority). Among others which, should have been completed, only half of
them got completed in time and the other half did not complete in time.
Information % distribution
Projects completed in time 27
Projects which are not completed in time 28
Projects which still have time for completion9 45
9 Projects which were reported as “still have time for completion” may have been over-reported. This
hunch got confirmed when we compared these figures with those in table 3.7
GfK MODE
PIDDC Report Jan, 2013
20
Information on completion status of the projects was also collected in a different form.
The district tourist officers were asked about the projects completed out of the ones which were taken up in the 11
th five year plan (reported in Table 3.7). It was reported
that only about 34% projects were completed during the 11th
five year plan (out of
all those sanctioned in the plan period).
The respondents were further asked reasons for delay in completion of the project. Their
responses are shown below:
Reason for delay in completion %
Cost exceeded the budget 17
Delay in tendering process 30
Rains 5
Delay in execution of work 10
Land acquisition 3
Don’t Know 35
While 35 percent officers reported that they did not know the reason for delay in
completion, 30 percent blamed the official process of tendering the job which needed to
be completed. Other reasons like “cost exceeded the budget”, or “delay in execution of
the work” were also reported by a relatively smaller percent of respondents.
3.5.6 Problems faced in implementation
The district/state Tourist Officers were asked whether they faced any problem in implementation of the project. If they reported “yes’ to this question, they were further
asked about the problems. The responses have been listed in the Table below.
Problems faced % distribution
No problems 38
Clearances from security agency 6
Contracting the work—tendering process, ensuring minimum response to tenders, approval of tenders etc.
18
Lack of men and material 5
Land acquisition/Land dispute 4
Tight budget/shortage of money stopped the work 7
Don’t know 21
Almost two-fifths of the officers of tourism did not report any implementation problem. Another 21 percent reported that they had no knowledge of the problems; perhaps they
were new to the position and/or were not associated with the project activities. The
remaining projects reported different types of problems shown in the above Table.
GfK MODE
PIDDC Report Jan, 2013
21
3.6 Impact of PIDDC scheme
The impact of the scheme, in this report, is being measured in three different forms
10.
First, data was collected on perception of the stakeholders on the impact of the
scheme on the parameters (1) Improvement on the attractiveness of the tourist sites, (2) Increase in the number of tourists, (3) Improvement in the employment opportunities for
the people living around the area of the site, (4) Increase in the income levels of people
of the area, (5) Improvement in the living pattern of the people living in the nearby areas, and (6) Overall development of the area. The second set of information was on the
actual increase in the number of tourists during 11th five year plan; part of which could
be attributed to the PIDDC scheme. The third set was actual increase in employment
of manpower. The data on each of these impact parameters has been reported below.
3.6.1 Perception of the stakeholders on the impact of the PIDDC scheme
All stakeholders were asked how they perceived the impact of the PIDDC scheme on
the following six impact parameters11
:
• Improvement in attractiveness of the tourist site
• Increase in the number of tourists
• Improvement in the employment opportunities
• Improvement in the income levels of people
• Improvement in the living pattern of people in the area, and
• Overall development of the area
This information was collected on three point scale—“Increased substantially”,
“Somewhat increased” and “No change”. In order to make sure that their answers
were based on their own mental assessment of the ground situation (and not just
random answers), they were further asked in what way they thought increase had
occurred if their answers were either “increased substantially” or “somewhat
increased”.
Table 3.4 and figures 4-7 show perception of impact parameters as reported by different
stakeholders and the reason why they thought so12
.
10 There is a fourth set of impact parameter, “Inflow of money”. This number has not been calculated here
since it was not possible to compute the actual increase in the number of tourists due to the impact of the
PIDDC scheme 11 As stated above, this was only one parameter of impact. The other two parameters were actual numbers,
discussed in 3.5.2 and 3.5.3. 12 As stated earlier, this question followed the response on the impact of PIDDC scheme to make sure that
their answers on the impact was based on their assessment of the ground situation. In this way. the response
on the impact was not mere perception but “thoughtful perception”.
GfK MODE
PIDDC Report Jan, 2013
22
Table 3.4 Reported perception of different categories of stakeholders of tourism on different
impact parameters and reasons why they thought so Information District/
State
Officer
Reception
Centre/
Ticket office
Tourist
Guide
Hotel/
Guest
house
Restau
rants
Tour
operator/
Travel
agency
Bus/Taxi
operator
Souvenir
Shop
1. % report Improvement in attractiveness
Increased substantially
33 32 20 7 9 10 15 16
Some what increased
42 54 59 41 44 42 52 51
No change 25 14 22 52 47 49 33 33
2. Percent stakeholders reported various factors which had improved attractiveness13 (%)
Improvement of amenities
46 53 33 35 38 37 29 34
Beautification of the surrounding areas
33 35 32 41 43 37 48 43
More infrastructure and its better maintenance
12 26 21 16 16 14 10 16
Improvement in looks of the monument
4 2 11 8 6 11 5 9
No particular reason
5 7 6 6 7 7 7 8
3.% report Increase in number of tourists
Increased substantially
28 39 29 9 11 18 16 20
Some what increased
49 59 60 55 51 53 59 63
No change 22 2 11 36 38 29 25 17
4. % report increase in employment
Increased substantially
13 22 15 6 4 7 8 7
Some what increased
47 55 48 42 41 54 53 50
No change 40 24 37 52 55 40 39 43
5. Percent stakeholders reported various factors which have improved employment
Jobs in tourism related industry
68 69 83 65 55 63 60 75
Jobs with private businesses
19 23 19 35 42 39 35 26
Improved scope of work with handicrafts
12 21 24 17 15 13 10 18
Jobs with tourism Department
6 5 5 4 2 4 7 3
No particular
reason
2 3 0 8 2 6 5 1
13 Total could be more than 100 as some respondents reported more than one reason/factor for their
response
GfK MODE
PIDDC Report Jan, 2013
23
Table 3.4 Reported perception of different categories of stakeholders of tourism on different
impact parameters and reasons why they thought so (Contd..) Information District/
State
Officer
Reception
Centre/
Ticket
office
Tourist
Guide
Hotel/
Guest house
Restau
rants
Tour
operator/
Travel
agency
Bus/Taxi
operator
Souvenir
Shop
6. % report Increase in income
Increased substantially
13 16 14 4 3 6 5 5
Some what increased
48 59 52 42 40 53 52 52
No change 40 25 34 54 57 41 43 43
7. Percent stakeholders reported various factors responsible for increase in income of people
Opportunities of new
businesses—higher demand
44 53 52 54 49 47 49 57
Jobs in tourism related industry
59 53 48 31 38 45 26 32
Jobs in private
Businesses –Higher demand
31 13 21 18 18 24 17 17
Higher income in business & higher salary in jobs
because of more demand
19 8 13 22 21 16 13 15
Higher income because of higher demand
0 5 10 4 1 5 3 7
No particular reason
6 3 2 6 3 6 10 6
8. % report improvement in the living pattern of residents
Increased substantially
15 14 8 4 3 5 6 6
Some what increased
44 43 57 37 37 40 47 44
No change 41 43 35 58 60 55 48 50
9. Percent stakeholders reported various factors which have improved living pattern of residents of the area
Life style improvement14
83 55 59 68 63 63 63 60
Better choice of items for purchase
15 55 37 30 29 29 30 37
Higher income 6 17 12 10 7 8 6 7
No particular reason
12 10 3 7 3 12 5 7
14 Improvement because of better roads, better parks, better transport, better choice of food, better lighting
and better means of entertainment.
GfK MODE
PIDDC Report Jan, 2013
24
Table 3.4 Reported perception of different categories of stakeholders of tourism on different
impact parameters and reasons why they thought so (Contd..) Information District/
State
Officer
Reception
Centre/
Ticket
office
Tourist
Guide
Hotel/
Guest house
Restau
rants
Tour
operator/
Travel
agency
Bus/Taxi
operator
Souvenir
Shop
10. % report overall development
Increased substantially
11 14 18 4 2 9 10 6
Some what
increased
45 41 49 40 42 43 48 50
No change 44 45 33 56 56 48 42 44
11. percent stakeholders reported various factors which have led to development of the area
Better Civic amenities
65 82 64 83 77 83 70 84
Better infrastructure
38 39 38 34 19 30 31 28
Increase in business opportunities
5 25 5 7 7 5 1 6
Increase in job opportunities
13 0 5 6 3 10 8 4
Increase in income
3 4 3 4 9 4 3 6
No particular reason
19 0 2 7 3 8 8 6
Fig 4: Perception of impact reported by District/State tourist office (%)
33 2813 13 15 11
42 49
47 47 4445
25 23
40 40 41 44
0%
10%
20%
30%
40%
50%
60%
70%
80%
90%
100%
Improvement in
attractiveness
Increase in
tourists
Increase in
employment
Increase in
income
Improvement in
the living
pattern of
Overall
development
No change
Some what
increased
Increased
substantially
GfK MODE
PIDDC Report Jan, 2013
25
Fig 5: Perception of impact reported by Reception Centre/Ticket Office
(%)
32 39
2216 14 14
54
59
54 59
43 41
1424 25
43 45
2
0%
10%
20%
30%
40%
50%
60%
70%
80%
90%
100%
Improvement in
attractiveness
Increase in
tourists
Increase in
employment
Increase in
income
Improvement in
the living
pattern of
residents
Overall
development
No change
Some what
increased
Increased
substantially
Office (%)
10 187 6 5 9
42
53
53 53 40
43
48 29
40 41 55
48
0% 10% 20% 30% 40% 50% 60% 70% 80% 90%
100%
Improvement in
attractiveness
Increase in tourists
Increase in
employment
Increase in income
Improvement in the living pattern of residents
Overall development
No change
Some what increased
Increased substantially
Fig 7: Perception of impact reported by Hotels/Guest Houses
(%)
7 6 6 4 4 4
41 55
42 42 37 40
52 36
52 54 58 56
0% 10%
20%
30%
40%
50%
60%
70%
80%
90%
100%
Improvement in
attractiveness
Increase in
tourists
Increase in
employment
Increase in
income
Improvement in the living pattern of
residents
Overall development
No change
Some what increased
Increased substantially
Fig 6: Perception of impact reported by Tour Operators/Travel Agents
GfK MODE
PIDDC Report Jan, 2013
26
The following are the highlights of the findings on the impact of the strengthening
undertaken of the tourist site:
• More than about two-thirds of the stakeholders perceived increase (“Substantial
increase” or “Somewhat increase”) in the attractiveness of the tourist site as well as
increase in the number of tourists who visited the site.
• About 50 percent stakeholders perceived increase in the employment opportunities,
increase in the income, increase in the living pattern of the residents and overall development of the area.
• Their reported reason why they thought that things had improved have also been
listed in the Table 3.4. Two most important reason for their “thoughtful perception”
are shown in the Table shown below:
Two important reasons for their perception on impact
of the scheme—why they thought things have
improved
Impact of PIDDC scheme
Reason 1 Reason 2
Improvement in attractiveness of the
tourist site
Improvement in amenities Beautification of the
surrounding areas
Increase in the number of tourists Their clientele has increased
Increase in employment Increase in tourism related jobs Availability of jobs in
private businesses
Increase in income of the people Better opportunities of new
businesses. Increased demand
increased competition and thus salaries
Availability of more
jobs and thus higher
salaries
Improvement in living pattern of
residents of the area
Increase in life style of the
people in the area
Availability of better
choice of items of
daily use
Increase in overall development Availability of better civic
amenities
Availability of better
infrastructure
In other words, stakeholders of the tourism industry thoughtfully perceived that
PIDDC scheme had brought about overall improvement in the area where tourism
site was located. They had also given justification why they perceived positive
impact of the scheme.
3.6.2 Increase in the number of tourists at the site/district
Second indicator to measure impact of the PIDDC scheme was “increase in the number
of tourists” at the tourist sites strengthened under PIDDC scheme. For this purpose, two sources were utilized to collect data on the number of tourists. The first source was
district authorities who were asked number of tourists in different years in the 11th five
year plan. The second source was stakeholders like hotels etc who were asked the number of tourists they had served in different years of the 11th five year plan. Data on the
number of tourists from both the sources have been discussed here15.
15 We are using data of the domestic tourists because of their large numbers-- the trend over different years
of 11th five year plan will be smoother
GfK MODE
PIDDC Report Jan, 2013
27
Table 3.5 shows data on the number of tourists reported by the district/state tourist
officers of the sampled tourist sites. Though this data may not be accurate in terms of
number of tourists but since the same source was utilized to collect data in different years, they can be used to assess trends in the number of tourists.
Table 3.5: Number of tourists reported by the district/state Tourist officer in
different years of 11th
five year plan Year No. of tourists Index number
2007-08 169806 100
2008-09 195798 115
2009-10 266781 157
2010-11 308586 182
2011-12 Not available*
* Data for the whole year 2011-12 was not available for several districts.
It may be seen that population of tourists has increased by about 82 percent in the first
four years of the 11th five year plan. This was a substantial increase when we compared with the increase of tourists in total India
16 where increase in four years was found to be
about 40 percent (Based on data taken from website of the Ministry of Tourism). (We are
aware of the limitations of comparing these two sets of data but they could reflect overall trend in the four years). This sharp increase (shown by the index calculated by taking
numbers in 2007-08 as base) in the trend may partly be the impact of the strengthening
done under PIDDC scheme.
Based on this additional increase of tourists (domestic) in the districts under study, one
could get a rough estimate of the inflow of money17
. It was found that per day
expenditure of the domestic tourist was reported to be Rs. 1698.0018
.
Table 3.6 shows data on tourists served by two important stakeholders –Hotels/Guest
Houses and Bus/Taxi Operators. These data was collected from the stakeholders by asking the number of tourists they had served in different years of 11
th five year plan.
Table 3.6: Number of tourists served by different stakeholders in the area in
different years Hotel/ Guest house Bus/Taxi operator Number of tourists by year
No. Index number No. Index number
2007-08 459368 100 293344 100
2008-09 516894 112 311635 106
2009-10 635348 138 334418 114
2010-11 786379 171 404058 138
2011-12 1146007 249 473357 161
Note: Only figures for two categories of stakeholders has been shown to suggest the order of
increase in the tourists
16 The comparability of these two sets of data is unknown but since both the sources use the same source of
data collection in different years of the 11th five year plan, they can be used here to compare the trend.. 17 We did not provide numbers since it was not possible to estimate the number of tourists which could be
attributed to the impact of PIDDC scheme. 18 Per day expenditure of the foreign tourist was reported to be Rs. 4250.00
GfK MODE
PIDDC Report Jan, 2013
28
It may be seen that number of tourists served by these two categories of stakeholders had
increase sharply. This increase was so sharp that a part of it could be attributed to
strengthening of the tourists’ sites under PIDDC scheme.
3.6.3 Increase in employment of manpower
Third indicator taken for measurement of the impact of the scheme was “increase in the
manpower employed by stakeholders in the sampled projects”. For this purpose, different
stakeholders (of tourism) were asked about their manpower in different years of the 11th five year plan because it was expected that increase in the number of tourists would
increase demand for the services. This increase in demand in services would be met by
deploying a larger manpower.
Table 3.7 shows manpower deployed by different categories of stakeholders in different
years of the 11th five year plan. Increase in the manpower has been shown by computing
index numbers with 2007-08 as base.
Table 3.7: Manpower employed by different categories of stakeholders in different
It may be noted that manpower in all stakeholder categories had increased rapidly – 40
percent to 80 percent in five year period. It was mainly because the tourist traffic had increased in these districts. The PIDDC scheme could take at least a part credit for this
increase in tourism.
3.7 Current status of tourism infrastructure in districts/tourist sites
In order to assess the current status of tourism infrastructure in the districts of sampled
projects (where PIDDC had strengthened the infrastructure in 11th five year plan), three
sets of information were collected. In the first set, the district tourist officers were asked :
(i) total number of tourist sites in their districts , (ii) number of tourist sites where
infrastructure had been strengthened under PIDDC.; the complementary figure would be the number of tourist sites where the infrastructure had still not been strengthened as yet.
Then they were further asked their perception on the status of the tourism infrastructure
in the district (Table 3.8).
GfK MODE
PIDDC Report Jan, 2013
29
In the second set, the district tourist officers were also asked the type of strengthening
that was needed at the tourist sites in their work districts. This information was collected
to see whether PIDDC scheme covers all dimensions/components of strengthening
The third set of information was collected from tourists. They were asked about their
tourism related experiences when they visited the tourist sites in the districts. Their experiences have been reported in Table 3.9.
This section gives all these three sets of information (Table 3.8 for the first two sets and Table 3.9 for the third set):
Table 3.8: Status of the tourists sites in the districts covered in the study
Information No. of tourist
sites
1.No. of tourist sites in all districts covered in the study 2264
2.No. of tourist sites strengthened under PIDDC in 10th five year plan 694
3.No. of tourist sites strengthened under PIDDC in 11th five year plan 970
4.No of tourists sites where strengthening work in 11th five year plan is
completed.
326
5. Perception of district tourist officer on the status of infrastructure at the tourist sites in their districts (% distribution)
Good 55
Reasonable 26
Poor 14
Very poor 5
Recommended (by district tourist officer) improvement to make the tourist site
more attractive for tourists
Appearance/Beautification of site 32
Wayside amenities 84
Physical infrastructure including accommodation for all categories of tourists
58
Civic sense in all service providers 12
Special tourism projects 11
Security of tourists 7
It may be noted that
1. About 600 projects ( or 27%) in the districts under study have not yet been strengthened under PIDDC scheme. But according to reporting of the district tourist
officers, 19% of them might have “poor” or “very poor” infrastructure. Thus, it
seemed that 114 projects in these districts still needed to be strengthened. (This
suggests need to continue PIDDC scheme).
GfK MODE
PIDDC Report Jan, 2013
30
2. The PIDDC scheme could fund all the needs of the tourist destinations/circuits
except security concerns of tourists. In this respect, PIDDC scheme is comprehensive
except the component of security of tourists.(No new component is needed in the
scheme except conveying the message of security needs to the tourists to the
concerned departments)
3. Only about 34% projects sanctioned in the 11th five year plan have been completed.
(The progress of work has been slow)
Experiences of the tourists during their visit
The tourists (numbering 3425 domestic and 219 foreigners ) visiting the tourist sites were asked their experiences on different components of tourism infrastructure and the
services they received during their visits. The response was recorded on three point
scale—“Satisfactory”, “OK” or “Unsatisfactory”. “OK” meant that the respondent was
lukewarm about the services and therefore, we have considered this response as non-satisfactory. Table 3.9 shows percent tourists who reported the service as “satisfactory”
(other than OK or unsatisfactory).
Table 3.9: Tourists reporting experiences “satisfactory” for the infrastructure
/services during their visits.
% tourists Infrastructure/Services
Domestic Foreigners
Problem in getting Local transportation 15 11
Journey to site satisfactory 87 90
Got lodging within budget 83 88
Room clean 91 93
Toilet clean 83 88
Quality of food in restaurant satisfactory 84 92
Response of tourist office in state satisfactory 49 40
Response of tourists office in district satisfactory 43 48
Response of the reception office satisfactory 60 66
Response with ticket office satisfactory 74 64
Good experiences with tourist guide 95 97
Good experience with tour operator 34 57
Experience with souvenirs buying satisfactory 78 93
Good physical appearance of monument 93 96
Site was clean 78 84
Lighting was adequate 78 87
Signage clear and adequate 67 80
Descriptions on sites satisfactory 70 78
Drinking water facilities satisfactory 64 74
Toilet facilities satisfactory 50 60
GfK MODE
PIDDC Report Jan, 2013
31
The following are the highlights of the experiences of the tourists during their visit to the
tourist destinations/circuits:
• Less than 50 % tourists had reported satisfaction with (i) response of tourist office at
state level, (ii) tourist office at district level, and (iii) service of the tour operator
whose services they had hired. In this connection, it may be noted that only 5% domestic tourists and 17% foreigner tourists had contacted the state tourist office, and
3% and 12% tourists respectively had contacted district tourist office.
• Less than two-thirds of the tourists (but more than 50%) reported satisfaction with (i)
response of the Reception Office/ Ticket office, (ii) signages in the monuments, (iii)
drinking water facilities and (iv) toilet facilities.
The tourists, after being asked about quality of different services (responses reported in
Table 3.9 above), were further asked
“What type of improvement could make the site more satisfactory to tourists’.
In response, the tourists made the following suggestions for improvement, in decreasing order
• Improve the beauty and cleanliness of the surroundings
• Provision of drinking water at the site
• More public toilets
• Improvement in the communication at the site
• More lighting at the site
• Creation of parks at the site
• Good hotel/lodging facilities
• Good parking facilities, and
• Security of the tourists, particularly of the foreign tourists
It may be noted that the PIDDC scheme funds all the needs suggested by the tourists except the security component. It is therefore recommended that proposals submitted for
PIDDC support should be made more comprehensive by including suggestions from the
tourists. It is also recommended that the MOT should coordinate with the security
agencies to make tourists feel more secure.
3.8 Suggestions for strengthening the PIDDC scheme
Two sources of data have been used to suggest strengthening measures for the PIDDC
scheme. The first source was district/state tourist officers who were directly asked suggestions for strengthening the PIDDC scheme so that the scheme could achieve its
desired goals. They were directly responsible for implementation (or
monitoring/coordinating) of the project and thus knew the problems. The second
source was the findings which have emerged from analysis reported in the earlier sections of the chapter or came as suggestions from different categories of respondents. This
section presents these suggestions.
GfK MODE
PIDDC Report Jan, 2013
32
3.8.1 Suggestions from the district tourist officers
The district tourist officers involved in implementation of the project supported by PIDDC were asked suggestions for strengthening the PIDDC scheme. Their suggestions
under various broad headings are shown below.
1.Scope & coverage of the PIDDC scheme
1.1 There is a need to make the tourist site more attractive to tourists. It required
beautification of the site and its surroundings including creation of basic infrastructure and desired civic amenities so that tourists could enjoy their visit with minimum discomforts.
1.2 PIDDC scheme should provide funds for inviting ideas from planners and architects to
make the tourist site more attractive and beautiful. This was the requirement tourists had
suggested to make the site more attractive. 1.3 Funding should also be provided for strong supervision/monitoring of the work during
the work period, The MOT should also continuously monitor the progress by making
actual field visits to the tourist sites. 1.4 It was suggested that components which could add entertainment items at the tourist
sites should also be added for funding in the PIDDC scheme. This would help tourists to
come to the tourist site with family, including children. Family tourism would be useful for promotion of tourism in the long run. In other words, it was suggested that the tourist
destinations should have value not only as sight seeing/ religious tourism/ historical
tourism but also entertainment tourism.
1.5 It was suggested that security of tourists, particularly foreign tourists was of great
concern and thus should receive attention of the concerned department/agency.
2.Quality of preparation of the project proposal
2.1 Many of the district tourist officers and persons in-charge of the reception centres
expressed opinion that they should be involved while formulating proposal for the PIDDC. It seemed that they were not involved in development of the proposal though different
modes were adopted by different states to prepare proposals for submitting to the Ministry
of Tourism.
2.2 Many of the district tourist officers/reception desk officers felt that proposals could be
made more comprehensive. They suggested that some funding should be provided in pre-
proposal stage so that the state could undertake a quick study to assess strengthening needs of the tourist destination/circuit. This small fund could help in ensuring that the proposal
was comprehensive where views of all stakeholders including the tourists could be taken
and included in the proposal for funding. . 2.3 The officers pointed out need for detailed guidelines on preparation of the proposals.
The existing guidelines were felt not detailed enough. .
2.4 It was suggested that MOT should carefully review the proposals by making a visit to
the state/district to discuss the proposal, changing it if necessary and then finalizing it. This may require a team of professionals with such background in the MOT to help in
development and monitoring the projects.
GfK MODE
PIDDC Report Jan, 2013
33
2.5 Adequate time should be given for developing proposal so that a pre-proposal study
(indicated in 2.2 above) could also be conducted
2.6 One pre-requisite of the proposal should be listing of maintenance plan of the state
government after strengthening was done under PIDDC. In this way, commitment of the state would be ensured in the maintenance of the assets created..
2.7 Some of the tourist officers suggested a good deal of flexibility in the timeline as many
unforeseen issues emerge during implementation of the sanctioned projects. This longer time of execution also increased the fund requirement. Thus funding limit specified in
PIDDC should be raised.
3.Time taken for approval 3.1 Time for approval should be reduced to maintain and sustain interest of the staff who
submitted the proposal. Too long a time could affect interest in the project.
3.2 Funds should be released as early as possible after approval of the project.
3.3 Strong monitoring by the state and the Centre will ensure timely completion of the project. Thus monitoring mechanism should be built, both at the Centre and the state
levels.
4.Financial assistance
4.1 The district/ state tourist officers had suggested some flexibility in switching of the
budget heads, if necessary.
5.Merits of the scheme 5.1 All tourist officers greatly appreciated this scheme. According to them, the PIDDC
scheme is very useful for improving tourism in the country. More and more funds should
be committed to this and other such schemes. In addition, a good deal of publicity should
be given to such schemes so that more and more states/districts could take benefits from such schemes.
5.2 The Tourist officers suggested that such schemes of the MOT should get more funds from the Planning Commission as projects strengthened under such schemes could help
develop the areas. There is a direct relationship in the increased flow of tourists and
development of the area and its residents.
5.3 Many states expressed need for technical guidance to optimally utilize funding from
the scheme effectively and achieve their tourism potential.
6. Constraints of the scheme
6.1 Many tourist officers did not know about the proposal as they were not involved in its development. This non-involvement affected their sincerity and commitment to the
project.
6.2 Many tourist officers expressed inadequacies in the projects in view of strengthening needs of the tourist sites. It was therefore necessary that proposals should be
comprehensive and based on actual assessment of the infrastructure needs of the tourist sites.
6.3 Many states expressed need for technical support for preparation of the project proposal. After financial support, the states might even need technical support for
implementation and monitoring to control quality of work and timeliness.
6.4 The scheme had helped only a limited number of tourist sites. Many more sites needed strengthening. Thus more funds, covering more tourist sites, were needed for increasing
tourism in India and take its allied benefits.
GfK MODE
PIDDC Report Jan, 2013
34
In other words, it is strongly recommended that this scheme should continue as
centrally sponsored scheme but there is need to streamline it to ensure (i) good
project proposal, (ii) serious effort in its implementation, (iii) careful systematic and
strong monitoring, both at the centre and state levels, and (iv) assurance for good
maintenance of the assets created .
3.8.2 Other suggestions (based on findings and our earlier experience in such projects)
• The PIDDC scheme provides 100% funding from the Central Government. We (GfK
MODE from their experience with other similar projects) recommend that states
might be asked to contribute a small part of the funding (say 10%). This is our
recommendation in view of our earlier experience; this would improve the quality
of execution, as states would have greater commitment and better monitoring for the projects where they have stakes.
• Based on the suggestion of the state/district tourist officers and our earlier experience
with such projects, it is recommended that the Ministry of Tourism should have a
full-time technical committee to scrutinize the proposals, monitor the progress, to
give technical advice and help the states to share experiences of each other. This will
greatly improve the quality and timeliness of the execution of the project. This committee members may also need to make visits to the site where work is being
undertaken.
• Involvement (in the form of project development, project execution and monitoring)
of the district tourist officer did not exist in many projects. Therefore, district tourist
officers had no interest in the project. Their cooperation was limited, mainly because
of lack of their interest in the project.
• We strongly suggest conducting a quick survey for need assessment of the tourist
site. The Marketing Division of the Ministry of Tourism should take technical lead for such a survey. This survey should be able to identify needs of the tourist sites so
that project proposal can include those needs of the tourist site.
GfK MODE
PIDDC Report Jan, 2013
35
CHAPTER IV
EVALUATION OF FAIRS AND FESTIVALS
4.1 Background
This study had selected two fairs/festivals organized by each of the 16 states where evaluation of the PIDDC scheme was being undertaken. These 16 states have been shown
in Annexure I, where PIDDC projects for evaluation have been listed. Their selection
process was based on the budget of the fairs/festivals – two highest budgeted
fairs/festivals were selected for the study from each of the 16 states.
As stated earlier in chapter on “Data & Methods”, data for evaluation was collected from
the organizers of the fairs/festivals at district/state level and a few hotels/guest houses located in the vicinity of the tourist sites and were serving the tourists visiting the
fairs/festivals selected for this study.
For analysis, these 32 projects (two projects from each of the 16 states) were grouped in
two categories—Fairs and Festivals. The definitions of the fair and festival are shown
below (Took from the Website of Google):
Fair
A fair typically has rides and is not based on a specific theme.
Fair is an exhibition usually with accompanying entertainment and amusements
Fair is celebrated on grand scale by more than one religious, tribe or community. It has
people from various walks of life.
Festival
A festival is usually a theme.
Festival is often a periodic celebration or program of events or entertainment being a
specified focus.
Festival is celebrated by one religious or sub-group, group, a tribe or a community with
exceptions to few festivals.
The names and groupings of the fairs and festivals have been shown in Annexure III19.
There were 14 fairs and 18 festivals.
19 It may be noted that there is a good deal of overlap between these two categories—one can classify an event in either group.
Keeping these definitions in mind and using our best judgement, an attempt was made to group 32 selected fairs/festivals into two
groups. Since it was possible, in some cases, to list the festivals/fairs in either category, our best distribution was sent to the
GfK MODE
PIDDC Report Jan, 2013
36
This chapter discussed the findings, separately for fairs and festivals, based on the data
collected for the selected fairs and festivals. The findings are presented in the following
four sections:
• Planning of the fairs/festivals
• Implementation
• Expenditure incurred and income generated, and
• Impact of the fairs/festivals.
Based on the findings and suggestions from the respondents, the recommendations are
presented in the last section of the chapter.
4.2 Planning of the festivals
Table below shows months when festivals were organized and their duration
It may be noted that most of the festivals were organized in winter months when
important festivals like Deepawali, Christmas, Durga Puja etc. come. The idea, perhaps, might be that besides, good weather in the months of September, October, November,
December, January and February, people in these months would be in festive mood. This
would be the right time to attract tourists to the festivals. Festivals during summer are those which relate to hills stations.
Coming to the information on duration of the festivals, it may be noted that more than
two-thirds of festivals were organized for the duration of seven days or less.—the duration in the decreasing order of their numbers was 3 days, closely followed by 5 days,
7 days and 10 days. The modal value of duration was 3 days.
Ministry of Tourism to check whether our grouping is reasonable. Since no comments were received from
the MOT, we were told that the grouping is reasonable.
% distribution Planned activities
Festivals Fairs
1.Month when planned
January/February 40 21
July/August 13 7
Sept./Oct. 13 29
Nov./Dec. 33 43
2. Duration
<=3 days 47 14
4– 7 days 20 58
8– 12 days 13 14
13-30 days 13 14
� 30 7 0
GfK MODE
PIDDC Report Jan, 2013
37
In the case of fairs, most of the fairs were held in winter months when people and the
families are in festive mood. It may also be noted that duration of the fairs was 5 -7 days,
which is different from the duration of the festivals. The modal duration of the fairs was reported to be 5 and 7 days (different from the festivals which was 3 days).
4.3 Implementation of the fairs and festivals
No particular difference in implementation was noticed between festivals and fairs. It was
found that most of the fairs and festivals had a focus on some specific activity related to religion, sports, culture or any such thing but the organizers had added several other
activities to give it a show of some mela/fair in order to attract more tourists and visitors.
In other words, both fairs and festivals had organized multiple activities, besides the
actual focus, to attract more visitors and tourists. They were especially particular to add activities for children, so as to keep children entertained and busy. This gave excuse to
parents and families to come to the festival/fair. While this had been the general approach
in implementation of the festivals, several festivals/fairs had added the commercial interests by having stalls of the traders and craftsmen so that they could exhibit and sell
their merchandise/ products/handicraft items. Rents of such stalls had become source of
income for the event (fair/festival). Thus, both fairs and festivals would attract a large number of locals, besides the tourists who would visit from outside the town. Based on
this experience, one of the strong recommendations made (by the district organizers of
the festivals) was to organize more of such fairs and festivals (if possible in all districts)
to make tourism more popular; the assumption was that people would start enjoying tourism, initially by visiting and enjoying local fairs and festivals and then be motivated
to visit other places as tourists.
4.4 Expenditure incurred and income generated
Information on expenditure and income was also collected from organizers of the
festivals. This information has been shown in the table below:
% distribution Information on Expenditure/Income
Festivals Fairs
1 .Entry to festival was ticketed 7 29
2. Total expenditure
<=10 lakhs 27 21
11– 20lakhs 20 7
21- 30 lakhs 7 21
31– 50 lakhs 13 0
>50 lakhs 20 50
Not reported 13 0
3. Financial support received was adequate for
organization of the festival
40 57
4. Reported generation of income 33 64
5. Support received from the state 57 57
GfK MODE
PIDDC Report Jan, 2013
38
The following were the main findings:
1. Only 7 percent festivals had charged entry fee compared to 29 percent, in the case of
fairs.
2. In general, fairs had spent more money in its organization than festivals. Part of this
money was recovered by generation of funds—64% fairs had generated their income
compared to only 33 percent festivals.
3. Their own money generation may be one factor that more fairs had reported
financial support adequate compared to festivals (57 percent fairs reported support
adequate against 40 percent in the case of festivals). Even those activities/events
which reported support adequate, indicated that impact of the festivals/fairs could be
made better by more publicity if they had more funding.
4. We feel that this form of dependence of the financial support has to be reduced; the
fairs/festivals should be able to meet at least major part of the expenses so that such
activities could be carried out more regularly/ periodically and in more districts.
It is possible and doable
. 5. Though festivals were organized by sharing the cost between the Centre and the
States, many festivals mentioned need of small additional grant from the state – as
cost over-ran the initial estimates. This happened in the case of 57% festivals and
fairs.
4.5 Impact of the festivals
Three questions related to the impact were asked from both categories of respondents
(organizers of the festivals and hoteliers/guest house operators) and
both categories of events—fairs and festivals These questions were:
• Attendance at the festival,
• Impact of the festival on number of tourists in the area during festival days and after,
and
• Role of festivals in increasing tourism.
Data on these questions has been discussed below.
4.5.1a Attendance at the festivals
There was a large variation in the reported numbers of the attendees in the festivals. This was so as there was no data on the numbers who actually attended the festival; every
respondent had his/her own guess on the numbers who attended the festival. In the case
of ticketed festivals (which was only a small percentage) , the number of attendees reported were quite encouraging. Even in such cases, this might not be the actual
numbers; the actual numbers might be more as many visitors were invited and many were
issued passes. In addition, there were attendees who were sponsors of the festivals.
GfK MODE
PIDDC Report Jan, 2013
39
4.5.1b Attendance at the fairs
As shown above, more fairs were ticketed than festivals. The attendance reported by the organizers varied between 100, 000 to 150, 000 except in one case, it was reported to be
between 20,000 and 50,000. As stated above, the reported number may be on lower side
as many visitors were invited and many were issued passes. In addition, there were attendees who were sponsors of the festivals.
4.5.2 Impact of the festivals and fairs on the number of tourists
When the respondents were further asked about the impact of the festivals and fairs on
tourism after the fair/festival, the responses were similar. All organizers reported that
occupancy in the hotels and guest houses during the event was full; tourists even had to stay away and commute because they could not get accommodation nearby. The hoteliers
located around the festival site also reported 100% occupancy of their rooms during the
festival days
When further asked about the impact of tourism after the festival or fair ended, it was
reported that there is an increase in the tourist traffic after the event; the perception was that this increase was of the order of about 5 to 10 percent. The hoteliers located around
the festival site also reported increase in occupancy by about 2 to 5 percent every year
after the festival.
Thus, overall, the fairs and festivals had positive impact on tourism.
The organizers of festivals and fairs felt that the impact of the event could be enhanced and attendance of the number of tourists could be increased if adequate publicity was
given to the festivals/fairs. They could not do justice to the publicity because of limited
funds allocated for this purpose. They required more funds for this purpose
The organizers were also asked suggestions as to how the impact of such festivals could
be enhanced. It was reported that facilities and services at the site of the fairs/festivals
were not adequate –it affected the number of tourists who visited the festivals. There was need to improve the infrastructure and quality of services at the sites in order to attract
more tourists. In this category, particular mention was made of the need of toilets,
drinking water, parking lots and the food courts. It was also pointed out that security arrangements, particularly for foreign tourists, should be organized so that this concern of
the attendees could be addressed.
In addition, it was also suggested that such festivals though focused on a particular theme, should be so organized that other groups (not particularly interested in the focused
theme) should also feel attracted to the festival and attend them. Special mention was
made to have entertainment facilities for children so that visits to the festivals became a family activity.
GfK MODE
PIDDC Report Jan, 2013
40
4.5.3 Role of fairs and festivals in increasing tourism
The organizers and the hoteliers located in the neighbourhood of the site where
fairs/festivals were held were asked “what role such fairs/festivals could play in tourism”.
The responses for both categories of events were similar. Thus this section reports their responses together.
Their reported perception of the role of the fairs and festivals has been listed below:
1. The fairs and festivals, initially, inculcate taste of the local people for outing and that too family outing. They become visitors to these events. This interest in
outing gradually develops into an interest in tourism for a few of this generation
and many more of the next generation. In other words, such fairs and festivals, in
the initial stages, would attract local visitors more, but slowly, they would start attracting tourists from other places because local visitors would have their mind
change to become tourists. This would happen more rapidly if the visitors
enjoyed their visit to the fairs/festivals (and it required good facilities and services at the tourist sites so that the visits became enjoyable). With this
perception of the role of fairs/festivals, the district organizers made a
recommendation that every district should organize, at least one fair/festival
annually.. In the long run, this will help in increasing tourism in the country.
2. The fairs/festivals promoted tourism in two ways--by increasing the number of tourists during the festival days and by changing the mindset of people who
became favourable to tourism, in general. That is, fairs/festivals, in the long run,
tended to increase tourism.
3. Besides increasing tourism, such events tended to create and spread awareness of the local culture, art and music as it was found that most of the fairs/festivals had
. included such activities to invite more visitors/tourists. That is, after attendance
at such festivals, people tended to appreciate local art, culture better and
appreciated local productions. In some states like Odisha, Department of Tourism is called Department of Tourism and Culture because tourism has close
relationship with culture.
4. The fairs and festivals exhibited local handlooms and craft items and had stalls on local culinary. Thus they generated awareness of the local handlooms, crafts and local culinary of the area. People tended to appreciate them, bought them and
thus local craft items received a boost. In this way, fairs and festivals increased
income of the traders and artisans.
5. It was also pointed out that the fairs/ festivals also had commercial value as
festivals increased interest in local items and handicrafts. It will increase demand for these items, leading to more varied production and better income for the local
traders.
6. Such fairs/festivals created more self-employment opportunities. Local people
could get short and long term employment.
GfK MODE
PIDDC Report Jan, 2013
41
4.6 Recommendations
Based on the ideas of the local organizers of the festivals and the results of this
evaluation study, its impact and the role it played or could play, the following
recommendations are made: 1. Every district should organize such fairs/festivals, at least once a year, to cultivate
tourism in the country which has several benefits. In the initial stages, such
festivals/fairs would attract local visitors and families who would start appreciating
such visits and ultimately become tourists. In order to make the visits more attractive and enjoyable, the fairs/festivals sites should have all or most of the civic amenities
(more details have been discussed in point 10 later).
2. It was suggested that such festivals/fairs should be held at most of the important tourist sites in every state and in districts even if they did not have tourist site as such.
This was only possible if such festivals/fairs could be made “almost” self-supporting.
For this purpose, organizers had suggested need for exploring the following possible sources of revenue:
• Sponsorship
• Advertisements
• Stalls—merchandise, handicrafts, food items, tour operators and travel agencies
etc
• Entry tickets and passes (reasonably priced)
• State and Central Government grants for fairs/festivals
3. We feel that while organizing a fair/festival, its four-fold role (cultivating and
increasing tourism, generation of awareness of the local culture and music, creating awareness of the local crafts, handlooms and commercial and employment benefits )
should be kept in view. That is, one should plan fairs and festivals carefully and
comprehensively to reap all its benefits, which require coordination among all the stakeholders —Department of Tourism, Department of culture including Art and
Music, Department of Handicrafts & Handlooms and the traders. This group should
identify suitable dates, duration (suggestion, in this regard, from this study was that it should be between 5 and 7 days), venue and the activities so that all the four goals
listed above could be met.
4. There is need to bring a balance between the efforts (in organization of the festival)
and duration of the festival—more efforts should make duration longer. In other words, organizing such festivals for about three days (modal value of the festivals
was 3 days and 5 days for the fairs studied here) might not be adequate to bring
balance between efforts and the output. The festivals could be for five days and
fairs for seven days. The planning should be so done as to sustain interest of the
visitors/tourists.
5. It was also suggested that activities in the fairs and festivals should be so planned that visit to the fairs/festivals became a family activity. It was particularly suggested
that fairs/festivals should organize sports, competition in games and if possible,
involve the tourists in the games to make the visit more enjoyable. In other words,
items which could entertain children and tourists should also be arranged in the festivals/fairs.
GfK MODE
PIDDC Report Jan, 2013
42
6. For the choice of time period, suggestion was made that the dates should be selected
by keeping in view the weather and holiday seasons like Deepawali, Dushehra,
Christmas, Onam, Ganesh Chaturthi etc. In other words, the spirit of festivity should be fully harnessed to attract tourists for the fairs and festivals.
7. Most of the states reported that they have plans to develop couple of tourist sites in
the state in such a way that fairs/festivals there could be branded with the state tourism. That is, the tourists should be able to link state with those particular
festivals and plan their visits to the state/fair/festival, especially around those
fair/festival days. This concept was similar to the idea of linking Mysore with festival of Dushehra—special activities in Mysore Palace during Dushehra days.
Rajasthan wanted to brand their Desert festival in Jaisalmer and Deepawali festival
in Jaipur with the state of Rajasthan. Similarly, Manipur planned to brand its
Equestrian Championship fair with tourism in the state of Manipur. They even have plans to invite polo players from foreign countries during the fair. After such
branding, they had plans to publicize the event widely in India and abroad. The
Ministry of Tourism could use its cultural attaches in Indian embassies and its own tourism departments to publicize these fairs/festivals well in advance so that tour
operators could plan their packaged tours and foreign tourists could plan their visits
during these festivals. In this publicity of the fairds/festivals, interests of tourism, culture, handicrafts and shopping should be highlighted so that these festivals could
appeal to all groups of people with varied interests.
8. Keeping this view in mind, it was suggested that each state should have at least one
important festival/fair as its brand festival for the state. It should be celebrated at some important and interesting tourist site on a grand scale so as to attract tourists to
the state. As far as possible, dates and periodicity of such a fair/festival should be so
fixed that tourists could plan well in advance to visit the fair/festival. The Ministry of Tourism, Government of India, could help the states to coordinate the dates of
such brand festivals so as to avoid overlap and enable tourists, particularly foreign
tourists, to visit more than one such festival ( in more than one state) during their
trip.
9. As far as the states are concerned, they should capitalize on the visit of the tourists to the brand festival/fair. Make it a show case to show all their art, music, culture,
food, dressing/textile, and other tourist sites in the neighbourhood. In other words,
careful planning should be done to show tourists all the important things of the state by organizing at the site being visited and/or by taking them for short packaged
trips. This would make stay in the state longer.
10. Suggestions were made for strengthening the infrastructure at the tourist sites where
fairs/festivals were held so that visits could be made more attractive and satisfying
during the festivities. The following needs of the tourist sites were particularly
highlighted by the organizers of the festivals/fairs:
• Sanitation services and facilities
• Drinking water facilities
GfK MODE
PIDDC Report Jan, 2013
43
• Good transportation facilities
• Parking facilities
• Construction of approach roads
• Development of picnic spots
• Lodging facilities to meet needs of all categories of tourists
For this purpose, states should utilize the funding of the Ministry of Tourism, Government of India, under the PIDDC scheme, to develop necessary infrastructure
and services needed by the tourists.
GfK MODE
PIDDC Report Jan, 2013
44
CHAPTER V
SUMMARY FINDINGS AND RECOMMENDATIONS
5.1 Background
The Ministry of Tourism (MOT), Government of India has been funding the states to
build and strengthen the existing infrastructure at the tourist sites to make the destinations
more attractive for tourism. Such efforts started in the ninth Five year plan in the form of financial assistance for specific activities like construction of budget accommodation,
tourist complexes etc. These individual activities were pooled into full-fledged schemes
in the 10th five year plan so that the states could request funds for building/improvement of the sites in more integrated/comprehensive fashion. This scheme of the 10th five year
plan was further streamlined in the 11th five year plan. This plan made further efforts to
harness full potential of tourism sector by improving infrastructure. This centrally sponsored scheme focuses on integrated infrastructure development of tourism
circuits/destinations and also on the improvement of the existing products as well as
development of new tourist products (PIDDC).
The states could also get funds if they organize fairs/festivals to invite the tourists. This
scheme aims at promoting tourism –people will come to enjoy fairs/festivals and will
ultimately convert to be tourists.
The Ministry of Tourism, Government of India is interested in evaluation of the scheme
(Product Infrastructure Development for Destinations and Circuits) of the 11th five year
plan so as to (i) assess impact of the scheme, and (ii) learn lessons to further strengthen/modify the scheme in the next plan periods for improved impact on tourism
The agency GfK MODE was selected, after due tendering process, to undertake this evaluation in 16 states and two UTs; all the mega projects funded in the 11
th five year
plan were also to be evaluated. This report presents findings of this evaluation.
5.2 Evaluation of PIDDC scheme - Important findings
The evaluation of the PIDDC scheme is based on the study of all the 35 mega projects,
selected 50 Circuits and 34 Destinations supported by the Ministry of Tourism, Government of India in the 11
th five year plan. They were spread over 24 states and two
UTs. The data was collected from all the stakeholders at the selected tourist sites where
the sampled project were located. These stakeholders were:
Department of Tourism
• State/District Tourist Officer responsible for implementation or coordination/
monitoring the progress of work of the selected projects
• Reception office/Ticket office located at the site of the selected project
GfK MODE
PIDDC Report Jan, 2013
45
Other stakeholders
• Tourist Guides
• Hotels/Guest Houses
• Tour Operators/ Travel Agents
• Bus/ Taxi Operators
• Restaurants
• Souvenir shops
• Tourists
This section discusses the findings based on the data collected from all the stakeholders
of these projects. The findings are presented in the following sections:
• Awareness of the PIDDC scheme and their sources
• Measures taken for maintenance and sustainability of the assets created
• Process of development of project proposal
• Experiences of the implementation of the project and its current status
• Impact of the PIDDC scheme
• Current status of tourism infrastructure in districts/where tourist sites were located,
and
• Suggestions for strengthening the PIDDC scheme
5.2.1 Awareness of the PIDDC scheme
• Only 65 percent of the district/state tourism officers were aware of the PIDDC
scheme. This percent looks to be too low, particularly as the projects sanctioned
under the scheme were supposed to be implemented by them (District/State Tourist
officer) or at least under their supervision though some of the officers might be new
since projects being evaluated here might have been initiated in the beginning years
of the 11th
five year plan.
• The level of awareness of PIDDC scheme was lower (45%) among the staff manning
the reception centres/ticket counters at the tourist sites being evaluated.
• This awareness was still lower among other stakeholders
• Regarding the source of awareness of the PIDDC scheme, district/state tourist
officers got to know about the scheme from the government circulars; most of the
other stakeholders learnt about it from newspaper advertisements.
5.2.2 Measures taken for maintenance and sustainability of the assets created
• About 12 to 22 percent employees of the Department of Tourism could not report the
arrangements for maintenance of the tourist destinations. Another 12-21 percent
reported that no specific arrangements for maintenance existed.
GfK MODE
PIDDC Report Jan, 2013
46
• Those who knew the maintenance arrangements, reported responsibilities of three
types of agencies, in decreasing percentage: Division of Department of Tourism,
Local Committees with membership of Department of Tourism, Village Pradhan and temple priest, and local Government Departments like PWD etc.
• Only 60 to 65 percent personnel of the Department of Tourism were satisfied with
the maintenance arrangements.
• Obviously, there was need to streamline arrangements of maintenance of the tourist
sites though they are being maintained periodically and on-call basis..
• One important suggestion was that strong monitoring system for maintenance needs
to be created—one senior officer should be given such responsibility and he/she be
made accountable for quality of maintenance.
5.2.3 Process of development of proposal
• Important tourist sites, selected on the basis of flow of tourists and infrastructure
needs, are selected for the support under PIDDC scheme.
• Though responsibility of preparation of proposal is that of the Director of Tourism,
he/she has been using different modes for its preparation in different states. The important modes are: (i) A committee of the officers of Department of Tourism, (ii)
Hiring of a Consultant, and (iii) Giving responsibility to a local team consisting of
District Tourist Officer and District Collector.
• No study is generally undertaken to determine the infrastructure needs of the site. But
inputs of the stakeholders is taken to identify the infrastructure for support from
PIDDC
• It takes about three to four weeks to write proposal and the cost comes to about Rs.
50,000.
• Some District Tourist Officers reported that the proposals submitted for support were
not comprehensive; they suggested need for a quick study.
5.2.4 Experiences of implementation of the project and its current status
• The execution of the project is undertaken differently in different states. In some
states, a unit is created to execute the activities. In some other states, the district
collector is given responsibility to implement it.
• In most of the states, a board is put up at the site to give details of the work being
undertaken, including source of its funding which is Ministry of Tourism, Government of India.
• Forty seven percent projects exclusively used funds received from the Ministry of
Tourism to execute the strengthening activities. Other projects had some small share
of the state governments, supplementing the MOT grant.
• Only 50 percent projects got implemented within six months of their sanction. On the
other extreme, 16 percent projects got implemented after one year of the sanction.
Major reason cited for this delay was either “do not know” (58%) or “delay in
inviting or approval of the tenders” (35%).
GfK MODE
PIDDC Report Jan, 2013
47
• Only 34 percent projects sanctioned in the 11th five year plan got completed during
the plan period. Others got delayed; major reported reasons for the delay were:
“delay in the tendering process”, “cost exceeded the budget”, and “delay in the execution of the project by contractor”
• About two-fifths of the projects did not face any problem in its execution.
5.2.5 Impact of PIDDC scheme
The impact of the projects was measured by three types of indicators: “thoughtful
perception” of district/state tourist officers of the impact, increase/change in the number of tourists visited the project sites during different years of 11
th five year plan, and
increase/change in employment of the manpower in the tourism related industry in
different years of 11th plan period. It may be pointed out that the impact, here, has
been assessed on the basis of one indicator of perception and two quantitative indicators. Even indicator of perception was more than perception since the respondents
were asked, following their reported perception, why they thought so; they were asked to
give reasons for the response they had given. Thus, perception related response was
based on their assessment of the ground situation and therefore, it was not mere
perception but a “thoughtful perception”.
These findings have been discussed in this section.
• More than about two-thirds of the stakeholders perceived (thoughtfully perceived)
increase (“Substantial increase” or “Somewhat increase”) in the attractiveness of the
tourist sites as well as increase in the number of tourists who visited the site.
• About 50 percent stakeholders perceived increase in the employment opportunities,
increase in the income, increase in the living pattern of the residents of the area and
overall development of the area.(Thoughtful perception).
• Number of tourists visiting the districts of the sampled tourist destinations, reported
by the district/state tourist officers, showed increase of 82 percent in the year 2010-11 compared to their number in 2007-08. Such increase in tourists for the total of
India was only 40 percent. (Substantial quantitative increase indeed!).
• Increase in number of tourists served by hotels/guest houses in the districts of the
sampled tourist sites was 149 percent in 2011-12 compared to 2007-08 and tourists served by buses/taxi operators increased by 61 percent in five year period of the 11
th
five year plan.(Quantitative change).
• Manpower deployed by stakeholders in the sampled districts increased by 40
percent, 84 percent, 78 percent, 41 percent and 74 percent for hotel/guest houses,
restaurants, tour operators/travel agencies, bus/taxi operators and souvenir shops respectively, during the period 2007-08 to 2011-12 (five years of 11
th five year plan).
This increase in employment was needed, mainly because tourist traffic had
increased during the period. (Quantitative change).
GfK MODE
PIDDC Report Jan, 2013
48
5.2.6 Current status of tourist sites
The district/state tourist officers manning the districts studied here were asked their
perception of the current infrastructure at the tourist sites. Similarly, the tourists visiting
the destination studied were also asked their tourism related experiences. Their responses, reported here, are suggestive of the strengthening needs of the area and the scheme
PIDDC.
• About 600 projects (or 27%) in the districts under study have not yet been
strengthened under PIDDC scheme. But according to reporting of the district tourist
officers, only 19% of them have poor or very poor infrastructure. Thus, it seems that
114 projects in these districts still needed strengthening.
• As stated earlier, only about 34% projects sanctioned in the 11th five year plan have
been completed; they still needed time to be completed.
• Less than 50 % tourists had reported satisfaction with (i) response of tourist office at
state level, (ii) tourist office at district level, and (iii) service of the tour operators
whose services they had hired.
• Less than two-thirds of the tourists (but more than 50%) reported satisfaction with (i)
response of the reception office, (ii) ticket office, (iii) signages at the monuments,
(iv) drinking water facilities, and (v) toilet facilities.
• The tourists who had visited the tourist sites under study had suggested the following
types of improvements in the tourist sites:
1. Improve the beauty and cleanliness of the surroundings
2. Provision of drinking water at the site
3. Provide more public toilets
4. More lighting at the site
5. Creation of parks at the site
7. Good hotel/lodging facilities
8. Good parking facilities, and
9. Security of the tourists, particularly of the foreign tourists. Though this is not the
direct responsibility of the tourism ministry, they need to coordinate with the
concerned departments.
5.3 Recommendations for PIDDC scheme
It may be noted that several tourist destinations/circuits still require strengthening. Sixty six percent of the projects sanctioned during 11
th five year plan are still to be completed.
In addition, there are 114 tourist destinations in the districts where the current study was
undertaken (24 districts in 18 states/UTs) needed to be strengthened as their infrastructure
was reported to be “poor” or “very poor”. In other words, PIDDC scheme which was started since 9
th five year plan (in different formats) needed to continue to strengthen the
tourism infrastructure in the country.
GfK MODE
PIDDC Report Jan, 2013
49
Regarding the PIDDC scheme, the district/state tourist officers expressed great
appreciation for the scheme. They felt that such support from the MOT, Government of India was the only way in which tourism in the country could improve. It is, therefore
strongly recommended that this scheme should continue as Centrally sponsored
scheme. Such schemes of the MOT should get more funds from the Planning Commission as projects strengthened under such schemes could greatly help not only to
increase tourism in the country and earn foreign exchange but would improve lives of the
residents of the area by giving them more income and other facilities which make quality of life better. Tourism also gives opportunity to the states/country to showcase its culture,
art, music, handicrafts etc, in addition to generating employment and better earnings of
the people. According to them, there is direct relationship in the increased flow of tourists
and development of the area and its residents. It was also suggested that such schemes of Government of India should get more publicity so that more and more states and districts
could benefit from such schemes.
As far as PIDDC scheme is concerned, it was found to be comprehensive and it could
fund all the needs of the tourist destinations/circuits except (i) security concerns of
tourists, and (ii) behavioral issues of the tourist staff (reported by tourists) at the state, district and reception centres of the Department of Tourism and the employees of the
tourism industry..The earlier component suggests need for MOT to coordinate with
concerned Departments for the security of the tourists. The latter component
suggests need for some periodic orientation and sensitization of the staff of the
department of tourism and others who deal with tourists.
Thus, the PIDDC scheme as such needs to be continued with some additionalities
(indicated above), but need was expressed to strengthen its implementation and
improve its impact by streamlining the process of proposal writing, implementation
and monitoring. (Recommendations in these regards have been later in the section).
A few suggestions to streamline functioning and actual implementation of the PIDDC
scheme (given by the district/state tourist officers and emerged from the findings of the
study) were the following:
• It seems that the district/state tourist officers and persons in-charge of the reception
centres of the tourist sites were not involved in development of the proposal. This
had affected their commitments towards execution of the PIDDC supported activities.. It is therefore recommended that these officers should get involved in
preparation of the proposal and then in its execution.
• The proposals submitted for funding from PIDDC were reported to be not fully
comprehensive. It was therefore suggested that PIDDC should provide some funding for pre-proposal stage so that the state could undertake a quick study to
assess “strengthening needs of the tourist destination/circuit”. This small fund
could help in ensuring that the proposal submitted was comprehensive where views of all stakeholders including that of the tourists were taken and included in
the proposals.
GfK MODE
PIDDC Report Jan, 2013
50
• The maintenance of the assets created under the scheme did not get enough
emphasis. Therefore, it was suggested that one pre-requisite for acceptance of the
proposal should be that the state sends maintenance plan after strengthening was
done by PIDDC. The Ministry of Tourism, Government of India should insist to
receive a plan of maintenance as a part of the proposal. In this way, commitment of the state would be ensured in long term maintenance of the tourist site.
• Many states expressed need for technical guidance/support to develop a
comprehensive proposal and optimally utilize funding received to achieve the
project goals. It is, therefore, recommended that the Ministry of Tourism should have a technical committee attached to PIDDC to scrutinize the proposal received
from the states. This scrutiny should involve site visits to ensure that all the needs
of the area were included in the proposal as well as a sound maintenance plan is set up. This approach could make the proposal more comprehensive and will help
improve the tourist sites in the country. This committee should also be made
responsible for monitoring the execution of the project by periodic visits to the
sites. In other words, it is suggested that MOT should undertake greater role
in making proposal better and improving implementation of the proposal
when funded. A group should be formed at MOT level for review of the
proposals, technical guidance in its implementation and continuous monitoring of the progress of the project. This type of support will have very
high cost-effectiveness of the PIDDC scheme supported projects.
• The limits of funding put in the scheme should be flexible. A review of the needs
of the tourist sites should allow justifying higher level of funding and recommending relaxation of the financial limits. Even changes in the funding lines
may be allowed.
• The PIDDC scheme provided 100% funding from the Central Government. On the
basis of our (GfK MODE’s) earlier experience with other such schemes, we
recommend that states might be asked to contribute a small part of the funding for the project submitted for PIDDC support (say 10%). This will improve the quality
of execution as states would have more commitment and better monitoring.
5.4 Evaluation of Fairs and Festivals—Important Findings
This study had selected two fairs/festivals organized by each of 16 states. These 16 states have been shown in Annexure I. Their selection process was based on the budget of the
fairs/festivals – two highest budgeted festivals/fairs were selected for the study from
each of the 16 states. These 32 projects were grouped into festivals and fairs with the
definitions specified in Google. There were 14 fairs and 18 festivals. They have been listed in the report. Since the findings for these both categories of events were similar on
some dimensions, they have been discussed for those dimensions together.
Data for evaluation was collected from the organizers of the festivals and fairs at
district/state level and a few hotels/guest houses located in the vicinity of the tourist sites
where fairs/festivals were held.
GfK MODE
PIDDC Report Jan, 2013
51
This section discusses the findings based on the data collected for the selected fairs and
festivals. The findings are presented in the following four sections:
• Planning of the fairs/festivals
• Implementation
• Expenditure incurred and income generated, and
• Impact of the fairs/festivals.
5.4.1 Planning of the fairs and festivals
• Most of the fairs and festivals were organized in winter months when important
festivals like Deepawali, Christmas, Durga Puja etc. come. The idea, perhaps, might be that besides, good weather in the months of September through February, people
in these months would be in festive mood. This would be the right time to attract
tourists to the festivals/fairs.
• More than two -thirds of the festivals were organized for the duration of seven days or
less. The modal duration was 3 days or less; modal value was 3 days.
• In the case of fairs, modal duration was 4-7 days with modal value of 5 and 7 days.
5.4.2 Implementation of the fairs and festivals
• No particular difference was found in implementation of the festivals and fairs.
• Most of the fairs and festivals had a focus on some specific activity related to religion,
sports, culture or any such thing but multiple activities were organized so as to attract
more tourists/visitors. In other words, there were more activities than the focused one
to make it a mela. While this had been the general approach in implementation, there were several fairs/festivals where commercial interests were also kept in mind—the
traders and craftsmen were involved so that they could exhibit and sell their
merchandise/ products/handicraft.
5.4.3 Expenditure incurred and income generated
• Most of the festivals/fairs did not charge entry fee—More fairs had levied entry fee
than festivals
• Thus, most of the festivals had no income from this (entry fee) important source.
Therefore, most of the festivals depended on the grants they had received from the
governments, both Central and the State. Only thirty three percent festivals and 64
percent fairs had generated some income..
• Though fairs/festivals were organized by sharing the cost between the Centre and the
States, many festivals mentioned need of small additional grant from the state – as
cost over-ran the initial estimates. This happened in the case of both fairs and festivals
-57 percent of them.
5.4.4 Impact of the festival
Three questions related to the impact were asked from both categories of respondents (organizers of the festivals and hoteliers/guest house operators) for both categories of
events. These questions were:
GfK MODE
PIDDC Report Jan, 2013
52
1. Attendance at the festival,
2. Impact of the festival on number of tourists in the area during festival days and after,
and
3. Role of festivals in increasing tourism.
Findings from these questions have been given below.
• There was a large variation in the reported number of the attendees in the festivals.
This was so as there was no data collected/maintained on the numbers who actually attended the festival/fairs; every respondent to the question had his/her own guess on
the numbers who attended the fairs or festivals. In the case of ticketed festivals (which
was only a small percent) the number of attendees reported were quite encouraging.
• In the case of ticketed fairs, attendance reported varied between 100,000 to 150,000.
• All organizers of the fairs/festivals reported increasing trend in tourism by about 5 to
10 percent per year after the event. The hoteliers located around the festival sites also
reported (a) about 100% occupancy of their rooms during the festival days, and (b)
increase in occupancy of about 2 to 5 percent per year after the festival.
• In order to attract more tourists, both categories of respondents pointed out need for
improvement in the infrastructure and quality of services at the tourist sites where fairs/festivals were held. Particular needs were pointed out for the toilets, drinking
water, parking lots and the food courts.
• The fairs/festivals promoted tourism in two ways--by increasing the number of tourists
during the festival days and by changing the mindset of people who became favourable to tourism, in general. That is, fairs/festivals, in the long run, tended to increase
tourism
• The festivals/fairs also helped in spreading awareness of the local culture, art,
handloom, handicraft and industry. These products got boost.
• It was pointed out that the fairs/ festivals also have commercial value as festivals/fairs
increased interest in local items and handicrafts. It ultimately increased demand for these items, leading to more varied production and better income for the local traders.
• Such fairs/festivals created more self-employment opportunities. Local people could
get short and long term employment.
5.5 Recommendations for greater effectiveness of the Fairs and Festivals
Based on the ideas of the local organizers of the festivals and the results of this evaluation
study, its impact and the role it played or could play, the following recommendations
are made: 1. Every district should organize such fairs/festivals, at least once a year, to cultivate
tourism in the country which has several benefits. In the initial stages, such
festivals/fairs would attract local visitors and families who would start enjoying such visits and ultimately become tourists. In order to make the visits more attractive and
enjoyable, the tourist/festival sites should have all or most of the civic amenities.
2. It was suggested that such festivals should be held at most of the important tourist sites in every state and in districts even if they did not have tourist site as such. This was
only possible if such festivals could be made “almost” self-supporting. For this
purpose, organizers had suggested need for exploring the following possible sources of
revenue:
GfK MODE
PIDDC Report Jan, 2013
53
• Sponsorship
• Advertisements
• Stalls—merchandise, handicrafts, food items, tour operators and travel agencies etc
• Entry tickets and passes (reasonably priced)
• State and Central Government grants for fairs/festivals
3. We (GfK MODE) feel that while organizing a fair/festival, its four-fold role
(cultivating and increasing tourism, generation of awareness of the local culture and music, creating awareness of the local crafts, and handlooms and commercial and
employment benefits ) should be kept in view. That is, one should plan fairs and
festivals carefully and comprehensively to reap all its benefits, which required coordination among all the stakeholders —Department of Tourism, Department of
Culture including art and music, Department of handicrafts & handlooms and the
traders. This group should identify suitable dates, duration (suggestion, in this regard,
from this study was that it should be between 5 and 7 days), venue and the activities so that all the four goals listed above could be met.
4. There is need to bring a balance between the efforts (in organization of the
festival/fairs) and duration of the festival—more efforts should make duration longer. In other words, organizing such festivals for about three days (modal value of the
festivals was 3 days and 5 days for the fairs studied here) might not be adequate to
bring balance between efforts and the output. The festivals could be for five days and fairs for seven days. The planning should be so done as to sustain interest of the
visitors/tourists.
5. It was also suggested that activities in the fairs and festivals should be so planned that
visit to the fairs/festivals became a family activity. It was particularly suggested that fairs/festivals should organize sports, competition in games and if possible, involve the
tourists in the games to make the visit more enjoyable. In other words, items which
could entertain children and tourists should also be arranged in the festivals/fairs
6. For the choice of time period, suggestion was made that the dates should be selected by
keeping in view the weather and holiday seasons like Deepawali, Dushehra, Christmas,
Onam, Ganesh Chaturthi etc. In other words, the spirit of festivity should be fully
harnessed to attract tourists for the fairs and festivals.
7. Most of the states reported that they have plans to develop couple of tourist sites in the
state in such a way that fairs/festivals there could be branded with the state tourism.
That is, the tourists should be able to link state with those particular festivals or fairs and plan their visits to the state, especially around those fair/festival days. This concept
was similar to the idea of linking Mysore with festival of Dushehra—special activities
in Mysore Palace during Dushehra days. Rajasthan wanted to brand their Desert festival in Jaisalmer and Deepawali festival in Jaipur with the state of Rajasthan.
Similarly, Manipur planned to brand its Equestrian Championship fair with tourism in
the state of Manipur. They even have plans to invite polo players from foreign
countries during this fair. After such branding, they had plans to publicize the event widely in India and abroad.
GfK MODE
PIDDC Report Jan, 2013
54
The Ministry of Tourism could use its cultural attaches in Indian embassies and its own
tourism departments to publicize these fairs/festivals well in advance so that tour operators
could plan their packaged tours and foreign tourists could plan their visits during these
festivals/fairs. In this publicity of the fairs/festivals, interests of tourism, culture, handicrafts and shopping should be highlighted so that these festivals could appeal to all
groups of people with varied interests.
8. Keeping this view in mind, it is recommended that each state should have at least one
important festival/fair as its brand festival/fair for the state. It should be celebrated at
some important and interesting tourist site on a grand scale so as to attract tourists to
the state. As far as possible, dates and periodicity of such a festival should be so fixed that tourists could plan well in advance to visit the fair/festival. The Ministry of
Tourism, Government of India, could help the states to coordinate the dates of such
brand festivals/fairs so as to avoid overlap and enable tourists, particularly foreign
tourists, to visit more than one such festivals/fairs ( in more than one state) during their trip.
9. As far as the states are concerned, they should capitalize on the visit of the tourists to
the brand festival/fair. Make it a show case to show all their art, music, culture, food, dressing/textile, and other tourist sites in the neighbourhood. In other words, careful
planning should be done to show tourists all the important things of the state by
organizing at the site being visited and/or by taking them for short packaged trips. This would make stay in the state longer.
10. Suggestions were made for strengthening the infrastructure at the tourist sites where
fairs/festivals were held so that the visits could be made more attractive and satisfying
during the festivities. The following needs of the tourist sites were particularly highlighted by the organizers of the festivals:
• Sanitation services and facilities
• Drinking water facilities
• Good transportation facilities
• Parking facilities
• Construction of approach roads
• Development of picnic spots
• Lodging facilities to meet needs of all categories of tourists
For this purpose, states should utilize the funding of the Ministry of Tourism,
Government of India, under the PIDDC scheme, to develop necessary infrastructure
and services needed by the tourists.
GfK MODE
PIDDC Report Jan, 2013
55
ANNEXURE I – STATE WISE LIST OF SAMPLE SELECTED FOR THE STUDY
State - Andhra Pradesh
PIDDC Projects Name Project No. District Year of
Sanctioning
Cost sanctioned (Rs.
in lakhs)
Balance Due
(Rs. in lakhs)
Mega Projects
Development of heritage circuit at Tirupati as mega circuit in Andhra Pradesh
Integrated Development of Dwarka-Nageshwar-Bet Dwarka as a tourist circuit in Gujarat
2008/PIDDC/GUSGOV/19 Dwarka 2008-09 798.9 394.95
Circuits
Development of Dandi as a tourist circuit covering Dandi-Gandhi Smruti Railway Station- Karadi in Gujarat
2009/PIDDC/GUSGOV/213 Navsari 2009 - 10 733.01
148.60
CFA for Integrated development of Buddhist circuit , covering three destination -Devni Mori of dist. Sabarkantha- Taranga and Vadnagar of district Mehsana in Gujarat
2011/GU-SGOV/4 Mehsana 2011 - 12 523.90
104.78
Destinations
Development of Ambardi Wildlife Interpretation Park in District Amreli as tourist destination in
Gujarat
2007/PIDDC/GUSGOV/29 Amreli 2007 - 08 474.25
95.25
Infrastructure and destination Developement at Champner -Pavagadh in Gujarat