NIO/SP-68/2010 (SSP2473) DISTRIBUTION RESTRICTED Impact of Accidental Spillage of Oil and Hazardous Chemicals in Mumbai Bay Subsequent to Ship Collision on 7 August 2010, on Marine Ecology (Interim Report) SPONSORED BY Maharashtra Pollution Control Board, Mumbai DECEMBER 2010
Transcript
NIO/SP-68/2010 (SSP2473)
DISTRIBUTION RESTRICTED
Impact of Accidental Spillage of Oil and Hazardous Chemicals in Mumbai Bay Subsequent to Ship Collision on 7 August 2010, on Marine Ecology (Interim Report) SPONSORED BY Maharashtra Pollution Control Board, Mumbai DECEMBER 2010
Impact of Accidental Spillage of Oil and Hazardous Chemicals in Mumbai Bay Subsequent to Ship Collision on 7 August 2010, on Marine Ecology (Interim Report) Project Leader S.N.Gajbhiye Associate Project Leaders Jiyalal Ram M.Jaiswar V.S.Naidu Soniya Sukumaran Anirudh Ram Jaiswar M.A.Rokade DECEMBER 2010
CONTENTS Project team i Executive summary ii List of tables vi List of figures vii Common abbreviations x
1 INTRODUCTION 1 1.1 Background 1 1.2 Objectives 1 1.3 Scope of work 2 1.3.1 Physical processes 4 1.3.2 Water quality 4 1.3.3 Sediment quality 5 1.3.4 Biological characteristics 5 1.3.5 Ecotoxicological studies 5 1.3.6 Period of study 5 1.4 NIO’s initiative 6 1.5 Approach strategy for Phase I of study 7 2 THE ACCIDENT AND SPILL SCENARIO 9 2.1 The accident 9 2.2 Leakage of oil and its transport 10 2.3 Falling of cargo containers and their fate 11 2.4 Follow-up action by concerned agencies 13 3 STUDY AREA 16 3.1 Mumbai Metropolitan Region (MMR) 16 3.2 Mumbai Bay 17 3.2.1 Hydrography 18 3.2.2 Water quality 20 3.2.3 Sediment quality 22 3.2.4 Flora and fauna 24 3.3 Patalganga Estuary 26 3.4 Amba Estuary 27 4 MODEL PREDICTIONS 28 4.1 Oil spill trajectory 28 4.2 Modelling by NIO, RC, Mumbai 30 4.3 Further study 32 5 STUDIES CONDUCTED 33 5.1 Vulnerable areas and sampling strategy 33 5.2 Baseline for comparison of post-spill scenarios 34 5.3 Sampling period and locations 34 5.4 Sampling frequency and methodology 37 5.5 Analysis of samples 38 5.6 Work-up and analysis of PHc 38
5.6.1 Seawater 38 5.6.2 Sediment 38 5.6.3 Biota 38 6 BEHAVIOUR OF OIL AND HAZARDOUS CHEMICALS 39 WHEN SPILLED 6.1 Oil 39 6.1.1 Physico-chemical characteristics of oil 39 6.1.2 Weathering processes 41 6.1.3 Metereological factors 46 6.1.4 Impact on flora and fauna 46 6.1.5 Geographical and physical status of a water body 47 6.1.6 Quantity and rate of spillage 47 6.2 Pesticides 48 6.2.1 Organophosphorus pesticides 48 6.2.2 Synthetic pyrothroids 50 6.2.3 Other 51 6.3 Hazardous chemicals 53 6.3.1 Sodium hydroxide 53 7 LIMITATIONS OF STUDY 54 7.1 Authorisation 54 7.2 Logistics 54 7.3 Weather 55 7.4 Sampling 55 7.5 Manpower 55 8 PRESENT STUDY AND OBSERVATIONS 56 8.1 Intertidal environment 57 8.1.1 Alibaug 57 8.1.2 Kihim 58 8.1.3 Dighodi 59 8.1.4 Mandva 60 8.1.5 Dharamtar 61 8.1.6 Uran 1 62 8.1.7 Uran 2 63 8.1.8 JNPT 63 8.1.9 Vashi 64 8.1.10 Trombay 65 8.1.11 Colaba 67 8.1.12 Girgaon 68 8.1.13 Dadar 69 8.1.14 Mahim 69 8.1.15 Juhu 70 8.1.16 Impact assessment of oil spill 70 8.2 Subtidal environment 78 8.2.1 Field observations 78 8.2.2 Water quality 78 8.2.3 Sediment quality 86 8.2.4 Flora and fauna 88
8.2.5 Impact assessment of oil spill 92 8.3 Impact assessment of spills of pesticides and hazardous chemicals 96 8.3.1 Organophosphorus pesticides 96 8.3.2 Synthetic pyrothroids 97 8.3.3 Hazardous chemicals 97 9 TENTATIVE FINDINGS AND PROPOSED STUDIES 98 9.1 Ship accident and NIO’s initiative 98 9.2 Tentative findings 98 9.2.1 Model Prediction 98 9.2.2 Intertidal environment 99 9.2.3 Subtidal environment 100 9.3 Proposed studies 101
EXECUTIVE SUMMARY Two cargo ships MSC Chitra and MV Khalijia 3 collided in the mouth area of Mumbai Harbour on 7 August 2010 (0937 h) resulting in leakage of 600 to 800 t of furnace oil and about 120 containers onboard the vessel Chitra, some of them containing pesticides and hazardous chemicals like organophosphorus pesticides and sodium hydroxide, fell in the sea. National Institute of Oceanography, Mumbai (NIO) on its own initiative started studies to assess the impact of the accident on the ecology of the Mumbai Bay and adjacent coastal areas, from 10 August to 8 September 2010. Subsequently, this study and its continuance were supported by the Maharashtra Pollution Control Board (MPCB). The objectives of the investigation were (i) to study the impact of spilled oil and hazardous materials on water quality, sediment quality, and flora and fauna of pre-selected sites, (ii) to conduct eco-toxicological investigations for evaluating the impact of oil and other hazardous substances on selected marine organisms of the affected sites and (iii) to suggest adequate mitigation measures to safeguard the sensitive coastal ecosystem of Mumbai and adjacent areas in the event of ship accidents and spillage in future.
This Interim Report which is based on the monitoring conducted by NIO under 4 series (Series I: 10 – 13 August 2010; Series II: 18-22 August 2010; Series III: 26-30 August 2010 and Series IV: 6-8 September 2010 is prepared to meet the agreed terms of reference of MPCB.
Study area The hydrodynamics suggest that the flushing of the inner zones of the Mumbai Bay is a delayed process.
Under the influence of contaminants such as sewage and industrial effluents entering the Bay its water quality is characterized by high nutrients and marked depletion in DO during low tides in the inner Bay. Accumulation of Cr, Hg, Zn, Corg and PHc in the Bay sediments has also occurred. High and variable population of plankton induced by organic pollution especially in the inner Bay is common. The mangrove habitat along the shore has been degraded due to increasing
iii
anthropogenic pressures. The Bay supports high standing stock of zooplankton and intertidal macrobenthos.
Model Prediction
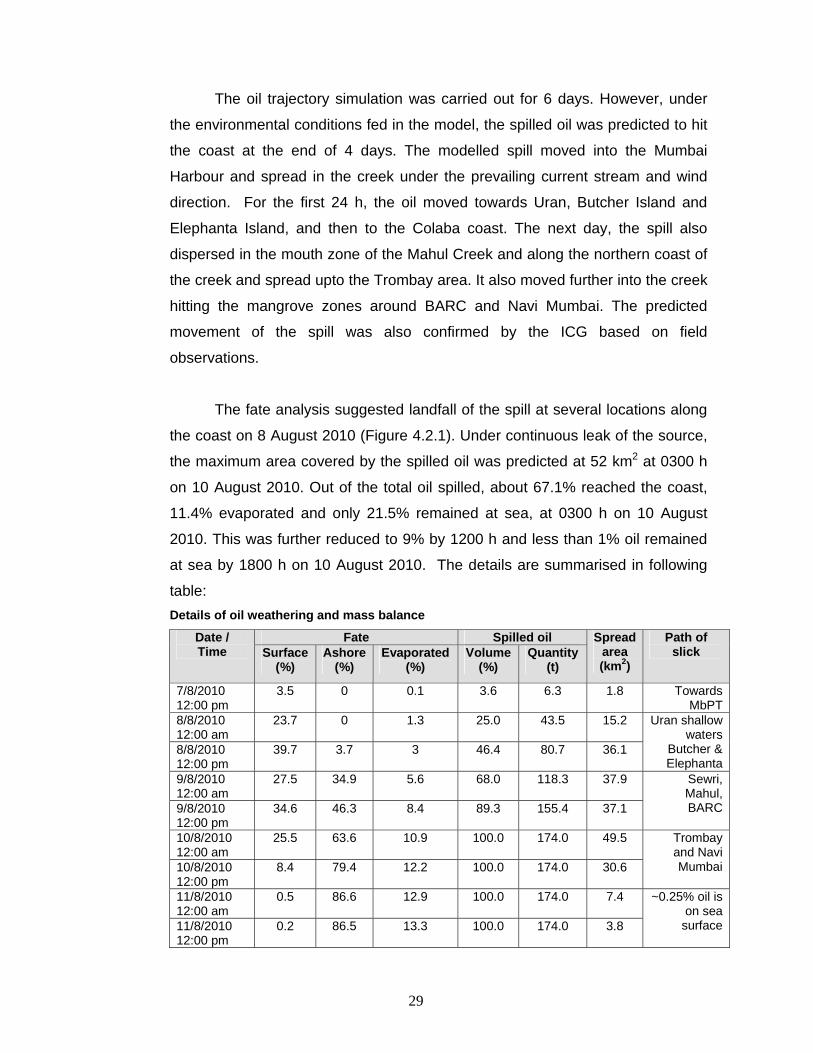
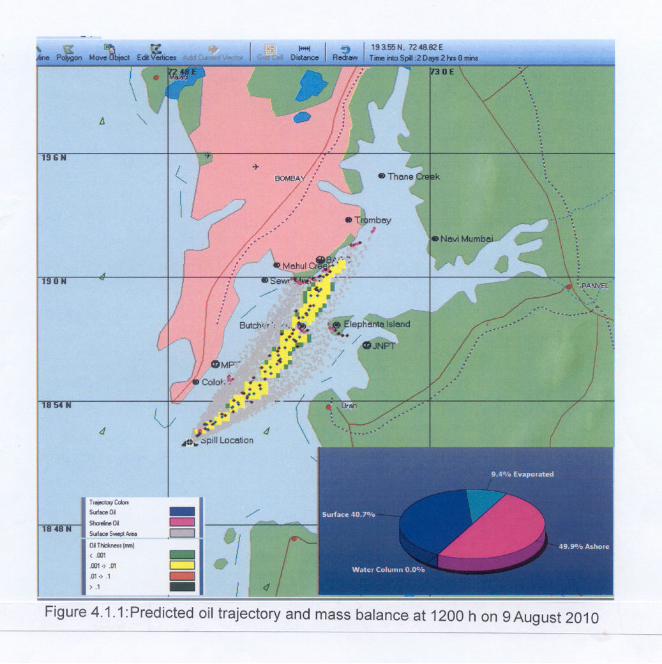
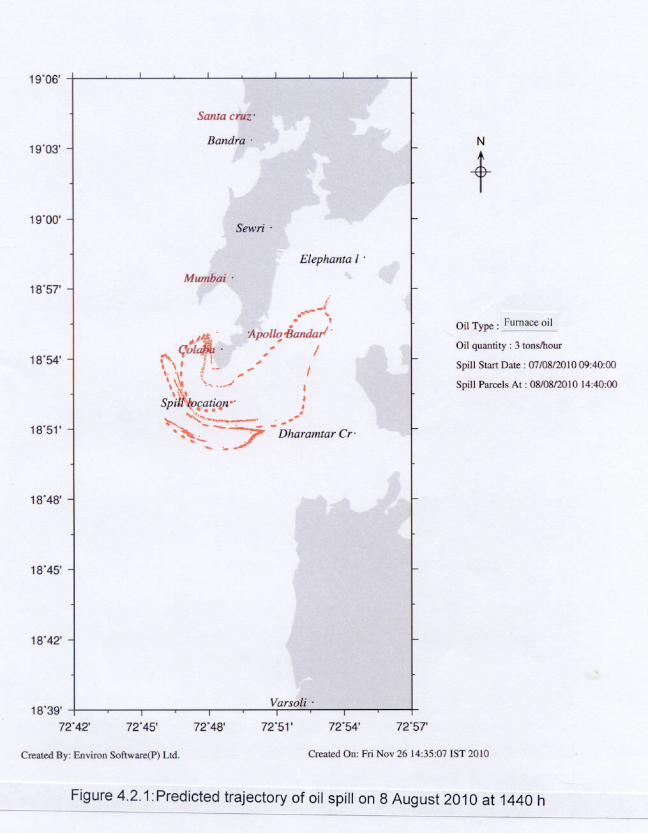
ICMAM – Project Directorate, Chennai as well as NIO modelled the spill assuming leakage rate of 3 t/h for about 3 days. The modelling results in both cases predicted that the spilled oil would hit the shores of Colaba, Uran, JNPT, Vashi, Trombay, Sewri etc. within the Mumbai Bay. The modelling results of NIO also predicted oil pollution in coastal areas south of the Bay mouth namely Mandva, Kihim, Alibaug etc. within 3 days of the spill. These predictions broadly matched the feedback from the field observations.
Tentative findings of intertidal monitoring
Among the 15 shore locations monitored on 10 August 2010, Colaba, Uran and Vashi had oil landfall. Intertidal areas of Trombay and Kihim and mangrove habitats at Vashi and Trombay were affected by oil. Some containers which had gone overboard and washed ashore were noticed at Dighodi and Uran with spilled materials like tea bags, sugar and biscuit packets, etc. strewn around. The west coast of Mumbai from Girgaon to Juhu was not affected by the oil spill.
The nearshore water quality of Series I revealed that the general water quality was comparable to the background except for PHc the concentrations of which were abnormally high (497-12075 µg/l) at Kihim, Uran, JNPT, Colaba and Mandva. During, Series II (after 8 days) majority of the shore segments except Uran 2 and Trombay revealed a marked recovery with much lower PHc levels (31.4 - 53.2 µg/l). The west coast of Mumbai showed expected water quality with the PHc values comparable to the background. Overall, the impact of the oil spill on the nearshore water quality was limited to enhanced levels of PHc in water at localized sites for a period of a week or so from the time of plugging the spill.
Increase in PHc in sediment of the intertidal zone was insignificant compared to the expected background at several sites except a marginal increase at Alibaug, Mandva and Trombay.
iv
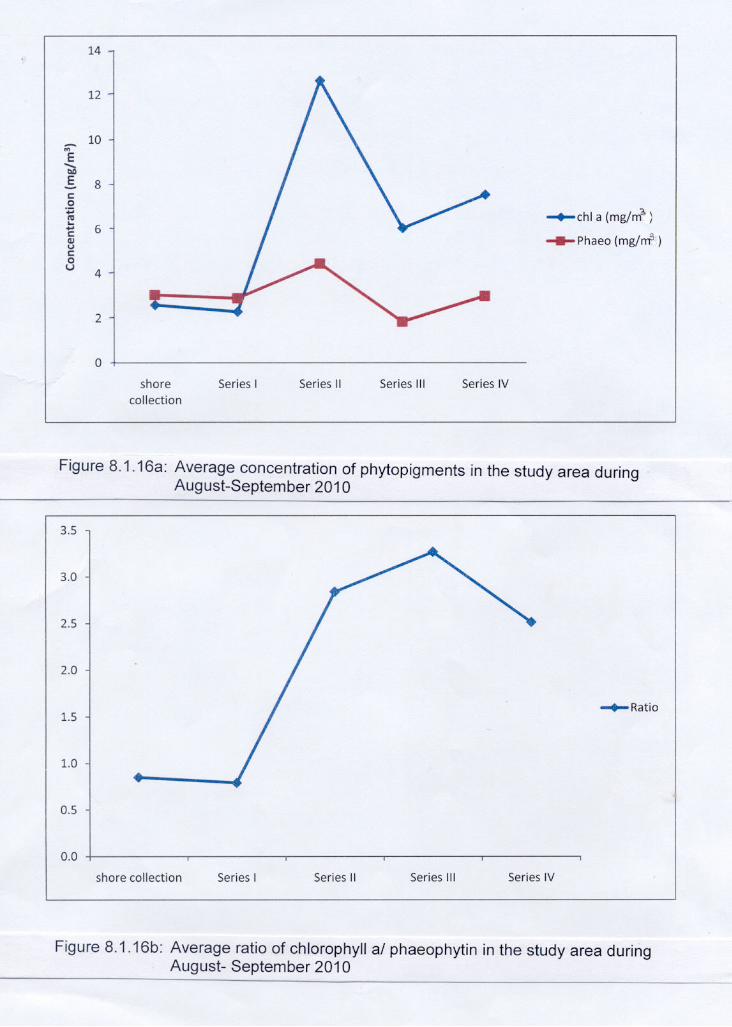
Considerable reduction in chlorophyll a (av < 1 mg/m3) and increase in phaeophytin resulting the poor ratios of chlorophyll a / phaeophytin (< 1) when compared with the values of September 2009 was probably due to mortality of phytoplankton caused by increased levels of PHc in water at Uran, Trombay and Colaba. Abundance of zooplankton and macrobenthos however, did not indicate any clear trend. Corals, barnacles, oysters and gastropods inhabiting the oil coated shore at Colaba were seen alive and did not show visible signs of acute stress. Mangroves (Avicennia marina) at JNPT, Vashi and Trombay were coated with oil up to a height of 0.5 to 1 m. High mortality of mangrove seedlings due to the oil spill was recorded at Trombay.
Tentative findings of subtidal monitoring The concentrations of PHc in water varied widely from as low as 5.2 µg/l at station 3 to the highest of 16902 µg/l at station 8 during Series I. However, as in the case of nearshore zone, the PHc values attained ambient status within a short period of 11 days (Series II) after the oil spill. The rest of the water quality parameters did not indicate any significant difference in comparison to expected background.
The levels of PHc in sediment (ND-22.1 µg/g, wet wt) in the Mumbai Bay were comparable to the background indicating no significant contamination of the bed by accidentally spilled oil. The bacterial count of TVC, TC and FC varied widely without any trend both in water and sediment of the Mumbai Bay. In the Bay they are known to be associated with the sewage releases.
. Chlorophyll a and phytoplankton populations indicated the possibility of phytoplankton mortality due to the oil spill in the initial stage (Series I). However, the recovery of phytoplankton in the affected areas of the Bay was fairly quick (Series II). A noticeable reduction in zooplankton standing stock and diversity was evident during Series II as compared to Series I. Similarly the abundance of fish eggs and fish larvae decreased to the extent of 90 and 76% respectively during Series II. It appears that the impact of the oil spill on zooplankton was delayed unlike the phytoplankton. High variability in standing stock and
v
diversity of subtidal macrobenthos was mainly associated with substratum characteristics and monsoonal disturbances and there was no evidence for the impact of oil on their standing stock in the Mumbai Bay.
The comparable levels of PHc in fish from Mumbai Bay during the pre- and post-spill periods preclude the possibility of its accumulation in fishes following the oil spill.
The fate of the contents of the containers with pesticides and hazardous chemicals going overboard is yet to be established.
Future plan Periodic monitoring of the Mumbai Bay and 100 km length of the coastline between Bassein and Alibaug will be continued until March 2011. Based on the results discussed in this report particular attention will be given to the recovery of intertidal ecology of spill-affected sites.
Ecotoxicological studies to assess neuro-toxicological impact on selected biota will be periodically undertaken.
Apart from the calibration of model, the weathering of selected fuels in the marine environment of Mumbai will be quantified in different seasons to generate information base for use in future.
A hypothetical leakage of a water soluble organophosphorus pesticide at the seabed will be modelled for different scenarios to assess the volume of the water column that might have levels to cause acute toxicity to organisms.
vi
LIST OF TABLES 4.2.1 Details of metereological parameters recorded at Santacruz during August
2010.
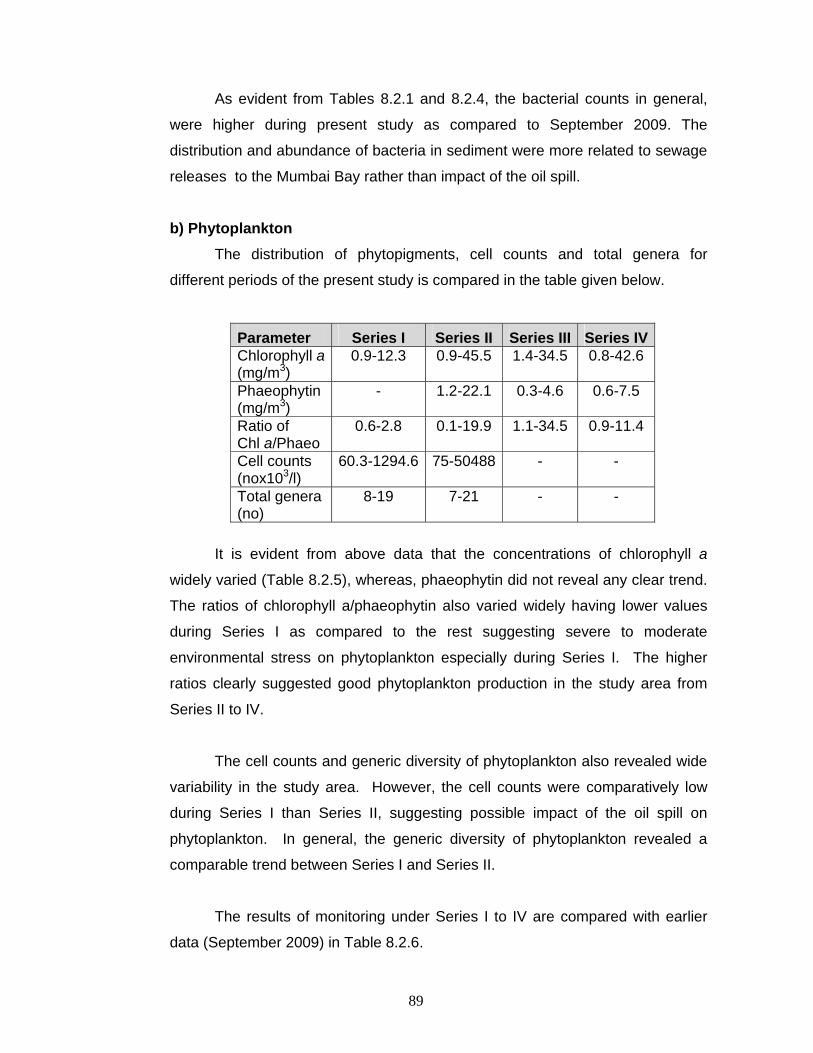
8.1.1 Distribution of phytopigments along the shore transects during August-September 2010.
8.1.2 PHc (µg/l) in seawater at subtidal stations sampled during Series I to IV and 2007-2010.
8.1.3 Water quality of intertidal transects along Mumbai Bay and adjoining coast (Series I – IV).
8.1.4 PHc (µg/g, wet wt) in subtidal sediment during Series I to III and 2007- 10.
8.2.1 Bacterial counts (cfu/ml) in surface water in Mumbai Bay during August-September 2010 (Series I-IV).
8.2.2 Bacterial counts (cfu/ml) in surface water at Mumbai Bay during September 2009.
8.2.3 Bacterial counts (cfu/g) in sediments at Mumbai Bay during September 2010 (I-IV Series).
8.2.4 Bacterial counts (cfu/g) in sediments at Mumbai Bay during September 2009.
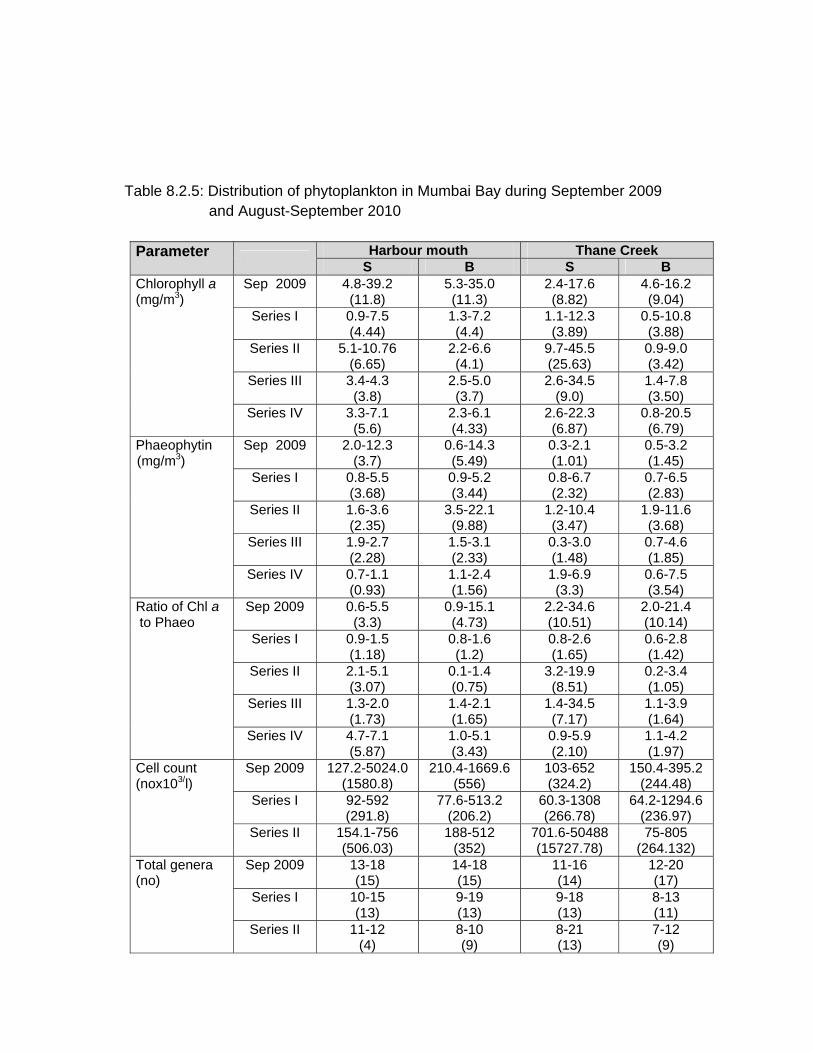
8.2.5 Distribution of phytoplankton in Mumbai Bay during September 2009 and August-September 2010.
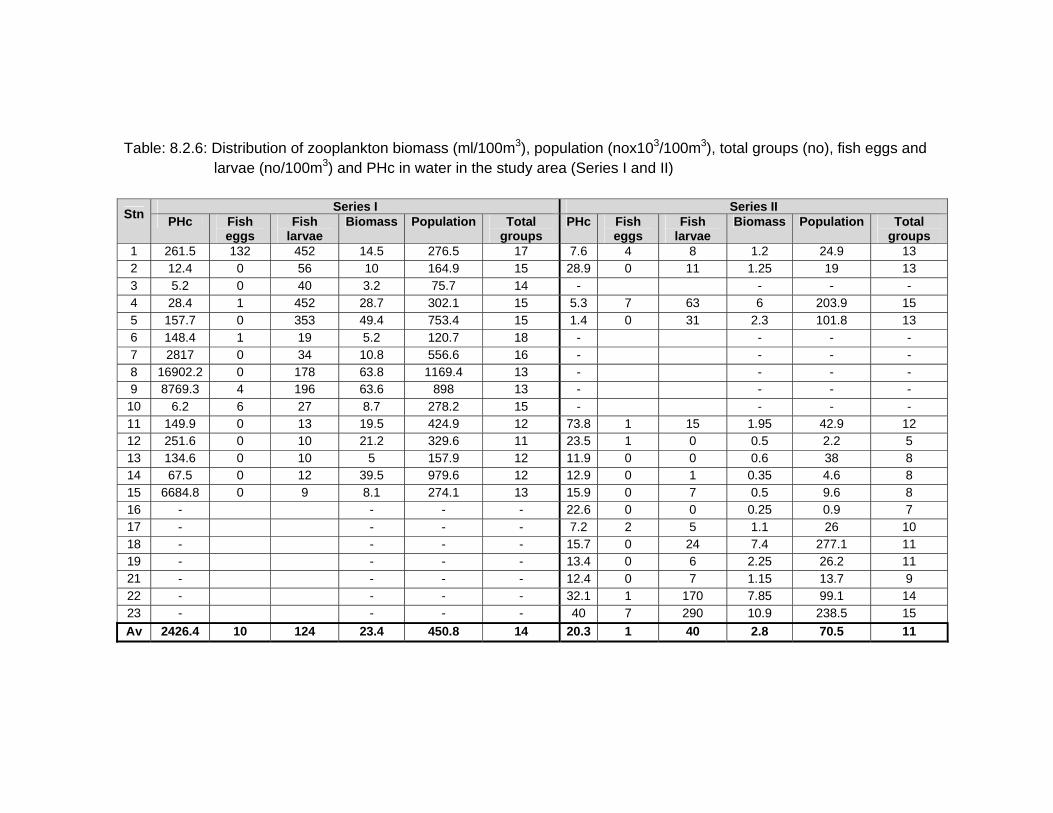
8.2.6 Distribution of zooplankton biomass (ml/100m3), population (nox103/100m3),
total groups (no) and fish eggs and larvae (no/100m3) and PHc in water in the study area (Series I and II).
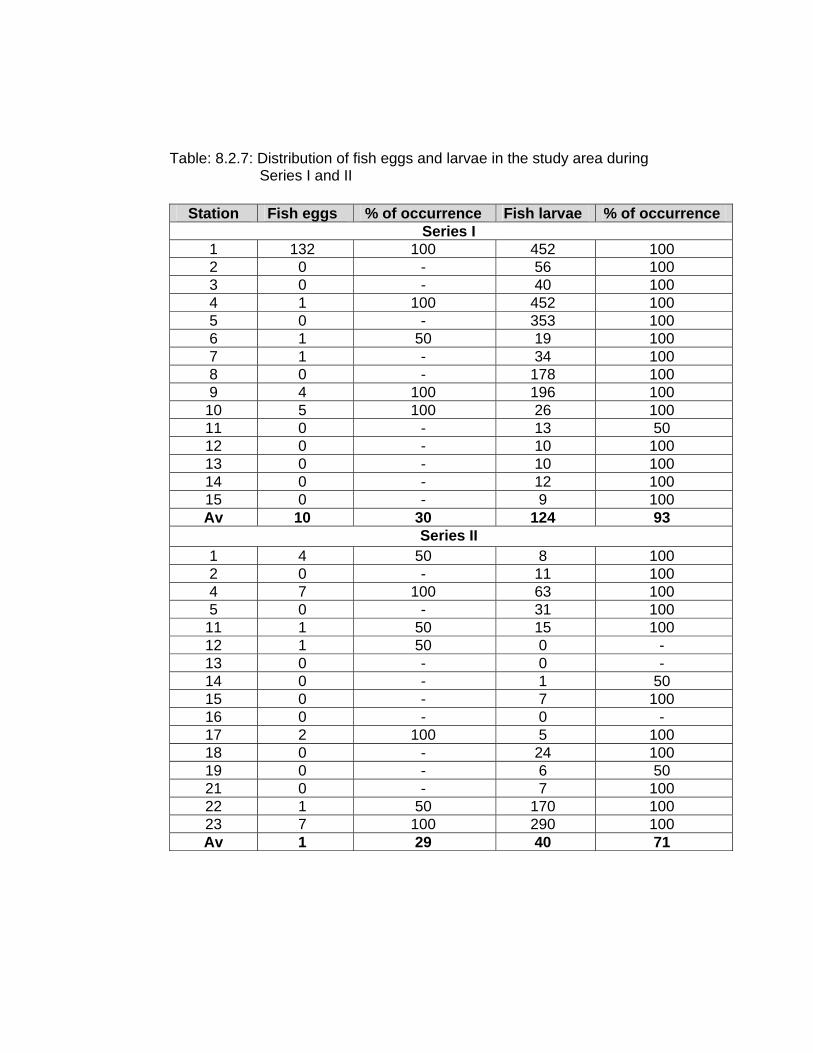
8.2.7 Distribution of fish eggs and larvae in the study area during Series I and II.
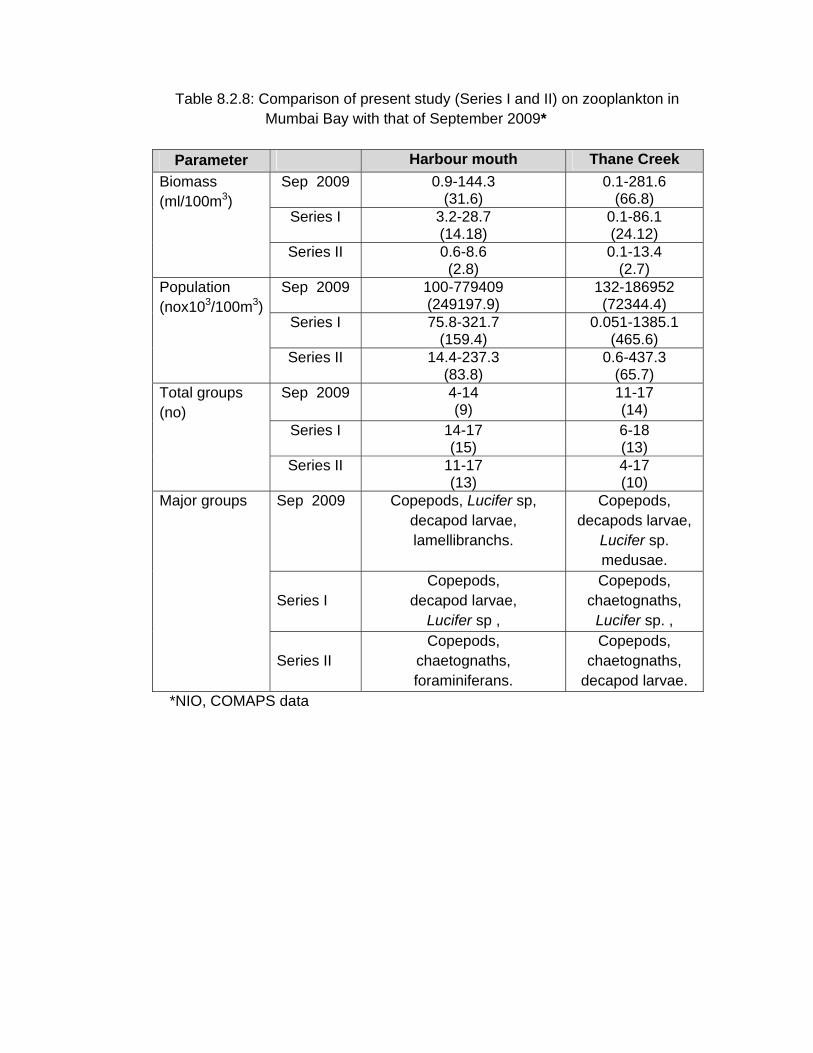
8.2.8 Comparison of present study (Series I and II) on zooplankton in Mumbai Bay with that of September 2009.
8.2.9 Comparative study of subtidal macrobenthos between September 2009 and August-September 2010.
vii
LIST OF FIGURES
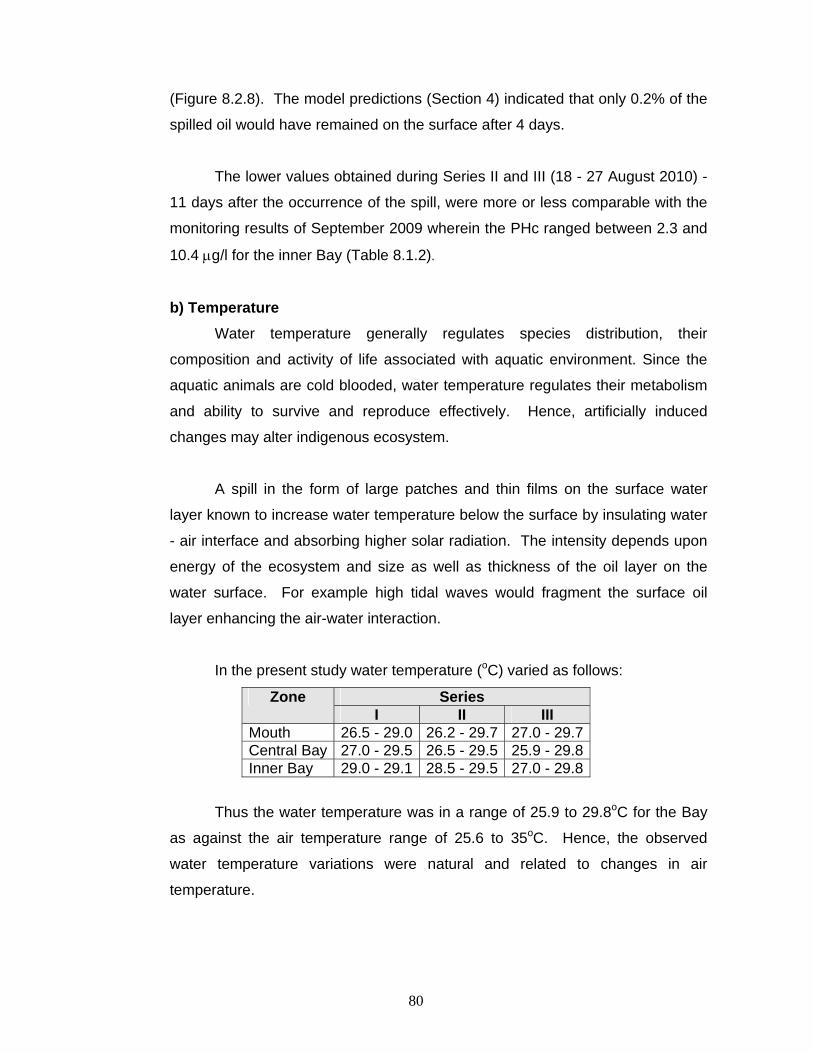
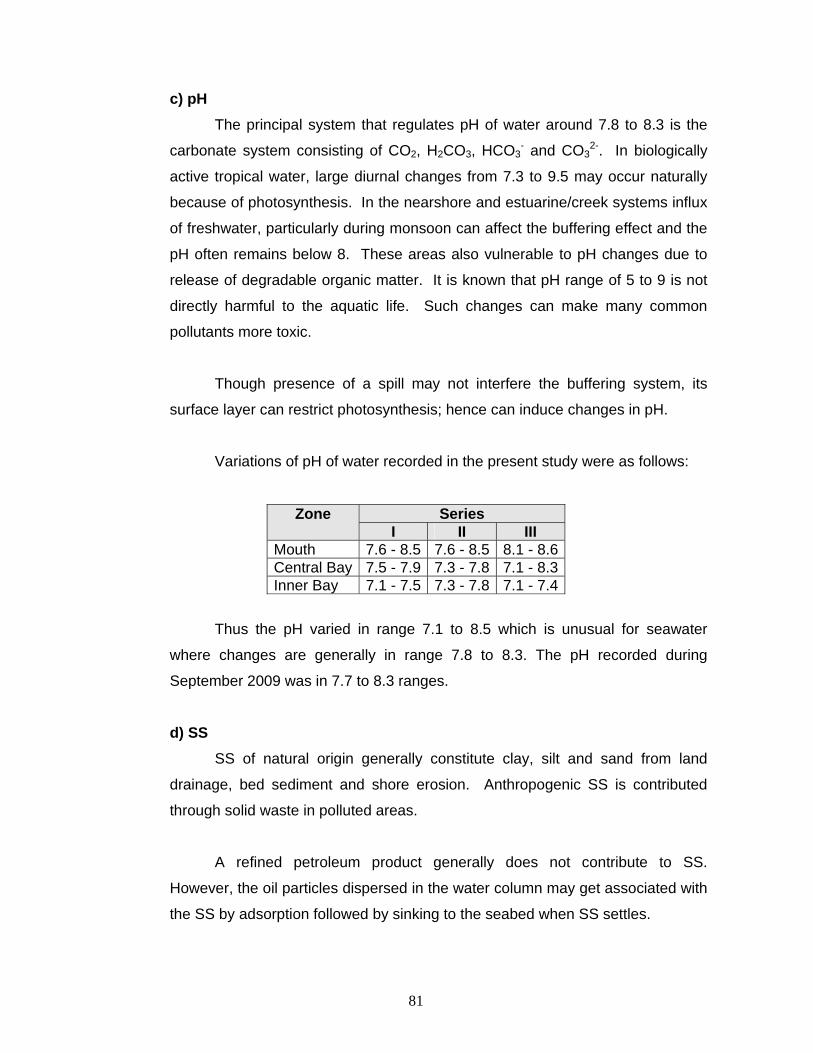
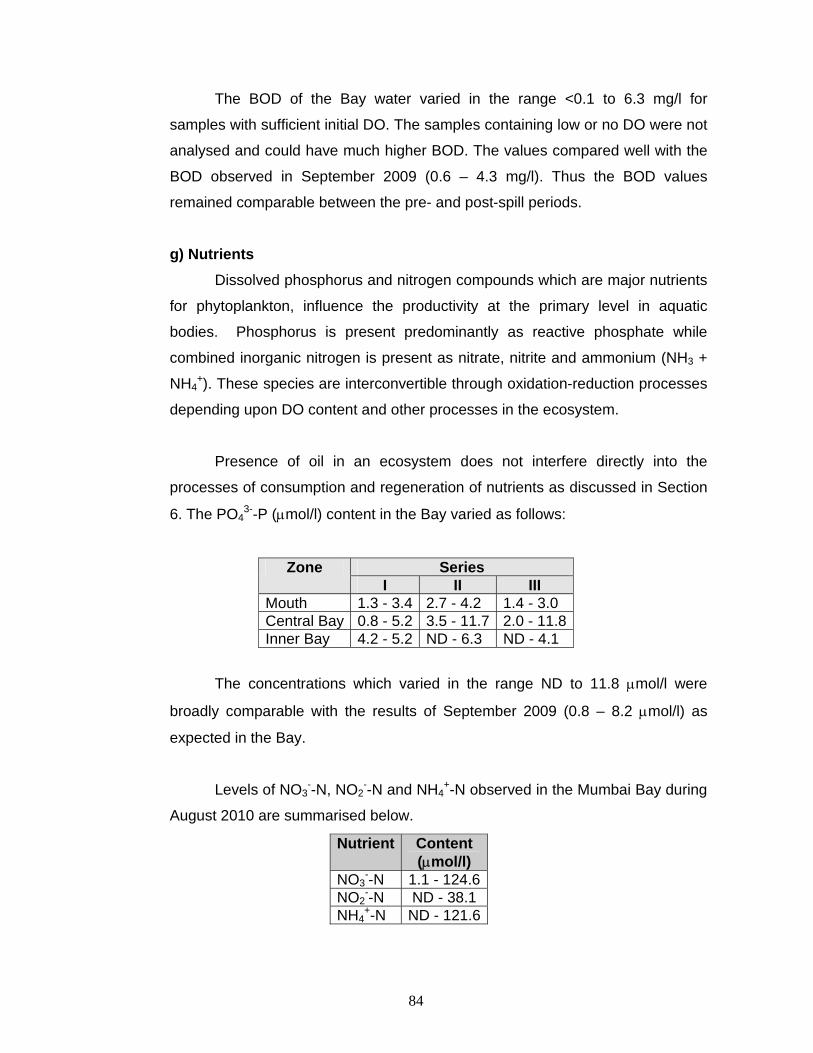
1.1.1 Accident and grounded sites of MSC Chitra on 7 August 2010. 1.1.2 *Tilting and grounding of MSC Chitra after accident. 1.1.3 *Several cargo containers falling in the sea. 1.4.1 Shore sampling locations at Mumbai Bay and adjacent coastal system
during initial study (Phase I). 1.4.2 Subtidal sampling locations in Mumbai Bay during initial study (Phase I). 2.1.1 *Damaged Khalijia 3 after the accident. 2.2.1 *Oil coated shore at Geeta Nagar (Colaba). 2.2.2 *Oil coated shore along Elephanta beach. 2.2.3 Oil coated along Uran. 2.2.4 Oil coated mangroves along Vashi Bridge. 2.3.1 *Containers floating in the navigational channel of Mumbai Bay. 2.3.2 Containers washed on shore at Uran. 2.3.3 Containers washed in the mangrove area at Dighodi. 2.3.4 The damaged container spilling the content on shore. 2.3.5 *Retrieved canisters washed ashore from a broken container. 2.3.6 Spilled materials from the broken containers at Uran. 2.3.7 *Salvage operation at the grounding site of the MSC Chitra. 2.4.1 *Beach cleaning at Uran. 2.4.2 *Carcass of a bird coated by oil slick. 2.4.3 *Oil residue collected for bioremediation. 3.0.1 *Map showing Mumbai Metropolitan Region (MMR). 4.1.1 Predicted oil trajectory and mass balance at 1200 h on 9 August 2010. 4.2.1 Predicted trajectory of oil spill on 8 August 2010 at 1440 h. 4.2.2 Predicted trajectory of oil spill on 9 August 2010 at 1040 h. 4.2.3 Predicted trajectory of oil spill on 15 August 2010 at 0940 h. 4.2.4 Predicted temporal variations of weathering processes in the Mumbai Bay
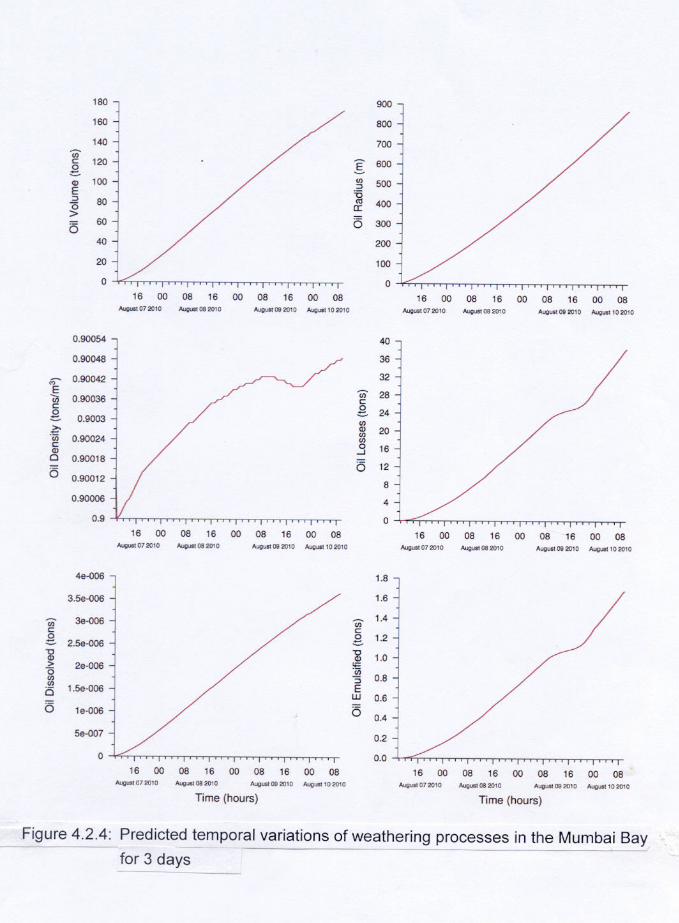
for 3 days. 4.2.5 Predicted temporal variations of weathering processes in the Mumbai Bay
for 7 days. 6.1.1 *Weathering processes of an oil spill in marine environment. 8.1.1a Wave action along the shore of Alibaug on 10 August 2010. 8.1.1b Tar balls on the Alibaug beach on 10 August 2010. 8.1.2a Oil patch noticed at Kihim beach. 8.1.2b Sampling in the tidal water at Kihim beach. 8.1.3a The container washed ashore at Dighodi. 8.1.3b The mangroves noticed (10 August 2010) free from oil coating at Dighodi. 8.1.5a The site around Dharamtar jetty. 8.1.5b No oil patch noticed at Amba estuary on 10 August 2010. 8.1.6a Shore sampling carried out at Uran 1 on 10 August 2010. 8.1.6b Broken containers noticed at Uran 1 8.1.7a Oil patches noticed (10 August 2010) close to shore at Uran 2. 8.1.7b The rocky areas found coated with oil at Uran 2. 8.1.9a The oil coated intertidal segment noticed at Vashi (10 August 2010). 8.1.9b The gastropods moving on oiled sediment at Vashi. 8.1.10a Mangroves coated with oil at Trombay. 8.1.10b Oil coated mangrove seedlings and pneumatophores at Trombay. 8.1.10c Mangroves selectively tagged for monitoring at Trombay.
viii
8.1.10d Mud skippers and crabs noticed in mangrove area at Trombay. 8.1.10e Mangrove seedlings coated with oil at Trombay. 8.1.10f High mortality of oil coated seedlings at Trombay. 8.1.10g Fading of mangrove leaves noticed after a month at Trombay. 8.1.11a Oil coated rocks at Colaba. 8.1.11b Oil contaminated tidal pool at Colaba. 8.1.11c Live corals in the intertidal zone at Colaba. 8.1.11d Barnacles, oysters (spat) and gastropods in the intertidal zone at Colaba. 8.1.11e 8.1.16a 8.1.16b
Spawning of intertidal gastropod at Colaba Average concentration of phytopigments in the study area during August-September 2010. Average ratio of chlorophyll a/ phaeophytin in the study area during August- September 2010.
8.1.16c Average macrobenthic biomass at the shore transects during August-September 2010.
8.1.16d Average macrobenthic abundance at the shore transects during August-September 2010.
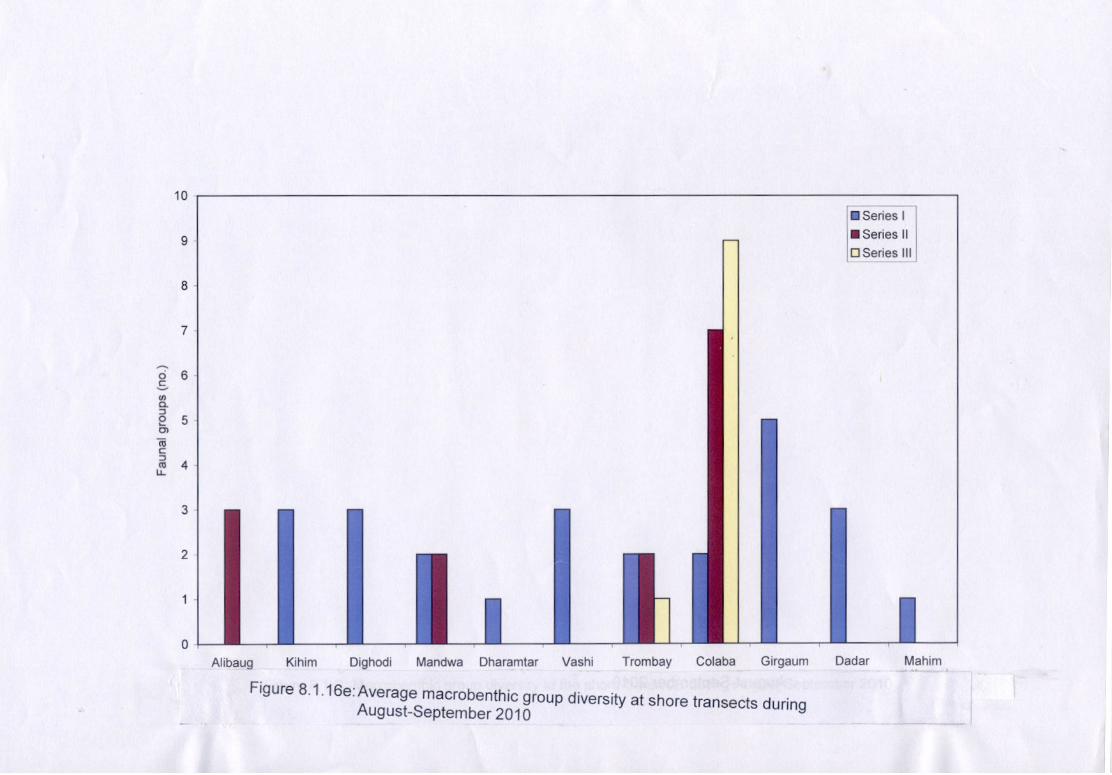
8.1.16e Average macrobenthic group diversity at shore transects during August-September 2010.
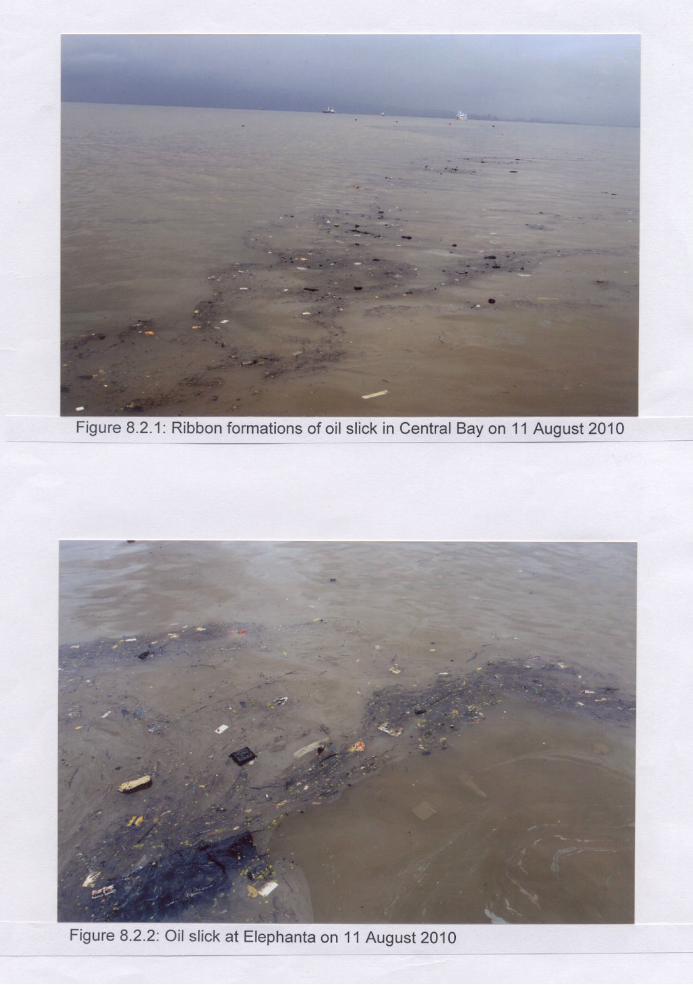
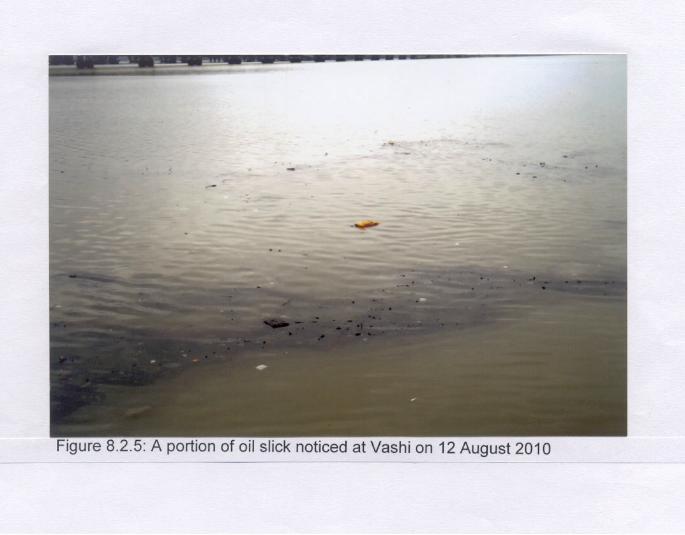
8.2.1 Ribbon formations of oil slick in Central Bay on 11 August 2010. 8.2.2 Oil slick at Elephanta on 11 August 2010. 8.2.3 The dispersed oil slick at Trombay on 12 August 2010. 8.2.4 The oil slick in surface water downstream of Trombay on 12 August 2010. 8.2.5 A portion of oil slick noticed at Vashi on 12 August 2010. 8.2.6 PHc concentration in subtidal water in Mumbai Bay during Series I. 8.2.7 Variation of petroleum hydrocarbons (PHc, µg/l) at different stations at
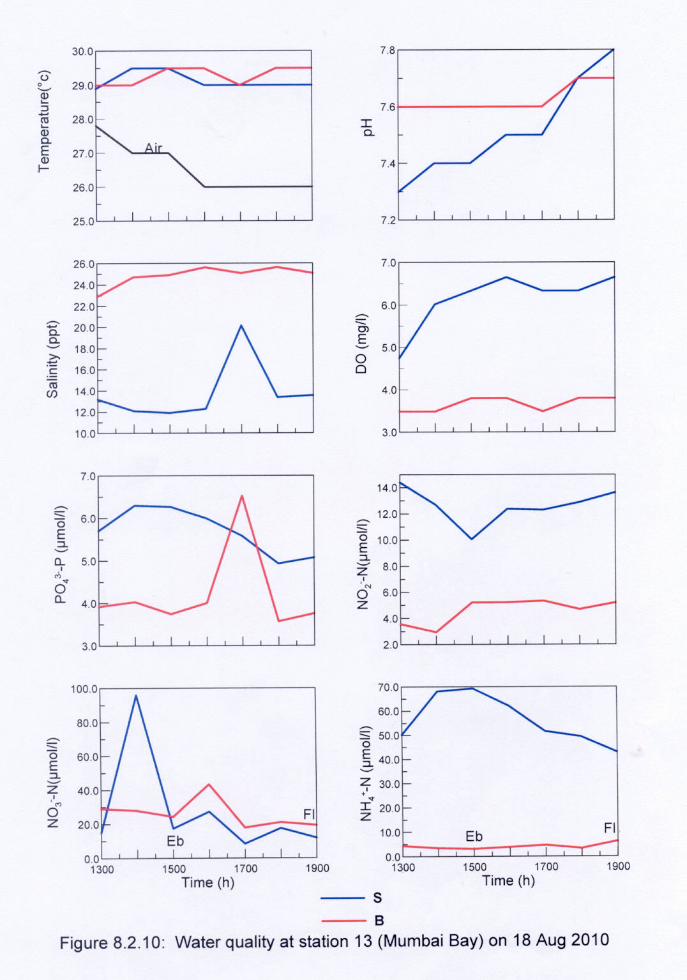
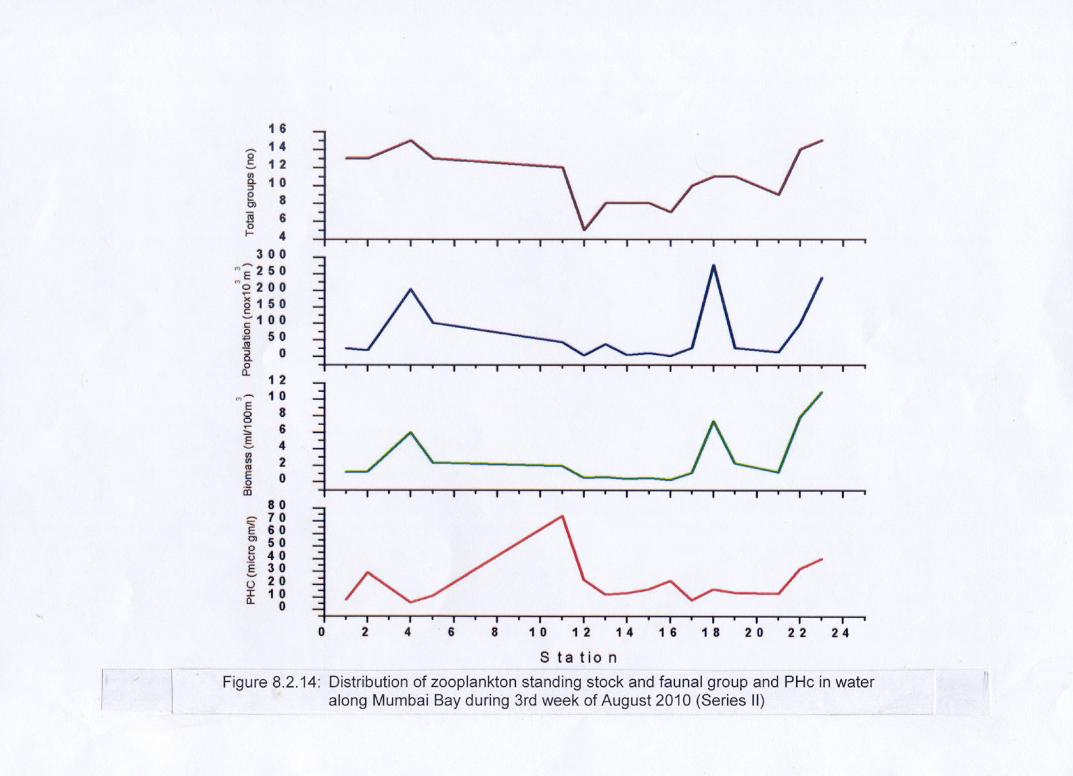
Mumbai Bay during post-spill period. 8.2.8 PHc concentration in subtidal water in Mumbai Bay during Series II. 8.2.9 Water quality at station 13 (Mumbai bay) on 13 August 2010. 8.2.10 Water quality at station 13 (Mumbai bay) on 18 August 2010. 8.2.11 Water quality at station 13 (Mumbai bay) on 25 August 2010. 8.2.12 Distribution of zooplankton standing stock and faunal group and PHc in
water along Mumbai Bay during 2nd week of August 2010 (Series I). 8.2.13 Abundance of fish eggs and larvae and PHc in water along Mumbai Bay
during 2nd week of August 2010 (Series I). 8.2.14 Distribution of zooplankton standing stock and faunal group and PHc in
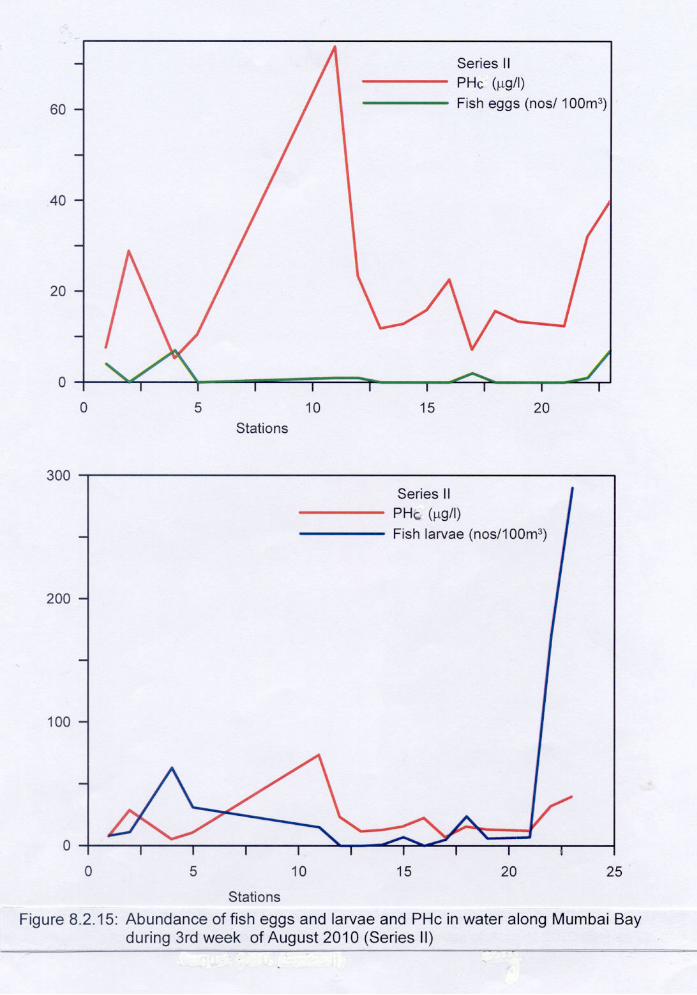
water along Mumbai Bay during 3rd week of August 2010 (Series II). 8.2.15 Abundance of fish eggs, larvae and PHc in water along Mumbai Bay during
3rd week of August 2010 (Series II).
ix
8.2.16 Average macrobenthic biomass at the subtidal stations during
August-September 2010. 8.2.17 Average macrobenthic abundance at the subtidal stations during
August-September 2010. 8.2.18 Macrobenthic group diversity at subtidal stations during
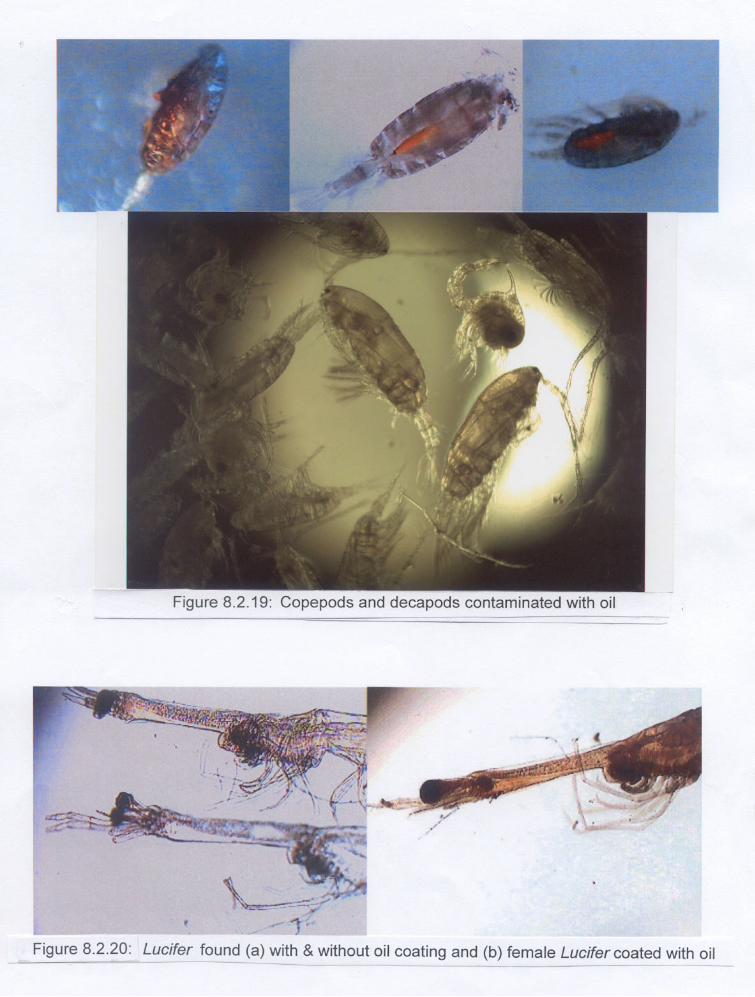
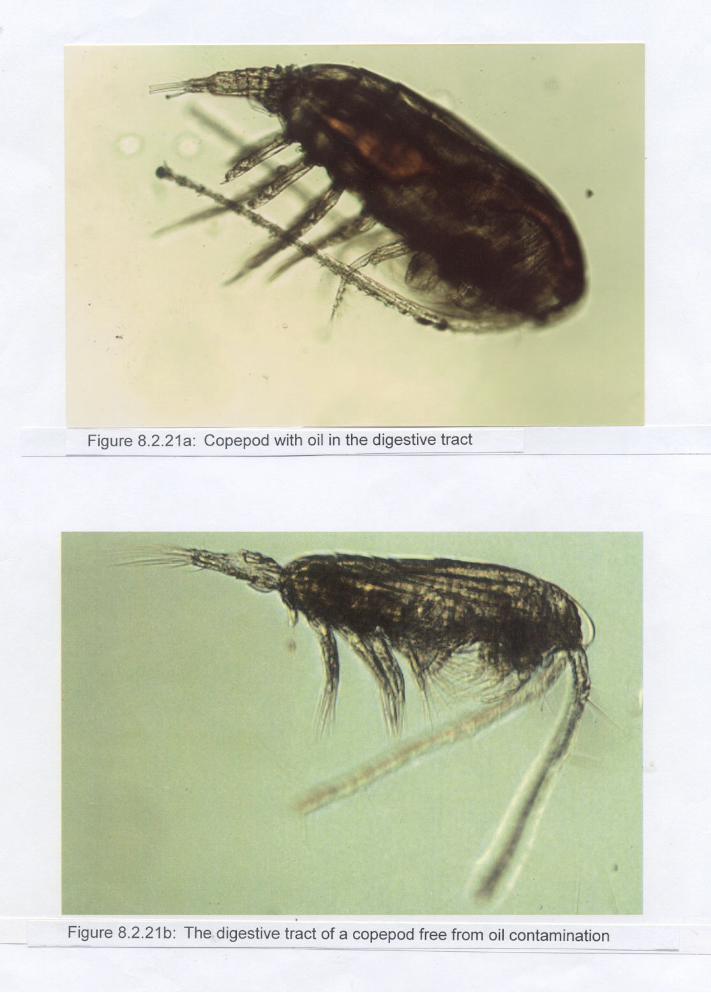
August-September 2010. 8.2.19 Copepods and decapods contaminated with oil. 8.2.20 Lucifer found (a) with & without oil coating and (b) female Lucifer
coated with oil. 8.2.21a Copepod with oil in the digestive tract. 8.2.21b The digestive tract of a copepod free from oil contamination. * Source: media/web sites
x
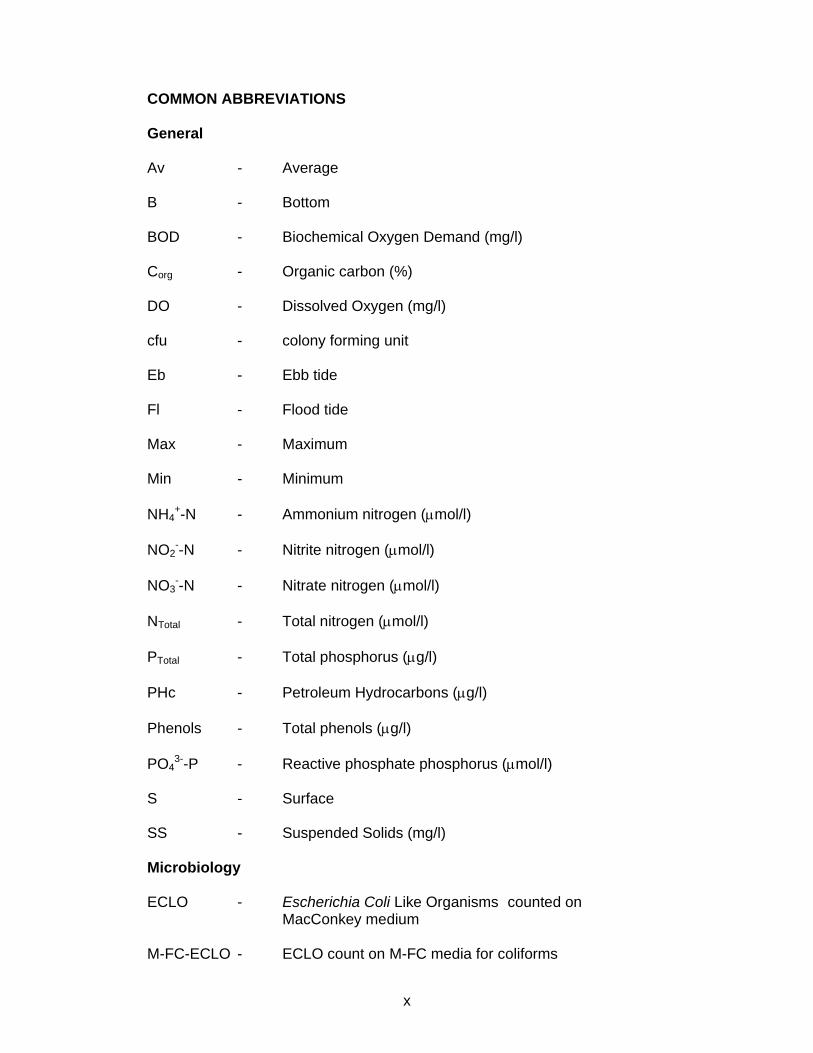
COMMON ABBREVIATIONS
General Av - Average B - Bottom BOD - Biochemical Oxygen Demand (mg/l) Corg - Organic carbon (%) DO - Dissolved Oxygen (mg/l) cfu - colony forming unit Eb - Ebb tide Fl - Flood tide Max - Maximum Min - Minimum NH4
+-N - Ammonium nitrogen (µmol/l) NO2
--N - Nitrite nitrogen (µmol/l) NO3
--N - Nitrate nitrogen (µmol/l) NTotal - Total nitrogen (µmol/l) PTotal - Total phosphorus (µg/l) PHc - Petroleum Hydrocarbons (µg/l) Phenols - Total phenols (µg/l) PO4
3--P - Reactive phosphate phosphorus (µmol/l) S - Surface SS - Suspended Solids (mg/l) Microbiology ECLO - Escherichia Coli Like Organisms counted on MacConkey medium M-FC-ECLO - ECLO count on M-FC media for coliforms
xi
MF - Membrane Filter PALO - Pseudomonas aeruginosa Like Organisms PKLO - Proteus / Klebsiella Like Organisms SFLO - Streptococcus faecalis Like Organsims SHLO - Shigella Like Organisms SLO - Salmonella Like Organisms TC - Total Coliforms TVC - Total Viable Counts VCLO - Vibrio cholerae Like Organisms VLO - Vibrio Like Organisms VPLO - Vibrio parahemolyticus Like Organisms
1 INTRODUCTION 1.1 Background
Two cargo ships MSC Chitra and MV Khalijia 3 collided in the mouth area
of the Mumbai Harbour on 7 August 2010 at 0937 h. Consequently, the
container ship MSC Chitra drifted and grounded near the Prong Reef Light
House (Figure 1.1.1). The accident resulted in leakage of a few hundred tonnes
(600 - 800) of the ship’s fuel - Furnace oil. Due to the grounding and tilting of
MSC Chitra, several containers, some of which containing hazardous and toxic
substances like organophosphorus pesticides; sodium hydroxide etc fell into the
sea (Figures 1.1.2 and 1.1.3).
National Institute of Oceanography (NIO), Mumbai on its own started
observations and conducted sampling in the affected area of Mumbai
Harbour/Thane Creek coastal system (hence forth referred as Mumbai Bay)
commencing from 10 August 2010.
With this background, the Maharashtra Pollution Control Board (MPCB)
approached the NIO to study and report the consequences with respect to the oil
spill and the release of hazardous chemicals in Mumbai Bay and associated
coastal system. NIO submitted the study proposal which has been accepted by
the MPCB. The objectives of the study are as follows:
1.2 Objectives
i) To study the impact of spilled oil and hazardous materials on water quality,
sediment quality and flora and fauna of the pre-selected sites.
ii) To conduct ecotoxicological investigations for evaluating the impact of oil spill
and other hazardous substances on selected marine organisms of the affected
sites, and
iii) To suggest adequate mitigation measures to safeguard the sensitive coastal
ecosystem of Mumbai and adjacent areas in the event of ship accidents and
spillages in future.
2
NIO has undertaken extensive sampling in the Mumbai Bay and
associated coastal system soon after the accident and post-spill period during
August 2010 (Figure 1.1.1). This has resulted in acquisition of valuable data.
As agreed, terms of reference require that the NIO to submit the findings
of the studies into three parts as follows:
Part I: Interim Report Interim Report to be submitted on the basis of data already acquired by
NIO after the accident (August - September 2010) referred as Phase I.
Part II: Rapid Report Rapid Report to be submitted on the basis of Phase II (September -
October 2010) (Section 1.3.6) studies.
Part III: Comprehensive Report Comprehensive Report to be submitted on the basis of all the study
phases (September 2010 - March 2011)
1.3 Scope of work
As mentioned in Section 1.1, NIO on its own started field observations
and sample collection in the Mumbai Bay coastal system during the spill and
post-spill periods. This has resulted in acquiring vital data pertaining to water
quality, sediment quality and biological characteristics as well as spill-affected
intertidal areas and mangroves. Also based on available data on physical
processes viz; tides, currents, circulation and bathymetry available with NIO,
numerical modelling of the oil spill to predict its probable trajectory and landfall
areas was undertaken. The modelling results suggested preferential transport of
the oil into the Mumbai Bay with the landfall on the coastline of the Bay. The
information generated through these field studies and modelling will be used to
select critical areas for assessment of impacts on marine ecology.
NIO has generated a fairly extensive environmental database for the
marine ecological status of the Mumbai Bay and adjacent coastal systems for
3
the last two decades. NIO routinely monitors the coastal waters of Maharashtra
and Gujarat including the marine environment off Mumbai, under the Coastal
Ocean Monitoring and Prediction System (COMAPS) programme of the Ministry
of Earth Sciences (MoES) commencing from 1992. This long-term database can
be usefully utilized to delineate the changes if any in the marine environmental
quality of the Mumbai Bay and adjacent areas due to the accidental spillage of
oil and chemicals. In the proposed study the COMAPS stations for which long-
term data are available will be also sampled. Spill-affected intertidal areas
including those which sustain mangroves will be selected as monitoring sites and
will be periodically sampled.
Investigations of marine oil spills worldwide have shown that the water
column except in the vicinity of the oiled coastline is freed from the petroleum
residues fairly quickly due to various weathering processes such as evaporation,
dilution, sedimentation etc. However, the left-over oil which could be fairly high in
the present case considering the nature of the spilled oil, would be transported to
the intertidal area under high tidal influence where it may get weathered and
remain stranded for a much longer duration.
Hence the shore biota of the oiled intertidal areas would be severely
affected. Thus, unlike phytoplankton, zooplankton and pelagic fishes which
would be freed from the oil pollution relatively quickly, the intertidal biota will be
under the influence of oil for a much longer duration.
A significant part of the weathered oil could sink to the seabed thereby
increasing its burden in the seafloor sediments. Hence, subtidal benthic
organisms could also be exposed to higher concentrations of oil for a longer
duration. Therefore, the status of intertidal and subtidal sediments and
associated biota will be particularly addressed during the proposed study. Long-
term studies subsequent to oil spills have shown that the oil stranded on
beaches or in sea floor sediments is biodegraded though the process is slow and
the local ecology of the affected areas recovers after a lapse of time – in some
instances after a decade or so though the process of recovery commences
within a year or so of the spill.
4
The hazardous substances like chlorinated pesticides, heavy metals,
polychlorinated biphenyls etc persist for a long duration in the environment and
also bioaccumulate in marine organisms. Furnace oil and pesticides are of
concern in the present context. While monitoring of oil in the environment and its
impact on biota is straight forward, a similar investigation for pesticides requires
the information on its chemical composition if its effect is to be monitored. This is
crucial because unlike chlorinated pesticides which are persistent and not easily
biodegradable, the commonly used organophosphorus pesticides quickly
degrade by hydrolysis on exposure to sunlight, air, and soil. These pesticides are
however, highly toxic. Hence, they could have significant and immediate
neurotoxicological impact on the marine food chain which needs to be
investigated through ecotoxicological studies.
The studies will essentially involve establishment of the pre-accident
status based on the available information as well as post-oil/pesticide spill
scenario with respect to water quality, sediment quality and biota. The results will
be utilized to assess the impact of the oil/pesticide spill on the marine
environment of the Mumbai Bay and adjacent coastal area (Figure 1.1.1). To
achieve above scope the following studies are proposed:
1.3.1 Physical processes
The data on tides and winds and their role in transporting the miscible
(water soluble) and floating pollutants will be evaluated using the predicted tide
and local wind as well as available data on current and circulation pattern. A
calibrated two dimensional (2D) pollutant dispersion model will be used to
delineate the area of spread of pesticides in the water column for a few
hypothetical locations and the duration of its persistence. Similarly an oil spill
transport model will be used to predict the fate of the spill and its landfall.
1.3.2 Water quality Water quality will be assessed at about 15 to 20 locations covering the
coastal stretch between Bassein and Alibaug. Out of these, 2 to 3 stations will be
monitored temporally for 12 h at the interval of 1 h whereas other stations will be
spot sampled. The samples collected at the surface and the bottom (wherever
5
the water depth exceeds 3 m) will be analyzed for salinity, Suspended Solids
d) Non-hydrocarbons: The major non-hydrocarbons are organic compounds
containing N, S and O (NSO) and metals like Ni, V, Cu, Zn and Fe. Contribution
of non-hydrocarbons to a oil varies from 2 to 50% and origin of a crude oil largely
influences the composition of these constituents. The O compounds are
generally in the form of phenols, carboxylic acids, ketones, esters etc. The N
compounds include substituted pyrine and quinoline compounds, pyrroles,
indoles, carbozones and benzcarbazones. Most of the sulphur in crude oil is
present as methyl-ethyl sulphite, cycloalkyl thiol, n-pentyl mercapton etc. Most
abundant metals namely Ni and V are found in the form of petroporphyrin
complexes and occur in the range of 0.03 to over 300 µg/l in crude petroleum.
41
The chemical characteristics that influence the behaviour of an oil spill is
composition i.e. type and percentages of hydrocarbons, non-hydrocarbons and
insolubles present in the oil. For example aliphatic and aromatic hydrocarbons
are hydrophobic and lowly soluble, hence have little tendency to mix, dissolve
and disperse in the water column. Non-hydrocarbons however form part of the
water column as they are soluble in water. The insolubles on the other hand
would persist for a long time forming part of a residue on seabed and beaches.
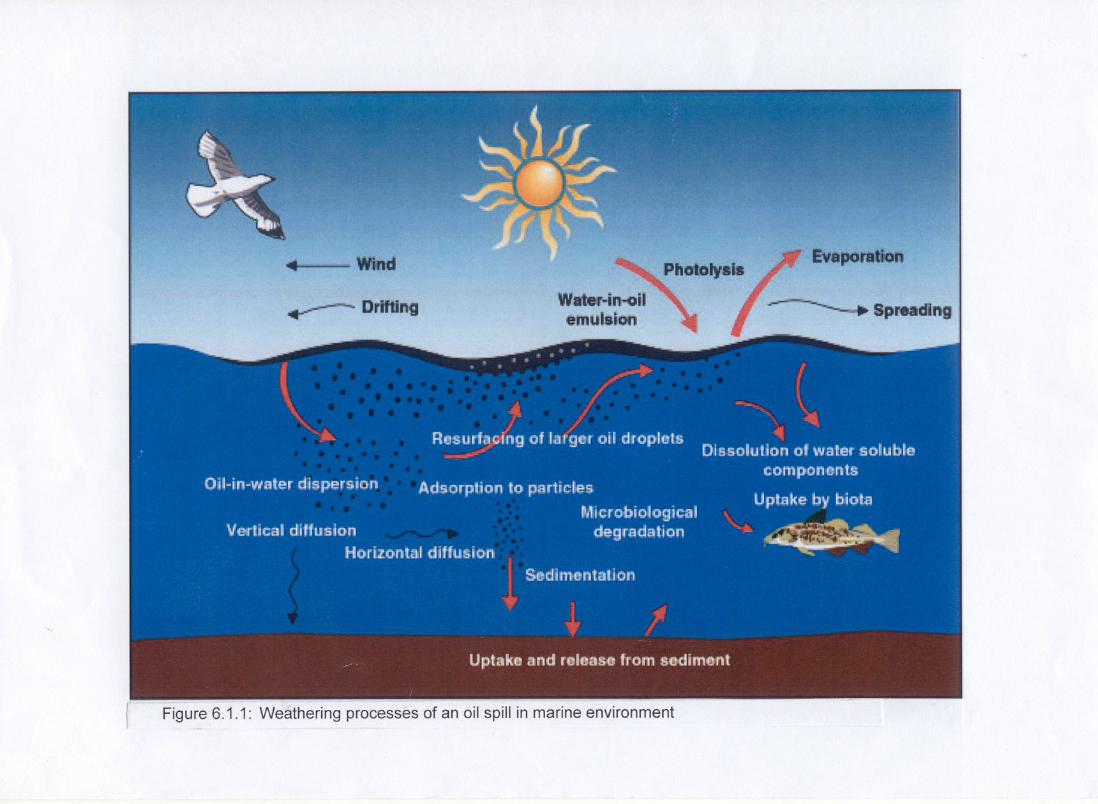
6.1.2 Weathering processes
Once oil enters the sea, several processes start acting simultaneously
resulting in alteration in its physical and chemical properties. These processes
include spreading, drifting, evaporation, dispersion, dissolution, emulsification,
photooxidation, microbial degradation and sedimentation (Figure 6.1.1). Though
each process has a typical effect, the resultant impact is generally a cumulative
one. Evaporation and dissolution are the two major processes, which are mainly
responsible for removing major fraction of spilled oil from the marine
environment in case of lighter products. Thus, both together can remove more
than 90% of hydrocarbons lighter than n-C10 within few hours of spill occurrence.
a) Spreading: Spreading of crude oil on the water surface begins as soon as oil
spills into the sea and largely depends upon volume of oil and its physical
characteristics namely density, viscosity and pour point. The environmental
factors such as wind velocity, current and temperature also influence spreading.
The four main physical forces influencing spreading on a calm seawater surface
are gravitation force, surface tension, inertia and frictional or viscous drag force.
Aromatic and aliphatic hydrocarbons with < 9 C atoms have greater tendency to
spread while compounds with higher molecular weights do not tend to spread on
water.
Spreading accelerates evaporation leading to increase in viscosity and
pour point of the residue. Presence of NSO compounds in petroleum also
facilitates dissolution and once soluble compounds are lost, spreading
decreases considerably.
42
b) Drift: Drift is a large-scale phenomenon that determines the movement of an
oil spill and is primarily controlled by wind, waves and surface currents. Thus for
instance, when the wind velocity is the determinant force in drift movement, a
slick can move at a rate of 3% of the wind velocity in the same direction as that
of the wind. However, prediction of drift of a spill on the basis of wind pattern
alone is difficult because of the current and wave perturbations.
c) Evaporation: Evaporation is the major process that removes the low boiling
components of petroleum from the sea surface. The composition of oil and its
physical properties, wind velocity, air and sea temperatures, turbulence, intensity
of solar radiation and surface area of the spill, all affect evaporation rates of
hydrocarbons.
Evaporation rate for a specific hydrocarbon is a function of its vapour
pressure, which in turn is inversely related to the molecular weight. The
compounds with vapour pressure greater than that of n C18 do not persist in a
spill for longer period while those with lesser vapour pressure do not evaporate
appreciably. Under normal conditions losses of aromatic hydrocarbons by
evaporation are 100 times greater than losses by dissolution and that the
evaporation rate for aliphatics may be 10,000 times greater than their rate of
dissolution. Loss of volatile hydrocarbons, mostly by evaporation, increases the
density and kinematic viscosity of the residual oil resulting in break-up of the
slick into smaller patches. Agitation of these patches enhances incorporation of
water due to increased surface area resulting in water-in-oil emulsion called as
chocolate mousse.
d) Dissolution: Dissolution is another physical process in which, the low
molecular weight hydrocarbons as well as polar non-hydrocarbon compounds
are lost to the water column. Rate of dissolution for various constituents of oil
depends on several factors such as their properties (molecular structure) and
their relative abundance as well as the physico-chemical characteristics of the
environment (salinity, temperature, turbulence etc). The water solubility of
hydrocarbons drop drastically as one goes to higher carbon numbers.
43
Branched alkanes demonstrate greater solubility for a given carbon
number than their straight chain counterparts. Ring formation also enhances
solubility for a given carbon number or molar volume. The degree of saturation is
inversely proportional to solubility for both chain and ring structures. The
solubility is also inversely related to the molecular weight of the hydrocarbons
within each group. The addition of a second or third double bond increases the
solubility proportionately and the presence of a triple bond increases solubility to
a greater proportion than presence of two double bonds.
e) Dispersion and emulsification: Dispersion, mechanical action of breaking
waves and turbulence in the water flow cause the spilled oil to break-up into
small droplets which diffuse in the water column to form oil-in-water emulsions.
Oil begins dispersing immediately on contact with water and the process is most
significant during the first 10 h or so. Once emulsion is formed, the particles
continue to break further and by 100 h dispersion usually overtakes spreading.
Although, such oil-in-water emulsions are not very stable in natural aquatic
environment, they are considerably stabilized by the suspended particles, natural
or added emulsifiers or dispersants. Unsterilized particles tend to resurface and
again form into a slick. The fate of oil-in-water emulsion appears to be
dispersion in the water column or association with solid particulate matter or
detritus and eventual biodegradation or incorporation in bottom sediments.
Water-in-oil emulsion formed during weathering tends to be more
coherent semisolid lumps called “chocolate mousse”. Experimental and limited
field studies have shown that these persistent emulsions contain roughly 80%
water and bacteria or solid particulate matter do not seem to be required for their
formation. Also, the rate of formation of emulsions under comparable conditions
varies dramatically with the nature of crude oil.
f) Photooxidation: Several petroleum hydrocarbons present in spilled oil
degrade in presence of sunlight and oxygen into polar hydroxyl compounds such
as aldehydes, alcohols, ethers and ketones and finally to lower molecular weight
carboxylic acids. As these products are hydrophilic, they change the solubility
behaviour of the slick. Photoxidation is inversely proportional to the film
44
thickness and directly proportional to the wave length of incident light. It is a
slow process and may take days to weeks to obtain significant results. Such
reactions occur more rapidly in aromatic and branched chain aliphatic
hydrocarbons than straight chain aliphatic hydrocarbons.
g) Biodegradation: Biodegradive processes influencing the fate of petroleum in
aquatic environment include microbial degradation, ingestion by zooplankton and
uptake by aquatic invertebrates and vertebrates.
Microorganisms, capable of oxidizing petroleum hydrocarbons and related
compounds, are widely spread in nature. Over 200 species of bacteria, yeast,
and filamentous fungi are known to metabolise one or more hydrocarbon
compounds ranging in complexity from methane to compounds of over 40 C
atoms. Microorganisms utilize oil as a source of carbon and energy, ultimately
degrading oil to CO2 and water. The rate of microbial degradation varies with
chemical complexity of the crude, microbial populations and environmental
conditions. The degradation by naturally occurring population of microorganisms
in the aquatic environment is generally slow and their impact on the oil spill may
be noticeable after some duration. However, 40 to 80% of a crude oil spill can
be biodegraded by microororganisms. Alkanes and cycloalkanes degrade faster
than Polycyclic Aromatic Hydrocarbons (PAHs). Thus, the concentrations of
oxygenated compounds may increase by 3 times after about 4 weeks of
microbial reactions.
h) Sedimentation/agglomeration: Most oils when spilled undergo processes of
transport and weathering, which increase the density of oil on the sea surface.
Hence, heavier fractions of oil are more likely to sink or remain suspended in the
water column. Oil and sand when mixed together by wave action causes the oil
to sink by incorporation of particulate matter and even by incorporation of high-
density organisms, such as barnacles. Some heavy crudes are however, denser
than seawater and immediately sink to the bottom after a spill.
Oil sinking offshore or in coastal waters is subject to movement due to
oceanic and coastal currents, tides, up-welling, down-welling, density currents
45
and littoral processes. Asphaltenes, the highest molecular weight compounds,
persist with little alteration to form tarry residues that ultimately settle to the
seafloor or become stranded along coastlines or on adjacent beaches, after
storms.
A loss of low boiling constituents also would result in increase in density
of the spill which would eventually sink as soon as its density becomes more
than that of water has. This process is accelerated by incorporation of spill
particles with the suspended matter which generally originate from the bed
sediment.
The capacity of a certain oil to sink as a function of their weathering is
also a function of its composition which determines the specific gravity/density.
Thus denser oils have more tendencies to sink during the weathering processes.
Generally oil sinks after extensive modifications which are the cumulative effect
of all weathering processes. Mostly the dispersed portion of the spill would
initially incorporate with suspended particles and would settle while chocolate
mousse would require more residence time to sink due to increase in density.
Generally, petroleum products do not form chocolate mousse.
Coating of birds and fish that would get entangled with the slick would be
immediate threat to the biota in the spill area. Bioaccumulation of the
dispersed/dissolved portion is the major route that would affect the biota
negatively leading to high mortality in initial stages. Though most of the ingested
portion would be eliminated in the feces and would return to the water column,
part of it would associate with tissues and gut permanently.
The above discussion implies that (i) contamination of water column, (ii)
beach pollution and (iii) ingestion by biota and coating of animals leading to
mortality are the major areas of concern in a event of spill taking place in a
marine environment.
46
6.1.3 Metereological factors
Metereological factors namely wind, air temperature, rain etc have greater
impact on fate of the oil spill in marine environment. For example, wind directs
movement of oil slick and facilitates in removing the lighter fraction in the spilled
oil while high air temperature causes increase in evaporation rates of the
constituents in the oil. Rains however have a negative effect resulting in re-entry
of the vaporised portion of the oil onto the earth. Aerosoles are known to be
formed because of association of vaporised fractions with dust and moisture
aided by lower temperatures. Winds also help spreading and drifting of oil slicks.
6.1.4 Impact on flora and fauna
Toxicity of an oil mostly falls in two general categories. The first category
includes effects associated with coating or smothering of an organism with oil.
Such effects are associated primarily with the higher molecular weight, water-
insoluble hydrocarbons. In the event of a spill of crude oil and very high boiling
residues, the various tarry substances that coat the feathers of birds and cover
intertidal organisms such as clams, oysters, and barnacles belong to this variety.
Although some organisms such as tubeworms and barnacles are surprisingly
little affected by such coatings, the effect on organisms such as aquatic birds
can be devastating.
The second category of toxicity involves disruption of an organism’s
metabolism due to the ingestion of oil and the incorporation of hydrocarbons into
lipid or other tissues in sufficient concentrations to upset the normal functioning
of the organisms. This is due to the cumulative effect of the individual
constituents present in an oil. It is generally agreed that aromatic hydrocarbons
are the most toxic, followed by cycloalkanes, then olefins, and lastly alkanes.
There is also a definite tendency for toxicity to be positively correlated with the
molecular size of the hydrocarbons.
Most toxic effects caused by ingestion of oil in water, however are
believed to be due to low molecular weight (C12 – c24) alkanes and low molecular
weight aromatics.
47
6.1.5 Geographical and physical status of a water body
When oil spills at high seas and away from the shore, it can have higher
exposure to weathering processes namely spreading, drifting, evaporation,
dissolution, dispersion, emulsification etc before it hits the coast. Hence, if such
spills are small, they are likely to weather and sink before the landfall thereby
sparing the intertidal biota from toxic effects of the spill. On the contrary, oil
spilled nearshore and in a semi enclosed water body such as estuary, creek, bay
and lagoon can hit the coast within minutes to hours depending on the location
of the spill and environmental conditions. Once on the coast it would persist for a
longer duration until removed physically or by natural processes. In high energy
zone and rough sea conditions, the spill washed ashore would re-enter the water
and would be removed after several tidal cycles. In low energy zone, however
the oil would persist for long time. Similarly, at sandy/silty beach the spilled oil
would penetrate deeper in the sediment aided by tide and wave action. At a
rocky beach however, it may re-enter the sea if the wave action is high but in a
low energy zones it would form coating on rock surface and also would persist
for longer duration in water pools/ditches in between the rocks.
6.1.6 Quantity and rate of spillage
It is obvious that when oil is spilled at a high rate and in large quantity, it
could have disastrous effect on the marine ecology as it would be difficult to
contain the spill due to its large size. Such spills form large patches of few
square kilometre area or several fragmented patches in several square kilometre
area. While a spill in small quantity and at a low rate can be easily contained
and recovered.
Large spills of crude oil and high boiling products generally form large
patches which restrict air - water interaction. Smaller spills and that released at
a slow rate are broken into small patches which can be recovered more easily.
Slicks of such spills may be drifted as isolated patches in different directions
depending upon tide and currents at the time of their release.
48
6.2 Pesticides Pesticide is a general term applied to any substance intended for
preventing, destroying, repelling or mitigating any pest. It is also called as
insecticide.
Pesticides are classified as follows:
Pesticides
Natural Synthetic
Inorganic Organic
Metals and derivatives Organochlorines Organophosphate Pyrothroids (DDT, aldrin, HCB (Parathion, Phorate, (Allethrin, Cynothrin Chlordane) Imidon, Rogar) Parmethrin) Though Organochlorines were used extensively in India, their wide-scale
applications have been stopped after India became signatory to the Stockholm
Convention on Persistent Organic Pollutants. In recent years the use of
synthetic phyrothroids has increased due to their low persistence, low side
effects and high potency.
6.2.1 Organophosphorus pesticides
The pesticides loaded on the ship belong to a class of organophorus
pesticides. They are synthetic and normally the derivatives of phosphoric /
phosphonic / phosphorothioic / phosphonothioic acids. Their general structure is
O(S) II R1 P X R2 Substituation in the side chain ‘x’ changes their reactivity and toxicity.
They are solids or semi solids with varied colours depending on the side chain.
49
Generally, they are slightly soluble in water and have high oil-water co-
efficient, low vapour pressure and low volatility. On oxidation they produce
higher toxic forms while their hydrolysis yield water soluble compounds which
are non-toxic. They are freely soluble in most of the polar organic solvents.
They are marketed as emulsificable concentrates, mettable powder,
formulations, granules, fogging formulations, smokes etc. Most of these liquid
formulations are inflammable and miscible with water. They are used to control
insects vectoring which are found in food, commercial crops and infestations in
domestic and commercial buildings and in man and domestic animals. They are
highly toxic to man with LD50 of 5 mg/kg to 0.5 - 5 g/kg. Though true chronic
poisoning following exposure does not occur, they are rapidly transformed and
excreted. Their acute intoxication or chronic exposure may lead to long term or
delayed effects such as inhabitation of cholinesterase by phosphorylation. The
detoxication route is hydrolysis when they are exposed to sunlight, air and soil.
Organophosphorus pesticides are known to be sufficiently stable to reach
marine ecosystem after agricultural use. They are toxic to invertebrates and
vertebrate aquatic animals even at nanogram per litre concentrations. Shrimp
and fish are particularly sensitive to them.
a) Dichlorvos: Dichlorvos is colourless to yellow liquid with boiling point of
74oC. Its chemical name is 2, 2 - dichlorovinyl dimethyl phosphate (C4 H7 CI2 C4
P). It is denser than water with the density of 1.314 g/ml. This highly volatile
liquid is stable to heat but hydrolysed by water at the rate of 3% per day and the
rate is high in alkaline water. It is corrosive to iron and steel.
Dichlorvos is highly toxic and WHO termed it as highly hazardous. It is
known to inhibit enzyme cholinesterase, and disrupts nervous and muscular
systems. The pesticide is mainly useful to control household pests and
protecting stored products from pests. LD50 for Goldfish is reported to be 10 to
40 µg/l (48 h).
50
b) Acephate: It is a colourless to white crystal form having melting point of 90 to
91oC. Chemically it is 0, S dimethyl-acetyl phosphoramidothiote (C4H10NO3PS).
It is denser than water and its water solubility is 79 g/100 ml. Acephate is also
highly soluble in polar organic solvents.
It is available in following formulations: wettable powder, soluble powder,
soluble extruded powder, granules, water soluble bags and liquid. It is mainly
used to control pests on cereals, oil bearing plants, fruits, vegetables etc.
Acephate is mostly practically non-toxic to marine/ estuarine fish; it shows
enhanced toxicity to freshwater organisms. LD50 (96 h) for sheepshed minnow at
910 ppm shows practically non-toxic nature of the pesticide. It acts as
anticholinesterase agent but has low bioaccumulation.
It is known as a stable compound in acidic condition but does degrade
through hydrolysis in alkaline medium (at pH 9 half life 18 d). The pesticide is
not persistent in clay soil under anaerobic condition and rapidly degrades in
sediment. It is known to degrade to methamidophos, another toxic compound.
c) Quinalphos: Its chemical name is O,O-diethyl-O-(Quinoxaline-2-yl)
phosphorothioate (C12H15N2O3PS). The odourless and colourless crystalline
solid (density 1.306) has melting point of 31 to 32oC and it decomposes at
120oC. Quinalphos is lowly soluble in water but possesses high solubility in
most of the organic solvents. It is stored at 4oC, since it shows rapid degradation
and short residual life at atmospheric conditions. WHO termed it as moderately
toxic pesticide. Quinalphos activity is by inhibition of chlolinertarase.
6.2.2 Synthetic pyrothroids
The pyrothroid loaded on the ship was ‘deltamethrin’ in solid form. It
belongs to a class synthetic pyrothroid compounds which are analogues of
pyrothrins, natural products found in chrysanthemum flowers. They are used as
pesticides to control a wide range of insects.
51
These pesticides are sparingly soluble in water and lowly reactive. They
also have low volatility and they bind to solid. Generally, they are not persistent
in the environment due to their rapid degradation within days to months.
They are highly toxic to fish and some invertebrates. They are also known
to exhibit sublethal effects on fish and crustaceans such as oxidative stress,
increased respiration, osmoregulation disruptions etc.
Deltamethrin (decamethrin) is chemically [cyano- (3-phenoxy phenyl) -
H19 Br2 NO3). It is colourless and odourless crystalline powder with very low
solubility in water (0.002 mg/l) but it is highly soluble in organic solvents. Though
it is stable to light, heat and air; it is unstable to alkaline media. The pesticide
has density of 1.5 g/cm3 with melting point of 98oC and boiling point of 300oC at
which temperature it decomposes.
It is not cholinesterase inhibitor and termed as moderately hazardous as
per EPA and FAO. Though its mammalian exposure is classified as safe, it is
highly toxic to aquatic life particularly fish having LC50 (96 h) in the range of 0.4
to 2 µg/l. Its water quality criteria for freshwater is 0.0004 mg/l. It accumulates
in fish but imparts mortality to crustaceans. Though it is highly toxic to
zooplankton, it is not acutely toxic to molluscs.
6.2.3 Other a) Indacloprid: Indacloprid or imidacloprid is a chlorinated analogue of nicotine.
Chemically it is neonicotinoid represented by a structure N-[1-[(6-chloro-3-
pyridyl)methyl] 4,5-dihydroimidazol-2-yl] nitramide (C9H10ClN5O2). The colourless
crystals have melting point of 136.4 to 143.8oC. It has low water solubility of 0.51
g/l at 20oC. It is employed in controlling a variety of crops including rice, grains,
cereals, vegetables, sugarcane and tobacco. It is also applied for cockroach
control.
52
It is not persistent in water at 0.65 µg/l. It has high dissipation rate (DT50)
of 1 to 2 years and has low partition co-efficient in water. It does not react with
an acid or base at room temperature. At pH 9 its DT50 is 355 days. However, its
decomposition by photolysis in water is high (half life 1.4-10 d). The microbial
action is comparatively slow in water and sediment with half life of 30 to 50 d.
It’s decomposition by hydrolysis is not the major route for its transformation.
Imidacloprid’s toxicity to organisms is through blocking acetylcholine
receptors. WHO assigned it as moderately toxic. Though it has high leaching
properties and does not accumulate in biota, its toxicity varies from organisms to
organisms. For example LD50 (48 h) is 13 µg/l for saltmarsh mosquito. LD50
(96 h) is 58200 and 34.1 µg/l for sheepshed minnow and mysid shrimp
respectively.
b) Mancozeb: It is a zinc ion coordination product with manganese ethylene – 1,
2 dithiocarbonate polymer. Chemically it is [1, 2–Ethazne diybis (carbanodithio)
(z-)] manganese zinc salt [(C4H6N2S4Mn)x(Zn)y]. It is used as a fungicide for
onion, pears, landscape, table and rois in grapes, wine grapes. It is a grayish
yellow powder with melting point of 192 to 194oC.
It is inert to atmospheric oxidation. It’s water solubility is 6.20 µg/l while
its half life for hydrolysis route is 166 d. It is known to decompose by heat and
expand to moisture and air. Hence it is stored at 4oC. It is applied as 50%
wettable powder. Its toxicity is not through choline inhibition but acts as wide
spectrum or fungal diseases. It imparts toxicity by inhibiting enzyme activity by
complexing with metal containing enzyme including those with production of
ATP.
In fish it distrupts biochemistry leading to mortality while in phytoplankton
it retards growth, physiology, population etc and mortality. In molluscs and
zooplankton it shows intoxication. The freshwater toxicity to rainbow trout is at
0.46 ppm. The pesticide does not accumulate in clams not induce cell
dysfunction.
53
6.3 Hazardous chemicals 6.3.1 Sodium hydroxide
The inorganic chemical is commercially known as caustic soda and is a
solid. The highly corrosive material dissolves in water exothermally and shows
pH above 7.5 in a scale of 7.5 to 14, the alkali range. If dissolved in large
quantities in seawater, it would increase temperature and enhance alkaline
strength of seawater.
It strongly reacts with acids producing salts and water. It also acts as
strong alkaline reagent (OH-) during hydrolysis reactions.
54
7 LIMITATIONS OF STUDY 7.1 Authorisation The region of oil spillage namely the coastal waters, the bay waters, the
coastline including beaches, mangroves, ports etc falls under multiple
government agencies namely Mumbai Port Trust (MbPT); The Indian Coast
Guard (ICG), Maharashtra Pollution Control Board (MPCB), Department of
Environment and Forest (DoEF); Government of Maharashtra, Municipal
Corporation of Greater Mumbai (MCGM); Collectors Raigad, Navi Mumbai,
Mumbai etc. Hence, it was necessary to take permissions from different
agencies or a nodal agency for monitoring of the Bay waters, beaches,
mangroves etc. Moreover no agency which could serve as the nodal agency for
authorisation had approached NIO to undertake the monitoring soon after the
spillage occurred. Inspite of these shortcomings NIO had taken initiative on its
own to start monitoring of the oil spill on 10 August 2010.
7.2 Logistics During such an emergency state of accidental oil spill in the coastal
waters, after authorisation from a Government agency, NIO had to immediately
plan and execute the monitoring studies to assess the status of the affected
coastal segments by the oil spill. This required immediate field survey which
included collection of water, sediment and biological samples. Immediate
availability of suitable boats for the survey team to work onboard is a pre-
requisite. In monsoon, the fishing operations are banned, hence availability of
suitable boat became difficult. Also necessary clearances from Customs and
Coast Guard required to take up the survey in the oil spill affected coastal areas,
was difficult in monsoon period. NIO was already working on the assigned R &
D and sponsored project activities. Therefore, in this emergency situation the
ongoing programmes either had to be stopped temporarily or re-scheduled in
order to accommodate these studies. In the present case, NIO has initiated the
shore based survey on an urgent basis by rescheduling the available
infrastructure (9 and 10 August 2010). With due authorisation and clearance by
concerned agencies NIO could start the boat survey of the oil affected coastal
segments only after a period of 4 days of oil spill and commenced the sampling
from 11 August 2010.
55
7.3 Weather In general, coastal oceanographic studies are rarely considered during
the monsoon period due to heavy wind and wave conditions which make
sampling difficult on a fishing boat. Hence the monitoring work was conducted
as soon as workable conditions in comparatively calmer weather were available.
7.4 Sampling In general, considerable difficulties in a boat operation and sampling
prevailed especially during monsoon period. Therefore, some selected
parameters of water, sediment and biological qualities were considered for
sampling and assessment of environmental traits. In some cases, sampling had
to be abandoned due to rough weather.
7.5 Manpower The availability of trained manpower for the survey, sampling and analysis
became very imminent for this monitoring work. Considering the enormous
pressure on the ongoing sponsored project works, NIO had successfully re-
scheduled its available technical and scientific manpower to undertake the oil
spill studies as an emergency measure.
56
8 PRESENT STUDY AND OBSERVATIONS
The observations in respect of water quality, sediment quality and flora
fauna which have been possibly affected by the recent oil spill at the Mumbai
Harbour within 3 to 4 weeks of the occurrence of the spill are presented below as
findings of the present study.
The sampling locations (Figures 1.4.1 and 1.4.2) have been categorised
in different segments namely (1) mouth region of the Mumbai Bay( spill site), (2)
Central Bay, (3) Inner segment (Thane Creek), (4) coast southward of Mumbai,
and (5) west coast of Mumbai on the basis of their topography as follows:
Area Subtidal station Shore transect Bay mouth 1 to 4, 23 Uran 1, Uran 2, Colaba Central Bay 5 to 12 and 17 to 22 JNPT, Trombay Inner segment of Bay 13 to 16 Vashi Southward coast of Mumbai
- Mandva, Dighodi, Kihim, Alibaug
West coast of Mumbai - Girgaon, Dadar, Mahim, Juhu
The first 3 segments are integral parts of Mumbai Bay while others are not
located in the Bay but along the adjoining coast, hence not included in the
subtidal environment of Mumbai Bay.
The field studies with respect to water quality, sediment quality, and flora
and fauna at the subtidal and intertidal environments were carried out under 4
sampling Series during the present study (Phase I) as given below.
Series Period I 10 - 14 August 2010 II 18 - 21 August 2010 III 25 - 28 August 2010 IV 6 - 8 September 2010
The observations recorded during the study period were discussed in two
categories namely intertidal and subtidal environments as follows:
57
8.1 Intertidal environment An oil slick while travelling on the water surface ultimately strikes the
shoreline beaches depending upon prevailing currents, tides, wind etc.
In general, the beach residue is not expected to cause gross variations in
temperature, salinity, DO, BOD, nutrients etc; while phenols may marginally
increase below the surface water. It is however likely that SS in the surface
water gets associated with the spill material thereby affecting its mobility.
Hence, apart from abnormally high concentrations of PHc it is expected that the
intertidal water quality would not suffer.
For a spill occurring in the coastal area, the ultimate landfall of oil is the
intertidal area where large quantity of oil can get accumulated. The deposition
may result in higher contamination during the initial stages in water and
sediment. In later stages however, these concentrations would decrease due to
loss of hydrocarbons, by weathering and tidal removal.
Consequent to the oil spill from MS Chitra which occurred at the mouth of
Mumbai Bay on 7 August 2010, NIO conducted shore-based field survey from 10
to 25 August 2010 along the coast between Alibaug and Juhu including the
Mumbai Bay. The intertidal environmental status of these transects in respect of
water quality, sediment quality and biota is described below.
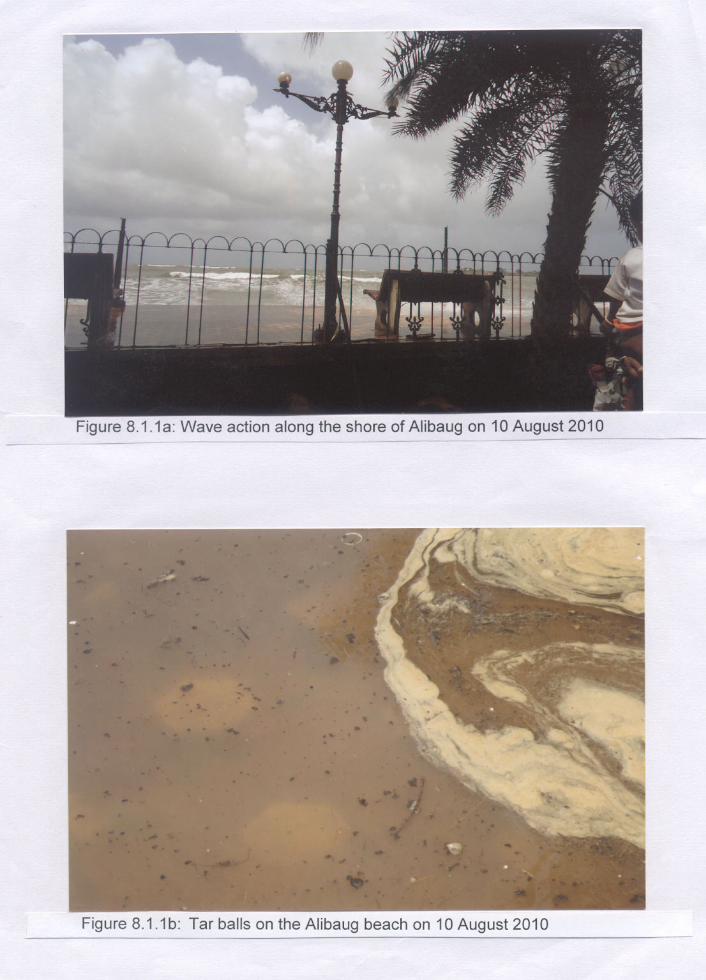
8.1.1 Alibaug a) Field observation (10 August 2010; 1100 h) Severe wave action along the shore of Alibaug (Figure 8.1.1a) with highly
turbid water and some tar balls at the intertidal area (Figure 8.1.1b) were
noticed. No oil was seen by the survey team as well as local people.
b) Water quality
The transect was characterised by PHc content of 116.5 and 31.4 µg/l on
10 and 20 August 2010 (sampling Series I and II respectively). The average
temperature remained around 30oC, average pH and SS varied from 8 to 7.7
58
and from 50 to 195 mg/l respectively. The highly oxygenated waters had high
DO (5.7-7.0 mg/l), and low BOD. The salinity varied from 14.5 to 20 ppt while
PO43--P, NO2
--N and NH4+-N remained low. NO3
--N varied in the range 6.9 to 11
µmol/l.
c) Sediment quality
PHc concentration in intertidal sediment was 26.1 µg/g, wet wt.
d) Flora and fauna
Phytoplankton: The variations of chlorophyll a (13.0 - 14.2 mg/m3) and
phaeophytin (1.1 - 1.2 mg//m3) were in a narrow range (Table 8.1.1). The ratios
of chlorophyll a/phaeophytin were high (10.8-12.9) suggesting a congenial
environment for the growth of phytoplankton. A bloom of Asterionella japonica
was noticed constituting 95% of the total phytoplankton population.
Zooplankton: In all seven groups of zooplankton were recorded with the
dominance of foraminiferans at this transect during Series I. The other
prominent groups were decapod larvae and chaetognaths.
Macrobenthos: Macrobenthic samples were collected during the Series II. The
biomass averaged at 6.5 g/m2, with average faunal abundance of 517 no/m2.
The macrobenthic group diversity averaged at 2 no with gastropods dominating
the macrobenthic population.
8.1.2 Kihim
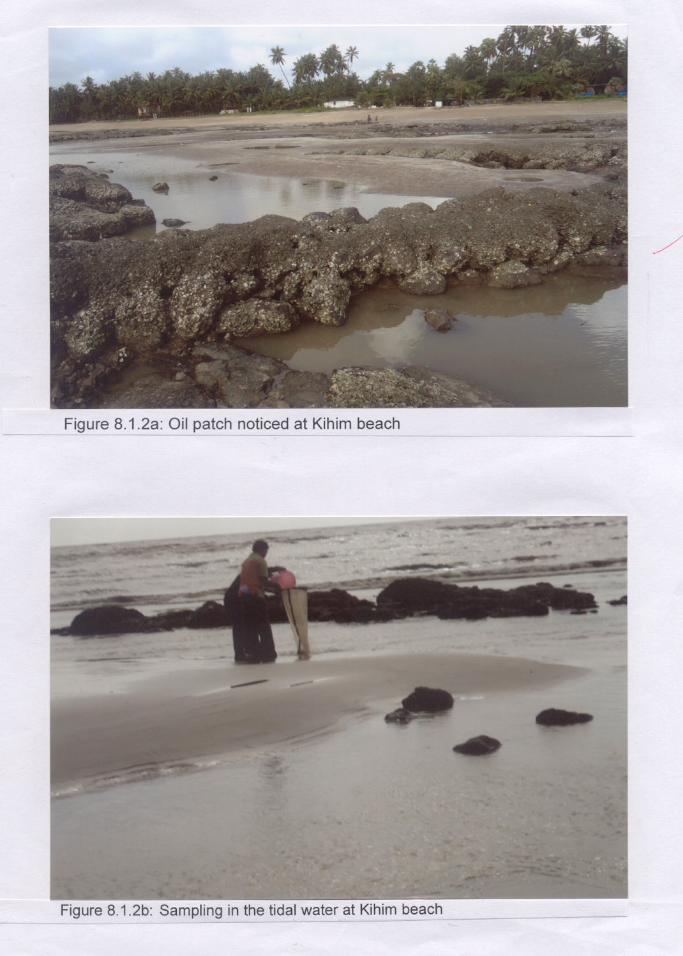
a) Field observation (10 August 2010; 1630 h) Several scattered oil patches were seen on the Kihim beach (Figure
8.1.2a) during sampling (Figures 8.1.1a and 8.1.1b).
b) Water quality
During the sampling Series I of 10 August 2010, the transect had high
PHc of 7490.6 µg/l in water. The other water quality parameters were
59
comparable with that of Alibaug except NH4+-N (8.1 µmol/l) and NO3
--N (40 -
40.8 µmol/l) which were high.
c) Flora and fauna
Phytoplankton: Chlorophyll a (6.5 - 9.0 mg/m3) and phaeophytin (2.4 - 3.8
mg/m3) varied in narrow ranges (Table 8.1.1). The ratios of chlorophyll
a/phaeophytin varied from 2.4 to 2.7. The phytoplankton cell count was 996
nox103/l and represented by 17 genera.
Zooplankton: A total of 6 groups of zooplankton was recorded at this transect
during Series I with foraminiferans dominating the populations.
Macrobenthos: During Series I the biomass averaged at 0.9 g/m2 with average
faunal abundance of 156 no/m2. Only 3 macrobenthic groups were identified with
the amphipods dominating the macrobenthic population.
8.1.3 Dighodi (10 August 2010; 1430 h) a) Field observation
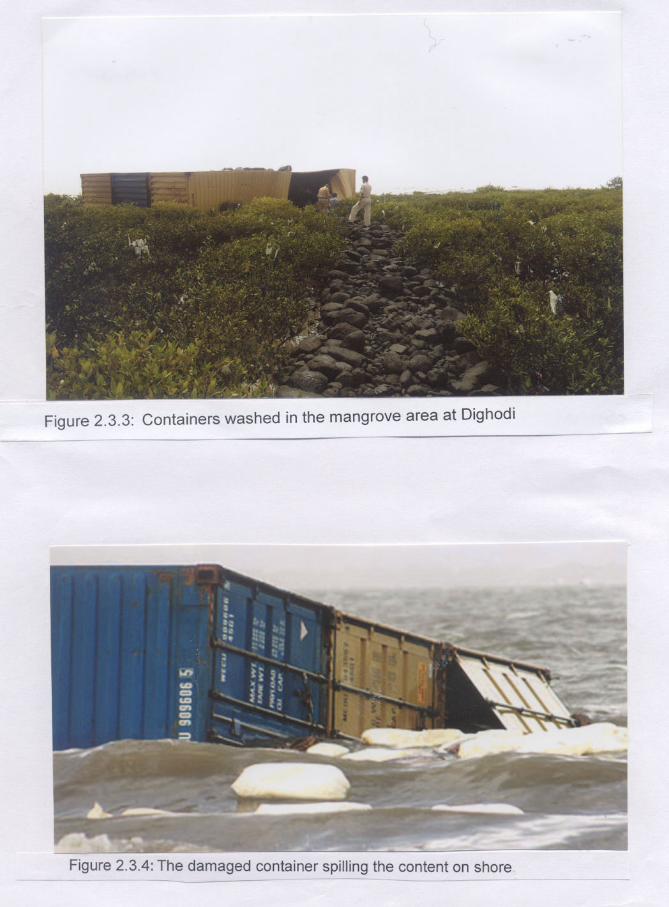
The broken container washed ashore and lying in a mangrove area was
noticed (Figure 8.1.3a) along with tea packets from the broken container spread
all over the area. The beach was visually free from oil patches though some
deposits of tar balls were visible along the high water line. The mangroves in the
area were also free from oil coating (Figure 8.1.3b).
b) Water quality
Dighodi waters contained PHc of 83.9 µg/l. As in the case of Kihim, the
water had relatively high concentration of NO3--N (33.7 - 35.4 µmol/l).
c) Sediment quality
The concentration of PHc in sediment was negligible (ND).
60
d) Flora and fauna
Phytoplankton: The concentrations of chlorophyll a and phaeophytin varied in
a narrow range. (Table 8.1.1). The average cell count (235.2 nox103/l) was
lower than Kihim but the generic diversity (15 genera) was comparable.
Zooplankton: In all, five groups of zooplankton were recorded with
foraminiferans as the most dominant group followed by copepods.
Macrobenthos: The biomass of macrobenthos ranged from 0.02 to 8.2 g/m2
(av 2.7 g/m2), with the faunal abundance averaging at 156 no/m2. Four faunal
groups with the dominance of polychaetes represented macrobenthic fauna.
Mangroves: The transect sustained dense mangroves (Figure 8.1.3b). A few
containers washed ashore were seen lying in the mangrove area. These
mangroves were however free from coating by oil.
8.1.4 Mandva a) Field observation (10 August 2010; 1300 h) This area was free from oil patches which also corroborated the
observations of the local inhabitants.
b) Water quality
During sampling Series I, PHc was high (497.5 µg/l) but decreased to
36.1 µg/l in the Series II. The water quality of this area was comparable with that
of Alibaug.
c) Sediment quality
The sediment PHc content was 15.7 µg/g, wet wt. and indicated absence
of significant contamination by oil.
61
d) Flora and fauna Phytoplankton: The phytopigments and cell count were of the order expected
for the region (Table 8.1.1). The generic diversity was comparable with that at
Dighodi.
Zooplankton: A total of four groups of zooplankton was recorded at this site
during Series I with foraminiferans and copepods dominating the populations.
Macrobenthos: Macrobenthic biomass averaged at 0.5 and 0.3 g/m2 during
Series I and II and the respective faunal abundance averaged at 93 and 84
no/m2. Isopod was the dominant group during Series I while brachyuran was the
major group in the subsequent Series.
8.1.5 Dharamtar a) Field observation (10 August 2010; 1730 h) The sites around Dharamtar Jetty (Figure 8.1.5a) which is located on the
Amba Estuary (Figure 8.1.5b) was found free from oil during the survey.
b) Water quality
The transect located along the eastern coast in the mid-segment of Amba
Estuary sustained low PHc (30 µg/l) and high pH of 8.8. Though DO was high
and BOD, PO43--P and NO2
--N were low; NO3-N and NH4
+-N levels were high
upto 33.7 and 13.4 µmol/l respectively.
c) Sediment quality
The content of PHc in sediment was 9.1 µg/g, wet wt.
d) Flora and fauna Phytoplankton: The concentrations of chlorophyll a (2.3 - 2.6 mg/m3) and
phaeophytin (2.4 - 3.4 mg/m3) varied in a narrow and comparable range (Table
8.1.1). The poor ratios (0.8 - 1.0) of chlorophyll a/phaeophytin were evident from
the results (Table 8.1.1). The cell counts (av 88 nox103/l) and generic diversity (8
genera) were also low.
62
Zooplankton: In all nine groups of zooplankton were recorded at this transect
during Series I with foraminiferans as the most dominant group. Copepods,
decapod larvae and gastropods were also in good numbers.
Macrobenthos: During Series I, the biomass was low (av 0.05 g/m2 ) and faunal
abundance averaged at 144 no/m2 with only polychaetes representing
macrobenthos.
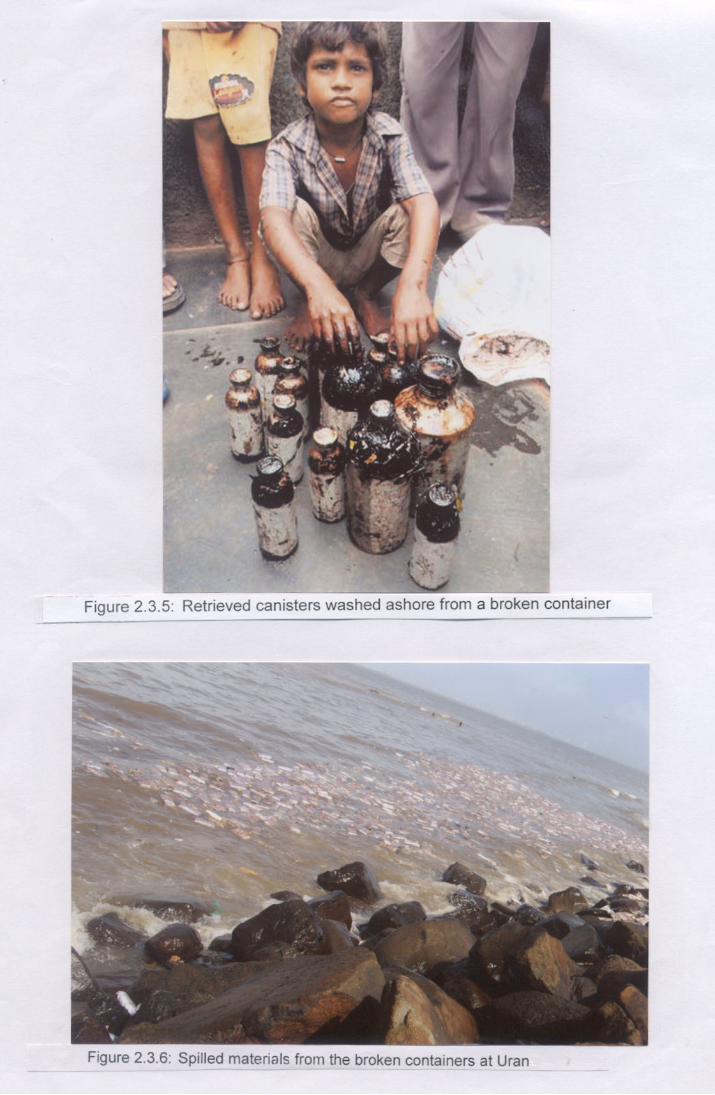
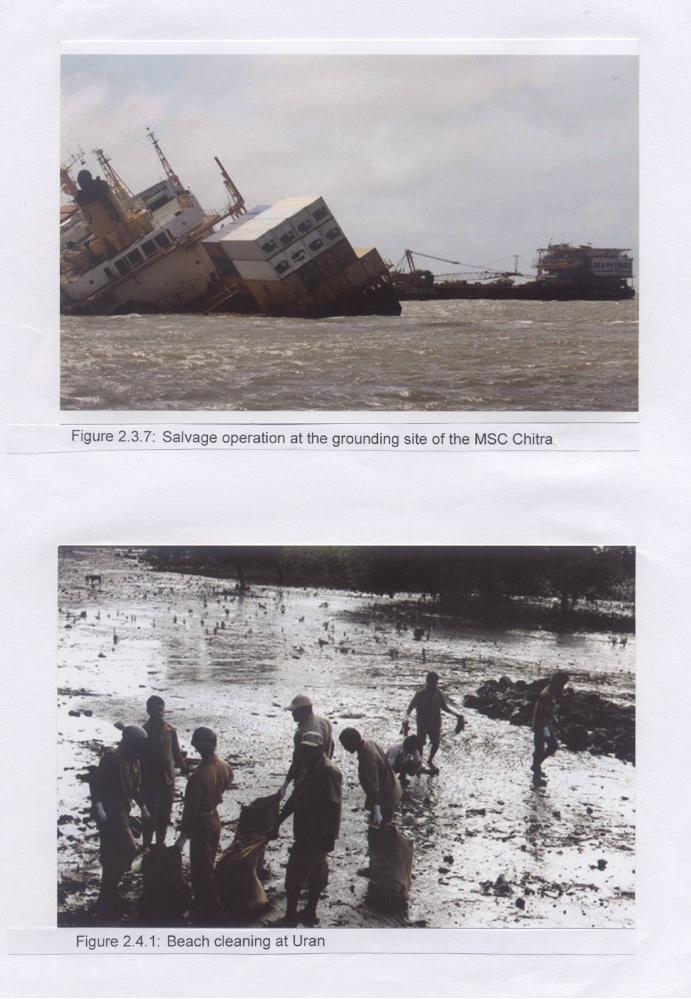
8.1.6 Uran 1 a) Field observation (10 August 2010; 1030 h) Five containers were seen crashed ashore on the Uran beach (Figure
2.3.2) with its contents like tea bags, biscuits, sugar bags etc scattered around
(Figure 2.3.6). The nearshore water had patches of oil film (Figure 8.1.6a). Local
people informed that 8 containers had washed on the shore on the night during 9
August 2010.
b) Water quality
On 10 August 2010, PHc levels were abnormally high of 4996.3 µg/l
which substantially decreased to 53.2 µg/l on 23 August 2010. The other water
quality parameters did not reveal any gross changes (Figure 8.1.6b).
c) Flora and fauna
Phytoplankton: The concentrations of chlorophyll a (0.4 mg/m3) and
phaeophytin (0.4 mg/m3) were low and associated cell counts of phytoplankton
(22.4 nox103/l) were the lowest recorded for intertidal segment of the present
study (Table 8.1.1). However, the generic diversity (11 genera) did not reveal
any noticeable reduction. Overall the poor ratio of chlorophyll/phaeophytin (1.0)
suggested that the environment was not conducive for phytoplankton growth at
this segment.
Zooplankton: Only three groups of zooplankton were recorded at this site
during Series I. The groups like copepods and foraminiferans were prominent
but less in numbers.
63
8.1.7 Uran 2 a) Field observation (10 August 2010; 1130 h) Oil patches were noticed close to the shore (Figure 8.1.7a) and nearshore
waters indicating contamination by oil. The rocky areas were also seen coated
with oil (Figure 8.1.7b). One broken container was seen floating near the shore.
b) Water quality
PHc levels were abnormally high (12075.6 µg/l) on 10 August 2010
(Series I) but decreased substantially to 124.7 µg/l on 23 August 2010 (Series
II). The other water quality parameters were in the expected ranges.
c) Flora and fauna Phytoplankton: The region also revealed low concentrations of chlorophyll a
(0.5 mg/m3) and phaeophytin (0.6 mg/m3) with poor ratio (0.8) of chlorophyll a /
phaeophytin (Table 8.1.1). However, due to high suspended load and oily
residues the cell counts could not be carried out.
8.1.8 JNPT a) Field observation (10 August 2010; 1245 h) One broken container was found floating near the shore. Mangroves
were seen coated with oil to a height of about 0.5 to 1 m.
b) Water quality
On 10 August 2010, PHc content indicated mild contamination by oil. The
other water quality parameters did not reveal any unusual deterioration.
c) Flora and fauna Phytoplankton: During Series I phaeophytin (2.8 - 3.1 mg/m3) was in excess of
chlorophyll a (1.9 - 2.2 mg/m3) with unusually poor ratio (0.7) of chlorophyll a /
phaeophytin indicating an unhealthy condition of phytoplankton cells (Table
8.1.1). A noticeable reduction in cell counts (59.2 nox103/l) and generic diversity
(9 genera) was evident. These results suggested higher mortality rate of
phytoplankton over the production during the Series I.
64
Zooplankton: In all 8 groups of zooplankton were recorded at this site during
Series I. Copepods were the most dominant group whereas groups like
chaetognaths, Lucifer sp and decapod larvae were also common.
Mangroves: Mangroves (Avicennia marina) were seen heavily coated with oil
for upto a height of 0.5 to 1 m.
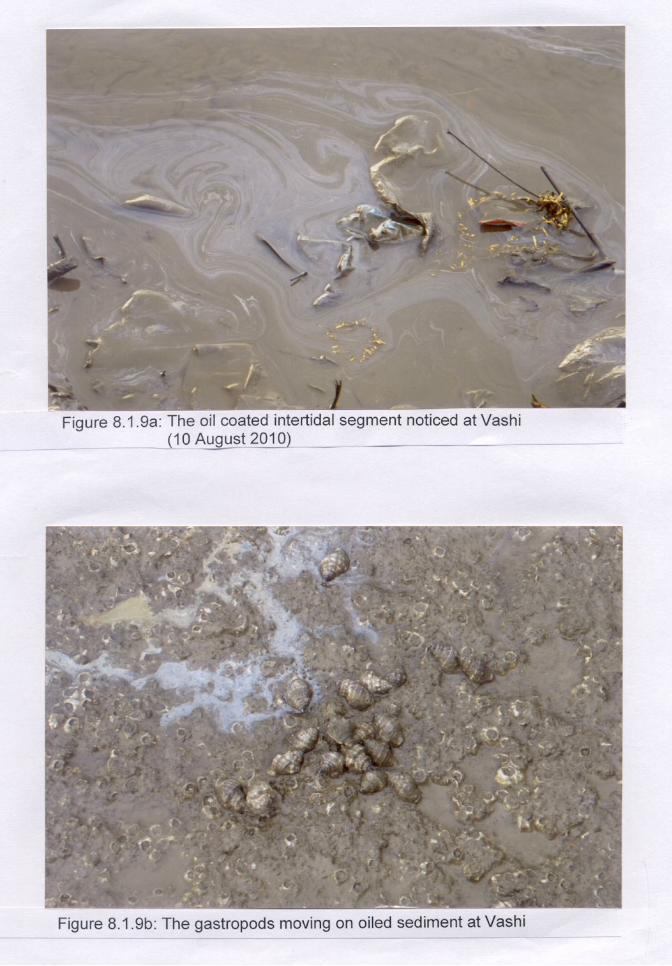
8.1.9 Vashi a) Field observation (10 August 2010; 1725 h) The oil coated intertidal segment as well as mangroves were noticed at
this site (Figure 8.1.9a). Also gastropods moving on the oiled sediments were
noticed (Figure 8.1.9b).
b) Water quality
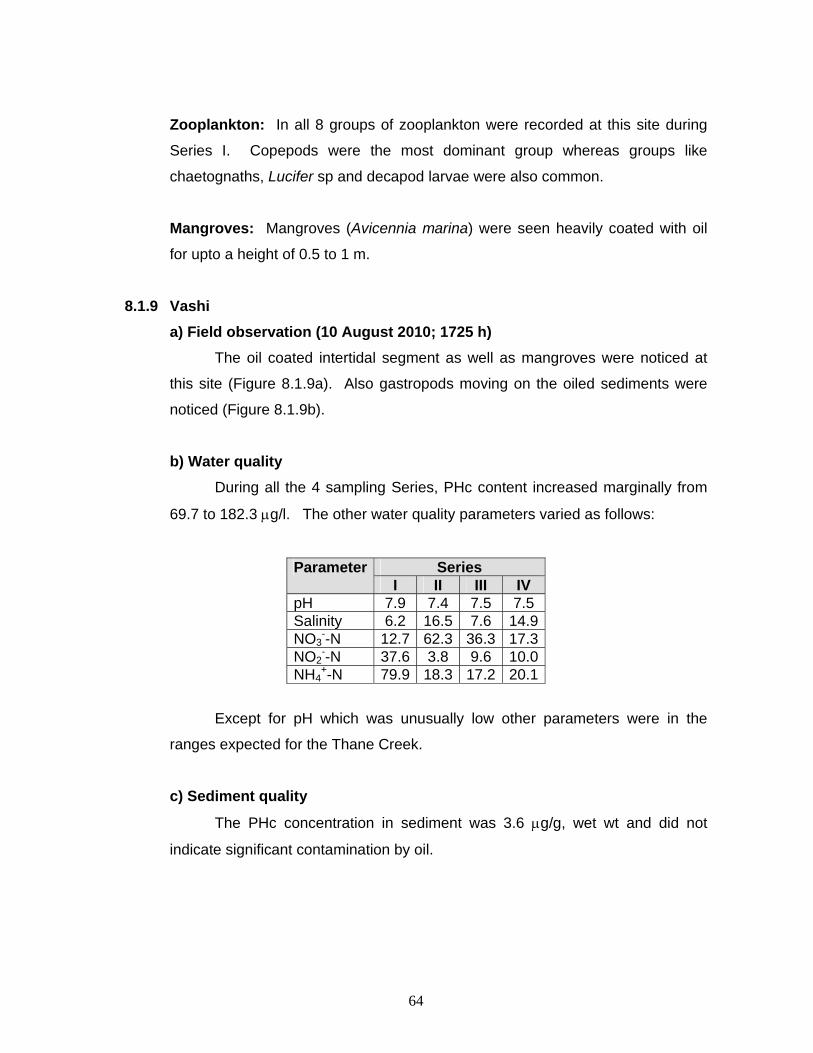
During all the 4 sampling Series, PHc content increased marginally from
69.7 to 182.3 µg/l. The other water quality parameters varied as follows:
Parameter Series I II III IV
pH 7.9 7.4 7.5 7.5 Salinity 6.2 16.5 7.6 14.9NO3
--N 12.7 62.3 36.3 17.3NO2
--N 37.6 3.8 9.6 10.0NH4
+-N 79.9 18.3 17.2 20.1
Except for pH which was unusually low other parameters were in the
ranges expected for the Thane Creek.
c) Sediment quality
The PHc concentration in sediment was 3.6 µg/g, wet wt and did not
indicate significant contamination by oil.
65
d) Flora and fauna Phytoplankton: The concentrations of chlorophyll a (4.8 - 5.3 mg/m3) and
phaeophytin (5.0 - 5.1 mg/m3) were comparable (Table 8.1.1) with ratios (0.9 -
1.0) of chlorophyll a / phaeophytin indicating delicate balance between life and
mortality of phytoplankton. The cell count (490.4 nox103/l) was high with
phytoplankton belonging to 11 genera.
Zooplankton: A total of eleven groups of zooplankton were recorded with
copepods as the most dominant group. The decapod larvae foraminiferans and
fish larvae were in good numbers during Series IV.
Macrobenthos: The biomass, faunal abundance and groups of macrobenthos
averaged at 0.3 g/m2, 57 no/m2, and 2 no respectively. Polychaete was the
dominant group.
Mangroves: Mangroves dominated by Avicennia marina were seen coated with
oil upto a height of about 0.75 m along the intertidal segment (Figure 2.2.4). The
sediment at this site also had a coating of oil.
8.1.10 Trombay a) Field observation (10 August 2010; 1215 h) Mangroves were found coated with oil upto a height of about 0.75 m
(Figure 8.1.10a). Mangrove seedlings and pneumatophores were also coated
with oil (Figure 8.1.10b). However, some fauna such as mud skippers and crabs
were active in the mangrove area on the sediment contaminated with oil (Figure
8.1.10c). A few mangrove plants were selected and tagged for monitoring, on 12
August 2010 (Figure 8.1.10d).
b) Water quality
There was an abnormal increase in PHc content from 54.7 µg/l on 10
August to 2909.8 µg/l on 16 August 2010. However, the other water quality
parameters did not reveal any deviations.
66
c) Sediment quality
Surprisingly though the water sustained high concentration of PHc, the
sediment of Series I collection sustained low concentration of PHc (41.1 µg/g,
wet wt) and the concentration further reduced (2.8 µg/g, wet wt) in the
subsequent collection of Series II.
d) Flora and fauna Phytoplankton: The concentrations of chlorophyll a (2.3 - 2.9 mg/m3) and
phaeophytin (2.7 - 2.8 mg/m3) were comparable (Table 8.1.1). The low ratios of
chlorophyll a/phaeophytin (0.8-1.1) and low phytoplankton cell count (87.2
nox103/l) and generic diversity (11 genera) like that of JNPT was observed at
this transect. The above results indicated that the site was not congenial for
phytoplankton growth during the initial period. However, much improved
conditions in reference to chlorophyll a (9.8 - 10.8 mg/m3) and the ratio of
chlorophyll a/phaeophytin (2.5 - 3.1) during IV Series were noticed. (Table 8.1.1).
Zooplankton: In all nine faunal groups of zooplankton with dominance of
copepods were noticed at this site during Series I. During Series II, the
population counts and group diversity (2 no) were noticeably reduced.
Foraminiferans were the dominant group during this period.
Macrobenthos: The average biomass of macrobenthos decreased from 0.9
g/m2 during Series I to 0.1 g/m2 during Series III. The respective decrease in
faunal average abundance was from 250 to 138 no/m2. The faunal diversity was
poor (0-2 groups) with the dominance of polychaetes.
Mangroves: The mangroves (Avicennia marina) had oil coating upto a height of
0.8 m from the bed level (Figure 8.1.10a). The mangrove seedlings (Figure
8.1.10e) and pneumatophores (Figue 8.1.10b) were also coated with oil on 10
August 2010. Salvadora persica were also recorded along the upper intertidal
area. Crabs and mud skippers however were active on the oil-contaminated
sediments (Figure 8.1.10d). The growth of oil affected mangroves was estimated
67
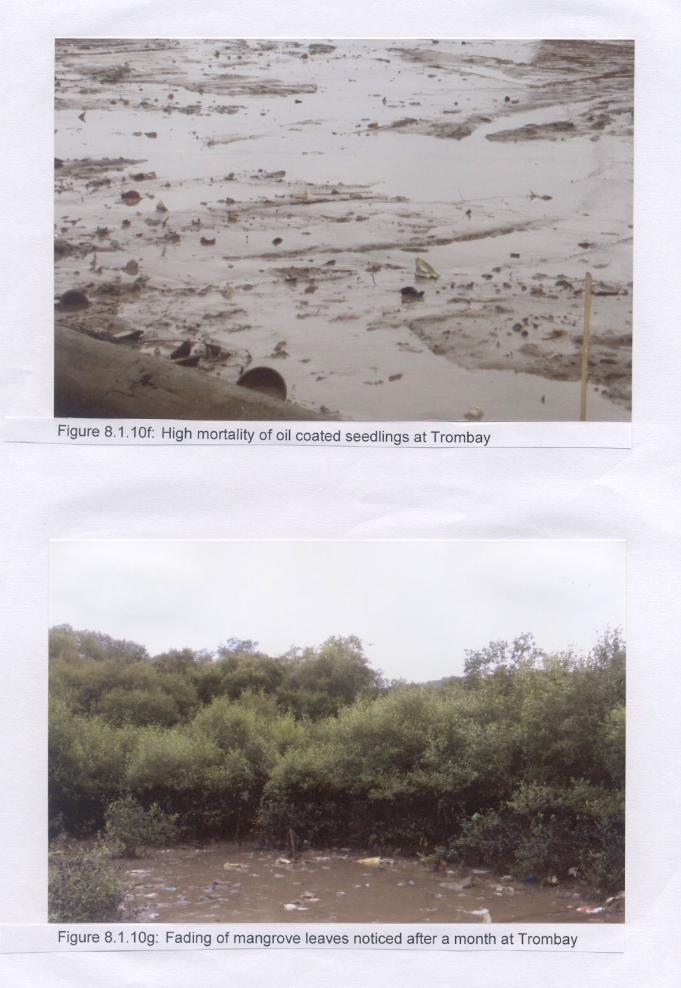
upto 0.15 m in 8 to 10 days (Figure 8.1.10c). The seedling density of 12 to 30/m2
recorded during Series I (Figure 8.1.10e) had fallen to near-zero during Series II
resulting significant obliteration of seedlings under the adverse impact of oil
(Figure 8.1.10f). The leaves of the oil affected mangroves had dried and their
growth was stunted as recorded on 14 October 2010 (Figure 8.1.10g).
8.1.11 Colaba a) Field observation (10 August 2010; 1545 h) The oil coated rocks and tidal pools were commonly noticed at this site
(Figures 8.1.11a and 8.1.11b) with some areas having live corals (Figure
8.1.11c). Oysters, barnacles and variety of gastropods inhabited the intertidal
segment.
b) Water quality
Very high PHc value (1825 µg/l) recorded on 10 August 2010 suggesting
contamination due to oil spill, decreased to 50 µg/l on 25 August 2010. Other
water quality parameters were in the accepted ranges.
c) Sediment quality
The sediment was sandy with unusually low concentration of PHc (0.06
µg/g; wet wt) during Series I collection and increased several folds (35.6 µg/g,
wet wt) in the sample of the Series II.
d) Flora and fauna Phytoplankton: The lower concentration of chlorophyll a (3.4 mg/m3) as
compared to phaeophytin (3.7 mg/m3) resulted a poor ratio of 0.9 and indicated
an unhealthy conditions of phytoplankton cells which could be due to oil spill
(Table 8.1.1). The cell counts (206 nox103/l) and generic diversity (11 no
genera) were comparable with those of Mandva and Dighodi sites.
Macrobenthos: This transect was studied during 3 Series. The standing stock
of macrobenthos fluctuated without clear trend. Polychaete and gastropod were
the dominant faunal groups present during Series I but were replaced by
amphipods during Series II and III. During Series I the intertidal area was
68
observed to be coated with oil (Figure 8.1.11a). A film of oil coating was noticed
at the intertidal water pools adjacent to areas where sand and gravel were
present during subsequent Series (Figure 8.1.11b). The live corals at rocky
intertidal segments in Colaba appeared to be unaffected by the oil spill (Figure
8.1.11c). Also the barnacles, oysters with their spat, gastropods and crabs were
seen alive (Figure 8.1.11d) and the spawning of gastropod (Figure 8.1.11e)
appeared to be unaffected by oil contamination.
8.1.12 Girgaon a) Field observation (10 August 2010; 1630 h)
The sampling site and the zone around was free from oil contamination.
b) Water quality
During sampling Series I PHc was 109.3 µg/l which could be considered
marginally elevated. The other water quality parameters were in expected
ranges.
c) Sediment quality
The PHc level in sediment was low (0.04 µg/g, wet wt) and indicated that
the sediment was free from oil contamination.
d) Flora and fauna Phytoplankton:
The concentration of chlorophyll a (5.5 mg/m3) was higher than that of
phaeophytin (3.3 mg/m3) with chlorophyll a/phaeophytin ratio of 1.7 indicating
conducive conditions for phytoplankton. The phytoplankton cell count (428
nox103/l) and generic diversity (15 genera) were as expected for the coastal area
of Mumbai (Table 8.1.1).
Macrobenthos: Girgaon was sampled during Series I. The biomass (av 5.5. g/m2), faunal
abundance (av 74 no/m2) and group diversity (av 2 no) of macrobenthos did not
indicate any abnormality.
69
8.1.13 Dadar a) Field observation (10 August 2010; 1800 h) The sampling area was free from visual patches of oil.
b) Water quality
The PHc was low (37.9 µg/l) and other water quality parameters were in
expected ranges.
c) Sediment quality
The PHc content in sediment was low (0.03 µg/g, wet wt) indicating
absence of contamination by oil.
d) Flora and fauna Zooplankton:
Six groups of zooplankton were identified in the sample obtained during
Series I with foraminiferans as the dominant group.
Macrobenthos: The biomass (av 2.8 g/m2), faunal abundance (av 463 no/m2) and group
diversity (av 2 no) of macrobenthos were as expected with polychaetes and
amphipods as the dominant groups.
8.1.14 Mahim a) Field observations (10 August 2010; 1845 h) The site did not indicate presence of any oil.
b) Water quality
The PHc concentration was low (26.5 µg/l) at this site on 10 August 2010
with other parameters in the ranges expected for Mahim Bay.
c) Sediment quality As expected, the PHc burden in sediment was low (0.04 µg/g, wet wt).
70
d) Flora and fauna
Phytoplankton: The higher concentrations of chlorophyll a (5.7 mg/m3) than that of
phaeophytin (1.9 mg/m3) indicated conditions supportive for the proliferation of
phytoplankton (Table 8.1.1).
Zooplankton: Among seven groups of zooplankton recorded at this location
foraminiferans and copepods were the most dominant with good numbers of
polychaetes and mysids.
Macrobenthos: The site was characterized by low biomass (av 0.02 g/m2), with
polychaetes and sergestids in the population.
8.1.15 Juhu a) Field observations: (25 August 2010; 1330h) This site sampled during Series III was visually free from oil patches.
b) Water quality
PHc content in water (37.5 µg/l) did not indicate significant contamination
by oil. The other water quality parameters were in expected ranges.
c) Sediment quality
The PHc content was 43.5 µg/g, wet wt.
d) Flora and fauna Zooplankton: A total of six groups of zooplankton was recorded with
foraminiferans as the most dominant group.
8.1.16 Impact assessment of oil spill a) Field observation
Out of the 16 shore locations visited on 10 August 2010; Uran 1, Uran 2,
Trombay and Colaba had deposits of oil in varying intensities. Mangroves at
71
Trombay were coated with oil up to about 0.5 to 1 m height under the high tidal
influence in the Thane Creek. Pneumatophores popularly termed as the
breathing roots of mangroves, as well as the mangrove seedlings were also
coated with oil in this zone. Few containers washed ashore in damaged
condition, broken members of containers and materials like tea bags, biscuits,
sugar bags etc had deposited on the intertidal zone at Uran. The coastal
segments of Kihim and Mandva were affected with low level oil contamination.
The nearby areas like Alibaug, Dighodi and Dharamtar on the contrary were free
from visible oil contamination though a, few containers and their contents like tea
and sugar bags had washed ashore at Dighodi. Vashi water in the Thane Creek
was also affected but to a minor extent. However, mangroves were affected by
oil at Vashi. Although the shoreline along Colaba was coated with oil, the
intertidal organisms including corals were active and alive. The shoreline along
the west coast of Mumbai including Girgaon, Dadar, Mahim and Juhu were
visually free from oil. b) Water quality PHc: Chronic petroleum inputs to the coastal area of Mumbai are a common
feature which is added through anthropogenic sources such as effluents from
refineries and petrochemical industries, sewage, ship traffic and many other
pathways. The oil thus added undergoes several weathering processes (Section
6) which result in its removal from the environment. Thus, the concentration of
PHc in water and sediment of coastal marine area of Mumbai would be a net
result of the quantity entering the system through a variety of routes and that is
removed by weathering. This balance would therefore be the background
concentration which should be known to analyze the post-spill levels in proper
perspective. Unlike petroleum associated with chronic sources, accidental oil
spillages add large volume of oil in a confined area and concentrations of PHc in
water and sediment can shoot-up to abnormal levels.
Available data for 2007-10 on the levels of PHc in coastal marine water of
Mumbai is compiled in the Table 8.1.2 indicate that the concentrations of PHc
expected in the coastal water of Mumbai were 2.3 to 72.4 µg/l. However, the
72
data presented above is for the subtidal area. It may be mentioned here that
information is lacking on the concentration of PHc in water associated with the
intertidal areas of Mumbai. Considering that the intertidal areas receive land
runoff during monsoon and many point releases are in the vicinity or on the
intertidal zone, the levels of PHc in the intertidal waters could be higher.
PHc concentrations in water collected from the intertidal zones of Mumbai
and regions around varied as follows:
Zone Transect Concentration (µg/g, wet wt)
Series I Series II Range Series I Series II
Bay mouth Uran 1 4996.3 53.2 1825.4-12075.6
50.0-124.7
Uran 2 12075.6 124.7 Colaba 1825.4 50.0
Central Bay JNPT 95.1 54.7 - 95.1 2090.8 Trombay 54.7 2090.8
Inner Bay Vashi 69.7 114.4 69.7 114.4
Coast southward of Mumbai
Mandva 497.5 36.1 83.9 - 7490.6
31.4-36.1
Dighodi 83.9 - Kihim 7490.6 - Alibaug 116.5 31.4
West Coast of Mumbai
Girgaon 109.3 - 26.5 - 109.3
37.4
Dadar 37.9 - Mahim 26.5 - Juhu 37.4
Amba estuary Dharamtar 30.0 - 30.0 -
As expected abnormally high concentrations (1825.4 - 12075.6 µg/l) of
PHc were recorded in the intertidal zone around the Bay mouth and at the south-
eastern coastal segments of the Bay during Series I with Mandva at the south-
western periphery having significantly high level of PHc (497.5 µg/l). The worst
affected zones were Uran 1, Uran 2, Colaba and Kihim. Other intertidal zones
did not indicate high concentration of PHc.
The results indicate that in the Series II of monitoring the PHc content at
Uran 1, Uran 2 and Colaba had decreased substantially (50-124.7 µg/l) and
were comparable to the baseline. It appears that under rough monsoonal
conditions and high tidal flushing the oil content in water had widely dispersed
and/or flushed out of the Bay. Thus, the impact of accidental oil spill on affected
73
intertidal area was short lived – probably a week and the nearshore water were
relieved of its excess PHc.
In the Series II measurements only Trombay area sustained unusually
high concentration of PHc, while, all other sites had levels comparable to the
background. Petroleum being immiscible with water, it could be an instance of oil
getting trapped in a confined area that could have been washed off from
contaminated intertidal sediment.
It is evident from the concentrations of 26.5 to 109.3 µg/l in nearshore
waters that the west coast of Mumbai was probably free from contamination by
the accidental oil spill.
Other water quality parameters: Unlike open ocean region, even uncontaminated coastal waters are
subject to significant short-time natural variations due to varying tide and season
as well as temporally changing geochemical processes. For coastal and inshore
areas of Mumbai that receive a variety of wastes, such variations can be high for
some water quality parameters. Thus for instance, the DO in natural coastal
waters is generally above 3.5 ml/l, while, in the inshore creeks of Mumbai
receiving sewage, the DO depletes to low value – even close to zero, at low tide
and increases to 1 to 2 mg/l at high tide. Similarly, in waters free from organic
pollution, NO2--N and NH4
+-N seldom exceed 1 µmol/l, however, in coastal
waters of Mumbai abnormally high concentrations of these constituents are not
uncommon. Evidently, these background variations should be considered while
interpreting the post-oil spill water quality of the Mumbai region. Based on the
available results of periodic monitoring of the Mumbai area, the range of water
quality parameters are compiled in Table 8.1.3.
It is also required to understand the changes expected in parameters
other than PHc subsequent to an oil spill. The literature information indicates that
the single most important parameter that can influence the organisms of the
affected area is DO which can be depleted due to oil layer that prevents air – sea
interaction and retards photosynthesis due to insufficient solar radiation
74
penetrating the oil layer. There can be delayed increase in nutrients resulting
from large-scale mortality of plankton and their decomposition releasing the
nutrients to the water column. However, such impacts generally occur in
confined areas or when the spilled oil covers a large sea surface.
Comparison of results in Table 8.1.3 wherein post-oil spill water quality is
presented with the background described in Section 3.1, clearly indicates that
the post-spill water quality is comparable with the background and no significant
changes in DO and nutrients are discernible. This is expected since the oil spill
was small, the oil layer in patches covered a small area and swift tidal
movements continuously renewed the water mass under the oil layer
transporting water from nearby areas not affected by the spill. High monsoon
induced turbulence also assisted in efficiently breaking the oil layer into patches.
c) Sediment quality
The PHc concentration in the intertidal sediment observed in different
sampling zones during the Series I of sampling is as follows:
Zone Transect Concentration (µg/g, wet wt)
Range of concentration(µg/g, wet wt)
Mouth of Bay Uran 1 -
0.06 Uran 2 - Colaba 0.06
Central Bay JNPT - 41.1 Trombay 41.1 Inner segment of Bay Vashi 3.6 3.6
Coast southward of Mumbai
Mandva 15.7
0.03 - 26.1 Dighodi 0.03 Kihim - Alibaug 26.1
West coast of Mumbai
Girgaon 0.04
0.03 - 0.04 Dadar 0.03 Mahim 0.04 Juhu -
Amba estuary Dharamtar 9.1 9.1
As evident from above data, during Series I, relatively high levels of PHc
were recorded only at few transects.
The published data indicate that the hydrocarbon content of sediments
range from 100 to 12000 µg/g, dry wt with most values less than 1000 µg/g, dry
75
wt in marine areas affected by sinking oil. The PHc content of sediments from
unpolluted coastal areas and marginal seas or basins is usually below 70 µg/g,
dry wt. The results of analysis of the present study are calculated based on wet
weight basis. On the basis of 50% moisture content in sediment the observed
values presented on wet weight basis would be double when considered on dry
weight basis. Hence the values (11.5 to 22.4 µg/g, wet wt) found for Central Bay
(stations 19 and 21) during Series II and III though higher than the background
are indicative of mild sediment contamination due to the accidental oil spill. The
results for 2007-2010 (Table 8.1.4) reveal that the concentration in subtidal
sediments were 0.2 to 10 µg/g, wet wt. Comparison of these results with the
observed values as given above also indicates no serious contamination of
sediments by oil spill.
At Colaba, however, high level of PHc was observed (35.6 µg/g, wet wt) during Series II of sampling. Such high concentration of PHc was absent at other
locations during Series II. Hence other locations did not indicate any serious
contamination of intertidal sediments.
d) Flora and fauna
Phytoplankton: The results of pigments revealed a significant reduction in the
concentration of chlorophyll a (0.4 - 0.5, av 0.5 mg/m3) and phaeophytin (0.4 -
0.6; av 0.5 mg/m3) in the tidal waters at Uran as compared to the rest of shore-
based locations (Table 8.1.1). In general, the locations like JNPT, Trombay,
Colaba and Dharamtar also indicated moderate reduction in chlorophyll a (1.9 -
3.5 mg/m3) as compared to the rest except Uran (Table 8.1.1). The locations
like Dighodi, Mandva, Alibaug, Kihim, Vashi, Girgaon and Mahim revealed
elevated levels of chlorophyll a (5.1 - 14.2 mg/m3) as compared to above
locations (Table 8.1.1). The highest chlorophyll a value of 14.2 mg/m3 was
recorded at Alibaug, whereas Kihim which is very close to Alibaug showed
relatively reduced chlorophyll a (6.5 - 9.0 mg/m3). In general, the phaeophytin
did not indicate any clear trend due to high fluctuations in their values. However,
the average concentration of phaeopigment for the entire area of present study
76
was higher than that of chlorophyll a (Figure 8.1.16a) suggesting possible
mortality of phytoplankton at various shore segments due to the oil spill.
This is further supported by the significant reduction in the ratios (<1) of
chlorophyll a/phaeophytin which indicated unhealthy conditions of the cells at
selected shore locations like Uran, Vashi, JNPT, Trombay and Colaba as
compared to the rest (Table 8.1.1, Figure 8.1.16b). Although, Kihim was
affected by the oil spill, being an open coast, probably the fast and effective
replenishment of water mass could have aided the recovery of phytoplankton.
The tidal waters at the shore generally supported higher pigment values
due to high nutrient availability. The shore segments of Uran, JNPT, Trombay,
Colaba and Kihim which were affected by oil indicated reduction in chlorophyll a
which could be due to the phytoplankton mortality caused by the oil spill. Again,
the end of monsoon period supports good primary production in the coastal
system of Mumbai due to high nutrient fluxes through land drainage and low
saline conditions which favour estuarine species. Accordingly, the Mumbai Bay
recorded higher concentration of chlorophyll a during September 2009 (Table
8.2.5). Hence, the low chlorophyll a recorded at selected shore locations could
be attributed to the phytoplankton mortality caused by the oil spill.
Zooplankton: The zooplankton results described in Section 8.1.4 clearly
indicated wide variability in the group diversity and group dominance of
zooplankton in the study area. Overall, Trombay and Vashi which were affected
by oil had very poor diversity of zooplankton during Series II and III respectively.
Similarly, Uran 1 revealed very poor diversity during Series I. The possibility of
zooplankton mortality due to the oil spill at these segments cannot be ruled out.
The rest of the coastal segments studied did not indicate any clear trend.
Macrobenthos: The oil coated intertidal segments were noticed at Vashi,
Trombay and Colaba (TIFR).
Colaba showed increasing trend in macrobenthic abundance and diversity
from Series I to Series III. This could be due to natural variability under
77
monsoon conditions. During Series I most of the intertidal area was observed to
be coated with oil. A film of floating oil was noticed at the intertidal water pools
adjacent to areas where sand and gravel were present during Series II.
At Trombay, a gradual reduction in standing stock and diversity was
noticed between Series I and Series III studies (Figures 8.1.16c to 8.1.16d).
However, further study is required to know the exact trend.
Sampling of most of the intertidal segments was done in Series I
anticipating oil contamination of these locations. However, majority of these
sites were free from oil contamination and showed normal distribution of
macrobenthic diversity. Therefore, fresh set of transects which were reported to
be oil affected were selected for future observations.
Mangroves: Mangroves of the Mandva - Dighodi segment were free from oil
coating. However, some of the mangroves within the Mumbai Bay, especially at
JNPT, Vashi and Trombay, were coated with oil up to a height of 0.5 to 1 m from
the ground level. These zones are dominated by Avicennia marina followed by
Salvadora persica. Hence, these species were mainly affected by the oil.
Seedlings and pneumatophores of Avicennia at Trombay were also covered by
oil leading to high mortality of the seedlings. Crabs and mudskippers were
however active on the oil contaminated mangrove sediment. The observations
conducted after a month indicated that the growth rate of the oil coated
mangroves was stunted and their leaves had dried. In fact the large stretches of
mangroves unaffected by the spill also had dry leaves. Hence, it is possible that
dried leaves were unrelated to oil spill and associated with some wide spread
infection on mangroves along Mumbai coast that had also been reported in the
past.
78
8.2 Subtidal environment Observations on water quality, sediment quality and flora and fauna of the
subtidal environment of Mumbai Bay and adjacent coastal area are as follows:
8.2.1 Field observations
At the spill site 2 to 3 m wide fairly long black coloured ribbons were seen
emerging from the grounded ship and directed towards Harbour area (Figure
1.1.2). It seems that the leakage was through a narrow rupture site of the ship.
In the mouth region a large patch having streaks of black colour with a large
spread out of shining oil film around was evident. Relatively smaller patches
were also visible in the region. A continuous coating of Colaba shore with black
oil was clearly visible from the seaward side.
In the Central Bay around Butcher Island large patches of atleast 500 x
100 m size having fading black colour with brownish tinge were seen possibly
indicating high dispersion of oil parcels on the water surface during transport
(Figures 8.2.1 to 8.2.2). A resultant drift of these patches towards Mahul-
Trombay shores was also observed.
Around Trombay the slick was in more dispersed form spread out in larger
area (Figures 8.2.3 to 8.2.4).
At Vashi the oil slick was seen drifting towards the upstream during high
tide (Figure 8.2.5). During low tide a large patch possibly the same that travelled
upstream was seen drifting downstream. It appeared that even after 6 days of
the spill occurrence some portion of the slick which neither hit the shore nor
dispersed in the water column remained oscillating in the Bay water with the tide.
8.2.2 Water quality
A spill oil of petroleum origin generally contains hydrocarbons as the
major constituent which is immiscible with water and possesses low reactivity.
Hence it is known that the oil may not be directly involved chemically in the water
quality processes even though it is present in abnormally high levels. However,
79
its constituents have the ability to influence the water quality due to their physical
presence in the water column.
Water quality recorded at different subtidal stations (Figure 1.4.2) is
described below.
a) PHc
The PHc concentrations (µg/l) in the spill affected areas given in Table
Based on above data, the PHc accumulation of ND to 22.1 µg/g, wet wt
was in following ranges in different sampling Series.
Zone Series I Series II Series IIIMouth ND 0.7-7.0 0.8-1.3 Central Bay 4.4-7.3 0.2-11.5 1.3-22.1 Inner Bay 2.6-9.1 1.2-3.5 0.6-5.8 Range ND-9.1 0.2-11.5 0.6-22.1
The highest accumulations of 11.5 and 22.1µg/g, wet wt occurred at
station 21 in the Central Bay towards the port area.
Marginal increases in the levels were recorded at stations 11 and 12 in
the Series II from 4.4 to 7.9 and 7.0 to 9.4 µg/g, wet wt respectively. A marked
increase in the accumulation was also evident in the Central Bay during the
Series III.
The PHc content of the Bay sediments (µg/g, wet wt) recorded during the
earlier monitoring events was as follows:
Zone Premonsoon (March 1999)
Monsoon (September 2009)
Premonsoon (2007-2009)
Postmonsoon(2009)
Mouth 32.4 0.5 - 0.6 - 1.0 - 10.1 Central Bay
7.6-41.4 - - 2.2 - 3.4
Inner Bay 42-42.8 1.0 - 4.0 4.8 - 10.0 0.2 0.9
Comparison of these data with the results of present study shows that the
levels of PHc had not increased in the region due to the oil spill. In fact
concentrations recorded in March 1999 exceeded the results of the present
monitoring. As discussed in Section 8.1.16, in areas affected by accidental oil
spills, the sediment burden of PHc increases several folds. This however was
not seen in the Bay sediments.
88
8.2.4 Flora and fauna
Bacteria, phytoplankton, zooplankton and benthos from the subtidal zone
of the Mumbai Bay (Thane Creek-Mumbai Harbour) were monitored during
Series I to IV of Phase I (Figure 1.4.1). The results are described below.
and SFLO in the surface water and the sediment from all the water quality
stations were determined and the results are given in Tables 8.2.1 and 8.2.4.
Seawater: The TVC counts varied widely (1000 - 296000 no/ml) with the
highest average counts of 120666 no/ml at the harbour mouth during Series II
(Table 8.2.1). No clear trend in their distribution between the harbour and Thane
Creek was observed. TC (20 - 1500 no/ml) and FC (10 - 760 no/ml) also varied
in a wide range without any trend. SLO occurred only in Thane Creek, while,
SFLO was not detected in the study area. Bacteria like ECLO, SHLO, PKLO,
VLO, VPLO, VCLO and PALO varied randomly as expected for areas receiving
untreated sewage.
In general, the bacterial counts of the present study (Table 8.2.2) were
much higher than that of September 2009 (Table 8.2.3) for some class of
bacteria. However, the distribution of ECLO, SHLO, PKLO, VLO, VPLO, VCLO
and PALO was broadly comparable between two periods (2009-2010). Hence,
the impact of the oil spill on the distribution and abundance of bacteria in surface
water in the Bay was not evident.
Sediment: The bacterial counts (no/g) in surface sediments of the Mumbai Bay
during the present study are given in the Table 8.2.3.
The bacterial counts in sediment were many folds higher than in water as
expected and their distribution was random. Thane Creek sustained relatively
higher counts than the harbour region.
89
As evident from Tables 8.2.1 and 8.2.4, the bacterial counts in general,
were higher during present study as compared to September 2009. The
distribution and abundance of bacteria in sediment were more related to sewage
releases to the Mumbai Bay rather than impact of the oil spill.
b) Phytoplankton
The distribution of phytopigments, cell counts and total genera for
different periods of the present study is compared in the table given below.
Parameter Series I Series II Series III Series IV Chlorophyll a (mg/m3)
0.9-12.3 0.9-45.5 1.4-34.5 0.8-42.6
Phaeophytin (mg/m3)
- 1.2-22.1 0.3-4.6 0.6-7.5
Ratio of Chl a/Phaeo
0.6-2.8 0.1-19.9 1.1-34.5 0.9-11.4
Cell counts (nox103/l)
60.3-1294.6 75-50488 - -
Total genera (no)
8-19 7-21 - -
It is evident from above data that the concentrations of chlorophyll a
widely varied (Table 8.2.5), whereas, phaeophytin did not reveal any clear trend.
The ratios of chlorophyll a/phaeophytin also varied widely having lower values
during Series I as compared to the rest suggesting severe to moderate
environmental stress on phytoplankton especially during Series I. The higher
ratios clearly suggested good phytoplankton production in the study area from
Series II to IV.
The cell counts and generic diversity of phytoplankton also revealed wide
variability in the study area. However, the cell counts were comparatively low
during Series I than Series II, suggesting possible impact of the oil spill on
phytoplankton. In general, the generic diversity of phytoplankton revealed a
comparable trend between Series I and Series II.
The results of monitoring under Series I to IV are compared with earlier
data (September 2009) in Table 8.2.6.
90
The comparison reveals reduction in the concentration of chlorophyll a,
ratio of chlorophyll a / phaeophytin, and the cell counts during the Series I as
compared to September 2009.
However, the values of phytopigments, cell counts and generic diversity of
Series II to IV were comparable with the data of September 2009. The marked
reduction in phytopigments and cell counts during Series I could be due to the
mortality of phytoplankton which are sensitive to petroleum hydrocarbons in
water (Section 8.2.2). The results of subsequent monitoring suggested that the
recovery of phytoplankton occurred in a short span.
c) Zooplankton
The standing stock and group diversity of zooplankton widely varied in the
study area during Series I and II (Tables 8.2.6 and 8.2.7, Figures 8.2.12 to
8.2.15) comparison of results with relatively high concentration of PHc with those
with near background levels of PHc (stations 7, 8 and 9) indicate no clear trends
and suggests that zooplankton were not grossly affected during the time of spill
in Series I as evident form table below.
Parameter Averages
Series I Series II PHc (µg/l) in water 2428.5 20.9Zooplankton Biomass (ml/100 m3) 23.4 2.8Population (nox103/100m3) 451 71 Total groups (no) 14 11 Fish eggs (no/100 m3) 18 1Fish larvae (no/100 m3) 115 37
It is evident from above table that the distribution and abundance of
zooplankton were found to be normal during the time of oil spill in Series I.
However, Series II revealed considerable reduction in the standing stock of
zooplankton although the water quality indicated near normal PHc level.
Similarly a drastic reduction in the abundance of fish eggs and larvae during
series II as compared to series I was noticed.
91
d) Macrobenthos
The distribution of subtidal macrobenthic faunal standing stock and
diversity for the study area is given in the table below.
Period Biomass
(g/m2, wet wt.)Population
(no/m2)Total groups
(no)Series I 0-19.2 0-11700 0-4 Series II 0-3.2 0-450 0-4 Series III 0-5.7 0-5075 0-3Series IV 0-13.5 0-6300 0-2
It is evident from above data that high variability in standing stock and
faunal group diversity was noticed for the subtidal macrobenthos of the study
area (Figures 4.2.16 to 4.2.18). A reduction in standing stock during Series II
and Series III as compared to Series I and Series IV was evident. However, the
faunal group diversity which was on a narrow range indicated a reduction during
Series III to Series IV as compared with Series I and Series II. Overall, both
faunal standing stock and group diversity showed a noticeable reduction during
August 2010 as compared to September 2009 (Table 8.2.9). This may be due to
natural variability associated with disturbance to substrate conditions because of
monsoonal activities.
e) PHc in biota
Commercial fishing in Mumbai Bay is at low level especially during
monsoon. Experimental trawling conducted in the study area during 19-21
August 2010 (Series II) revealed a small catch <5 kg/h. Some selective species
from this catch were analyzed for PHc content and the results are given below.
From the available literature, PHc in fishes of the Mumbai Bay is compiled
in the following table:
Fish Concentration(µg/g, wet wt)
Bombay Duck 3.4
Cat fish 8.4
Indian mackerel 2.9
Anchovy 1.0 - 9.6
Dhoma 0.8 - 10.8
The comparison of the present results with those reported in the past
indicated that there was no evidence for the accumulation of PHc in fishes
subsequent to the spill. In fact the values of the present monitoring are lower
than reported earlier.
8.2.5 Impact assessment of oil spill The physical observations show that prevailing circulation pattern
influenced by tide, currents and wind during the period of spillage has high
impact on small but continuous leakage (3 days) of oil resulting in transporting of
major spill in the Mumbai Bay and some fraction directed towards the coast
south of Mumbai Bay. Highly fragmented parcels of the slick on the water
surface could be due to high turbulence and wave action prevailed in monsoon.
It was also aided by properties of the constituents of the spilled oil. Presence of
isolated patches of oil on water surface would lead to highly variable distribution
of dissolved and dispersed fractions in the water column. Hence, adverse
impact on flora and fauna of the affected areas would be highly uneven from one
sampling location to the other.
b) Water quality
PHc concentrations recorded during Series I (11 to 14 August 2010)
revealed high concentrations in isolated patches in the Inner and the Central
Bay.
The relatively low PHc levels (<100 µg/l) during subsequent sampling
Series suggested that the small residual dissolved and dispersed fraction of the
93
spilled oil in water had possibly diluted and weathered thereby reliving the Bay
water from excess PHc (Figures 8.2.6 and 8.2.8).
The past data for PHc in water of the Bay indicate that the levels though
variable are generally in 2.3 to 72.4 µg/l range (Table 8.1.2). Thus it is evident
that the impact of the spilled oil on the PHc content was short-lived. The Central
Pollution Control Board (CPCB) has set water quality standards for coastal
waters and marine outfalls. The primary water quality criteria for use in salt pans,
shell fishing, mariculture and ecologically sensitive zone (Class SW-I) specifies
concentration of 0.1 mg/l (100 µg/l) of oil and grease (including petroleum
products).
High SS content in the Bay was possibly inherited from disturbances of
bed sediment and land drainage during monsoon period. Wide variations in
salinity (1.8 to 35.4 ppt) were also due to monsoonal runoff. Variable DO
sometimes falling to low values and high concentrations of NO2--N, NO3
--N and
NH4+-N in some instances are in agreement with the past data sets for the Bay
and have been considered to be due to release of sewage to the Bay. The
overall assessment indicates that the impact of the spill on water quality of the
Bay was limited to abnormally high concentrations of PHc in water confined to
localized areas that too for a short duration of less than a week and background
levels had attained at the majority of stations within 11 days from the accident.
The variations in other quality parameters though indicated a deteriorated marine
environment, these variations could be explained based on the past monitoring
records and particularly of September 2009.
c) Sediment quality
PHc concentrations in the subtidal sediment of the Mumbai Bay were ND
to 9.1, 0.2 to 11.5 and 0.6 to 22.1 µg/g, wet wt during Series I to III respectively
(Table 8.1.4).
The accumulation of PHc in sediments reported for Mumbai for the pre-
spill period (2007-2009) was 0.2 to 10.1 µg/g, wet wt. Hence the values of 11.5
94
to 22.4 µg/g, wet wt for Central Bay (stations 19 and 21) during Series II and III
were marginally higher than the background in some instances.
d) Flora and fauna Bacteria: The bacterial counts of TVC, TC, FC and other selective bacteria
widely varied and without any trend both in water and sediment at the Mumbai
Bay during the present study (August/September 2010). The bacterial counts
both in water (Tables 8.2.1 and 8.2.2) and sediment (Tables 8.2.3 and 8.2.4)
were relatively higher during the present study as compared to those of
September 2009. The large variations in bacterial populations are common in
areas receiving sewage and also influenced by land drainage. A short-lived small
oil spill in a polluted coastal system is unlikely to have altered significantly the
distribution and abundance of bacteria in the system.
Phytoplankton: The concentration of chlorophyll a (av 5.2 mg/m3) and
phaeophytin (av 2.3 mg/m3) in the surface waters during the Series I was lower
than the results of September 2009 thereby suggesting possible reduction in
their levels. Moreover, the average concentration of phaeophytin similar to the
shore sampling results remained higher than that of chlorophyll a (Figure
8.1.16a) leading to low chlorophyll a / phaeophytin ratios (av < 1) during the
Series I. These results indicated a possible mortality of phytoplankton due to the
oil spill (Figure 8.1.16b). The concentration of chlorophyll a (av 20.6 mg/m3) and
their cell counts (75 - 50488 nox103/l) increased considerably during Series II.
The chlorophyll a/phaeophytin ratios significantly improved during Series II (av
11.7), Series III (av 6.5) and Series IV (av 3.3) supporting the inference of
adverse impact of the oil spill on phytoplankton immediately after the spill
(Series I). Such recovery of phytoplankton has been commonly reported
following oil spills due to fresh recruits from the adjacent waters unaffected by
oil. Blooms of phytoplankton were recorded in the Mumbai Bay during Series II
of the present study as well as in September 2009. Such blooms could be due to
higher input of freshwater, organic load and nutrients to the coastal system
through land drainage which could favour typical estuarine species to grow in
abundance for a short period. Also the reduction in zooplankton standing stock
noticed during Series II could have reduced the grazing pressure on
95
phytoplankton. However, the Mumbai Bay probably returned to normal
conditions with respect to phytopigments during Series III and IV of study (Table
8.2.5).
Zooplankton: The results presented in Section 8.2.4 clearly revealed a
noticeable reduction in zooplankton standing stock and group diversity in the
Mumbai Bay especially during Series II as compared to Series I. It was also
found that major groups like copepods, decapods, Lucifer sp and chaetognaths
were coated with oil (Figures 8.2.19 and 8.2.20). Some organisms had oil in their
digestive track (Figure 8.2.21a) and/or within their body (Figure 8.2.19). The high
PHc content in water probably resulted in mortality of zooplankton leading to low
biomass recorded in Series II. In fact there was 89% reduction in biomass and
86% decrease in population during Series II as compared to Series I within a
short period which was unusual (Table 8.2.6; Figures 8.2.12 and 8.2.14).
Considerable reduction in fish eggs (90%) and larvae (76%) during Series II in
reference to Series I was also evident within a short period of about a week
(Table 8.2.7; Figures 8.2.13 and 8.2.15). This suggests that the impact of the oil
spill on phytoplankton was immediate whereas it was delayed to be reflected in
the standing stock of zooplankton.
The comparison of Thane Creek with Harbour mouth open coastal system
clearly revealed reduction in zooplankton standing stock in both coastal systems
during the Series II of the study. Both coastal systems revealed considerable
reduction in zooplankton standing stock during August 2010 as compared to
September 2009 (Table 8.2.8).
Macrobenthos: High variability in standing stock and faunal group diversity
were noticed in the distribution of subtidal macrobenthos of the Mumbai Bay
during the present study [Section 8.2.4(d)] with reduction in these parameters
when compared to September 2009 results (Table 8.2.9). However, this
conclusion should be treated with caution since seasonal variability of
macrobenthos in the Mumbai Bay is common which may be due to substrate
changes inducted by monsoon activities and high freshwater influx to the
96
system. This possibility appears more likely in view of comparable PHc in
sediments in pre- and post-spill periods (Section 8.2.3).
PHc in biota: Generally organisms from coastal regions show consistently low
levels of hydrocarbons in the range of 0.1 to 10 µg/g, wet wt. It has been
reported that tissues of organisms exposed to petroleum contained 10 to 100
times more hydrocarbons than the tissues of marine animals unexposed to the
contamination.
It is known that fish generally avoid spill affected areas. The general
avoidance thresholds are < 1 mg/l of Water Soluble Fraction (WSF) of PHc for
seawater.
The PHc content in fish from the Mumbai Bay reported in literature was
0.1 to 10.8 µg/g, wet wt which was comparable to the levels recorded in fishes
from normal coastal areas. The concentrations of PHc in the post-spill period
varied in the range 0.8 - 3.9 µg/g, wet wt which was even below the levels
reported earlier for the pre-spill period.
Hence, there was no evidence for accumulation of PHc in the fish
samples collected after the occurrence of oil spill.
8.3 Impact assessment of spills of pesticides and hazardous chemicals It was reported that some metal canisters containing pesticides and
hazardous chemicals reportedly washed ashore on the beaches. However, their
fate was not known. Their possible fate on spillage in sea would be as follows:
8.3.1 Organophosphorus pesticides
There were 3 pesticides namely dichlorvos, acephate and quinolphos
loaded on the ship.
A pesticide if spilled in the sea would dissolve in water. The lethal
concentration of it to fish would exist only in the localized area of spillage.
97
Whether such concentration would persist in the Bay would depend on the mass
of the pesticide entering the water, rate of its dissolution, dilution by diffusion and
advection etc. Nevertheless, it has high potential to cause fish mortality in the
affected areas. Hydrolysis is slow at pH 4 but rapid at pH 9 which is nearer to
the seawater pH. Biodegradation may occur, especially under acidic conditions
with slow hydrolysis, or where populations of acclimated micro-organisms exist,
as in polluted waters. Its decomposition rate by hydrolysis is over 3% per day in
seawater.
8.3.2 Synthetic pyrothroids
A synthetic pyrothroid; deltamethrin when spilled in water would tend to
sink as its solid form is heavier than water. Being sparingly soluble, its spillage
may not cause large-scale mortality of pelagic organisms though demersal
animals may be at high risk at the site of spillage.
The pesticide would slowly decompose by hydrolysis in seawater at pH
above 7.5. It has a tendency to bind with solids and hence may remain in the
bed sediment before being hydrolysed.
8.3.3 Hazardous chemicals a) Sodium hydroxide
Sodium hydroxide is highly soluble in water and the process is
exothermic. The spillage of sodium hydroxide in bulk could enhance pH and
temperature of seawater and extent to which this could happen would depend on
several factors as discussed under Section 6. The impact on biota would depend
on the extent of increase in pH and temperature rise. In view of the buffering
capacity of seawater and rapid dispersion impact would be on short duration.
98
9 TENTATIVE FINDINGS AND PROPOSED STUDIES 9.1 Ship accident and NIO’s initiative
The ships MSC Chitra and MV Khalijia 3 collided in the mouth area of
Mumbai Bay on 7 August 2010, at 0937 h. Subsequently, MSC Chitra drifted
and grounded near the Prong Reef Light House. The accident resulted in the
leakage of 600 to 800 t of furnace oil and about 120 containers onboard the
vessel - some of which containing pesticides and hazardous chemicals like
organophosphorus pesticides and sodium hydroxide fell in the sea. NIO on its
own conducted assessment of impact of the accident on marine ecology of the
Mumbai Bay and adjacent coastal areas commencing from 10 August 2010.
The initial study by NIO considered selective parameters of water quality,
sediment quality and flora and fauna. For this purpose 15 shore locations and
22 subtidal stations were sampled. These investigations were carried out in four
series between 10 August and 8 September 2010. The tentative findings based
on the observations and proposed plan for future studies are presented below.
9.2 Tentative findings 9.2.1 Model Prediction
ICMAM – Project Directorate, Chennai as well as NIO modelled the spill
assuming leakage rate of 3 t/h over about 3 days. ICMAM used OILMAP to
predict the movement and spreading of the spilled oil and ADIOS to evaluate the
weathering processes at spatial and temporal scales in the Mumbai Harbour –
Thane Creek model domain. NIO used the Hydrodyn-Oilsoft software with the
project domain extended also to the coastal area between Versova and
Revdanda upto a distance of 25 km from the coast. The modelling results in both
cases predicted that the spilled oil would hit the shores of Colaba, Uran, JNPT,
Vashi, Trombay, Sewri etc. within the Mumbai Bay. The modelling results of NIO
also predicted the pollution of coastal areas south of the Bay mouth namely
Mandva, Kihim, Alibaug etc within 3 days of the spill. These predictions broadly
matched the feedback of the field observations.
99
9.2.2 Intertidal environment Among the 15 shore transects investigated in the Mumbai Bay and
adjacent areas on 10 August 2010; Colaba, Uran and Vashi had oil landfall.
Intertidal area of Trombay and mangrove habitats at Vashi and Trombay were
also found coated with oil. Low level of oil contamination was noticed at Kihim
beach. Some containers which had gone overboard following the accident and
washed ashore were noticed at Dighodi and Uran with spilled materials like
teabags, sugar and biscuit pockets, etc strewn around. The west coast of
Mumbai from Girgaon to Juhu was unaffected by the oil spill.
The nearshore water quality of Series I revealed that the salinity, SS, DO,
phosphate, nitrate, nitrite, ammonia and phenols were in the ranges expected for
the region with no measurable impact of the accidental oil spill as expected.
However, the concentrations of PHc were abnormally high (498-12075 µg/l) at
Kihim, Uran, Colaba and Mandva during Series I under the influence of slick
drifted into the coast. During, Series II (after 8 days) majority of the shore
segments sampled excepting Uran 2, Trombay and Vashi revealed a marked
recovery with much lower PHc levels (<53.2 µg/l). The west coast of Mumbai
had expected water quality with the PHc values comparable to the background
revealing the absence of any significant impact of the oil spill in this zone.
Overall, the impact of the oil spill on nearshore water quality was limited to
enhanced levels of PHc in water of localized sites for a period of a week or so
from the time of the occurrence of oil spill. The recovery which was fairly fast
was probably due to high wave generated turbulence and land runoff associated
with the monsoon season.
Increase in PHc in sediment of the intertidal zone was insignificant
compared to the expected background at several sites with only a marginal
increase at Alibaug, Mandva and Trombay. Considerable reduction in chlorophyll
a (av < 1 mg/m3) and ratios of chlorophyll a/phaeophytin (< 1) when compared
with the values of September 2009 was probably due to mortality of
phytoplankton as an impact of increased levels of PHc in water at shore
locations like Uran, Trombay and Colaba. Mortality of phytoplankton in marine
areas affected by oil has been well-documented. Abundance of zooplankton and
100
macrobenthos at the shore segments did not indicate any clear trend. Corals,
barnacles, oysters and gastropods inhabiting the oil coated shore at Colaba
were live and did not show visible signs of acute stress. Mangroves (Avicennia
marina) at JNPT, Vashi and Trombay were coated with oil up to a height of 0.5
to 1 m.
High mortality of mangrove seedlings was noticed at Trombay due to
smothering by oil.
9.2.3 Subtidal environment Due to uneven distribution of dispersed and dissolved oil in the water
column, the concentrations of PHc in water varied widely from as low as 5.2 µg/l
at station 3 to the highest of 16902 µg/l at station 8 during Series I. However, as
in the case of nearshore zone, the PHc values in the water of the Bay attained
normal and ambient status within a short period of 11 days (Series II) after the oil
spill. The rest of the water quality parameters indicated no significant differences
in comparison with the expected background.
The levels of PHc in sediment (ND - 22.1 µg/g, wet wt) in the Mumbai Bay
were comparable to the background indicating insignificant contamination of the
bed by accidentally spilled oil. It is possible that since the oil spill was relatively
small, the sinking residue was widely dispersed under tidal and monsoonal
conditions leading to only minor transport to the bottom sediment of a given
area.
The bacterial count of TVC, TC and FC varied widely without any trend
both in water and sediment of the Mumbai Bay. In the Bay they are known to be
associated with the sewage releases .
The results of chlorophyll a and phytoplankton populations indicated the
possibility of phytoplankton mortality due to the oil spill in the initial stage (Series
I). However, the recovery of phytoplankton in the affected areas of the Bay was
fairly quick (Series II). Fast recovery of phytoplankton in areas affected by small
101
oil spills through recruitment from nearby sites unaffected by oil has been fairly
well-established.
A noticeable reduction (86-89%) in zooplankton standing stock and
diversity was evident during Series II as compared to Series I values, wherein
high PHc occurred in water. Similarly the abundance of fish eggs and larvae
decreased to the extent of 90 and 76% respectively during series II. It appears
that the impact of oil spill on phytoplankton of the affected areas was immediate
whereas it was delayed in case of zooplankton.
High variability in standing stock and diversity of subtidal macrobenthos
was mainly associated with substrate changes and monsoonal disturbances and
there was no evidence of the impact of the oil on their standing stock in the
Mumbai Bay.
The comparable levels of PHc in fish from Mumbai Bay during the pre-
and post-spill periods precludes the possibility of its accumulation in fishes
following the oil spill.
The fate of the contents of the containers with pesticides and hazardous
chemicals going overboard is yet to be established.
9.3 Proposed studies As given in Section 1 of this report NIO will continue monitoring of the
Mumbai Bay and 100 km length of the coastline between Bassein and Alibaug.
These studies will be spread over a period of 7 months (September 2010 –
March 2011) as follows:
Phase PeriodII September-October 2010 III November-December 2010 and January 2011 IV February - March 2011
102
Based on the results discussed in this report particular attention will be
given to the recovery of intertidal ecology of spill-affected sites.
Ecotoxicological studies to assess neuro-toxicological impact on biota,
rupture of DNA and oxidative stress on selective organisms will be done.
Apart from the calibration of model, the weathering of selected fuels in the
marine environment of Mumbai will be quantified in different seasons to generate
information base for use in future.
A hypothetical leakage of water soluble organophoshorus pesticide such
as acephate at the seabed will be modelled for different scenarios to assess the
volume of the water column that might have levels to cause acute toxicity to
organisms.
Table 4.2.1: Details of metereological parameters recorded at Santacruz during August 2010
Date 0830 Temp 0C 1730 Temp 0C Rainfall Wind(0830) Wind(1730) Total Cloud Amount(okta)D.B. W.B. D.B. W.B. mm Direction Speed(kmph) Direction Speed(kmph) 0830 1730