Danish Fundamental Metrology Ltd. Matematiktorvet 307 DK-2800 Kgs. Lyngby Tel +45 4593 1144 Fax +45 4593 1137 www.dfm.dtu.dk 30 April 2009 Ref 1107-03 PTJ Report no. DFM-2008-R30 Page 1 of 44 Summary In 2008 IPQ asked DFM to participate in a bilateral comparison on pH fol- lowing the transfer of the Portuguese set-up for primary pH measure- ments from the University of Lisbon to IPQ. IPQ wanted to test their capa- bility in primary pH measurements through the bilateral comparison. The bilateral comparison is registered as EURAMET project 1051. DFM acted as coordinating laboratory for the bilateral comparison. Due to limitations of DFM's production capacity and ability to do stability and ho- mogeneity testing the comparison did not fulfil the rules of a supplemen- tary key comparison and cannot formally link to a CCQM key comparison. This report contains the details of the comparison including the results of the two institutes and an evaluation of the equivalence of these. Prepared by Pia Tønnes Jakobsen Danish Fundamental Metrology Ltd. Matematiktorvet 307 DK-2800 Kgs. Lyngby Report on IPQ-DFM bilateral com- parison on phosphate buffer 2008
Transcript
Danish Fundamental
Metrology Ltd.
Matematiktorvet 307
DK-2800 Kgs. Lyngby
Tel +45 4593 1144
Fax +45 4593 1137
www.dfm.dtu.dk
30 April 2009
Ref 1107-03 PTJ
Report no. DFM-2008-R30
Page 1 of 44
Summary
In 2008 IPQ asked DFM to participate in a bilateral comparison on pH fol-lowing the transfer of the Portuguese set-up for primary pH measure-ments from the University of Lisbon to IPQ. IPQ wanted to test their capa-bility in primary pH measurements through the bilateral comparison. The bilateral comparison is registered as EURAMET project 1051.
DFM acted as coordinating laboratory for the bilateral comparison. Due to limitations of DFM's production capacity and ability to do stability and ho-mogeneity testing the comparison did not fulfil the rules of a supplemen-tary key comparison and cannot formally link to a CCQM key comparison.
This report contains the details of the comparison including the results of the two institutes and an evaluation of the equivalence of these.
Prepared by Pia Tønnes Jakobsen Danish Fundamental Metrology Ltd. Matematiktorvet 307 DK-2800 Kgs. Lyngby
Report on IPQ-DFM bilateral com-
parison on phosphate buffer 2008
Page 2 of 44
1 Background, participants and time schedule ............................. 3 1.1 Background .......................................................................... 3 1.2 Participants .......................................................................... 3 1.3 Time schedule ...................................................................... 4 2 Measurement sample and conditions ....................................... 5 2.1 Sample ................................................................................ 5 2.2 Measurement conditions ........................................................ 5 3 Participants results ................................................................ 7 3.1 Results of DFM...................................................................... 7 3.2 Results of IPQ....................................................................... 7 4 Evaluation of results .............................................................. 8 5 Conclusion............................................................................ 9 6 Appendix 1..........................................................................10 7 Appendix 2..........................................................................15 8 Appendix 3..........................................................................32
Contents
Page 3 of 44
1.1 Background
The Portuguese primary pH set-up was transferred from the University of Lisbon Faculty of sciences to Instituto Português da Qualidade (IPQ) in 2008. After the transfer of the set-up IPQ wanted to test their capability in primary pH measurements.
Danish Fundamental Metrology (DFM) and IPQ agreed on a bilateral comparison coordinated by DFM. The comparison was carried out as EURAMET project 1051.
Due to limitations of DFM's production capacity and ability to do stabil-ity and homogeneity testing the comparison was bilateral. The comparison did not fulfil the rules of a supplementary key comparison and cannot be formally linked to a CCQM key comparison.
1.2 Participants
The participants were:
DFM Pia Tønnes Jakobsen Danish Fundamental Metrology Ltd. Matematiktorvet 307 DK-2800 Kgs. Lyngby Denmark Direct telephone: +45 45 25 58 87 Telephone: +45 45 93 11 44 Fax: +45 45 93 11 37 E-mail: [email protected] IPQ Maria João Nunes Instituto Português da Qualidade LCM Rua António Gião, 2 2829-513 Caparica Portugal Direct telephone: +351 212 94 82 63 Telephone: +351 212 94 81 85 or +351 212 94 81 86 Fax: +351 212 94 81 88 E-mail: [email protected]
1 Background, participants and time
schedule
Page 4 of 44
1.3 Time schedule
The originally agreed time schedule was:
Dispatch of samples: 2008-07-16 Measurement period: 2008-07-16 to 2008-08-15 Deadline for receipt of report: 2008-09-30 Draft report: 2008-11-15 Deadline for receipt of comments to draft report: 2008-12-31 Final report sent to EURAMET: 2009-02-28
However, the writing of the draft report was delayed. The draft report was sent from DFM to IPQ on 2009-02-27. IPQ and DFM agreed on 2009-04-01 as deadline for comments to the draft report. And the final report will be sent to EURAMET by 2009-05-30.
Page 5 of 44
2.1 Sample
The comparison was carried out on a physiological phosphate buffer, that is an aqueous solution containing 0.03043 mol kg-1 Na2HPO4 (disodium hydrogen phosphate) and 0.008695 mol kg-1 KH2PO4 (potassium dihydro-gen phosphate).
The buffer was prepared by dissolving weighed quantities of NIST SRM 186g I and II in a weighed quantity of argonbubbled, deionised water with conductivity lower than 200 µS/m. The salts are weighed and transferred to a glass bottle to which the water is added. The bottle is shaken until the salts are dissolved and left to stand for an hour. After renewed shak-ing the samples for measurement are taken from this solution. The pro-duction method used at DFM differs somewhat from the method recom-mended by NIST and thus the pH of the produced buffer does not neces-sarily match that stated in the certificate from NIST for SRM 186g.
DFM took the aliquots used for the measurements directly from the large bottle in which the buffer was produced.
For the buffer to be sent to IPQ was prepared three 1 L glass bottles with plastic screw caps (so-called bluecap bottles). The bottles and their caps were soaked over night in 2% solution of Extran® MA01. Extran® MA01 is an alkaline detergent solution from Merck. The bottles and caps were then rinsed thoroughly in high purity water and dried at 120 °C for 6 hours.
After cooling the bottles, the buffer was filled into the bottles and the screw caps screwed on. The bottles were labelled, the screw cap re-tightened a couple of times and then the bottles were sealed using Parafilm®. After weighing the bottles, they were cooled in a refrigerator over night, packed in a large box containing styrofoam insulation material and shipped to Portugal by courier service. IPQ had been instructed to refrigerate the buffer immediately after receipt and keep it refrigerated for at least two days. IPQ was further instructed to store the bottles with buffer at room temperature not exceeding 30 °C from the day before the start of the measurements.
The DFM did not provide IPQ with the hydrochloric acid and the chloride salt (sodium or potassium chloride) that must be used for the measure-ments.
2.2 Measurement conditions
The measurement conditions stated in the protocol were:
It is recommended to use HCl with SI traceable known molality close to a molality of 0.01 mol/kg to measure the standard potential of the Ag/AgCl electrodes.
2 Measurement sample and condi-
tions
Page 6 of 44
Alkali chloride of certified high quality should be added at at least three different molalities in the range of 0.005 mol/kg to 0.02 mol/kg.
The pH measurements are to be carried out at 15 °C, 25 °C, and 37 °C using the primary measurement for pH (Harned cell). Use the standard protocol of your laboratory for this measurement.
For the Faraday constant and for the gas constant the 2006 CO-DATAa values are to be used. These are F = 96 485.3399(24) C·mol-1 and R = 8.314 472(15) J mol-1 K-1. The standard pressure to be used in the evaluation is 101 325 Pa.
The protocol of the comparison is appendix 1 of this report.
a Values available at http://physics.nist.gov/cuu/Constants/index.html.
Page 7 of 44
3.1 Results of DFM
The measurement report of DFM is appendix 2 of this report. The results of DFM are summarised in the table below.
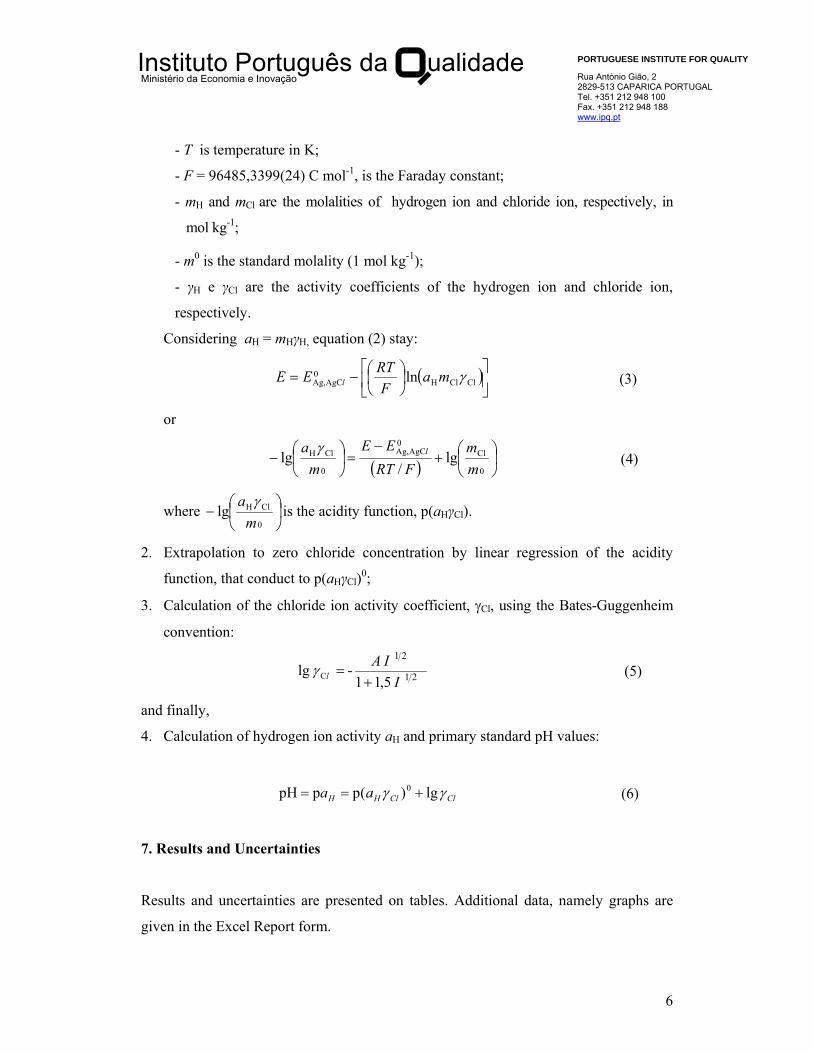
In the table E°Ag/AgCl is the standard potential of the silver/silver chloride electrodes, U(E°Ag/AgCl) is the expanded uncertainty of this at the 95 % confidence level, p°(aHγCl) is the acidity function at zero chloride molality, U(p°(aHγCl)) is the expanded uncertainty of this, pH is the pH value and U(pH) is the expanded uncertainty of this.
The report from IPQ was received on 2008-09-30. The report submitted by IPQ is appendix 3 of this report. The results of IPQ are summarised in the table below.
3.2.1 Communication with IPQ IPQ was asked to expand on a number of details in the submitted report. Further IPQ was asked to recheck the calculation at 25 °C.
3 Participants results
Page 8 of 44
The standard potentials of the silver/silver chloride electrodes are not di-rectly comparable, as the exact standard potential of a silver/silver chlo-ride electrode will depend on the manufacturing of the electrode. How-ever, large discrepancies from the tabulated, theoretical value of the stan-dard potential indicate problems. However, in this case both participants report satisfactory standard potentials of the silver/silver chloride elec-trodes.
Both the acidity functions at zero chloride molality and the pH can be compared, but the only difference between these values is the correction for the chloride activity coefficient at zero molality based on the Bates-Guggenheim convention. The reported results show that both participants are able to apply the Bates-Guggenheim convention correctly at all three temperatures. Thus only the pH values were compared.
The equivalence of the reported pH values were evaluated based on a weighted mean of DFM's and IPQ's results. The calculated degrees of equivalence are:
DFM IPQ
Temperature D U(D) D U(D)
15 °C 0.0000 0.0002 0.0009 0.0067
25 °C 0.0001 0.0003 -0.0013 0.0048
37 °C 0.0001 0.0002 -0.0030 0.0052
The degrees of equivalence are shown in the graph below. The error bars in the graph are 95% confidence level error bars.
-0,0100
-0,0080
-0,0060
-0,0040
-0,0020
0,0000
0,0020
0,0040
0,0060
0,0080
0,0100
DFM 15 °C IPQ 15 °C DFM 25 °C IPQ 25 °C DFM 37 °C IPQ 37 °C
Measurement ID
Deg
ree
of E
quiv
alen
ce
4 Evaluation of results
Page 9 of 44
The result of this bilateral comparison is that IPQ has demonstrated equivalence with DFM for measurement of pH of phosphate buffer.
5 Conclusion
Page 10 of 44
The protocol of the comparison is given on the following 4 pages.
6 Appendix 1
Page 1 of 4
IPQ-DFM bilateral comparison on phosphate buffer 2008
Measurement protocol
Introduction The Portuguese primary pH set-up was transferred from the University of Lisbon Faculty of sciences to Instituto Português da Qualidade (IPQ). After the transfer of the set-up IPQ wants to test their capability in primary pH measurements and that is the purpose of this bilateral comparison coordinated by DFM. The comparison is registered as EURAMET project 1051. The buffer to be measured in this comparison will be a physiological phosphate buffer (0.03043 mol kg-1 Na2HPO4 and 0.008695 mol kg-1 KH2PO4). Due to limitations of DFM's production capacity and ability to do stability and homogeneity testing the comparison is bilateral. The comparison does not fulfil the rules of a supplementary key comparison and cannot formally link to a CCQM key comparison. Participating laboratories and contact persons DFM Pia Tønnes Jakobsen Danish Fundamental Metrology Ltd. Matematiktorvet 307 DK-2800 Kgs. Lyngby Denmark Direct telephone: +45 45 25 58 87 Telephone: +45 45 93 11 44 Fax: +45 45 93 11 37 E-mail: [email protected] IPQ Maria João Nunes Instituto Português da Qualidade LCM Rua António Gião, 2 2829-513 Caparica Portugal Direct telephone: +351 212 94 82 63 Telephone: +351 212 94 81 85 or +351 212 94 81 86 Fax: +351 212 94 81 88 E-mail: [email protected]
Page 2 of 4
Time schedule Dispatch of samples: 2008-07-16 Measurement period: 2008-07-16 to 2008-08-15 Deadline for receipt of report: 2008-09-30 Draft report: 2008-11-15 Deadline for receipt of comments to draft report: 2008-12-31 Final report sent to EURAMET: 2009-02-28 Sample The sample will be prepared at DFM from high purity water and NIST SRM 186g I and II (Na2HPO4 and KH2PO4). However, the method of preparation at DFM differs slightly from that recommended by NIST, and thus the pH of the produced buffer does not necessarily match that stated in the certificate of NIST for SRM 186g. The water mass fraction will be given on each bottle. The ionic strength of the buffer is 0.1 mol kg-1. IPQ will receive three 1 L glass bottles with plastic screw caps ("Blue cap" bottles) with buffer from DFM. The screw caps will be sealed by plastic film (Parafilm®). The bottles will be shipped in a cardboard box by courier. Hydrochloric acid and sodium or potassium chloride will not be provided. It is recommended to dry the alkali chloride at least at 400 °C for at least two hours. Actions at receipt 1. Do not remove the Parafilm® seal or uncap the bottles. Immediately after receipt inspect the
received bottles for damage, leakage or visible contaminants in the solution. Confirm the receipt of the samples by e-mail to the coordinating laboratory. In the e-mail report the condition of the bottles.
2. Place the bottles in a refrigerator for at least two days. Do not remove the Parafilm® seal or uncap the bottles.
3. On the day before the use of the solution the bottle(s) should be taken out of the refrigerator and stored at room temperature (not exceeding 30 °C). Do not remove the Parafilm® seal or uncap the bottles.
4. Before uncapping the bottles or removing the Parafilm® seal weigh each bottle to a resolution of at least 0.01 g. The bottle mass in air (apparent mass)1 should be reported together with the pressure, humidity and temperature of the weighing laboratory at the time of the weighing. Report the results of the weighing of the bottles by e-mail to the coordinating laboratory.
5. Check that the apparent mass of each bottle does not deviate by more than 0.2 gram from that stated by the coordinating laboratory. If the apparent mass deviates more, please contact the coordinating laboratory before uncapping the bottle.
6. Shake the bottle well for about 30 seconds before opening it in order to assure homogeneity of the solution.
Measurement conditions It is recommended to use HCl with SI traceable known molality close to a molality of 0.01 mol/kg to measure the standard potential of the Ag/AgCl electrodes. Alkali chloride of certified high quality should be added at at least three different molalities in the range of 0.005 mol/kg to 0.02 mol/kg.
1 This means that the balance indication should be corrected according to the balance calibration but no correction for air buoyancy should be performed.
Page 3 of 4
The pH measurements are to be carried out at 15 °C, 25 °C, and 37 °C using the primary measurement for pH (Harned cell). Use the standard protocol of your laboratory for this measurement. For the Faraday constant and for the gas constant the 2006 CODATA2 values are to be used. These are F = 96 485.3399(24) C mol-1 and R = 8.314 472(15) J mol-1 K-1. The standard pressure to be used in the evaluation is 101 325 Pa. Instructions for reporting The participants must submit an Excel report form prepared by the coordinating laboratory and e-mailed to the participants together with this protocol. The measurement report form has seven worksheets: Summary, Results at 15 ºC, Results at 25 ºC, Results at 37 ºC, Graphs at 15 ºC, Graphs at 25 ºC and Graphs at 37 ºC. The Summary sheet contains information about the participant, the samples including weighing to check the integrity of the bottles and a summary of the results, namely the standard potentials, the acidity functions at zero chloride molality and the pH. Further there is the possiblity to make comments. The cells with green colour must be filled in, however the comments are optional. The Results at 15 ºC, Results at 25 ºC and Results at 37 ºC sheets contain more detailed information about the results. Again the green cells must be filled in (except for comments which are optional), but also the tables for cell voltage and acidity functions must be filled in. In the cell voltage table information regarding the acid cells must be given for as many cells as the participant use. In both tables information must be given for at least three different chloride concentrations and again for as many cells as the participant use. The result of any cell that is not included in the calculation should be given, but please mark it as disregarded by changing the font colour to red. Do so in both tables, if it is a buffer cell that is not included in the calculation. If a cell is disregarded please state the reason for disregarding it in the comments field. Further to the numerical data in the Results at 15 ºC, Results at 25 ºC and Results at 37 ºC sheets, data must also be given graphically in the Graphs at 15 ºC, Graphs at 25 ºC and Graphs at 37 ºC sheets. Also here the greens cells must be filled in, but comments are optional. Graphs must be pasted in over the yellow squares. The text in the yellow squares can be covered by the graph. Preferably the raw data from which the graphs are plotted should be inserted elsewhere in the sheets. The uncertainty must be evaluated in accordance with GUM.3 All significant sources of uncertainty must be taken into account. Remember to include an uncertainty from the extrapolation of the acidity function to zero chloride molality. Include at least uncertainty budgets for the acid concentration, the molality of chloride at one level, the standard potential of the Ag|AgCl electrodes at each temperature and the acidity function at zero chloride molality at each temperature. The uncertainty budgets must be given in Excel sheets.
2 Values available at http://physics.nist.gov/cuu/Constants/index.html. These values are those recently approved as the 2006 CODATA values (see http://physics.nist.gov/cuu/Reference/versioncon.shtml and “background information” in that link). The difference in F from the 2002 CODATA value [Mohr PJ and Taylor BN 2005 Rev. Modern Phys. 77(1) 1-107] is insignificant for this Key Comparison. R remains unchanged. 3 ISO 1003 Guide to the Expression of Uncertainty in Measurement, ISBN 92-67-10188-9, 1st Ed., International Organization for Standardization, Geneva, Switzerland, 1993.
Page 4 of 4
Further to this the participants must submit at written description of their measurement procedure. This must contain information on:
• Source and quality of the hydrochloric acid and sodium or potassium chloride used for the measurements. State also whether sodium or potassium chloride was used and drying conditions for the salt.
• Description of the method of determination of the concentration of the hydrochloric acid. • Description of preparation of Ag|AgCl electrodes including age of the used electrodes. • Description of preparation of the Pt|H2 electrodes including age of the used electrodes. • Description of how each set of electrodes are stored. • Description of any preconditioning and/or comparison procedures used for either set of
electrodes. • Description of method of preparation of hydrochloric acid used in the cells. • Description of method of preparation of chloride containing buffer. • Description of the measurement procedure including details such as number of cells used,
which solutions are measured at the same time, interval between potential measurements, stabilisation time, criteria for signal stability, criteria for temperature stability, are different temperatures measured independently, etc.
• Description of calculation procedure to evaluate the pH including equations used. Please detail how the voltages used in the calculation are extracted from the measured data. Include also an example of calculation of the chloride molality in buffer solution.
• Volume of the electrochemical cell (portion of the Harned cell in which the Pt|H2 and Ag|AgCl electrodes are immersed).
• Volume of humidifier portion of the Harned cell. • Flow rate of H2 in the Harned cells (at least approximate flow rate). • A picture of the measurement cell.
Page 15 of 44
DFM's measurement report for this comparison is given on the following 16 pages.
7 Appendix 2
Danish Fundamental
Metrology Ltd.
Matematiktorvet 307
DK-2800 Kgs. Lyngby
Tel +45 4593 1144
Fax +45 4593 1137
www.dfm.dtu.dk
27 February 2009
Ref 1107-03 PTJ
Page 1 of 16
Summary
This document gives details of the measurement procedure and uncer-tainty calculation used at DFM for the IPQ-DFM bilateral comparison on pH carried out in 2008. The comparison is registered as EURAMET project 1051.
Prepared by Pia Tønnes Jakobsen Danish Fundamental Metrology Ltd. Matematiktorvet 307 DK-2800 Kgs. Lyngby
DFM report for IPQ-DFM bilateral
comparison on pH 2008
Page 2 of 16
1.1 Acid and chloride salt
DFM produces the acid for the Harned cell measurements by a two-step procedure. In the first step, an approximate 0.1 mol/kg HCl(aq) solution is prepared from Merck suprapur 30% HCl. The ~0.1 mol/kg HCl(aq) solu-tion is called the stock acid. One batch of stock acid weighs around 10 kg and last for about 5 years.
The exact molality of the stock acid is determined by coulometric titration. This is done immediately after the production of the stock acid and at in-tervals as long as there remains stock acid. One round of coulometric ti-tration consists in ten repeat measurements. Immediately after production a round of coulometry is done. This results in a molality with uncertainty. The stock acid molality is assigned this molality until the next round of coulometry is done. A new round of coulometric titration is performed at a time where the molality of the stock acid is still assumed to be within the 95% confidence level of the uncertainty determined at the first round of coulometry. If this is confirmed by the new round, the stock acid is as-signed this molality until the next round of coulometry. New rounds of coulometry are done until no more stock acid remains. If any round of coulometry does not confirm the previous value, corrective actions have to be taken.
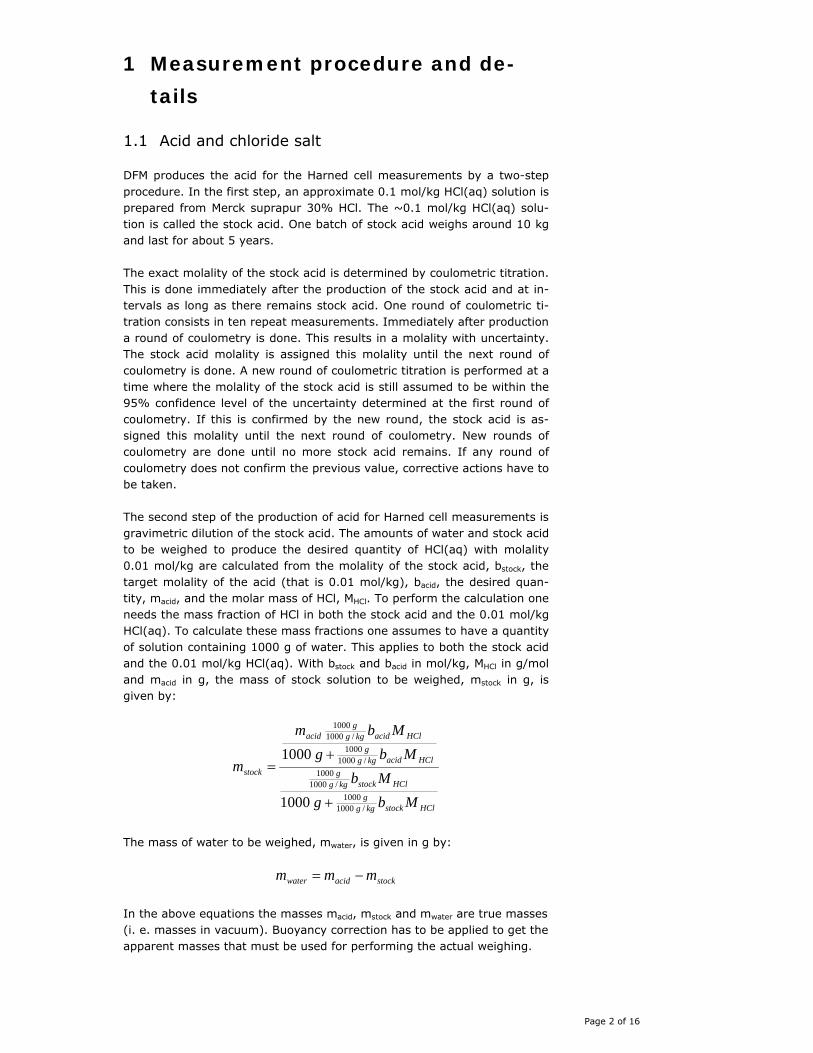
The second step of the production of acid for Harned cell measurements is gravimetric dilution of the stock acid. The amounts of water and stock acid to be weighed to produce the desired quantity of HCl(aq) with molality 0.01 mol/kg are calculated from the molality of the stock acid, bstock, the target molality of the acid (that is 0.01 mol/kg), bacid, the desired quan-tity, macid, and the molar mass of HCl, MHCl. To perform the calculation one needs the mass fraction of HCl in both the stock acid and the 0.01 mol/kg HCl(aq). To calculate these mass fractions one assumes to have a quantity of solution containing 1000 g of water. This applies to both the stock acid and the 0.01 mol/kg HCl(aq). With bstock and bacid in mol/kg, MHCl in g/mol and macid in g, the mass of stock solution to be weighed, mstock in g, is given by:
HClstockkggg
HClstockkggg
HClacidkggg
HClacidkggg
acid
stock
MbgMb
MbgMbm
m
/10001000
/10001000
/10001000
/10001000
1000
1000
+
+=
The mass of water to be weighed, mwater, is given in g by:
stockacidwater mmm −=
In the above equations the masses macid, mstock and mwater are true masses (i. e. masses in vacuum). Buoyancy correction has to be applied to get the apparent masses that must be used for performing the actual weighing.
1 Measurement procedure and de-
tails
Page 3 of 16
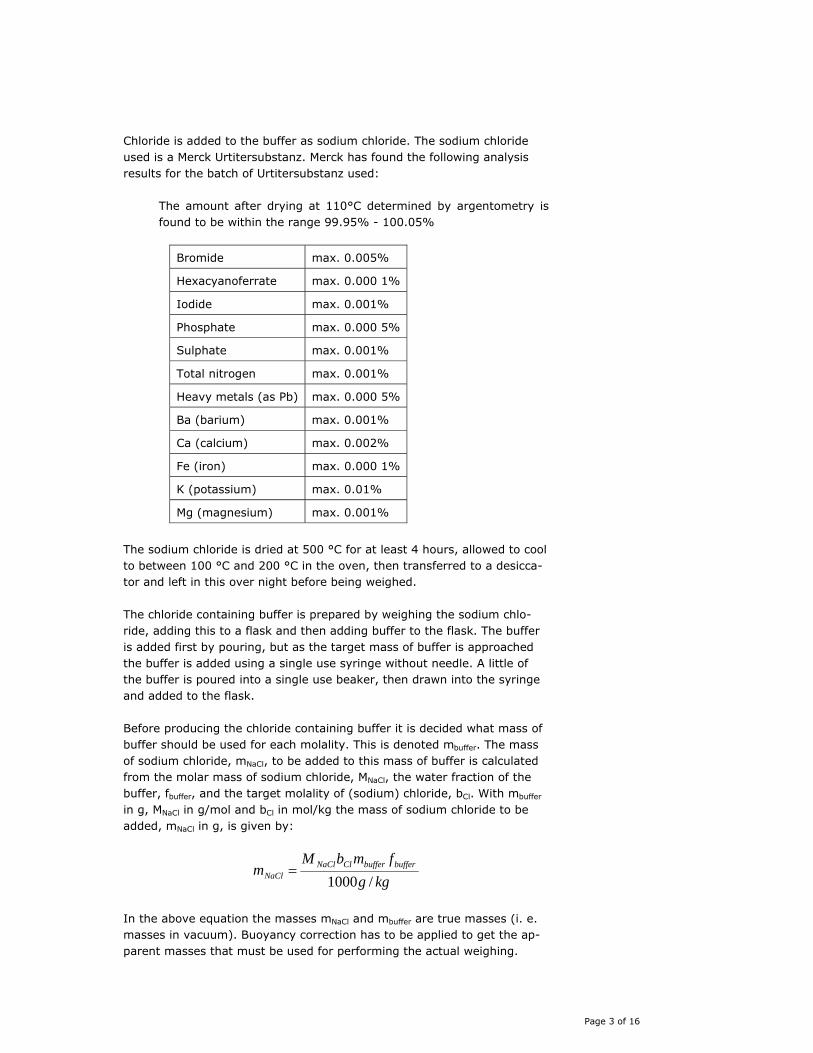
Chloride is added to the buffer as sodium chloride. The sodium chloride used is a Merck Urtitersubstanz. Merck has found the following analysis results for the batch of Urtitersubstanz used:
The amount after drying at 110°C determined by argentometry is found to be within the range 99.95% - 100.05%
Bromide max. 0.005%
Hexacyanoferrate max. 0.000 1%
Iodide max. 0.001%
Phosphate max. 0.000 5%
Sulphate max. 0.001%
Total nitrogen max. 0.001%
Heavy metals (as Pb) max. 0.000 5%
Ba (barium) max. 0.001%
Ca (calcium) max. 0.002%
Fe (iron) max. 0.000 1%
K (potassium) max. 0.01%
Mg (magnesium) max. 0.001%
The sodium chloride is dried at 500 °C for at least 4 hours, allowed to cool to between 100 °C and 200 °C in the oven, then transferred to a desicca-tor and left in this over night before being weighed.
The chloride containing buffer is prepared by weighing the sodium chlo-ride, adding this to a flask and then adding buffer to the flask. The buffer is added first by pouring, but as the target mass of buffer is approached the buffer is added using a single use syringe without needle. A little of the buffer is poured into a single use beaker, then drawn into the syringe and added to the flask.
Before producing the chloride containing buffer it is decided what mass of buffer should be used for each molality. This is denoted mbuffer. The mass of sodium chloride, mNaCl, to be added to this mass of buffer is calculated from the molar mass of sodium chloride, MNaCl, the water fraction of the buffer, fbuffer, and the target molality of (sodium) chloride, bCl. With mbuffer in g, MNaCl in g/mol and bCl in mol/kg the mass of sodium chloride to be added, mNaCl in g, is given by:
kggfmbM
m bufferbufferClNaClNaCl /1000
=
In the above equation the masses mNaCl and mbuffer are true masses (i. e. masses in vacuum). Buoyancy correction has to be applied to get the ap-parent masses that must be used for performing the actual weighing.
Page 4 of 16
1.1.1 Calculation examples
Example of calculation of target for acid production and realised molality:
bstock = 0.100 062 mol/kg with u =0.000 012 mol/kg
MHCl = 36.460 94 g/mol with u = 0.002 0 g/mol
macid = 1000 g (Specified value, thus no uncertainty)
bacid, target = 0.01 mol/kg (Specified value, thus no uncertainty)
⇔
⋅⋅+
⋅⋅
⋅⋅+
⋅⋅⋅
=
molgkgmolgmolgkgmol
molgkgmolgmolgkgmolg
m
kggg
kggg
kgggkgg
g
ettstock
/46094.36/100062.01000/46094.36/100062.0
/46094.36/01.01000/46094.36/01.01000
/10001000
/10001000
/10001000
/10001000
arg,
gm ettstock 27.100arg, =
gggm ettwater 73.89927.1001000arg, =−=
DFM actually uses no correction for buoyancy for the production of the hydrochloric acid. Thus these masses are also the target masses in air.
The realised weighing results for the IPQ-DFM bilateral comparison run were (both as masses in air):
mstock, target = 100.30 g
mwater, target = 899.71 g
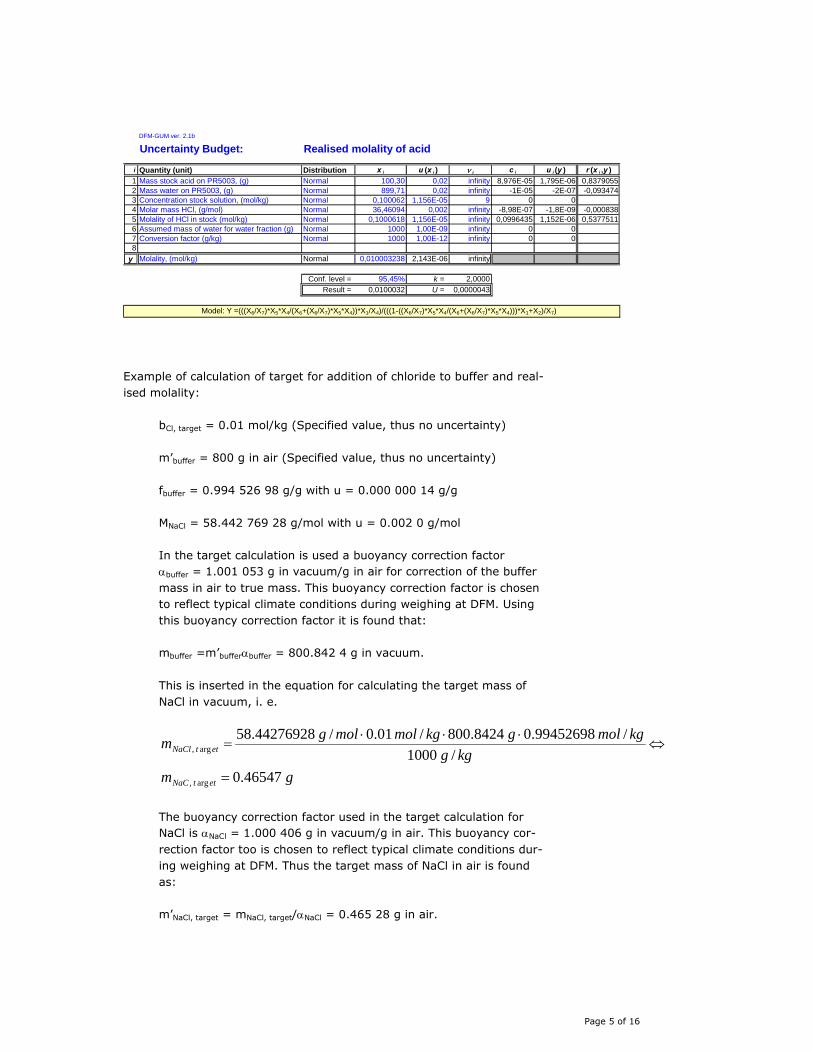
These are inserted into an uncertainty spreadsheet. The calculation and result is seen from the picture below. Both the assumed mass of water for calculating the water fraction and the conversion factor between g and kg must be given an uncertainty for the calculation to work. Very small uncertainties are assigned to these quantities, to make the contribution to the uncertainty of the molality insignifi-cant.
Page 5 of 16
DFM-GUM ver. 2.1b
Uncertainty Budget: Realised molality of acid
i Quantity (unit) Distribution x i u (x i ) ν i c i u i (y ) r (x i ,y )1 Mass stock acid on PR5003, (g) Normal 100,30 0,02 infinity 8,976E-05 1,795E-06 0,83790552 Mass water on PR5003, (g) Normal 899,71 0,02 infinity -1E-05 -2E-07 -0,0934743 Concentration stock solution, (mol/kg) Normal 0,100062 1,156E-05 9 0 04 Molar mass HCl, (g/mol) Normal 36,46094 0,002 infinity -8,98E-07 -1,8E-09 -0,0008385 Molality of HCl in stock (mol/kg) Normal 0,1000618 1,156E-05 infinity 0,0996435 1,152E-06 0,53775116 Assumed mass of water for water fraction (g) Normal 1000 1,00E-09 infinity 0 07 Conversion factor (g/kg) Normal 1000 1,00E-12 infinity 0 08
y Molality, (mol/kg) Normal 0,010003238 2,143E-06 infinity
Conf. level = 95,45% k = 2,0000Result = 0,0100032 U = 0,0000043
Model: Y =(((X6/X7)*X5*X4/(X6+(X6/X7)*X5*X4))*X1/X4)/(((1-((X6/X7)*X5*X4/(X6+(X6/X7)*X5*X4)))*X1+X2)/X7)
Example of calculation of target for addition of chloride to buffer and real-ised molality:
bCl, target = 0.01 mol/kg (Specified value, thus no uncertainty)
m’buffer = 800 g in air (Specified value, thus no uncertainty)
fbuffer = 0.994 526 98 g/g with u = 0.000 000 14 g/g
MNaCl = 58.442 769 28 g/mol with u = 0.002 0 g/mol
In the target calculation is used a buoyancy correction factor αbuffer = 1.001 053 g in vacuum/g in air for correction of the buffer mass in air to true mass. This buoyancy correction factor is chosen to reflect typical climate conditions during weighing at DFM. Using this buoyancy correction factor it is found that:
mbuffer =m’bufferαbuffer = 800.842 4 g in vacuum.
This is inserted in the equation for calculating the target mass of NaCl in vacuum, i. e.
The buoyancy correction factor used in the target calculation for NaCl is αNaCl = 1.000 406 g in vacuum/g in air. This buoyancy cor-rection factor too is chosen to reflect typical climate conditions dur-ing weighing at DFM. Thus the target mass of NaCl in air is found as:
m’NaCl, target = mNaCl, target/αNaCl = 0.465 28 g in air.
Page 6 of 16
The realised weighing results for the IPQ-DFM bilateral comparison run were:
m’buffer = 799.98 g in air
m’NaCl = 0.465 29 g in air
For the conversion of realised masses in air to true masses are used buoyancy correction factors based on the climate conditions at the time of the weighing. For the IPQ-DFM bilateral comparison the buoyancy correction factors are:
αbuffer = 1.001 031 g in vacuum/g in air
αNaCl = 1.000 397 g in vacuum/g in air
The corresponding masses in vacuum are then found to be:
mbuffer = 800.804 8 g in vacuum
mNaCl = 0.465 48 g in vacuum
These values are inserted into an uncertainty spreadsheet. The cal-culation and result is seen from the picture below. The conversion factor between g and kg must be given an uncertainty for the calcu-lation to work. A very small uncertainty is assigned to this quantity, to make the contribution to the uncertainty of the molality insignifi-cant.
DFM-GUM ver. 2.1b
Uncertainty Budget: Realised molality of chloride for nominal value 0.01 mol/kg
i Quantity (unit) Distribution x i u (x i ) ν i c i u i (y ) r (x i ,y )1 Mass of NaCl (g) Normal 0,46548 0,00020 infinity 0,0214845 4,297E-06 0,9951742 Mass of buffer (g) Normal 800,8048 0,020 infinity -1,25E-05 -2,5E-07 -0,0578453 Water fraction buffer Normal 0,994526979 1,434E-07 infinity -0,010056 -1,44E-09 -0,0003344 Molar mass NaCl (g/mol) Normal 58,44276928 0,0020 infinity -0,000171 -3,42E-07 -0,0792625 Conversion factor (g/kg) Normal 1000 1,00E-09 infinity 1E-05 1E-14 2,316E-096
y Molality of NaCl (mol/kg) Normal 0,010000514 4,318E-06 infinity
Conf. level = 95,45% k = 2,0000Result = 0,0100005 U = 0,0000086
Model: Y =(X1/X4)/((X2*X3)/X5)
1.2 Electrodes
Silver oxide is prepared by mixing a solution of analytical grade silver ni-trate with a solution of analytical grade sodium hydroxide. The molarity of the silver nitrate solution is ~0.98 mol/L and the sodium hydroxide solu-tion has molarity ~1 mol/L. The resulting precipitate is washed repeatedly in deionised water until the conductivity of the water after washing is con-
Page 7 of 16
stant and below 30 µS/cm. The precipitate is then filtered using vacuum, and the silver oxide stored for minimum one month prior to use. The silver oxide is stored humid and in darkness.
The silver/silver chloride electrodes are prepared by a paste of the silver oxide prepared above and deionised water being deposited onto a plati-num helix. The silver oxide is thermally decomposed to silver. When a suf-ficient amount of silver (100 mg - 250 mg) has been deposited, about 20% of the silver is converted to silver chloride by electrolytic oxidation in 0.1 mol/L hydrochloric acid. The silver/silver chloride electrodes are then stored in hydrochloric acid with molality 0.005 mol/kg for at least one month before use. The silver/silver chloride electrodes used by DFM for the IPQ-DFM bilateral comparison were prepared between 2008-01-02 and 2008-01-10 both dates included. The electrodes were first used for measurements in March 2008.
Prior to every experiment the electrodes are checked for consistency of the set. Starting two days before the measurements are started the elec-trodes are placed in deionised water for between 1 hour and 3 hours, then in argon bubbled sodium chloride with molality 0.01 mol/kg for at least 24 hours. The potential of each electrode against a silver/silver chloride electrode of a different batch is then measured in this solution. The elec-trodes are only used if the difference between highest and lowest potential does not exceed 40 µV. The electrodes are left in the sodium chloride so-lution over night. Before mounting in the cells, the electrodes again are placed in deionised water for between 1 hour and 3 hours. Just before mounting, they are dabbed gently with filter paper to remove adhering water.
DFM regenerates the platinum hydrogen electrodes prior to every primary pH experiment. Two days before starting the measurements the platinum hydrogen electrodes are cleaned by boiling in 6 mol/L nitric acid, rinsed three times in deionised water and boiled in deionised water. Then the electrodes are annealed until redglowing by heating in a pure methanol flame. The electrodes are then electrolytically cleaned in 0.1 mol/L nitric acid, first as anode for 1 minute, then as cathode for 4 minutes. After this a fresh layer of platinum black is electrodeposited onto the electrodes. The electrodes are left in deionised water over night. The next day the elec-trodes are placed in a hydrogen bubbled hydrochloric acid with molality 0.01 mol/kg for at least 3 hours. One electrode is chosen as reference and the potentials of the others measured against this. If the difference be-tween highest and lowest potential exceeds 40 µV, the electrodes are not used. After measuring the potentials the electrodes are left in deionised water over night. Before inserting the electrodes in the Harned cells, they are dabbed gently with filter paper to remove adhering water.
Page 8 of 16
1.3 Cells and hydrogen flow
The cell is shown in the picture below. The total volume of the cell is ~100 mL of which the humidifier part is ~60 mL. The flowrate of hydrogen in each cell is not really known, but is 4 mL/min to 8 mL/min.
1.4 Experimental procedure
Twelve cells are used for the experiment. They are placed in a 150 L water bath used for temperature control of the cells. The cells are divided into four groups of three cells each. The groups are hydrochloric acid with mo-lality 0.01 mol/kg, buffer with sodium chloride molality ~0.005 mol/kg,
Page 9 of 16
buffer with sodium chloride molality ~0.010 mol/kg and buffer with so-dium chloride molality ~0.015 mol/kg.
The twelve cells are connected to a vacuum pump and an argon source. The cells are evacuated to a pressure low than 10 mbar. Then argon is applied to get atmospheric pressure in the cells. This is repeated three times totally. Then the cells are opened towards the atmosphere and ar-gon is flushed through the cells at about 5 mbar overpressure for 10 min-utes. Then the cells are closed, and each cell filled with the appropriate measurement solution which is forced into the cell by an overpressure of argon. The hydrogen flow in each cell is started as soon as the cell is filled. Filling all the cells takes between 90 minutes and 120 minutes.
During filling, the temperature control is not applied. The set-up is placed in a room with the room temperature controlled to be 23 °C ± 0.5 °C. The experiment is started at 25 °C and it takes typically around 2 hours to achieve a temperature close to 25 °C in the water bath and thus in the cells. Then the temperature setpoint often has to be adjusted to achieve an operating temperature that is 25 °C ± 0.005 °C. This may take up to 2 hours more. Between completion of the filling and achieving the correct operating temperature the hydrogen flow in each cell is adjusted to an appropriate flow.
Measurements start automatically when the temperature is within 0.2 °C of the nominal temperature. A round of measurements consists in meas-uring the temperature three times, then the twelve potentials, then the atmospheric pressure and finally temperature another three times. The six temperature measurements are averaged, and the potentials and pressure are assigned to have been measured at the average temperature. One round of measurements is done every 30 minutes.
The stability criteria are described below, but typically it takes 5 hours - 6 hours from completion of the filling before stability is achieved. When changing the temperature during the experiment, there is a time lapse of 2 hours to 4 hours during which no measurements are done. This is the time it takes to heat or cool to the new temperature. Measurements start automatically when the temperature is within 0.2 °C of the nominal tem-perature. From the time where measurements start, it usually takes be-tween 30 minutes and 2 hours to achieve stability at the new temperature including adjustment of the temperature setpoint to achieve an operating temperature that is within ± 5 mK of the nominal temperature.
Once sufficient data has been collected at 25 °C, the nominal temperature is changed to 37 °C and data are collected at this temperature. When suf-ficient data are acquired at 37 °, the temperature is changed to 15 °C and measurements done at this temperature. Finally, the temperature is changed back to 25 °C to check that no changes in buffer properties have occurred during the experiment.
Page 10 of 16
1.5 Potential selection and stability criteria
A time interval of minimum 4 hours is used for the calculation of the acid-ity function at zero chloride molality. This time interval is chosen to be the same for each of the four groups of cells. This time interval is chosen so, that each group of cells fulfil the criteria given below and the measured temperature is stable within ±2 mK in the time interval. The time interval is chosen to be as long as possible. The time interval may start at any time after the start of the experiment, where the stability criteria are met, and will end if the stability criteria are no longer met. In practice, less than twelve cells might be used, as some cells might not fulfil the criteria and are thus left out of the calculation.
The measured potentials are considered stable if the potential changes by no more than ±10 µV/h for each cell. Single points may deviate more than this, but this is an exception. During the time interval used the potentials in the three cells with hydrochloric acid measured at nominally the same time are not allowed to differ more from each other than 60 µV. For cells containing buffer with the same molality of sodium chloride the potentials measured at nominally the same time are not allowed to differ more from each other than 100 µV.
The measurement software automatically corrects the measured voltage for calibration error of the digital voltmeter used for the measurements and for the hydrogen pressure. The partial pressure of hydrogen is calcu-lated from the measured atmospheric pressure and the measured average temperature using an equation for the vapour pressure of water as a func-tion of temperature. The vapour pressure of water is subtracted from the atmospheric pressure and the result of this is taken as the partial pressure of hydrogen.
Examples of curves of potential as a function of time during the time when the potentials are considered stable are shown below. The temperature in both cases is 25ºC. The first curve is the hydrochloric acid cells and the second is buffer with ~0,010 m chloride. The potentials used in the calcu-lation of the pH value are the intercept of linear regressions of the poten-tial of a cell as a function of time. The potentials are referred to the time when stability is achieved. The linear fits are also shown on the figures below.
The uncertainty of each potential is found by combining two contributions. The first contribution, which is by far the smallest, is the uncertainty of the intercept of the regressions. The second contribution is the uncertainty associated with the allowed scatter between the cells within a group. For the hydrochloric acid cells the standard uncertainty of this second contri-bution is equal to 60 µV divided by two times the squareroot of 3, that is
VVuscatter µµ 17)32/(60 == . For the buffer cells one finds analogously
DFM has employed a new scheme of calculating uncertainty based on a method and software developed by Lars Nielsen, DFMa.
The scheme takes as its input the vector of the directly observed (that is measured or otherwise estimated) quantities {z} with the covariance ma-trix {{Σ}}. A model is set up based on:
1) the ‘true value’ of the directly observed quantities {ζ}, which have been estimated by {z}
2) parameters with no prior information {β}
3) physical or mathematical constraints between the parameters {f(ζ, β)=0}.
The direct observables {ζ} and the parameters {β} are then found using Lagrange multipliers {λ} by minimising the quantity Θ, given by
( ) ( ) ( ) ),(2;,, 1 ζβλζζλζβ fzzz TT +−Σ−=Θ −
The uncertainties of the directly observed quantities {z} are propagated via the minimised quantity Θ, thus the uncertainties and correlation coef-ficients of ζ and β are found directly from the calculation.
The example values given below are for carbonate buffer and have noth-ing to do with the measurements done for the bilateral comparison be-tween DFM and IPQ.
For calculating uncertainty of a complete primary pH experiment, we have the following 49 directly observed quantities, the z-vector, which are es-timates of the corresponding ‘true values’ in the ζ-vector. The standard uncertainties of the z-quantities are shown (the correlations among the balance parameters are used, but not shown).
a L. Nielsen, “Least-squares estimation using Lagrange multipliers”, Metrologia 35
(1998), 115–118. Erratum, Metrologia 37 (2000), 183. Implemented in the software package
LongtermStabilityAT201 z29 1 7,5E-07 1 LongtermStabilityPR5003 z30 1 4,0E-06 1 Constants GasConstant z31 8,314472 0,000015 J/(mol K) StandardPressure z32 101325 0,1 Pa FaradayConstant z33 96485,3383 0,0083 C/mol Potentials PotentialHCl1 z34 0,4643078 1,70E-05 V referred to start PotentialHCl2 z35 0,4643084 1,70E-05 V PotentialHCl3 z36 0,4642843 1,70E-05 V PotentialLowCl1 z37 0,9562611 2,90E-05 V PotentialLowCl2 z38 0,9562573 2,90E-05 V PotentialLowCl3 z39 0,9561499 1,00E+02 V PotentialMedCl1 z40 0,9379536 1,00E+02 V PotentialMedCl2 z41 0,9379927 1,00E+02 V PotentialMedCl3 z42 0,9380784 2,90E-05 V PotentialHighCl1 z43 0,9273226 2,90E-05 V PotentialHighCl2 z44 0,9273425 2,90E-05 V PotentialHighCl3 z45 0,9273234 2,90E-05 V DVM DVMError z46 0 8,00E-06 1 Environment AveragePressure z47 101325 10 Pa AverageTemperature z48 25,0048 0,005 oC Activity ActivityCoefficientHCl z49 0,90426 0,0001 1
Cells that are excluded, have uncertainty u = 100 V. This will cause them to have negligible weight in the adjustment of ζ and β.
Page 14 of 16
We identify 21 quantities with no prior information (i. e. which we want to determine), the β-vector, here shown with the result from the mathemati-cal solution:
Quantity group Quantity name βi x u(x) Unit Buoyancy corrections AirDensity β1 1,1798764 0,0025432 kg/m3
The quantities are constrained by a set of 30 functional constraints de-scribing the relations among the parameters, put in a form of f(ζ, β)=0. The purpose of the functions is to ensure the propagation of uncertainties from the measured quantities. One advantage of this form is the possibil-ity to use multivariate and implicit expressions. The following illustrates how the constraints are set up.
Air density: The ‘unknown quantity’ β1 is the air density, which is ‘con-strained’ by the BIPM standard formula with the laboratory environmental parameters temperature, humidity, etc., ζ1 through ζ5 by
( ) 0,,,,: 1543211 =− βζζζζζρairf
Buoyancy correction: There are four buoyancy correction factors, β2 through β5, for HCl, NaCl, water and solution, again handled as ‘unknown quantities’. Each is constrained to substance density and air density by a relation, e.g. here given for HCl:
01/8000
1: 26
112 =−⎟⎟
⎠
⎞⎜⎜⎝
⎛−⎟
⎠⎞
⎜⎝⎛ − β
ζββf
Molalities: Four molalities are used, given by the parameters β6 through
β9. The starting point for the constraint function is the indication on the balance of the aliquot of buffer solution and NaCl, e.g. for the buffer with low chloride addition, ζ11 and ζ12. The measurement capability of the bal-
Page 15 of 16
ance is taken into account by using a scale factor and a second order cor-rection of the indication, determined from calibration, a long term stability factor and the buoyancy correction factor, hence a relation similar to
E.g. the true mass of the weighed low chloride expanded becomes
( ) 32
11251124112329 1 βζζζζζζζ ++=truem
This expression is incorporated into the molality constraint that, again for low chloride addition, using the molar mass for NaCl and the water frac-tion of the buffer becomes:
0: 610,17
,6 =− β
ζζ buffertrue
NaCltrue
mm
f
Similar equations apply for the other chloride molalities and for the acid molality.
The measured potentials in the HCl cells are used to determine an average potentiala, which is introduced as parameter β10. The constraint functions are:
0: 1036...3412...10 =− βζf
The nine acidity function values are β11 through β19. The cell potentials (ζ37 through ζ45) are quantities estimated from the measurement, while natural constants (e.g. the Faraday constant, ζ33) are taken from tables and literature. The constraint functions have the form (here for low chlo-ride, cell 1)
( )( )( ) 0logloglog2
10ln15.2731
: 1147
3221
64994831
3346103713 =−++−
++−
βζζ
βζβζζ
ζζβζf
The linear regression is parameterised through slope and intercept as pa-rameters β20 and β21. Constraint functions then relate the acidity function values β11 through β19 to the linear fit using the relevant chloride molality (β6 through β8):
0: 19...11218/7/62030...22 =−+ ββββf
The example given here has the acidity function intercept at zero chloride molality, β21, as the final result of calculation.
a The standard potential of the silver/silver chloride electrode is not calculated as part of the calculation of the pH value. Instead the term involving the mean activity of HCl is included in the equation for the acidity function.
Page 16 of 16
Usually the pH value is the final result of the calculation. In that case the scheme is expanded with the ionic strength of the buffer and the two ‘con-stants’ of the Bates-Guggenheim convention as directly observed quanti-ties, with the logarithm of the chloride ion activity coefficient at zero chlo-ride molality and the pH as quantities with no prior information and finally with two constraint functions tied to the logarithm of the chloride ion activity coefficient at zero chloride molality and the pH.
The minimisation of the quantity Θ is (usually) done iteratively and a solution yields not only adjusted values (solutions) to ζ and β, but also uncertainties and the complete covariance or correlation matrix, and allows for a chi-square test of the overall consistency of the model. Consistency is rejected, if the chi-square probability is less than 5 %. If a solution requires that, say ζ37 must be adjusted more than twice the uncertainty of the measured value z37, then one should look closer at the uncertainty estimate of this quantity. A plot of the normalized deviations (ζ – z)/u(ζ – z) give an overview of possible problematic quantities.
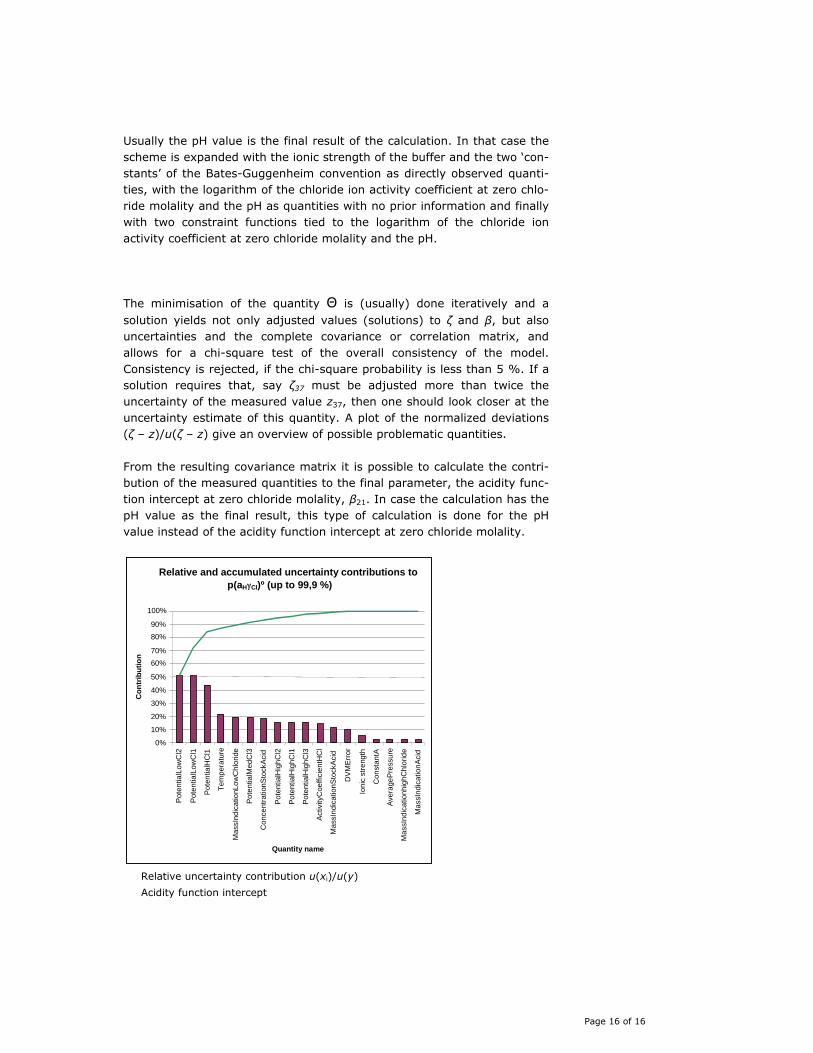
From the resulting covariance matrix it is possible to calculate the contri-bution of the measured quantities to the final parameter, the acidity func-tion intercept at zero chloride molality, β21. In case the calculation has the pH value as the final result, this type of calculation is done for the pH value instead of the acidity function intercept at zero chloride molality.
Relative and accumulated uncertainty contributions to
p(aHγCl)º (up to 99,9 %)
0% 10% 20% 30% 40% 50% 60% 70% 80% 90%
100%
Pote
ntia
lLow
Cl2
Pote
ntia
lLow
Cl1
Pot
entia
lHC
l1
Tem
pera
ture
Mas
sInd
icat
ionL
owC
hlor
ide
Pote
ntia
lMed
Cl3
Con
cent
ratio
nSto
ckAc
id
Pote
ntia
lHig
hCl2
Pote
ntia
lHig
hCl1
Pote
ntia
lHig
hCl3
Activ
ityC
oeffi
cien
tHC
l M
assI
ndic
atio
nSto
ckA
cid
DVM
Erro
r Io
nic
stre
ngth
Con
stan
tA
Aver
ageP
ress
ure
Mas
sInd
icat
ionh
ighC
hlor
ide
Mas
sInd
icat
ionA
cid
Quantity name
Con
trib
utio
n
Relative uncertainty contribution u(xi)/u(y)
Acidity function intercept
Page 32 of 44
The report of IPQ is given on the following 12 pages.
Table 1. Standard uncertainty of the standard potential of the Ag׀AgCl electrodes (Eº) from measurements in hydrochloric acid (mHCl = 0,01 mol kg-1) at 15 ºC.
Quantity Estimate
xi Standard
uncertainty u(xi)
Sensitivity coefficient
׀ic׀
Uncertainty contribution
ui(Eº)
Uncertainty contributionui(Eº) / %
E / V
T / K
mHCl / mol kg-1
2HP / Pa ∆E BIAS / V
0,463444
288,18
0,01
1,018×105
2,4×10⁻⁵
4,1×10⁻⁵
5×10⁻³
4,7×10⁻⁶
3
1,1×10⁻⁵
1
8,2×10⁻⁴
5,10
7,5×10⁻⁸
1
4,1×10⁻⁵
4,3×10⁻⁶
2,4×10⁻⁵
2,3×10⁻⁷
1,1×10⁻⁵
50,8
5,3
29,7
0,3
14,0
uc(Eº) = 4,9×10⁻⁵ V Eº = (0,22839 ± 0,00010) V
Table 2. Standard uncertainty of the acidity function (p(aHγCl)) at 15 ºC.
Table 3. Standard uncertainty in the standard potential of the Ag׀AgCl electrodes (Eº) from measurements in hydrochloric acid (mHCl = 0,01 mol kg-1) at 25 ºC.
Quantity Estimate
xi Standard
uncertainty u(xi)
Sensitivity coefficient
׀ic׀
Uncertainty contribution
ui(Eº)
Uncertainty contributionui(Eº) / %
E / V
T / K
mHCl / mol kg-1
2HP / Pa ∆E BIAS / V
0,465343
298,14
0,01
1,019×105
1,7×10⁻⁵
6,8×10⁻⁵
5×10⁻³
4,7×10⁻⁶
3
1,5×10⁻⁵
1
8,2×10⁻⁴
5,28
7,5×10⁻⁸
1
6,8×10⁻⁵
3,9×10⁻⁶
2,5×10⁻⁵
2,3×10⁻⁷
1,5×10⁻⁵
60,8
3,5
22,4
0,2
13,1
uc(Eº) = 7,4×10⁻⁵ V Eº = (0,22227 ± 0,00015) V
Table 4. Standard uncertainty of the acidity function (p(aHγCl)) at 25 ºC.
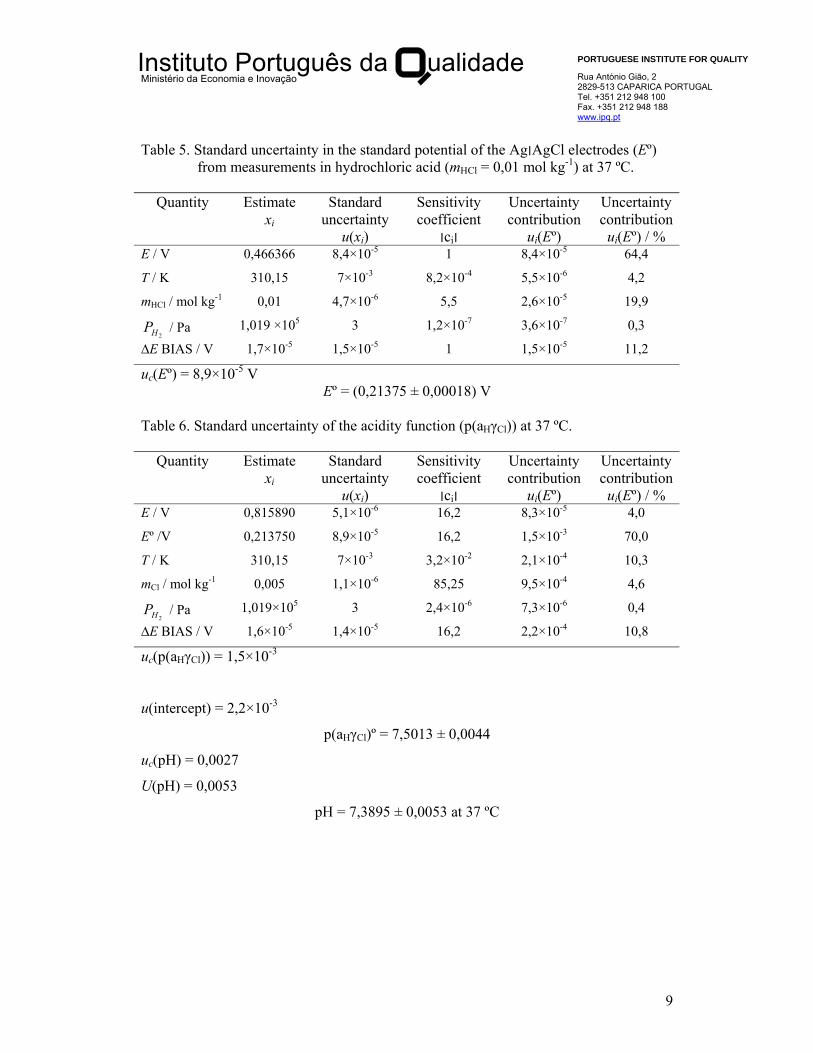
Table 5. Standard uncertainty in the standard potential of the Ag׀AgCl electrodes (Eº) from measurements in hydrochloric acid (mHCl = 0,01 mol kg-1) at 37 ºC.
Quantity Estimate
xi Standard
uncertainty u(xi)
Sensitivity coefficient
׀ic׀
Uncertainty contribution
ui(Eº)
Uncertainty contributionui(Eº) / %
E / V
T / K
mHCl / mol kg-1
2HP / Pa ∆E BIAS / V
0,466366
310,15
0,01
1,019 ×105
1,7×10⁻⁵
8,4×10⁻⁵
7×10⁻³
4,7×10⁻⁶
3
1,5×10⁻⁵
1
8,2×10⁻⁴
5,5
1,2×10⁻⁷
1
8,4×10⁻⁵
5,5×10⁻⁶
2,6×10⁻⁵
3,6×10⁻⁷
1,5×10⁻⁵
64,4
4,2
19,9
0,3
11,2
uc(Eº) = 8,9×10⁻⁵ V Eº = (0,21375 ± 0,00018) V
Table 6. Standard uncertainty of the acidity function (p(aHγCl)) at 37 ºC.