A REPORT ON “To find out a methodology of ranking Debt Mutual Fund Schemes that can be adopted by ITC Limited to invest its surplus cash”. By Ankit Dhanuka O r ga n i z a tion RUSSELL CREDIT LIMITED
Transcript
A REPORT
ON
“To find out a methodology of ranking Debt Mutual Fund Schemes that
can be adopted by ITC Limited to invest its surplus cash”.
By
Ankit Dhanuka
O r ga n i z a tion
RUSSELL CREDIT LIMITED
(WHOLLY OWNED SUBSIDIARY OF ITC LTD)
VIRGINIA HOUSE
37 J L NEHRU ROAD
KOLKATA-700071
PROJECT COMPLETION CERTIFICATE
ACKNOWLEDGEMENT
Success is not a destination but a journey- it is often said. I realized it even better during my Internship program. When I completed this journey, I may not have come this far without help, guidance and support of certain people who acted as guide, friend and torchbearers along the way.
Words often fail to express one's inner feeling of gratitude and indebtedness to one' s benefactor but then it is only readily available medium through which the undersigned can express his sincere thanks to all those who are associated with his work in one way or the other.
I take this opportunity to express my sincere gratitude to Mr. Jagdish Singh, (Head- Corporate Treasury, ITC Limited) who provided me this great opportunity to work in the Corporate Treasury of ITC Limited and gave me such a challenging project.
I feel it my profound privilege to express my most sincere gratitude and indebtedness to my mentor, Mr. Bishnu Agrawal, (Assistant Manager, Corporate Treasury, ITC Ltd) who has been instrumental in providing me direction, constant encouragement and cooperation in an attempt to take this project to a logical conclusion.
I would also like to thank Mr. Suresh Kumar, (Front Office Manager, Corporate Treasury, ITC Ltd), Mr. Abhishek Kumar, (Back Office Manager, Corporate Treasury, ITC Ltd) & Ms. Aanchal Dhawan, (Assistant Manager, Corporate Treasury, ITC Ltd) for their constant help and co-operation.
Apart from the people at ITC, I would like to thank Mr. Sandipan Ray, Institutional Sales, Principal Mutual Fund and Mr. Vijay Kumar, Business Development Manager, CRISIL for their help, co-operation and invaluable time.
I wish to thank my Faculty Mentor Prof. Subir Srimani for his constant support and encouragement.
Last but not the least; I would like to thank my fellow trainees at ITC, for making my stay at ITC a memorable one.
My 12 weeks at ITC Ltd have been a great learning experience. Apart from knowledge enrichment, it has provided value addition in terms of corporate culture and corporate conduct.
- Ankit Dhanuka
TABLE OF CONTENTS1. Company Profile 1-12
1.1 Brief History 1
1.2 ITC's Core Values 2
1.3 Corporate Strategy of ITC 3
1.4 Major Business Divisions 3-10
1.5 Porter's Five Forces Model 10-12
1.6 BCG Matrix (Industry Analysis) 12
2. Abstract 13-14
3. Introduction 15-18
3.1 Objectives 15
3.2 Methodology & Limitations 16
3.3 Gtnews Survey 17
3.4 Ernst & Young Survey 18
4. Main Text 19-84
4.1 Stage 1
4.1.1 ABC of Mutual Funds
20-46
20-36
4.1.1.1 Types 21-34
4.1.1.2 Advantages Of Investing in MF 35
4.1.1.3 Disadvantages Of Investing in MF 36
4.1.2 Investment alternatives for Surplus Cash 36-44
4.1.3 Risk-Return Matrix 44
4.1.4 Comparison of MF with other instruments 44-46
4.2 Stage 2 47-56
4.2.1 CRISIL-CPR 47-50
4.2.2 ICRA-Methodology 50-53
4.2.3 Value Research Fund Rating 53-55
4.2.4 Asset Management Companies 56
4.3 Stage 3 57-58
4.4 Stage 4 59-71
4.4.1 Why Ranking only for Liquid & Liquid Plus 60-61
4.4.2 Selection of AMC 62
4.4.3 Ranking Methodology 63-66
4.4.3.1 Corpus Size 63
4.4.3.2 Investment in AAA 64
4.4.3.3 Investment in GOI securities 64
4.4.3.4 Average Maturity 64-65
4.4.3.5 Point To Point Returns 65-66
4.4.4 Ratio for Performance Evaluation 66-71
4.4.4.1 Alpha Ratio 66-67
4.4.4.2 Information Ratio 67-68
4.4.4.3 Sharpe Ratio 68-69
4.4.4.4 Sortino Ratio 69-70
4.5 Stage 5
4.4.4.5 Treynor Ratio 70-71
72-84
4.5.1 Steps Involved in Final Analysis 72-73
4.5.2 Final Analysis 73-80
4.5.3 Comparison 80-81
5. Findings 82
6. Conclusion 83
7. Recommendations 84
8. References 85-86
Page 1
1. COMPANY PROFILE
ITC is one of India's foremost private sector companies with a market capitalisation of
FMCG-Cigarettes: ITC is the market leader in cigarettes in India. With its wide range of
invaluable brands, it has a leadership position in every segment of the market. It's highly
popular portfolio of brands includes Insignia, India Kings, Classic, Gold Flake, Silk Cut,
Navy Cut, Scissors, Capstan, Berkeley, Bristol and Flake.
FMCG-Foods: ITC made its entry into the branded & packaged Foods business in
August 2001 with the launch of the Kitchens of India brand. A more broad-based entry
has been made since June 2002 with brand launches in the Confectionery, Staples and
Snack Foods segments.
The Foods business is today represented in 4 categories in the market. These are:
Ready To Eat FoodsStaplesConfectionerySnack Foods
FMCG-Lifestyle Retailing: ITC‘s Lifestyle Retailing Business Division has established
a nationwide retailing presence through its Wills Lifestyle chain of exclusive specialty
stores. Wills Lifestyle, the fashion destination, offers a tempting choice of Wills Classic
work wear, Wills Sport relaxed wear, Wills Clublife evening wear, fashion accessories
and Essenza Di Wills – an exclusive range of fine fragrances and bath & body careproducts and Fiama Di Wills - a range of premium shampoos and shower gels. Wills
Lifestyle has also introduced Wills Signature designer wear, designed by the leading
designers of the country.
With a distinctive presence across segments at the premium end, ITC has also established
John Players as a brand that offers a complete fashion wardrobe to the male youth of
today. The recent launch of Miss Players with its range of trendy fashion wear for young
women has been a successful addition to the youthful offering. With its brands, ITC is
committed to build a dominant presence in the apparel market through a robust portfolio
of offerings.
FMCG-Personal Care: In line with ITC's aspiration to be India's premier FMCG
company, recognised for its world-class quality and enduring consumer trust, ITC
forayed into the Personal Care business in July 2005. In the short period since its entry,
ITC has already launched an array of brands, each of which offers a unique and superior
value proposition to discerning consumers. Anchored on extensive consumer research
and product development, ITC's personal care portfolio brings world-class products with
clearly differentiated benefits to quality-seeking consumers.
ITC's Personal Care portfolio under the 'Essenza Di Wills', 'Fiama Di Wills', 'Vivel Di
Wills' 'Vivel UltraPro', 'Vivel' and 'Superia' brands has received encouraging consumer
response and is being progressively extended nationally.
FMCG-Education & Stationery: ITC made its entry into the stationery business in the
year 2002 with its premium range of notebooks, followed in the year 2003 with the more
popular range to augment its offering.
Today, ITC continues to blend its core capabilities to market a growing range of
education and stationery products. These capabilities include,
1. Manufacturer of India‘s first Ozone treated environment friendly Elemental
Chlorine Free (ECF) pulp, paper and paperboard.
2. Knowledge of image processing, printing & conversion garnered from its
Packaging & Printing Business.
3. Brand Building & Trade Marketing & Distribution strengths resident in its FMCG
Business.
ITC‘s stationary Brands are marketed as ―Classmate and ―Paperkraft, with Classmate
addressing the needs of students and Paperkraft targeted towards college students and
executives.
FMCG-Safety Matches: As part of its strategic initiative to create multiple drivers of
growth in the FMCG sector, ITC commenced marketing safety matches sourced from the
small-scale sector. The Matches business leverages the core strengths of ITC in
.
Page 5
marketing and distribution, brand building, supply chain management and paperboard &
packaging to offer Indian consumers high quality safety matches.
ITC‘s range of Safety matches includes popular brands like i Kno, Mangaldeep, Aim, Aim
Mega and Aim Metro. With differentiated product features and innovative value
additions, these brands effectively address the needs of different consumer segments. The
Aim brand is the largest selling brand of Safety Matches in India. ITC also exports
regular and premium safety matches brands to markets such as Middle East, Africa and
the USA. The successful acquisition of Wimco Limited by Russell Credit Limited, a
wholly owned subsidiary of ITC has consolidated the market standing of the Company's
Matches business through synergy benefits derived through combined portfolio of
offerings, improved servicing of proximal markets and freight optimization. Through its
participation, ITC aims to enhance the competitiveness of the small and medium scale
sectors through its complementary R&D based product development and marketing
strengths, especially the breadth and depth of the Company's trade marketing and
distribution.
FMCG-Agarbattis: As part of ITC's business strategy of creating multiple drivers of
growth in the FMCG sector, the Company commenced marketing Agarbattis (incense
sticks) sourced from small-scale and cottage units in 2003. This business leverages the
core strengths of ITC in nation-wide distribution and marketing, brand building, supply
chain management, manufacture of high quality paperboards and the creation of
innovative packaging solutions to offer Indian consumers high quality Agarbattis. With
its participation in the business, ITC aims to enhance the competitiveness of the small
and medium scale sectors through its complementary R&D based product development
and strengths in trade marketing and distribution.
Mangaldeep Agarbattis are available in a wide range of fragrances like Rose, Jasmine,
Bouquet, Sandalwood, Madhur, Durbar, Tarangini, Anushri, Ananth and Mogra.
Page 6
B. HOTELS
ITC entered the hotels business in 1975 with the acquisition of a hotel in Chennai, which
was then rechristened ITC Chola. Since then the ITC-Welcomgroup brand has become
synonymous with Indian hospitality. With over 100 hotels in more than 75 destinations,
ITC-Welcomgroup has set new standards of excellence in the hotel industry in
Accommodation, Cuisine, Environment and Guest Safety. ITC's Hotels business is one of
India's finest and fastest growing hospitality chains. ITC Hotels' commitment to
delivering globally benchmarked services, embedded in a culture deeply rooted in India's
rich tradition of hospitality, gives it a unique and distinct identity.
C. Paperboards Paper & Packaging
Paperboards & Speciality Paper Division: ITC‘s Paperboards and Specialty Papers Division is India‘s largest and most technologically advanced paper and paperboards business. ITC caters to a wide spectrum of packaging, graphic, communication, writing,
printing and specialty paper requirements through its four world-class mills in India.
Having pioneered many speciality applications like cigarette tissues, packaging boards,
aseptic cartons and gypsum liners, ITC‘s Paperboards and Specialty papers businessenjoys market leadership in the value-added paperboards segment, and also has a
significant share of the Indian paperboards market. It is also the largest Indian exporter of
coated boards.
Page 7
The product range includes:
Packaging & Printing: ITC's Packaging & Printing Business is the country's largest
convertor of paperboard into packaging. It converts over 50,000 tonnes of paper and
paperboard per annum into a variety of value-added packaging solutions for the food &
beverage, personal products, cigarette, liquor, cellular phone and IT packaging industries.
It has also entered the Flexibles and Corrugated Cartons business.
The Division, which was set up in 1925 as a strategic backward integration for ITC's
Cigarettes business, is today India's most sophisticated packaging house. State-of-the-art
technology, world-class quality and a highly skilled and dedicated team have combined
to position ITC as the first-choice supplier of high value added packaging.
Page 8
D. Agri Business
Agri Commodities & Rural Services: ITC's pre-eminent position as one of India's
leading corporates in the agricultural sector is based on strong and enduring farmer
partnerships, that has revolutionized and transformed the rural agricultural sector. A
unique rural digital infrastructure network, coupled with deep understanding of
agricultural practices and intensive research, has built a competitive and efficient supply
chain that creates and delivers immense value across the agricultural value chain. One of
the largest exporters of agri products from the country, ITC sources the finest of Indian
5. Processed Fruits - Fruit Purees/Concentrates, IQF/Frozen Fruits, Organic Fruit
Products, Fresh Fruits
6. Coffee & Spices - Coffee, Black Pepper, Chilly, Turmeric, Ginger, Celery and
other Seed Spices
Cigarette Leaf Tobacco: ITC pioneered the cultivation and development of Leaf
Tobaccos in India. Nearly a century of creating customer delight ensures that
globally, ITC's Leaf Tobacco business is synonymous with being "The One Stop Shop
for Quality Indian Tobaccos". The Leaf Tobacco business' partnership with the farmer is
also almost
100 years old. In a spirit that truly embodies the Company's "commitment beyond the
market", ITC has helped the Indian farmer grow quality leaf tobaccos and linked him to
global markets.
Page 9
ITC is the largest buyer, processor and exporter of leaf tobaccos in India - creating a
global benchmark as the single largest integrated source of quality tobaccos. Serving
customers in 50 countries across more than 70 destinations, ITC co-creates and delivers
value at every stage of the leaf tobacco value chain.
1.5. Porters Five Forces Model –ITC Limited
ITC is diversified in its businesses and this makes an overall analysis with regard to its
individual business units highly complex. The company‘s diversified status originates
from its corporate strategy aimed at creating multiple drivers of growth, anchored on its
time-tested core competencies:
1. Unmatched distribution reach
2. Superior brand-building capabilities
3. Effective supply chain management
4. Acknowledged service skills in hotel business.
Over the years, ITC has diversified its business risk by diversifying its product categories
into multi-businesses, which are different in nature, yet, draws from competencies of
existing businesses to fructify into a strategic business unit. E.g., matches business draws
strength from the distribution and branding competencies of the tobacco business and has
already taken over more than 40% of the branded matches segment in the country.
Its businesses are spread over a wide spectrum, ranging from FMCG to hotels, packaging,
paper and paperboards and international commodities trading. Each of these businesses is
vastly different from the other in its type, the state of its evolution and the basic nature of
its activity, all of which influence the choice of the form of governance. The challenge of
governance for ITC therefore lies in fashioning a model that addresses the uniqueness of
each of its businesses and yet strengthens the unity of purpose of the company as a
whole.
Page 10
ITC’s Five Forces Model
A comprehensive analysis for ITC is difficult owing to its diversified presence in several
sectors of the industry. An attempt is being made to provide a brief overview of the same.
1. ITC has an immensely strong presence in all the sectors it caters to. A large-
scale business like that of ITC is hard to compete with. ITC has carved a niche
in the market in all the segments that it is present in. It is far ahead of its age-
old competitors as well as potential entrants owing to its focus on value
creation for the consumer through significant investments in product design,
innovation, manufacturing technology, quality, marketing and distribution.
2. With such a powerful presence in its business sectors, it is threatened by
substitutes, however, to a much lesser extent as compared to businesses with a
similar profile. Some SBUs of ITC are faced with stiff competition owing to
their late entry in to the same
3. Bargaining power of buyers is moderate, in fact, low as far as most of the
businesses of ITC are concerned. This is primarily owing to the fact that ITC
believes in unadulterated quality and strives to achieve the same in all its
endeavors
4. Bargaining power of suppliers is low due to the overpowering presence of ITC
as far as all the divisions are concerned. Long-term relationships with
suppliers are beneficial for the company as well as the suppliers. Suppliers
abide by ITC‘s terms, again owing to the trust and quality that ITC stands for
and look forward to longer contracts leading to the establishment of standard
sources of supply
5. Rivalry among the existing players within all the sectors in the industry is
strong. Well-established and big companies desire to get bigger and the
smaller, growing companies desire to reach the performance levels
of the leading players in the market. ITC has been consistently
outperforming its competitors in some of the sectors where it has
had a long presence. It has several close competitors in certain other
segments and it has yet to reach the benchmark levels in other
segments where it is a relatively new player in the Markets
Page 11
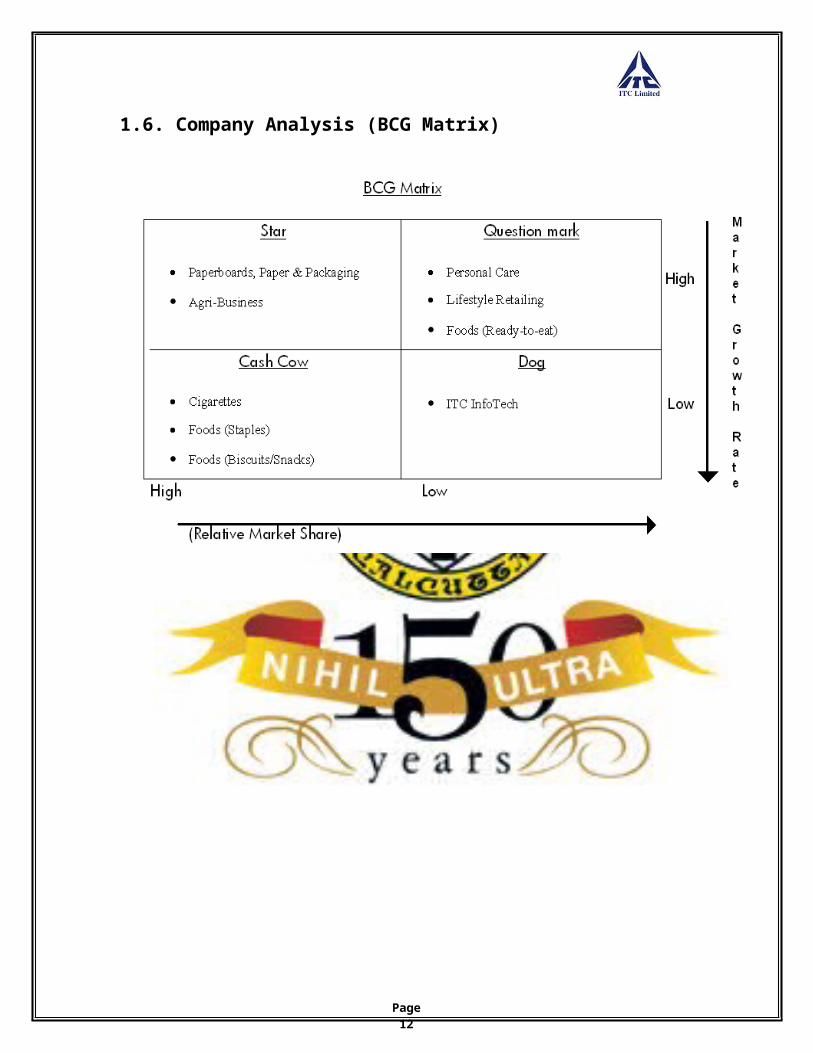
1.6. Company Analysis (BCG Matrix)
Page 12
2. ABSTRACT
The role of the Treasury as a strategic business unit has become more pronounced as
Indian corporate stride confidently towards newer geographic to expand their global
footprints. The role of the Treasury in India has evolved from pure fund management to
cover strategic hedging, risk management and more recently fund raising and balance
sheet management.
The Indian Corporate Treasury has evolved over a period of time. The focus is now
pivoted around centralization of activities and enhancing efficiencies through better
negotiation with banks and capitalization of opportunities presented through
liberalization.
Corporate Treasury was earlier expected to display efficiency through banking
negotiations and the execution of sacrosanct strategies. Today, their role has become
more holistic and involves more decision-making and strategy development as compared
to overall risk philosophy of companies. As competencies develop and the focus shifts to
superior performance delivery, Indian treasuries are likely to evolve into ―Strategic
Business units‖ focused on adding value to other business units.
The main objective of this project is to study the debt schemes of various Asset
Management Companies (AMCs) under Liquid & Liquid Plus or Ultra Short Term
(Treasury Advantage) categories and then suggest a methodology that can be used by
ITC Limited for deployment of surplus cash. The project also covers the overview of
Mutual Fund Industry and parameters involved in selecting the right scheme under the
said category.
In ITC Limited, the deployment of temporary liquidity of the company is guided by the
twin objective – ―Capital Protection & Return Optimization‖. The investments are mainly
made in Liquid, Treasury Plus, Floating Rate, Fixed Maturity Plans, Short Term
Funds and Income Schemes of Debt Mutual Funds.
Page 13
The project is completed in five stages. The main focus & activity of each stage is given
below –
Page 14
3. INTRODUCTION
The main objective of the project is to study the methodology used in the mutual fund
industry to Rank debt schemes of various Asset Management Companies (AMCs) under
Liquid & Ultra Short Term (Treasury Advantage) categories and then suggest a
methodology, which can be used by ITC Limited for deployment of surplus cash. This
project report is primarily an insight in to the area of investment management, as a part,
of the Treasury operations that are carried out in ITC Limited.
It involves a thorough and in-depth understanding of the importance of investment
decisions for corporate houses, the investment process, the various criteria for making the
process more effective and the relevance of those criteria depending on the varied
investment objectives. It also involves a deep understanding of the financial markets in
terms of the several classifications within them as well as a detailed insight into the
various investment alternatives that are available to the corporate houses.
The project also discusses the concept of mutual funds in great detail, including their
types, as well as the several benefits associated with them. It also provides an overview
of the various classifications of mutual funds and the criteria for selecting the appropriate
investment opportunity.
3.1 Objectives of the Project:
To understand the Mutual Fund Industry and the factors affecting it.
To understand the Ranking Methodology used in the Industry.
To critically examine the Ranking Methodology used by the Industry. This is to
identify the pros and cons of the ranking methodology that would help in
developing a new methodology of ranking mutual fund schemes.
To suggest a ranking methodology to ITC Limited that would also meet its twin
objective of Capital Protection & Return Optimization.
Page 15
3.2 Methodology:
Visit Mutual Fund houses to understand:
o Various Categories of Debt Mutual Fund Schemes
o The perspective of various Mutual Fund Schemes on the Mutual Funds
industry as a whole
o The sensitivity of various Mutual Fund Schemes to the market conditions.
o The methodology of Portfolio Creation.
Refer Textbooks, Research Papers, Fact Sheets of Mutual Funds, presentations
available within the organization and Internet for secondary data and latest
happenings in Mutual Fund industry.
Study the ranking methodology used by the Industry and critically analyzing it.
Discuss ideas with the managers of Corporate Treasury and identifying crucial
areas within ranking of mutual fund schemes.
3.2 Limitations of the study:
Comparison with peers is not possible as the investment methodology of parking
temporary cash is not publicly available.
As Kolkata is the marketing hub for mutual fund houses and financial decisions
are taken at their head offices in Mumbai, discussion with fund managers about
their mode of portfolio selection could not be feasible.
Since the company invests only in Debt Mutual Funds, the methodology for
Equity Mutual Funds was not done as would not meet the objective of the
Company.
The study would be limited to Liquid, Ultra Short Term Schemes as these are
most suited for Cash Management. Also, all other categories of Debt Mutual
Funds are very sensitive to interest rates movements and investments in these
schemes are based on the existing market conditions.
Page 16
Methods of collecting data:
The NAVs of the mutual Fund schemes were obtained from AMFI website
(www.amfiindia.com).
The data related to debt market were obtained from FIMMDA website
(w w w. f i m mda. c o m ) & databases such as Prowess and Bloomberg.
The portfolio and the average maturity of the debt mutual fund schemes were
provided on a weekly basis by CRISIL.
Surveys – GTnews and Ernst & Young survey:
The main objective of the project was Surplus Cash Management and hence Internet was
referred to obtain the trend in the corporate world. The two surveys, which are
summarized here, show the pattern in India as well as in the Western World.
3.3. Gtnews.com is the home for treasurers around the world for key speeches and
information. The survey presented here was conducted between March & April 2008 in
association with SEB. The corporate that participated in the survey where mostly from
Europe & America.
The key findings of this survey was –
60% (last year 63%) of the corporate use bank deposits to allocate their surplus
cash.
52% (last year 51%) of the corporate use money market mutual funds to allocate
their surplus cash.
(* Source: htt p:/ /www.gt news.com/ feature/287.c f m )
Page 17
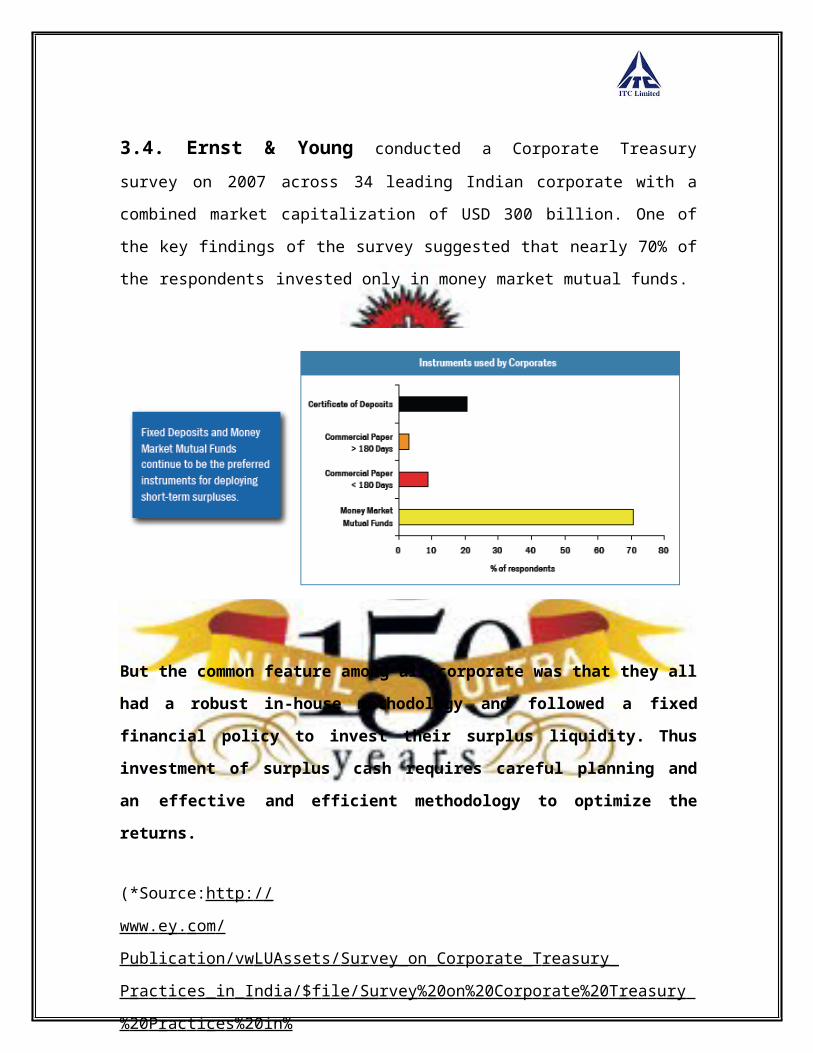
3.4. Ernst & Young conducted a Corporate Treasury survey on 2007 across 34
leading Indian corporate with a combined market capitalization of USD 300 billion. One
of the key findings of the survey suggested that nearly 70% of the respondents invested
only in money market mutual funds.
But the common feature among all corporate was that they all had a robust in-house
methodology and followed a fixed financial policy to invest their surplus liquidity.
Thus investment of surplus cash requires careful planning and an effective and
efficient methodology to optimize the returns.
(*Source:ht t p: / /ww w . e y . c om /P ubl i ca t i on/v w L U A ssets/ S u r v e y _on_Co r po r a te_T r e a su r y _
P r a c t i ce s_in _ I ndia/$ f i l e / S u r v e y % 20on % 20Corp o r a te % 20 T r e a s u r y % 20 P ra c t i ce s%20in%
20 India.p df)
Page 18
4. MAIN TEXT
As already mentioned, this project focuses on the Surplus Cash Management of Treasury
Operations at ITC Limited. The project focuses on the debt schemes of Mutual Funds
under Liquid & Liquid Plus (or Ultra Short Term) category. ITC Ltd invest its Surplus
Cash in the following instruments –
1. Debt schemes of Mutual Funds.
2. Fixed Maturity Plans of Mutual Funds.
3. Bank Fixed Deposits.
4. Tax Free Bonds.
The main objective of the project is to understand the Mutual Funds industry and come
out with a Ranking Methodology to invest in Liquid & Liquid plus category, as this is the
only category where a pre-defined ranking methodology can be set. Moreover interest
rate movements least affect these schemes.
Thus keeping the objective in mind, the whole project was divided into five stages –
Page 19
4.1 Stage 1
In this stage of the project, I have understood the Mutual Fund Industry and its various
products. I am really indebted to managers of Corporate Treasury who spared their
invaluable time to explain the practical aspects of the theoretical concepts.
The following is my understanding of concepts involved in Mutual Funds & the industry
as a whole –
4.1.1. ABC of Mutual Funds
A mutual fund represents a vehicle for collective investment. It pools money from
investors, with a promise that professional managers who are expected to honor the
promise would invest the money in a particular manner. On participating in a mutual fund
scheme, investors become part owners of the investments held under that scheme.
The idea behind a mutual fund is that investors lack the time or the inclination or the
skills to manage their investments. Professional managers, acting on behalf of the mutual
fund, manage the investments for the benefit of investors, in return for a management fee.
The organization that manages the investment is the Asset Management Company
(AMC). Individuals within the AMC who perform this role of managing investments are
the fund managers. Each mutual fund unit represents an investor's proportionate
ownership of the fund's holdings and the income those holdings generate.
Investors have their individual
preferences on how they would
like their money to be invested
and how much risk they would
be willing to take. Professional
managers can choose to
manage each individual
investor‘s money as per the
Page 20
investor‘s preferences. Such personal treatment is referred to as Portfolio
Management
Scheme (PMS) in India. This scheme is economically feasible only for investment
portfolios above a particular value. The breakeven asset size, which depends on the cost
structure of the manager, is rarely below Rs.10, 00,000. The Asset Under Management
(As On 31.03.2009) shows that bulk of investment is in income fund, which is a preferred
investment destination for corporate to park their surplus cash.
The main characteristics of Mutual Funds can be shown as –
4.1.1.1. Types of Schemes
MF schemes can be offered with any of a range of investment objectives, each
corresponding to a certain point in the risk-return matrix. In a broad sense, they can be
classified on the basis of –
Tenor Asset Class Position Philosophy Geography
Page 21
Classification on Time Basis
a. Open-End Schemes - These are schemes that do not have a fixed maturity. The
MF ensures liquidity by announcing sale and repurchase price for the units of an
open-end scheme on an ongoing basis. Investors who wish to exit from an open-
end scheme can offer their units to the MF for redemption, generally called
repurchase. Similarly, the MF can sell new units to investors desirous of
participating in the scheme, generally called sale. Every such transaction goes to
change the unit capital of the scheme.
Additionally, the MF can choose to provide liquidity through listing of the
scheme in the stock market. In such a scenario, investors can either trade in the
market or opt for the sale and repurchase route.
Open mutual funds generally do not deploy in illiquid investments, as they are
liable to redeem the investors‘ money at a very short notice. Also, the average
maturity of the portfolio of an open mutual fund is also very low which makes it
easy for the fund to liquidate its assets at a very short notice without any
appreciable losses.
b. Closed-End Schemes - A closed mutual fund, as the name suggests, has
restrictions on the minimum holding period and the investor is required to pay a
penalty in the form of load if he wants to redeem his investment without fulfilling
the minimum holding period criteria. As a closed mutual fund invests in securities
which are susceptible to market risk, entry / exit in securities is planned by the
fund manager based on the minimum time period committed by the investor.
Since a fund may suffer losses if the investor redeems his investment prematurely,
there is a need to put restrictions on free entry / exit by investors in the scheme.
Page 22
Generally, such funds offer better returns than open-ended funds as they can
deploy in relatively risky instruments and also in instruments, which have higher
average maturity and enjoy the steepness of the yield curve. Occasionally,
closed-end schemes provide a repurchase option to investors, either for a specified
period or after a specified period, normally up to a total limit for all investors
together, or a limit per investor.
Classification on Asset Class Basis
a. Equity Schemes – Equity schemes invest primarily in equities. While mutual
funds most often invest in the stock market, fund managers do not just buy any
old stock they find attractive. Some funds specialize in investing in large-cap
stocks; others in small-cap stocks, and still others invest in what has left - mid-cap
stocks. Equity schemes invest the bulk of their corpus in equity shares or equity
linked instruments and the balance in cash.
Depending on the scheme objective, investments could be in growth stocks where
earnings growth is expected to be attractive, or momentum stocks that go up or
down in line with the market, or value stocks where the fund manager is of the
view that current valuations in the market do not reflect intrinsic value, or income
stocks that earn high returns through dividends.
b. Debt/Income Schemes – Debt instruments invest in debt instruments, i.e., bonds
and cash. They are of the following types:
1. Gilt Schemes – A gilt scheme or a government securities scheme invests
only in government bonds, which may typically account for 80-85 percent
of the corpus, and cash that may account for the balance. Gilt schemes
may be dedicated to gilts of varying maturities – long-term, medium-term
and short-term.
Page 23
2. Bond Schemes - These securities invest in bond securities issued by the
Government or any other issuer.
3. Junk Bond Schemes – These invest in securities that are below the
investment grade. However, attractive returns in such poor quality
investments would more than make up for the higher risk of losing the
entire investment in some cases.
4. Money Market/Liquid Schemes – These schemes invest in short term
debt instruments. Money market funds have relatively low risks, compared
to other mutual funds (and most other investments). By law, they can
invest in only certain high-quality, short-term investments.
Money market funds pay dividends that generally reflect short-term
interest rates, and historically the returns for money market funds have
been lower than for either bond or stock funds. That's why "inflation risks"
— the risk that inflation will outpace and erode investment returns over
time — can be a potential concern for investors in money market funds.
5. Balanced Schemes - Balanced schemes invest in a mix of equity and debt.
The debt instruments ensure a basic interest income, which the fund
manager hopes to top up with capital gains on the investment portfolio.
However, losses can eat into the basic interest income and capital.
The greatest benefit of a balanced investment program is that it makes risk
more palatable. An allocation to bonds moderates the short-term volatility
of stocks, giving the risk-averse long-term investor the confidence to
sustain a heavy allocation to equities.
Page 24
Classification on Position Philosophy Basis
a. Sector Funds – Regular equity funds invest in a mix of equities that are spread across
different sectors. Thus they are often referred to as Diversified Equity Funds. Sector
funds, on the other hand, are expected to invest only in a specific sector. For instance, an
energy fund would only invest in energy companies.
b. Index Funds – These funds seek to have a position that replicates an identified index,
BSE Sensex or NSE Nifty. Such a position can be created using either of the two
methods given below.
Maintaining an investment portfolio that replicates the composition of
a chosen index can do it. Thus, the stocks in such a fund‘s portfolio
would be the same as are used in calculating the index. The proportion
of each stock in the portfolio too would be the same as the weight of
the stock in the calculation of that index. This replicating style of
investment is called ‗passive investment‘. Index funds are thus oftencalled passive funds. Funds that are not passive are managed funds.
Index schemes are also referred to as unmanaged schemes or tracker
schemes since they seek to track a specific index. Passive investment
places lower demands on the time and efforts of the AMC. All that is
required is a good system that would integrate the valuation of
securities from the market and information of sales and repurchases of
units as well as generate the requisite buy/sell orders. Thus,
management fees are lower for index funds as compared to managed
schemes.
Alternately, a mutual fund, through its research can identify a basket
of securities and/or derivatives whose movement is similar to that of
the index. Schemes that invest in such baskets can be viewed as active
index funds.
Page 25
seeks to beat the performance of its benchmark index by at least 0.1 percent, but no more
than 2 percent.
d. Exchange Traded Funds – These are open-end funds that can be traded on the
exchange at any time throughout the course of the day. Like index funds, they are
benchmarked to a stock exchange index. Though, the legal structure and makeup vary
around the world, the major common features include:
An exchange listing and ability to trade continually.
They are index-linked rather than actively managed.
Through dynamic and quantitative strategies, these can be dynamic
rather than static indexing strategies.
The ability to handle contributions and redemptions on an in-kind
basis (typically in large blocks of shares only).
Their 'value' (but not necessarily the price at which they trade—they
can trade at a 'premium' or 'discount' to the 'underlying' assets' value)
derives from the value of the 'underlying' assets comprising the fund.
These qualities provide ETFs with some significant advantages compared with traditional
open-ended collective investments. The ETF structure allows for a diversified, low cost,
low turnover index investment. This appeals to both institutional and retail investors both
for long-term holding and for selling short and hedging strategies
e. Fixed Maturity Plans/Serial Schemes – Investors in debt securities get their expected
yield if they hold fixed coupon debt securities until maturity. But, if they sell their
securities earlier, then what they recover would depend on the market situation at the
time of sale. They could end up with either a capital gain or a capital loss.
Fixed maturity plans (FMPs) seek to eliminate the risk of such capital loss by investing
exclusively in a pre-specified debt security. On maturity, the scheme would redeem the
security and pay the investor. The investor, however, can exit earlier. But the investor‘srecovery would depend on the market situation at the time of his/her exit. Thus, investors
Page 26
are assured of a fixed return, if they stay invested in the scheme for the period originally
envisaged. They also have an earlier exit option, in case they invest in an FMP that is
structured as an open-ended scheme.
When a series of FMPs are issued for different maturities, they are called Serial Funds.
These can choose to invest exclusively in government securities, in which case they
become Serial Gilts. Alternatively, they can invest in non-government securities, in
which case they become Serial Bond Schemes.
f. Hedge/Leveraged Funds - A hedge fund is a fund that can take both long and short
positions, use arbitrage, buy and sell undervalued securities, trade options or bonds, and
invest in almost any opportunity in any market where it foresees impressive gains at
reduced risk. Hedge fund strategies vary enormously -- many hedge against downturns in
the markets -- especially important today with volatility and anticipation of corrections in
overheated stock markets. The primary aim of most hedge funds is to reduce volatility
and risk while attempting to preserve capital and deliver positive returns under all market
conditions.
Key Characteristics of Hedge Funds
Hedge funds utilize a variety of financial instruments to reduce risk, enhance
returns and minimize the correlation with equity and bond markets. Many hedge
funds are flexible in their investment options (can use short selling, leverage,
derivatives such as puts, calls, options, futures, etc.).
Hedge funds vary enormously in terms of investment returns, volatility and risk.
Many, but not all, hedge fund strategies tend to hedge against downturns in the
markets being traded.
Many hedge funds have the ability to deliver non-market correlated returns.
Many hedge funds have as an objective consistency of returns and
capital preservation rather than magnitude of returns.
Page 27
Experienced investment professionals who are generally disciplined and
diligent manage most hedge funds.
Pension funds, endowments, insurance companies, private banks and high net
worth individuals and families invest in hedge funds to minimize overall portfolio
volatility and enhance returns.
Most hedge fund managers are highly specialized and trade only within their area
of expertise and competitive advantage.
Hedge funds benefit by heavily weighting hedge fund managers‘ remuneration
towards performance incentives, thus attracting the best brains in the investment
business. In addition, hedge fund managers usually have their own money
invested in their fund.
While the name hedge funds‘ gives a psychological comfort of a fund being on low risk,
the truth is very different from it. Hedge funds are leveraged funds where the fund
manager invests a mix of funds belonging to its investors (unit capital and reserves) and
funds from lenders (borrowed funds). A leveraging of 2 would imply that for every Re.1
of unit capital, an additional Rs.2 is borrowed, thus investing Rs.3 in the market.
Borrowed funds have interest and repayment obligations that are independent of how the
market performs. Thus, in adverse market conditions, a non-leveraged fund only needs to
bear a loss. However, a leveraged fund would also need to generate additional resources
to meet the interest and repayment obligations on borrowed funds. Thus, hedge funds are
extremely risky funds, the level of risk being a function of the extent of leveraging.
a. Option Income Fund – This refers to a type of mutual fund, which attempts to
increase current income through continual option writing. There are two
implications for an option writer:
If the stock of a company rises above the price, the investor would
exercise his/her option in which case the option writer would lose out on
the opportunity of gaining from that appreciation (opportunity loss
Page 28
If the option writer operates on a fully hedged basis, then he/she will retain
the shares of the company in the portfolio, so that they can be offered if
the investor exercises his/her option. During the period that the option
writer holds the share, the dividend would belong to him/her (holding
income).
Classification on Geography Basis
a. Country/Region Funds – These funds invest in securities from a specific country or
region. The underlying belief is that the chosen country or region is expected to
demonstrate superior performance, which in turn, would be favorable for the securities of
that country. The returns on country funds are affected not only by the performance of the
market where they are invested but also by the changes in exchange rates.
b. Offshore Funds – These funds mobilize moneys from investors for investment outside
the country.
Classification on Investment Objective Basisa. Aggressive Growth Funds – This means that investors will be buying into stocks that
have a chance for dramatic growth and may gain value rapidly. This type of investing
carries a high element of risk with it since stocks with dramatic price appreciation
potential often lose value quickly during downturns in the economy. It is a great option
for investors who do not need their money within the next 5 years, but have a more long-
term perspective. This option should not be chosen if capital conservation is being looked
at. Instead, it should be chosen when one could afford to potentially lose the value of
one‘s investment.
b. Growth Funds – As with aggressive growth, growth seeks to achieve high returns.
However, the portfolios will consist of large, medium and small sized companies. The
fund portfolio chooses to invest in stable, well established, blue-chip companies together
with a small portion in small and new businesses. The fund manager would pick growth
stocks, which will use their profits to grow rather than to pay out dividends. It is a
Page 29
medium to long-term commitment. However, they are perhaps more beneficial in the
long-term.
c. Growth and Income Funds – A combination of growth and income funds, also
known as balanced funds, is that which has a mix of goals. They seek to provide investors
with current income while still offering the potential for growth. Some funds buy stocks
and bonds so that the portfolio will generate income whilst still keeping ahead of
inflation. They are able to achieve multiple objectives desirable to the investors. They
have a low to moderate stability along with a moderate potential for current income and
growth.
d. Income Funds – These funds will generally invest in a number of fixed income
securities. This will provide investors with regular income. The fund manager would
choose to buy debentures, company fixed deposits, etc. in order to provide investors with
a steady income. Despite being a stable option, it has some risk components. As interest
rates go up or down, the prices of income fund shares, particularly bonds, move in the
opposite direction. This makes income funds, interest rate sensitive.
e. Money Market Mutual Fund – The most cautious investor should opt for this type,
which aims at maintaining capital preservation. This indicates that gains would not be an
option even though the interest rates given on these funds could be higher than that of
bank deposits. These funds pose very little risk but at the same time would not protect the
investors‘ initial investments‘ buying power. They are highly liquid enabling investors to
alter their investment strategies.
Since the whole project revolves around Liquid & Liquid Plus schemes, this two schemes
require more explanation.
Liquid & Liquid Plus or Ultra Short Term (or Treasury Advantage)
Liquid Fund: Liquid funds are used primarily as an alternative to short-term fix deposits.
Liquid funds invest with minimal risk (like money market funds). Most funds have a
Page 30
lock-in period of a maximum of three days to protect against procedural (primarily
banking) glitches, and offer redemption proceeds within 24 hours.
Liquid funds score over short term fix deposits. Banks give a fixed rate in the range 5%-
5.5% p.a. for a term of 15-30 days. Returns from deposits are taxable depending on the
tax bracket of the investor, which considerably pulls down the actual return. Dividends
from liquid funds are tax-free in the hands of investor, which is why they are more
attractive than deposits.
Liquid Plus or Ultra Short Term (or Treasury Advantage): The Mutual Fund industry
has created an Income Scheme, where lower Dividend Distribution Tax (DDT) is
applicable called Liquid Plus Scheme. These schemes are positioned between the liquid
scheme and the Short Term Income scheme with respect to the risk return matrix. The
focus of these schemes is to optimize portfolio yield through a judicious mix of short
duration and MTM assets. Average portfolio maturity of these schemes is around 6 to 12
months. They maintain MTM portion at around 5-10%.
The differences between this two schemes are-
1. Investment tenure
This is the major differentiating factor between liquid and Ultra Short Term funds. The
debt instruments held by Ultra Short Term funds have a longer tenure than liquid funds
i.e. the portfolios of Ultra Short Term funds have a higher average maturity than those of
liquid funds. In effect, while investors can invest in liquid funds for as briefly as one day,
the holding period for Ultra Short Term funds should be higher than that.
2. Exit load
Both liquid and Ultra Short Term funds can be redeemed within a day. However, if Ultra
Short Term funds are redeemed within a specified period, there can be an exit load (the
minimum investment tenure and the exit load varies across fund houses). On the other
hand, there is no exit load on liquid funds.
Page 31
Page 32
In order to generate higher yields, some of these Ultra Short Term Schemes have exit
loads ranging from 0.05% - 0.25% and a lock-in period of 5-15 days. This is to
discourage investors having 1-5 day’s surplus from entering these schemes that may
impact the overall returns.
3. Dividend distribution tax
Ultra Short Term funds are more tax efficient than liquid funds. In terms of tax
implications, a dividend distribution tax of 28.3250% is charged on liquid funds, whereas
it‘s 22.6600% for Ultra Short Term funds.
4. Risk
Ultra Short Term funds are riskier vis-a -vis liquid funds. This is mainly due to two
reasons a) Ultra Short Term funds hold investments that have a higher maturity and b)
there is no limit on the mark-to-market (MTM) component of Ultra Short Term funds as
opposed to a maximum of 10% MTM limit on liquid funds.
Since Ultra Short Term Schemes take exposure in longer maturity papers, they carry an
additional amount of risk while generating higher returns. However, since the proportion
of MTM element is generally in between 10-15% in the entire portfolio, there shall not be
any major impact on the returns and are expected to deliver returns at least equal to that
of Liquid Schemes on a consistent basis.
Holiday NAV
Traditional Liquid Schemes have the concept of previous day NAV, which implies that
the funds get invested on a day before actual investment letter along-with fund transfer
advice is given to Mutual Fund AMC. Hence funds can be deployed on the basis of actual
surplus in the banks on a particular day.
However, Ultra Short Term Schemes have same day NAV that implies that investments
made on any business day before the normal cut-off timings shall get NAV of the
Page 33
investment date and the actual outflow of funds will take place on the next working day.
Also, there is no Holiday NAV for these schemes. In this case the funds needs to be
deployed based upon the estimated surplus collections for next day by means of a cheque,
which shall be banked on the next working day. Further, the funds may be switched from
Liquid/Short Term Floater Schemes for deployment in Ultra Short Term Schemes.
Additionally, the days on which Ultra Short Term Schemes don‘t declare NAV (i.e.
Holiday NAV), the surplus collection for those days be first deployed in Liquid/Short
Term Floater Schemes and subsequently switched to Ultra Short Term Schemes.
The concept of Holiday NAV is very important in Liquid Funds. It basically provides a
corporate house dividend for two non working days, Saturdays & Sundays, even if the
redemption is done on Friday. This facility is not available in Ultra Short Term Funds.
The whole concept is summarized below –
Liquid FundsUltra ShortTerm Funds
Redemption Day Friday FridayPayout Day Monday MondayNAV Applicable Sunday FridayDividend forSaturday & Sunday
Yes No
Page 34
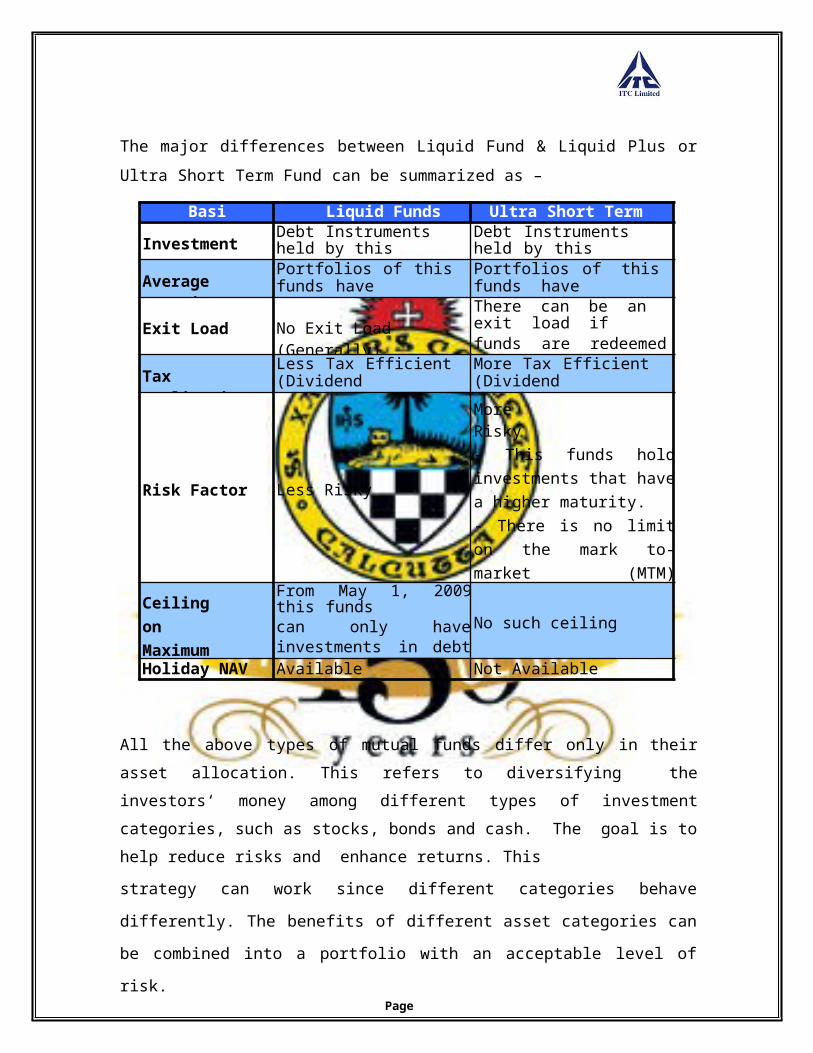
The major differences between Liquid Fund & Liquid Plus or Ultra Short Term Fund can
be summarized as –
Basis Liquid Funds Ultra Short Term Funds
Investment TenureDebt Instruments held by thisfunds have shorter tenure
Debt Instruments held by thisfunds have Longer tenure
Average MaturityPortfolios of this funds havelower average maturity
Portfolios of this funds havehigher average maturity
Exit Load No Exit Load (Generally)There can be an exit load iffunds are redeemed within a specified time (Generally)
Tax ImplicationsLess Tax Efficient (DividendDistribution Tax of 28.325%)
More Tax Efficient (DividendDistribution Tax of 22.66%)
Risk Factor Less Risky
More Risky- This funds hold investments that have a higher maturity.- There is no limit on the mark to-market (MTM) component of liquid plus funds as opposed to the 10% MTM limit on liquid funds.
Ceiling on Maximum maturity
From May 1, 2009 this fundscan only have investments in debt instruments of three months tenure
No such ceiling
Holiday NAV Available Not Available
All the above types of mutual funds differ only in their asset allocation. This refers to
diversifying the investors‘ money among different types of investment categories, such as
stocks, bonds and cash. The goal is to help reduce risks and enhance returns. This
strategy can work since different categories behave differently. The benefits of different
asset categories can be combined into a portfolio with an acceptable level of risk.
Page 35
4.1.1.2. Advantages
1. Portfolio Diversification: Mutual Funds leads to diversification of risks. As
corporate can choose schemes based on the risk appetite. When the market is
volatile Mutual Funds gives huge options to investors. There are index funds,
which capture the return of entire index. There are also sector-based schemes,
which invest, only in that particular sector like banking sector, FMCG etc.
2. Professional management: Qualified investment professionals who seek to
maximize returns and minimize risk monitor investor's money. It is the Fund
Manager's job to (a) find the best securities for the fund, given the fund's stated
investment objectives; and (b) keep track of investments and changes in market
conditions and adjust the mix of the portfolio, as and when required.
3. Reduction in transaction costs: It reduces the overall transaction fee for the
corporate. As they normally invest in liquid funds for their daily cash
management, there are many investments, redemptions and sweep into other
schemes from the existing one on a daily basis. If the investments are done
directly on the underlying security there will be huge costs involved and hence
less returns.
4. Liquidity: Normally corporate investors invest in open-ended schemes with no
lock in period. Investments are mainly done keeping in mind their working capital
needs. Thus normally those schemes are chosen which are liquid and on
redemptions can sell their underlying securities easily.
5. Tax Benefits: Corporate investors choose the mutual fund route to invest their
surplus cash because it is tax efficient. The tax rate on Liquid schemes is 28.325%
and on Liquid Plus it is 22.66%. Thus in both the cases it is less than the 33.33%,
which is corporate tax rate for profits earned.
4.1.1.3. Disadvantages
1. No control over costs: A corporate investor pays less expense compared to retail
investors. But the rate remains same how ever large the investment is. Fund
managers charge a hefty fee for his professional management and that is not
dependent on the kind of returns, which the scheme is generating.
2. No tailor made portfolios: The schemes which are there in the market cannot be
customized based on the risk appetite of the corporate. A corporate might invest
in a scheme, which has a high percentage of AA papers in the portfolio to increase
their return whereas another corporate might not invest in those schemes
considering them volatile and hence risky.
3. No say on the management: A corporate investor has no say on the management
of mutual fund schemes even if he owns the maximum permissible 20% of the
asset under management.
4.1.2. Investment Alternatives for Surplus Cash
When corporate invests their temporary cash, the main emphasis lies on
Capital preservation &
Return optimization.
Keeping these two factors in mind the major alternatives could be –
Bank fixed deposits
Corporate fixed deposits
Corporate bonds
Mutual Funds
Equity
Real Estate
Bullion
Financial Derivatives
Page 36
Bank fixed deposits: It is a money deposit at a banking institution that normally cannot
be withdrawn before a certain "term" or period of time. When the term is over it can be
withdrawn or it can be held for another term. Generally speaking, the longer the term the
better the yield on the money. A certificate of deposit is a time-deposit product.
These deposits are stringently regulated and banks operate under stricter requirements
regarding Stuatory Liquidity Ratio (SLR) & Cash reserve Ratio (CRR).
Bank Deposits up to Rs 1,00,000 are protected by the Deposit Insurance and Credit
Guarantee Corporation (DICGC), as long as bank has paid the requisite insurance
premium of 5 paise per annum for every Rs 100 of deposits.
The factors to consider while investing in Bank Fixed Deposits are –
Prevailing Interest rate and hence CRR.
Inflation
Tax Rate.
Currently the interest rates for a 15 day Fixed Deposit hovers between 3.00-3.50% per
annum and for a 30-45 days Fixed Deposit, it ranges between 4-5%.
The tenure for which a company parks its surplus cash primarily depends upon the
working capital requirements and the prevailing interest rate scenario.
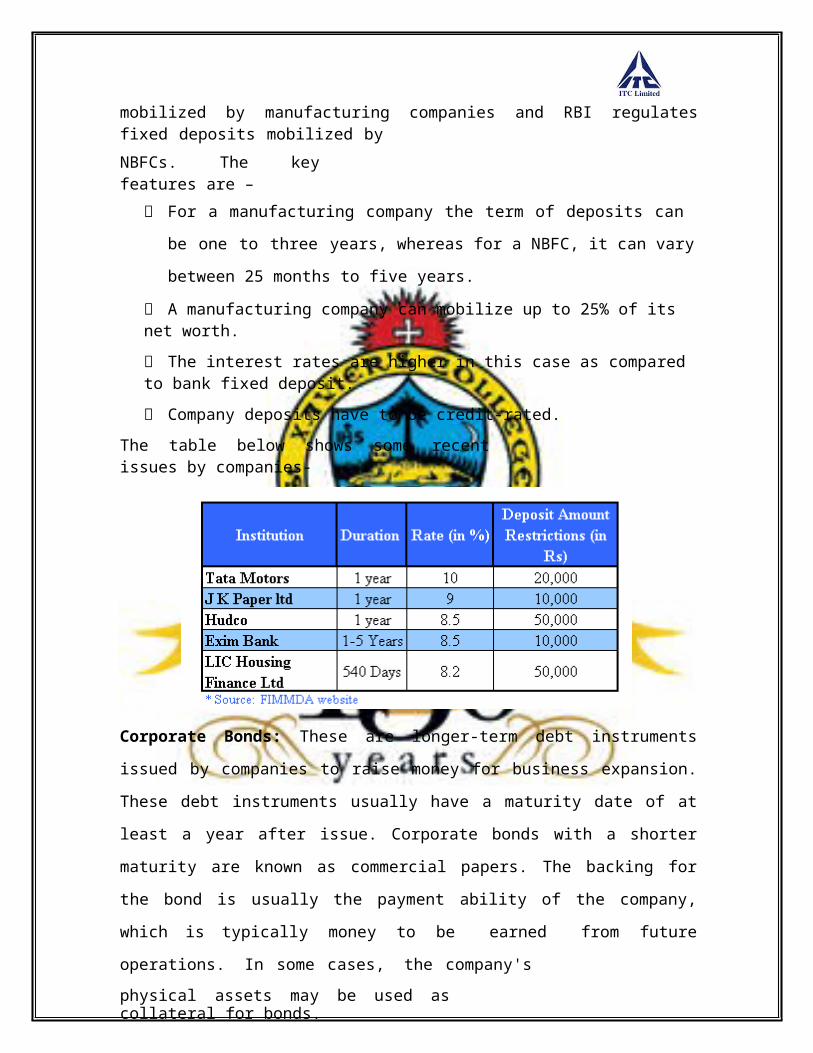
Corporate Fixed Deposits: Fixed deposits are unsecured borrowings by the company
accepting the deposit. The Company Law Board (CLB) regulates fixed deposits
Page 37
mobilized by manufacturing companies and RBI regulates fixed deposits mobilized by
NBFCs. The key features are –
For a manufacturing company the term of deposits can be one to three years,
whereas for a NBFC, it can vary between 25 months to five years.
A manufacturing company can mobilize up to 25% of its net worth.
The interest rates are higher in this case as compared to bank fixed deposit.
Company deposits have to be credit-rated.
The table below shows some recent issues by companies-
Corporate Bonds: These are longer-term debt instruments issued by companies to raise
money for business expansion. These debt instruments usually have a maturity date of at
least a year after issue. Corporate bonds with a shorter maturity are known as commercial
papers. The backing for the bond is usually the payment ability of the company, which is
typically money to be earned from future operations. In some cases, the company's
physical assets may be used as collateral for bonds.
Page 38
Some of the AAA bonds are presented below –
* Source: FIMMDA website
Corporate bonds are considered higher risk than government bonds. As a result, interest
rates are almost always higher, even for top-flight credit quality companies.
Here are some benefits of corporate bonds:
1. Attractive yields: Corporations generally offer higher yields than government
bonds of the same maturity.
2. Dependable income: Corporate bonds offer investors the opportunity of a steady
income, while preserving the principal.
3. Safety: Credit rating agencies, like S&P and Moody, rate corporate bonds
according to associated risk and rewards. Ratings reflect the capability of the
issuing authority to deliver timely returns. The higher the rating, the safer the
investment.
4. Diversity: An investor can choose from a variety of sectors and credit-quality
characteristics.
5. Marketability: Most corporate bonds sell easily and quickly due to the market‘s
size and liquidity.
Page 39
6. Put Benefit: When interest rate rises in the market, the subscriber to the issue
would not like to stick with the bond paying lower coupon rate. In this scenario
investors dump the bonds with lower coupon rate and subscribe to the issue with
higher returns.
While corporate bonds offer a higher yield than some other investments, they are also
accompanied by higher risks. These include:
1. Interest Rate Risk: Interest rate movements can significantly reduce the value of
the bond.
2. Credit Risk: Corporate bonds are not secured by collateral. Thus an investor
faces the risk of a corporation failing to meet the debt obligation.
3. Event Risk: Corporate bonds have exposure to event-based risks. Corporate
reshuffles, takeovers or restructuring have far reaching consequences on the credit
rating and price of such bonds.
4. Call Risk: Callable corporate bonds can be a nightmare when the issuer declares
the purchase of bonds after a stipulated time period. Corporations usually call off
a high-yielding bond when interest rates plummet. This gives the company a
chance to reissue bonds at lower interest rates. In such cases, an investor receives
only the par value of the bond.
Mutual Funds: Instead of directly buying equity shares and/or fixed income instruments,
one can participate in various schemes floated by mutual funds, which, in turn, invest in
equity shares and fixed income securities. There are three broad types of mutual fund
schemes:
Equity Schemes
Debt Schemes
Balanced Schemes
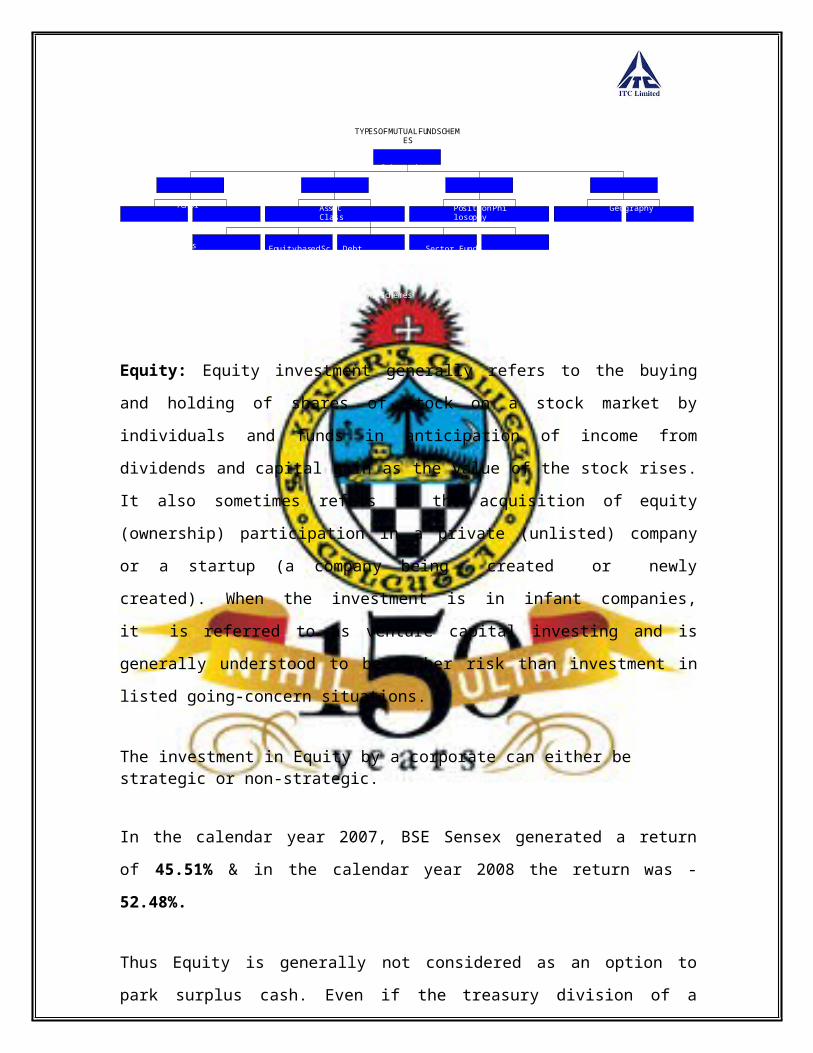
MF schemes can be offered with any of a range of investment objectives, each
corresponding to a certain point in the risk-return matrix. In a broad sense, they can be
classified on the basis of –
Page 40
TYPESOFMUTUALFUNDSCHE
MES
Schemesbasedo
n
Tenor Asset Class
PositionPhilosophy
Geography
OpenEndSchemes
CloseEndSchemes
EquitybasedSchemes
Debt basedSchemes
Sector Funds
IndexFunds
OffshoreFund RegionFund
Gilt Schemes BondSchemes JunkBondSchemes MoneyMarket Schemes BalancedSchemes
Equity: Equity investment generally refers to the buying and holding of shares of stock
on a stock market by individuals and funds in anticipation of income from dividends and
capital gain as the value of the stock rises. It also sometimes refers to the acquisition of
equity (ownership) participation in a private (unlisted) company or a startup (a company
being created or newly created). When the investment is in infant companies, it is
referred to as venture capital investing and is generally understood to be higher risk than
investment in listed going-concern situations.
The investment in Equity by a corporate can either be strategic or non-strategic.
In the calendar year 2007, BSE Sensex generated a return of 45.51% & in the calendar
year 2008 the return was -52.48%.
Thus Equity is generally not considered as an option to park surplus cash. Even if the
treasury division of a corporate house invests in Equity, it is merely for the purpose of
return maximization or the investment in strategic in nature. The quantum of investment
in equity compared to debt market is very less for surplus cash management.
Page 41
The movement of sensex in both Bull & Bear phase is shown for highlighting the
volatility in the market –
Page 42
Real Estate: Real estate is basically defined as immovable property such as land and
buildings. The investment in real estate essentially depends on the risks associated with
it, that is to say, even if the venture succeeds when the future stream of income will
accrue to the investor and the alternative investment opportunities. Real estate investment
can be attractive if viewed as a business opportunity; it can generate rental income, using
it as collateral to secure a loan for a business venture, to offset otherwise taxable income
through cash savings on tax-deductible interest rate losses, or simply from the profits
garnered from its resale. Notable, in this context is the gains reaped by real estate
speculators who trade in real estate futures (by buying and selling purchase options).
Precious Objects: Precious objects are items that are generally small in size but highly
valuable in monetary terms. Today, many investors use precious metals, or their stocks,
as a hedge against massive inflation. The important precious objects are:
Gold and silver
Precious stones
Art objects
The advantages of Precious Metals as an investment are –
Precious metals are an excellent hedge against inflation. Historically, gold, silver,
and platinum have been accepted as standards of value. During periods of
hyperinflation, their prices rise accordingly to keep pace.
Precious metal stocks, like other stocks, can be easily bought and sold on major
stock exchanges, giving them a high measure of liquidity.
Owning shares in a precious metal company is an easy way to invest in precious
metals without having to physically buy and hold the actual commodities.
The disadvantages of Precious Metals as an investment are –
Like collectibles, precious metals do not earn interest.
Precious metal prices are greatly influenced by the actions of governments. For
example, if Russia (the world's major producer of platinum) were to decide to sell
off its stockpiles of the metal in order to raise capital, the price of platinum
worldwide would drop.
Page 43
Financial Derivatives: A financial derivative is an instrument whose value is derived
from the value of an underlying asset. It may be viewed as a side bet on the asset. Options
and futures are the most important financial derivatives from the point of view of
investors.
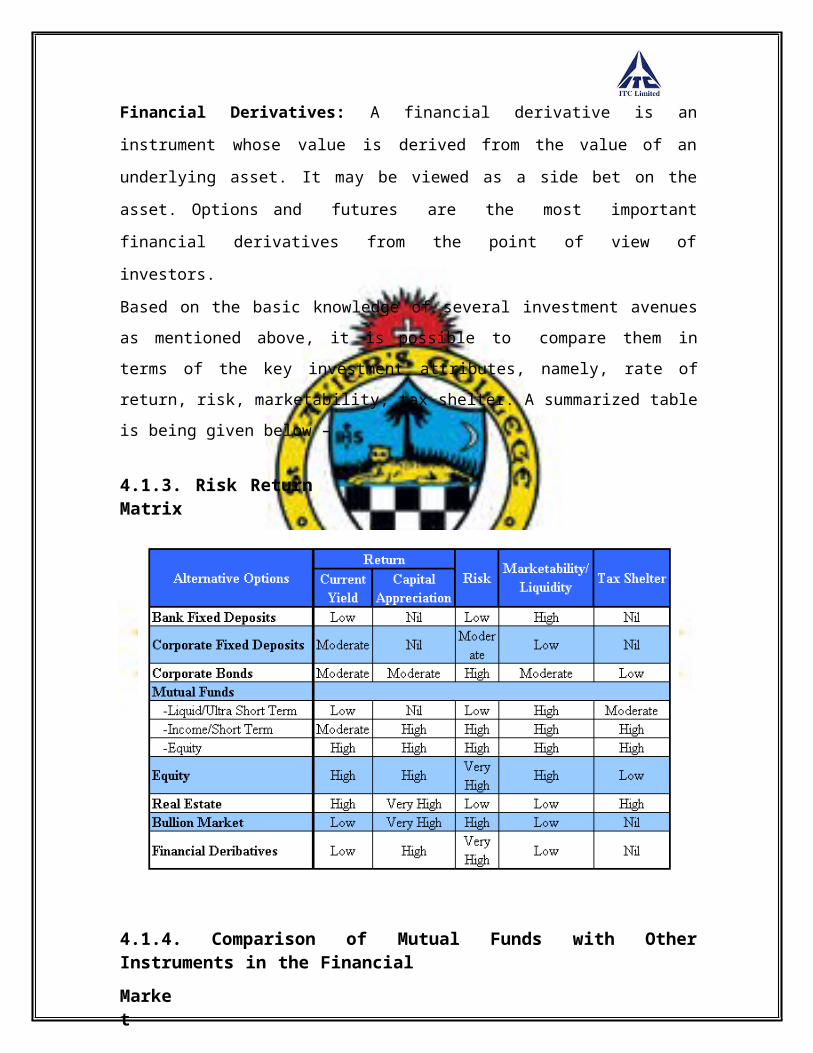
Based on the basic knowledge of several investment avenues as mentioned above, it is
possible to compare them in terms of the key investment attributes, namely, rate of
return, risk, marketability, tax shelter. A summarized table is being given below –
4.1.3. Risk Return Matrix
4.1.4. Comparison of Mutual Funds with Other Instruments in the Financial
Market
Company Fixed Deposits Vs Mutual Funds – Fixed deposits are unsecured borrowings
by the company accepting the deposit. Credit rating of the fixed deposit instrument is an
indication of the inherent default risk in the investment.
The moneys of investors in a mutual fund scheme are invested by the AMC in specific
investments under that scheme. These investments are held and managed in-trust for the
Page 44
benefit of the scheme‘s investors. On the other hand, there is no direct correlation
between a company‘s fixed deposit mobilization, and the avenues where these resources
are deployed.
A corollary of such linkage between mobilization and investment is that the gains and
losses from the mutual fund scheme entirely flow through to the investors. Therefore,
there can be no certainty of yield, unless a named guarantor assures a return, or, to a
lesser extent, if the investment is in a serial gilt scheme. On the other hand, the return
under a fixed deposit is certain, subject only to the default risk of the borrower.
Both fixed deposits and mutual funds offer liquidity, but subject to certain differences as
given below:
The provider of liquidity in the case of fixed deposits is the borrowing company.
In mutual funds, the liquidity provider is the scheme itself as in the case of open-
end schemes, or the market as in the case of closed-end schemes.
The basic value at which fixed deposits are en cashed is not subject to market risk.
However, the value at which units of a scheme are redeemed entirely depends on
the market. If securities have gained in value during the period, then the investor
can even earn a return that is higher than what he/she anticipated at the time of
investment. Conversely, a loss could also result.
Early encashment of fixed deposits is always subject to a penalty charged by the
company that accepted the fixed deposit. Mutual fund schemes also have the
option of charging a penalty on early redemption of units by way of an exit load.
If the NAV appreciates adequately, then despite the exit load, the investor could
earn a capital gain on the investment.
Bank Fixed Deposits Vs Mutual Funds – Bank fixed deposits are similar to company
fixed deposits. The major difference is that banks are more stringently regulated than are
companies. They even operate under stricter requirements as far as statutory liquidity
ratio (SLR) and cash reserve ratio (CRR) are concerned.
While the above causes a lot of comfort, bank deposits are also subject to default risk.
However, given the political and economic impact of bank defaults, the Government as
well as the Reserve Bank of India (RBI) tries to ensure that banks do not fail.
Page 45
Bonds and Debentures Vs Mutual Funds – As in the case of fixed deposits, credit
rating of the bond/debenture is an indication of the inherent default risk in the investment.
However, unlike fixed deposits, bonds and debentures are transferable securities. While
an investor may have an early encashment option from the issuer, generally liquidity is
through a listing in the market. Its implications are :
If the security does not get traded in the market, then the liquidity remains on
paper. In this respect, an open-end scheme offering continuous sale/repurchase
option is superior.
The value that the investor would realize in an early exit is subject to market risk.
The investor could have a capital gain or a capital loss. This aspect is similar to
that of a mutual fund scheme.
It is possible for an astute investor to earn attractive returns by directly investing in the
debt market, and actively managing the positions. Given the market realities in India, it is
difficult for most investors to actively manage their debt portfolio. Further, at times, it is
difficult to execute trades in the debt market even when the transaction size is as high as
Rs.1 crore. In this respect, investment in a debt scheme would be beneficial.
Debt securities could be backed by a hypothecation or a mortgage of an identified fixed
and/or current assets (secured bonds/debentures). In such a case, if there is a default, the
identified assets become available for meeting redemption requirements. An unsecured
bond/debenture is for all practical purposes like a fixed deposit, as far as the access to
assets is concerned.
A custodian for the benefit of the investors in the scheme holds the investments of a
mutual fund scheme. Thus, the securities that relate to a scheme are ring-fenced for the
benefit of its investors.
Equity Vs Mutual Funds – Investment in both equity and mutual funds are subject to
market risk. An investor holding an equity security that is not traded in the market place
has a problem realizing value from it. But investment in an open-end mutual fund
eliminates this direct risk of not being able to sell the investment in the market. An
indirect risk remains, because the scheme has to realize its investments to pay investors.
The AMC is however in a better position to handle the situation.
Page 46
4.2. Stage 2
After understanding the Mutual Fund Industry and the major players involved in the
market. The second stage of the project was to study the methodology of ranking Mutual
Fund schemes used by the Credit Rating Agencies (CRISIL & ICRA), Internet site
It basically benchmarks a mutual fund scheme vis-à-vis its peers.
It serves as a guide to investors in selecting schemes for asset allocation.
It takes into account both NAV & the portfolio of the schemes.
The ranking is done at the end of each quarter and displayed in the website
(w w w. c risi l . c o m ).
Methodology
Since the analysis was related only to the Liquid & Liquid plus schemes of the Mutual
Funds. The same was only studied for the CRISIL-CPR. The salient points are presented
below-
Only those schemes are included in the ranking which satisfies the following –
o Full portfolio disclosure for the preceding three months.
o One year NAV for the Liquid & Liquid plus category of Mutual Funds.
o Average Asset Under Management (AUM) is calculated based on the last
months average from the date of ranking. For the Liquid and Liquid plus
the cut off set is – Liquid (Institutional) – 100 crores
Liquid (Super Institutional) – 150 crores Liquid Plus or Ultra Short Term (Institutional) – 100 crores Liquid Plus or Ultra Short Term (Super Institutional) – 150 crores
For consistent CRISIL-CPR category a scheme has to consistently feature in all
quarterly rankings for the last 5 years time frame.
Page 47
The performance of a scheme is judged on the following parameters –
o Superior Returns Score: It gives the relative measure of the return & the
risk for the schemes within a peer group. For Liquid & Liquid plus
category, the SRS is calculated for one year, though normally SRS is
calculated for non-debt schemes of Mutual Funds. The steps involved in
calculation are-
Daily return of the scheme within the peer group is calculated for
the period of analysis.
The daily average of this return is the peer average return for this
scheme.
The difference between daily peer average and the scheme daily
return is calculated, this is the differential return series for the
scheme.
The average return divided by the standard deviation of the
differential return is the Superior Return Score.
The tope performer gets the rank of 1 while others are ranked in
descending order.
o Mean return & Volatility: It is mostly calculated for debt schemes of
Mutual funds as they show less volatility. It is calculated as follows-
Mean return is calculated for the period of I year for each of the
schemes.
Standard Deviation of daily return is considered as volatility.
One-year period is broken down into 4 periods of three months; the
recent 3 months are given the maximum weightage.
o Portfolio Concentration: Portfolio of the funds are analysed in detail as
the Indian Debt Market is still evolving.
Securities belonging to companies in the Manufacturing, Banks,
Deposits & Securitized papers will have an individual issuer
Page 48
specific threshold. The rationale behind doing this is to penalize
the additional risk being taken by investing higher proportions in
an individual company‘s debt security over and above the specifiedthreshold.
o Liquidity: Liquidity measures the ease with which an investor can convert
an investment to cash without a material adverse impact on either capital
or return. All corporate bonds in the portfolio are divided into three
categories based on CRISIL Fixed Income Research Team.
Liquid
Semi-Liquid
Illiquid
o Asset Quality: In the case of debt portfolio, asset quality plays an
important role driving the probability of an investor getting repayments on
principal and interest in full and in time. Asset quality is evaluated as – Based on its 20-year history of rating default and statistics
maintained by it.
Based on its rating and when it is not available, a view is taken
based on the available information.
o Average Maturity: The CRISIL-CPR is silent on this.
o Downside Risk Probability: It measures the probability of the investment
getting lower returns then short tenure risk free securities. Risk free return
as taken as the 91-day T bill yield over the period.
o Asset Size: Anything above the cut off is better.
o Historic Performance in the CRISIL-CPR: It is important to judge a
consistent performer.
Page 49
CRISIL-CPR Category Definitions –
4.2.2. ICRA online methodology for ranking mutual fund schemes
ICRA ONLINE Mutual Fund (MF) Rankings seek to inform investors and MF
intermediaries of the category-wise relative performance of MF schemes. The rankings,
covering the two time horizons of one and three years, have been arrived at following an
in-depth analysis of critical parameters, including: risk-adjusted performance; portfolio
concentration characteristics; liquidity; corpus size; average maturity; and portfolio
turnove
Eligibility Criteria for Ranking
The Net Asset Value (NAV) of the MF scheme should have been disclosed daily
during the period covered by the ranking.
In the case of one-year ranking, complete disclosure of monthly portfolio should
have been made for the past one year. In the case of three-year ranking, complete
disclosure of quarterly portfolios should have been made for the past three years.
The scheme‘s corpus size should be at least 5% of the average fund size of the
category. The average fund size of the category is calculated after classifying all
schemes into various categories on the basis of asset allocation.
.
Page 50
Any category should have a minimum of five schemes to be included for the
ranking exercise.
Only growth option, if available, of the open ended category has been taken for
the ranking.
The categories for ranking are:
Diversified Equity Schemes-Defensive
Diversified Equity Schemes-Aggressive
Sector Schemes (Only Technology Funds considered)
Index Funds (Nifty)
ELSS
Balanced Schemes
Marginal Equity Schemes/Monthly Income Plans
Income Schemes-Long Term and Short Term
Gilt Schemes-Long Term and Short Term
Liquid Schemes
Classification of Schemes
The classification of MF schemes has been done on the basis of the asset allocation and
investment pattern of the schemes concerned. This is different from the traditional offer
document-based scheme classification. The classification on the basis of asset allocation
and investment pattern holds more relevance as these two factors determine the risk level
of MF schemes.
MF schemes with equity exposure have been classified as Marginal Equity, Balanced,
and Equity, on the basis of the extent of the equity exposure. Then they have been sub-
classified as Diversified–Defensive, Diversified-Aggressive, and Sector schemes on thebasis of their sectoral concentration.
Page 51
Debt-based MF schemes have been categorised on the basis of their average allocation to
Gilt securities. Then they have been sub-classified as Debt-Short Term and Debt-Long
Term schemes, depending on their average portfolio maturity over the ranking period.
The Ranking Parameters
1. Return Analysis:
Risk adjusted return has been calculated on the basis of "Investor Expectation Ratio (IE
Ratio)" that is defined as the ratio of excess return and risk. The excess return is the
average daily active return of the scheme calculated for the ranking period over the
average peer group return. Downside deviation of the Semi-standard deviation schemes'
return from the expected return of the peer group calculated for the period covered, has
been taken as the surrogate of risk. Here average peer group return has been taken as the
proxy for the expected return. Higher the risk premium per unit risk, better it is. In the
case of Index Schemes, the Return Analysis has been done on the basis of Tracking
Error. Lower the tracking error, better it is.
2. Portfolio Concentration Analysis:
MF schemes that do not have an adequately diversified portfolio carry a higher risk than
well-diversified schemes. While for equity schemes, company concentration has been
considered, sector concentration has been evaluated for debt schemes. Company
concentration has been judged taking NSE NIFTY as the benchmark to decide the
overexposure in any of the scrips in the portfolio. For debt schemes, the sectors that have
been considered are Gilt; Non-Banking Financial Companies; Manufacturing Companies;
Banks/Financial Institutions/Development Institutions; and Non-Financial/Non-
Manufacturing Companies. Overexposure to any of these sectors has been penalised.
3. Liquidity:
Liquidity analysis has been done only for equity schemes. In this case the liquidity
coefficient for a scheme was calculated as the weighted average of the liquidity
coefficients of all scrips in the portfolio. The liquidity coefficient of a scrip is calculated
Page 52
as the total number of shares in the portfolio of the scheme divided by the total daily
turnover of the scrip. Schemes with higher liquidity have been preferred.
4. Corpus Size:
Since a larger size of the scheme's corpus lends stability to an MF scheme during periods
of high redemption pressure, preference has been accorded to large-size schemes.
5. Average Maturity:
Average maturity has been considered in the case of Debt, Gilt and Liquid categories.
Schemes with higher average maturity carry higher interest rate risks as compared with
schemes with lower average maturity. Lower average maturity has been preferred.
6. Portfolio Turnover:
Schemes with low portfolio turnover have been preferred over ones with higher portfolio
turnover.
4.2.3. Valueresearch Fund Rating
The procedure for rating Liquid & Liquid plus category of Mutual Fund schemes are –
The ratings are based on an 18-month weekly risk-adjusted performance.
It does not rate any fund without the 18-month track record.
It does not rate any fund which has an average AUM of less then 5 crores.
Each category must have at least 10 schemes to be rated.
Calculation of Value Research Fund Risk Grade.
Calculation of Value Research Fund Return Grade.
Calculation of Value Research Fund Rating.
Page 53
Value Research Fund Risk Grade
The Value Research Fund Risk Grade captures the fund‘s risk of loss. Fund Risk Grade is
different from the conventional risk and volatility measures like standard deviation and
beta as it indicates only downside volatility. The latter refers to absolute losses and even
periods when the fund underperforms a risk-free guaranteed investment. The rationale:
you can always get a guaranteed return by investing in a risk-free guaranteed investment
like a bank term-deposit. The risk of investing in a mutual fund not only includes the
possibility of losing money, but also the chance of earning less than you would have on a
guaranteed investment.
To calculate Fund Risk, monthly/weekly fund returns are compared against the monthly
risk-free return for equity and hybrid funds and weekly risk-free return for debt funds.
Risk-free return is defined as State Bank‘s 45-180 days Term Deposit Rate. For allmonths/weeks the fund has underperformed the risk-free return, the magnitude of
underperformance is added. This helps us to arrive at the average underperformance and
how the fund has performed vis-à-vis its category average. The relative performance of
the fund is expressed as a risk score.
The risk score of a fund is then assigned according to the following distribution:
High Top 10%
Above Average Next 22.5%
Average Middle 35%
Below Average Next 22.5%
Low Bottom 10%
Page 54
Value Research Fund Return Grade
The Value Research Fund Return Grade captures a fund‘s risk-adjusted return in
comparison to other funds in the category. The returns though adjusted for dividend,
bonus or rights, are not adjusted for loads. The fund‘s monthly/weekly return is
compared with the monthly/weekly risk-free return to arrive at the fund‘s total return in
excess of the risk-free return. The monthly average risk-adjusted return is compared
with the average category return to arrive at the final score. In case of a negative
category average return, the risk-free return is used as benchmark. A score in excess of
one indicates that the fund has performed better than its category average and vice-
versa.
The return score of a fund is then assigned according to the following distribution:
High Top 10%
Above Average Next 22.5%
Average Middle 35%
Below Average Next 22.5%
Low Bottom 10%
Value Research Fund Rating
The Value Research Fund Rating (Risk-adjusted Rating) is determined by subtracting the
fund‘s Risk Score from its Return Score. The resulting number is then assigned according
to the following distribution:
Top 10%
Next 22.5%
Middle 35%
Next 22.5%
Bottom 10%
Page 55
4.2.4. Asset Management Companies
The Asset Management Companies does not come out with a full-fledged Ranking
methodology but rather give a comparison with peers in the same category. The
comparison is done mostly on the basis of returns generated.
Page 56
4.3. Stage 3
Ranking Methodology, as mentioned in Stage 2, were critically analysed in this stage.
The analysis was done keeping in mind the requirements of ITC Limited that has a huge
fund for Surplus Cash Investment.
CRISIL-CPR
a. Pros
i. It takes into account both NAV & Portfolio of schemes, thus gives
a holistic view.
ii. It penalizes the additional risk being taken by investing higher
proportion in an individual company‘s debt security over and
above the specified threshold.
iii. It can evaluate the asset quality in a better way based on its 20 year
of experience.
b. Cons
i. The Ranking is done only at the end of each quarter & hence
corporate like ITC Ltd cannot use the same as it invests normally
for a very short period of time and hence cannot use the same
ranking throughout the quarter.
ii. Ranking Methodology requires one year NAV and hence newer
launched funds are not included.
iii. The cut off Asset Under Management is very low for a corporate
like ITC Ltd, which has a huge investible surplus.
iv. It does not say anything about the average maturity.
v. For calculation of mean return & volatility, weightage is given to
the return of 12 months. Thus it might not give the true picture to a
corporate like ITC Limited whose investment horizon is 7-15 days.
ICRA Online Methodology
a. Pros
i. It prefers lower average maturity.
Page 57
ii. It prefers higher corpus size of AUM.
b. Cons
i. It does not give details of the parameters in quantitative terms.
ii. It does not analyse the portfolio of the debt schemes.
Valueresearchonline Rating Methodology
a. Pros
i. It penalizes only the downside volatility.
b. Cons
i. It does not rate any fund without the 18-month track record.
ii. The cut off AUM is too low for a corporate like ITC Limited
iii. It takes 45-180 day term deposit rate as the risk free rate.
Asset Management Company
a. Pros
i. It takes point-to-point return on various time frames.
b. Cons
i. It only compares based on the return generated and not on the
portfolio of the schemes.
Thus the Ranking Methodology presented by various agencies has their own pros & cons.
ITC Limited that has a huge surplus cash (>3,000 crores) cannot replicate its investment
ideology on any of the above. Thus a new Ranking Methodology will have to be
formulated keeping in mind the twin objective of – Capital Protection
Return Optimization
Page 58
4.4. Stage 4
Ranking Methodology was developed in this stage of the project based on my
understanding of the Mutual Fund Industry and Ranking Methodology adopted by
various agencies and taking feedbacks from managers of Corporate Treasury as what
would ideally suit a corporate like ITC Ltd, which has a Surplus Cash to invest in the
range of 3000-4000 crores.
In ITC Limited, the deployment of temporary liquidity of the company is guided by the
twin objective - Capital Protection & Return Optimization. The investments are mainly
made in Liquid, Treasury Plus, Floating Rate, Fixed Maturity Plans, Short Term Funds
and Income Schemes of Debt Mutual Funds.
ITC is a manufacturing company, having its presence in various businesses, viz,
Cigarettes, Agri, Paper, Paper Boards, Matches, Agarbatties, Biscuits, Atta, Ready-to-eat
products, Life Style Retailing, Stationeries, Hotels, etc. All these business divisions use
cash for their business operations, which is forecasted on a daily basis to Corporate
Treasury, based on a very robust and time tested forecasting technique.
Corporate Treasury is located at its Head Office in Kolkata and centrally manages the
Treasury Operations for all the business divisions. It collates the forecasts of all
businesses and finds out the position of liquidity at enterprise level, through its cash
management system. The temporary liquidity, at enterprise level, is invested in Mutual
Fixed Deposits, Bonds, Funds, inter alia. The investment of temporary liquidity is guided
by various factors as detailed below:
The Capex and Working Capital needs of the company.
The Twin Objective of Capital Protection & Return Optimization.
The credit risk of the counter party.
The relationship of the counter party with ITC Limited.
The Present Market conditions, viz., Interest Rates, Shape of Yield Curve.
Page 59
View of the market going forward.
In case of Fixed Deposits, funds are deployed with the bank providing the
most suitable quote and tenure.
In case of Bonds, funds are deployed primary in Bonds with tax efficiency
(i.e., Tax Free Bonds). Funds are deployed in bonds with the most suitable
ratings and held to maturity yield.
Investments in Mutual Funds are done under various types of categories, viz.,
Liquid, Treasury Plus, Floating Rate, Fixed Maturity Plans, Short Term Funds
and Income Schemes.
Investment in Fixed Maturity Plans, Short Term Funds and Income Schemes are based on
Liquidity of the instruments and view on interest rates in the market, inter alias. These
schemes of Mutual Funds are very sensitive to the movements in the interest rates.
Majority of the surplus is invested in Liquid, Ultra Short Term Schemes of Debt
Mutual Funds. These schemes are used for daily cash management. For investment in
these schemes, ITC has its own methodology of ranking various schemes of Debt Mutual
Funds.
4.4.1. Why Ranking Methodology can be developed for Liquid & Ultra Short
Term Funds and not for other alternative investment avenues for surplus
cash?
The treasury division of ITC Ltd is a profit center and has pre-defined profit
targets to meet and even out perform them. But having said that it is primarily a
cost center & service center fulfilling the cash requirements of all divisions.
Hence it can only invest in those asset classes where there is Capital Protection
and enough liquidity so that it can square off its position and meet the cash
requirement.
Page 60
Page 61
Since Liquid & Ultra Short Term Funds of Mutual Funds provides ample
opportunity for ―Capital Protection & Return Optimization, majority of
surplus cash is invested here and hence a systematic process is needed.
Ranking or a systematic investment process is not possible in case of Bank Fixed
Deposits, Corporate Fixed Deposits, Tax Free Bonds, Income Funds of Asset
Management Companies, etc., because of the following reasons-
o Investment in FD‘s require quotations from banks and investments are
made with the bank providing most suitable / best rate.
o Investment in FMPs is not preferred because of current statutory
regulations, which does not allow Mutual Fund houses to show either the
expected yield or the portfolio. Thus the volume of business as a whole in
this particular category is going down.
o Investments in bonds require analysis of interest rate movements.
o Apart form analysis of interest rate movements, Fund manager‘s
experience also plays an important role for investment in Income Funds.
o Surplus Cash generated at enterprise levels is managed to meet the
working capital requirement of the business and hence invested for a very
short tenure (less than 1 week). And investment in the above mentioned
instrument requires some time horizon (3 to 6 months) before which these
instruments won‘t be able to generate the expected return correspondingthe risk involved in these instruments.
Sr No. Asset Management Company
1 AIG Global Investment Group Mutual Fund2 Baroda Pioneer Mutual Fund3 Benchmark Mutual Fund4 Bharti AXA Mutual Fund5 Birla Sun Life Mutual Fund6 Canara Robeco Mutual Fund7 DBS Chola Mutual Fund8 Deutsche Mutual Fund9 DSP BlackRock Mutual Fund
What it m easures Excess return over the desired return obtained vrom CAPM
CalculationJensen's Alpha=Portfolio Re turn-(Risk Free Rate+PortfolioBeta*(Mkt Return-Risk Free Rate) )
Positive RatioIndicates
MF did better than then exp ectation
Higher the Better TRUE
Advantage Good indicator of the past
Disadvantage Does not tell about the future. Too many parameters required
Depende nt Factors Realized Return, Mkt Return, Risk Free Rate, Beta of portfolio
4.4.4.2. Information Ratio: It is defined as expected active return divided by tracking
error, where active return is the difference between the return of the security and the
return of a selected benchmark index, and tracking error is the standard deviation of the
active return.
It measures the expected active return of the manager's portfolio divided by the amount
of risk that the manager takes relative to the benchmark. The higher the information ratio,
the higher the active return of the portfolio, given the amount of risk taken, and the better
the manager. Top-quartile investment managers typically achieve information ratios of
about one-half.
The information ratio is similar to the Sharpe ratio but, whereas the Sharpe ratio
compares the excess return of an asset against the return of a risk free asset, the
information ratio compares active return to the most relevant benchmark index. Excess
return denotes the return over the risk-free asset, while active return denotes the return
over the benchmark.
Rp = Return of the portfolio
Ri = Return of the index or benchmark
Page 68
Sp-i = Tracking error (standard deviation of the difference between returns of the
portfolio and the returns of the index).
To summarise –
4.4.4.3. Sharpe Ratio: It is calculated by subtracting the risk-free rate of return from the
rate of return for an investment and dividing the result by the investment's standard
deviation of its return.
The Sharpe ratio tells investors whether an investment's returns are due to smart
investment decisions or the result of excess risk. This measurement is very useful because
although one portfolio or security can reap higher returns than its peers, it is only a good
investment if those higher returns do not come with too much additional risk. The greater
an investment's Sharpe ratio, the better its risk-adjusted performance.
To summarize –
Page 69
PARTICULARS SHARPE RATIO
DefinitionIt is calculated by subtracting the risk-free rate of return from the rate of return for an investment and dividing the result by the
What it m easuresWhether the investments are result of smart investment moves or result of excessive risk.
Calculation (Return-Risk Fre e Ra te) / Standa rd Deviation of Return
Positive RatioIndicates
MF did better than comparable T-Bill
Higher the Better TRUE
Advantage-Good indicator of the past, directly computable.-Not relative to a benchmark Index so can be used to analyse other asset classes, absolute retu rns etc.
Disadvantage
-Does n ot tell about the futu re.-Does n ot include those risks that do not affect the volatility.-Penalizes both upside and d ownside volatility.-Not suitab le for Index-sensitive portfolios.
Depende nt Factors Excess Return & Volatility
4.4.4.4. Sortino Ratio: The Sortino ratio measures the risk-adjusted return of an
investment asset, portfolio or strategy. It is a modification of the Sharpe ratio but
penalizes only those returns falling below a user-specified target, or required rate of
return, while the Sharpe ratio penalizes both upside and downside volatility equally. It
is thus a measure of risk-adjusted returns that treats risk more realistically than the
Sharpe ratio.
This differentiation of upward and downward volatility allows the calculation to
provide a risk-adjusted measure of a security or fund's performance without
penalizing it for upward price changes.
A large Sortino Ratio indicates a low risk of large losses occurring.
Page 70
To summarize –
4.4.4.5. Treynor Ratio: The Treynor ratio (sometimes called reward-to-volatility
ratio) relates excess return over the risk-free rate to the additional risk taken; however
systematic risk instead of total risk is used. The higher the Treynor ratio, the better
the performance under analysis.
Like the Sharpe ratio, the Treynor ratio (T) does not quantify the value added, if any,
of active portfolio management. It is a ranking criterion only. A ranking of portfolios
based on the Treynor Ratio is only useful if the portfolios under consideration are
sub-portfolios of a broader, fully diversified portfolio. If this is not the case, portfolios
with identical systematic risk, but different total risk, will be rated the same. But the
portfolio with a higher total risk is less diversified and therefore has a higher
unsystematic risk, which is not priced, in the market.
Page 71
The Treynor ratio is calculated as:
(Average Return of the Portfolio - Average Return of the Risk-Free Rate) / Beta of
the Portfolio).
To summarize –
PARTICULARS TREYNOR RATIO
DefinitionMeasures the return earned in excess of riskless investmen t per unit of market risk
What it m easuresThe return in excess of riskless investment p er unit of systematic risk
Calculation (Portfolio Return-Risk Fre e Ra te) /Beta
Positive RatioIndicates
Did better than Risk Free Rate.
Higher the Better TRUE
Advantage-Good indicator of the past.-Can be used for comparing different portfolios with a similar benchmark.
Disadvantage
-Does n ot tell about the futu re.-It is just a ran king criterion.-Does n ot Quantify the value added.-Not useful for comparing portfolios in d ifferent asset class sinceBeta is required in the calculation.