171
1/171 EIOPA REGULAR USE EIOPA-BoS-17/334 20 December 2017 Report on long-term guarantees measures and measures on equity risk 2017

1/171
EIOPA REGULAR USE
EIOPA-BoS-17/334
20 December 2017
Report on long-term guarantees measures
and measures on equity risk
2017

2/171
Table of Contents
Executive summary .................................................................................................... 3
I. Introduction ...................................................................................................... 6 I.1 Review of the LTG measures and measures on equity risk ............................................. 6 I.2 Legal background ..................................................................................................... 7 I.3 Data ....................................................................................................................... 8 I.4 Introduction to Solvency II quantitative requirements ................................................... 8 I.5 Overview of the European insurance market ............................................................... 10 II. Overview of the use and the impact of LTG measures and measures on equity
risk ........................................................................................................................ 14 II.1 Use of the measures ............................................................................................... 14 II.2 Impact of the measures on the financial position of undertakings ................................. 21 II.3 Impact on policyholder protection ............................................................................. 44 II.4 Impact on the investments of undertakings ............................................................... 46 II.5 Impact on consumers and products .......................................................................... 56 II.6 Impact on competition and level playing field in the EU insurance market ...................... 62 II.7 Impact on financial stability ..................................................................................... 64 III. Specific analysis for each of the measures ...................................................... 67 III.1 Extrapolation of the risk-free interest rates .............................................................. 67 III.2 Matching adjustment ............................................................................................. 79 III.3 Volatility adjustment.............................................................................................. 92 III.4 Transitional measure on the risk-free interest rates ................................................. 116 III.5 Transitional measure on technical provisions .......................................................... 122 III.6 Duration-based equity risk sub-module .................................................................. 142 III.7 Symmetric adjustment to the equity risk charge ..................................................... 143 III.8 Extension of the recovery period ........................................................................... 151 IV. Thematic focus on public disclosure .................................................................. 153 Annexes ................................................................................................................. 160 Annex 1: Overview of the European insurance market .................................................... 160 Annex 2: Impact of the measures on the financial position of undertakings........................ 162 Annex 3: Asset classes ................................................................................................ 167 Annex 4: Impact on consumers and products ................................................................. 168

3/171
Executive summary
The Solvency II Directive requires a review of the long-term guarantees measures
(LTG) and the measures on equity risk until 1 January 2021. As part of this review,
EIOPA annually reports on the impact of the application of the LTG measures and the
measures on equity risk to the European Parliament, the Council and the Commission.
This report on the LTG measures and the measures on equity risk is the second
annual report.
The LTG measures are the extrapolation of risk-free interest rates, the matching
adjustment, the volatility adjustment, the extension of the recovery period in case of
non-compliance with the Solvency Capital Requirement, the transitional measure on
the risk-free interest rates and the transitional measure on technical provisions. The
equity risk measures are the application of a symmetric adjustment mechanism to the
equity risk charge and the duration-based equity risk sub-module.
The use of the matching adjustment, the volatility adjustment, the two transitional
measures and the duration-based equity risk sub-module are not mandatory for
undertakings. In the European Economic Area (EEA), 783 insurance and reinsurance
undertakings in 23 countries were on 31 December 2016 using at least one of these
measures.
The aggregated amount of technical provisions for the undertakings using the
matching adjustment, the volatility adjustment, the transitional measure on the risk-
free interest rates, the transitional measure on technical provisions and the duration-
based equity risk sub-module amounts to 74% of the technical provisions in the EEA
insurance and reinsurance market. 730 undertakings representing 66% of the overall
amount of technical provisions at EEA level are using the volatility adjustment. The
transitional on technical provisions is the second most used measure, applied by 163
undertakings representing 25% of the overall amount of technical provisions at EEA
level. The matching adjustment is used by 38 undertakings representing 15% of the
overall amount of technical provisions in the EEA. The transitional on risk free rate is
used by six undertakings and the duration-based equity risk sub-module by one
undertaking with a negligible market share in technical provisions in both cases.
The impact of the measures on the financial position has been reported to national
supervisory authorities for the first time in 2017. Information on the impact of the
matching adjustment, volatility adjustment, transitional measure on the risk-free
interest rates and transitional measure on technical provisions has been collected
through the regular annual reporting. This information relates to all life and non-life
insurance and reinsurance undertakings, broadening the scope of the report
significantly compared to last year, which was based on data collected through
EIOPA’s 2016 insurance stress test and captured 78% of the EEA life insurance
market. For the undertakings using these measures, removing the measures would
result on average in a reduction of the Solvency Capital Requirement ratio by 69
percentage points; the weigthed average ratio with measures is 217% while the same
ratio without the measures would be 148%. Insurance and reinsurance undertakings
comply with the Solvency Capital Requirement if their Solvency Capital Requirement
ratio is at least 100%. Removing these measures would decrease the amount of

4/171
eligible own funds to cover the Solvency Capital Requirement by 164 billion euro and
increase the Solvency Capital Requirement by 73 billion euro.
Where insurance or reinsurance undertakings depend on the transitional measures to
comply with the Solvency Capital Requirement, NSAs are generally confident that
undertakings will be able to reduce the dependency on transitional measures, to the
point of no dependency by 1 January 2032. However, it was noted that it is still very
early in the transitional period and there is significant exposure to how internal and
external factors develop. For example, the economic conditions in particular the
persistence of a low-interest rate environment, the biometric experience and the
ability of undertakings to shift from guaranteed products to products without
guarantees. Without consideration of UK undertakings (for which 2016 figures are not
available), the total number of undertakings not complying with the SCR without the
transitional measures at EEA level decreased by 5 from 35 undertakings at the
beginning of 2016, to 30 undertakings at the end of the year; the missing amount of
eligible own funds to comply with the SCR without the transitional measures
decreased by 2.48 billion euro, from 5.26 billion euro at the beginning of 2016 to 2.78
billion euro at the end of the year.
In order to assess the impact of the extrapolation of risk-free interest rates and of the
symmetric adjustment mechanism to the equity risk charge EIOPA carried out an
information request to insurance and reinsurance undertakings. With regard to the
extrapolation, undertakings assessed the impact of three scenarios to change
parameters of the extrapolation. The scenario that turned out to be most severe on
average was the increase of the starting point of the extrapolation for the euro from
20 to 30 years. In this scenario, undertakings with long-term cashflows reported a
reduction of the Solvency Capital Requirement ratio by rounded 28 percentage points;
the ratio with measures is 240% while the ratio without the measures would be
211%. The scenario would cause a reduction of own funds by 45 billion euro and an
increase of the Solvency Capital Requrement by 16 billion euro.
At the end of 2016 the symmetric adjustment to the equity capital charge, which can
vary from -10 to +10 percentage points, was at -1.4 percentage points. Undertakings
not applying the transitional measure on equity risk reported that the impact of not
applying the adjustment was on average a reduction of the Solvency Capital
Requirement ratio by 2 percentage points; the ratio with adjustment is 232% while
the ratio without the adjustment would be 230%.
The feedback from national supervisory authorities indicates that there is no specific
case yet, where undue capital relief was observed for an undertaking due to the
application of the LTG measures or measures on equity risk. No concrete observations
of positive or negative impacts of the LTG measures and equity risk measures on
policyholder protection were raised. Furthermore, no concrete cases were identified by
national supervisory authorities in which the application of the measures prevented
them from taking any supervisory measures which they would have considered
desirable for policyholder protection.
As regards the impact of the measures on the investments of undertakings, no clear
conclusions can be drawn at this stage. Half of the national supervisory authorities did
not observe a clear trend in their national market regarding the behaviour of

5/171
undertakings as long-term investors. From the remaining authorities, a third of them
observed a reallocation from government bonds to corporate bonds, a third of them
witnessed an increasing investment in illiquid assets and another third noted an
increase in government bond investments. Almost all NSAs stated that they did not
observe any significant link between the LTG measures and the reported changes.
Long-term guarantees are included in many types of insurance products and widely
spread among European countries, with large differences between the relative
importance of long-term guarantees products in each market. The most significant
line of business with long-term guarantees products in the majority of countries is
traditional life insurance products with profit participation. The most common
guarantees relate to minimum interest rates, guarantees on sum assured and on
surrender value.
Consistent with the trends observed last year, availability of long-term guarantees
products is mainly stable or decreasing across EEA, but in general national
supervisory authorities did not relate the trend to the design of the LTG measures. A
number of authorities observed a shift to unit-linked, pure protection or hybrid
products, a decreasing level of financial guarantee included in the contracts or a
decreasing duration of the guarantees offered. The main drivers identified for the
decreasing availability of long-term guarantees products are the low interest rate
environment, the increasing cost of guarantees and taxation regulation.
Approximately half of the countries reported some cases of consumer detriment where
policyholders have been encouraged to surrender or transfer products with high
guarantees without full transparent information. A small number of national
supervisory authorities reported consumer protection issues regarding the introduction
of new products with guarantees.
With regard to the impact of the LTG measures and the measures on equity risk on
competition and level playing field, different supervisory approaches to the measures
were identified. The differences relate to the scope of application of the volatility
adjustment, the treatment of the volatility adjustment in internal models and the
approval of the transitional measures.
For this report EIOPA analysed the public disclosure of insurance and reinsurance
undertakings on their use of the LTG measures and the measures on equity risk.
Almost all undertakings provided, where applicable, the required quantitative
information about the impact of a removal of the matching adjustment, the volatility
adjustment, the transitional measure on the risk-free interest rates or the transitional
measure on technical provisions on their financial position. The level of detail of the
disclosed qualitative information on the use of the measures varies significantly by
undertaking.
EIOPA asked selected stakeholders, including analysts, rating agencies, journalists
and consumer protection organisations about their perception of the public disclosure.
The stakeholders stressed the importance of transparency on the measures. They
noted insufficiencies with respect to the completeness and comparability of the first
public disclosure under Solvency II. Stakeholders also expressed their interest in the
disclosure of additional information on the measures and provided some concrete
suggestions.

6/171
I. Introduction
I.1 Review of the LTG measures and measures on equity risk
The long-term guarantees (LTG) measures were introduced in the Solvency II
Directive1 through the Omnibus II Directive2 in order to ensure an appropriate
treatment of insurance products that include long-term guarantees. The measures on
equity risk should ensure an appropriate measure of equity risk in setting the capital
requirement for insurance and reinsurance undertakings in relation to the risks arising
from changes in the level of equity prices.
The Solvency II Directive requires a review of the LTG measures and the measures on
equity risk by 1 January 2021. The review consists of the following elements:
EIOPA annually reports on the impact of the application of the LTG measures and
the measures on equity risk to the European Parliament, the Council and the
Commission.
EIOPA provides an opinion on the assessment of the application of the LTG
measures and the measures on equity risk to the Commission.
Based on the opinion submitted by EIOPA the Commission submits a report on the
impact of the LTG measures and the measures on equity risk to the European
Parliament and to the Council. The report will be accompanied, if necessary, by
legislative proposals.
The 2017 EIOPA report on the LTG measures and the measures on equity risk is the
second annual report3. The 2017 report is structured in four main sections. The first
section provides introductory information, among others on the legal background of
the review of the LTG measures and measures on equity risk and on the data used for
this report, and concludes with a short overview of the European insurance market.
The second section captures the overall impact of the LTG measures and measures on
equity risk on the financial position of the undertakings, the impact on policyholder
protection, the impact on investments, the impact on consumer protection and
availability of products, the impact on competition and level playing field in the EU
insurance market and the impact on financial stability.
The third section of the report sets out in more detail the impact of each of the
measures.
The fourth section contains information on the thematic focus, which this year is on
the public disclosure on LTG measures and measures on equity risk.
1 Directive 2009/138/EC of 25 November 2009 of the European Parliament and of the Council on the taking-up and
pursuit of the business of Insurance and Reinsurance (Solvency II), OJ L 335, 17.12.2009, p.1. 2 Directive 2014/51/EU of the European Parliament and of the Council of 16 April 2014 amending Directives
2003/71/EC and 2009/138/EC and Regulations (EC) No 1060/2009, (EU) No 1094/2010 and (EU) No 1095/2010 in respect of the powers of the European Supervisory Authority (European Insurance and Occupational Pensions Authority) and the European Supervisory Authority (European Securities and Markets Authority), OJ L153, 22.05.2014, p.1. 3 The 2016 report can be consulted on EIOPA’s website at the following link:
https://eiopa.europa.eu/Publications/Responses/EIOPA-BoS-16-279_LTG_REPORT_2016.pdf

7/171
EIOPA plans to submit the opinion on the assessment of the application of the LTG
measures and the measures on equity risk to the Commission in 2020, based on the
annual reports submitted by then.
I.2 Legal background
Article 77(f)(1) of the Solvency II Directive requires EIOPA on an annual basis and
until 1 January 2021 to report to the European Parliament, the Council and the
Commission about the impact of the application of Articles 77a to 77e and 106, Article
138(4) and Articles 304, 308c and 308d, including the delegated or implementing acts
adopted pursuant thereto.
The table below summarises the LTG measures and the measures on equity risk
subject to the review and the relevant articles of the Solvency II Directive.
Articles Name of the measure Abbreviation
in this report
77a Extrapolation of the risk-free interest rates -
77b, 77c Matching adjustment MA
77d Volatilty adjustment VA
106 Symmetric adjustment mechanism to the
equity risk charge
SA
138(4) Extension of the recovery period -
304 Duration-based equity risk sub-module DBER
308c Transitional on the risk-free rate TRFR
308d Transitional on technical provisions TTP
The review also covers Article 77e of the Solvency Directive on technical information
on the risk-free interest rates produced by EIOPA.
Article 77(f)(1) also requires national supervisory authorities (NSAs) to provide the
following information to EIOPA on an annual basis:
the availability of long-term guarantees in insurance products in their national
markets and the behaviour of insurance and reinsurance undertakings as long-
term investors;
the number of insurance and reinsurance undertakings applying the matching
adjustment, the volatility adjustment, the extension of the recovery period in
accordance with Article 138(4), the duration-based equity risk sub-module and
the transitional measures set out in Articles 308c and 308d;
the impact on the insurance and reinsurance undertakings' financial position of
the matching adjustment, the volatility adjustment, the symmetric adjustment
mechanism to the equity capital charge, the duration-based equity risk sub-

8/171
module and the transitional measures set out in Articles 308c and 308d, at
national level and in anonymised way for each undertaking;
the effect of the matching adjustment, the volatility adjustment, the symmetric
adjustment mechanism to the equity capital charge and the duration-based
equity risk sub-module on the investment behaviour of insurance and
reinsurance undertakings and whether they provide undue capital relief;
the effect of any extension of the recovery period in accordance with Article
138(4) on the efforts of insurance and reinsurance undertakings to re-establish
the level of eligible own funds covering the Solvency Capital Requirement or to
reduce the risk profile in order to ensure compliance with the Solvency Capital
Requirement;
where insurance and reinsurance undertakings apply the transitional measures
set out in Articles 308c and 308d, whether they comply with the phasing-in
plans referred to in Article 308e of the Solvency II Directive and the prospects
for a reduced dependency on these transitional measures, including measures
that have been taken or are expected to be taken by the undertakings and
supervisory authorities, taking into account the regulatory environment of the
Member State concerned.
I.3 Data
The data used for this report are taken from the quantitative reporting templates
(QRT) submitted by insurance and reinsurance undertakings to their NSAs with
reference date 31 December 20164. Additionally, EIOPA launched a specific request to
insurance and reinsurance undertakings from the EEA and subject to Solvency II to
provide the following information: impact of the symmetric adjustment mechanism to
the equity risk charge on the financial position of undertakings; impact of the
extrapolation of risk-free interest rates on the financial position of undertakings; and
losses due to bond defaults and downgrades of bonds in matching adjustment
portfolios5.
EIOPA also carried out a questionnaire to ascertain the experience of NSAs with
regard to the impact of the LTG measures and the measures on equity risk and the
public disclosure of the measures.
I.4 Introduction to Solvency II quantitative requirements
The main objective of Solvency II is to protect the insurance policyholders and
beneficiaries. An essential aspect of policyholder protection is the ability of insurance
and reinsurance undertakings to fulfil their insurance and reinsurance contracts, even
under adverse circumstances, for example in a financial crisis or when a natural
4 Few undertakings with a reporting year different than the natural year reported data for a point in time earlier than
31 December 2016. Unplausible figures affecting individual data submitted by 23 undertakings were disregarded in the analysis.This is not expected to have a material impact on the results presented in the report. Data from the QRT were extracted between 9 and 22 November 2017. 5 The detailed content of the information request (i.e. Excel template, technical specifications and technical
information) can be consulted on EIOPA’s website in the following link: https://eiopa.europa.eu/regulation-supervision/insurance/long-term-guarantees-review

9/171
catastrophe occurs. Solvency II includes quantitative requirements on insurance and
reinsurance undertakings to ensure that their financial position allows them to pay the
expected insurance benefits and also to bear unexpected losses that they might incur
under adverse circumstances.
The quantitative requirements include in particular:
market-consistent valuation of assets and liabilities,
economic determination of own funds,
risk-based capital requirements.
Assets and liabilities
Solvency II introduced a valuation of assets and liabilities specifically for supervisory
purposes. Assets and liabilities are valued at the amount for which they could be
exchanged between knowledgeable willing parties in an arm’s length transaction.
The assets of an insurance or reinsurance undertaking consist mainly of the
investments that insurers make with the insurance premiums they receive. Typically
these investments comprise bonds, equities and real estate, held directly or through
investment funds.
The liabilities of an insurance or reinsurance undertaking consist mainly of technical
provisions set up for the insurance and reinsurance obligations of the undertaking.
Insurance and reinsurance obligations can be of long duration.
The long-term guarantee measures extrapolation, MA, VA, TRFR and TTP relate to the
calculation of technical provisions, the first four of them specifically to the risk-free
interest rates.
Own funds and capital requirements
Insurance and reinsurance undertakings have to hold own funds that cover their
capital requirements. The own funds are based on the difference between assets and
liabilities.
There are two capital requirements in Solvency II, the Solvency Capital Requirement
(SCR) and the Minimum Capital Requirement (MCR).
The SCR is a risk-based capital requirement. The SCR corresponds to the amount of
own funds needed to withstand the worst annual loss expected to occur over the next
200 years. If an insurance or reinsurance undertaking is not complying with the SCR,
it has to take measures to meet the SCR again within six months, for example by
increasing its capital or by reducing its risk.
The SCR can be calculated with a standard formula that is specified in the law or with
an internal model that was approved by the NSA. It is also possible to calculate a part
of the SCR with an internal model (partial internal model) and the remaining part with
the standard formula.
10/171
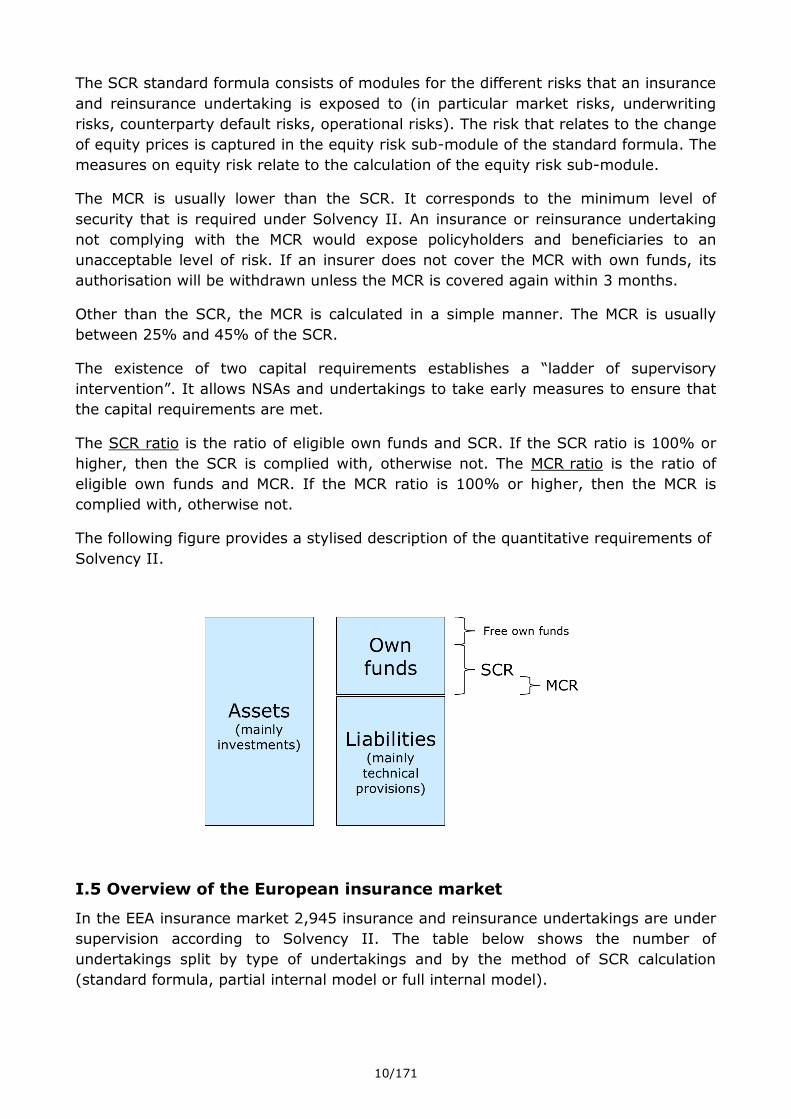
The SCR standard formula consists of modules for the different risks that an insurance
and reinsurance undertaking is exposed to (in particular market risks, underwriting
risks, counterparty default risks, operational risks). The risk that relates to the change
of equity prices is captured in the equity risk sub-module of the standard formula. The
measures on equity risk relate to the calculation of the equity risk sub-module.
The MCR is usually lower than the SCR. It corresponds to the minimum level of
security that is required under Solvency II. An insurance or reinsurance undertaking
not complying with the MCR would expose policyholders and beneficiaries to an
unacceptable level of risk. If an insurer does not cover the MCR with own funds, its
authorisation will be withdrawn unless the MCR is covered again within 3 months.
Other than the SCR, the MCR is calculated in a simple manner. The MCR is usually
between 25% and 45% of the SCR.
The existence of two capital requirements establishes a “ladder of supervisory
intervention”. It allows NSAs and undertakings to take early measures to ensure that
the capital requirements are met.
The SCR ratio is the ratio of eligible own funds and SCR. If the SCR ratio is 100% or
higher, then the SCR is complied with, otherwise not. The MCR ratio is the ratio of
eligible own funds and MCR. If the MCR ratio is 100% or higher, then the MCR is
complied with, otherwise not.
The following figure provides a stylised description of the quantitative requirements of
Solvency II.
I.5 Overview of the European insurance market
In the EEA insurance market 2,945 insurance and reinsurance undertakings are under
supervision according to Solvency II. The table below shows the number of
undertakings split by type of undertakings and by the method of SCR calculation
(standard formula, partial internal model or full internal model).

11/171
The total number of undertakings decreased by 105 compared with data at 1 January
2016.
Number of undertakings
Standard
formula
Partial internal
model
Full internal
model
Total
Life undertakings 550 29 22 601
Non-life undertakings 1540 38 36 1614
Undertakings pursuing both life
and non-life activities 367 24 8 399
Reinsurance undertakings6 312 7 12 331
Total 2769 98 78 2945
In the EEA insurance market 322 groups are under supervision according to Solvency
II. 1326 solo insurance and reinsurance undertakings, representing 45% of all
insurance and reinsurance undertakings, are part of these groups.
Number of groups
Standard formula
Partial
internal model
Full
internal model
Total
Number of groups 287 25 10 322
Number of insurance and
reinsurance undertakings in EEA part of the groups
1169 85 72 1326
The following diagram provides an overview of the amount of technical provisions and
gross written premiums of all insurance and reinsurance undertakings subject to
Solvency II. The amounts are provided separately for life insurance and for non-life
insurance obligations. Additional information with respect to the European insurance
market can be consulted in Annex 1 of this report.
6 The figures for reinsurance undertaking in this table do not include reinsurance undertakings from the UK. They are
included in the other columns according to the reinsurance activity that they are pursuing.

12/171
Technical provisions and gross written premiums of EEA undertakings
EEA undertakings Life Non-life Total
Technical provisions
(billion EUR) 8025 744 8,769
Gross written premiums
(billion EUR) 842 453 12957
Technical provisions and gross written premiums of undertakings in the EEA part of a group
7 The gross written premiums are not comparable with the gross written premiums in the LTG review report 2016. In
the LTG review report 2016 the aggregated amount of gross written premiums as reported in the quantitative reporting template on premiums, claims (S.05.01) for the first quarter 2016 were used. Note also that the data used on gross written premiums is based on a reporting template that follows accounting recognition and valuation. In some countries following IFRS or local GAAP that recognise the difference between insurance and investment contracts, some insurance contracts may be recognised as investment contracts and be accounted as such, i.e. with no premiums reported in this template for those contracts.
0
2000
4000
6000
8000
10000
Life Non-life Total
Bill
ion
EU
R
Technical provisions
0
200
400
600
800
1000
1200
1400
Life Non-life Total
Bill
ion
EU
R
Gross written premiums
0
2000
4000
6000
8000
Life Non-life Total
Bill
ion
EU
R
Technical provisions
0
200
400
600
800
1000
1200
Life Non-life Total
Bill
ion
EU
R
Gross written premiums

13/171
EEA undertakings in a
group Life Non-life Total
Technical Provisions
(billion EUR) 6,685 544 7,229
Gross Written Premiums
(billion EUR) 702 336 1,038

14/171
II. Overview of the use and the impact of LTG measures
and measures on equity risk
II.1 Use of the measures
Some of the LTG measures and measures on equity risk are applied by insurance and
reinsurance undertakings on a optional basis, while the use of other measures is mandatory.
The application of MA, VA, TRFR, TTP and DBER is optional for undertakings, subject to conditions laid down in the Solvency II Directive and Regulations.
All other measures are an integral part of the Solvency II framework and hence of
mandatory application. In particular, the extrapolation of risk-free interest rates is applicable to all undertakings for the calculation of their technical provisions. The
symmetric adjustment mechanism is applicable to all undertakings that use the standard formula to calculate the equity risk sub-module of the SCR, including all undertaking using a partial internal model not covering that sub-module.
Finally, the extension of the recovery period in exceptional adverse situations is only applicable to undertakings breaching the SCR after a declaration of such a situation by
EIOPA. So far, EIOPA has not declared an exceptional adverse situation.
All information on the use of the measures set out in this section relates to the
situation as known on 31 December 2016. The graphs and tables with the number of undertakings, split by life, non-life, both life and non-life and reinsurance
undertakings, are based on the information in the NSAs questionnaire. All other graphs and tables are based on QRT data.
Use of MA, VA, TRFR, TTP and DBER by solo undertakings
In the EEA, 783 insurance and reinsurance undertakings in 23 countries are using at least one of the optional LTG measures MA, VA, TRFR, TTP or DBER. The aggregated
amount of technical provisions for those undertakings is 74.2% of the technical provisions in the European market.
Out of the total 2945 undertakings, 2162 undertakings, nearly three out of four are not using any of the LTG measures MA, VA, TRFR, TTP or DBER. The use of any measures differs between type of undertaking, as illustrated below. The undertakings
not using any measures represent 25.8% of the technical provisions in the European market. There are 8 countries where none of these measures are applied by any of
the national undertakings (EE, HR, IS, LT, LV, MT, PL and SI – please see section III for further detail).

15/171
Undertakings not
applying any of the measures
Undertakings applying at least one measure
Life 288 313
Non-life 1368 246
Both life and non-life 194 205
Reinsurance 312 19
Total 2162 783
0
500
1000
1500
2000
2500
Undertakings not applying any of the measures Undertakings applying at least one measure
Use of MA, VA, TRFR, TTP and DBER Number of undertakings
life non-Life both life and non-life reinsurance
0
1000
2000
3000
4000
5000
6000
7000
Undertakings not applying any of themeasures
Undertakings applying at least one measure
Use of MA, VA, TRFR, TTP and DBER Technical provisions
Life Non-life

16/171
Technical provisions in EUR billions
Undertakings not
applying any of the
measures
Undertakings applying at least one measure
Life 1792 (22.3%) 6233 (77.7%)
Non-life 472 (63.4%) 272 (36.6%)
Total 2264 (25.8%) 6505 (74.2%)
730 undertakings located in 23 countries are using the VA. The TTP is used by 163
undertakings in 11 countries. The MA is used by 38 undertakings in Spain and the United Kingdom. The TRFR is used by 6 undertakings in 4 countries. Only 1 undertaking (in France) is using the DBER sub-module.
Undertakings may, and sometimes do, use more than one of the measures, as is also illustrated in this table: the total of users per measure and the number of
undertakings not using any of the measures exceeds the total number of undertakings. The use of a combination of measures is addressed in more detail in a separate section below.
Number of undertakings using the measures
Type of
undertaking
Total number of
undertakings VA TTP MA TRFR DBER
No
measure
Life 601 276 109 22 2 1 288
Non-life 1614 236 13 0 0 0 1368
Both life and non-life
399 192 41 16 3 0 194
Reinsurance 331 26 0 0 1 0 312
Total 2945 730 163 38 6 1 2162
Compared with the data as at 1st January 2016, the number of undertakings using the VA decreased by 122 compared with the data as at 1 January 2016. It is assumed
that one reason for this decrease is that some undertakings which used the VA at the start of Solvency II decided to not apply the VA at year end 2016. Also, the number of life insurance undertakings as at year end 2016 decreased by 80 compared with the
number of life insurance undertakings at the start of Solvency II. This also impacted the number of undertakings using the measures. The number of undertakings using
the TTP increased by 9 compared with the data as at 1 January 2016. This is due to new approvals for this measure in 20168. While the number of undertakings using the MA did not change, the number of MA portfolios increased. Undertakings are
8 See information on the number of new approvals in 2016 for MA, VA, TTP and TRFR in table below.

17/171
permitted to have more than one machting adjustment portfolio, with each portfolio
needing separate approval. For the TRFR the number of undertakings using the measure increased by 1 by compared with the data as at 1 January 2016. The number
of undertakings using the DBER did not change.
The following diagram provides an overview, by type of undertaking, of the proportion of undertakings using each measure. The diagram shows that the use of the measures is in particular relevant for life undertakings, as well as for undertakings pursuing both
life and non-life activities. Nearly half of all life insurance undertakings in the EEA (46%) are using the VA.
The following diagram shows the market share of technical provisions of undertakings using one of the LTG measures. This further illustrates the widespread use of the VA
in the European market (with undertakings using the VA holding 65.7% of all technical provisions in the EEA), followed by the TTP (market share of 24.8%) and the MA
(market share of 15.0%). These technical provisions, to a very large extent, relate to life insurance obligations. For example, for insurers using the VA, 95.4% of technical provisions relate to life insurance obligations, amounting to 62.7% of the overall
market share in technical provisions of 65.7%.
46%
18%
4%
48%
15%
1% 0%
85%
48%
10%
4%
49%
8%
0% 0%
94%
25%
6% 1%
73%
VA TTP MA No measure
Proportion of undertakings using each measure
Life Non-Life Both life and non-life Reinsurance Total

18/171
EEA market share in technical provisions using the measures
VA TTP MA TRFR DBER
Life 62.7% 24.5% 14.9% 0.2% 0.0%
Non-life 3.0% 0.3% 0.1% 0.1% 0.0%
Total 65.7% 24.8% 15.0% 0.3% 0.0%
Use of MA, VA, TRFR, TTP and DBER by insurance groups9
Of the 322 EEA insurance groups subject to Solvency II, 134 groups use the VA, 74 groups use the TTP and 20 groups use the MA. The TRFR is used by 3, and the DBER by 2 insurance groups. Note that, within a group, use can be made of more than one
of the measures. This explains why the total of number of groups using the measures and the number of groups not using any of the measures, exceeds the total number of
groups in the table below.
Number of EEA Solvency II groups using the measures
Total number of EEA groups
VA TTP MA TRFR DBER No
measure
EEA groups 322 134 74 20 3 1 172
9 An EEA group using a measure means that at least one solo insurance or reinsurance undertaking part of the group
uses the measure.
0%
10%
20%
30%
40%
50%
60%
70%
Volatility adjustment Transitional ontechnical provisions
Matching adjustment Transitional on risk freeinterest rate
Duration based equity
EEA market share in technical provisions of undertakings using the measures
Life Non-Life

19/171
In the EEA, 1326 insurance and reinsurance undertakings are part of an EEA Solvency
II group. 495 insurance and reinsurance undertakings part of an EEA group are using at least one of the optional LTG measures. Again, please note that a combination of
use of measures is possible.
Number of solo undertakings part of a group using the measures
Total number of solo
undertakings in EEA part of
a group
VA TTP MA TRFR DBER No
measure
Solo
undertakings in EEA
part of a group
1326
469
112
30
5
1
831
Technical provisions of EEA undertakings part of a group using the
measures
VA TTP MA TRFR DBER
Life 53.5% 20.6% 14.4% 0.2% 0.0%
Non-life 2.7% 0.2% 0.1% 0.0% 0.0%
Total 56.2% 20.8% 14.5% 0.2% 0.0%
The diagram below shows if within a group use is made, by any EEA (re)insurer within the group, of the respective measure. Again, a combination of use occurs.
The following diagram provides an overview of the percentage of solo undertakings in the EEA part of a group using the respective measure.
42%
23%
6%
53%
VA TTP MA No measure
Percentage of number of EEA groups using each measure
Number of EEA groups

20/171
Use of a combination of the measures MA, VA, TRFR, TTP and DBER
According to the Solvency II Directive it is admissible for an insurance or reinsurance undertaking to apply several measures at the same time. Certain combinations of
measures, however, are explicitly excluded:
Undertakings that apply the TTP cannot apply the TRFR (see Articles 308c(4)(b)
and 308d(5)(a) of the Solvency II Directive).
Undertakings that apply the TRFR cannot apply the MA to the same insurance and reinsurance obligations (see Article 308c(3) of the Solvency II Directive).
Undertakings that apply the MA to a portfolio of insurance or reinsurance obligations cannot apply the VA to those obligations (see Articles 77b(3) and
77d(5) of the Solvency II Directive).
The following table shows the simultaneous application of two measures with respect
to the same liabilities, with the number and market share of undertakings at EEA level applying such combination:
Combination of measures Number of
undertakings
Market share (technical
provisions)
Use of TTP and MA 27 10.7%
Use of TTP and VA 129 15.8%
Use of TRFR and VA 5 0.2%
Note that an undertaking may also use other combinations of measures, e.g. it may
combine the use of the VA and the MA, but not to the same liabilities.
Use of Symmetric adjustment to the equity risk charge
The symmetric adjustment mechanism applies to the undertakings that use the
standard formula to calculate the equity risk sub-module of the SCR, including all
undertakings using a partial internal model not covering that submodule.
35%
8% 2%
63%
VA TTP MA No measure
Percentage of number of solo undertakings part of an EEA group
using each measure

21/171
Type of undertakings Number of
undertakings Market share
(technical provisions)
Standard formula 2769 60.8%
Partial internal model not covering equity risk
51 9.6%
Total 2820 70.4%
II.2 Impact of the measures on the financial position of undertakings
Background on the impact of the measures MA, VA, TRFR and TTP
The LTG measures MA, VA, TRFR and TTP relate to the calculation of technical
provisions. But the impact of these measures on the financial position of insurance
and reinsurance undertakings is not restricted to a change in the amount of technical
provisions. The change in technical provisions itself can also have an impact on other
items of the balance sheet and on the capital requirements and own funds.
This section contains an explanation of how these LTG measures impact the financial
position of insurance and reinsurance undertakings. The description is based on the
typical effects and may not be applicable to all undertakings.
Impact on technical provisions
Removing MA, VA and TRFR usually decrease the relevant risk-free interest rates used
to calculate the technical provisions10 and consequently in most cases increase the
technical provisions by means of higher discounting effects11. Apart from the
discounting effect the measures may also impact some assumptions made in the
calculation of technical provisions, for example about the amount of future
discretionary benefits of insurance with profit participation.
The TTP directly impacts the amount of technical provisions. Removing it typically
increases the amount of technical provisions.
Impact on assets and liabilities other than technical provisions
Where removing the measures increase the amount of technical provisions this
increase in liabilities may often be accompanied by an decrease of net deferred tax
liabilities.
Impact on SCR and MCR
The measures can impact parts of the SCR and MCR calculation in different directions.
Some parts may not at all be affected by the use of the measures, for others an
10
Removing MA, VA and TRFR will in most instances reduce the relevant risk-free term structures. However, under
certain circumstances, the adjustments can turn negative. In that situation, removing the adjustment would increase the relevant risk-free interest rates. 11
It is possible under Solvency II that the part of technical provisions to which the measures are applied is negative
(for example when the value of expected insurance premiums exceeds the value of expected insurance payments). In that specific case, lower discount rates result in lower technical provisions.

22/171
increase or a decrease of the capital requirements can occur. An increase of the
capital requirement after removing the measures may in particular happen where the
technical provisions are used as measure for the size of risk that the capital
requirements aim to capture. The capital requirements may also be increased through
a higher loss-absorbing capacity of technical provisions where the removal of the
measures decreased the amount of future discretionary benefits in technical
provisions. A similar effect is the increase of the capital requirements through a higher
loss-absorbing capacity of deferred taxes where deferred taxes are decreased by the
removal of the measures.
Typically removing the measures will increase SCR and MCR.
Impact on own funds
The increase in technical provisions leads to an decrease of own funds. A slight
relative increase of technical provisions may lead to a significant relative reduction of
own funds, in particular for life insurance undertakings. For a typical life insurance
undertaking the ratio of own funds and technical provisions is 1/10. Therefore an
increase of technical provisions by 1% would lead to a reduction of own funds of 10%.
This comparison is only based on the direct impact of changes in technical provisions
on the amount of own funds. The impact may be mitigated by indirect effects, for
example a reduction in deferred tax liabilities.
Also the changes to the SCR and MCR caused by the removal of the measures can
have an impact on the eligible own funds to cover these capital requirements because
there are limits to these own funds that depend on the capital requirements.
Typically removing the measures will reduce the amount of own funds.
Summary of the impacts on the financial position
The following table summarises the typical impact on different items of the financial
position. The arrows are upward (resp. downward) if it is more likely than unlikely
that the items concerned will increase (resp. decrease) when the measures are
removed.
Items
Typical impact of
removing MA, VA,
TRFR and TTP
Technical provisions ↗
Net deferred tax liabilities ↘
Eligible own funds ↘
SCR and MCR ↗
Loss-absorbing capacity of future discretionary
benefits and deferred tax liabilities ↘

23/171
Data availability and reliability for assessing the impact of the measures in
2017
Two approaches were used to collect the necessary data in order to produce this
report.
EIOPA has collected information about the impact of the measures MA, VA, TRFR and
TTP on 1 January 2017 through the dedicated Quantitative Reporting Templates that
were sent to NSAs in 2017 for the first time since their application. The information
collected allows a consistent analysis of the impact of these four measures.
As regards to extrapolation and SA, information was collected through an information
request. The scope of the request was restricted to undertakings exceeding thresholds
on equity risk and cash-flows. Therefore the information available to EIOPA about the
impact of extrapolation and SA on the financial position of undertakings is limited but
considered as representative for those undertakings whose solvency situation is
significantly impacted by the measures.
Concerning the DBER, at the beginning of 2017 only 1 insurance undertaking was
using this measure. For this reason, the remainder of this section deals only with
extrapolation, SA, MA, VA, TRFR and TTP. The presented results relate to the
reference date of 31 December 2016.
Finally, the ERP has by definition no direct impact on the financial position of
undertakings.
Impact of the measures MA, VA, TRFR and TTP
The absolute impact of the measures MA, VA, TRFR and TTP on the whole EEA market
is set out in the following tables for all the solo undertakings and all the groups
separately. For the whole market (groups and solos) removing the measures would
increase the amount of technical provisions by 215 billion euro. Eligible own funds to
cover the SCR would reduce by 164 billion euro. The SCR would increase by 73 billion
euro.

24/171
Aggregation of the impact on all the insurance and reinsurance undertakings
Amount with MA, VA, TRFR
and TTP (billion euro)
Impact of removing the measures (billion euro) Amount without MA, VA, TRFR, and TTP (billion
euro)
Impact of TTP
Impact of TRFR
Impact of VA
Impact of MA
Impact of all
measures
Technical
provisions
8 774 128 1 32 54 215 8 988
Basic own Funds 1 518 -93 -1 -23 -49 -166 1 352
Excess of assets over liabilities
1 459 -97 -1 -23 -50 -171 1 288
Restricted own funds due to ring- fencing and matching portfolio
15 -4 0 -1 -2 -7 8
Eligible own funds to cover the SCR
1 527 -94 -1 -22 -47 -164 1 363
Tier 1 1 429 -97 -1 -25 -48 -171 1 258
Tier 2 90 1 0 1 0 2 92
Tier 3 9 2 0 2 1 5 14
SCR 666 9 0 30 34 73 739
Eligible own funds to cover the MCR
1 447 -96 -1 -24 -47 -169 1 278
MCR 234 3 0 8 8 19 253

25/171
Aggregation of the impact on all groups
Amount with MA, VA, TRFR
and TTP (billion euro)
Impact of the measures (billion euro) Amount without MA,
VA, TRFR, and TTP
(billion euro) Impact of TTP
Impact of TRFR
Impact of VA
Impact of MA
Impact of all
measures
Technical provisions
7 524 107 1 31 55 194 7 718
Basic own Funds 890 -77 0 -18 -47 -143 747
Excess of assets over liabilities
908 -81 0 -21 -50 -152 755
Restricted own funds due to ring- fencing and
matching portfolio
11 -3 0 6 -2 2 13
Eligible own funds to cover the SCR
971 -77 0 -18 -40 -135 836
Tier 1 851 -80 0 -20 -45 -144 707
Tier 2 106 1 0 1 4 5 112
Tier 3 14 1 0 1 1 4 18
SCR 491 7 0 32 35 74 564
The following graph displays the overall impact of the use of the measures MA, VA,
TRFR and TTP on the SCR ratio for the whole EEA market (including both undertakings
using and not using the measures). The impact is shown at EEA and at country level.
The graph shows the SCR ratio with (dark blue) and without (light blue) these
measures. No results at country level are shown for EE, HR, IS, LT, LV, MT, PL and SI
because the undertakings from these countries do not apply any of the measures (MA,
VA, TRFR and TTP).
At the EEA level, removing the measures would result on average12 in a decrease of
the SCR ratio by 45 percentage points. The impact goes up to 75 percentage points at country level. For two countries the average solvency ratios without the use of the
measures is below 100%. Throughout this report average ratios are weighted averages, where the denominator of the ratios was used as weights.
12
Figures at the EEA level are derived through the sum of eligible own funds and SCR of every country, including the
ones where no measures are used.

26/171
The following graphs display the overall impact of the use of the measures MA, VA,
TRFR and TTP on the SCR ratio for undertakings that apply at least one of the
measures. The impact is shown at EEA and at country level. The first graphs shows
the SCR ratio with (dark blue) and without (light blue) these measures. The red bars
are for the EEA level. The second graph shows the impact in percentage points.
At the EEA level, removing the measures result on average in a decrease of the SCR ratio by 69 percentage points. The impact goes up to 113 percentage points at
country level. For two countries the average solvency ratio without the use of the measures is below 100%. Concerning the impact in Romania, it is negative because as
at year end 2016, the volatility adjustment for the Romanian leu was negative at -2 bps.
153%
226%
265%
176%
155%
210%
176%
219%
233%
217%
172%
217%
163%
224%
205%
238%
296%
331%
225%
271%
197%
176%
268%
229%
77%
223%
265%
176%
97%
173%
137%
216%
233%
208%
170%
216%
120%
201%
182%
187%
238%
271%
223%
271%
196%
150%
252%
184%
0% 50% 100% 150% 200% 250% 300% 350%
UK
SK
SE
RO
PT
NO
NL
LU
LI
IT
IE
HU
GR
FR
FI
ES
DK
DE
CZ
CY
BG
BE
AT
EEA
Average impact of removing measures MA, VA,
TRFR and TTP on the SCR ratio of the whole EEA market
Ratio w/o MA, VA,TRFR and TTP
Ratio with MA, VA,TRFR and TTP

27/171
154%
215%
153%
136%
152%
222%
166%
194%
199%
218%
163%
183%
169%
198%
186%
223%
314%
341%
253%
218%
219%
177%
248%
217%
47%
210%
150%
136%
86%
166%
116%
187%
182%
208%
145%
181%
114%
167%
151%
147%
234%
228%
246%
210%
217%
148%
226%
148%
0% 50% 100% 150% 200% 250% 300% 350% 400%
UK
SK
SE
RO
PT
NO
NL
LU
LI
IT
IE
HU
GR
FR
FI
ES
DK
DE
CZ
CY
BG
BE
AT
EEA
Average impact of removing MA, VA, TRFR and TTP
on SCR ratio of undertakings using at least one of those measures
Ratio w/o MA, VA, TRFRand TTP
Ratio with MA, VA, TRFRand TTP

28/171
The following graphs display the impact of removing the measures MA, VA, TRFR and
TTP on the SCR ratio of every undertaking using at least one of those measures. Each
dot in the diagram represents one undertaking. The type of each undertaking is
indicated by the colour of the dot.
The horizontal axis relates to the SCR ratio without the measures MA, VA, TRFR and
TTP. The solvency ratios with all these measures that undertakings actually
apply (current SCR ratio) are shown on the vertical axis. The SCR ratio of 100% that
undertakings are required to have under Solvency II is indicated by an additional
vertical and horizontal line. The continuous diagonal line corresponds to
undertakings without an impact of the measures. Undertakings located on this
-108
-5
-3
0
-66
-57
-49
-8
-16
-9
-18
-1
-55
-30
-35
-76
-80
-113
-7
-8
-2
-29
-21
-69
-120-100-80-60-40-20020
UK
SK
SE
RO
PT
NO
NL
LU
LI
IT
IE
HU
GR
FR
FI
ES
DK
DE
CZ
CY
BG
BE
AT
EEA
Average impact of removing MA, VA, TRFR and
TTP on SCR ratio of undertakings using at least one of those measures in % pts

29/171
line have the same SCR ratios with and without measures. The more an
undertaking is located away from the diagonal line, the bigger the impact of the
measures. The broken diagonal lines corresponds to an impact of 100, 200 and 400
percentage points on the SCR ratio.
In terms of SCR ratio, 74% of undertakings using at least one measure reported an
absolute impact between 0 and 100 percentage points.
11% of the undertakings using at least one measure reported an SCR ratio without
measures below 100% (86 undertakings, with 19% of the total technical provisions in
the EEA). 1.9% of those undertakings reported negative eligible own funds to cover
the SCR without measures (15 undertakings, with 2.4% of the total technical
provisions in the EEA).
The following graphs display the impact of removing the measures MA, VA, TRFR and
TTP on the MCR ratio of every undertaking using at least one of those measures.

30/171
In terms of MCR ratio, 71% of undertakings using at least one measure reported an
absolute impact between 0 and 200 percentage points.
5% of undertakings using at least one measure reported an MCR ratio without
measures below 100% (40 undertakings, with 7% of the total technical provisions in
the EEA). 2.3% of those undertakings reported negative eligible own funds to cover
the MCR without measures (18 undertakings, with 2.6% of the total technical
provisions in the EEA).
The following graph shows the impact of removing the measures on the SCR (light
blue) and on the eligible own funds to cover the SCR (dark blue). The red bars are for the EEA level. On average, eligible own funds to cover the SCR would decrease by 19%, while the SCR would increase by 18% if the measures were removed.

31/171
The following graph displays the impact of removing the measures on the value of technical provisions (TP) at EEA and national level. Removing the measures for those
undertakings applying the measure would result in an average increase of technical provisions by 3.3% at EEA level. The impact goes up to 8.1% at country level.
-56.4%
-2.4%
-1.8%
0.0%
-43.2%
-18.5%
-9.3%
-2.9%
-4.8%
-2.1%
-8.4%
-1.0%
-27.9%
-8.9%
-18.3%
-34.3%
-5.6%
-19.0%
-0.1%
-2.7%
-0.5%
-6.8%
-4.4%
-19.1%
44.8%
0.0%
0.0%
0.0%
0.6%
9.3%
29.2%
1.1%
3.6%
2.3%
2.8%
-0.2%
6.8%
7.6%
0.8%
-0.6%
26.5%
21.2%
2.6%
0.9%
0.4%
11.4%
4.6%
18.4%
-80% -60% -40% -20% 0% 20% 40% 60%
UK
SK
SE
RO
PT
NO
NL
LU
LI
IT
IE
HU
GR
FR
FI
ES
DK
DE
CZ
CY
BG
BE
AT
EEA
Average impact of removing MA, VA, TRFR and TTP
on eligible own funds to cover the SCR (EoF SCR) and SCR of undertakings using at least one of those
measures
SCR
EoF SCR

32/171
The following graphs show the impact on the MCR ratio, the MCR and the eligible own funds to cover the MCR.
At the EEA level, removing the measures would result in an average loss of 173 percentage points with regard to the MCR ratio. The impact goes up to 386% points at
country level.
At EEA level, removing the measures decreases eligible own funds to cover the MCR 21%, while the MCR increases by 14%.
6.6%
0.7%
0.1%
0.0%
7.4%
3.0%
1.1%
0.2%
0.6%
0.5%
1.2%
0.2%
6.0%
1.3%
2.9%
8.1%
1.3%
6.3%
0.0%
1.5%
0.7%
1.1%
1.6%
3.3%
-1.0% 0.0% 1.0% 2.0% 3.0% 4.0% 5.0% 6.0% 7.0% 8.0% 9.0%
UK
SK
SE
RO
PT
NO
NL
LU
LI
IT
IE
HU
GR
FR
FI
ES
DK
DE
CZ
CY
BG
BE
AT
EEA
Average impact of removing MA, VA, TRFR and TTP on TP of
undertakings using at least one of those measures

33/171
541%
515%
373%
287%
426%
517%
384%
505%
701%
543%
442%
423%
434%
448%
596%
546%
800%
910%
765%
358%
392%
373%
774%
567%
155%
502%
366%
287%
205%
374%
311%
485%
645%
519%
399%
416%
289%
375%
474%
352%
589%
613%
762%
348%
390%
308%
713%
394%
0% 100% 200% 300% 400% 500% 600% 700% 800% 900% 1000%
UK
SK
SE
RO
PT
NO
NL
LU
LI
IT
IE
HU
GR
FR
FI
ES
DK
DE
CZ
CY
BG
BE
AT
EEA
Average impact of removing MA, VA, TRFR and TTP
on MCR ratio of undertakings using at least one of those measures
Ratio w/o MA, VA, TRFRand TTP
Ratio with MA, VA, TRFRand TTP

34/171
The box-plots bellow illustrate how the impact of removing the measures MA, VA, TTP
and TRFR is distributed across undertakings. For example, in case the removal of the
measures for an individual undertaking would lead to a decrease of basic own funds
(BoF) from 100 to 35 ubits, the relative decrease of -65% is reflected in the box-plot.
The bottom of the blue box represents the lower quartile (25th percentile) of the data
set. The top of the blue box represents the higher quartile (75th percentile) of the data
-59.8%
-2.3%
-1.9%
0.0%
-50.6%
-22.9%
-12.7%
-2.9%
-5.1%
-2.4%
-8.4%
-1.1%
-30.5%
-10.3%
-19.0%
-35.7%
-5.5%
-21.1%
-0.1%
-2.7%
-0.5%
-7.7%
-4.6%
-21.0%
40.3%
0.2%
0.0%
0.0%
2.7%
6.4%
7.7%
1.1%
3.1%
2.1%
1.5%
0.4%
4.4%
7.2%
1.9%
-0.2%
28.4%
17.0%
0.3%
0.0%
0.0%
11.5%
3.6%
13.6%
-80% -60% -40% -20% 0% 20% 40% 60%
UK
SK
SE
RO
PT
NO
NL
LU
LI
IT
IE
HU
GR
FR
FI
ES
DK
DE
CZ
CY
BG
BE
AT
EEA
Average impact of removing MA, VA, TRFR and TTP
on eligible own funds to cover the MCR (EoF MCR) and MCR of undertakings using at least one of those
measures
MCR
EoF MCR

35/171
set. The black band inside the box is always the middle quartile (50th percentile or
median). For example, with regard to the impact on BoF, in about 75% of cases, the
removal of the measures would result in a decrease of BoF. In 50% of cases, the
removal would lead to a decrease by at least 2.6%. In 25% of cases, the removal of
the measures would result in a decrease of BoF by at least 10%. The end of the lines
extending from the boxes represent the 10th and 90th percentiles, respectively.
Outliers (i.e. cases where the observed impact is higher than the 90th percentile, or
lower than the 10th percentile) are plotted as individual points. We can observe that,
in general, all relevant variables show skewed distributions and a significant number
of outliers.
Impact and relevance of extrapolation
As market information is only available for a limited amount of years, the risk-free
interest rate term structure for the purpose of the valuation of technical provisions
needs both, an interpolation between available maturities as well as an extrapolation
beyond the existing maturities.
As insurance liabilities can be very long-term, the valuation of the technical provisions
requires assumptions about interest rates for these maturities to arrive at a present
value of insurance liabilities. Thus, the extrapolation of the risk-free interest rate term
structure is a mandatory measure which cannot simply be switched off to quantify its
impact on the size of technical provisions, own funds and SCR for undertakings.
It is however possible to vary key parameters of the extrapolation mechanism to
assess the relevance of it. The extrapolation of the risk-free curve is performed via
the Smith-Wilson approach, key input parameters are the starting point of the
extrapolation (the so called last liquid point, LLP), the level of the ultimate forward
rate (UFR) to which the interest rates are extrapolated to and the convergence speed.
With regard to the impact of the extrapolation on the financial position of
undertakings the LTG report 2016 included only the results of sensitivity calculations
that insurers performed for their risk management to the extent they were available.
36/171
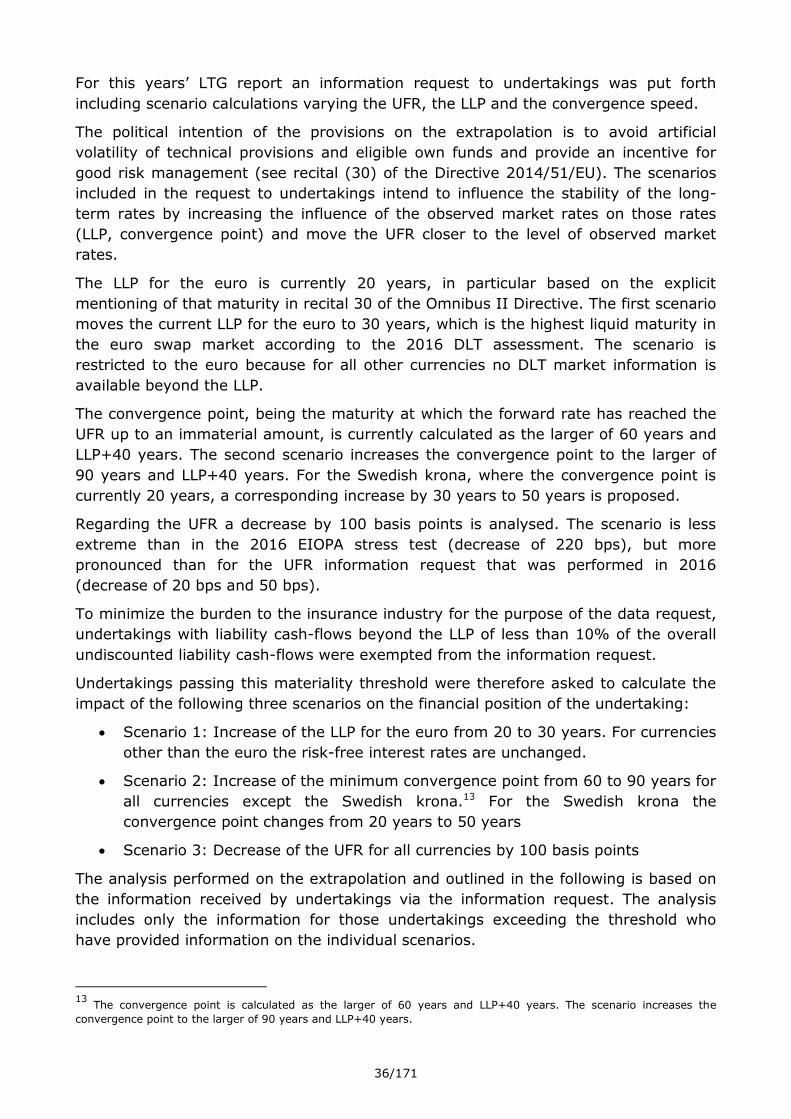
For this years’ LTG report an information request to undertakings was put forth
including scenario calculations varying the UFR, the LLP and the convergence speed.
The political intention of the provisions on the extrapolation is to avoid artificial
volatility of technical provisions and eligible own funds and provide an incentive for
good risk management (see recital (30) of the Directive 2014/51/EU). The scenarios
included in the request to undertakings intend to influence the stability of the long-
term rates by increasing the influence of the observed market rates on those rates
(LLP, convergence point) and move the UFR closer to the level of observed market
rates.
The LLP for the euro is currently 20 years, in particular based on the explicit
mentioning of that maturity in recital 30 of the Omnibus II Directive. The first scenario
moves the current LLP for the euro to 30 years, which is the highest liquid maturity in
the euro swap market according to the 2016 DLT assessment. The scenario is
restricted to the euro because for all other currencies no DLT market information is
available beyond the LLP.
The convergence point, being the maturity at which the forward rate has reached the
UFR up to an immaterial amount, is currently calculated as the larger of 60 years and
LLP+40 years. The second scenario increases the convergence point to the larger of
90 years and LLP+40 years. For the Swedish krona, where the convergence point is
currently 20 years, a corresponding increase by 30 years to 50 years is proposed.
Regarding the UFR a decrease by 100 basis points is analysed. The scenario is less
extreme than in the 2016 EIOPA stress test (decrease of 220 bps), but more
pronounced than for the UFR information request that was performed in 2016
(decrease of 20 bps and 50 bps).
To minimize the burden to the insurance industry for the purpose of the data request,
undertakings with liability cash-flows beyond the LLP of less than 10% of the overall
undiscounted liability cash-flows were exempted from the information request.
Undertakings passing this materiality threshold were therefore asked to calculate the
impact of the following three scenarios on the financial position of the undertaking:
Scenario 1: Increase of the LLP for the euro from 20 to 30 years. For currencies
other than the euro the risk-free interest rates are unchanged.
Scenario 2: Increase of the minimum convergence point from 60 to 90 years for
all currencies except the Swedish krona.13 For the Swedish krona the
convergence point changes from 20 years to 50 years
Scenario 3: Decrease of the UFR for all currencies by 100 basis points
The analysis performed on the extrapolation and outlined in the following is based on
the information received by undertakings via the information request. The analysis
includes only the information for those undertakings exceeding the threshold who
have provided information on the individual scenarios.
13
The convergence point is calculated as the larger of 60 years and LLP+40 years. The scenario increases the
convergence point to the larger of 90 years and LLP+40 years.

37/171
The data sample for the analysis on the extrapolation is thus different to the analysis
performed for the other LTG measures, which cover the whole market.
Relevance of the extrapolation
The following table summarizes the composition of the data sample on the
extrapolation by type of undertaking. It reflects the number of undertakings reporting
to exceed the materiality threshold which were included in the analysis and the
corresponding technical provisions for those undertakings:
Number of undertakings
Reporting to
exceed the threshold
Total % of Total
Life 260 601 43%
Non-Life 160 1.614 10%
Both 142 399 36%
Reinsurance 7 331 2%
Total 569 2.945 19%
Amounts in billion EUR Undertakings exceeding the
threshold
Total % of Total
Technical Provisions 5026 8769 57%
The following graph and table further detail the composition by country and by type of
undertaking within the data sample. Nearly half of the undertakings reporting to
exceed the threshold which form the basis for the quantitative analysis on the impact
of the specified scenarios on the financial position are life undertakings (260 out of
569). However, the composition varies a lot by country.

38/171

39/171
Impact of the extrapolation
Information on the impact of the specified scenarios on the financial position by
country is outlined in section III.1. Results by country are only provided for those
countries where the calculation included more than three undertakings.
For those undertakings not exceeding the threshold, the impact of the design of the
extrapolation on the financial position was expected to be immaterial. This was also
confirmed for those undertakings who voluntarily delivered information on the three
scenarios although not exceeding the threshold. The sample however contains
undertakings exceeding the threshold, who have reported an immaterial impact of the
three scenarios.
The following table outlines the absolute impact of the three specified scenarios based
on the sample of 569 undertakings. For the whole sample considered, the scenarios
impact the amount of technical provisions by 56, 12 and 27 billion euro. For scenario
Country Life Non-lifeBoth life and
non-lifeReinsurance
EEA 46% 28% 25% 1%
AT 17% 13% 70% 0%
BE 21% 21% 59% 0%
CY 100% 0% 0% 0%
CZ 0% 0% 100% 0%
DE 50% 46% 0% 4%
DK 80% 12% 8% 0%
EE 0% 50% 50% 0%
ES 28% 28% 43% 0%
FI 39% 50% 11% 0%
FR 53% 21% 26% 0%
GR 14% 0% 86% 0%
HR 20% 20% 60% 0%
HU 27% 9% 64% 0%
IE 89% 0% 11% 0%
IT 43% 10% 48% 0%
LI 86% 0% 14% 0%
LU 79% 18% 3% 0%
LV 100% 0% 0% 0%
MT 100% 0% 0% 0%
NL 79% 21% 0% 0%
NO 38% 0% 63% 0%
PL 43% 57% 0% 0%
PT 18% 64% 18% 0%
RO 57% 0% 43% 0%
SE 18% 18% 64% 0%
SI 0% 0% 100% 0%
SK 0% 0% 100% 0%
UK 100% 0% 0% 0%

40/171
1 the eligible own funds to cover the SCR decrease by 45 billion euro and the SCR
increases by 16 billion euro. Scenario 1 is also the scenario with the highest impact for
the whole sample, followed by scenario 3 and scenario 2.
Amount
with VA,
MA and
measures
on equity
risk and
equity
transitional
(billion
euro)
Impact of specified extrapolation scenarios
(billion euro)
Scenario 1:
Impact of
increasing
the LLP for
EUR from
20 to 30
years
Scenario 2:
Impact of
increasing the
minimum
convergence
point from 60
to 90 years*
Scenario 3:
Impact of
decreasing the
UFR by 100 bps
Technical
provisions 5094 56 12 27
Eligible
own funds
to cover
the SCR
724 -45 -10 -22
SCR 299 16 3 7
Eligible
own funds
to cover
the MCR
687 -46 -11 -23
MCR 114 6 1 3
* SEK increase of convergence point from 20 to 50 years
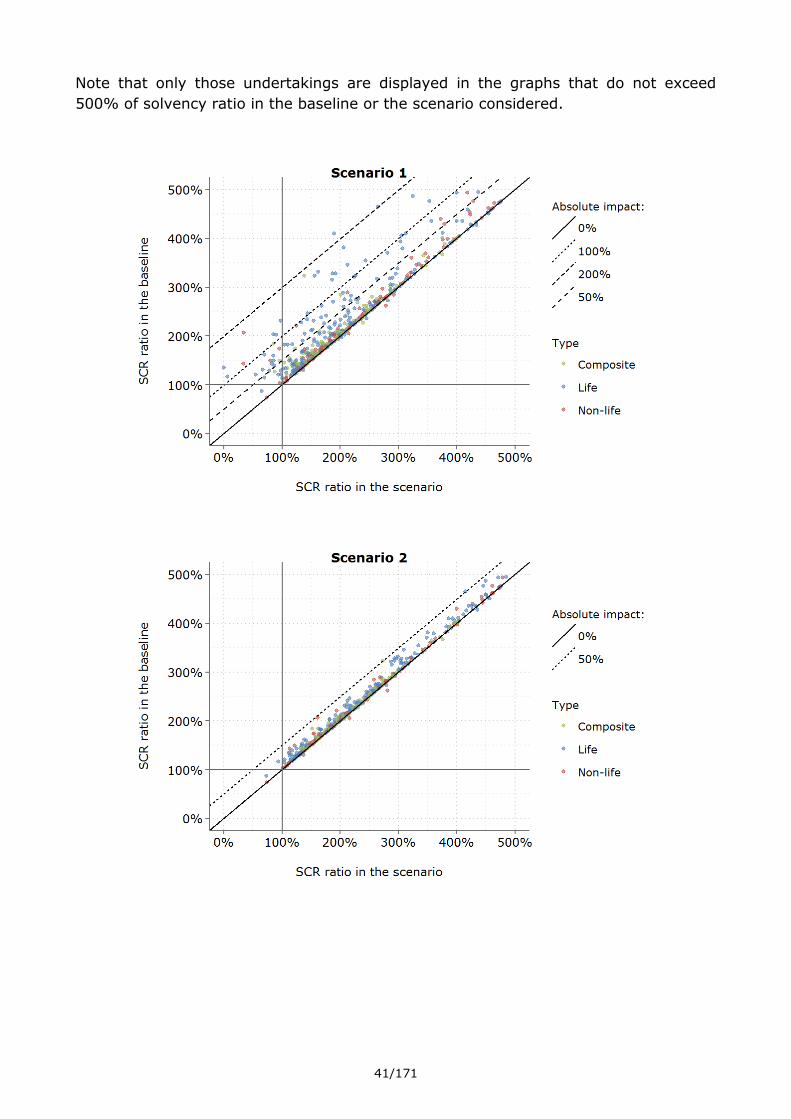
For each undertaking in the sample, the following graphs show the individual solvency
ratios in the baseline (including all other LTG measures and measures on equity risk)
against the solvency ratios in each of the three scenarios.
Each dot in the diagrams represents one undertaking. The type of each undertaking is
indicated by the colour of the dot. The horizontal axis relates to the SCR ratio in the
individual scenarios. The solvency ratios in the baseline are shown on the vertical
axis. The SCR ratio of 100% that undertakings are required to have under Solvency II
is indicated by an additional vertical and horizontal line. The more an undertaking is
located away from the diagonal line, the bigger the impact of the measures. The
broken diagonal lines corresponds to an impact of 100, 200 and 400 percentage
points on the SCR ratio.
The graphs show that the impact is very diverse across undertakings, in particular
Non-life insurers show lower impact than Life and Composite insurers.
41/171
Note that only those undertakings are displayed in the graphs that do not exceed
500% of solvency ratio in the baseline or the scenario considered.

42/171
In terms of SCR ratio, 6% of undertakings reported an absolute impact of more than
100 percentage points for scenario 1 (32 undertakings). For scenario 2 this was the
case for 1 undertaking (0,2% of undertakings) and for scenario 3 for 2% of
undertakings. The vast majority thus reported an absolute impact lower than 100
percentage points for all scenarios.
5% of undertakings in scenario 1 reported an SCR ratio below 100% (28
undertakings). This is the case for 0,7% of undertakings in scenario 2 (4
undertakings) and 2.5% of undertakings in scenario 3 (14 undertakings). For scenario
1 these undertakings make up 7.83% of technical provisions, whereas for scenarios 2
and 3 these undertakings contain 0.03% or rather 3.12% of technical provisions. To
cover the SCR again, those undertakings reporting an SCR ratio below 100% need to
increase their eligible own funds by 6,09 bn euro for scenario 1, 0.08 bn euro for
scenario 2 and 1.01 bn euro for scenario 3.
There is one undertaking having negative eligible own funds to cover the SCR already
in the baseline. No additional undertakings with negative eligible own funds were
observed for the three scenarios.
In terms of MCR ratio, 21% of undertakings reported an absolute impact of more than
100 percentage points for scenario 1 (113 undertakings). For scenario 2 this was the
case for 20 undertaking (4% of undertakings) and for scenario 3 for 11% of
undertakings (60 undertakings). The vast majority thus reported an absolute impact
lower than 100 percentage points for all scenarios.
0.8% of undertakings in scenario 1 reported an MCR ratio below 100% (4
undertakings). This is the case for 0.2% of undertakings in scenario 2 (1 undertaking)
and 0.4% of undertakings in scenario 3 (2 undertakings). For scenario 1 these
undertakings make up 0.84% of technical provisions, whereas for scenarios 2 and 3
these undertakings contain 0.01% or rather 0.02% of technical provisions. To cover
the MCR again, those undertakings reporting an MCR ratio below 100% need to

43/171
increase their EoF by 0.83 bn euro for scenario 1, 003 bn euro for scenario 2 and 0.05
bn euro for scenario 3.
The box-plots bellow illustrate how the impact of the scenarios compared to the
baseline (including VA, MA and measures on equity risk and equity transitional) is
distributed across undertakings, by showing the 1st and 3rd quartiles and the median
of reported impacts in percentage points. In addition, the red dots represent the
corresponding means. The widest distribution is observed for scenario 1, followed by
scenario 3 and scenario 2. For scenario 1 and 3 a number of outliers are observable
with impacts even below -100%, which lead to the observed differences between the
median impact and the mean impact.
Impact of the symmetric adjustment mechanism
The following table outlines the absolute impact of the the symmetric adjustment
mechanism to the equity risk sub-modul put to zero for 225 undertakings, which
submitted the information requested.
Amount with LTG
measures and on
equity risk and
equity transitional
(billion euro)
Impact of the symmetric adjustment to the equity
risk sub-modul put to zero
Without application of
the equity transitional
With application of the
equity transitional
SCR 96 1.5 0.15
MCR 32 0.39 0.03

44/171
II.3 Impact on policyholder protection
The review analyses the effect of the LTG measures and measures on equity risk on
policyholder protection. For this purpose, EIOPA has asked NSAs to report observations on the impact of the measures on policyholder protection and in particular on cases of revocation of the approval to apply one of the measures and
cases of undue capital relief by the LTG measures or measures on equity risk.
Some NSAs commented on general observations but no concrete observations of
positive or negative impacts of the LTG measures and equity risk measures on policyholder protection were raised. Furthermore, no concrete cases were identified in
which the application of the LTG measures and equity risk measures prevented NSAs from taking any supervisory measures which they would have considered desirable for policyholder protection.
As in the LTG report 2016 it was assessed whether cases of undue capital relief have occurred due to the application of the MA, the VA, the DBER or the SA. An undue
capital relief would be an unduly low amount of technical provisions or capital requirement negatively impacting policyholder protection.
NSAs typically monitor the impact of the application of the LTG measures and equity
risk measures on the undertaking’s solvency position.
With respect to the VA NSAs typically assess the impact of setting the VA to zero.
Several NSAs reported that they monitor undertaking’s investment portfolio considering the actual investment return, changes to the portfolio’s composition and credit quality and their investment strategy. This includes a comparison to the
“reference portfolio” used for the determination of the VA and undertaking’s ability to maintain its assets (do they face the risk of a forced sale of assets). Some NSAs
particularly outline that they focus on the question of whether undertakings are able to earn the VA in practice. For that purpose, a comparison of the rates actually earned by undertakings to the size of the VA or a retrospective check are suggested. These
assessments are performed on a case by case basis, but no automatic checks are performed. The processes of NSAs thereby vary, depending on whether an approval
process for the VA is foreseen.
With respect to the MA, one NSA assesses whether it is confident with the SCR calculation and Own funds determination when assessing whether cases of undue
capital relief occur. It is analyzed whether the SCR calculation is adequate considering the risks inherent in undertaking’s asset portfolio (either because of non-adequacy of
the Standard Formula or miss-calibration of the internal model) and whether Own Funds are overestimated to due an incorrect calibration of the fundamental spread (either because of an under-calibration of the floors or incorrect mapping of assets by
undertakings).
The feedback from NSAs indicates that there is no specific case yet, where undue
capital relief was observed for an undertaking due to the application of the LTG measures or measures on equity risk.
According to Article 37(1)(d) of the Solvency II Directive a capital-add on can be
applied to undertakings applying the MA, the VA or the transitional measures where the supervisory authority concludes that the risk profile of that undertaking deviates
significantly from the assumptions underlying those adjustments and transitional measures. Considering the observations made, consequently no NSA imposed yet a
capital add-on based on observed cases of undue capital relief.
Two NSAs (FR, LU) reported on a revocation of the approval to apply the TTP. The reason was that the undertakings did not use the measure or not anymore.

45/171
One NSA refused an application for the MA because the applicant was proposing to
include assets in the MA portfolio which were not eligible for inclusion.
No refusal or revocation was observed that was motivated by NSAs concerns on
undue capital relief.
Undue capital relief from MA could arise from inadequate matching of assets and
liabilities, use of MA where the liabilities are not sufficiently illiquid, and/or the
calibration of the fundamental spread (FS) does not provide adequate buffer against
the risk of adverse credit events.
This analysis will focus on whether more adverse credit events are occurring in MA
portfolios than has been anticipated by the calibration of FS.
Undertakings with approval to use MA were asked to provide information about the
losses due to default and/or downgrade that had been experienced during 2016,
alongside the fundamental spread that had been assumed during 2016.
34 responses were received (15 from ES, 19 from UK).
No undertakings reported losses from default, which is consistent with the wider
market14, whereby no investment grade defaults were observed.
5 undertakings, comprising 6 MA portfolios, reported losses from downgrade – defined
as being a loss incurred where the asset was removed from the portfolio in 2016,
following any downgrade that had taken place prior to that removal. For two of these
undertakings the proportion of the portfolio loss was roughly 2 basis points, compared
to fundamental spreads of between 65 basis points and 71 basis points on those
portfolios. The other four portfolios incurred losses due to default which were lower
than 1 basis point, compared to fundamental spreads of between 41 basis points and
59 basis points on those portfolios.
We note that the wider market experienced upgrades and downgrades that were more
widespread than might be inferred from the reported losses. One reason for the low
level of reported losses might be that insurers retained downgraded assets within
their portfolios.
The fundamental spread is designed to absorb the long-term average cost of default
and downgrade (see Article 77c (2) of the Solvency II Directive). This is not expected
to be directly comparable to a single time period. Indeed, as noted above, 2016 had a
lower than average number of defaults. Continuing this comparison on an annual
basis should help to identify periods where the fundamental spread is insufficient to
absorb the costs of adverse credit events.
The feedback from national supervisory authorities indicates that there is no specific
case yet, where undue capital relief was observed for an undertaking due to the
application of the long-term guarantee measures or measures on equity risk. No
concrete observations of positive or negative impacts of the long-term guarantees
measures and equity risk measures on policyholder protection were raised.
Furthermore, no concrete cases were identified by national supervisory authorities in
14
https://www.spglobal.com/our-insights/2016-Annual-Global-Corporate-Default-Study-and-Rating-Transitions.html

46/171
which the application of the measures prevented them from taking any supervisory
measures which they would have considered desirable for policyholder protection.
II.4 Impact on the investments of undertakings
Investment portfolios of undertakings using the measures MA, VA, TRFR or
TTP
According to Article 77f(1)(a) and (3) of the Solvency II Directive, the review should
analyse the effect of the long-term guarantees measures and measures on equity risk
on long term investment strategies. To assess the impact of measures MA, VA, TRFR
and TTP on the investments of insurance and reinsurance undertakings, EIOPA has
analysed the investment allocation of undertakings as reported to NSAs under
Solvency II. The data on asset classes were derived from the year end 2016 balance
sheet for Solvency II.
Moreover, EIOPA carried out a more in-depth analysis on certain characteristics of the
bond portfolio of insurers using the measures MA, VA, TTP or TRFR. The data used in
this analysis stem from the list of assets reported to the NSAs at the end of 2016.
Note that since some undertakings are not required to submit the list of assets
template, the bond portfolio analysis is only based on 61% of all European
undertakings.
The following graph describes the investment allocation of insurance and reinsurance
undertakings on the end of 2016. The graph shows the allocation to four main asset
classes15 at EEA level and for each country. A great diversity of the allocations at
country level can be observed. These country specificities should be taken into
account when analysing the investments of undertakings that apply the LTG measures
and equity risk measures, in particular where the use of a measure is not equally
common in all countries.
15
For a full description of each asset class please refer to Annex 3.

47/171
Investment allocation at EEA and country level
The following graph illustrates the investment allocation at the end of 2016 of
undertakings that apply the MA, VA, TRFR or TTP, or that do not apply one of these
measures, in comparison with the investment allocation of all EEA undertakings. It
shows that the investment allocation of undertakings using LTG measures differs from
that of other EEA undertakings. In particular, undertakings that apply the VA have on
average the highest proportion of corporate and government bonds, followed by
undertakings using the TTP and undertakings using the MA. Undertakings which do
not apply either one of the measures MA, VA, TRFR or TTP show, on average, a lower
proportion of corporate and government bonds when compared with the other groups.
All groups of undertakings showed a low portion of equity investments.
CountryGovernment
bonds
Corporate
bondsEquities
Assets held
for IL & UL
contracts
Other
investments
EEA 23% 22% 3% 26% 26%
AT 19% 21% 1% 16% 43%
BE 50% 22% 4% 11% 13%
BG 53% 12% 4% 2% 28%
CY 7% 16% 1% 38% 39%
CZ 46% 19% 1% 17% 17%
DE 18% 28% 1% 5% 48%
DK 9% 20% 4% 26% 42%
EE 17% 31% 0% 36% 15%
ES 54% 22% 1% 6% 17%
FI 6% 22% 4% 48% 20%
FR 28% 30% 3% 13% 26%
GR 49% 15% 1% 16% 19%
HR 61% 2% 6% 4% 27%
HU 43% 2% 1% 45% 10%
IE 11% 10% 1% 71% 7%
IT 44% 16% 1% 17% 22%
LI 3% 5% 0% 85% 7%
LT 41% 5% 0% 39% 15%
LU 12% 10% 1% 66% 11%
LV 46% 4% 1% 9% 39%
MT 29% 15% 5% 2% 49%
NL 36% 12% 3% 26% 23%
NO 13% 32% 3% 16% 35%
PL 39% 2% 0% 32% 26%
PT 36% 22% 3% 24% 15%
RO 54% 6% 0% 24% 16%
SE 10% 18% 15% 38% 20%
SI 31% 25% 2% 22% 20%
SK 42% 25% 0% 20% 12%
UK 10% 16% 4% 57% 14%

48/171
With regard to the TRFR, the number of undertakings applying this measure is very
small and thus the average investment portfolio may not be representative for each
undertaking using that measure.
With regard to this graph and the following graphs of this section caution should be
applied when analyzing the correlations between the asset allocation or the
characteristics of the bond portfolios and the use of the measures, as it is at this stage
too soon to draw any conclusion on the causal effects of these LTG measures on the
investments of undertakings.
Bond portfolio of undertakings using the MA, VA, TRFR or TTP
The following graphs illustrate the credit quality of the bond portfolio of the
undertakings applying the measures MA, VA, TRFR or TTP as at end 2016. The credit
quality is measured in credit quality steps (CQS), which vary from 0 to 6, with 0
denoting the highest credit quality and 6 denoting the lowest credit quality. Bonds
considered as “investment grade” usually have a CQS between 0 and 3.
On average, undertakings that apply the measures MA, VA, TRFR or TTP hold bonds of
lower credit quality than undertakings that do not apply any of these measures.
In relation to the credit quality of corporate bonds, there are no significant
differences between undertakings using the VA or one of the transitional measures
TRFR or TTP. However, undertakings using the transitional measures have a slightly
higher proportion of bonds of the highest credit quality compared to undertakings
using the VA. Compared to these two classes of undertakings, undertakings using the
MA show on average a lower credit quality, evidenced by a higher proportion of bonds
in CQS 2 and 3 and a lower proportion of bonds in CQS 0 and 1.
For government bonds, the data shows a significantly lower proportion of bonds in
CQS 2, across all different groups of undertakings considered. Similarly as for
corporate bonds, there are no significant differences between undertakings using the
0%
20%
40%
60%
80%
100%
Allundertakings
VA TTP TRFR MA No measure
Investment allocation of undertakings applying the measures
Others
IL & UL
Equity
Corporate bonds
Governmentbonds

49/171
VA or one of the transitional measures TRFR or TTP, and a lower average credit
quality for undertakings using the MA. Compared to the situation for corporate bonds,
the different credit quality between users of the MA and users of other measures is
more pronounced, as evidenced by a higher proportion of bonds in CQS 3.
In both cases, the weight of the non-rated bonds, which comprehends all assets for
which a credit assessment of a credit rating agency is not available to the insurance or
reinsurance undertaking, is consistent between the different groups of undertakings.
The above findings are further illustrated by the following box-plots, in which the blue
boxes represent the 25%, 50% and 75% quantiles of undertaking’s average CQS of
bond portfolios and the red dots represent the unweighted averages of this variable
for each group of undertakings.
This graph also shows that the dispersion of the credit quality of the bond portfolios of
individual undertakings is generally higher for government bonds than for corporate
bonds. Moreover, for government bonds, the average credit quality is higher than
than the mean value of the credit quality, with the exception of undertakings using
0%
20%
40%
60%
80%
100%
MA VA TTP &TRFR
Nomeasure
EEA
Corporate bonds
CQS 0 CQS 1 CQS 2 CQS 3 CQS > 3 Non rated
0%
20%
40%
60%
80%
100%
MA VA TTP &TRFR
Nomeasure
EEA
Government bonds

50/171
the MA, where the mean value is higher than the average value. This is due to the
fact that for users of the MA, 50% of undertakings have an average CQS of near to 3,
and the proportion of bonds in CQS greater than 3 is very low, so the distribution of
the credit quality of individual insurers government bond portfolios is very skewed.
Note that differences in the average asset allocation or in the characteristics of the
bond portfolios between the different groups of undertakings as analysed above are,
to some extent, due to the high degree of variety of asset investments by insurers
across different countries in the EEA, and the fact that the use of the measures is not
evenly spread across different markets. This is in particular relevant for the MA, which
is only used in two countries. More detailed information on the investments of insurers
using the MA, VA, TRFR or TTP at the level of individual countries is provided in the
third section of this report.
The following graphs illustrate the credit quality and duration of the bond portfolio of
the undertakings applying at least one the measures MA, VA, TRFR or TTP and of
undertakings not applying any of the referred measures, as at end 2016 at EEA and at
national level.
Government bonds: Credit quality for undertakings applying the measures
Country CQS 0 CQS 1 CQS 2 CQS 3 CQS > 3Non-
rated
EEA 14% 42% 3% 37% 1% 3%
AT 15% 53% 23% 9% 1% 1%
BE 9% 69% 6% 9% 1% 7%
BG 8% 0% 2% 70% 20% 0%
CY 0% 0% 0% 0% 100% 0%
DE 35% 41% 8% 12% 1% 3%
DK 70% 5% 2% 9% 3% 10%
ES 2% 2% 1% 89% 1% 6%
FI 39% 44% 1% 13% 0% 1%
FR 8% 75% 2% 13% 1% 2%
GR 16% 21% 4% 14% 41% 4%
HU 1% 1% 0% 91% 7% 1%
IE 35% 40% 10% 12% 0% 2%
IT 2% 2% 1% 94% 0% 0%
LU 14% 64% 4% 13% 1% 5%
NL 72% 19% 1% 3% 0% 3%
NO 52% 29% 8% 1% 1% 9%
PT 0% 27% 20% 52% 1% 1%
RO 0% 0% 0% 94% 0% 6%
SE 58% 41% 1% 0% 0% 0%
SK 7% 12% 79% 1% 0% 0%
UK 9% 89% 1% 1% 0% 1%

51/171
Government bonds: Credit quality for undertakings not applying the
measures
Country CQS 0 CQS 1 CQS 2 CQS 3 CQS > 3Non-
rated
EEA 31% 42% 9% 12% 2% 5%
AT 19% 52% 15% 12% 2% 1%
BE 17% 56% 12% 14% 1% 0%
BG 3% 2% 4% 85% 7% 0%
CY 12% 22% 19% 18% 26% 4%
DE 50% 36% 6% 6% 1% 1%
DK 91% 5% 0% 0% 0% 4%
EE 9% 23% 64% 4% 0% 0%
ES 11% 11% 2% 71% 2% 2%
FI 52% 27% 5% 15% 0% 0%
FR 10% 71% 2% 13% 2% 2%
GR 35% 36% 3% 3% 23% 0%
HR 3% 1% 3% 3% 89% 0%
HU 0% 0% 0% 97% 3% 0%
IE 26% 44% 10% 18% 1% 2%
IT 5% 15% 3% 76% 1% 0%
LI 73% 16% 4% 0% 0% 7%
LT 9% 15% 51% 12% 5% 9%
LU 50% 39% 4% 3% 0% 4%
LV 0% 16% 74% 6% 4% 0%
MT 41% 39% 6% 6% 0% 7%
NL 47% 37% 2% 11% 1% 2%
NO 33% 22% 2% 1% 0% 43%
PL 2% 0% 95% 2% 0% 1%
RO 1% 0% 0% 97% 1% 1%
SE 70% 8% 2% 2% 0% 18%
SI 16% 10% 47% 20% 6% 1%
SK 8% 1% 86% 4% 1% 0%
UK 21% 51% 2% 1% 0% 24%
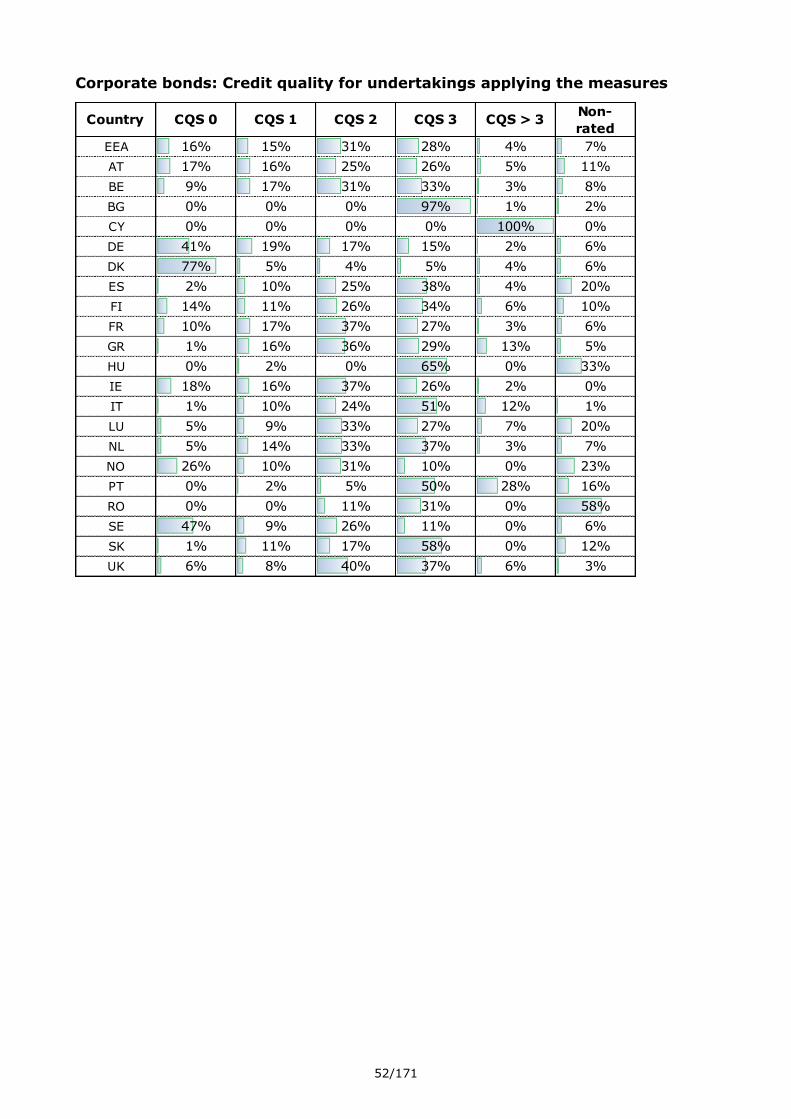
52/171
Corporate bonds: Credit quality for undertakings applying the measures
Country CQS 0 CQS 1 CQS 2 CQS 3 CQS > 3Non-
rated
EEA 16% 15% 31% 28% 4% 7%
AT 17% 16% 25% 26% 5% 11%
BE 9% 17% 31% 33% 3% 8%
BG 0% 0% 0% 97% 1% 2%
CY 0% 0% 0% 0% 100% 0%
DE 41% 19% 17% 15% 2% 6%
DK 77% 5% 4% 5% 4% 6%
ES 2% 10% 25% 38% 4% 20%
FI 14% 11% 26% 34% 6% 10%
FR 10% 17% 37% 27% 3% 6%
GR 1% 16% 36% 29% 13% 5%
HU 0% 2% 0% 65% 0% 33%
IE 18% 16% 37% 26% 2% 0%
IT 1% 10% 24% 51% 12% 1%
LU 5% 9% 33% 27% 7% 20%
NL 5% 14% 33% 37% 3% 7%
NO 26% 10% 31% 10% 0% 23%
PT 0% 2% 5% 50% 28% 16%
RO 0% 0% 11% 31% 0% 58%
SE 47% 9% 26% 11% 0% 6%
SK 1% 11% 17% 58% 0% 12%
UK 6% 8% 40% 37% 6% 3%

53/171
Corporate bonds: Credit quality for undertakings not applying the measures
Country CQS 0 CQS 1 CQS 2 CQS 3 CQS > 3Non-
rated
EEA 30% 17% 25% 19% 3% 7%
AT 29% 11% 17% 26% 7% 10%
BE 31% 15% 27% 20% 2% 4%
BG 4% 7% 6% 54% 13% 15%
CY 40% 12% 18% 22% 5% 3%
DE 43% 19% 19% 14% 2% 3%
DK 89% 3% 2% 1% 1% 4%
EE 4% 15% 29% 48% 2% 1%
ES 7% 19% 39% 28% 4% 2%
FI 5% 3% 17% 33% 7% 35%
FR 9% 18% 35% 29% 4% 6%
GR 51% 14% 10% 8% 10% 7%
HR 4% 5% 16% 39% 10% 26%
HU 0% 0% 8% 42% 31% 19%
IE 8% 16% 36% 30% 6% 4%
IT 16% 13% 35% 25% 8% 3%
LI 4% 13% 12% 3% 0% 67%
LT 25% 17% 19% 34% 5% 0%
LU 9% 15% 42% 21% 2% 10%
LV 0% 7% 11% 51% 27% 4%
MT 14% 18% 33% 34% 1% 1%
NL 14% 25% 31% 24% 1% 5%
NO 25% 4% 27% 8% 0% 36%
PL 0% 0% 30% 35% 10% 24%
PT 0% 27% 67% 6% 0% 0%
RO 0% 0% 14% 40% 18% 27%
SE 60% 7% 10% 10% 3% 11%
SI 10% 8% 22% 42% 11% 7%
SK 0% 25% 21% 38% 4% 13%
UK 5% 17% 36% 21% 1% 19%

54/171
Supervisory observations on the investment behaviour
To collect information about the impact of the LTG measures and measures on equity
risk on the investment behaviour of undertakings, EIOPA asked NSAs about their
observations regarding trends in the behaviour of undertakings as long-term
investors, the drivers associated with those trends and their view on any connections
between the measures and the trends observed.
0,0
2,0
4,0
6,0
8,0
10,0
12,0
14,0
16,0
Average duration of government bond portfolios
Undertakings using no measure Undertakings using at least one measure
0,0
2,0
4,0
6,0
8,0
10,0
12,0
Average duration of corporate bond portfolios
Undertakings using no measure Undertakings using at least one measure

55/171
Approximately half of the NSAs reported that they did not observe any trend in their
national market regarding the behaviour of undertakings as long-term investors. This
is line with the observations made in the 2016 EIOPA LTG report.
From the remaining NSAs, a third of them observed a reallocation from government
bonds to corporate bonds, a third of them witnessed an increasing investment in
illiquid assets and another third noted an increase in government bond investments.
Also, one NSA reported a trend to invest in riskier assets and an increase of indirect
investments.
NSAs were also asked whether they had observed any trend in respect of the holding
of equities. The majority of NSAs reported that they did not observe any such trend.
One NSA reported a slight increase in equity holdings, specifically equities listed in
advanced markets. Another NSA stated that where insurers have changed their
holdings of equities it is due to idiosyncratic reasons rather than due to any market
trends.
In relation to the duration of bond portfolios, most NSAs reported that they did not
observe any trend in their national markets. Conversely, three NSAs reported an
increasing trend for the duration of bond portfolios.
The main drivers for the trends and changes addressed by NSAs were the low-yield
environment (especially for the reallocation from government bonds to corporate
bonds), the search for yield and the asset-liability matching (especially for the
increase in duration). In addition, a few NSAs indicated as drivers the de-risking of
assets, the tax and legal environment and the introduction of Solvency II.
It should be noted that, in line with last year’s report, no NSA provided factual
evidence of significant links between the use of the MA, VA, SA or DBER and the
experienced trends/changes concerning the investment behaviour of undertakings as
long-term investors.
EIOPA survey on the investment behaviour of the insurance sector
As part of its work on financial stability EIOPA has carried out in 2017 a survey on the
investment behaviour of the insurance sector.16 The survey was based on data and
questionnaire responses from 87 insurance groups and 4 solo undertakings with
headquarters in 16 EEA countries. The survey analysed the investment behaviour
during the period 2011 to 2016, hence the period before the application of Solvency II
that was characterised by a persisting low yield environment. The analysis led to the
identification of a number of trends that might be associated with a search for yield
behaviour:
A trend towards lower credit rating quality fixed income securities can be seen
in the data. At the same time, the large number of sovereign and corporate
downgrades during the observation period needs to be considered.
16
See https://eiopa.europa.eu/Publications/Press%20Releases/EIOPA%20identifies%20a%20search-for-
yield%20trend%20in%20the%20investment%20behaviour%20of%20insurers.pdf.

56/171
A trend towards more illiquid investments such as non-listed equity and loans
excluding mortgages can also be identified. However, a decrease in (the value
of) property investments is also detected.
The average maturity of the bond portfolio for the majority of the sample has
overall increased in the past 5 years.
The tendency to invest into new asset classes could be observed among
insurance groups. Although the amounts are currently low compared to the size
of the portfolios, almost 75% of the sample responded positively towards
increasing their investments in asset classes such as: infrastructure,
mortgages, loans, real estate.
A small decrease in the debt portfolio is observed against a small increase in
‘other investments’ between 2015 and 2016. Equity allocation has remained
unchanged.
Nonetheless, when looking at the developments in the investment allocation on
an aggregate level, changes in all three main investment categories from 2011
to 2016 have only been marginal.
As regards the impact of the measures on the investments of undertakings, no clear
conclusions can be drawn at this stage. Half of the national supervisory authorities did
not observe a clear trend in their national market regarding the behaviour of
undertakings as long-term investors. From the remaining authorities, a third of them
observed a reallocation from government bonds to corporate bonds, a third of them
witnessed an increasing investment in illiquid assets and another third noted an
increase in government bond investments. Almost all NSAs stated that they did not
observe any significant link between the measures and the reported changes.
II.5 Impact on consumers and products
The Solvency II regulatory framework does not include a legal definition of “long-term
guarantee”. The following section has been populated based each NSA’s own definition
of LTG, which may differ across the region.
NSAs quoted the following types of products as examples of insurance products
including LTG that are currently available in their national markets:
Traditional life insurance (e.g. with profit contracts, savings products, whole
life, endowment, annuities)
Hybrid products, which combine the features of Unit Linked and With Profits
benefits.
Unit-linked products with guaranteed return or capital protection
Variable annuities
Health insurance (e.g. annuities related to disabilities, or workers
compensation)
Non-life annuities (e.g. stemming from third party liability insurance)

57/171
Specific non-life insurance products (e.g. construction risk and borrowers’
insurance)
The vast majority of products with LTG (approximately 99% based on written
premiums) occur in the life lines of business.
The following table provides a summary of the distribution of products with LTGs
across Europe. A green cell in the table indicates that there are material volumes of
LTG products of this type in the market (materiality is based on NSAs own definition).
Country Traditional Life Insurance
Hybrid Products
Unit Linked with guaranteed return or capital protection
Variable Annuities
Health insurance
Non-Life Annuities
Specific NL Insurance
AT Y N Y N N N N
BE Y N Y N Y Y N
BG Y N Y N N N N
CY Y N Y N Y N N
CZ Y N Y N Y N N
DE Y Y N N N N N
DK Y N Y N Y N N
EE Y N Y N N Y N
ES Y N Y N N N N
FI Y N Y Y Y Y N
FR Y N Y N Y Y Y
GR Y N Y N N N N
HR Y N N N N N N
HU Y N Y N N N N
IE Y N N Y N N N
IS N N N N N N N
IT Y Y N N N N N
LI Y N Y Y N N N
LT Y N Y N N N N
LU Y N N N N Y N
LV Y N N N N Y N
MT Y N N N N N N
NL Y N Y N Y N N
NO Y N N N N N N
PL Y N Y N N Y N
PT Y N Y N Y N N
RO Y N Y N Y Y N

58/171
SE Y N N N N N N
SI Y N Y Y Y N N
SK Y N Y N N N N
UK Y Y Y N Y N N
In annex 4 more detailed indication can be found of the main products available in
each market that contain LTGs.
Approximately 70% of total life technical provisions relate to business with LTGs. At a
country level, there are large differences between the relative importance of LTG
products in the market. The graph below shows the percentage of total technical
provisions for products with long-term guarantees, split by country. Please note that
this table covers all products with LTG features, irrespective of whether the LTG
measures are used or not. Please note also that these figures are indicative, as they
are based on NSAs own definition of LTG, which may differ across the national
markets.17
The following chart gives an indicative split, based on the responses from 21
countries, of written premiums for products with long-term guarantees by type of
product.
17
For Malta no percentage is shown since the total life insurance technical provisions are negative.

59/171
Traditional life insurance products with profit participation make up approximately
70% of written premium for LTG products. In this line of business, the most common
guarantees relate to minimum interest rates and guarantees on sum assured and on
surrender value. This is the most significant line of business with long-term
guarantees in the majority of countries. Most countries responded that over 95% of
the total products in this line of business contain LTGs.
Unit Linked business with guarantees makes up 14% of the total written premiums for
LTG products. In this line of business, the most common guarantees relate to return
of premiums, or guarantees on the minimum investment return. Countries can
broadly be split into two categories. In the first category, which is applicable to the
majority of the countries, the share of unit-linked products with guarantees is very
small, or indeed zero, compared to that for with-profits product. For the remaining 3
countries there are more significant shares of unit-linked business with guarantees
(EE, NL, SI). One country has indicated that unit linked products with guarantees is
the most significant source of LTG products in its market (SI).
Annuities business makes up 11% of the total written premiums for LTG products. In
this line of business, the most common guarantees relate to the payment of an
annuity (fixed of index-linked) for life. Two countries have indicated that this line of
business is the most significant source of LTG products in their country (NL, UK). All
other countries that responded indicated that products with LTGs makes up the
minority of the Annuities products on sale in their countries.
One country (IE) indicated that variable annuity business was the most significant
source of LTGs in their market. In this business, it is common to have a combination
of minimum investment return, guaranteed surrender benefit and guaranteed death
benefit.
For the small volumes of non-life products (e.g. construction risk and borrowers’
insurance), these fall into non-life lines of business such as “fire and other damage to
property insurance”, “general liability insurance” and “miscellaneous financial loss”.

60/171
LTG products are offered both by insurance undertakings that apply and that do not
apply voluntary LTG measures. LTG measures are also applied to products that do not
include long-term guarantees.
For all products the duration of such guarantees is mainly lifelong or a fixed duration.
Among NSAs that provided specific information on this respect, fixed durations no
shorter than 6-8 years were mentioned.
Trend regarding availability of products including long-term guarantee
Approximately one third of NSAs interviewed did not observe any significant change
regarding the availability of LTG products in their national market.
Almost the same number of countries observed a decreasing trend of availability of
such products; in two of them, the decreasing trend started well in advance of SII. For
none of these countries the reason for the decrease has to be related to the design of
the LTG measures. These findings are aligned with the trends observed last year.
Compared to last year (where 3 NSAs have mentioned an increasing trend) this year
only one country (LI) observed a slight increase, although with a decreasing
guaranteed rate. One NSA reported that in its market (NO) LTG products are not
available anymore since 2015. Undertaking stopped writing the business because of
the risk that the return on assets from year to year does not cover the quite high
annual interest guarantees and because of the capital that needs to be be held for this
risk. However, under existing group contracts the amount of guarantees may stil
increase because of accrual of new benefits with regard to insured persons and the
inclusion of new insured persons in the group.
In general, both in case of a decreasing availability and in case of no significant
change in the availability of these products, the following phenomena (already
mentioned last year) have been observing by a number of NSAs:
a shift to unit-linked, pure protection or hybrid products;
a decreasing level of financial guarantee included in the contracts or a change
in the way the guarantee is accounted for (not year by year but only at the end
of the contract)
a decreasing duration of the guarantees.
Moreover, in the majority of countries where a decreasing trend has been observed, it
was also reported that few undertakings (not more than 5) have stopped at all
offering these kind of products.
Similarly to what has been reported last year, the main drivers identified for the
decreasing availability of LTG products are:
the low interest rate environment (mentioned by 7 NSAs);
the increased cost of guarantees caused by the low interest rate environment
and the reflection of the cost in the Solvency II requirements, in particular in
the calculation of the technical provisions and the SCR (mentioned by 3 NSAs)

61/171
the introduction of the Risk Margin that is particularly high for products with
significant non-hedgeable risks such as longevity risk (mentioned by 1 NSA);
taxation regulation (mentioned by 3 NSAs).
Others reasons that were mentioned are the reinvestment risk, the decreasing
mortality riskand misselling issues and change in government policy on retirement
income.
On the other hand, one NSA stated that local laws and fiscal rules have contributed to
maintain stable the level of availability of these products and another NSA mentioned
that the low environment have contributed to a slight increase of the demand of these
products due to a “search for yield” from household.
With regard to the impact that the phenomena above mentioned have on consumer
protection, approximately half of the countries reported some cases of consumer
detriment where policyholders have been boosted to surrender or transfer products
with high guarantees without a full transparent information. In one country, in
particular, the phenomenon of transferring products with high guaranteed rates was
quite significant. Many of these cases happened during the financial crisis before the
entry into force of Solvency II and were mainly due to the end of the high yield
environment. Two NSAs changed the legislation in 2014 to avoid consumer detriment
when transferring from guaranteed to unit-linked products. In UK many cases were
observed with reference to annuity products both before and after the change of
legislation on pensions (April 2015). Almost all NSAs where cases of consumer
detriment were observed have promptly reacted to limit the problem and to avoid
future similar cases.
The majority of NSAs have not observed that current trends regarding the availability
of products with long-term guarantees raised consumer protection issues. Three
countries reported consumer protection issues with regard to these trends. These
issues related the provision of enough, fair and balanced information on the products
(FI), the comprehensibility of unit-linked insurance (CZ), the transparency,
complexity, conflicts of interest of hybrid life insurance products (IT). With regard to
hybrid products it was in particular observed that the level of guarantee and its
possible change over time was not transparent, high and opaque costs were opaque
and high and that there could be a conflict of interest due to the link between insurers
and assets managers.
The main supervisory activities and measures taken by NSAs were:
the improvement of regulation (especially on transparency and reporting
requirements);
ad hoc on site inspection on the transfer of products not in the consumer
interest and active discussion with the undertakings about their selling
practices;
in-depth analysis on hybrid products, share of findings with Consumer
Associations and publication of hints to consumers;
focus on the proper conduct of insurance brokers and intermediaries.

62/171
EIOPA’s survey on the investment behaviour of the insurance sector18
also analysed
the development of unit-linked and index-linked business in the context of the low
yield environment. The volume of this business has doubled from 2011 to 2016 and
78% of the participants of the survey reported changes in the product design in order
to decrease guarantees in their products or to eliminate guarantees from their
products.
LTG guarantees are included in many types of insurance products and widely spread
among European countries [70% of total life technical provisions relate to business
with LTGs], with large differences between the relative importance of LTG products in
each market. 12 NSAs (CY, FI, HR, IE, IS, LI, LV, LU, MT, PL, PT, UK) reported that
products with LTG are not present or constitute a minority in their market.
The most significant line of business with LTG products in the majority of countries is
Traditional Life Insurance products with profit participation [70% of written premium
for LTG products]; the most common guarantees relate to minimum interest rates and
guarantees on sum assured and on surrender value.
Consistently with the trends observed last year, availability of LTG products is mainly
stable or decreasing across EEA, but in general the trend was not related to the the
design of the LTG measures. In any case, a number of NSAs observed
a shift to unit-linked, pure protection or hybrid products,
a decreasing level of financial guarantee included in the contracts,
a decreasing duration of the guarantees.
The main drivers identified for the decreasing availability of LTG products are the low
interest rate environment, increased costs of guarantees and taxation regulation.
Approximately half of the countries reported some cases of consumer detriment where
policyholders have been boosted to surrender or transfer products with high
guarantees without a full transparent information. Few NSA reported consumer
protection issues regarding the introduction of new products with guarantees.
II.6 Impact on competition and level playing field in the EU insurance
market
This section on competition and level playing field is a new subsection. This topic is included in the list of relevant items for the review of the LTG measures and measures on equity risk in Article 77f(3)(c) of the Solvency II Directive, but was not included in
the report 2016 because of the scarcity of data and limited experience on the topic at that time.
In response to the question of whether they had observed any impact of the LTG measures and measures on equity risk on competition, the was majority of NSAs did not report any such observations.
18
See reference on page 55 of this report.

63/171
The focus of the analysis of competition and level playing field for this report was on
national differences in the supervisory treatment of the measures.
With regard to the internal models to calculate the SCR, two different treatments
of the VA can be observed, the modelling of a constant VA and the modelling of a dynamic VA. The approaches are further explained in section III.3. The modelling of a
dynamic VA results in a significant lower SCR for spread risk.
Ten NSAs commented that they would allow undertakings using internal models to apply the dynamic VA and reported the number of undertakings doing so as at year-
end 2016:
Country Solo
undertakings Groups
Austria 2 0
Belgium 2 0
Czech Republic 1 0
France 13 1
Germany 24 2
Italy 5 1
Luxembourg 1 0
Netherlands 7 3
The NSA from Ireland would also allow for the use of the dynamic VA but had not
received applications for approval.
The majority of NSAs reported that they did not (yet) take a decision on whether they would allow for application of the dynamic VA, either because there is no undertaking
applying an internal model in their country or because undertakings do not apply the VA. Furthermore, two NSAs are reluctant to allow undertakings using internal models
to apply the dynamic VA.
With respect to the TTP, different supervisory practices were observed concerning
the possibility to apply a lower amount of transitional deduction to technical provisions than the maximum amount that has been approved by the NSA.
Again, responses show a mixed picture:
Three NSAs indicated that undertakings in their jurisdiction always have to apply the maximum amount and argue with the reading of the SII Directive or
the transposition into national law.
Other five NSAs allow to apply a lower amount. In three of these cases however no undertaking departs from applying the maximum amount. The other two
NSAs gave further information on their practices. Whereas one considers that where a reduction of the maximum amount has been performed during the
transitional period, this cannot be repealed in later years the other NSA allows to cancel a reduction of the deduction at a later date with the pre-requisite that a consistent approach over the transitional period is followed. This NSA also
expects undertakings to reflect on their approach in the risk management framework and the ORSA.
For the remaining cases, the NSAs did not (yet) take a decision as either no undertaking applies the TTP in that country or because it was not yet

64/171
observable that undertakings wanted to apply a lower amount of the
transitional deduction than the maximum amount.
Another aspect where varying approaches have been observed is with respect to the start of the use of the transitional measures after 1 January 2016. Whereas the
majority of NSAs allow for approval of the measures also after 1 January 2016, two NSAs apply limitations and are reluctant to approve those. During 2016 the use of the transitional measures was granted to 20 undertakings from five countries.
An issue identified with regard to the applications for the TTP after 1 January 2016 is
the question which contracts need to be considered in the calculation of the transitional deduction.
Two different approaches were described by NSAs where the TTP can be applied for
after 1 January 2016:
The majority of NSAs considers that it would be necessary for undertakings to
base their calculations on the set of relevant contracts which were in the insurers’ book of business on 1 January 2016 and which are still part of the undertaking’s portfolio at the start of the transitional.
Others consider that in case of application of the TTP after 1 January 2016, undertakings would be expected to base their calculations on the set of relevant
contracts which were in the insurer's book of business on 1 January 2016. However, where the risk profile has changed considerably compared to 1 January 2016 (this could also be triggered by a drastic run-off of insurers book
of business), a recalculation would be required which would then reflect those obligations which are still part of the undertaking's portfolio as at the
recalculation date.
Where undertakings use the TTP or the TRFR, NSAs gave a clear feedback that undertakings in this case account for the change of technical provisions in the
calculation of deferred tax assets and liabilities.
With regard to the impact of the long-term guarantees measures and the measures on
equity risk on competition and level playing field different supervisory approached to
the measures were identified. The differences relate to the scope of application of the
volatility adjustment, the treatment of the volatility adjustment in internal models and
the approval of the transitional measures.
II.7 Impact on financial stability
According to Article 77f(3)(j) of the Solvency II Directive, the review of the LTG measures and measures on equity risk should analyse the effect of the measures on financial stability. For that purpose EIOPA has asked the NSAs to report any observed
concrete impact of the measures on the financial stability. One NSA observed anticyclical effects to be accounted to the application of the TTP. Undertakings using
this measure were able to recalculate the transitional amount after changes in their risk profile, which allowed them to absorb some of the impact of the sensitivity of the risk margin in relation to interest rates.
Analysis of the ESRB regarding the macroprudential consequences of the regulatory risk-free yield curve

65/171
In August 2017 the ESRB published a report on regulatory risk-free yield curve
properties and macroprudential consequences19. This report considers the macroprudential consequences of the regulatory risk-free yield curve with a view to
informing the ongoing work at EIOPA on the methodology for deriving this yield curve, as well as the upcoming Solvency II reviews. In what follows, an ad verbum
transcription of the executive summary of ESRB’s report is given:
“Executive summary
The regulatory risk-free yield curve has a direct impact on the behaviour of insurers.
It affects their provisioning and may influence hedging and investments choices. As a result,
its design and derivation from market data are important. This report considers the
macroprudential consequences of the regulatory risk-free yield curve with a view to informing
the ongoing work at the European Insurance and Occupational Pensions Authority (EIOPA) on
the methodology for deriving this yield curve, as well as the upcoming Solvency II reviews.
Macroprudential requirements for the regulatory risk-free yield curve call for the use
of a market-based curve. The requirements used for insurance regulation are: (1) realistic
estimates of liability values, (2) consistent derivation and application of the curves, (3)
adequate risk management incentives, and (4) prevention of procyclical behaviour. The first
three requirements are better achieved when the regulatory risk-free yield curve is based on
market data. The fourth requirement may conflict with the market valuation of insurers’
balance sheets. As there is some initial evidence on the procyclical behaviour of insurers
(Bank of England, 2014; De Nederlandsche Bank, 2015), potential procyclical effects should
be monitored and further work needs to be undertaken to consider how these effects and/or
their causes could be addressed through, for example, macroprudential policy measures
beyond the basic risk-free yield curve.
There are divergent views on deriving the regulatory yield curve for longer
maturities where financial markets are less liquid. For longer maturities, swap markets
and sovereign bond markets are less liquid. Solvency II takes this into consideration by using
a hybrid of market rates and extrapolations. This report assesses whether, within this setting,
the relevant parameters of the regulatory risk-free yield curve are set in accordance with
macroprudential requirements.
For the long end of the regulatory risk-free yield curve, the realistic setting of the
last liquid point (LLP) and the ultimate forward rate (UFR), and the convergence
between them, is essential. To derive the long end of the regulatory risk-free yield curve,
Solvency II applies the Smith-Wilson technique, which is based on: (1) market values for the
liquid part of the curve; (2) the LLP, which is the maturity beyond which market rates are not
used; (3) the level of the UFR, which is the assumed one-year forward rate in the distant
future; and (4) the convergence speed from the LLP to the UFR. This technique delivers fairly
stable levels of regulatory risk-free yields for the long end of the curve. The setting of these
parameters determines the regulatory risk-free yield curve.
In April 2017, EIOPA developed a methodology to derive the UFR on an ongoing
basis (European Insurance and Occupational Pensions Authority, 2017a), which will
be applied from 1 January 2018 onwards. Using this methodology, the UFR for the euro is
calculated to be 3.65%. The methodology includes a limit on the annual change of the UFR of
15 basis points. The limit implies that the UFR will be changed from 4.2% to 4.05% in 2018
and, ceteris paribus, linearly onwards. A large majority of European Systemic Risk Board
(ESRB) members favoured this reduction of the current level of the UFR, and made a policy
observation that the transition appears to be too slow, should a “low-for-long” scenario prevail
over the next decade.
This report makes three proposals, which, under current market conditions and
together with the forthcoming reduction in the UFR, would result in a lower
19
See ESRB: Regulatory risk-free yield curve properties and macroprudential consequences, August 2017,
https://www.esrb.europa.eu/pub/pdf/reports/esrb.reports170817_regulatoryriskfreeyieltcurveproperties.en.pdf.
66/171
regulatory risk-free yield curve. The findings of this report suggest that the current curve
may underestimate insurers’ liabilities and, thus, generate unrealised losses. The exact impact
of the proposed changes on the technical provisions of life insurers’ solvency should be
carefully assessed, taking into account the whole landscape of European insurers, before
arriving at a conclusion about further changes to theregulatory1 risk-free yield curve.
Comparison with the low-for-long yield stress curve used in the 2016 EIOPA stress test
indicates that the overall impact of the proposals put forward in this report should be less
significant than that of the abovementioned stress test. Potential second-round effects of a
lower risk-free yield curve, such as those caused by insurers hunting for duration, should be
monitored and may require additional macroprudential policy measures.
Specifically, the report proposes considering one or more of the points below, taking
into account that their combined implementation may require more fundamental
changes to the derivation of the regulatory risk-free yield curve:
A new method to derive the LLP and to extend the LLP for the euro regulatory
risk-free yield curve from 20 to 30 years. According to common liquidity measures,
there is little difference in liquidity between euro swap rates at 20-year and 30-year
maturities. The same holds for liquidity in euro sovereign bond markets. On the basis
of the liquidity of swap and bond markets, the LLP for the euro regulatory risk-free
yield curve should be moved to 30 years.
Extending the convergence period (from LLP to UFR) from 40 years to 100
years. This would reduce the weight of the UFR and increase the weight of the liquid
part of the regulatory risk-free yield curve when deriving the illiquid part of the
regulatory risk-free yield curve.
Blending the extrapolated part of the curve partly with market data, provided
that sufficiently reliable market data are available, as, for instance, is done in
the regulation of Swedish and Dutch pension funds. The requirement to
extrapolate the risk-free yield curve from an LLP that is set at a single maturity can
lead to excessive risk exposure to interest rate risk around that maturity and,
potentially, to procyclical hedging behaviour. Furthermore, based on the properties of
the extrapolation method, it may necessitate a relatively short-term realisation of
unrealised losses when maturity buckets of liabilities approach the LLP over time.
The analysis performed in this report provides a basis for further, ongoing reviews
of the regulatory risk-free yield curve. In particular, this report concentrates on the euro,
but when reviewing the regulatory risk-free yield curve, EIOPA may wish to analyse the
regulatory risk-free yield curves for a broader range of currencies. Since liquidity varies over
time, a regular reassessment of the LLPs, based on a fixed methodology, seems warranted.”
A description of the ESRBs’ analysis which forms the basis for the ESRB’s proposals
can be found in the main body of their work.

67/171
III. Specific analysis for each of the measures
III.1 Extrapolation of the risk-free interest rates
Recital 30 of the Omnibus II Directive states that the relevant risk-free interest rate
term structure should avoid artificial volatility of technical provisions and eligible own
funds and provide an incentive for good risk management. Furthermore, the choice of
the starting point of the extrapolation of risk-free interest rates should allow
undertakings to match with bonds the cash flows which are discounted with non-
extrapolated interest rates in the calculation of the best estimate.
Article 77a of the Solvency II Directive requires that the determination of the relevant
risk-free interest rate term structure shall make use of, and be consistent with,
information derived from relevant financial instruments. According to Article 44 of the
Solvency II Delegated Regulation20 the relevant financial instruments are interest rate
swaps and government bonds.
According to Article 77a of the Solvency II Directive the determination of the risk-free
interest rate term structure shall take into account relevant financial instruments of
those maturities where the markets for those financial instruments as well as for
bonds are deep, liquid and transparent. The highest of those maturities is called last
liquid point (LLP).
For maturities where the markets for the relevant financial instruments or for bonds
are no longer deep, liquid and transparent, the relevant risk-free interest rate term
structure shall be extrapolated. The extrapolated part of the relevant risk-free interest
rate term structure shall be based on forward rates converging smoothly from one or
a set of forward rates in relation to the longest maturities for which the relevant
financial instrument and the bonds can be observed in a deep, liquid and transparent
market to an ultimate forward rate (UFR).
The extrapolation of the risk-free interest rate term structure is a mandatory measure
which cannot simply be switched off to quantify its impact on the size of technical
provisions, own funds and SCR for undertakings. It is however possible to vary key
parameters of the extrapolation mechanism to assess the relevance of it.
As described in subsection II.2, undertakings with liability cash-flows beyond the LLP
that exceed 10% of the overall undiscounted liability cash-flows were asked to
calculate the impact of the following three scenarios on their financial position:
Scenario 1: Increase of the LLP for the euro from 20 to 30 years. For currencies
other than the euro the risk-free interest rates are unchanged.
Scenario 2: Increase of the convergence point from 60 to 90 years for all
currencies except the Swedish krona.21 For the Swedish krona the convergence
point changes from 20 years to 50 years
20
Commission Delegated Regulation (EU) 2015/35 of 10 October 2014 supplementing Directive 2009/138/EC of
the European Parliament and of the Council on the taking-up and pursuit of the business of Insurance and Reinsurance (Solvency II), OJ L 12, 17.1.2015 21
The convergence point is calculated as the larger of 60 years and LLP+40 years. The scenario increases the
convergence point to the larger of 90 years and LLP+40 years.

68/171
Scenario 3: Decrease of the UFR for all currencies by 100 basis points
The baseline on the basis of which the scenarios are calculated includes the other LTG measures.
Impact on the financial position of undertakings
As for section II.2, the analysis performed on the extrapolation and outlined in the
following is based on the information received by undertakings via the information
request including scenario calculations varying the UFR, the LLP and the convergence
speed. The analysis includes only the information for those undertakings exceeding
the threshold who have provided information on the individual scenarios.
The data sample for the analysis on the extrapolation is thus different to the analysis
performed for the other LTG measures, which cover the whole market.
Results by country are only provided for those countries where the calculation
included more than three undertakings.
The following graphs show the average impact at EEA level and per country of each of
the three specified scenarios on the SCR ratio, the SCR and the eligible own funds to
cover the SCR.
At EEA level, scenario 1 would result in a reduction of the SCR ratio by 27 percentage
points, scenario 2 would result in a reduction of the SCR ratio by 6 percentage points
and scenario 3 would result in a reduction of the SCR ratio by 12 percentage points.
The average change in SCR ratios is the highest for undertakings in Germany, and
Netherlands.

69/171

70/171
As outlined in section II.2 more than half of the undertakings in the data sample are
life and composite undertakings (402 of 569 undertakings). The following graph
displays the impact on the SCR ratios of the three specified scenarios for life and
composite undertakings only. The graph shows that the impact on the financial
position by country is typically higher for life and composite undertakings compared to
the whole sample. Particular differences are observable for Germany where the whole
sample from the data request includes a high number of non-life undertakings. The
impact on the financial position of the three scenarios on non-life and reinsurance
undertakings compared to the whole sample is typically lower than compared to the
whole sample. A graph outlining the impact on the SCR ratio for non-life and
reinsurance undertakings is included in annex 5.

71/171
The following graphs outline the impact at EEA level and by country of the three
specified scenarios on EoF and SCR.

72/171

73/171

74/171
The following graph outlines the impact at EEA level and by country of the three
specified scenarios on technical provisions. At the EEA level, scenario 1 would result in an increase of technical provisions by 1.11%, scenario 2 would result in an increase of technical provisions by 0.23% and scenario 3 would result in a an increase of technical
provisions by 0.53%.

75/171
The following graphs show the average impact of the three specified scenarios on the MCR ratio, the MCR and the eligible own funds to cover the MCR, at country and at
EEA level for undertakings in the data sample.
At the EEA level, scenario 1 would result in a reduction of the MCR ratio by 67 percentage points, scenario 2 would result in a reduction of the SCR ratio by 16
percentage points and scenario 3 would result in a reduction of the SCR ratio by 34 percentage points.

76/171

77/171

78/171

79/171
III.2 Matching adjustment
According to Recital 31 of the Omnibus Directive, where insurance and reinsurance undertakings hold bonds or other assets with similar cash-flow characteristics to
maturity, they are not exposed to the risk of changing spreads on those assets. In order to avoid changes of asset spreads from impacting on the amount of own funds
of those undertakings, they should be allowed to adjust the relevant risk-free interest rate term structure in line with the spread movements of their assets.
Insurance and reinsurance undertakings may therefore apply a matching adjustment (MA) to the relevant risk-free interest rate term structure when they value their life

80/171
insurance or reinsurance obligations, including annuities stemming from non-life
insurance.
The MA can only be applied where specific requirements on the insurance and reinsurance obligations, the assets covering the obligations and the management of these obligations and assets are met (Article 77c of the Solvency II Directive). In
particular, the expected asset cash flows must replicate each of the expected cash flows of the insurance or reinsurance obligations (cash-flow matching, Article
77c(1)(c) of that Directive).
The use of the matching adjustment under the Solvency II regime is subject to prior supervisory approval.
The matching adjustment is derived from the spreads between the interest rate that could be earned from the undertaking’s assets and the basic risk-free interest rates.
The matching adjustment is reduced by a fundamental spread that allows for expected loss from default and downgrade of the undertaking’s assets.
Undertakings calculate the MA themselves, based on their own portfolios of assets. The fundamental spreads are specified in implementing acts.
Use of the matching adjustment
38 insurance undertakings from Spain (15 undertakings) and the UK (23 undertakings) apply the MA. In 2016, the UK received 12 new applications to use the
MA. Undertakings are permitted to have more than one machting adjustment portfolio and each portfolio needs separate approval. The number of undertakings using the MA did not change compared with the data as at 1 January 2016.
Number of undertakings using MA
Country Life Non-life
Both life
and non-life
Total
Reinsurance
ES 3 0 12 0 15
UK 19 0 4 0 23
EEA 22 0 16 0 38
0
5
10
15
20
25
ES UK
Number of undertaking using MA
Life Non-life Both life and non-life Reinsurance

81/171
In the UK, 20 of these undertakings are part of a group. In Spain, 10 of these
undertakings are part of a group.
The technical provisions of undertakings applying the MA represent 14.95% of the total amount of technical provisions in the EEA. The technical provisions of
undertakings applying the MA in Spain represent 1.32% and in the United Kingdom 13.63% of the overall technical provisions in the EEA.
The insurance and reinsurance undertakings using MA and being part of a group
represent 97% of the technical provisions of undertakings applying the MA.
The following graph displays the market share in terms of technical provisions at
national level for undertakings using the MA. In the UK, undertakings representing 52.7% of the national market are using the MA. In Spain, undertakings representing
55.7% of the national market are using the MA.
According to the Solvency II Directive it is possible to apply the TTP and the MA to the
same liabilities simultaneously. 6 of the 15 undertakings in Spain are applying the TTP
0.00%
2.00%
4.00%
6.00%
8.00%
10.00%
12.00%
14.00%
16.00%
ES UK
EEA market share in technical provisions of undertakings using the MA
Life Non-life

82/171
and the MA to the same liabilities simultaneously. In UK, 21 of the 23 undertakings
are applying both the TTP and the MA to the same liabilities.
Undertakings applying the TTP and MA to the same liabilities simultaneously
Number of undertakings
% EEA market share in TP
% National market share in TP
ES 6 0.5% 20.3%
UK 21 10.2% 39.4%
EEA 27 10.7% -
The following diagram provides a summary of the number of EEA groups using the matching adjustment.
Impact on the financial position of undertakings
The results presented in this section are based on data from 2017 Quantitative Reporting Templates.
The following graph displays the average size of the MA for undertakings in countries where the MA is applied, as well as at EEA level.
1
5
14
20
0
5
10
15
20
25
NL ES UK EEA
Number of EEA groups using MA
0 20 40 60 80 100 120
Weighted average of matching adjustments (bps)
EEA
ES
UK

83/171
The following graph illustrates the dispersion of individual values for the MA in the
different markets, and at EEA level. The box and whisker plots show the dispersion for MA in Spain, the UK and the EEA. The whiskers show the lowest and highest values
recorded although two data points collected (one from Spain, one from the UK) showed an MA of 0 so their data was omitted from the calculations. The box shows
the 25th to 75th percentile with the change in colour representing the 50th percentile (or the median).
As the MA is used in two countries, Spain and United Kingdom, the impact at the EEA level is being driven by the impact in these two countries.
The following graph shows the overall impact of the use of the MA on the SCR ratio for the whole market of the countries where the MA is used. For those countries, it includes both undertakings using and not using the MA. For this sample, the MA
results on average in an increase of the SCR ratio by 18 percentage points.
The following graphs display the overall impact of the use of the MA on the SCR ratio
for undertakings that apply this measure. The impact is shown at EEA and at country
level. The first graphs shows the SCR ratio with (dark blue) and without (light blue)
0
50
100
150
200
250
300
350
ES UK EEA
Dispersion of matching adjustments (bps)
153%
238%
229%
97%
218%
211%
0% 50% 100% 150% 200% 250%
UK
ES
EEA
Average impact of removing the MA on SCR ratio of
the whole EEA market
Ratio w/o MA
Ratio with MA, VA,TRFR and TTP

84/171
the MA. The red bars are for the EEA level. The second graph shows the impact in
percentage points.
At the EEA level, removing the MA result on average in a decrease of the SCR ratio by
91 percentage points.
The following graph displays the impact of removing the MA on the SCR ratio of every
undertaking using this measures. Each dot in the diagram represents one
undertaking, comparing the individual SCR ratio against the estimated SCR ratio
without the MA. The type of each undertaking is indicated by the colour of the dot.
In terms of SCR ratio, 58% reported an absolute impact between 0% and 100%.
42% of undertakings using the measure reported an SCR ratio without MA below
100% (16 undertakings, with 12% of the total technical provisions in the EEA).13% of
those undertakings reported negative eligible own funds to cover the SCR without MA
(5 undertakings, with 1.3% of the total technical provisions in the EEA).
For this measure, there are not clear differences between Life and Composite
undertakings.
155%
264%
162%
65%
186%
71%
0% 50% 100% 150% 200% 250% 300%
UK
ES
EEA
Average mpact of removing the MA on SCR ratio for
undertakings using the measure
Ratio w/o MA
Ratio with MA
-89
-79
-91
-100-90-80-70-60-50-40-30-20-100
UK
ES
EEA
Average impact of removing the MA on SCR ratio of
undertakings using the measure in %pts
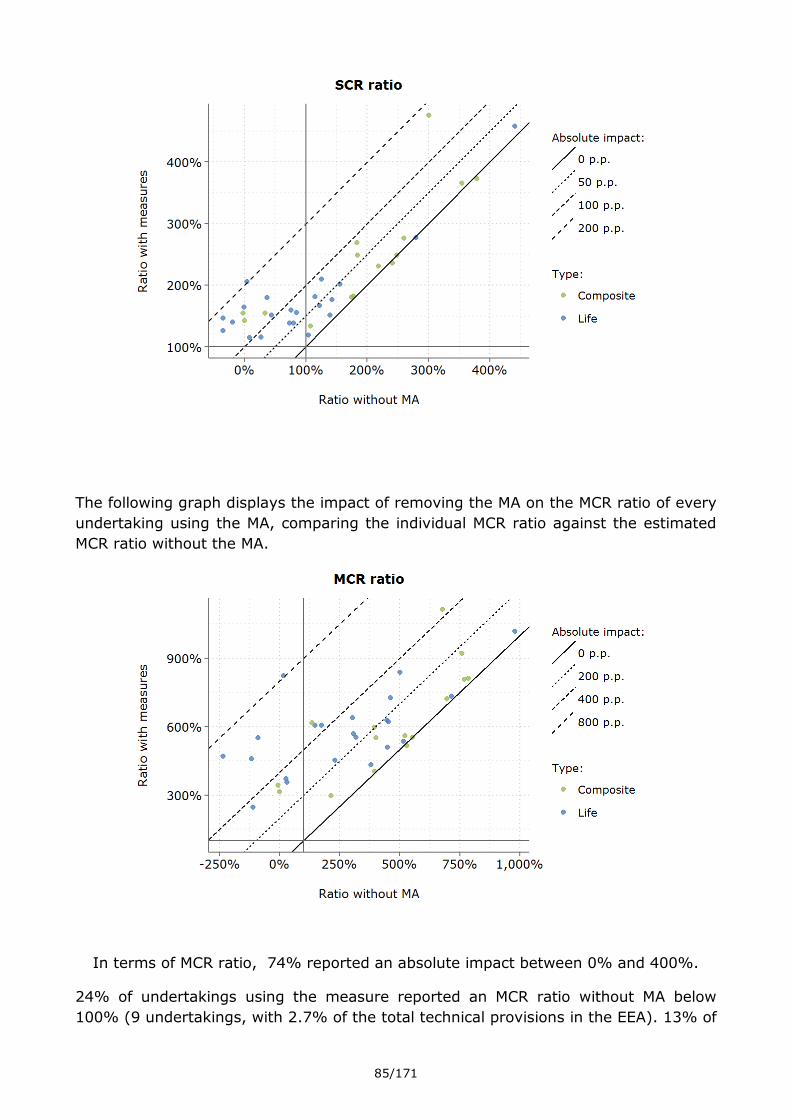
85/171
The following graph displays the impact of removing the MA on the MCR ratio of every
undertaking using the MA, comparing the individual MCR ratio against the estimated
MCR ratio without the MA.
In terms of MCR ratio, 74% reported an absolute impact between 0% and 400%.
24% of undertakings using the measure reported an MCR ratio without MA below
100% (9 undertakings, with 2.7% of the total technical provisions in the EEA). 13% of

86/171
those undertakings reported negative eligible own funds to cover the MCR without MA
(5 undertakings, with 1.3% of the total technical provisions in the EEA).
The following graph shows the impact of removing the MA on the SCR (light blue) and on the eligible own funds to cover the SCR (dark blue). The red bars are for the EEA
level. On average, eligible own funds to cover the SCR would decrease by 37%, while the SCR would increase by 44% if the MA were removed.
Regarding the impact of the MA on the SCR shown in the graph below, note that removing the MA typically increases the capital requirement for spread risk which
leads to an increase in the SCR. At the same time, where the MA is applied, no diversification between the MA portfolio and the remaining part of the portfolio can be
recognized according to articles 216 and 217 of the Solvency II Delegated Regulation. With the removal of the MA, such diversification effect can be taken into account
which leads to a decrease in the SCR. For the Spanish undertakings the latter effect overweighs and thus the effect observed when removing this measure is a reduction of the SCR due to the recognition of diversification between the matching adjustment
portfolio and the remaining part of the undertaking.
The following graph displays the impact of removing the MA on the value of technical
provisions (TP) at EEA and national level. The average increase in technical provisions without the MA for those undertakings applying the measure would be around 4% at EEA level.
-38.0%
-32.2%
-37.4%
47.1%
-3.4%
43.7%
-60% -40% -20% 0% 20% 40% 60%
UK
ES
EEA
Average impact of removing the MA on eligible own
funds to cover the SCR (EoF SCR) and SCR of undertakings using the measure
SCR
EoF SCR

87/171
The following graph shows the impact of the MA on the MCR ratio at country and at
EEA level for undertakings using that measure. Without the MA the MCR ratio would decrease on average by 314 percentage points.
4.0%
5.4%
4.1%
0.0% 1.0% 2.0% 3.0% 4.0% 5.0% 6.0%
UK
ES
EEA
Average impact of removing the MA on the
technical provisions of undertakings using the measure
559%
593%
562%
236%
408%
249%
0% 100% 200% 300% 400% 500% 600% 700%
UK
ES
EEA
Average impact of removing the MA on the MCR
ratio of undertakings using the measure
Ratio w/o MA
Ratio with MA

88/171
The box-plots below illustrate how the impact of removing the MA is distributed across undertakings.22
Impact on the investments of undertakings
The following graphs compare the average asset portfolio of undertakings applying the
MA. The first table shows the average investment allocation of undertakings using the
MA in the different countries and at EEA level. The second and third table show the
average credit quality of the portfolio of government and corporate bonds,
respectively, of undertakings applying the MA. The fourth graph shows the average
duration of the government and corporate bond portfolios for undertakings using the
22
The bottom (respectively, top) of the blue box represents the lower quartile (respectively, higher quartile) of the
data set. The black band inside the box is always the middle quartile (50th percentile or median). The end of the lines extending from the boxes (called whiskers) represent the 10th and 90th percentiles, respectively. Outliers are plotted as individual points.
-39.8%
-33.4%
-39.1%
42.4%
-3.2%
37.7%
-60% -40% -20% 0% 20% 40% 60%
UK
ES
EEA
Average impact of removing the MA on eligible own
funds to cover the MCR (EoF MCR) and MCR of
undertakings using the measure
MCR
EoF MCR

89/171
MA. These graphs show that undertakings from Spain and from the United Kingdom
that use the MA have on average different asset portfolios.
Investment allocation at EEA and country level of
undertakings applying the MA
Government bonds: Credit quality for undertakings applying the MA
Government bonds: Credit quality for undertakings applying the MA
CountryGovernment
bonds
Corporate
bondsEquities
Assets held
for IL & UL
contracts
Other
investments
EEA 19% 22% 5% 37% 17%
ES 67% 17% 0% 7% 9%
UK 13% 22% 6% 41% 18%
Country CQS 0 CQS 1 CQS 2 CQS 3 CQS > 3Non-
rated
EEA 4% 33% 0% 62% 0% 0%
ES 1% 1% 0% 97% 1% 0%
UK 9% 88% 1% 1% 0% 1%
Country CQS 0 CQS 1 CQS 2 CQS 3 CQS > 3Non-
rated
EEA 5% 9% 38% 38% 6% 4%
ES 1% 12% 32% 41% 5% 9%
UK 6% 8% 40% 38% 6% 3%
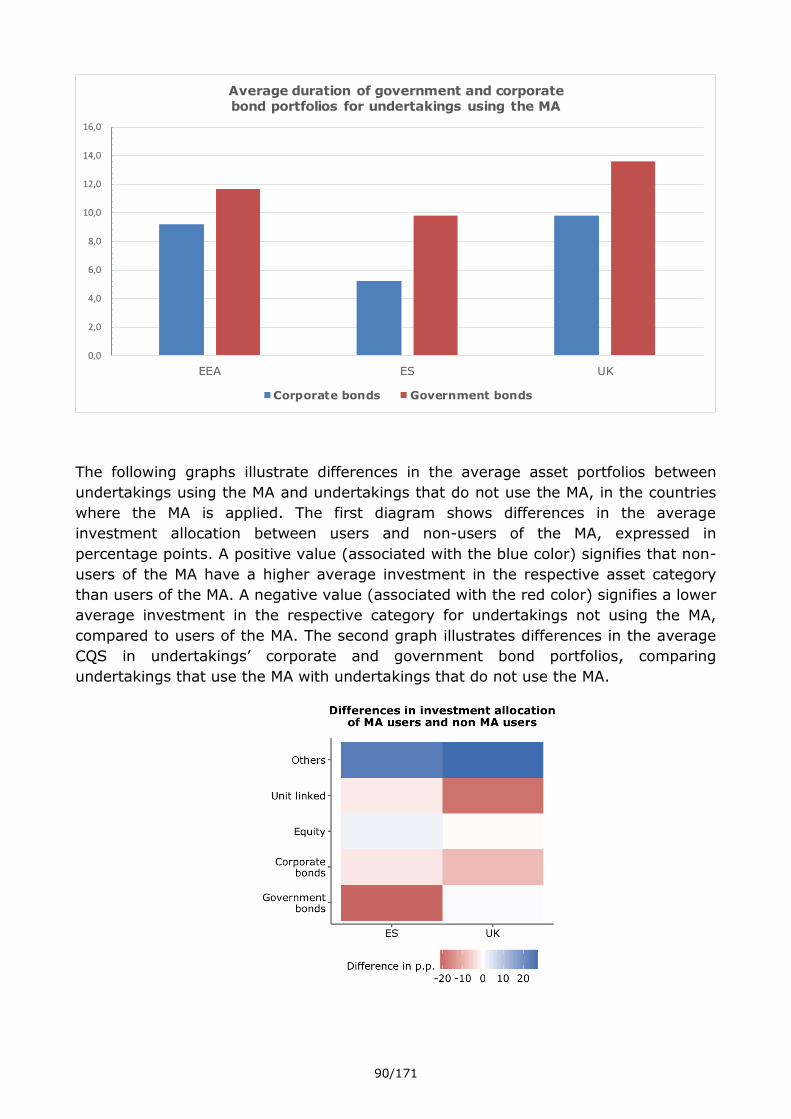
90/171
The following graphs illustrate differences in the average asset portfolios between
undertakings using the MA and undertakings that do not use the MA, in the countries
where the MA is applied. The first diagram shows differences in the average
investment allocation between users and non-users of the MA, expressed in
percentage points. A positive value (associated with the blue color) signifies that non-
users of the MA have a higher average investment in the respective asset category
than users of the MA. A negative value (associated with the red color) signifies a lower
average investment in the respective category for undertakings not using the MA,
compared to users of the MA. The second graph illustrates differences in the average
CQS in undertakings’ corporate and government bond portfolios, comparing
undertakings that use the MA with undertakings that do not use the MA.
0,0
2,0
4,0
6,0
8,0
10,0
12,0
14,0
16,0
EEA ES UK
Average duration of government and corporate bond portfolios for undertakings using the MA
Corporate bonds Government bonds

91/171
Impact on consumers and products
The following table sets out the share of gross written premiums of undertakings
using the MA compared to the total gross premiums written by all undertakings, for
each line of business (columns 1 to 6) the total life insurance and life reinsurance
business (column 7), and the total for non-life insurance and reinsurance business
(column 8). The table is based on data reported by undertakings in the annual QRTs
for 2016.
Country 1. Health insurance
2. Insurance with profit
participation
3. Index linked
and unit linked
insurance
4. Other life
insurance
5. Health reinsurance
6. Life reinsurance
7. Total life insurance
and reinsurance
8. Total non-life
insurance and
reinsurance
ES 0.0% 14.0% 59.0% 73.7% 0.0% 6.4% 51.2% 6.2%
UK 46.7% 93.4% 20.2% 90.3% 45.2% 88.8% 63.5% 1.9%
EEA 1.6% 4.6% 7.7% 46.5% 2.1% 58.4% 18.7% 0.7%
With respect to the insurance products offered by insurance undertakings applying the
MA in Spain, the following characteristics have been reported by the NSA:
the purpose of the products is saving for retirement,
the insurance obligations for the products fall in the Solvency II line of business
“other life insurance”,
the products guarantee life annuities or a lump sum payment,
the products offer a guaranteed interest rate.
In the United Kingdom, MA-eligible liabilities primarily consist of ‘individual’ annuities
and ‘bulk-purchase’ annuities. At a basic level an annuity is a contract that pays an
income to the policyholder in return for an upfront premium, although as with any
contract there are variants on this core theme (for example, in some cases the income
stream increases in line with an inflation index). An ‘individual’ annuity is sold to
individual policyholders, usually at retirement. ‘Bulk-purchase’ annuities are products
that are generally sold to pension funds, which purchase an annuity-style asset to
cover some or all of the liabilities of the pension fund. These products fall under the
Solvency II line of business “other life insurance”.

92/171
III.3 Volatility adjustment
Recital 32 of the Omnibus II Directive states that in order to prevent pro-cyclical
investment behaviour, insurance and reinsurance undertakings should be allowed to
adjust the relevant risk-free interest rate term structure to mitigate the effect of
exaggerations of bond spreads.
For that purpose insurance and reinsurance undertakings can apply a volatility
adjustment (VA) to the risk-free interest rate term structure. The VA is based on 65%
of the risk-corrected spread between the interest rate that could be earned from a
reference portfolio of assets and the risk-free interest rates without any adjustment.
The reference portfolio is representative for the assets which insurance and
reinsurance undertakings are invested in to cover their insurance and reinsurance
obligations.
Member States may require prior approval by supervisory authorities for insurance
and reinsurance undertakings to apply a VA. 10 countries impose such an approval
process (DE, DK, EE, HR, IE, PL, PT, RO, SI, UK).
The VA is derived per currency. It is the same for all insurance and reinsurance
obligations of a currency unless a country specific increase applies.
Undertakings that apply a VA to a portfolio of insurance or reinsurance obligations
shall not apply a MA to those obligations.
Article 77d(6) of the Solvency Directive states that by way of derogation from Article
101, the SCR shall not cover the risk of loss of basic own funds resulting from changes
of the VA.
Use of the volatility adjustment
The VA is used by 730 undertakings in 23 countries (AT, BE, BG, CY, CZ, DE, DK, ES, FI, FR, GR, HU, IE, IT, LI, LU, NL, NO, PT, RO, SE, SK and UK).
Number of undertakings using VA
0
20
40
60
80
100
120
140
160
180
200
AT BE BG CY CZ DE DK ES FI FR GR HU IE IT LI LU NL NO PT RO SE SK UK
Number of undertakings using VA
Life Non-life Both life and non-life Reinsurance

93/171
Country Life Non-life Both life and
non-life
Total
Variation from last
year Reinsurance
AT 2 3 8 2 15 -4
BE 9 12 16 0 37 -3
BG 0 3 4 0 7 -5
CY 1 0 0 0 1 -1
CZ 0 1 7 0 8 -2
DE 59 20 0 3 82 -1
DK 20 6 0 0 26 11
ES 17 33 36 1 87 1
FI 5 3 2 0 10 0
FR 49 70 66 4 189 -28
GR 2 6 15 0 23 -3
HU 1 1 5 0 7 -1
IE 4 1 0 2 7 1
IT 30 26 18 0 74 -18
LI 2 0 0 0 2 -3
LU 26 10 0 12 48 -63
NL 24 18 0 2 44 -9
NO 3 3 4 0 10 3
PT 7 8 1 0 16 0
RO 0 0 1 0 1 0
SE 2 1 0 0 3 2
SK 1 0 4 0 5 1
UK 12 11 5 0 28 0
EEA 276 236 192 26 730 -122
The total number of undertakings using the VA in the EEA decreases with 122 in comparison to last year’s report. The most relevant decrease in the number of VA users occurred in Luxembourg, France and Italy. The most relevant increase in the
number of VA users occurred in Denmark.
Six countries received in total 23 applications to use the VA after 1 January 2016. The
following table shows the number of applications in the countries concerned:
Country VA
Denmark 11
Estonia 1
Germany 3
Ireland 1
Romania 1
UK 7
Total 23
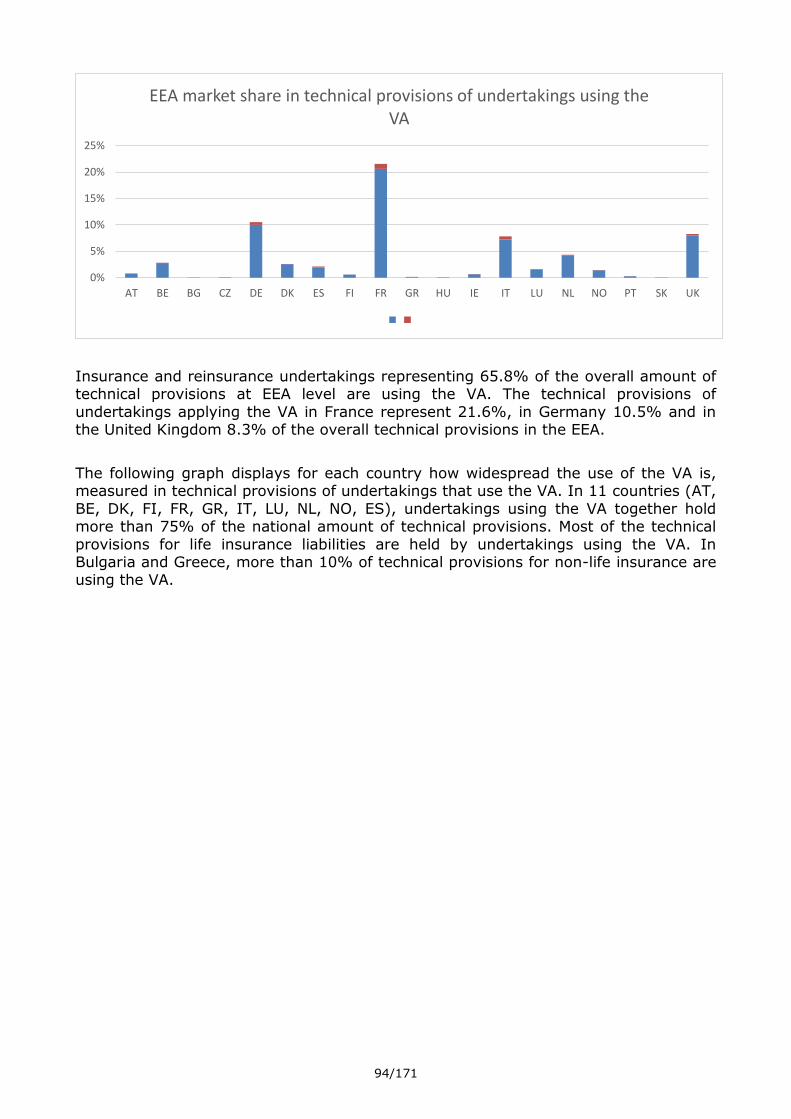
94/171
Insurance and reinsurance undertakings representing 65.8% of the overall amount of technical provisions at EEA level are using the VA. The technical provisions of
undertakings applying the VA in France represent 21.6%, in Germany 10.5% and in the United Kingdom 8.3% of the overall technical provisions in the EEA.
The following graph displays for each country how widespread the use of the VA is, measured in technical provisions of undertakings that use the VA. In 11 countries (AT,
BE, DK, FI, FR, GR, IT, LU, NL, NO, ES), undertakings using the VA together hold more than 75% of the national amount of technical provisions. Most of the technical
provisions for life insurance liabilities are held by undertakings using the VA. In Bulgaria and Greece, more than 10% of technical provisions for non-life insurance are using the VA.
0%
5%
10%
15%
20%
25%
AT BE BG CZ DE DK ES FI FR GR HU IE IT LU NL NO PT SK UK
EEA market share in technical provisions of undertakings using the VA

95/171
According to the Solvency II Directive it is possible to apply simultaneously the TTP or the TRFR and the VA to the same liabilities.
At EEA level, undertakings with 15.8% of the overall amount of technical provisions
are applying the VA and the TTP or the TRFR to the same liabilities.
Undertakings applying simultaneously TTP and VA to the same liabilities
Country Number of
undertakings % EEA market
share in TP % National market
share in TP
AT 2 (*) (*)
BE 1 (*) (*)
DE 51 4% 25%
ES 22 1% 40%
0% 20% 40% 60% 80% 100% 120%
AT
BE
BG
CZ
DE
DK
ES
FI
FR
GR
HU
IE
IT
LU
NL
NO
PT
SK
UK
National market share in technical provisions of undertakings using the VA

96/171
FI 7 0% 57%
FR 12 2% 9%
GR 1 (*) (*)
IE 1 (*) (*)
LI 1 (*) (*)
NO 5 1% 83%
PT 9 0% 44%
UK 17 6% 25%
EEA 129 15.8% -
(*) Data from Austria, Belgium, Greece, Ireland, Liechtenstein are not disclosed for confidentiality reasons because the number of undertakings concerned is lower than
3.
The following diagram shows the number of EEA groups using VA.
469 of the 730 EEA insurance and reinsurance undertakings using the VA are part of a group. In Germany, all EEA solo undertakings using VA are part of a group.
The 469 EEA undertakings being part of a group represent 56.2% of the EEA market share in technical provisions of undertakings applying the VA.
2
8
35
4
14
2
18
3
11
3
14
2 2 2
14
0
5
10
15
20
25
30
35
40
AT BE DE DK ES FI FR GR IT LU NL NO PT SE UK
Number of EEA groups using VA
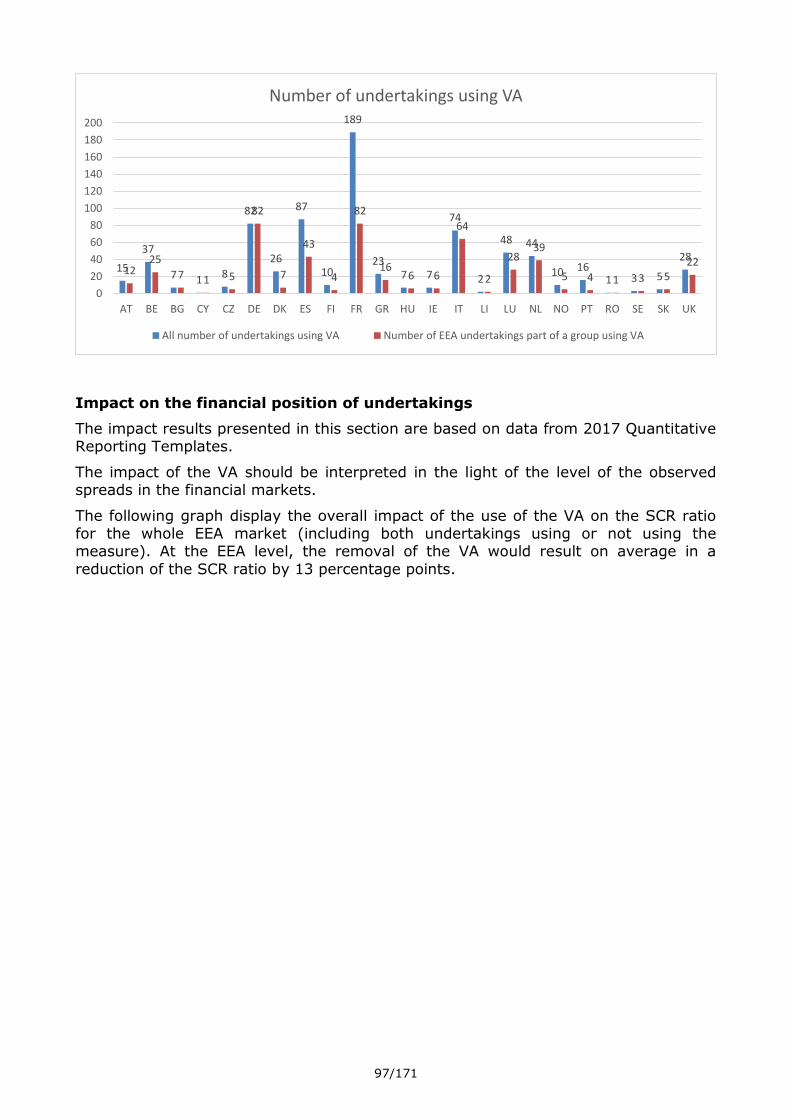
97/171
Impact on the financial position of undertakings
The impact results presented in this section are based on data from 2017 Quantitative Reporting Templates.
The impact of the VA should be interpreted in the light of the level of the observed spreads in the financial markets.
The following graph display the overall impact of the use of the VA on the SCR ratio for the whole EEA market (including both undertakings using or not using the measure). At the EEA level, the removal of the VA would result on average in a
reduction of the SCR ratio by 13 percentage points.
15
37
7 1 8
82
26
87
10
189
23 7 7
74
2
48 44
10 16 1 3 5
28 12
25
7 1 5
82
7
43
4
82
16 6 6
64
2
28 39
5 4 1 3 5 22
0
20
40
60
80
100
120
140
160
180
200
AT BE BG CY CZ DE DK ES FI FR GR HU IE IT LI LU NL NO PT RO SE SK UK
Number of undertakings using VA
All number of undertakings using VA Number of EEA undertakings part of a group using VA

98/171
The following graphs show the average impact at EEA level and per country of the VA on the SCR ratio. The graphs are based on impact of the VA for the undertakings that
apply the VA.
At EEA level removing the VA results in an average reduction of the SCR ratio of 24
percentage points. The average change in SCR ratios is the highest for undertakings in Germany, Denmark, and Netherlands. This comes from the fact that the impacts on SCR are significantly higher for those countries.
153%
226%
265%
176%
155%
210%
176%
219%
233%
217%
172%
217%
163%
224%
205%
238%
296%
331%
225%
271%
197%
176%
268%
229%
151%
223%
265%
176%
152%
197%
137%
216%
233%
208%
172%
216%
156%
210%
201%
234%
238%
306%
223%
271%
196%
151%
258%
216%
0% 50% 100% 150% 200% 250% 300% 350%
UK
SK
SE
RO
PT
NO
NL
LU
LI
IT
IE
HU
GR
FR
FI
ES
DK
DE
CZ
CY
BG
BE
AT
EEA
Average impact of removing the VA on the SCR
ratio of the whole EEA market
Ratio w/o VA
Ratio with MA, VA,TRFR and TTP

99/171
160%
215%
153%
136%
172%
215%
166%
194%
199%
218%
163%
183%
169%
197%
186%
223%
314%
339%
253%
218%
219%
177%
247%
223%
154%
210%
150%
136%
165%
194%
116%
187%
186%
208%
156%
181%
160%
180%
180%
217%
234%
286%
246%
210%
217%
150%
232%
199%
0% 50% 100% 150% 200% 250% 300% 350% 400%
UK
SK
SE
RO
PT
NO
NL
LU
LI
IT
IE
HU
GR
FR
FI
ES
DK
DE
CZ
CY
BG
BE
AT
EEA
Average impact of removing the VA on the SCR
ratio of undertakings using the measure
Ratio w/o VA
Ratio with VA

100/171
The following graph displays the impact of removing the VA on the SCR ratio of every
undertaking using this measures. Each dot in the diagram represents one
undertaking, comparing the individual SCR ratio against the estimated SCR ratio
without the VA. The type of each undertaking is indicated by the colour of the dot.
In terms of SCR ratio, 83% of undertakings that use the VA reported an absolute
impact between 0% and 50%.
3% of undertakings using the measure reported an SCR ratio without VA below 100%
(20 undertakings, with 3.3% of the total technical provisions in the EEA). 0.4% of
these undertakings reported negative eligible own funds to cover the SCR without VA
(3 undertakings, with 0.01% of the total technical provisions in the EEA).
-6
-5
-3
0
-7
-21
-49
-8
-12
-9
-7
-1
-9
-18
-6
-6
-80
-53
-7
-8
-2
-27
-15
-24
-90-80-70-60-50-40-30-20-10010
UK
SK
SE
RO
PT
NO
NL
LU
LI
IT
IE
HU
GR
FR
FI
ES
DK
DE
CZ
CY
BG
BE
AT
EEA
Average impact of the VA on the SCR ratio of undertakings using the measure in %pts

101/171
Also note that the Life and Composite undertakings show, in general, slightly higher
impacts on this level than Non-life undertakings.
The following graph displays the impact of removing the MA on the MCR ratio of every
undertaking using the MA, comparing the individual MCR ratio against the estimated
MCR ratio without the MA. In terms of MCR ratio, 83% of undertakings that use the
VA reported an absolute impact between 0% and 100%.
0.7% of undertakings using the measure reported an MCR ratio without VA below
100% (5 undertakings, with 0.01% of the total technical provisions in the EEA). 0.4%
of these undertakings reported negative eligible own funds to cover the MCR without
VA (3 undertakings, with 0.01% of the total technical provisions in the EEA).

102/171
The following graph shows the impact of removing the VA on the SCR (light blue) and
on the eligible own funds to cover the SCR (dark blue). The red bars are for the EEA level. On average, eligible own funds to cover the SCR would decrease by 3%, while
the SCR would increase by 9% if the VA were removed.
The following graph displays the impact of removing the VA on the value of technical
provisions (TP) at EEA and national level. Removing the VA for those undertakings applying the measure would result in an average increase of technical provisions by 0,6% at EEA level.
-3.3%
-2.4%
-1.8%
0.0%
-3.5%
-4.5%
-9.3%
-2.9%
-2.9%
-2.1%
-3.0%
-1.0%
-3.1%
-3.0%
-2.4%
-2.3%
-5.6%
-1.2%
-0.1%
-2.7%
-0.5%
-5.9%
-2.2%
-2.9%
0.7%
0.0%
0.0%
0.0%
0.7%
5.9%
29.2%
1.1%
3.6%
2.3%
1.3%
-0.2%
2.4%
6.5%
0.8%
0.3%
26.5%
16.9%
2.6%
0.9%
0.4%
11.1%
4.1%
8.6%
-15% -10% -5% 0% 5% 10% 15% 20% 25% 30% 35%
UK
SK
SE
RO
PT
NO
NL
LU
LI
IT
IE
HU
GR
FR
FI
ES
DK
DE
CZ
CY
BG
BE
AT
EEA
Average impact of removing the VA on eligible
own funds to cover the SCR (EoF SCR) and SCR of undertakings using the measure
SCR
EoF SCR

103/171
The following graphs show the average impact of the VA on the MCR ratio, the MCR
and the eligible own funds to cover the MCR, at country and at EEA level for undertakings using that measure. At the EEA level, the removal of the VA would result on average in a reduction of the MCR ratio by 52 percentage points.
0.6%
0.7%
0.1%
0.0%
0.5%
0.8%
1.1%
0.2%
0.3%
0.5%
0.4%
0.2%
0.7%
0.4%
0.4%
0.4%
1.3%
0.4%
0.0%
1.5%
0.7%
0.9%
0.7%
0.6%
-0.5% 0.0% 0.5% 1.0% 1.5% 2.0%
UK
SK
SE
RO
PT
NO
NL
LU
LI
IT
IE
HU
GR
FR
FI
ES
DK
DE
CZ
CY
BG
BE
AT
EEA
Average impact of removing the VA on the
technical provisions of undertakings using the measure

104/171
526%
515%
373%
287%
372%
500%
384%
505%
701%
543%
442%
423%
434%
447%
596%
547%
800%
911%
765%
358%
392%
373%
777%
562%
503%
502%
366%
287%
352%
442%
311%
485%
660%
519%
425%
416%
415%
407%
577%
532%
589%
793%
762%
348%
390%
312%
742%
510%
0% 100% 200% 300% 400% 500% 600% 700% 800% 900% 1000%
UK
SK
SE
RO
PT
NO
NL
LU
LI
IT
IE
HU
GR
FR
FI
ES
DK
DE
CZ
CY
BG
BE
AT
EEA
Average impact of removing the VA on the MCR
ratio of undertakings using the measure
Ratio w/o VA
Ratio with VA

105/171
The box-plots below illustrate how the impact of removing the measures VA is
distributed across undertakings.23 In terms of how the impact of measures is distributed across undertakings, VA users
present slightly skewed distributions, with a number of outliers.
23
The bottom (respectively, top) of the blue box represents the lower quartile (respectively, higher quartile) of the
data set. The black band inside the box is always the middle quartile (50th percentile or median). The end of the lines extending from the boxes (called whiskers) represent the 10th and 90th percentiles, respectively. Outliers are plotted as individual points.
-3.5%
-2.3%
-1.9%
0.0%
-4.8%
-6.2%
-12.7%
-2.9%
-3.0%
-2.4%
-3.1%
-1.1%
-3.6%
-3.4%
-2.5%
-2.4%
-5.5%
-1.6%
-0.1%
-2.7%
-0.5%
-6.7%
-2.3%
-3.4%
1.0%
0.2%
0.0%
0.0%
0.5%
6.2%
7.7%
1.1%
3.1%
2.1%
0.9%
0.4%
0.8%
6.0%
0.6%
0.4%
28.4%
13.0%
0.3%
0.0%
0.0%
11.3%
2.4%
6.5%
-20% -10% 0% 10% 20% 30% 40%
UK
SK
SE
RO
PT
NO
NL
LU
LI
IT
IE
HU
GR
FR
FI
ES
DK
DE
CZ
CY
BG
BE
AT
EEA
Average impact of removing the VA on eligible own
funds to cover the MCR (EoF MCR) and MCR of
undertakings using the measure
MCR
EoF MCR

106/171
Analysing the distribution of the relative impact on the SCR per type of SCR formula,
we conclude that on average, IM and PIM users reported higher impacts than SF
users. Also, the IM and PIM users show a more skewed distribution, while most SF
users reported an almost zero impact.
The size of the VA as at year end 2016 for the Euro is 13 bps and has thus decreased
from year end 2015 where it was 22bps. The graphs presented in this section show that the impact of a removal of the VA on the solvency position is considerable for a
number of countries. This was already observed in the LTG report 2016. Although the size of the European VA has decreased by 40% in 2016 compared to 2015, the impact
of a removal of the VA has not mirrored that decrease for a number of countries. Nevertheless, the magnitude of the impact differs from one country to another. Besides, one should keep in mind that last year report was based on stress test
sample data whereas this year report is based on the QRT data so the size and the nature of the sample are different as for example this year it contains also non-life
undertakings. Moreover, the comparisons of the figures are affected by the dynamic modelling of the VA of some internal model users that are embedded in the analysis.

107/171
Treatment of the VA in internal models
Two different treatments of the VA can be observed where internal modes are used to calculate the SCR. In some internal models the VA is considered to remain unchanged
during the following 12 months (constant VA). This approach is the same as the treatment of the VA in the standard formula for the calculation of the SCR. Other
internal models take account of the possible change of the VA during the following 12 months (dynamic VA). The VA can change over time because the spreads of the market indices that the VA calculation is based on change or because the risk
correction to the VA changes. Another reason for change to the VA can be changes in the investment behaviour of insurance and reinsurance undertakings as reflected in
the annual updates of the representative portfolio of assets that are applied in the VA calculation.
Where the VA moves in line with the spreads on the assets of the undertaking, the
modelling of a dynamic VA reduces the effect of spread widening and spread narrowing on the own funds of the insurer: Decreases in asset value caused by the
spread widening are partially or fully compensated by decreases of technical provisions caused by the change of the VA. In the same way increases in asset values caused by narrower spreads are compensated. As a results the capital requirements
for the risk of spread widening are usually lower if a dynamic VA is modelled than if a constant VA is being used.
EIOPA has analysed internal models that include a dynamic VA in 2017. The analysis covered internal models from 7 insurance groups with headquarters in 5 countries and assessed in particular the impact of the modelling of a dynamic VA on the solvency
position of the groups or some of their undertakings at the end of 2016. For the sample of groups and undertakings that provided comparable figures, the modelling of
a dynamic VA results in a capital requirement for spread risk that is about half as large as the capital requirement derived by using a constant VA. The overall SCR derived with a dynamic VA is in the range of 69% to 94% of the SCR calculated with a
constant VA. Compared to the use of the constant VA, the use of a dynamic VA increased the SCR ratio by 15 to 62 % points.
The analysis also showed that the modelling approaches to the dynamic VA differ across internal models, in particular regarding the calculation of the future VAs and how they are taken into account in the balance sheet. Views among the participating
groups were split on whether the modelling of a dynamic VA produces incentives to move towards riskier assets and whether it might foster herding behaviour towards
the representative portfolio of assets that the VA calculation is based on.
EIOPA issued an opinion on the supervisory assessment of internal models including a
dynamic VA.24
Application of a country-specific increase to the VA
Background information on the calculation of the VA
For each currency the VA is calculated as 65% of a risk-corrected spread (S_RCcurrency). The relevant spread is the difference between the interest rate that could be earned from assets included in a reference portfolio for assets in that
currency and the basic risk-free interest rates for that currency.
24
link to opinion

108/171
A country-specific increase to the VA may apply, depending on the spread on the
assets of a country-specific reference portfolio. That increase is calculated as 65%
of the difference between the risk-corrected spread of that country reference portfolio (S_RCcountry ) and twice the risk-corrected currency spread S_RCcurrency. The
country-specific increase applies whenever that difference is positive (i.e. when S_RCcountry > 2* S_RCcurrency) and the risk-corrected country spread is higher than 100 basis points. This implies that the country-specific increase cannot be negative
while the VA before increase can assume both positive and negative values.
The VA with country-specofic increase is given by the following equation:
VA = 65% * [S_RCcurrency + max (S_RCcountry – 2* S_RCcurrency, 0) ] ,
where S_RCcountry > 100 bps.
S_RCcurrency and S_RCcountry are calculated as the difference between the spread at portfolio level (Scurrency and Scountry) and the related risk correction (RCcurrency and
RCcountry):
S_RCcurrency = Scurrency – RCcurrency and S_RCcountry = Scountry – RCcountry
The reference portfolio comprises two asset classes that contribute to the spread:
government bonds and corporate bonds. For each class the average spreads (Sgov and Scorp) and the risk corrections (RCgov and RCcorp) are derived.
The portfolio spreads (Scurrency and Scountry) and portfolio risk corrections (RCcurrency
and RCcountry) are calculated by applying portfolio weights (wgov, wcorp) to the government and corporate components:
Scurrency = wgov*max(Sgov;0) + wcorp*max (Scorp; 0)
RCcurrency = wgov*max(RCgov;0) + wcorp*max(0;RCcorp)
Scountry and RCcurrency are calculated in the same way, but based on the reference portfolio per country.
The reference portfolios are representative of assets held by European insurance and reinsurance undertakings to cover:
- the best estimate for (re)insurance obligations denominated in that currency (reference portfolio per currency)
- the best estimate for (re)insurance obligations of products sold in the insurance market of that country and denominated in the currency of that country (reference portfolio per country).
The reference portfolios are updated on an annual basis.
1) Analysis of the amount of the currency and country risk-corrected spread for the calculation of the VA (S_RCcountry and S_RCcurrency)

109/171
The graph shows, for each country, the values of the risk-corrected currency spread
(blue bar),the risk-corrected country spread (red bar), the final value of the VA (green triangle) and the trigger level of the country-specific increase of 100 bps
(red line). When applying 65% to the blue bar, the final value of the VA (represented by the green triangle) results. The reference date for the data is the 31 December 2016.
It can be observed that there is a considerable heterogeneity among countries with
regard to the risk-corrected country spread, also among the countries of the euro area that apply the same amount of VA: for some countries the country spread is much higher than the currency one, even double (i.e. Greece, Italy, Portugal,
Spain), whilst for other countries it is much lower, even lower than the half (i.e. Belgium, Estonia, Finland, Ireland, Lithuania, Malta, Slovakia, Slovenia). This
means that, at country level, the spread deriving from assets hold by the national undertakings can be significantly higher or lower that the level of spread hold in the representative portfolio defined at currency level.
Moreover it can be observed that for one country (Romania) the currency VA is negative even if the risk corrected country spread is nearly 12 times the currency
spread in absolute terms and it is higher than the majority of the country spreads of other countries that apply a positive VA. The large difference between the
country and the currency spread is likely to disappear with the next update of the representative portfolios.
Finally the graph shows that for some countries the condition that the country
spread to be higher than twice the currency spread is met (i.e. Greece, Italy, Portugal, Spain), but the second condition that the risk-corrected country spread to
be higher than 100 bps is not met. At the reference date of the graph (31 December 2016), the condition that prevents the country-specific increase to apply is the threshold of 100 bps for the risk-corrected country spread. This is consistent
with the low level of credit spreads observed in the markets at that date.
-10
0
10
20
30
40
50
60
70
80
90
100
110
Au
stri
a
Be
lgiu
m
Bu
lgar
ia
Cro
atia
Cyp
rus
Cze
ch R
epu
blic
De
nm
ark
Esto
nia
Fin
lan
d
Fran
ce
Ger
man
y
Gre
ece
Hu
nga
ry
Ice
lan
d
Ire
lan
d
Ital
y
Latv
ia
Lie
chte
nst
ein
Lith
uan
ia
Luxe
mb
ou
rg
Mal
ta
Net
her
lan
ds
No
rway
Po
lan
d
Po
rtu
gal
Ro
man
ia
Slo
vaki
a
Slo
ven
ia
Spai
n
Swed
en
Swit
zerl
and
Un
ite
d K
ingd
om
Val
ue
in b
ps
Risk-corrected currency and country spread
S_RC_Currency (bps) S_RC_Country (bps) VA trigger level 100 bps

110/171
2) Analysis of the amount of the government and corporate risk-corrected spread for
the calculation of the country VA (S_RC_gov_country, S_RC_corp_country and S_RC_country)
Background information on the calculation of the risk correction
The risk correction is intended to account for expected losses, unexpected credit
risk, and any other relevant risks of the assets. It is calculated as follows:
For the spread on government bonds:
RC= 30% LTAS for exposures to governments of EEA countries
RC= 35% LTAS for exposures to other governments
where LTAS is the long-term average of the spread over the risk-free interest rate
of assets of the same duration, credit quality and asset class.The average relates to the last 30 years.
For the spread on corporate bonds:
RC = MAX ( PD + CoD, 35% LTAS ), where
PD = the credit spread corresponding to the probability of default on the
assets;
CoD = the credit spread corresponding to the expected loss resulting from
downgrading of the assets;
LTAS = as above
Where no reliable credit spreads can be derived from long-term default statistics, the risk correction can be expressed as:
RC= 35% LTAS.
Au
stri
a
Be
lgiu
m
Cyp
rus
Esto
nia
Fin
lan
d
Fran
ce
Ger
man
y
Gre
ece
Ire
lan
d
Ital
y
Latv
ia
Lith
uan
ia
Luxe
mb
ou
rg
Mal
ta
Net
her
lan
ds
Po
rtu
gal
Slo
vaki
a
Slo
ven
ia
Spai
n
-50
0
50
100
150
200
250
Val
ue
s in
bp
s
Country specific increase of the VA - Euro area countries
S_RC_corp RC_Corp_country S_RC_gov RC_Gov_country S_RC_Country RC_Country Country increaseof the VA
Trigger Level

111/171
These graphs look at the national component of the VA only (the first graph relates to the countries of the euro area, and the second graph relates to the countries
with other currencies).
With respect to the national representative portfolio, the graphs show a comparison between the level of the market spreads for corporate bonds (Scorp – green bar), for
government bonds (Sgov – blue bar) and the corresponding level of the spread at country portfolio level (Scountry - burgundy bar): for each category of spread, the
total value is decomposed into the amount attributed to the risk-correction (in lighter colour) and the risk-corrected spread (in darker colour).
Also the level of the potential country-specific increase of the VA is shown (red
bar), irrespectively of whether it is triggered or not. This level represents 65% of the difference between the risk-corrected country spread and twice the risk-
corrected currency spread, that must be added to the VA only if this difference is positive and if the risk-corrected country spread (dark burgundy bar) is higher than 100 basis points. Given that such conditions are not met for any of the countries in
the graphs, no country-specific increase of the VA is applied.The reference date for the data is the 31 December 2016.
For most of countries (except for Cyprus and Greece), corporate spreads are largely higher than government ones. The spread at portfolio level, due to the weighting, is significantly lower than the one related to the two components: there are four
cases (Portugal, Denmark, Hungary and Romania) where the total spreads at portfolio level are higher than the threshold of 100 bps (red line), but the risk
corrected spread is not.
The risk correction represents a large part of the total spread (nearly 61% on average for the corporate bonds, 54% for government, 59% at country-portfolio
level). Considering that, for government bonds, the risk correction is defined as the 35% of the long-term average spread (over the last 30 years), the size of the
Bu
lgar
ia
Cro
atia
Cze
ch R
epu
blic
De
nm
ark
Hu
nga
ry
Ice
lan
d
Lie
chte
nst
ein
No
rway
Po
lan
d
Ro
man
ia
Swed
en
Swit
zerl
and
Un
ite
d K
ingd
om
-100
0
100
200
300
400
500
600
Val
ue
s in
bp
sCountry specific increase of the VA - Other countries
S_RC_corp RC_Corp_country S_RC_gov RC_Gov_country
S_RC_Country RC_Country Country increaseof the VA
Trigger Level

112/171
weight is due to the higher level of spreads observed in the past years (that
contributes to the LTAS), compared to the current (lower) level of the spreads.
Impact on investments of undertakings
The following graphs compare the average asset portfolio of undertakings applying the
VA. The first table shows the average investment allocation of undertakings using the
VA in the different countries and at EEA level. The second and third graph shows the
average credit quality of the portfolio of government and corporate bonds,
respectively, of undertakings applying the VA. The fourth graph shows the average
duration of the portfolio of government and corporate bonds of undertakings applying
the VA.
Investment allocation at EEA and country level of
undertakings applying the VA
CountryGovernment
bonds
Corporate
bondsEquities
Assets held
for IL & UL
contracts
Other
investments
EEA 27% 24% 2% 20% 27%
AT 21% 22% 1% 16% 39%
BE 51% 22% 4% 11% 13%
BG 63% 1% 0% 7% 29%
CY 8% 0% 0% 57% 35%
CZ 39% 20% 1% 24% 16%
DE 16% 27% 0% 6% 50%
DK 9% 19% 5% 29% 38%
ES 57% 22% 1% 7% 13%
FI 7% 18% 4% 56% 16%
FR 28% 31% 3% 14% 24%
GR 49% 15% 1% 18% 16%
HU 41% 0% 1% 52% 6%
IE 12% 9% 0% 77% 2%
IT 44% 16% 1% 16% 22%
LI 6% 4% 0% 79% 11%
LU 13% 8% 0% 74% 5%
NL 37% 12% 2% 28% 20%
NO 13% 31% 3% 18% 35%
PT 34% 25% 1% 31% 9%
RO 76% 9% 1% 0% 14%
SE 18% 25% 0% 47% 10%
SK 48% 22% 0% 19% 11%
UK 13% 17% 5% 48% 17%

113/171
Government bonds: Credit quality for undertakings applying the VA
Country CQS 0 CQS 1 CQS 2 CQS 3 CQS > 3Non-
rated
EEA 13% 41% 3% 39% 1% 3%
AT 15% 52% 23% 9% 1% 1%
BE 9% 69% 6% 9% 1% 7%
BG 8% 0% 2% 70% 20% 0%
CY 0% 0% 0% 0% 100% 0%
DE 34% 40% 9% 13% 1% 3%
DK 70% 5% 2% 9% 3% 10%
ES 2% 2% 1% 89% 1% 6%
FI 39% 44% 1% 13% 0% 1%
FR 8% 75% 2% 13% 1% 2%
GR 16% 21% 4% 14% 41% 4%
HU 1% 1% 0% 91% 7% 1%
IE 35% 40% 10% 12% 0% 2%
IT 2% 2% 1% 94% 0% 0%
LU 14% 64% 4% 13% 1% 5%
NL 72% 19% 1% 3% 0% 3%
NO 52% 28% 8% 1% 1% 10%
RO 0% 0% 0% 94% 0% 6%
SE 58% 41% 1% 0% 0% 0%
SK 7% 12% 79% 1% 0% 0%
UK 8% 89% 1% 0% 0% 1%

114/171
Corporate bonds: Credit quality for undertakings applying the VA
The following graphs illustrate differences in the average asset portfolios between
undertakings using the VA and undertakings that do not use the VA, in the countries
where the VA is applied. The first diagram shows differences in the average
investment allocation between users and non-users of the VA, expressed in
Country CQS 0 CQS 1 CQS 2 CQS 3 CQS > 3Non-
rated
EEA 15% 15% 31% 28% 4% 7%
AT 18% 16% 24% 26% 5% 11%
BE 9% 17% 31% 33% 3% 8%
BG 0% 0% 0% 97% 1% 2%
CY 0% 0% 0% 0% 100% 0%
DE 38% 17% 19% 17% 2% 6%
DK 77% 5% 4% 5% 4% 6%
ES 2% 10% 25% 38% 4% 21%
FI 14% 11% 26% 34% 6% 10%
FR 10% 17% 37% 27% 3% 6%
GR 1% 16% 36% 29% 13% 5%
HU 0% 2% 0% 65% 0% 33%
IE 18% 16% 37% 26% 2% 0%
IT 1% 10% 24% 51% 12% 1%
LU 5% 9% 33% 27% 7% 20%
NL 5% 14% 33% 37% 3% 7%
NO 27% 9% 32% 10% 0% 21%
RO 0% 0% 11% 31% 0% 58%
SE 47% 9% 26% 11% 0% 6%
SK 1% 11% 17% 58% 0% 12%
UK 4% 10% 41% 37% 2% 5%
0,0
2,0
4,0
6,0
8,0
10,0
12,0
14,0
16,0
EEA AT BE BG CY DE DK ES FI FR GR HU IE IT LU NL NO RO SE SK UK
Average duration of government and corporate bond portfolios for undertakings using the VA
Corporate bonds Government bonds

115/171
percentage points. A positive value (associated with the blue color) signifies that non-
users of the VA have a higher average investment in the respective asset category
than users of the VA. A negative value (associated with the red color) signifies a lower
average investment in the respective category for undertakings not using the VA,
compared to users of the VA. The second graph illustrates differences in the average
CQS in undertakings’ corporate and government bond portfolios, comparing
undertakings that use the VA with undertakings that do not use the VA.
Impact on consumers and products

116/171
The following table sets out the share of gross written premiums of undertakings
using the VA compared to the total gross written premiums by all undertakings in that country, for each line of business (columns 1 to 6) the total life insurance and life
reinsurance business (column 7), and the total for non-life insurance and reinsurance business (column 8). The table is based on data reported by undertakings in the
annual QRTs for 2016. For instance, in Austria 77.0% of the total life insurance and life reinsurance
premiums and 83.2% of health insurance premiums are written by undertakings applying the VA.
Country 1. Health insurance
2. Insurance with profit
participation
3. Index linked
and unit linked
insurance
4. Other life
insurance
5. Health reinsurance
6. Life reinsurance
7. Total life insurance
and reinsurance
8. Total non-life
insurance and
reinsurance
AT 83.2% 75.8% 70.8% 83.1% 5.2% 89.2% 77.0% 69.5%
BE 37.4% 94.0% 77.8% 74.9% 0.0% 100.0% 88.6% 84.2%
BG 0.0% 63.8% 90.4% 22.5% 0.0% 55.5% 54.9% 21.9%
CY 0.0% 0.9% 2.4% 4.3% 0.0% 0.0% 2.4% 0.0%
CZ 5.1% 50.6% 55.7% 77.4% 0.0% 0.1% 47.2% 46.2%
DE 35.7% 79.2% 79.1% 83.4% 1.6% 14.6% 57.3% 28.6%
DK 87.3% 81.9% 97.4% 89.5% 100.0% 100.0% 95.1% 5.3%
ES 62.2% 96.5% 98.4% 89.7% 0.0% 10.5% 90.9% 45.6%
FI 100.0% 93.5% 89.4% 79.9% 0.0% 100.0% 89.8% 32.3%
FR 95.8% 94.4% 97.6% 90.1% 37.4% 87.3% 92.4% 55.6%
GR 100.0% 98.0% 99.6% 99.5% 0.0% 100.0% 99.1% 70.7%
HU 82.6% 29.7% 58.1% 62.2% 0.0% 0.0% 49.8% 50.1%
IE 16.6% 0.8% 18.9% 32.6% 0.0% 6.1% 16.1% 4.0%
IT 99.6% 98.0% 90.2% 88.1% 100.0% 99.0% 95.8% 89.4%
LE 0.0% 3.8% 6.2% 0.0% 0.0% 0.0% 5.0% 0.0%
LX 17.7% 96.4% 88.2% 43.3% 0.0% 2.7% 77.7% 29.9%
MT 0.0% 0.0% 0.0% 0.0% 0.0% 0.0% 0.0% 1.5%
NL 93.3% 99.8% 96.4% 98.0% 79.1% 56.0% 95.5% 16.3%
NO 41.2% 91.9% 84.9% 96.4% 0.0% 0.0% 87.1% 14.7%
PT 0.0% 65.3% 70.5% 9.7% 0.0% 88.0% 38.8% 44.7%
RO 0.0% 0.9% 0.0% 5.5% 0.0% 0.0% 2.0% 12.4%
SE 8.8% 5.9% 7.4% 0.0% 0.0% 0.0% 6.6% 0.0%
SK 54.2% 31.7% 45.2% 43.9% 0.0% 0.0% 38.4% 50.1%
UK 54.3% 21.3% 20.6% 35.3% 66.0% 48.6% 35.1% 20.6%
EEA 45.9% 86.1% 54.2% 62.5% 15.5% 49.8% 64.4% 36.7%
III.4 Transitional measure on the risk-free interest rates
For a period of 16 years after the start of Solvency II, insurance and reinsurance undertakings may apply the transitional measure on the risk-free interest rate. Under
the transitional measure undertakings apply a transitional adjustment to the risk-free interest rate for the valuation of insurance and reinsurance obligations. The transitional adjustment is based on the difference between the discount rates of

117/171
Solvency I and the risk-free interest rates. At the beginning of Solvency II the
transitional adjustment is 100% of that difference. Over the transitional period of 16 years the transitional adjustment is linearly reduced to zero. The transitional measure
applies only to insurance and reinsurance obligations arising from contracts concluded before the start of Solvency II.
The use of the transitional measure is subject to supervisory approval.
Use of the transitional measure on the risk-free interest rates
Only 6 undertakings, in 4 countries, are using the TRFR. Compared to last year, only one more undertaking in Greece is using the TRFR.
The market share in technical provisions of undertakings using the TRFR is negligible, both at EEA level and national level, except in Greece, where the aggregated market
share of the three undertakings using the TRFR is approximately 20 per cent of the national market.
According to the Solvency II Directive it is possible to apply simultaneously the TRFR
and the VA to the same liabilities. Among the 6 European undertakings applying TRFR, 5 also apply the VA.
Three EEA groups are using the TRFR.
0
1
2
3
4
DE FR GR IE
Number of undertakings using the TRFR
Life Non-life Both life and non-life Reinsurance
1 1 1
3
0
0.5
1
1.5
2
2.5
3
3.5
DE NL UK EEA
Number of EEA groups using TRFR

118/171
Impact on the financial position of undertakings
The impact results presented in this section are based on data from 2017 Quantitative Reporting Templates.
Note that the number of TRFR users is limited (only 6 undertakings). The average impact of the TRFR by country therefore to a large extent mirrors the specifics of the
individual undertakings in that market rather than the countries‘ specificities.
The following graph shows the overall impact of the use of the TRFR on the SCR ratio for the whole market of the countries where the TRFR is used. For those countries, it
includes both undertakings using and not using the TRFR. This shows that removing the TRFR has merely no impact on the average SCR ratio for the whole market, except
for Greece.
The following graphs display the overall impact of the use of the TRFR on the SCR
ratio for undertakings that apply this measure. The impact is shown at EEA and at
country level. The first graphs shows the SCR ratio with (dark blue) and without (light
blue) the TRFR. The red bars are for the EEA level. The second graph shows the
impact in percentage points.
The impact of the TRFR on the SCR ratio for undertakings applying the measure is 63 percentage points. The average SCR ratio with the TRFR is 186% and 123% without
the measure. This effect on the SCR ratio is due to an average increase of 10% in the SCR and an average decrease of 28% in the eligible own funds when the measure is not used.
172%
163%
224%
331%
229%
171%
140%
224%
331%
229%
0% 50% 100% 150% 200% 250% 300% 350%
IE
GR
FR
DE
EEA
Average impact of removing the TRFR on the SCR ratio of the whole EEA market
Ratio w/oTRFR
Ratio with MA,VA, TRFR and TTP
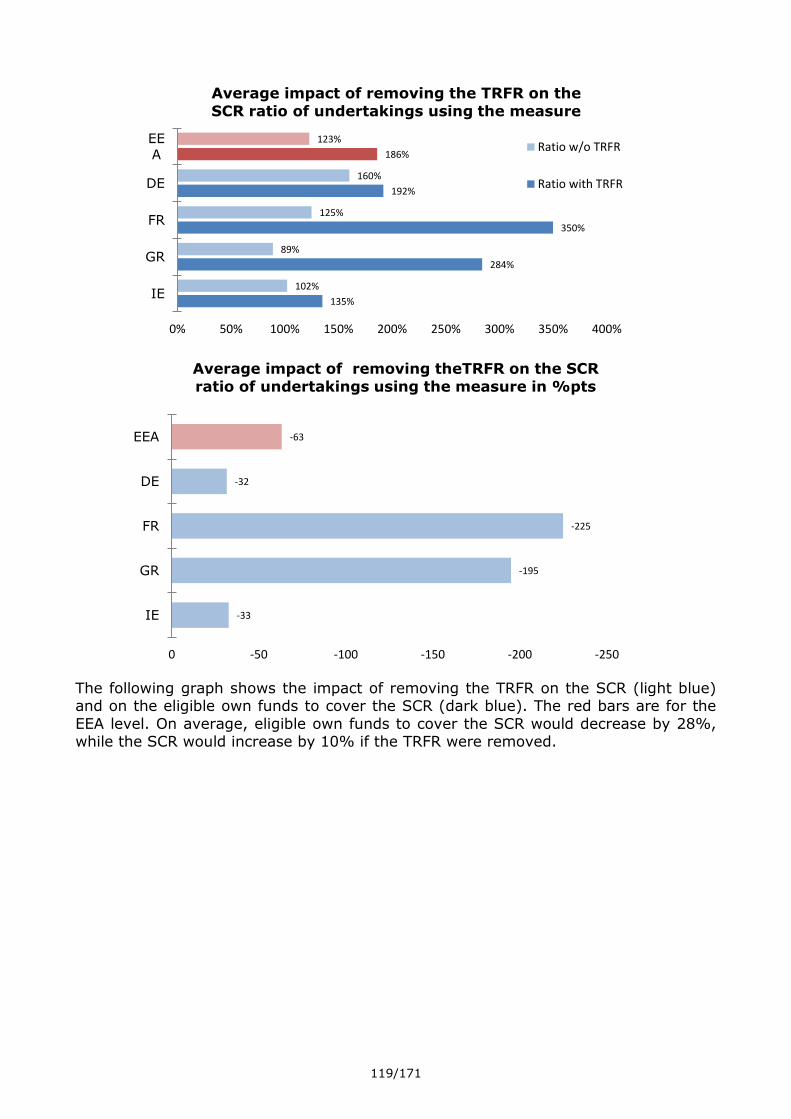
119/171
The following graph shows the impact of removing the TRFR on the SCR (light blue) and on the eligible own funds to cover the SCR (dark blue). The red bars are for the
EEA level. On average, eligible own funds to cover the SCR would decrease by 28%, while the SCR would increase by 10% if the TRFR were removed.
135%
284%
350%
192%
186%
102%
89%
125%
160%
123%
0% 50% 100% 150% 200% 250% 300% 350% 400%
IE
GR
FR
DE
EE
A
Average impact of removing the TRFR on the
SCR ratio of undertakings using the measure
Ratio w/o TRFR
Ratio with TRFR
-33
-195
-225
-32
-63
-250-200-150-100-500
IE
GR
FR
DE
EEA
Average impact of removing theTRFR on the SCR
ratio of undertakings using the measure in %pts

120/171
The following graph displays the impact of removing the TRFR on the value of
technical provisions (TP) at EEA and national level. The average impact of the TRFR on the technical provisions for undertakings applying the measure is an increase of 7%
when the measure is removed.
The impact of removing the TRFR on the MCR ratio for undertakings applying the measure is 228 percentage points. The average MCR ratio with the TRFR is 647% and
418% without the measure.
-20.7%
-59.0%
-64.3%
-5.8%
-27.6%
4.7%
30.8%
0.0%
12.8%
9.7%
-80.0% -60.0% -40.0% -20.0% 0.0% 20.0% 40.0%
IE
GR
FR
DE
EEA
Average impact of removing theTRFR on eligible
own funds to cover the SCR (EoF SCR) and SCR of undertakings using the measure
SCR
EoF SCR
6.7%
13.0%
19.4%
1.5%
7.0%
0.0% 5.0% 10.0% 15.0% 20.0% 25.0%
IE
GR
FR
DE
EEA
Average impact of removing the TRFR on the
technical provisions of undertakings using the measure

121/171
Information on the phasing-in plans for the TRFR and the prospects for a reduced dependency on the measures can be found in section III.5.
509%
742%
778%
754%
647%
394%
227%
237%
599%
418%
0% 100% 200% 300% 400% 500% 600% 700% 800% 900%
IE
GR
FR
DE
EEA
Average impact of removing the TRFR on the
MCR ratio of undertakings using the measure
Ratio w/o TRFR
Ratio with TRFR
-20.7%
-64.0%
-69.6%
-10.5%
-30.6%
2.5%
17.6%
0.0%
12.8%
7.3%
-80.0% -70.0% -60.0% -50.0% -40.0% -30.0% -20.0% -10.0% 0.0% 10.0% 20.0% 30.0%
IE
GR
FR
DE
EEA
Average impact of removing the TRFR on eligible
own funds to cover the MCR (EoF MCR) and MCR of
undertakings using the measure
MCR
EoF MCR

122/171
Information on the phasing-in plans for the TRFR and the prospects for a reduced
dependency on the measures can be found in section III.5.
Impact on investments of undertakings, consumers and products
As only six insurers are applying the TRFR, it is not possible to disclose more detailed
data on the impact of this measure on investments of undertakings , consumers and
products per country. The data have been combined with the data for the TTP and are
presented in subsection III.5.
The following table sets out the share of gross written premiums of undertakings using the TRFR compared to the total gross premiums written by all undertakings, for
each line of business (columns 1 to 6) the total life insurance and life reinsurance business (column 7), and the total for non-life insurance and reinsurance business (column 8). The table is based on data reported by undertakings in the annual QRTs
for 2016. Please note that due to the small number of undertakings in individual markets using this transitional measure, results have been presented at EEA level,
and not been split by individual country.
Country 1. Health insurance
2. Insurance with profit
participation
3. Index linked
and unit linked
insurance
4. Other life
insurance
5. Health reinsurance
6. Life reinsurance
7. Total life insurance
and reinsurance
8. Total non-life
insurance and
reinsurance
EEA 0.4% 0.2% 0.3% 0.1% 0.0% 0.3% 0.3% 0.5%
III.5 Transitional measure on technical provisions
For a period of 16 years after the start of Solvency II, insurance and reinsurance
undertakings may apply the transitional measure on technical provisions (TTP). Under the transitional measure undertakings apply a transitional deduction to the technical provisions for their insurance and reinsurance obligations.
The transitional deduction is based on the difference between the technical provisions under Solvency I and the technical provisions under Solvency II. At the beginning of
Solvency II the transitional adjustment is 100% of that difference, i.e. the technical provisions are equal to the technical provisions under Solvency I. Over the transitional period of 16 years the transitional deduction is reduced to zero. The transitional
measure applies only to insurance and reinsurance obligations arising from contracts concluded before the start of Solvency II.
The use of the transitional measure is subject to supervisory approval.
Use of the transitional measure on technical provisions
The TTP is applied by 163 undertakings from 11 countries (AT, BE, DE, ES, FI, FR, GR,
LI, NO, PT, and UK).

123/171
The technical provisions of undertakings applying the TTP represent 24.9% of the total
amount of technical provisions in the EEA. The technical provisions of undertakings applying the TTP in UK represent 13.7% and in Germany 5.3% of the overall technical
provisions in the EEA.
Number of undertakings using TTP
Country Life Non-life Both life
and non-life Reinsurance Total
Variation
from last year
AT 0 0 4 0 4 0
BE 1 0 0 0 1 0
DE 58 5 0 0 63 6
ES 6 1 15 0 22 0
FI 3 2 2 0 7 0
FR 7 0 6 0 13 6
GR 0 0 1 0 1 0
LI 1 0 0 0 1 0
NO 2 0 4 0 6 0
PT 8 5 3 0 16 -3
UK 23 0 6 0 29 1
EEA 109 13 41 0 163 9
The total number of undertakings using the TTP in the EEA has increased by 9 from last year’s report. The most relevant increase in the number of TTP users occurred in France and Germany, followed by the UK. A decrease in the number of TTP users
occurred Portugal. In five countries, applications for the use of the TTP after 1st

124/171
January 2016 were received. The following diagram shows the number of applications
in the countries concerned:
Country TTP
Austria 1
France 6
Germany 7
Spain 10
UK 1
Total 25
The market share in technical provisions of undertakings using the TTP is shown in the graph below. This illustrates that, among undertakings using the TTP, undertakings in
the UK have the highest EEA market share, followed by undertakings in DE and FR.
The following graph displays the market share in terms of technical provisions at
national level for undertakings using the TTP. In Norway, undertakings representing 88.9% of the national market share using the TTP. In the United Kingdom, Finland
and Portugal, undertakings representing more than 50% of the national market are using TTP.
0.0%
2.0%
4.0%
6.0%
8.0%
10.0%
12.0%
14.0%
16.0%
AT BE DE ES FI FR GR LI NO PT UK
EEA market share in technical provisions of undertakings using the TTP

125/171
According to the Solvency II Directive it is possible to apply simultaneously the TTP
and the MA or the VA to the same liabilities.
Undertakings applying simultaneously TTP and VA to the same liabilities
Country Number of
undertakings EEA market share in TP
% National market share in TP
AT 2 (*) (*)
BE 1 (*) (*)
DE 51 4% 25%
ES 22 1% 40%
FI 7 0% 57%
FR 12 2% 9%
GR 1 (*) (*)
LI 1 (*) (*)
NO 5 1% 83%
PT 9 0% 44%
UK 17 6% 25%
EEA 129 15.8% -

126/171
(*) Data from Austria, Belgium, Greece, Ireland and Liechtenstein are not disclosed
for confidentiality reasons because the number of undertakings concerned is lower than 3.
Undertakings applying simultaneously TTP and MA to the same liabilities
Number of
undertakings
% EEA market share in
TP
% National market
share in TP
ES 6 0.5% 20.3%
UK 21 10.2% 39.4%
EEA 27 10.7% -
The following diagram shows the number of EEA groups using the TTP.
The 112 EEA undertakings being part of a group and using the TTP represent 20.8%
of the EEA market share in technical provisions. They cover 83.5% of the technical provisions of undertakings using TTP.
1 1
37
5
2 1 1 2 3 5
1
0
5
10
15
20
25
30
35
40
AT BE DE ES FI FR GR NL NO PT SE
Number of EEA groups using TTP
4 1
63
22
7 13
1 1 6
16
29
2 1
55
12
3 3 1 1 5 6
23
0
10
20
30
40
50
60
70
AT BE DE ES FI FR GR LI NO PT UK
Number of undertakings using TTP
Number of undertakings using TTP Number of EEA undertakings part of a group using TTP

127/171
Impact on the financial position of undertakings
The impact results presented in this section are based on data from 2017 Quantitative Reporting Templates.
The following graph displays the overall impact of the TTP on the SCR ratio for the
whole EEA sample (including both undertakings using or not using the measure). At
the EEA level, removing the TTP would result on average in a decrease of the SCR
ratio by 17 percentage points.
The following graphs show the overall impact of the use of the TTP on the SCR ratio
for undertakings that apply this measure. At EEA level, by removing the TTP the financial position of the insurance and reinsurance undertakings using that measure
would show a decrease of the SCR ratio from 212% to 124%. Without the TTP the eligible amount of own funds to cover the SCR would decrease by 37% while SCR would increase by 7% upon recalculation of the SCR.
153%
155%
210%
233%
163%
224%
205%
238%
331%
176%
268%
229%
128%
100%
186%
233%
149%
214%
186%
210%
294%
174%
263%
212%
0% 50% 100% 150% 200% 250% 300% 350%
UK
PT
NO
LI
GR
FR
FI
ES
DE
BE
AT
EEA
Average impact of removing the TTP on the SCR
ratio of the whole EEA market
Ratio w/o TTP
Ratio with MA, VA, TRFRand TTP

128/171
The average change in SCR ratios is the highest for undertakings in Germany, France,
and Belgium. Usually both components of the SCR ratio (SCR and eligible own funds) are affected by the use of the TTP, but in opposite direction. Typically eligible own
funds decrease while the SCR increases when the TTP is removed. Germany has the largest decrease of eligible own funds and the largest increase in the SCR.
154%
151%
229%
233%
170%
292%
179%
283%
369%
294%
255%
212%
107%
80%
186%
203%
96%
153%
142%
176%
136%
159%
159%
124%
0% 50% 100% 150% 200% 250% 300% 350% 400%
UK
PT
NO
LI
GR
FR
FI
ES
DE
BE
AT
EEA
Average impact of removing the TTP on the SCR
ratio of undertakings using the measure
Ratio w/o TTP
Ratio with TTP

129/171
The following graph displays the impact of removing the TTP on the SCR ratio of every
undertaking using this measures. Each dot in the diagram represents one
undertaking, comparing the individual SCR ratio against the estimated SCR ratio
without the TTP. The type of each undertaking is indicated by the colour of the dot.
In terms of SCR ratio, 70% reported an absolute impact between 0% and 200%.
26% of undertakings using the TTP reported an SCR ratio without the measure below
100% (43 undertakings with 8% of the total technical provisions in the EEA). 2.5% of
those undertakings reported negative eligible own funds to cover the SCR without TTP
(4 undertakings, with 0.05% of the total technical provisions in the EEA).
Also note that there are not clear differences between Life, Non-life and Composite
undertakings.
-47
-71
-44
-30
-73
-139
-37
-107
-233
-135
-95
-88
-250-200-150-100-500
UK
PT
NO
LI
GR
FR
FI
ES
DE
BE
AT
EEA
Average impact of removing the TTP on the
SCR ratio of undertakings using the measure in %pts

130/171
The following graph displays the impact of removing the TTP on the MCR ratio of
every undertaking using the TTP, comparing the individual MCR ratio against the
estimated MCR ratio without the TTP.
In terms of MCR ratio, 62% reported an absolute impact between 0% and 400%.
12% of undertakings using the TTP reported an MCR ratio without the measure below
100% (20 undertakings, with 0.5% of the total technical provisions in the EEA). 3% of
those undertakings reported negative eligible own funds to cover the MCR without TTP
(5 undertakings, with 0.05% of the total technical provisions in the EEA).

131/171
The following graph shows the impact of removing the TTP on the SCR (light blue) and
on the eligible own funds to cover the SCR (dark blue). The red bars are for the EEA level. On average, eligible own funds to cover the SCR would decrease by 37%, while
the SCR would increase by 7% if the TTP were removed.
The following graph displays the impact of removing the MA on the value of technical
provisions (TP) at EEA and national level. The average increase in technical provisions
without the TTP would be around 6% at EEA level. At country level, undertakings from
Germany would have the highest average increase due of the application of the TTP.
-26.8%
-46.6%
-15.7%
-12.8%
-43.2%
-41.0%
-20.6%
-37.3%
-56.6%
-36.5%
-31.3%
-37.4%
5.1%
0.3%
4.1%
0.1%
0.3%
12.4%
0.1%
1.0%
17.7%
17.4%
9.9%
7.3%
-70% -60% -50% -40% -30% -20% -10% 0% 10% 20% 30%
UK
PT
NO
LI
GR
FR
FI
ES
DE
BE
AT
EEA
Average impact of removing the TTP on eligible
own funds to cover the SCR (EoF SCR) and SCR of undertakings using the measure
SCR
EoF SCR

132/171
The following graph shows the impact of the TTP on the MCR ratio at country and at
EEA level for undertakings using that measure. Without the TTP the MCR ratio
decreases on average by 280 percentage points.
At country level, average MCR solvency ratios are not below 100% without applying
the TTP. As for the effects noted on the SCR, similarly for MCR the analysis shows that
undertakings from Germany, France and Belgium have the highest average impact.
3.2%
8.5%
2.5%
0.5%
9.5%
8.4%
3.8%
10.3%
12.8%
7.2%
9.9%
6.2%
0.0% 2.0% 4.0% 6.0% 8.0% 10.0% 12.0% 14.0%
UK
PT
NO
LI
GR
FR
FI
ES
DE
BE
AT
EEA
Average impact of removing the TTP on the technical
provisions of undertakings using the measure

133/171
551%
437%
520%
460%
510%
663%
558%
674%
845%
653%
678%
631%
376%
194%
420%
395%
255%
319%
431%
405%
292%
335%
397%
351%
0% 100% 200% 300% 400% 500% 600% 700% 800% 900%
UK
PT
NO
LI
GR
FR
FI
ES
DE
BE
AT
EEA
Average impact of removing the TTP on the
MCR ratio of undertakings using the measure
Ratio w/o TTP
Ratio with TTP
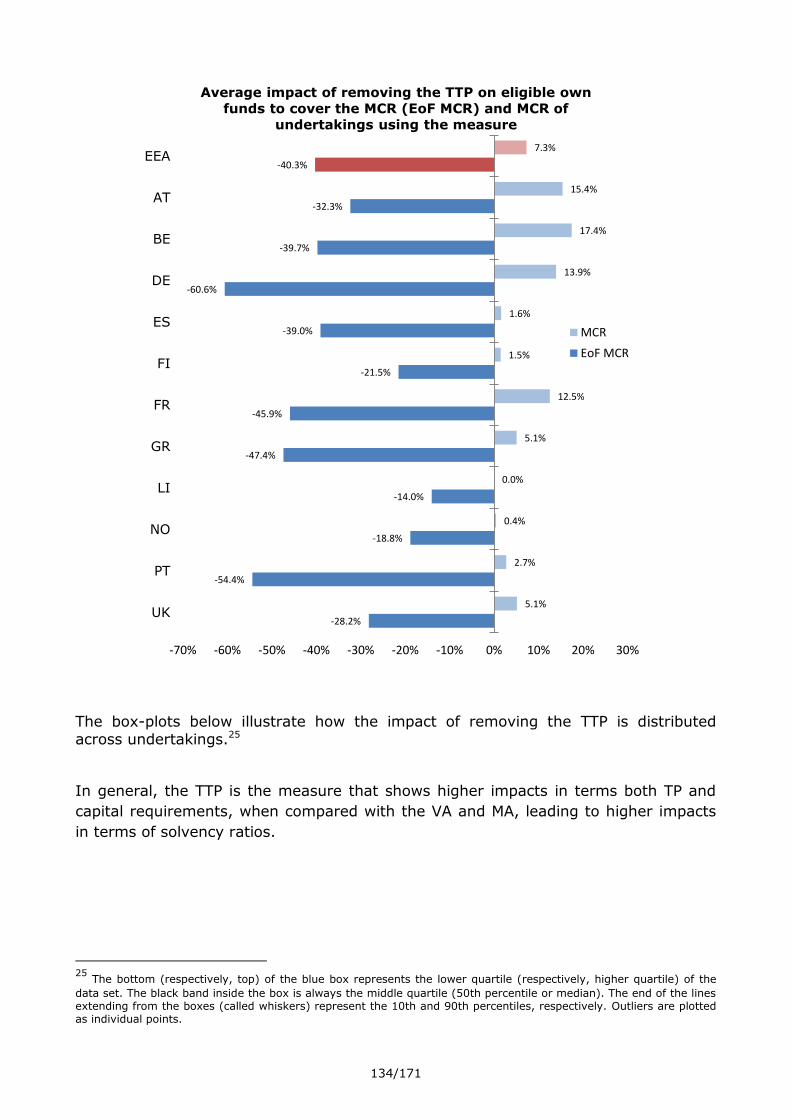
134/171
The box-plots below illustrate how the impact of removing the TTP is distributed across undertakings.25
In general, the TTP is the measure that shows higher impacts in terms both TP and
capital requirements, when compared with the VA and MA, leading to higher impacts
in terms of solvency ratios.
25
The bottom (respectively, top) of the blue box represents the lower quartile (respectively, higher quartile) of the
data set. The black band inside the box is always the middle quartile (50th percentile or median). The end of the lines extending from the boxes (called whiskers) represent the 10th and 90th percentiles, respectively. Outliers are plotted as individual points.
-28.2%
-54.4%
-18.8%
-14.0%
-47.4%
-45.9%
-21.5%
-39.0%
-60.6%
-39.7%
-32.3%
-40.3%
5.1%
2.7%
0.4%
0.0%
5.1%
12.5%
1.5%
1.6%
13.9%
17.4%
15.4%
7.3%
-70% -60% -50% -40% -30% -20% -10% 0% 10% 20% 30%
UK
PT
NO
LI
GR
FR
FI
ES
DE
BE
AT
EEA
Average impact of removing the TTP on eligible own
funds to cover the MCR (EoF MCR) and MCR of
undertakings using the measure
MCR
EoF MCR

135/171
Reliance on transitional measures (TTP and TRFR)
The table below shows the overall number of undertakings using either the TTP or
TRFR, and for these the number of undertakings which were required to submit a
phasing-in plan (“PIP”).
Member State Number of
undertakings
using TTP/TRFR
Number of
undertakings for
which a PIP was
requested
AT 4 0
BE 1 0
DE 64 27
ES 22 8
FI 7 1
FR 14 1
GR 4 2
IE 1 0
LI 1 0
NO 6 1
PT 16 7
UK 29 13
EEA 169 60

136/171
There are 169 undertakings that use the TTP or TRFR, and of these 60 were required
to submit a phasing-in plan in 2016, as they were reliant on the TTP or the TRFR to
have full SCR coverage at some point during 2016. At the end of 2016 some of these
undertakings were already not reliant on the TTTP/TRFR to comply with the SCR26.
Review of phasing-in plans
Of the 45 phasing-in plans received by NSAs, several had elements in common.
Measure
Number of PIP
including the
measure
Retention of profits or earnings 27
Raising of new capital 16
Reduction of risk-profile 20
Change of product design 10
Reduction on expenses 17
Reduction of discretionary benefits 7
Reduction of other benefits 2
Other 5
Risk profile reductions that were discussed further were changes to the investment
mix, changes to the reinsurance program and better asset-liability matching.
Product design changes that were discussed further were increased premiums, focus
on less capital-intensive products, reductions in the level of guarantees and creation
of new types of annuity products.
Other elements (in addition to those mentioned above) were to elect to go into run-off
(3 undertakings), to merge with another undertaking and to consider application for
use of the MA.
Two NSAs reported that on occasion they had required draft phasing-in plans to be
resubmitted where they had been found to be insufficient or inappropriate in
quantitative or qualitative terms. In all cases, the resubmitted phasing-in plans were
accepted by the NSA.
For example, this was the case where the description of the planned measures was
not complete, or their expected impact was not quantified in a sufficient manner.
Enhancements were also required in cases where key underlying assumptions (such
26
That was the case for 14 undertakings in DE, one in FI and one in PT.

137/171
as on new business written during the transitional period) were not made subject to
sensitivity analysis.
Review of progress reports
Undertakings that are reliant on transitional measures to fully cover the SCR are
expected to submit progress reports on an annual basis. At the point in time of the
survey, 9 progress reports had been received by NSAs. Although only 3 progress
reports had been recorded as not being delivered, which indicates that the low
number of reports received is likely to be a matter of timing, rather than widespread
non-compliance. Where they have been submitted, NSAs generally reported that the
progress reports are considered sufficient and illustrate the progress of undertakings
in complying with the SCR without the transitional measures.
Views of NSAs
NSAs are generally confident that undertakings will be able to reduce the dependency
on transitional measures, to the point of no dependency by 1 January 2032. However,
it was noted that the situation is still very early in the transitional period and there is
significant exposure to how internal and external factors develop, for example
economic conditions, biometric experience, the ability to shift from guaranteed
products to products without guarantees, and the persistence of a low-interest rate
environment.
The following table provides an overview of the number of undertakings not complying
with the SCR without the transitional measures on 1 January 2017 and the missing
amount of eligible own funds to comply with the SCR without the transitional
measures on 1 January and 31 December 2016.
Undertakings not complying
with the SCR without the
transitional measures
Missing amount of eligible own funds to
comply with the SCR without the
transitional measures (billion euro)
Country 2016 2017 2016 2017
FR 0 1 0 0.13
DE 16 13 3.46 1.59
ES 4 3 0.14 0.23
GR 3 2 0.27 0.06
NO 0 1 0 0.01
PT 12 10 1.39 0.76
UK N/A 13 N/A 6.12
Total N/A 43 N/A 8.9
Without consideration of UK undertakings (for which 2016 figures are not available),
the total number of undertakings not complying with the SCR without the transitional

138/171
measures at EEA level decreased by 5, from 35 undertakings at the beginning of
2016, to 30 undertakings at the end of the year; the missing amount of eligible own
funds to comply with the SCR without the transitional measures decreased by 2.48
billion euro, from 5.26 billion euro at the beginning of 2016 to 2.78 billion euro at the
end of the year.
Supervisory measures taken or expected to be taken by NSAs
NSAs were asked to report about the measures that they have taken or that they
expect to take with respect to undertakings depending on these transitional measures
to comply with the SCR. NSAs reported a variety of approaches.
One NSA noted that they consider the solvency position of undertakings both with TTP
and without TTP when assessing the riskiness of undertakings.
One NSA measures the level of risk of the undertakings without the effect of
transitional measures when constructing a work plan, and prioritises reviews of
undertakings using TTP or TRFR, particularly if they are reliant on transitional
measures to fully cover the SCR. The NSA expects companies to use appropriate
metrics to measure their risks and to define their risk appetite (i.e. without
transitional measures); take into account in their strategies the fact that they comply
with their SCR only through the use of transitional measures; and present clear and
relevant information to their AMSB, regarding solvency issues, and provide the
relevant information in their SFCR.
One NSA noted that they would disagree to dividend payments, if those payments
were considered likely to endanger the future solvency situation.
One NSA performed an exercise to understand the impact on undertakings of the 1/16
reduction of the transitional from 31 December 2016 to 1 January 2017.
One NSA explicitly informs the market on a regular basis about the number of
undertakings depending on transitional measures and the extent to which transitional
measures are necessary to comply with the SCR.
Two NSAs have communicated supervisory statements setting expectations as regards
the use of transitional measures. One includes the expectation that undertakings
should be able to demonstrate that their capital position is sustainable under a range
of operating conditions after allowing for any capital distributions and the TTP run-off.
NSAs generally reported that they expect companies to implement the measures they
have committed to in phasing-in plans, and intend to monitor the progress made
during the transitional period by reviewing the progress reports. NSAs reported that in
the event that the phasing-in plans or progress reports are inadequate, and this
inadequacy is not remediated by an amended plan, revocation of the transitional
measure will be considered.]
Impact on the investments of undertakings
The following graphs compare the average asset portfolio of undertakings applying the
TTP or the TRFR. The first table shows the average investment allocation of
undertakings using the TTP or TRFR in the different countries and at EEA level. The

139/171
second and third graph shows the average credit quality of the portfolio of
government and corporate bonds, respectively, of undertakings applying the TTP or
the TRFR. The fourth graph shows the average duration of the portfolio of government
and corporate bonds of undertakings applying these measures.
Investment allocation at EEA and country level of undertakings applying the
TTP or the TRFR
Government bonds: Credit quality for undertakings applying the TTP or the
TRFR
CountryGovernment
bonds
Corporate
bondsEquities
Assets held
for IL & UL
contracts
Other
investments
EEA 20% 27% 4% 26% 23%
AT 17% 29% 2% 13% 39%
BE 53% 19% 2% 14% 12%
DE 24% 36% 1% 8% 31%
ES 52% 22% 1% 8% 17%
FI 8% 24% 4% 46% 18%
FR 32% 29% 3% 14% 22%
GR 44% 18% 1% 26% 11%
IE 40% 57% 0% 0% 3%
LI 0% 0% 0% 89% 11%
NO 13% 32% 3% 15% 37%
PT 38% 21% 4% 19% 18%
UK 14% 22% 6% 39% 19%
Country CQS 0 CQS 1 CQS 2 CQS 3 CQS > 3Non-
rated
EEA 18% 49% 3% 27% 1% 2%
AT 14% 60% 22% 2% 0% 1%
BE 5% 79% 5% 10% 1% 0%
DE 36% 43% 7% 11% 1% 3%
ES 2% 2% 1% 94% 1% 0%
FI 39% 44% 1% 14% 0% 1%
FR 3% 66% 1% 25% 1% 4%
GR 11% 22% 6% 17% 36% 8%
IE 29% 70% 0% 0% 0% 1%
NO 52% 28% 9% 1% 1% 9%
PT 0% 27% 20% 52% 1% 1%
UK 8% 89% 1% 1% 0% 1%

140/171
Corporate bonds: Credit quality for undertakings applying the TTP or the
TRFR
The following graphs illustrate differences in the average asset portfolios between
undertakings using the TTP and undertakings that do not use the TTP, in the countries
where the TTP is applied. The first diagram shows differences in the average
investment allocation between users and non-users of the TTP, expressed in
percentage points. A positive value (associated with the blue color) signifies that non-
users of the TTP have a higher average investment in the respective asset category
than users of the TTP. A negative value (associated with the red color) signifies a
lower average investment in the respective category for undertakings not using the
TTP, compared to users of the TTP. The second graph illustrates differences in the
average CQS in undertakings’ corporate and government bond portfolios, comparing
undertakings that use the TTP with undertakings that do not use the TTP.
Country CQS 0 CQS 1 CQS 2 CQS 3 CQS > 3Non-
rated
EEA 22% 14% 27% 25% 4% 8%
AT 11% 15% 34% 25% 3% 12%
BE 3% 12% 45% 32% 8% 0%
DE 43% 20% 15% 14% 2% 6%
ES 2% 11% 33% 39% 5% 9%
FI 13% 11% 26% 34% 6% 10%
FR 4% 14% 30% 30% 4% 17%
GR 1% 17% 34% 28% 17% 3%
IE 6% 17% 56% 21% 1% 0%
NO 26% 9% 31% 10% 0% 23%
PT 0% 2% 5% 50% 28% 16%
UK 6% 8% 40% 38% 6% 3%
0,0
2,0
4,0
6,0
8,0
10,0
12,0
14,0
16,0
EEA AT BE DE ES FI FR GR IE NO PT UK
Average duration of government and corporate bond portfolios for undertakings using the TTP or the TRFR
Corporate bonds Government bonds

141/171
Impact on consumers and products
The following table sets out the share of gross written premiums of undertakings using the TTP compared to the total gross premiums written by all undertakings in
that country, for each line of business (columns 1 to 6) the total life insurance and life reinsurance business (column 7), and the total for non-life insurance and reinsurance business (column 8). The table is based on data reported by undertakings in the
annual QRTs for 2016.
For instance, in Austria 7% of the total life insurance and life reinsurance premiums and that 8.3% of premiums for index-linked and unit-linked business are written by undertakings applying the TTP.

142/171
Country 1. Health insurance
2. Insurance with profit
participation
3. Index linked
and unit linked
insurance
4. Other life
insurance
5. Health re-
insurance
6. Life re-insurance
7. Total life
insurance and re-
insurance
8. Total non-life
insurance and
reinsurance
AT 0.3% 9.8% 8.3% 8.4% 0.0% 0.6% 7.0% 3.8%
BE (*) (*) (*) (*) (*) (*) (*) (*)
DE 15.3% 44.2% 37.7% 18.5% 0.1% 1.1% 28.7% 0.1%
ES 0.0% 26.6% 35.7% 32.4% 0.0% 1.5% 30.1% 11.4%
FI 100.0% 75.6% 55.2% 45.1% 0.0% 100.0% 58.0% 30.8%
FR 3.1% 6.6% 7.6% 5.7% 0.8% 14.9% 7.7% 2.9%
GR (*) (*) (*) (*) (*) (*) (*) (*)
LI 0.0% 2.2% 2.8% 0.0% 0.0% 0.0% 2.3% 0.0%
NO 27.0% 98.7% 79.4% 89.7% 0.0% 0.0% 87.0% 2.3%
PT 100.0% 64.6% 55.7% 84.5% 0.0% 29.8% 72.4% 69.0%
UK 63.5% 98.5% 21.0% 92.0% 66.0% 89.1% 64.6% 4.6%
EEA 14.1% 19.1% 13.4% 44.2% 3.4% 61.2% 26.7% 3.2%
(*) Data from this country is not disclosed for confidentiality reasons because the number of
undertakings applying the measure is lower than 3.
III.6 Duration-based equity risk sub-module
The standard formula for the SCR includes an equity risk sub-module that captures
the risk stemming from changes in the level of equity market prices. The equity risk sub-module is based on risk scenarios that envisage a fall in equity market prices of
39% or 49%, depending on the type of equity.
Instead of that equity risk sub-module, undertakings can use a duration-based equity risk sub-module that is, with regard to certain equity investments, based on a risk
scenario that envisages a fall in equity market prices of 22%. The duration-based equity risk sub-module can only be applied by life insurance undertakings that provide
certain occupational retirement provisions or retirement benefits and meet further requirements, in particular that the average duration of the undertaking’s liabilities
exceeds an average of 12 years and that the undertaking is able to hold equity investments at least for 12 years.
The possibility to apply the DBER is a Member State option of the Solvency II
Directive (Article 304(1)). The application of the DBER by an insurance undertaking is subject to supervisory approval.
Only one undertakings in France is using the DBER as at 31 December 2016.
According to the information disclosed by the undertaking in its the Solvency and
Financial Condition Report, removing the DBER would reduce the SCR ratio by 26,6%
from a ratio of 105.5% with the DBER (but without TTP and VA) to a ratio of 78.9%
without the DBER. Removing the measure would reduce the MCR ratio by 59% from a
ratio of 234.4% with the DBER (but without TTP and VA) to a ratio of 175.4% without
the measure. However, it should be noted the impact of removing the DBER in the
SCR could be compensated if the undertaking used the transitional on equity risk.
As only one undertaking in France was using the DBER as at 1 January 2017, no
impact on investments and consumers and products is shown for the DBER due to
confidentiality reasons.

143/171
III.7 Symmetric adjustment to the equity risk charge
Recital 61 of the Solvency II Directive states that in order to mitigate undue potential
pro-cyclical effects of the financial system and avoid a situation in which insurance and reinsurance undertakings are unduly forced to raise additional capital or sell their investments as a result of unsustained adverse movements in financial markets, the
market risk module of the standard formula for the SCR should include a symmetric adjustment mechanism with respect to changes in the level of equity prices.
The symmetric adjustment is expected to be positive (i.e. the capital requirement is
higher) when markets have risen recently, and negative (i.e. the capital requirement
is lower) when equity markets have dropped in the previous months.
Use of the symmetric adjustment to the equity risk charge
The symmetric adjustment mechanism applies to all undertakings that use the
standard formula to calculate the equity risk sub-module of the SCR, including all undertakings using a partial internal model.
Impact on the financial position of undertaking
The impact results presented in this section are based on the information request to
undertakings, in which the impact of removing the symmetric adjustment mechanism
on both the SCR and the MCR were collected.
The information request was particularly addressed to undertakings exceeding a
materiality threshold defined as follows: capital requirement for equity risk net of the
loss absorbing capacity of technical provisions divided by the SCR exceeding 50%.
Undertakings not exceeding the materiality threshold could submit data on a
voluntary basis.
In total data from 231 undertakings from 22 Member States have been received: 133
undertakings exceeding the materiality threshold, 94 undertakings not exceeding the
materiality threshold and 4 undertakings where no indication was provided. The equity
38 66
43 32 26
304
88
12
161
47
441
40 22 27
173
8
104
37 9
265
7
60
138
70 62 43 31
136
16 15
299
0
50
100
150
200
250
300
350
400
450
500
AT BE BG CY CZ DE DK EE ES FI FR GR HR HU IE IS IT LI LT LU LV MT NL NO PL PT RO SE SI SK UK
Number of undertakings using symmetric adjustment

144/171
investments of those undertakings represents the 25% of the total equity investments
of all undertakings in the EEA.
In the analysis of the data differentiation has been made between undertakings which
apply the transitional measure on equity risk according to Article 308b(13) of the
Solvency II Directive and undertakings which do not apply that measure. Within the
considered sample, 56 undertakings reported to use the transitional measure on
equity risk and 175 reported not to use it.
Due to confidentiality reasons, in this section data at national level are not shown for
those countries for which less than 3 undertakings reported an impact of the SA.
The following graphs show the average impact at EEA level and per country of
removing the symmetric adjustment mechanism on the SCR and the SCR ratio as well
as on the MCR and MCR ratio for undertakings not applying the equity transitional.
Since the SA at 31 Dec 2016 was - 1.44%, setting the SA to zero would increase the
stress on equity exposures applied to calculate the SCR. At EEA level the average
impact of removing the SA on the SCR for undertakings not applying the equity
transitional is 0.9%; undertakings reported that the impact of not applying the
adjustment was on average a reduction of the SCR ratio by 2 percentage points; the
ratio with adjustment is 218% while the ratio without the adjustment would be 216%.
If only those undertakings particularly exposed to equity risk (i.e. those exceeding the
materiality threshold) were considered, the average impact on the SCR would be
1.3%; those undertakings reported that the impact of not applying the adjustment
was on average a reduction of the SCR ratio by 2 percentage points; the ratio with
adjustment is 232% while the ratio without the adjustment would be 230%.

145/171
0.2%
0.1%
1.6%
1.5%
1.2%
0.8%
1.4%
2.4%
0.5%
1.0%
0.2%
1.4%
0.0%
0.9%
0.0% 0.5% 1.0% 1.5% 2.0% 2.5% 3.0%
UK
NL
LU
IS
IT
IE
FR
FI
ES
DK
DE
BE
AT
EEA
Average impact on the SCR of removing the SA without application of the equity transitional
160%
175%
194%
170%
259%
180%
225%
237%
273%
348%
377%
235%
311%
218%
159%
174%
191%
167%
256%
178%
222%
231%
272%
344%
377%
232%
311%
216%
UK
NL
LU
IS
IT
IE
FR
FI
ES
DK
DE
BE
AT
EEA
Average impact on the SCR ratio of removing the SA without application of the equity transitional
SCR without SA
SCR with SA

146/171
At EEA level the average impact of removing the SA on the MCR for undertakings not
applying the equity transitional is 0.4%; if only those undertakings particularly
exposed to equity risk (i.e. those exceeding the materiality threshold) were
considered, the average impact on the MCR would be 0.5%.
0.2%
0.1%
1.4%
0.0%
0.7%
0.1%
1.2%
2.2%
0.3%
0.2%
0.1%
0.0%
0.0%
0.4%
0.0% 0.5% 1.0% 1.5% 2.0% 2.5%
UK
NL
LU
IS
IT
IE
FR
FI
ES
DK
DE
BE
AT
EEA
Average impact on the MCR of removing the SA without application of the equity transitional

147/171
The following graphs show the average impact at EEA level and per country of
removing the symmetric adjustment mechanism on the SCR and the SCR ratio as well
as on the MCR and MCR ratio for undertakings applying the equity transitional.
At EEA level the average impact of removing the SA on the SCR for undertakings not
applying the equity transitional is 0.5%; if only those undertakings particularly
exposed to equity risk (i.e. those exceeding the materiality threshold) were
considered, the average impact on the SCR would be the same.
546%
522%
531%
441%
644%
503%
480%
879%
739%
771%
1402%
480%
1095%
593%
545%
521%
523%
441%
441%
503%
474%
860%
737%
769%
1401%
480%
1095%
591%
UK
NL
LU
IS
IT
IE
FR
FI
ES
DK
DE
BE
AT
EEA
Average impact on the MCR ratio of removing the SA without application of the equity transitional
MCR ratio with SA put tozero
MCR ratio

148/171
0.3%
0.7%
0.8%
0.3%
1.1%
0.2%
0.5%
0.5%
0.0% 0.2% 0.4% 0.6% 0.8% 1.0% 1.2%
NL
FR
FI
ES
DK
DE
BE
EEA
Average impact on the SCR of removing the SA with application of the equity transitional

149/171
At EEA level the average impact of removing the SA on the MCR for undertakings
applying the equity transitional is 0.3%; if only those undertakings particularly
exposed to equity risk (i.e. those exceeding the materiality threshold) were
considered, the average impact on the MCR would be 0.4%.
288%
332%
209%
289%
324%
379%
210%
303%
287%
330%
207%
288%
320%
379%
209%
302%
NL
FR
FI
ES
DK
DE
BE
EEA
Average impact on the SCR ratio of removing the SA with application of the equity transitional
SCR without SA
SCR with SA

150/171
0.1%
0.7%
0.6%
0.3%
1.0%
0.2%
0.4%
0.3%
0.0% 0.2% 0.4% 0.6% 0.8% 1.0% 1.2%
NL
FR
FI
ES
DK
DE
BE
EEA
Average impact on the MCR of removing the SA with application of the equity transitional

151/171
III.8 Extension of the recovery period
Under Solvency II insurance and reinsurance undertakings are required to hold
eligible own funds that cover their SCR. When an undertaking is not covering its SCR,
the national supervisory authority shall require it to take the necessary measures to
achieve, within six months from the observation of non-compliance with the SCR, the
re-establishment of the level of eligible own funds covering the SCR or the reduction
of its risk profile to ensure compliance with the SCR. The supervisor may, if
appropriate, extend that period by three months.
Article 138(4) of the Solvency II Directive states that supervisory authorities may,
under certain circumstances, further extend the recovery period for the re-
establishment of compliance with the SCR as set out in Article 138(2) of that Directive
by a maximum period of 7 years.
This power applies in the event of exceptional adverse situations affecting insurance
and reinsurance undertakings that represent a significant share of the market or of
the affected lines of business. The condition for an exceptional adverse situation are
on or more of the following:
• A fall in financial markets which is unforeseen, sharp and steep;
• A persistent low interest rate environment;
• A high-impact catastrophic event.
1129%
953%
807%
667%
930%
1361%
427%
912%
1127%
947%
802%
665%
921%
1359%
425%
909%
NL
FR
FI
ES
DK
DE
BE
EEA
Average impact on the MCR ratio of removing the SA with application of the equity transitional
MCR without SA
MCR with SA

152/171
This extension of the recovery period can only be granted after EIOPA has declared
the existence of an exceptional adverse situation. A necessary condition for the
declaration is a request by a national supervisory authority. Article 288 of the
Solvency II Delegated Regulation further states several factors and criteria that EIOPA
shall take into account in assessing the existence of an exceptional adverse situation.
Where appropriate EIOPA could consult the ESRB before deciding on the existence of
an exceptional adverse situation.
Once EIOPA has declared the existence of an exceptional adverse situation, the
national supervisory authorites can decide on an extension of the period and
determine its length for individual insurance and reinsurance undertakings. For that
purpose the supervisors shall take into account the factors and criteria set out in
Article 289 of the Solvency II Delegated Regulation. To ensure a consistent approach
in the extension of the recovery period, EIOPA issued on 14 September 2015
Guidelines on the extension of the recovery period in exceptional adverse situations.
The guidelines relate in particular to the decision to grant an extension, the duration
of the extension and the withdrawal and revocation of the extension.
During the extended recovery period the undertakings affected are required to submit
every three months a progress report to their NSA setting out the measures taken
and the progress made to meet the SCR; in case of no significant progress, the
extension of the recovery period will be withdrawn.
To date EIOPA has not received a request to declare an exceptional adverse situation.
It should be noted that the transitional measure of Article 308b(14) of the Solvency II
Directive may in 2017 still apply to cases of non-compliance with the SCR. According
to that transitional provision, the recovery period for undertakings which comply with
Solvency I capital requirements at the end of 2015 but do not comply with the SCR in
the first year of application of Solvency II, may last until 31 December 2017.
Where an insurance or reinsurance undertaking is subject to the SCR transitional
measure, it has to submit a progress report to its NSA every three months setting out
the measures taken to re-establish the level of eligible own funds covering the SCR or
to reduce the risk profile to ensure compliance with the SCR. The extension has to be
withdrawn where that progress report shows that there was no significant progress in
achieving that objective.
The following table shows the number of undertakings breaching the SCR (taking into
account all LTG measures and equity measures applied) on 31 December 2016. For
countries not listed in the table all undertakings meet the SCR.
Country Undertakings
breaching the
SCR
Bugaria 3
Cyprus 1
Czech Republic 1

153/171
France 4
Greece 1
Ireland 3
Italy 4
Luxembourg 6
Malta 2
Netherlands 3
Norway 1
Poland 1
Romania 1
Spain 2
UK 12
Total 44
IV. Thematic focus on public disclosure
Solvency II requires insurance and reinsurance undertakings that apply the MA, VA TRFR or TTP to publicly disclose information on them, in particular about their financial
position without application of the measures.27 In May 2017 insurance and reinsurance undertakings had to make these disclosures for the first time as part of their publication of the Solvency and Financial Condition Report (SFCR).
As a thematic focus of this report EIOPA assessed the relevance, comprehensibility and completeness of the disclosed information and whether it is useful for comparison
across undertakings. The assessment was based in particular on a questionnaire to NSAs about the first public disclosure and on a workshop with stakeholders that are the main addressees of the public disclosure, in particular analysts, rating agencies,
journalists and consumer protection associations.
Mandatory disclosures
For the purpose of the thematic focus on public disclosure, NSAs responded on a detailed questionnaire. To answer the questions put forth in this questionnaire, NSAs
analyzed the SFCRs on the basis of a representative sample of the undertakings in their market, putting particular focus on those undertakings using the LTG measures
or measures on equity risk.
27
See Article 296 (2)(d) to (f) of the Solvency II Delegated Regulation.

154/171
With one exemption, NSAs were broadly satisfied with the completeness of the
information disclosed by undertakings as well as its consistency with the information reported for solvency purposes.
Concrete observations with respect to cases of incomplete or inconsistent information were however addressed by 10 NSAs. Inconsistencies between the information
reported for solvency purposes and the disclosed information was identified by 5 NSAs, however only for a small group of undertakings. Incomplete information was also identified by 5 NSAs.
Specific considerations where NSAs were not satisfied with the quality of the way the measures are described in the narrative part of the SFCRs include the following:
The level of detail of the information provided varies by undertakings. Whereas some undertakings focus solely on quantitative information others provided further qualitative information including background information on the LTG
measures. Thus, the description of LTG measures was observed to be very brief in some cases and could well be more comprehensive to ensure better
understanding of the effectiveness of the measures. This includes cases where the presentation of the impact of the measures was limited to quantitative information. Only disclosing the quantitative information of QRT S.22.01.
without further explanations of the figures was identified as a negative example by some NSAs.
In individual cases undertakings did not report about the fact that they were not meeting the solvency capital requirement as at Q3 2016 without the TTP where they were again meeting the requirements at YE 2016. This was
considered inadequate by the NSA concerned. In another case, a supervisor missed more detailed information and explanation on the impact of the TTP.
The summary of the SFCR was not considered to be complete and sufficient in addressing the use and impact of the measures in the case of one NSA.
Additional information provided
No NSA reported on concrete expectations to disclose further information with respect
to the LTG measures and equity risk measures in addition to the information requested in Article 296(2) letters d-g and Article 297(3) in Solvency II Delegated Regulation. However, some NSAs indicated that at the point in time where the
questionnaire was answered, they were still in the process of finalizing their assessment on the quality of submissions. Any final conclusions on the need for
further information in the narrative part concerning the measures would therefore only be drawn afterwards. Thus, whereas no particular expectations were set for 2017
as the first year of public disclosure this may be reconsidered by NSAs in the future.
NSAs also analyzed whether undertakings have actually disclosed additional information with respect to the LTG measures and equity risk measures.
Only a small number of NSAs identified additional information on the VA such as information on liquidity planning, measures in case the VA is set to zero, impact of the
VA on the investment behavior or information on the written policy. Individual undertakings provided further information e.g. on the impact of the VA on the best estimate by LoB, the impact of varying sizes of the VA on the solvency position or
details of the approval process.
In half of the Member States where the transitional measures are applied, NSAs
identified further information with respect to the these measures such as details on

155/171
undertaking’s phasing in plan, a description of their dependency on the measure,
information on the run-off of the transitional or details on the approval process.
Only one NSA identified additional information on the MA. Where undertakings gave
further information on the MA, they generally provided – next to the quantitative impact on balance sheet items such as TPs, OF and SCR – an explanation on the
quantification of the MA.
With respect to the extrapolation, a number of NSAs identified undertakings addressing the impact of applying a different UFR on their solvency position.
Relative impact of measures
The project group was also particularly interested in whether undertakings using the
LTG measures and equity risk measures disclose any relative impact of the measures, e.g. providing information such as “the SCR changes by x % without application of the LTG measures”.
Observations vary across countries. Whereas 13 NSAs did not observe any undertakings disclosing relative impacts (including those countries where the
measures are not applied) – others observe a small number of undertakings outlining relative impacts. Nevertheless, 5 NSAs reported that a big share of the market reported on the relative impact of the measures.
Where undertakings addressed the relative impact of the measures they typically mention the relative impact of the measures on the SCR or the solvency ratio,
sometimes also on Own Funds and TP.
Summary of the SFCR
NSAs also provided information on whether the summary of the SFCR (Article 292 of
the Solvency II Delegated Regulation) includes the reference to the measures used and information on the impact of the measures.
Undertakings using one of the transitional measures in most cases report on the use of the measures in the summary of the SFCR.
With respect to the VA, the picture is not so homogeneous. Around half of the
undertakings that are using the VA mention the use of the VA in the summary of the SFCRs. However, it can be observed that for countries where only a small number of
undertakings uses the VA, the VA is typically mentioned in the summary. In contrast, in countries where the use of the VA is common, the summary does only mention the use of the VA in some cases.
Practices vary also in the countries where the MA is used. Whereas in one country all MA users mention the use of the measures in the summary, in the other country only
some undertakings mention the use of the MA in the summary.
Where undertakings provided information on the use of the measures in the summary
of the SFCR they did not necessarily also provide information on the impact of the measures. For all measures NSAs observed the mentioning of the impact of the measures only in some cases.
Further information on SFCRs
Only 1 NSA reported on a case where a permission not to disclose information
concerning the measures on the basis of Article 53 (1) of the Solvency II Directive was granted.
The majority of NSAs did not identify any undertakings indicating a major
development according to Article 54(1) of the Solvency II Directive in their SFCR.

156/171
One case was however observed: One undertaking disclosed approval for a second MA
portfolio as well as two recalculations of the TTP. This undertaking also disclosed an approval to apply VA to the relevant risk-free interest rate term structure but did not
provide detailed analysis as the change was not considered material. These three disclosures were made on own initiative.
7 NSAs observed individual cases in which undertakings in their SFCR reflected the estimated impact of the decrease of the portion of the adjustment performed on the first day of the next financial year (see EIOPA Opinion of 21 December 2016 on
disclosure of information related to the use of transitional measures in the calculation of technical provisions - the opinion recommends the disclosure of the estimated
impact of the decrease of the portion of the adjustment performed on the first day of the next financial year where it has a material impact on the solvency position of the undertaking).
The majority of NSAs did not observe any market reactions following the public
disclosure of the impact of the measures. From the rest of the countries, the following
reactions have been observed:
Press articles providing some general considerations about the disclosure of LTG
measures across Europe.
Some market analysts have published rankings of solvency ratios without the transitional measures.
The majority of NSAs did not report any relevant evidence on how the information
disclosed on the impact of the LTG measures and equity risk measures has been
perceived by policyholders/investors/market analysts. From the rest of the countries,
two NSAs referred that some market analysts put the focus on the solvency ratio ex-
transitional. Another NSA noted that the information on the impact of LTG measures
has been perceived with a quite remarkable level of interest by market analysts and
considered useful to assess those situations where the use of such measures might
have a considerable impact on solvency position.
Regarding the press coverage on the public disclosure of the Solvency II data, a
majority of NSAs noted little or no press coverage of the public disclosure of Solvency
II data. Where press coverage had been observed, the main messages were:
Some NSAs noted that TTP had been a primary focus of the discussion, with MA also mentioned.
One NSA noted that the coverage observed focused on the figures without LTG/equity measures. Other NSAs noted that press coverage either included the LTG/equity measures within the reporting, or reported on both with and
without the measures.
Articles / presentations had also been noted on the heterogeneity of the
published SFCRs, for example in terms of presentation, number of pages and explanation.
Some coverage was critical of the SFCRS that had been produced in respect of
the first reporting period.
Other coverage analysed results within jurisdictions, such as Germany,
Luxembourg, the Netherland and the United Kingdom.

157/171
NSAs were also asked about the level of concern in the media with respect to cases
where undertakings are dependent on the measures to comply with capital
requirements. A number of NSAs pointed out that no local undertakings were
dependent on the measures to comply with capital requirements.
Where NSAs had observed media comment, the majority indicated that there was
either a low or very low level of concern.
Four NSAs had observed a medium level of concern. Three of the four medium
responses were in respect of only some of the measures. They mentioned TTP as a
concern, plus one NSA also indicated that MA was of medium concern in the media.
Stakeholders perception
In order to understand stakeholders perception of the presentation of LTG measures
in undertaking’s SFCRs, a questionnaire was circulated to selected stakeholders
including rating agencies, actuarial organizations, journalists, consulting undertakings,
associations for consumers and investors as well as analysts. In addition, a workshop
was organized in September 2017 for the purpose of discussing the public disclosure
on the measures. At the workshop were representativies of auditors, rating agencies,
analysts, journalists, actuarial associations and consumer protection associations.
In the responses to the questionnaire, participants emphasised the importance of
transparency on the measures, in particular with regard to their impact on the
solvency position. Overall it the first round of publications was deemed to be
satisfactory, but insufficiencies with respect to completeness and comparability of
information were identified. It was also mentioned that in some cases it is not
sufficient to just have quantitative information without further qualitative information
on the context.
During the workshop, several topics were discussed in detail.
This was for example the level of detail that needs to be included in the SFCRs. The
association for consumer protection strongly supported further illustration of the use
and the impact of the measures for the purpose of the transparency to policyholders,
in particular in the summary of the SFCR. However, others noted that the information
is not per se understandable by policyholders, even if further information was
provided. According to them, the information included in the SFCRs should therefore
reflect the information needed by an informed third party. Rating Agencies explained
that a full understanding of the undertaking’s business model and its capitalization is
difficult anyway considering the complexity of Solvency II and the reconciliation with
IFRS or local GAAP.
Stakeholders expressed their interest in additional information on the measures and
suggested its disclosure in the SFCRs:
Information on the portfolio of assets on the basis of which the MA is
determined as well as explanations on the derivation of the MA and the final size of the MA that is applied in the valuation of technical provisions.
The solvency ratios with and without the measures – the quantitative templates only provide the own funds and SCRs separately with and without the measures.

158/171
A general analysis of change to track changes in the valuation and solvency
position from one year to the next year – this suggestion is not solely related to the use of LTG measures or the measures on equity risk.
The result of sensitivity calculations. Where some undertakings calculate such sensitivities already, the comparability between undertakings is limited. It was
suggested to standardize the scenarios to ensure comparability.
Information on the duration mismatch or the level of financial guarantees that undertakings are providing to policyholders to enable better understanding of
the impact of the use of the measures on undertaking’s solvency position.
The impact of the use of a measure by product or line of business or to consider
the impact of a measure separately for the back book and new business. This would allow stakeholders to understand the relevance of the measures for the undertaking in the future.
With regard to the VA information on the liquidity policy of the undertaking and the size of the VA it would have if it was calculated on the basis of the
undertaking’s assets instead of the assets of a portfolio representative for the market.
Information on the impact of the extrapolation like calculating the impact of
variations of the UFR on the solvency position.
The impact of the transitionals over time and the measures undertakings intend
to apply in order to strengthen their solvency position.
Stakeholders expressed the need for further qualitative considerations next to the
quantitative figures about the LTG measures and measures on equity risk to enable
the readers of the report to get a better picture on the business an undertaking
performs as well as the view an undertaking has on its business.
Stakeholders noted that they did not observe any massive market reaction to the
disclosure of the impact of the LTG measures.
The questionnaire was also discussed at the meeting of EIOPA’s insurance and
reinsurance stakeholder group on 5 September 2017. The main input from the group
was that the disclosure on the measures should consider whether the addressees of
the disclosed information sufficiently understand the measures in order to put that
information in context.
Public disclosure by NSAs
Article 31(2) of the Solvency II Directive establishes the requirement of mandatory
disclosure by NSAs. Such requirement is developed in Articles 315 to 317 of the
Solvency II Delegated Regulation and the ITS with regard to the templates and
structure of the disclosure of specific information by supervisory authorities28. The
requirement includes the mandatory disclosure of aggregate statistical data regarding
the use of adjustments or transitional measures by undertakings.
28 Commission Implementing Regulation (EU) 2015/2451 of 2 December 2015 laying down implementing technical standards with regard to the templates and the structure of the disclosure of specific information by supervisory authorities in accordance with Directive 2009/138/EC of the European Parliament and of the Council

159/171
Such information shall be disclosed in respect of each calendar year within three
months after the date by which the undertakings having a financial year ending 31
December are required to submit annual reporting templates (i.e. 20th August 2017
for statistical data for year 2016).
After NSAs published in their websites aggregate data on the use of measures by
undertakings in their jurisdiction none of them received any question from
stakeholders regarding the information disclosed with respect to the measures. Only
one NSA (UK) mentioned general queries on the LTG package and its impact.
Additional relevant information with respect to the measures is available on the
website of some NSAs, such as:
Requirements for the approval processes for certain measure (DK, FR)
General information on those measures can be find on the page dedicated under Solvency 2 (FR, IS)
Supervisory statements/ Q&A documents with respect to the application of certain measures (DE, UK, NL)
One NSA (DE) has published assessments of the annual Solvency II narrative and
quantitative reporting of insurance undertakings (as at year-end 2016) in its national
market (including issues with respect to the publication of information on the use of
LTG measures in the SFCR) and guidance for undertakings on the supervisory
reporting under Solvency II29) which is updated on a regular basis. The ongoing
assessment of the narrative and quantitative reporting of insurers - including issues
with respect to the publication of information on the use of LTG measures in the SFCR
- will lead to further updates, and where necessary addtions, during the course of this
year.
One NSA has published a Q&A with respect to 'Applying the volatility adjustment in
internal models'
Most of the NSAs have not organised any dedicated event with stakeholders to explain
the LTG measures and equity risk measures and/or the public disclosure of data on
the measures. Only two NSAs organised specific meetings with stakeholders dedicated
to the application of certain measures; in particular DK organised a meeting with the
industry regarding the VA and MA and FR organised a meeting on the DBER. Other
NSAs have reported communication with stakeholders with respect to the measures
either through the participation in different events with the industry and/or actuarial
associations (BE, FR, DE, NO) or though bilateral discussion with interested
undertakings (GR, UK)
Several NSAs organised events regarding the public disclosure in general (IS, IT, LI)
not limited to the LTG measures; in particular IT organised regular workshops with
journalists on Solvency II and on the first year of public disclosure, including the LTG
measures.
29
See https://www.bafin.de/dok/7851368.

160/171
Annexes
Annex 1: Overview of the European insurance market
The following charts show for each EEA country the number of insurance and
reinsurance undertakings and their share of the EEA insurance market expressed as
percentage of technical provisions and of gross written premiums.
38 68
43 32 27
339
89
12
161
47
460
40 22 27
184
8
109
37 9
268
7
61
145
70 62 43 31
140
16 15
335
0
50
100
150
200
250
300
350
400
450
500
AT BE BG CY CZ DE DK EE ES FI FR GR HR HU IE IS IT LI LT LU LV MT NL NO PL PT RO SE SI SK UK
Number of undertakings

161/171
0.0%
5.0%
10.0%
15.0%
20.0%
25.0%
30.0%
AT BE BG CY CZ DE DK EE ES FI FR GR HR HU IE IS IT LI LT LU LV MT NL NO PL PT RO SE SI SK UK
EEA market share in technical provisions per country
0.0%
5.0%
10.0%
15.0%
20.0%
25.0%
AT BE BG CY CZ DE DK EE ES FI FR GR HR HU IE IS IT LI LT LU LV MT NL NO PL PT RO SE SI SK UK
EEA market share in technical provisions of EEA undertakings part of a group per country

162/171
Annex 2: Impact of the measures on the financial position of
undertakings
The following graphs show the impact of removing the measures MA, VA, TRFR and
TTP on technical provisions, eligible own funds to cover the SCR and the SCR per
undertaking. The impact is measured relative to the amount with the measures. Each
bar corresponds to one undertaking. The bars are ordered by size in each graph. The
graphs demonstrate that there is a wide disparity of the impact.

163/171

164/171

165/171
The following graph shows the average impact at EEA level and per country of each of
the three specified scenarios on the SCR ratio for non-life and reinsurance
undertakings.

166/171

167/171
Annex 3: Asset classes
The statistics on investments of insurance and reinsurance undertakings presented in
this report are based on the following asset classification. The asset classes are
specified in terms of the items of the Solvency II balance sheet used for supervisory
reporting (template S.02.01.02).
30
Derivative liabilities (shown in row R0790) taken into account with a negative sign.
Asset Class
Row and designation in balance sheet template
Row Designation
Government bonds R0140 Government bonds
Corporate bonds R0150 Corporate bonds
Equities R0100 Equities
Assets held for index-linked and unit-linked products
R0220 Assets held for index-linked
and unit-linked products
Other assets
R0080 Property (other than for
own use)
R0090 Holdings in related
undertakings, including
participations
R0160 Structured notes
R0170 Collateralised securities
R0180 Collective Investments
Undertakings
R0190/R0790 Derivatives30
R0200 Deposits other than cash
equivalents
R0210 Other investments
R0410 Cash and cash equivalents

168/171
Annex 4: Impact on consumers and products
The following table provides a more detailed indication of the main products available
in each market that contain LTG. Again, this is based on the NSA’s own definition of
LTG, which may differ across the region. In addition, the definition of what counts as
material differs across the region. Some countries have provided information of all
products with LTGs, whereas others have only responded with the key source of LTGs.
Country Description of products
AT Traditional Life Insurance : With Profit min interest rate guarantee
BE
Traditional Life Insurance:
Life insurance, return of premium
With Profit products
Unit Linked with guaranteed return or capital protection:UL with Guarantee
repayment percentage of net premium
Health insurance: Workers Compensation
Non-Life Annuities: Motor third party liability
BG
Traditional Life Insurance: With profit products
Index-linked and unit-linked insurance
CY
Traditional Life Insurance: Endowments with guaranteed surrender and maturity
value
Savings products with death and survival cover
Unit Linked with guaranteed return or capital protection:UL with guaranteed interest
rate
Health insurance: Income protection products
CZ
Traditional Life Insurance: Endowment and universal life products with guaranteed
interest rate
Unit Linked with guaranteed return or capital protection: UL with guaranteed
interest rate
Health insurance: Annuity related to health protection (disability)
DE
Traditional Life Insurance: Savings and pension products offering, guaranteed
interest rate, guaranteed bonuses on with profits products once allocated,
guaranteed minimum pay out on endowment (lump sum or annuity), guaranteed
surrender value in first years of contract
Hybrid Products: Hybrid products are a mix of pure UL with traditional With Profits.
Contain a dynamic shifting mechanism (similar to CPPI) so guaranteed benefit is
ensured
DK
Traditional Life Insurance: Savings products with risk covers
Unit Linked with guaranteed return or capital protection:Few products with
guaranteed features

169/171
Country Description of products
Health insurance: Workers Compensation
EE
Traditional Life Insurance: Endowment with guaranteed interest rate
Annuity with profit participation
Unit Linked with guaranteed return or capital protection: UL with capital protection
(paid in premium or locked in value)
Non-Life Annuities: Motor third party liability
ES
Traditional Life Insurance: Traditional life with profits products with guaranteed
investment return
Unit Linked with guaranteed return or capital protection: Pure UL with small capital
on death
FI
Traditional Life Insurance: Savings and investment policies with guaranteed interest
rates, pensions products with capital protection
Unit Linked, simialr to traditional life, but with guaranteed death benefits
Variable Annuity GMDB guarantees
Non-Life Annuities: Motor third party liability and Workers Compensation
FR
Traditional Life Insurance: Savings or pension product with guaranteed interest
rate.
Savings product offers guaranteed surrender rate
Borrowers insurance covering death
Unit Linked with guaranteed return or capital protection:UL with guaranteed interest
rate
Health insurance: Annuity related to health protection (disability)
Non-Life Annuities: Motor third party liability
Specific NL Insurance: Construction Risk: These are insurance contracts to protect
the building in case any flaws are discovered within 10 years of the construction;
GR
Traditional Life Insurance: Traditional whole life and endowment products
Unit Linked with guaranteed return or capital protection:UL with guaranteed interest
rate or capital protection
HR Traditional Life Insurance: Life insurance with guarantees on surrender value and
sum assured
HU
Traditional Life Insurance: With profit products for savings and pensions purposes
Unit Linked with guaranteed return or capital protection:UL with capital protection

170/171
Country Description of products
IE
Traditional Life Insurance: With Profit products make up a small proportion of the
market
Variable Annuities:A mix of GMAB, GMWB and GMDB guarantees on both single
and regular premium basis. Mainly sold on a cross-border basis into multiple
counties.
IT
Traditional Life Insurance: With profit products with guarantees on interest rate,
sum assured and investment return
Hybrid Products: 27% of new life insurance products sold in 2016 are hybrid
products (mix of with profits and UL)
Unit Linked with guaranteed return or capital protection:Small volume of UL with
capital protection
Some products have specific management techniques (E.g. CPPI) to guarantee a
minimum return
Variable Annuities:One insurance group offers this type of product
LI
Traditional Life Insurance: Few undertakings offering traditonal products with
guarantees on interest rates
Unit Linked: Few undertakings offerer unit linked products with guaranteed capital
protection
Variable Annuity: Single premium GMWB products
LT
Traditional Life Insurance: With profit endowment with guaranteed sum assured
Unit Linked with guaranteed return or capital protection:UL with capital protection
LU
Traditional Life Insurance: Saving product with guaranteed interest rate
Non-Life Annuities: Annuities stemming from non-life liability products
LV
Traditional Life Insurance: Savings product with interest rate guarantee
Non-Life Annuities: Motor third party liability
MT Traditional Life Insurance: With Profits
NL
Traditional Life Insurance: Life insurance with guarantees on sum assured and profit
sharing
Unit Linked with guaranteed return or capital protection:UL with guaranteed
minimum investment return
Health insurance: Annuity related to health protection (disability
NO Traditional Life Insurance: Private group pension products
PL Traditional Life Insurance: Traditional Life Insurance: Saving and investment
product with guaranteed interest rate

171/171
Country Description of products
Unit Linked with guaranteed return or capital protection:Value of UL fund
guaranteed not to be lower than previous day / month / year
Non-Life Annuities: Motor third party liability
PT
Traditional Life Insurance: Saving and investment product with guaranteed interest
rate
Unit Linked with guaranteed return or capital protection: UL with guaranteed
interest rate or capital protection
Health insurance: Workers Compensation
RO
Traditional Life Insurance: With Profits with guaranteed sum assured
Unit Linked with guaranteed return or capital protection: Guaranteed policy account
value at death or maturity
Health insurance: Annuity related to health protection (disability)
Non-Life Annuities: Annuities stemming from non-life liability products
SE
Traditional Life Insurance: Life insurance with guarantees on sum assured
Unit Linked with guaranteed return or capital protection:Trend in the market for UL
products to have no, or limited, guarantees
SI
Traditional Life Insurance: Endowment assurance
Unit Linked with guaranteed return or capital protection: Typical purpose is
pensions
Variable Annuities: Typical purpose is pensions
Health insurance: Accident and health assurance or supplementary insurance
underwritten in addition to life insurance
SK
Traditional Life Insurance: Traditional life products with guaranteed investment
return
Unit Linked with guaranteed return or capital protection: UL with protection (e.g.
Critical illness, permanent disability)
UK
Traditional Life Insurance: With Profits with guaranteed sum assured and
investment return
Hybrid Products: Small amount on unitised with profits business with guaranteed
interest rate
Unit Linked with guaranteed return or capital protection:Small volume with
guaranteed value on maturity
Health insurance: Payment protection orders are annuities linked to a medical costs
index arising from accident compensation claims.


