+ All Categories
Home > Documents > Report on Nevada s Housing Market -...

Report on Nevada s Housing Market -...

Date post: 17-Feb-2018
Category:
Upload: vuongthuan
View: 213 times
Download: 0 times
Share this document with a friend
23
Report on Nevadas Housing Market October 2014 Funding provided by the Housing Data and Index Project, a joint initiative of: This series of reports on Nevadas Housing Market is co‐presented by the Lied Institute for Real Estate Studies at the University of Nevada, Las Vegas and the State of Nevada Department of Business & Industry. These reports provide monthly updates on housing market trends for stakeholders throughout Nevada.
Transcript

ReportonNevada’sHousingMarket

October2014

FundingprovidedbytheHousingDataandIndexProject,ajointinitiativeof:

ThisseriesofreportsonNevada’sHousingMarketisco‐presentedbytheLiedInstituteforRealEstateStudiesattheUniversityofNevada,LasVegasandtheStateofNevadaDepartmentofBusiness&Industry.ThesereportsprovidemonthlyupdatesonhousingmarkettrendsforstakeholdersthroughoutNevada.

Page| 1

Nevada’sHousingMarket |October2014

TableofContents

NevadaStatewideTrends…….................................... 2

NorthernTrends………………………………………….. 10

SouthernTrends………………………………………….. 14

RuralTrends…………………………………………........... 18

Page| 2

Nevada’sHousingMarket |October2014

NevadaStatewideTrends

Population:2,790,136 in2013 HousingUnits:1,186,879 in2013

Source:U.S.CensusBureau:StateandCountyQuickFacts

Page| 3

NevadaStatewideTrends

Nevada’sHousingMarket |October2014

Nye

Elko

Clark

Lincoln

Humboldt

Washoe

WhitePine

Lander

Pershing

Eureka

Churchill

Mineral

Lyon

Esmeralda

Douglas

Storey

CarsonCity

Single‐FamilyHomeSales* October2014 M2MChange Y2YChangeNew 568 +1.7% ‐28.9%Existing 4550 ‐3.2% ‐11.1%DistressShare 17.3% ‐0.6% ‐27.2%

ResidentialConstructionTotalStarts 1150 ‐12 +357Single‐Family 723 +15 ‐22Multifamily 427 ‐27 +389

AverageSingle‐FamilySalesPrice*New $321,343 ‐0.1% +10.9%Existing $213,556 ‐0.4% +6.6%Distress $162,866 +0.1% +4.1%

Source:LiedInstitutecalculationsusingCoreLogic DataandtheStateoftheCitiesDataSystems byU.S.DepartmentofHousingandUrbanDevelopment.*FiguresportrayThree‐MonthMovingWeightedAverages

NevadasawlessthanaonepercentdecreaseindistresspropertysalesthismonthasbothshortsalesandREOsalesdecreasedmodestly.TheshareofhomeownersunderwaterinNevadaisnowat25percent– lessthanaonepercentdecreasefromonequarterago.

HomepricesinNevadasawalmostnochangethismonth.NorthernNevada’sincreaseinnewhomepricesweresimplyoffsetbySouthernNevada’sdecreaseinnewhomeprices.Likewise,SouthernNevada’sincreaseinexistinghomepriceswereoffsetbyadecreaseinNorthernNevada’sexistinghomeprices.

Totalresidentialconstructionstartsaresignificantlyhigherthantheywerethistimelastyear.ThisisduetolargeincreasesinmultifamilystartupsinSouthernNevada,assingle‐familystartupshavebeenrelativelysimilartothatoflastyearthroughoutallofNevada.

NevadaStatewideTrends

Page| 4

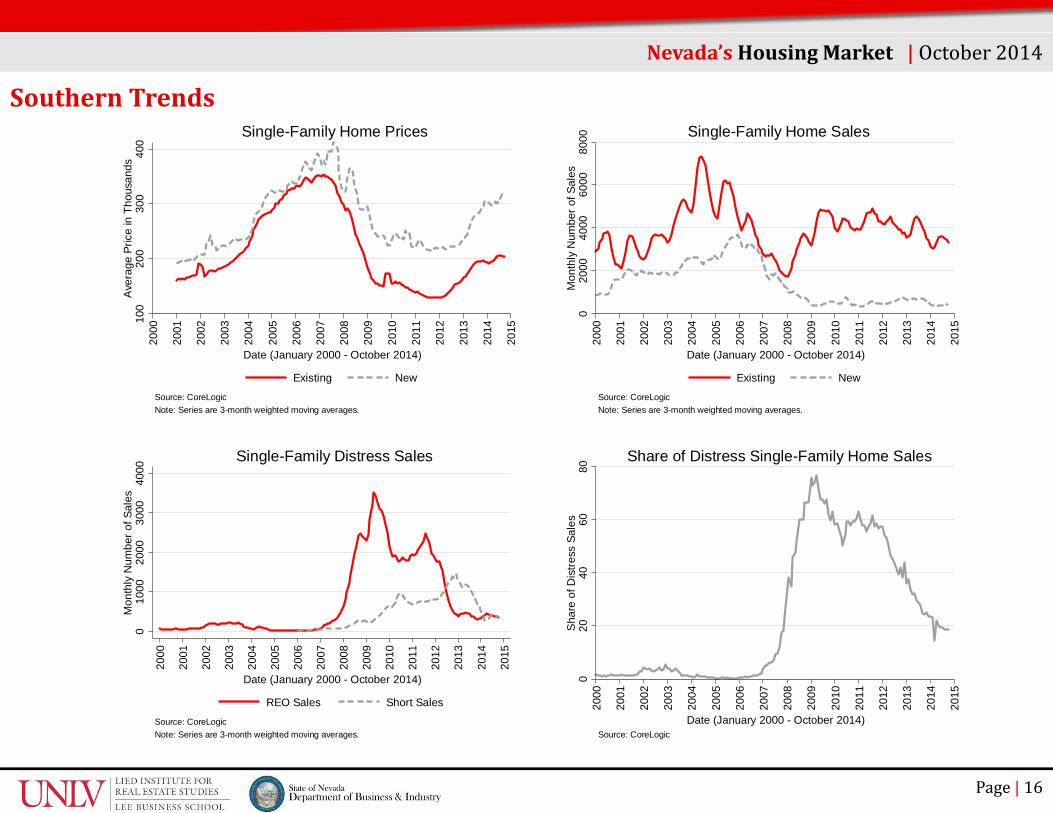
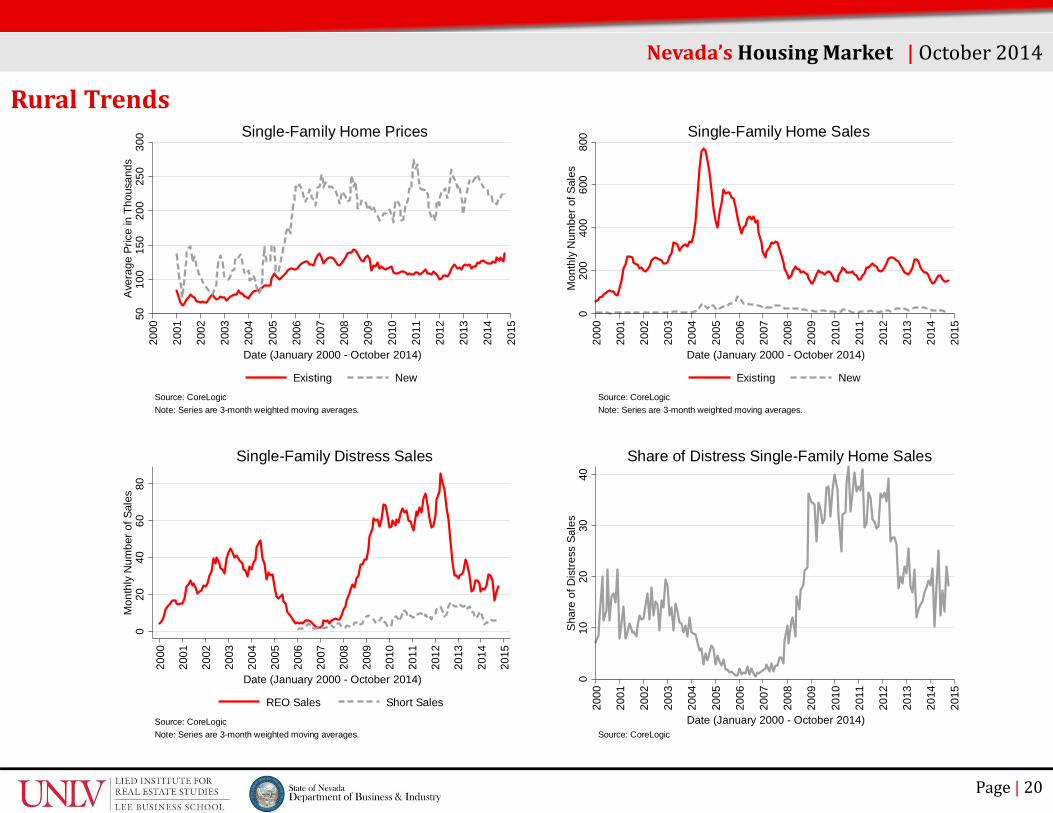
The Single‐Family Home Prices figure above shows the three‐month moving average price of existing homes and new homes.Existing homes are single family homes that were exchanged from one private owner to another. This includes homes sold byreal estate agents, owners, and lenders. New homes are single family homes that were exchanged from a builder to a privateowner. The other figure, Single‐Family Homes Sales, illustrates the number of those transactions for both existing and newhomes. A seasonal pattern is obvious in the Single‐Family Home Sales graph, with, more home sales during the summer thanduring the winter.

Nevada’sHousingMarket |October201410

020

030

040

0A

vera

ge P

rice

in T

hous

ands

2000

2001

2002

2003

2004

2005

2006

2007

2008

2009

2010

2011

2012

2013

2014

2015

Date (January 2000 - October 2014)

Existing New

Source: CoreLogicNote: Series are 3-month weighted moving averages.

Single-Family Home Prices

020

0040

0060

0080

0010

000

Mon

thly

Num

ber o

f Sal

es

2000

2001

2002

2003

2004

2005

2006

2007

2008

2009

2010

2011

2012

2013

2014

2015

Date (January 2000 - October 2014)

Existing New

Source: CoreLogicNote: Series are 3-month weighted moving averages.

Single-Family Home Sales

NevadaStatewideTrends

Page| 5

The Housing Affordability figure shows the proportion of home sales that could have been bought by borrowers earning atleast the local median income, with a conventional loan. This index was developed by the National Association of HomeBuilders (NAHB), to provide a benchmark of affordability. The other figure, Nevada Single‐Family Homes for Sale, shows thenumber of homes available for sale at the end of the month. These numbers include new listings that are awaiting a purchasingcontract, as well as homes that are under contract and about to sell.

Nevada’sHousingMarket |October201420

4060

8010

0P

ropo

rtion

of A

fford

able

Hom

e S

ales

2000

2001

2002

2003

2004

2005

2006

2007

2008

2009

2010

2011

2012

2013

2014

Date (1 Quarter 2000 - 3 Quarter 2014)

Las Vegas Reno Nation

Source: National Association of Home BuildersNote: Series denote the proportion of home sales affordable at median income.

Housing Affordability

Equilibrium

1020

3040

50W

asho

e Li

stin

gs in

Hun

dred

s

250

220

190

160

130

100

Cla

rk L

istin

gs in

Hun

dred

s

2007 2008 2009 2010 2011 2012 2013 2014Date (January 2007 - October 2014)

Clark Washoe

Source: Greater Las Vegas Association of Realtors and UNR's Center for Regional Studies

Nevada Single-Family Homes for Sale

NevadaStatewideTrends

Page| 6

Single‐Family Distress Sales is a figure that displays the monthly number of Real Estate Owned (REO) sales and short sales.REO sales are homes that have been repossessed by lenders through foreclosure and then sold in the market. Short sales, onthe other hand, are homes that were sold for an amount below the owner’s outstanding mortgage balance. Both numbers arethree‐month weighted moving averages. The other figure, Share of Distress Single‐Family Home Sales, tracks the proportion ofhome sales (including new home sales) that were REO sales or short sales. The long term decline in that share continues, evenas the number of such sales remains roughly level, indicating an increasing number of “normal” sales.

Nevada’sHousingMarket |October2014

020

4060

80S

hare

of D

istre

ss S

ales

2000

2001

2002

2003

2004

2005

2006

2007

2008

2009

2010

2011

2012

2013

2014

2015

Date (January 2000 - October 2014)Source: CoreLogic

Share of Distress Single-Family Home Sales

010

0020

0030

0040

00M

onth

ly N

umbe

r of S

ales

2000

2001

2002

2003

2004

2005

2006

2007

2008

2009

2010

2011

2012

2013

2014

2015

Date (January 2000 - October 2014)

REO Sales Short Sales

Source: CoreLogicNote: Series are 3-month weighted moving averages.

Single-Family Distress Sales

NevadaStatewideTrends

Page| 7

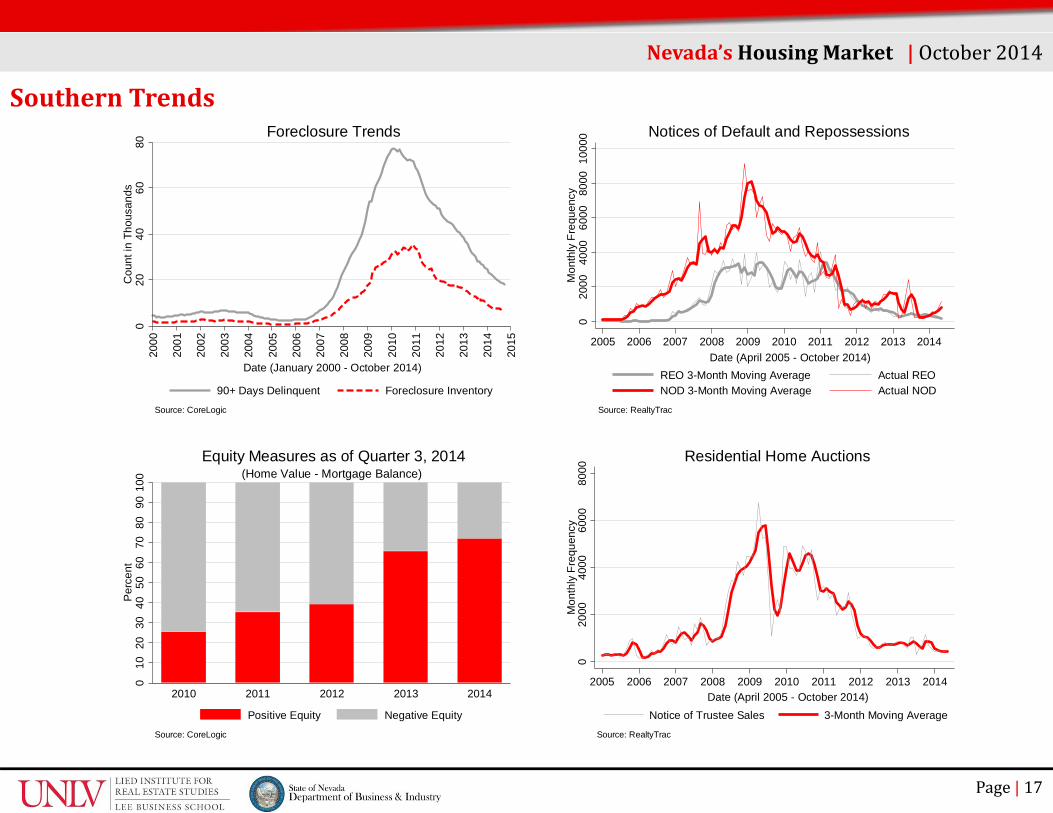
The Foreclosure Trends figure includes two series: the 90+ Days Delinquent series and the Foreclosure Inventory series. The90+ Days Delinquent series consists of the number of homes that are secured by a loan in default for 90 days or more. Thisincludes homes that are in the process of being foreclosed. The Foreclosure Inventory series consists of homes that have begunthe foreclosure process or are in some stage of foreclosure. The other figure depicts what proportion of homes secured by amortgage have positive equity or negative equity. When a home has a market value at or above its outstanding mortgagebalance, it is consider to have positive equity. Otherwise, the house has negative equity.

Nevada’sHousingMarket |October20140

2040

6080

100

Cou

nt in

Tho

usan

ds

2000

2001

2002

2003

2004

2005

2006

2007

2008

2009

2010

2011

2012

2013

2014

2015

Date (January 2000 - October 2014)

90+ Days Delinquent Foreclosure Inventory

Source: CoreLogic

Foreclosure Trends

100

9080

7060

5040

3020

100

Per

cent

2010 2011 2012 2013 2014

Source: CoreLogic

(Home Value - Mortgage Balance)Equity Measures as of Quarter 3, 2014

Positive Equity Negative Equity

NevadaStatewideTrends

Page| 8

These two figures are based on numbers gathered from County records by RealtyTrac. The first figure shows the monthlynumber of Notices of Default and Repossessions. The Notice of Default (NOD) is the initial stage of foreclosure that starts atleast 90 days after the homeowner’s mortgage default date. Not all homes that receive a NOD will necessarily be foreclosed.There exist other alternatives homeowners can invoke such as a loan modification, deed‐in‐lieu of foreclosure, and short sale.The other figure, Residential Home Auctions, shows the monthly number of homes that received a Notice of Trustee Sale andunderwent a public auction. It includes both the successful and unsuccessful auctions. Those that were unsuccessful revertback to the lender.

Nevada’sHousingMarket |October20140

2000

4000

6000

8000

1000

0M

onth

ly F

requ

ency

2005 2006 2007 2008 2009 2010 2011 2012 2013 2014Date (April 2005 - October 2014)

REO 3-Month Moving Average Actual REONOD 3-Month Moving Average Actual NOD

Source: RealtyTrac

Notices of Default and Repossessions

020

0040

0060

0080

00M

onth

ly F

requ

ency

2005 2006 2007 2008 2009 2010 2011 2012 2013 2014Date (April 2005 - October 2014)

Notice of Trustee Sales 3-Month Moving Average

Source: RealtyTrac

Residential Home Auctions

1.251.75.5.250Mortgage Foreclosure Starts as Percent of Stock

DelawareLouisiana

18. NevadaPennsylvania

TennesseeArkansasKentucky

MaineOhio

AlabamaIllinois

Rhode IslandIndianaGeorgia

ConnecticutNew York

MississippiFlorida

MarylandNew Jersey

Source: Mortgage Bankers Association's National Delinquency Survey

3rd Quarter 2014Top 20 States in Foreclosure Starts

121086420Percent of Loans in the Foreclosure Inventory

KentuckySouth Carolina

OklahomaIndianaOregon

Rhode IslandPennsylvania

OhioDelawareVermont

New Mexico9. Nevada

MarylandIllinoisHawaii

ConnecticutMaine

New YorkFlorida

New Jersey

Source: Mortgage Bankers Association's National Delinquency Survey

3rd Quarter 2014Top 20 States in Foreclosure Inventory

NevadaStatewideTrends

Page| 9

These figures rank Nevada nationally on the basis of data provided by The Mortgage Bankers Association’s NationalDelinquency Survey. The Top 20 States in Foreclosure Inventory uses the proportion of outstanding loans that are in theforeclosure inventory ‐ that is, the number of home loans reported to be in some stage of foreclosure divided by the totalnumber of home loans serviced. The Top 20 States in Foreclosure Starts is a ranking that uses mortgage foreclosure starts as apercent of stock. In other words, this is the number of initiated foreclosures divided by the total number of home loansserviced.

Nevada’sHousingMarket |October2014

Ranked8in2014Q2

Ranked15in2014Q2

Page| 10

Nevada’sHousingMarket |October2014

NorthernTrends

Population:614,491in2013 HousingUnits:267,161in2013

Source:U.S.CensusBureau:StateandCountyQuickFacts (CarsonCity,Churchill,Douglas,Lyon,Storey,andWashoeCounty)

Page| 11

NorthernTrends Theshareofhomessoldunderdistressdecreasedbyoverone

percentagepointthismonth.Thiswasduetoa40percentdecreaseinthenumberofREOsalesinNorthernNevadathismonth.ShortsalesactuallyincreasedbyonepercentfromlastmonthinNorthernNevada.

NorthernNevadatypicallyexperiencesadecreaseinresidentialconstructionstartsinthemonthofOctober.TotalresidentialconstructionstartsforNorthernNevadawerestillhigherthismonththantheywereformostothermonthsof2014.

NewhomepricessawanunusuallylargeincreasewhileexistinghomepricessawanunusuallylargedecreasethismonthinNorthernNevada.TheaveragepricegapbetweenanewhomeandanexistinghomeinNorthernNevadaisnowover$90,000.

Nye

Elko

Clark

Lincoln

Humboldt

Washoe

WhitePine

Lander

Pershing

Eureka

Churchill

Mineral

Lyon

Esmeralda

Douglas

Storey

CarsonCity

Nevada’sHousingMarket |October2014

Single‐FamilyHomeSales* October2014 M2MChange Y2YChange

New 109 ‐1.5% ‐1.5%Existing 1047 ‐2.4% ‐4.1%DistressShare 12.2% ‐8.6% ‐47.4%

ResidentialConstructionTotalStarts 221 ‐48 +128Single‐Family 165 +4 +74Multifamily 56 ‐52 +54

AverageSingle‐FamilySalesPrice*New $343,954 +3.1% +8.9%Existing $253,365 ‐2.2% +7.5%Distress $195,488 +0.7% +16.1%

Source:LiedInstitutecalculationsusingCoreLogic DataandtheStateoftheCitiesDataSystems byU.S.DepartmentofHousingandUrbanDevelopment.*FiguresportrayThree‐MonthMovingWeightedAverages

Page| 12

NorthernTrends

Nevada’sHousingMarket |October2014

150

200

250

300

350

400

Ave

rage

Pric

e in

Tho

usan

ds

2000

2001

2002

2003

2004

2005

2006

2007

2008

2009

2010

2011

2012

2013

2014

2015

Date (January 2000 - October 2014)

Existing New

Source: CoreLogicNote: Series are 3-month weighted moving averages.

Single-Family Home Prices

050

010

0015

0020

00M

onth

ly N

umbe

r of S

ales

2000

2001

2002

2003

2004

2005

2006

2007

2008

2009

2010

2011

2012

2013

2014

2015

Date (January 2000 - October 2014)

Existing New

Source: CoreLogicNote: Series are 3-month weighted moving averages.

Single-Family Home Sales

020

4060

Sha

re o

f Dis

tress

Sal

es

2000

2001

2002

2003

2004

2005

2006

2007

2008

2009

2010

2011

2012

2013

2014

2015

Date (January 2000 - October 2014)Source: CoreLogic

Share of Distress Single-Family Home Sales

010

020

030

040

0M

onth

ly N

umbe

r of S

ales

2000

2001

2002

2003

2004

2005

2006

2007

2008

2009

2010

2011

2012

2013

2014

2015

Date (January 2000 - October 2014)

REO Sales Short Sales

Source: CoreLogicNote: Series are 3-month weighted moving averages.

Single-Family Distress Sales

NorthernTrends

Page| 13

Nevada’sHousingMarket |October2014

05

1015

Cou

nt in

Tho

usan

ds

2000

2001

2002

2003

2004

2005

2006

2007

2008

2009

2010

2011

2012

2013

2014

2015

Date (January 2000 - October 2014)

90+ Days Delinquent Foreclosure Inventory

Source: CoreLogic

Foreclosure Trends10

090

8070

6050

4030

2010

0P

erce

nt

2010 2011 2012 2013 2014

Source: CoreLogic

(Home Value - Mortgage Balance)Equity Measures as of Quarter 3, 2014

Positive Equity Negative Equity

050

010

0015

00M

onth

ly F

requ

ency

2005 2006 2007 2008 2009 2010 2011 2012 2013 2014Date (April 2005 - October 2014)

REO 3-Month Moving Average Actual REONOD 3-Month Moving Average Actual NOD

Source: RealtyTrac

Notices of Default and Repossessions

020

040

060

080

010

00M

onth

ly F

requ

ency

2005 2006 2007 2008 2009 2010 2011 2012 2013 2014Date (April 2005 - October 2014)

Notice of Trustee Sales 3-Month Moving Average

Source: RealtyTrac

Residential Home Auctions

Page| 14

Nevada’sHousingMarket |October2014

SouthernTrends

Population:2,027,868 in2013 HousingUnits:854,089 in2013

Source:U.S.CensusBureau:StateandCountyQuickFacts (ClarkCounty)

Nye

Elko

Clark

Lincoln

Humboldt

Washoe

WhitePine

Lander

Pershing

Eureka

Churchill

Mineral

Lyon

Esmeralda

Douglas

Storey

CarsonCity

Page| 15

SouthernTrends

Nevada’sHousingMarket |October2014

Single‐FamilyHomeSales* October2014 M2MChange Y2YChangeNew 449 +2.4% ‐31.3%Existing 3324 ‐3.7% ‐12.5%DistressShare 18.8% +1.2% ‐23.1%

ResidentialConstructionTotalStarts 879 +32 +228Single‐Family 532 ‐5 ‐85Multifamily 347 +37 +313

AverageSingle‐FamilySalesPrice*New $317,819 ‐0.8% +10.4%Existing $204,995 +0.2% +5.6%Distress $158,191 +0.1% +1.8%

Source:LiedInstitutecalculationsusingCoreLogic DataandtheStateoftheCitiesDataSystems byU.S.DepartmentofHousingandUrbanDevelopment.*FiguresportrayThree‐MonthMovingWeightedAverages

TheshareofhomessoldunderdistressincreasedslightlythismonthinSouthernNevada.However,thetotalnumberofdistressedpropertysalesdecreasedjustasthetotalnumberofhomessolddecreasedthismonth.Notably,thetotalnumberofREOsalesinSouthernNevadadecreased8percentfromlastmonth.

MultifamilyconstructionisnowconsistentlymakingupalargeshareoftotalresidentialconstructionstartsinSouthernNevada.Octobermarksthefourthconsecutivemonthofover300multifamilyresidentialconstructionstartsinSouthernNevada.

NewhomepricessawasmalldecreasewhileexistinghomepricessawasmallincreasethismonthinSouthernNevada.TheaveragepricegapbetweenanewhomeandanexistinghomeinSouthernNevadaisstillover$110,000.

SouthernTrends

Page| 16

Nevada’sHousingMarket |October2014

100

200

300

400

Ave

rage

Pric

e in

Tho

usan

ds

2000

2001

2002

2003

2004

2005

2006

2007

2008

2009

2010

2011

2012

2013

2014

2015

Date (January 2000 - October 2014)

Existing New

Source: CoreLogicNote: Series are 3-month weighted moving averages.

Single-Family Home Prices

020

0040

0060

0080

00M

onth

ly N

umbe

r of S

ales

2000

2001

2002

2003

2004

2005

2006

2007

2008

2009

2010

2011

2012

2013

2014

2015

Date (January 2000 - October 2014)

Existing New

Source: CoreLogicNote: Series are 3-month weighted moving averages.

Single-Family Home Sales

020

4060

80S

hare

of D

istre

ss S

ales

2000

2001

2002

2003

2004

2005

2006

2007

2008

2009

2010

2011

2012

2013

2014

2015

Date (January 2000 - October 2014)Source: CoreLogic

Share of Distress Single-Family Home Sales

010

0020

0030

0040

00M

onth

ly N

umbe

r of S

ales

2000

2001

2002

2003

2004

2005

2006

2007

2008

2009

2010

2011

2012

2013

2014

2015

Date (January 2000 - October 2014)

REO Sales Short Sales

Source: CoreLogicNote: Series are 3-month weighted moving averages.

Single-Family Distress Sales

Page| 17

SouthernTrends

Nevada’sHousingMarket |October2014

020

4060

80C

ount

in T

hous

ands

2000

2001

2002

2003

2004

2005

2006

2007

2008

2009

2010

2011

2012

2013

2014

2015

Date (January 2000 - October 2014)

90+ Days Delinquent Foreclosure Inventory

Source: CoreLogic

Foreclosure Trends10

090

8070

6050

4030

2010

0P

erce

nt

2010 2011 2012 2013 2014

Source: CoreLogic

(Home Value - Mortgage Balance)Equity Measures as of Quarter 3, 2014

Positive Equity Negative Equity

020

0040

0060

0080

0010

000

Mon

thly

Fre

quen

cy

2005 2006 2007 2008 2009 2010 2011 2012 2013 2014Date (April 2005 - October 2014)

REO 3-Month Moving Average Actual REONOD 3-Month Moving Average Actual NOD

Source: RealtyTrac

Notices of Default and Repossessions

020

0040

0060

0080

00M

onth

ly F

requ

ency

2005 2006 2007 2008 2009 2010 2011 2012 2013 2014Date (April 2005 - October 2014)

Notice of Trustee Sales 3-Month Moving Average

Source: RealtyTrac

Residential Home Auctions

Page| 18

Nevada’sHousingMarket |October2014

RuralTrends

Population:147,777 in2013 HousingUnits:65,629in2012

Source:U.S.CensusBureau:StateandCountyQuickFacts (Elko,Esmeralda,Eureka,Humboldt,Lander,Lincoln,Mineral,Nye,Pershing,andWhitePineCounty)

Page| 19

RuralTrends NewhomesaleswereunchangedthismonthinRuralNevadaand

remainconsiderablylowerthantheyhavebeenfortherestof2014.RuralNevadawastheonlyregioninNevadatoseeanincreaseinexistinghomesalesthismonth.

TheshareofhomessoldunderdistresscontinuestofluctuateeachmonthinRuralNevada.ThismonthRuralNevadasawadecreasesinbothREOsalesandshortsales.TherewereonlytwoshortsalesthattookplacethismonthinRuralNevada,thelowestamountof2014.

Existinghomepricesincreased8.8percentthismonthinRuralNevada,thiswasthelargestmonthlyincreaseinexistinghomepricesforRuralNevadasince2005.ExistinghomepricesinRuralNevadaarenowthehighesttheyhavebeensince2008.

Nye

Elko

Clark

Lincoln

Humboldt

Washoe

WhitePine

Lander

Pershing

Eureka

Churchill

Mineral

Lyon

Esmeralda

Douglas

Storey

CarsonCity

Nevada’sHousingMarket |October2014

Single‐FamilyHomeSales* October2014 M2MChange Y2YChangeNew 8 +0.0% ‐72.2%Existing 155 +4.5% ‐19.3%DistressShare 18.3% ‐16.9% +8.3%

ResidentialConstructionTotalStarts 50 +4 +1Single‐Family 26 +16 ‐21Multifamily 24 ‐12 +22

AverageSingle‐FamilySalesPrice*New $223,463 ‐1.4% ‐6.9%Existing $137,404 +8.8% +9.1%Distress $109,881 +5.8% +15.3%

Source:LiedInstitutecalculationsusingCoreLogic DataandtheStateoftheCitiesDataSystems byU.S.DepartmentofHousingandUrbanDevelopment.*FiguresportrayThree‐MonthMovingWeightedAverages

RuralTrends

Page| 20

Nevada’sHousingMarket |October2014

5010

015

020

025

030

0A

vera

ge P

rice

in T

hous

ands

2000

2001

2002

2003

2004

2005

2006

2007

2008

2009

2010

2011

2012

2013

2014

2015

Date (January 2000 - October 2014)

Existing New

Source: CoreLogicNote: Series are 3-month weighted moving averages.

Single-Family Home Prices

020

040

060

080

0M

onth

ly N

umbe

r of S

ales

2000

2001

2002

2003

2004

2005

2006

2007

2008

2009

2010

2011

2012

2013

2014

2015

Date (January 2000 - October 2014)

Existing New

Source: CoreLogicNote: Series are 3-month weighted moving averages.

Single-Family Home Sales

010

2030

40S

hare

of D

istre

ss S

ales

2000

2001

2002

2003

2004

2005

2006

2007

2008

2009

2010

2011

2012

2013

2014

2015

Date (January 2000 - October 2014)Source: CoreLogic

Share of Distress Single-Family Home Sales

020

4060

80M

onth

ly N

umbe

r of S

ales

2000

2001

2002

2003

2004

2005

2006

2007

2008

2009

2010

2011

2012

2013

2014

2015

Date (January 2000 - October 2014)

REO Sales Short Sales

Source: CoreLogicNote: Series are 3-month weighted moving averages.

Single-Family Distress Sales

Page| 21

RuralTrends

Nevada’sHousingMarket |October2014

0.5

11.

5C

ount

in T

hous

ands

2000

2001

2002

2003

2004

2005

2006

2007

2008

2009

2010

2011

2012

2013

2014

2015

Date (January 2000 - October 2014)

90+ Days Delinquent Foreclosure Inventory

Source: CoreLogic

Foreclosure Trends10

090

8070

6050

4030

2010

0P

erce

nt

2010 2011 2012 2013 2014

Source: CoreLogic

(Home Value - Mortgage Balance)Equity Measures as of Quarter 3, 2014

Positive Equity Negative Equity

050

100

150

200

Mon

thly

Fre

quen

cy

2005 2006 2007 2008 2009 2010 2011 2012 2013 2014Date (April 2005 - October 2014)

REO 3-Month Moving Average Actual REONOD 3-Month Moving Average Actual NOD

Source: RealtyTrac

Notices of Default and Repossessions

050

100

150

200

Mon

thly

Fre

quen

cy

2005 2006 2007 2008 2009 2010 2011 2012 2013 2014Date (April 2005 - October 2014)

Notice of Trustee Sales 3-Month Moving Average

Source: RealtyTrac

Residential Home Auctions

Page| 22

About the Lied Institute

The Lied Institute was established in 1989 by the LeeBusiness School at the University of Nevada, Las Vegasto foster excellence in real estate education andresearch. Through partnerships with business andcommunity leaders, the Lied Institute strives toimprove the real estate business and effective publicpolicy practices in Southern Nevada. The instituteproduces relevant and timely real estate research,supports educational programs in real estateeconomics and finance for students and professionals,and provides community outreach and continuingeducation.

About the Department of Business & Industry

The Department of Business and Industry is a cabinetlevel agency in the Nevada State government. TheDepartment’s objective is to encourage and promotethe development and growth of business and to ensurethe legal operation of business in order to protectconsumers by maintaining a fair and competitiveregulatory environment. The Director’s office atBusiness and Industry manages a number of programsand initiatives to address the needs of smallbusinesses, homeowners and consumers includingsmall business advocacy, bond programs, access tocapital, housing retention programs, constituentservices and fraud prevention and education.

LiedInstituteforRealEstateStudies4505S.MarylandParkway,Box456025

LasVegas,NV89154‐6025

EdwardCoulsonDirector

(702)895‐[email protected]

BettyCampbellProgramCoordinator(702)895‐4492

[email protected]

PeterCountsGraduateAssistant

[email protected]

DepartmentofBusiness&Industry555E.WashingtonAve#4900

LasVegas,NV89101

BruceBreslowDirector

(775)684‐[email protected]

AshokMirchandaniDeputyDirector(702)486‐4492

[email protected]

©Copyright2013ReportonNevada’sHousingMarketReadersmayreproducethepublication’sitemsiftheycitethepublicationnameanddate,andnotethecopyrightofLiedInstituteforRealEstateStudies,UniversityofNevada,LasVegasandtheStateofNevadaDepartmentofBusiness&Industry

Nevada’sHousingMarket |October2014


Recommended