85
REPORT ON REGISTRATION OF BIRTHS AND DEATHS 2015 REGISTRY OF BIRTHS AND DEATHS IMMIGRATION AND CHECKPOINTS AUTHORITY SINGAPORE
| Date post: | 28-May-2019 |
| Category: |
Documents |
| Upload: | truongdung |
| View: | 219 times |
| Download: | 0 times |
REPORT
ON REGISTRATION
OF BIRTHS AND DEATHS
2015
REGISTRY OF BIRTHS AND DEATHS
IMMIGRATION AND CHECKPOINTS AUTHORITY
SINGAPORE
P R E F A C E
Under the Registration of Births and Deaths Act (Chapter 267), the Registry of
Births and Deaths has been charged with the responsibility of registering all live-births, still-
births and deaths in Singapore.
The Report on Registration of Births and Deaths, 2015 is the 28th publication in the
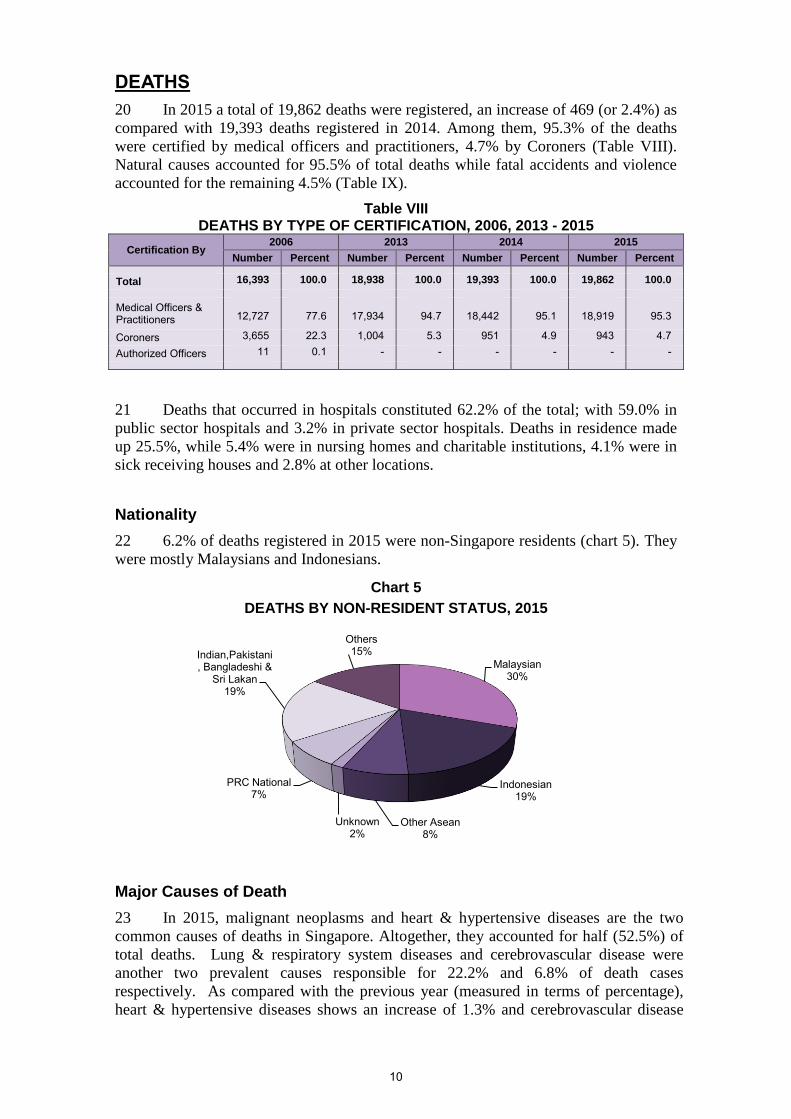
annual series by the Registry. The Report aims to provide an overview of the annual changes in
the population, births, deaths and other vital statistics. The statistical tables and charts on vital
statistics will be of interest to academics, demographers and medical professionals. Specimen
certificates of and procedures for the registration of births, still-births and deaths have been
included in the annexure.
The Registry of Births and Deaths gratefully acknowledges the assistance and
contribution of the Ministry of Health, the Department of Statistics, the Singapore Police Force
and all other agencies in the publication of this Report.
REGISTRAR-GENERAL OF BIRTHS AND DEATHS
SINGAPORE
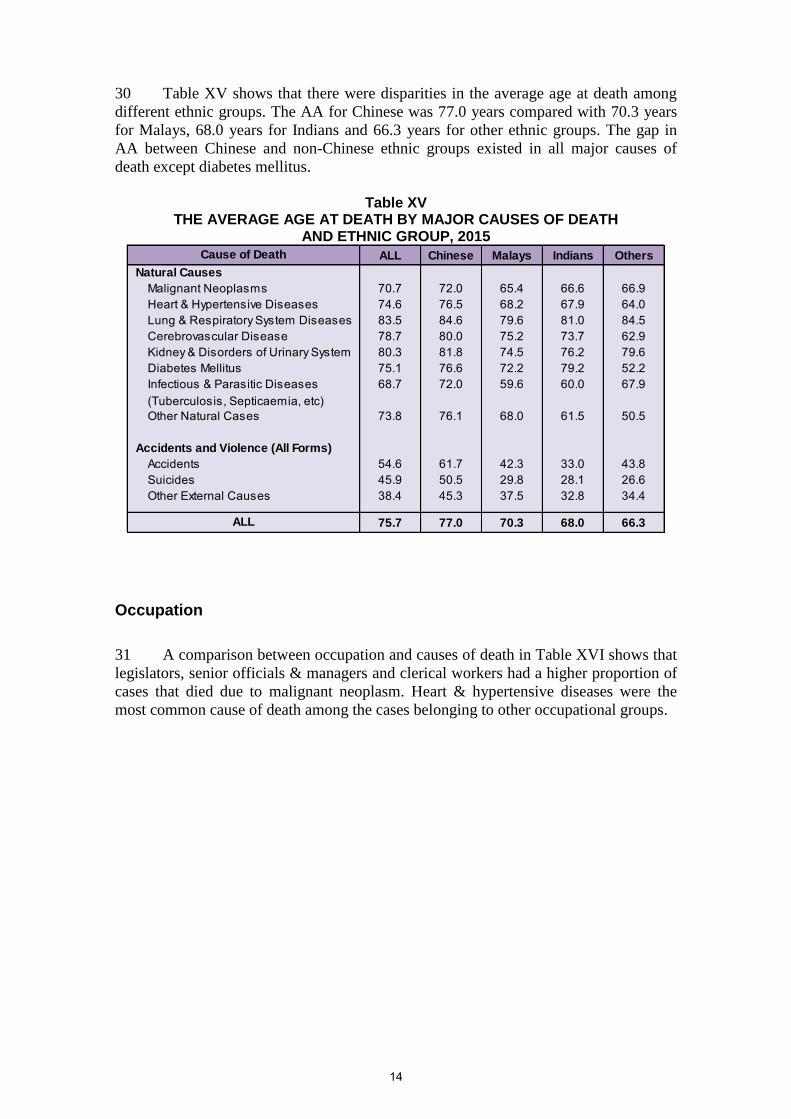
June 2016

C O N T E N T S
Page
KEY INDICATORS, 2006, 2013 - 2015 1
GENERAL 2
Late Registrations 2
Re-registration of Adopted Children 2
LIVE-BIRTHS 3
Teenage Births 4
Single Parent Registration Births (SP Births) 4
Age and Ethnic Group of Mother 5
Birth Order 6
First Time Mother 6
Type of Births and Period of Gestation 7
Birth Weight and Age of Mother 8
DEATHS 10
Nationality 10
Major Causes of Death 10
Average Age at Death 11
Gender 12
Ethnic Group 13
Occupation 14
Infant Mortality 16
Neonatal Mortality 16
Perinatal Mortality 16
Maternal Mortality 16
i

C O N T E N T S - (continued)
Page
STILL-BIRTHS 17
LIST OF ANNEXURE
Annex A Procedures for the Registration of Births,
Deaths and Still-births 18
Annex B Certificate of Registration of Birth 21
Annex C Certificate of Registration of Death 22
Annex D Certificate of Registration of Still birth 23
EXPLANATORY NOTES 24
LIST OF TABLES
POPULATION, NATURAL INCREASE, BIRTHS AND DEATHS 1. Population and Vital Statistics, 1971 - 2015 26
2. Population Growth and Vital Rates, 1971 - 2015 27
3. Population by Ethnic Group, 1971 - 2015 28
4. Male Population by Ethnic Group, 1971 - 2015 29
5. Female Population by Ethnic Group, 1971 - 2015 30
6. Sex Ratio of Population by Ethnic Group, 1971 - 2015 31
7. Natural Increase by Ethnic Group, 1971 - 2015 32
8. Crude Rates of Natural Increase by Ethnic Group, 1971 - 2015 33
9. Live-births by Ethnic Group, 1971 - 2015 34
10. Crude Birth Rates by Ethnic Group, 1971 - 2015 35
11. Deaths by Ethnic Group, 1971 - 2015 36
12. Crude Death Rates by Ethnic Group, 1971 - 2015 37
13. Infant Deaths by Ethnic Group, 1971 - 2015 38
14. Infant Mortality Rates by Ethnic Group, 1971 - 2015 39
ii

C O N T E N T S - (continued)
Page
LIVE-BIRTHS
15. Live-births by Ethnic Group of Father and Sex of Child,
January - December, 2015 40
16. Live-births by Ethnic Group of Father and Mother, 2015 40
17. Live-births by Place of Occurrence and Ethnic Group of
Mother, 2015 41
18. Live-births by Attendant at Birth and Ethnic Group
of Mother, 2015 41
19. Live-births by Age, Ethnic Group of Mother and Sex of
Child, 2015 42
20. Live-births by Age Group, Ethnic Group of Mother and
Birth Order, 2015 43
21. Live-births by Occupation of Mother and Birth Order, 2015 44
22. Live-births by Nationality of Father and Mother, 2015 45
23. Live-births by Educational Qualification, Ethnic Group of
Mother and Birth Order, 2015 46
24. Live-births by Age Group, Ethnic Group and Educational
Qualification of Mother, 2015 47
25. Mothers by Age Group and Type of Birth, 2015 48
26. Live-births by Birth Weight, Age Group of Mother and
Sex of Child, 2015 49
27. Live-births (Single Births) by Period of Gestation, Birth
Weight and Sex of Child, 2015 50
28. Live-births (Twins) by Period of Gestation, Birth Weight
and Sex of Child, 2015 51
STILL BIRTHS
29. Still births by Ethnic Group of Mother and Sex of Child,
January - December, 2015 52
30. Still births by Attendant at Birth, Ethnic Group of Mother
and Sex of Child, 2015 52
iii

C O N T E N T S - (continued)
Page
31. Still births by Place of Occurrence and Ethnic Group of Mother, 2015 53
32. Still births by Birth Weight, Age Group of Mother and Sex of Child, 2015 53
33. Still births by Period of Gestation, Birth Weight and Sex of Child, 2015 54
DEATHS 34. Deaths by Ethnic Group and Sex, January - December, 2015 55
35. Deaths by Place of Occurrence and Ethnic Group, 2015 55
36. Infant Deaths by Ethnic Group and Sex,
January - December, 2015 56
37. Infant Deaths by Place of Occurrence and Ethnic
Group, 2015 56
38. Infant Deaths by Age, Ethnic Group and Sex, 2015 57
39. Deaths by Age Group, Ethnic Group and Sex, 2015 58
40. Deaths by Age Group, Marital Status and Sex, 2015 59
41. Deaths by Age Group, Occupation and Sex, 2015 60
42. Deaths by Cause and Type of Certification, 2015 61
43. Deaths and Death Rates by Cause, 2013 - 2015 63
44. Male Deaths by Cause and Age Group, 2015 65
45. Female Deaths by Cause and Age Group, 2015 69
46. Deaths by Cause, Ethnic Group and Sex, 2015 73
iv

REPORT ON REGISTRATION OF BIRTHS AND DEATHS, 2015
KEY INDICATORS, 2006, 2013 - 2015
2006 2013 2014 2015
Number Rate* Number Rate* Number Rate* Number Rate*
Natural Increase 21,924 5.9 20,782 4.6 22,839 5.1 22,323 4.9
Chinese 12,231 4.7 9,456 3.3 11,292 3.9 10,456 3.6
Malays 4,151 8.7 3,438 6.9 3,713 7.4 4,092 8.1
Indians 2,588 8.4 3,222 7.6 3,168 7.3 3,350 7.3
Others 2,954 20.5 4,666 18.0 4,666 17.5 4,425 15.9
Live Births 38,317 10.3 39,720 9.3 42,232 9.8 42,185 9.7
Chinese 24,646 9.2 23,890 8.2 25,958 8.8 25,412 8.6
Malays 6,491 13.2 6,067 11.7 6,468 12.4 6,961 13.3
Indians 3,843 12.0 4,648 11.0 4,678 10.8 4,895 10.9
Others 3,337 23.0 5,115 19.6 5,128 19.3 4,917 17.9
Deaths 16,393 4.4 18,938 4.6 19,393 4.7 19,862 4.8
Chinese 12,415 4.5 14,434 4.9 14,666 4.9 14,956 5.0
Malays 2,340 4.4 2,629 4.8 2,755 5.0 2,869 5.1
Indians 1,255 3.6 1,426 3.3 1,510 3.5 1,545 3.6
Others 383 2.4 449 1.6 462 1.9 492 2.0
Infant Mortality 117 2.6 94 2.0 83 1.8 84 1.7
Neonatal Mortality 70 1.7 52 1.1 50 1.1 41 0.8
Perinatal Mortality 145 3.8 110 2.8 123 2.9 118 2.8
Still Births 99 2.6 80 2.0 86 2.0 90 2.1
* Refer to Explanatory Notes on page 24
1

GENERAL
The Immigration & Checkpoints Authority (ICA) administers the Registration
of Births and Deaths Act (Chapter 267). Under this Act, all live births, deaths and still
births occurring within Singapore and its territorial waters are required to be registered
within the stipulated period. The Registry also re-registers births under the Adoption of
Children Act (Chapter 4).
2 In 2015, 42,185 live births, 19,862 deaths and 90 still births were registered. In
this report, date of occurrence is adopted for the compilation of births statistics while
date of registration is adopted for deaths statistics.
Late Registrations
3 Live births registered after 42 days from occurrence are classified as late
registrations. In 2015 there were 191 late registrations of live births. Of these, 12 cases
were registered after a lapse of 12 months from the date of birth.
4 Deaths registered after three days from occurrence are treated as late
registrations. In 2015, there were 220 late registrations of deaths. Of these, 147 cases
were registered after seven days from the date of death.
Re-Registration of Adopted Children
5 Under the Adoption of Children Act, the birth of a child shall be registered
under the Registration of Births and Deaths Act upon an Adoption Order issued by the
Court. If the child's birth had previously been registered under the Registration of
Births and Deaths Act, the name of the child, as well as the names and other particulars
of the adoptive parents, as recorded in the Adoption Order, are entered in the birth
register in place of the natural or last adoptive parents of the child. In 2015, 315
children were adopted and registered under the Act.
2

LIVE BIRTHS
6 The number of live births was 42,185 in 2015, showing a decrease of 0.1%
compared with 42,232 in 2014. The crude birth rate declined from 9.8 to 9.7 per 1,000
Singapore residents this year (Chart 1).
Chart 1 LIVE BIRTHS AND CRUDE BIRTH RATES, 2006 – 2015
7 Among the newborns, 25,412 (60.2%) were Chinese, 6,961 (16.5%) Malays,
4,895 (11.6%) Indians and 4,917 (11.7%) of newborns were of other races. In 2015,
Malays registered the highest birth rate of 13.3 per 1,000 residents followed by Indians
at 10.9 per 1,000 residents. Chinese registered the lowest rate of 8.6 per 1,000 residents.
Chart 2 CRUDE BIRTH RATE BY ETHNIC GROUP, 2006 – 2015
0.0
5.0
10.0
15.0
20.0
25.0
0
10,000
20,000
30,000
40,000
50,000
60,000
2006 2007 2008 2009 2010 2011 2012 2013 2014 2015
Number
Year
Live-births
Crude Birth Rate
Per 1000 residents
8.0
9.0
10.0
11.0
12.0
13.0
14.0
15.0
2006 2007 2008 2009 2010 2011 2012 2013 2014 2015
Per 1000 residents
Year
Malays
Chinese
Indians
3

Teenage Births
8 There were 341 live births born to teenagers aged 19 and below in 2015, a
reduction of 16.0% as compared with 406 in 2014. 56.9% of the teenage births were
born to Malays. Chinese (27.3%), Indians (9.7%) and other ethnic groups (6.1%)
accounted for the remaining teenage births.
Table I TEENAGE BIRTHS BY ETHNIC GROUP, 2006 - 2015
Year Chinese Malays Indians Others Total
2006 229 462 75 72 838
(27.3%) (55.1%) (9.0%) (8.6%) (100.0%)
2007 231 458 77 54 820
(28.2%) (55.8%) (9.4%) (6.6%) (100.0%)
2008 265 419 83 49 816
(32.5%) (51.3%) (10.2%) (6.0%) (100.0%)
2009 209 375 53 41 678
(30.8%) (55.3%) (7.8%) (6.1%) (100.0%)
2010 231 309 63 38 641
(36.1%) (48.2%) (9.8%) (5.9%) (100.0%)
2011 187 339 67 31 624
(30.0%) (54.3%) (10.7%) (5.0%) (100.0%)
2012 183 310 45 37 575
(31.8%) (53.9%) (7.8%) (6.5%) (100.0%)
2013 155 251 50 31 487
(31.8%) (51.5%) (10.3%) (6.4%) (100.0%)
2014 136 210 38 22 406
(33.5%) (51.7%) (9.4%) (5.4%) (100.0%)
2015 93 194 33 21 341
(27.3%) (56.9%) (9.7%) (6.1%) (100.0%)
Single Parent Registration Births (SP Births)
9 In 2015, 409 live births were registered without the father’s name. Out of these
409 SP births, 83 (20.3%) births were born to teenagers age 19 and below.
10 As similarly observed in teenage births, Malays made up the largest proportion
of SP births. However, the number of Malays SP births has been on a declining trend
since 2011.
4

Table II SP BIRTHS BY ETHNIC GROUP, 2006 – 2015
Year Chinese Malays Indians Others Total
2006 158 248 52 37 495
(31.9%) (50.1%) (10.5%) (7.5%) (100.0%)
2007 153 311 58 39 561
(27.3%) (55.4%) (10.3%) (7.0%) (100.0%)
2008 199 270 56 25 550
(36.2%) (49.1%) (10.2%) (4.5%) (100.0%)
2009 205 263 52 34 554
(37.0%) (47.5%) (9.4%) (6.1%) (100.0%)
2010 212 242 57 43 554
(38.3%) (43.7%) (10.3%) (7.7%) (100.0%)
2011 164 281 39 35 519
(31.6%) (54.1%) (7.5%) (6.8%) (100.0%)
2012 180 258 43 42 523
(34.4%) (49.4%) (8.2%) (8.0%) (100.0%)
2013 170 224 47 47 488
(34.9%) (45.9%) (9.6%) (9.6%) (100.0%)
2014 173 191 45 37 446
(38.8%) (42.8%) (10.1%) (8.3%) (100.0%)
2015 159 189 30 31 409
(38.9%) (46.2%) (7.3%) (7.6%) (100.0%)
Age and Ethnic Group of Mother
11 The highest proportion of live births were born to mothers aged 30 - 34 years
(42.0%), followed by mothers aged 25 - 29 years (25.4%) and 35 - 39 years (21.6%)
(Chart 3).
Chart 3 LIVE BIRTHS BY AGE GROUP
AND ETHNIC GROUP OF MOTHER, 2015
-
5.0
10.0
15.0
20.0
25.0
30.0
35.0
40.0
45.0
50.0
Under 20 20 - 24 25 - 29 30 - 34 35 - 39 40 - 49
Percent
Age Group of Mother
Total Chinese Malays Indians Others
5

Birth Order
12 Live births in 2015 comprised 48.0% 1st order, 35.2% 2nd order, 12.1% 3rd order
and 4.7% 4th & higher order births (Chart 4).
13 Based on the resident birth order figures, it seems that women have been
delaying the birth of children till a later age. The median age of mothers showed
increases across all birth orders when compared against 2006. For the first order births,
the median age of mothers increased from 29.4 years in 2006 to 30.5 years in 2015.
Similarly, the median age for mothers of second and third order births increased from
31.8 years to 32.8 years and 33.6 yrs to 34.1 years respectively (Table III).
Chart 4 LIVE BIRTHS BY BIRTH ORDER, 2012 – 2015
Table III RESIDENT BIRTH ORDER BY PERIOD AND
MEDIAN AGE OF MOTHER, 2006, 2013 – 2015
Birth Order
2006 2013 2014 2015
Age Age Age Age
1st order 29.4 yrs 30.3 yrs 30.4 yrs 30.5 yrs 2nd order 31.8 yrs 32.5 yrs 32.6 yrs 32.8 yrs 3rd order 33.6 yrs 34.2 yrs 34.0 yrs 34.1 yrs 4th order 34.6 yrs 35.0 yrs 34.7 yrs 34.4 yrs
First Time Mother
14 The median age of resident live births for first time mothers was 30.5 years at
the time of giving birth. Malay mothers have their first child at 27.5 years, against 31.2
years, 29.8 years and 30.3 years for Chinese, Indians and other ethnic groups
respectively.
15 Among these first time mothers, 53.5% had university degrees and 46.5% had
‘A’ level or lower qualification.
Total 1st 2nd 3rd 4th & over2012 42,663 20,755 15,082 4,988 1,838
2013 39,720 19,292 13,924 4,651 1,853
2014 42,232 20,327 15,262 4,859 1,784
2015 42,185 20,248 14,857 5,099 1,981
0
5,000
10,000
15,000
20,000
25,000
30,000
35,000
40,000
45,000
Num
ber
Birth Order
2012 2013 2014 2015
6

16 13,629 or 76.1% of the first time resident live births mothers were employed in
2015. Of these, 83.8% were holding executive, managerial, professional and related
occupations. Clerical and sales related professions accounted for another 15.2% of
working mothers.
Table IV RESIDENT LIVE-BIRTHS FOR FIRST TIME MOTHER BY ETHNIC GROUP,
EDUCATION AND OCCUPATION
Ethnic Group, Educational Qualification and Occupation of Mother
Number of First Time Mother
Median Age (years)
2014 2015 2014 2015
Ethnic Group
Chinese 12,572 12,242 31.1 31.2
Malays 2,513 2,835 27.5 27.5
Indians 1,479 1,447 29.3 29.8
Others 1,406 1,391 30.6 30.3
Total 17,970 17,915 30.4 30.5
Education Level No Qualification 311 315 28.2 28.8
Primary 918 843 27.5 27.4
GCE 'N' Level 710 661 25.7 25.8
GCE 'O' Level 1,797 1,677 28.4 28.0
GCE 'A' Level 4,676 4,840 29.5 29.5
University 9,557 9,578 31.3 31.5
Unknown 1 1 - -
Total 17,970 17,915 30.4 30.5
Occupation
Legislators, Senior Officials, Managers, Professionals, Technicians & Other Associate Professionals 11,188 11,414 31.0 31.1
Clerical, Service, Shop & Market Sales Workers 2,057 2,078 29.0 28.6
Agricultural & Fishery Workers 2 0 - - Production, Transport & Other Manual
Workers 66 58 29.8 29.8 Workers Not Classifiable by Occupation 63 79 30.5 28.9 Not Working 4,594 4,286 28.7 28.8 Total 17,970 17,915 30.4 30.5
Type of Birth and Period of Gestation
17 40,915 mothers had single births, 626 had twins (including three with one live
birth and one still birth) and 7 had triplet.
18 The modal gestation period for single births was 38 weeks which accounted for
32.2%. The modal gestation period for twin births was 37 weeks, accounting for 30.7%
of total twin births. Premature single births, defined as births with gestation period of
36 weeks or less, totaled 2,844 (6.9%) of single births. The number of premature twins,
with 36 weeks or less gestation period, accounted for 61.8% of twin births (Table V).
7

Table V LIVE BIRTHS BY PERIOD OF GESTATION AND TYPE OF BIRTH, 2015
Birth Weight and Age of Mother
19 Birth weight of 3,000 - 3,499 grammes accounted for 43.1% of newborns.
Babies weighing between 2,500 - 2,999 grammes constituted 32.0% while those
weighing above 3,500 grammes accounted for 15.7%. Only 9.2% of the babies weighed
under 2,500 grammes. Birth weight was found to correlate positively with period of
gestation. Table VII reflects a strong tendency that the longer the gestation period, the
greater the baby’s weight became. Twin births were generally lighter in weight than
single births.
Table VI LIVE BIRTHS BY BIRTH WEIGHT AND AGE GROUP OF MOTHER, 2015
Number Percent Number Percent Number Percent Number Percent Number Percent
All 42,185 100.0 40,915 100.0 1,249 100.0 21 100.0 - -
Under 28 127 0.3 97 0.2 30 2.4 - - - - 28 - 31 233 0.6 174 0.4 56 4.5 3 14.3 - - 32 - 35 1,489 3.5 1,094 2.7 377 30.2 18 85.7 - -
36 1,787 4.2 1,479 3.6 308 24.7 - - - - 37 6,222 14.8 5,838 14.3 384 30.7 - - - - 38 13,250 31.4 13,160 32.2 90 7.2 - - - -
39 11,991 28.4 11,987 29.3 4 0.3 - - - - 40 6,432 15.3 6,432 15.7 - - - - - - 41 601 1.4 601 1.5 - - - - - -
42 & Over 52 0.1 52 0.1 - - - - - -
Unknown 1 0.0 1 0.0 - - - - - -
Period of
Gestation
(weeks)
Type of Birth
Single Twins Triplets OthersTotal
Under
1515 - 19 20 - 24 25 - 29 30 - 34 35 - 39 40 - 44 45 - 54 Unknown
All 42,185 9 332 2,557 10,733 17,703 9,102 1,675 74 -
Under 1,500 336 1 9 18 80 135 72 20 1 -
1,500 - 1,999 599 - 7 32 122 236 146 51 5 -
2,000 - 2,499 2,957 1 42 210 663 1,178 714 137 12 -
2,500 - 2,999 13,499 3 133 933 3,583 5,472 2,843 504 28 -
3,000 - 3,499 18,179 4 113 1,037 4,694 7,818 3,789 709 15 -
3,500 - 3,999 5,857 - 27 292 1,418 2,521 1,365 221 13 -
4,000 & Over 758 - 1 35 173 343 173 33 - -
Unknown - - - - - - - - - -
Birth Weight
(grammes)Total
Age Group of Mother (years)
8

Table VII SINGLE AND TWIN LIVE BIRTHS
BY BIRTH WEIGHT AND PERIOD OF GESTATION, 2015
Under
3737 38 39 40
41 &
overUnknown
Total 40,915 2,844 5,838 13,160 11,987 6,432 653 1
Under 1,500 242 242 - - - - - - 1,500 - 1,999 376 335 31 8 2 - - - 2,000 - 2,499 2,424 916 698 552 205 50 3 - 2,500 - 2,999 13,143 1,004 2,787 4,855 3,188 1,215 93 1 3,000 - 3,499 18,118 305 1,934 6,061 6,159 3,373 286 - 3,500 - 3,999 5,854 37 343 1,519 2,191 1,554 210 - 4,000 & over 758 5 45 165 242 240 61 - Unknown - - - - - - - -
Total 1,249 771 384 90 4 - - -
Under 1,500 90 90 - - - - - - 1,500 - 1,999 213 199 14 - - - - - 2,000 - 2,499 526 345 160 21 - - - - 2,500 - 2,999 356 119 188 45 4 - - - 3,000 - 3,499 61 18 22 21 - - - - 3,500 - 3,999 3 - - 3 - - - - 4,000 & over - - - - - - - - Unknown - - - - - - - -
Birth Weight
(grammes) Total
Period of Gestation (weeks)
Single Births
Twin Births
9
DEATHS
20 In 2015 a total of 19,862 deaths were registered, an increase of 469 (or 2.4%) as
compared with 19,393 deaths registered in 2014. Among them, 95.3% of the deaths
were certified by medical officers and practitioners, 4.7% by Coroners (Table VIII).
Natural causes accounted for 95.5% of total deaths while fatal accidents and violence
accounted for the remaining 4.5% (Table IX).
Table VIII DEATHS BY TYPE OF CERTIFICATION, 2006, 2013 - 2015
Certification By 2006 2013 2014 2015
Number Percent Number Percent Number Percent Number Percent Total 16,393 100.0 18,938 100.0 19,393 100.0 19,862 100.0 Medical Officers & Practitioners
12,727
77.6
17,934
94.7
18,442
95.1
18,919
95.3
Coroners 3,655 22.3 1,004 5.3 951 4.9 943 4.7
Authorized Officers 11 0.1 - - - - - -
21 Deaths that occurred in hospitals constituted 62.2% of the total; with 59.0% in
public sector hospitals and 3.2% in private sector hospitals. Deaths in residence made
up 25.5%, while 5.4% were in nursing homes and charitable institutions, 4.1% were in
sick receiving houses and 2.8% at other locations.
Nationality
22 6.2% of deaths registered in 2015 were non-Singapore residents (chart 5). They
were mostly Malaysians and Indonesians.
Chart 5
DEATHS BY NON-RESIDENT STATUS, 2015
Major Causes of Death
23 In 2015, malignant neoplasms and heart & hypertensive diseases are the two
common causes of deaths in Singapore. Altogether, they accounted for half (52.5%) of
total deaths. Lung & respiratory system diseases and cerebrovascular disease were
another two prevalent causes responsible for 22.2% and 6.8% of death cases
respectively. As compared with the previous year (measured in terms of percentage),
heart & hypertensive diseases shows an increase of 1.3% and cerebrovascular disease
Malaysian30%
Indonesian19%
Other Asean8%
Unknown2%
PRC National7%
Indian,Pakistani, Bangladeshi &
Sri Lakan19%
Others15%
10

declines by 1.6%. Unnatural causes such as accidents, suicides and other external
injuries made up 4.5%.
Table IX
COMPARATIVE MAJOR CAUSES OF DEATH BETWEEN 2014 AND 2015
Average Age at Death
24 15,958 deceased persons in 2015 were aged 60 years and over. Persons aged
between 50 and 59 years old accounted for 10.8% of the total deaths. Deaths of persons
under one year of age (infant deaths) numbered 84.
Table X DEATHS BY AGE GROUP, 2006, 2013 – 2015
2014 2015
Number Percent Number Percent
Natural Causes 18,484 95.3 18,967 95.5
Malignant Neoplasms 5,701 29.4 5,903 29.7 Heart & Hypertensive Diseases 4,165 21.5 4,534 22.8 Lung & Respiratory System Diseases 4,232 21.8 4,417 22.2 Cerebrovascular Disease 1,620 8.4 1,357 6.8 Kidney & Disorders of Urinary System 944 4.9 925 4.7 Diabetes Mellitus 277 1.4 250 1.3 Infectious & Parasitic Diseases 217 1.1 194 1.0 (Tuberculosis, Septicaemia, etc) Other Natural Cases 1,328 6.8 1,387 7.0Accidents and Violence (All Forms) 909 4.7 895 4.5
Accidents 417 2.2 425 2.1 Suicides 415 2.1 409 2.1 Other External Causes 77 0.4 61 0.3
Total 19,393 100.0 19,862 100.0
Cause of Death
Age Group
(years)
Total 16,393 100.0 18,938 100.0 19,393 100.0 19,862 100.0
Under 1 117 0.7 94 0.5 83 0.4 84 0.4
1 – 9 52 0.3 52 0.3 35 0.2 44 0.2
10 – 19 111 0.7 95 0.5 86 0.4 92 0.5
20 – 29 296 1.8 275 1.5 262 1.4 266 1.3
30 – 39 462 2.8 379 2.0 390 2.0 392 2.0
40 – 49 1,102 6.7 906 4.8 878 4.5 871 4.4
50 – 59 2,131 13.0 2,222 11.7 2,193 11.3 2,155 10.8
60 – 69 2,740 16.7 3,340 17.6 3,396 17.5 3,661 18.4
70 – 79 4,292 26.2 4,627 24.4 4,671 24.1 4,679 23.6
80 & over 5,075 31.0 6,946 36.7 7,399 38.2 7,618 38.4
Unknown 15 0.1 2 0.0 - - - -
2015
Number PercentNumber Percent Number Percent Number Percent
2006 2013 2014
11

25 The average age at death (AA in short), measured by the median was 75.7 years.
The highest AA of 83.5 years was recorded for those who died of lung & respiratory
system diseases, followed by 80.3 years for kidney & disorders of urinary system and
78.7 years for cerebrovascular disease.
Table XI
TRENDS OF THE AVERAGE AGE AT DEATH BY CAUSES OF DEATH
26 The AA has been gradually lengthening over the years. It was 73.0 years in
2006. It increased to 74.4 years and 75.7 years in 2010 and 2015 respectively. Not
including other natural causes, the increase in AA was most conspicuous among lung &
respiratory system disease (80.3 years in 2006 to 83.5 years in 2015) and diabetes
mellitus (72.9 year in 2006 to 75.1 years in 2015).
Gender
27 Males outnumbered females in mortality, giving a ratio of 1,189 males to 1,000
females. In terms of causes of death, males registered a higher proportion in heart &
hypertensive diseases and accidents & violence while females registered a higher
proportion in kidney & disorders of urinary system and cerebrovascular disease.
Table XII MORTALITY IN 2015 BY SEX AND CAUSES OF DEATH
2006 2007 2008 2009 2010 2011 2012 2013 2014 2015
Natural Causes
Malignant Neoplasms 68.9 69.7 69.3 69.9 69.8 70.3 70.5 70.2 70.6 70.7Heart & Hypertensive Diseases 74.1 73.7 73.6 73.6 74.7 73.8 73.3 74.3 74.3 74.6Lung & Respiratory System Diseases 80.3 80.7 81.1 81.0 81.5 81.9 82.1 82.4 83.1 83.5Cerebrovascular Disease 78.1 78.2 78.6 78.7 78.8 78.9 79.7 79.3 79.4 78.7Kidney & Disorders of Urinary System 78.3 77.6 78.7 78.5 79.0 78.7 79.2 80.1 81.3 80.3Diabetes Mellitus 72.9 72.8 73.4 73.6 71.7 73.1 73.0 74.4 76.7 75.1Infectious & Parasitic Diseases 73.0 72.3 74.0 74.3 74.8 72.2 68.5 69.3 67.7 68.7(Tuberculosis, Septicaemia, etc)Other Natural Cases 64.9 65.9 66.9 66.4 69.5 69.8 71.4 71.9 72.8 73.8
Accidents and Violence (All Forms)
Accidents 46.3 43.9 48.0 49.1 49.2 49.9 52.9 52.5 53.8 54.6Suicides 47.3 47.1 48.2 46.4 47.1 51.4 47.9 47.5 50.9 45.9Other External Causes 43.0 42.7 42.8 42.8 42.8 42.7 39.0 42.1 39.4 38.4
73.0 73.3 73.3 73.9 74.4 74.3 74.2 74.9 75.5 75.7
Cause of Death
ALL
Number Percent Number
18,967 95.5 10,127 93.9 8,840 97.4
Malignant Neoplasms 5,903 29.7 3,213 29.8 2,690 29.6Heart & Hypertensive Diseases 4,534 22.8 2,702 25.0 1,832 20.2Lung & Respiratory System Diseases 4,417 22.2 2,297 21.3 2,120 23.4Cerebrovascular Disease 1,357 6.8 618 5.7 739 8.1Kidney & Disorders of Urinary System 925 4.7 345 3.2 580 6.4Diabetes Mellitus 250 1.3 114 1.1 136 1.5Infectious & Parasitic Diseases 194 1.0 120 1.1 74 0.8Other Natural Cases 1,387 7.0 718 6.7 669 7.4
895 4.5 662 6.1 233 2.6
Accidents 425 2.1 348 3.2 77 0.9Suicides 409 2.1 271 2.5 138 1.5Other External Causes 61 0.3 43 0.4 18 0.2
19,862 100.0 10,789 100.0 9,073 100.0
Female
Percent
Male
Total
Cause of Death
Natural Causes
Accidents and Violence (All Forms)
Total
Number Percent
12

28 Females lived longer than their male counterparts. The AA was 72.3 years for
males compared to 79.7 years for females, a difference of 7 years. The sex differential
in AA changed little over the years and it occurred across all major causes of death.
Table XIII COMPARATIVE AVERAGE AGE AT DEATH BY CAUSES AND SEX
Ethnic Group 29 75.3% of deaths registered in 2015 were Chinese while Malays, Indians and
other ethnic groups made up of 14.4%, 7.8% and 2.5% of death cases respectively.
Table XIV
MORTALITY IN 2015 BY ETHNIC GROUP AND CAUSES OF DEATH
Cause of Death Sex 2006 2007 2008 2009 2010 2011 2012 2013 2014 2015
F 68.4 70.6 69.1 69.7 69.9 70.3 70.1 70.7 70.6 71.2M 69.1 69.3 69.4 69.9 69.7 70.4 70.6 69.9 70.7 70.3F 78.7 78.7 79.1 78.9 80.1 80.2 79.0 80.4 80.0 80.7M 69.9 70.0 68.8 69.4 69.6 68.8 68.2 69.4 69.6 68.9F 83.5 84.3 84.5 84.6 84.9 84.9 85.1 85.4 86.1 86.4M 78.3 78.6 78.6 78.7 78.6 79.6 79.3 79.6 80.3 80.5F 80.8 80.6 80.9 81.6 81.7 82.0 82.9 82.7 82.9 81.9M 74.1 74.6 74.1 74.2 73.5 75.0 74.5 75.4 75.1 74.2F 79.7 78.9 80.3 79.9 80.9 80.3 80.9 81.8 82.9 81.8M 76.6 75.1 75.5 75.7 75.9 76.7 76.4 76.9 78.5 77.1F 75.2 74.4 74.5 77.4 74.5 76.1 76.8 78.3 79.2 77.0M 69.5 69.6 71.5 68.7 69.0 69.1 68.8 69.0 71.1 70.5F 77.8 76.1 79.1 79.4 79.7 78.7 76.5 74.7 74.7 77.0M 70.4 68.9 71.1 72.0 70.9 69.4 63.6 66.5 63.4 67.1F 69.0 72.5 73.1 74.0 72.4 73.8 74.6 76.3 78.2 79.7M 60.9 60.7 60.6 60.9 66.1 63.8 66.2 67.2 66.5 68.1F 64.7 56.2 59.1 70.7 61.4 69.4 70.9 68.3 75.1 66.0M 40.6 41.7 44.1 43.4 46.2 44.5 48.8 49.3 45.2 53.0F 48.3 47.0 47.8 50.8 46.3 50.2 47.8 47.1 47.5 44.2M 47.0 47.1 48.3 44.8 47.9 51.6 48.0 47.6 51.7 45.9F 43.1 45.4 40.8 48.0 44.6 46.2 34.9 41.8 38.9 30.4M 43.0 41.4 44.0 40.0 42.1 42.5 41.9 42.2 41.8 43.0F 76.5 76.9 77.0 77.6 78.0 77.9 78.1 78.9 79.5 79.7
M 70.5 70.5 70.1 70.7 71.2 71.4 71.5 72.0 72.5 72.3
Other External Causes
ALL
Accidents
Suicides
Other Natural Cases
Kidney & Disorders of Urinary System
Diabetes Mellitus
Infectious & Parasitic Diseases
Malignant Neoplasms
Heart & Hypertensive Diseases
Lung & Respiratory System Diseases
Cerebrovascular Disease
Natural Causes 18,967 95.5 14,349 95.9 2,791 97.3 1,389 89.9 438 89.0
Malignant Neoplasms 5,903 29.7 4,812 32.2 653 22.8 277 17.9 161 32.7 Heart & Hypertensive Diseases 4,534 22.8 3,093 20.7 802 28.0 527 34.1 112 22.8 Lung & Respiratory system Diseases 4,417 22.2 3,446 23.0 613 21.4 279 18.1 79 16.1 Cerebrovascular Disease 1,357 6.8 999 6.7 253 8.8 71 4.6 34 6.9 Kidney & Disorders of Urinary System 925 4.7 692 4.6 149 5.2 70 4.5 14 2.8 Diabetes Mellitus 250 1.3 162 1.1 61 2.1 24 1.6 3 0.6 Infectious & Parasitic Diseases 194 1.0 140 0.9 35 1.2 13 0.8 6 1.2 (Tuberculosis, Septicaemia, etc)Other Natural Cases 1,387 7.0 1,005 6.7 225 7.8 128 8.3 29 5.9
Accidents and Violence (All Forms) 895 4.5 607 4.1 78 2.7 156 10.1 54 11.0
Accidents 425 2.1 269 1.8 56 2.0 79 5.1 21 4.3 Suicides 409 2.1 305 2.1 12 0.4 67 4.3 25 5.1 Other External Causes 61 0.3 33 0.2 10 0.3 10 0.7 8 1.6
19,862 100.0 14,956 100.0 2,869 100.0 1,545 100.0 492 100.0
Number Percent
Total
Number Percent Number Percent Number PercentCause of Death
Total Chinese Malays Indians Others
Number Percent
13
30 Table XV shows that there were disparities in the average age at death among
different ethnic groups. The AA for Chinese was 77.0 years compared with 70.3 years
for Malays, 68.0 years for Indians and 66.3 years for other ethnic groups. The gap in
AA between Chinese and non-Chinese ethnic groups existed in all major causes of
death except diabetes mellitus.
Table XV
THE AVERAGE AGE AT DEATH BY MAJOR CAUSES OF DEATH AND ETHNIC GROUP, 2015
Occupation
31 A comparison between occupation and causes of death in Table XVI shows that
legislators, senior officials & managers and clerical workers had a higher proportion of
cases that died due to malignant neoplasm. Heart & hypertensive diseases were the
most common cause of death among the cases belonging to other occupational groups.
ALL Chinese Malays Indians Others
Natural Causes
Malignant Neoplasms 70.7 72.0 65.4 66.6 66.9Heart & Hypertensive Diseases 74.6 76.5 68.2 67.9 64.0Lung & Respiratory System Diseases 83.5 84.6 79.6 81.0 84.5Cerebrovascular Disease 78.7 80.0 75.2 73.7 62.9Kidney & Disorders of Urinary System 80.3 81.8 74.5 76.2 79.6Diabetes Mellitus 75.1 76.6 72.2 79.2 52.2Infectious & Parasitic Diseases 68.7 72.0 59.6 60.0 67.9(Tuberculosis, Septicaemia, etc)Other Natural Cases 73.8 76.1 68.0 61.5 50.5
Accidents and Violence (All Forms)
Accidents 54.6 61.7 42.3 33.0 43.8Suicides 45.9 50.5 29.8 28.1 26.6Other External Causes 38.4 45.3 37.5 32.8 34.4
75.7 77.0 70.3 68.0 66.3
Cause of Death
ALL
14

Table XVI MORTALITY IN 2015 BY OCCUPATION AND CAUSES OF DEATH
Number
Natural Causes
Malignant Neoplasms 5,903 49 45 43 20 99 1 13 48 40 5 5,540 Heart & Hypertensive Diseases 4,534 40 46 76 16 210 - 32 113 137 4 3,860 Lung & Respiratory System Diseases 4,417 4 6 9 3 29 - 5 14 16 4 4,327 Cerebrovascular Disease 1,357 6 7 11 10 26 - 6 19 21 2 1,249 Kidney & Disorders of Urinary System 925 1 4 1 - 4 - 1 3 5 - 906 Diabetes Mellitus 250 - 2 1 - 2 - 1 1 1 - 242 Infectious & Parasitic Diseases 194 3 5 2 1 4 - - 2 5 - 172 Other Natural Cases 1,387 7 19 11 7 37 1 3 22 20 3 1,257
Accidents and Violence (All Forms)
Accidents 425 8 16 27 1 36 - 14 34 65 7 217 Suicides 409 12 18 17 7 50 - 9 16 44 3 233 Other External Causes 61 1 3 4 - 8 - 5 6 5 2 27
19,862 131 171 202 65 505 2 89 278 359 30 18,030
Percent
Natural Causes
Malignant Neoplasms 29.7 37.4 26.3 21.3 30.8 19.6 50.0 14.6 17.3 11.1 16.7 30.7 Heart & Hypertensive Diseases 22.8 30.5 26.9 37.6 24.6 41.6 - 36.0 40.6 38.2 13.3 21.4 Lung & Respiratory System Diseases 22.2 3.0 3.5 4.5 4.6 5.7 - 5.6 5.0 4.4 13.3 24.0 Cerebrovascular Disease 6.8 4.6 4.1 5.4 15.4 5.2 - 6.8 6.8 5.8 6.7 6.9 Kidney & Disorders of Urinary System 4.7 0.8 2.3 0.5 . 0.8 - 1.1 1.1 1.4 - 5.0 Diabetes Mellitus 1.3 - 1.2 0.5 . 0.4 - 1.1 0.4 0.3 - 1.3 Infectious & Parasitic Diseases 1.0 2.3 2.9 1.0 1.5 0.8 - - 0.7 1.4 - 1.0 Other Natural Cases 7.0 5.3 11.1 5.4 10.8 7.3 50.0 3.4 7.9 5.6 10.0 7.0
Accidents and Violence (All Forms)
Accidents 2.1 6.1 9.4 13.4 1.5 7.1 - 15.7 12.2 18.1 23.3 1.2 Suicides 2.1 9.2 10.5 8.4 10.8 9.9 - 10.1 5.8 12.3 10.0 1.3 Other External Causes 0.3 0.8 1.8 2.0 - 1.6 - 5.6 2.2 1.4 6.7 0.2
100.0 100.0 100.0 100.0 100.0 100.0 100.0 100.0 100.0 100.0 100.0 100.0
Other
Workers
Persons Not
WorkingTotal
Legislators,
Senior Officials
& Managers
Professionals
Technicians &
Associate
Professionals
Clerical
Workers
Service
Workers,
Shop &
Market
Sales
Workers
Agricultural &
Fishery
Workers
Cause of Death
Total
Total
Plant &
Machine
Operators &
Assemblers
Production
Craftsmen
Cleaners &
Labourers
15

Infant Mortality
32 Of the 84 infant deaths registered in 2015, 56 were males and 28 were females.
The main causes of infant death were Perinatal Originated Conditions (35.7%) and
Congenital Anomalies (34.5%). The infant mortality rate in 2015 was 1.7 per 1,000
resident live births (Chart 6).
Chart 6 INFANT MORTALITY RATES, 2006 – 2015
Neonatal Mortality
33 The number fell from 70 in 2006 to 41 in 2015. Correspondingly, the neonatal
mortality rate also dropped from 1.7 per 1,000 resident live births in 2006 to 0.8 per
1,000 resident live births in 2015.
Perinatal Mortality
34 Including still births, there were 118 perinatal deaths registered in 2015. The
perinatal mortality rate was 2.8 per 1,000 live births and still births.
Maternal Mortality
35 In 2015, there were 3 maternal death registered.
0.0
1.0
2.0
3.0
4.0
5.0
6.0
0
20
40
60
80
100
120
140
2006 2007 2008 2009 2010 2011 2012 2013 2014 2015
Number
Year
Infant Mortality
Infant Mortality Rates
Per 1000 resident live-births
16
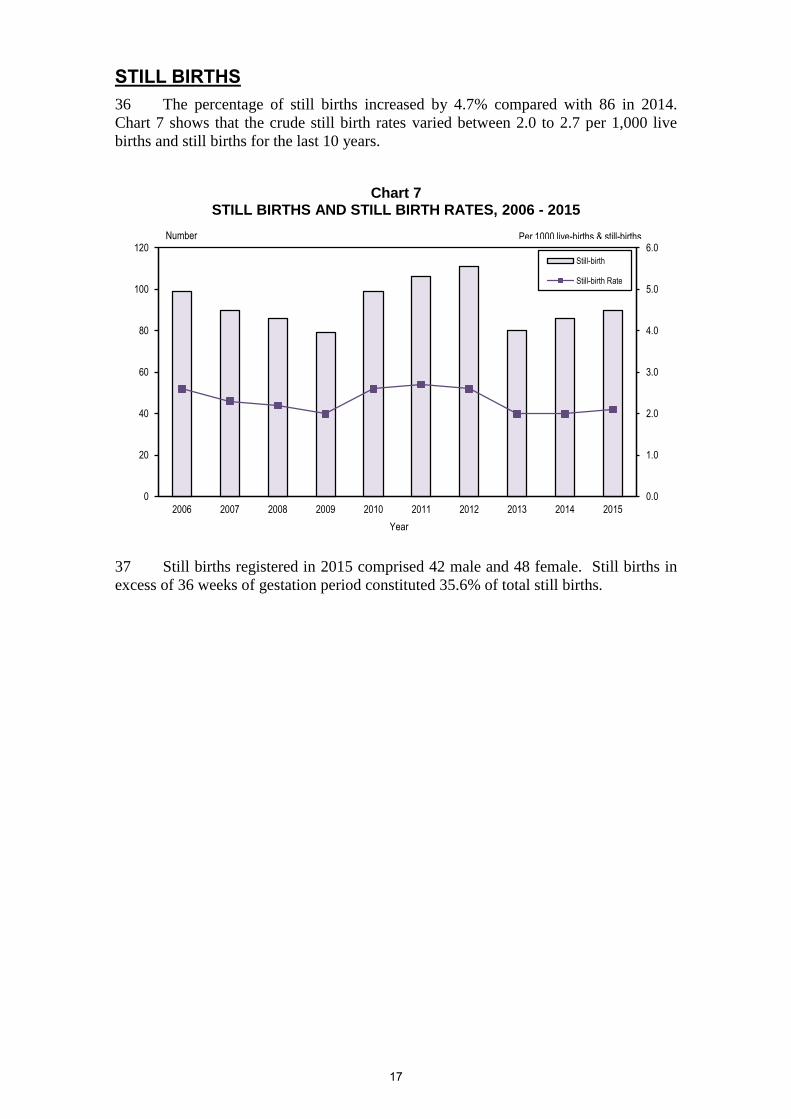
STILL BIRTHS
36 The percentage of still births increased by 4.7% compared with 86 in 2014.
Chart 7 shows that the crude still birth rates varied between 2.0 to 2.7 per 1,000 live
births and still births for the last 10 years.
Chart 7 STILL BIRTHS AND STILL BIRTH RATES, 2006 - 2015
37 Still births registered in 2015 comprised 42 male and 48 female. Still births in
excess of 36 weeks of gestation period constituted 35.6% of total still births.
0.0
1.0
2.0
3.0
4.0
5.0
6.0
0
20
40
60
80
100
120
2006 2007 2008 2009 2010 2011 2012 2013 2014 2015
Number
Year
Still-birth
Still-birth Rate
Per 1000 live-births & still-births
17

ANNEXURE
PROCEDURES FOR THE REGISTRATION OF
LIVE BIRTHS, DEATHS AND STILL BIRTHS
LIVE BIRTHS
All live births occurring in Singapore can be registered at one of the following Birth
Registration Centres stated below:
a Registry of Births and Deaths at the ICA Building;
b Gleneagles Hospital;
c KK Women’s and Children’s Hospital;
d Mount Alvernia Hospital;
e Mount Elizabeth Hospital;
f Mount Elizabeth Novena Hospital;
g National University Hospital;
h Parkway East Hospital;
i Raffles Hospital;
j Singapore General Hospital; or
k Thomson Medical Pte Ltd.
2 The following documents are required to be produced at the time of birth registration:
a Notification of Live birth;
b Identification Documents of both parents i.e. Singapore Pink Identity Card or
Foreign Travel Document (with their Singapore Blue Identity Card or Long
Term Pass Card issued by ICA, if applicable); and
c Original Marriage Certificate of parents.
3 The Certificate of Registration of Birth is prepared in 2 copies. One copy is retained by
the Registrar while the other copy is laminated and issued to the informant. The fee for a birth
certificate is S$18.00. For births registered at the respective maternity hospitals, these centres
may charge an additional administrative fee on top of the fee for a birth certificate.
4 All live births must be registered within 14 days. Registrations effected after 14 days
but before the expiry of 42 days are classified as Delayed Registrations. Registrations after the
expiry of 42 days are classified as Late Registrations.
Annex A
18

DEATHS
5 Deaths which occur in government restructured hospitals can be registered at the
respective hospitals. Deaths which occur elsewhere in Singapore are registered at the Registry
of Births and Deaths or any of the Police Divisional Headquarter/Neighbourhood Police Centre
or Post. The following documents are required to be produced for registration:
a Certificate of Cause of Death issued by a medical practitioner;
b Identification Document of deceased, i.e. Singapore Pink Identity Card or
Foreign Travel Document (with their Singapore Blue Identity Card or Long
Term Pass Card issued by ICA, if applicable);
c Singapore Passport of deceased;
d Birth Certificate or Certificate of Citizenship of deceased, where applicable; and
e Identification Document of the Informant, i.e. Singapore Pink Identity Card or
Foreign Travel Document (with their Singapore Blue Identity Card or Long
Term Pass Card issued by ICA).
6 A death which has occurred at home and is not attended by a doctor must first be reported
to the Police who will make arrangements for an authorised medical practitioner to examine the
body. The medical practitioner will issue a Certificate of Cause of Death if he is satisfied that the
death is due to natural causes. The death must then be registered at the Registry of Births and
Deaths or any of the Police Divisional Headquarter/Neighbourhood Police Centre or Post. The
documents required to be produced for registration are as mentioned in Paragraph 5 above.
7 The Certificate of Registration of Death, together with the attached Burial/Cremation
Permit, is prepared in 2 copies. One copy is issued to the informant and the other copy is
retained by the Registrar. An acknowledgement slip for the documents (as mentioned in
paragraph 5b, c and d) surrendered will be issued to the informant. All documents invalidated
are returned to the informant.
8 No fee is required for the registration of a death. If the body of a deceased is to be
exported to another country, an Export Permit must be obtained from the Port Health Officer,
Ministry of the Environment and Water Resources. The Export Permit can only be obtained
after the death has been registered.
9 All deaths in Singapore must be registered within three days of occurrence. Death
registrations after three days are classified as Late Registrations.
19
STILL-BIRTHS
10 Still-births which occur in government restructured hospitals are registered at the
respective hospitals. Still-births which occur elsewhere in Singapore are registered at the
Registry of Births and Deaths or any of the Police Divisional Headquarter/Neighbourhood
Police Centre or Post. The following documents are required to be produced for registration:
a Notification of Still-birth issued by a doctor;
b Identification Documents of both parents i.e. Singapore Pink Identity Card
or Foreign Travel Document (with Singapore Blue Identity Card or Long
Term Pass Card issued by ICA, if applicable); and
c Identification Document of the Informant, i.e. Singapore Pink Identity Card
or Foreign Travel Document (with Singapore Blue Identity Card or Long
Term Pass Card issued by ICA).
11 Upon registration, a Permit to Bury or Cremate Body and an acknowledgement slip for
the documents surrendered are issued to the informant while the Certificate of Registration of
Still-birth is retained by the Registrar. No fee is required for the registration of a still-birth.
12 All still-births must be registered within 14 days.
20

Birth Registered at
Full Name
Sex Date of Birth Time of BirthHours
Place or Address of Birth
Name Date of Birth
NRIC/Identification Document No. Race Dialect Group
Nationality Country/Place of Birth
Address
Name
NRIC/Identification Document No. Race Dialect Group
Nationality Country/Place of Birth
Name
NRIC/Identification Document No. Relationship
Address
FOR OFFICIAL USE
I certify that the above information given by me is correct.
Informant's Signature or Thumb Impression Date for Registrar of Births and Deaths Date
FA
TH
ER
'S
PA
RT
ICU
LA
RS
INF
OR
MA
NT
'S
PA
RT
ICU
LA
RS
BIRTH REGISTRATION No.
REPUBLIC OF SINGAPORECERTIFICATE OF REGISTRATION OF BIRTH
CH
ILD
'S P
AR
TIC
UL
AR
SM
OT
HE
R'S
PA
RT
ICU
LA
RS
21
Annex B

Death registered at
Full name of deceased
NRIC/Identification Document No. Sex Date of Birth
Race/Dialect Group Nationality Country/Place of Birth
Home Address Date and Hour of Death
Place or Address where death occurred
Years Months Days Hours I
Disease or condition (a)
leading to death
(b)
Antecedent Causes (c)
II
Other significant
conditions
Name and official status of person certifying cause of death Certificate of Cause of Death Reference No.: Date:
Name I certify that the above information given by me is correct.
Address
NRIC/Identification Document No.
Relationship Informant's Signature / DateThumb Impression
Name of Registration Officer
Designation
Datefor Registrar of Births and DeathsR
EG
IST
RA
TIO
N
OF
FIC
ER
Approximate interval between onset and death
DEATH REGISTRATION NO.REPUBLIC OF SINGAPORECERTIFICATE OF REGISTRATION OF DEATH
DE
CE
AS
ED
CA
US
E O
F D
EA
TH
BY
CE
RT
IFIE
RIN
FO
RM
AN
T
22
Annex C

Still-birth registered at
Sex Date of Birth Hour of Birth
Place and Address Cause of Death
Maiden Name
NRIC/Identification Document No. Race/Dialect Group Nationality Country/Place of Birth
Date of Birth Address
Name
NRIC/Identification Document No. Race/Dialect Group Nationality Country/Place of Birth
State relationship (e.g. Father, Mother, etc.) Name and Address
NRIC/Identification Document No.
I certify that the information given by me is correct.
Informant's Signature or Date Registrar of Births and Deaths Date
Thumb Impression
STILL-BIRTH REGISTRATION No.
CH
ILD
'S
PA
RT
ICU
LA
RS
INF
OR
MA
NT
'S
PA
RT
ICU
LA
RS
FA
TH
ER
'S
PA
RT
ICU
LA
RS
MO
TH
ER
'S
PA
RT
ICU
LA
RS
REPUBLIC OF SINGAPORE
CERTIFICATE OF REGISTRATION OF STILL-BIRTH
of Birth
No.
23
Annex D

EXPLANATORY
NOTES
EXPLANATORY NOTES
1 Resident population refers to Singapore citizens and permanent residents. Data
from 2003 onwards exclude residents who have been away from Singapore for
a continuous period of 12 months or longer as at the reference period.
2 For 1980, the annual population growth rate refers to the annualised increase
of the resident population over the previous Census year (1970). For 1990, the
rate is computed based on 1989 and 1990 data using de facto concept. For
2003, the rate is computed based on 2003 unrevised population estimates.
From 1980 onwards, this rate is based on Singapore residents only.
3 Sex ratio refers to the number of males per thousand females. From 1980
onwards, this ratio is based on Singapore residents only.
4 Natural increase refers to the excess of births over deaths.
5 Crude rate of natural increase refers to the natural increase per thousand
population. From 1980 onwards, this rate is based on Singapore residents only.
6 A live birth refers to an infant, irrespective of the duration of gestation, which
after the complete expulsion or extraction from its mother, breathes or shows any
other signs of life. From 1953 onwards, the figures are based on date of
occurrence. Prior to 1953, they are based on date of registration.
7 Crude birth rate refers to the number of live births per thousand population.
From 1980 onwards, this rate is based on Singapore residents only.
8 Birth order refers to the numerical order of a child in relation to all previous live
births of its mother.
9 Period of gestation refers to the number of weeks a baby remained in its mother's
womb before birth.
10 A premature birth refers to a birth with less than 37 weeks of gestation.
11 A death refers to the permanent disappearance of all signs of life of a living
person at any time. Death figures referred to the number of deaths registered
during the year.
12 Crude death rate refers to the number of deaths per thousand population. From
1980 onwards, this rate is based on Singapore residents only.
13 Infant mortality refers to death of persons under one year of age.
24

14 Crude infant mortality rate refers to the number of infant deaths per thousand
live births. From 1980 onwards, this rate is based on resident live births only.
15 Neonatal mortality refers to death of persons under 28 days of age.
16 Crude neonatal mortality rate refers to the number of neonatal deaths per
thousand live births. From 1990 onwards, this rate is based on resident live births
only.
17 Perinatal mortality refers to still birth and death of persons under seven days of
age.
18 Crude perinatal mortality rate refers to the number of perinatal deaths per
thousand live births and still births.
19 Maternal mortality refers to deaths of mothers owing to deliveries and
complications arising from pregnancy, childbirth and puerperium.
20 Crude maternal mortality rate refers to the number of maternal deaths per
hundred thousand live births and still births.
21 A still birth refers to an infant born after a minimum of 28 weeks of gestation,
which after expulsion or extraction from its mother, does not breathe or show
any signs of life. Still birth figures referred to the number of still births registered
during the year.
22 Crude still birth rate refers to the number of still births per thousand live births
and still births.
23 Resident live-births refer to those with at least one parent who is Singapore
citizen or permanent resident.
25

TABLES

1971 2,112,900 35,759 47,088 11,329 437 948 660 996 10
1972 2,152,400 38,156 49,678 11,522 401 954 714 1,027 18
1973 2,193,000 36,349 48,269 11,920 386 981 689 973 7
1974 2,229,800 31,594 43,268 11,674 359 728 523 788 8
1975 2,262,600 28,501 39,948 11,447 304 555 407 668 12
1976 2,293,300 31,135 42,783 11,648 333 498 353 634 6
1977 2,325,300 26,409 38,364 11,955 308 474 357 622 6
1978 2,353,600 27,376 39,441 12,065 280 498 381 604 8
1979 2,383,500 28,311 40,779 12,468 272 540 398 611 3
1980 2,282,125 28,712 41,217 12,505 264 483 366 556 2
1981 2,324,400 29,387 42,250 12,863 282 451 320 537 2
1982 2,365,700 29,758 42,654 12,896 274 456 348 559 5
1983 2,406,200 27,264 40,585 13,321 223 382 269 434 6
1984 2,443,700 28,394 41,556 13,162 243 365 256 435 5
1985 2,482,600 29,136 42,484 13,348 227 394 297 461 2
1986 2,518,600 25,558 38,379 12,821 201 359 248 394 5
1987 2,553,900 30,443 43,616 13,173 206 324 246 397 3
1988 2,598,500 39,267 52,957 13,690 203 368 245 389 6
1989 2,647,600 33,600 47,669 14,069 208 315 219 378 2
1990 2,735,868 37,251 51,142 13,891 206 341 238 376 1
1991 2,794,700 35,238 49,114 13,876 198 269 172 318 2
1992 2,849,800 35,065 49,402 14,337 171 245 146 281 2
1993 2,904,500 35,764 50,225 14,461 168 235 147 275 4
1994 2,959,400 34,608 49,554 14,946 167 214 121 256 3
1995 3,013,500 33,066 48,635 15,569 140 195 102 212 2
1996 3,068,100 32,987 48,577 15,590 150 183 113 220 2
1997 3,123,400 32,028 47,333 15,305 139 179 106 208 2
1998 3,180,000 28,007 43,664 15,657 133 183 106 213 6
1999 3,229,700 27,820 43,336 15,516 125 150 86 183 4
2000 3,273,363 31,304 46,997 15,693 143 137 82 204 8
2001 3,325,900 26,084 41,451 15,367 107 100 55 146 4
2002 3,382,900 24,940 40,760 15,820 114 123 68 159 5
2003 3,366,900 21,449 37,485 16,036 95 100 60 135 2
2004 3,413,300 21,314 37,174 15,860 115 82 44 143 2
2005 3,467,800 21,277 37,492 16,215 102 95 60 141 5
2006 3,525,900 21,924 38,317 16,393 99 117 70 145 4
2007 3,583,100 22,350 39,490 17,140 90 94 52 121 3
2008 3,642,700 22,604 39,826 17,222 86 104 62 123 3
2009 3,733,900 22,469 39,570 17,101 79 102 63 126 0
2010 3,771,721 20,357 37,967 17,610 99 100 53 134 1
2011 3,789,300 21,627 39,654 18,027 106 97 62 154 3
2012 3,818,200 24,182 42,663 18,481 111 98 58 156 1
2013 3,844,800 20,782 39,720 18,938 80 94 52 110 1
2014 3,870,700 22,839 42,232 19,393 86 83 50 123 1
2015 3,902,700 22,323 42,185 19,862 90 84 41 118 3
* Source : Singapore Department of Statistics
Note: (1) Population figures from 1980 onwards refer to Singapore residents only. Resident population comprises Singapore citizens and permanent residents.
Infant
MortalityStill-birthsLive-births Deaths
(2) Data from 2003 onwards exclude residents who have been away from Singapore for a continuous period of 12 months or longer as at the reference
period.
Natural
IncreasePopulation *
Table 1POPULATION AND VITAL STATISTICS, 1971 - 2015
YearMaternal
Mortality
Perinatal
Mortality
Neonatal
Mortality
26
1971 19 16.9 22.3 5.4 9.2 20.1 14.0 21.0 21.0
1972 19 17.7 23.1 5.4 8.0 19.2 14.4 20.5 35.9
1973 19 16.6 22.0 5.4 7.9 20.3 14.3 20.0 14.4
1974 17 14.2 19.4 5.2 8.2 16.8 12.1 18.1 18.3
1975 15 12.6 17.7 5.1 7.6 13.9 10.2 16.6 29.8
1976 14 13.6 18.7 5.1 7.7 11.6 8.3 14.7 13.9
1977 14 11.4 16.5 5.1 8.0 12.4 9.3 16.1 15.5
1978 12 11.6 16.8 5.1 7.0 12.6 9.7 15.2 20.1
1979 13 11.9 17.1 5.2 6.6 13.2 9.8 14.9 7.3
1980 13 1 12.7 17.6 4.9 6.4 8.0 8.9 13.4 4.8
1981 19 12.7 17.6 4.9 6.6 8.2 7.6 12.6 4.7
1982 18 12.6 17.5 4.9 6.4 9.6 8.2 13.0 11.6
1983 17 11.3 16.3 5.0 5.5 8.8 6.6 10.6 14.7
1984 16 11.7 16.5 4.8 5.8 7.3 6.2 10.4 12.0
1985 16 11.7 16.6 4.9 5.3 7.6 7.0 10.8 4.7
1986 14 10.2 14.8 4.6 5.2 6.1 6.5 10.2 13.0
1987 14 11.9 16.6 4.7 4.7 5.5 5.6 9.1 6.8
1988 17 14.9 19.8 4.9 3.8 5.5 4.6 7.3 11.3
1989 19 12.6 17.5 4.9 4.3 6.3 4.6 7.9 4.2
1990 22 2 13.5 18.2 4.7 4.0 6.6 4.7 7.3 1.9
1991 22 12.5 17.1 4.6 4.0 5.4 3.5 6.4 4.1
1992 20 12.1 16.8 4.7 3.4 4.8 3.0 5.7 4.0
1993 19 12.2 16.8 4.6 3.3 4.7 3.0 5.5 7.9
1994 19 11.6 16.2 4.7 3.4 4.1 2.4 5.1 6.0
1995 18 10.8 15.6 4.8 2.9 3.8 2.0 4.3 4.1
1996 18 10.5 15.2 4.7 3.1 3.6 2.2 4.5 4.1
1997 18 10.0 14.5 4.5 2.9 3.6 2.2 4.4 4.2
1998 18 8.5 13.1 4.6 3.0 4.1 2.4 4.9 13.7
1999 16 8.3 12.8 4.5 2.9 3.3 1.9 4.2 9.2
2000 14 9.2 13.7 4.5 3.0 2.5 1.5 4.3 17.0
2001 16 7.5 11.8 4.3 2.6 2.2 1.1 3.5 9.6
2002 17 7.0 11.4 4.4 2.8 2.9 1.6 3.9 12.2
2003 16 3 6.0 10.5 4.5 2.5 2.5 1.6 3.6 5.3
2004 14 5.9 10.3 4.4 3.1 2.0 1.1 3.8 5.4
2005 16 5.8 10.2 4.4 2.7 2.1 1.3 3.8 13.3
2006 17 5.9 10.3 4.4 2.6 2.6 1.7 3.8 10.4
2007 16 5.9 10.3 4.5 2.3 2.1 1.2 3.1 7.6
2008 17 5.8 10.2 4.4 2.2 2.1 1.3 3.1 7.5
2009 25 5.6 9.9 4.3 2.0 2.2 1.3 3.2 0.0
2010 10 4.9 9.3 4.4 2.6 2.0 1.1 3.5 2.6
2011 5 5.1 9.5 4.5 2.7 2.0 1.3 3.9 7.5
2012 8 5.6 10.1 4.5 2.6 1.8 1.1 3.6 2.3
2013 7 4.6 9.3 4.6 2.0 2.0 1.1 2.8 2.5
2014 7 5.1 9.8 4.7 2.0 1.8 1.1 2.9 2.4
2015 8 4.9 9.7 4.8 2.1 1.7 0.8 2.8 7.1
* Source : Singapore Department of Statistics1
Refer to annualised growth over the resident population in 1970.
2 Annual growth rate between 1989 and 1990 is computed on 1989 and 1990 data using de facto concept.
3 Annual growth rate between 2002 and 2003 is computed based on unrevised population estimates for 2003.
Note: (1) The annual population growth rate refers to the annual population increase per thousand population.
The annual population growth rate, natural increase, live-birth and death from 1980 onwards is based on Singapore residents only.
Resident population comprises Singapore citizens and permanent residents.
(2) The crude neonatal mortality rate from 1990 onwards is based on resident live births only.
(3) The crude maternal mortality rate refers to the number of maternal deaths per hundred thousand live births and still births.
Neonatal
Mortality
Perinatal
Mortality
Maternal
Mortality
Table 2POPULATION GROWTH AND VITAL RATES, 1971 - 2015
Year Population *Natural
IncreaseLive-births Deaths Still-births
Infant
Mortality
27
1971 2,112,900 1,611,100 316,300 146,300 39,200
1972 2,152,400 1,643,400 321,200 147,300 40,500
1973 2,193,000 1,676,800 326,100 148,400 41,700
1974 2,229,800 1,707,100 330,200 149,400 43,100
1975 2,262,600 1,733,700 334,100 150,200 44,600
1976 2,293,300 1,758,800 337,400 151,100 46,000
1977 2,325,300 1,785,300 340,700 151,900 47,400
1978 2,353,600 1,808,200 344,100 152,700 48,600
1979 2,383,500 1,832,400 347,600 153,500 50,000
1980 (Census) 2,282,125 1,787,816 328,718 143,404 22,187
1981 2,324,400 1,820,000 333,200 148,300 22,800
1982 2,365,700 1,851,200 337,800 153,200 23,500
1983 2,406,200 1,881,300 342,700 158,000 24,200
1984 2,443,700 1,908,800 347,400 162,700 24,800
1985 2,482,600 1,937,100 352,600 167,400 25,600
1986 2,518,600 1,962,900 357,900 171,700 26,200
1987 2,553,900 1,988,000 363,000 176,100 26,700
1988 2,598,500 2,021,500 369,000 180,700 27,200
1989 2,647,600 2,059,100 375,400 185,300 27,800
1990 (Census) 2,735,868 2,127,872 384,338 194,048 29,610
1991 2,794,700 2,172,300 392,400 198,800 31,200
1992 2,849,800 2,213,000 400,300 203,600 32,800
1993 2,904,500 2,253,600 408,100 208,500 34,300
1994 2,959,400 2,293,200 416,000 214,300 35,900
1995 3,013,500 2,332,900 423,300 220,300 37,100
1996 3,068,100 2,371,800 430,100 227,700 38,500
1997 3,123,400 2,410,100 436,700 236,400 40,200
1998 3,180,000 2,448,700 443,300 245,800 42,200
1999 3,229,700 2,482,600 449,500 253,300 44,300
2000 (Census) 3,273,363 2,513,847 455,207 257,866 46,443
2001 3,325,900 2,552,100 461,800 263,000 49,100
2002 3,382,900 2,589,500 468,400 271,900 53,100
2003 3,366,900 2,572,600 469,800 269,900 54,600
2004 3,413,300 2,599,800 475,700 278,100 59,700
2005 3,467,800 2,626,700 480,700 291,100 69,200
2006 3,525,900 2,656,400 486,000 303,100 80,500
2007 3,583,100 2,687,000 490,600 313,400 92,100
2008 3,642,700 2,721,800 495,100 323,400 102,300
2009 3,733,900 2,770,300 500,100 343,500 120,000
2010 (Census) 3,771,721 2,793,980 503,868 348,119 125,754
2011 3,789,300 2,808,300 506,600 349,000 125,300
2012 3,818,200 2,832,000 509,500 351,000 125,700
2013 3,844,800 2,853,800 512,800 351,700 126,500
2014 3,870,700 2,874,400 516,700 353,000 126,700
2015 3,902,700 2,900,000 520,900 355,000 126,800
Source : Singapore Department of Statistics
Note: (1) Figures from 1980 onwards refer to Singapore residents only. Resident population comprises Singapore citizens and permanent residents.
(2) Figures may not add up to totals due to roundings.
(3) Data from 2003 onwards exclude residents who have been away from Singapore for a continuous period of 12 months or longer at the
reference period.
Table 3POPULATION BY ETHNIC GROUP, 1971 - 2015
Year Total Chinese Malays Indians Others
28

1971 1,081,200 812,100 161,300 87,600 20,200
1972 1,101,100 828,400 164,200 87,600 20,900
1973 1,121,400 845,100 167,100 87,600 21,600
1974 1,139,700 860,200 169,500 87,700 22,300
1975 1,156,100 873,500 171,800 87,700 23,100
1976 1,171,300 886,000 173,700 87,800 23,800
1977 1,187,300 899,300 175,600 87,900 24,500
1978 1,201,400 910,700 177,600 87,900 25,200
1979 1,216,300 922,900 179,600 87,900 25,900
1980 (Census) 1,159,011 900,259 167,273 80,435 11,044
1981 1,179,800 916,200 169,600 82,700 11,300
1982 1,200,300 931,800 171,900 85,000 11,600
1983 1,220,500 946,800 174,400 87,300 11,900
1984 1,239,100 960,500 176,900 89,600 12,200
1985 1,258,500 974,600 179,600 91,800 12,500
1986 1,276,500 987,400 182,400 94,000 12,700
1987 1,294,200 1,000,000 185,000 96,200 13,000
1988 1,316,600 1,016,800 188,100 98,400 13,200
1989 1,341,300 1,035,700 191,500 100,700 13,500
1990 (Census) 1,386,291 1,071,055 195,950 104,996 14,290
1991 1,414,300 1,092,500 199,800 106,900 15,000
1992 1,439,100 1,111,100 203,500 108,900 15,600
1993 1,464,200 1,130,000 207,100 110,900 16,100
1994 1,489,200 1,148,100 210,900 113,500 16,700
1995 1,514,000 1,166,300 214,100 116,300 17,200
1996 1,540,000 1,184,900 217,400 119,900 17,900
1997 1,565,800 1,202,300 220,400 124,200 18,800
1998 1,591,800 1,219,900 223,400 128,800 19,700
1999 1,614,800 1,235,300 226,300 132,400 20,800
2000 (Census) 1,634,667 1,249,662 228,850 134,337 21,818
2001 1,658,600 1,267,000 232,000 136,500 23,100
2002 1,684,300 1,283,400 235,100 140,800 25,100
2003 1,673,400 1,273,300 235,600 138,600 25,900
2004 1,695,000 1,285,600 238,200 142,800 28,500
2005 1,721,100 1,297,800 240,400 149,600 33,300
2006 1,748,200 1,310,900 242,800 155,900 38,700
2007 1,775,500 1,324,700 245,000 161,500 44,300
2008 1,803,000 1,339,600 247,000 167,100 49,200
2009 1,844,700 1,360,200 249,100 178,100 57,300
2010 (Census) 1,861,133 1,370,083 250,885 180,327 59,838
2011 1,868,200 1,375,700 252,200 180,500 59,700
2012 1,880,000 1,385,600 253,600 180,900 59,900
2013 1,891,500 1,395,200 255,200 180,900 60,300
2014 1,902,400 1,403,900 257,000 181,400 60,100
2015 1,916,600 1,415,300 259,100 182,300 59,900
Source : Singapore Department of Statistics
Note: (1) Figures from 1980 onwards refer to Singapore residents only. Resident population comprises Singapore citizens and permanent residents.
(2) Figures may not add up to totals due to roundings.
(3) Data from 2003 onwards exclude residents who have been away from Singapore for a continuous period of 12 months or longer at the
reference period.
Table 4MALE POPULATION BY ETHNIC GROUP, 1971 - 2015
Year Total Chinese Malays Indians Others
29

1971 1,031,700 799,000 155,000 58,700 19,000
1972 1,051,300 815,000 157,000 59,700 19,600
1973 1,071,600 831,700 159,000 60,800 20,100
1974 1,090,100 846,900 160,700 61,700 20,800
1975 1,106,500 860,200 162,300 62,500 21,500
1976 1,122,000 872,800 163,700 63,300 22,200
1977 1,138,000 886,000 165,100 64,000 22,900
1978 1,152,200 897,500 166,500 64,800 23,400
1979 1,167,200 909,500 168,000 65,600 24,100
1980 (Census) 1,123,114 887,557 161,445 62,969 11,143
1981 1,144,600 903,800 163,700 65,600 11,500
1982 1,165,400 919,400 165,900 68,200 11,900
1983 1,185,700 934,500 168,300 70,700 12,300
1984 1,204,600 948,300 170,500 73,100 12,700
1985 1,224,200 962,500 173,100 75,500 13,100
1986 1,242,100 975,400 175,500 77,700 13,400
1987 1,259,700 988,000 178,100 79,900 13,700
1988 1,281,900 1,004,700 180,900 82,300 14,000
1989 1,306,400 1,023,500 183,900 84,600 14,300
1990 (Census) 1,349,577 1,056,817 188,388 89,052 15,320
1991 1,380,400 1,079,800 192,600 91,900 16,200
1992 1,410,700 1,101,900 196,800 94,800 17,200
1993 1,440,300 1,123,600 200,900 97,600 18,200
1994 1,470,200 1,145,100 205,100 100,800 19,100
1995 1,499,500 1,166,600 209,100 104,000 19,900
1996 1,528,100 1,186,900 212,700 107,900 20,600
1997 1,557,700 1,207,800 216,200 112,200 21,400
1998 1,588,200 1,228,800 219,900 116,900 22,500
1999 1,614,900 1,247,300 223,200 120,900 23,500
2000 (Census) 1,638,696 1,264,185 226,357 123,529 24,625
2001 1,667,300 1,285,100 229,800 126,500 26,000
2002 1,698,600 1,306,200 233,300 131,200 28,000
2003 1,693,500 1,299,400 234,200 131,300 28,700
2004 1,718,200 1,314,300 237,500 135,400 31,200
2005 1,746,700 1,328,900 240,300 141,500 36,000
2006 1,777,700 1,345,500 243,200 147,200 41,800
2007 1,807,600 1,362,300 245,600 151,900 47,800
2008 1,839,700 1,382,200 248,100 156,300 53,100
2009 1,889,100 1,410,100 250,900 165,400 62,700
2010 (Census) 1,910,588 1,423,897 252,983 167,792 65,916
2011 1,921,100 1,432,600 254,400 168,500 65,600
2012 1,938,200 1,446,400 255,900 170,100 65,800
2013 1,953,200 1,458,600 257,700 170,800 66,200
2014 1,968,300 1,470,500 259,600 171,700 66,600
2015 1,986,100 1,484,700 261,800 172,600 66,900
Source : Singapore Department of Statistics
Note: (1) Figures from 1980 onwards refer to Singapore residents only. Resident population comprises Singapore citizens and permanent residents.
(2) Figures may not add up to totals due to roundings.
(3) Data from 2003 onwards exclude residents who have been away from Singapore for a continuous period of 12 months or longer at the
reference period.
Table 5FEMALE POPULATION BY ETHNIC GROUP, 1971 - 2015
Indians OthersYear Total Chinese Malays
30

1971 1,048 1,016 1,041 1,492 1,063
1972 1,047 1,016 1,046 1,467 1,066
1973 1,046 1,016 1,051 1,441 1,075
1974 1,046 1,016 1,055 1,421 1,072
1975 1,045 1,015 1,059 1,403 1,074
1976 1,044 1,015 1,061 1,387 1,072
1977 1,043 1,015 1,064 1,373 1,070
1978 1,043 1,015 1,067 1,356 1,077
1979 1,042 1,015 1,069 1,340 1,075
1980 (Census) 1,032 1,014 1,036 1,277 991
1981 1,031 1,014 1,036 1,261 983
1982 1,030 1,013 1,036 1,247 977
1983 1,029 1,013 1,036 1,236 969
1984 1,029 1,013 1,037 1,225 960
1985 1,028 1,013 1,038 1,216 952
1986 1,028 1,012 1,039 1,209 949
1987 1,027 1,012 1,039 1,204 950
1988 1,027 1,012 1,040 1,196 946
1989 1,027 1,012 1,041 1,189 941
1990 (Census) 1,027 1,013 1,040 1,179 933
1991 1,025 1,012 1,038 1,164 923
1992 1,020 1,008 1,034 1,149 905
1993 1,017 1,006 1,031 1,137 887
1994 1,013 1,003 1,028 1,126 875
1995 1,010 1,000 1,024 1,119 868
1996 1,008 998 1,022 1,112 869
1997 1,005 996 1,019 1,107 876
1998 1,002 993 1,016 1,102 875
1999 1,000 990 1,014 1,095 884
2000 (Census) 998 989 1,011 1,087 886
2001 995 986 1,009 1,079 888
2002 992 983 1,008 1,073 895
2003 988 980 1,006 1,056 903
2004 986 978 1,003 1,055 914
2005 985 977 1,000 1,057 925
2006 983 974 998 1,060 925
2007 982 972 997 1,063 926
2008 980 969 996 1,070 927
2009 976 965 993 1,077 913
2010 (Census) 974 962 992 1,075 908
2011 972 960 991 1,072 911
2012 970 958 991 1,064 911
2013 968 957 990 1,059 910
2014 967 955 990 1,056 902
2015 965 953 990 1,056 896
Source : Singapore Department of Statistics
Note: (1) Figures from 1980 onwards refer to Singapore residents only. Resident population comprises Singapore citizens and permanent residents.
(2) Data from 2003 onwards exclude residents who have been away from Singapore for a continuous period of 12 months or longer at the
reference period.
Table 6SEX RATIO OF POPULATION BY ETHNIC GROUP, 1971 - 2015
(Males Per Thousand Females)
Year Total Chinese Malays Indians Others
31

1971 35,759 26,821 5,782 2,231 925
1972 38,156 28,892 6,116 2,212 936
1973 36,349 28,103 5,416 1,850 980
1974 31,594 23,983 4,753 1,741 1,117
1975 28,501 21,744 4,261 1,410 1,086
1976 31,135 24,535 4,080 1,385 1,135
1977 26,409 20,031 3,909 1,417 1,052
1978 27,376 20,759 4,101 1,477 1,039
1979 28,311 21,262 4,249 1,638 1,162
1980 28,712 20,392 5,149 1,873 1,298
1981 29,387 20,530 5,556 1,925 1,376
1982 29,758 20,568 5,729 2,026 1,435
1983 27,264 18,008 5,919 2,027 1,310
1984 28,394 18,623 6,261 2,117 1,393
1985 29,136 19,070 6,443 2,155 1,468
1986 25,558 15,532 6,476 2,168 1,382
1987 30,443 19,713 6,961 2,364 1,405
1988 39,267 27,776 7,419 2,599 1,473
1989 33,600 21,564 7,914 2,640 1,482
1990 37,251 24,630 8,098 2,918 1,605
1991 35,238 22,833 8,012 2,716 1,677
1992 35,065 22,530 7,825 2,917 1,793
1993 35,764 23,296 7,841 2,879 1,748
1994 34,608 22,832 7,314 2,688 1,774
1995 33,066 21,475 7,011 2,630 1,950
1996 32,987 21,459 6,808 2,602 2,118
1997 32,028 20,599 6,574 2,675 2,180
1998 28,007 16,819 6,346 2,608 2,234
1999 27,820 17,205 5,838 2,451 2,326
2000 31,304 20,066 6,082 2,633 2,523
2001 26,084 15,311 5,687 2,537 2,549
2002 24,940 14,678 5,027 2,704 2,531
2003 21,449 12,069 4,404 2,474 2,502
2004 21,314 11,923 4,320 2,390 2,681
2005 21,277 12,018 4,123 2,516 2,620
2006 21,924 12,231 4,151 2,588 2,954
2007 22,350 12,510 3,731 2,678 3,431
2008 22,604 12,242 3,862 2,703 3,797
2009 22,469 11,982 3,564 2,837 4,086
2010 20,357 9,954 3,176 3,003 4,224
2011 21,627 11,134 3,118 2,972 4,403
2012 24,182 12,648 3,376 3,287 4,871
2013 20,782 9,456 3,438 3,222 4,666
2014 22,839 11,292 3,713 3,168 4,666
2015 22,323 10,456 4,092 3,350 4,425
Table 7NATURAL INCREASE BY ETHNIC GROUP, 1971 - 2015
Year Total Chinese Malays Indians Others
32

1971 16.9 16.6 18.3 15.2 23.6
1972 17.7 17.6 19.0 15.0 23.1
1973 16.6 16.8 16.6 12.5 23.5
1974 14.2 14.0 14.4 11.7 25.9
1975 12.6 12.5 12.8 9.4 24.3
1976 13.6 13.9 12.1 9.2 24.7
1977 11.4 11.2 11.5 9.3 22.2
1978 11.6 11.5 11.9 9.7 21.4
1979 11.9 11.6 12.2 10.7 23.2
1980 12.7 11.7 16.0 14.0 35.2
1981 12.7 11.5 17.0 14.0 36.6
1982 12.6 11.3 17.1 14.0 37.5
1983 11.3 9.7 17.4 13.6 34.0
1984 11.7 10.0 18.1 13.9 35.4
1985 11.7 10.0 18.4 13.4 36.3
1986 10.2 8.1 18.2 13.3 32.2
1987 11.9 10.1 19.4 14.0 32.9
1988 14.9 13.7 20.2 14.8 35.8
1989 12.6 10.5 21.2 14.4 33.0
1990 13.5 11.6 21.3 15.3 32.6
1991 12.5 10.6 20.6 14.0 31.1
1992 12.1 10.3 19.8 14.4 29.7
1993 12.2 10.4 19.5 14.2 27.8
1994 11.6 10.0 17.8 12.9 27.2
1995 10.8 9.3 16.7 12.2 25.7
1996 10.5 9.1 16.1 11.8 26.0
1997 10.0 8.6 15.2 11.7 25.1
1998 8.5 6.9 14.5 11.0 23.2
1999 8.3 7.0 13.1 9.9 23.6
2000 9.2 8.0 13.5 10.2 24.3
2001 7.5 6.1 12.4 9.5 22.9
2002 7.0 5.7 10.9 9.6 21.3
2003 6.0 4.8 9.6 8.9 21.7
2004 5.9 4.6 9.3 8.5 22.2
2005 5.8 4.6 8.8 8.6 19.8
2006 5.9 4.7 8.7 8.4 20.5
2007 5.9 4.7 7.9 8.4 20.9
2008 5.8 4.5 8.1 8.0 21.3
2009 5.6 4.4 7.4 7.9 20.0
2010 4.9 3.6 6.6 8.2 19.1
2011 5.1 4.0 6.3 7.5 18.8
2012 5.6 4.4 6.9 8.0 20.1
2013 4.6 3.3 6.9 7.6 18.0
2014 5.1 3.9 7.4 7.3 17.5
2015 4.9 3.6 8.1 7.3 15.9
Note: From 1980 onwards the crude rate of natural increase is based on Singapore residents only.
Table 8CRUDE RATES OF NATURAL INCREASE BY ETHNIC GROUP, 1971 - 2015
Year Total Chinese Malays Indians Others
33

1971 47,088 35,608 7,246 3,090 1,144
1972 49,678 37,797 7,594 3,107 1,180
1973 48,269 37,326 6,903 2,824 1,216
1974 43,268 33,128 6,176 2,638 1,326
1975 39,948 30,635 5,647 2,339 1,327
1976 42,783 33,627 5,470 2,324 1,362
1977 38,364 29,404 5,364 2,307 1,289
1978 39,441 30,178 5,523 2,472 1,268
1979 40,779 30,926 5,755 2,684 1,414
1980 41,217 30,143 6,654 2,883 1,537
1981 42,250 30,491 7,131 2,979 1,649
1982 42,654 30,503 7,315 3,125 1,711
1983 40,585 28,324 7,527 3,115 1,619
1984 41,556 28,745 7,900 3,222 1,689
1985 42,484 29,355 8,104 3,280 1,745
1986 38,379 25,361 8,124 3,211 1,683
1987 43,616 29,839 8,636 3,441 1,700
1988 52,957 38,245 9,224 3,716 1,772
1989 47,669 32,330 9,741 3,763 1,835
1990 51,142 35,296 9,943 3,975 1,928
1991 49,114 33,423 9,878 3,804 2,009
1992 49,402 33,475 9,783 4,024 2,120
1993 50,225 34,251 9,809 4,022 2,143
1994 49,554 34,080 9,412 3,864 2,198
1995 48,635 33,384 9,093 3,737 2,421
1996 48,577 33,230 8,975 3,818 2,554
1997 47,333 32,285 8,627 3,833 2,588
1998 43,664 28,641 8,476 3,885 2,662
1999 43,336 28,973 7,994 3,651 2,718
2000 46,997 31,967 8,309 3,850 2,871
2001 41,451 27,063 7,816 3,712 2,860
2002 40,760 26,782 7,268 3,815 2,895
2003 37,485 24,326 6,697 3,632 2,830
2004 37,174 24,060 6,573 3,541 3,000
2005 37,492 24,313 6,511 3,672 2,996
2006 38,317 24,646 6,491 3,843 3,337
2007 39,490 25,390 6,252 3,994 3,854
2008 39,826 25,331 6,305 4,014 4,176
2009 39,570 24,799 6,053 4,196 4,522
2010 37,967 23,303 5,711 4,285 4,668
2011 39,654 24,691 5,719 4,376 4,868
2012 42,663 26,760 5,908 4,672 5,323
2013 39,720 23,890 6,067 4,648 5,115
2014 42,232 25,958 6,468 4,678 5,128
2015 42,185 25,412 6,961 4,895 4,917
Indians Others
LIVE - BIRTHS BY ETHNIC GROUP, 1971 - 2015Table 9
Year Total Chinese Malays
34

1971 22.3 22.1 22.9 21.1 29.2
1972 23.1 23.0 23.6 21.1 29.1
1973 22.0 22.3 21.2 19.0 29.2
1974 19.4 19.4 18.7 17.7 30.8
1975 17.7 17.7 16.9 15.6 29.8
1976 18.7 19.1 16.2 15.4 29.6
1977 16.5 16.5 15.7 15.2 27.2
1978 16.8 16.7 16.1 16.2 26.1
1979 17.1 16.9 16.6 17.5 28.3
1980 17.6 16.6 20.2 19.8 42.1
1981 17.6 16.5 21.3 19.8 43.9
1982 17.5 16.2 21.5 20.0 44.1
1983 16.3 14.8 21.8 19.3 40.5
1984 16.5 14.8 22.6 19.4 41.3
1985 16.6 14.9 22.8 19.2 41.3
1986 14.8 12.7 22.6 18.4 37.9
1987 16.6 14.8 23.7 19.2 39.2
1988 19.8 18.6 24.9 20.3 41.4
1989 17.5 15.5 25.9 20.0 39.9
1990 18.2 16.4 25.8 20.2 38.2
1991 17.1 15.2 25.1 18.9 35.9
1992 16.8 15.0 24.3 19.3 34.3
1993 16.8 15.1 23.9 19.0 32.5
1994 16.2 14.7 22.5 17.7 31.8
1995 15.6 14.2 21.3 16.6 31.3
1996 15.2 13.9 20.7 16.3 30.1
1997 14.5 13.3 19.6 15.7 28.6
1998 13.1 11.6 18.9 15.3 27.5
1999 12.8 11.5 17.6 13.9 27.7
2000 13.7 12.6 18.1 14.1 27.9
2001 11.8 10.5 16.8 13.3 26.1
2002 11.4 10.2 15.3 13.2 25.2
2003 10.5 9.4 14.1 12.7 24.8
2004 10.3 9.2 13.7 12.1 24.8
2005 10.2 9.1 13.4 12.0 22.6
2006 10.3 9.2 13.2 12.0 23.0
2007 10.3 9.3 12.6 11.9 22.9
2008 10.2 9.2 12.6 11.3 23.1
2009 9.9 8.8 12.0 11.2 21.5
2010 9.3 8.2 11.2 11.3 20.8
2011 9.5 8.6 11.1 10.8 20.4
2012 10.1 9.2 11.5 11.2 21.5
2013 9.3 8.2 11.7 11.0 19.6
2014 9.8 8.8 12.4 10.8 19.3
2015 9.7 8.6 13.3 10.9 17.9
Note: From 1980 onwards the crude birth rate is based on Singapore residents only.
Table 10CRUDE BIRTH RATES BY ETHNIC GROUP, 1971 - 2015
Year Total Chinese Malays Indians Others
35

1971 11,329 8,787 1,464 859 219
1972 11,522 8,905 1,478 895 244
1973 11,920 9,223 1,487 974 236
1974 11,674 9,145 1,423 897 209
1975 11,447 8,891 1,386 929 241
1976 11,648 9,092 1,390 939 227
1977 11,955 9,373 1,455 890 237
1978 12,065 9,419 1,422 995 229
1979 12,468 9,664 1,506 1,046 252
1980 12,505 9,751 1,505 1,010 239
1981 12,863 9,961 1,575 1,054 273
1982 12,896 9,935 1,586 1,099 276
1983 13,321 10,316 1,608 1,088 309
1984 13,162 10,122 1,639 1,105 296
1985 13,348 10,285 1,661 1,125 277
1986 12,821 9,829 1,648 1,043 301
1987 13,173 10,126 1,675 1,077 295
1988 13,690 10,469 1,805 1,117 299
1989 14,069 10,766 1,827 1,123 353
1990 13,891 10,666 1,845 1,057 323
1991 13,876 10,590 1,866 1,088 332
1992 14,337 10,945 1,958 1,107 327
1993 14,461 10,955 1,968 1,143 395
1994 14,946 11,248 2,098 1,176 424
1995 15,569 11,909 2,082 1,107 471
1996 15,590 11,771 2,167 1,216 436
1997 15,305 11,686 2,053 1,158 408
1998 15,657 11,822 2,130 1,277 428
1999 15,516 11,768 2,156 1,200 392
2000 15,693 11,901 2,227 1,217 348
2001 15,367 11,752 2,129 1,175 311
2002 15,820 12,104 2,241 1,111 364
2003 16,036 12,257 2,293 1,158 328
2004 15,860 12,137 2,253 1,151 319
2005 16,215 12,295 2,388 1,156 376
2006 16,393 12,415 2,340 1,255 383
2007 17,140 12,880 2,521 1,316 423
2008 17,222 13,089 2,443 1,311 379
2009 17,101 12,817 2,489 1,359 436
2010 17,610 13,349 2,535 1,282 444
2011 18,027 13,557 2,601 1,404 465
2012 18,481 14,112 2,532 1,385 452
2013 18,938 14,434 2,629 1,426 449
2014 19,393 14,666 2,755 1,510 462
2015 19,862 14,956 2,869 1,545 492
Indians Others
Table 11DEATHS BY ETHNIC GROUP, 1971 - 2015
Year Total Chinese Malays
36

1971 5.4 5.5 4.6 5.9 5.6
1972 5.4 5.4 4.6 6.1 6.0
1973 5.4 5.5 4.6 6.6 5.7
1974 5.2 5.4 4.3 6.0 4.8
1975 5.1 5.1 4.1 6.2 5.4
1976 5.1 5.2 4.1 6.2 4.9
1977 5.1 5.3 4.3 5.9 5.0
1978 5.1 5.2 4.1 6.5 4.7
1979 5.2 5.3 4.3 6.8 5.0
1980 4.9 4.9 4.2 5.8 6.9
1981 4.9 5.0 4.3 5.8 7.3
1982 4.9 4.9 4.4 6.0 6.6
1983 5.0 5.1 4.4 5.7 6.5
1984 4.8 4.8 4.5 5.5 5.9
1985 4.9 4.9 4.4 5.8 5.0
1986 4.6 4.6 4.4 5.1 5.7
1987 4.7 4.7 4.3 5.2 6.3
1988 4.9 4.9 4.7 5.5 5.6
1989 4.9 4.9 4.6 5.5 6.9
1990 4.7 4.7 4.5 4.9 5.7
1991 4.6 4.6 4.4 4.8 4.8
1992 4.7 4.7 4.5 4.9 4.7
1993 4.6 4.6 4.4 4.8 4.6
1994 4.7 4.7 4.7 4.8 4.5
1995 4.8 4.9 4.6 4.3 5.6
1996 4.7 4.7 4.7 4.5 4.1
1997 4.5 4.6 4.4 4.0 3.5
1998 4.6 4.6 4.5 4.3 4.3
1999 4.5 4.5 4.5 4.0 4.1
2000 4.5 4.6 4.6 4.0 3.6
2001 4.3 4.4 4.3 3.8 3.2
2002 4.4 4.5 4.5 3.6 3.9
2003 4.5 4.6 4.5 3.8 3.1
2004 4.4 4.5 4.3 3.6 2.6
2005 4.4 4.5 4.6 3.5 2.7
2006 4.4 4.5 4.4 3.6 2.4
2007 4.5 4.6 4.7 3.5 2.0
2008 4.4 4.6 4.6 3.4 1.8
2009 4.3 4.5 4.6 3.3 1.5
2010 4.4 4.6 4.6 3.1 1.7
2011 4.5 4.7 4.8 3.3 1.6
2012 4.5 4.8 4.6 3.2 1.4
2013 4.6 4.9 4.8 3.3 1.6
2014 4.7 4.9 5.0 3.5 1.9
2015 4.8 5.0 5.1 3.6 2.0
Note: From 1980 onwards the crude death rate is based on Singapore residents only.
Table 12CRUDE DEATH RATES BY ETHNIC GROUP, 1971 - 2015
Year Total Chinese Malays Indians Others
37

1971 948 658 203 70 17
1972 954 677 195 55 27
1973 981 692 217 60 12
1974 728 538 137 40 13
1975 555 376 121 41 17
1976 498 335 103 45 15
1977 474 354 79 31 10
1978 498 341 110 36 11
1979 540 369 108 47 16
1980 483 336 102 37 8
1981 451 305 101 33 12
1982 456 313 97 38 8
1983 382 244 90 39 9
1984 365 243 74 32 16
1985 394 253 100 34 7
1986 359 219 92 36 12
1987 324 194 88 36 6
1988 368 241 97 24 6
1989 315 200 79 27 9
1990 341 216 84 35 6
1991 269 177 60 25 7
1992 245 145 68 27 5
1993 235 148 62 21 4
1994 214 133 53 24 4
1995 195 126 47 12 10
1996 183 108 54 14 7
1997 179 108 47 20 4
1998 183 108 45 23 7
1999 150 93 30 18 9
2000 137 77 42 9 9
2001 100 50 33 12 5
2002 123 70 31 18 4
2003 100 56 22 15 7
2004 82 34 32 12 4
2005 95 54 21 12 8
2006 117 65 30 14 8
2007 94 55 27 9 3
2008 104 52 29 15 8
2009 102 46 36 14 6
2010 100 52 23 15 10
2011 97 52 29 8 8
2012 98 55 23 7 13
2013 94 38 33 13 10
2014 83 47 23 8 5
2015 84 43 27 11 3
Table 13INFANT DEATHS BY ETHNIC GROUP, 1971 - 2015
Year Total Chinese Malays Indians Others
38
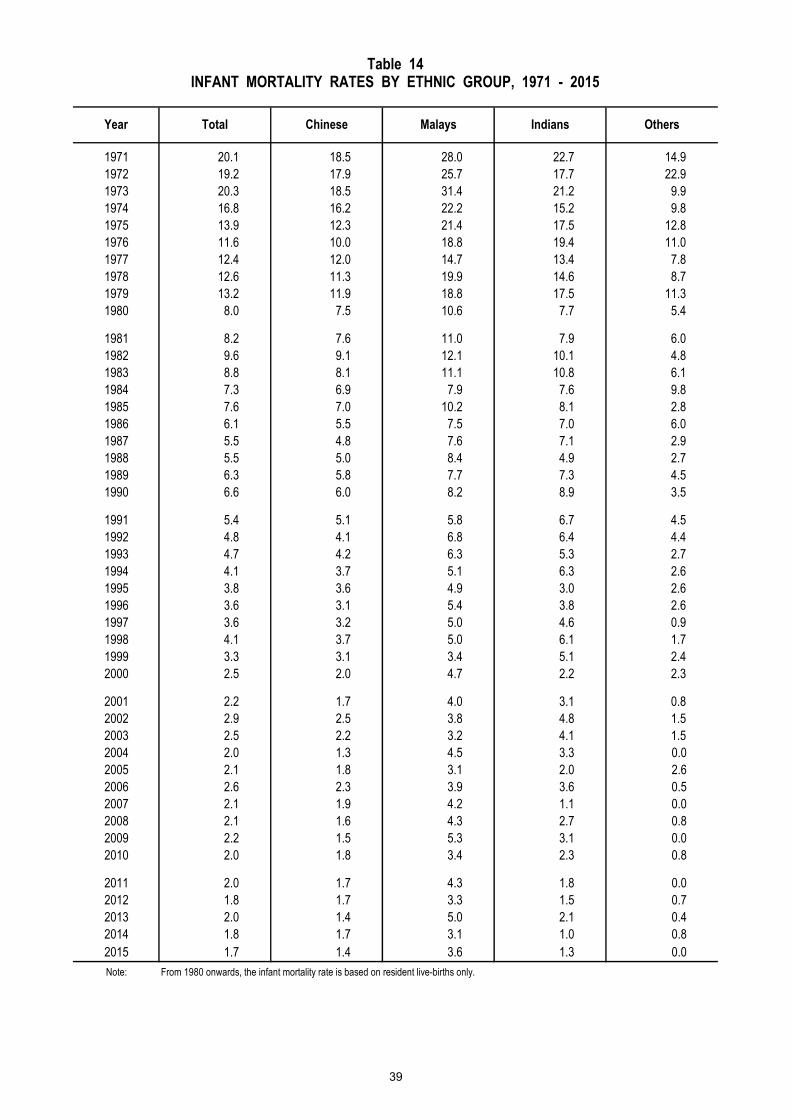
1971 20.1 18.5 28.0 22.7 14.9
1972 19.2 17.9 25.7 17.7 22.9
1973 20.3 18.5 31.4 21.2 9.9
1974 16.8 16.2 22.2 15.2 9.8
1975 13.9 12.3 21.4 17.5 12.8
1976 11.6 10.0 18.8 19.4 11.0
1977 12.4 12.0 14.7 13.4 7.8
1978 12.6 11.3 19.9 14.6 8.7
1979 13.2 11.9 18.8 17.5 11.3
1980 8.0 7.5 10.6 7.7 5.4
1981 8.2 7.6 11.0 7.9 6.0
1982 9.6 9.1 12.1 10.1 4.8
1983 8.8 8.1 11.1 10.8 6.1
1984 7.3 6.9 7.9 7.6 9.8
1985 7.6 7.0 10.2 8.1 2.8
1986 6.1 5.5 7.5 7.0 6.0
1987 5.5 4.8 7.6 7.1 2.9
1988 5.5 5.0 8.4 4.9 2.7
1989 6.3 5.8 7.7 7.3 4.5
1990 6.6 6.0 8.2 8.9 3.5
1991 5.4 5.1 5.8 6.7 4.5
1992 4.8 4.1 6.8 6.4 4.4
1993 4.7 4.2 6.3 5.3 2.7
1994 4.1 3.7 5.1 6.3 2.6
1995 3.8 3.6 4.9 3.0 2.6
1996 3.6 3.1 5.4 3.8 2.6
1997 3.6 3.2 5.0 4.6 0.9
1998 4.1 3.7 5.0 6.1 1.7
1999 3.3 3.1 3.4 5.1 2.4
2000 2.5 2.0 4.7 2.2 2.3
2001 2.2 1.7 4.0 3.1 0.8
2002 2.9 2.5 3.8 4.8 1.5
2003 2.5 2.2 3.2 4.1 1.5
2004 2.0 1.3 4.5 3.3 0.0
2005 2.1 1.8 3.1 2.0 2.6
2006 2.6 2.3 3.9 3.6 0.5
2007 2.1 1.9 4.2 1.1 0.0
2008 2.1 1.6 4.3 2.7 0.8
2009 2.2 1.5 5.3 3.1 0.0
2010 2.0 1.8 3.4 2.3 0.8
2011 2.0 1.7 4.3 1.8 0.0
2012 1.8 1.7 3.3 1.5 0.7
2013 2.0 1.4 5.0 2.1 0.4
2014 1.8 1.7 3.1 1.0 0.8
2015 1.7 1.4 3.6 1.3 0.0
Note: From 1980 onwards, the infant mortality rate is based on resident live-births only.
Table 14INFANT MORTALITY RATES BY ETHNIC GROUP, 1971 - 2015
Year Total Chinese Malays Indians Others
39

Total Males Females Males Females Males Females Males Females Males Females
Total 42,185 21,755 20,430 13,054 12,358 3,608 3,353 2,564 2,331 2,529 2,388
January 3,700 1,920 1,780 1,172 1,133 300 248 233 213 215 186 February 3,027 1,548 1,479 931 875 256 254 168 163 193 187 March 3,441 1,778 1,663 1,062 1,048 267 244 221 177 228 194
April 3,364 1,656 1,708 967 1,003 318 290 186 192 185 223 May 3,421 1,824 1,597 1,059 912 322 294 228 199 215 192 June 3,304 1,720 1,584 1,011 978 295 238 207 187 207 181
July 3,525 1,823 1,702 1,107 1,016 287 271 204 212 225 203 August 3,472 1,783 1,689 1,094 1,015 288 293 208 187 193 194 September 3,786 1,929 1,857 1,151 1,161 339 299 211 204 228 193
October 3,778 1,948 1,830 1,202 1,087 319 322 224 195 203 226 November 3,667 1,885 1,782 1,168 1,092 273 283 237 201 207 206 December 3,700 1,941 1,759 1,130 1,038 344 317 237 201 230 203
Table 15LIVE - BIRTHS BY ETHNIC GROUP OF FATHER AND SEX OF CHILD,
JANUARY - DECEMBER, 2015
MonthTotal Chinese Malays Indians Others
LIVE - BIRTHS BY ETHNIC GROUP OF FATHER AND MOTHER , 2015
Table 16
Ethnic Group of Father TotalEthnic Group of Mother
Chinese Malays Indians Others
Indians
Others
Total
Chinese
25,005 7,33142,185
Malays
76 1,608
4,895 269 598 3,809 219
4,461 5,388
25,412 23,455 273
4,917 1,019 449 147 3,302
6,961 262 6,011 429 259
40

Total 42,185 25,005 7,331 4,461 5,388
Public Sector Hospitals 17,730 7,303 5,545 2,881 2,001
Private Sector Hospitals 24,300 17,651 1,716 1,575 3,358
Residence 106 35 47 3 21
Other Locations 49 16 23 2 8
Total 42,185 25,005 7,331 4,461 5,388
Doctor in Public Sector Hospitals 15,594 6,697 4,419 2,679 1,799
Doctor in Private Sector Hospitals 24,320 17,660 1,715 1,575 3,370
Ambulance Officer / Paramedic 10 3 6 - 1
Midwife or Nurse in Public Sector Hospitals 2,140 608 1,128 202 202
Midwife or Nurse in Private Sector Hospitals 7 3 2 - 2
Delivery without aid of doctor, midwife or nurse 114 34 61 5 14
Unknown - - - - -
Table 17LIVE - BIRTHS BY PLACE OF OCCURRENCE AND ETHNIC GROUP OF MOTHER, 2015
Place of Occurrence TotalEthnic Group of Mother
Chinese Malays Indians Others
Table 18LIVE - BIRTHS BY ATTENDANT AT BIRTH AND ETHNIC GROUP OF MOTHER, 2015
Attendant at BirthMalays Indians Others
TotalEthnic Group of Mother
Chinese
41

Total Males Females Males Females Males Females Males Females Males Females
Total 42,185 21,755 20,430 12,818 12,187 3,801 3,530 2,324 2,137 2,812 2,576
Under 15 9 4 5 2 2 1 2 1 1 - -
15 7 3 4 - 2 3 2 - - - - 16 26 11 15 3 6 6 8 1 1 1 - 17 55 41 14 6 3 28 11 5 - 2 - 18 91 45 46 11 12 25 29 7 1 2 4 19 153 87 66 28 18 47 32 7 9 5 7
20 219 113 106 50 35 38 49 9 17 16 5 21 313 150 163 47 65 75 66 13 21 15 11 22 495 268 227 87 88 108 79 28 28 45 32 23 648 340 308 116 115 137 106 39 39 48 48 24 882 453 429 174 167 157 155 58 55 64 52
25 1,261 678 583 292 238 249 196 61 79 76 70 26 1,710 881 829 423 378 262 272 99 92 97 87 27 2,191 1,073 1,118 549 576 301 299 113 132 110 111 28 2,599 1,376 1,223 761 667 333 287 143 139 139 130 29 2,972 1,496 1,476 852 866 300 280 204 181 140 149
30 3,538 1,786 1,752 1,047 1,056 310 303 217 204 212 189 31 3,629 1,925 1,704 1,180 1,035 277 239 234 201 234 229 32 3,835 2,022 1,813 1,278 1,176 242 223 246 179 256 235 33 3,525 1,783 1,742 1,137 1,151 200 173 211 194 235 224 34 3,176 1,680 1,496 1,048 965 191 191 189 147 252 193
35 2,644 1,351 1,293 914 840 122 130 106 121 209 202 36 2,320 1,237 1,083 848 737 108 92 124 104 157 150 37 1,745 907 838 605 582 90 76 69 64 143 116 38 1,369 697 672 468 455 61 71 49 50 119 96 39 1,024 499 525 329 352 46 66 37 27 87 80
40 719 340 379 218 247 41 37 23 25 58 70 41 447 224 223 158 148 15 26 15 10 36 39 42 278 150 128 103 82 16 12 8 7 23 27 43 148 67 81 39 52 7 12 5 4 16 13 44 83 34 49 22 37 3 3 2 4 7 5
45 23 9 14 7 12 1 1 - - 1 1 46 21 10 11 5 9 1 1 1 - 3 1 47 11 6 5 3 4 - - - 1 3 - 48 3 2 1 2 1 - - - - - - 49 9 2 7 2 6 - 1 - - - -
>=50 7 5 2 4 2 - - - - 1 -
Unknown - - - - - - - - - - -
Table 19LIVE - BIRTHS BY AGE, ETHNIC GROUP OF MOTHER AND SEX OF CHILD, 2015
Mother's
Age (years)
Total Chinese Malays Indians Others
42
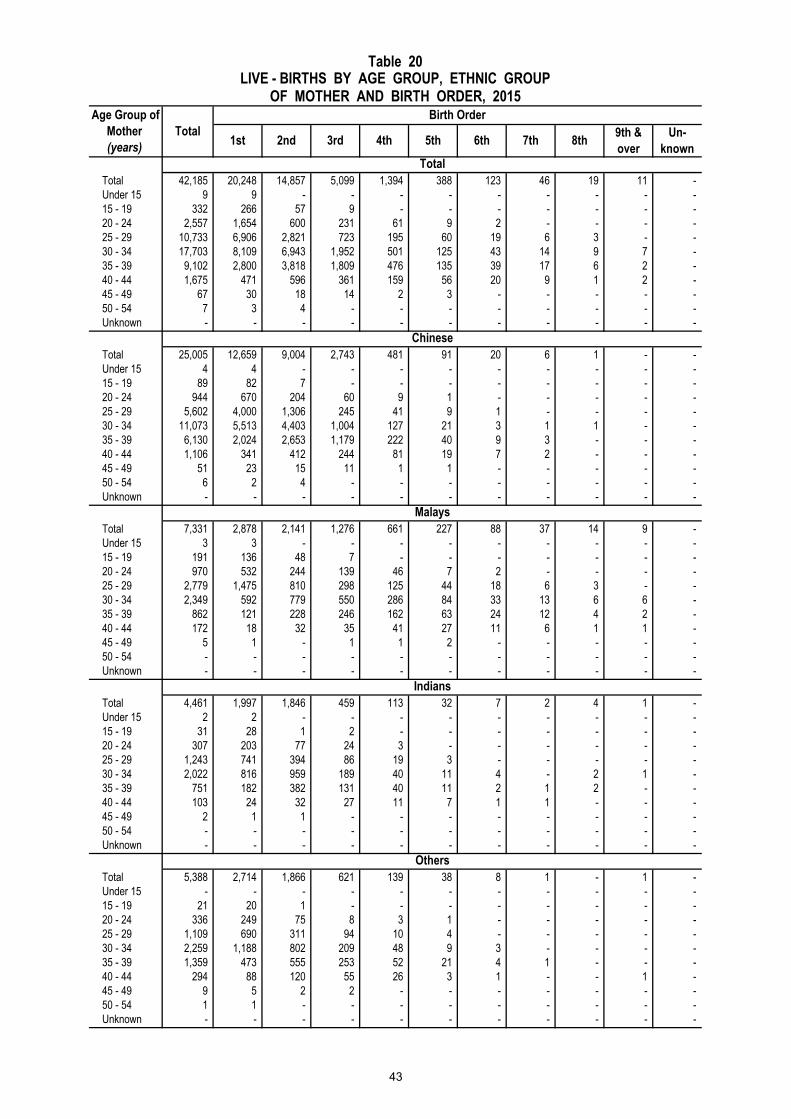
Total 42,185 20,248 14,857 5,099 1,394 388 123 46 19 11 -
Under 15 9 9 - - - - - - - - -
15 - 19 332 266 57 9 - - - - - - -
20 - 24 2,557 1,654 600 231 61 9 2 - - - -
25 - 29 10,733 6,906 2,821 723 195 60 19 6 3 - -
30 - 34 17,703 8,109 6,943 1,952 501 125 43 14 9 7 -
35 - 39 9,102 2,800 3,818 1,809 476 135 39 17 6 2 -
40 - 44 1,675 471 596 361 159 56 20 9 1 2 -
45 - 49 67 30 18 14 2 3 - - - - -
50 - 54 7 3 4 - - - - - - - -
Unknown - - - - - - - - - - -
Total 25,005 12,659 9,004 2,743 481 91 20 6 1 - -
Under 15 4 4 - - - - - - - - -
15 - 19 89 82 7 - - - - - - - -
20 - 24 944 670 204 60 9 1 - - - - -
25 - 29 5,602 4,000 1,306 245 41 9 1 - - - -
30 - 34 11,073 5,513 4,403 1,004 127 21 3 1 1 - -
35 - 39 6,130 2,024 2,653 1,179 222 40 9 3 - - -
40 - 44 1,106 341 412 244 81 19 7 2 - - -
45 - 49 51 23 15 11 1 1 - - - - -
50 - 54 6 2 4 - - - - - - - -
Unknown - - - - - - - - - - -
Total 7,331 2,878 2,141 1,276 661 227 88 37 14 9 -
Under 15 3 3 - - - - - - - - -
15 - 19 191 136 48 7 - - - - - - -
20 - 24 970 532 244 139 46 7 2 - - - -
25 - 29 2,779 1,475 810 298 125 44 18 6 3 - -
30 - 34 2,349 592 779 550 286 84 33 13 6 6 -
35 - 39 862 121 228 246 162 63 24 12 4 2 -
40 - 44 172 18 32 35 41 27 11 6 1 1 -
45 - 49 5 1 - 1 1 2 - - - - -
50 - 54 - - - - - - - - - - -
Unknown - - - - - - - - - - -
Total 4,461 1,997 1,846 459 113 32 7 2 4 1 -
Under 15 2 2 - - - - - - - - -
15 - 19 31 28 1 2 - - - - - - -
20 - 24 307 203 77 24 3 - - - - - -
25 - 29 1,243 741 394 86 19 3 - - - - -
30 - 34 2,022 816 959 189 40 11 4 - 2 1 -
35 - 39 751 182 382 131 40 11 2 1 2 - -
40 - 44 103 24 32 27 11 7 1 1 - - -
45 - 49 2 1 1 - - - - - - - -
50 - 54 - - - - - - - - - - -
Unknown - - - - - - - - - - -
Total 5,388 2,714 1,866 621 139 38 8 1 - 1 -
Under 15 - - - - - - - - - - -
15 - 19 21 20 1 - - - - - - - -
20 - 24 336 249 75 8 3 1 - - - - -
25 - 29 1,109 690 311 94 10 4 - - - - -
30 - 34 2,259 1,188 802 209 48 9 3 - - - -
35 - 39 1,359 473 555 253 52 21 4 1 - - -
40 - 44 294 88 120 55 26 3 1 - - 1 -
45 - 49 9 5 2 2 - - - - - - -
50 - 54 1 1 - - - - - - - - -
Unknown - - - - - - - - - - -
Total
Others
Un-
knownTotal
Chinese
9th &
over
Indians
7th
Malays
1st 2nd
Table 20LIVE - BIRTHS BY AGE GROUP, ETHNIC GROUP
OF MOTHER AND BIRTH ORDER, 2015
6th5th3rd
Birth OrderAge Group of
Mother
(years)4th 8th
43

Total 42,185 20,248 14,857 5,099 1,394 388 123 46 19 11 -
Working 29,688 15,074 10,337 3,324 723 168 43 15 3 1 -
2,978 1,481 1,111 331 49 4 2 - - - -
Professionals 8,221 4,396 2,896 786 120 20 2 1 - - -
13,261 6,954 4,628 1,357 260 42 13 5 1 1 -
Clerical Workers 1,895 737 667 343 107 32 6 3 - - -
3,023 1,364 940 455 173 66 17 6 2 - -
Agricultural & Fishery Workers 1 - 1 - - - - - - - -
91 44 28 15 2 2 - - - - -
20 8 7 3 - 2 - - - - -
20 9 4 1 4 - 2 - - - -
178 81 55 33 8 - 1 - - - -
Not Working 12,497 5,174 4,520 1,775 671 220 80 31 16 10 -
Workers Not Classifiable by
Occupation
Cleaners, Labourers & Related
Workers
9th & over7th
Birth Order
Legislators, Senior Officials &
Managers
4th 5th Unknown
Plant & Machine Operators &
Assemblers
8th6th
Production Craftsmen & Related
Workers
Service Workers, Shop & Market
Sales Workers
Technicians & Associate
Professionals
Table 21LIVE - BIRTHS BY OCCUPATION OF MOTHER AND BIRTH ORDER, 2015
Occupation of Mother Total1st 2nd 3rd
44
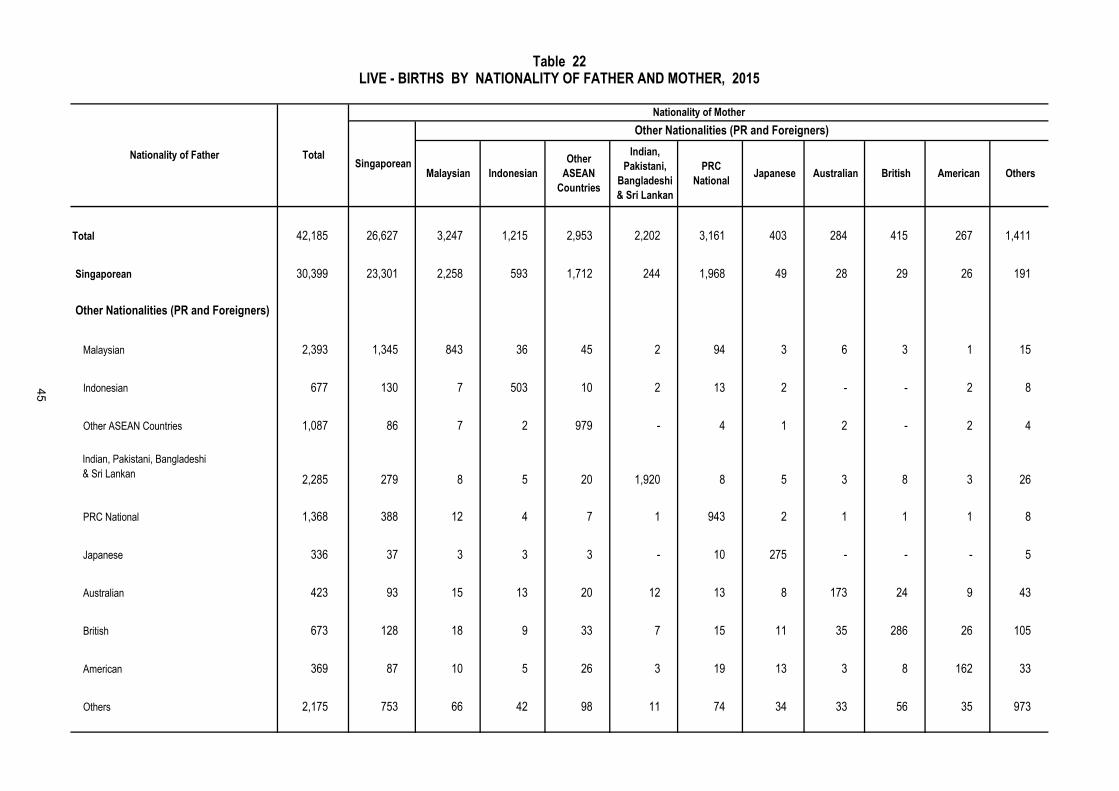
Total 42,185 26,627 3,247 1,215 2,953 2,202 3,161 403 284 415 267 1,411
Singaporean 30,399 23,301 2,258 593 1,712 244 1,968 49 28 29 26 191
Other Nationalities (PR and Foreigners)
Malaysian 2,393 1,345 843 36 45 2 94 3 6 3 1 15
Indonesian 677 130 7 503 10 2 13 2 - - 2 8
Other ASEAN Countries 1,087 86 7 2 979 - 4 1 2 - 2 4
2,285 279 8 5 20 1,920 8 5 3 8 3 26
PRC National 1,368 388 12 4 7 1 943 2 1 1 1 8
Japanese 336 37 3 3 3 - 10 275 - - - 5
Australian 423 93 15 13 20 12 13 8 173 24 9 43
British 673 128 18 9 33 7 15 11 35 286 26 105
American 369 87 10 5 26 3 19 13 3 8 162 33
Others 2,175 753 66 42 98 11 74 34 33 56 35 973
Singaporean
Nationality of Mother
Indian, Pakistani, Bangladeshi
& Sri Lankan
IndonesianMalaysian
Total
Others
Nationality of Father
Other Nationalities (PR and Foreigners)
Table 22LIVE - BIRTHS BY NATIONALITY OF FATHER AND MOTHER, 2015
Japanese Australian
Indian,
Pakistani,
Bangladeshi
& Sri Lankan
PRC
National
Other
ASEAN
Countries
British American
45
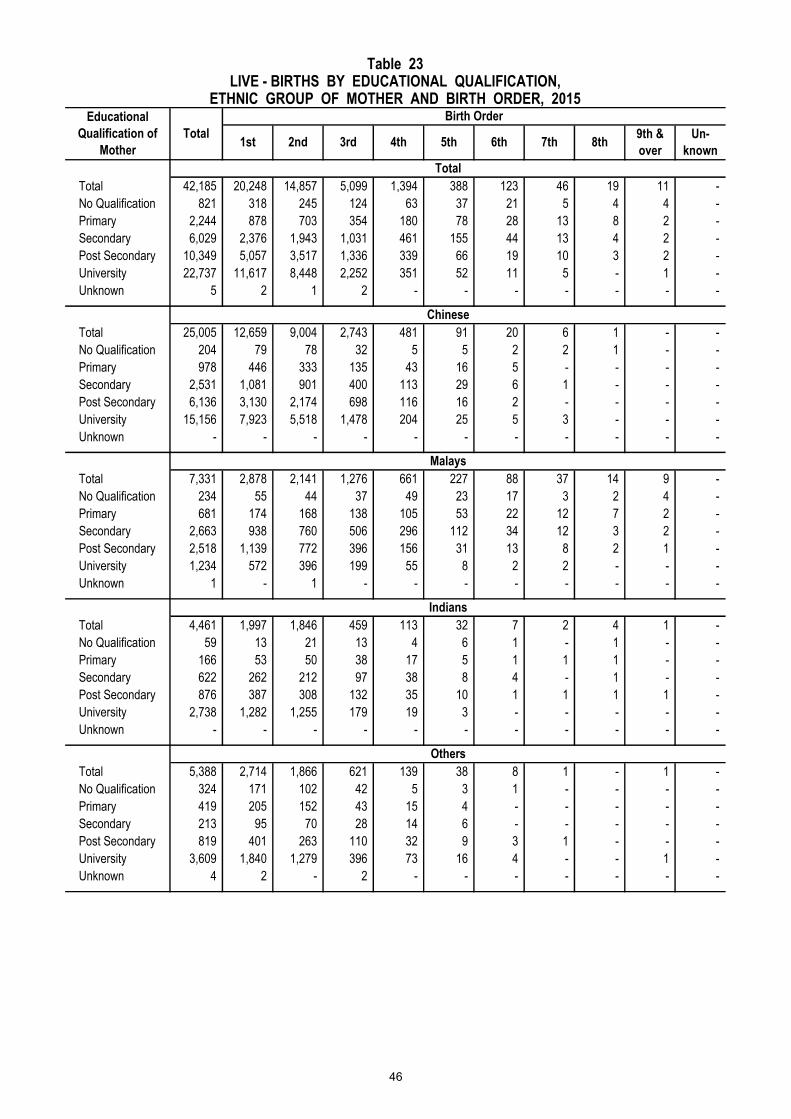
Total 42,185 20,248 14,857 5,099 1,394 388 123 46 19 11 -
No Qualification 821 318 245 124 63 37 21 5 4 4 -
Primary 2,244 878 703 354 180 78 28 13 8 2 -
Secondary 6,029 2,376 1,943 1,031 461 155 44 13 4 2 -
Post Secondary 10,349 5,057 3,517 1,336 339 66 19 10 3 2 -
University 22,737 11,617 8,448 2,252 351 52 11 5 - 1 -
Unknown 5 2 1 2 - - - - - - -
Total 25,005 12,659 9,004 2,743 481 91 20 6 1 - -
No Qualification 204 79 78 32 5 5 2 2 1 - -
Primary 978 446 333 135 43 16 5 - - - -
Secondary 2,531 1,081 901 400 113 29 6 1 - - -
Post Secondary 6,136 3,130 2,174 698 116 16 2 - - - -
University 15,156 7,923 5,518 1,478 204 25 5 3 - - -
Unknown - - - - - - - - - - -
Total 7,331 2,878 2,141 1,276 661 227 88 37 14 9 -
No Qualification 234 55 44 37 49 23 17 3 2 4 -
Primary 681 174 168 138 105 53 22 12 7 2 -
Secondary 2,663 938 760 506 296 112 34 12 3 2 -
Post Secondary 2,518 1,139 772 396 156 31 13 8 2 1 -
University 1,234 572 396 199 55 8 2 2 - - -
Unknown 1 - 1 - - - - - - - -
Total 4,461 1,997 1,846 459 113 32 7 2 4 1 -
No Qualification 59 13 21 13 4 6 1 - 1 - -
Primary 166 53 50 38 17 5 1 1 1 - -
Secondary 622 262 212 97 38 8 4 - 1 - -
Post Secondary 876 387 308 132 35 10 1 1 1 1 -
University 2,738 1,282 1,255 179 19 3 - - - - -
Unknown - - - - - - - - - - -
Total 5,388 2,714 1,866 621 139 38 8 1 - 1 -
No Qualification 324 171 102 42 5 3 1 - - - -
Primary 419 205 152 43 15 4 - - - - -
Secondary 213 95 70 28 14 6 - - - - -
Post Secondary 819 401 263 110 32 9 3 1 - - -
University 3,609 1,840 1,279 396 73 16 4 - - 1 -
Unknown 4 2 - 2 - - - - - - -
Birth Order
Chinese
2nd
Indians
4th
Table 23LIVE - BIRTHS BY EDUCATIONAL QUALIFICATION,
ETHNIC GROUP OF MOTHER AND BIRTH ORDER, 2015Educational
Qualification of
Mother
Total Un-
known
Total
3rd
Malays
9th &
over
Others
5th 6th 7th 8th1st
46

Total 42,185 821 2,244 6,029 10,349 22,737 5
Under 15 9 - 9 - - - -
15 - 19 332 6 126 199 1 - -
20 - 24 2,557 112 411 1,023 865 145 1
25 - 29 10,733 252 641 1,934 3,315 4,590 1
30 - 34 17,703 248 614 1,673 3,957 11,209 2
35 - 39 9,102 157 327 938 1,844 5,835 1
40 - 44 1,675 45 116 250 354 910 -
45 - 49 67 1 - 12 13 41 -
50 - 54 7 - - - - 7 -
Unknown - - - - - - -
Total 25,005 204 978 2,531 6,136 15,156 -
Under 15 4 - 4 - - - -
15 - 19 89 - 22 66 1 - -
20 - 24 944 15 142 328 382 77 -
25 - 29 5,602 54 265 707 1,663 2,913 -
30 - 34 11,073 61 283 720 2,469 7,540 -
35 - 39 6,130 52 191 543 1,335 4,009 -
40 - 44 1,106 21 71 159 275 580 -
45 - 49 51 1 - 8 11 31 -
50 - 54 6 - - - - 6 -
Unknown - - - - - - -
Total 7,331 234 681 2,663 2,518 1,234 1
Under 15 3 - 3 - - - -
15 - 19 191 3 81 107 - - -
20 - 24 970 24 148 537 246 15 -
25 - 29 2,779 53 172 952 1,123 479 -
30 - 34 2,349 85 173 707 861 523 -
35 - 39 862 56 72 289 259 185 1
40 - 44 172 13 32 68 28 31 -
45 - 49 5 - - 3 1 1 -
50 - 54 - - - - - - -
Unknown - - - - - - -
Total 4,461 59 166 622 876 2,738 -
Under 15 2 - 2 - - - -
15 - 19 31 2 14 15 - - -
20 - 24 307 6 35 129 107 30 -
25 - 29 1,243 15 46 203 306 673 -
30 - 34 2,022 15 37 173 328 1,469 -
35 - 39 751 15 24 83 119 510 -
40 - 44 103 6 8 19 15 55 -
45 - 49 2 - - - 1 1 -
50 - 54 - - - - - - -
Unknown - - - - - - -
Total 5,388 324 419 213 819 3,609 4
Under 15 - - - - - - -
15 - 19 21 1 9 11 - - -
20 - 24 336 67 86 29 130 23 1
25 - 29 1,109 130 158 72 223 525 1
30 - 34 2,259 87 121 73 299 1,677 2
35 - 39 1,359 34 40 23 131 1,131 -
40 - 44 294 5 5 4 36 244 -
45 - 49 9 - - 1 - 8 -
50 - 54 1 - - - - 1 -
Unknown - - - - - - -
Unknown
Chinese
Total
Primary SecondaryPost
SecondaryUniversity
Malays
Indians
Others
Table 24LIVE - BIRTHS BY AGE GROUP, ETHNIC GROUP
AND EDUCATIONAL QUALIFICATION OF MOTHER, 2015Age Group of
Mother
(years)
Total
Educational Qualification of Mother
No
Qualification
47

Total 41,548 40,915 623 3 7 - -
Under 15 9 9 - - - - -
15 - 19 327 322 5 - - - -
20 - 24 2,535 2,513 22 - - - -
25 - 29 10,631 10,530 98 1 2 - -
30 - 34 17,439 17,176 260 1 2 - -
35 - 39 8,906 8,710 194 1 1 - -
40 - 44 1,632 1,591 39 - 2 - -
45 - 49 64 61 3 - - - -
50 - 54 5 3 2 - - - -
Unknown - - - - - - -
Type of Birth
Total Number
of Mothers4 Live-births
Triplets Quadruplets
Table 25MOTHERS BY AGE GROUP AND TYPE OF BIRTH, 2015
3 Live-births1 Live-birth &
1 Still-birth2 Live-births
Single-births
TwinsAge Group of
Mother (years) Unknown
48

Total 42,185 9 332 2,557 10,733 17,703 9,102 1,675 67 7 -
Under 1,000 133 - 4 7 33 57 27 5 - - -
1,000 - 1,499 203 1 5 11 47 78 45 15 1 - -
1,500 - 1,999 599 - 7 32 122 236 146 51 3 2 -
2,000 - 2,499 2,957 1 42 210 663 1,178 714 137 10 2 -
2,500 - 2,999 13,499 3 133 933 3,583 5,472 2,843 504 27 1 -
3,000 - 3,499 18,179 4 113 1,037 4,694 7,818 3,789 709 14 1 -
3,500 - 3,999 5,857 - 27 292 1,418 2,521 1,365 221 12 1 -
4,000 - 4,499 704 - 1 34 162 320 159 28 - - -
4,500 - 4,999 52 - - 1 11 22 13 5 - - -
5,000 & over 2 - - - - 1 1 - - - -
Unknown - - - - - - - - - - -
Total 21,755 4 187 1,324 5,504 9,196 4,691 815 29 5 -
Under 1,000 70 - 4 5 17 28 13 3 - - -
1,000 - 1,499 108 1 2 5 27 46 21 6 - - -
1,500 - 1,999 289 - 4 16 60 109 67 30 1 2 -
2,000 - 2,499 1,320 - 21 86 283 536 322 65 5 2 -
2,500 - 2,999 6,183 1 70 444 1,648 2,488 1,308 212 12 - -
3,000 - 3,499 9,731 2 67 574 2,491 4,242 1,999 350 6 - -
3,500 - 3,999 3,545 - 18 168 856 1,524 844 129 5 1 -
4,000 - 4,499 470 - 1 26 112 204 109 18 - - -
4,500 - 4,999 38 - - - 10 18 8 2 - - -
5,000 & over 1 - - - - 1 - - - - -
Unknown - - - - - - - - - - -
Total 20,430 5 145 1,233 5,229 8,507 4,411 860 38 2 -
Under 1,000 63 - - 2 16 29 14 2 - - -
1,000 - 1,499 95 - 3 6 20 32 24 9 1 - -
1,500 - 1,999 310 - 3 16 62 127 79 21 2 - -
2,000 - 2,499 1,637 1 21 124 380 642 392 72 5 - -
2,500 - 2,999 7,316 2 63 489 1,935 2,984 1,535 292 15 1 -
3,000 - 3,499 8,448 2 46 463 2,203 3,576 1,790 359 8 1 -
3,500 - 3,999 2,312 - 9 124 562 997 521 92 7 - -
4,000 - 4,499 234 - - 8 50 116 50 10 - - -
4,500 - 4,999 14 - - 1 1 4 5 3 - - -
5,000 & over 1 - - - - - 1 - - - -
Unknown - - - - - - - - - - -
Males
Females
Birth Weight
(grammes)Total
Age Group of Mother (years)
Under
1515 - 19 20 - 24 25 - 29 30 - 34
Table 26LIVE - BIRTHS BY BIRTH WEIGHT, AGE GROUP OF MOTHER
AND SEX OF CHILD, 2015
Total
35 - 39 40 - 44 45 - 49Un-
known50 - 54
49

Total 40,915 105 137 376 2,424 13,143 18,118 5,854 704 54 -
Under 28 97 79 17 1 - - - - - - -
40 13 24 3 - - - - - - -
31 7 18 6 - - - - - - -
39 4 17 18 - - - - - - -
64 1 20 39 4 - - - - - -
90 1 16 54 16 3 - - - - -
157 - 13 53 79 11 1 - - - -
304 - 8 56 171 59 8 1 1 - -
543 - 1 62 245 191 38 4 2 - -
1,479 - 3 43 401 740 258 32 2 - -
5,838 - - 31 698 2,787 1,934 343 38 7 -
13,160 - - 8 552 4,855 6,061 1,519 155 10 -
11,987 - - 2 205 3,188 6,159 2,191 228 14 -
6,432 - - - 50 1,215 3,373 1,554 225 15 -
601 - - - 2 87 262 193 50 7 -
42 & over 52 - - - 1 6 24 17 3 1 -
Unknown 1 - - - - 1 - - - - -
Total 21,116 57 71 199 1,056 5,992 9,689 3,543 470 39 -
Under 28 58 48 10 - - - - - - - -
20 5 13 2 - - - - - - -
18 3 9 6 - - - - - - -
19 - 9 10 - - - - - - -
46 1 11 31 3 - - - - - -
55 - 7 33 12 3 - - - - -
84 - 5 23 48 8 - - - - -
184 - 4 27 105 43 5 - - - -
312 - 1 36 134 114 24 1 2 - -
804 - 2 19 178 424 160 19 2 - -
3,119 - - 9 277 1,442 1,147 213 28 3 -
6,892 - - 2 205 2,213 3,423 943 100 6 -
6,078 - - 1 81 1,271 3,236 1,329 147 13 -
3,095 - - - 12 439 1,568 910 154 12 -
301 - - - - 31 113 117 35 5 -
42 & over 31 - - - 1 4 13 11 2 - -
Unknown - - - - - - - - - - -
Total 19,799 48 66 177 1,368 7,151 8,429 2,311 234 15 -
Under 28 39 31 7 1 - - - - - - -
20 8 11 1 - - - - - - -
13 4 9 - - - - - - - -
20 4 8 8 - - - - - - -
18 - 9 8 1 - - - - - -
35 1 9 21 4 - - - - - -
73 - 8 30 31 3 1 - - - -
120 - 4 29 66 16 3 1 1 - -
231 - - 26 111 77 14 3 - - -
675 - 1 24 223 316 98 13 - - -
2,719 - - 22 421 1,345 787 130 10 4 -
6,268 - - 6 347 2,642 2,638 576 55 4 -
5,909 - - 1 124 1,917 2,923 862 81 1 -
3,337 - - - 38 776 1,805 644 71 3 -
300 - - - 2 56 149 76 15 2 -
42 & over 21 - - - - 2 11 6 1 1 -
Unknown 1 - - - - 1 - - - - -
Table 27
Period of
Gestation
(weeks)
Total Under
1,000
1,000 -
1,499
1,500 -
1,999
2,000 -
2,499
4,500 &
over
LIVE - BIRTHS (SINGLE BIRTHS) BY PERIOD OF GESTATION, BIRTH WEIGHTAND SEX OF CHILD, 2015
28
Males
Females
Total
29
30
31
32
33
34
35
36
37
38
39
40
37
38
41
28
29
30
31
32
40
39
40
41
28
29
30
35
Birth Weight (grammes)
3,000 -
3,499
3,500 -
3,999
Un-
known
4,000 -
4,499
31
33
34
35
36
2,500 -
2,999
41
36
37
38
39
32
33
34
50

Total 1,249 28 62 213 526 356 61 3 - - -
Under 28 30 23 7 - - - - - - - -
8 2 6 - - - - - - - -
12 - 12 - - - - - - - -
16 - 13 3 - - - - - - -
20 2 6 12 - - - - - - -
41 1 2 36 2 - - - - - -
48 - 5 34 9 - - - - - -
126 - 8 48 66 4 - - - - -
162 - 3 39 95 24 1 - - - -
308 - - 27 173 91 17 - - - -
384 - - 14 160 188 22 - - - -
90 - - - 21 45 21 3 - - -
4 - - - - 4 - - - - -
- - - - - - - - - - -
- - - - - - - - - - -
42 & over - - - - - - - - - - - Unknown - - - - - - - - - - -
Total 630 13 34 87 261 191 42 2 - - -
Under 28 19 13 6 - - - - - - - -
5 - 5 - - - - - - - -
7 - 7 - - - - - - - -
8 - 5 3 - - - - - - -
6 - - 6 - - - - - - -
15 - 2 13 - - - - - - -
26 - 3 19 4 - - - - - -
64 - 6 17 39 2 - - - - -
77 - - 12 47 18 - - - - -
156 - - 12 81 51 12 - - - -
197 - - 5 77 101 14 - - - -
48 - - - 13 17 16 2 - - -
2 - - - - 2 - - - - -
- - - - - - - - - - -
- - - - - - - - - - -
42 & over - - - - - - - - - - -
Unknown - - - - - - - - - - -
Total 619 15 28 126 265 165 19 1 - - -
Under 28 11 10 1 - - - - - - - -
3 2 1 - - - - - - - -
5 - 5 - - - - - - - -
8 - 8 - - - - - - - -
14 2 6 6 - - - - - - -
26 1 - 23 2 - - - - - -
22 - 2 15 5 - - - - - -
62 - 2 31 27 2 - - - - -
85 - 3 27 48 6 1 - - - -
152 - - 15 92 40 5 - - - -
187 - - 9 83 87 8 - - - -
42 - - - 8 28 5 1 - - -
2 - - - - 2 - - - - -
- - - - - - - - - - -
- - - - - - - - - - -
42 & over - - - - - - - - - - -
Unknown - - - - - - - - - - -
2,500 -
2,999
41
36
37
38
39
32
33
34
35
Birth Weight (grammes)
3,000 -
3,499
3,500 -
3,999
Un-
known
4,000 -
4,499
31
33
34
35
36
40
39
40
41
28
29
30
37
38
41
28
29
30
31
32
35
36
37
38
39
40
28
Males
Females
Total
29
30
31
32
33
34
Table 28
Period of
Gestation
(weeks)
Total Under
1,000
1,000 -
1,499
1,500 -
1,999
2,000 -
2,499
4,500 &
over
LIVE - BIRTHS (TWIN BIRTHS) BY PERIOD OF GESTATION, BIRTH WEIGHTAND SEX OF CHILD, 2015
51

Total Males Females Males Females Males Females Males Females Males Females
Total 90 42 48 20 24 12 12 4 9 6 3
January 9 3 6 3 3 - 1 - 2 - - February 7 2 5 - 3 2 1 - 1 - - March 8 3 5 - 3 2 1 - - 1 1
April 12 6 6 2 3 1 1 1 2 2 - May 2 2 - 2 - - - - - - - June 10 4 6 - 4 2 2 2 - - -
July 7 3 4 2 3 - 1 1 - - - August 8 5 3 1 1 3 - - - 1 2 September 7 5 2 5 1 - 1 - - - -
October 7 1 6 1 2 - 3 - 1 - - November 6 4 2 2 - 1 1 - 1 1 - December 7 4 3 2 1 1 - - 2 1 -
Total Males Females Males Females Males Females Males Females Males Females
Total 90 42 48 20 24 12 12 4 9 6 3
Unknown - - - - - - - - - - -
-
-
1
-
- - - -
- -
-
-
-
1 1
Delivery without aid of
Doctor, Midwife or Nurse - - - - -
- -
Ambulance Officer /
Paramedic - - - -
Midwife or Nurse in Private
Sector Hospitals - -
3 3
- - - -
-
-
2 1
- - -
8 2
Midwife or Nurse in Public
Sector Hospitals 13 6 7 1
12 4
Doctor in Private Sector
Hospitals 35 18 17 10 3 2 1 3
5 2 2
Doctor in Public Sector
Hospitals 42 18 24 9 9 5
Table 30
STILL - BIRTHS BY ATTENDANT AT BIRTH,
ETHNIC GROUP OF MOTHER AND SEX OF CHILD, 2015
Attendant at BirthTotal Chinese Malays Indians Others
Table 29STILL - BIRTHS BY ETHNIC GROUP OF MOTHER AND SEX OF CHILD,
JANUARY - DECEMBER, 2015
MonthTotal Chinese Malays Indians Others
52

T M F M F M F M F M F M F M F M F M F M F
Total 90 42 48 - - 2 - 1 5 14 14 13 18 9 8 3 3 - - - -
Under 1,000 11 1 10 - - - - 1 1 - 2 - 4 - 2 - 1 - - - -
1,000-1,499 18 10 8 - - - - - 1 2 2 5 2 1 2 2 1 - - - -
1,500-1,999 15 11 4 - - 1 - - 1 5 1 3 1 2 - - 1 - - - -
2,000-2,499 18 7 11 - - - - - 1 3 4 2 3 2 3 - - - - - -
2,500-2,999 18 7 11 - - 1 - - 1 3 3 2 6 1 1 - - - - - -
3,000-3,499 7 4 3 - - - - - - - 1 1 2 3 - - - - - - -
3,500-3,999 2 1 1 - - - - - - - 1 - - - - 1 - - - - -
4,000 & over 1 1 - - - - - - - 1 - - - - - - - - - - -
Unknown - - - - - - - - - - - - - - - - - - - - -
--
9
6
3
-
13
9
4
-
24
17
622
- 1
-- -
44
22
90
54
35
1
Other Locations
Private Sector Hospitals
Residence
Chinese Malays Indians Others
Total
Public Sector Hospitals
30-34 35-39 40-44 45-49 50-54
Table 31STILL - BIRTHS BY PLACE OF OCCURRENCE AND
ETHNIC GROUP OF MOTHER, 2015Place of Occurrence Total
Table 32
STILL - BIRTHS BY BIRTH WEIGHT,
AGE GROUP OF MOTHER AND SEX OF CHILD, 2015
Birth Weight
(grammes)
TotalAge Group of Mother (years)
Under 15 15-19 20-24 25-29
53

Total 90 11 18 15 18 18 7 2 1 -
28 6 4 2 - - - - - - - 29 6 3 3 - - - - - - - 30 6 2 4 - - - - - - - 31 6 1 5 - - - - - - - 32 7 - 1 4 1 1 - - - - 33 5 - 2 3 - - - - - - 34 9 - - 4 3 2 - - - - 35 4 - - - 2 2 - - - - 36 8 - - - 5 2 1 - - - 37 10 1 1 2 1 3 1 1 - - 38 11 - - 1 2 5 3 - - - 39 8 - - - 3 1 2 1 1 - 40 3 - - - 1 2 - - - - 41 - - - - - - - - - -
42 & over - - - - - - - - - - Unknown 1 - - 1 - - - - - -
Total 42 1 10 11 7 7 4 1 1 -
28 1 1 - - - - - - - - 29 2 - 2 - - - - - - - 30 2 - 2 - - - - - - - 31 2 - 2 - - - - - - - 32 5 - 1 3 - 1 - - - - 33 4 - 2 2 - - - - - - 34 6 - - 4 1 1 - - - - 35 1 - - - - 1 - - - - 36 2 - - - 2 - - - - - 37 6 - 1 1 1 2 1 - - - 38 4 - - 1 - 1 2 - - - 39 5 - - - 2 - 1 1 1 - 40 2 - - - 1 1 - - - - 41 - - - - - - - - - -
42 & over - - - - - - - - - - Unknown - - - - - - - - - -
Total 48 10 8 4 11 11 3 1 - -
28 5 3 2 - - - - - - - 29 4 3 1 - - - - - - - 30 4 2 2 - - - - - - - 31 4 1 3 - - - - - - - 32 2 - - 1 1 - - - - - 33 1 - - 1 - - - - - - 34 3 - - - 2 1 - - - - 35 3 - - - 2 1 - - - - 36 6 - - - 3 2 1 - - - 37 4 1 - 1 - 1 - 1 - - 38 7 - - - 2 4 1 - - - 39 3 - - - 1 1 1 - - - 40 1 - - - - 1 - - - - 41 - - - - - - - - - -
42 & over - - - - - - - - - - Unknown 1 - - 1 - - - - - -
Table 33STILL - BIRTHS BY PERIOD OF GESTATION, BIRTH WEIGHT
AND SEX OF CHILD, 2015
Unknown
Period of
Gestation
(weeks)
1,000-
1,499
1,500-
1,999
2,000-
2,499
Females
Males
Total
2,500-
2,999
3,000-
3,499
3,500-
3,999
4000 &
Over
Total
Birth Weight (grammes)
Under
1,000
54

Total Males Females Males Females Males Females Males Females Males Females
Total 19,862 10,789 9,073 8,024 6,932 1,521 1,348 951 594 293 199
January 1,701 919 782 679 608 136 113 74 45 30 16 February 1,481 848 633 631 501 120 80 75 42 22 10 March 1,680 925 755 704 580 125 106 75 51 21 18
April 1,589 853 736 644 567 114 105 71 47 24 17 May 1,725 902 823 661 621 148 123 72 59 21 20 June 1,827 957 870 723 667 124 143 79 45 31 15
July 1,781 965 816 714 623 139 125 88 50 24 18 August 1,689 946 743 702 573 143 113 78 42 23 15 September 1,554 848 706 645 534 103 102 79 53 21 17
October 1,625 878 747 619 556 140 113 94 61 25 17 November 1,589 899 690 674 505 114 109 81 57 30 19 December 1,621 849 772 628 597 115 116 85 42 21 17
80
264
Table 35
DEATHS BY PLACE OF OCCURRENCE AND ETHNIC GROUP, 2015
492
42
85
8
11
2
32 32
3,756 894
302
324
115
750
47
1,5452,869
982
46
8
3858
25
66
1,747
742
550
14,956
8,720
447
5,059
346
822
635
Total
Public Sector Hospitals
Private Sector Hospitals
Nursing Homes & Clinics
Public & Charitable Institutions
Licensed Sick Receiving Houses
Residence
Other Locations
19,862
11,713
639
337
Malays Indians OthersPlace of Occurrence Total
Ethnic Group
Chinese
Table 34DEATHS BY ETHNIC GROUP AND SEX,
JANUARY - DECEMBER 2015
MonthTotal Chinese Malays Indians Others
55

Total Males Females Males Females Males Females Males Females Males Females
Total 84 56 28 31 12 14 13 9 2 2 1
January 5 4 1 2 - 1 1 1 - - - February 7 5 2 3 1 1 - - - 1 1 March 4 2 2 1 1 1 1 - - - -
April 7 6 1 1 1 3 - 2 - - - May 9 3 6 2 1 1 5 - - - - June 10 6 4 5 3 - 1 1 - - -
July 8 4 4 3 1 1 2 - 1 - - August 4 3 1 3 1 - - - - - - September 11 8 3 5 1 2 2 1 - - -
October 11 9 2 3 1 4 1 2 - - - November 2 2 - 2 - - - - - - - December 6 4 2 1 1 - - 2 1 1 -
Other Locations - - - -
Table 37
INFANT DEATHS BY PLACE OF OCCURRENCE AND ETHNIC GROUP, 2015
-
-Residence 3 2 1 -
Nursing Homes & Clinics - - - - -
-
3
Private Sector Hospitals 7 5 1 1
Public Sector Hospitals 74 36 25 10
Total 84 43 27 11 3
Place of Occurrence
Indians Others
TotalEthnic Group
Chinese Malays Indians Others
Table 36INFANT DEATHS BY ETHNIC GROUP AND SEX,
MonthTotal Chinese Malays
JANUARY - DECEMBER 2015
56

Total M F M F M F M F M F
Total Infant Deaths 84 56 28 31 12 14 13 9 2 2 1
Under 28 days (Neo-Natal Deaths) 41 25 16 16 7 4 8 4 1 1 -
Under 1 day 10 5 5 3 - 1 5 1 - - -
1 day and under 2 days 5 5 - 3 - 1 - 1 - - -
2 days and under 3 days 3 2 1 1 1 - - 1 - - -
3 days and under 4 days 7 3 4 1 4 - - 1 - 1 -
4 days and under 5 days 1 - 1 - - - 1 - - - -
5 days and under 6 days 1 1 - 1 - - - - - - -
6 days and under 7 days 1 1 - 1 - - - - - - -
7 days and under 14 days 4 2 2 2 - - 1 - 1 - -
14 days and under 21 days 4 2 2 2 1 - 1 - - - -
21 days and under 28 days 5 4 1 2 1 2 - - - - -
28 days and under 2 months 13 11 2 7 1 4 - - - - 1
2 months and under 3 months 11 7 4 2 1 2 3 3 - - -
3 months and under 4 months 4 2 2 - 1 1 1 - - 1 -
4 months and under 5 months 5 5 - 4 - - - 1 - - -
5 months and under 6 months 2 1 1 - - - - 1 1 - -
6 months and under 7 months 2 1 1 - 1 1 - - - - -
7 months and under 8 months 3 2 1 - 1 2 - - - - -
8 months and under 9 months 1 1 - 1 - - - - - - -
9 months and under 10 months 2 1 1 1 - - 1 - - - -
10 months and under 11 months - - - - - - - - - - -
11 months and under 1 year - - - - - - - - - - -
Table 38INFANT DEATHS BY AGE, ETHNIC GROUP AND SEX, 2015
AgeTotal Chinese Malays Indians Others
57

Total M F M F M F M F M F
Total 19,862 10,789 9,073 8,024 6,932 1,521 1,348 951 594 293 199
Under 1 84 56 28 31 12 14 13 9 2 2 1
1 & under 2 11 8 3 4 1 2 - 1 1 1 1
2 & under 3 9 9 - 7 - - - 2 - - -
3 & under 4 6 2 4 2 4 - - - - - -
4 & under 5 6 4 2 3 1 1 1 - - - -
5 - 9 12 10 2 5 2 2 - 2 - 1 -
10 - 14 31 15 16 7 9 5 2 1 1 2 4
15 - 19 61 37 24 17 18 7 - 8 4 5 2
20 - 24 120 79 41 24 21 12 8 41 5 2 7
25 - 29 146 100 46 49 23 11 10 35 5 5 8
30 - 34 173 109 64 57 40 19 13 25 5 8 6
35 - 39 219 145 74 83 38 25 19 29 8 8 9
40 - 44 349 227 122 139 78 41 20 31 16 16 8
45 - 49 522 327 195 206 132 52 38 49 14 20 11
50 - 54 845 529 316 336 205 113 74 61 26 19 11
55 - 59 1,310 843 467 565 292 157 123 98 39 23 13
60 - 64 1,659 1,067 592 777 399 161 136 102 47 27 10
65 - 69 2,002 1,302 700 966 489 202 139 99 61 35 11
70 - 74 1,993 1,213 780 978 570 139 143 68 57 28 10
75 - 79 2,686 1,539 1,147 1,226 849 195 191 86 93 32 14
80 - 84 2,748 1,370 1,378 1,099 1,079 166 183 79 88 26 28
85 & over 4,870 1,798 3,072 1,443 2,670 197 235 125 122 33 45
Unknown - - - - - - - - - - -
Table 39DEATHS BY AGE GROUP, ETHNIC GROUP & SEX, 2015
Age Group
(years)
Total Chinese Malays Indians Others
58
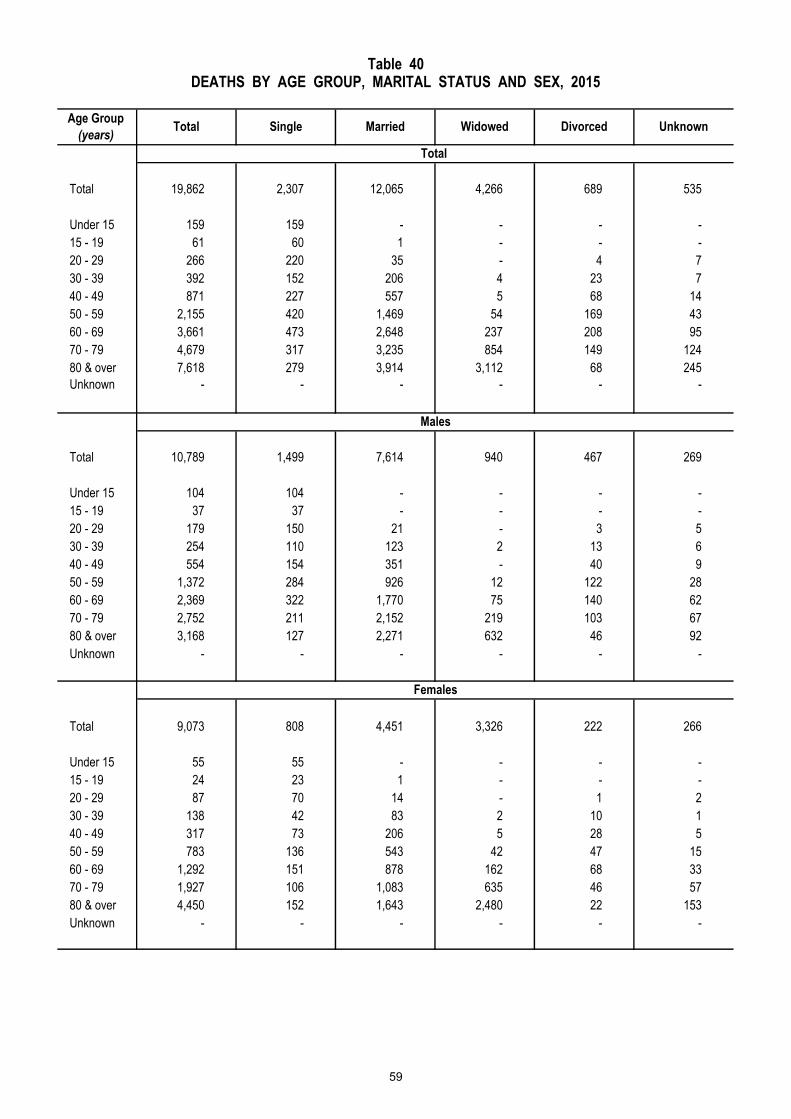
Total 19,862 2,307 12,065 4,266 689 535
Under 15 159 159 - - - -
15 - 19 61 60 1 - - -
20 - 29 266 220 35 - 4 7
30 - 39 392 152 206 4 23 7
40 - 49 871 227 557 5 68 14
50 - 59 2,155 420 1,469 54 169 43
60 - 69 3,661 473 2,648 237 208 95
70 - 79 4,679 317 3,235 854 149 124
80 & over 7,618 279 3,914 3,112 68 245
Unknown - - - - - -
Total 10,789 1,499 7,614 940 467 269
Under 15 104 104 - - - -
15 - 19 37 37 - - - -
20 - 29 179 150 21 - 3 5
30 - 39 254 110 123 2 13 6
40 - 49 554 154 351 - 40 9
50 - 59 1,372 284 926 12 122 28
60 - 69 2,369 322 1,770 75 140 62
70 - 79 2,752 211 2,152 219 103 67
80 & over 3,168 127 2,271 632 46 92
Unknown - - - - - -
Total 9,073 808 4,451 3,326 222 266
Under 15 55 55 - - - -
15 - 19 24 23 1 - - -
20 - 29 87 70 14 - 1 2
30 - 39 138 42 83 2 10 1
40 - 49 317 73 206 5 28 5
50 - 59 783 136 543 42 47 15
60 - 69 1,292 151 878 162 68 33
70 - 79 1,927 106 1,083 635 46 57
80 & over 4,450 152 1,643 2,480 22 153
Unknown - - - - - -
Table 40DEATHS BY AGE GROUP, MARITAL STATUS AND SEX, 2015
Age Group
(years)Total Single Married Widowed Divorced Unknown
Total
Males
Females
59

Total 19,862 131 171 202 65 505 2 726 30 18,030
Under 15 159 - - - - - - - - 159
15 - 19 61 - - - - - - 2 3 56
20 - 29 266 2 13 20 5 28 1 76 9 112
30 - 39 392 15 39 37 9 48 - 85 7 152
40 - 49 871 36 42 45 12 104 - 124 5 503
50 - 59 2,155 46 36 64 25 164 1 227 6 1,586
60 - 69 3,661 29 31 34 11 126 - 169 - 3,261
70 - 79 4,679 3 10 2 3 35 - 43 - 4,583
80 & over 7,618 - - - - - - - - 7,618
Unknown - - - - - - - - - -
Total 10,789 112 129 165 15 440 1 636 26 9,265
Under 15 104 - - - - - - - - 104
15 - 19 37 - - - - - - 2 3 32
20 - 29 179 2 11 17 2 18 - 60 8 61
30 - 39 254 11 26 27 2 40 - 72 5 71
40 - 49 554 31 28 35 1 90 - 107 5 257
50 - 59 1,372 41 29 53 5 147 1 208 5 883
60 - 69 2,369 24 26 31 2 112 - 154 - 2,020
70 - 79 2,752 3 9 2 3 33 - 33 - 2,669
80 & over 3,168 - - - - - - - - 3,168
Unknown - - - - - - - - - -
Total 9,073 19 42 37 50 65 1 90 4 8,765
Under 15 55 - - - - - - - - 55
15 - 19 24 - - - - - - - - 24
20 - 29 87 - 2 3 3 10 1 16 1 51
30 - 39 138 4 13 10 7 8 - 13 2 81
40 - 49 317 5 14 10 11 14 - 17 - 246
50 - 59 783 5 7 11 20 17 - 19 1 703
60 - 69 1,292 5 5 3 9 14 - 15 - 1,241
70 - 79 1,927 - 1 - - 2 - 10 - 1,914
80 & over 4,450 - - - - - - - - 4,450
Unknown - - - - - - - - - -
Males
Females
Total
Table 41DEATHS BY AGE GROUP, OCCUPATION AND SEX, 2015
Not Working
Workers Not
Classifiable
By
Occupation
Production
Craftsmen &
Other Related
Workers
Technicians
& Associate
Professionals
Clerical
Workers
Service
Workers,
Shop &
Market Sales
Workers
Agricultural &
Fishery
Workers
Age Group
(years)Total
Legislators,
Senior
Officials &
Managers
Professionals
60

Doctors Coroners
All Causes 19,862 18,919 943
1-001 Certain infectious and parasitic diseases A00-B99 194 194 -
1-002 Cholera A00 - - -
1-003 Diarrhoea and gastroenteritis of presumed infectious origin A09 36 36 -
1-004 Other intestinal infectious diseases A01-A08 4 4 -
1-005 Respiratory tuberculosis A15-A16 38 38 -
1-006 Other tuberculosis A17-19 3 3 -
1-007 Plague A20 - - -
1-008 Tetanus A33-A35 - - -
1-009 Diphtheria A36 - - -
1-010 Whooping cough A37 1 1 -
1-011 Meningococcal infection A39 - - -
1-012 Septicaemia A40-A41 41 41 -
1-013 Infections with a predominantly sexual mode of transmission A50-64 - - -
1-014 Acute poliomyelitis A80 - - -
1-015 Rabies A82 - - -
1-016 Yellow fever A95 - - -
1-017 Other arthropod-borne viral fevers and viral haemorrhagic fevers A90-A94,A96-A99 6 6 -
1-018 Measles B05 - - -
1-019 Viral hepatitis B15-B19 4 4 -
1-020 Human immunodeficiency virus [HIV] disease B20-B24 35 35 -
1-021 Malaria B50-B54 1 1 -
1-022 Leishmaniasis B55 - - -
1-023 Trypanosomiasis B56-B57 - - -
1-024 Schistosomiasis B65 - - -
1-025 Remainder of certain infectious and parasitic diseases A21-A32,A38,A42-A49,A65-
A79,A81,A83-A89,B00-B04,B06-
B09,B25-B49,B58-B64,B66-
B94,B99
25 25 -
1-026 Neoplasms C00-D48 5,986 5,986 -
1-027 Malignant neoplasm of lip, oral cavity and pharynx C00-C14 223 223 -
1-028 Malignant neoplasm of oesophagus C15 111 111 -
1-029 Malignant neoplasm of stomach C16 319 319 -
1-030 Malignant neoplasm of colon, rectum and anus C18-C21 878 878 -
1-031 Malignant neoplasm of liver and intrahepatic bile ducts C22 563 563 -
1-032 Malignant neoplasm of pancreas C25 378 378 -
1-033 Malignant neoplasm of larynx C32 22 22 -
1-034 Malignant neoplasm of trachea, bronchus and lung C33-C34 1,313 1,313 -
1-035 Malignant melanoma of skin C43 15 15 -
1-036 Malignant neoplasm of breast C50 450 450 -
1-037 Malignant neoplasm of cervix uteri C53 78 78 -
1-038 Malignant neoplasm of other and unspecified parts of uterus C54-C55 88 88 -
1-039 Malignant neoplasm of ovary C56 133 133 -
1-040 Malignant neoplasm of prostate C61 179 179 -
1-041 Malignant neoplasm of bladder C67 90 90 -
1-042 Malignant neoplasm of meninges, brain and other parts of central
nervous system
C70-C72 83 83 -
1-043 Non-Hodgkin's lymphoma C82-C85 191 191 -
1-044 Multiple myeloma and malignant plasma cell neoplasms C90 47 47 -
1-045 Leukaemia C91-C95 146 146 -
1-046 Remainder of malignant neoplasms
C17,C23-C24,C26-C31,C37-
C41,C44-C49,C51-C52,C57-
C60,C62-C66,C68-C69,C73-
C81,C88,C96-C97
596 596 -
1-047 Remainder of neoplasms D00-D48 83 83 -
Note: The causes of death are adapted from the Mortality Tabulation List of the International Classification of Diseases - Tenth Revision.
Table 42
DEATHS BY CAUSE AND TYPE OF CERTIFICATION, 2015
Listing Description of Cause of Death ICD 10 CodeCertified By
Total
61

Doctors Coroners
1-048 Diseases of the blood and blood-forming organs and certain disorders
involving the immune mechanismD50-D89
10 10 -
1-049 Anaemias D50-D64 5 5 -
1-050 Remainder of diseases of the blood and blood-forming organs and certain
disorders involving the immune mechanismD65-D89 5 5 -
1-051 Endocrine, nutritional and metabolic diseases E00-E88 270 270 -
1-052 Diabetes mellitus E10-E14 250 250 -
1-053 Malnutrition E40-E46 - - -
1-054 Remainder of endocrine, nutritional and metabolic diseases E00-E07,E15-E34,E50-E88 20 20 -
1-055 Mental and behavioural disorders F01-F99 1 1 -
1-056 Mental and behavioural disorders due to psychoactive substance use F10-F19 - - -
1-057 Remainder of mental and behavioural disorders F01-F09,F20-F99 1 1 -
1-058 Diseases of the nervous system G00-G98 206 206 -
1-059 Meningitis G00,G03 6 6 -
1-060 Alzheimer's disease G30 2 2 -
1-061 Remainder of diseases of the nervous system G04-G25,G31-G98 198 198 -
1-062 Diseases of the eye and adnexa H00-H57 - - -
1-063 Diseases of the ear and mastoid process H60-H93 4 4 -
1-064 Diseases of the circulatory system I00-I99 6,101 6,101 -
1-065 Acute rheumatic fever and chronic rheumatic heart diseases I00-I09 24 24 -
1-066 Hypertensive diseases I10-I13 778 778 -
1-067 Ischaemic heart diseases I20-I25 3,313 3,313 -
1-068 Other heart diseases I26-I51 419 419 -
1-069 Cerebrovascular diseases I60-I69 1,357 1,357 -
1-070 Atherosclerosis I70 18 18 -
1-071 Remainder of diseases of the circulatory system I71-I99 192 192 -
1-072 Diseases of the respiratory system J00-J98 4,417 4,417 -
1-073 Influenza J09-J11 2 2 -
1-074 Pneumonia J12-J18 3,859 3,859 -
1-075 Other acute lower respiratory infections J20-J22 2 2 -
1-076 Chronic lower respiratory diseases J40-J47 455 455 -
1-077 Remainder of diseases of the respiratory system J00-J06,J30-J39,J60-J98 99 99 -
1-078 Diseases of the digestive system K00-K92 477 477 -
1-079 Gastric and duodenal ulcer K25-K27 37 37 -
1-080 Diseases of the liver K70-K76 187 187 -
1-081 Remainder of diseases of the digestive system K00-K22,K28-K66,K80-K92 253 253 -
1-082 Diseases of the skin and subcutaneous tissue L00-L98 111 111 -
1-083 Diseases of the musculoskeletal system and connective tissue M00-M99 90 90 -
1-084 Diseases of the genitourinary system N00-N98 928 928 -
1-085 Glomerular and renal tubulo-interstitial diseases N00-N15 20 20 -
1-086 Remainder of diseases of the genitourinary system N17-N98 908 908 -
1-087 Pregnancy, childbirth and the puerperium O00-O99 3 3 -
1-088 Pregnancy with abortive outcome O00-O07 1 1 -
1-089 Other direct obstetric deaths O10-O92 2 2 -
1-090 Indirect obstetric deaths O98-O99 - - -
1-091 Remainder of pregnancy, childbirth and the puerperium O95-O97 - - -
1-092 Certain conditions originating in the perinatal period P00-P96 30 30 -
1-093Congenital malformations, deformations and chromosomal
abnormalitiesQ00-Q99 62 62 -
1-094 Symptoms, signs and abnormal clinical and laboratory findings, not
elsewhere classifiedR00-R99 77 29 48
1-095 External causes of morbidity and mortality V01-Y89 895 - 895
1-096 Transport accidents V01-V99 168 - 168
1-097 Falls W00-W19 156 - 156
1-098 Accidental drowning and submersion W65-W74 17 - 17
1-099 Exposure to smoke, fire and flames X00-X09 12 - 12
1-100 Accidental poisoning by and exposure to noxious substances X40-X49 21 - 21
1-101 Intentional self-harm X60-X84 409 - 409
1-102 Assault X85-Y09 17 - 17
1-103 All other external causes W20-W64,W75-W99,X10-X39,X50-
X59,Y10-Y89 95 - 95
Note: The causes of death are adapted from the Mortality Tabulation List of the International Classification of Diseases - Tenth Revision.
Listing Description of Cause of Death ICD 10 Code TotalCertified By
Table 42
DEATHS BY CAUSE AND TYPE OF CERTIFICATION, 2015
62

2013 2014 2015 2013 2014 2015
All Causes 18,938 19,393 19,862 463.22 471.16 477.62
1-001 Certain infectious and parasitic diseases 211 217 194 5.02 5.04 4.59
1-002 Cholera - - - - - -
1-003 Diarrhoea and gastroenteritis of presumed infectious origin 28 28 36 0.65 0.72 0.90
1-004 Other intestinal infectious diseases 4 5 4 0.08 0.13 0.10
1-005 Respiratory tuberculosis 42 52 38 0.99 1.21 0.95
1-006 Other tuberculosis 9 8 3 0.21 0.21 0.05
1-007 Plague - - - - - -
1-008 Tetanus - - - - - -
1-009 Diphtheria - - - - - -
1-010 Whooping cough - - 1 - - 0.03
1-011 Meningococcal infection 1 1 - 0.03 - -
1-012 Septicaemia 47 37 41 1.17 0.90 1.05
1-013 Infections with a predominantly sexual mode of transmission - - - - - -
1-014 Acute poliomyelitis - - - - - -
1-015 Rabies - - - - - -
1-016 Yellow fever - - - - - -
1-017 Other arthropod-borne viral fevers and viral haemorrhagic fevers 8 6 6 0.18 0.13 0.05
1-018 Measles - - - - - -
1-019 Viral hepatitis 9 1 4 0.21 0.03 0.05
1-020 Human immunodeficiency virus [HIV] disease 46 53 35 1.14 1.21 0.82
1-021 Malaria - 1 1 - - -
1-022 Leishmaniasis - - - - - -
1-023 Trypanosomiasis - - - - - -
1-024 Schistosomiasis - - - - - -
1-025 Remainder of certain infectious and parasitic diseases 17 25 25 0.36 0.49 0.59
1-026 Neoplasms 5,849 5,790 5,986 144.64 142.27 145.82
1-027 Malignant neoplasm of lip, oral cavity and pharynx 243 255 223 6.14 6.41 5.51
1-028 Malignant neoplasm of oesophagus 108 93 111 2.68 2.35 2.69
1-029 Malignant neoplasm of stomach 342 311 319 8.37 7.60 7.87
1-030 Malignant neoplasm of colon, rectum and anus 825 809 878 20.81 20.20 21.75
1-031 Malignant neoplasm of liver and intrahepatic bile ducts 545 591 563 13.55 14.42 13.84
1-032 Malignant neoplasm of pancreas 314 309 378 7.59 7.52 9.07
1-033 Malignant neoplasm of larynx 18 36 22 0.42 0.93 0.54
1-034 Malignant neoplasm of trachea, bronchus and lung 1,261 1,277 1,313 31.45 31.67 32.31
1-035 Malignant melanoma of skin 23 24 15 0.55 0.54 0.33
1-036 Malignant neoplasm of breast 475 439 450 11.86 10.64 10.89
1-037 Malignant neoplasm of cervix uteri 72 81 78 1.79 1.99 1.79
1-038 Malignant neoplasm of other and unspecified parts of uterus 80 85 88 1.98 2.14 2.15
1-039 Malignant neoplasm of ovary 129 129 133 3.20 3.31 3.25
1-040 Malignant neoplasm of prostate 183 179 179 4.68 4.47 4.41
1-041 Malignant neoplasm of bladder 63 81 90 1.59 1.99 2.18
1-042 Malignant neoplasm of meninges, brain and other parts of central nervous system70 78 83 1.69 1.94 2.02
1-043 Non-Hodgkin's lymphoma 176 172 191 3.93 4.08 4.48
1-044 Multiple myeloma and malignant plasma cell neoplasms 51 45 47 1.30 1.16 1.02
1-045 Leukaemia 171 155 146 3.85 3.31 3.07
1-046 Remainder of malignant neoplasms 626 552 596 15.45 13.56 14.63
1-047 Remainder of neoplasms 74 89 83 1.77 2.04 2.00 Note: (1) The causes of death are adapted from the Mortality Tabulation List of the International Classification of Diseases - Tenth Revision.
(2) Death rates are computed based on the number of resident deaths over resident population.
Deaths Death Rates
Number Per 100,000 Residents
DEATHS AND DEATH RATES BY CAUSE, 2013 - 2015
Listing Description of Cause of Death
Table 43
63

2013 2014 2015 2013 2014 2015
1-048Diseases of the blood and blood-forming organs and certain disorders involving the
immune mechanism14 23 10 0.31 0.49 0.13
1-049 Anaemias 4 8 5 0.10 0.18 0.10
1-050 Remainder of diseases of the blood and blood-forming organs and certain disorders involving the
immune mechanism10 15 5 0.21 0.31 0.03
1-051 Endocrine, nutritional and metabolic diseases 253 296 270 6.35 7.36 6.69
1-052 Diabetes mellitus 247 277 250 6.24 6.92 6.20
1-053 Malnutrition - - - - - -
1-054 Remainder of endocrine, nutritional and metabolic diseases 6 19 20 0.10 0.44 0.49
1-055 Mental and behavioural disorders 3 1 1 0.08 0.03 0.03
1-056 Mental and behavioural disorders due to psychoactive substance use - - - - - -
1-057 Remainder of mental and behavioural disorders 3 1 1 0.08 0.03 0.03
1-058 Diseases of the nervous system 136 144 206 3.38 3.51 4.87
1-059 Meningitis 1 1 6 0.03 0.03 0.13
1-060 Alzheimer's disease - 1 2 - 0.03 0.05
1-061 Remainder of diseases of the nervous system 135 142 198 3.36 3.46 4.69
1-062 Diseases of the eye and adnexa - - - - - -
1-063 Diseases of the ear and mastoid process 1 - 4 0.03 - 0.10
1-064 Diseases of the circulatory system 5,765 5,987 6,101 140.24 144.78 145.34
1-065 Acute rheumatic fever and chronic rheumatic heart diseases 24 30 24 0.57 0.72 0.56
1-066 Hypertensive diseases 593 697 778 14.67 17.13 18.50
1-067 Ischaemic heart diseases 2,934 3,098 3,313 71.68 74.72 79.41
1-068 Other heart diseases 363 340 419 8.06 7.54 9.35
1-069 Cerebrovascular diseases 1,680 1,620 1,357 41.09 39.71 32.41
1-070 Atherosclerosis 16 18 18 0.42 0.47 0.46
1-071 Remainder of diseases of the circulatory system 155 184 192 3.75 4.50 4.64
1-072 Diseases of the respiratory system 4,061 4,232 4,417 101.90 105.33 110.03
1-073 Influenza 1 3 2 - 0.05 0.03
1-074 Pneumonia 3,512 3,680 3,859 88.33 91.90 96.37
1-075 Other acute lower respiratory infections 1 4 2 0.03 0.05 0.05
1-076 Chronic lower respiratory diseases 435 446 455 10.87 11.11 11.33
1-077 Remainder of diseases of the respiratory system 112 99 99 2.68 2.22 2.25
1-078 Diseases of the digestive system 418 482 477 10.12 11.65 11.43
1-079 Gastric and duodenal ulcer 43 34 37 1.07 0.88 0.90
1-080 Diseases of the liver 171 192 187 4.06 4.47 4.41
1-081 Remainder of diseases of the digestive system 204 256 253 4.99 6.30 6.12
1-082 Diseases of the skin and subcutaneous tissue 115 124 111 2.89 3.05 2.72
1-083 Diseases of the musculoskeletal system and connective tissue 59 81 90 1.53 1.99 2.23
1-084 Diseases of the genitourinary system 967 951 928 24.63 24.00 22.91
1-085 Glomerular and renal tubulo-interstitial diseases 21 16 20 0.47 0.41 0.51
1-086 Remainder of diseases of the genitourinary system 946 935 908 24.16 23.59 22.39
1-087 Pregnancy, childbirth and the puerperium 1 1 3 - - 0.08
1-088 Pregnancy with abortive outcome - 1 1 - - 0.03
1-089 Other direct obstetric deaths 1 - 2 - - 0.05
1-090 Indirect obstetric deaths - - - - - -
1-091 Remainder of pregnancy, childbirth and the puerperium - - - - - -
1-092 Certain conditions originating in the perinatal period 43 42 30 0.81 0.98 0.64
1-093 Congenital malformations, deformations and chromosomal abnormalities 47 50 62 0.99 1.14 1.31
1-094Symptoms, signs and abnormal clinical and laboratory findings, not elsewhere classified 62 63 77 1.40 1.24 1.59
1-095 External causes of morbidity and mortality 933 909 895 18.91 18.29 17.14
1-096 Transport accidents 176 183 168 3.04 3.31 3.07
1-097 Falls 149 137 156 3.36 2.87 3.23
1-098 Accidental drowning and submersion 11 10 17 0.18 0.13 0.15
1-099 Exposure to smoke, fire and flames 4 9 12 0.08 0.08 0.13
1-100 Accidental poisoning by and exposure to noxious substances 15 15 21 0.36 0.23 0.44
1-101 Intentional self-harm 422 415 409 9.29 9.17 8.43
1-102 Assault 14 14 17 0.21 0.23 0.38
1-103 All other external causes
142 126 95 2.39 2.27 1.31
Note: (1) The causes of death are adapted from the Mortality Tabulation List of the International Classification of Diseases - Tenth Revision.
(2) Death rates are computed based on the number of resident deaths over resident population.
Deaths Death Rates
Number Per 100,000 Residents
Table 43
DEATHS AND DEATH RATES BY CAUSE, 2013 - 2015
Listing Description of Cause of Death
64

Under
28
days
All Causes 10,789 25 31 8 9 2 4 10 52 179 254 554 1,372 1,067 1,302 1,213 1,539 1,370 1,798 -
1-001 Certain infectious and parasitic diseases 120 - 1 - - - - - 2 - 10 14 17 12 14 12 16 8 14 -
1-002 Cholera - - - - - - - - - - - - - - - - - - - -
1-003 Diarrhoea and gastroenteritis of presumed infectious origin 14 - 1 - - - - - - - 1 1 - 2 2 1 1 1 4 -
1-004 Other intestinal infectious diseases 2 - - - - - - - - - - - 1 - - - 1 - - -
1-005 Respiratory tuberculosis 25 - - - - - - - - - - 3 4 - 2 5 2 3 6 -
1-006 Other tuberculosis 3 - - - - - - - 1 - - - - - - - 1 1 - -
1-007 Plague - - - - - - - - - - - - - - - - - - - -
1-008 Tetanus - - - - - - - - - - - - - - - - - - - -
1-009 Diphtheria - - - - - - - - - - - - - - - - - - - -
1-010 Whooping cough - - - - - - - - - - - - - - - - - - - -
1-011 Meningococcal infection - - - - - - - - - - - - - - - - - - - -
1-012 Septicaemia 23 - - - - - - - - - - 1 4 3 2 2 6 3 2 -
1-013 Infections with a predominantly sexual mode of transmission - - - - - - - - - - - - - - - - - - - -
1-014 Acute poliomyelitis - - - - - - - - - - - - - - - - - - - -
1-015 Rabies - - - - - - - - - - - - - - - - - - - -
1-016 Yellow fever - - - - - - - - - - - - - - - - - - - -
1-017 Other arthropod-borne viral fevers and viral haemorrhagic fevers 3 - - - - - - - - - 1 - - - - 1 1 - - -
1-018 Measles - - - - - - - - - - - - - - - - - - - -
1-019 Viral hepatitis 4 - - - - - - - - - - - 3 - - - - - 1 -
1-020 Human immunodeficiency virus [HIV] disease 32 - - - - - - - - - 4 9 3 5 5 3 3 - - -
1-021 Malaria 1 - - - - - - - - - - - - 1 - - - - - -
1-022 Leishmaniasis - - - - - - - - - - - - - - - - - - - -
1-023 Trypanosomiasis - - - - - - - - - - - - - - - - - - - -
1-024 Schistosomiasis - - - - - - - - - - - - - - - - - - - -
1-025 Remainder of certain infectious and parasitic diseases 13 - - - - - - - 1 - 4 - 2 1 3 - 1 - 1 -
Note: The causes of death are adapted from the Mortality Tabulation List of the International Classification of Diseases - Tenth Revision.
Table 44MALE DEATHS BY CAUSE AND AGE GROUP, 2015
Total28 days
& under
1 year
1 year 2 yearsUn-
known4 years
5-9
years
70-74
yearsDescription of Cause of Death
10-19
years
20-29
years
30-39
years
75-79
years
85 years
& over3 yearsListing
80-84
years
40-49
years
50-59
years
60-64
years
65-69
years
65

Under
28
days
1-026 Neoplasms 3,259 1 - 1 4 1 - 1 8 18 28 140 483 396 515 444 496 401 322 -
1-027 Malignant neoplasm of lip, oral cavity and pharynx 179 - - - - - - - - 2 5 17 57 25 30 12 12 10 9 -
1-028 Malignant neoplasm of oesophagus 86 - - - - - - - - - - 2 20 8 21 12 11 8 4 -
1-029 Malignant neoplasm of stomach 162 - - - - - - - - 1 1 8 24 16 21 19 30 23 19 -
1-030 Malignant neoplasm of colon, rectum and anus 467 - - - - - - - - 1 2 16 59 63 83 67 62 57 57 -
1-031 Malignant neoplasm of liver and intrahepatic bile ducts 403 - - - - - - - - - 2 12 69 64 70 52 55 45 34 -
1-032 Malignant neoplasm of pancreas 207 - - - - - - - - - 1 14 34 30 35 41 22 20 10 -
1-033 Malignant neoplasm of larynx 19 - - - - - - - - - - - 1 5 4 4 1 3 1 -
1-034 Malignant neoplasm of trachea, bronchus and lung 861 - - - - - - - - - 3 27 117 104 125 128 174 113 70 -
1-035 Malignant melanoma of skin 9 - - - - - - - - - - 1 - 1 - 2 2 2 1 -
1-036 Malignant neoplasm of breast 1 - - - - - - - - - - - - - - - 1 - - -
1-037 Malignant neoplasm of cervix uteri - - - - - - - - - - - - - - - - - - - -
1-038 Malignant neoplasm of other and unspecified parts of uterus - - - - - - - - - - - - - - - - - - - -
1-039 Malignant neoplasm of ovary - - - - - - - - - - - - - - - - - - - -
1-040 Malignant neoplasm of prostate 179 - - - - - - - - - - - 5 9 19 27 38 38 43 -
1-041 Malignant neoplasm of bladder 57 - - - - - - - - - - 1 1 5 11 8 12 10 9 -
1-042 Malignant neoplasm of meninges, brain and other parts of central nervous system 52 1 - - 1 1 - - - 5 2 7 13 8 4 6 4 - - -
1-043 Non-Hodgkin's lymphoma 109 - - - - - - - 1 - 2 8 16 7 20 14 13 15 13 -
1-044 Multiple myeloma and malignant plasma cell neoplasms 23 - - - - - - - - - - - 6 3 5 2 3 1 3 -
1-045 Leukaemia 87 - - 1 1 - - - 3 3 4 7 13 10 13 9 6 13 4 -
1-046 Remainder of malignant neoplasms 312 - - - 2 - - 1 3 5 6 17 46 36 47 35 40 34 40 -
1-047 Remainder of neoplasms 46 - - - - - - - 1 1 - 3 2 2 7 6 10 9 5 -
1-048Diseases of the blood and blood-forming organs and
certain disorders involving the immune mechanism5 - - 1 - - 1 - 1 - - - 1 - - 1 - - - -
1-049 Anaemias 2 - - - - - - - 1 - - - - - - 1 - - - -
1-050 Remainder of diseases of the blood and blood-forming organs and certain disorders involving the immune mechanism 3 - - 1 - - 1 - - - - - 1 - - - - - - -
Note: The causes of death are adapted from the Mortality Tabulation List of the International Classification of Diseases - Tenth Revision.
85
years &
over
Un-
known
50-59
years
60-64
years
65-69
years
70-74
years
75-79
years
80-84
years4 years
5-9
years
10-19
years
20-29
years
30-39
years
40-49
years
Table 44MALE DEATHS BY CAUSE AND AGE GROUP, 2015
Listing Description of Cause of Death Total28 days
& under
1 year
1 year 2 years 3 years
66
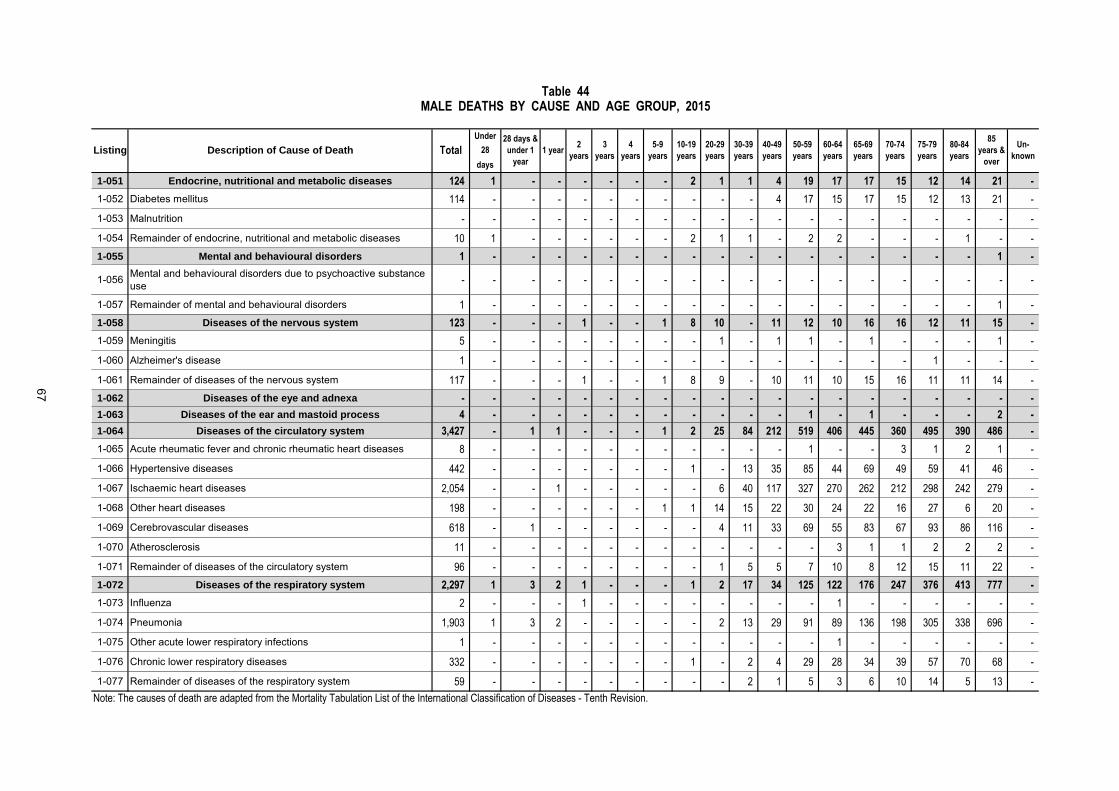
Under
28
days
1-051 Endocrine, nutritional and metabolic diseases 124 1 - - - - - - 2 1 1 4 19 17 17 15 12 14 21 -
1-052 Diabetes mellitus 114 - - - - - - - - - - 4 17 15 17 15 12 13 21 -
1-053 Malnutrition - - - - - - - - - - - - - - - - - - - -
1-054 Remainder of endocrine, nutritional and metabolic diseases 10 1 - - - - - - 2 1 1 - 2 2 - - - 1 - -
1-055 Mental and behavioural disorders 1 - - - - - - - - - - - - - - - - - 1 -
1-056 Mental and behavioural disorders due to psychoactive substance use - - - - - - - - - - - - - - - - - - - -
1-057 Remainder of mental and behavioural disorders 1 - - - - - - - - - - - - - - - - - 1 -
1-058 Diseases of the nervous system 123 - - - 1 - - 1 8 10 - 11 12 10 16 16 12 11 15 -
1-059 Meningitis 5 - - - - - - - - 1 - 1 1 - 1 - - - 1 -
1-060 Alzheimer's disease 1 - - - - - - - - - - - - - - - 1 - - -
1-061 Remainder of diseases of the nervous system 117 - - - 1 - - 1 8 9 - 10 11 10 15 16 11 11 14 -
1-062 Diseases of the eye and adnexa - - - - - - - - - - - - - - - - - - - -
1-063 Diseases of the ear and mastoid process 4 - - - - - - - - - - - 1 - 1 - - - 2 -
1-064 Diseases of the circulatory system 3,427 - 1 1 - - - 1 2 25 84 212 519 406 445 360 495 390 486 -
1-065 Acute rheumatic fever and chronic rheumatic heart diseases 8 - - - - - - - - - - - 1 - - 3 1 2 1 -
1-066 Hypertensive diseases 442 - - - - - - - 1 - 13 35 85 44 69 49 59 41 46 -
1-067 Ischaemic heart diseases 2,054 - - 1 - - - - - 6 40 117 327 270 262 212 298 242 279 -
1-068 Other heart diseases 198 - - - - - - 1 1 14 15 22 30 24 22 16 27 6 20 -
1-069 Cerebrovascular diseases 618 - 1 - - - - - - 4 11 33 69 55 83 67 93 86 116 -
1-070 Atherosclerosis 11 - - - - - - - - - - - - 3 1 1 2 2 2 -
1-071 Remainder of diseases of the circulatory system 96 - - - - - - - - 1 5 5 7 10 8 12 15 11 22 -
1-072 Diseases of the respiratory system 2,297 1 3 2 1 - - - 1 2 17 34 125 122 176 247 376 413 777 -
1-073 Influenza 2 - - - 1 - - - - - - - - 1 - - - - - -
1-074 Pneumonia 1,903 1 3 2 - - - - - 2 13 29 91 89 136 198 305 338 696 -
1-075 Other acute lower respiratory infections 1 - - - - - - - - - - - - 1 - - - - - -
1-076 Chronic lower respiratory diseases 332 - - - - - - - 1 - 2 4 29 28 34 39 57 70 68 -
1-077 Remainder of diseases of the respiratory system 59 - - - - - - - - - 2 1 5 3 6 10 14 5 13 -
Note: The causes of death are adapted from the Mortality Tabulation List of the International Classification of Diseases - Tenth Revision.
85
years &
over
Un-
known
50-59
years
60-64
years
65-69
years
70-74
years
75-79
years
80-84
years
4
years
5-9
years
10-19
years
20-29
years
30-39
years
40-49
years
Table 44MALE DEATHS BY CAUSE AND AGE GROUP, 2015
Listing Description of Cause of Death Total28 days &
under 1
year
1 year2
years
3
years
67

Under
28
days
1-078 Diseases of the digestive system 242 - 2 - - - - - 1 - 3 14 50 24 25 32 32 28 31 -
1-079 Gastric and duodenal ulcer 25 - - - - - - - - - - 2 3 4 1 3 2 4 6 -
1-080 Diseases of the liver 111 - 2 - - - - - - - 2 12 37 15 13 13 7 6 4 -
1-081 Remainder of diseases of the digestive system 106 - - - - - - - 1 - 1 - 10 5 11 16 23 18 21 -
1-082 Diseases of the skin and subcutaneous tissue 34 - - - - - - - - - - - 1 3 8 5 3 3 11 -
1-083Diseases of the musculoskeletal system and connective
tissue43 - - 2 - - - - - 1 - 2 4 4 10 5 2 7 6 -
1-084 Diseases of the genitourinary system 348 - - - - - - 1 - - 1 11 38 24 34 39 54 61 85 -
1-085 Glomerular and renal tubulo-interstitial diseases 10 - - - - - - - - - - 2 2 - - 2 1 1 2 -
1-086 Remainder of diseases of the genitourinary system 338 - - - - - - 1 - - 1 9 36 24 34 37 53 60 83 -
1-087 Pregnancy, childbirth and the puerperium - - - - - - - - - - - - - - - - - - - -
1-088 Pregnancy with abortive outcome - - - - - - - - - - - - - - - - - - - -
1-089 Other direct obstetric deaths - - - - - - - - - - - - - - - - - - - -
1-090 Indirect obstetric deaths - - - - - - - - - - - - - - - - - - - -
1-091 Remainder of pregnancy, childbirth and the puerperium - - - - - - - - - - - - - - - - - - - -
1-092 Certain conditions originating in the perinatal period 23 17 6 - - - - - - - - - - - - - - - - -
1-093Congenital malformations, deformations and chromosomal
abnormalities34 4 12 1 2 - 1 2 1 2 3 1 1 1 1 2 - - - -
1-094Symptoms, signs and abnormal clinical and laboratory
findings, not elsewhere classified43 1 6 - 1 - - 1 2 3 7 6 2 5 2 1 - 2 4 -
1-095 External causes of morbidity and mortality 662 - - - - 1 2 3 24 117 100 105 99 43 38 34 41 32 23 -
1-096 Transport accidents 139 - - - - - - 1 4 24 28 20 28 9 5 6 7 4 3 -
1-097 Falls 130 - - - - 1 1 - - 14 7 10 13 9 10 8 20 23 14 -
1-098 Accidental drowning and submersion 14 - - - - - 1 2 2 3 2 2 - - 1 1 - - - -
1-099 Exposure to smoke, fire and flames 9 - - - - - - - - 3 1 2 1 1 - 1 - - - -
1-100 Accidental poisoning by and exposure to noxious substances 14 - - - - - - - - 4 2 2 4 1 - 1 - - - -
1-101 Intentional self-harm 271 - - - - - - - 16 49 44 50 40 19 21 17 6 4 5 -
1-102 Assault 11 - - - - - - - 1 2 1 2 2 - 1 - 2 - - -
1-103 All other external causes 74 - - - - - - - 1 18 15 17 11 4 - - 6 1 1 -
Note: The causes of death are adapted from the Mortality Tabulation List of the International Classification of Diseases - Tenth Revision.
85
years &
over
Un-
known
50-59
years
60-64
years
65-69
years
70-74
years
75-79
years
80-84
years
4
years
5-9
years
10-19
years
20-29
years
30-39
years
40-49
years
Table 44MALE DEATHS BY CAUSE AND AGE GROUP, 2015
Listing Description of Cause of Death Total28 days &
under 1
year
1 year2
years
3
years
68

Under
28
days
All Causes 9,073 16 12 3 - 4 2 2 40 87 138 317 783 592 700 780 1,147 1,378 3,072 -
1-001 Certain infectious and parasitic diseases 74 - 1 - - 1 - - - 1 1 - 13 8 7 2 11 8 21 -
1-002 Cholera - - - - - - - - - - - - - - - - - - - -
1-003 Diarrhoea and gastroenteritis of presumed infectious origin 22 - - - - - - - - - - - 1 2 4 1 2 6 6 -
1-004 Other intestinal infectious diseases 2 - - - - - - - - - - - - - - - - - 2 -
1-005 Respiratory tuberculosis 13 - - - - - - - - - - - 4 2 1 1 3 - 2 -
1-006 Other tuberculosis - - - - - - - - - - - - - - - - - - - -
1-007 Plague - - - - - - - - - - - - - - - - - - - -
1-008 Tetanus - - - - - - - - - - - - - - - - - - - -
1-009 Diphtheria - - - - - - - - - - - - - - - - - - - -
1-010 Whooping cough 1 - 1 - - - - - - - - - - - - - - - - -
1-011 Meningococcal infection - - - - - - - - - - - - - - - - - - - -
1-012 Septicaemia 18 - - - - - - - - - 1 - 2 1 1 - 5 - 8 -
1-013 Infections with a predominantly sexual mode of transmission - - - - - - - - - - - - - - - - - - - -
1-014 Acute poliomyelitis - - - - - - - - - - - - - - - - - - - -
1-015 Rabies - - - - - - - - - - - - - - - - - - - -
1-016 Yellow fever - - - - - - - - - - - - - - - - - - - -
1-017 Other arthropod-borne viral fevers and viral haemorrhagic fevers 3 - - - - - - - - - - - 2 1 - - - - - -
1-018 Measles - - - - - - - - - - - - - - - - - - - -
1-019 Viral hepatitis - - - - - - - - - - - - - - - - - - - -
1-020 Human immunodeficiency virus [HIV] disease 3 - - - - - - - - - - - 3 - - - - - - -
1-021 Malaria - - - - - - - - - - - - - - - - - - - -
1-022 Leishmaniasis - - - - - - - - - - - - - - - - - - - -
1-023 Trypanosomiasis - - - - - - - - - - - - - - - - - - - -
1-024 Schistosomiasis - - - - - - - - - - - - - - - - - - - -
1-025 Remainder of certain infectious and parasitic diseases 12 - - - - 1 - - - 1 - - 1 2 1 - 1 2 3 -
Note: The causes of death are adapted from the Mortality Tabulation List of the International Classification of Diseases - Tenth Revision.
85 years
& over3 yearsListing
80-84
years
40-49
years
50-59
years
60-64
years
65-69
years
70-74
yearsDescription of Cause of Death
10-19
years
20-29
years
30-39
years
75-79
years
Table 45
FEMALE DEATHS BY CAUSE AND AGE GROUP, 2015
Total28 days
& under
1 year
1 year 2 yearsUn-
known4 years
5-9
years
69
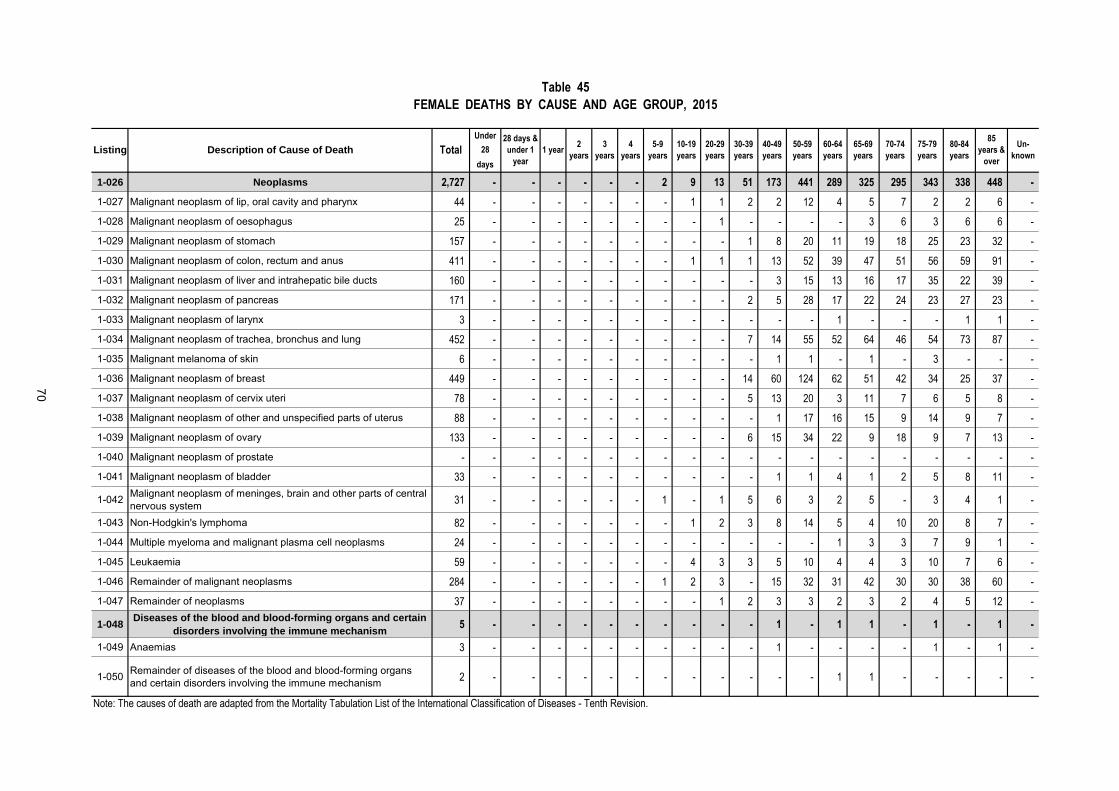
Under
28
days
1-026 Neoplasms 2,727 - - - - - - 2 9 13 51 173 441 289 325 295 343 338 448 -
1-027 Malignant neoplasm of lip, oral cavity and pharynx 44 - - - - - - - 1 1 2 2 12 4 5 7 2 2 6 -
1-028 Malignant neoplasm of oesophagus 25 - - - - - - - - 1 - - - - 3 6 3 6 6 -
1-029 Malignant neoplasm of stomach 157 - - - - - - - - - 1 8 20 11 19 18 25 23 32 -
1-030 Malignant neoplasm of colon, rectum and anus 411 - - - - - - - 1 1 1 13 52 39 47 51 56 59 91 -
1-031 Malignant neoplasm of liver and intrahepatic bile ducts 160 - - - - - - - - - - 3 15 13 16 17 35 22 39 -
1-032 Malignant neoplasm of pancreas 171 - - - - - - - - - 2 5 28 17 22 24 23 27 23 -
1-033 Malignant neoplasm of larynx 3 - - - - - - - - - - - - 1 - - - 1 1 -
1-034 Malignant neoplasm of trachea, bronchus and lung 452 - - - - - - - - - 7 14 55 52 64 46 54 73 87 -
1-035 Malignant melanoma of skin 6 - - - - - - - - - - 1 1 - 1 - 3 - - -
1-036 Malignant neoplasm of breast 449 - - - - - - - - - 14 60 124 62 51 42 34 25 37 -
1-037 Malignant neoplasm of cervix uteri 78 - - - - - - - - - 5 13 20 3 11 7 6 5 8 -
1-038 Malignant neoplasm of other and unspecified parts of uterus 88 - - - - - - - - - - 1 17 16 15 9 14 9 7 -
1-039 Malignant neoplasm of ovary 133 - - - - - - - - - 6 15 34 22 9 18 9 7 13 -
1-040 Malignant neoplasm of prostate - - - - - - - - - - - - - - - - - - - -
1-041 Malignant neoplasm of bladder 33 - - - - - - - - - - 1 1 4 1 2 5 8 11 -
1-042 Malignant neoplasm of meninges, brain and other parts of central nervous system 31 - - - - - - 1 - 1 5 6 3 2 5 - 3 4 1 -
1-043 Non-Hodgkin's lymphoma 82 - - - - - - - 1 2 3 8 14 5 4 10 20 8 7 -
1-044 Multiple myeloma and malignant plasma cell neoplasms 24 - - - - - - - - - - - - 1 3 3 7 9 1 -
1-045 Leukaemia 59 - - - - - - - 4 3 3 5 10 4 4 3 10 7 6 -
1-046 Remainder of malignant neoplasms 284 - - - - - - 1 2 3 - 15 32 31 42 30 30 38 60 -
1-047 Remainder of neoplasms 37 - - - - - - - - 1 2 3 3 2 3 2 4 5 12 -
1-048Diseases of the blood and blood-forming organs and certain
disorders involving the immune mechanism5 - - - - - - - - - - 1 - 1 1 - 1 - 1 -
1-049 Anaemias 3 - - - - - - - - - - 1 - - - - 1 - 1 -
1-050 Remainder of diseases of the blood and blood-forming organs and certain disorders involving the immune mechanism 2 - - - - - - - - - - - - 1 1 - - - - -
Note: The causes of death are adapted from the Mortality Tabulation List of the International Classification of Diseases - Tenth Revision.
Table 45
FEMALE DEATHS BY CAUSE AND AGE GROUP, 2015
Listing Description of Cause of Death Total28 days &
under 1
year
1 year2
years
3
years
4
years
5-9
years
10-19
years
20-29
years
30-39
years
40-49
years
85
years &
over
Un-
known
50-59
years
60-64
years
65-69
years
70-74
years
75-79
years
80-84
years
70

Under
28
days
1-051 Endocrine, nutritional and metabolic diseases 146 - - - - - - - 1 - 2 9 10 9 10 25 32 18 30 -
1-052 Diabetes mellitus 136 - - - - - - - - - 1 7 7 8 10 24 32 17 30 -
1-053 Malnutrition - - - - - - - - - - - - - - - - - - - -
1-054 Remainder of endocrine, nutritional and metabolic diseases 10 - - - - - - - 1 - 1 2 3 1 - 1 - 1 - -
1-055 Mental and behavioural disorders - - - - - - - - - - - - - - - - - - - -
1-056 Mental and behavioural disorders due to psychoactive substance use - - - - - - - - - - - - - - - - - - - -
1-057 Remainder of mental and behavioural disorders - - - - - - - - - - - - - - - - - - - -
1-058 Diseases of the nervous system 83 1 - 1 - 1 - - 4 4 4 3 9 6 7 6 11 13 13 -
1-059 Meningitis 1 1 - - - - - - - - - - - - - - - - - -
1-060 Alzheimer's disease 1 - - - - - - - - - - - - - - - - - 1 -
1-061 Remainder of diseases of the nervous system 81 - - 1 - 1 - - 4 4 4 3 9 6 7 6 11 13 12 -
1-062 Diseases of the eye and adnexa - - - - - - - - - - - - - - - - - - - -
1-063 Diseases of the ear and mastoid process - - - - - - - - - - - - - - - - - - - -
1-064 Diseases of the circulatory system 2,674 - 2 - - - 1 - 7 12 23 52 182 159 199 241 353 464 979 -
1-065 Acute rheumatic fever and chronic rheumatic heart diseases 16 - - - - - - - - - 1 - 2 3 2 4 - 2 2 -
1-066 Hypertensive diseases 336 - - - - - - - - - 1 5 34 30 36 34 38 61 97 -
1-067 Ischaemic heart diseases 1,259 - - - - - - - - - 4 17 72 73 96 118 171 229 479 -
1-068 Other heart diseases 221 - 2 - - - 1 - 5 8 9 11 19 10 15 23 32 31 55 -
1-069 Cerebrovascular diseases 739 - - - - - - - 2 4 7 17 47 39 45 53 103 126 296 -
1-070 Atherosclerosis 7 - - - - - - - - - - - - - - 1 1 1 4 -
1-071 Remainder of diseases of the circulatory system 96 - - - - - - - - - 1 2 8 4 5 8 8 14 46 -
1-072 Diseases of the respiratory system 2,120 - - - - 1 - - - 4 9 20 51 55 84 114 238 357 1,187 -
1-073 Influenza - - - - - - - - - - - - - - - - - - - -
1-074 Pneumonia 1,956 - - - - 1 - - - 3 6 16 41 45 72 93 209 333 1,137 -
1-075 Other acute lower respiratory infections 1 - - - - - - - - - - - - - - - 1 - - -
1-076 Chronic lower respiratory diseases 123 - - - - - - - - - 2 3 7 9 6 11 20 21 44 -
1-077 Remainder of diseases of the respiratory system 40 - - - - - - - - 1 1 1 3 1 6 10 8 3 6 -
Note: The causes of death are adapted from the Mortality Tabulation List of the International Classification of Diseases - Tenth Revision.
Table 45
FEMALE DEATHS BY CAUSE AND AGE GROUP, 2015
Listing Description of Cause of Death Total28 days
& under
1 year
1 year 2 years 3 years 4 years5-9
years
10-19
years
20-29
years
30-39
years
40-49
years
85 years
& over
Un-
known
50-59
years
60-64
years
65-69
years
70-74
years
75-79
years
80-84
years
71

Under
28
days
1-078 Diseases of the digestive system 235 - 1 - - - - - 2 1 5 7 14 14 8 13 29 42 99 -
1-079 Gastric and duodenal ulcer 12 - - - - - - - - 1 - - - 2 - 1 1 1 6 -
1-080 Diseases of the liver 76 - 1 - - - - - 1 - 4 6 8 5 2 4 10 14 21 -
1-081 Remainder of diseases of the digestive system 147 - - - - - - - 1 - 1 1 6 7 6 8 18 27 72 -
1-082 Diseases of the skin and subcutaneous tissue 77 - - - - - - - - - 1 1 - 1 2 5 8 17 42 -
1-083Diseases of the musculoskeletal system and connective
tissue47 - - - - - - - - 1 1 2 7 5 7 3 8 6 7 -
1-084 Diseases of the genitourinary system 580 - - - - - - - - - 6 6 26 31 33 58 90 102 228 -
1-085 Glomerular and renal tubulo-interstitial diseases 10 - - - - - - - - - - - 1 1 1 1 1 1 4 -
1-086 Remainder of diseases of the genitourinary system 570 - - - - - - - - - 6 6 25 30 32 57 89 101 224 -
1-087 Pregnancy, childbirth and the puerperium 3 - - - - - - - - - 3 - - - - - - - - -
1-088 Pregnancy with abortive outcome 1 - - - - - - - - - 1 - - - - - - - - -
1-089 Other direct obstetric deaths 2 - - - - - - - - - 2 - - - - - - - - -
1-090 Indirect obstetric deaths - - - - - - - - - - - - - - - - - - - -
1-091 Remainder of pregnancy, childbirth and the puerperium - - - - - - - - - - - - - - - - - - - -
1-092 Certain conditions originating in the perinatal period 7 5 2 - - - - - - - - - - - - - - - - -
1-093Congenital malformations, deformations and chromosomal
abnormalities28 8 5 2 - - 1 - 2 1 - 4 3 - 1 1 - - - -
1-094Symptoms, signs and abnormal clinical and laboratory
findings, not elsewhere classified34 2 1 - - - - - 1 4 3 5 2 2 3 2 2 3 4 -
1-095 External causes of morbidity and mortality 233 - - - - 1 - - 14 46 29 34 25 12 13 15 21 10 13 -
1-096 Transport accidents 29 - - - - - - - 2 2 3 1 2 2 2 6 5 3 1 -
1-097 Falls 26 - - - - - - - 1 4 1 2 3 - - 2 4 4 5 -
1-098 Accidental drowning and submersion 3 - - - - 1 - - - 1 - - - 1 - - - - - -
1-099 Exposure to smoke, fire and flames 3 - - - - - - - - - - - - 2 1 - - - - -
1-100 Accidental poisoning by and exposure to noxious substances 7 - - - - - - - - 1 2 3 - - - - 1 - - -
1-101 Intentional self-harm 138 - - - - - - - 11 30 17 26 16 7 10 5 10 1 5 -
1-102 Assault 6 - - - - - - - - 4 2 - - - - - - - - -
1-103 All other external causes 21 - - - - - - - - 4 4 2 4 - - 2 1 2 2 -
Note: The causes of death are adapted from the Mortality Tabulation List of the International Classification of Diseases - Tenth Revision.
Table 45FEMALE DEATHS BY CAUSE AND AGE GROUP, 2015
Listing Description of Cause of Death Total28 days &
under 1
year
1 year2
years
3
years
4
years
5-9
years
10-19
years
20-29
years
30-39
years
40-49
years
85
years &
over
Un-
known
50-59
years
60-64
years
65-69
years
70-74
years
75-79
years
80-84
years
72

Total Males Females Males Females Males Females Males Females Males Females
All Causes 19,862 10,789 9,073 8,024 6,932 1,521 1,348 951 594 293 199
1-001 Certain infectious and parasitic diseases 194 120 74 91 49 20 15 5 8 4 2
1-002 Cholera - - - - - - - - - - -
1-003 Diarrhoea and gastroenteritis of presumed infectious origin 36 14 22 8 13 4 9 1 - 1 -
1-004 Other intestinal infectious diseases 4 2 2 2 2 - - - - - -
1-005 Respiratory tuberculosis 38 25 13 23 8 2 2 - 3 - -
1-006 Other tuberculosis 3 3 - 2 - 1 - - - - -
1-007 Plague - - - - - - - - - - -
1-008 Tetanus - - - - - - - - - - -
1-009 Diphtheria - - - - - - - - - - -
1-010 Whooping cough 1 - 1 - - - 1 - - - -
1-011 Meningococcal infection - - - - - - - - - - -
1-012 Septicaemia 41 23 18 19 15 3 1 1 1 - 1
1-013 Infections with a predominantly sexual mode of transmission - - - - - - - - - - -
1-014 Acute poliomyelitis - - - - - - - - - - -
1-015 Rabies - - - - - - - - - - -
1-016 Yellow fever - - - - - - - - - - -
1-017 Other arthropod-borne viral fevers and viral haemorrhagic fevers 6 3 3 1 2 - - 1 1 1 -
1-018 Measles - - - - - - - - - - -
1-019 Viral hepatitis 4 4 - 2 - - - 1 - 1 -
1-020 Human immunodeficiency virus [HIV] disease 35 32 3 26 - 6 - - 2 - 1
1-021 Malaria 1 1 - - - - - - - 1 -
1-022 Leishmaniasis - - - - - - - - - - -
1-023 Trypanosomiasis - - - - - - - - - - -
1-024 Schistosomiasis - - - - - - - - - - -
1-025 Remainder of certain infectious and parasitic diseases 25 13 12 8 9 4 2 1 1 - -
Note: The causes of death are adapted from the Mortality Tabulation List of the International Classification of Diseases - Tenth Revision.
Ethnic Group
Chinese Malays Indians Others
Table 46
DEATHS BY CAUSE, ETHNIC GROUP AND SEX, 2015
Listing Description of Cause of DeathTotal
73
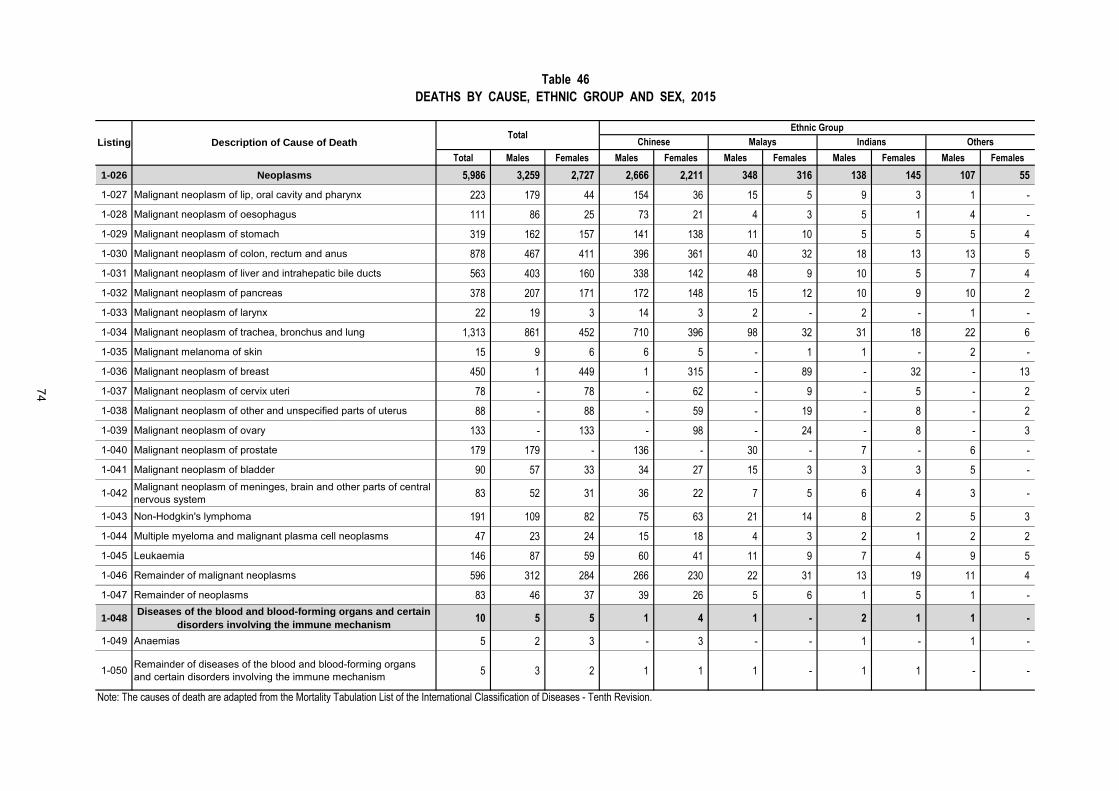
Total Males Females Males Females Males Females Males Females Males Females
1-026 Neoplasms 5,986 3,259 2,727 2,666 2,211 348 316 138 145 107 55
1-027 Malignant neoplasm of lip, oral cavity and pharynx 223 179 44 154 36 15 5 9 3 1 -
1-028 Malignant neoplasm of oesophagus 111 86 25 73 21 4 3 5 1 4 -
1-029 Malignant neoplasm of stomach 319 162 157 141 138 11 10 5 5 5 4
1-030 Malignant neoplasm of colon, rectum and anus 878 467 411 396 361 40 32 18 13 13 5
1-031 Malignant neoplasm of liver and intrahepatic bile ducts 563 403 160 338 142 48 9 10 5 7 4
1-032 Malignant neoplasm of pancreas 378 207 171 172 148 15 12 10 9 10 2
1-033 Malignant neoplasm of larynx 22 19 3 14 3 2 - 2 - 1 -
1-034 Malignant neoplasm of trachea, bronchus and lung 1,313 861 452 710 396 98 32 31 18 22 6
1-035 Malignant melanoma of skin 15 9 6 6 5 - 1 1 - 2 -
1-036 Malignant neoplasm of breast 450 1 449 1 315 - 89 - 32 - 13
1-037 Malignant neoplasm of cervix uteri 78 - 78 - 62 - 9 - 5 - 2
1-038 Malignant neoplasm of other and unspecified parts of uterus 88 - 88 - 59 - 19 - 8 - 2
1-039 Malignant neoplasm of ovary 133 - 133 - 98 - 24 - 8 - 3
1-040 Malignant neoplasm of prostate 179 179 - 136 - 30 - 7 - 6 -
1-041 Malignant neoplasm of bladder 90 57 33 34 27 15 3 3 3 5 -
1-042 Malignant neoplasm of meninges, brain and other parts of central nervous system 83 52 31 36 22 7 5 6 4 3 -
1-043 Non-Hodgkin's lymphoma 191 109 82 75 63 21 14 8 2 5 3
1-044 Multiple myeloma and malignant plasma cell neoplasms 47 23 24 15 18 4 3 2 1 2 2
1-045 Leukaemia 146 87 59 60 41 11 9 7 4 9 5
1-046 Remainder of malignant neoplasms 596 312 284 266 230 22 31 13 19 11 4
1-047 Remainder of neoplasms 83 46 37 39 26 5 6 1 5 1 -
1-048Diseases of the blood and blood-forming organs and certain
disorders involving the immune mechanism10 5 5 1 4 1 - 2 1 1 -
1-049 Anaemias 5 2 3 - 3 - - 1 - 1 -
1-050 Remainder of diseases of the blood and blood-forming organs and certain disorders involving the immune mechanism 5 3 2 1 1 1 - 1 1 - -
Note: The causes of death are adapted from the Mortality Tabulation List of the International Classification of Diseases - Tenth Revision.
Ethnic Group
Chinese Malays Indians Others
Table 46
DEATHS BY CAUSE, ETHNIC GROUP AND SEX, 2015
Listing Description of Cause of DeathTotal
74

Total Males Females Males Females Males Females Males Females Males Females
1-051 Endocrine, nutritional and metabolic diseases 270 124 146 77 93 27 40 19 10 1 3
1-052 Diabetes mellitus 250 114 136 74 88 23 38 16 8 1 2
1-053 Malnutrition - - - - - - - - - - -
1-054 Remainder of endocrine, nutritional and metabolic diseases 20 10 10 3 5 4 2 3 2 - 1
1-055 Mental and behavioural disorders 1 1 - - - 1 - - - - -
1-056 Mental and behavioural disorders due to psychoactive substance use - - - - - - - - - - -
1-057 Remainder of mental and behavioural disorders 1 1 - - - 1 - - - - -
1-058 Diseases of the nervous system 206 123 83 87 61 15 11 17 6 4 5
1-059 Meningitis 6 5 1 5 1 - - - - - -
1-060 Alzheimer's disease 2 1 1 - - 1 - - - - 1
1-061 Remainder of diseases of the nervous system 198 117 81 82 60 14 11 17 6 4 4
1-062 Diseases of the eye and adnexa - - - - - - - - - - -
1-063 Diseases of the ear and mastoid process 4 4 - 4 - - - - - - -
1-064 Diseases of the circulatory system 6,101 3,427 2,674 2,348 1,901 595 495 397 216 87 62
1-065 Acute rheumatic fever and chronic rheumatic heart diseases 24 8 16 6 12 2 3 - - - 1
1-066 Hypertensive diseases 778 442 336 336 236 62 54 34 39 10 7
1-067 Ischaemic heart diseases 3,313 2,054 1,259 1,338 882 375 231 287 124 54 22
1-068 Other heart diseases 419 198 221 126 157 37 38 25 18 10 8
1-069 Cerebrovascular diseases 1,357 618 739 460 539 103 150 43 28 12 22
1-070 Atherosclerosis 18 11 7 8 4 3 1 - 2 - -
1-071 Remainder of diseases of the circulatory system 192 96 96 74 71 13 18 8 5 1 2
1-072 Diseases of the respiratory system 4,417 2,297 2,120 1,766 1,680 335 278 159 120 37 42
1-073 Influenza 2 2 - 1 - 1 - - - - -
1-074 Pneumonia 3,859 1,903 1,956 1,473 1,559 269 251 129 109 32 37
1-075 Other acute lower respiratory infections 2 1 1 1 1 - - - - - -
1-076 Chronic lower respiratory diseases 455 332 123 243 89 61 23 24 6 4 5
1-077 Remainder of diseases of the respiratory system 99 59 40 48 31 4 4 6 5 1 -
Note: The causes of death are adapted from the Mortality Tabulation List of the International Classification of Diseases - Tenth Revision.
Ethnic Group
Chinese Malays Indians Others
Table 46
DEATHS BY CAUSE, ETHNIC GROUP AND SEX, 2015
Listing Description of Cause of DeathTotal
75

Total Males Females Males Females Males Females Males Females Males Females
1-078 Diseases of the digestive system 477 242 235 162 190 38 32 39 12 3 1
1-079 Gastric and duodenal ulcer 37 25 12 17 10 4 2 3 - 1 -
1-080 Diseases of the liver 187 111 76 68 59 16 10 27 7 - -
1-081 Remainder of diseases of the digestive system 253 106 147 77 121 18 20 9 5 2 1
1-082 Diseases of the skin and subcutaneous tissue 111 34 77 23 61 8 13 2 3 1 -
1-083Diseases of the musculoskeletal system and connective
tissue90 43 47 36 32 4 14 3 1 - -
1-084 Diseases of the genitourinary system 928 348 580 261 434 52 97 26 44 9 5
1-085 Glomerular and renal tubulo-interstitial diseases 20 10 10 5 4 4 3 1 3 - -
1-086 Remainder of diseases of the genitourinary system 908 338 570 256 430 48 94 25 41 9 5
1-087 Pregnancy, childbirth and the puerperium 3 - 3 - 3 - - - - - -
1-088 Pregnancy with abortive outcome 1 - 1 - 1 - - - - - -
1-089 Other direct obstetric deaths 2 - 2 - 2 - - - - - -
1-090 Indirect obstetric deaths - - - - - - - - - - -
1-091 Remainder of pregnancy, childbirth and the puerperium - - - - - - - - - - -
1-092 Certain conditions originating in the perinatal period 30 23 7 16 6 3 1 4 - - -
1-093Congenital malformations, deformations and chromosomal
abnormalities62 34 28 20 13 7 12 6 2 1 1
1-094Symptoms, signs and abnormal clinical and laboratory
findings, not elsewhere classified77 43 34 27 26 8 5 3 1 5 2
1-095 External causes of morbidity and mortality 895 662 233 439 168 59 19 131 25 33 21
1-096 Transport accidents 168 139 29 79 22 26 3 31 3 3 1
1-097 Falls 156 130 26 94 18 10 3 18 2 8 3
1-098 Accidental drowning and submersion 17 14 3 8 3 3 - 2 - 1 -
1-099 Exposure to smoke, fire and flames 12 9 3 3 2 2 - 3 1 1 -
1-100 Accidental poisoning by and exposure to noxious substances 21 14 7 7 4 5 - 2 2 - 1
1-101 Intentional self-harm 409 271 138 202 103 4 8 52 15 13 12
1-102 Assault 17 11 6 10 4 1 2 - - - -
1-103 All other external causes 95 74 21 36 12 8 3 23 2 7 4
Note: The causes of death are adapted from the Mortality Tabulation List of the International Classification of Diseases - Tenth Revision.
Ethnic Group
Chinese Malays Indians Others
Table 46
DEATHS BY CAUSE, ETHNIC GROUP AND SEX, 2015
Listing Description of Cause of DeathTotal
76

![BIRTHS, MARRIAGES AND DEATHS [a81y1963]BIRTHS, … · any births, marriages or deaths registration office in existence prior to the commencement of this Act. (2) The Secretary may](https://static.documents.pub/doc/80x56/60dc4d3f4aae351d7570c520/births-marriages-and-deaths-a81y1963births-any-births-marriages-or-deaths-registration.jpg)


