8
Building a Sustainable Future Report on the 2016 PEPFAR Sustainability Indices and Dashboards (SIDs)
| Date post: | 25-Jun-2018 |
| Category: |
Documents |
| Upload: | truongcong |
| View: | 214 times |
| Download: | 0 times |
Building a Sustainable FutureReport on the 2016 PEPFAR Sustainability Indices and Dashboards (SIDs)
The global HIV response has changed dramatically since PEPFAR was launched in 2003, pivoting from an emergency response characterized by the urgent need to scale up HIV services largely funded by external donors, to one where responsibility is shared among donors, partner governments, civil society, the private sector, and other stakeholders, together united behind the goal of achieving an AIDS-free generation. Today, PEPFAR is engaged in the third phase of the program, focused on sustainable control of the epidemic through a data-driven approach that strategically targets geographic areas and populations where we can achieve the most impact for our investments. Doing so is imperative if we wish to achieve the ambitious 90-90-90 goals set forth by UNAIDS. And wherever countries stand in that effort, it is vital to start planning early to ensure that once epidemic control is achieved, the services, systems, financing, and policies required to maintain that control are available to PEPFAR beneficiaries and partner countries.
For most countries where PEPFAR invests, the road to sustainability is a long one marked by the gradual strengthening of capacities, systems, and national finances. For some, sustainable control of the HIV/AIDS epidemic is beginning to come within sight; for others, despite steady progress, that goal remains some distance down the road. PEPFAR has set out to measure for the first time where countries are situated on the sustainability spectrum, with the aim of providing new data to inform annual PEPFAR investments and an opportunity for a dedicated sustainability dialogue with national stakeholders.
The Sustainability Index and Dashboard (SID) tool, comprising 90 questions spread across 15 elements, was completed in 41 PEPFAR countries (both bilateral and regional programs) during COP 16 with the participation of PEPFAR field staff, government partners, civil society, multilateral agencies, and other stakeholders. The results from the 2016 SID will serve as the baseline against which future iterations of the tool will be compared to track progress over time. Individual country findings from the 2016 SIDs can be found at http://www.pepfar.gov/countries/cop/c71524.htm.
This report contains analysis that looks across 41 national SIDs that were completed during COP 16 to provide a snapshot of the sustainability landscape across PEPFAR countries. In particular, the following pages focus on:
● Overall findings and scores across all PEPFAR countries
● A comparison of SID scores across LTS and TA/TC countries
● A cross-section of priority policy reforms
● Domestic resource mobilization related to key commodities
● Civil society engagement
It is important to recognize that the SIDs were largely completed between January and March of 2016, and in the months since, several countries subsequently approved policy changes (for example, enacting Test and START, or Treat All, policies) that are not reflected in the SID scores. Such policy changes, and any related increase in score, will be reflected in the next iteration of SIDs.
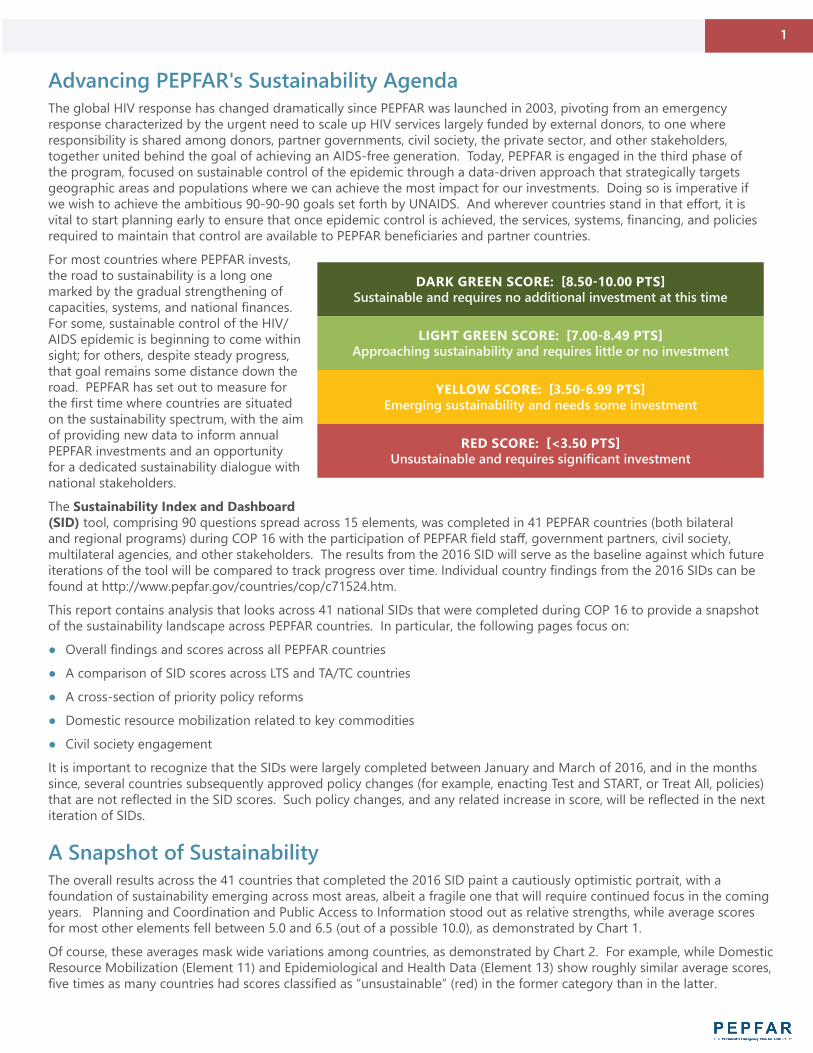
Advancing PEPFAR's Sustainability Agenda
DARK GREEN SCORE: [8.50-10.00 PTS]Sustainable and requires no additional investment at this time
LIGHT GREEN SCORE: [7.00-8.49 PTS]Approaching sustainability and requires little or no investment
YELLOW SCORE: [3.50-6.99 PTS]Emerging sustainability and needs some investment
RED SCORE: [<3.50 PTS]Unsustainable and requires significant investment
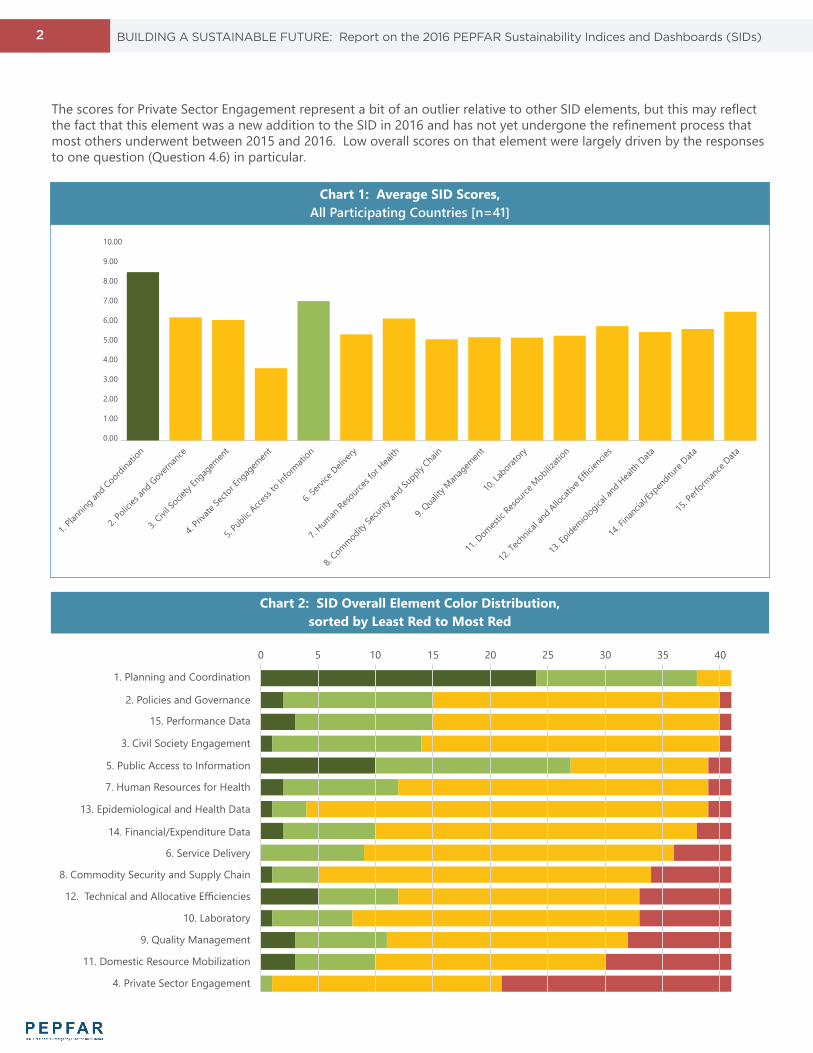
The overall results across the 41 countries that completed the 2016 SID paint a cautiously optimistic portrait, with a foundation of sustainability emerging across most areas, albeit a fragile one that will require continued focus in the coming years. Planning and Coordination and Public Access to Information stood out as relative strengths, while average scores for most other elements fell between 5.0 and 6.5 (out of a possible 10.0), as demonstrated by Chart 1.
Of course, these averages mask wide variations among countries, as demonstrated by Chart 2. For example, while Domestic Resource Mobilization (Element 11) and Epidemiological and Health Data (Element 13) show roughly similar average scores, five times as many countries had scores classified as “unsustainable” (red) in the former category than in the latter.
A Snapshot of Sustainability
1
2 BUILDING A SUSTAINABLE FUTURE: Report on the 2016 PEPFAR Sustainability Indices and Dashboards (SIDs)
The scores for Private Sector Engagement represent a bit of an outlier relative to other SID elements, but this may reflect the fact that this element was a new addition to the SID in 2016 and has not yet undergone the refinement process that most others underwent between 2015 and 2016. Low overall scores on that element were largely driven by the responses to one question (Question 4.6) in particular.
Chart 2: SID Overall Element Color Distribution,sorted by Least Red to Most Red
Chart 1: Average SID Scores,All Participating Countries [n=41]
1. Planning and Coordination
14. Financial/Expenditure Data
2. Policies and Governance
10. Laboratory
7. Human Resources for Health
13. Epidemiological and Health Data
6. Service Delivery
15. Performance Data
9. Quality Management
8. Commodity Security and Supply Chain
3. Civil Society Engagement
11. Domestic Resource Mobilization
12. Technical and Allocative Efficiencies
5. Public Access to Information
4. Private Sector Engagement
0 5 10 15 20 25 30 35 40
10.00
9.00
8.00
7.00
6.00
5.00
4.00
3.00
2.00
1.00
0.00
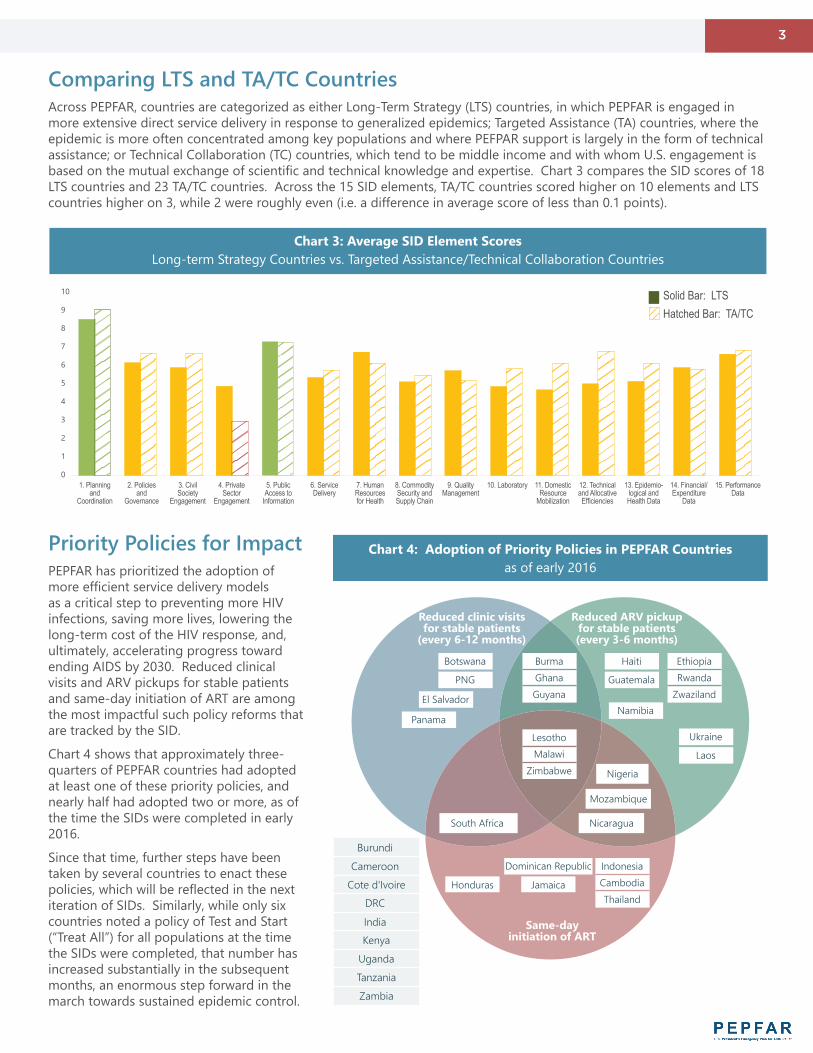
Chart 3: Average SID Element ScoresLong-term Strategy Countries vs. Targeted Assistance/Technical Collaboration Countries
Across PEPFAR, countries are categorized as either Long-Term Strategy (LTS) countries, in which PEPFAR is engaged in more extensive direct service delivery in response to generalized epidemics; Targeted Assistance (TA) countries, where the epidemic is more often concentrated among key populations and where PEFPAR support is largely in the form of technical assistance; or Technical Collaboration (TC) countries, which tend to be middle income and with whom U.S. engagement is based on the mutual exchange of scientific and technical knowledge and expertise. Chart 3 compares the SID scores of 18 LTS countries and 23 TA/TC countries. Across the 15 SID elements, TA/TC countries scored higher on 10 elements and LTS countries higher on 3, while 2 were roughly even (i.e. a difference in average score of less than 0.1 points).
Comparing LTS and TA/TC Countries
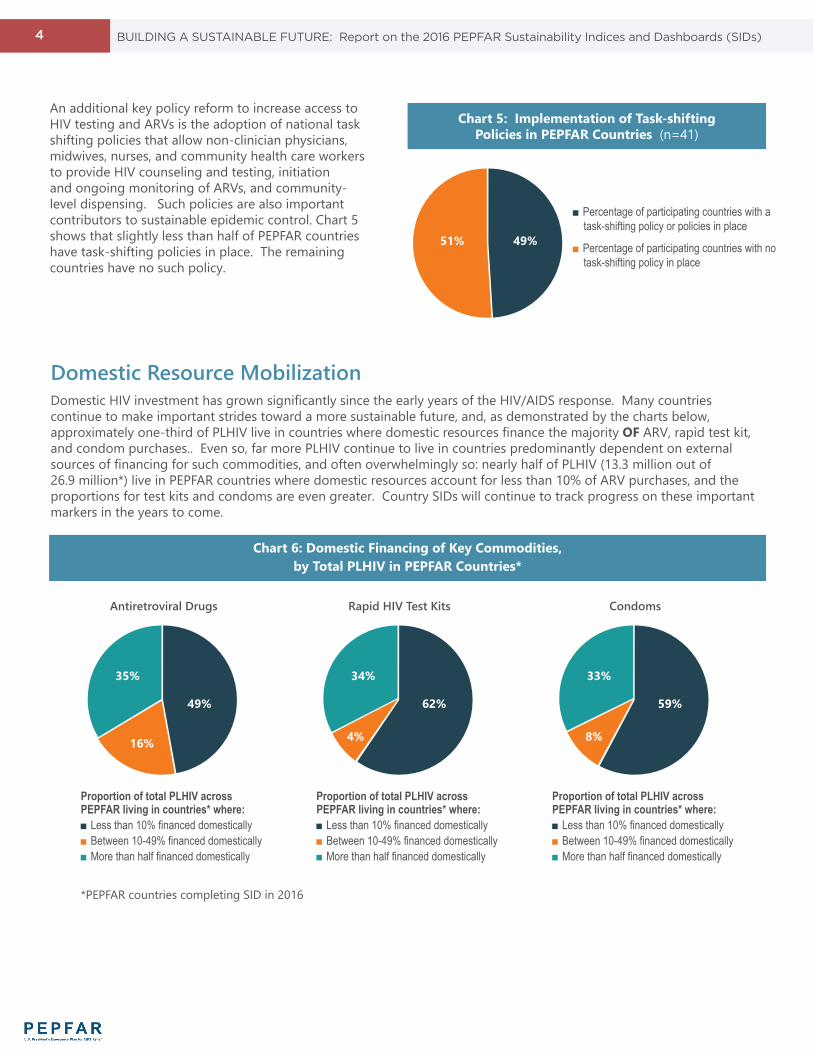
PEPFAR has prioritized the adoption of more efficient service delivery models as a critical step to preventing more HIV infections, saving more lives, lowering the long-term cost of the HIV response, and, ultimately, accelerating progress toward ending AIDS by 2030. Reduced clinical visits and ARV pickups for stable patients and same-day initiation of ART are among the most impactful such policy reforms that are tracked by the SID.
Chart 4 shows that approximately three-quarters of PEPFAR countries had adopted at least one of these priority policies, and nearly half had adopted two or more, as of the time the SIDs were completed in early 2016.
Since that time, further steps have been taken by several countries to enact these policies, which will be reflected in the next iteration of SIDs. Similarly, while only six countries noted a policy of Test and Start (“Treat All”) for all populations at the time the SIDs were completed, that number has increased substantially in the subsequent months, an enormous step forward in the march towards sustained epidemic control.
Priority Policies for Impact Chart 4: Adoption of Priority Policies in PEPFAR Countriesas of early 2016
ZambiaTanzaniaUgandaKenyaIndia
DRC
Cameroon
Burundi
Cote d'Ivoire
South Africa
Mozambique
Nicaragua
Nigeria
LesothoMalawi
Zimbabwe
Dominican Republic
JamaicaHonduras
IndonesiaCambodiaThailand
BurmaGhanaGuyana
EthiopiaRwanda
Zwaziland
HaitiBotswana
GuatemalaPNG
El Salvador
PanamaNamibia
Ukraine
Laos
Reduced clinic visits for stable patients
(every 6-12 months)
Same-day initiation of ART
Reduced ARV pickup for stable patients (every 3-6 months)
3
Solid Bar: LTS Hatched Bar: TA/TC
10
9
8
7
6
5
4
3
2
1
01. Planning
and Coordination
2. Policies and
Governance
3. Civil Society
Engagement
4. Private Sector
Engagement
5. Public Access to
Information
6. Service Delivery
7. Human Resources for Health
8. Commodity Security and Supply Chain
9. Quality Management
10. Laboratory 11. Domestic Resource
Mobilization
12. Technical and Allocative Efficiencies
14. Financial/ Expenditure
Data
15. Performance Data
13. Epidemio- logical and Health Data
Domestic HIV investment has grown significantly since the early years of the HIV/AIDS response. Many countries continue to make important strides toward a more sustainable future, and, as demonstrated by the charts below, approximately one-third of PLHIV live in countries where domestic resources finance the majority OF ARV, rapid test kit, and condom purchases.. Even so, far more PLHIV continue to live in countries predominantly dependent on external sources of financing for such commodities, and often overwhelmingly so: nearly half of PLHIV (13.3 million out of 26.9 million*) live in PEPFAR countries where domestic resources account for less than 10% of ARV purchases, and the proportions for test kits and condoms are even greater. Country SIDs will continue to track progress on these important markers in the years to come.
Domestic Resource Mobilization
Chart 6: Domestic Financing of Key Commodities,by Total PLHIV in PEPFAR Countries*
Proportion of total PLHIV across PEPFAR living in countries* where:■ Less than 10% financed domestically■ Between 10-49% financed domestically■ More than half financed domestically
Rapid HIV Test Kits
62%
4%
34%
Proportion of total PLHIV across PEPFAR living in countries* where:■ Less than 10% financed domestically■ Between 10-49% financed domestically■ More than half financed domestically
Condoms
59%
8%
33%
49%
16%
Proportion of total PLHIV across PEPFAR living in countries* where:■ Less than 10% financed domestically■ Between 10-49% financed domestically■ More than half financed domestically
Antiretroviral Drugs
*PEPFAR countries completing SID in 2016
35%
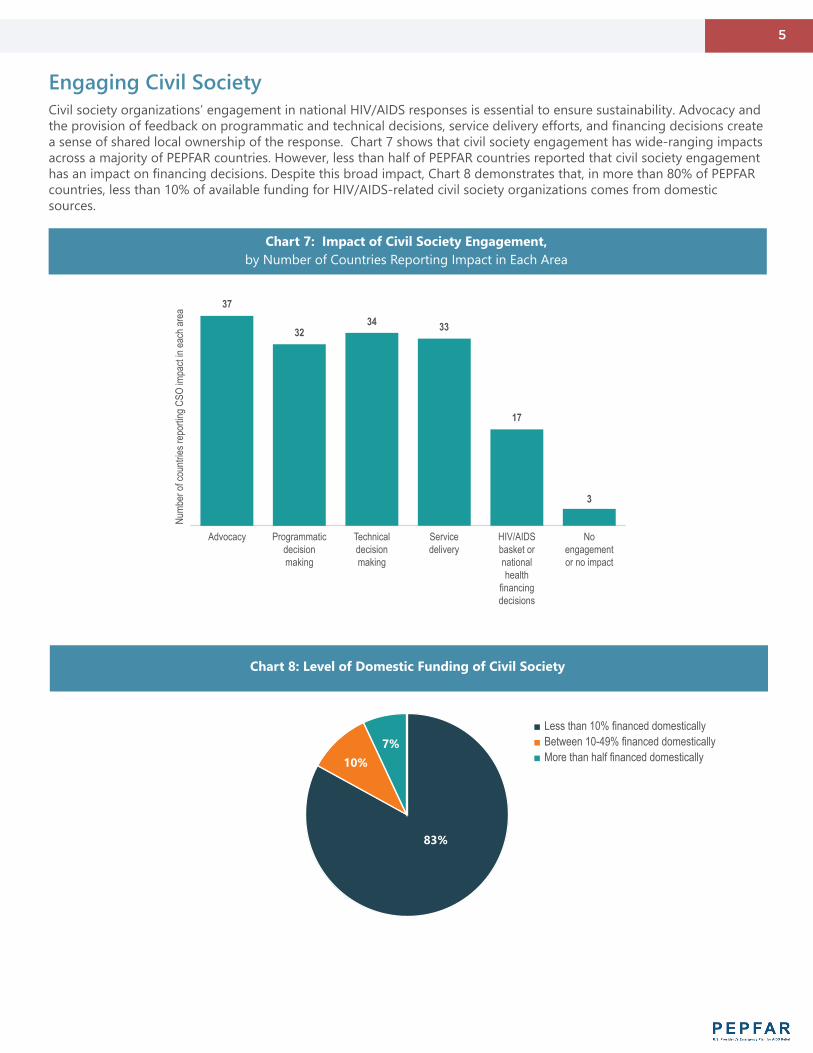
An additional key policy reform to increase access to HIV testing and ARVs is the adoption of national task shifting policies that allow non-clinician physicians, midwives, nurses, and community health care workers to provide HIV counseling and testing, initiation and ongoing monitoring of ARVs, and community-level dispensing. Such policies are also important contributors to sustainable epidemic control. Chart 5 shows that slightly less than half of PEPFAR countries have task-shifting policies in place. The remaining countries have no such policy.
Chart 5: Implementation of Task-shifting Policies in PEPFAR Countries (n=41)
■ Percentage of participating countries with a task-shifting policy or policies in place
■ Percentage of participating countries with no task-shifting policy in place
49%51%
4 BUILDING A SUSTAINABLE FUTURE: Report on the 2016 PEPFAR Sustainability Indices and Dashboards (SIDs)
Civil society organizations’ engagement in national HIV/AIDS responses is essential to ensure sustainability. Advocacy and the provision of feedback on programmatic and technical decisions, service delivery efforts, and financing decisions create a sense of shared local ownership of the response. Chart 7 shows that civil society engagement has wide-ranging impacts across a majority of PEPFAR countries. However, less than half of PEPFAR countries reported that civil society engagement has an impact on financing decisions. Despite this broad impact, Chart 8 demonstrates that, in more than 80% of PEPFAR countries, less than 10% of available funding for HIV/AIDS-related civil society organizations comes from domestic sources.
Chart 7: Impact of Civil Society Engagement,by Number of Countries Reporting Impact in Each Area
Service delivery
HIV/AIDS basket or national health
financing decisions
Noengagementor no impact
Technical decision making
Programmatic decision making
Advocacy
Numb
er of
coun
tries r
epor
ting C
SO im
pact
in ea
ch ar
ea
37
3234 33
17
3
Chart 8: Level of Domestic Funding of Civil Society
83%
10%7%
■ Less than 10% financed domestically■ Between 10-49% financed domestically■ More than half financed domestically
Engaging Civil Society
5
The global HIV response has changed dramatically since PEPFAR was launched in 2003, pivoting from an emergency response characterized by the urgent need to scale up HIV services largely funded by external donors, to one where responsibility is shared among donors, partner governments, civil society, the private sector, and other stakeholders, together united behind the goal of achieving an AIDS-free generation. Today, PEPFAR is engaged in the third phase of the program, focused on sustainable control of the epidemic through a data-driven approach that strategically targets geographic areas and populations where we can achieve the most impact for our investments. Doing so is imperative if we wish to achieve the ambitious 90-90-90 goals set forth by UNAIDS. And wherever countries stand in that effort, it is vital to start planning early to ensure that once epidemic control is achieved, the services, systems, financing, and policies required to maintain that control are available to PEPFAR beneficiaries and partner countries.
For most countries where PEPFAR invests, the road to sustainability is a long one marked by the gradual strengthening of capacities, systems, and national finances. For some, sustainable control of the HIV/AIDS epidemic is beginning to come within sight; for others, despite steady progress, that goal remains some distance down the road. PEPFAR has set out to measure for the first time where countries are situated on the sustainability spectrum, with the aim of providing new data to inform annual PEPFAR investments and an opportunity for a dedicated sustainability dialogue with national stakeholders.
The Sustainability Index and Dashboard (SID) tool, comprising 90 questions spread across 15 elements, was completed in 41 PEPFAR countries (both bilateral and regional programs) during COP 16 with the participation of PEPFAR field staff, government partners, civil society, multilateral agencies, and other stakeholders. The results from the 2016 SID will serve as the baseline against which future iterations of the tool will be compared to track progress over time. Individual country findings from the 2016 SIDs can be found at http://www.pepfar.gov/countries/cop/c71524.htm.
This report contains analysis that looks across 41 national SIDs that were completed during COP 16 to provide a snapshot of the sustainability landscape across PEPFAR countries. In particular, the following pages focus on:
● Overall findings and scores across all PEPFAR countries
● A comparison of SID scores across LTS and TA/TC countries
● A cross-section of priority policy reforms
● Domestic resource mobilization related to key commodities
● Civil society engagement
It is important to recognize that the SIDs were largely completed between January and March of 2016, and in the months since, several countries subsequently approved policy changes (for example, enacting Test and START, or Treat All, policies) that are not reflected in the SID scores. Such policy changes, and any related increase in score, will be reflected in the next iteration of SIDs.
Photo credit: Sarah Day Smith/PEPFAR