80
REPORT ON THE ANNUAL NATIONAL ASSESSMENTS 2012 GRADES 1 TO 6 & 9

REPORT ON THE ANNUAL NATIONAL ASSESSMENTS
2012
GRADES 1 TO 6 & 9


REPORT ON THE ANNUAL NATIONAL ASSESSMENTS 2012
GRADES 1 TO 6 & 9

IV REPORT ON THE ANNUAL NATIONAL ASSESSMENTS 2012
Published by the Department of Basic Education
222 Struben Street
Private Bag X895, Pretoria, 0001
Telephone: 012 357 3000 Fax: 012 323 0601
Website: http://www.education.gov.za
© Department of Basic Education, 2012
ISBN: 978-1-4315-1559-2

VREPORT ON THE ANNUAL NATIONAL ASSESSMENTS 2012
TABLE OF CONTENTSFOREWORD BY MINISTER . . . . . . . . . . . . . . . . . . . . . . . . . . . . . . . . . . . . . . . . . . . . . . . . . . . . . . . . . . . . . . . .1
EXECUTIVE SUMMARY . . . . . . . . . . . . . . . . . . . . . . . . . . . . . . . . . . . . . . . . . . . . . . . . . . . . . . . . . . . . . . . . . . . .2
1. ANA IN THE EDUCATION SECTOR PLAN . . . . . . . . . . . . . . . . . . . . . . . . . . . . . . . . . . . . . . . . . . . . . . . .4
2. INTERVENTION STRATEGIES . . . . . . . . . . . . . . . . . . . . . . . . . . . . . . . . . . . . . . . . . . . . . . . . . . . . . . . . .6
2.1 Introduction . . . . . . . . . . . . . . . . . . . . . . . . . . . . . . . . . . . . . . . . . . . . . . . . . . . . . . . . . . . . . . . . . . . .6
2.2 Curriculum and Assessment Policy Statement . . . . . . . . . . . . . . . . . . . . . . . . . . . . . . . . . . . . . . . . .6
2.3 Integrated National Literacy and Numeracy Strategy: A Whole-school Approach . . . . . . . . . . . . . .7
2.4 The Annual National Assessment Exemplars . . . . . . . . . . . . . . . . . . . . . . . . . . . . . . . . . . . . . . . . .7
2.5 Curriculum Coverage Instrument . . . . . . . . . . . . . . . . . . . . . . . . . . . . . . . . . . . . . . . . . . . . . . . . . . .8
2.6 National Strategy for Learner Attainment . . . . . . . . . . . . . . . . . . . . . . . . . . . . . . . . . . . . . . . . . . . . .8
2.7 Workbooks . . . . . . . . . . . . . . . . . . . . . . . . . . . . . . . . . . . . . . . . . . . . . . . . . . . . . . . . . . . . . . . . . . . .9
2.8 Integrated Quality Management Systems (IQMS) and District Support . . . . . . . . . . . . . . . . . . . . .10
3. DESIGN AND METHODOLOGY . . . . . . . . . . . . . . . . . . . . . . . . . . . . . . . . . . . . . . . . . . . . . . . . . . . . . . . . 11
3.1 Design Features of ANA 2012 . . . . . . . . . . . . . . . . . . . . . . . . . . . . . . . . . . . . . . . . . . . . . . . . . . . . . 11
3.2 Development of Assessment Instruments . . . . . . . . . . . . . . . . . . . . . . . . . . . . . . . . . . . . . . . . . . . . 11
3.3 Learner Registration . . . . . . . . . . . . . . . . . . . . . . . . . . . . . . . . . . . . . . . . . . . . . . . . . . . . . . . . . . . .14
3.4 Printing, Packing and Distribution of Tests . . . . . . . . . . . . . . . . . . . . . . . . . . . . . . . . . . . . . . . . . . .14
3.5 Test Administration . . . . . . . . . . . . . . . . . . . . . . . . . . . . . . . . . . . . . . . . . . . . . . . . . . . . . . . . . . . . .15
3.6 Marking and Moderation of Learner Scripts . . . . . . . . . . . . . . . . . . . . . . . . . . . . . . . . . . . . . . . . . .16
3.7 Data Capture and Processing . . . . . . . . . . . . . . . . . . . . . . . . . . . . . . . . . . . . . . . . . . . . . . . . . . . .19
3.8 ANA in Independent Schools . . . . . . . . . . . . . . . . . . . . . . . . . . . . . . . . . . . . . . . . . . . . . . . . . . . . .19
3.9 ANA in Special Schools . . . . . . . . . . . . . . . . . . . . . . . . . . . . . . . . . . . . . . . . . . . . . . . . . . . . . . . . .20
4. ANA 2012 RESULTS . . . . . . . . . . . . . . . . . . . . . . . . . . . . . . . . . . . . . . . . . . . . . . . . . . . . . . . . . . . . . . . . .22
4.1 Overall Performance in Average Percentage marks . . . . . . . . . . . . . . . . . . . . . . . . . . . . . . . . . . . .22
4.2 Percentage of Learners Showing Adequate and Higher Achievement . . . . . . . . . . . . . . . . . . . . . .24
4.3 Provincial Trends in the Performance of Grades 1-6 and 9 . . . . . . . . . . . . . . . . . . . . . . . . . . . . . .25
4.4 Analysis by Seven Levels of Achievement . . . . . . . . . . . . . . . . . . . . . . . . . . . . . . . . . . . . . . . . . . .38
4.5 Analysis of achievement by gender . . . . . . . . . . . . . . . . . . . . . . . . . . . . . . . . . . . . . . . . . . . . . . . .46
4.6 AnalysisbyOfficialSchoolPovertyQuintile . . . . . . . . . . . . . . . . . . . . . . . . . . . . . . . . . . . . . . . . . .50
4.7 Analysis of Language Performance by Language of Learning and Teaching . . . . . . . . . . . . . . . . .52
4.8 Performance by District . . . . . . . . . . . . . . . . . . . . . . . . . . . . . . . . . . . . . . . . . . . . . . . . . . . . . . . . . .54
4.9 Comparison of Performance between Public and Independent Schools . . . . . . . . . . . . . . . . . . . .63
4.10 Performance of special schools . . . . . . . . . . . . . . . . . . . . . . . . . . . . . . . . . . . . . . . . . . . . . . . . . . .63
4.11 Comparison of Original Marks with Moderated Marks . . . . . . . . . . . . . . . . . . . . . . . . . . . . . . . . . .65
4.12 Overall Measures of Quality Assurance . . . . . . . . . . . . . . . . . . . . . . . . . . . . . . . . . . . . . . . . . . . . .65
4.13 Limitations of the Study . . . . . . . . . . . . . . . . . . . . . . . . . . . . . . . . . . . . . . . . . . . . . . . . . . . . . . . . . .65
5. CONCLUSION . . . . . . . . . . . . . . . . . . . . . . . . . . . . . . . . . . . . . . . . . . . . . . . . . . . . . . . . . . . . . . . . . . . . .67

VI REPORT ON THE ANNUAL NATIONAL ASSESSMENTS 2012
LIST OF TABLES
Table 1.1: Targets in percentage of learners for 2011 to 20141
Table 3.1: Number of learners registered for ANA
Table 3.2: Number of sampled scripts moderated nationally
Table 3.3: Breakdown of marking centres per province
Table 3.4: Number of independent schools that participated in ANA 2012
Table 3.5: Number of learners in independent schools who wrote ANA, by grade
Table 3.6: Participation of special schools in ANA 2012
Table 4.1: National average percentage marks for Language in 2011 and 2012 (Grades 1–3)
Table 4.2: National average percentage marks for Language in 2011 and 2012 (Grades 4–6 & 9)
Table 4.3: National average percentage marks for Mathematics in 2011 and 2012
Table 4.4: Percentage of learners obtaining at least 50% of the Mathematics marks
Table 4.5: Percentage of learners obtaining at least 50% of the Language marks
Table 4.6: Achievement in Grade 1 Mathematics by province in 2012
Table 4.7: Achievement in Grade 1 Language by province
Table 4.8: Achievement in Grade 2 Mathematics by province
Table 4.9: Achievement in Grade 2 Language by province
Table 4.10: Achievement in Grade 3 Mathematics by province
Table 4.11: Achievement in Grade 3 Language by province
Table 4.12: Achievement in Grade 4 Mathematics by province
Table 4.13: Achievement in Grade 4 Language by province
Table 4.14: Achievement in Grade 5 Mathematics by province
Table 4.15: Achievement in Grade 5 Language by province
Table 4.16: Achievement in Grade 6 Mathematics by province
Table 4.17: Achievement in Grade 6 Language by province
Table 4.18: Achievement in Grade 9 Mathematics by province
Table 4.19: Achievement in Grade 9 Language by province
Table 4.20: Percentage of Grade 3 learners in achievement levels in Mathematics by province
Table 4.21: Percentage of Grade 3 learners in achievement levels in Home Language (HL) by province
Table 4.22: Percentage of Grade 6 learners in achievement levels in Mathematics by province
Table 4.23: Percentage of Grade 6 learners in achievement levels in HL by province
Table 4.24: Percentage of Grade 6 learners in achievement levels in First Additional Language (FAL) by province
Table 4.25: Percentage of Grade 9 learners in achievement levels in Mathematics by province
Table 4.26: Percentage of Grade 9 learners in achievement levels in HL by province
Table 4.27: Percentage of Grade 9 learners in achievement levels in FAL by province
Table 4.28: Average marks in Mathematics by grade and poverty quintile
Table 4.29: Average marks in HL by grade and poverty quintile
Table 4.30: Average marks in FAL by grade and poverty quintile
Table 4.31: Average marks in HL by grade and language of learning and teaching (Grades 1–3)
Table 4.32: Average marks in HL by grade and language of learning and teaching (Grades 4–6 & 9)
1 Targets for Grade 9 will be set once the baseline has been established from the ANA 2012 results.

VIIREPORT ON THE ANNUAL NATIONAL ASSESSMENTS 2012
Table 4.33: Average marks in FAL by grade and language of learning and teaching (Grades 4–6 & 9)
Table 4.34: Mean percentages for Grade 3 for districts in each province for Language and Mathematics
Table 4.35: Mean percentages for Grade 6 for districts in each province for Language and Mathematics
Table 4.36: Mean percentages for Grade 9 for districts in each province for Language and Mathematics
Table 4.37: Average marks in Mathematics by grade and school type
Table 4.38: Average marks in HL by school type for Grade 3
Table 4.39: Average marks in Language by school type for Grade 6
Table 4.40: Average percentage marks for Grade 3 in Home Language and Mathematics in Special Schools
Table 4.41: Average percentage marks for Grade 6 in Languages and Mathematics in Special Schools
Table 4.42: Comparison between original and moderated marks

VIII REPORT ON THE ANNUAL NATIONAL ASSESSMENTS 2012
LIST OF FIGURESFigure 4.1: National average percentage marks for Language in 2011 and 2012 (Grades 1–3)
Figure 4.2: National average percentage marks for Language in 2011 and 2012 (Grades 4-6 and 9)
Figure 4.3: National average percentage marks for Mathematics in 2011 and 2012
Figure 4.4: Provincial average percentage marks for Grade 1 Mathematics in 2011 and 2012
Figure 4.5: Provincial average percentage marks for Grade 1 Language in 2011 and 2012
Figure 4.6: Provincial average percentage marks for Grade 2 Mathematics in 2011 and 2012
Figure 4.7: Provincial average percentage marks for Grade 2 Language in 2011 and 2012
Figure 4.8: Provincial average percentage marks for Grade 3 Mathematics in 2011 and 2012
Figure 4.9: Provincial average percentage marks for Grade 3 Language in 2011 and 2012
Figure 4.10: Provincial average percentage marks for Grade 4 Mathematics in 2011 and 2012
Figure 4.11: Provincial average percentage marks for Grade 4 Language in 2011 and in 2012
Figure 4.12: Provincial average percentage marks for Grade 5 Mathematics in 2011 and 2012
Figure 4.13: Provincial average percentage marks for grade 5 language in 2011 and in 2012
Figure 4.14: Provincial average percentage marks for Grade 6 Mathematics in 2011 and 2012
Figure 4.15: Provincial average percentage marks for Grade 6 Language in 2011 and 2012
Figure 4.16: Percentage of grade 3 learners in achievement levels in Mathematics by province
Figure 4.17: Percentage of Grade 3 learners in achievement levels in Home Language by province
Figure 4.18: Percentage of Grade 6 learners in achievement levels in Mathematics by province
Figure 4.19: Percentage of Grade 6 learners in achievement levels in Home Language by province
Figure 4.20: Percentage of Grade 6 learners in achievement levels in First Additional Language by province
Figure 4.21: Percentage of Grade 9 learners in achievement levels in Mathematics by province
Figure 4.22: Percentage of grade 9 learners in achievement levels in Home Language by province
Figure 4.23: Percentage of grade 9 learners in achievement levels in First Additional Language by province
Figure 4.24: Average percentage marks in Grade 3 Mathematics by gender
Figure 4.25: Average percentage marks in Grade 3 Home Language by gender
Figure 4.26: Average percentage marks in Grade 6 Mathematics by gender
Figure 4.27: Average percentage marks in Grade 6 Home Language by gender
Figure 4.28: Average percentage marks in Grade 6 FAL by gender
Figure 4.29: Average percentage marks in Grade 9 Mathematics by gender
Figure 4.30: Average percentage marks in Grade 9 Home Language by gender
Figure 4.31: Average percentage marks in Grade 9 FAL by gender
Figure 4.32: Average percentage marks in Grade 3 by subject and poverty quintile
Figure 4.33: Average percentage marks in Grade 6 by subject and poverty quintile
Figure 4.34: Average percentage marks in Grade 9 by subject and poverty quintile
Figure 4.35: Average percentage marks in Grade 1 Home Language
Figure 4.36: Average percentage marks in Grade 2 Home Language
Figure 4.37: Average percentage marks in Grade 3 Home Language

1REPORT ON THE ANNUAL NATIONAL ASSESSMENTS 2012
FOREWORD BY MINISTER It is my proud privilege to announce the performance of learners who wrote the
Annual National Assessment (ANA) during the week of 18–21 September 2012.
GovernmenthasidentifiedtheAnnualNationalAssessmentasastrategictoolfor
monitoring and improving the level and quality of basic education, with a special
focus on the foundational skills of Literacy and Numeracy.
The ANA was written by all Grades 1 to 6 and Grade 9 learners, in public schools,
including special schools and state-funded independent primary schools in South
Africa. In excess of 7 million learners across more than 24 000 schools wrote the
ANA in 2012.
The ANA 2011 results gave us a measured picture of levels of performance at primary school level in Literacy and
NumeracyatthekeytransitionalstagesofGrades3and6forthefirsttimeinourcountry.Theresultsprovidedan
important baseline in relation to the 2014 targets.
The ANA 2012 Report provides Grades 1 to 6 and 9 results on learner achievement. Since Grade 9 results are
releasedforthefirsttime,theyshouldenabletheDepartmenttonowestablishanobjectivenationalbenchmarkby
which to measure Language and Mathematics achievement levels at the end of the Senior Phase.
It is critical that the ANA data be effectively utilised at all levels of the system to sustain Government’s solid electoral
mandate and to demonstrate that measurable delivery is taking place in the basic education sector. ANA provides
valuable evidence on how the various strategies and interventions which the Department has implemented over the
last few years are impacting on learner performance.
It is important to note that while there has been some improvement in the achievement of learning outcomes in most
grades in 2012, we still have a long way to go towards realising the desired 60% threshold of learners mastering the
minimum Language and Mathematics competencies by the end of Grades 3, 6 and 9.
I invite all education stakeholders and the broader South African public to receive this Report and view it as an
important milestone towards tracking progress in the achievement of learning outcomes in our schools as we improve
the quality of basic education.
MRS ANGELINA MATSIE MOTSHEKGA, MP
MINISTER OF BASIC EDUCATION
DATE: 3 DECEMBER 2012

2 REPORT ON THE ANNUAL NATIONAL ASSESSMENTS 2012
EXECUTIVE SUMMARYThe improvement of the quality of basic education has been identified as the top priority of the SouthAfrican
Government on which the Department of Basic Education (DBE) has to deliver. Within this context, the Annual National
Assessment (ANA) is a critical measure for monitoring progress in learner achievement. The Education Sector Plan,
Action Plan to 2014: Towards the Realisation of Schooling 2025,specifies thatANA isa testingprogrammethat
requiresallschoolsinthecountrytoconductthesamegrade-specificLanguageandMathematicstestsforGrades
1 to 6 and Grade 9.
The choice of subjects to prioritise for monitoring has been informed by the recognition worldwide of Literacy and
Numeracyas thekey foundational skills thatpredispose learners toeffective learning inall fieldsof knowledge.
Several measures, such as the provision of workbooks and the repackaging of the National Curriculum Statement
in the form of the Curriculum and Assessment Policy Statement were put in place this year to improve education. In
addition, the DBE also provided exemplar questions and exemplar tests to schools in the course of the year in order
to ensure that teachers and learners were exposed to the kind of questions they could expect in the Annual National
Assessment.
This report communicateskeyfindings from thesecond large-scalenationalassessment,ANA2012,whichwasconducted in September 2012. Chapter 1 of the report locates ANA within the Education Sector Plan. In Chapter 2 the report foregrounds some of the initiatives and interventions that the DBE and the Provincial Departments of Education (PEDs) put in place to give effect to the intents of the Action Plan. Chapter 3 outlines the design and methodologyoftheANA2012study.TheresultsarereportedinChapter4.Chapter5isasummaryofthekeyfindings
and a proposed plan of action on how the system should respond to the results in the short, medium and long term.
All learners in public schools in Grades 1 to 6 and Grade 9 took curriculum-appropriate tests developed by the DBE in
Language and Mathematics in September 2012. Marking guides/Memorandums were made available to all schools
and tests were marked by the relevant teachers. Departmental procedures and control measures were in place to
ensure that marking was done correctly. Learner scores were captured on a central database to provide system-
wide information on learner achievement at all levels of governance as one of the measures to inform constructive
engagement in order to improve education. While marking the scripts of learners, teachers received immediate
feedback on the strengths and weaknesses of their learners. Schools reported learner achievement in ANA to each
parent.
The overall results for ANA in Grades 1 to 6 point towards a general improvement in the performance of learners
in the ANA tests. In the summary tables below, the average percentage that learners achieved in Language and
Mathematics is indicated.
Summary tables of average percentage marks for Languages in 2011 and 2012
GRADE HOME LANGUAGE 2012 LANGUAGE 2011
1 58 59
2 55 52
3 52 35

3REPORT ON THE ANNUAL NATIONAL ASSESSMENTS 2012
GRADE HOME LANGUAGE 2012 FIRST ADDITIONAL LANGUAGE 2012
LANGUAGE 2011
4 43 34 34
5 40 30 28
6 43 36 28
9 43 35 *
* Grade 9 tests were not written in 2011.
Summary tables for average percentage marks for Mathematics in 2011 and 2012
GRADE MATHEMATICS 2012 MATHEMATICS 20111 68 632 57 553 41 284 37 285 30 286 27 309 13 *
* Grade 9 tests were not written in 2011.
An encouraging observation from the results is the noticeable increase in the performance of learners in Grade 3
in both Language and Mathematics. The acute focus of Government in strengthening basic skills at the foundation
phase is starting to have a positive impact and is encouraging for the system going forward. It should, however, be
noted that the Grade 9 performance of learners in Mathematics is below expectation and will therefore receive the
immediate attention of the DBE through additional and more intensive structured intervention programmes.
The positive achievement of the 2012 learner cohort is also indicated in the number of learners achieving the required
competencies of content knowledge for the respective grades. In 2012, noticeable increases were obtained in both
Grades 3 and 6. For example, in Grade 3 Mathematics, the number of learners achieving at least 50% increased
from 17% in 2011 to 37% in 2012. In Grade 6 Mathematics, the number of learners achieving at least 50% decreased
from 12% in 2011 to 11% in 2012.
ThepurposeoftheReportistoenablevarioustiersofeducationtoutilisethefindingsinordertodevisewaysto
improve education. Hence, the Report provides an analysis of achievement of learners at national, provincial and
district levels. An essential feature is the district performance provided for each province.
In addition, the analysis is contextualised for broader intersectoral interventions within and across Government
departments and social partners by providing achievement results according to gender, poverty index quintiles and
the language of teaching and learning. The immediate target, however, is the various tiers of education with the
intentionofsupplyingcredibleinformationtoassistteachers,principalsanddepartmentofficialstostrengthentheir
existing and planned efforts of improving the quality of teaching and learning.

4 REPORT ON THE ANNUAL NATIONAL ASSESSMENTS 2012
1. ANA IN THE EDUCATION SECTOR PLANThe Annual National Assessment (ANA) is an essential initiative at the heart of the Education Sector Plan, Action Plan to 2014: Towards the Realisation of Schooling 2025. The key thrust and long-term focus of the Sector Plan, hereafter referred to as the Action Plan, is to improve the quality of basic education. The Action Plan outlines clearandmeasurableoutcomesthattheSectorhasidentifiedwithintheprioritiesofGovernment.Inparticular,theimprovementofthequalityofbasiceducationhasbeenidentifiedasthetoppriorityofGovernmentonwhichtheDepartment of Basic Education (DBE) has to deliver. Within this context, ANA is a critical measure for monitoring progress in achieving set targets in terms of learner achievement.
The Action PlanspecifiesthatANAisatestingprogrammethatrequiresallschoolsinthecountrytoconductthesamegrade-specificLanguageandMathematicstestsforGrades1to6andGrade9.Thechoiceofsubjectstoprioritiseformonitoring has been informed by the recognition worldwide of Literacy and Numeracy as the key foundational skills thatpredisposelearnerstoeffectivelearninginallfieldsofknowledge.Accordingly,thefirstthree(3)ofthe27goalsthat the Education Sector has set for itself address improvements in Literacy and Numeracy at the key transitional grades, viz. Grades 3, 6 and 9, and progress in this regard will be measured through ANA.
Whilst assessment by itself cannot improve learning, it provides important evidence to inform planning and development of appropriate interventions for improvement at all levels, from national through provinces and districts toindividualschools.ThefollowingarethekeywaysinwhichevidencecollectedthroughANA,asspecifiedintheAction Plan, will contribute to improving the quality of learning and teaching in the schools:
Exposing teachers to best practices in assessment. Where the provincial department has implemented province-wide standardised assessments, this has been found to change teacher practices for the better2. What ANA does is this: it exposes all teachers across the country to what national experts consider best practice in assessments. This will give all teachers a clearer idea of how to proceed when they develop their own assessments at critical points in the school year.
Targeting interventions to the schools that need them most. With ANA, districts have a standard source of information to determine which schools are most urgently in need of support. Information from ANA will be used to direct teachers towards particular kinds of teacher development programmes and to engage seriously with school principalsonthespecificsubject-basedchallengesconfrontinghis/herschool.
Giving schools the opportunity to pride themselves in their own improvement. ANA makes it possible for primary schools to do what secondary schools have been able to do for many years, with the Grade 12 results. The Grade 12 results are used as a common yardstick to measure improvement over the years. This will allow schools to take pride in knowing that the efforts to improve the teaching and learning in the school is producing the desired outcomes.
Giving parents better information on the education of their children. Parents have a right to know how well the schools they send their children to perform. If the results in the school are below what it should be, then ANA provides a good basis for parents to ask the school questions about what is wrong and to become involved in putting together a plan for the school that will improve the situation.
2 This was found in a series of case studies of poorly performing schools in the Western Cape conducted by Stellenbosch University in 2010.

5REPORT ON THE ANNUAL NATIONAL ASSESSMENTS 2012
As stated in the Action Plan, some of the mechanisms through which the DBE has planned to bring about improvements in the achievement of measurable learning outcomes of a high quality include:
(a) Attracting young, motivated and appropriately trained teachers into the profession
(b) Ensuring that learners cover all the topics and skills that they should cover in a current school year
(c) Ensuring that every learner has access to the minimum set of textbooks and workbooks required according to national policy
(d) Improving access of children to quality Early Childhood Development (ECD) below Grade 1
Marshalling the above and a number of other strategies and mechanisms, and working with the community and other stakeholders,theDBEhassetitselfspecifictargetsatthekeytransitionalgradesandthesewillbemonitoredandtracked through ANA results. The national targets that the DBE has set in the Medium Term Expenditure Framework (MTEF) have been summarised in Table 1.1.
Table 1.1: Targets in percentage of learners achieving 50% and above, for 2011 to 20143
GRADE LANGUAGE MATHEMATICS
2011 2012 2013 2014 2011 2012 2013 2014
3 53 55 58 60 53 55 58 60
6 46 51 55 60 35 44 52 60
The overarching goal, as per the injunction of the President of the Republic of South Africa in the State of the Nation Address in 2010, is that by 2014, at least 60% of learners in Grades 3, 6 and 9 should achieve acceptable levels (i.e. 50% and above) of competency in Language and Mathematics.
3 Targets for Grade 9 will be set once the baseline has been established from the ANA 2012 results.

6 REPORT ON THE ANNUAL NATIONAL ASSESSMENTS 2012
2. INTERVENTION STRATEGIES2.1 Introduction
The DBE, working together with the PEDs, has taken great strides to implement and give effect to the intents of the Action Plan. In this chapter, some of the key intervention strategies that have been put in place prior to the conduct of ANA 2012 have been highlighted. The strategies range from the review of the curriculum, the launch of a comprehensive Literacy and Numeracy strategy, comprehensive feedback that was given to schools following the release of ANA 2011 results, learner support materials placed in the hands of teachers and learners, and support given to districts. This chapter serves to describe the context within which the results of ANA 2012 need to be interpreted, although any direct causal relationships between the actions taken and the outcomes should only be made with considered caution.
2.2 Curriculum and Assessment Policy Statement
South Africa has experienced numerous educational challenges that, at various points in time, necessitated a curriculum review. The democratic South Africa has, to date, experienced two curriculum reviews. The reviews were largely dictated to by observed low levels of learner performance and inadvertent curriculum implementation ambiguities thatmade it difficult for teachers to teacheffectively.Tomitigate the challengesassociatedwith theNational Curriculum Statement (NCS, Grades R–9), the re-packaged curriculum, NCS (Grades R–12), with its essential component called the Curriculum and Assessment Policy Statement (CAPS), was introduced from the beginning of 2012. The curriculum for Grades R–12 has been streamlined and strengthened in CAPS. The content hasbeensimplifiedandmadeclearer.ContentcoveragepertermforeachgradehasbeenmappedoutinCAPS.CAPS has been planned to be implemented incrementally per phase in the General Education and Training (GET) and Further Education and Training (FET) bands as follows: Grades R–3 and Grade 10 in 2012, Grades 4–6 and Grade 11 in 2013 and Grades 7–9 and Grade 12 in 2014.
International and regional studies indicated that South African learners tended to achieve below acceptable levels in reading, writing and counting. The CAPS provide teachers with curriculum and assessment statements that are clear, succinct and unambiguous to enable them to improve learners’ Numeracy and Literacy skills effectively. For instance, since number concept development is critical in the early years of schooling, the main focus in terms of teaching and learning time is given to the content area of Mathematics that deals with Numbers, Operations and Relationships. It is envisaged that the mastery of this content area will contribute immensely to the general Mathematics competency of learners. Mental Mathematics, which is also credited for its ability to enhance the development of number sense and number concept, features prominently in the curriculum, especially in the primary school Mathematics.
In order to improve performance in Literacy in the Foundation Phase, the Languages CAPS are packaged according to the following critical skills: Listening and Speaking, Reading and Phonics, Handwriting and Writing, and Language Structures and Use (Conventions). Given their critical importance, disproportionately more time is provided for teaching of these skills in the schools. The packaging of the CAPS takes learners back to basics in a systematic order. They are expected to master sounds (vowels and consonants) and letters to prepare their speaking and listening and writing skills. They are therefore expected to have full mastery of phonics in order to develop proper construction of words, sentences, paragraphs and stories. It is envisaged that full implementation of the Languages CAPS will eradicate the current poor performance of learners in literacy.

7REPORT ON THE ANNUAL NATIONAL ASSESSMENTS 2012
The Intermediate Phase and the Senior Phase Languages CAPS are packaged according to four skills: Listening and Speaking, Reading and Viewing, Writing and Presenting, and Language Structures and Conventions. Again, the teaching of these skills is allocated disproportionately more time in the schools. The Language Structures and Conventions are allocated relatively less time. However, in real terms, the allocation of teaching time is such that teaching of concepts and skills that can be integrated across subjects is allocated more time. The CAPS content is packaged over a two-week cycle in each school term, thereby affording teachers an instrument that will ensure curriculum coverage over a particular period.
2.3 Integrated National Literacy and Numeracy Strategy: A Whole-school Approach
Following the release of the ANA results in June 2011, a National Strategy to improve Literacy and Numeracy achievement in all schools was implemented. The strategy introduced systems, processes and procedures that are aimed at improving classroom practice and learner achievement in the short term, and maintain that improvement over the medium to long term. Given that improved Literacy and Numeracy achievement has been acknowledged as the key thrust to improving the quality of basic education, this strategy will also serve as a platform to improve effectivenessofschoolsanddistrictofficesingeneral.
In essence this strategy:
(a) Promotes and drives the literacy and numeracy and will make a lasting impact on the quality of education over the next two years, with the impact continuing through the longer term
(b) Introduces a common implementation plan to pursue the literacy and numeracy targets for Grades 1–9, as outlined in the Action Plan to 2014
(c) Integrates several substrategies, specifically teacher development, curriculum support materials, ICT ineducation, and accountability systems, to enrich the Literacy and Numeracy strategy
(d) Prioritises the poor-performing schools in the poor-performing districts (which are most likely to be quintiles 1–3 schools) for special and sustained monitoring, support and intervention. Grades 3, 6 and 9 were targeted for specialised attention in 2012 and moving to 2013, as were Grades 2, 5 and 8 in 2012. It is these learners’ performance in ANA 2013 that will determine the rate of progress made towards achieving the targets
(e) Introduces an intensive programme of monitoring for support and intervention at school, district or provincial and DBE level to ensure that the plan remains on track at all times
The strategy assists in strengthening the capacity of teachers to deliver the Literacy and Numeracy curriculum inparticular,andforallmanagersinthesector(schoolprincipals,district,provincialandDBEofficials)toproviderelevant and adequate support to both teachers and learners to ensure that the quality of education is improved dramatically over the next two critical school years.
2.4 The Annual National Assessment Exemplars
Schools were made aware of the nature of the ANA tests to be expected through ANA test exemplars. ANA test developers developed three sets of exemplars, a set each for the three terms, for Languages and Mathematics. The purpose was to expose teachers to the different ways of questioning that may best suit different learning styles of learners, without compromising the skill assessed. Teachers could then select items from exemplars and compile their own class tests.

8 REPORT ON THE ANNUAL NATIONAL ASSESSMENTS 2012
In addition, sets of full exemplar/model tests and marking guidelines were also developed, which were meant to exposelearnerstoafully-fledgedtest,andafterhavingtakenthesetestexemplars,learnerswouldhavemusteredthenecessaryconfidencetoconfrontthefinalANAtestswritteninSeptember2012.Theexemplartestswerealsoaccompanied by ANA Assessment Guidelines, which listed the content to be covered in the September 2012 tests. These Assessment Guidelines were important as the tests were written in September in the third term. Therefore, teachers had to be made aware of the curriculum coverage to be included in the test. Schools, teachers and learners were expected to have gone through these exemplars and exemplar tests before learners could write ANA in September 2012.
The publication of the ANA Assessment Guidelines and exemplar tests for Grades 1, 3, 6 and 9 in the July and August newspaper supplements also assisted in making teachers, parents and learners aware of the scope and depth of ANA. Overall, the system was fairly well prepared for ANA 2012.
2.5 Curriculum Coverage Instrument
The DBE has developed a national instrument to monitor curriculum coverage in schools. It focuses on intensifiedmonitoring, guidance, control and support of teaching and learning and gives prominence to the following aspects of curriculum delivery:
(a) Ensuring full curriculum coverage in all grades
(b) Improving the quantity of assessment tasks in all grades
(c) Giving more written work to learners
(d) Optimal use of teaching and learning time
(e) Instilling and maintaining the culture of discipline
(f) Ensuring regular attendance by teachers and learners
(g) Regular monitoring of the achievement of the set of goals per subject
Theinstrumentisamanagementtoolusedbycurriculumofficialsduringschoolsupportvisitstotrackprogresswiththe completion of the syllabus.
2.6 National Strategy for Learner Attainment
To give effect to the intent of the Action Plan to improve learner performance, the DBE has developed a National Strategy for Learner Attainment (NSLA). The objectives of this strategy are as follows:
(a) Sustained improvement in learner outcomes or performance
(b) Enhanced accountability at all levels of the system
(c) Greater focus on basic functionality of schools
(d) Protecting teaching and learning time
(e) Improved support for teaching and learning
(f) Increased efforts on time on task

9REPORT ON THE ANNUAL NATIONAL ASSESSMENTS 2012
In January 2012 at the NSLA Lekgotla, certain strategic interventions were announced and the PEDs drew up implementation, monitoring and support plans for the following targeted interventions:
(a) Development of management and leadership
(b) Comprehensive teacher development programme
(c) Resource provisioning
(d) Efficientschoolsupport
(e) General education and training support
(f) Enhancingproficiencyoflanguages
(g) Maths and Science improvement
(h) Protecting teaching time and quality contact time during teaching and learning
(i) Effective implementation of credible assessment and examinations
(j) Adding value to the development of the learner
Regular reports on progress with the NSLA interventions have been received from the Provincial Curriculum and District Heads. The NSLA has gained momentum as it has given effect to the launching of the Learner Attainment Improvement Strategy (LAIS) at national, provincial, district and school level in support of improving learner performanceinbothLiteracyandNumeracyinANA2012inGrades1to9andtheNationalSeniorCertificateforGrade 12 across the system.
2.7 Workbooks
Goal 19 of the Action Plan states the following:
Ensure that every learner has access to a minimum set of textbooks and workbooks required according to National policy.
During the 2011 academic year the DBE distributed Literacy and Numeracy workbooks for over 11 million learners (Grades 1–6). In 2012, Mathematics workbooks were also printed and distributed to learners in Grade 9. This intervention serves the following purposes:
(a) Ensuring that schools that lacked learning resources and photocopying facilities would be supported through the provision of worksheets
(b) Providing a variety of activities to reinforce Literacy/Language and Numeracy skills
(c) Introducing learners to the language and concepts required for learning and understanding their other subjects
(d) Assisting teachers to focus, in a targeted manner, on the skills that learners should be acquiring in each grade as outlined in the curriculum
(e) Helping teachers to monitor learners’ performance in key activities, and preparing learners for the formats used in various standardised assessments
Each workbook is made up of at least 128 easy-to-follow worksheets to improve listening, reading, writing and mathematical skills.

10 REPORT ON THE ANNUAL NATIONAL ASSESSMENTS 2012
The workbook package contains the following books:
• Alearners’workbookinHomeLanguage(HL)(thatis,inalltheelevenofficiallanguages)forGrades1to6
• AMathematicsworkbookinalltheofficiallanguagesforGrades1to3andintwoofficiallanguagesforGrades4 to 9
• A workbook in English First Additional Language (FAL) per learner for Grades 1 to 6
The workbooks were developed in synchronisation with the CAPS. Therefore, they assist teachers in pacing and sequencing their work better as they consist of attractive worksheets to be worked on daily and on a term-by-term basis.Theworkbookshaveinfluencedtheteachers’practiceandclassroommanagement.Theyhavealsoincreasedlearners’ interest and participation in the lessons, thereby improving their reading, writing and calculations skills in the process.
2.8 Integrated Quality Management Systems (IQMS) and District Support
A total of 70 external moderators were deployed in all provinces to monitor and evaluate, amongst others, the implementation of the IQMS in schools, as well as the quality of internal and external assessment results (e.g. ANA). They also monitored the quality and implementation of the school’s intervention strategies emanating from the ANA results. This entailed monitoring, if schools were using the ANA results to develop their improvement plans. It was encouraging to note that, based on these evaluations, most schools were systemically maintaining their assessment records and developing improvement plans. The IQMS moderators also provided support to schools in this regard, where possible. It was also established that subject advisors maintained a visible presence at schools in certain provinces and in these provinces, subject advisors could be relied upon to support teachers in the implementation of the curriculum. It was also reported that these subject advisors paid regular visits to these schools. Circuit managers in most provinces were also providing good support to schools through personal visits, written communications and telephonic support.

11REPORT ON THE ANNUAL NATIONAL ASSESSMENTS 2012
3. DESIGN AND METHODOLOGY3.1 Design Features of ANA 2012
ANA is premised on the principle that effective testing will assist in diagnosing learner shortcomings, which will serve as valuable feedback to schools, teachers, learners and parents. This feedback will assist schools in the development of intervention strategies for learner improvement.
ANA tests were based on the National Curriculum Statement (NCS) for Grades 4–6 and 9, while for Grades 1–3 it was based on the Curriculum and Assessment Policy Statement (CAPS), introduced in the Foundation Phase in 2012.
Key design features of ANA 2012 included the following:
(a) The test focused on two subjects, i.e. Mathematics and Languages, which are regarded as the foundational skills for further learning.
(b) The assessment targeted the terminal points in each phase, i.e. Grades 3, 6 and 9. The other grades, i.e. Grades 1, 2, 4 and 5, were also tested so as to obtain a holistic picture of performance in the GET band.
(c) In the foundation phase, learners were tested in their mother tongue, which is the language of learning and teaching. In the intermediate and senior phases, the tests were administered in the two languages of teaching and learning, which is either English or Afrikaans.
(d) Languages in the intermediate and senior phases were offered at HL and FAL level.
(e) Testspecificationsorframeworksguideditemandtestdevelopment.Twoformsofeachtestweredevelopedandpiloted.Basedonthepilotresultsafinaltestwascompiled.
(f) Anchor items from the ANA 2011 test were included in the 2012 test, so as to allow for a comparison of learner performance across years.
(g) The tests were taken by all learners at a school and were administered by a teacher from the school, but not the regular class teacher.
(h) Asampleofschoolsperprovinceweresubjectedtoaverificationprocesssoastoensurethevalidityofthedata being collected.
(i) To quality assure the marking process, a sample of scripts per class, per grade, per school were marked centrally at the provincial level, under the supervision of the provincial department.
(j) All learners writing the Annual National Assessment were registered on a national data base and the marks of learners were captured on the national data base.
3.2 Development of Assessment Instruments
(a) Test specification frameworks
Thetestspecificationframeworkprovidedadetailedoutlinetoteachersandlearners,andthescopeanddepthofeach of the tests. These tests were administered in September 2012 and therefore there was a need to avoid any confusionoftheareasthatwillbetested.ThetestspecificationframeworksweredevelopedbythetestdeveloperswhoareexperiencedsubjectexpertsappointedbytheDBE.Thetestspecificationframeworkincludedthelearningoutcomes,thenumberofitemsperskill,questiontypes,thecognitivelevelstobetestedandthedifficultylevelsofquestions.Theframeworkalsospecifiedthedurationandthetotalnumberofmarksforthetest.

12 REPORT ON THE ANNUAL NATIONAL ASSESSMENTS 2012
Inthe2012ANAcycle,thedistributionofquestiondifficultyinallthetestswassetat20%easy,60%moderateand20%difficult. InLanguage,a fewopen-endedquestions required learners toprovideshortanswerswhileothersdemanded them to demonstrate creative writing skills. In Mathematics, a few questions needed simple recall of assumed knowledge while others demanded the demonstration of complex problem-solving skills.
(b) Setting of tests
The tests were developed by panels of subject experts who were appointed as test developers and this included teachers currently teaching the grade and the subject, as well as subject advisors and curriculum specialists. Each panel comprised two test developers, a moderator and editors. This team developed the test prototype in English, and a panel of ‘versioners’ were responsible for versioning the English test to the other 10 languages in the case of the foundation phase and into Afrikaans for the intermediate and senior phases. After the test was versioned, it was edited by an editor for each of the 10 languages. Editors of the different languages sat together to discuss the changes as a standardisation measure and to make sure that there was no compromise to the test frameworks.
Piloting of test items
The tests for Grades 3, 6 and 9 were pre-tested as part of the testing protocol to ensure the validity and fairness of the test items. The pre-testing involved the administering of the test items on a sample of learners, the scoring of these itemsandthestatisticalanalysisoftheseitemswhichprovidesdataontheirsuitabilityforinclusioninthefinaltest.
The tests were prepared for the pre-testing and this entailed packaging two forms of the test, i.e. Form A and Form B, per subject, per grade and language. The two tests were piloted in 85 schools across nine provinces. The 85 schools were selected through a purposive sample representing the school population.
In each of the sampled schools 25 learners in a grade were randomly selected to take both the Language and Mathematics tests.Teachers fromsampledschoolsadministered the testsandweremonitoredbyDBEofficials.The tests were marked by selected teachers. Marked scripts were then forwarded to the DBE and a team of data capturers captured the scores per item, per test. The scores per item were statistically analysed.
Piloting the tests ensured the following:
• Suitability of each test for the target grade
• The appropriateness of the language of the test
• The clarity (non-ambiguity) of the questions
• The duration of each test and its suitability for the target grade
• Thelevelofdifficultyoftheitemsineachtest
• Gender, cultural, linguistic and other biases in the test items
• Validity and reliability of the test as a whole

13REPORT ON THE ANNUAL NATIONAL ASSESSMENTS 2012
Refinement of test items
Resultsfromtheanalysiswereusedbytestdevelopersandmoderatorstofinalisethetestsbychoosingthemostsuitable items from Forms A and B, in line with the test framework.
An attempt was made to link the 2012 test to the 2011 test by repeating a few of the items from 2011 in the 2012 test. Thiswas,however,onlypossibleforsomegradesandspecificallywithMathematics.LanguagetestsforGrades4 to 6 could not link items from 2011, given that the language tests in 2011 were not demarcated into HL and FAL.
(c) Test review
ThetestswerereviewedfirstbyaninternalmoderatorappointedbytheDBEandthenforwardedforexternalreviewto the members of an Advisory Committee, who comprised both local (national) and external (international) experts. The Advisory Committee was appointed by the Director-General to provide advice on the broader issues relating to ANA and to provide expert opinion on the construction and design of the tests.
The members of the Advisory Committe included the following:
• Roelien Herholdt (Joint Education Trust)
• Dr Surette van Staden (University of Pretoria)
• Mr Mathews Makgamathe (Human Science Research Council)
• Dr Eunice Greer (US Department of Education Institute of Education Sciences)
• Dr Emmanuel Sikali (Harvard University, School of Education)
• Dr V. Govender (University of Fort Hare)
• Dr William Lorie (Metrica Research Associates,USA)
• Professor Anil Kanjee (Tshwane University of Technology)
Members of the Advisory Committee were provided with the tests, memoranda, test frameworks and National Curriculum Statement (NCS) for Grades 4–6 and 9, as well as the Curriculum and Assessment Policy Statement (CAPS) for Grades 1 to 3, so as to allow them to make their inputs on the basis of the curriculum statements.
Moderators and test developers were provided with the inputs from the Advisory Committee and changes were made to the tests, accordingly.
The tests were then adapted for learners with barriers to learning and this included blind and deaf learners. In the case of blind learners, the tests were Brailled by service providers appointed for this task.
(d) Formatting and proofreading
Thetestswereformatted(layout)togivethemanaestheticandprofessionallook.Editorsinallofficiallanguagesedited the tests to ensure that there were no linguistic or typographical errors. Final editing and quality assurance of theANAtestsweredonebytheDBEeditorswhohaveworkedwiththeNationalSeniorCertificate(NSC)toensurethat an equivalent standard is maintained.

14 REPORT ON THE ANNUAL NATIONAL ASSESSMENTS 2012
3.3 Learner Registration
One of the critical areas of weakness with the management of the 2011 ANA was the capturing of learner data from approximately 20 000 schools and six million learners. Therefore, the establishment of a dependable national learner database was of critical importance in the implementation of ANA 2012. It was, therefore, imperative that the Department of Basic Education (DBE), together with the provincial education departments (PEDs), establish a well-definedregistrationprocesssupportedbyadependableInformationTechnology(IT)systemtoensurethatthe2012 ANA data would be accurately captured and processed. This would also facilitate a high degree of precision intheplanningandpreparationofANAactivities.Thestatisticsgeneratedfromthedatabasewouldprovidespecificassessment information on learners currently enrolled in Grades 1 to 6 and 9 in all public and participating independent schools.
At the start of the school year in January 2012, each school completed a registration form for their learners participating in the 2012 ANA. The registration form required a class level, the language of learning and teaching (LOLT), unique identifierinformationforeachlearner,theassessmentlevel(HLorFAL)fortestingandanindicationofthespecialneeds category, if applicable.
The registration forms were collected by the districts and submitted to a service provider, based in each province, that took responsibility for the capturing of the registration data. After the data was captured on the IT system, registration schedules of the captured data was printed and submitted to schools for validation by school principals. Corrections wereindicatedontheschoolschedulesandthesewerecapturedontheITsystem.Provincialofficialsensuredthatthe registration process was correctly and accurately completed for all public and state-funded independent schools. The registration process closed in August 2012.
ThestatisticsonregisteredlearnersarereflectedinTable 3.1.
Table 3.1: Number of learners registered for ANA
PROVINCE GRADE 1 GRADE 2 GRADE 3 GRADE 4 GRADE 5 GRADE 6 GRADE 9 TOTAL
Eastern Cape 215 321 179 411 163 194 158 399 151 580 149 519 148 828 1 166 252
Free State 65 665 58 178 51 139 53 188 50 633 50 742 67 045 396 590
Gauteng 195 601 172 495 157 972 150 006 145 757 148 367 166 483 1 136 681
KwaZulu-Natal 287 086 247 075 221 499 218 267 212 283 232 372 214 537 1 633 119
Limpopo 145 242 132 425 118 256 121 721 119 308 125 152 194 165 956 269
Mpumalanga 118 298 104 040 91 871 93 061 92 348 93 501 105 261 698 380
Northern Cape 28 260 24 939 23 566 24 616 23 461 23 243 23 228 171 313
North West 78 594 73 101 65 368 64 809 60 311 60 131 62 766 465 080
Western Cape 103 425 88 477 81 498 83 916 79 900 79 205 88 901 605 322
National 1 237 492 1 080 141 974 363 967 983 935 581 944 397 1 089 049 7 229 006
The total number of learners registered for ANA was 7 229 006. The number of learners in Grade 1 was the largest. The number of boys was 3 736 422 and the number of girls was 3 467 869, so slightly more boys than girls were registered. For 27 715 learners the gender was not indicated. There were 23 580 public schools and 813 independent schools that registered learners.

15REPORT ON THE ANNUAL NATIONAL ASSESSMENTS 2012
3.4 Printing, Packing and Distribution of Tests
Two parallel processes for the printing, packing and distribution of ANA test materials were employed. The DBE printed for provinces (Free State, Gauteng, Limpopo and Northern Cape) that indicated that they could not print according to the provided Norms and Standards for Printing, Packing and Distribution of ANA test materials. Eastern Cape, KwaZulu-Natal, Mpumalanga, North West and Western Cape printed in-house, in line with the Norms and Standards.PrintingwasdonecentrallythroughaserviceprovidersecuredbytheDBEforthefirstfourprovincesandineachofthefiveprovincesthatprintedin-house.Theprintingwasquality-assuredaccordingtotheNormsandStandards,forexamplethesigningoffofproofsandthecontinuousmonitoringofthequalityofproofsatthespecifiedintervalsbydesignatedofficials.ThesafetyandsecurityoftheprintingwarehousewerealsospecifiedintheNormsand Standards.
Printedtestswerepackedaccordingtogradeandsubjectperschool.Thetestswerefirstputintotriple-sealedbagsper subject, language and grade before being packed into a labelled box for each school. The printing and packing processwasmonitoredbyDBEandPEDofficials.Theschoolmaterialswerefirstdeliveredtoaprovincialwarehousewheredistrictofficialsperformedmoreverificationofthematerialsperschool.Thiswasdonetwoweeksbeforethetest administration process.
A week before the test administration the materials were delivered to nodal points closer to schools. Only schools that were very far (more than 20 km) from the nodal points collected test materials two working days before the test administration date. The rest of the schools collected the test materials on a daily basis, i.e. the Grade 12 model of test distribution was followed. An audit of all storage areas (provincial warehouse, nodal points and schools, where applicable) was performed during the state of readiness visits, and again closer to the delivery date. All test materials were delivered to the nodal points by 14 September 2012. Each delivery point was allocated with an emergency pack which contained all the tests to cater for shortages, should there be a need. Only Western Cape delivered tests from the provincial warehouse directly to schools on a daily basis.
3.5 Test Administration
To a large extent, the administration of tests was managed by School Management Teams (SMTs) under the overall supervision of school principals. However, given the diversity of school contexts and the need to ensure that tests were administered under controlled and as similar conditions as was possible, a number of standardisation measures were put in place. The following are some of the key measures that were taken to ensure that tests were administered under fair, transparent and credible conditions:
(a) Use of a common timetable
AsearlyasFebruary2012,acommontimetable,whichspecifiedthedates(18–21September2012)andtimesatwhichspecificANAtestsweretobewrittenwasdisseminatedtoallschools.Inadditiontostrengtheningawarenessabout ANA, the timetable also assisted schools to plan appropriately for the conduct of ANA 2012.
(b) Training of participants in test administration
The DBE developed and disseminated to schools a Test Administration Manual (TAM), which outlined in fair detail the duties and responsibilities of all role-players in ANA. To minimise possible misinterpretation of the TAM, the DBE ran atrainingsessionforcorerepresentativeofficialsfromprovincesanddistrictsonhowtomanagetheconductofANA.Inturn,officialsinthecoreteamarrangedtrainingsessionsfortheircounterpartsaswellasschoolprincipalsintheirrespective provinces and districts. School principals were further supplied with copies of a guideline document which highlighted key procedures to be followed in schools before, during and after test administration.

16 REPORT ON THE ANNUAL NATIONAL ASSESSMENTS 2012
(c) Invigilation during test administration
School principals were informed on how they should assign teachers to invigilate during test administration sessions, provided a teacher was not assigned to invigilate his/her own class. Invigilation included reading out instructions to learners on how they were expected to conduct themselves throughout the test administration session. For instance, learners were expected to answer each test question on their own without seeking or offering assistance to others.
Invigilators of Grades 1 and 2 were instructed to read each test question clearly two times before allowing learners time to write their responses independently. Learners in Grade 3 and above read the questions independently and silently and wrote their answers in the provided booklets. Invigilators collected all the booklets at the end of the allowed time for test administration in each session.
(d) Monitoring of test administration
Whilst schools were largely responsible for managing the test administration process, there was both intensive and extensive monitoring of the process from district, provincial and national levels of the education system. Teams of districtandprovincialofficialsvisitedschoolsunannouncedtoverifythatschoolscompliedwiththerequirementsandspecificationsoutlinedintheTAM.MembersoftheDBEBroadManagement,whichincludeddirectors,chiefdirectorsand deputy director-generals, also visited random samples of schools in all the provinces to check compliance and also to provide guidance where necessary.
Overall, all monitoring teams reported satisfactory compliance with prescribed procedures for test administration and that ANA tests were administered under fair and well-controlled conditions in all the schools that they visited. Challengesthatwereidentifiedincludedafewinstanceswheretestswereinshortsupply.Inallidentifiedinstances,test shortages were met either from emergency boxes that were supplied to each delivery point or through additional copiesthatweremadeatschoolsorthedistrictofficefacilities.Alltheseinitiativesensuredthateverylearnerineveryschool was given the opportunity to participate in ANA 2012.
3.6 Marking and Moderation of Learner Scripts
Ensuring that all learner responses are valid and evaluated correctly, fairly and consistently is a critical activity in the whole of the ANA process. Some of the steps that had been taken to make sure that all the learner scripts were marked consistent with agreed-upon memoranda and that the marking was duly moderated have been described in this section.
(a) Preparation of common marking guides/memoranda
Test developers and moderators developed a comprehensive marking guide/memorandum for each of the tests to ensure that all possible responses to each question were exhaustively represented. This was an important control andstandardisationmeasurebecauseitwouldhavebeenverydifficulttocommunicateanychangesthatcouldarisein the process of teachers marking in their respective schools across the country.
To further ensure that the marking guides/memoranda were consistent, but also responsive to the known diverse contexts in the South African schooling system, the DBE hosted centralised discussions of marking guides/memoranda thatwereattendedbyrepresentativesubjectexpertsfromalltheprovinces.Theirinputswereusedtofinalisethemarking guides/memoranda and make them as self-explanatory as possible. Notwithstanding all the measures taken to validate and simplify the marking guides/memoranda, the core teams of provincial participants were still tasked to runorientationsessionsfordistrictofficialsandteachersonhowtointerpretthemarkingguides/memoranda.Mostof the core team members were appointed as chief markers to oversee the quality of the marking and moderation of scripts.

17REPORT ON THE ANNUAL NATIONAL ASSESSMENTS 2012
(b) Marking and moderation at school level
After every test administration session, the completed learner test booklets or scripts were handed over to teachers of the affected classes to start marking their learners’ responses. Teachers had to follow the marking guides/memoranda that had been adopted centrally for marking learner responses. Heads of specific subjectdepartments moderated the scripts marked by teachers to ensure that the marking guides/memoranda were properly followed in evaluating learners’ responses. School principals played an oversight role to make sure that all scripts were marked and that Heads of Departments had done satisfactory moderation.
(c) Centralised moderation of marks
In addition to the moderation of marking that was done at school level, the DBE and the PEDs arranged for centralised moderation of random samples of school-marked scripts, either at district or provincial level. Centralised moderation focused on re-marking the sampled scripts at the critical transition grades, viz. Grades 3, 6 and 9. Provinces worked with districts to select competent teachers to work under trained chief markers at the central marking venues.
Selection of scripts for moderation
The sampling of scripts for centralised moderation was assigned to school principals. To guide the principals in making random selection of scripts, the DBE provided a detailed documented guideline which included lists of random numbers to use in selecting Grades 3, 6 and 9 scripts for centralised moderation. Principals were to select three scripts of learners who matched the supplied random numbers from each class in the three grades. This ensured that the selection of scripts for centralised moderation was not biased.
The number of sampled scripts from Grades 3, 6 and 9 that were moderated nationally has been summarised in Table 3.2.
Table 3.2: Number of sampled scripts moderated nationally
GRADE 3 GRADE 6 GRADE 9 TOTAL
103 141 87 671 72 754 263 566
The number of scripts on which moderation marks was reported was 103141 in Grade 3, 87671 in Grade 6 and 72754 in grade 9.
Selection and number of marking venues
A critical criterion for the selection of marking venues was the numbers involved, both of scripts to be marked and themarkerstobeinvolved.SchoolswithidealaccommodationoranyothersuitablevenueidentifiedbythePED,served as marking centres for the centralised moderation of sampled Grades 3, 6 and 9 scripts. PEDs ensured an environment that facilitated smooth marking and moderation. All the scripts of learners in Grade 3 or Grade 6 from independent schools who participated in ANA 2012 were marked and moderated at the central venue.
In total, twenty-five centreswereestablishedacross thenineprovinces.Thebreakdownofmarking centresperprovince is given in Table 3.3.

18 REPORT ON THE ANNUAL NATIONAL ASSESSMENTS 2012
Table 3.3: Breakdown of marking centres per province
PROVINCE NO. OF VENUES
Eastern Cape 1
Free State 3
Gauteng 5
KwaZulu-Natal 1
Limpopo 3
Mpumalanga 1
Northern Cape 1
North West 5
Western Cape 5
Total 25
From Table 3.3, there were 25 marking centres for ANA 2012. The variation of numbers of venues across the provinceswas influenced largelyby thenatureandsizeofaccommodation thateachcentreoffered.PEDswereresponsible for all logistical arrangements of setting up marking centres, while the DBE monitored the process of marking and moderation in all the centres.
Selection and appointment of markers
Markers and all other marking personnel were appointed by PEDs prior to the commencement of the writing of ANA. The following were some of the key norms and standards that regulated the process of selecting competent personnel for the centralised moderation of scripts:
Teachers who meet the requirements for examination-related work as indicated in the Personnel Administrative Measures (PAM) are appointed for moderation marking.
The principal, in collaboration with the staff, nominates one teacher who currently teaches each of the Languages offered in Grades 3, 6 and 9, and one teacher who currently teaches Mathematics in each of Grades 3, 6 and 9 in each school for centralised moderation.
Qualifying teachers are nominated for centralised moderation on the basis of seniority in terms of years of service teaching in the grade, relevant phase and on a rotational basis.
District selection committees recommend markers for appointment by the PED.
District selection committees nominate chief markers from suitably qualified curriculum officials/subject advisors or, where necessary, lead teachers, etc.
Teacher union representatives attend the selection meetings as observers of the process to select marking personnel.
A PED selection committee selects chief markers, senior markers and markers for appointment.
All marking personnel are appointed by the Head of Department or delegated representative.
No major problems that would have compromised the integrity of the national assessment were reported by PEDs.

19REPORT ON THE ANNUAL NATIONAL ASSESSMENTS 2012
Marking and moderation procedures
The PED’s chief markers who attended the national marking guides/memoranda discussions for each subject, language and grade facilitated the training of markers at the centralised moderation venues. The ANA Marking Manual outlined the norms and standards as well as detailed processes that were to be followed by all, thereby ensuring that there was a consistent and standardised approach to the marking and moderation of ANA scripts across the country. Marking for each grade and subject was moderated by a senior marker or chief marker, of whom the majority were part of the national marking guides/memoranda discussions that were conducted centrally by the DBE.
3.7 Data Capture and Processing
After moderation, teachers at school and at the centralised moderation centres recorded all learners’ marks on a computer-generated mark sheet. The completed mark sheets were then forwarded to a central capturing centre that was managed by a contracted service provider in each province. The service provider appointed for capturing scanned all the submitted mark sheets to keep an electronic record of documents received and documents returned to schools in cases where there were corrections that needed to be made by the school. An approach which involved double capture was followed as a quality control measure. This entailed data being captured by two separate data capturers,whichensuredverificationofthecaptureddata.
Approximately85%oftheexpectedlearnerrecordswerecaptured.Giventhatthiswasthefirsttimethatdataofthiskind and magnitude was captured (baseline), it is expected that higher levels of precision will be achieved as the system receives enhancements in future assessments.
All captured data, including learner test marks, was uploaded onto the national mainframe. From the mainframe, a number of queries could be run to “clean” the data, e.g. removing duplicate records, identifying and correcting “wild codes”, such as learner scores that exceeded the total mark in the test, and other spurious entries.
Once cleaned, the data was ready for analysis.
3.8 ANA in Independent Schools
The National Norms and Standards for School Funding (NNSSF), as amended, provides for conditions to be met by registered independent schools in order for them to be considered for a State subsidy. In particular, par. 177 (1) (a) of the NNSSF provides that:
“A primary school phase may be considered for subsidy using the latest provincial learner assessment results of public ordinary schools, if-
(i) the average of its learner achievement rate in literacy and numeracy in the Grade 3 or Grade 6 assessment is equal to or more than the provincial latest achievement rate of Grade 3 or Grade 6 in public schools.”
The amendment to the NNSSF gave effect to the implementation of the Annual National Assessment (ANA) in subsidised independent schools through Government Gazette No. 33973, published on 31 January 2011. The Gazette, in accordance with paragraphs 177 (1) (a) and 177 (3) of the NNSSF pronounces a determination that the Grade 3 or Grade 6 instrument used for the ANA in public schools, where applicable, be used to measure learner achievement within independent schools which are eligible for subsidy.
All state-funded independent schools with a primary-school phase completed a registration form for their learners participating in ANA 2012. The registration process was conducted in the same way as in public schools.

20 REPORT ON THE ANNUAL NATIONAL ASSESSMENTS 2012
Testadministrationinindependentschoolswasconductedbytrainedofficialsfromdistrictoffices.Insomeinstances,teachersadministeredthetestsunderthesupervisionandmonitoringofadistrictofficial.Toensurethattestswereadministered under controlled conditions, some standardisation measures were put in place, such as:
(a) Following a common timetable, which is the same as used by public schools
(b) Using the TAM, which outlined the duties and responsibilities of all role-players in ANA.
Tables 3.4 and 3.5 indicate the statistics on the number of schools per province and the number of learners that participated in ANA 2012 in independent schools.
Table 3.4: Number of independent schools that participated in ANA 2012
INDEPENDENT SCHOOLS
PROVINCE SCHOOLS
Eastern Cape 123
Free State 53
Gauteng 267
KwaZulu-Natal 114
Limpopo 85
Mpumalanga 82
Northern Cape 3
North West 29
Western Cape 57
National 813
Table 3.5: Number of learners in independent schools who wrote ANA, by grade
GRADES HL FAL MATHEMATICS
Grade 3 6 831 5 861
Grade 6 7 568 3 729 11 641
Scripts for Grades 3 and 6 of all learners who wrote ANA in independent schools were marked and moderated at centralised marking venues in each province. As in public schools, some steps were taken to make sure that all learner scripts were marked consistent with agreed-upon marking guides/memoranda. Markers completed computer-generated mark sheets. After marking and moderation, mark sheets were captured in the centralised capturing centres in each province.
3.9 ANA in Special Schools
Special schools completed a learner registration form where the special needs of learners were indicated. The ANA tests were adapted for visual and hearing disabilities. Tests were Brailled and adapted for deaf learners in all eleven officiallanguagesforGrades1–3andinEnglishandAfrikaansforGrades4–to6and9.Thetestswereprintedandpacked by the DBE and distributed to schools by the provinces.
A total of 12 379 learners from a 119 special schools participated in ANA 2012. In Table 3.6, the number of schools and learners that participated is indicated for each of the nine provinces.

21REPORT ON THE ANNUAL NATIONAL ASSESSMENTS 2012
Table 3.6: Participation of special schools in ANA 2012
SPECIAL SCHOOLS
PROVINCE SCHOOLS LEARNERS
Eastern Cape 6 362
Free State 3 80
Gauteng 5 959
KwaZulu-Natal 75 7 962
Limpopo 6 345
Mpumalanga 10 1 488
Northern Cape 1 73
North West 1 29
Western Cape 12 1 081
National 119 12 379

22 REPORT ON THE ANNUAL NATIONAL ASSESSMENTS 2012
4. ANA 2012 RESULTS4.1 Overall Performance in Average Percentage marks
The average percentage marks in Home Language (HL) and First Additional Language (FAL) in the various grades are presented in Tables 4.1 and 4.2 and Figures 4.1 and 4.2. It is important to note that direct comparisons across years can only be done with extreme caution, as the Language test used in 2011 in Grades 1-6, was pitched at the level of the language of learning and teaching. In 2012, however, two tests were set, one at Home Language level and the other at First Additional Language level in Grades 4-6 and 9. Candidates, therefore, wrote either of these tests in 2012. Only one test was written at Home Language by Grades 1, 2 and 3 learners.
Table 4.1: National average percentage marks for Language in 2011 and 2012 (Grades 1-3)
GRADE HL 2012 LANG 2011
1 58 59
2 55 52
3 52 35
Figure 4.1: National average percentage marks for Language in 2011 and 2012 (Grades 1–3)
Table 4.2: National average percentage marks for Language in 2011 and 2012 (Grades 4-6 & 9)
GRADE HL 2012 FAL 2012 LANG 20114 43 34 34
5 40 30 28
6 43 36 28
9 43 35 NA

23REPORT ON THE ANNUAL NATIONAL ASSESSMENTS 2012
* Grade 9 was not part of ANA 2011.
Figure 4.2: National average percentage marks for Language in 2011 and 2012 (Grades 4-6 and 9)
FromtherespectivetablesandfiguresitcanbeobservedthatthehighestaveragemarkinLanguageatthefoundationphase was in Grade 1 (58%) and the lowest was in Grade 3 (52%). This pattern of decrease in performance from Grade 1 to Grade 3 was quite similar in 2011. Overall, learner performance at the intermediate phase and Grade 9 was comparatively lower with a maximum average mark of 43% in Grade 9 Home Language and a minimum of 30% in Grade 5 First Additional Language. Generally, performance of the learners who were tested at the Home Language level was higher than that of their counterparts who took the test at the First Additional Language level, an observationthatisinkeepingwithresearchfindingsworldwide.
The average percentage marks in Mathematics are presented in Table 4.3 and Figure 4.3.
Table 4.3: National average percentage marks for Mathematics in 2011 and 2012.
GRADE MATHEMATICS 2012 MATHEMATICS 2011 DIFFERENCE (% POINTS)
1 68 63 5
2 57 55 2
3 41 28 13
4 37 28 9
5 30 28 2
6 27 30 -3
9 13 *

24 REPORT ON THE ANNUAL NATIONAL ASSESSMENTS 2012
** Grade 9 was not part of ANA 2011.
Figure 4.3: National average percentage marks for Mathematics in 2011 and 2012
AsinLanguage,thepatternofperformanceinMathematics,asobservedfromtherespectivetablesandfigures,showed a decrease from Grade 1 (68%) to Grade 9 (13%). A similar pattern was observed in 2011 except that the average percentage marks were generally higher in 2012. Only at Grade 6 level did performance show a slight dip of three percentage points. As a baseline, the average mark of 13% at Grade 9 level was worryingly low. It is evident that more focused interventions are needed at the intermediate and senior phases.
Overall, where direct comparisons could be made, the performance of learners in 2012 was appreciably higher than in 2011. The exceptionally low performance in Mathematics at Grade 6 and at Grade 9 level in particular will require a more concerted approach to the current and future interventions.
4.2 Percentage of Learners Showing Adequate and Higher Achievement
In this section the percentage of Grade 3 and 6 learners who obtained 50% or more of the test marks are reported for both 2012 and 2011. The focus of reporting in this section is on Grades 3 and 6 because these were the grades whereadequateexternalverificationofthequalityofmarkingwasdonesystematicallyinbothyearsandthefindingsare, therefore, more comparable.
In terms of the CAPS, a mark of at least 50% is required for adequate and higher achievement. The percentage of Grade 3 and 6 learners who obtained 50% or more of the Mathematics test marks in 2011 and 2012 are reported in Tables 4.4 and 4.5.
Table 4.4: Percentage of learners obtaining at least 50% of the Mathematics marks
GRADE 2011 2012
3 17 36
6 12 11
It can be observed from Table 4.4 that in Grade 6, the percentage of learners reaching the adequate and higher achievement levels remained fairly similar across the two years (12% and 11%, respectively), whilst in Grade 3 there wasasignificantincreaseinthisproportion,from17%in2011to36%in2012.

25REPORT ON THE ANNUAL NATIONAL ASSESSMENTS 2012
Table 4.5: Percentage of learners obtaining at least 50% of the Language marks
GRADE LANG 2011 HL 2012 FAL 2012
3 31 57 -
6 15 39 24
For both Grades 3 and 6 there was a large increase in the percentage of learners reaching the adequate and higher levels of achievement, viz. 31% to 57% and 15% to 39%, respectively.
4.3 Provincial Trends in the Performance of Grades 1-6 and 9
The average percentage marks per province, as well as the percentage of learners reaching at least the adequate achievement level, are shown in the tables below for each grade and subject. The average percentage marks in 2011 and 2012 are also displayed in graphs.
It needs to be noted that the data for Grades 3, 6 and 9 has been extensively quality assured through the moderation and verification processesswhich included provincial, national and externalmeasures. The external verificationapplied to Grades 3 and 6 in 2011. The Data for the remaining grades has only undergone internal quality assurance at the school and district level.
Table 4.6: Achievement in Grade 1 Mathematics by province in 2012
PROVINCE AVERAGE PERCENTAGE MARK PERCENTAGE LEARNERS ACHIEVING 50% AND MORE
EC 65,2 72,8
FS 70,2 81,0
GP 74,1 85,7
KZN 69,1 78,8
LP 64,7 73,1
MP 65,9 74,9
NC 63,5 71,6
NW 63,3 71,2
WC 70,1 80,3
National 68,1 77,4
Average percentage marks in Grade 1 Mathematics ranged from 63,3% in North West to 74,1% in Gauteng. Gauteng had the highest percentage or proportion of Grade 1 learners (85,7%) who achieved adequate and higher levels of performance in Mathematics, while the lowest percentage in this category (71,2%) were in North West.
Average percentage marks of Grade 1 learners in Mathematics in 2011 and 2012 are shown in Figure 4.6 per province.

26 REPORT ON THE ANNUAL NATIONAL ASSESSMENTS 2012
Figure 4.4: Provincial average percentage marks for Grade 1 Mathematics in 2011 and 2012
There was a slight increase in average percentage marks in all the provinces, except for the Eastern Cape where the average percentage declined by one percentage point.
Table 4.7: Achievement in Grade 1 Language by province in 2012
PROVINCE AVERAGE PERCENTAGE MARK PERCENTAGE LEARNERS ACHIEVING 50% AND MORE
EC 55,0 60,0
FS 59,8 68,5
GP 62,7 72,1
KZN 58,4 65,4
LP 54,6 58,8
MP 54,1 58,1
NC 52,4 55,7
NW 53,1 55,5
WC 61,0 68,5
National 57,5 63,7
Gauteng had the highest percentage or proportion of Grade 1 learners (72,1%) who achieved adequate and higher levels of performance in Language. Northern Cape had the lowest (55,7%).
Average percentage marks of Grade 1 learners in Language in 2011 and 2012 are shown in Figure 4.9 per province.

27REPORT ON THE ANNUAL NATIONAL ASSESSMENTS 2012
Figure 4.5: Provincial average percentage marks for Grade 1 Language in 2011 and 2012
Achievement in Grade 1 Language remained fairly similar in 2012 as in 2011.
The achievement of Grade 2 learners in Mathematics by province in 2012 is shown in Table 4.8.
Table 4.8: Achievement in Grade 2 Mathematics by province in 2012
PROVINCE AVERAGE PERCENTAGE MARK PERCENTAGE LEARNERS ACHIEV-ING 50% AND MORE
EC 55.2 63.3
FS 59.7 72.6
GP 63.2 78.3
KZN 58.4 69.9
LP 52.7 59.2
MP 54.3 62.9
NC 54.4 61.5
NW 50.6 54.2
WC 62.1 76.8
National 57.4 67.8
Gauteng had the highest percentage of Grade 2 learners achieving adequate and higher levels of performance. North West had the lowest.

28 REPORT ON THE ANNUAL NATIONAL ASSESSMENTS 2012
Figure 4.6: Provincial average percentage marks for Grade 2 Mathematics in 2011 and 2012
There was a slight improvement in the average percentage marks for Grade 2 Mathematics in 2012 across all provinces, except for the Eastern Cape and North West.
Table 4.9: Achievement in Grade 2 Language by province in 2012
PROVINCE AVERAGE PERCENTAGE MARK PERCENTAGE LEARNERS ACHIEVING 50% AND MORE
EC 52,8 60,0 FS 56,3 66,4 GP 59,1 69,9 KZN 57,8 68,4 LP 53,3 60,4 MP 53,4 61,4 NC 48,7 52,2 NW 46,9 48,8 WC 59,9 71,6 National 55,3 64,0
Western Cape had the highest percentage of Grade 2 learners who achieved the adequate and higher levels of performance. North West had the lowest.

29REPORT ON THE ANNUAL NATIONAL ASSESSMENTS 2012
Figure 4.7: Provincial average percentage marks for Grade 2 Language in 2011 and 2012
There was a slight improvement in the average percentage marks for Grade 2 Language in 2012 across all provinces, except for Eastern Cape and North West.
Table 4.10: Achievement in Grade 3 Mathematics by province in 2012
PROVINCE AVERAGE PERCENTAGE MARK PERCENTAGE LEARNERS ACHIEVING 50% AND MORE
EC 40,5 34,9
FS 44,7 41,8
GP 46,9 47,9
KZN 42,2 37,6
LP 34,4 23,7
MP 35,6 25,0
NC 37,9 31,2
NW 34,1 23,4
WC 47,4 48,0
National 41,2 36,3
Western Cape had the highest percentage of Grade 3 learners (48,0%) who achieved adequate and higher levels of performance while North West had the lowest (23,4%).
The provincial average percentage marks for Grade 3 in Mathematics in 2011 and 2012 are shown in Figure 4.12

30 REPORT ON THE ANNUAL NATIONAL ASSESSMENTS 2012
Figure 4.8: Provincial average percentage marks for Grade 3 Mathematics in 2011 and 2012
There was a large increase in the average achievement marks in Grade 3 Mathematics in all provinces.
Table 4.11: Achievement in Grade 3 Language by province in 2012
PROVINCE AVERAGE PERCENTAGE MARK PERCENTAGE LEARNERS ACHIEVING 50% AND MORE
EC 50,3 52,7
FS 56,3 65,2
GP 54,8 61,7
KZN 53,5 59,2
LP 47,9 48,8
MP 48,0 48,9
NC 49,4 51,4
NW 46,4 46,3
WC 57,1 67,4
National 52,0 56,6
Western Cape had the highest percentage (67,4%) of Grade 3 learners who achieved the adequate and higher levels of performance in Language. North West had the lowest (46,3%).
The provincial average percentage marks for Grade 3 Language in 2011 and 2012 are shown in Figure 4.14.

31REPORT ON THE ANNUAL NATIONAL ASSESSMENTS 2012
Figure 4.9: Provincial average percentage marks for Grade 3 Language in 2011 and 2012
There was a large increase in the average achievement in Grade 3 Language in all provinces during this period.
The achievement of Grade 4 learners in Mathematics by province in 2012 is shown in Table 4.14.
Table 4.12: Achievement in Grade 4 Mathematics by province in 2012
PROVINCE AVERAGE PERCENTAGE MARK PERCENTAGE LEARNERS ACHIEVING 50% AND ABOVE
EC 35,3 22,7
FS 36,3 22,9
GP 42,0 35,9
KZN 39,4 30,5
LP 29,4 13,7
MP 31,7 16,0
NC 34,9 23,0
NW 31,0 15,5
WC 45,6 42,2
National 37,0 26,3
Western Cape had the highest percentage (42,2%) of Grade 4 learners who achieved adequate and higher levels of performance in Mathematics. Limpopo had the lowest (13,7%).
The provincial average percentage marks for Grade 4 Mathematics in 2011 and 2012 are shown in Figure 4.15.

32 REPORT ON THE ANNUAL NATIONAL ASSESSMENTS 2012
Figure 4.10: Provincial average percentage marks for Grade 4 Mathematics in 2011 and 2012
There was a large increase in the average achievement in Grade 4 Mathematics in all provinces in 2012.
The achievement of Grade 4 learners in Language by province in 2012 is shown in Table 4.12.
Table 4.12: Achievement in Grade 4 Language by province in 2012
HOME LANGUAGE FAL
PROVINCE AVERAGE PERCENTAGE
MARK
PERCENTAGE LEARNERS
ACHIEVING 50% AND MORE
AVERAGE PERCENTAGE
MARK
PERCENTAGE LEARNERS
ACHIEVING 50% AND MORE
EC 38,3 32,5 36,0 28,8
FS 53,4 59,0 31,9 21,2
GP 49,7 53,2 40,0 36,9
KZN 38,2 31,9 34,3 26,4
LP 24,1 12,1 28,5 17,4
MP 31,8 23,6 30,4 19,4
NC 41,1 39,1 33,2 24,8
NW 25,9 14,3 29,9 19,5
WC 54,8 63,0 33,4 24,2
National 42,6 41,3 33,6 25,2
In Home Language Western Cape had the highest percentage (63,0%) of Grade 4 learners who achieved adequate and higher levels of performance. Limpopo had the lowest (12,1%). In First Additional Language Gauteng had the highest percentage (36,9%) of Grade 4 learners who achieved adequate and higher levels of performance. Limpopo had the lowest (17,4%).
The provincial average percentage marks for Grade 4 learners in Language in 2011 and 2012 are shown in Figure 4.11.

33REPORT ON THE ANNUAL NATIONAL ASSESSMENTS 2012
Figure 4.11: Provincial average percentage marks for Grade 4 Language in 2011 and in 2012
In general in 2012 Grade 4 learners who took the Home Language test performed better than those who took the First Additional Language test.
The achievement of Grade 5 learners in Mathematics by province in 2012 is shown in Table 4.14.
Table 4.14: Achievement in Grade 5 Mathematics by province in 2012
PROVINCE AVERAGE PERCENTAGE MARK PERCENTAGE LEARNERS ACHIEVING 50% AND ABOVE
EC 28,1 12,0
FS 30,9 15,5
GP 35,7 24,3
KZN 31,1 16,7
LP 24,3 7,4
MP 26,1 8,9
NC 27,1 12,7
NW 26,1 9,1
WC 39,4 30,9
National 30,4 16,1
Western Cape had the highest percentage (30,9%) of Grade 5 learners achieving adequate and higher levels of performance in Mathematics. Limpopo had the lowest (7,4%).
The provincial average percentage marks for Grade 5 Mathematics in 2011 and 2012 are shown in Figure 4.12.

34 REPORT ON THE ANNUAL NATIONAL ASSESSMENTS 2012
Figure 4.12: Provincial average percentage marks for Grade 5 Mathematics in 2011 and 2012
There was a considerable increase in the average achievement marks in Grade 5 Mathematics in all provinces, except for Eastern Cape in 2012.
The achievement of Grade 5 learners in Language by province in 2012 is shown in Table 4.15.
Table 4.15: Achievement in Grade 5 Language by province in 2012
HOME LANGUAGE FAL
PROVINCE AVERAGE PERCENTAGE
MARK
PERCENTAGE LEARNERS
ACHIEVING 50% AND ABOVE
AVERAGE PERCENTAGE
MARK
PERCENTAGE LEARNERS
ACHIEVING 50% AND ABOVE
EC 35,0 27,6 30,3 16,4
FS 50,2 53,9 27,9 11,5
GP 45,5 46,4 35,8 25,7
KZN 34,4 26,7 31,0 18,4
LP 24,2 12,0 25,2 10,8
MP 30,9 22,0 26,3 10,6
NC 38,1 31,0 30,1 17,7
NW 26,2 13,6 27,9 12,6
WC 50,9 55,2 31,0 16,0
National 39,9 36,5 29,6 15,9
In Home Language Western Cape had the highest percentage (55,2%) of Grade 5 learners who achieved adequate and higher levels of performance in Language. Limpopo had the lowest (12,0%). In First Additional Language Gauteng had the highest percentage (25,7%) of Grade 5 learners achieving adequate and higher levels of performance. Mpumalanga had the lowest (10,6%).
The provincial average percentage marks for Grade 5 Language in 2011 and 2012 are shown in Figure 4.13.

35REPORT ON THE ANNUAL NATIONAL ASSESSMENTS 2012
Figure 4.13: Provincial average percentage marks for grade 5 language in 2011 and in 2012
In 2012 Grade 5 learners who took the Home Language test performed better than those who took the First Additional Language test except in Limpopo and North West.
The achievement of Grade 6 learners in Mathematics by province in 2012 is shown in Table 4.16.
Table 4.16: Achievement in Grade 6 Mathematics by province in 2012
PROVINCE AVERAGE PERCENTAGE MARK PERCENTAGE LEARNERS ACHIEVING 50% AND MORE
EC 24,9 8,1
FS 28,4 11,7
GP 30,9 16,4
KZN 28,1 11,8
LP 21,4 4,6
MP 23,4 5,7
NC 23,8 7,6
NW 23,6 7,1
WC 32,7 19,9
National 26,7 10,6
Western Cape had the highest percentage (19,9%) of Grade 6 learners achieving adequate and higher levels of performance in Mathematics. Limpopo had the lowest (4,6%).
The provincial average percentage marks for Grade 6 Mathematics in 2011 and in 2012 are shown in Figure 4.14.

36 REPORT ON THE ANNUAL NATIONAL ASSESSMENTS 2012
Figure 4.14: Provincial average percentage marks for Grade 6 Mathematics in 2011 and 2012
There was a slight decrease in the average achievement in Grade 6 Mathematics in all provinces, except for Free State in 2012.
The achievement of Grade 6 learners in Language by province in 2012 is shown in Table 4.17.
Table 4.17: Achievement in Grade 6 Language by province in 2012
HOME LANGUAGE FALPROVINCE AVERAGE
PERCENTAGE MARK
PERCENTAGE LEARNERS
ACHIEVING 50% AND MORE
AVERAGE PERCENTAGE
MARK
PERCENTAGE LEARNERS
ACHIEVING 50% AND MORE
EC 38,4 29,4 36,3 25,0 FS 52,2 56,8 37,3 24,8 GP 49,3 51,6 42,8 38,9
KZN 40,9 34,9 35,3 23,5 LP 28,2 14,5 31,7 18,2 MP 33,4 23,2 31,1 17,6 NC 39,0 29,1 36,4 25,3 NW 33,1 20,4 36,1 24,9 WC 49,7 50,4 38,3 28,7
National 42,8 38,7 35,6 24,4
In Home Language Free State had the highest percentage (56,8%) of Grade 6 learners who achieved adequate and higher levels of performance. Limpopo had the lowest (14,5%). In First Additional Language Gauteng had the highest percentage of adequate and higher Grade 6 achievers and Mpumalanga had the lowest (17,6%).
Provincial average percentage marks for Grade 6 Language in 2011 and in 2012 are shown in Figure 4.15.

37REPORT ON THE ANNUAL NATIONAL ASSESSMENTS 2012
Figure 4.15: Provincial average percentage marks for Grade 6 Language in 2011 and 2012
In 2012, Grade 6 learners who took the Home language test performed better than those who took the First Additional Language test, except for Limpopo and North West.
The achievement of Grade 9 learners in Mathematics by province in 2012 is shown in Table 4.18.
Table 4.18: Achievement in Grade 9 Mathematics by province in 2012
PROVINCE AVERAGE PERCENTAGE MARK PERCENTAGE LEARNERS ACHIEVING 50% AND MORE
EC 14,6 2,6 FS 14,0 3,1 GP 14,7 3,7
KZN 12,0 1,9 LP 8,5 0,5 MP 11,9 1,0 NC 13,2 2,0 NW 11,2 1,4 WC 16,7 5,0
National 12,7 2,3
Western Cape had the highest percentage (5,0%) of Grade 9 learners who achieved adequate and higher levels of performance in Mathematics. Limpopo had the lowest (0,5%).
The achievement of Grade 9 learners in Language by province in 2012 is shown in Table 4.19.

38 REPORT ON THE ANNUAL NATIONAL ASSESSMENTS 2012
Table 4.19: Achievement in Grade 9 Language by province in 2012
HOME LANGUAGE FAL
PROVINCE AVERAGE PERCENTAGE
MARK
PERCENTAGE LEARNERS
ACHIEVING 50% AND MORE
AVERAGE PERCENTAGE
MARK
PERCENTAGE LEARNERS
ACHIEVING 50% AND MORE
EC 42,6 36,0 35,0 20,9
FS 48,9 48,7 37,2 22,9
GP 50,3 54,1 40,3 31,0
KZN 37,7 28,4 32,3 17,6
LP 31,2 17,0 29,8 13,7
MP 40,3 32,8 37,4 24,8
NC 44,3 36,1 37,9 26,2
NW 39,3 29,2 39,1 27,0
WC 48,4 47,4 37,2 22,9
National 43,4 38,9 34,6 20,8
In Home Language Gauteng had the highest percentage (54,1%) of Grade 9 learners who achieved adequate and higher levels of performance. Limpopo had the lowest (17,0%). In First Additional Language Gauteng had the highest percentage (31,0%) of Grade 9 learners achieving adequate and higher levels of performance. Limpopo had the lowest (13,7%).
4.4 Analysis by Seven Levels of Achievement
Learner achievement was expressed in terms of the seven levels of achievement shown below.
Key: Seven Levels
RATING CODE PERCENTAGE DESCRIPTOR
Level 1 0–29 Not achieved
Level 2 30–39 Elementary achievement
Level 3 40–49 Moderate achievement
Level 4 50–59 Adequate achievement
Level 5 60–69 Substantial achievement
Level 6 70–79 Meritorious achievement
Level 7 80–100 Outstanding achievement
The distribution of learner achievement across the achievement levels is shown in Table 4.20 and Figure 4.14 for Grade 3 Mathematics.

39REPORT ON THE ANNUAL NATIONAL ASSESSMENTS 2012
Table 4.20: Percentage of Grade 3 learners in achievement levels in Mathematics by province
PROVINCE L1 L2 L3 L4 L5 L6 L7
NW 44,0 17,9 14,8 11,9 6,4 3,2 1,9
LP 43,5 17,7 15,1 11,5 6,7 3,5 2,0
MP 40,6 18,3 16,2 12,7 7,1 3,4 1,7
NC 37,9 15,8 15,1 13,4 9,1 5,4 3,4
EC 31,9 16,6 16,6 15,4 10,3 5,9 3,3
KZN 29,6 16,3 16,5 15,7 10,7 6,7 4,5
GP 23,4 13,6 15,1 17,1 13,9 9,7 7,3
FS 22,9 16,6 18,7 18,7 11,9 7,0 4,3
WC 22,5 14,1 15,4 16,4 13,4 9,7 8,5
National 31,7 16,1 15,9 15,1 10,4 6,5 4,4
Figure 4.16: Percentage of grade 3 learners in achievement levels in Mathematics by province
About a third of the learners function at the not achieved level in Grade 3 Mathematics.
The distribution of learner achievement across achievement levels is shown in Table 4.21 and Figure 4.16 for Grade 3 Home Language.

40 REPORT ON THE ANNUAL NATIONAL ASSESSMENTS 2012
Table 4.21: Percentage of Grade 3 learners in achievement levels in Home Language by province
PROVINCE L1 L2 L3 L4 L5 L6 L7
NW 26,3 10,2 17,2 13,3 16,9 7,9 8,2
LP 24,9 9,8 16,4 12,7 17,3 8,8 10,0
MP 23,7 10,1 17,3 13,5 17,7 8,3 9,5
NC 23,3 9,4 15,9 12,7 17,5 9,6 11,6
EC 19,9 9,7 17,8 13,6 18,8 9,7 10,5
KZN 17,2 8,2 15,4 13,0 20,1 11,8 14,3
GP 16,2 7,5 14,6 12,8 20,8 12,4 15,8
WC 12,6 6,3 13,7 13,5 23,8 14,5 15,6
FS 11,8 7,5 15,5 15,2 22,3 13,0 14,7
National 19,0 8,6 15,9 13,3 19,7 10,9 12,7
Figure 4.17: Percentage of Grade 3 learners in achievement levels in Home Language by province
About 13 percent of Grade 3 learners are in the highest category of achievement and 19 percent in the lowest.
The distribution of learner achievement across achievement levels is shown in Table 4.22 and Figure 4.18 for Grade 6 Mathematics.

41REPORT ON THE ANNUAL NATIONAL ASSESSMENTS 2012
Table 4.22: Percentage of Grade 6 learners in achievement levels in Mathematics by province
PROVINCE L1 L2 L3 L4 L5 L6 L7
LP 78,0 10,6 6,8 2,7 1,3 0,4 0,3
MP 74,6 12,2 7,5 3,1 1,6 0,7 0,4
NW 73,7 12,1 7,2 4,0 1,9 0,8 0,4
NC 73,5 11,3 7,5 3,6 2,3 1,0 0,7
EC 68,8 13,3 9,8 4,6 2,3 0,8 0,4
KZN 62,0 14,5 11,7 6,1 3,6 1,4 0,7
FS 60,7 16,2 11,4 5,9 3,4 1,5 0,9
GP 55,9 15,1 12,6 7,6 5,0 2,4 1,3
WC 54,6 14,5 11,0 7,6 6,0 3,6 2,7
National 66,0 13,5 10,0 5,3 3,2 1,4 0,8
Figure 4.18: Percentage of Grade 6 learners in achievement levels in Mathematics by province
About one percent of Grade 6 learners are in the highest category of achievement and 65 percent in the lowest.
The distribution of learner achievement across achievement levels is shown in Table 4.23 and Figure 4.19 for Grade 6 Home Language.

42 REPORT ON THE ANNUAL NATIONAL ASSESSMENTS 2012
Table 4.23: Percentage of Grade 6 learners in achievement levels in Home Language by province
PROVINCE L1 L2 L3 L4 L5 L6 L7
LP 61,4 14,0 10,1 6,7 4,1 2,2 1,5
MP 50,6 14,2 12,1 9,3 6,5 4,2 3,2
NW 49,2 16,8 13,7 9,5 6,0 3,0 1,9
EC 38,1 17,6 15,0 11,4 8,2 5,8 4,0
KZN 36,4 14,3 14,3 11,6 9,6 7,5 6,3
NC 32,9 19,3 18,6 13,9 8,3 4,4 2,5
GP 20,2 12,4 15,8 16,5 14,6 11,8 8,8
WC 15,2 15,3 19,1 18,3 13,7 10,3 8,0
FS 12,7 12,9 17,6 19,5 16,8 11,7 8,9
National 31,0 14,7 15,6 13,9 10,8 8,0 6,1
Figure 4.19: Percentage of Grade 6 learners in achievement levels in Home Language by province
About six percent of learners are in the highest category of achievement and 30 percent in the lowest.
The distribution of learner achievement across achievement levels is shown in Table 4.24 and Figure 4.20 for Grade 6 First Additional Language.

43REPORT ON THE ANNUAL NATIONAL ASSESSMENTS 2012
Table 4.24: Percentage of Grade 6 learners in achievement levels in First Additional Language by province
PROVINCE L1 L2 L3 L4 L5 L6 L7
MP 53,8 17,3 11,3 8,5 4,9 2,7 1,4
LP 52,8 17,6 11,4 7,9 4,9 3,1 2,3
KZN 43,5 19,2 13,8 10,5 6,6 3,8 2,6
NW 42,5 19,7 13,0 10,8 6,5 4,3 3,3
NC 41,0 18,8 14,9 11,5 6,7 4,4 2,8
EC 40,6 19,7 14,6 11,1 7,2 4,0 2,7
FS 36,2 22,4 16,6 11,5 7,3 3,9 2,2
WC 35,3 20,4 15,6 13,3 8,9 4,4 2,2
GP 30,2 16,0 14,8 14,4 11,4 7,6 5,6
National 43,2 18,8 13,7 10,6 6,9 4,1 2,8
Figure 4.20: Percentage of Grade 6 learners in achievement levels in First Additional Language by province
About three percent of learners are in the highest category of achievement and 43 percent in the lowest.
The distribution of learner achievement across achievement levels is shown in Table 4.25 and Figure 4.21 for Grade 9 Mathematics.

44 REPORT ON THE ANNUAL NATIONAL ASSESSMENTS 2012
Table 4.25: Percentage of grade 9 learners in achievement levels in Mathematics by province
PROVINCE L1 L2 L3 L4 L5 L6 L7
LP 97,9 1,2 0,5 0,2 0,1 0,1 0,0
MP 95,0 2,7 1,3 0,6 0,3 0,1 0,1
NW 94,7 2,7 1,2 0,7 0,3 0,2 0,1
NC 93,3 3,2 1,5 1,0 0,5 0,3 0,2
KZN 92,4 3,6 2,0 1,0 0,5 0,3 0,1
FS 90,6 4,1 2,3 1,5 0,9 0,4 0,3
EC 88,3 5,8 3,4 1,5 0,7 0,3 0,2
GP 88,1 5,3 3,0 1,7 1,1 0,6 0,3
WC 86,1 5,7 3,3 2,2 1,4 0,9 0,4
National 91,9 3,8 2,1 1,1 0,6 0,3 0,2
Figure 4.21: Percentage of Grade 9 learners in achievement levels in Mathematics by province
Less than one percent of Grade 9 learners are in the highest category of achievement and 92 percent in the lowest.
The distribution of learner achievement across achievement levels is shown in Table 4.26 and Figure 4.22 for Grade 9 Home Language.

45REPORT ON THE ANNUAL NATIONAL ASSESSMENTS 2012
Table 4.26: Percentage of Grade 9 learners in achievement levels in Home Language by province
PROVINCE L1 L2 L3 L4 L5 L6 L7
LP 52,8 18,1 12,2 8,8 5,1 2,2 0,9
KZN 38,3 17,9 15,5 13,1 8,9 4,7 1,7
NW 32,4 20,4 18,1 14,2 8,5 4,5 2,1
MP 31,6 17,9 17,7 15,3 10,4 5,2 1,9
EC 25,8 19,1 19,1 15,9 11,4 6,6 2,2
NC 17,4 22,3 24,3 17,9 11,1 5,3 1,8
GP 13,3 13,6 19,0 20,9 18,1 10,9 4,3
FS 13,1 17,4 20,9 20,5 14,9 9,4 3,8
WC 10,7 17,8 24,1 22,5 15,3 7,1 2,6
National 24,7 17,5 19,0 17,3 12,4 6,6 2,5
Figure 4.22: Percentage of grade 9 learners in achievement levels in Home Language by province
About three percent of learners are in the highest category of achievement and about a quarter in the lowest.
The distribution of learner achievement across achievement levels is shown in Table 4.27 and Figure 4.23 for Grade 9 First Additional Language.

46 REPORT ON THE ANNUAL NATIONAL ASSESSMENTS 2012
Table 4.27: Percentage of Grade 9 learners in achievement levels in First Additional Language by province
PROVINCE L1 L2 L3 L4 L5 L6 L7
LP 56,0 18,3 12,0 7,5 3,9 1,7 0,7
KZN 49,3 19,2 13,9 9,6 5,2 2,1 0,7
EC 41,1 21,3 16,7 11,8 6,2 2,3 0,6
MP 34,1 21,4 19,6 14,4 7,5 2,4 0,5
FS 33,8 23,2 20,1 13,3 6,9 2,2 0,5
NC 33,5 21,5 18,9 15,1 7,8 2,4 0,9
WC 32,5 23,8 20,9 14,4 6,4 1,9 0,2
NW 29,7 22,3 21,0 15,3 8,1 2,9 0,8
GP 27,1 20,4 21,5 17,5 9,6 3,2 0,8
National 42,3 20,4 16,6 11,7 6,2 2,3 0,7
Figure 4.23: Percentage of grade 9 learners in achievement levels in First Additional Language by province
About one percent of Grade 9 learners are in the highest category of achievement and about 42 percent in the lowest.

47REPORT ON THE ANNUAL NATIONAL ASSESSMENTS 2012
4.5 Analysis of achievement by gender
The average percentage marks obtained by males and females are depicted in the graphs and tables below per grade and subject.
Figure 4.24: Average percentage marks in Grade 3 Mathematics by gender
Females performed better than males in all provinces.
Figure 4.25: Average percentage marks in Grade 3 Home Language by gender
Females performed better than males in all provinces.
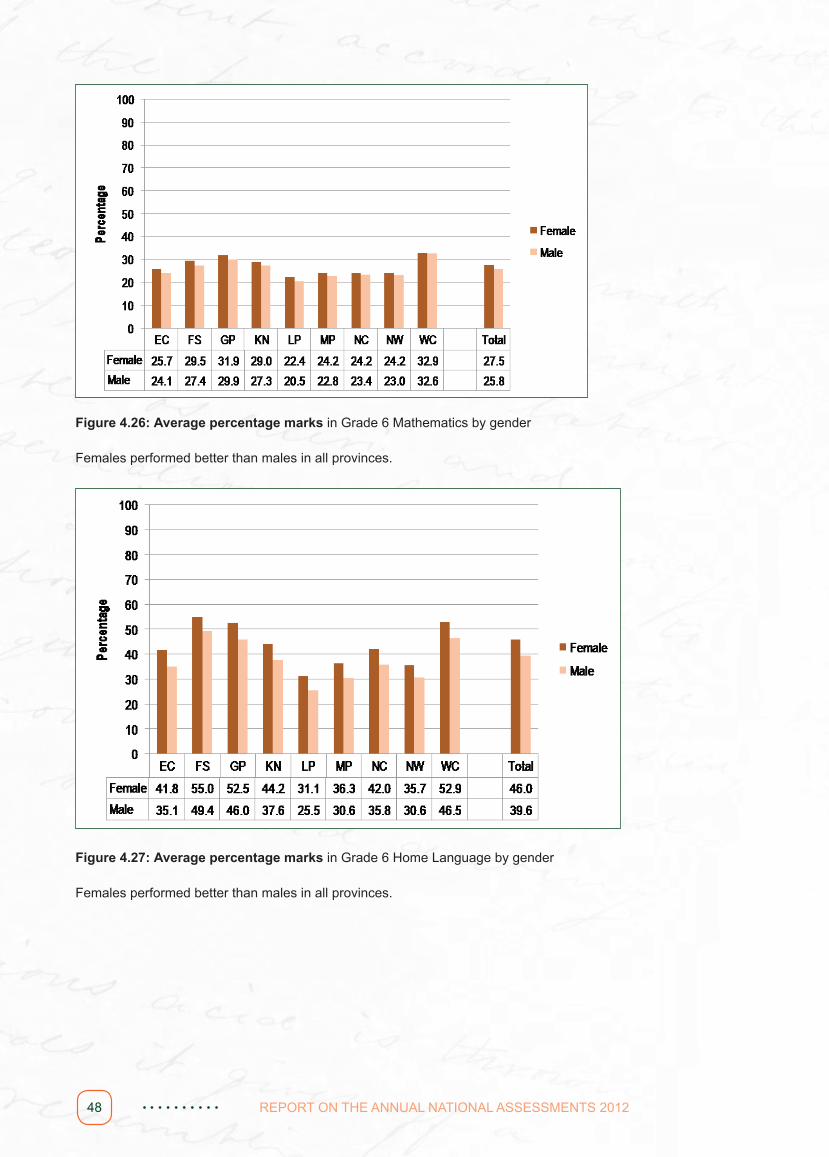
48 REPORT ON THE ANNUAL NATIONAL ASSESSMENTS 2012
Figure 4.26: Average percentage marks in Grade 6 Mathematics by gender
Females performed better than males in all provinces.
Figure 4.27: Average percentage marks in Grade 6 Home Language by gender
Females performed better than males in all provinces.

49REPORT ON THE ANNUAL NATIONAL ASSESSMENTS 2012
Figure 4.28: Average percentage marks in Grade 6 FAL by gender
Females performed better than males in all provinces.
Figure 4.29: Average percentage marks in Grade 9 Mathematics by gender
Females performed better than males in all provinces.

50 REPORT ON THE ANNUAL NATIONAL ASSESSMENTS 2012
Figure 4.30: Average percentage marks in Grade 9 Home Language by gender
Females performed better than males in all provinces.
Figure 4.31: Average percentage marks in Grade 9 FAL by gender
Females performed better than males in all provinces.
4.6 AnalysisbyOfficialSchoolPovertyQuintile
For resourcing purposes schools are categorised according to a poverty index referred to as a quintile, where a quintileof1wouldindicate“poverty”,andaquintileof5wouldindicate“affluence”.Itmustbenotedthatthequintilesare not equal in size. In particular, quintiles 4 and 5 contain considerably fewer schools than quintiles 1, 2 and 3 which are roughly similar in size.

51REPORT ON THE ANNUAL NATIONAL ASSESSMENTS 2012
The tables and graphs below indicate the distribution of achievement across school quintiles in the subjects for the various grades. The tables show the distribution across grades, while the graphs depict achievement in the various subjects for each of Grades 3, 6 and 9.
Table 4.28: Average percentage marks in Mathematics by grade and poverty quintile
GRADE QUINTILE 1 QUINTILE 2 QUINTILE 3 QUINTILE 4 QUINTILE 5
1 64,5 65,8 67,4 70,2 77,3
2 53,8 54,6 56,4 60,3 67,5
3 37,8 38,0 39,5 43,3 53,7
4 32,2 32,2 34,8 40,0 53,2
5 26,3 26,2 27,8 32,5 46,7
6 23,7 23,8 24,5 27,4 39,6
9 10,8 10,4 10,6 11,9 23,7
Table 4.29: Average percentage marks in Home Language by grade and poverty quintile
GRADE QUINTILE 1 QUINTILE 2 QUINTILE 3 QUINTILE 4 QUINTILE 5
1 53,6 54,4 56,4 59,5 70,0
2 51,6 52,6 54,3 57,7 66,3
3 49,2 49,6 50,8 53,1 61,7
4 25,5 27,3 31,3 45,4 62,3
5 24,2 26,1 30,1 41,9 57,4
6 28,8 31,0 34,8 43,9 57,7
9 31,8 33,9 38,1 42,6 53,9
Table 4.30: Average percentage marks in FAL by grade and poverty quintile
GRADE QUINTILE 1 QUINTILE 2 QUINTILE 3 QUINTILE 4 QUINTILE 5
4 31,5 31,9 34,5 38,0 44,7
5 27,4 27,8 29,8 33,9 46,8
6 33,0 33,9 36,3 39,8 50,2
9 31,3 32,5 35,6 38,8 46,5

52 REPORT ON THE ANNUAL NATIONAL ASSESSMENTS 2012
Figure 4.32: Average percentage marks in Grade 3 by subject and poverty quintile
Figure 4.33: Average percentage marks in Grade 6 by subject and poverty quintile

53REPORT ON THE ANNUAL NATIONAL ASSESSMENTS 2012
Figure 4.34: Average percentage marks in Grade 9 by subject and poverty quintile
In all grades and subjects there is a tendency for learners in higher quintile schools to achieve better than learners in lowerquintileschools.Theincreaseismorepronouncedbetweenquintilesfourandfive.
The interesting observation is that the socio-economic gradient is steeper in Grades 6 and 9 than in Grade 3.
4.7 Analysis of Language Performance by Language of Learning and Teaching
The tables and figures below represent the achievement of learners in Language by language of learning andteaching.
Table 4.31: Average percentage marks in home language by grade and language of learning and teaching (Grades 1-3)
HOME LANGUAGE GRADE 1 GRADE 2 GRADE 3
AFRIKAANS 63,5 61,6 60,5
ENGLISH 62,4 58,9 53,9
ISINDEBELE 51,5 54,9 46,5
ISIXHOSA 54,3 52,3 49,9
ISIZULU 56,3 56,7 53,1
SEPEDI 52,5 51,7 46,6
SETSWANA 51,2 45,0 44,3
SISWATI 54,3 55,6 48,0
SOTHO 57,6 54,6 54,0
TSHIVENDA 58,8 56,1 49,4
XITSONGA 58,0 54,7 49,1
The following graphs are based on the table above.

54 REPORT ON THE ANNUAL NATIONAL ASSESSMENTS 2012
Figure 4.35: Average percentage marks in Grade 1 Home Language
Figure 4.36: Average percentage marks in Grade 2 Home Language
Figure 4.37: Average percentage marks in Grade 3 Home Language

55REPORT ON THE ANNUAL NATIONAL ASSESSMENTS 2012
In general learners in Grades 1—3 who wrote the test in Afrikaans or English performed better and learners who wrote the test in Setswana performed poorer.
Table 4.32: Average percentage marks in Home Language by grade and language of learning and teaching (Grades 4-6 & 9)
GRADE AFRIKAANS ENGLISH
4 52,3 39,4
5 48,1 37,1
6 47,9 41,0
9 48,9 41,5
Table 4.33: Average percentage marks in FAL by grade and language of learning and teaching (Grades 4-6 & 9)
GRADE AFRIKAANS ENGLISH
4 52,1 33,4
5 48,7 29,4
6 51,7 35,4
9 46,8 34,5
In Grades 4 to 6 and 9 learners with Afrikaans as language of learning and teaching preformed slightly better than learners with English as language of learning and teaching.
4.8 Performance by District
In the following tables average percentage marks for Grades 3, 6 and 9 Language and Mathematics are presented by province and district.
Table 4.34: Average percentage marks for Grade 3 for districts in each province
PROVINCE DISTRICT MATHEMATICS HOME LANGUAGE
EC
BUTTERWORTH 49,2 57,6
COFIMVABA 43,0 53,9*
CRADOCK 41,1 50,1
DUTYWA 40,7* 50,6
EAST LONDON 51,9* 56,1
FORT BEAUFORT 44,9 54,1
GRAAFF-REINET 35,2 48,2
GRAHAMSTOWN 37,8 48,4
KING WILLIAMS TOWN 39,7 49,4
LADY FRERE 24,0* 51,4
LIBODE 40,2 48,2
LUSIKISIKI 37,8 49,0
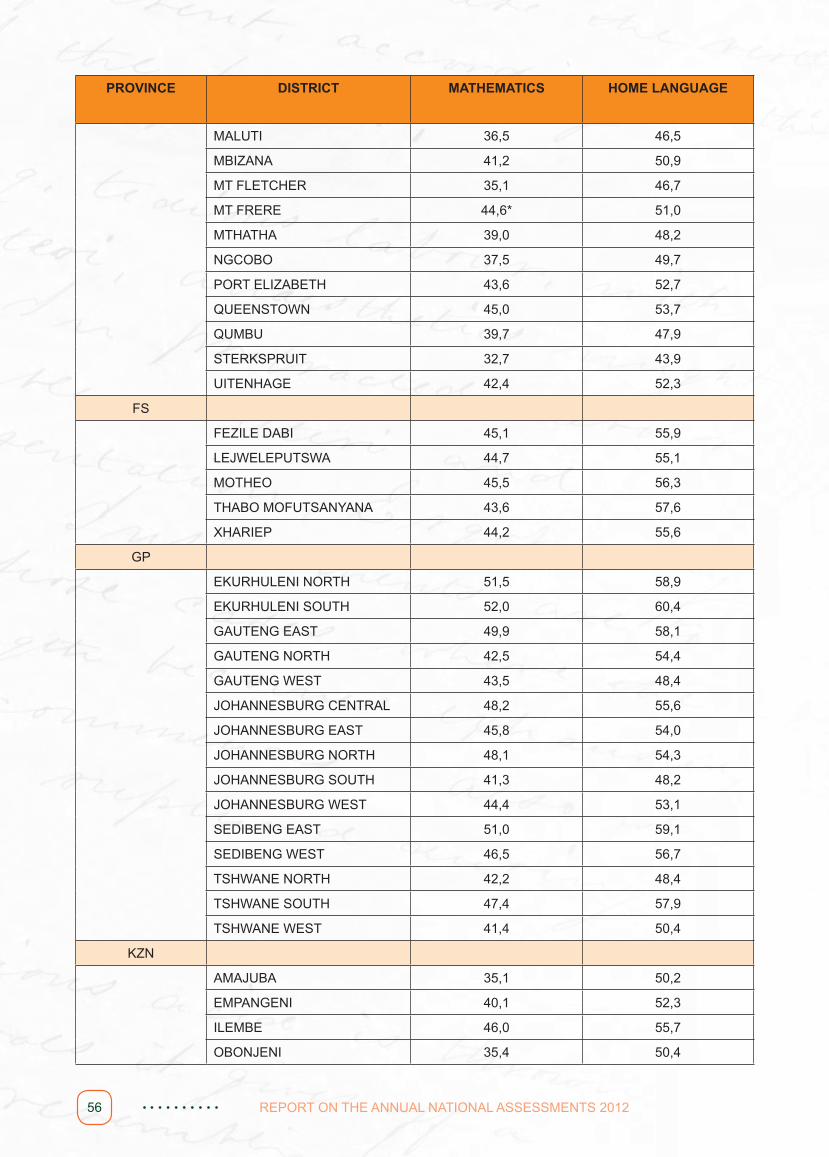
56 REPORT ON THE ANNUAL NATIONAL ASSESSMENTS 2012
PROVINCE DISTRICT MATHEMATICS HOME LANGUAGE
MALUTI 36,5 46,5
MBIZANA 41,2 50,9
MT FLETCHER 35,1 46,7
MT FRERE 44,6* 51,0
MTHATHA 39,0 48,2
NGCOBO 37,5 49,7
PORT ELIZABETH 43,6 52,7
QUEENSTOWN 45,0 53,7
QUMBU 39,7 47,9
STERKSPRUIT 32,7 43,9
UITENHAGE 42,4 52,3
FS
FEZILE DABI 45,1 55,9
LEJWELEPUTSWA 44,7 55,1
MOTHEO 45,5 56,3
THABO MOFUTSANYANA 43,6 57,6
XHARIEP 44,2 55,6
GP
EKURHULENI NORTH 51,5 58,9
EKURHULENI SOUTH 52,0 60,4
GAUTENG EAST 49,9 58,1
GAUTENG NORTH 42,5 54,4
GAUTENG WEST 43,5 48,4
JOHANNESBURG CENTRAL 48,2 55,6
JOHANNESBURG EAST 45,8 54,0
JOHANNESBURG NORTH 48,1 54,3
JOHANNESBURG SOUTH 41,3 48,2
JOHANNESBURG WEST 44,4 53,1
SEDIBENG EAST 51,0 59,1
SEDIBENG WEST 46,5 56,7
TSHWANE NORTH 42,2 48,4
TSHWANE SOUTH 47,4 57,9
TSHWANE WEST 41,4 50,4
KZN
AMAJUBA 35,1 50,2
EMPANGENI 40,1 52,3
ILEMBE 46,0 55,7
OBONJENI 35,4 50,4

57REPORT ON THE ANNUAL NATIONAL ASSESSMENTS 2012
PROVINCE DISTRICT MATHEMATICS HOME LANGUAGE
OTHUKELA 39,7 51,9
PINETOWN 44,0 55,3
PORT SHEPSTONE 40,1 50,4
SISONKE 39,2 48,3
UGU 38,8 51,3
UMGUNGUNDLOVU 44,2 54,7
UMLAZI 48,9 57,8
UMZINYATHI 46,1 55,0
VRYHEID 42,7 54,6
LP
CAPRICORN 34,4 49,2
GREATER SEKHUKHUNE 30,0 45,0
MOPANI 36,3 48,4
VHEMBE 37,4 50,0
WATERBERG 33,6 46,1
MP
BOHLABELA 35,2 46,9
EHLANZENI 37,1 48,7
GERT SIBANDE 36,3 47,5
NKANGALA 32,8* 48,9
NC
FRANCES BAARD 39,3 49,1
JOHN TAOLO GAETSEWE 31,0 44,0
NAMAKWA 45,1 60,1
PIXLEY KA SEME 35,6 47,8
SIYANDA 41,4 51,8
NW
BOJANALA 36,5 49,3
DR KENNETH KAUNDA 38,0 49,8
DR RUTH SEGOMOTSI MOMPATI 30,4 41,8
NGAKA MODIRI MOLEMA 31,1 43,9
WC
CAPE WINELANDS 45,7 58,2
EDEN AND CENTRAL KAROO 43,1 55,1
METRO CENTRAL 49,3 56,4
METRO EAST 48,5 58,2
METRO NORTH 48,9 58,3

58 REPORT ON THE ANNUAL NATIONAL ASSESSMENTS 2012
PROVINCE DISTRICT MATHEMATICS HOME LANGUAGE
METRO SOUTH 49,1 55,1
OVERBERG 48,0 59,8
WEST COAST 45,8 57,7
*Note: In cases with an asterisk the average mark should be interpreted with caution due to capturing rates of less than 50%.
Table 4.35: Average percentage marks for Grade 6 for districts in each province
PROVINCE DISTRICT MATHEMATICSHOME
LANGUAGE
FIRST ADDITIONAL LANGUAGE
EC
BUTTERWORTH 29,4 29,6 39,7
COFIMVABA 25,5 28,5 36,5
CRADOCK 23,5 39,8 37,6
DUTYWA 25,7 27,2 32,7
EAST LONDON 29,4 49,0 41,9
FORT BEAUFORT 26,9 48,1 39,1
GRAAFF-REINET 23,5 38,2 35,7
GRAHAMSTOWN 25,4 39,0 41,9
KING WILLIAMS TOWN 24,9 34,8 39,8
LADY FRERE 25,5 32,7 36,5
LIBODE 23,5 28,3 34,3
LUSIKISIKI 23,9 29,3 33,9
MALUTI 19,9 30,5 31,0
MBIZANA 26,7 27,1 37,0
MT FLETCHER 18,4 33,0 31,8
MT FRERE 25,7 32,8 34,9
MTHATHA 23,6 32,6 36,2
NGCOBO 22,2 30,6 34,3
PORT ELIZABETH 26,4 47,0 41,5
QUEENSTOWN 23,7 46,9 35,5
QUMBU 28,7 30,5 35,9
STERKSPRUIT 20,3 28,3 32,5
UITENHAGE 25,0 39,8 42,5

59REPORT ON THE ANNUAL NATIONAL ASSESSMENTS 2012
PROVINCE DISTRICT MATHEMATICSHOME
LANGUAGE
FIRST ADDITIONAL LANGUAGE
FS
FEZILE DABI 32,3 52,8 40,6
LEJWELEPUTSWA 28,3 51,7 36,2
MOTHEO 27,8 54,1 36,9THABO MOFUTSANYA-NA 27,7 53,9 37,1
XHARIEP 23,1 40,6 33,7
GP
EKURHULENI NORTH 33,4 56,5 44,2
EKURHULENI SOUTH 37,0 50,8 48,4
GAUTENG EAST 31,8 46,8 44,8
GAUTENG NORTH 27,2 41,9 33,3
GAUTENG WEST 30,8 50,9 42,2JOHANNESBURG CEN-TRAL 26,9 48,1 47,8
JOHANNESBURG EAST 31,6 52,8 40,6JOHANNESBURG NORTH 31,8 51,6 44,9JOHANNESBURG SOUTH 24,9 46,2 37,5
JOHANNESBURG WEST 29,8 50,2 42,4
SEDIBENG EAST 34,6 57,3 36,0
SEDIBENG WEST 28,1 43,8 37,7
TSHWANE NORTH 29,5 48,9 38,7
TSHWANE SOUTH 32,4 48,7 48,1
TSHWANE WEST 28,7 40,9 42,5
KZN
AMAJUBA 24,5 45,9 33,5
EMPANGENI 27,6 32,6 35,8
ILEMBE 29,9 40,6 36,4
OBONJENI 24,8 24,1 29,5
OTHUKELA 26,0 42,3 33,6
PINETOWN 28,2 44,0 38,2
PORT SHEPSTONE 34,0 51,7 48,6
SISONKE 24,7 27,0 33,7
UGU 23,9 28,9 33,3
UMGUNGUNDLOVU 30,7* 41,4 37,5
UMLAZI 34,1 49,9 41,5
UMZINYATHI 31,1 35,2 36,7
VRYHEID 27,8 30,6 35,3

60 REPORT ON THE ANNUAL NATIONAL ASSESSMENTS 2012
PROVINCE DISTRICT MATHEMATICSHOME
LANGUAGE
FIRST ADDITIONAL LANGUAGE
LP
CAPRICORN 22,8 32,6 34,4
GREATER SEKHU-KHUNE 17,8 22,7 28,0
MOPANI 21,1 28,4 32,6
VHEMBE 23,8 26,1 31,9
WATERBERG 20,2 34,0 31,3
MP
BOHLABELA 19,7 23,5 27,9
EHLANZENI 25,0 38,8 31,7
GERT SIBANDE 24,2 32,3 31,8
NKANGALA 24,1 39,6 32,4
NC
FRANCES BAARD 24,7 42,0 41,1
JOHN TAOLO GAETSEWE 21,5 37,2 30,5
NAMAKWA 31,0 42,0 47,7
PIXLEY KA SEME 21,6 36,2 34,1
SIYANDA 24,1 38,3 34,0
NW
BOJANALA 24,4 36,7 38,7
DR KENNETH KAUNDA 23,3 35,6 35,0
DR RUTH SEGOMOTSI MOMPATI 21,3 27,2 32,0
NGAKA MODIRI MOLE-MA 24,9 32,2 36,7
WC
CAPE WINELANDS 29,5 46,1 33,8
EDEN AND CENTRAL KAROO 27,9 42,8 38,6
METRO CENTRAL 38,3 54,1 38,8
METRO EAST 30,8 50,9 37,3
METRO NORTH 34,3 52,5 39,8
METRO SOUTH 35,4 52,5 40,7
OVERBERG 33,7 49,2 38,4
WEST COAST 31,1 47,2 37,0
*Note: In cases with an asterisk the average mark should be interpreted with caution due to capturing rates of less than 50%.

61REPORT ON THE ANNUAL NATIONAL ASSESSMENTS 2012
Table 4.36: Average percentage marks for Grade 9 for districts in each province
PROVINCE DISTRICT MATHEMATICSHOME
LANGUAGE
FIRST ADDITIONAL LANGUAGE
EC
BUTTERWORTH 20,2 35,1 36,3
COFIMVABA 18,5 34,1 36,8
CRADOCK 10,6 42,8 33,0
DUTYWA 18,4 34,6 32,8
EAST LONDON 13,2 47,7 35,4
FORT BEAUFORT 10,3 28,8 31,7
GRAAFF-REINET 11,1 42,4 36,9
GRAHAMSTOWN 13,1 54,9 37,6
KING WILLIAMS TOWN 11,3 41,8 35,7
LADY FRERE 14,8 37,7 33,8
LIBODE 16,2 33,2 33,9
LUSIKISIKI 14,4 36,3 33,8
MALUTI 12,7 32,5 32,9
MBIZANA 16,8 32,0 34,9
MT FLETCHER 11,1 37,4 30,5
MT FRERE 17,1 37,2 35,3
MTHATHA 14,9 35,9 35,4
NGCOBO 14,5 38,4 33,6
PORT ELIZABETH 14,7 47,4 38,4
QUEENSTOWN 12,0 55,7 37,9
QUMBU 17,4 23,7 33,7
STERKSPRUIT 11,8 46,0 34,6
UITENHAGE 13,2 43,7 38,0
FS
FEZILE DABI 14,1 51,0 39,2
LEJWELEPUTSWA 11,8 47,0 35,3
MOTHEO 16,9 51,4 38,7
THABO MOFUTSANYANA 13,4 46,5 36,7
XHARIEP 10,6 41,7 34,1

62 REPORT ON THE ANNUAL NATIONAL ASSESSMENTS 2012
PROVINCE DISTRICT MATHEMATICSHOME
LANGUAGE
FIRST ADDITIONAL LANGUAGE
GP
EKURHULENI NORTH 16,3 55,1 41,0
EKURHULENI SOUTH 17,2 49,3 43,6
GAUTENG EAST 12,6 49,6 39,7
GAUTENG NORTH 13,8 48,7 37,1
GAUTENG WEST 15,2 54,6 40,1JOHANNESBURG CENTRAL 10,4 43,7 42,6
JOHANNESBURG EAST 16,4 51,1 40,9JOHANNESBURG NORTH 16,2 50,5 42,9JOHANNESBURG SOUTH 11,0 46,8 38,4
JOHANNESBURG WEST 14,0 48,9 38,6
SEDIBENG EAST 17,9 55,1 39,5
SEDIBENG WEST 11,2 44,4 40,5
TSHWANE NORTH 13,9 56,3 38,2
TSHWANE SOUTH 21,2 54,2 40,6
TSHWANE WEST 12,5 45,7 38,8KZN
AMAJUBA 11,5 36,9 33,7
EMPANGENI 10,9 32,1 31,2
ILEMBE 12,5 35,4 31,6
OBONJENI 9,9 28,3 28,9
OTHUKELA 11,1 45,0 31,5
PINETOWN 12,3 43,2 33,6
PORT SHEPSTONE 17,0 39,0 50,4
SISONKE 11,8 34,0 28,1
UGU 8,7 31,1 30,8
UMGUNGUNDLOVU 12,2 39,4 35,2
UMLAZI 16,0 42,6 42,1
UMZINYATHI 14,3 31,4 31,7
VRYHEID 11,5 34,0 30,0LP
CAPRICORN 9,3 37,2 31,9GREATER SEKHUKHUNE 7,7 29,9 28,7
MOPANI 8,2 30,1 29,2
VHEMBE 8,7 28,5 29,0
WATERBERG 8,5 33,3 29,9

63REPORT ON THE ANNUAL NATIONAL ASSESSMENTS 2012
PROVINCE DISTRICT MATHEMATICSHOME
LANGUAGE
FIRST ADDITIONAL LANGUAGE
MP
BOHLABELA 8,6 29,9 31,0
EHLANZENI 12,5 44,8 39,7
GERT SIBANDE 12,1 38,7 38,9
NKANGALA 13,5 46,0 39,1NC
FRANCES BAARD 13,8 46,2 40,6JOHN TAOLO GAETSEWE 11,9 39,4 33,2
NAMAKWA 13,3 43,6 41,3
PIXLEY KA SEME 13,2 45,5 39,7
SIYANDA 13,5 43,7 40,3NW
BOJANALA 11,5 41,6 41,1
DR KENNETH KAUNDA 13,1 44,5 39,5DR RUTH SEGOMOTSI MOMPATI 8,9 34,0 34,2NGAKA MODIRI MOLEMA 11,6 38,2 40,0
WC
CAPE WINELANDS 17,5 48,5 34,9
EDEN AND CENTRAL KAROO 16,3 47,3 36,0
METRO CENTRAL 18,2 48,2 39,0
METRO EAST 15,0 49,0 37,6
METRO NORTH 17,1 50,4 37,9
METRO SOUTH 16,1 47,3 36,4
OVERBERG 16,3 48,1 37,8
WEST COAST 17,0 47,5 35,2

64 REPORT ON THE ANNUAL NATIONAL ASSESSMENTS 2012
4.9 Comparison of Performance between Public and Independent Schools
Independent schools that considered applying for government subsidy were required to take part in ANA and others volunteered to take part on their own. Results for Grades 3 and 6 are compared for independent and public schools below.
Table 4.37: Average percentage marks in Mathematics by grade and school type
GRADE PUBLIC INDEPENDENT
3 41,2 48,1
6 26,7 37,0
Table 4.38: Average percentage marks in Home Language by school type for Grade 3
GRADE PUBLIC INDEPENDENT
3 52,0 54,8
Table 4.39: Average percentage marks in Language by school type for Grade 6
GRADE HOME LANGUAGE FIRST ADDITIONAL LANGUAGE
PUBLIC INDEPENDENT PUBLIC INDEPENDENT
6 42,8 56,1 35,6 55,2
Independent schools achieved higher scores than public schools. However, a fair comparison between independent and public schools would need to take differences in socio-economic status into account. Moreover, participation in ANA amongst independent schools was far from universal. Consiquently the sample that participated does not necessarilyaccuratelyreflectthesectoreasawhole.
4.10 Performance of special schools
The tables below indicate the achievement of learners in special schools for grades 3 and 6 in Languages and Mathematics. Due to the varying nature of special needs among participating schools, there are variances in the provincialaveragepercentagesreflectedinthetablebelow.Theaveragemarksarerepresentedaspercentages.

65REPORT ON THE ANNUAL NATIONAL ASSESSMENTS 2012
Table 4.40: Average percentage marks for Grade 3 in Home Language and Mathematics in Special Schools
HOME LANGUAGE MATHEMATICS
PROVINCE AVERAGE MARK (%) AVERAGE MARK (%)
EC 47.6 50.6
FS 31.6 16.4
GP 42.3 46.7
KZ 6.7 31.0
LP 0.0* 14.6
MP 27.9 34.6
NC 33.5 21.7
NW 48.0 26.5
WC 59.1 30.3
National 19.6 32.3
* There were no participating learners for this subject.
In general, the national average for learners in special schools in Grade 3 was better in Mathematics than in Home Languages. In Limpopo, learners did not write the Home Language test. For the same test, in seven provinces the performance of learners was above the national average. The KwaZulu-Natal province had the highest number of learners participating in both the Home Language and Mathematics tests, but a high number of learners achieved low scores in the Home Language test.
Table 4.41: Average percentage marks for Grade 6 in Languages and Mathematics in Special Schools
HOME LANGUAGEFIRST ADDITIONAL
LANGUAGE MATHEMATICS
PROVINCE AVERAGE MARK (%) AVERAGE MARK (%) AVERAGE MARK (%)
EC 9.8 47.9 22.0
FS 0.0* 18.7 5.8
GP 27.8 38.9 29.5
KZ 1.5 2.1 24.9
LP 0.0* 6.8 8.8
MP 0.0 5.1 21.9
NC 17.1 22.0 5.9
NW 0.0* 42.1 21.9
WC 51.5 35.8 27.0
National 8.7 10.3 23.6
* There were no participating learners for this subject.
As in grade 3, the national average for learners in special schools in Grade 6 performed better in Mathematics than in Home Langauges. In three provinces, the Free State, Limpopo and the North West, learners did not write the Home language test but instead wrote the First Additional Language test. In Mathematics, there were notable low scores in the Free State, Limpopo and the Northern Cape while performance in six provinces ranged from 22% in the Eastern Cape to 30% in the Western Cape.

66 REPORT ON THE ANNUAL NATIONAL ASSESSMENTS 2012
4.11 Comparison of Original Marks with Moderated Marks
A sample of Grades 3, 6 and 9 scripts were sent to marking venues in each province for centralised moderation. In the tables below, means for the marks given by the teacher and means from the moderation centres are presented.
Table 4.42: Comparison between original and moderated marks
SUBJECT GRADE ORIGINAL MARK IN %
MODERATED MARK IN %
CORRELATION
MATHEMATICS 3 44,6 44,8 0,9561
LANGUAGE 3 55,8 53,3 0,9208
MATHEMATICS 6 28,7 28,4 0,9547
HOME LANGUAGE 6 43,9 43,4 0,9618
FIRST ADDITIONAL LANGUAGE 6 38,2 37,1 0,8977
MATHEMATICS 9 15,0 14,9 0,9759
HOME LANGUAGE 9 45,9 44,4 0,9317
FIRST ADDITIONAL LANGUAGE 9 36,2 34,8 0,9021
The average percentage marks of the moderated marks were generally only slightly lower than the average percentage of the original marks. In addition, the correlations between the two sets of marks were always in all cases higher than 0.9, an indication that marking at school level was fairly consistent and in line with the approved memoranda.
4.12 Overall Measures of Quality Assurance
Overall quality control and assurance measures that were taken to ensure that the ANA results are valid, reliable and credible includes the following:
(a) Developing and distributing a Test Administration Manual (TAM) that was followed by all data collectors.
(b) Conducting test administration orientation sessions based on the TAM for core groups of provincial and district officialsandensuringthecascadetrainingofallschoolprincipalsaschiefinvigilatorsintheirrespectiveschools.
(c) Appointingpart-timemonitorswhowereretiredteachers/officialsandexperiencedinassessment.Thepart-time monitors together with members of senior management from DBE were orientated to monitor and to reinforce teams of both the DBE and PED monitors deployed to monitor test administration in schools that wereinthesampleforANAverification.
(d) Monitoring the quality of marking and moderation in schools by re-marking a sample of Grades 3, 6 and 9 scripts from all the schools that participated in ANA 2012.
4.13 Limitations of the Study
The tests administered were of standard length for summative assessments and all learners in a grade took the same test. Consequently, the number and variety of questions that could be included was limited, and so were the assessmentstandardsthatcouldbeassessed.Eventhoughthetestframeworksidentifiedimportantaspectsofthecurriculum to be included in the test, not every desirable amount of work could be included without risking learner fatigue.

67REPORT ON THE ANNUAL NATIONAL ASSESSMENTS 2012
Both the NCS and CAPS assume that knowledge is cumulative and that the curricula of later grades scaffold on the curriculaofearliergrades.Thetestsweredirectedatspecificgrades,andallthequestionsinthetestsassessedsome aspect of the curriculum for that grade. Consequently, there was no deliberate attempt to include questions to assess the degree to which the assessment standards of earlier grades had been achieved. For learners in the “Not Achieved” category, the tests did indicate what they could not do, but the tests were not designed to show the Grade level at which such learners were actually able to function.
For learners in Grades 1 to 3, only HL was assessed for all learners. Therefore, all learners in a grade (Grades 1–3) took equivalent forms of the Language test because the same Language test was versioned into all the eleven South Africanofficiallanguagesthatcanbeusedforteachingandlearninginschools.LearnersinGrades4–6andGrade9 took the Language test at either HL or FAL level. Because the tests were pitched at different levels, no equivalence should be assumed and, therefore, any comparisons should be done with extreme caution.
SomeofthespecificlimitationsthatneedtobeborneinmindrelatetomakingcomparisonsbetweentheresultsofANA2012andtheresultsofthepreviousANA,ANA2011.Thereforethecomparisonsofassessmentsreflectedinthis report must be viewed with caution. The limitations relate to the following:
• The design and methodologies used in ANA are still at infancy stage. Generally it takes time for these to stabilise.
• The different times of testings would have impacted on learner performance. In 2011, the tests were administered in February, while in 2012, testing was done in September.
• Thescopeofworktestedin2011coveredafullyear’swork,whilein2012,onlyworkcoveredinthefirstthreequarters of the year was tested.
Notwithstanding the above, the results of 2012 and the comparisons, where applicable provide critical and useful information for monitoring the levels and quality of learning outcomes in basic education.

68 REPORT ON THE ANNUAL NATIONAL ASSESSMENTS 2012
5. CONCLUSIONTheprocessesandfindingsofANA2012havepresentedvaluablelessonstoinformthesharpeningofthestrategiesof the Education Sector towards improving the quality of basic education. Not only does the availability of empirical information on the state of basic education provide a solid platform for planning improvement strategies, but the suc-cessful completion of the assessment also attests to the robustness of existing administrative systems shared by the DBE and the PEDs for executing national operations of the magnitude of ANA 2012.
In terms of key processes that characterised the conduct of ANA 2012, the key role of integrated cooperation among the DBE, provinces, districts and schools ensured the unparalleled success in managing an operation that involved in excess of 7 million learners in more than 24 000 schools. There was evidence of preparedness for the assessment, both in terms of support given to children by parents and tuition in the schools.
Key findings from theassessment includedobservations that,while learner achievement in both LanguageandMathematics at the foundation phase was largely of adequate quality and level, learner achievement at the interme-diatephaseingeneralandinGrade9Mathematicsinparticular,showedwide-rangingdeficienciesinbasicknowl-edgeandcompetencies.Forinstance,atnationallevel,significantlymorethanhalfoftheGrade3learnerpopulationachieved adequate to outstanding levels of performance in Language, a proportion fairly close to the 60% target set for 2014. The percentage of Grade 3 learners achieving the same levels of performance in Mathematics was just above a third of the population.
AtGrade6level,approximatelytwooutofeveryfivelearnersdemonstratedadequatetooutstandingachievementsin Language, provided teaching and learning occurred in their “home language”. Where the language of learning and teachingwasdifferentfromthe“homelanguage”,onlyoneoutofeveryfiveGrade6learnersreachedthesamelevelof performance. Achievement of Grade 6 learners in Mathematics was much lower, with only one out of every ten learners achieving adequate and higher levels of performance.
ANA 2012 established important national baseline performance at Grade 9 level. In both Language and Mathematics, Grade 9 learners demonstrated a fairly limited repertoire of necessary basic skills and knowledge, a signal warranting particular attention, given that this is a critical transition grade into the Further Education and Training Band of the school system. With the vital empirical knowledge of the extent of the challenge, all levels of the education system will be better prepared to develop appropriate intervention programmes to turn the situation around at the senior phase.
Theresultsconfirmthatanumberoffactorsareatplayintheeducationsystem.Theseincludegenerallyknown,butperhapslessoftenquantifiedsocio-economic,demographicandhistoricalrealitiesofSouthAfrica.Forinstance,thenegative impact of poverty was clearly borne out by emerging patterns of performance across the quintiles. Learners in schools in the lower poverty quintiles consistently achieved much lower learning outcomes than their counterparts in the higher quintile schools. Congruent to poverty differentials in performance were also patterns of performance, whichreflectedrelativelylowerachievementinpredominantlyruralandhistoricallydisadvantagedprovinces.
It is evident from the results that the current strategies of the DBE that focus on, inter alia, an integrated Language and Mathematics strategy, provision of workbooks to promote regular written work, strengthening the implementation of Early Childhood Development programmes, with a focus on the poor sectors of the population, need to be both consolidated and accelerated. The observed increases in learner scores at Grades 3 and 6, particularly in Language, between 2011 and 2012 indicate that the system could be responding to some of the interventions that the Department has put in place, although causal effects may not be conclusively inferred from this evidence alone.

69REPORT ON THE ANNUAL NATIONAL ASSESSMENTS 2012
NOTES

70 REPORT ON THE ANNUAL NATIONAL ASSESSMENTS 2012
NOTES


0.0
0.2
0.4
0.6
0.8
1.0
ISBN: 978-1-4315-1559-2
© Department of Basic Education, 2012


