256
REPORT ON THE FINANCIAL AND BANKING CRISIS IN SPAIN, 2008-2014

REPORT ON THE FINANCIAL AND BANKINGCRISIS IN SPAIN, 2008-2014
REPO
RT O
N T
HE
FIN
ANCI
AL A
ND
BAN
KIN
G C
RISI
S IN
SPA
IN, 2
008-
2014
C
M
Y
CM
MY
CY
CMY
K
cubierta_crisisOK.pdf 1 03/07/2017 12:02:10


RepoRt on the financial and banking cRisis in spain, 2008-2014
May 2017

This is an English translation of a report originally published in Spanish on the Banco de España website under the title “Informe sobre la crisis financiera y bancaria en España, 2008-2014”. In the event of any discrepancies between the two reports, the Spanish version shall prevail.
Reproduction for educational and non-commercial purposes is permitted provided that the source is acknowledged.
© Banco de España, Madrid, 2017
Legal deposit: M-14827-2017Printed in Spain by Villena Artes Gráficas

contents
Introduction 23
1 The years of economic expansion: analysis of the period 2000-2007 271.1 Macroeconomic environment 27
A. International economy 27B. Spanish economy 29
1.2 Situation of the financial sector 35A. Credit to the resident private sector 35B. Non-performing loans 38C. Government debt holdings of deposit institutions 39D. Sources of credit institutions’ financing: deposits and securitisations 41E. Profitability of the sector 43F. Solvency indicators 44
Capital 45Risk-weighted assets (RWAs) 46Solvency ratios 47
G. Singularities of the savings banks’ business 471.3 Regulatory framework and supervisory powers 48
A. Solvency regulations 49B. Accounting regulations 52C. Sanctions regime and supervisory powers 53D. Legal status and governance of savings banks 54
1.4 Measures taken by the Banco de España 55A. Introduction of countercyclical provisions 57B. Treatment of special investment vehicles 60C. Other supervisory measures 60
2 The early years of the crisis (2008-2011) 632.1 Macroeconomic environment 63
A. World economy 63The financial crisis and the world economy (2008-2009) 63The euro area crisis (2010-2011) 67Economic policy responses 70 Monetary policy 70 Fiscal policy 71 European institutional architecture 71
B. Performance of the Spanish economy 732008-2009: The first stage of the crisis 732010: The failed recovery 782011: The double-dip recession 80
2.2 Financial sector 82A. Credit to the resident private sector 83B. Non-performing loans 84C. Government debt 86D. Deposits and securitisation transactions 88E. Profitability 89F. Solvency 91G. The crisis highlighted the credit portfolio’s risks 92
2.3 International regulatory framework 93A. Changes in prudential regulation 94
A.1 Microprudential framework: Basel III 95A.2 Macroprudential framework 95A.3 Systemically important institutions 98 Prudential regulation in Europe 98
B. Other elements of the regulatory framework 100Strengthening and harmonisation of international accounting standards 100Best practices on remuneration and corporate governance 101Strengthening the regulation and monitoring of non-banking sectors 101Other regulatory measures 102
C. Financial system bail-out policies 103Liability guarantees and other liquidity measures 104Recapitalisations 104Asset write-down measures 104
2.4 Regulatory measures in Spain 107A. 2008: Measures to strengthen the liquidity of financial institutions and enhance depositor and investor
confidence 108Measures to strengthen the liquidity of institutions 109Deposit protection 110
B. 2009: Restructuring and concentration measures for the sector: creation of the Fund for the Orderly Restructuring of the Banking Sector (FROB I) 110Objectives of the FROB 111 Management of restructuring processes 111 Strengthening the own funds of institutions participating in integration processes 112
C. 2010: Strengthening of the soundness of institutions and reform of the savings bank sector 113Strengthening of the soundness of credit institutions 113Reform of the savings banks sector 114
D. 2011: Strengthening financial institutions’ solvency and other measures 117Royal Decree-Law 2/2011 of 18 February on the strengthening of the Spanish financial system 117 Capital requirements 117 Establishment of the FROB II 118Other additional measures to strengthen the solvency of credit institutions 118 Royal Decree 771/2011 of 3 June 2011 118 Royal Decree-Law 16/2011 of 14 October 2011 119 Banco de España Circular No. 5/2011 of 30 November 2011 119
2.5 Supervisory actions 120 Strategy and course of action 121
A. Enhancing Spanish credit institutions’ solvency 123B. Bail-outs, restructuring and concentration: transformation of the savings banks sector 125
First interventions by the Banco de España: Caja Castilla-La Mancha and CajaSur 126Integration processes in the savings bank sector 128Stock-take of the transformation of the savings banks sector at December 2011 130BFA-Bankia (2010 - 2011) 130
C. Stress testing in a process of improving the information on the banking industry 133Actions in 2010 133Actions in 2011 134
D. The 2008-2011 adjustment in figures 134
3 The worsening of the crisis (2012-2013) 1373.1 Macroeconomic environment 137
A. The international environment 137B. The crisis and renewed political momentum in mid-2012 in the euro area 138C. The Spanish economy 142
3.2 The financial sector 149A. Credit to the resident private sector 149
Non-performing loans 151B. Government debt 153C. Deposits and securitisations 155D. Profitability 155E. Solvency 155
3.3 International regulatory framework 159A. Basel banking regulation 160B. Other areas of regulatory reform – FSB 160
A framework for the treatment of systemically important institutions 160Regulation and monitoring of shadow banking 161OTC derivatives markets 161Other developments 161
C. European regulations (2012-2013) 162Own funds 162Additional information to be provided by institutions to supervisors 162Remuneration 162Guidelines on the assessment of the suitability of members of the management body and key function holders (EBA/GL/2012/06) 163Guidelines on the data collection exercise regarding high earners (EBA/GL/2012/05) 163Guidelines on the remuneration benchmarking exercise (EBA/GL/2012/04) 163
3.4 Spanish regulatory framework 164A. Write-down of exposures to the real estate sector 164
A.1 The measures introduced by Royal Decree-Law 2/2012 were threefold 164A.2 Subsequently, Royal Decree-Law 18/2012 established two additional measures to bolster the balance
sheet clean-up 166B. Memorandum of Understanding (MoU) with the European Commission 167
B.1 Stress tests and identification of capital needs 170B.2 Recapitalisation, restructuring and/or resolution of credit institutions (Royal Decree-Law 24/2012
and subsequent Law 9/2012) 170Crisis management 171 Early intervention measures 171 Restructuring measures 171 Resolution measures 171Allocation of recapitalisation costs 172Segregation of assets to an asset management company and strengthening of the FROB’s powers 173Other significant matters included in Law 9/2012 174
B.3 Creation of Sareb 174B.4 Reform of the legal framework for savings banks 175
Other legal changes 1763.5 Supervisory actions of the Banco de España 177
A. Write-down of exposures to the real estate sector 177B. Actions relating to the MoU entered into by the Spanish Government and the European Commission 179
B.1 Stress tests and identification of capital needs 179B.1.1 Prior independent assessment of the Spanish banking system (aggregate exercise) 179B.1.2 Individual assessment of Spanish institutions 180
B.2 Measures arising from the signing of the MoU with the European Commission in July 2012 180B.3 Recapitalisation of credit institutions 183B.4 Hybrid instrument burden-sharing exercise 185B.5 Restructuring of banks’ balance sheets: transfers to Sareb 186B.6 Other restrictions imposed on institutions which received aid 187B.7 Other commitments assumed in the MoU of July 2012 188

C. Actions performed relating to institutions included in group 1 of the MoU 189C.1 Additional contingency measures required from BFA-Bankia 189C.2 Catalunya Banc (2010-2014) 192C.3 NCG Banco (2010 -2014) 194C.4 Banco de Valencia (2011-2013) 195
D. Other supervisory actions 196
4 Normalisation of the situation and strengthening of the system in 2014 2014.1 Macroeconomic environment 201
A. International economy 201B. Performance of the Spanish economy 203
4.2 Financial sector 209A. Credit to the resident private sector and investment in government debt 209
A.1 Non-performing loans 210B. Government debt 210C. Customer deposits 210D. Profitability 211E. Solvency 213
4.3 Regulatory framework 213A. Single legal framework (single rulebook) 215B. Single Supervisory Mechanism 215C. Single Resolution Mechanism 220D. Key Spanish law in this period 222
4.4 Action taken to restructure the Spanish financial system (2014-2015) 223A. Sale of FROB and DGSCI investees 223B. Other action 224
B.1 Merger of credit cooperatives 224B.2 Investigation of alleged irregular operations 225
C. Pre-SSM comprehensive assessment of the banking sector in November 2014 225
5 Overview of the crisis 2295.1 Appraisal of the restructuring process 229 Capacity readjustment 232 Loan write-downs 233 Enhanced solvency 2345.2 Summary of the financial system support measures 235
Annex 1 Cooperation and initiatives of the Banco de España with the courts 241
Annex 2 Banco de España publications on the crisis 243

tables index
Table 1.1 Year-on-year, cumulative and quarter-on-quarter rates of change of credit to the resident private sector (CRPS), with breakdown of lending to the real estate and construction sector and mortgage loans for house purchases 62
Table 2.1 Changes in forecast GDP growth for Spain 74Table 2.2 Non-performing loans to the resident private sector in Spain 85Table 2.3 Main income statement items relative to average total assets (ATA) 90Table 2.4 Aid granted to the financial sector in the EU 105Table 2.5 FROB I investments 112Table 2.6 Restructuring process. Objectives 123Table 2.7 FROB II support 125Table 2.8 Transformation of the savings bank sector 131Table 2.9 Downsizing of the banking network 135Table 3.1 Breakdown of write-downs in the period 2008-2012 178
Table 3.2 Stress test results 181Table 3.3 Results by institution and group 183Table 3.4 Arbitration relating to hybrid capital instruments and subordinated debt 186Table 3.5 Assets transfered to Sareb 187Table 3.6 Summary of the aid granted until 31 December 2013 199
Table 4.1 Holdings of the FROB and DGSCI in banks receiving State aid 224
Table 5.1 Decrease in size of banking network 232Table 5.2 Loan write-downs. Total deposit institutions. Business in Spain 233Table 5.3 Deposit institutions. Credit to other resident sectors 234Table 5.4 Capital increases at deposit institutions 234Table 5.5 Summary of assistance provided in financial system restructuring process 236Table 5.6 Summary of net assistance, FROB + DGSCI 237


chaRts index
Chart 1.1 Main international developments before the crisis 28Chart 1.2 GDP and inflation in Spain and the euro area before the crisis 30Chart 1.3 Build-up of imbalances in the Spanish economy 33Chart 1.4 Cumulative growth in credit to the resident private sector, house prices and real and nominal GDP 36Chart 1.5 Credit to the resident private sector in Spain and as a percentage of GDP 36Chart 1.6 Distribution of lending by type of institution 37 Chart 1.7 Distribution of lending by purpose 38 Chart 1.8 Non-performing loans to the resident private sector in Spain 40Chart 1.9 NPL ratios. Non-performing loans to the resident private sector in Spain 40 Chart 1.10 Coverage ratio. Non-performing loans to the resident private sector in Spain 40Chart 1.11 Spanish general government debt securities 41Chart 1.12 Spanish general government debt securities as a percentage of total assets 41Chart 1.13 Deposits and percentage of total liabilities 42Chart 1.14 Marketable debt securities 43Chart 1.15 Main income statement items relative to average total assets 44Chart 1.16 Return on equity (ROE) and return on assets (ROA) 44Chart 1.17 Total capital, Tier 1 capital and risk-weighted assets 46Chart 1.18 Total capital ratio and Tier 1 capital ratio 46
Chart 2.1 Tensions in international financial markets 64Chart 2.2 GDP growth and policy interest rates 65Chart 2.3 Euro area crisis. First stage 69Chart 2.4 Eurosystem monetary policy 71Chart 2.5 GDP, employment and prices in Spain during the first stage of the crisis 75Chart 2.6 Fiscal policy in Spain. First stage of the crisis 76Chart 2.7 Spain’s balance of payments 77Chart 2.8 House prices in Spain 78Chart 2.9 Financing conditions in Spain 81Chart 2.10 Forecasting errors in projections of Spain’s real GDP 82Chart 2.11 Lending to the resident private sector in Spain. Absolute terms and as percentage of GDP 83Chart 2.12 Cumulative growth of lending to resident private sector, by purpose 83Chart 2.13 NPL ratios. Non-performing loans to the Spanish resident private sector 86Chart 2.14 Coverage ratio. Non-performing loans to the resident private sector in Spain 86Chart 2.15 Spanish general government debt securities 87Chart 2.16 Spanish general government debt securities as a share of total assets 87Chart 2.17 Deposits and percentage of total liabilities 88Chart 2.18 Marketable debt securities 89

Chart 2.19 Return on equity (ROE) and return on assets (ROA) 90Chart 2.20 Main income statement items relative to average total assets (ATA) 90Chart 2.21 Total capital, Tier 1 capital and risk weighted assets 92Chart 2.22 Total capital ratio and Tier 1 capital ratio 92Chart 2.23 Fiscal impact of aid to the financial sector in the EU 106
Chart 3.1 GDP growth and official interest rates 137Chart 3.2 Worsening of the euro area crisis 139Chart 3.3 Eurosystem monetary policy 140 Chart 3.4 Balance of payments crisis in Spain in 2012 143Chart 3.5 Financing conditions in Spain 144Chart 3.6 Fiscal policy in Spain 145Chart 3.7 Changes in GDP, employment and prices in Spain 147Chart 3.8 House prices in Spain 148Chart 3.9 Lending to the resident private sector in Spain and percentage of GDP 150Chart 3.10 Cumulative growth of lending to the resident private sector, by purpose 151Chart 3.11 Cumulative growth of lending to the resident private sector, house prices and real and nominal GDP 151Chart 3.12 Non-performing loans to the resident private sector in Spain 152Chart 3.13 NPL ratios. Non-performing loans to the resident private sector in Spain 152Chart 3.14 NPL ratios. Non-performing loans to the resident private sector in Spain 152Chart 3.15 Foreclosed assets. Non-performing loans to the resident private sector in Spain 153Chart 3.16 Spanish general government debt securities 154Chart 3.17 Spanish general government debt securities as percentage of total assets 154Chart 3.18 Deposits and percentage of total liabilities 156Chart 3.19 Year-on-year rate of change of private-sector deposits 156Chart 3.20 Securitised assets 156Chart 3.21 Return on equity (ROE) and return on assets (ROA) 157Chart 3.22 Main income statement items relative to average total assets 157Chart 3.23 Total capital, Tier 1 capital and risk-weighted assets 158Chart 3.24 Total capital ratio and Tier 1 capital ratio 158
Chart 4.1 GDP growth and official interest rates 201Chart 4.2 Eurosystem monetary policy 202Chart 4.3 GDP and inflation in Spain and the euro area 203Chart 4.4 Financing conditions in Spain 205Chart 4.5 Fiscal policy in Spain 206Chart 4.6 GDP, employment and prices in Spain 207Chart 4.7 Build-up of imbalances in the Spanish economy 208Chart 4.8 House prices in Spain 208Chart 4.9 Credit to the resident private sector in Spain, in absolute terms and as percentage of GDP 209Chart 4.10 Cumulative growth of credit to the resident private sector, by loan purpose 209Chart 4.11 Non-performing loans to the resident private sector in Spain 211

Chart 4.12 NPL ratios. Non-performing loans to the resident private sector in Spain 211Chart 4.13 Coverage ratio. Non-performing loans to the resident private sector in Spain 211Chart 4.14 Spanish general government debt securities 212Chart 4.15 Deposits, in absolute terms and as a percentage of total liabilities 212Chart 4.16 Return on equity (ROE) and return on assets (ROA) 213Chart 4.17 Main income statement items as a percentage of average total assets 213Chart 4.18 Total capital, Tier 1 capital and risk-weighted assets 214Chart 4.19 Total capital ratio and Tier 1 capital ratio 214Chart 4.20 Net impact of stress adverse scenario on CET1% 226Chart 4.21 Net impact of AqR on CET1% 227
Chart 5.1 Savings banks: total assets 231Chart 5.2 Capacity reduction 232Chart 5.3 Loan write-downs. Total deposit institutions 233


diagRam index
Diagram 3.1 Process of obtaining external assistance for the restructuring of the financial system 182
Diagram 4.1 Organisation of the SSM and the decision-making process 221
Diagram 5.1 Timeline of main measures since 2009 239

boxes index
Box 1.1 Total capital and Tier 1 capital 45Box 1.2 International capital standards: Basel I 50Box 1.3 Basel II capital accord 51Box 1.4 Main elements of countercyclical provisions 58
Box 2.1 Key developments in the reform of European economic governance 72Box 2.2 Main elements of Basel III 97Box 2.3 Regulatory framework for systemically important financial institutions (2010-2011) 99Box 2.4 Main regulatory changes in Spain, in chronological order (2008-2011) 108Box 2.5 Circular 3/2010 on tightening of provisioning requirements for past-due loans and foreclosures 114Box 2.6 Institutional protection schemes (IPSs) 116Box 2.7 Summary of the main regulatory milestones relating to restructuring 120Box 2.8 First interventions by the Banco de España: CCM and CajaSur 126Box 2.9 Asset protection schemes (APSs) 129
Box 3.1 Main legal changes in Spain in chronological order (2012-2013) 165Box 3.2 Main elements of the Memorandum of Understanding (MOU) 168Box 3.3 Criteria on refinancing and restructuring 197
Box 4.1 Main features of European solvency rules (CRR and CRD IV) 216Box 4.2 Main features of European rules on resolution (BRRD) 217Box 4.3 European committee rules 218Box 4.4 Main legal changes in Spain derived from the European regulatory framework, in chronological order 223


abbReviations
AIG American International Group (USA)APS Asset Protection SchemeAqR Asset quality ReviewATAs Average total assetsBAMC Bank Assets Management Company (Slovenia)BBK Bilbao Bizkaia KutxaBCBS Basel Committee on Banking SupervisionBIS Bank for International SettlementsBMN Banco Mare Nostrumbp Basis pointsBRRD Bank Recovery and Resolution DirectiveCBE Banco de España CircularCCP Central counterpartyCCR Central Credit RegisterCDS Credit default swapCEBS Committee of European Banking SupervisorsCEIOPS Committee of European Insurance and Occupational Pensions Supervisors CESR Committee of European Securities RegulatorsCET-1 Common Equity Tier-1CMG Crisis management groupsCNMV Spanish National Securities Market CommissionCoCos Contingent convertiblesCPI Consumer price indexCRAs Credit rating agenciesCRD IV Capital Requirements Directive IVCRR Capital Requirements RegulationDGS Deposit Guarantee SchemeDGSCI Deposit Guarantee Scheme for Credit InstitutionsEBA European Banking AuthorityEC European CommissionECB European Central BankECOFIN Economic and Financial Affairs CouncilEFSF European Financial Stability FacilityEFSM European Financial Stability MechanismEIOPA European Insurance and Occupational Pensions AuthorityELA Emergency Liquidity AssistanceESCB European System of Central BanksESFS European System of Financial SupervisorsESM European Stability MechanismESMA European Securities and Markets AuthorityESRB European Systemic Risk BoardEU European UnionFAFA Fund for the Acquisition of Financial AssetsFASB Financial Accounting Standards BoardFROB Fund for the Orderly Restructuring of the Banking SectorFSAP Financial Sector Assessment ProgramFSB Financial Stability BoardFSF Financial Stability ForumG20 Group of TwentyGDP Gross domestic productG-SIBs Global systemically important banks

IAS International Accounting StandardsIASB International Accounting Standards BoardICAC Spanish Accounting and Audit InstituteIFRS International Financial Reporting StandardsIGAE Spanish National Audit OfficeIIP International investment positionIMF International Monetary FundINE Spanish National Statistics InstituteIOSCO International Organization of Securities CommissionsIPS Institutional Protection SchemeJST Joint Supervisory TeamLCR Liquidity coverage ratioLTD Loan-to-depositLTROs Long-term refinancing operationsLTV Loan-to-valueMoU Memorandum of UnderstandingMREL Minimum requirement for own funds and eligible liabilitiesNAMA National Asset Management Agency (Ireland)NCAs National competent authoritiesNCWO No creditor worse offNPLs Non-performing loansNRAs National resolution authoritiesNSFR Net stable funding ratioOECD Organisation for Economic Co-operation and DevelopmentOTC Over the counterpp Percentage pointsqE quantitative easingRD Royal DecreeRDL Royal Decree-LawRGLF Regional Government Liquidity FundROA Return on assetsROE Return on equityRWAs Risk-weighted assetsSareb Spanish asset management companySIBs Systemically important banksSIFIs Systemically important financial institutionsSIVs Special investment vehiclesSMEs Small and medium-sized enterprisesSPEs Special-purpose entitiesSRB Single Resolution BoardSRF Single Resolution FundSRM Single Resolution MechanismSSBs Standard-setting bodiesSSM Single Supervisory MechanismTFP Total factor productivityTLTROs Targeted long-term refinancing operationsUnnim Institution resulting from merger of Caixa Sabadell, Caixa Terrassa and Caixa ManlleuVAT Value added tax

intRodUction
The Banco de España has, through print and electronic means, provided the public with access to ample documentation on the international financial crisis that commenced in 2007. The purpose of this report is to offer an orderly and systematic analysis of its impact on the Spanish financial system and of the set of regulatory, supervisory and intervention measures adopted during the period 2008-2014. The report uses a descriptive approach, analysing the development of the crisis and the actions carried out, with a view to providing broad references to readers and analysts.
This report, which was coordinated by Fernando Eguidazu, a Banco de España council member, includes contributions from the Banco de España’s Directorates General Banking Supervision, Economics, Statistics and Research, Financial Stability, Regulation and Resolution, and the General Secretariat.
It comprises five chapters and two annexes. The first four chapters are ordered chronologically, identifying four stages: the years of economic expansion (2000-2007), the onset of the crisis (2008-2011), the worsening of the crisis (2012-2013) and the economic and financial normalisation (2014). Chapter 5 includes an assessment of the Spanish banking system’s restructuring process.
The crisis can only be understood as a continuum, although different phases can be identified within each period. This classification has been adopted for clarity and because the stages identified mark significant changes in the economic cycle and in the restructuring process of the Spanish banking system, particularly the savings bank sector.
An analysis of the first period, spanning most of the years of economic expansion (2000-2007), is necessary to understand the build-up of imbalances and risks in the global, European and Spanish economies. The second period (2008-2011) is marked by the global financial crisis and by the policies adopted in response thereto, including an in-depth revision of financial regulations and the beginning of the clean-up and restructuring of the financial system. The third period (2012-2013) is characterised by the new measures adopted in view of the worsening of the crisis in Europe, resulting in the double-dip recession, the first symptoms of which had already appeared in 2011, and, as regards the regulatory framework in Spain, by the agreement with the EU on the financial sector, in the form of the Memorandum of Understanding signed in July 2012. The report concludes in 2014, with the progressive normalisation of the economic situation and the launch of the Banking Union which entailed, from November that year, the transfer of a substantial portion of the supervisory powers of

24 banco de españa
the Banco de España, as well as of the other participant supervisory national authorities, to the Single Supervisory Mechanism.
For the sake of a smooth narrative, all the chapters share the same structure. Each has four sections. The first section refers to the macroeconomic environment from an international, European and Spanish standpoint. It analyses macroeconomic developments and responses in respect of monetary and fiscal policy and of the institutional and structural reforms undertaken.
The second section of each chapter describes, for the corresponding period, the performance of the banking system through a detailed review of its main variables. There is a particular focus on developments in credit, an essential item of the financial system’s activity, including an analysis of the different types of borrowers and of credit quality, i.e. loans deemed non-performing and their related non-performing loan (NPL) and coverage ratios. Other variables of financial institutions’ balance sheets are also analysed, including government debt and, on the liabilities side, changes in funding raised: deposits, issues of securities (covered bonds) and asset securitisations. Changes in profitability are also analysed and the section concludes with solvency indicators, measuring resilience in terms of institutions’ loss-absorption capacity.1
Two matters should be clarified in connection with the second section of each chapter. First, the analysis is based on the financial statements of credit institutions with relevant adjustments to the data series for uniformity as regards definition and comparability. There were highly significant regulatory and accounting changes during the period analysed in the report which directly impacted the data included in the financial statements submitted by deposit institutions and on which the analysis was based; noteworthy among these was the new Banco de España Circular CBE 4/2004, which came into force on 1 January 2005, implementing the International Accounting Standards (IAS) adopted by the European Union (EU) from January 2005.
Second, for each variable the performance of deposit institutions2 as a whole is analysed, differentiating between their main component parts: commercial banks and savings banks. For simplicity, reference is made to the performance of commercial banks, on one hand, and of savings banks, on the other, assuming that performance in each of these two groups of institutions was not uniform (the report indicates that savings banks were the main recipients of public aid, but, logically, not all savings banks were). Also, it should be noted that from 2010 the reform of the savings banks sector initiated pursuant to RDL 11/2010 of 9 July 2010 ended with the transformation of most of
1 �The financial variables refer to business in Spain, except in the case of profitability and solvency, where consolidated data are used. Consolidated data include the data of subsidiaries abroad, unless it is expressly stated that they relate to business in Spain.
2 �Comprising commercial banks, savings banks and credit cooperatives.

25RepoRt on the financial and banking cRisis in spain, 2008-2014
the institutions in this sector into commercial banks. However, for information purposes, the comparison between commercial banks and savings banks is maintained in several sections, the latter group comprising the “former savings banks sector”, i.e. institutions whose legal status was once that of savings banks, regardless of whether they were subsequently transformed into banking institutions.
The third section of each chapter refers to the international and Spanish regulatory framework.3 One of the main elements of response to the international financial crisis was the profound financial regulation reform coordinated internationally through the Financial Stability Board and the Basel Committee, and which entailed specific developments in Europe and Spain alike. The Banco de España contributed to the preparation and approval of this framework through its participation in international and European fora, and through its advisory functions on national legislation and the regulatory implementation thereof, mainly through the Banco de España’s circulars.
The fourth section of each chapter (the fifth in Chapters 2 and 3) addresses supervisory actions undertaken by the Banco de España in the exercise of its powers. These actions relate to the macroeconomic and financial environment of each period and are determined by the regulatory framework in force from time to time.
Finally, the report includes two annexes. Annex 1 summarises the cooperation of the Banco de España and the FROB with the judicial authorities in connection with the banking crisis, including submissions to the judicial authorities of operations potentially involving criminal activity. Annex 2 includes a list of the main documents published by the Banco de España in connection with the crisis, namely the Annual Report, Financial Stability Report, Report on Banking Supervision in Spain, Economic Bulletin, briefing notes and press releases. The report is mainly based on these publications, and on documents issued by international bodies such as the European Central Bank, the International Monetary Fund and the European Commission.
3 �As there were significant regulatory developments during the period 2008-2013, Chapters 2 and 3 include two distinct sections on this issue: one on the international and European framework and one on the Spanish framework.


1 THE YEARS OF ECONOMIC EXPANSION:
ANALYSIS OF THE PERIOD 2000-2007
1.1 �MACROECONOMIC�ENVIRONMENT
By the end of 2007 the Spanish economy had recorded fourteen years of uninterrupted economic growth. During that period, Spain achieved its aim to be among the first countries to join Economic and Monetary Union (EMU), in 1999, meeting the criteria required in respect of price stability, interest rates, exchange rates and sustainability of public finances. Euro area membership entailed not only a step up in the Spanish economy’s participation in the global economic boom, but also this environment had a particularly expansionary impact in Spain. For that reason, as a prelude to analysis of the years of economic expansion in Spain, it is appropriate to first consider the international environment and, especially, the prolonged period of growth and stability of the global economy that came to be known as the Great Moderation.
A. International economy
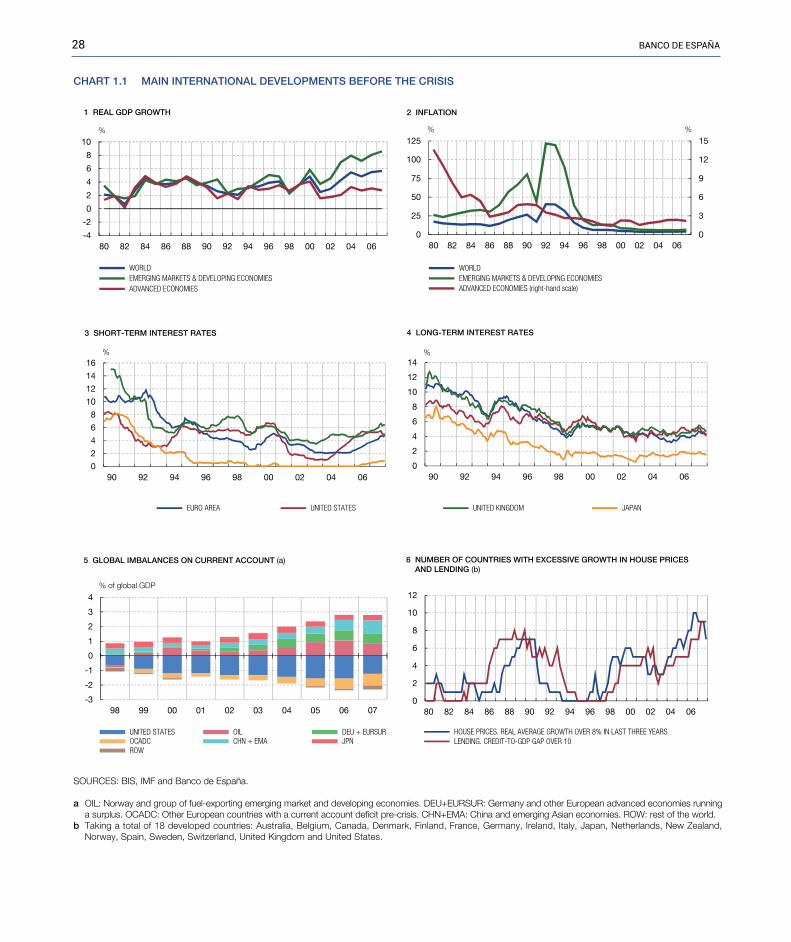
Between 2000 and 2007 global GDP rose by 42%, with annual growth rates (see Chart 1.1) of at least 2.5% in all cases. World economic growth was affected, in 2001, by the dot-com crisis and the terrorist attacks in the United States. However, the main advanced economies responded with expansionary monetary policies that provided, at least in part, for a continuation of the financial upturn, with continued growth in lending and in certain asset prices including, in a good many advanced economies, those of real estate assets.
This response by the main monetary authorities was possible thanks to the absence of significant inflationary pressures, despite the notable and prolonged economic growth recorded.1 Indeed, in the period indicated, the average rate of inflation in the advanced countries overall barely reached 2.1%, with a high of 2.4% in 2006. Increasing globalisation and, especially, the incorporation of emerging economies into world trade contributed to this benign inflation scenario by limiting the scope for
1 �In this respect it is important to note that, at that time, most central banks were mandated to maintain consumer price stability, but this mandate did not extend to prices of real or financial assets. For a discussion of whether or not monetary policy should also take account of developments in asset prices see, for example, the paper authored by Ben Bernanke and Mark Gertler (2001), “Should Central Banks Respond to Movements in Asset Prices?”, American Economic Review, Papers and Proceedings, 91, num. 2, pp. 253–257.
28 banco de españa
0
2
4
6
8
10
12
14
16
90 92 94 96 98 00 02 04 06
3 SHORT-TERM INTEREST RATES
%
-4
-2
0
2
4
6
8
10
80 82 84 86 88 90 92 94 96 98 00 02 04 06
WORLD EMERGING MARKETS & DEVELOPING ECONOMIES ADVANCED ECONOMIES
%
1 REAL GDP GROWTH
0
2
4
6
8
10
12
14
90 92 94 96 98 00 02 04 06
%
4 LONG-TERM INTEREST RATES
0
3
6
9
12
15
0
25
50
75
100
125
80 82 84 86 88 90 92 94 96 98 00 02 04 06
WORLD EMERGING MARKETS & DEVELOPING ECONOMIES ADVANCED ECONOMIES (right-hand scale)
%
2 INFLATION
%
-3
-2
-1
0
1
2
3
4
98 99 00 01 02 03 04 05 06 07
UNITED STATES OIL DEU + EURSUR OCADC CHN + EMA JPN ROW
5 GLOBAL IMBALANCES ON CURRENT ACCOUNT (a)
% of global GDP
0
2
4
6
8
10
12
80 82 84 86 88 90 92 94 96 98 00 02 04 06
HOUSE PRICES. REAL AVERAGE GROWTH OVER 8% IN LAST THREE YEARS LENDING. CREDIT-TO-GDP GAP OVER 10
6 NUMBER OF COUNTRIES WITH EXCESSIVE GROWTH IN HOUSE PRICES AND LENDING (b)
SOURCES: BIS, IMF and Banco de España.
a OIL: Norway and group of fuel-exporting emerging market and developing economies. DEU+EURSUR: Germany and other European advanced economies running a surplus. OCADC: Other European countries with a current account deficit pre-crisis. CHN+EMA: China and emerging Asian economies. ROW: rest of the world.
b Taking a total of 18 developed countries: Australia, Belgium, Canada, Denmark, Finland, France, Germany, Ireland, Italy, Japan, Netherlands, New Zealand, Norway, Spain, Sweden, Switzerland, United Kingdom and United States.
EURO AREA UNITED STATES UNITED KINGDOM JAPAN
CHART 1.1 MAIN INTERNATIONAL DEVELOPMENTS BEFORE THE CRISIS
29RepoRt on the financial and banking cRisis in spain, 2008-2014
price increases of goods and services in the advanced economies. Moreover, the high savings levels recorded in some of the main emerging economies gave rise to a general decline in both nominal and real interest rates, to historically low levels, and prompted high capital flows into advanced countries. As a result, significant imbalances built up in the current account balances of some of the leading economies, which became commonly known as “global imbalances”.
In tandem with this increase in economic globalisation came an intense process of financial integration. The sharp rise in financial flows between regions and countries was accompanied, in turn, by a high degree of financial innovation, characterised by rapid growth in the use of new instruments, such as certain structured products and credit derivatives. Some of these products gradually became more complex, and purportedly more efficient when it came to avoiding excessive risk concentration. The speed with which some of these financial assets evolved was faster, in some cases, than the pace of adjustment of the regulatory framework. At the same time, it became increasingly hard to identify the agents assuming the ultimate risk of these financial instruments and products, making their monitoring difficult.
With the benefit of hindsight, there can be no doubt that the real level of risk assumed at that time in the global financial markets was much higher than was estimated or could be expected, and that some of the newest and most complex products proved to be less reliable than estimated, especially in some jurisdictions, all of which contributed to the outbreak of the crisis and its subsequent worsening. In addition, the lack of early detection and monitoring tools for systemic risk and the low level of development at that time of global macroprudential policies hindered the early detection of these excesses.
Likewise, in retrospect, the international environment described was conducive to pursuit by the main central banks of monetary policies that were probably too lax, thus contributing to the build-up of the imbalances mentioned. Fiscal policies too were affected by the long period of economic boom and asset price inflation. Although some countries achieved a favourable financial situation, with a budget surplus and a significant reduction in debt, it later became clear that part of those improvements were a result of temporary increases in public revenue frequently connected to real estate market growth. Subsequently, when this revenue suddenly disappeared, fiscal positions deteriorated significantly, narrowing the room for manoeuvre available to authorities to counter the effects of the crisis.
B. Spanish economy
In this international setting, real GDP growth in Spain was 34.5% in cumulative terms in the period 2000 to 2007, with an annual average rate of 3.8% (see Chart 1.2). As a result, economic growth in terms of GDP per capita rose significantly, converging by 9.8 pp2 in respect of the euro
2 In nominal terms.

30 banco de españa
area average, to reach 94.8% in 2007. This positive macroeconomic performance was especially evident in the employment rate, which rose by 12.2 pp in the period, against the backdrop of a significant increase (of almost 12 pp) in the female participation rate, on the one hand, and strong demographic expansion, with population growth of almost five million in the period (1.3% in annual average terms), some 90% of which was owing to net inflows of immigrants, on the other.
This long period of expansion also had a number of undesirable effects, which translated into a build-up of significant macroeconomic and financial imbalances. Euro area membership entailed the loss of the mechanism whereby exchange rates could be adjusted relative to those of the other euro area countries, and the adoption of a common monetary policy that was appropriate for the euro area as a whole. Joining an economic area that enjoyed greater macroeconomic stability meant that interest rates fell considerably in Spain, an effect that was heightened by the expansionary monetary policy prevailing in the period.
In consequence, after Spain joined the euro area, interest rates were low compared with those that would have been advisable in view of the cyclical position of the Spanish economy. The resultant strong expansionary impulse encouraged higher spending by different agents and was accompanied by growth in the debt of households and non-financial corporations, which in terms of GDP rose by 97 pp (from 94% to 191% of GDP) in the period 2000-2007.
The growth in financing to the private sector was concentrated especially in the real estate sector, which posted annual average growth rates of 20% in loans for house purchases and 29% in loans to
SOURCES: Eurostat, INE, European Commission and Banco de España.
CHART 1.2 GDP AND INFLATION IN SPAIN AND THE EURO AREA BEFORE THE CRISIS
0
1
2
3
4
5
6
1998 1999 2000 2001 2002 2003 2004 2005 2006 2007
1 REAL GDP (Rate of change)
%
0.0
0.5
1.0
1.5
2.0
2.5
3.0
3.5
4.0
1998 1999 2000 2001 2002 2003 2004 2005 2006 2007
2 INFLATION
%
SPAIN EURO AREA

31RepoRt on the financial and banking cRisis in spain, 2008-2014
construction and real estate service firms in that period.3 After a minor slowdown in 2002 and the first half of 2003, linked to the effects of the dot-com crisis, financing raised by the private sector picked up again in the second half of 2003, reaching peak annual growth rates of 25% (in December 2005) in loans to households for house purchases and 44% (in December 2007) in loans to construction and real estate firms. The notable growth in the real estate sector and the strong flow of financing into the sector fuelled each other, eventually giving rise to excesses in the rate of house-building and in house prices.
The surge in demand for housing observed in the period was encouraged by, high future income prospects, easier access to mortgage credit (courtesy of low interest rates and longer maturity periods, among other factors) and the notable population increase. The consequent upward momentum in prices also helped to fuel demand momentum, prompting greater expectations of higher real estate prices which fomented growth in the supply of credit, underpinned by the developments in real estate prices and assets.
Housing supply responded, somewhat belatedly but intensely, to this higher demand, which was also encouraged by the accommodative credit conditions for the real estate and construction sectors, the availability of development land, boosted by several regulatory changes introduced from the end of the 1990s, and the plentiful supply of labour, fuelled by the large migration flows. In the strong demand setting described, all these factors prompted a very marked increase in investment in housing. Indeed, as a percentage of GDP, housing investment almost doubled in the period 2000-2007, reaching a peak of 12% (more than 5 pp above the figure for the euro area). Investment in non-residential building (civil and public works) increased by 1.4 pp, while the number of social security registered workers in the construction sector rose by more than one million and, in 2007, housing starts totalled more than 600,000.
That said, despite the significant increase in supply, house prices (measured by the statistics on appraised value of the Ministry of Public Works) soared, rising by 100% in real terms and by 150% in nominal terms in the period. This house price momentum heightened in the years leading up to the crisis and came to form a pattern consistent with a speculative bubble, such that, for a protracted period, house prices were higher than the level consistent with the fundamental housing market determinants.4
3 See Section 1.2 for an analysis of credit growth in the reference period. 4 �A speculative bubble may be defined as a disproportionate increase in the price of an asset, such that it exceeds the value
that would be consistent with its fundamental determinants for a protracted period. In the case of housing, the “fundamental value” would be its value as a durable good that provides accommodation for its inhabitants. The presence of a speculative element in house prices would reflect expectations by some house buyers of obtaining a return on their property, by subsequently selling it at a sufficiently high price, above that they would obtain by keeping it for their own use or placing it on the rental market.

32 banco de españa
Ultimately, the combination of real estate sector imbalances and very high indebtedness in the economy became the main transmission mechanism of the subsequent crisis. The significant feedback loop that developed between real estate prices and the indebtedness of certain segments of the household and non-financial corporation sectors increased their vulnerability (and that of the financial system itself ) to potential adjustments in real estate prices and tightening of financial conditions.
Against this background of excessively accommodative financial and monetary conditions for the Spanish economy, the inflation rate was systematically higher in Spain than in the euro area overall (see Chart 1.2). The build-up of positive inflation differentials with respect to the euro area from the very start of its existence (around 1 pp per annum on average up to 2008) fuelled a significant loss of price competitiveness relative to the rest of the euro area, as both profit margins and unit labour costs grew at a faster pace than the euro area average. Spain’s low labour productivity growth (and especially its low total factor productivity growth)5 relative to the rest of the euro area, together with its high wage growth rates, gave rise, in the period 1996-2008 (see Chart 1.3), to an increase in unit labour costs relative to the euro area as a whole verging on 25%.
The strong demand pressure and the loss of external competitiveness of the Spanish economy also had very significant consequences. Although Spain’s world export market shares remained quite steady, the weight of imports in final demand rose by 2 pp in the period, resulting in a current and capital account deficit of 9% of GDP in 2007, one of the highest among the developed countries.
Recurring balance of payments deficits in the period gave rise to a negative net international investment position (IIP) for the Spanish economy of 80% of GDP in 2007, whitch was also very high by international standards (see Chart 1.3). Most of these capital inflows into Spain were obtained directly or indirectly by credit institutions, through sales to international investors of securities (especially asset-backed securities and covered bonds) issued by those institutions (or, in the case of asset-backed securities, by special-purpose vehicles), backed largely by their loan portfolios. These funds, which financed the expansion of credit to households and non-financial corporations in Spain, entailed a growing reliance on the willingness of external investors to maintain a flow of funds to meet not only the maturities but also the new needs deriving from the persistent current account deficit.
In short, during this period of economic expansion, highly significant imbalances built up, in terms of resident private-sector debt, reliance on external financing, the weight of the real estate
5 �Total factor productivity (TFP) is defined as the part of final output that cannot be related to the levels of employment and capital utilised in its production, and that seeks therefore to reflect intangibles, including, in particular, technological progress, innovation, research and development, the economic and institutional environment and competitiveness.

33RepoRt on the financial and banking cRisis in spain, 2008-2014
sector in the economy, over-valuation of the price of real estate assets and loss of competitiveness. Economic agents tended to underestimate the importance of these imbalances, in a setting in which Spain’s recent inclusion in an economic area that enjoyed greater macroeconomic stability made it difficult to distinguish between the long and short-term effects of that inclusion. This limited appreciation of the level of risk extended to the valuations of many financial assets, and discrimination as to the credit quality of the different financial products and agents proved to be clearly insufficient.
This build-up of macroeconomic and financial imbalances also occurred in other countries of the euro area, particularly in those that started out from lower levels of income per capita. With the advent of monetary union, these countries saw a significant fall in their real interest rates and an improvement in their growth expectations, and they received financing essentially from other member countries with current account surpluses and more moderate economic growth rates. Problems
CHART 1.3 BUILD-UP OF IMBALANCES IN THE SPANISH ECONOMY
90
95
100
105
110
115
120
125
95 96 97 98 99 00 01 02 03 04 05 06 07
1 UNIT LABOUR COSTS IN SPAIN RELATIVE TO THE EURO AREA
1995 Q4 = 100
0
2
4
6
8
10
12
14
95 96 97 98 99 00 01 02 03 04 05 06 07
% of GDP
3 INVESTMENT IN HOUSING
0
50
100
150
200
250
95 96 97 98 99 00 01 02 03 04 05 06 07
HOUSEHOLDS NON-FINANCIAL CORPORATIONS GENERAL GOVERNMENT
% of GDP
4 TOTAL DEBT
-120
-100
-80
-60
-40
-20
0
-10
-8
-6
-4
-2
0
2
95 96 97 98 99 00 01 02 03 04 05 06 07
CURRENT AND CAPITAL ACCOUNT BALANCE IIP (right-hand scale)
2 BALANCE OF PAYMENTS AND INTERNATIONAL INVESTMENT POSITION (a)
% of GDP % of GDP
SOURCES: Eurostat, INE and Banco de España.
a Assets minus liabilities relative to the rest of the world.
34 banco de españa
emerged of private-sector over-indebtedness, banking system vulnerability, excessive reliance on external saving, competitiveness losses and, in some cases, fiscal sustainability, with varying degrees of intensity, in these countries, although in general their scope and their possible consequences were not correctly diagnosed. The financial markets underestimated the risks deriving from these developments, so that, for example, the differences in risk premia applied to different sovereign debt issuers virtually disappeared.
In their analysis of the Spanish economy, the Banco de España and other international organisations such as the IMF and the OECD identified these problems and issued warnings about the growing vulnerability of households’ finances associated with their increasing debt, a significant over-valuation of housing, the build-up of competitiveness losses, the level of concentration in credit institutions’ portfolios and the excessive reliance on borrowing.6 These imbalances in the Spanish economy were identified as risks for continuation along the central economic growth path, but a progressive deceleration in activity was projected, compatible with a gradual correction of these imbalances which, in the event, did not occur. As will be seen in Chapters 2 and 3 of this report, there was no anticipation of a severe economic downturn such as that which ensued from 2008, nor, clearly, of the factors that triggered that downturn, namely the international financial crisis, in the first instance, and the euro area sovereign debt crisis, in the second.
Regarding economic policy recommendations, given that the prevailing financial and monetary conditions were excessively accommodative for the Spanish economy, the use in that period of other domestic economic policy levers, which could have helped to counter the generation of these imbalances, was clearly insufficient. In particular, as indicated above, the limited implementation at the international level of systems permitting early detection of systemic financial risk and of macroprudential policy tools – which started to be developed as a consequence of the crisis – acted as a constraint on the adoption of a more forward-looking and more efficient approach to prevention of the crisis, both in Spain and globally.
In the case of Spain, the constraints on adopting such an approach were most evident in relation to the excessive credit growth in the years preceding the crisis and the high exposure of credit institutions to real estate sector risks. It should be noted, however, that the Banco de España developed a raft of specific regulatory instruments to counter the build-up of these risks in the Spanish financial system, including the “dynamic provisions”, analysed below in detail in Section 1.2. Subsequently, however, as the international financial crisis unfolded and international capital markets severely tightened, the Spanish regulatory instruments implemented during the expansionary phase proved
6 �See, inter alia, the Banco de España’s Annual Report and Financial Stability Report for this period, the IMF’s reports on Article IV Consultations and the OECD’s Economic Studies.

35RepoRt on the financial and banking cRisis in spain, 2008-2014
to be clearly insufficient and, as will be analysed in the next chapter, only from 2008 did work begin on the development of a new regulatory and supervisory framework coordinated at the international level.
Moreover, the supply-side reforms affecting the labour, product and factor markets and the economy’s productivity also proved insufficient to achieve the aim of maintaining and enhancing the competitive capacity of the economy, as required by membership of a monetary union.
Lastly, insofar as budget policy is concerned, although during the first years of euro area membership Spain’s general government agencies reduced their financing needs substantially, to the extent that fiscal surpluses were recorded in 2006 and 2007, taking government debt to 36% of GDP in 2007, it is clear that the fiscal policy stance during that expansionary phase was not sufficiently countercyclical. In particular, as was demonstrated when the real estate bubble came to an end, the improved fiscal position was underpinned in part by cyclical effects and by extraordinary revenue closely linked to the real estate boom, whereas a large portion of the higher public spending commitment had a significant structural component.
1.2� SITUATION�OF�THE�FINANCIAL�SECTOR
As described in the previous section, the first few years after 2001 were marked by rapid growth in the volume of credit and by an increasing proportion of real estate lending. This section offers a more detailed description of the strong expansion of the financial sector and, in particular, of the savings banks, which by December 2007 accounted for 49% of total credit in the system, outpacing the growth of the commercial banks (even though neither all of the savings banks nor all of the commercial banks behaved in the same fashion). For this purpose, there follows a review of the main indicators of the deposit institution sector, such as developments in lending and non-performing loans, sources of financing, profitability and, lastly, solvency. As will be seen, throughout the reference period the main variables remained consistent with the prevailing economic expansion, although towards the end of the period they started to reflect a turnaround.
A. Credit to the resident private sector
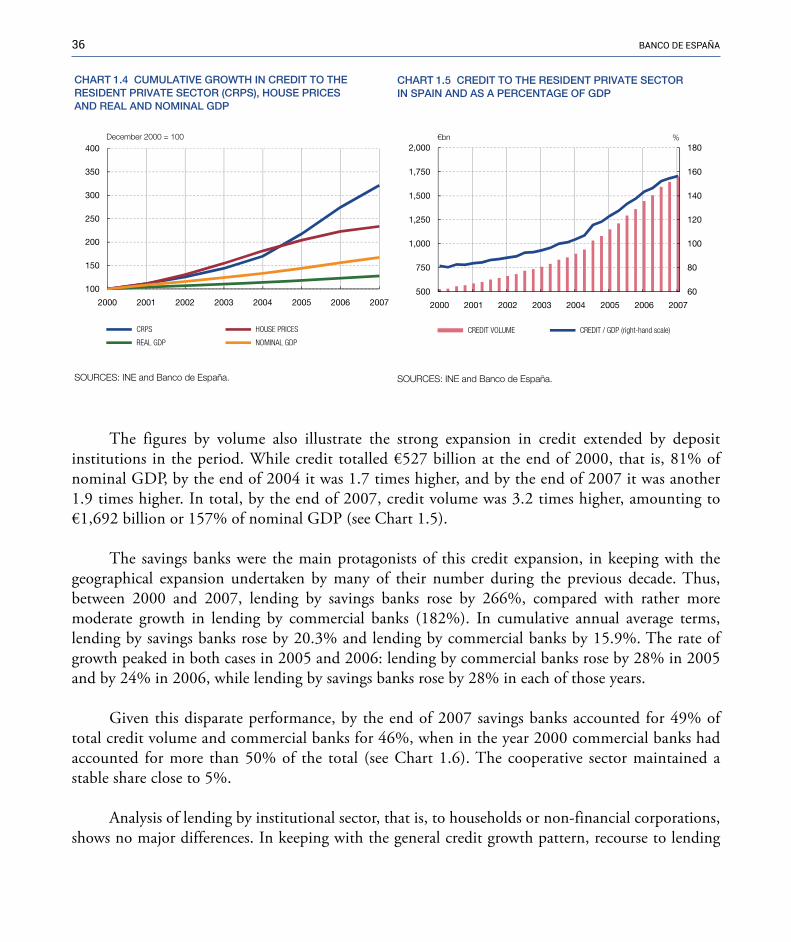
As shown in Charts 1.4 and 1.5, in the years 2001 to 2007 credit growth outpaced that of nominal GDP, and with an increasingly larger gap. Credit rose by 221% in the period, while nominal GDP rose by 67% and real GDP by 28%. The average annual rate of change in credit throughout the period considered was 18.1%, with the highest growth rates being recorded in 2005 (28%) and 2006 (26%), well above the average year-on-year rate of change in nominal GDP in the period which was 7.6% (see Chart 1.4).
36 banco de españa
The figures by volume also illustrate the strong expansion in credit extended by deposit institutions in the period. While credit totalled €527 billion at the end of 2000, that is, 81% of nominal GDP, by the end of 2004 it was 1.7 times higher, and by the end of 2007 it was another 1.9 times higher. In total, by the end of 2007, credit volume was 3.2 times higher, amounting to €1,692 billion or 157% of nominal GDP (see Chart 1.5).
The savings banks were the main protagonists of this credit expansion, in keeping with the geographical expansion undertaken by many of their number during the previous decade. Thus, between 2000 and 2007, lending by savings banks rose by 266%, compared with rather more moderate growth in lending by commercial banks (182%). In cumulative annual average terms, lending by savings banks rose by 20.3% and lending by commercial banks by 15.9%. The rate of growth peaked in both cases in 2005 and 2006: lending by commercial banks rose by 28% in 2005 and by 24% in 2006, while lending by savings banks rose by 28% in each of those years.
Given this disparate performance, by the end of 2007 savings banks accounted for 49% of total credit volume and commercial banks for 46%, when in the year 2000 commercial banks had accounted for more than 50% of the total (see Chart 1.6). The cooperative sector maintained a stable share close to 5%.
Analysis of lending by institutional sector, that is, to households or non-financial corporations, shows no major differences. In keeping with the general credit growth pattern, recourse to lending
100
150
200
250
300
350
400
2000 2001 2002 2003 2004 2005 2006 2007
CRPS HOUSE PRICES
REAL GDP NOMINAL GDP
December 2000 = 100
CHART 1.4 CUMULATIVE GROWTH IN CREDIT TO THERESIDENT PRIVATE SECTOR (CRPS), HOUSE PRICESAND REAL AND NOMINAL GDP
SOURCES: INE and Banco de España.
CHART 1.5 CREDIT TO THE RESIDENT PRIVATE SECTORIN SPAIN AND AS A PERCENTAGE OF GDP
60
80
100
120
140
160
180
500
750
1,000
1,250
1,500
1,750
2,000
2000 2001 2002 2003 2004 2005 2006 2007
CREDIT VOLUME CREDIT / GDP (right-hand scale)
€bn %
SOURCES: INE and Banco de España.

37RepoRt on the financial and banking cRisis in spain, 2008-2014
increased similarly in both sectors, with growth rates over 220% between 2000 and 2007 and annual average rates over 18%. However, significant differences are observed according to loan purpose, with a higher proportion linked to the real estate sector.
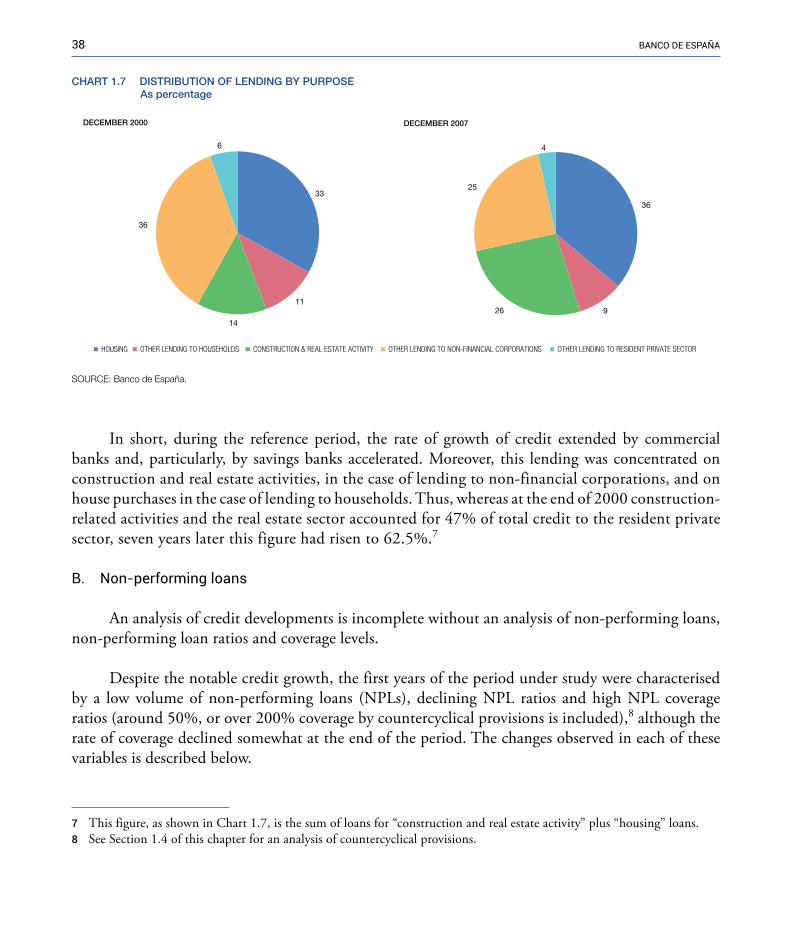
— In the case of lending to Spanish households, between 2000 and 2007 a substantial increase is observed in loans for house purchases, which record cumulative average annual growth of 19.7% between 2000 and 2007 – 252% in the period – compared with 14.6% for loans for other purposes, essentially consumer loans. Accordingly, in 2007, 80% of total lending to households was for house purchases, compared with 75% in 2000. Of this increase in lending to households, commercial banks accounted for 37% and savings banks for 57%.
— As regards lending to non-financial corporations, there was a significant increase in credit extended to firms in the construction and real estate sectors, which recorded a cumulative average annual rate of change of almost 30%, compared with 12% in the case of credit extended to firms in other sectors. In cumulative terms, lending to the real estate sector rose by 513%, compared with lending to all other sectors, which rose by just 120%. Thus, as a proportion of total lending to the resident private sector, lending to construction and real estate firms went from 14% at the end of 2000 to 26% in December 2007 (see Chart 1.7). Both commercial and savings banks progressively increased their lending to construction and real estate sector firms, although savings banks to a greater extent than commercial banks: while lending by the latter rose at average annual rates of 27.7%, lending by savings banks rose at rates verging on 31% year-on-year.
5243
5DECEMBER 2000
CHART 1.6 DISTRIBUTION OF LENDING BY TYPE OF INSTITUTIONAs percentage
SOURCE: Banco de España.NB: For the purposes of analysis, the savings bank group comprises the "former savings bank sector", including all institutions that have at some time had the legalstatus of a savings bank, irrespective of their subsequent transformation into banking institutions.
46
49
5DECEMBER 2007
COMMERCIAL BANKS SAVINGS BANKS CREDIT COOPERATIVES
38 banco de españa
In short, during the reference period, the rate of growth of credit extended by commercial banks and, particularly, by savings banks accelerated. Moreover, this lending was concentrated on construction and real estate activities, in the case of lending to non-financial corporations, and on house purchases in the case of lending to households. Thus, whereas at the end of 2000 construction-related activities and the real estate sector accounted for 47% of total credit to the resident private sector, seven years later this figure had risen to 62.5%.7
B. Non-performing loans
An analysis of credit developments is incomplete without an analysis of non-performing loans, non-performing loan ratios and coverage levels.
Despite the notable credit growth, the first years of the period under study were characterised by a low volume of non-performing loans (NPLs), declining NPL ratios and high NPL coverage ratios (around 50%, or over 200% coverage by countercyclical provisions is included),8 although the rate of coverage declined somewhat at the end of the period. The changes observed in each of these variables is described below.
7 This figure, as shown in Chart 1.7, is the sum of loans for “construction and real estate activity” plus “housing” loans. 8 See Section 1.4 of this chapter for an analysis of countercyclical provisions.
33
11
14
36
6
DECEMBER 2000
CHART 1.7 DISTRIBUTION OF LENDING BY PURPOSEAs percentage
36
926
25
4
DECEMBER 2007
HOUSING OTHER LENDING TO HOUSEHOLDS CONSTRUCTION & REAL ESTATE ACTIVITY OTHER LENDING TO NON-FINANCIAL CORPORATIONS OTHER LENDING TO RESIDENT PRIVATE SECTOR
SOURCE: Banco de España.
39RepoRt on the financial and banking cRisis in spain, 2008-2014
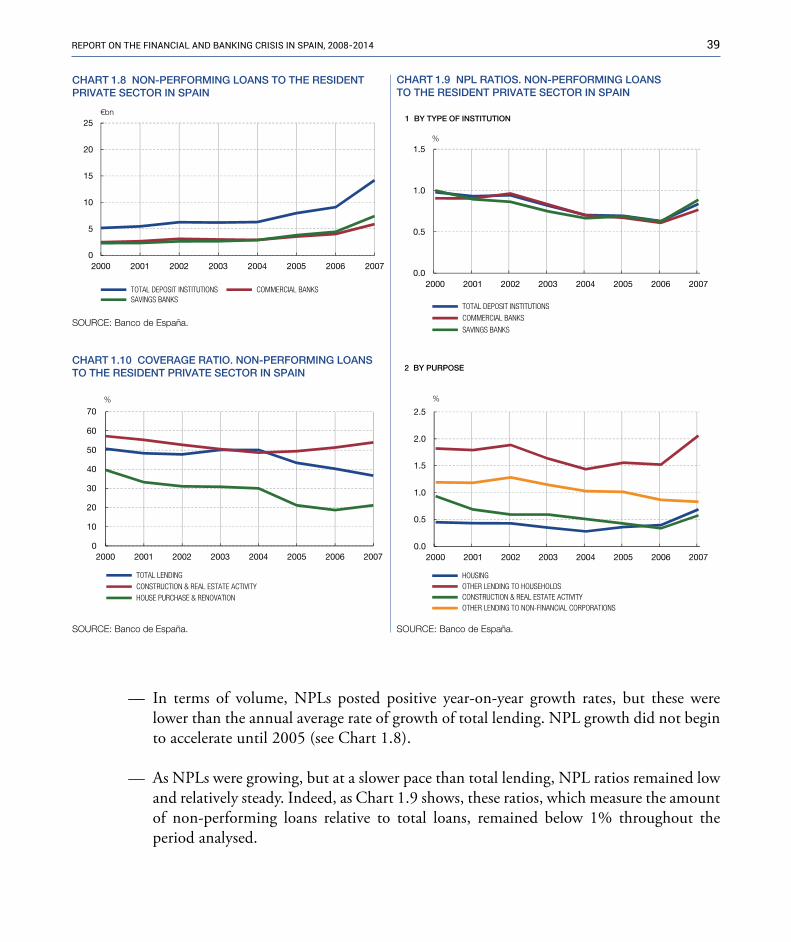
— In terms of volume, NPLs posted positive year-on-year growth rates, but these were lower than the annual average rate of growth of total lending. NPL growth did not begin to accelerate until 2005 (see Chart 1.8).
— As NPLs were growing, but at a slower pace than total lending, NPL ratios remained low and relatively steady. Indeed, as Chart 1.9 shows, these ratios, which measure the amount of non-performing loans relative to total loans, remained below 1% throughout the period analysed.
0
5
10
15
20
25
2000 2001 2002 2003 2004 2005 2006 2007
TOTAL DEPOSIT INSTITUTIONS COMMERCIAL BANKS SAVINGS BANKS
€bn
CHART 1.8 NON-PERFORMING LOANS TO THE RESIDENTPRIVATE SECTOR IN SPAIN
CHART 1.9 NPL RATIOS. NON-PERFORMING LOANSTO THE RESIDENT PRIVATE SECTOR IN SPAIN
0.0
0.5
1.0
1.5
2000 2001 2002 2003 2004 2005 2006 2007
TOTAL DEPOSIT INSTITUTIONS
COMMERCIAL BANKS
SAVINGS BANKS
1 BY TYPE OF INSTITUTION
%
0.0
0.5
1.0
1.5
2.0
2.5
2000 2001 2002 2003 2004 2005 2006 2007
HOUSING OTHER LENDING TO HOUSEHOLDS CONSTRUCTION & REAL ESTATE ACTIVITY OTHER LENDING TO NON-FINANCIAL CORPORATIONS
%
2 BY PURPOSECHART 1.10 COVERAGE RATIO. NON-PERFORMING LOANSTO THE RESIDENT PRIVATE SECTOR IN SPAIN
SOURCE: Banco de España.
0
10
20
30
40
50
60
70
2000 2001 2002 2003 2004 2005 2006 2007
TOTAL LENDING CONSTRUCTION & REAL ESTATE ACTIVITY HOUSE PURCHASE & RENOVATION
%
SOURCE: Banco de España. SOURCE: Banco de España.
40 banco de españa
NPL ratios remained at low levels in all components of credit to the private sector. In the case of loans for house purchases, the ratio was even below 0.5%, being slightly higher, at close to 2%, in the case of loans for other purposes (see Chart 1.9). For their part, non-financial corporations had NPL ratios below 1% for lending to the construction and real estate sectors, and slightly higher ratios for lending for other activities.
— Regarding coverage ratios, deposit institutions’ credit risk appeared to be adequately covered. Between 2000 and 2004, NPL coverage ratios were high, around 50%-60%, save in the case of loans to households for house purchases which stood at 30%-40%, as shown in Chart 1.10.
These NPL and coverage ratios remained at similar levels both for commercial and savings banks. At the end of the period analysed, in 2007, a turnaround started to be observed in both the NPL and coverage ratios, and developments at commercial and savings banks started to diverge. The volume of NPLs rose sharply, more so for savings banks (with year-on-year rates of change verging on 70%) than for commercial banks (below 50%) and at a much higher pace than total lending (growth rates below 20%).
This prompted widespread increases in NPL ratios (save in the case of lending to non-financial corporations for other activities), although they continued to be relatively low: at the end of 2007 the NPL ratio for lending to the resident private sector was 0.8%. The coverage ratio dropped to 37%, compared with more than 50% in 2003 and 2004. As will be seen in the next chapter, the NPL situation worsened in 2008, both in absolute and relative terms.
C. Government debt holdings of deposit institutions
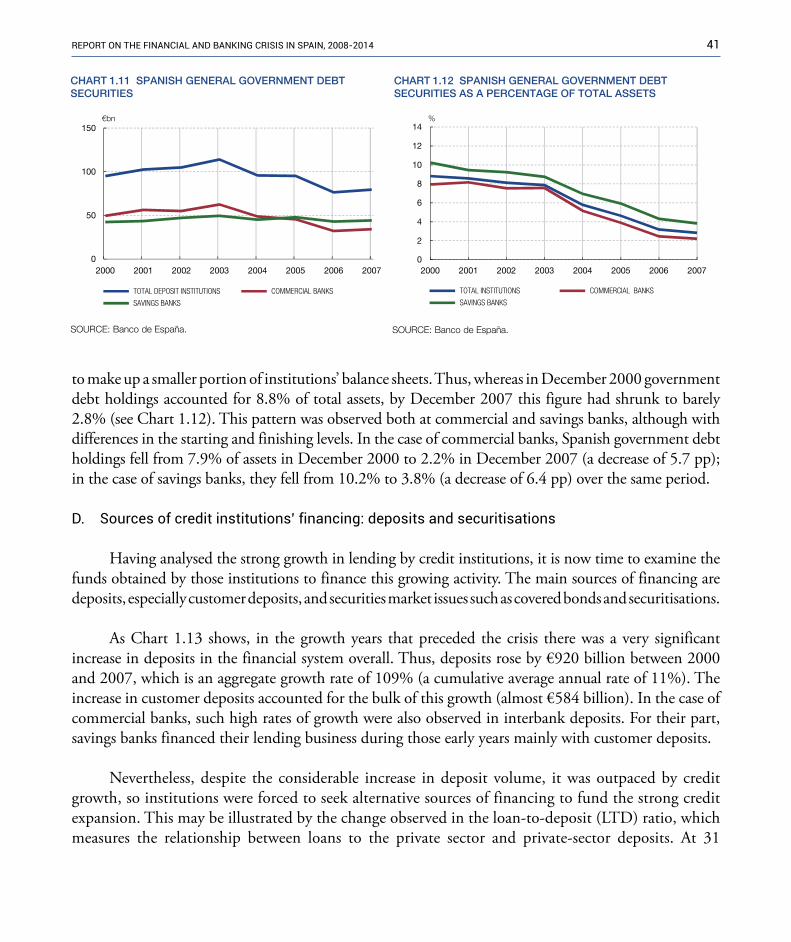
For purposes of comparison with the developments described in the following chapters, it should be noted that during the first years of the period analysed the volume of Spanish government debt held by deposit institutions was relatively steady and was proportionately much lower than that held subsequently. Between 2000 and 2005 these holdings fluctuated, for the system overall, around the level of €100 billion, with a peak of €114 billion in 2003. The volume of holdings of Spanish government debt was stable both for savings banks (around €45 billion) and commercial banks (around €55 billion).
From 2006 and up to the end of the expansionary period, Spain’s commercial banks gradually reduced the volume of government debt on their balance sheets, to €34 billion in December 2007, while the volume at savings banks remained unchanged (see Chart 1.11).
This relative stability in Spanish government debt holdings in a period of strong balance sheet growth for Spanish deposit institutions (total assets of business in Spain increased by 160% between December 2000 and December 2007) meant that Spanish government debt securities gradually came
41RepoRt on the financial and banking cRisis in spain, 2008-2014
to make up a smaller portion of institutions’ balance sheets. Thus, whereas in December 2000 government debt holdings accounted for 8.8% of total assets, by December 2007 this figure had shrunk to barely 2.8% (see Chart 1.12). This pattern was observed both at commercial and savings banks, although with differences in the starting and finishing levels. In the case of commercial banks, Spanish government debt holdings fell from 7.9% of assets in December 2000 to 2.2% in December 2007 (a decrease of 5.7 pp); in the case of savings banks, they fell from 10.2% to 3.8% (a decrease of 6.4 pp) over the same period.
D. Sources of credit institutions’ financing: deposits and securitisations
Having analysed the strong growth in lending by credit institutions, it is now time to examine the funds obtained by those institutions to finance this growing activity. The main sources of financing are deposits, especially customer deposits, and securities market issues such as covered bonds and securitisations.
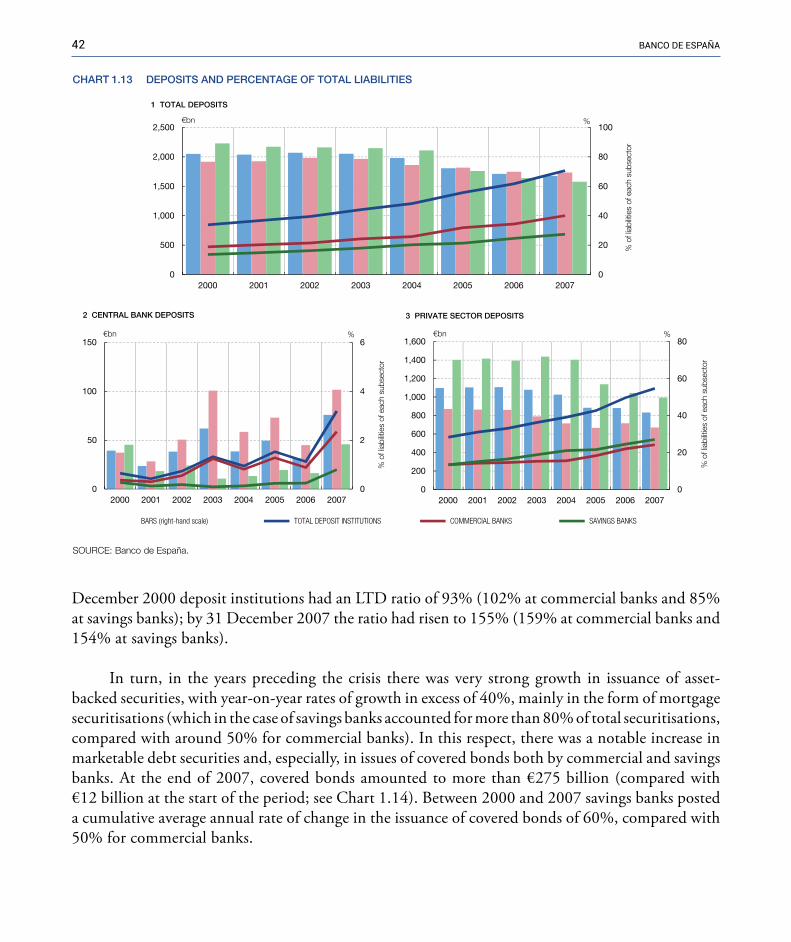
As Chart 1.13 shows, in the growth years that preceded the crisis there was a very significant increase in deposits in the financial system overall. Thus, deposits rose by €920 billion between 2000 and 2007, which is an aggregate growth rate of 109% (a cumulative average annual rate of 11%). The increase in customer deposits accounted for the bulk of this growth (almost €584 billion). In the case of commercial banks, such high rates of growth were also observed in interbank deposits. For their part, savings banks financed their lending business during those early years mainly with customer deposits.
Nevertheless, despite the considerable increase in deposit volume, it was outpaced by credit growth, so institutions were forced to seek alternative sources of financing to fund the strong credit expansion. This may be illustrated by the change observed in the loan-to-deposit (LTD) ratio, which measures the relationship between loans to the private sector and private-sector deposits. At 31
CHART 1.11 SPANISH GENERAL GOVERNMENT DEBTSECURITIES
0
50
100
150
2000 2001 2002 2003 2004 2005 2006 2007
TOTAL DEPOSIT INSTITUTIONS COMMERCIAL BANKS
SAVINGS BANKS
€bn
CHART 1.12 SPANISH GENERAL GOVERNMENT DEBTSECURITIES AS A PERCENTAGE OF TOTAL ASSETS
0
2
4
6
8
10
12
14
2000 2001 2002 2003 2004 2005 2006 2007
TOTAL INSTITUTIONS COMMERCIAL BANKS
SAVINGS BANKS
%
SOURCE: Banco de España. SOURCE: Banco de España.
42 banco de españa
December 2000 deposit institutions had an LTD ratio of 93% (102% at commercial banks and 85% at savings banks); by 31 December 2007 the ratio had risen to 155% (159% at commercial banks and 154% at savings banks).
In turn, in the years preceding the crisis there was very strong growth in issuance of asset-backed securities, with year-on-year rates of growth in excess of 40%, mainly in the form of mortgage securitisations (which in the case of savings banks accounted for more than 80% of total securitisations, compared with around 50% for commercial banks). In this respect, there was a notable increase in marketable debt securities and, especially, in issues of covered bonds both by commercial and savings banks. At the end of 2007, covered bonds amounted to more than €275 billion (compared with €12 billion at the start of the period; see Chart 1.14). Between 2000 and 2007 savings banks posted a cumulative average annual rate of change in the issuance of covered bonds of 60%, compared with 50% for commercial banks.
CHART 1.13 DEPOSITS AND PERCENTAGE OF TOTAL LIABILITIES
0
20
40
60
80
100
0
500
1,000
1,500
2,000
2,500
2000 2001 2002 2003 2004 2005 2006 2007
€bn %
% o
f lia
bilit
ies
of e
ach
subs
ecto
r
1 TOTAL DEPOSITS
SOURCE: Banco de España.
0
2
4
6
0
50
100
150
2000 2001 2002 2003 2004 2005 2006 2007
€bn %
% o
f lia
bilit
ies
of e
ach
subs
ecto
r
2 CENTRAL BANK DEPOSITS
0
20
40
60
80
0
200
400
600
800
1,000
1,200
1,400
1,600
2000 2001 2002 2003 2004 2005 2006 2007
€bn %
% o
f lia
bilit
ies
of e
ach
subs
ecto
r
3 PRIVATE SECTOR DEPOSITS
BARS (right-hand scale) TOTAL DEPOSIT INSTITUTIONS COMMERCIAL BANKS SAVINGS BANKS

43RepoRt on the financial and banking cRisis in spain, 2008-2014
E. Profitability of the sector
Overall, Spanish deposit institutions’ financial statements showed healthy results in the years preceding the crisis, assisted by rapid credit growth and low levels of NPLs.
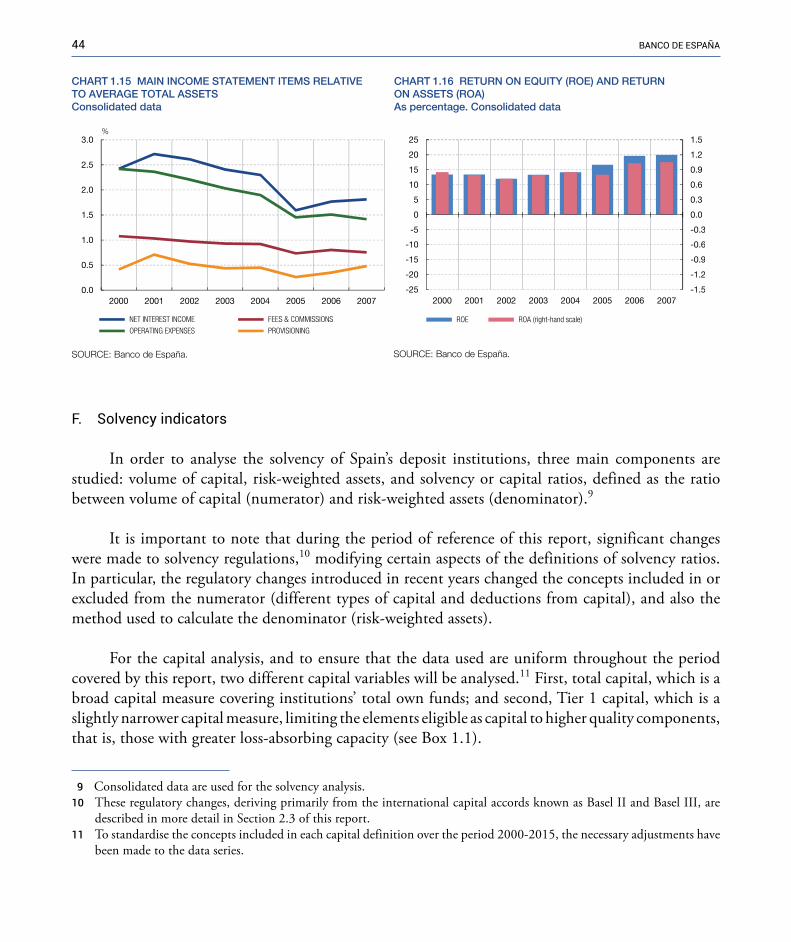
Institutions became more efficient, courtesy of the substantial growth in assets managed, which meant that the ratio of operating expenses to average total assets tended to decline. Moreover, although in the period 2000 to 2007 net interest income decreased in relative terms owing to the fall in interest rates, in absolute terms it rose as a result of the higher volume of transactions. Also in that period, institutions’ fee and commission income tended to decline, as competition to attract new customers (borrowers and depositors) heightened. Lastly, as a consequence of the low levels of NPLs, loan loss provisioning expenses were very low relative to credit volumes (see Chart 1.15).
In this setting, on consolidated data, return on equity (ROE) held steady between 2000 and 2007, remaining over 12% at all times and verging on 20% even at the end of 2007. Likewise on consolidated data, return on assets (ROA) also remained high, standing above 0.7% in all cases and reaching a peak of 1.05% in December 2007 (see Chart 1.16). Thus, institutions’ profits rose at a faster pace than their capital or assets.
Considering activity pursued in Spain only, income statements showed a similar performance, with ROE remaining over 13% on average in the period 2000 to 2007, as the ratio of operating expenses to average total assets also declined. There was little difference between commercial and savings banks, which posted similar ROE and ROA levels. As to the ratio of operating expenses to average total assets, savings banks recorded somewhat higher levels, although they also obtained efficiency gains at a faster pace than commercial banks in the period.
0
50
100
150
200
250
300
350
2000 2001 2002 2003 2004 2005 2006 2007
€bn
1 COVERED BONDS
CHART 1.14 MARKETABLE DEBT SECURITIES
0
50
100
150
200
250
300
350
2000 2001 2002 2003 2004 2005 2006 2007
€bn
2 ASSET-BACKED SECURITIES
SOURCE: Banco de España.
TOTAL DEPOSIT INSTITUTIONS COMMERCIAL BANKS SAVINGS BANKS
44 banco de españa
F. Solvency indicators
In order to analyse the solvency of Spain’s deposit institutions, three main components are studied: volume of capital, risk-weighted assets, and solvency or capital ratios, defined as the ratio between volume of capital (numerator) and risk-weighted assets (denominator).9
It is important to note that during the period of reference of this report, significant changes were made to solvency regulations,10 modifying certain aspects of the definitions of solvency ratios. In particular, the regulatory changes introduced in recent years changed the concepts included in or excluded from the numerator (different types of capital and deductions from capital), and also the method used to calculate the denominator (risk-weighted assets).
For the capital analysis, and to ensure that the data used are uniform throughout the period covered by this report, two different capital variables will be analysed.11 First, total capital, which is a broad capital measure covering institutions’ total own funds; and second, Tier 1 capital, which is a slightly narrower capital measure, limiting the elements eligible as capital to higher quality components, that is, those with greater loss-absorbing capacity (see Box 1.1).
��9 Consolidated data are used for the solvency analysis.10 �These regulatory changes, deriving primarily from the international capital accords known as Basel II and Basel III, are
described in more detail in Section 2.3 of this report.11 �To standardise the concepts included in each capital definition over the period 2000-2015, the necessary adjustments have
been made to the data series.
CHART 1.15 MAIN INCOME STATEMENT ITEMS RELATIVETO AVERAGE TOTAL ASSETSConsolidated data
0.0
0.5
1.0
1.5
2.0
2.5
3.0
2000 2001 2002 2003 2004 2005 2006 2007
NET INTEREST INCOME FEES & COMMISSIONS
OPERATING EXPENSES PROVISIONING
%
CHART 1.16 RETURN ON EQUITY (ROE) AND RETURNON ASSETS (ROA)As percentage. Consolidated data
-1.5
-1.2
-0.9
-0.6
-0.3
0.0
0.3
0.6
0.9
1.2
1.5
-25
-20
-15
-10
-5
0
5
10
15
20
25
2000 2001 2002 2003 2004 2005 2006 2007
ROE ROA (right-hand scale)
SOURCE: Banco de España. SOURCE: Banco de España.
box 1.1 ToTAL CAPITAL AND TIER 1 CAPITAL
Different capital measures may be used to analyse deposit institutions’ solvency, according to the concepts included in or excluded from the capital definition. These definitions vary according to the solvency regulations in force from time to time. Thus, during the fifteen years analysed in this report (2000-2014) the solvency regulations underwent significant changes, chiefly the introduction of Basel II solvency standards in 20081 and Basel III solvency standards in 2014,2 described in detail in Section 2.3 of this report. Basel III, for instance, whose essential aim3 was not only to raise capital requirements for institutions but especially to enhance capital quality (that is, the capacity to absorb losses), introduced
Common Equity Tier 1 (CET1). This new capital definition, which corresponds to the highest quality capital and immediately became the market benchmark for assessing institutions’ solvency, is only available from June 2014, so its analysis for the entire period is not possible. This report analyses two solvency variables: total capital and Tier 1 capital.
Total capital comprises Tier 1 and Tier 2 capital. Tier 1 capital is more limited and includes the relevant capital deductions.
Tier 1 capital elements have the most loss-absorbing capacity and, therefore, the highest quality. The essential elements of Tier 1 capital are share capital, including similar elements such as savings banks’ equity units (cuotas participativas), and reserves, while preference shares (participaciones preferentes), hybrid instruments that grant their holders voting rights that are more limited than those of ordinary shares, are only eligible if they meet certain conditions and up to a certain limit. The main deductions are for goodwill and other intangibles.
The chief element of Tier 2 capital, which is part of total capital but not of Tier 1 capital, is subordinated debt. Other key elements are general loan loss provisions and asset revaluation reserves.
1 �Banco de España Circular 3/2008 of 22 May 2008 to credit institutions on determination and control of minimum own funds is the main standard adapting Spanish legislation to the Basel II criteria, transposing EU Directives 2006/48/EC and 2006/49/EC.
2 �Basel III was transposed into Spanish legislation through Regulation (EU) 575/2013 of 26 June 2013 (directly applicable in the Member States) and Law 10/2014 on the regulation, supervision and solvency of credit institutions which transposes Directive 2013/36/EU of 26 June 2013 into Spanish law.
3 �Other, equally significant, aims of Basel III were to standardise capital definitions at an international level and strengthen transparency.
45REPoRt oN thE FINANCIAl AND BANkING CRISIS IN SPAIN, 2008-2014
The changes in capital, risk-weighted assets and solvency ratios over the period 2000 to 2007 are analysed below:
— Capital. As Chart 1.17 shows, institutions’ volume of capital increased significantly during the expansionary years. In absolute terms, between 2000 and 2007 the total capital of the Spanish financial system rose by €135 billion, up 155% on the level at the start of 2000. Over the same period, higher quality Tier 1 capital rose by slightly less (€85 billion, an increase of 118% between 2000 and 2007). Thus, during those years,
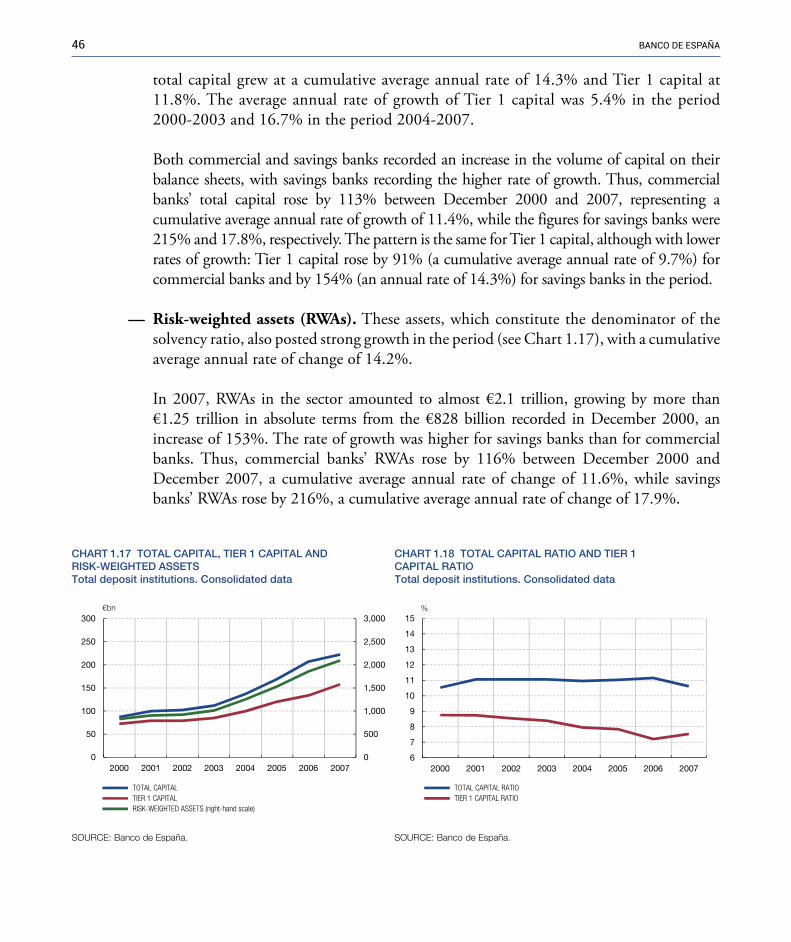
46 banco de españa
total capital grew at a cumulative average annual rate of 14.3% and Tier 1 capital at 11.8%. The average annual rate of growth of Tier 1 capital was 5.4% in the period 2000-2003 and 16.7% in the period 2004-2007.
Both commercial and savings banks recorded an increase in the volume of capital on their balance sheets, with savings banks recording the higher rate of growth. Thus, commercial banks’ total capital rose by 113% between December 2000 and 2007, representing a cumulative average annual rate of growth of 11.4%, while the figures for savings banks were 215% and 17.8%, respectively. The pattern is the same for Tier 1 capital, although with lower rates of growth: Tier 1 capital rose by 91% (a cumulative average annual rate of 9.7%) for commercial banks and by 154% (an annual rate of 14.3%) for savings banks in the period.
— Risk-weighted assets (RWAs). These assets, which constitute the denominator of the solvency ratio, also posted strong growth in the period (see Chart 1.17), with a cumulative average annual rate of change of 14.2%.
In 2007, RWAs in the sector amounted to almost €2.1 trillion, growing by more than €1.25 trillion in absolute terms from the €828 billion recorded in December 2000, an increase of 153%. The rate of growth was higher for savings banks than for commercial banks. Thus, commercial banks’ RWAs rose by 116% between December 2000 and December 2007, a cumulative average annual rate of change of 11.6%, while savings banks’ RWAs rose by 216%, a cumulative average annual rate of change of 17.9%.
CHART 1.17 TOTAL CAPITAL, TIER 1 CAPITAL ANDRISK-WEIGHTED ASSETSTotal deposit institutions. Consolidated data
0
500
1,000
1,500
2,000
2,500
3,000
0
50
100
150
200
250
300
2000 2001 2002 2003 2004 2005 2006 2007
TOTAL CAPITAL TIER 1 CAPITAL RISK-WEIGHTED ASSETS (right-hand scale)
€bn
SOURCE: Banco de España.
CHART 1.18 TOTAL CAPITAL RATIO AND TIER 1CAPITAL RATIOTotal deposit institutions. Consolidated data
6
7
8
9
10
11
12
13
14
15
2000 2001 2002 2003 2004 2005 2006 2007
TOTAL CAPITAL RATIO TIER 1 CAPITAL RATIO
%
SOURCE: Banco de España.
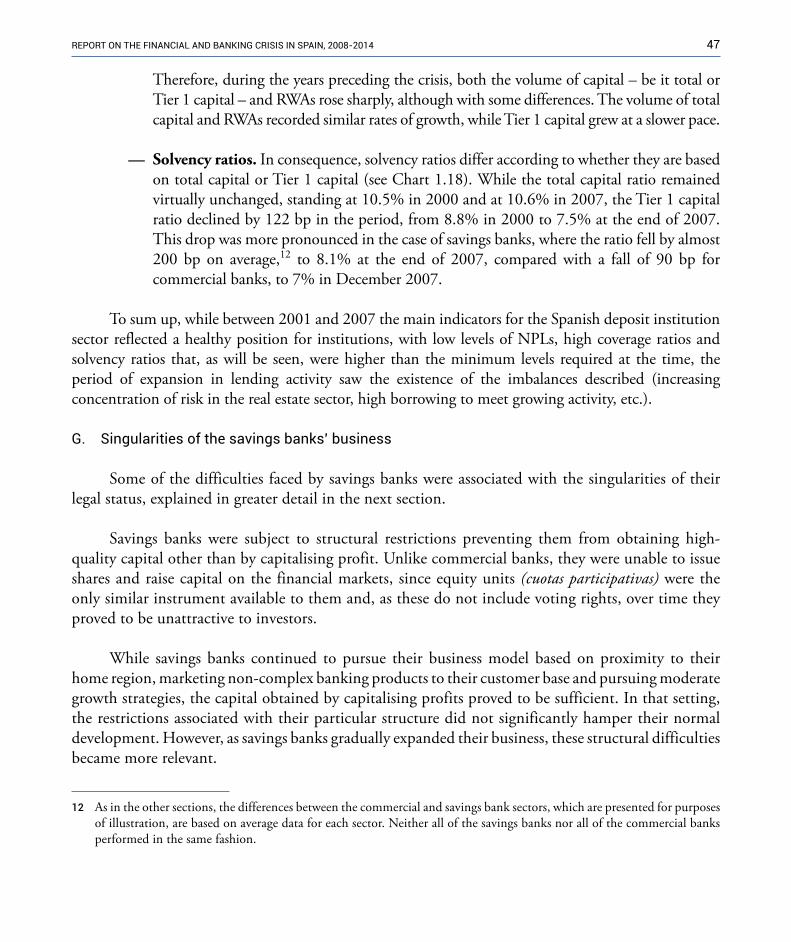
47RepoRt on the financial and banking cRisis in spain, 2008-2014
Therefore, during the years preceding the crisis, both the volume of capital – be it total or Tier 1 capital – and RWAs rose sharply, although with some differences. The volume of total capital and RWAs recorded similar rates of growth, while Tier 1 capital grew at a slower pace.
— Solvency ratios. In consequence, solvency ratios differ according to whether they are based on total capital or Tier 1 capital (see Chart 1.18). While the total capital ratio remained virtually unchanged, standing at 10.5% in 2000 and at 10.6% in 2007, the Tier 1 capital ratio declined by 122 bp in the period, from 8.8% in 2000 to 7.5% at the end of 2007. This drop was more pronounced in the case of savings banks, where the ratio fell by almost 200 bp on average,12 to 8.1% at the end of 2007, compared with a fall of 90 bp for commercial banks, to 7% in December 2007.
To sum up, while between 2001 and 2007 the main indicators for the Spanish deposit institution sector reflected a healthy position for institutions, with low levels of NPLs, high coverage ratios and solvency ratios that, as will be seen, were higher than the minimum levels required at the time, the period of expansion in lending activity saw the existence of the imbalances described (increasing concentration of risk in the real estate sector, high borrowing to meet growing activity, etc.).
G. Singularities of the savings banks’ business
Some of the difficulties faced by savings banks were associated with the singularities of their legal status, explained in greater detail in the next section.
Savings banks were subject to structural restrictions preventing them from obtaining high-quality capital other than by capitalising profit. Unlike commercial banks, they were unable to issue shares and raise capital on the financial markets, since equity units (cuotas participativas) were the only similar instrument available to them and, as these do not include voting rights, over time they proved to be unattractive to investors.
While savings banks continued to pursue their business model based on proximity to their home region, marketing non-complex banking products to their customer base and pursuing moderate growth strategies, the capital obtained by capitalising profits proved to be sufficient. In that setting, the restrictions associated with their particular structure did not significantly hamper their normal development. However, as savings banks gradually expanded their business, these structural difficulties became more relevant.
12 �As in the other sections, the differences between the commercial and savings bank sectors, which are presented for purposes of illustration, are based on average data for each sector. Neither all of the savings banks nor all of the commercial banks performed in the same fashion.

48 banco de españa
As savings banks expanded their activity beyond their traditional or original geographical areas, both their branch networks and their overheads expanded significantly, in keeping with their traditional business model based on retail banking and customer proximity. In some cases, this expansion entailed relaxing credit standards and disregarding sector concentration risks. Indeed, as seen above, over the course of the protracted economic growth phase some savings banks built up imbalances deriving from their high exposure to the real estate development and construction sector.
The traditional sources of financing were not sufficient to fund this strong business growth, as a consequence of the higher credit demand, so savings banks began to make more recurrent use of wholesale financing, mainly through covered bonds or asset securitisations.
Specifically, following the start of monetary union and the creation of the single currency, savings banks financed a significant part of their growth via recourse to the euro markets, issuing securities subscribed mainly by “non-resident investors”, and their retail deposit base lost ground compared with international financing. In retrospect, the relative proportion of securitised liabilities was high for the prevailing level of risk aversion on the financial markets. It should be noted, however, that this greater recourse to wholesale markets was undertaken quite prudently, with most maturities concentrated in the medium and long term. The diminishing level of profitability also became apparent, essentially owing to oversized structures, the increase in non-earning assets and the higher cost of debt.
All these factors shaped an unfavourable setting for the savings banks, making a transformation of their structure advisable. This transformation, as described in the next section, began with corporate moves aiming to raise their efficiency levels, boosting their competitive position and their market credibility by increasing their average size and harnessing synergies. However, as will be seen in more depth below, these moves proved to be tardy and insufficient.
1.3 REGULATORY�FRAMEWORK�AND�SUPERVISORY�POWERS
Before describing the measures taken by the supervisor during the period analysed, an overview of the regulatory framework governing banking activity at the time is appropriate.
The regulatory framework governing the activity of deposit institutions seeks to safeguard the stability of the financial system and preserve the essential economic role played by the banking sector, namely intermediation between savings and credit, by raising funds, chiefly deposits, and granting credit and loans to firms, households and general government. Clearly, this activity is not devoid of risks or uncertainties, such as those deriving from the economic cycle, financial innovation, inefficient management or growing globalisation and financial interdependence, all of which may affect the stability of the system.
49RepoRt on the financial and banking cRisis in spain, 2008-2014
The regulations governing the Spanish banking sector, without forgetting the accounting regulations, are chiefly based on international banking agreements, deriving from the Basel Capital Accords, and the adaptation of European Union law to those accords through the relevant Directives and Regulations.
The following analysis covers the main elements of the regulatory framework: regulations on solvency requirements; accounting regulations; the sanctions regime and supervisory powers; and, lastly, the specific legal status of savings banks.
A Solvency regulations
Solvency regulation is one of the key elements of regulation of credit institutions. For most of the economic growth years, the regulatory solvency framework was based on the first Capital Accord – Basel I – that was published in 1988 and was the guiding principle for the Community Directives that were transposed into Spanish law.
As indicated in Box 1.2, one of the main elements of Basel I was the introduction of a minimum capital requirement or solvency ratio of 8% that aimed to measure the relationship between an institution’s regulatory capital and the risks assumed in its activity, although as subsequently became evident the sensitivity of the solvency ratio to the risk assumed was quite low.
box 1.2 INTERNATIoNAL CAPITAL STANDARDS: bASEL I
The Basel Committee on Banking Supervision (BCBS) is the leading international authority for the harmonisation of international financial regulation, made up of representatives of the supervisory bodies and central banks of the G20 countries. Its objective is to set uniform international standards in banking regulation and supervision. These international standards are “soft law” and are an essential component of the standards set in the various jurisdictions relating to the regulation of the financial system in the last two decades.
During most of the economic growth years, the regulatory solvency framework was based on
the first Capital Accord, Basel I, which was published in 1988. The cornerstones of Basel I were the introduction of a definition of the components of regulatory capital and the setting of a minimum capital requirement or solvency ratio of 8%. This ratio aimed to measure the relationship between the volume of an institution’s regulatory capital and the risks assumed in its activity. However, the ratio’s sensitivity to risk was low, as it did not sufficiently distinguish such an important factor for measuring capital needs as the credit quality of different lending operations and, therefore, their different probability of default.
50 banco de españa
The European solvency regulations were transposed into Spanish law through Law 13/1985 of 25 May 1985 and its subsequent amendments, including in particular those introduced by Law 13/1992 of 1 June 1992 and its implementing regulations (Royal Decree 1343/1992 of 6 November 1992, Ministerial Order of 30 December 1992 and Circular 5/1993 of 26 March 1993) and Law 19/2003 of 4 July 2003. Basel I standards were thus included in Spanish legislation from the end of 1992.
In particular, banking regulation in force at that time in Spain aimed to ensure that credit institutions’ capital met minimum quality requirements. To that end, a distinction was drawn between Tier 1 and Tier 2 capital, the latter with lower loss-absorbing capacity and, therefore, lower quality. In no circumstances could Tier 2 capital exceed Tier 1 capital. In addition, certain elements of Tier 2 capital could not exceed 50% of Tier 1 capital.
Tier 1 capital included, inter alia, share capital, initial capital, savings banks’ equity units (cuotas participativas), preference shares (participaciones preferentes)13 – provided that certain conditions were met – and reserves. As a further precaution, and in order to ensure optimum capital quality, preference shares could not account for more than 30% of an institution’s Tier 1 capital.14 At that time, bearing in mind these limits, of the solvency ratio of 8% required, Tier 1 capital had to account for at least 2.8%;15 as will be seen in subsequent chapters of this report, this requisite was to increase substantially in following years.
Moreover, the minimum solvency ratio of 8% was essentially intended to cover the credit risk assumed by credit institutions.16 Each institution’s ratio was obtained by dividing its total capital by its risk-weighted assets, the bulk of the latter corresponding to credit risk. Risk-weighted assets were calculated using an approach that provided for little discrimination of credit risk, based on a very simple “standardised” method that classified assets into five pre-determined categories, weighted according to factors established in the legislation that defined the risk associated with those factors.17
The regulations also established other measures, such as: i) limits on risk concentration by borrower (individual borrowers or risk groups),18 although there were no specific limits on sectoral
13 �The voting rights conferred by these shares are not comparable to those conferred by ordinary shares as they allow no say in institutions’ decision-making.
14 This condition was included in Law 13/2003 and subsequently in Rule Eleven of Circular 3/2008.15 �If Tier 2 capital cannot exceed 100% of Tier 1 capital, the latter must account for at least 50% of total capital. If preference
shares may account for up to 30% of Tier 1 capital, then high-quality capital instruments would account for at least 35% of total capital (70% of 50%). The total solvency ratio required is 8%; 35% of that figure is 2.8%.
16 �Although this was not the only risk covered, as foreign exchange risk, trading book risk and commodity price risk were also included.
17 The weighting factors by type of asset were 0%, 10%, 20%, 50% and 100%. 18 �Exposures to a single customer or group of related customers could not exceed 25% of capital (20% in the case of the
institution’s own group). Moreover, large exposures (understood as those that accounted for at least 10% of an institution’s capital) could not exceed 800% of capital.
51RepoRt on the financial and banking cRisis in spain, 2008-2014
box 1.3 bASEL II CAPITAL ACCoRD
In 2004, in order to overcome the weaknesses highlighted in respect of Basel I, the Basel Committee proposed Basel II. The main aim of this new Accord was to enhance and increase the risk sensitivity of banking regulations, making the calculation of risk-weighted assets much more sophisticated, and to strengthen supervision. The regulatory framework was based on three pillars:
i) Pillar 1, relating to minimum capital requirements, which revised the Basel I model. In addition to introducing operational risk requirements (adding operational risk-weighted assets), the main new feature was that it allowed institutions to use internal risk measurement models to calculate weighted assets, based on their own risk estimates. These models had to be validated by the supervisory authorities. The changes sought to recognise the advances made in portfolio management and internal loan classification techniques that, in principle, should provide incentives for banks to improve their risk measurement and their management capacity.
ii) Pillar 2, on supervisory review of the capital needs estimated by institutions following analysis of their risk profile. Pillar 2, which complemented Pillar 1, sought to ensure that institutions had additional safety buffers to cover other risks not envisaged in Pillar 1. Indeed, Pillar 2 was one of the key new features of Basel II. The aim was for institutions to improve their risk management and to have a capital policy closely linked to management. For that purpose institutions were required to conduct an annual internal capital adequacy assessment, which was subsequently reviewed by the supervisory authorities. Pillar 2 gave supervisors a bigger role: they were to act when they considered that an institution was operating with capital levels that were not consistent with its risk profile and they could impose on an institution a capital requirement above the minimum requirement established in Pillar 1.
iii) Pillar 3, which introduced market discipline, required institutions to have formal market reporting policies, including quantitative and qualitative aspects of the activities pursued and the risks those activities entailed.
concentration; ii) the need for appropriate accounting procedures, risk management systems and internal control arrangements according to the size of the institution and the complexity of its business, and for policies clearly defined by its governing bodies; and (iii) the need for an appropriate, transparent organisational structure with well-defined reporting lines.19
In 2004 the Basel Committee published Basel II (see Box 1.3), a revised version of the 1988 Capital Accord, which aimed, inter alia, to enhance and increase risk sensitivity in banking regulations and strengthen supervision.
19 �In 1996, market risk requirements were introduced into Basel I (“Amendment to the Capital Accord to incorporate market risks”, BIS, January 1996).

52 banco de españa
These international Accords were not transposed into European regulations until 2006, through Directives 2006/48/EC and 2006/49/EC. Transposition of the European regulations into the Spanish legal framework began in 2007 with Law 36/2007 of 16 November 2007, amending the above-mentioned Law 13/1985, and Royal Decree 216/2008 of 15 February 2008. The transposition process was completed in 2008, coinciding with the outbreak of the crisis in Spain, with the publication of Banco de España Circular 3/2008 of 22 May 2008 on determination and control of minimum own funds, described in detail in the next chapter.20
B Accounting regulations
In light of their importance, mention should also be made of the accounting regulations. Since 1989 the Banco de España has powers to set the accounting standards to which credit institutions are subject. In 1991 the Banco de España published Circular 4/1991, which was implemented following the principle of prudence when it came to setting the requirements for the recording of credit risk provisions by institutions on their balance sheets.21
In mid-2000, with a view to reducing the cyclical nature of credit risk provisioning, as it was observed that these provisions declined considerably in cyclical upturns and rose sharply in downturns, the Banco de España changed the method of calculation of general provisions, incorporating a countercyclical element, to be described in more detail in the next section.
In 2004, the accounting framework of Spain’s credit institutions had to be adapted to International Accounting Standards (IAS), which had been incorporated into European law by Regulation (EC) No 1606/2002 of the European Parliament and of the Council of 19 July 2002.22 The Banco de España implemented this adaptation through Circular 4/2004, both for consolidated and individual financial statements. Thus, thereafter, the accounting rules applied by Spanish credit institutions had to be consistent with IAS.
However, these new international accounting standards were based on different principles to those that had underpinned the previous Spanish accounting model, which complicated their incorporation into Spanish regulations rather. Under the new accounting regulations, management had broader powers to set accounting policy, compared with the more rigid and deterministic Spanish
20 �In response to the international financial crisis, the Basel II standards were complemented, as discussed below, by Basel III (see Chapter 4 of this report).
21 �The Circular divided credit risk provisions between specific provisions (to be set aside according to a specific calendar in the case of past-due exposures) and general provisions.
22 �The Regulation obliged all institutions publicly traded on an EU regulated market to use IAS to prepare and submit their consolidated financial statements.

53RepoRt on the financial and banking cRisis in spain, 2008-2014
accounting model. The new framework gave institutions more discretion as to how to reflect a true and fair view of their financial situation, at the same time as it made the supervisory function more complex.
Spanish accounting practice adapted to the new international framework, although efforts were made to conserve the prudential criteria that characterised Spanish regulations. Thus, the Banco de España’s traditional approach was maintained, preserving certain stricter elements of Spanish accounting practice, such as aspects relating to the recognition and coverage of non-performing assets.
Two elements in particular should be highlighted: the countercyclical provisions, which were maintained, albeit with certain adjustments; and the strict restrictions on institutions holding special vehicles off balance sheet. As described in the next section, both these elements helped to limit or reduce risk during the financial crisis.
C. Sanctions regime and supervisory powers
The regulatory framework also envisaged the sanctions regime and the supervisory arrangements in the event of breach of the rules. In this respect, Law 26/1988 of 29 July 1988 on the discipline and intervention of credit institutions, in force in that period, is notable.
The supervisory functions carried out by the Banco de España essentially consisted of regular on-site inspections of institutions and continuous off-site monitoring based on analysis of the confidential information furnished by them (with the exception of the two big banking groups, Santander and BBVA, which were subject to continuous on-site monitoring, with teams of inspectors based at the banks’ headquarters). According to the conclusions drawn from the supervisory exercises and the nature of the events detected, under Law 26/1988 the Banco de España had the following powers:
— To make recommendations to institutions and requirements of them, alerting them to the weaknesses detected and requiring that the appropriate corrective measures be taken.
— In the case of institutions with a capital shortfall, to assess and, where appropriate, approve a plan to be submitted by the institution for resuming compliance with the required levels. Limits would also be set on the distribution of profit.
— In addition, in the event of breach of the applicable rules, to file disciplinary proceedings and impose and/or propose sanctions according to the circumstances of each case.23
23 �Law 26/1988 attributed to the Banco de España the power to impose sanctions for serious and minor infringements, and to propose severe sanctions to the Minister for Economic Affairs and Finance. The power to withdraw authorisation lay with the Council of Ministers, at the proposal of the Banco de España.
54 banco de españa
— In exceptionally serious situations,24 to take control of the institution concerned and replace its directors.
In addition to these supervisory aspects, it should be noted that Deposit Guarantee Schemes were in place, regulated by Royal Decree 2606/1996 of 20 December 1996. These schemes, funded by the credit institutions themselves, were established in order to withstand possible banking crises, with a dual role: (i) to cover customers’ deposits in the event of an institution being unable to reimburse its liabilities;25 and (ii) to help restructure debilitated credit institutions.
D. legal status and governance of savings banks
In retrospect, the singularities of the legal status of savings banks were determined, first by their complex and rigid governance structure, which was less flexible than that of listed companies and less conducive to implementing best international practice in terms of corporate governance and to ensuring that the members of their governing bodies had the necessary professional experience. And second, by the structural restrictions on raising high-quality capital by means other than by capitalising profits, which meant, as indicated earlier, that the equity units were the only instrument available. However, as these units did not confer voting rights, they proved unattractive to investors, which limited their development and, therefore, the possibility of their contributing to enhance management of savings banks and market discipline.
The savings banks’ legal status has been the focus of prolific doctrinal debate in which political interests have played no small part. The savings banks undoubtedly had a welfare role, but equally they operated in a highly competitive financial market that required them to seek efficiency and competitiveness. So it seems there may possibly have been a conflict between their welfare role and the search for profit.
The Spanish Constitutional Court judgment 49/1988 of 22 March 1988, in response to various appeals filed alleging that Law 31/1985 on regulation of the basic rules on governing bodies of savings banks was unconstitutional, failed to clarify their legal status. Although the judgment seems to affirm their welfare role, their purpose being not to distribute profit but to devote their excess income to welfare activities, the Constitutional Court also indicates as follows: “Without denying that the legal status of savings banks is similar to that of foundations, or that they may be categorically classed as foundations for the purpose of placing them in a legal construct recognised by Spanish law, the truth is that they are, in any event, foundations of a very special kind, dominated
24 �Giving a reasoned explanation to the Ministry of Economic Affairs and Finance. 25 �In this respect, Royal Decree 1642/2008 of 10 October 2008 raised the coverage limit from €20,000 to €100,000 (which
is still the limit today).

55RepoRt on the financial and banking cRisis in spain, 2008-2014
by their role as credit institutions”. This judgment underlined their atypical nature, as not-for-profit institutions, in contrast with the traditional concept of a firm, although since the entry into force of Royal Decree 2290/1977 of 22 August 1977 they operate on an equal footing with companies (commercial banks).
These aspects justified the presence of public authorities on savings banks’ governing bodies, a presence that was recognised in the specific legislation of the regional governments, which viewed savings banks as an important instrument in their political and economic actions. These political interests ultimately sought to exert control over savings banks, in view of their welfare role.
Against this backdrop, Law 31/1985 established savings banks’ governing bodies: the general assembly (senior decision-making body), the board of directors and the control committee. It also indicated the collective interests that would be represented on the general assembly26 through representatives of local government, depositors, founders, employees and institutions that represent the collective interest in their sphere of operation, all with a complex system of election of those representatives.
Law 44/2002 of 2 November 2002 on financial system reform measures established that public representatives could not hold more than 50% of the votes at the general assembly, so as to prevent savings banks from being considered public institutions under EU law. Nevertheless, savings banks cannot be said to have been managed or run separately from the public authorities in each region. With the benefit of hindsight, this corporate governance structure was not conducive to adoption of the measures needed to address the crisis.
1.4 MEASURES�TAKEN�BY�THE�BANCO�DE�ESPAÑA
As described in Sections 1.1 and 1.2 above, during the economic growth years risks built up for the activity of credit institutions, creating imbalances that had a particularly harsh impact on savings banks. Although financial institutions’ main indicators reflected a healthy position both in terms of risk coverage and solvency, the concentration of risk in the real estate and construction sectors and the growing reliance on wholesale markets flagged the need for caution.
In this setting, the Banco de España, within the scope of its powers, gradually adapted to the international legislation, establishing measures to halt latent risk, or to help cover it should it
26 �The above-mentioned judgment considered the proportional distribution of the various groups that make up the general assembly non-essential, meaning that the regions could establish a different distribution.
56 banco de españa
materialise, such as the countercyclical provisions or the strict restrictions on the creation of special investment vehicles off balance sheet, as described below.
The Pillar 2 guidelines (see Box 1.3) introduced by Basel II, which allowed the supervisor to impose a capital requirement above the minimum requirement established under Pillar 1, according to the annual internal capital adequacy assessment, were incorporated into the Banco de España’s procedures (as indicated in Section 1.3, the European legislation incorporating Basel II was not fully transposed into Spanish regulations until 2008). Reviewing the risk profile of institutions was nothing new for the Banco de España. The new feature was establishing the link between the risk profile of an institution (which includes both quantitative and qualitative elements) and the adequacy of its solvency level. The crisis, which began to be felt in Spain in 2008, complicated the implementation of the new approach as this tool, which allows the supervisor to impose levels of capital above the minimum requirement or to limit certain activities, is a supervisory tool for crisis prevention rather than crisis management.
Aware of the difficulties involved in achieving effective and quality implementation of the advanced approaches permitted under the new Basel II framework, in 2004 the Banco de España resolved to design a “roadmap” over three years, identifying the institutions that could use advanced approaches from January 2008 and the process to be followed.27 During that period it spent much time and effort validating institutions’ internal models that determine the capital requirements needed to cover Pillar 1 risks. The validation processes were continuous and repetitive, consisting of on-site supervisory measures at institutions and work performed at the Banco de España itself.
Regarding the Banco de España’s supervisory powers, during the years preceding the financial crisis the legislative framework was essentially microprudential in approach, concentrated on ensuring that individual financial institutions were solvent and sound. There were no regulatory elements in place at the time that could ensure a correct link between macroprudential and microprudential supervision,28 as various international organisations subsequently highlighted in response to the international financial crisis of 2007. The low level of implementation at an international level of systems for early detection of systemic financial risk and of macroprudential policy tools – which began to be developed as a consequence of the crisis – limited the possibility of earlier measures being taken to ward off the crisis on both a national and a global scale.
27 �In order to convey to the sector the supervisor’s expectations, criteria and demands as to the validation of approaches, in 2006 the Banco de España published a document entitled “Implementation and Validation of Basel II Advanced Approaches in Spain”, http://www.bde.es/f/webbde/COM/supervision/politica/Documento_Supervision_Web_ingles_completo.pdf.
28 �See the report of the Internal Committee of the Banco de España, published in October 2012, entitled “Analysis of the supervisory procedures of the Banco de España and recommendations for their reform”, http://www.bde.es/f/webbde/GAP/Secciones/SalaPrensa/ComunicadosBCE/DecisionesPoliticaMonetaria/13/Arc/Fic/Informe_de_la_Comision_Interna_en.pdf.
57RepoRt on the financial and banking cRisis in spain, 2008-2014
A. Introduction of countercyclical provisions
As mentioned earlier, in mid-2000 the Banco de España introduced new countercyclical provisioning requirements, known as “dynamic” provisions internationally and as “statistical” provisions in Spain.29
How these countercyclical provisions worked was relatively straightforward. Institutions had to cover at all times the expected loss through the cycle on the loan portfolio. This entailed additional provisioning (against the income statement) during upturns, when NPLs and, more generally, non-performing assets were very low, and release of those provisions, credited to the income statement, when the economic cycle contracted and NPLs started to emerge.
The following main objectives motivated the Banco de España to introduce the countercyclical provisions:
First, the desire to counter a development that had been observed for some years in Spain. The existing credit risk provisions behaved very procyclically, that is, they were very low for long periods, when the economic boom kept NPLs at very low levels, and they rose sharply when the economic cycle changed direction, with the consequent impact on NPLs and institutions’ income statements. Indeed, the provisions built up by Spanish banks in 1999 were the lowest and also the most procyclical of all the OECD countries. Provisions in Spain were so highly sensitive to the economic cycle because specific provisions were only set aside when loans became non-performing, meaning that they increased in parallel with, but not ahead of, the growth in NPL portfolios.
Second, there was also a concern for the possible future development of the credit cycle. In 1998 and 1999 credit was already escalating, growing at double-digit real rates, largely as a consequence of the fall in real interest rates. This concern was fuelled by the still recent experience of the previous credit cycle, when credit expanded very significantly, linked in part to the real estate sector, credit standards eased and NPLs rose substantially with the onset of the recession.
The countercyclical provisions were an innovation in the Spanish and international accounting and regulatory world. In general, they were not well received by international or other jurisdictions’ accounting regulators, as they surpassed the concept of incurred losses. Spanish credit institutions were also opposed to them, as they feared their book profit would decline (see Box 1.4).
29 �For a detailed analysis of these provisions, see J. Saurina and C. Trucharte (2017), The Countercyclical Provisions of the Banco de España, 2000-2016 (Ed. Banco de España).

58 banco de españa
box 1.4 MAIN ELEMENTS oF CoUNTERCYCLICAL PRoVISIoNS
Until countercyclical elements were included, Spanish provisions covered specific and general losses (very close to the idea of incurred losses). Specific provisions covered materialised incurred losses (when a default event had occurred) while general provisions covered an estimate of incurred losses not yet materialised in the form of a default event, according to a breakdown of the portfolio by risk level at each point in time (thus excluding past-due exposures).
Incurred losses not yet materialised represent loan portfolio impairment arising from loss events that have occurred, that have not yet given rise to default on a loan but that, with a non-zero probability, will result in lower future cash flows from those loans than were initially envisaged. For example, the fact that a firm records significant losses in a year is clearly an indication as to its future ability to repay its debts; that is, the loss event recognised will affect repayment of its debt, even though at the date of recognition of the losses there has been no default.
The inclusion of the countercyclical element in the concept and calculation of the provisions clearly introduced coverage of expected loss. Expected loss is a statistical concept: it is the average (mathematical expectation) of losses due to default that are expected (based on experience) to appear (materialise) over a set future period.
The countercyclical provisions incorporated various elements. The volume of provisions required was determined not only by the volume of the loan portfolios at a set date, but also by how they evolved in the period analysed. If lending had grown, the calculation would result in higher general provisions (new provisioning requirements), subject to the ceiling on the stock of those provisions. The theoretical new general provisioning requirement was reduced by the amount of specific provisions (coverage of exposures reported as non-performing) set aside in the period. The parameters used for these calculations had been drawn from the experience of the crisis of the 1990s.
At times of economic expansion and lending growth, when new specific provisioning requirements were very low owing to the low level of defaulting borrowers, the calculation method gave rise to higher countercyclical provisions.
At times of crisis, with low lending growth and rising default on loans, general provisions were released, offsetting the higher specific provisioning required.1
The incorporation into the Spanish legislative framework of IAS, by application of the European Union Regulation, was a significant change, especially for a country such as Spain where the banking supervisor had standard-setting powers for the supervised banks, subject to prior approval by the Spanish Accounting and Audit Institute (ICAC).
As described in the previous section, IAS put the emphasis on financial reporting being useful for investors, whereas under the former Spanish accounting regulations (the previous Accounting Circular)
1 �For a more detailed description see Box III.1, “The new general provision as a macroprudential instrument”, Financial Stability Report, May 2005, Banco de España, pp. 73-74.
58 BANCo DE ESPAñA
59RepoRt on the financial and banking cRisis in spain, 2008-2014
the emphasis was on protecting funds entrusted to institutions and, especially, retail customer deposits. Accordingly, European regulations amended the principle of prudent valuation that had hitherto been the guiding principle of accounting regulations for banks in Spain.
Nevertheless, the Banco de España decided not to abandon the countercyclical provisions, keeping them in force, as to do otherwise may have added further momentum to the cyclical upturn, but the provisioning regulations had to be adapted to comply with IAS. The new system maintained the general provisioning component, but it was transformed so as to allow for countercyclical behaviour.
Spanish banks built up countercyclical provisions up to the end of 2007, when the stock peaked at around €26 billion. This occurred before NPLs began to increase and when credit to the private sector, although decelerating, was still growing at a very substantial year-on-year rate. Until then countercyclical provisioning had always been positive, with the provisions set aside charged to the income statement, and the stock of provisions had increased continuously, with the sole exception of a slight dip in early 2005 when IAS came into force, given the adjustments that had to be made, as explained above. These provisions amounted to between 15% and 20% of banks’ net operating income, representing a reduction on the same scale in book profit. The loan loss provisions set aside strengthened institutions’ solvency. Had such provisions not been made, institutions’ book profit would have been higher in an amount equal to the provisions. Bearing in mind that book profit is a determinant in the decision to pay dividends, had the provisions not been set aside, institutions would have paid out higher dividends and, therefore, retained earnings levels would have been lower.
As described in the next chapter, after mid-2008 the flow of countercyclical provisions began to turn negative, owing to the substantial increase in NPLs and, in consequence, in specific provisioning requirements. This negative flow of countercyclical provisions began to act as a significant drain on the stock built up since mid-2000 when these provisions were first introduced, countering to some extent the increase in specific provisions and, therefore, moderating their impact on institutions’ profit levels and capital.
It is important to note that the countercyclical provisions were calibrated on the basis of the credit cycle that preceded Spain’s entry into the euro area, which included the 1993 recession that was considerably less acute than the double-dip recession that commenced in 2008. They were not calibrated for upward or downward shocks of the magnitude of the crisis that was to unfold, which meant that, in many cases, the stock of provisions built up was not sufficient to offset the provisioning requirements that arose from 2008.
That said, and as indicated above, the countercyclical provisions built up in the Spanish banking system overall amounted to almost €26 billion.30 Accordingly, countercyclical provisions helped some
30 �These provisions were eligible as Tier 2 capital in the part not exceeding 1.25% of the weighted risks used as a basis for the calculation of coverage.
60 banco de españa
banks to reinforce their robustness and, in the case of the bailed-out banks, the €7 billion that had been built up in countercyclical provisions reduced the subsequent injections of funds needed. Taking into account the extremely adverse conditions that Spanish institutions faced during the crisis, the conclusion drawn is that the countercyclical provisions, designed and established by the Banco de España alone among the BCBS member supervisors, at a time when there were no countercyclical instruments in place at an international level, played a positive, albeit limited, role in helping the Spanish banking sector better withstand the initial effects of the crisis.
B. treatment of special investment vehicles
Unlike other jurisdictions with major international banking systems, Spain adopted a very strict interpretation of the criteria that allowed credit institutions not to include special investment vehicles (SIVs)31 in their scope of consolidation.32 The application of these stricter criteria prevented such vehicles from being excluded from the consolidable group. In consequence, these vehicles were taken into account for the purposes of calculating the necessary own funds and capital requirements.
The creation of such special purpose vehicles off balance sheet contributed, in other countries, to the development of operations involving the transformation and securitisation of subprime loans, which were at the source of the collapse of Lehman Brothers and of the international propagation of the crisis. Low-quality mortgage loans were bundled up and transformed into bonds, which were in turn unbundled and repackaged, so that it became very difficult to assess the risk of the end instruments, despite the excellent credit ratings assigned by the credit rating agencies. These bonds were acquired by numerous US and European banks. Long-term investments were funded by issuing very short-term securities targeted at money market funds. This is the originate-to-distribute model. The collapse in house prices in the United States and the consequent increase in subprime delinquencies marked the start of the international financial crisis.
C. other supervisory measures
Without prejudice to the lack of regulatory provision for macroprudential tools mentioned earlier, in the period leading up to the crisis, and in light of the latent risks observed in Spanish
31 �IAS, including the interpretations, listed the factors that had to be taken into account in order to consider whether or not a credit institution exerted control over special purpose vehicles (which include SIVs). The Banco de España, through Circular 4/2004, promoted strict implementation of the IAS framework in this respect, establishing that if analysis of the determining factors produced no clear and irrefutable conclusion as to the loss of control over a special purpose vehicle, the latter must be included in the consolidated statements. Supervisory measures designed to ensure that the consolidation criteria relating to these vehicles were being correctly applied complemented these regulations.
32 �The scope of consolidation sets out the companies to be included (consolidated) for presentation of overall information on the economic and financial situation of an institution or group for the purposes of setting the capital requirements.
61RepoRt on the financial and banking cRisis in spain, 2008-2014
lending activity, the Banco de España conveyed to institutions, in the framework of its inspection activity, a series of recommendations and reflections on the main risks observed, notably:
— In respect of real estate financing, it pointed out: i) the importance of observing the 80%33 loan-to-value limit in retail mortgages; (ii) the uncertainty created by lengthening maturities in floating rate loans; and (iii) its concern regarding the volume of real estate developer financing, especially where borrowers had not contributed funds proportional to the scale of the project and the loan repayment expectations rested on a hypothetical price increase.34
— Regarding financing of the high mortgage loan growth rates (see Table 1.1), it noted that the need for greater recourse to the markets demanded appropriate risk management, establishing a diversification policy and setting maximum limits on wholesale market funding and concentration of maturities. It also insisted on the need to improve liquidity contingency plans.35
— Lastly, as to governance of savings banks, it indicated that the correct functioning of the different governing bodies and delegated committees was essential and that the control function must be fulfilled.
One may question whether more vigorous steps could have been taken, promoting the legal amendments needed to limit risk concentration by sector, leverage levels or maximum loan-to-value (LTV) ratios.36 However, as indicated above, the international regulations of the time did not provide for the use of such macroprudential tools. Moreover, institutions’ solvency and provisioning levels, together with market developments and economic forecasts, supported the view that, in general, the instruments available and the existing legal provisions would allow institutions to withstand gradual balance sheet correction.
33 �The capital regulations (Circular 5/1993 of 26 March 1993) established a higher weighting, for the purposes of calculation of risk-weighted assets, for retail mortgage loans with an LTV over 80%.
34 �In respect of the growing concentration of risk in the real estate sector, it should be noted that the capital regulations of the day provided for the imposition of limits on risks assumed by credit institutions with individual borrowers or economic groups, but there were no limits on sectoral concentration. Such limits were subsequently deemed an element to be taken into consideration in Pillar 2 (Basel III) for the purpose of setting additional capital requirements.
35 �The existing regulations provided for no limit on leverage. Today, Regulation 575/2013 (the CRR) sets out how the leverage ratio should be calculated and the information to be furnished, although there is still no defined limit (the BIS considers the minimum should be 3%) and, logically, no date for compliance with such a limit. However, as in the case of concentration and the LTV ratio, high leverage risk may be assessed when setting additional capital requirements under Pillar 2 (Basel III).
36 �This could have been done, even though there was no legal authorisation to introduce such a limit.
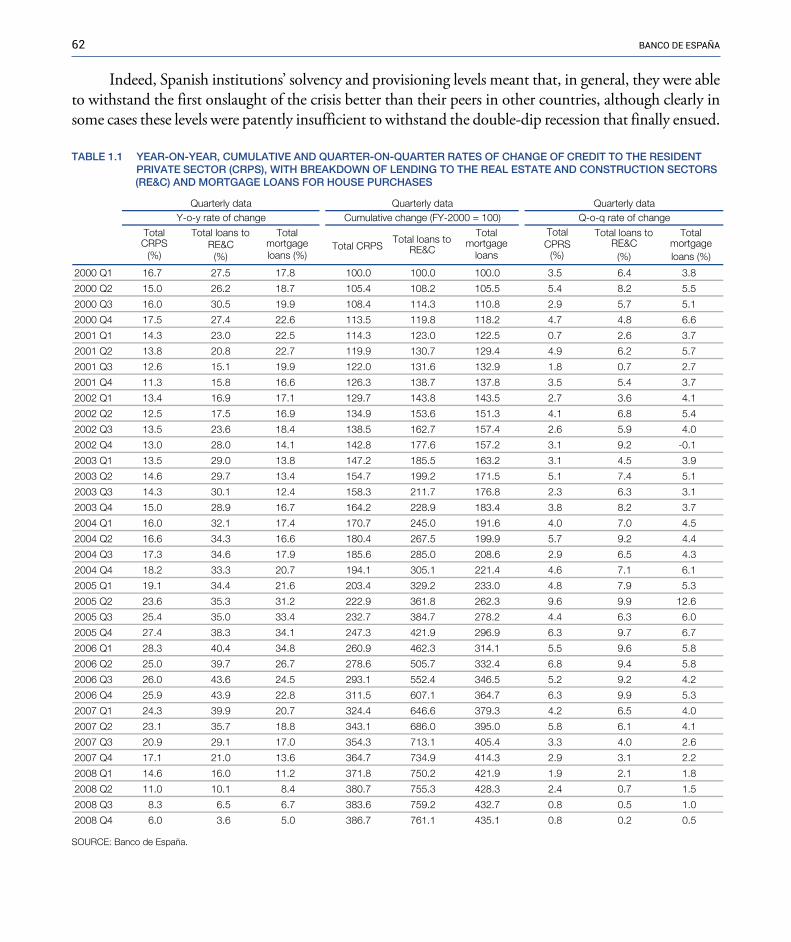
62 banco de españa
Indeed, Spanish institutions’ solvency and provisioning levels meant that, in general, they were able to withstand the first onslaught of the crisis better than their peers in other countries, although clearly in some cases these levels were patently insufficient to withstand the double-dip recession that finally ensued.
TotalCRPS
(%)
Total loans to RE&C
(%)
Totalmortgageloans (%)
Total CRPSTotal loans to
RE&C
Totalmortgage
loans
TotalCPRS
(%)
Total loans to RE&C
(%)
Totalmortgageloans (%)
2000 Q1 16.7 27.5 17.8 100.0 100.0 100.0 3.5 6.4 3.8
2000 Q2 15.0 26.2 18.7 105.4 108.2 105.5 5.4 8.2 5.5
2000 Q3 16.0 30.5 19.9 108.4 114.3 110.8 2.9 5.7 5.1
2000 Q4 17.5 27.4 22.6 113.5 119.8 118.2 4.7 4.8 6.6
2001 Q1 14.3 23.0 22.5 114.3 123.0 122.5 0.7 2.6 3.7
2001 Q2 13.8 20.8 22.7 119.9 130.7 129.4 4.9 6.2 5.7
2001 Q3 12.6 15.1 19.9 122.0 131.6 132.9 1.8 0.7 2.7
2001 Q4 11.3 15.8 16.6 126.3 138.7 137.8 3.5 5.4 3.7
2002 Q1 13.4 16.9 17.1 129.7 143.8 143.5 2.7 3.6 4.1
2002 Q2 12.5 17.5 16.9 134.9 153.6 151.3 4.1 6.8 5.4
2002 Q3 13.5 23.6 18.4 138.5 162.7 157.4 2.6 5.9 4.0
2002 Q4 13.0 28.0 14.1 142.8 177.6 157.2 3.1 9.2 -0.1
2003 Q1 13.5 29.0 13.8 147.2 185.5 163.2 3.1 4.5 3.9
2003 Q2 14.6 29.7 13.4 154.7 199.2 171.5 5.1 7.4 5.1
2003 Q3 14.3 30.1 12.4 158.3 211.7 176.8 2.3 6.3 3.1
2003 Q4 15.0 28.9 16.7 164.2 228.9 183.4 3.8 8.2 3.7
2004 Q1 16.0 32.1 17.4 170.7 245.0 191.6 4.0 7.0 4.5
2004 Q2 16.6 34.3 16.6 180.4 267.5 199.9 5.7 9.2 4.4
2004 Q3 17.3 34.6 17.9 185.6 285.0 208.6 2.9 6.5 4.3
2004 Q4 18.2 33.3 20.7 194.1 305.1 221.4 4.6 7.1 6.1
2005 Q1 19.1 34.4 21.6 203.4 329.2 233.0 4.8 7.9 5.3
2005 Q2 23.6 35.3 31.2 222.9 361.8 262.3 9.6 9.9 12.6
2005 Q3 25.4 35.0 33.4 232.7 384.7 278.2 4.4 6.3 6.0
2005 Q4 27.4 38.3 34.1 247.3 421.9 296.9 6.3 9.7 6.7
2006 Q1 28.3 40.4 34.8 260.9 462.3 314.1 5.5 9.6 5.8
2006 Q2 25.0 39.7 26.7 278.6 505.7 332.4 6.8 9.4 5.8
2006 Q3 26.0 43.6 24.5 293.1 552.4 346.5 5.2 9.2 4.2
2006 Q4 25.9 43.9 22.8 311.5 607.1 364.7 6.3 9.9 5.3
2007 Q1 24.3 39.9 20.7 324.4 646.6 379.3 4.2 6.5 4.0
2007 Q2 23.1 35.7 18.8 343.1 686.0 395.0 5.8 6.1 4.1
2007 Q3 20.9 29.1 17.0 354.3 713.1 405.4 3.3 4.0 2.6
2007 Q4 17.1 21.0 13.6 364.7 734.9 414.3 2.9 3.1 2.2
2008 Q1 14.6 16.0 11.2 371.8 750.2 421.9 1.9 2.1 1.8
2008 Q2 11.0 10.1 8.4 380.7 755.3 428.3 2.4 0.7 1.5
2008 Q3 8.3 6.5 6.7 383.6 759.2 432.7 0.8 0.5 1.0
2008 Q4 6.0 3.6 5.0 386.7 761.1 435.1 0.8 0.2 0.5
Y-o-y rate of change Cumulative change (FY-2000 = 100) Q-o-q rate of changeatad ylretrauQatad ylretrauQatad ylretrauQ
SOURCE: Banco de España.
TABLE 1.1 YEAR-ON-YEAR, CUMULATIVE AND QUARTER-ON-QUARTER RATES OF CHANGE OF CREDIT TO THE RESIDENT PRIVATE SECTOR (CRPS), WITH BREAKDOWN OF LENDING TO THE REAL ESTATE AND CONSTRUCTION SECTORS (RE&C) AND MORTGAGE LOANS FOR HOUSE PURCHASES
2 THE EARLY YEARS OF THE CRISIS (2008-2011)
2.1 MACROECONOMIC�ENVIRONMENT
A. World economy
The financial crisis and the world economy (2008-2009)
The first signs of the global financial crisis began to emerge in mid-2007, starting in a relatively minor segment of the US mortgage market, that of high-risk or sub-prime mortgages.1 Nevertheless, the impact spread rapidly around the world, in a context in which the preceding long period of global economic growth had been accompanied by widespread underestimation of risks, such that prices both of real and financial assets were extremely high, as was private-sector financial and non-financial debt.
In the United States, where there had been a particularly long and intense real estate boom, the slowdown in the sector began in early 2006. Nevertheless, it was not until 2007 that defaults on sub-prime mortgages began to rise sharply. The turnaround in the real estate sector, coupled with expectations that the expansionary phase of the economic cycle was running out of steam, triggered an upward revision of investors’ risk perceptions and a drop in financial asset prices that was initially limited, but gradually gained momentum, reaching an ever greater range and number of products and markets.
The outcome was a sudden paralysis of some of the main financing markets, including the interbank markets, as was reflected by the spikes in risk premia in these markets (see Chart 2.1). This led to a significant tightening of financial conditions for the private sector, first in the United States and then in other –mainly advanced– economies, including the euro area and Spain.
In the case of financial institutions, the closure of wholesale funding markets triggered a process of disorderly deleveraging, with liquidation of assets that, in turn, led to new losses and the effect spreading to other institutions not initially exposed. Hedge funds that had based their high returns
1 �The sub-prime mortgage segment accounted for 13% of total US mortgage lending at the time. The mortgage loans in question were extended to borrowers with low credit ratings. During the upward cycle they were often granted with conditions that increased the risk (initial interest rates below market rates and amounts that were high relative to borrowers’ incomes).

64 banco de españa
on leveraged investments also had to make significant divestments. The situation deteriorated over the course of 2008 as the tension on international financial markets heightened and an ever larger number of institutions were affected, with a number having to be bailed out (among others, Bear Stearns, Fannie Mae and Freddy Mac in the United States and Northern Rock in the United Kingdom).
The collapse of the investment bank Lehman Brothers in September 2008, followed by the nationalisation by the US Government of American International Group (AIG), the world’s largest insurer, prompted a quantum leap in investors’ fears. It brought the US financial system to the verge of collapse, triggering a sudden rise in risk premia on world markets, a sharp fall in stock market prices and a strong upsurge in volatility. Thus, for example, in the days following the fall of Lehman
0.0
0.5
1.0
1.5
2.0
2.5
3.0
3.5
2007 2008 2009 2010 2011
UNITED STATES EURO AREA UNITED KINGDOM
1 INTEREST RATE SPREAD BETWEEN USA, EURO AREA AND UNITED KINGDOMInterbank - 3 month OIS
%
CHART 2.1 TENSIONS IN INTERNATIONAL FINANCIAL MARKETS (a)
0
5
10
15
20
25
30
2007 2008 2009 2010 2011
EURO AREA FINANCIAL CORPS. EURO AREA NON-FINANCIAL CORPS.
US FINANCIAL CORPORATIONS US NON-FINANCIAL CORPORATIONS (b)
%
2 SPREAD BETWEEN BBB DEBT - 5-YEAR GOVERNMENT DEBT
0
20
40
60
80
100
120
2007 2008 2009 2010 2011
S&P 500 DJ EURO STOXX 300 NIKKEI 225
3 STOCK MARKET INDICES
Base 100 = 31.12.2006
0
10
20
30
40
50
60
70
80
90
2007 2008 2009 2010 2011
S&P 500 DJ EURO STOXX 50 NIKKEI 225
%
4 IMPLICIT VOLATILITY
SOURCES: Datastream, Merrill Lynch and Banco de España.
a Monthly averages of daily data.b Calculated from the unweighted average of the Merrill Lynch industrial, utilities and telecommunications sector bond indices.
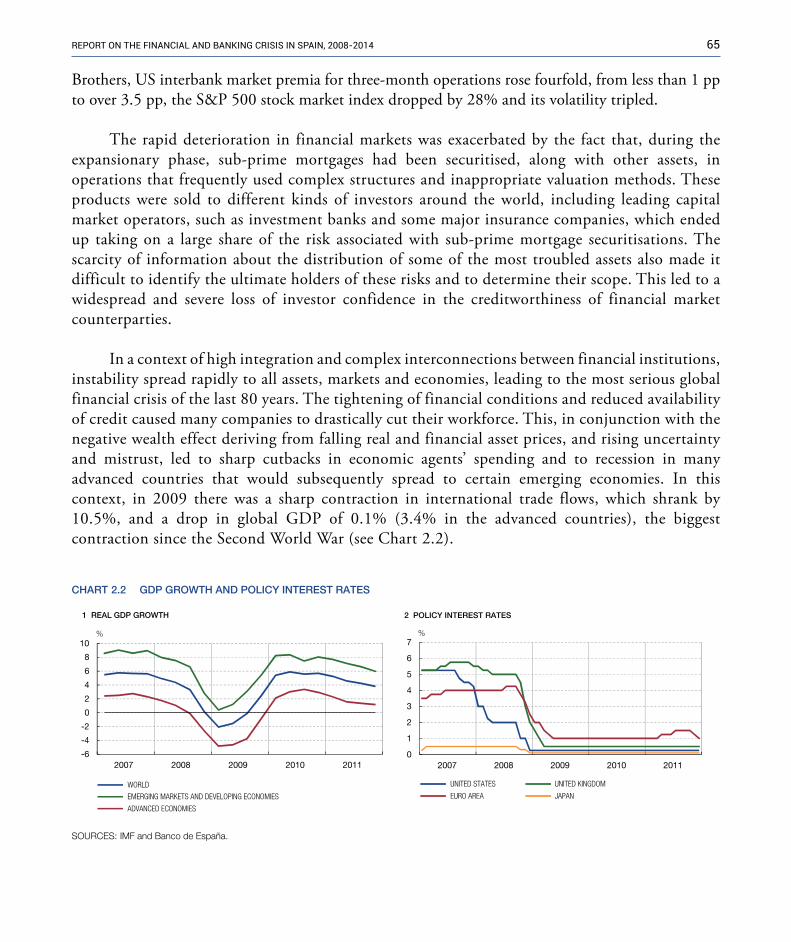
65RepoRt on the financial and banking cRisis in spain, 2008-2014
Brothers, US interbank market premia for three-month operations rose fourfold, from less than 1 pp to over 3.5 pp, the S&P 500 stock market index dropped by 28% and its volatility tripled.
The rapid deterioration in financial markets was exacerbated by the fact that, during the expansionary phase, sub-prime mortgages had been securitised, along with other assets, in operations that frequently used complex structures and inappropriate valuation methods. These products were sold to different kinds of investors around the world, including leading capital market operators, such as investment banks and some major insurance companies, which ended up taking on a large share of the risk associated with sub-prime mortgage securitisations. The scarcity of information about the distribution of some of the most troubled assets also made it difficult to identify the ultimate holders of these risks and to determine their scope. This led to a widespread and severe loss of investor confidence in the creditworthiness of financial market counterparties.
In a context of high integration and complex interconnections between financial institutions, instability spread rapidly to all assets, markets and economies, leading to the most serious global financial crisis of the last 80 years. The tightening of financial conditions and reduced availability of credit caused many companies to drastically cut their workforce. This, in conjunction with the negative wealth effect deriving from falling real and financial asset prices, and rising uncertainty and mistrust, led to sharp cutbacks in economic agents’ spending and to recession in many advanced countries that would subsequently spread to certain emerging economies. In this context, in 2009 there was a sharp contraction in international trade flows, which shrank by 10.5%, and a drop in global GDP of 0.1% (3.4% in the advanced countries), the biggest contraction since the Second World War (see Chart 2.2).
CHART 2.2 GDP GROWTH AND POLICY INTEREST RATES
SOURCES: IMF and Banco de España.
-6
-4
-2
0
2
4
6
8
10
2007 2008 2009 2010 2011
WORLD
ADVANCED ECONOMIES
%
1 REAL GDP GROWTH
0
1
2
3
4
5
6
7
2007 2008 2009 2010 2011
UNITED STATES UNITED KINGDOM
EURO AREA JAPAN
%
2 POLICY INTEREST RATES
EMERGING MARKETS AND DEVELOPING ECONOMIES
66 banco de españa
From 2007 on, the major international monetary authorities responded to these tensions by increasing liquidity supply and in some instances acting in concert. For example, following the initial turbulence in August 2007, a currency swap facility was set up between the main central banks in order to make it easier for financial institutions to obtain foreign currency. From 2008, the measures destined to alleviate the effects of the financial crisis extended along three main fronts: additional monetary policy measures, support for the financial sectors affected and fiscal policy.
— First, on the monetary front, from September 2008 the central banks in the leading advanced and emerging economies made sharp cuts in interest rates and embarked on unprecedented concerted actions. In parallel, measures were introduced to make the framework for providing liquidity to financial institutions more flexible, increasing the number of institutions with access to central bank funding, broadening the range of assets eligible as collateral for monetary policy operations and extending the maturity of the liquidity provided to the market. Some central banks also began to use non-standard tools.
In the case of the euro area, the ECB, which just three months earlier, in July 2008, had again raised the main refinancing rate in the face of concerns about inflationary pressures driven by rising energy prices, reversed its policy in October with a 50 bp cut to the reference rate, bringing it down to 3.75%. This was followed by further cuts that left it at 1% in May 2009. The Eurosystem continued to meet all funding demands through open market operations, extended the validity of the broadened list of eligible collateral, introduced new operations with 12-month maturities and set up a covered bond purchase programme, a category which includes Spanish mortgage covered bonds (cédulas hipotecarias).
— Second, Governments adopted various measures supporting the banking industry to facilitate its funding and recapitalisation. These measures included expanding deposit guarantee schemes, offering State guarantees for bank debt issues and providing public funding in the form of loans and purchases of high quality assets. In many countries the deterioration in banks’ solvency was addressed by injecting public capital (to the extent that some institutions were even nationalised) and, in some cases, by buying impaired assets or introducing asset protection schemes for financial institutions. In this context, a number of systemically important institutions were bailed out, particularly in the United States and Europe. All told, up to 2010 this entailed the disbursement of $1.5 trillion in the main advanced economies (see Section 3.3.C). Additionally, with the backing of the G20, work also began on reforming the global financial system.
— Third, Governments adopted discretionary economic stimulus policies that included tax cuts or measures to increase public spending, together with assistance for the groups and sectors hardest hit by the crisis. Given the usual lag between the design and implementation
67RepoRt on the financial and banking cRisis in spain, 2008-2014
of discretionary fiscal measures, their main impact began to be felt from 2009 onwards. Specifically, it was estimated that, on average for the G20 countries, they involved the mobilisation of resources amounting to around 2% of GDP in each year of the period from 2009 to 2010. In Europe’s case, the European Economic Recovery Plan channelled fiscal stimulus of around 1.5% of EU GDP over this same period. These programmes were dominated by measures on the expenditure side, specifically transfers and public investment.
As a result of these measures, global GDP began a gradual recovery in 2009, with a return to positive growth rates in the second half of the year. In 2010, the recovery was stronger, with growth of 5.4% in real terms. Financial markets also stabilised, volatility and risk aversion dropped significantly from the peaks they reached at the end of 2008, asset prices recovered and some segments of the capital markets gradually began to reopen.
However, the recovery was not evenly distributed across geographical areas: it was more robust in the emerging economies (with real GDP growth of around 7% in 2010), particularly in Asia, and weaker in the advanced economies. Among the latter, the recovery in the United States (2.5%) and Japan (4.2%) was more robust than in the euro area (2.0%) or the United Kingdom (1.9%). Within the euro area there were also significant differences between countries, with strong GDP growth in Germany (3.9%) and Finland (3%), a degree of stagnation in Spain (0%) and Ireland (0.4%), and a significant contraction in Greece (-5.5%). This marked dispersion in the rate of progress within the single-currency area was largely due to the outbreak of the euro area crisis.
The euro area crisis (2010-2011)
In Europe the process of normalisation was upset in the early months of 2010 by the emergence of the first episodes of the euro area sovereign debt crisis. The origins of the crisis, which was triggered by the loss of confidence in Greece’s public finances figures in late 2009, lie in the fact that serious macroeconomic and financial imbalances had built up in certain Member States during the economic expansion. These concerned public finances, private sector and real estate sector indebtedness, exposure of the financial system to both sectors and loss of competitiveness. Moreover, the euro area’s existing institutional framework proved to be insufficiently developed and lacking the necessary flexibility to address these problems in advance. It was able neither to prevent problems arising nor to establish clear and transparent rules of conduct in the face of possible crises. This situation exacerbated the subsequent tensions and allowed their effects to spread to certain member countries whose fundamentals had not significantly diverged from patterns of stability.
The tensions initially arose as a result of the Greek fiscal crisis, which first spread to the sovereign debt of countries perceived to be more vulnerable, fiscally or financially, or to have a worse economic
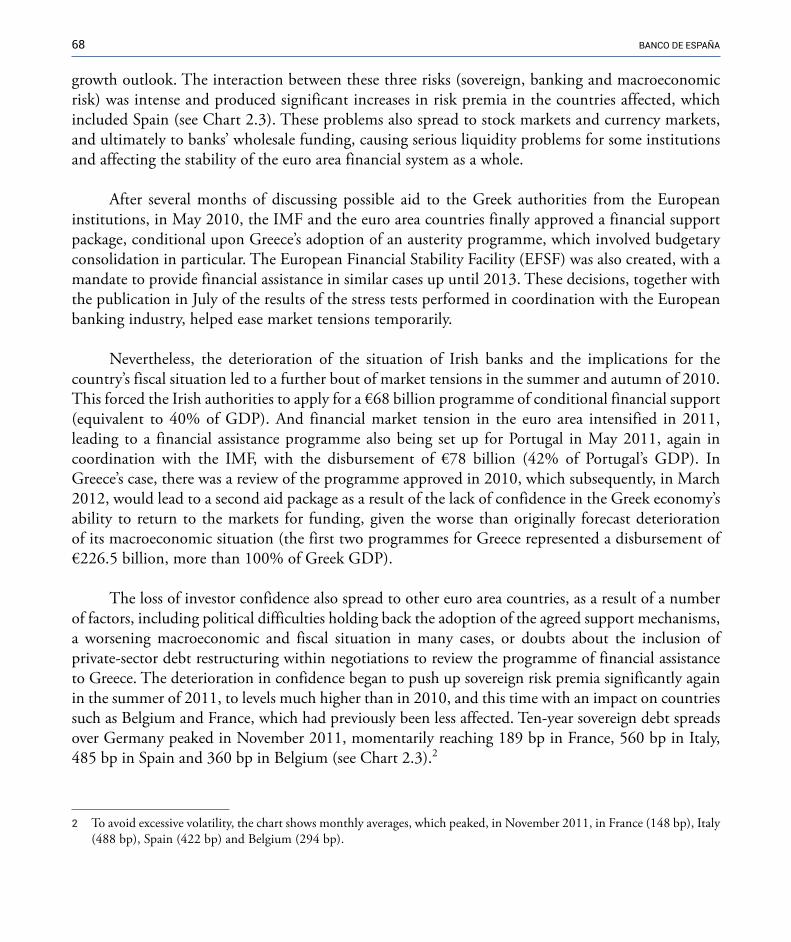
68 banco de españa
growth outlook. The interaction between these three risks (sovereign, banking and macroeconomic risk) was intense and produced significant increases in risk premia in the countries affected, which included Spain (see Chart 2.3). These problems also spread to stock markets and currency markets, and ultimately to banks’ wholesale funding, causing serious liquidity problems for some institutions and affecting the stability of the euro area financial system as a whole.
After several months of discussing possible aid to the Greek authorities from the European institutions, in May 2010, the IMF and the euro area countries finally approved a financial support package, conditional upon Greece’s adoption of an austerity programme, which involved budgetary consolidation in particular. The European Financial Stability Facility (EFSF) was also created, with a mandate to provide financial assistance in similar cases up until 2013. These decisions, together with the publication in July of the results of the stress tests performed in coordination with the European banking industry, helped ease market tensions temporarily.
Nevertheless, the deterioration of the situation of Irish banks and the implications for the country’s fiscal situation led to a further bout of market tensions in the summer and autumn of 2010. This forced the Irish authorities to apply for a €68 billion programme of conditional financial support (equivalent to 40% of GDP). And financial market tension in the euro area intensified in 2011, leading to a financial assistance programme also being set up for Portugal in May 2011, again in coordination with the IMF, with the disbursement of €78 billion (42% of Portugal’s GDP). In Greece’s case, there was a review of the programme approved in 2010, which subsequently, in March 2012, would lead to a second aid package as a result of the lack of confidence in the Greek economy’s ability to return to the markets for funding, given the worse than originally forecast deterioration of its macroeconomic situation (the first two programmes for Greece represented a disbursement of €226.5 billion, more than 100% of Greek GDP).
The loss of investor confidence also spread to other euro area countries, as a result of a number of factors, including political difficulties holding back the adoption of the agreed support mechanisms, a worsening macroeconomic and fiscal situation in many cases, or doubts about the inclusion of private-sector debt restructuring within negotiations to review the programme of financial assistance to Greece. The deterioration in confidence began to push up sovereign risk premia significantly again in the summer of 2011, to levels much higher than in 2010, and this time with an impact on countries such as Belgium and France, which had previously been less affected. Ten-year sovereign debt spreads over Germany peaked in November 2011, momentarily reaching 189 bp in France, 560 bp in Italy, 485 bp in Spain and 360 bp in Belgium (see Chart 2.3).2
2 ��To avoid excessive volatility, the chart shows monthly averages, which peaked, in November 2011, in France (148 bp), Italy (488 bp), Spain (422 bp) and Belgium (294 bp).
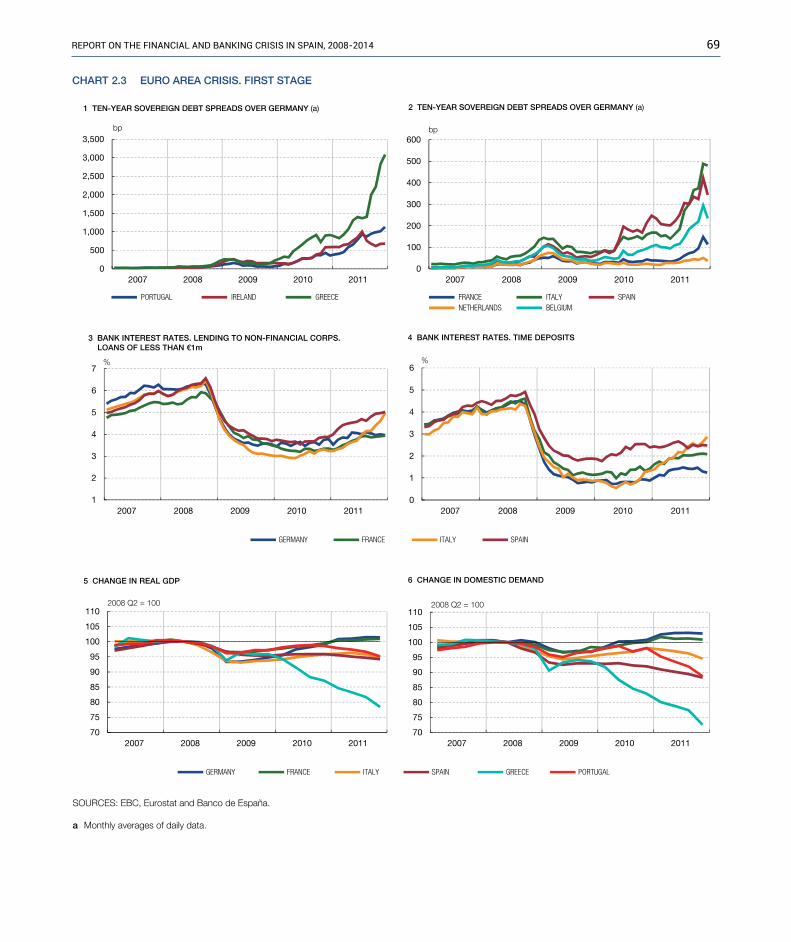
69RepoRt on the financial and banking cRisis in spain, 2008-2014
1
2
3
4
5
6
7
2007 2008 2009 2010 2011
3 BANK INTEREST RATES. LENDING TO NON-FINANCIAL CORPS. LOANS OF LESS THAN €1m
%
CHART 2.3 EURO AREA CRISIS. FIRST STAGE
0
1
2
3
4
5
6
2007 2008 2009 2010 2011
%
4 BANK INTEREST RATES. TIME DEPOSITS
70
75
80
85
90
95
100
105
110
2007 2008 2009 2010 2011
5 CHANGE IN REAL GDP
2008 Q2 = 100
70
75
80
85
90
95
100
105
110
2007 2008 2009 2010 2011
2008 Q2 = 100
6 CHANGE IN DOMESTIC DEMAND
0
500
1,000
1,500
2,000
2,500
3,000
3,500
2007 2008 2009 2010 2011
PORTUGAL IRELAND GREECE
1 TEN-YEAR SOVEREIGN DEBT SPREADS OVER GERMANY (a)
bp
0
100
200
300
400
500
600
2007 2008 2009 2010 2011
FRANCE ITALY SPAINNETHERLANDS BELGIUM
bp
2 TEN-YEAR SOVEREIGN DEBT SPREADS OVER GERMANY (a)
GERMANY FRANCE ITALY SPAIN
GERMANY FRANCE ITALY SPAIN GREECE PORTUGAL
SOURCES: EBC, Eurostat and Banco de España.
a Monthly averages of daily data.

70 banco de españa
Given that the banks held substantial portfolios of sovereign debt, the deterioration in sovereign debt issued by the most vulnerable euro area countries exacerbated the funding difficulties faced by euro area banks, with the ensuing risks for financial stability and economic development in the worst affected countries, as could also be seen in the tensions in currency markets, stock markets and interbank markets. It is worth noting that, in the context of this new episode of financial strain, the supervisory authorities for the Belgian, French, Italian and Spanish stock markets, in coordination with the European Securities and Markets Authority (ESMA), agreed to introduce temporary restrictions on short selling of shares in financial institutions, so as to ensure financial stability and the orderly functioning of the capital markets.
Economic policy responses
In this environment, the economic policy stance in 2010 and 2011 varied widely around the world. In the United States, monetary policy adopted new non-conventional stimulus measures based on expanding the balance sheet of the Federal Reserve Board. This involved a new phased programme of $600 billion of securities purchases (quantitative Easing II), bringing the total bought since 2008 to $2.35 trillion, equivalent to 15% of US GDP, while in the fiscal policy area, new budgetary stimulus plans were adopted.
In the euro area, monetary policy moderated its expansionary stance somewhat in the first half of 2011, while fiscal policy had already turned contractionary in 2010 as a result of the difficult sovereign debt market conditions, and there was also a major overhaul of the European institutional architecture:
— Monetary policy. The ECB maintained its accommodative monetary policy stance throughout 2010. In May 2010 the Securities Market Programme was launched, through which government bonds were purchased, primarily in order to keep the monetary policy transmission mechanism operating smoothly (see Chart 2.4).
Relative easing of tensions in the first few months of 2011, coupled with the prospects of economic recovery in the euro area and an upturn in inflation rates to levels close to 3%, in a context of rising energy and food prices, led the ECB to raise its main benchmark interest rate by 25 bp in April and July.
However, in view of the worsening of the sovereign debt crisis in the summer of that year, monetary policy in the euro area changed direction again and further expansionary measures were adopted. These included cuts by the ECB in policy interest rates in November and December (25 bp in each case, returning the rate on main refinancing operations to 1%), new long-term loan auctions (three years) to credit institutions in December 2011 and February 2012, a reduction in the reserve requirement and broadening of the range of assets eligible as collateral for monetary policy operations.
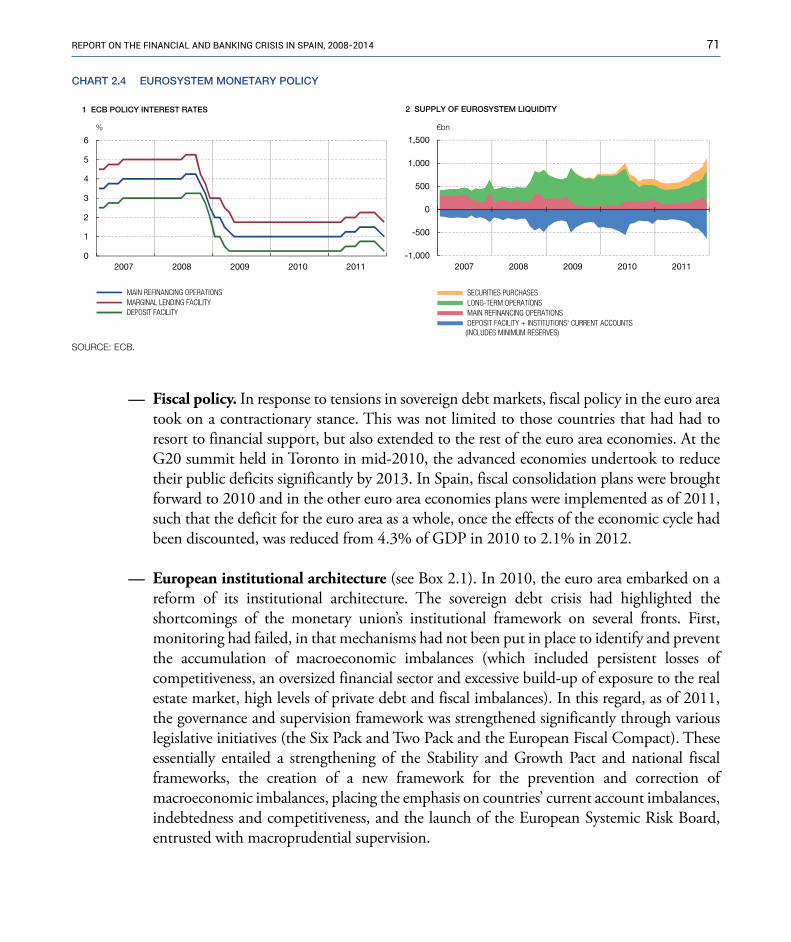
71RepoRt on the financial and banking cRisis in spain, 2008-2014
— Fiscal policy. In response to tensions in sovereign debt markets, fiscal policy in the euro area took on a contractionary stance. This was not limited to those countries that had had to resort to financial support, but also extended to the rest of the euro area economies. At the G20 summit held in Toronto in mid-2010, the advanced economies undertook to reduce their public deficits significantly by 2013. In Spain, fiscal consolidation plans were brought forward to 2010 and in the other euro area economies plans were implemented as of 2011, such that the deficit for the euro area as a whole, once the effects of the economic cycle had been discounted, was reduced from 4.3% of GDP in 2010 to 2.1% in 2012.
— European institutional architecture (see Box 2.1). In 2010, the euro area embarked on a reform of its institutional architecture. The sovereign debt crisis had highlighted the shortcomings of the monetary union’s institutional framework on several fronts. First, monitoring had failed, in that mechanisms had not been put in place to identify and prevent the accumulation of macroeconomic imbalances (which included persistent losses of competitiveness, an oversized financial sector and excessive build-up of exposure to the real estate market, high levels of private debt and fiscal imbalances). In this regard, as of 2011, the governance and supervision framework was strengthened significantly through various legislative initiatives (the Six Pack and Two Pack and the European Fiscal Compact). These essentially entailed a strengthening of the Stability and Growth Pact and national fiscal frameworks, the creation of a new framework for the prevention and correction of macroeconomic imbalances, placing the emphasis on countries’ current account imbalances, indebtedness and competitiveness, and the launch of the European Systemic Risk Board, entrusted with macroprudential supervision.
CHART 2.4 EUROSYSTEM MONETARY POLICY
SOURCE: ECB.
0
1
2
3
4
5
6
2007 2008 2009 2010 2011
MAIN REFINANCING OPERATIONS MARGINAL LENDING FACILITY DEPOSIT FACILITY
1 ECB POLICY INTEREST RATES
%
-1,000
-500
0
500
1,000
1,500
2007 2008 2009 2010 2011
SECURITIES PURCHASES LONG-TERM OPERATIONS MAIN REFINANCING OPERATIONS DEPOSIT FACILITY + INSTITUTIONS' CURRENT ACCOUNTS (INCLUDES MINIMUM RESERVES)
€bn
2 SUPPLY OF EUROSYSTEM LIQUIDITY
72 banco de españa
box 2.1 kEY DEVELoPMENTS IN ThE REFoRM oF EURoPEAN ECoNoMIC goVERNANCE
1 Strengthening of fiscal and macroeconomic supervision (Six-Pack, Two-Pack and Fiscal Compact)
Strengthening of the Stability and Growth Pact: limits were introduced on expenditure growth in the Pact'spreventive arm, a debt reduction rule in the corrective arm and sanctions that are broader and applicableduring earlier phases of the procedure.
Creation of the macroeconomic imbalance procedure. A series of indicators (the alert mechanism) are used to determine which countries have (or are at risk of having) excessive imbalances and recommendations are issued following an "in-depth review". Sanctions may be imposed if these recommendations are not followed.
The Treaty on Stability, Coordination and Governance in the Economic and Monetary Union (TSCG) requiresMember States (except the Czech Republic and the United Kingdom) to commit themselves to a balancedbudget over the course of the cycle and to introduce an automatic correction mechanism for possible deviations.
European Commission Regulation giving the European Commission the authority to issue an opinion on thenational budgets of the euro area countries before they are adopted by national parliaments, and requiringMember States to set up independent national councils.
European Commission Regulation that introduces the enhanced supervision procedure for countries that have requested financial assistance.
2 Establishment of crisis management mechanisms
BANKING UNION: Entry into force of the Single Resolution Mechanism (SRM) and the Single SupervisoryMechanism (SSM) giving the ECB responsibility for bank supervision. Creation of the Single Resolution Fund.Implementation of various capital market union initiatives.ECONOMIC UNION: Creation of national productivity boards and improvement of the macroeconomic imbalances procedure to facilitate convergence.FISCAL UNION: Creation of the European Fiscal Board.
Progress
Improvements to macroeconomic supervision and crisis management mechanisms (2010-2013)
1 Economic union, to bolster structural convergence and social cohesion.2 Financial union, seeking to build full banking union and implement capital market union.3 Fiscal union, aiming to improve the coordination of public finances and establish fiscal capacity across the euro area.4 Political union to enhance the democratic legitimacy of the European institutions.
The Five Presidents' Report (preceded by the Four Presidents' Report in 2012) proposed four pillars on which a more genuine economic and monetary union should be built:
Six-Pack(December 2011)
Fiscal Compact (January 2013)
Two-Pack (May 2013)
European Financial Stability Facility (EFSF) / European Financial Stabilisation Mechanism (EFSM)
European Stability Mechanism (ESM)
Progress towards a more solid economic and monetary union (Four Presidents' Report, December 2012, and Five Presidents'Report, July 2015)
SOURCE: Banco de España.
The Member States of the euro area created the EFSF in June 2010 to provide financial assistance to euro area countries requiring it (Ireland and Portugal in 2011 and Greece in 2012). This facility was a transitional arrangement with a financial capacity of up to €440 billion, through debt issues backed by State guarantees. The EFSM wasalso created, which is available for all EU countries and is authorised to obtain market funding of up to €60 billionsecured by the EU budget.
In October 2012, euro area Member States signed the ESM Treaty, under which the ESM took over the functions of the EFSF. This is a permanent crisis management institution with its own legal personality, subscribed capital of €700 billion and effective lending capacity of €500 billion. Spain received assistance from the ESM in December 2012, Cyprus in May 2013 and Greece in August 2015.
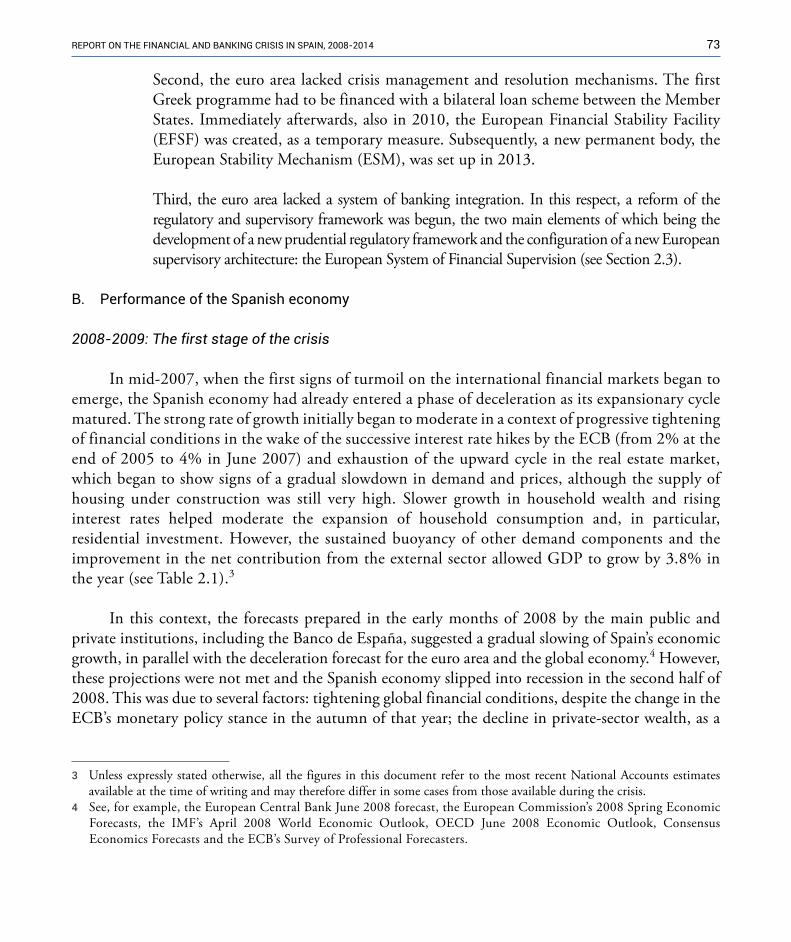
73RepoRt on the financial and banking cRisis in spain, 2008-2014
Second, the euro area lacked crisis management and resolution mechanisms. The first Greek programme had to be financed with a bilateral loan scheme between the Member States. Immediately afterwards, also in 2010, the European Financial Stability Facility (EFSF) was created, as a temporary measure. Subsequently, a new permanent body, the European Stability Mechanism (ESM), was set up in 2013.
Third, the euro area lacked a system of banking integration. In this respect, a reform of the regulatory and supervisory framework was begun, the two main elements of which being the development of a new prudential regulatory framework and the configuration of a new European supervisory architecture: the European System of Financial Supervision (see Section 2.3).
B. Performance of the Spanish economy
2008-2009: The first stage of the crisis
In mid-2007, when the first signs of turmoil on the international financial markets began to emerge, the Spanish economy had already entered a phase of deceleration as its expansionary cycle matured. The strong rate of growth initially began to moderate in a context of progressive tightening of financial conditions in the wake of the successive interest rate hikes by the ECB (from 2% at the end of 2005 to 4% in June 2007) and exhaustion of the upward cycle in the real estate market, which began to show signs of a gradual slowdown in demand and prices, although the supply of housing under construction was still very high. Slower growth in household wealth and rising interest rates helped moderate the expansion of household consumption and, in particular, residential investment. However, the sustained buoyancy of other demand components and the improvement in the net contribution from the external sector allowed GDP to grow by 3.8% in the year (see Table 2.1).3
In this context, the forecasts prepared in the early months of 2008 by the main public and private institutions, including the Banco de España, suggested a gradual slowing of Spain’s economic growth, in parallel with the deceleration forecast for the euro area and the global economy.4 However, these projections were not met and the Spanish economy slipped into recession in the second half of 2008. This was due to several factors: tightening global financial conditions, despite the change in the ECB’s monetary policy stance in the autumn of that year; the decline in private-sector wealth, as a
3 �Unless expressly stated otherwise, all the figures in this document refer to the most recent National Accounts estimates available at the time of writing and may therefore differ in some cases from those available during the crisis.
4 �See, for example, the European Central Bank June 2008 forecast, the European Commission’s 2008 Spring Economic Forecasts, the IMF’s April 2008 World Economic Outlook, OECD June 2008 Economic Outlook, Consensus Economics Forecasts and the ECB’s Survey of Professional Forecasters.

74 banco de españa
result of the real estate market correction and falling financial asset prices; heightened uncertainty; and the decline in exports in the wake of the sharp contraction in global trade.
Between mid-2008 and end-2009 real GDP contracted by 4.6% (see Chart 2.5). The adjustment fell heaviest on domestic demand, which dropped by 7%, with an accumulated decline of 4.5% in private consumption, 27% in investment in capital goods and 21% in construction investment. Despite the drop in sales abroad, the strong contraction in imports enabled the external sector to make a positive contribution up until the second quarter of 2009, partially alleviating the sharp contraction in GDP.
The recession was significantly worse than in the mid-1970s, when GDP barely dropped, and the early 1990s, when GDP contracted by just 2 pp. Nevertheless, in comparative international terms, the contraction was similar to that in the main European countries. Specifically, during this economic downturn the Spanish economy’s GDP contracted by 4.6%, as mentioned, and that of
ObservedGDP (e) year t-1 year t year t-1 year t year t-1 year t year t-1 year t
2000 5.3 3.5 3.7 3.3 4.3 – – 3.5 3.8
2001 4.0 3.4 2.9 2.9 2.9 – – 3.4 3.2
2002 2.9 3.2 2.3 2.9 2.1 – – 3.3 2.1
2003 3.2 3.2 2.2 3.3 2.1 – – 3.1 2.0
2004 3.2 3.1 2.8 3.1 2.9 – – 3.0 2.8
2005 3.7 3.3 2.8 2.5 3.0 – – 3.3 2.7
2006 4.2 3.0 3.3 3.2 3.3 – – 2.7 3.1
2007 3.8 3.2 3.6 3.0 3.6 – 3.7 2.8 3.7
2008 1.1 3.4 1.8 2.7 1.6 3.1 2.4 3.4 2.2
2009 -3.6 1.7 -3.0 1.1 -4.2 2.1 -3.0 1.8 -3.2
2010 0.0 -0.7 -0.4 -0.9 -0.2 -1.0 -0.4 -1.0 -0.4
2011 -1.0 0.9 0.8 0.9 0.9 0.8 0.8 0.8 0.8
2012 -2.9 1.6 -1.8 1.6 -1.6 1.5 -1.5 1.5 -1.8
2013 -1.7 0.1 -1.6 -0.8 -1.7 0.2 -1.5 -0.3 -1.5
2014 1.4 0.7 0.9 0.4 1.0 0.6 1.2 0.9 1.1
2015 3.2 1.0 2.5 1.5 2.9 1.7 2.8 2.1 2.8
2016 3.2 2.0 2.6 2.8 2.8 2.7 2.7 2.6 2.6
IMF (SpringForecasts) (a)
Banco de España (Economicprojections report) (c)
European Commission(Spring Forecasts) (d)
OECD (SpringForecasts) (b)
TABLE 2.1 CHANGES IN FORECAST GDP GROWTH FOR SPAIN
SOURCES: European Commission, IMF, INE and Banco de España.
a IMF forecast in April of reference year and preceding year.b OECD forecast in May or June of reference year and preceding year.c Banco de España forecast in Economic projections report of reference year and preceding year.d European Commission forecast in spring of reference year and preceding year.e Latest growth rate published by the INE.
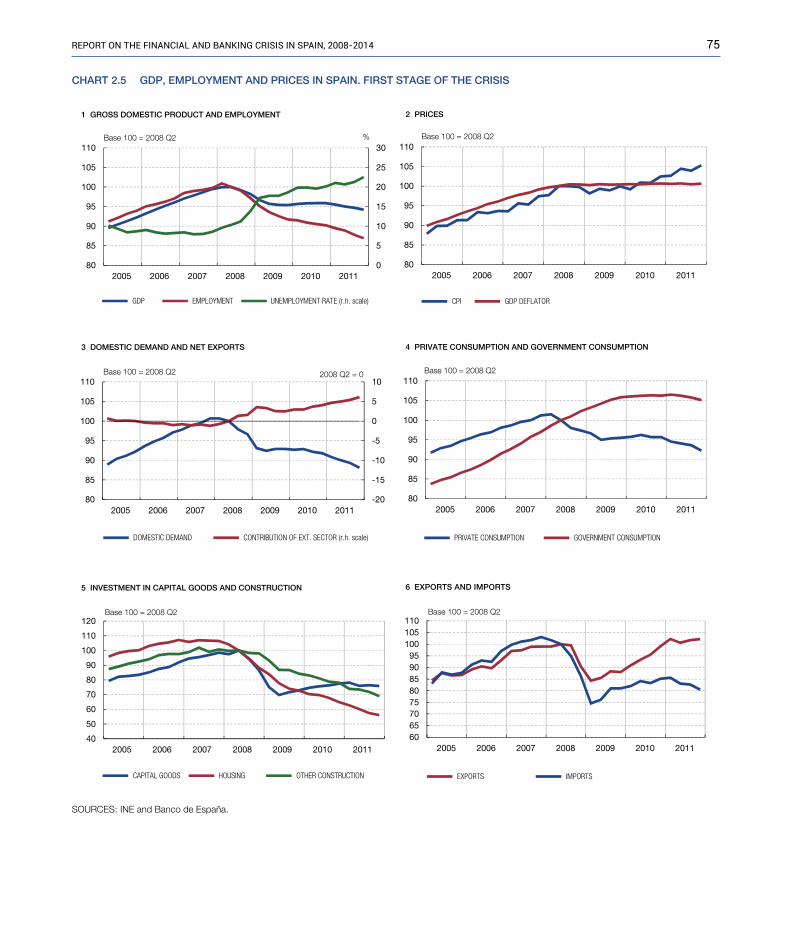
75RepoRt on the financial and banking cRisis in spain, 2008-2014
SOURCES: INE and Banco de España.
CHART 2.5 GDP, EMPLOYMENT AND PRICES IN SPAIN. FIRST STAGE OF THE CRISIS
0
5
10
15
20
25
30
80
85
90
95
100
105
110
2005 2006 2007 2008 2009 2010 2011
GDP EMPLOYMENT UNEMPLOYMENT RATE (r.h. scale)
1 GROSS DOMESTIC PRODUCT AND EMPLOYMENT
Base 100 = 2008 Q2 %
80
85
90
95
100
105
110
2005 2006 2007 2008 2009 2010 2011
CPI GDP DEFLATOR
2 PRICES
-20
-15
-10
-5
0
5
10
80
85
90
95
100
105
110
2005 2006 2007 2008 2009 2010 2011
DOMESTIC DEMAND CONTRIBUTION OF EXT. SECTOR (r.h. scale)
3 DOMESTIC DEMAND AND NET EXPORTS
2008 Q2 = 0Base 100 = 2008 Q2
80
85
90
95
100
105
110
2005 2006 2007 2008 2009 2010 2011
PRIVATE CONSUMPTION GOVERNMENT CONSUMPTION
4 PRIVATE CONSUMPTION AND GOVERNMENT CONSUMPTION
Base 100 = 2008 Q2
40
50
60
70
80
90
100
110
120
2005 2006 2007 2008 2009 2010 2011
CAPITAL GOODS HOUSING OTHER CONSTRUCTION
5 INVESTMENT IN CAPITAL GOODS AND CONSTRUCTION
Base 100 = 2008 Q2
6065707580859095
100105110
2005 2006 2007 2008 2009 2010 2011
EXPORTS IMPORTS
6 EXPORTS AND IMPORTS
Base 100 = 2008 Q2
Base 100 = 2008 Q2
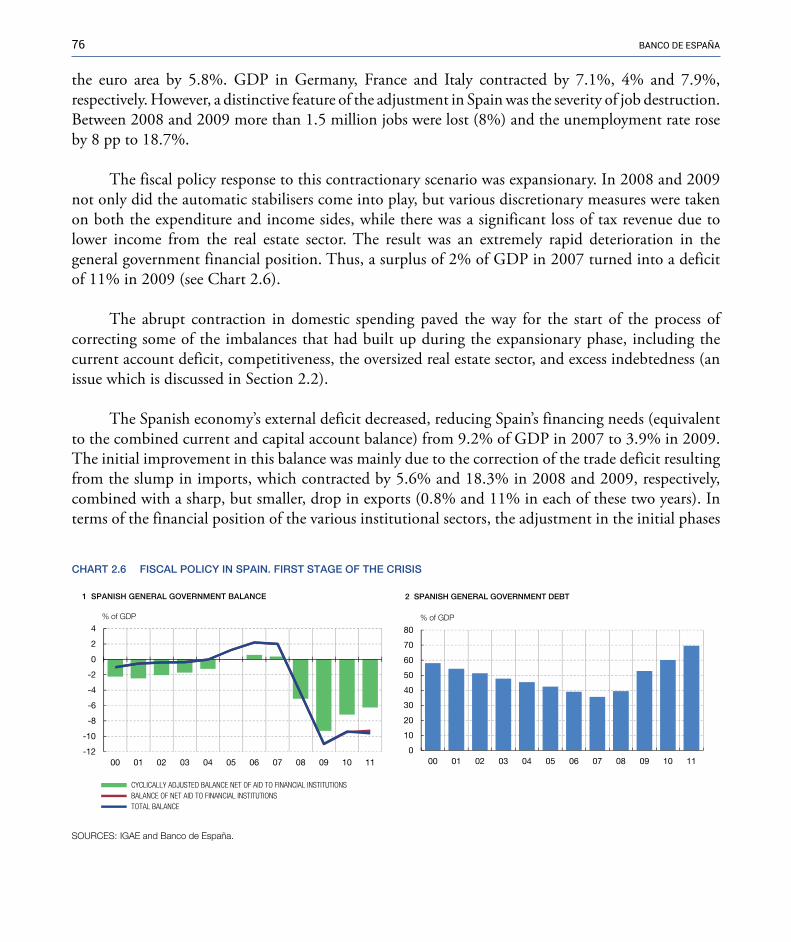
76 banco de españa
the euro area by 5.8%. GDP in Germany, France and Italy contracted by 7.1%, 4% and 7.9%, respectively. However, a distinctive feature of the adjustment in Spain was the severity of job destruction. Between 2008 and 2009 more than 1.5 million jobs were lost (8%) and the unemployment rate rose by 8 pp to 18.7%.
The fiscal policy response to this contractionary scenario was expansionary. In 2008 and 2009 not only did the automatic stabilisers come into play, but various discretionary measures were taken on both the expenditure and income sides, while there was a significant loss of tax revenue due to lower income from the real estate sector. The result was an extremely rapid deterioration in the general government financial position. Thus, a surplus of 2% of GDP in 2007 turned into a deficit of 11% in 2009 (see Chart 2.6).
The abrupt contraction in domestic spending paved the way for the start of the process of correcting some of the imbalances that had built up during the expansionary phase, including the current account deficit, competitiveness, the oversized real estate sector, and excess indebtedness (an issue which is discussed in Section 2.2).
The Spanish economy’s external deficit decreased, reducing Spain’s financing needs (equivalent to the combined current and capital account balance) from 9.2% of GDP in 2007 to 3.9% in 2009. The initial improvement in this balance was mainly due to the correction of the trade deficit resulting from the slump in imports, which contracted by 5.6% and 18.3% in 2008 and 2009, respectively, combined with a sharp, but smaller, drop in exports (0.8% and 11% in each of these two years). In terms of the financial position of the various institutional sectors, the adjustment in the initial phases
CHART 2.6 FISCAL POLICY IN SPAIN. FIRST STAGE OF THE CRISIS
SOURCES: IGAE and Banco de España.
-12
-10
-8
-6
-4
-2
0
2
4
00 01 02 03 04 05 06 07 08 09 10 11
CYCLICALLY ADJUSTED BALANCE NET OF AID TO FINANCIAL INSTITUTIONS BALANCE OF NET AID TO FINANCIAL INSTITUTIONS TOTAL BALANCE
% of GDP
1 SPANISH GENERAL GOVERNMENT BALANCE
0
10
20
30
40
50
60
70
80
00 01 02 03 04 05 06 07 08 09 10 11
% of GDP
2 SPANISH GENERAL GOVERNMENT DEBT

77RepoRt on the financial and banking cRisis in spain, 2008-2014
of the crisis reflected the private sector’s improved financing capacity, resulting from lower investment and higher savings, which was only partially offset by general government’s increased net borrowing (see Chart 2.7). However, the persistence of the external deficit and the asset and liability valuation effects exacerbated the deterioration in the Spanish economy’s net international investment position, which reached 94% of GDP at end-2009.
That same year, Spain’s CPI dropped by 0.3% relative to the previous year, a substantial price moderation that also exceeded that of the euro area, such that the inflation differential with the euro area turned negative for the first time since the launch of the single currency.
In the real estate market, by end-2009 house prices had fallen 10% from their peak in the third quarter of 2007 (see Chart 2.8) and the volume of sales had more than halved.5 The intensity of the adjustment in these years was also much greater than that registered in previous episodes in Spain, although it was in line with the scale of the preceding expansion and influenced by the impact of the sudden tightening of borrowing conditions in a sector highly dependent on external finance.
Thus investment in new housing fell significantly, with a contraction of 35% between 2007 and 2010, and the construction sector shed almost a million jobs, with the consequent spillover effects for the rest of the economy. Nevertheless, the adjustment on the supply side was relatively gradual, as in
5 The value of urban land dropped by 25% over this same period.
CHART 2.7 SPAIN'S BALANCE OF PAYMENTS
SOURCES: INE and Banco de España.
-15
-10
-5
0
5
10
99 00 01 02 03 04 05 06 07 08 09 10 11
FINANCIAL INSTITUTIONS NON-FINANCIAL CORPORATIONS HOUSEHOLDS GENERAL GOVERNMENT
% of GDP
2 NET LENDING (+) / NET BORROWING (-) BY INSTITUTIONAL SECTOR
-120
-100
-80
-60
-40
-20
0
20
99 00 01 02 03 04 05 06 07 08 09 10 11
CAPITAL ACCOUNT PRIMARY AND SECONDARY INCOMES GOODS AND SERVICESNET LENDING (+) / NET BORROWING (-) (NATIONAL ECONOMY)
NET LENDING (+) / NET BORROWING (-) (NATIONAL ECONOMY)
€bn
1 CURRENT AND CAPITAL ACCOUNTS
78 banco de españa
2008 and 2009 construction work continued on housing begun before the onset of the crisis (approximately one million homes over the two-year period; on average, building and development work takes slightly more than two years to complete). This contributed to the build-up of a substantial stock of unsold housing, which weighed down on prices and held back new housing starts in subsequent years.
2010: The failed recovery
In early 2010, when an upturn began in the global economy, the Spanish economy was in a position where the contraction in GDP was progressively smaller, and adjustment of the main imbalances that had built up during the expansionary phase was under way. Nevertheless, up to that point, the absorption of these imbalances had been very limited. The external deficit was shrinking and competitiveness improving, but the process was far from complete. Levels of private-sector debt and dependence on external finance remained very high and the concerns about the extent of the impact of real estate asset impairment impinged on the perceived soundness of the financial sector. On top of this were the imbalances generated by the crisis, in the form of extremely high unemployment rates and the deterioration of the general government financial position.
Against this backdrop, the economic growth forecasts available pointed to a gradual recovery not exempt from risks. However, financial distress in European markets in the wake first of the Greek crisis and then of the Irish crisis, significantly affected the Spanish economy. Thus, the yield spread between Spanish and German ten-year sovereign debt rose to over 200 bp at end-2010 and credit
CHART 2.8 HOUSE PRICES IN SPAIN
-15-10-505
10152025
98 99 00 01 02 03 04 05 06 07 08 09 10 11
NOMINAL REAL
1 HOUSE PRICESYear-on-year rates
%
2025303540455055606570
0123456789
10
98 99 00 01 02 03 04 05 06 07 08 09 10 11
HOUSE PRICES / MEDIAN HOUSEHOLD GDI
THEORETICAL DEBT BURDEN IN THE FIRST YEAR (a) (right-hand scale)
2 HOUSING AFFORDABILITY INDICATORS
% %
SOURCES: Eurostat, INE, Ministerio de Fomento and Banco de España.
a Amount of instalments payable in the first year following purchase of a typical home paid for with a standard loan of 80% of the value of the property, as a percentage of the annual disposable income of a median household.
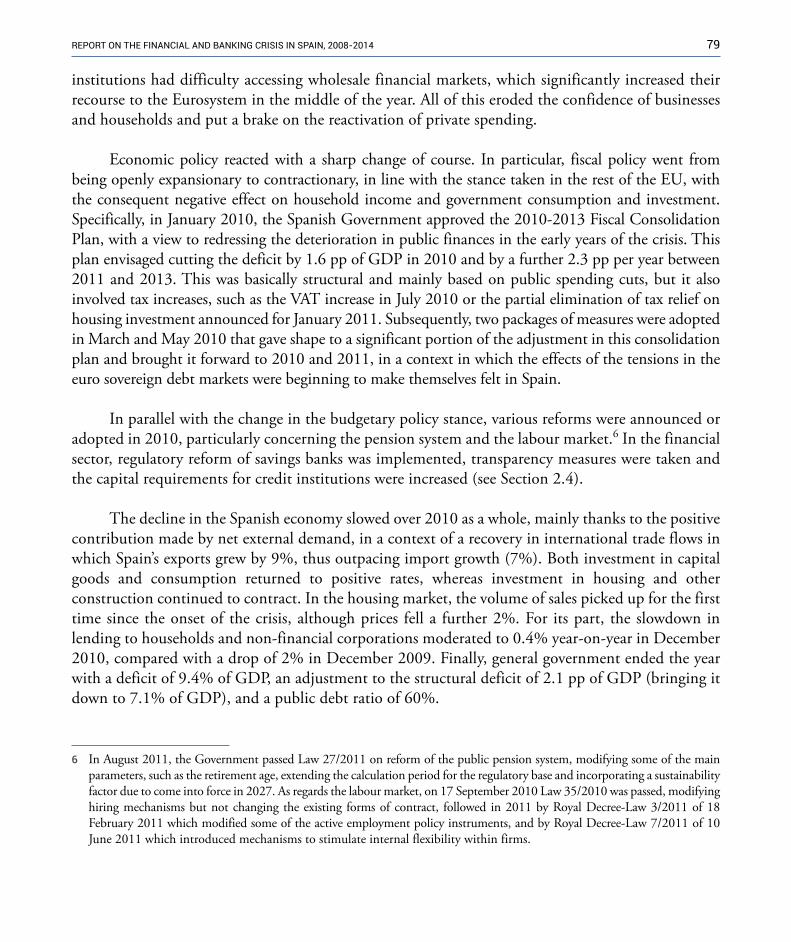
79RepoRt on the financial and banking cRisis in spain, 2008-2014
institutions had difficulty accessing wholesale financial markets, which significantly increased their recourse to the Eurosystem in the middle of the year. All of this eroded the confidence of businesses and households and put a brake on the reactivation of private spending.
Economic policy reacted with a sharp change of course. In particular, fiscal policy went from being openly expansionary to contractionary, in line with the stance taken in the rest of the EU, with the consequent negative effect on household income and government consumption and investment. Specifically, in January 2010, the Spanish Government approved the 2010-2013 Fiscal Consolidation Plan, with a view to redressing the deterioration in public finances in the early years of the crisis. This plan envisaged cutting the deficit by 1.6 pp of GDP in 2010 and by a further 2.3 pp per year between 2011 and 2013. This was basically structural and mainly based on public spending cuts, but it also involved tax increases, such as the VAT increase in July 2010 or the partial elimination of tax relief on housing investment announced for January 2011. Subsequently, two packages of measures were adopted in March and May 2010 that gave shape to a significant portion of the adjustment in this consolidation plan and brought it forward to 2010 and 2011, in a context in which the effects of the tensions in the euro sovereign debt markets were beginning to make themselves felt in Spain.
In parallel with the change in the budgetary policy stance, various reforms were announced or adopted in 2010, particularly concerning the pension system and the labour market.6 In the financial sector, regulatory reform of savings banks was implemented, transparency measures were taken and the capital requirements for credit institutions were increased (see Section 2.4).
The decline in the Spanish economy slowed over 2010 as a whole, mainly thanks to the positive contribution made by net external demand, in a context of a recovery in international trade flows in which Spain’s exports grew by 9%, thus outpacing import growth (7%). Both investment in capital goods and consumption returned to positive rates, whereas investment in housing and other construction continued to contract. In the housing market, the volume of sales picked up for the first time since the onset of the crisis, although prices fell a further 2%. For its part, the slowdown in lending to households and non-financial corporations moderated to 0.4% year-on-year in December 2010, compared with a drop of 2% in December 2009. Finally, general government ended the year with a deficit of 9.4% of GDP, an adjustment to the structural deficit of 2.1 pp of GDP (bringing it down to 7.1% of GDP), and a public debt ratio of 60%.
6 �In August 2011, the Government passed Law 27/2011 on reform of the public pension system, modifying some of the main parameters, such as the retirement age, extending the calculation period for the regulatory base and incorporating a sustainability factor due to come into force in 2027. As regards the labour market, on 17 September 2010 Law 35/2010 was passed, modifying hiring mechanisms but not changing the existing forms of contract, followed in 2011 by Royal Decree-Law 3/2011 of 18 February 2011 which modified some of the active employment policy instruments, and by Royal Decree-Law 7/2011 of 10 June 2011 which introduced mechanisms to stimulate internal flexibility within firms.
80 banco de españa
2011: The double-dip recession
According to the data published by the INE over the course of 2011, the year began with a continuation of the incipient recovery that had started to emerge in 2010, showing modest but positive rates of GDP growth in the first two quarters. In this context, the forecasts made in the spring of that year by the IMF, the European Commission, the OECD and the Banco de España still pointed to GDP growth for the year of 0.8% in Spain (see Table 2.1).
However, renewed tensions in the euro area financial markets, which intensified in the second half of the year, raised the aggregate uncertainty in the euro area overall, with a negative impact on euro area growth. In Spain, the tensions mainly affected general government and credit institutions, and led to a substantial rise in borrowing costs. Credit institutions, which had already suffered difficulties in 2010, although to a lesser extent, started to pass on their higher costs to customers at the start of 2011, reducing the supply and raising the cost of loans to Spanish households and businesses (see Chart 2.9).
This fresh bout of financial market tension in the euro area (see Chart 2.3), which became particularly intense as from July, led to a sharp tightening of financing conditions for all resident agents and heightened overall uncertainty, which had a further contractionary effect on the Spanish economy, confounding the forecasts of recovery made by the leading national and international institutions, including the Banco de España, in the first half of the year, as mentioned earlier.
Lastly, the National Statistics Institute (INE) would later report a 1% contraction in GDP over 2011 as a whole. In this regard, it is worth noting that 2011 saw the biggest forecasting error in recent years (defined as the difference between the final GDP estimate and the macroeconomic forecasts made in the spring of the same year) by the IMF, the European Commission, the OECD and the Banco de España, bigger even than that recorded in 2008 (see Chart 2.10 and Table 2.1).
As regards employment, the downward trend accelerated and employment contracted by 3.7%, resulting in an unemployment rate of 23% at end-2011. The adjustment in the real estate sector intensified, with the volume of house sales down 30% and prices down 11% compared with the previous year, at the same time as sluggish economic activity and the need to deleverage limited the scope for growth in the balance of outstanding credit to the private sector, which dropped by 3%. Bad loans and arrears continued to rise, particularly among the savings banks (see Section 2.2), and the outlook for financial institutions’ earnings also worsened. In this context, in February the Government approved an increase in the capital requirements for credit institutions (see Section 2.5). Also, in this setting, in relation to the budget, there was a deviation from the general government deficit target for the year of more than 3 pp of GDP (9.6% compared
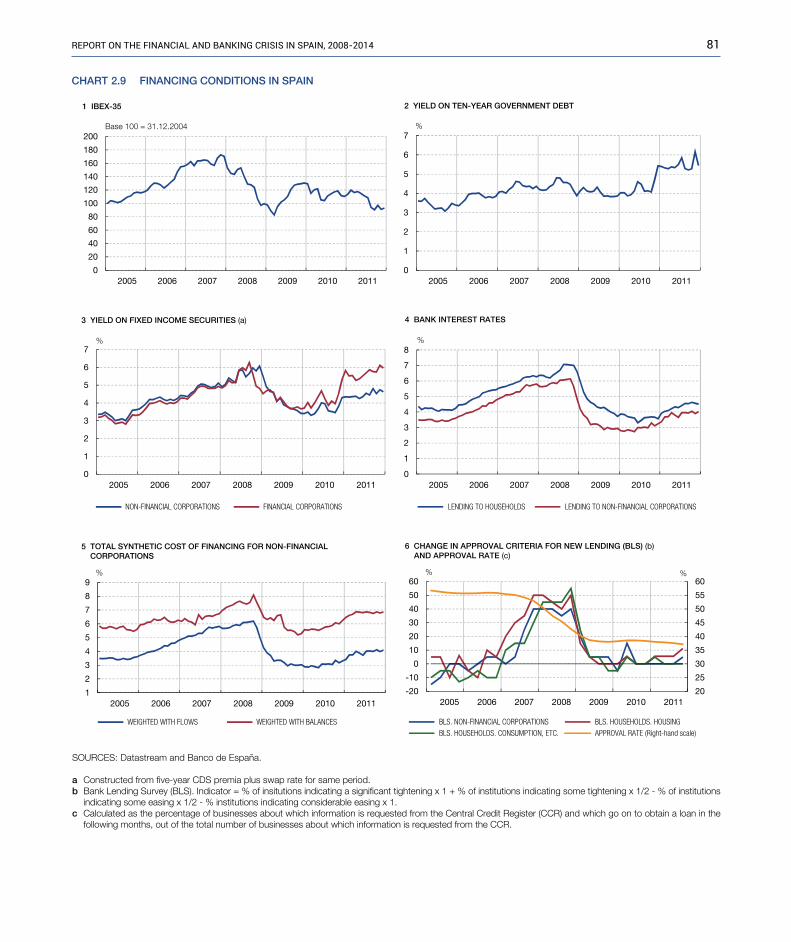
81RepoRt on the financial and banking cRisis in spain, 2008-2014
0
1
2
3
4
5
6
7
2005 2006 2007 2008 2009 2010 2011
NON-FINANCIAL CORPORATIONS FINANCIAL CORPORATIONS
3 YIELD ON FIXED INCOME SECURITIES (a)
%
CHART 2.9 FINANCING CONDITIONS IN SPAIN
0
1
2
3
4
5
6
7
8
2005 2006 2007 2008 2009 2010 2011
LENDING TO HOUSEHOLDS LENDING TO NON-FINANCIAL CORPORATIONS
%
4 BANK INTEREST RATES
1
2
3
4
5
6
7
8
9
2005 2006 2007 2008 2009 2010 2011
WEIGHTED WITH FLOWS WEIGHTED WITH BALANCES
5 TOTAL SYNTHETIC COST OF FINANCING FOR NON-FINANCIAL CORPORATIONS
%
20
25
30
35
40
45
50
55
60
-20
-10
0
10
20
30
40
50
60
2005 2006 2007 2008 2009 2010 2011
BLS. NON-FINANCIAL CORPORATIONS BLS. HOUSEHOLDS. HOUSING BLS. HOUSEHOLDS. CONSUMPTION, ETC. APPROVAL RATE (Right-hand scale)
%
6 CHANGE IN APPROVAL CRITERIA FOR NEW LENDING (BLS) (b) AND APPROVAL RATE (c)
%
0
20
40
60
80
100
120
140
160
180
200
2005 2006 2007 2008 2009 2010 2011
1 IBEX-35
Base 100 = 31.12.2004
0
1
2
3
4
5
6
7
2005 2006 2007 2008 2009 2010 2011
%
2 YIELD ON TEN-YEAR GOVERNMENT DEBT
SOURCES: Datastream and Banco de España.
a Constructed from five-year CDS premia plus swap rate for same period.b Bank Lending Survey (BLS). Indicator = % of insitutions indicating a significant tightening x 1 + % of institutions indicating some tightening x 1/2 - % of institutions
indicating some easing x 1/2 - % institutions indicating considerable easing x 1.c Calculated as the percentage of businesses about which information is requested from the Central Credit Register (CCR) and which go on to obtain a loan in the
following months, out of the total number of businesses about which information is requested from the CCR.
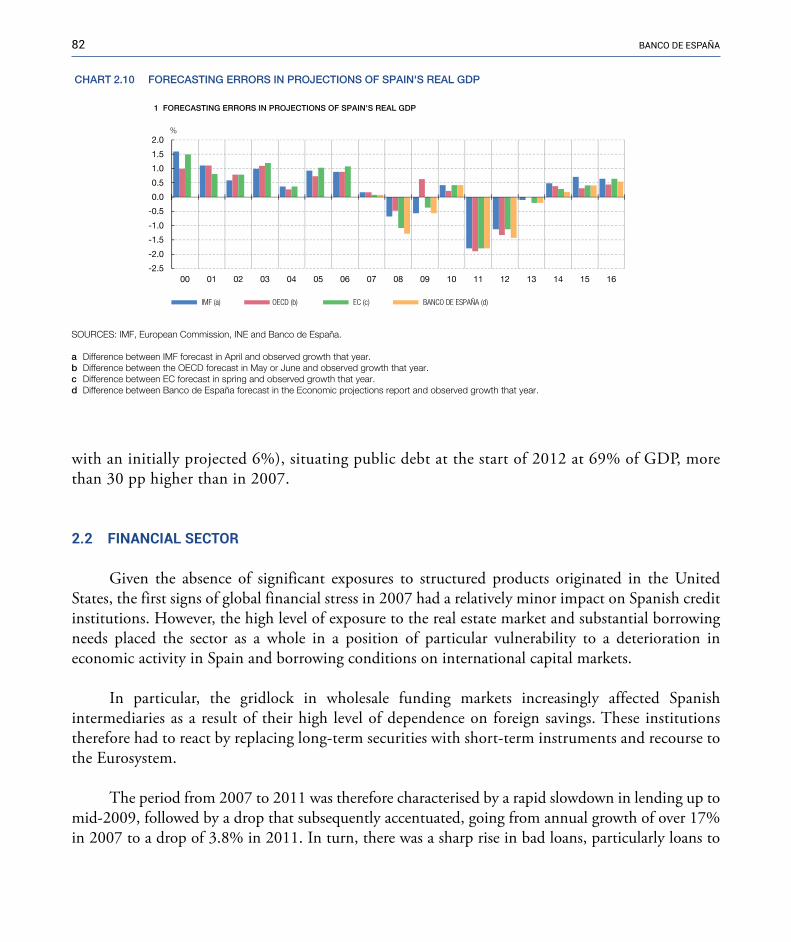
82 banco de españa
with an initially projected 6%), situating public debt at the start of 2012 at 69% of GDP, more than 30 pp higher than in 2007.
2.2 FINANCIAL�SECTOR�
Given the absence of significant exposures to structured products originated in the United States, the first signs of global financial stress in 2007 had a relatively minor impact on Spanish credit institutions. However, the high level of exposure to the real estate market and substantial borrowing needs placed the sector as a whole in a position of particular vulnerability to a deterioration in economic activity in Spain and borrowing conditions on international capital markets.
In particular, the gridlock in wholesale funding markets increasingly affected Spanish intermediaries as a result of their high level of dependence on foreign savings. These institutions therefore had to react by replacing long-term securities with short-term instruments and recourse to the Eurosystem.
The period from 2007 to 2011 was therefore characterised by a rapid slowdown in lending up to mid-2009, followed by a drop that subsequently accentuated, going from annual growth of over 17% in 2007 to a drop of 3.8% in 2011. In turn, there was a sharp rise in bad loans, particularly loans to
CHART 2.10 FORECASTING ERRORS IN PROJECTIONS OF SPAIN'S REAL GDP
-2.5
-2.0
-1.5
-1.0
-0.5
0.0
0.5
1.0
1.5
2.0
00 01 02 03 04 05 06 07 08 09 10 11 12 13 14 15 16
IMF (a) OECD (b) EC (c) BANCO DE ESPAÑA (d)
%
1 FORECASTING ERRORS IN PROJECTIONS OF SPAIN'S REAL GDP
SOURCES: IMF, European Commission, INE and Banco de España.
a Difference between IMF forecast in April and observed growth that year.b Difference between the OECD forecast in May or June and observed growth that year.c Difference between EC forecast in spring and observed growth that year.d Difference between Banco de España forecast in the Economic projections report and observed growth that year.

83RepoRt on the financial and banking cRisis in spain, 2008-2014
the real estate and construction sector, in a context of worsening financial conditions for real estate businesses, whose situation progressively deteriorated, given the impossibility of freeing themselves from their financial burdens by liquidating their real estate assets.
The result was rapid growth in the non-performing loans (NPL) ratio, which started out very low, at 0.8% in 2007, rising to 8% by the end of 2011, with generally higher ratios among the savings banks (9.3%) than the commercial banks (6.8%). The distance between the commercial banks and savings banks also increased during the period in terms of their coverage ratios and ability to generate profits.
A. Credit to the resident private sector
Credit granted to Spanish households and non-financial corporations slowed rapidly from 2008, when credit grew by 6%, compared with rates that had been over 17% since 2004 (see Chart 2.11). In year-on-year terms, credit began to drop in the third quarter of 2009, and 2010 was the first calendar year in which it declined. Overall, in the period from December 2007 to December 2011, outstanding lending by deposit-taking institutions to the resident private sector in Spain dropped by 0.2% (around €3.7 billion). However, in the period from December 2008 to December 2011, the drop was 5.9% (€105.7 billion).
This sharp contraction in lending from 2008 onwards was driven by both demand- and supply-side factors. Falling domestic spending, the loss of confidence among economic agents and the
CHART 2.11 LENDING TO THE RESIDENT PRIVATE SECTORIN SPAIN. ABSOLUTE TERMS AND AS PERCENTAGE OF GDP
60
80
100
120
140
160
180
500
750
1,000
1,250
1,500
1,750
2,000
00 01 02 03 04 05 06 07 08 09 10 11
VOLUME OF LENDING LENDING / GDP (right-hand scale)
€bn %
SOURCES: INE and Banco de España.
CHART 2.12 CUMULATIVE GROWTH OF LENDING TO THE RESIDENT PRIVATE SECTOR, BY PURPOSE
100
200
300
400
500
600
700
HOUSING OTHER LENDING TO HOUSEHOLDS CONSTRUCTION AND REAL ESTATE BUSINESS OTHER LENDING TO NON-FINANCIAL CORPORATIONS
Base 100 = December 2000
SOURCE: Banco de España.
00 01 02 03 04 05 06 07 08 09 10 11

84 banco de españa
reassessment of their financial position reined in applications for new borrowing by households and businesses substantially. At the same time, the upward revision of perceived risks, against a background of a profound global crisis and falling asset prices, and the deterioration in lending conditions all contributed to tightening the supply of new credit.
It is worth noting that the drop in credit between 2007 and 2011 was due to the savings banks, as lending by the commercial banks continued to grow, albeit very moderately (cumulative growth of 0.5% over the period). The savings banks, which had grown much faster in the preceding years, slowed the rate at which they granted credit in this period, such that there was a cumulative drop of 1.4% in their lending.
By institutional sector, the downward correction in the outstanding balance of loans to households started earlier in the case of lending for consumption and other purposes (with shorter average maturities) than in that of lending for house purchases (with longer maturities). Lending to households grew by €2.4 billion overall (0.3%) between December 2007 and December 2011 (Chart 2.12). Credit intended for housing purchases continued to grow during the period, with a cumulative rise of 5.3% over the four-year period (€32 billion), while credit for other purposes dropped significantly in terms of both the absolute amount (€30 billion) and as a percentage (a cumulative drop of almost 20%). The behaviour of the commercial banks and savings banks was similar in terms of credit to households during the period.
There was also a significant decrease in lending to non-financial corporations in the period. Overall, lending to non-financial corporations dropped by 6.2% between 2007 and 2011 (almost €54 billion). This drop was due to the behaviour of credit to businesses in the real estate and construction sector, which fell by more than €57 billion (–12.9% in cumulative terms). Indeed, other business lending increased by €3.4 billion in the period (0.8% in cumulative terms). There were differences, however, in how commercial banks and savings banks behaved in terms of granting credit to businesses. Specifically, the commercial banks cut their lending to real estate and construction businesses more than did savings banks (–15% compared with –11%) and they also reduced their lending to other businesses, while savings banks increased their lending to businesses other than those in the real estate and construction sectors during this period.
B. Non-performing loans
Broadly speaking, the period 2007-2011 was characterised by a sharp increase in non-performing loans (NPLs), particularly in lending to the real estate and construction sector, which led to rising non-performing loan ratios. The distance between commercial banks’ and savings banks’ NPL ratios and coverage ratios also widened, as was to be expected given the savings banks’ greater exposure to real estate sector lending.

85RepoRt on the financial and banking cRisis in spain, 2008-2014
The biggest increase in the volume of NPLs, in both absolute and relative terms, took place in 2008 (see Table 2.2), with year-on-year growth of over 300%. NPLs were concentrated particularly in lending to the real estate and construction sector, which rose to over 45% of the total volume of NPLs, compared with less than 20% in previous years. Non-performing loans remained on an upward path and began to rise faster again in 2011, particularly in the case of the savings banks, with an annual growth rate of over 44%.
This increase led to an upturn in the NPL ratio for households and non-financial corporations, particularly in the case of lending to the real estate and construction sector. The NPL ratio in this sector stood at over 20% in December 2011, while in other non-financial sectors and lending to households other than for house purchases, it stood at around 6.5% (the NPL ratio on housing loans was below 3%; see Chart 2.13). In general, the savings banks also had higher NPL ratios than the commercial banks, except in the case of loans to households for purposes other than house purchases.
For their part, coverage ratios decreased slightly relative to 2007, with a minimum of less than 30% in 2008. In December 2011 they stood at 36.3%, with commercial banks’ and savings banks’ ratios being similar (see Chart 2.14).
Percentage year-on-year changeNon-performing loans to private sector
YearsTotal deposit-taking
institutionsCommercial
banksSavingsbanks
Savingsbanks (%)
Totaldeposit-takinginstitutions (%)
82.274.261.50002
71.288.758.533.276.264.51002
18.2196.6163.4136.211.342.62002
02.193.3-46.0-66.210.302.63002
57.734.3-83.178.209.292.64002
08.2360.2227.6218.345.379.75002
04.6141.3112.4134.410.401.96002
80.7609.6410.6514.798.502.417002
25.66374.59214.62365.4392.3245.068002
29.8275.1795.5455.4459.9341.889002
17.8192.3182.6198.2562.5494.2010102
06.4402.7145.2384.6750.3548.5311102
TABLE 2.2 NON-PERFORMING LOANS TO THE RESIDENT PRIVATE SECTOR IN SPAIN
€bn and percentage
SOURCE: Banco de EspañaNOTE: Total institutions data include commercial banks, savings banks and credit cooperatives.
Commercialbanks (%)

86 banco de españa
C. Government debt
The financial crisis marked a turning point in how institutions behaved regarding their government debt holdings, which started to grow as a substitute for lending to the private sector. Between December 2007 and December 2011, the volume of government debt held by banks grew by 145%, rising from €79 billion at end-2007 to €194 billion at end-2011 (see Chart 2.15). Particularly noteworthy was the annual growth of 54% financial institutions as a whole saw in 2009.
CHART 2.13 NPL RATIOS. NON-PERFORMING LOANS TO THE SPANISH RESIDENT PRIVATE SECTOR
0
2
4
6
8
10
2000 2001 2002 2003 2004 2005 2006 2007 2008 2009 2010 2011
ALL DEPOSIT-TAKING INSTITUTIONS COMMERCIAL BANKS SAVINGS BANKS
%
1 BY TYPE OF INSTITUTION
0
5
10
15
20
25
2000 2001 2002 2003 2004 2005 2006 2007 2008 2009 2010 2011
HOUSING OTHER LENDING TO HOUSEHOLDS CONSTRUCTION AND REAL ESTATE BUSINESS OTHER LENDING TO NON-FINANCIAL CORPORATIONS
%
2 BY PURPOSE
SOURCE: Banco de España.
CHART 2.14 COVERAGE RATIO. NON-PERFORMING LOANS TO THE RESIDENT PRIVATE SECTOR IN SPAIN
0
10
20
30
40
50
60
70
2000 2001 2002 2003 2004 2005 2006 2007 2008 2009 2010 2011
TOTAL LENDING CONSTRUCTION AND REAL ESTATE BUSINESS HOUSE PURCHASES AND REFURBISHMENT
%
SOURCE: Banco de España.
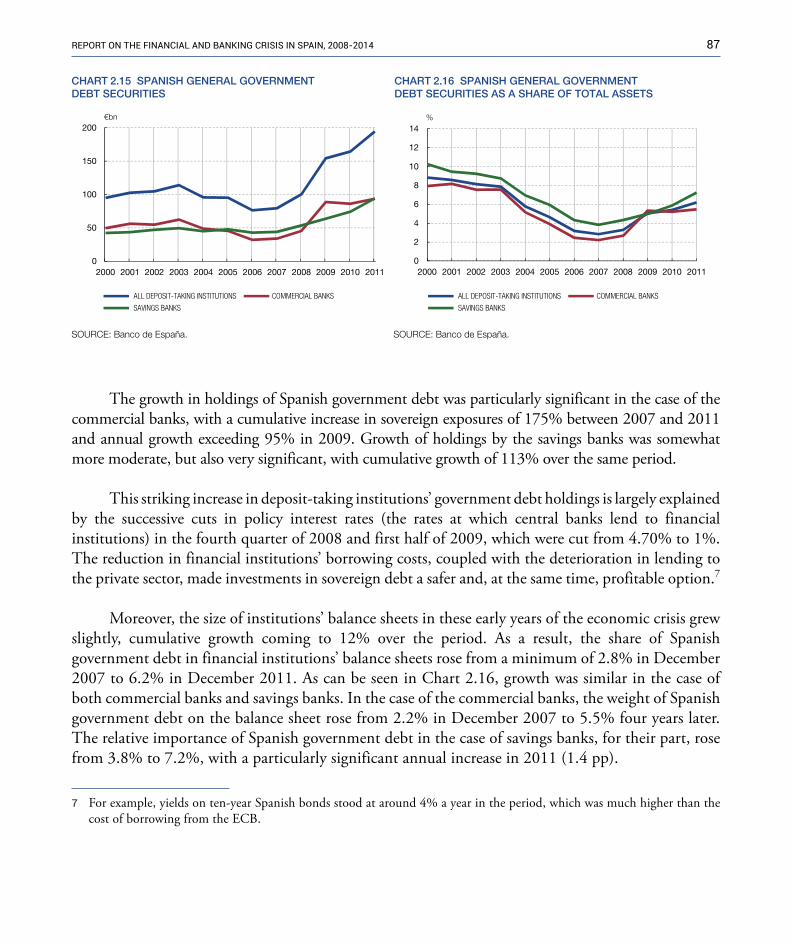
87RepoRt on the financial and banking cRisis in spain, 2008-2014
The growth in holdings of Spanish government debt was particularly significant in the case of the commercial banks, with a cumulative increase in sovereign exposures of 175% between 2007 and 2011 and annual growth exceeding 95% in 2009. Growth of holdings by the savings banks was somewhat more moderate, but also very significant, with cumulative growth of 113% over the same period.
This striking increase in deposit-taking institutions’ government debt holdings is largely explained by the successive cuts in policy interest rates (the rates at which central banks lend to financial institutions) in the fourth quarter of 2008 and first half of 2009, which were cut from 4.70% to 1%. The reduction in financial institutions’ borrowing costs, coupled with the deterioration in lending to the private sector, made investments in sovereign debt a safer and, at the same time, profitable option.7
Moreover, the size of institutions’ balance sheets in these early years of the economic crisis grew slightly, cumulative growth coming to 12% over the period. As a result, the share of Spanish government debt in financial institutions’ balance sheets rose from a minimum of 2.8% in December 2007 to 6.2% in December 2011. As can be seen in Chart 2.16, growth was similar in the case of both commercial banks and savings banks. In the case of the commercial banks, the weight of Spanish government debt on the balance sheet rose from 2.2% in December 2007 to 5.5% four years later. The relative importance of Spanish government debt in the case of savings banks, for their part, rose from 3.8% to 7.2%, with a particularly significant annual increase in 2011 (1.4 pp).
7 �For example, yields on ten-year Spanish bonds stood at around 4% a year in the period, which was much higher than the cost of borrowing from the ECB.
CHART 2.15 SPANISH GENERAL GOVERNMENTDEBT SECURITIES
0
50
100
150
200
2000 2001 2002 2003 2004 2005 2006 2007 2008 2009 2010 2011
ALL DEPOSIT-TAKING INSTITUTIONS COMMERCIAL BANKS
SAVINGS BANKS
ALL DEPOSIT-TAKING INSTITUTIONS COMMERCIAL BANKS
SAVINGS BANKS
€bn
CHART 2.16 SPANISH GENERAL GOVERNMENTDEBT SECURITIES AS A SHARE OF TOTAL ASSETS
0
2
4
6
8
10
12
14
2000 2001 2002 2003 2004 2005 2006 2007 2008 2009 2010 2011
%
SOURCE: Banco de España.SOURCE: Banco de España.
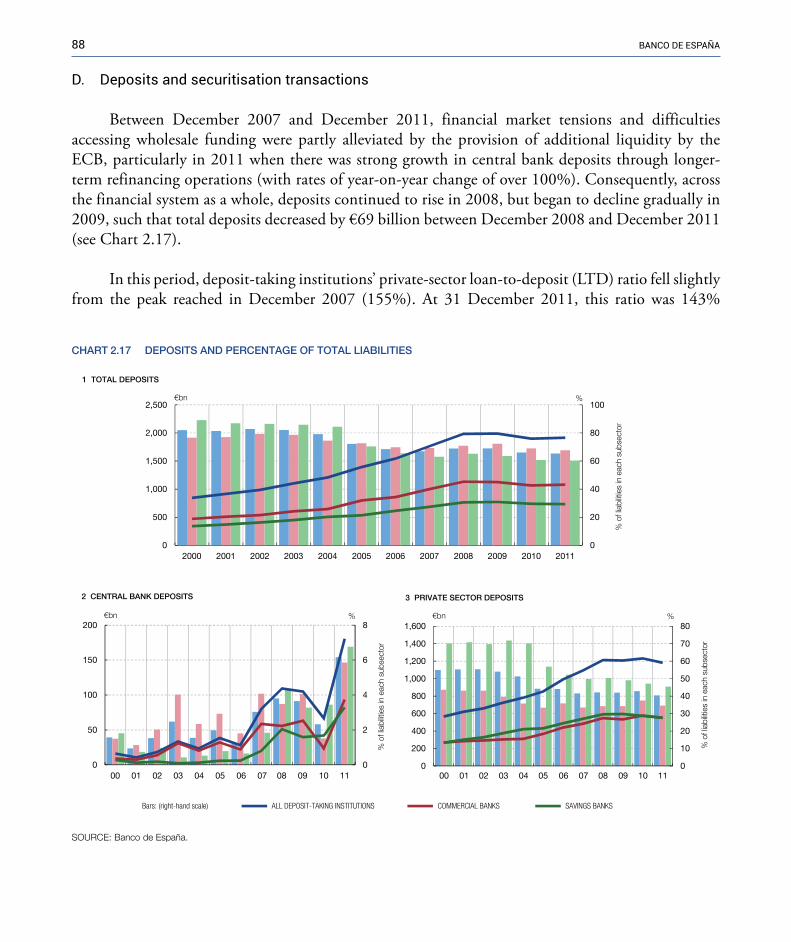
88 banco de españa
D. Deposits and securitisation transactions
Between December 2007 and December 2011, financial market tensions and difficulties accessing wholesale funding were partly alleviated by the provision of additional liquidity by the ECB, particularly in 2011 when there was strong growth in central bank deposits through longer-term refinancing operations (with rates of year-on-year change of over 100%). Consequently, across the financial system as a whole, deposits continued to rise in 2008, but began to decline gradually in 2009, such that total deposits decreased by €69 billion between December 2008 and December 2011 (see Chart 2.17).
In this period, deposit-taking institutions’ private-sector loan-to-deposit (LTD) ratio fell slightly from the peak reached in December 2007 (155%). At 31 December 2011, this ratio was 143%
CHART 2.17 DEPOSITS AND PERCENTAGE OF TOTAL LIABILITIES
0
20
40
60
80
100
0
500
1,000
1,500
2,000
2,500
2000 2001 2002 2003 2004 2005 2006 2007 2008 2009 2010 2011
€bn %
% o
f lia
bilit
ies
in e
ach
subs
ecto
r
1 TOTAL DEPOSITS
0
2
4
6
8
0
50
100
150
200
00 01 02 03 04 05 06 07 08 09 10 11
€bn %
% o
f lia
bilit
ies
in e
ach
subs
ecto
r
2 CENTRAL BANK DEPOSITS
0
10
20
30
40
50
60
70
80
0
200
400
600
800
1,000
1,200
1,400
1,600€bn %
% o
f lia
bilit
ies
in e
ach
subs
ecto
r
3 PRIVATE SECTOR DEPOSITS
SOURCE: Banco de España.
Bars: (right-hand scale) ALL DEPOSIT-TAKING INSTITUTIONS COMMERCIAL BANKS SAVINGS BANKS
00 01 02 03 04 05 06 07 08 09 10 11
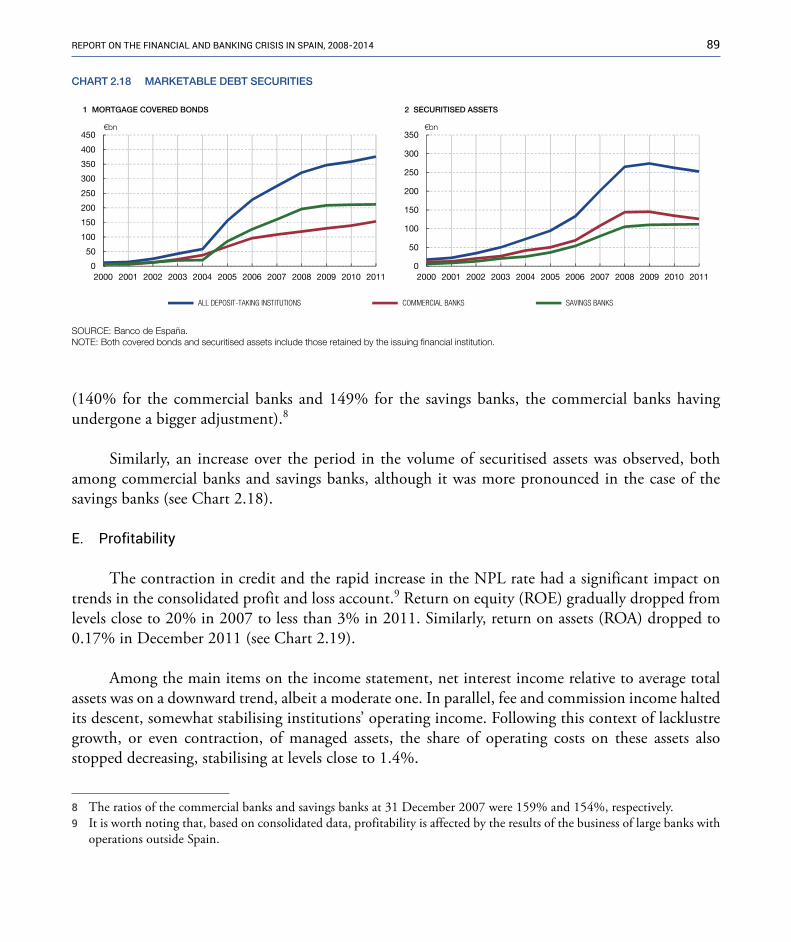
89RepoRt on the financial and banking cRisis in spain, 2008-2014
(140% for the commercial banks and 149% for the savings banks, the commercial banks having undergone a bigger adjustment).8
Similarly, an increase over the period in the volume of securitised assets was observed, both among commercial banks and savings banks, although it was more pronounced in the case of the savings banks (see Chart 2.18).
E. Profitability
The contraction in credit and the rapid increase in the NPL rate had a significant impact on trends in the consolidated profit and loss account.9 Return on equity (ROE) gradually dropped from levels close to 20% in 2007 to less than 3% in 2011. Similarly, return on assets (ROA) dropped to 0.17% in December 2011 (see Chart 2.19).
Among the main items on the income statement, net interest income relative to average total assets was on a downward trend, albeit a moderate one. In parallel, fee and commission income halted its descent, somewhat stabilising institutions’ operating income. Following this context of lacklustre growth, or even contraction, of managed assets, the share of operating costs on these assets also stopped decreasing, stabilising at levels close to 1.4%.
8 The ratios of the commercial banks and savings banks at 31 December 2007 were 159% and 154%, respectively.9 �It is worth noting that, based on consolidated data, profitability is affected by the results of the business of large banks with
operations outside Spain.
0
50
100
150
200
250
300
350
400
450
2000 2001 2002 2003 2004 2005 2006 2007 2008 2009 2010 2011
€bn
1 MORTGAGE COVERED BONDS
CHART 2.18 MARKETABLE DEBT SECURITIES
SOURCE: Banco de España.NOTE: Both covered bonds and securitised assets include those retained by the issuing financial institution.
0
50
100
150
200
250
300
350
2000 2001 2002 2003 2004 2005 2006 2007 2008 2009 2010 2011
€bn
2 SECURITISED ASSETS
ALL DEPOSIT-TAKING INSTITUTIONS COMMERCIAL BANKS SAVINGS BANKS
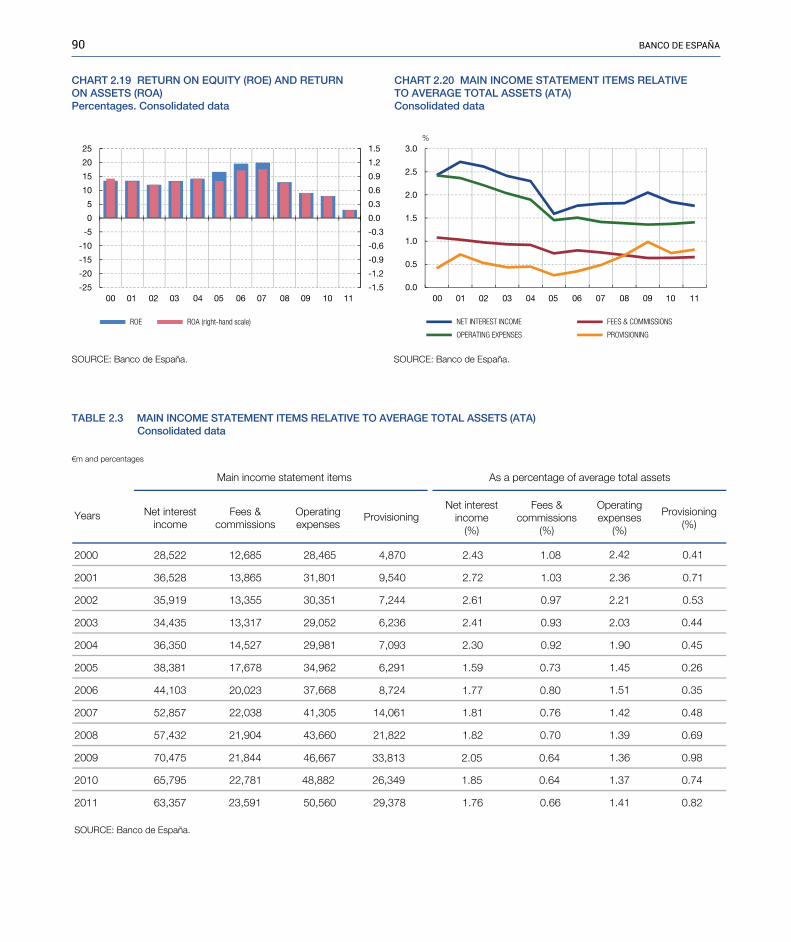
90 banco de españa
-1.5
-1.2
-0.9
-0.6
-0.3
0.0
0.3
0.6
0.9
1.2
1.5
-25
-20
-15
-10
-5
0
5
10
15
20
25
00 01 02 03 04 05 06 07 08 09 10 11 00 01 02 03 04 05 06 07 08 09 10 11
ROE ROA (right-hand scale)
CHART 2.19 RETURN ON EQUITY (ROE) AND RETURN ON ASSETS (ROA)Percentages. Consolidated data
CHART 2.20 MAIN INCOME STATEMENT ITEMS RELATIVETO AVERAGE TOTAL ASSETS (ATA)Consolidated data
0.0
0.5
1.0
1.5
2.0
2.5
3.0
NET INTEREST INCOME FEES & COMMISSIONS
OPERATING EXPENSES PROVISIONING
%
SOURCE: Banco de España.SOURCE: Banco de España.
As a percentage of average total assetsMain income statement items
Years Net interestincome
Fees &commissions
Operatingexpenses
ProvisioningNet interest
income(%)
Fees &commissions
(%)
Operatingexpenses
(%)
Provisioning(%)
2000 28,522
2001 36,528
2002 35,919
2003 34,435
2004 36,350
2005 38,381
2006 44,103
2007 52,857
2008 57,432
2009 70,475
2010 65,795
2011 63,357
Consolidated data
€m and percentages
12,685 28,465 2.43 1.084,870 2.42 0.41
13,865 31,801 9,540 2.72 1.03 2.36 0.71
13,355 30,351 7,244 2.61 0.97 2.21 0.53
13,317 29,052 6,236 2.41 0.93 2.03 0.44
14,527 29,981 7,093 2.30 0.92 1.90 0.45
17,678 34,962 6,291 1.59 0.73 1.45 0.26
20,023 37,668 8,724 1.77 0.80 1.51 0.35
22,038 41,305 14,061 1.81 0.76 1.42 0.48
21,904 43,660 21,822 1.82 0.70 1.39 0.69
21,844 46,667 33,813 2.05 0.64 1.36 0.98
22,781 48,882 26,349 1.85 0.64 1.37 0.74
23,591 50,560 29,378 1.76 0.66 1.41 0.82
TABLE 2.3 MAIN INCOME STATEMENT ITEMS RELATIVE TO AVERAGE TOTAL ASSETS (ATA)
SOURCE: Banco de España.

91RepoRt on the financial and banking cRisis in spain, 2008-2014
Nevertheless, the item with the biggest impact on net income on the income statement was undoubtedly the growth of provisions over the period, which rose due to the increase in non-performing assets (see Chart 2.20 and Table 2.3). Whereas in December 2005 provisions came to just 0.26% of average total assets (ATA), in December 2009 they reached 0.98%, averaging 0.81% over the period. Overall, impairment losses on the consolidated income statement came to €111 billion in the four-year period from 2008 to 2011.
Considering only business in Spain, the drop in profitability was even sharper, with losses already being registered in 2011 due to the performance of the savings banks, which suffered a bigger impact from provisions on their profit and loss account (€36 billion over the four-year period as a whole). The profitability of the financial sector was largely sustained during the period by the large Spanish banks’ foreign business.
F. Solvency
As of end-2007, changes took place in institutions’ solvency basically with a view to strengthening their highest quality capital or common equity Tier 1 (CET-1) position. Based on consolidated data (including foreign business), the solvency of both the commercial banks and savings banks improved, although there were two different types of adjustment: whereas the commercial banks increased their capital, at the savings banks the adjustment took place through a reduction in risk-weighted assets.
Across the financial system as a whole, over the four-year period from December 2007 to December 2011, Tier 1 capital increased by more than €41 billion, equal to 26% cumulative growth over the period.10 Over the same period, growth in total capital was somewhat lower, at €14 billion (6%). During this four-year period, financial institutions focused on bolstering their core capital, in an attempt to demonstrate the strength of their solvency position to the market. Thus, in line with the reduction in credit, the system’s risk-weighted assets (RWAs) dropped by €150 billion, or more than 7%, between December 2007 and December 201111 (see Chart 2.21).
The increase in capital and decrease in risk-weighted assets boosted the capital ratios, in particular the Tier 1 capital ratio, as this was the type of capital that had been strengthened most (see Chart 2.22). In particular, the total capital ratio increased by 154 bp, rising from 10.6% in December 2007 to 12.2% at end-2011, while the Tier 1 capital ratio rose by 271 bp (from 7.5% at end-2007 to 10.2% in December 2011).
10 �The reason for the bigger increase in Tier 1 capital than in total own funds was the reduction in Tier 2 funds, largely as a result of the decrease in general provisions and subordinated debt.
11 �The capital ratios are calculated by dividing the amounts of eligible own funds by risk-weighted assets, such that an improvement in these ratios may derive from either an increase in eligible own funds or a decrease in risk-weighted assets or a combination of both.
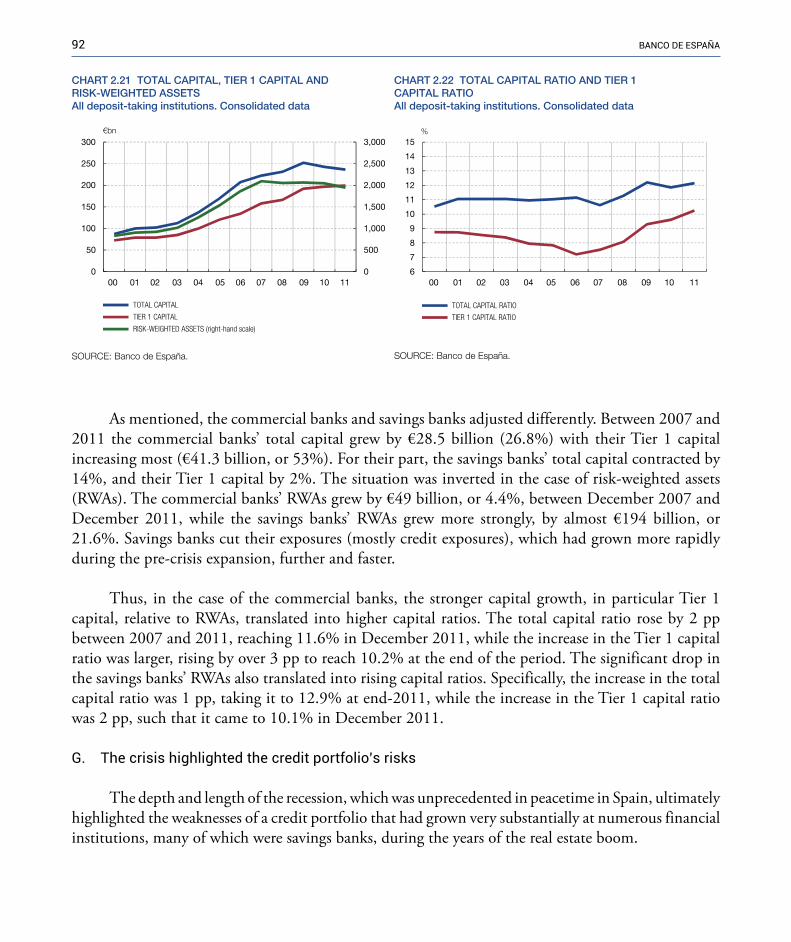
92 banco de españa
As mentioned, the commercial banks and savings banks adjusted differently. Between 2007 and 2011 the commercial banks’ total capital grew by €28.5 billion (26.8%) with their Tier 1 capital increasing most (€41.3 billion, or 53%). For their part, the savings banks’ total capital contracted by 14%, and their Tier 1 capital by 2%. The situation was inverted in the case of risk-weighted assets (RWAs). The commercial banks’ RWAs grew by €49 billion, or 4.4%, between December 2007 and December 2011, while the savings banks’ RWAs grew more strongly, by almost €194 billion, or 21.6%. Savings banks cut their exposures (mostly credit exposures), which had grown more rapidly during the pre-crisis expansion, further and faster.
Thus, in the case of the commercial banks, the stronger capital growth, in particular Tier 1 capital, relative to RWAs, translated into higher capital ratios. The total capital ratio rose by 2 pp between 2007 and 2011, reaching 11.6% in December 2011, while the increase in the Tier 1 capital ratio was larger, rising by over 3 pp to reach 10.2% at the end of the period. The significant drop in the savings banks’ RWAs also translated into rising capital ratios. Specifically, the increase in the total capital ratio was 1 pp, taking it to 12.9% at end-2011, while the increase in the Tier 1 capital ratio was 2 pp, such that it came to 10.1% in December 2011.
G. the crisis highlighted the credit portfolio’s risks
The depth and length of the recession, which was unprecedented in peacetime in Spain, ultimately highlighted the weaknesses of a credit portfolio that had grown very substantially at numerous financial institutions, many of which were savings banks, during the years of the real estate boom.
CHART 2.21 TOTAL CAPITAL, TIER 1 CAPITAL ANDRISK-WEIGHTED ASSETSAll deposit-taking institutions. Consolidated data
0
500
1,000
1,500
2,000
2,500
3,000
0
50
100
150
200
250
300
00 01 02 03 04 05 06 07 08 09 10 11
TOTAL CAPITAL
TIER 1 CAPITAL
RISK-WEIGHTED ASSETS (right-hand scale)
€bn
SOURCE: Banco de España.
CHART 2.22 TOTAL CAPITAL RATIO AND TIER 1CAPITAL RATIOAll deposit-taking institutions. Consolidated data
6
7
8
9
10
11
12
13
14
15
TOTAL CAPITAL RATIO
TIER 1 CAPITAL RATIO
%
SOURCE: Banco de España.
00 01 02 03 04 05 06 07 08 09 10 11

93RepoRt on the financial and banking cRisis in spain, 2008-2014
In line with how the economy progressed, with first a slowdown (2008) and then a very deep recession (2009), lending to the private sector continued to slow and then to contract, while the NPL rate began to rise at an ever-faster rate as the economy deteriorated. The 2009 recession was unusually intense, making it Spain’s severest since the Civil War. This seriously damaged businesses’ and households’ net worth, and created the conditions for the rise in non-performing loans that year.
The slower pace of GDP contraction in 2010 helped moderate the rate at which NPL ratios were rising, but the new recession in 2011, which proved persistent and worsened over the following two years, ultimately impaired deposit-taking institutions’ credit portfolios, in particular, those linked to the real estate development and construction sector, which suffered a sharp rise in NPLs and a credit squeeze, in line with the significant drop in prices and slump in activity in the Spanish real estate sector.
The continuously rising NPL rate and consequent specific provision requirements had an impact on financial institutions’ profit and loss accounts. This impact was more marked in the case of those financial institutions with most exposure to the real estate development and construction sector, which reduced their ability to generate profits and therefore the possibility of retaining earnings as reserves with which to build up capital. Private-sector debt reduction, together with refuge taken in government debt in the face of rising NPLs and deteriorating quality of demand for credit, led to a reduction in RWAs that boosted the solvency ratio, despite the fact that the capital (the numerator in these ratios) was growing more slowly, in particular, in the case of the savings banks, which were dependent on profits to increase their own funds, as they could not issue equity to bolster them.
2.3 INTERNATIONAL�REGULATORY�FRAMEWORK�
The international authorities reacted to the collapse of Lehman Brothers in September 2008 by adopting a series of initiatives, including a reform of financial supervision and regulation. The first step was to hold the first summit of G20 leaders at the head of state and government level in Washington in November 2008. The leaders at the meeting agreed on the need to adopt urgent exceptional measures to stabilise financial markets and undertook to reform the international financial system. The reform was given its general outline at this first summit, with more details being added following the second summit held in London in April 2009. This can be summarised as being on three main fronts: (a) changes to prudential banking regulations (microprudential and macroprudential regulations, including various measures on the treatment of systemically important financial institutions); (b) other regulatory reforms; and (c) bail-out measures for financial systems.
Implementation of the reforms began in 2008, based on a new institutional framework for international coordination of financial regulation and supervision. Within this framework the G20
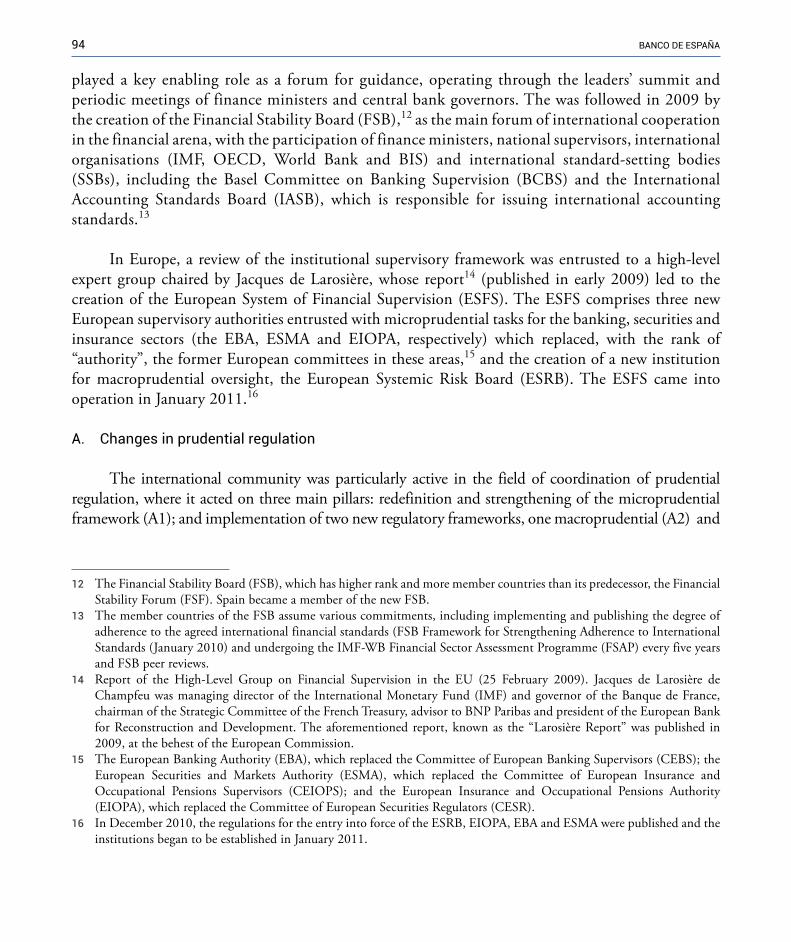
94 banco de españa
played a key enabling role as a forum for guidance, operating through the leaders’ summit and periodic meetings of finance ministers and central bank governors. The was followed in 2009 by the creation of the Financial Stability Board (FSB),12 as the main forum of international cooperation in the financial arena, with the participation of finance ministers, national supervisors, international organisations (IMF, OECD, World Bank and BIS) and international standard-setting bodies (SSBs), including the Basel Committee on Banking Supervision (BCBS) and the International Accounting Standards Board (IASB), which is responsible for issuing international accounting standards.13
In Europe, a review of the institutional supervisory framework was entrusted to a high-level expert group chaired by Jacques de Larosière, whose report14 (published in early 2009) led to the creation of the European System of Financial Supervision (ESFS). The ESFS comprises three new European supervisory authorities entrusted with microprudential tasks for the banking, securities and insurance sectors (the EBA, ESMA and EIOPA, respectively) which replaced, with the rank of “authority”, the former European committees in these areas,15 and the creation of a new institution for macroprudential oversight, the European Systemic Risk Board (ESRB). The ESFS came into operation in January 2011.16
A. Changes in prudential regulation
The international community was particularly active in the field of coordination of prudential regulation, where it acted on three main pillars: redefinition and strengthening of the microprudential framework (A1); and implementation of two new regulatory frameworks, one macroprudential (A2) and
12 �The Financial Stability Board (FSB), which has higher rank and more member countries than its predecessor, the Financial Stability Forum (FSF). Spain became a member of the new FSB.
13 �The member countries of the FSB assume various commitments, including implementing and publishing the degree of adherence to the agreed international financial standards (FSB Framework for Strengthening Adherence to International Standards (January 2010) and undergoing the IMF-WB Financial Sector Assessment Programme (FSAP) every five years and FSB peer reviews.
14 �Report of the High-Level Group on Financial Supervision in the EU (25 February 2009). Jacques de Larosière de Champfeu was managing director of the International Monetary Fund (IMF) and governor of the Banque de France, chairman of the Strategic Committee of the French Treasury, advisor to BNP Paribas and president of the European Bank for Reconstruction and Development. The aforementioned report, known as the “Larosière Report” was published in 2009, at the behest of the European Commission.
15 �The European Banking Authority (EBA), which replaced the Committee of European Banking Supervisors (CEBS); the European Securities and Markets Authority (ESMA), which replaced the Committee of European Insurance and Occupational Pensions Supervisors (CEIOPS); and the European Insurance and Occupational Pensions Authority (EIOPA), which replaced the Committee of European Securities Regulators (CESR).
16 �In December 2010, the regulations for the entry into force of the ESRB, EIOPA, EBA and ESMA were published and the institutions began to be established in January 2011.

95RepoRt on the financial and banking cRisis in spain, 2008-2014
another specific enhanced framework (A3) for systemically important financial institutions (SIFIs).17 As will be discussed below, in all these fields, and within the international framework, the EU has developed its own regulatory and supervisory initiatives and instruments, adapting them to the situation of the Economic and Monetary Union.
A.1 Microprudential framework: Basel III
At the behest of the G20, the Basel Committee on Banking Supervision (BCBS) developed the reforms to strengthen international standards on banking regulation. The first steps were taken in 2009 with a series of measures that were part of the set of reforms known as Basel II.5, including higher capital requirements for exposures in the trading book and for securitisation and resecuritisation transactions.
However, the bulk of the reforms were developed later, between 2010 and 2011, giving rise to a new regulatory framework known as Basel III, which introduced substantial changes to the preceding accord (Basel II) to improve its transparency and consistency. Basel III strengthened the regulation of the banks at individual level (microprudential regulation) so that they can withstand periods of stress better; it also introduced measures aimed at preventing and mitigating the risks that may build up in the banking sector as a whole (macroprudential regulation).
On the microprudential level, Basel III established stricter liquidity and capital quality requirements, setting the minimum Tier 1 capital requirement at 6%, with a minimum of 4.5% for the highest-quality capital (CET-1).18 It also established a further series of requirements, such as an additional capital conservation buffer of 2.5%, a parallel leverage ratio independent from the RWA-based capital requirements, and minimum liquidity standards (both short and medium/long term). These measures are being phased in over the period from 2013 to 2018 (see Box 2.2).
A.2 Macroprudential framework19
One of the main lessons of the global financial crisis was the inadequacy of a regulatory framework based solely on monitoring individual institutions, as it failed to allow for proper control
17 �G-SIFI: Global-SIFI.18 The Basel II framework did not establish an explicit minimum CET-1 capital requirement, but it was understood that at
least 2% of RWAs should be made up of CET-1 capital (CET-1 did not exist as such in Basel II, but a similar concept, that of core capital, did).
19 �The aim of macroprudential policy is to help safeguard the stability of the financial system as a whole. In particular, it aims to develop and apply instruments that make it possible to temper and address the systemic risks that develop over the course of the credit cycle (time dimension). It also aims to address the impact on systemic risk arising out of financial institutions’ size, complexity and interconnectedness (cross-cutting structural dimension).
96 banco de españa
of the risks building up across the financial system as a whole.20 Thus, following the London summit in April 2009, the G20 promoted a reconfiguration of the regulatory systems to facilitate the identification and consideration of macroprudential risks. On the international level, the FSB, IMF and BIS prepared progress reports on the frameworks and tools, identifying best practices in macroprudential policy.21 These reports highlighted that macroprudential frameworks need to be tailored to each country’s conditions, as there is no standard configuration that matches all national situations. Nevertheless, they did identify a series of common challenges in terms of systemic risk, evaluation of new tools in various situations, the establishment of institutional frameworks, and governance to implement macroprudential policy.
In the regulatory realm, as Box 2.2 shows, Basel III also established specific macroprudential regulations, in particular, the introduction of a countercyclical capital buffer and an additional buffer for financial institutions classed as being of systemic importance.
In the EU, the European Systemic Risk Board (ESRB) came into operation in 2011 with the participation of national and European authorities, including the ECB, which hosted its secretariat.22 This developed into the reference European forum for discussion of issues of macroprudential oversight, performing an important analytical role, and discussing risks and possible sources of vulnerability in the financial system. The ESRB also coordinates national macroprudential measures implemented in the EU, mainly in the framework of the solvency regulations applicable to credit institutions, which transpose global standards agreed by the BCBS into national legislation.
Although the ESRB does not have binding powers over EU Member States, it can decide to issue formal acts such as warnings of systemic risks and recommendations for voluntary compliance by the authorities in each country. Since its creation, the ESRB has prepared some ten recommendations,23 covering topics as diverse as the establishment of national macroprudential authorities, granting loans in foreign currencies and setting countercyclical buffer rates. It has also issued warnings about risks in the residential property sector in eight European countries24 (not including Spain).
20 �In 2008, the Financial Stability Forum (FSF) began to point in this direction with a report on the elements contributing to increased procyclicality (Report of the Financial Stability Forum on Enhancing Market and Institutional Resilience). This was followed in 2009 with a series of recommendations to reduce procyclicality, including mechanisms allowing resources to be built up at times of economic prosperity so they could be released during situations of economic and financial stress (Recommendations for Addressing Procyclicality in the Financial System, April 2009).
21 �Macroprudential policy tools and frameworks. Update to G20 Finance Ministers and Central Bank Governors – FSB, IMF and BIS (March 2011). Macroprudential policy tools and frameworks. Progress report to G20 – FSB, IMF and BIS (October 2011).
22 �National authorities (central banks, bank, securities and insurance supervisory authorities) and Community bodies (ECB, the European Commission, EBA, ESMA, EIOPA and the Economic and Financial Committee) all participate in the ESRB. The ESRB also has an advisory committee of academics.
23 https://www.esrb.europa.eu/mppa/recommendations/html/index.en.html24 https://www.esrb.europa.eu/mppa/warnings/html/index.en.html

97RepoRt on the financial and banking cRisis in spain, 2008-2014
box 2.2 MAIN ELEMENTS oF bASEL III
Microprudential reform:
— Improvement in the definition and quality of ordinary capital and asset risks. The new definition of capital is stricter, in that some hybrid instruments have ceased to be recognised as part of the highest-quality capital, common equity Tier 1 (CET-1) capital, for example. It also tightens the definition of Tier 1 and Tier 2 capital.
— Increased minimum capital requirement. Thus, for CET-1 capital, the minimum requirement is set at 4.5% of RWAs. The requirement rises to 6% (minimum Tier 1 capital ratio) when additional Tier 1 capital is added, and to 8% (total capital ratio) when Tier 2 capital is added.
— Establishment of an additional capital conservation buffer of 2.5% for CET-1 above the minimum capital requirements for absorption of losses in times of stress and to ensure banks remain able to lend to the real economy.
— Improvement in how risks are reflected by changing the treatment of market risk, off-balance-sheet operations, securitisation transactions, and requirements for the calculation of counterparty credit risk exposures. A framework of large exposure limits was also developed in order to curb the excessive concentration of risk, by capping banks’ overall exposure with each individual counterparty at a maximum of 25% of their Tier 1 capital. If the institution is a global
systemically important bank (G-SIB), its exposure to any other G-SIB may not exceed 15% of its Tier 1 capital.
— Introduction of a minimum leverage ratio of 3%, calculated as the ratio between banks’ Tier 1 capital and their total assets, including off-balance sheet transactions, independently of the risks of these exposures (unlike the capital requirements, which are set relative to RWAs).
— Introduction of two minimum liquidity standards: (i) the liquidity coverage ratio (LCR), whereby banks hold sufficient liquid assets to meet short-term liquidity needs in the event of episodes of market stress; and (ii) the net stable funding ratio (NSFR), which requires that banks hold a minimum level of stable funding sources relative to the degree of liquidity of their assets.
Reforms on the macroprudential level
— A countercyclical capital buffer was established in order to prevent and mitigate systemic risks of a cyclical nature that may be caused by excessive credit growth at the aggregate level.
— For institutions classed as being systemically important (see Section A.3), an additional capital buffer was established to address the externalities associated with their size, complexity and interconnectedness.
98 banco de españa
A.3 Systemically important institutions
The G20 also promoted the development of a differentiated regulatory framework for systemically important financial institutions (SIFIs),25 which in the case of systemically important banks, are identified as global systemically important banks (G-SIBs). These are banks that would represent a serious risk for the financial system as a whole if their viability were in danger, because of the complexity, scale and importance of their systemic connections. This means they raise a problem of moral hazard, being referred to as “too big to fail”.
Work in this area was led by the FSB26 with the publication of a series of reports that resulted in the introduction of legislative and institutional changes. In 2010, it published the regulatory framework of reference to strengthen the requirements applicable to SIFIs,27 comprising three types of additional measures for these financial institutions, over and above the standards laid down for other institutions: additional requirements to increase their loss-absorbing capacity, standards and requirements for the resolution of institutions of this type, and recommendations for more thorough and effective supervision. This framework has been in the process of being phased in since 2010 (see Box 2.3), focusing in particular on the banking segment. The FSB, in conjunction with the BCBS, has published a list of G-SIBs since 2011. This list comprises approximately thirty institutions.28
Prudential regulation in euroPe
All these international standards and agreements on prudential regulation have been incorporated into the European legal system, mainly through Regulation 2013/575/EU (CRR) and Directive 2013/36/EU (CRD IV) on capital requirements (usually referred to jointly as CRR/CRD IV; see Box 3.1) and through Directive 2014/59/EU on bank recovery and resolution (BRRD; see Table 3.2). For their part, CEBS and then EBA have been developing this standard through their advisory role to the European Commission and the development of the associated legal instruments, such as technical standards and EBA guidelines.29
25 SIFIs include banks, insurance companies and other financial institutions.26 �In 2009, the FSB published a set of high level principles to strengthen cross-border cooperation (FSB Principles for Cross-
border Cooperation on Crisis Management, April 2009).27 Reducing the moral hazard posed by systemically important financial institutions- FSB (November 2010).28 The number of Spanish banks on the list of G-SIBs has been one or two, depending on the year.29 �The guidelines prepared include: Technical advice on liquidity risk management (2008), Guidelines on Liquidity Buffers
and Survival Periods (2009), Guidelines on the revised large exposures regime (2009), Guidelines on Hybrid Capital Instruments (2009), Guidelines on Remuneration Policies and Practices (2010), Guidelines on the management of concentration risk under the supervisory review process (2010), Guidelines on Internal Governance (GL 44) (2011).
99RepoRt on the financial and banking cRisis in spain, 2008-2014
One of the priority lines of action on the international scale in 2010, and particularly in 2011, was the development of a framework for the treatment of systemically important financial institutions, particularly in the banking sector (G-SIBs). The objective was to develop a framework proportionate to these institutions’ greater potential risk of destabilisation. The main initiatives during the period are outlined below:1
November 2010: the FSB published its recommendations2 for more thorough and effective supervision of SIFIs, based on stronger supervision mandates, more resources and powers and higher supervisory expectations in relation to risk management, governance and internal controls.
November 2011:
— The FSB published the framework document for SIFIs,3 which envisaged the development of: (i) essential attributes of resolution frameworks; (ii) evaluation methodologies; and (iii) measures to strengthen the intensity and effectiveness of the supervision of SIFIs.
— The BCBS published a framework4 for the evaluation of global systemically important banks (G-SIBs), establishing the capital
surcharge system they need to comply with in order to ensure they have greater loss-absorbing capacity. This requirement must be met with highest-quality capital (CET-1) and may vary between 1% and 2.5% of RWAs, depending on the institution’s degree of systemic importance (to avoid institutions increasing their systemicity, a surcharge of up to 3.5% may be applied, if necessary). At the same time, the FSB published an initial list of G-SIBs,5 prepared by the BCBS using its own methodology. The list is updated annually.
— The FSB published a new international standard to promote the adoption of effective resolution frameworks (Key Attributes).6 The standard establishes specific requirements for G-SIFIs and their competent authorities, such as: (a) the preparation of recovery and resolution plans; (b) performing evaluations of their resolution capacity; and (c) the need to establish agreements to prepare and enhance cooperation between resolution authorities in different jurisdictions at times of crisis. It also establishes the key principle that, in the event of collapse of a financial institution, shareholders and creditors should assume a large share of the costs of its recapitalisation (a process referred to as bail-in).
box 2.3 REgULAToRY FRAMEwoRk FoR SYSTEMICALLY IMPoRTANT FINANCIAL INSTITUTIoNS (2010-2011)
1 See Report on Banking Supervision in Spain, Banco de España, 2011.
2 Intensity and Effectiveness of SIFI Supervision Recommendations for Enhanced Supervision – FSB (November 2010).
3 Policy Measures to Address Systemically Important Financial Institutions - FSB (November 2011).
4 Global systemically important banks: Assessment methodology and the additional loss absorbency requirement – BCBS (November 2011).
5 Included in the document Policy Measures to Address Systemically Important Financial Institutions - FSB (November 2011).
6 Key Attributes of Effective Resolution Regimes for Financial Institutions – FSB (November 2011). Document updated in October 2014 to incorporate sectoral annexes to promote its implementation in non-bank financial institutions (such as insurance companies or market infrastructures).
100 banco de españa
Two further CEBS initiatives are also worth noting: the development of stress tests and the banking sector recapitalisation exercise. The CEBS ran several stress tests30 on the European banking system as a whole as part of the general strategy to strengthen and rebuild financial institutions’ balance sheets. The first of these took place in 2009 at the behest of the ECOFIN Council, looking at a sample of 22 cross-border banks from which aggregate data were obtained. In subsequent years (2010 and 2011) the sample was expanded and the individual results obtained for each bank were published in order to bolster market discipline on financial institutions.
Lastly, the resurgence of the sovereign debt crisis in the autumn of 2011 led the EBA to run a banking system recapitalisation exercise, which began in late 2011. The EBA conducted an in-depth analysis of 71 European banks in order to detect their possible capital shortfalls. In the light of its findings, the EBA issued Recommendation EBA/REC/2011/1 (08/12/2011), urging banks to reach a 9% Core Tier 1 ratio by June 2012, and requiring banks with a shortfall to submit capital plans enabling them to comply with the recommendation.
B. other elements of the regulatory framework
Together with the pillars of prudential regulation (micro- and macroprudential and SIFIs), the G20 also promoted a series of additional regulatory reforms aiming to curb an excessive accumulation of risks in the financial system, developed, on the international level, by the FSB in coordination with the Basel Committee and other international standard-setting bodies (SSBs), and in Europe by the CEBS and, at the end of the period, by the EBA. This comprised a broad range of measures, including in particular: (i) measures to harmonise accounting standards; (ii) remuneration policies; and (iii) regulation of shadow banking.
(i) Strengthening and harmonisation of international accounting standards. The international financial crisis highlighted the weaknesses of the “incurred-loss” model used by the International Accounting Standards Board (IASB) and the Financial Accounting Standards Board (FASB) in their standards for the recognition and estimation of loan loss provisions. This model was criticised for doing “too little, too late” given the lateness and inadequacy of the provisions it recognised.
As a result of the foregoing, the G20,31 prudential supervisors and the markets asked international accounting regulators to replace the “incurred-loss” model with an
30 Section 2.5(C) below summarises the scope of these tests in Spain. 31 Improving Financial Regulation - FSB (September 2009).

101RepoRt on the financial and banking cRisis in spain, 2008-2014
“expected loss” model. In response, in 2014 the IASB published IFRS 9 and the US accounting regulatory body, the FASB, published its equivalent standard in 2016. The international standards will be obligatory in 2018, while the US standards will be applicable as of 2020 or 2021, depending on the characteristics of the financial institution.
In the incurred loss model applicable during the financial crisis, and, as mentioned, still in effect, provisions are recognised when there is objective evidence of impairment (such as arrears on the loan or the borrower being made redundant). The requirement for a trigger event for the recognition of provisions led many financial institutions to fail to cover the risk of default on their performing exposures adequately. The new expected loss model will require recognition of provisions for all credit risk exposures, including those which have not yet suffered an event of default.
(ii) Best practices on remuneration and corporate governance. The analysis of the causes of the financial crisis suggests that it was exacerbated by excessive remuneration policies, which had driven a disproportionate risk appetite. In this connection, the FSB published a set of standards on compensation,32 while in Europe the Capital Requirements Directive (CRD III) laid down standards to control and correct this phenomenon and the CEBS drew up guidelines.33 The aim was to promote more prudent risk management and make compensation policies subject to effective governance and supervision mechanisms, through measures such as: 1) effective independent oversight of compensation policies and practices by the board of directors; 2) the relationship between variable compensation, the institution’s profits and the need to maintain a sound solvency position; 3) imposing limits on guaranteed bonuses;34 4) the composition and qualification of management bodies; 5) enhancing transparency; and 6) strengthening supervision in this area, including the imposition of penalties where necessary.
(iii) Strengthening the regulation and monitoring of non-banking sectors. The build-up of risks outside the banking industry35 had serious consequences when the crisis
32 Principles for Sound Compensation Practices – Implementation Standards – FSB (September 2009).33 Guidelines on Remuneration Policies and Practices (2010), Guidelines on Internal Governance (GL 44) (2011).34 �A bonus is a variable salary complement linked to productivity, i.e. the payment is normally conditional upon meeting
certain targets that are set in advance. 35 �For example, the collapse of two Bear Stearns hedge funds in the summer of 2007, the recapitalisation of AIG (an insurance
group) and the collapse of Lehman Brothers in September 2008.
102 banco de españa
broke, leading the G20 to back measures to avoid the risk of banking activities migrating to unregulated, or less regulated, financial system players or mechanisms (shadow banking).
The January 2010 Joint Forum report36 noted that the increased requirements on banks in response to the crisis could result in typical banking risks being driven out of the banking sector,37 and to avoid this it established a series of recommendations. In 2011 the FSB began a project to monitor the risks that were building up outside the banking sector, and since then it has led work in this area.38 As a result of the FSB’s recommendations, regulatory measures were developed to address the risks associated with securitisation transactions39 or interconnections between banks and other institutions (for example, through improvements in the rules on the consolidation of off-balance sheet entities and enhancements to prudential regulations).
(iv) Other regulatory measures. The G20 backed other measures aimed at: a) reflecting the risk assumed in the form of OTC off-balance sheet derivatives transactions, including the obligation that they be traded on electronic platforms or exchanges, cleared through central counterparties (CCPs) and reported to central registers (trade repositories); b) reducing the dependency of banks, institutional investors and other market participants40 on risk ratings issued by credit rating agencies (CRAs); c) strengthening and relaunching securitisation operations41 (for example, by reviewing their prudential treatment, transparency and consolidation in the banking area) to bolster the provision of credit to the real economy; and d) improving the dissemination of public information and strengthening market discipline42 towards the end of 2012.
36 �Joint forum with representatives of the BCBS (banking), IOSCO (securities) and IAIS (insurance). Review of the Differentiated Nature and Scope of Financial Regulation – Key Issues and Recommendations - Joint Forum (January 2010).
37 �Credit intermediation with transformation of liquidity, maturities and leveraging, but without being subject to the banking prudential framework or having access to central bank liquidity or a deposit guarantee system.
38 �See, for example, the following FSB publications: Recommendations to Strengthen Oversight and Regulation of Shadow Banking (October 2011); Global Shadow Banking Monitoring Report (November 2012) and Policy Framework for Strengthening Oversight and Regulation of Shadow Banking Entities (August 2013).
39 �Unregulated Financial Markets and Products (September 2009) – IOSCO, Disclosure Principles for Public Offerings and Listings of Asset-Backed Securities (April 2010) – IOSCO.
40 �Principles for Reducing Reliance on CRA Ratings - FSB (October 2010). The road map for these principles envisaged eliminating CRAs’ ratings from standards, legislation and regulation and encouraging financial institutions to bolster their own internal credit assessment processes to replace ratings from agencies.
41 Improving Financial Regulation – FSB (September 2009).42 See medium-term actions on strengthening transparency and accountability (G20 Action Plan – Washington, 2008).
103RepoRt on the financial and banking cRisis in spain, 2008-2014
C. Financial system bail-out policies43
Governments of developed countries have deployed numerous measures to support the financial system since the onset of the financial crisis. These public interventions were not uniform, as they were shaped by the specific features of national financial systems –particularly financial institutions’ business models and their ability to absorb shocks– and also by the severity and duration of the economic crisis and the amount of fiscal leeway available in each country.44
Public support measures in the EU were subject to the conditionality criteria envisaged in EU law on State aid. Hence, countries that applied for financial support through the European Stability Mechanism were subject to enhanced conditionality with country-specific requirements. Given the severity of the crisis, the European Commission introduced a specific temporary framework in competition legislation to authorise financial support for the financial system. This was set out in the “Banking Communication” dated 13 October 2008, which enabled a concerted action plan to be deployed to bail out Europe’s financial systems.45 As time passed, the Commission revised this temporary framework, although it did not withdraw it altogether, and the conditions for the granting of State aid to the financial sector gradually became stricter. Finally, in 2013, following the experience of recapitalisation of the Spanish banking system, the Commission adopted the Communication currently in effect, which replaced the 2008 Banking Communication.46
Between October 2008 and October 2012, over 350 decisions were adopted in the EU regarding around 50 general schemes supporting the financial system and interventions affecting more than 90 financial institutions. The action plans envisaged a wide variety of measures, and in some cases the tools used to provide support were centralised through specific entities (either already existing or created specifically for this purpose), such as the SoFF (Sonderfonds Finanzmarktstabilisierung) in Germany, the
43 �For more information on these policies, see “The cost of interventions in the financial sector since 2008 in the EU countries”, Analytical Articles, Banco de España (6 April 2017).
44 �It should be noted that the causality between banking and fiscal problems can operate in both directions (in the case of Ireland, the banking crisis threatened to overwhelm the public finances, whereas in that of Greece, the country’s fiscal problems weighed down the banking sector), and they feed back into one another (as in the case of the loop between sovereign and banking risk in the European sovereign debt crisis).
45 �A further three Communications with more specific criteria were issued over the course of 2009: the Communication on recapitalisation in January 2009; the Communication on impaired assets in March 2009; and the Communication on restructuring in August 2009.
46 �In 2013 the European Commission raised the minimum requirements regarding bail-ins (whereby shareholders and creditors assume losses) and made authorisation of financial support conditional upon the existence of a restructuring plan, with the dual objective of speeding up the resolution process and better calibrating the minimum level of aid necessary. These changes were partly a response to the serious deterioration in public finances, and also to the need to incorporate considerations that would be applicable under the new common legislation on resolution (through the Bank Recovery and Resolution Directive, BRRD) to safeguard taxpayers’ interests.

104 banco de españa
SFEF (Société de Financement de l’Economie Française) in France, the HFSF (Hellenic Financial Stability Fund) in Greece or the FROB (Fondo de Reestructuración Ordenada Bancaria) in Spain.
The measures adopted by the various countries were of three main types:
(i) Liability guarantees and other liquidity measures. At the start of the systemic phase of the global crisis, in October 2008, measures were taken, such as guarantees for new bank debt issues (the most widely used measure) and various public systems were set up to provide the banks with liquidity, whether directly or indirectly through centralised State agencies (such as SoFFin in Germany and SFEF in France). In Spain, the Fund for the Acquisition of Financial Assets (FAFA) was set up to purchase high quality assets from banks.
(ii) Recapitalisations. A second line of support addressed the banks’ difficulties attracting private investors to finance the capital needs arising as a result of the impairment of the asset portfolio (initially structured products and, as the economic crisis progressed, credit portfolios) and the increased capital requirements established by the authorities in an attempt to restore confidence in the sector. This State aid in the form of capital injections took place both under the general schemes applicable to the banking sector as a whole and in response to specific operations at banks facing varying degrees of difficulty, which in some cases resulted in the partial or total nationalisation of some of them.
(iii) Asset write-down measures. In some cases, however, the capital injections were insufficient to resolve the situation of vulnerability, particularly at the height of the crisis of confidence (as in 2008, and later in the countries affected by the sovereign debt crisis) or at certain high-risk institutions. In these cases it was necessary to reduce the uncertainty over the value of the impaired assets and facilitate the restructuring of institutions through aid to build up their balance sheets. These measures included a range of mechanisms to segregate and insure portfolios of impaired assets, such as the Asset Protection Scheme in the United Kingdom in 2009 and the Spanish asset protection schemes, including systems to segregate and transfer these assets to vehicles, entities or institutions specifically for their management and liquidation. Within this latter category general schemes were designed for the sector, with the creation of ad-hoc structures to acquire impaired assets from various financial institutions, such as the National Asset Management Agency (NAMA) in Ireland (set up in late 2009), Sareb in Spain (created in 2012) or the Bank Assets Management Company (BAMC) in Slovenia (created in 2013).
Management and liquidation entities were also set up for specific banks, as in the case of WestLB (Erste Abwicklungsanstalt, in late 2009) or Hypo Real Estate (FMS Wertmanagement, in 2010) in Germany, which, despite being specific, involved the transfer of large portfolios of assets with a book value of 3% and 8% of German GDP,
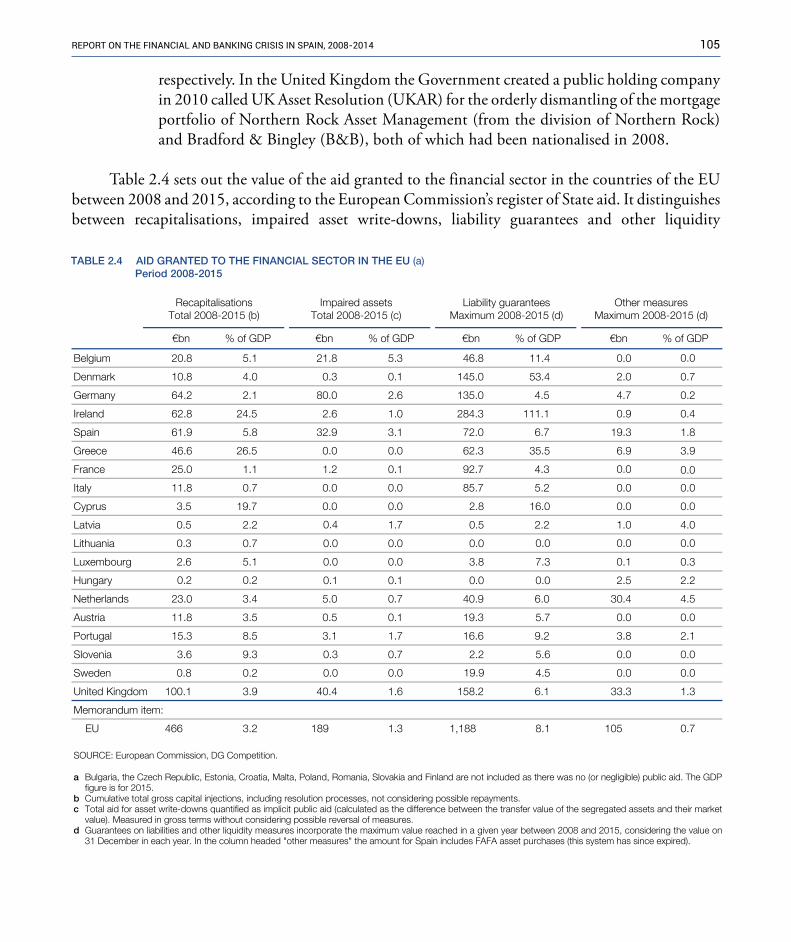
105RepoRt on the financial and banking cRisis in spain, 2008-2014
respectively. In the United Kingdom the Government created a public holding company in 2010 called UK Asset Resolution (UKAR) for the orderly dismantling of the mortgage portfolio of Northern Rock Asset Management (from the division of Northern Rock) and Bradford & Bingley (B&B), both of which had been nationalised in 2008.
Table 2.4 sets out the value of the aid granted to the financial sector in the countries of the EU between 2008 and 2015, according to the European Commission’s register of State aid. It distinguishes between recapitalisations, impaired asset write-downs, liability guarantees and other liquidity
SOURCE: European Commission, DG Competition.
a Bulgaria, the Czech Republic, Estonia, Croatia, Malta, Poland, Romania, Slovakia and Finland are not included as there was no (or negligible) public aid. The GDP figure is for 2015.
b Cumulative total gross capital injections, including resolution processes, not considering possible repayments.c Total aid for asset write-downs quantified as implicit public aid (calculated as the difference between the transfer value of the segregated assets and their market
value). Measured in gross terms without considering possible reversal of measures.d Guarantees on liabilities and other liquidity measures incorporate the maximum value reached in a given year between 2008 and 2015, considering the value on
31 December in each year. In the column headed "other measures" the amount for Spain includes FAFA asset purchases (this system has since expired).
€bn % of GDP €bn % of GDP €bn % of GDP €bn % of GDP
Belgium
Denmark
Germany
Ireland
Spain
Greece
France
Italy
Cyprus
Latvia
Lithuania
Luxembourg
Hungary
Netherlands
Austria
Portugal
Slovenia
Sweden
United Kingdom
Memorandum item:
EU
RecapitalisationsTotal 2008-2015 (b)
Impaired assetsTotal 2008-2015 (c)
Liability guaranteesMaximum 2008-2015 (d)
Other measuresMaximum 2008-2015 (d)
TABLE 2.4 AID GRANTED TO THE FINANCIAL SECTOR IN THE EU (a)Period 2008-2015
20.8 5.1 21.8 5.3 46.8 11.4 0.0 0.0
10.8 4.0 0.3 0.1 145.0 53.4 2.0 0.7
64.2 2.1 80.0 2.6 135.0 4.5 4.7 0.2
62.8 24.5 2.6 1.0 284.3 111.1 0.9 0.4
61.9 5.8 32.9 3.1 72.0 6.7 19.3 1.8
46.6 26.5 0.0 0.0 62.3 35.5 6.9 3.9
25.0 1.1 1.2 0.1 92.7 4.3 0.0 0.0
11.8 0.7 0.0 0.0 85.7 5.2 0.0 0.0
3.5 19.7 0.0 0.0 2.8 16.0 0.0 0.0
0.5 2.2 0.4 1.7 0.5 2.2 1.0 4.0
0.3 0.7 0.0 0.0 0.0 0.0 0.0 0.0
2.6 5.1 0.0 0.0 3.8 7.3 0.1 0.3
0.2 0.2 0.1 0.1 0.0 0.0 2.5 2.2
23.0 3.4 5.0 0.7 40.9 6.0 30.4 4.5
11.8 3.5 0.5 0.1 19.3 5.7 0.0 0.0
15.3 8.5 3.1 1.7 16.6 9.2 3.8 2.1
3.6 9.3 0.3 0.7 2.2 5.6 0.0 0.0
0.8 0.2 0.0 0.0 19.9 4.5 0.0 0.0
100.1 3.9 40.4 1.6 158.2 6.1 33.3 1.3
466 3.2 189 1.3 1,188 8.1 105 0.7
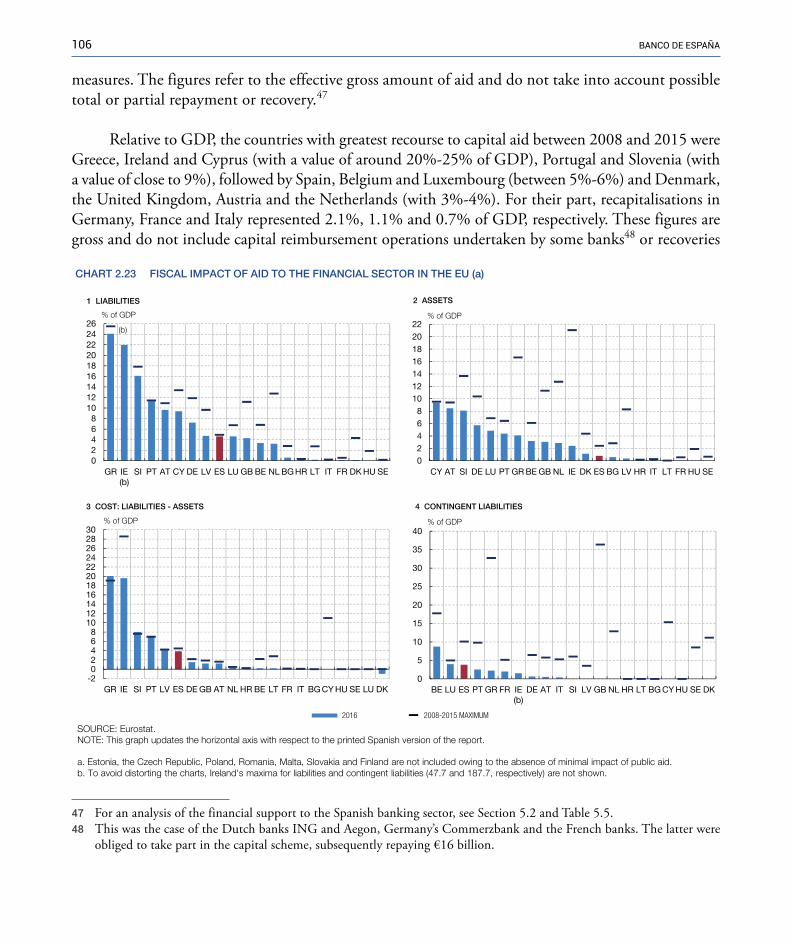
106 banco de españa
measures. The figures refer to the effective gross amount of aid and do not take into account possible total or partial repayment or recovery.47
Relative to GDP, the countries with greatest recourse to capital aid between 2008 and 2015 were Greece, Ireland and Cyprus (with a value of around 20%-25% of GDP), Portugal and Slovenia (with a value of close to 9%), followed by Spain, Belgium and Luxembourg (between 5%-6%) and Denmark, the United Kingdom, Austria and the Netherlands (with 3%-4%). For their part, recapitalisations in Germany, France and Italy represented 2.1%, 1.1% and 0.7% of GDP, respectively. These figures are gross and do not include capital reimbursement operations undertaken by some banks48 or recoveries
47 For an analysis of the financial support to the Spanish banking sector, see Section 5.2 and Table 5.5.48 �This was the case of the Dutch banks ING and Aegon, Germany’s Commerzbank and the French banks. The latter were
obliged to take part in the capital scheme, subsequently repaying €16 billion.
02468
10121416182022
CY AT SI DE LU PT GR BE GB NL IE DK ES BG LV HR IT LT FR HU SE
2 ASSETS
% of GDP
02468
101214161820222426
GR IE(b)
SI PT AT CY DE LV ES LU GB BE NL BG HR LT IT FR DK HU SE
1 LIABILITIES
% of GDP
(b)
0
5
10
15
20
25
30
35
40
BE LU ES PT GR FR IE(b)
DE AT IT SI LV GB NL HR LT BG CY HU SE DK
4 CONTINGENT LIABILITIES
% of GDP
CHART 2.23 FISCAL IMPACT OF AID TO THE FINANCIAL SECTOR IN THE EU (a)
-202468
1012141618202224262830
GR IE SI PT LV ES DE GB AT NL HR BE LT FR IT BG CY HU SE LU DK
3 COST: LIABILITIES - ASSETS
% of GDP
SOURCE: Eurostat.NOTE: This graph updates the horizontal axis with respect to the printed Spanish version of the report.
a. Estonia, the Czech Republic, Poland, Romania, Malta, Slovakia and Finland are not included owing to the absence of minimal impact of public aid.b. To avoid distorting the charts, Ireland's maxima for liabilities and contingent liabilities (47.7 and 187.7, respectively) are not shown.
2016 2008-2015 MAXIMUM

107RepoRt on the financial and banking cRisis in spain, 2008-2014
deriving from resolution processes. The largest impaired asset write-downs were made in Belgium (5.3% of GDP), Spain (3.1% of GDP) and Germany (2.6%).49
Chart 2.23 plots the figures at the end of 201650 (and the maximum levels reached since 2008) for: 1) the increase in government debt deriving from measures to support the financial sector (liabilities chart); 2) values of assets (not always at market prices) held by general government as a result of these measures (and which may generate future income),51 and 3) the net balance of liabilities and assets. The fourth panel of the chart shows the value of contingent liabilities, reflecting the potential additional costs in the case of collateral being foreclosed.
According to Eurostat the fiscal cost, approximated by public-sector indebtedness (net of assets), stood at 1.9% of GDP across the euro area as a whole at the end of 2016, with a wide range of variation between countries. Thus, Greece and Ireland are the countries which have taken on the most public debt (around 20% of GDP), followed by Slovenia and Portugal (7%-8% of GDP). This figure came to 3.8% of GDP in Spain’s case. However, the final cost of aid to the financial sector will not be fully quantified until the restructuring processes currently under way are completed and the public sector has freed itself from its remaining exposure to the banking sector.
2.4 REGULATORY�MEASURES�IN�SPAIN
During the period 2008-2011, the Spanish authorities fostered several initiatives under which, on the one hand, international reforms were adapted to the country’s financial system and, on the other, specific reforms were developed to tackle the crisis in Spain. During this period four major types of measures can be identified, adopted in chronological order (see Box 2.4 for the main regulatory changes of the period), as follows:
a) 2008: Measures aimed at strengthening the liquidity of financial institutions and the confidence of depositors and investors.
b) 2009: Financial sector restructuring and consolidation measures (FROB I).
c) 2010: Strengthening of the soundness of institutions and reform of the savings banks sector.
d) 2011: Strengthening of the solvency of credit institutions (FROB II).
49 �It is worth noting that in the case of transfers of problem assets, the implicit aid component is calculated as being the difference between the value at which the assets are transferred (which must be similar to a real value) and their market value (possibly below their real value, in a context of illiquid markets).
50 This report includes data updated for 2016 (the printed Spanish version of the report includes data for 2015).51 �The volume of assets was particularly large in countries where balance sheet restructuring had taken place through entities
belonging to the public sector, such as in Austria, Germany and the United Kingdom.

— 10 October 2008: Royal Decree-Law 6/2008 creating the Fund for the Acquisition of Financial Assets (FAFA).
— 10 October 2008: Royal Decree 1642/2008 reforming the deposit guarantee schemes.
— 13 October 2008: Royal Decree-Law 7/2008 on urgent economic-financial measures.
— 26 June 2009: Royal Decree-Law 9/2009 establishing the Fund for the Orderly Restructuring of the Banking Sector (FROB).
— 29 June 2010: Banco de España Circular 3/2010 amending Circular 4/2004 of 22 December 2004 on public and confidential financial reporting rules and formats.
— 9 July 2010: Royal Decree-Law 11/2010 on the reform of the savings banks sector.
— 18 February 2011: Royal Decree-Law 2/2011 on the strengthening of the solvency of credit institutions.
— 3 June 2011: Royal Decree 771/2011 amending Royal Decree 216/2008 of 15 February 2008 on the own funds of financial institutions, and Royal Decree 2606/1996 of 20 December 1996 on deposit guarantee schemes of credit institutions.
— 14 October 2011: Royal Decree-Law 16/2011 unifying the three deposit guarantee schemes.
— 30 November 2011: Banco de España Circular 5/2011 amending Circular 4/2004 of 22 December 2004 on public and confidential financial reporting rules and formats.
box 2.4 MAIN REgULAToRY ChANgES IN SPAIN, IN ChRoNoLogICAL oRDER (2008-2011)
108 BANCo DE ESPAñA
A. 2008: Measures to strengthen the liquidity of financial institutions and enhance depositor and investor confidence
As discussed earlier, the onset of the international financial crisis led to the adoption of extraordinary measures in the main economies, which aimed to improve the liquidity of credit institutions in response to the tension present in the wholesale capital markets. In Europe, the purpose of these measures was twofold: 1) to ensure appropriate liquidity conditions for the functioning of credit institutions that would improve lending conditions for households and firms, thereby mitigating the possible transfer to the real economy of the difficulties credit institutions were facing obtaining funding on the wholesale markets; and 2) to strengthen coverage of deposits, providing greater certainty and guarantees of protection to depositors and investors.
109RepoRt on the financial and banking cRisis in spain, 2008-2014
Measures to strengthen the liquidity of institutions
Although the impact of the first wave of the financial crisis was more limited in Spain, Spanish authorities developed two measures to improve liquidity in concert with the other euro area countries: the establishment of a fund for the acquisition of high-quality financial assets and the development of a system to grant State guarantees for certain issuances.
— Royal Decree-Law 6/2008 of 10 October 2008 created the Fund for the Acquisition of Financial Assets (FAFA), assigned to the Ministry of Economic Affairs and Finance. Initially, €30 billion was allocated to the fund,52 expandable to €50 billion,53 to invest in high-quality instruments issued by credit institutions holding as collateral new loans54 granted to individuals, firms and non-financial institutions. Acquisitions were made through an auction scheme. The objective of the Fund was to provide liquidity to credit institutions to encourage lending to firms and individuals.
The FAFA was a temporary measure that would, in principle, continue until the financial markets stabilised, although a deadline was set for the holding of auctions as at 31 December 2009. Between November 2008 and January 2009 four auctions were held which provided liquidity to 54 credit institutions for an amount in excess of €19 billion. The FAFA was wound down in June 2012 with a profit for the State of approximately €650 million arising from the interest on transactions granted (equal to an average yield of 3.45%)55.
— Royal Decree-Law 7/2008 of 13 October 2008 set up a mechanism for the granting of State guarantees within the framework of the concerted action plan among the euro area countries. This mechanism enabled the State to guarantee,56 on a temporary basis (until 31 December 2009) and under normal market conditions, new issues by credit institutions resident in Spain of financial instruments traded on official Spanish secondary markets.57 The total maximum amount that could be guaranteed was set at €100 billion for 2008. This Royal Decree-Law also authorised the Ministry of Economic
52 The contribution to the Fund was made with a charge to the State Budget.53 This maximum amount was reduced to €43.25 billion under Royal Decree-Law 9/2009 of 26 June 2009. 54 Credit granted after 7 October 2008.55 http://www.fondoaaf.tesoro.es/Doc/Nota%20prensa%20FAAF%20120601.pdf56 �These guarantees were granted by the Ministry of Economic Affairs and Finance and accrued a commission reflecting the
risk assumed by the State on each transaction. 57 The maximum term for these issues was 5 years.
110 banco de españa
Affairs and Finance (following a report from the Banco de España) to acquire, as an exception, eligible securities to strengthen credit institutions’ own funds. The volume of issues guaranteed by the State in 2008 and 2009 amounted to approximately €69.7 billion.58
Deposit protection
Royal Decree 1642/2008 of 10 October 2008 raised the maximum amounts guaranteed for deposits and investments by individuals from €20,000 to €100,000, ahead of the European regulations (Directive 2009/14/EC of 11 March 2009) promoting convergence among the different national deposit-guarantee schemes.59 The objective was to achieve greater depositor and investor confidence in the safety of balances at credit institutions at a time of notable difficulty, when the first effects of the crisis began to be seen.
B. 2009: Restructuring and consolidation measures for the sector: creation of the Fund for the orderly Restructuring of the Banking Sector (FRoB I)
In former banking crises, deposit guarantee schemes, together with the Banco de España, dealt with financial institutions’ individual crises. However, following the intervention of Caja de Ahorros de Castilla-La Mancha,60 and in view of the persistence of the crisis, the need to have the necessary financial capacity to promote an orderly restructuring of the Spanish banking system became apparent.
The FROB was created through Royal Decree-Law 9/2009 of 26 June 2009.61 The initial provision was €9 billion, with the possibility of funding itself in the market or receiving loans.62 It was governed by a Governing Committee consisting of eight members,63 five from the Banco de
58 �For further details, visit: http://www.tesoro.es/emisiones-avaladas-por-la-administraci%C3%B3n-general-del-estado-con-cargo-al-programa-2008 and http://www.tesoro.es/emisiones-avaladas-por-la-administraci%C3%B3n-general-del-estado-0.
59 �Spain set the minimum amount at €100,000 on the basis of the agreement reached by the Council of the European Union on 7 October 2008. This agreement gave rise to Directive 2009/14/EC which set the minimum amount guaranteed by the deposit-guarantee schemes at €50,000 (previously €20,000) and established a deadline that ended on 31/12/2010 to raise that amount to €100,000.
60 See Box 2.8.61 �Royal Decree-Law 9/2009 of 26 June 2009 on bank restructuring and strengthening of credit institution equity was amended
on several occasions: Royal Decree-Law 6/2010 of 9 April 2010, Royal Decree-Law 2/2011 of 18 February 2011, and Royal Decree-Law 2/2012 of 3 February 2012. It was finally repealed by Royal Decree-Law 24/2012 of 31 August 2012.
62 �The FROB was initially funded with €6.75 billion charged to the State Budget and €2.25 billion provided by the deposit guarantee schemes. The borrowed funds obtained by the FROB could not exceed three times the endowment capital existing from time to time (with the possibility of reaching ten times that amount, a limit which was reduced to a maximum of six times by Royal Decree-Law 2/2012).
63 �Under Royal Decree-Law 2/2011, the Governing Committee came to have nine members (of which two represented the Ministry of Economic Affairs and Finance, four were proposed by the Banco de España and three represented the deposit guarantee schemes).
111RepoRt on the financial and banking cRisis in spain, 2008-2014
España (whose Deputy Governor was the Chairman) and three others, each of whom represented one of the existing deposit guarantee schemes.
Objectives of the FROB
The FROB was set up with two objectives: (i) to manage the restructuring processes of credit institutions that had been unable to overcome their difficulties; and (ii) to strengthen the own funds of credit institutions involved in integration processes, if needed (and if so requested).
(i) Management of restructuring processes. The management model for the restructuring processes was based on the three then-existing deposit guarantee schemes and this new institution, and it had three phases:
1 A credit institution undergoing difficulties and in need of a restructuring process was first required to seek a private solution to resolve its problems and ensure its future viability. A private solution is defined as an operation involving no government agency or State aid of any kind.
2 If the credit institution was unable to find a private solution on its own to carry out the restructuring process required, it had the alternative of designing an action plan with aid from the deposit guarantee schemes. Such a plan, which required approval from the Banco de España, could entail three actions: (i) the strengthening of equity and solvency, (ii) a merger or takeover, and (iii) the full or partial transfer of the business. In these cases, the FROB could provide funding to the deposit guarantee schemes so that they could carry out the financial support functions included in the action plans.
3 If despite being in a weak position the credit institution failed to submit the above-mentioned plan or to comply with it once it had been approved, or if such a plan were not deemed viable in the supervisor’s opinion, the Banco de España could resolve to replace the management bodies of the credit institution concerned, appointing the FROB as its provisional administrator. In such an event, the FROB would have to submit to the Banco the España for approval a restructuring plan ultimately aiming at a merger of the institution or the full or partial transfer of the business.64 Also, the FROB was required to submit to the Ministry of Economic Affairs and Finance an economic report on the financial impact of the restructuring plan on the funding provided from the State Budget.
64 �In this case, the FROB could provide financial support to an institution, provided a restructuring plan were drawn up and always in keeping with the principle of the most efficient use of public resources.
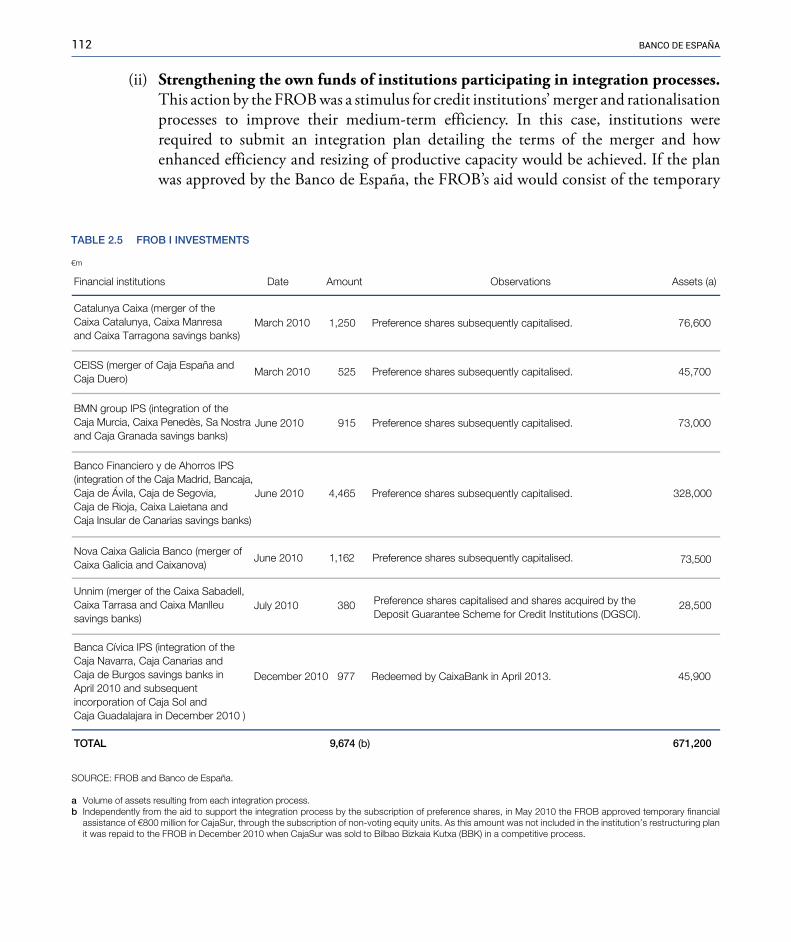
112 banco de españa
(ii) Strengthening the own funds of institutions participating in integration processes. This action by the FROB was a stimulus for credit institutions’ merger and rationalisation processes to improve their medium-term efficiency. In this case, institutions were required to submit an integration plan detailing the terms of the merger and how enhanced efficiency and resizing of productive capacity would be achieved. If the plan was approved by the Banco de España, the FROB’s aid would consist of the temporary
Assets (a)ObservationsAmountDateFinancial institutions
Catalunya Caixa (merger of theCaixa Catalunya, Caixa Manresaand Caixa Tarragona savings banks)
March 2010
CEISS (merger of Caja España andCaja Duero)
March 2010
BMN group IPS (integration of theCaja Murcia, Caixa Penedès, Sa Nostraand Caja Granada savings banks)
June 2010
Banco Financiero y de Ahorros IPS(integration of the Caja Madrid, Bancaja,Caja de Ávila, Caja de Segovia, Caja de Rioja, Caixa Laietana and Caja Insular de Canarias savings banks)
June 2010
Nova Caixa Galicia Banco (merger ofCaixa Galicia and Caixanova) 005,37Preference shares subsequently capitalised. 261,1June 2010
Unnim (merger of the Caixa Sabadell,Caixa Tarrasa and Caixa Manlleusavings banks)
July 2010 Preference shares capitalised and shares acquired by the Deposit Guarantee Scheme for Credit Institutions (DGSCI).
28,500
Banca Cívica IPS (integration of theCaja Navarra, Caja Canarias andCaja de Burgos savings banks inApril 2010 and subsequentincorporation of Caja Sol andCaja Guadalajara in December 2010 )
December 2010
4 (b)76,9LATOT 671,200
TABLE 2.5 FROB I INVESTMENTS
€m
SOURCE: FROB and Banco de España.
a Volume of assets resulting from each integration process.b Independently from the aid to support the integration process by the subscription of preference shares, in May 2010 the FROB approved temporary financial
assistance of €800 million for CajaSur, through the subscription of non-voting equity units. As this amount was not included in the institution’s restructuring plan it was repaid to the FROB in December 2010 when CajaSur was sold to Bilbao Bizkaia Kutxa (BBK) in a competitive process.
1,250 Preference shares subsequently capitalised. 76,600
525 Preference shares subsequently capitalised. 45,700
915 Preference shares subsequently capitalised. 73,000
4,465 Preference shares subsequently capitalised. 328,000
380
977 Redeemed by CaixaBank in April 2013. 45,900

113RepoRt on the financial and banking cRisis in spain, 2008-2014
acquisition of equity instruments issued by the institutions, such as preference shares or other instruments convertible into capital. The institution would undertake to repurchase these securities from the FROB as soon as possible; otherwise, they would be converted into capital,65 as finally occurred in most cases.
This second objective was the main focus of the FROB’s actions during a first phase known as FROB I (extending from inception of the FROB in 2009 until Royal Decree-Law 2/2011 was published, as mentioned later on in this report). The aid which the FROB undertook to provide to support the integration processes was based on the acquisition of preference shares. In this connection, FROB I’s investment amounted to €9,674 million,66 which is broken down in Table 2.5. The restructuring process was concentrated in the savings banks sector. Thus, after only three years, 46 groups of institutions existing at end-2007 decreased to 15 groups at end-2011.67
C. 2010: Strengthening of the soundness of institutions and reform of the savings bank sector
Strengthening of the soundness of credit institutions
In June 2010, an additional step was taken to strengthen the soundness of credit institutions through the entry into force of Banco de España Circular 3/2010 of 29 June 2010.68 The objective was for credit institutions to improve their credit transaction management policies in order to reduce non-performance,69 and to increase coverage of defaulted exposures and of assets foreclosed in satisfaction of debt (see Box 2.5). In the latter case, the intention was to encourage credit institutions to sell these assets in view of their increasing real estate portfolios.70
65 �If the buy-back had not taken place within five years from the disbursement or if the Banco de España considered it unlikely to occur, the institution could request that they be converted into capital.
66 �In addition to this amount, €800 million of non-voting equity units in CajaSur were purchased. See note (b) to Table 2.5 67 �These data do not include the Spanish Savings Bank Confederation (CECA), which not only acts as the Spanish savings
bank association, but also has a banking licence (currently operating under the name of Cecabank).68 �This Circular amended Banco de España Circular 4/2004, known as the accounting Circular.69 �Essential credit policy aspects were addressed which constituted ex-ante risk management principles. These included the
appropriate assessment of a borrower’s payment capacity, the role that collateral should have in analysing the granting of loans and management thereof, the adoption of an appropriate policy to establish the conditions for renegotiation of a borrower’s debts, and the need to be extremely prudent in the use of appraisal or similar values.
70 �Credit institutions did not wish to record losses on the sale of foreclosed properties, considering that their market price was lower than their carrying amount. Circular 3/2010 required an increase in coverage which, in principle, narrowed the distance between the carrying amount and potential market value, which meant that the institutions had to record the potential loss in case of sale, eliminating obstacles to such sale.
Prior to the circular, the estimated impairment of loans and receivables was calculated on the basis of a schedule that took into account how long a transaction was past-due (as the transaction became past-due for a longer period of time, provisioning increased). This schedule differed depending on whether or not the loans were secured and, if appropriate, depending on the nature of the security (there was a “long schedule” which extended full coverage of the exposure to six years for loans with real estate collateral on finished dwellings and a “short schedule” under which full coverage was achieved in 24 months in all other cases).
Circular 3/2010 unified these schedules into a single progressive schedule under which the exposure was fully provisioned once 12 months had
elapsed from its classification as non-performing, net of the value of any collateral securing the loan. This value, in the case of real estate collateral, was subject to certain conditions (the circular recognised real estate collateral for a first mortgage at the lower of the cost in the deed and the appraisal value, but applying a series of haircuts ranging from 20% in the case of finished houses used as the borrower’s principal residence to 50% for building lots and development land).
As regards the value of assets arising from foreclosures in payment of debt, the circular required provisioning therefor to increase in accordance with the number of months the foreclosed assets were in the portfolio (20% if the property was between 12 and 24 months in the portfolio and 30% from then on).
114 BANCo DE ESPAñA
box 2.5 CIRCULAR 3/2010 oN TIghTENINg oF PRoVISIoNINg REqUIREMENTS FoR PAST-DUE LoANS AND FoRECLoSURES.
Reform of the savings banks sector
The reform of the sector was begun with Royal Decree-Law 11/2010 of 9 July 2010. The persistence of the financial crisis and its particular impact on this sector made it necessary to establish a framework endowing it with greater flexibility to attract high-quality capital, adjust their operating structure and improve governance. The main elements of the reform were as follows:
(i) Measures promoting access to capital markets. These included the possibility of issuing equity units with voting rights71 and the obligation to list equity unit issues offered to the public in general on secondary markets. Additionally, the limits on ownership of equity units per unit-holder were abolished, enhancing acquisition flexibility.
71 The voting rights were to be exercised in proportion to the related share in equity.

115RepoRt on the financial and banking cRisis in spain, 2008-2014
(ii) Measures on institutional organisation alternatives to provide access to the market. Thus, savings banks could engage in their financial activity either by establishing a bank through which they would indirectly engage in banking business (maintaining their legal status as a savings bank or becoming a foundation) or by means of an Institutional Protection Scheme (IPS), which the savings bank would become a part of (section 2.5.B details these processes).
In the case of IPSs, the regulations then in force were characterised by the pooling of earnings, solvency and liquidity, and the creation of a system around a central credit institution that functioned as a central decision-making unit (see Box 2.6). These regulations were amended as follows:
— the commitment of permanence and stability of institutions in the IPS was strengthened by authorising the Banco de España to assess an institution before its withdrawal from the IPS in order to determine both its individual viability and that of the system as a whole, and
— the central institution was required to be a public limited company and at least 50%-owned by the savings banks.
(iii) Measures promoting greater professionalisation of savings banks’ governing bodies. These included the following:
— an adequate level of knowledge and experience was required of the members of the board and the oversight committee in the performance of their tasks,
— the maximum weight of public authorities in the governing bodies was reduced to 40% from the previous limit of 50%),72
— the incompatibility of elected politicians and high-ranking government officials was established, precluding their appointment as members of the governing bodies,
— savings banks were required to set up two new committees, the appointments and remuneration committee and the welfare projects committee, and
— with a view to reinforcing transparency and market discipline, all savings banks were required to publish a corporate governance report annually.
72 �Also, the possibility was established for the different regional governments to participate in savings banks’ governing bodies through members of renowned prestige and professionalism appointed by their regional parliament.

116 banco de españa
— Law 36/2007 of 16 November 2007 amending Law 13/1985 of 25 May 1985 introduced Institutional Protection Schemes (IPSs) for the first time. In 2008, Royal Decree 215/2008 (Art. 26(7)) and Banco de España Circular 3/2008 (Rule 15(5)) adapted IPSs to the framework of capital requirements for credit risk (in line with Directive 2006/48/EC). This rule permitted exposures to counterparties belonging to the same IPS to have a weighting of 0% under certain conditions.
— In 2010 Royal Decree-Law 6/2010 of 9 April 2010 once again amended Law 13/1985 by recognising that IPSs complying with certain requirements (stricter than stipulated by Royal Decree 215/2008 and Banco de España Circular 3/2008) could be considered as a consolidable group of credit institutions for capital requirement compliance purposes (Art. 8(3)(d)). The purpose of this reform was to “pave the way for integration agreements to be reached among a type of institutions (savings banks) which, given their corporate nature and complex governance, do not have the same flexibility as banks to close merger agreements”.1
It should be borne in mind that when it became essential to restructure the savings bank
sector, in an attempt to conduct a concentration process that would allow the sector to gain in efficiency and face the crisis with greater strength, stiff resistance to the disappearance of savings banks as individual institutions arose, as a result of the importance of their economic role in the territories where they operated, against a backdrop of significant representation of regional public authorities in their management bodies. The aim with IPSs was to meet the objectives of a merger without the individual institution disappearing, although it would be subordinated in the main management aspects to the IPS’s central body.
The basis of the reinforced IPSs, which were those used in restructuring the sector, was a contractual agreement among the participating institutions involving the assignment to a central institution of the capacity to establish and implement business strategies and internal and risk control tools. Participants also agreed to pool at least 40% of their liquidity, solvency and earnings, and that they should remain within the IPS for a minimum period of ten years, which could not be shortened without the Banco de España first analysing the viability of the outcome of such fragmentation. IPSs formed in this manner became consolidable groups of credit institutions dominated by a central institution which were, in essence, de facto mergers (“cold mergers”, as they were called) since, for economic, albeit not legal, purposes, each participant lost its individuality. Full pooling of liquidity, solvency and results was achieved at most of the IPSs formed.
box 2.6 INSTITUTIoNAL PRoTECTIoN SChEMES (IPSs)
1 Speech by the Deputy Governor of the Banco de España at the conference “Savings bank restructuring and institutional protection systems” organised by Caja de Ahorros de Granada http://www.bde.es/f/webbde/GAP/Secciones/SalaPrensa/IntervencionesPublicas/sub171210.pdf

117RepoRt on the financial and banking cRisis in spain, 2008-2014
D. 2011: Strengthening financial institutions’ solvency and other measures
Additional steps were taken in 2011 to strengthen the solvency of institutions, in line with the regulatory developments which the Basel Committee and the EU were coordinating (resulting in Basel III and CRR/CRD IV, see Section 2.3.A). In Spain these measures resulted in several regulations, including most notably Royal Decree-Law 2/2011 of 18 February 2011 on the strengthening of the Spanish financial system.
Royal Decree-Law 2/2011 of 18 February on the strengthening of the Spanish financial system
This included two main elements: (i) the new capital requirements regulation (in line with the new international regulatory framework) and (ii) a second FROB action phase (known as FROB II), extending its actions to participation in the shareholder structure of credit institutions, thereby supporting institutions having more difficulty meeting the new regulatory requirements.
(i) Capital requirements. The Royal Decree-Law sought to strengthen the level of solvency of national credit institutions, in line with the aims pursued by the revision of international standards which the Basel III accord entailed. On one hand, the notion was introduced of core capital as top-quality capital ensuring a high loss-absorption capacity. It comprised, among others, the following items: capital, reserves, share premium accounts, revaluation surpluses, minority interests (in the case of subsidiaries, the percentage of own funds held by natural or legal persons not belonging to the group) and, additionally, the instruments subscribed by the FROB. Revaluation losses and intangible assets were deducted from these items.
Additionally, institutions were required to achieve a minimum core capital of 8% of their risk weighted assets, or 10% in the case of institutions facing stronger constraints on raising quality capital when necessary.73 The deadline for this requirement was 10 March 2011 (practically one month after the publication of the Royal Decree-Law), with the possibility of establishing a strategy of phasing in compliance up to 30 September 2011 with the consent of the Banco de España (which could also authorise
73 �Basically, institutions with a wholesale funding ratio of over 20% and not having at least 20% of their capital held by third parties. The ratio was obtained by dividing the net wholesale funding of liquid assets by the amount representing credit to customers. Wholesale funding was the sum of: deposits at central banks and credit institutions, securities issued placed with wholesale or institutional investors and deposits from professionals in the financial sector or large firms, provided the balances were non-operating. Liquid assets available comprised cash balances at central banks, deposits at other credit institutions and debt and equity securities readily convertible into liquidity.
118 banco de españa
a further extension of up to three months in certain cases). In this connection, the institutions could undertake their recapitalisation to reach the minimum requirement through private investor fund-raising, stock market launches, corporate transactions or resorting to the FROB as allowed by this Royal Decree-Law.
The Royal Decree-Law also provided that, once the institutions had reached the new capital requirements, in the event of a short-term non-compliance of up to 20% of the required core capital ratio, the Banco de España could impose restrictions on the distribution of dividends, funding for welfare projects, the remuneration of preference shares and the variable compensation for directors and managers.
(ii) Establishment of the FROB II. In order to mitigate Spanish institutions’ difficulties accessing wholesale financial markets, the FROB’s role as a public instrument was adapted. For this purpose, provision was made for the FROB to be able give support through the acquisition of ordinary shares74 from institutions not meeting the required capital levels (and requesting such support), in such a way that the FROB would directly participate in the Board of Directors of the issuing institution in proportion to its percentage of ownership in the capital. The institution was required to submit a recapitalisation plan, including a business plan, and the undertaking of several commitments, such as the reduction of overheads, enhancement of corporate governance and the development of its lending activity.
The FROB could have a holding in the capital of a credit institution on a temporary basis and was required to sell the shares acquired under market conditions, either to the institution itself or to third parties, within five years.
Other additional measures to strengthen the solvency of credit institutions
— Royal Decree 771/2011 of 3 June 2011, addressing in particular: (i) the requirement for institutions to establish liquidity risk identification, measurement and monitoring systems, and (ii) the development of a new regime on remuneration policies and practices
74 �This requirement obliged the institution receiving support from the FROB to be a bank. Therefore, if the institution requesting such aid was a savings bank, it was required to transfer its financial activity within three months either to a bank through which it could indirectly engage in such activity (maintaining its legal status as a savings bank or becoming a foundation) or to a bank acting as a central institution of an institutional protection system which the savings bank would become a part of. Notwithstanding the above, in order for credit cooperatives to participate in this process if necessary, provision was made for the FROB to be able to acquire preference shares convertible into contributions to the share capital of such credit cooperatives.
119RepoRt on the financial and banking cRisis in spain, 2008-2014
aiming to avoid policies that would undermine the soundness of institutions and contribute to excessive risk-taking, establishing certain principles to be followed in connection with the remuneration of employees whose professional activities have an influence on the institution’s risk profile. Also, in the case of institutions receiving public aid for restructuring or balance sheet clean-up, additional specific requirements were defined which the remuneration schemes of these institutions were required to meet. This rule established for the first time a specific oversight capacity over aspects relating to credit institutions’ remuneration policy.
— Royal Decree-Law 16/2011 of 14 October 2011, unifying the three then-existing deposit guarantee schemes (for banks, savings banks and credit cooperatives) into a single scheme, and strengthening one of the functions traditionally being performed by the schemes, that of strengthening the solvency of institutions in difficulty. For this purpose, the scheme’s scope of operation was broadened allowing it to adopt preventive and balance-sheet clean-up measures75 within the framework of an institution’s restructuring plan, provided it was approved by the Banco de España.
— Banco de España Circular 5/2011 of 30 November 2011. In order to improve confidence in credit institutions through enhanced balance sheet reporting, the Circular established market transparency requirements for credit institutions with regard to their exposures to the real estate sector.76 They were required to disclose (at individual and consolidated level) qualitative and quantitative information on such exposures.77
Overall, these measures form a general strategy of strengthening of solvency and, if appropriate, restructuring of financial institutions. Box 2.7 summarises the main regulatory developments approved from 2009 in this field.
75 �These measures could consist of: (i) financial assistance in the form of the granting of soft loans or the acquisition or impaired or non-performing assets (ii) capital restructuring of the institution, (iii) support to merger processes or the transfer of a business to another credit institution; and/or (iv) improvement of management.
76 �Transparency, which the Banco de España had already recommended to institutions in 2010. In November of that year, a letter was sent to professional associations asking institutions to disclose information on their exposure to the construction and development sector and to retail mortgages following a previously defined template and to make public the policies set in place to deal with the sector’s troubled assets.
77 �In particular, as regards financing to construction, real estate development and housing purchases, as well as foreclosed assets in payment of debt.
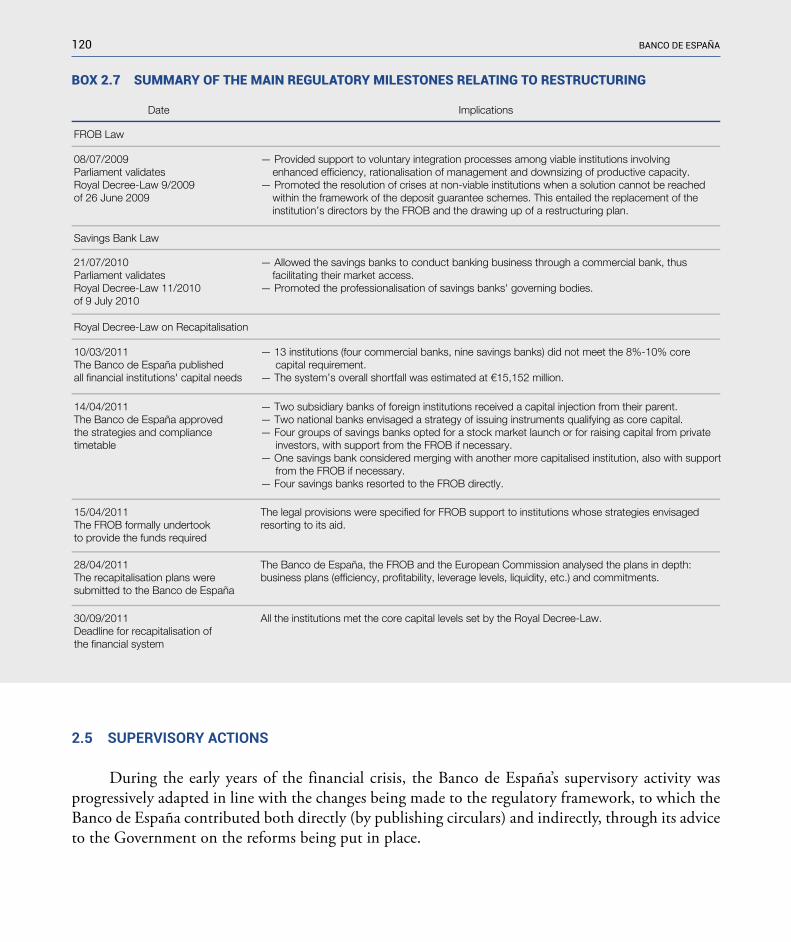
120 BANCo DE ESPAñA
box 2.7 SUMMARY oF ThE MAIN REgULAToRY MILESToNES RELATINg To RESTRUCTURINg
ImplicationsDate
FROB Law
08/07/2009 Parliament validates Royal Decree-Law 9/2009 of 26 June 2009
— Provided support to voluntary integration processes among viable institutions involving enhanced efficiency, rationalisation of management and downsizing of productive capacity. — Promoted the resolution of crises at non-viable institutions when a solution cannot be reached within the framework of the deposit guarantee schemes. This entailed the replacement of the institution’s directors by the FROB and the drawing up of a restructuring plan.
Savings Bank Law
21/07/2010 Parliament validates Royal Decree-Law 11/2010 of 9 July 2010
— Allowed the savings banks to conduct banking business through a commercial bank, thus facilitating their market access. — Promoted the professionalisation of savings banks' governing bodies.
Royal Decree-Law on Recapitalisation
10/03/2011 The Banco de España published all financial institutions' capital needs
— 13 institutions (four commercial banks, nine savings banks) did not meet the 8%-10% core capital requirement. — The system’s overall shortfall was estimated at €15,152 million.
14/04/2011 The Banco de España approved the strategies and compliance timetable
— Two subsidiary banks of foreign institutions received a capital injection from their parent. — Two national banks envisaged a strategy of issuing instruments qualifying as core capital.— Four groups of savings banks opted for a stock market launch or for raising capital from private investors, with support from the FROB if necessary.— One savings bank considered merging with another more capitalised institution, also with support from the FROB if necessary. — Four savings banks resorted to the FROB directly.
15/04/2011 The FROB formally undertook to provide the funds required
The legal provisions were specified for FROB support to institutions whose strategies envisaged resorting to its aid.
28/04/2011 The recapitalisation plans were submitted to the Banco de España
The Banco de España, the FROB and the European Commission analysed the plans in depth: business plans (efficiency, profitability, leverage levels, liquidity, etc.) and commitments.
30/09/2011 Deadline for recapitalisation of the financial system
All the institutions met the core capital levels set by the Royal Decree-Law.
2.5 SUPERVISORY�ACTIONS
During the early years of the financial crisis, the Banco de España’s supervisory activity was progressively adapted in line with the changes being made to the regulatory framework, to which the Banco de España contributed both directly (by publishing circulars) and indirectly, through its advice to the Government on the reforms being put in place.
121RepoRt on the financial and banking cRisis in spain, 2008-2014
In part, due to certain features of regulatory and supervisory policy (such as the treatment of structured vehicles and the existence of countercyclical provisions), the initial impact of the crisis (from late 2007 to the first half of 2008) was absorbed by the financial institutions without serious difficulty, although the existing imbalances were becoming more pronounced. The unfolding turmoil in the wake of the worsening international crisis in late 2008, which has been discussed in previous sections, led to the period 2009-2011 being marked by the consolidation of the savings banks sector.78 Several of the integration processes involved needed public support and some financial institutions received assistance on more than one occasion, as their future earnings forecasts deteriorated and their estimates of future impairments rose.
Strategy and course of action
From 2009, as the economic and financial conditions worsened, the outlook for the Spanish financial system became tougher, and the problem went from being one of liquidity, caused by the imbalance between deposits taken and increased lending, to one of solvency, deriving from the economic recession and its impact in terms of the rising NPL rate.
The crisis at the savings bank Caja de Ahorros de Castilla La Mancha79 in March 2009 brought about in a turning point in the strategy for restructuring of troubled institutions (basically savings banks), which was set out in Royal Decree-Law 9/2009, constituting the Fund for the Orderly Restructuring of the Banking Sector (FROB). This two-pronged strategy entailed a case-by-case study, giving priority to private solutions:80
78 �As mentioned elsewhere in this report, the savings banks sector faced a serious constraint on its ability to raise top-quality capital by any means other than through earnings, as the instrument available was that of non-voting equity units, which were relatively unattractive to investors, given their lack of voting rights. There was also resistance from governing bodies to steps of any kind that might result in the disappearance of the institution or its losing its independence by joining a group managed by another savings bank.
79 �This case influenced subsequent legislative developments as it involved a number of additional factors on top of the difficulties inherent in any restructuring: (i) the destabilisation of the institution before and after the intervention, with significant outflows of deposits that could only be stabilised with the adoption of a Royal Decree-Law (4/2009 of 29 March 2009) whereby the State guaranteed all the institution’s liabilities to avoid its collapse and contagion of the system. This led the Banco de España to grant emergency liquidity assistance (ELA) of €1.5 billion; and (ii) the financial sector’s scant appetite to buy the institution, as evidenced by the fact that just two offers were received, resulting in a high level of aid, although this was met by the DGS and the sector, and cost less than its liquidation would have done. All the foregoing took place in a context in which the savings bank’s general assembly remained the most senior governing body.
80 �Up until 2009, the model for resolving banking crises was based on the Banco de España’s taking control over the institution affected or replacing its directors. There was also the option of the sectoral deposit guarantee schemes lending funds to their member institutions. This approach, which had been followed since the banking crisis in the late 1970s and early 1980s (replacing the directors was first provided for by Royal Decree-Law 5/1978 and subsequently in Law 26/1988 of 29 July 1988; and the deposit guarantee schemes were created in 1977 when the private banks were established) suffered from a number of limitations. In particular, the financial capacity of the schemes had not been calibrated to address a systemic crisis, and extraordinary contributions could lead to contagion. Moreover, recapitalisation normally required the approval of the institution’s general assembly, and no provision had been made for special authority to be granted to allow emergency recapitalisation.
122 banco de españa
— Restructuring non-viable crisis-stricken institutions when no solution can be found within the framework of the deposit-guarantee scheme. This entailed the FROB’s replacing the institution’s directors and the drafting of a restructuring plan.
— Support for voluntary mergers between viable institutions to yield efficiency gains, rationalise their administration, and downsize their productive capacity.
Bearing in mind the lack of legal tools with which to apply resolution processes,81 this strategy was considered to be better than winding up insolvent institutions through insolvency proceedings, which experience had shown to result in a substantial loss of value. In particular, when there are thousands of creditors, as in the case of a credit institution’s depositors, liquidation through insolvency proceedings would almost certainly result in losses for the depositors concerned (over and above the amount guaranteed by the deposit guarantee scheme) as well as a paralysis of banking services, with the consequent negative impact on confidence in the system and the risk of contagion to the rest of the sector. Compared with winding-up through insolvency proceedings, the strategy of supporting institutions meant shoring up their viability by strengthening their regulatory capital and ensuring the continuity of their essential functions, so as to protect depositors,82 while minimising the cost in terms of public resources and the risk of contagion affecting the stability of the financial system as a whole. In this connection it is worth noting that the regulations on the resolution and restructuring of credit institutions did not come into effect until 2012. The new regulations opened up a new route for managing crisis-stricken institutions by offering an alternative to insolvency proceedings, when in the public interest (see Section 3.4.B.2).
Other alternatives, such as injecting public funds in the form of instruments not convertible into capital and without voting rights, without forcing the institution into a merger, or that of bailing out, restructuring and selling institutions considered non-viable, were ruled out, either because they only addressed the symptoms, without inducing the necessary restructuring (for example, as regards the governance of the savings banks), or because they would have required massive injections of public funds at a time when there had been a significant deterioration in the fiscal situation and the conditions under which the public sector could raise finance.
The strategy of supporting concentration and restructuring in the banking industry basically aimed to shore up confidence in the financial system and ensure its stability while safeguarding
81 �Resolution is understood to mean the set of measures adopted by the authorities to deal with a financial institution’s non-viability while safeguarding the public interest. The basic goals are to protect depositors and minimise the cost to taxpayers (compared to the insolvency proceedings normally used to wind up companies).
82 �Indeed, from the depositors’ point of view, this strategy made it possible to keep the entire value of their deposits intact. If crisis-stricken institutions had been wound up through insolvency proceedings, the DGS would only have covered €100,000 per depositor per institution. Depositors would have been forced to seek recovery for any amounts in excess of this limit through insolvency proceedings, with no guarantee whatsoever.

123RepoRt on the financial and banking cRisis in spain, 2008-2014
depositor protection. Table 2.6 summarises this strategy’s main objectives and instruments. Within this general framework, the steps taken by the Banco de España can be summarised as: (a) strengthening institutions’ solvency (balance-sheet clean-up and recapitalisation); (b) fostering restructuring of the system through voluntary mergers and the resolution of less viable institutions; and (c) improving information on the banking sector (through stress-tests).83
A. Enhancing Spanish credit institutions’ solvency
To address the financial sector restructuring and concentration process (see Section B, below), financial institutions were obliged to embark on a significant effort to clean up their credit portfolios so as to comply with the Banco de España’s accounting requirements. These included the 2010 reform to the rules on write-downs, which, among other things, significantly shortened the schedule for provisions, as mentioned earlier. Between January 2008 and December 2011 the volume of provisions set aside came to €138,353 million (13% of Spain’s GDP).84
83 �Section (D) summarises the figures on the adjustment to the financial system over the period 2008-2011.84 �Of this amount, €87,407 million was debited against the profit and loss account, €32,847 million was charged against reserves,
and €18,098 million came from general provisions (figures for business in Spain from the consolidated balance sheet).
TABLE 2.6 RESTRUCTURING PROCESS. OBJECTIVES
SOURCE: Banco de España.
GENERAL OBJECTIVES INSTRUMENTS
2 Downsizing the financial system — Integration of financial institutions— Capacity reduction plans
3 Encouraging the entry of private investors — Incentives for new private capital
4 Improving financial institutions' governance — Incentives for the conversion of savings banks
5 Reducing the cost to taxpayers — Stimulating the clean-up through integration processes— Entry of private investors
6 Reassuring the markets
— Increased solvency and recapitalisation requirements— Transparency:
· Detailed disclosure of each institution's exposure to property developer and real estate risk· Inclusion of the whole sector in the EU stress tests
1 Cleaning up financial institutions'balance sheets before recapitalising them
— Provisioning— Write-downs against reserves during mergers
FUNDAMENTAL OBJECTIVES — Maintaining confidence in, and stability of, the financial system— Ensuring depositor protection
124 banco de españa
In late 2010, as a result of the problems arising in the Irish banking sector, there was a second episode of the euro area sovereign debt crisis, which again placed a question mark over the capacity of the Spanish financial system. It was in this context, as mentioned in Section 2.4.D above, that Royal Decree-Law 2/2011 (new capital requirements and FROB II) was adopted, with the aim of strengthening the solvency of Spain’s financial institutions in order to dispel these doubts.
The Banco de España evaluated the additional capital each institution85 needed to reach the level of core capital required (8% and 10% of risk-weighted assets) and published its findings in March 2011. Thirteen institutions were identified as having a core capital shortfall and required to submit their recapitalisation strategies in which they were to set out the measures they intended to take to reach these levels.86 The strategies approved by the Banco de España in April 2011 were the following:87
— Four institutions opted to raise private capital, either by the incorporation of private investors, or through stock market launches whereby the institutions sought to place at least 20% of their share capital. In this case, a minimum core capital ratio of 8% would be sufficient for them to comply with Royal Decree-Law 2/2011. Bankia and Banca Cívica concluded their stock market flotation in July, raising €3,092 million and €600 million, respectively. Banco Mare Nostrum (BMN) issued convertible instruments with voting rights for €242 million and Liberbank, which initially opted to raise private capital, finally raised the necessary capital internally.
— Two institutions opted to recapitalise using additional funds provided by their foreign parents. These were Barclays Bank and Deutsche Bank.
— Two institutions undertook capital increases and corporate operations. These were Bankinter and Bankpyme.
— Caja España de Inversiones, Salamanca y Soria, Caja de Ahorros y Monte de Piedad –CEISS (resulting from the merger of Caja España and Caja Duero) opted for integration with Unicaja.88
— Four institutions (Novacaixagalicia, Catalunya Caixa, Caja de Ahorros Unión de Cajas de Manlleu, Sabadell y Tarrasa (Unnim) and Caja de Ahorros del Mediterráneo, CAM) requested
85 �This analysis covered all 114 credit institutions registered in Spain that were able to accept reimbursable funds from the public. 86 �Institutions had the option of adjusting their capital ratios through extraordinary operations of the types indicated in
Royal Decree-Law 2/2011 (by selling off branches, strategic shareholdings, or asset portfolios), which would reduce their initially estimated capital requirements if these operations materialised.
87 See the November 2011 Financial Stability Report for details. 88 The process was complex and did not reach fruition until 2014.
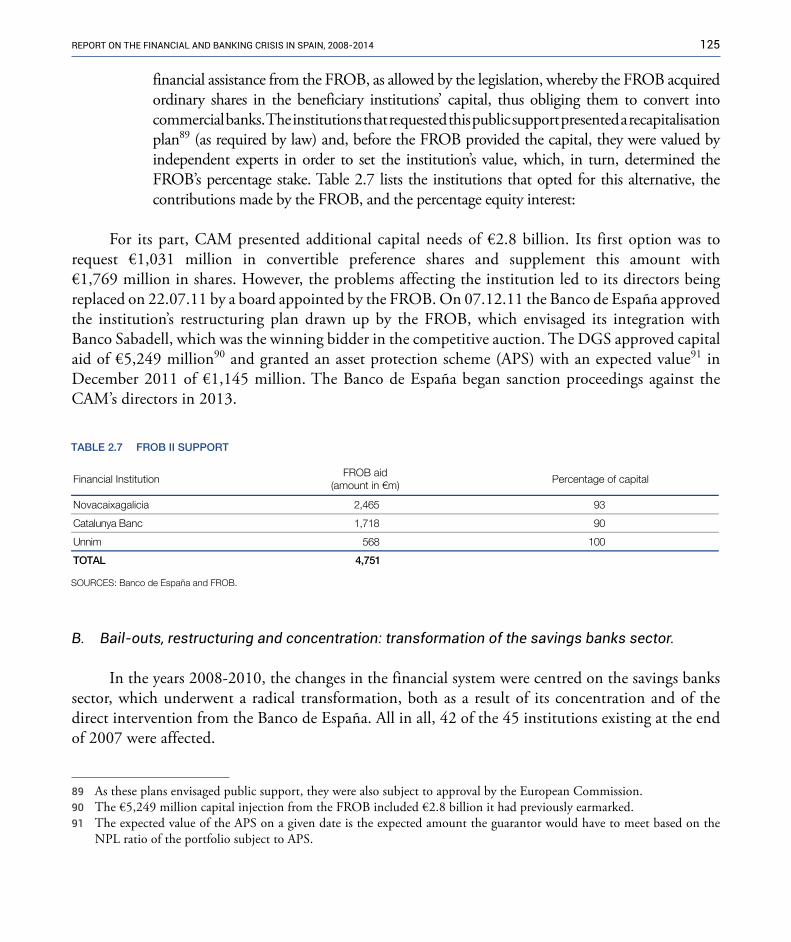
125RepoRt on the financial and banking cRisis in spain, 2008-2014
financial assistance from the FROB, as allowed by the legislation, whereby the FROB acquired ordinary shares in the beneficiary institutions’ capital, thus obliging them to convert into commercial banks. The institutions that requested this public support presented a recapitalisation plan89 (as required by law) and, before the FROB provided the capital, they were valued by independent experts in order to set the institution’s value, which, in turn, determined the FROB’s percentage stake. Table 2.7 lists the institutions that opted for this alternative, the contributions made by the FROB, and the percentage equity interest:
For its part, CAM presented additional capital needs of €2.8 billion. Its first option was to request €1,031 million in convertible preference shares and supplement this amount with €1,769 million in shares. However, the problems affecting the institution led to its directors being replaced on 22.07.11 by a board appointed by the FROB. On 07.12.11 the Banco de España approved the institution’s restructuring plan drawn up by the FROB, which envisaged its integration with Banco Sabadell, which was the winning bidder in the competitive auction. The DGS approved capital aid of €5,249 million90 and granted an asset protection scheme (APS) with an expected value91 in December 2011 of €1,145 million. The Banco de España began sanction proceedings against the CAM’s directors in 2013.
B. Bail-outs, restructuring and concentration: transformation of the savings banks sector.
In the years 2008-2010, the changes in the financial system were centred on the savings banks sector, which underwent a radical transformation, both as a result of its concentration and of the direct intervention from the Banco de España. All in all, 42 of the 45 institutions existing at the end of 2007 were affected.
89 As these plans envisaged public support, they were also subject to approval by the European Commission.90 The €5,249 million capital injection from the FROB included €2.8 billion it had previously earmarked.91 �The expected value of the APS on a given date is the expected amount the guarantor would have to meet based on the
NPL ratio of the portfolio subject to APS.
Financial InstitutionFROB aid
(amount in €m) Percentage of capital
39564,2Novacaixagalicia
09817,1BancaynulataC
001865m
SOURCES: Banco de España and FROB.
innU
157,4LATOT
TABLE 2.7 FROB II SUPPORT
126 banco de españa
CCM
Following a series of inspections in 2008 and 2009, a serious shortfall was detected in the provisions covering loan impairment, in conjunction with an unstable funding structure (increased recourse to wholesale markets as a result of continuous investment growth despite the steady decline in deposits and the worsening economic climate). At the same time, the governance framework was clearly deficient and the measures needed to shift away from the management model of the boom years had not been taken. This led to an unsustainable liquidity situation in which the institution’s rating was cut from BBB+ to BB+1 (Fitch) in February 2009, cutting it off from interbank funding. The situation was exacerbated by the lack of assets eligible as collateral with the European System of Central
Banks. In addition to the foregoing, the investment coverage needs led CCM to breach the solvency ratio, with two-year write-down forecasts that were impossible to meet, apart from showing a high concentration of exposures to two economic groups.
CCM accounted for less than 1% of the Spanish banking system’s assets. Solutions other than taking control of the savings bank had been sought through the DGS. However, these efforts proved fruitless, such that, given the breach of the required levels of capital and the financial outlook, on 28.03.092 the Executive Commission of the Banco de España resolved to replace CCM’s directors.3 In view of CCM’s precarious liquidity situation, in order to be able to provide the Banco de
box 2.8 FIRST INTERVENTIoNS bY ThE bANCo DE ESPAñA: CCM AND CAjA SUR
First interventions by the banco de esPaña: caja castilla-la Mancha and cajasur
During this period, the Banco de España had to replace the directors of certain institutions, such as Caja de Ahorros de Castilla-La Mancha (CCM) and CajaSur (although the circumstances were different in each case). In the latter case, the Banco de España intervened under the framework established by Royal Decree-Law 9/2009 mentioned earlier, which entailed appointing the FROB as the provisional administrator, thus streamlining the process of crisis management since the experience with CCM. In the case of both CCM and CajaSur, the Banco de España began disciplinary proceedings against the institutions’ directors (see Box 2.8).
1 The ratings given by rating agencies are an important factor in raising funds on the financial markets. If the rating drops below investment grade (BBB- in the case of Fitch and Standard & Poor’s) it is extremely difficult to obtain wholesale funding.
2 http://www.bde.es/f/webbde/GAP/SalaPrensa/Notas Informativas/09/Arc/Fic/presbe102.pdf
3 The Banco de España thus exercised its authority to take control of any credit institution pursuant to Article 31 of Law 26/1988 of 29 July 1988 on the discipline and intervention of credit institutions.
127RepoRt on the financial and banking cRisis in spain, 2008-2014
box 2.8 FIRST INTERVENTIoNS bY ThE bANCo DE ESPAñA: CCM AND CAjASUR (cont’d)
España with the collateral it needed to grant emergency liquidity assistance (ELA) of €900 million,4 and so meet the needs arising following the measures adopted, the Government enacted Royal Decree-Law 4/2009 of 29 March 2009 allowing a central-government guarantee of up to €9 billion to be given in 2009. With the backing of this guarantee, the Banco de España granted CCM the ELA for €900 million.
On 03.11.09 the Executive Commission of the Banco de España approved CCM’s draft proposal for its integration with Caja de Ahorros de Asturias. Finally, on 30.06.10 CCM’s general assembly approved the integration plans. The Deposit Guarantee Scheme5 decided to support the plans financially with capital aid of €1,740 million6 and an asset protection scheme (APS) with an expected value in December 2011 of €1,715 million.
CajaSur
The case of CajaSur was similar to that of CCM, the similarities including a shortfall in coverage of investments, excessive growth, an unstable financial structure and a rating downgrade. However, unlike CCM, in CajaSur’s case integration was possible (with Unicaja), in principle, enabling these problems to be solved. Nevertheless, after
various ups and downs, the board of directors rejected the proposed merger, without having a viable alternative plan. In the light of these problems, on 21.05.107 the Banco de España resolved to replace CajaSur’s directors and appoint the FROB as the provisional administrator. The FROB supported the institution with the subscription and disbursement of €800 million in non-voting equity units issued by CajaSur, thus giving the FROB control over the savings bank.
This took place under the new framework established by Royal Decree-Law 9/2009 and, therefore, with the participation of the FROB, which enabled a quicker, more flexible and efficient solution to be found than in the case of CCM, which was handled under the traditional framework (in which any rupture required the approval of the general assembly and the regional government).
On 15.07.10 a restructuring plan was approved that envisaged the acquisition of CajaSur by Bilbao Bizkaia Kutxa (BBK), following a competitive process. The FROB granted an APS of €392 million (the FROB’s maximum liability) to cover a portfolio with a book value of around €5,540 million,8 with the €800 million in non-voting equity units issued and subscribed by the FROB being redeemed.
4 Under the ESCB procedures for the provision of emergency liquidity assistance.
5 http://www.bde.es/f/webbde/GAP/Secciones/SalaPrensa/NotasInformativas/09/presbe132.pdf
6 €1.3 billion was initially granted, finally rising to €1,740 million.
7 http://www.bde.es/f/webbde/GAP/Secciones/SalaPrensa/NotasInformativas/10/Arc/Fic/presbe141.pdf
8 The details of the restructuring plan are available at: http://ec.europa.eu/competition/state_aid/cases/237557/ 237557_1164518_62_2.pdf
128 banco de españa
integration Processes in the savings bank sector
The bulk of savings bank integration processes used the institutional protection scheme (IPS) mechanism. The nature of the savings banks and their complex governance meant that the conditions under which traditional mergers are carried out (with the disappearance of the merged entities) were an obstacle to integration, particularly where savings banks from more than one region were concerned. The legal form and design of the IPS mechanism sought to provide a flexible integration formula analogous to that of a merger in terms of the practical outcome, including the fact that control would go to a core institution within the IPS (see Box 2.6). Precisely because the IPS’s effects were analogous, in economic terms, to those of a merger (given the pooling of solvency, liquidity and earnings between the member institutions, but without their disappearance as legal entities), all the constituent savings banks in an IPS drew up their individual accounts, charging the same value adjustments to reserves as on the consolidated accounts of the IPS, thereby avoiding any discrepancy between the valuations on the consolidated accounts and those on the stand-alone accounts of the constituent savings banks (credit cooperatives belonging to an IPS also made this same value adjustment). This was equivalent to making these adjustments on the consolidated accounts and was carried out following consultation with the Banco de España,92 IPSs not being regulated as such under the existing accounting legislation.
As already mentioned in section 2.4.B, the tasks of the FROB (created in 2009) included supporting the integration of viable institutions that voluntarily agreed to merge or to participate in IPSs, so as to achieve greater efficiency, administrative streamlining and downsizing of their productive capacity. In this framework, the Banco de España’s efforts focused on analysing and, where applicable, approving these processes. In those cases where the FROB provided financial support, the European Commission’s approval was also necessary, as this support constitutes State aid, which means that a series of conditions have to be met and commitments made in order to safeguard competition.93
2010 and 2011 were marked by the downsizing of the banking sector, particularly in the case of the savings banks (there was also merger and take-over activity among the commercial banks and rural credit cooperatives,94 but to a lesser extent). Through various integration processes, affecting 42 financial institutions, the savings banks sector contracted from 45 groups of institutions to just 15. Three of these processes took place without financial support from the FROB or the deposit guarantee scheme (DGS) (La Caixa-Girona, Unicaja-Jaén and Caja 3).
92 Under Rule 8.3 of Circular 4/2004.93 State aid must not put institutions that did not resort to it in a less favourable competitive position than those that did. 94 �By way of example, in 2010 the merger of Banco Guipuzcoano with Banco Sabadell began, and the operational integration
of Caja Rural de Casinos, Caja Rural de Albalat dels Sorells and Caja Campo with Cajamar was completed.

129RepoRt on the financial and banking cRisis in spain, 2008-2014
An asset protection scheme is a mechanism whereby the granting institution (the Deposit Guarantee Scheme or the FROB) wholly or partly guarantees the value of a portfolio to a credit institution, over and above the provisions set aside by the beneficiary institution to cover these assets. Given that this mechanism gives a degree of certainty to the value of the assets covered, it is a particularly useful tool when troubled institutions are being sold.
Two types of APSs were used in the restructuring of the Spanish banking system:
i) APSs with an explicit maximum guaranteed amount, such that the first losses incurred on operations covered by the APS are met by its guarantor up to that limit. This was the mechanisms chosen for the APS the Deposit Guarantee Scheme (DGS) granted to CCM.
ii) Those in which the party granting the APS guarantees a given percentage of the final losses incurred as losses materialise on operations covered by the APS, with the beneficiary institution assuming the remainder (known as the “shared risk scheme”). Some also set an upper limit on the guarantor’s liability (as happened in the case of CajaSur).
The guarantor indemnifies the net aggregate losses (losses less recoveries) deriving from the protected portfolio, with annual valuations against the guarantor, if the aggregate losses grow from year to year, or in the guarantor’s favour otherwise. An annual estimate is made of the APS’s effective losses on the covered risks (in general, an independent expert is engaged to make the estimate).
box 2.9 ASSET PRoTECTIoN SChEMES (APSs)
At the institutions’ request, the FROB provided financial support95 to seven projects by subscribing convertible preference shares, eligible as Tier 1 capital, with a commitment to repurchase them within not more than five years (extensible for a further two years), with a yield of 7.75%. This process, known as FROB I, required aid totalling €9,674 million96 (see Table 2.5). The new capital requirements subsequently led some financial institutions to request fresh support from the FROB, in this case through subscriptions of shares worth €4,751 million (FROB II). In some cases this aid was complemented with the use of asset protection schemes (APSs) through the FROB and the DGS (see Box 2.9).
95 �For reference, aid came to around 2% of the institution’s risk-weighted assets (http://ec.europa.eu/competition/state_aid/legislation/restructuring_paper_en.pdf )
96 �In addition to this sum, in 2010 the FROB subscribed €800 million of non-voting equity units in CajaSur, which were redeemed that same year (see Table 2.5 and Box 2.8).
130 banco de españa
stock-take oF the transForMation oF the savings banks sector at deceMber 2011
All these actions brought about a transformation of the savings banks sector, the progress of which is shown in Table 2.8 below. Within these processes, the BFA-Bankia process in 2010-2011 deserves special mention.97
bFa-bankia (2010 - 2011)
The agreement constituting the BFA group was signed in June 2010, forming an IPS comprising seven institutions: Caja de Ahorros y Monte de Piedad de Madrid, Caja de Ahorros de Valencia, Castellón y Alicante (Bancaja), Caja Insular de Ahorros de Canarias, Caja de Ahorros y Monte de Piedad de Ávila, Caixa d’Estalvis Laietana, Caja de Ahorros y Monte de Piedad de Segovia and Caja de Ahorros de la Rioja. The stated goal of the savings banks concerned was to improve their ability to confront the financial crisis.
The group was established in December 2010, with the founding of BFA as the group’s core company. BFA was created with assets of around €328 billion, a banking book of €230 billion, customer deposits of €165 million, own funds of €13.9 billion (BIS II solvency ratio of 12.1%) and over 27,700 employees.
The FROB provided financial support of €4,465 million through the subscription of preference shares. The overall goal of the planned integration was to bolster solvency, while adapting to the new regulatory requirements for own funds in the most efficient way possible. To overcome their profitability problems, arising from their relatively unproductive assets associated with the real estate sector, the member savings banks needed both to set aside provisions to cover possible future losses and to undertake a process of internal restructuring to reduce their capacity (adjusting the size of their branch networks and central services).
The group’s initial characteristics included:
— Its strong positioning in the Spanish market, with a geographically diversified business. At national level, the joint market shares of the savings banks comprising the IPS came to 11.23% of the credit portfolio and 10.67% of deposits. By joining forces, the group of savings banks aimed to build a network of branches with the capacity to achieve the group’s strategic objectives.
97 �Apart from the case of BFA-Bankia, other significant processes affected Catalunya Caixa, NovaCaixaGalicia and Banco de Valencia. A summary of the processes in given in Section 3.5.C

131RepoRt on the financial and banking cRisis in spain, 2008-2014
— The integration sought to embark on a round of branch closures to enable it to benefit from synergies allowing it to raise efficiency through cost rationalisation.
— Measures were adopted with a view to bringing forward the timetable of write-downs required and to step up liquidity generation, so as to reduce dependence on wholesale markets. Provisions of €9,207 million were set aside from reserves to cover expected losses.
FROB I (a) FROB II (b) DGS (c)
Caja Madrid, Bancaja, Caja Ávila, Caja Segovia, Caja Rioja, Caixa Laietana, C.I. de Canarias
343,213564,4IPS)0102( aiknaB-AFB
Caja Murcia, Caixa Penedès, Sa Nostra, Caja Granada
102,76519IPS)0102( NMB
Caja Navarra, Caja Canarias, Caja Burgos, CajaSol, Caja Guadalajara
728,17779IPS)0102( acivíC acnaB
Caja Inmaculada, Caja C. de Burgos, Caja Badajoz
527,02IPS)0102( 3 ajaC
Caixa Catalunya, Caixa Manresa, Caixa Tarragona
940,77817,1052,1Merger )0102( axiacaynulataC
Caixa Sabadell, Caixa Terrasa, Caixa Manlleu
882,92865083Merger)0102( minnU
733,24525Merger)0102( SSIECoreuD ajaC ,añapsE ajaC
632,27564,2261,1Merger)0102( aicilagaxiacavoNavonaxiaC ,aicilaG axiaC
551,83Merger)0102( ajacinUnéaJ ajaC ,ajacinU
107,673Merger)0102( axiaC aLanoriG axiaC ,axiaC aL
Caja Asturias + CCM, Caja Cantabria, Caja Extremadura
Liberbank (2011)1,740 +
APS 1,71550,847
159,07800 +
APS 392IPS
IPS
)1102( knabaxtuKaxtuK ,latiV ajaC ,ruSajaC + KBB
441,54—
419—
353—
CAM5,249 +
APS 1,14570,805
TOTAL10,474 +APS 392
4,7516,989 +
APS 2,860
Total assetsat 31.12.2011
Aid
Ibercaja
Ontinyent
Pollença
Sold to Banco de Sabadell (2011)
Original savings banks(45 groups)
New groupsat 31.12.2011
(15 groups)
Modelof integration
TABLE 2.8 TRANSFORMATION OF THE SAVINGS BANK SECTOR€m
SOURCES: FROB, DGF and Banco de España.
a Aid granted pursuant to Royal-Decree Law 9/2009 (FROB I) through subscription of preference shares.b Aid granted pursuant to Royal-Decree Law 2/2011 (FROB II) through subscription of ordinary shares.c Expected value of asset protection schemes (APSs) at 31.12.11 is given.

132 banco de españa
— Despite the integration, the governance problems deriving from the savings banks’ legal form remained, resulting in a two-headed organisation (Caja Madrid and Bancaja).
— Integrating systems and procedures proved slow and complex, although there were no serious incidents.
In the first half of 2011, to meet the higher capital requirements laid down by Royal Decree-Law 2/2011 (the group was required to meet a 10% core capital ratio, unless it placed at least 20% of its capital in the hands of third parties, as its wholesale funding ratio was over 20%), the group decided to float most of its business on the stock market. To this end, BFA was apportioned the whole financial business of the savings banks and then a significant part of this business was then apportioned Bankia.98 This left BFA (apart from its holding in Bankia) with government bonds, financial investments, risks with real estate developers classed as non-performing or substandard, foreclosed land, etc. totalling €40 billion in assets, and the subordinated debt. In short, BFA ended up holding the assets whose valuation was surrounded by the greatest uncertainty. The aim was to launch Bankia on the stock market99 in order to meet the 8% core capital ratio. The flotation took place in July 2011, with 47.6% being placed (824,572,253 shares). The price of the initial public offering was set at €3.75 per share (74% discount on the underlying book value, set by common accord between Bankia and the underwriters) for both the wholesale and retail tranches. BoA-Merrill Lynch, JP Morgan, Deutsche Bank and UBS took part, along with Bankia, in the placement of the wholesale tranche.
The stock market launch improved the group’s solvency by raising capital of €3,092 million on the markets. This enabled the IPS to comply with the levels of core capital required by Royal Decree-Law 2/2011 referred to above, and to pass the EBA’s stress tests in July 2011.
Following the IPO, the group’s core capital ratio stood at 8.5% at 30.09.2011 (above the 8% minimum the group was required to meet pursuant to Royal Decree-Law 2/2011, having placed at least 20% of its share capital on the stock market). The preference shares subscribed by the FROB contributed 200 bp to it. The core capital ratio maintained by the BFA-Bankia group was in line with that of top-tier Spanish banks at the start of the fourth quarter of 2011.
��98 The group had a banking licence in the name of Altae Banco, which it changed to Bankia.99 �Certain aspects of this group’s management, such as Bankia’s IPO, gave rise to preliminary proceedings being instituted at
central criminal court number 4 of the National High Court, and proceedings are currently under way. Having regard to these circumstances, the contents of this section do not aim to assess those matters which are subject to investigation within the aforementioned proceedings.
133RepoRt on the financial and banking cRisis in spain, 2008-2014
For its part, the BIS II solvency ratio, for which the minimum level was 8%, and which included preference shares and subordinated debt held by customers in its calculation, was 13.66%. The BFA-Bankia group’s deleveraging policy enabled it to bolster its solvency. The policy’s aim was also to improve the structural liquidity position it had inherited from its founding savings banks (which had increased their indebtedness during the years of extremely strong credit growth).
A review of the combination of businesses deriving from the IPS was also carried out in 2011. This led to an increase in provisions of €3,931 million, charged to reserves and prepaid taxes.
As 2011 progressed, the economic situation deteriorated and there was a significant rise in the NPL rate and refinancings of loans on the real estate developer portfolio that were still classed as standard exposures. This fact had a particularly severe impact on financial institutions holding a large percentage of real estate developer exposures on their portfolio, such as the BFA- Bankia group. These factors, in conjunction with the new write-down requirements established by Royal Decrees 2/2012 and 18/2012, affected the group’s position (see Section 3.5 of this report).
C. Stress testing in a process of improving the information on the banking industry
During the period covered by this chapter, efforts were made to enhance the market disclosure of credit institutions’ situation. Spanish financial institutions were required to disclose more information about the restructuring process, detailed information about their exposure to the real estate sector, and their participation in stress tests. Having covered these first two topics above, this section will discuss the stress tests performed to allay doubts about the Spanish banking system, which largely revolved around the situation of the savings banks and their exposure to the real estate sector.
actions in 2010
In 2010, Spain’s banks took part in the EU-wide stress tests coordinated by the Committee of European Banking Supervisors (CEBS),100 the results of which were published on 23 July 2010. The tests were based on the balance sheets for the year ending 31 December 2009 and the time frame of the exercise was two years (2010 and 2011). To ensure maximum transparency, the Banco de España decided that the exercise in Spain should be as broad as possible. This affected: (i) the number of financial institutions, with 27 Spanish institutions being included (all the listed banks and the savings banks resulting from the restructuring
100 �Unlike the tests carried out in 2009, in which only the aggregate situation of the 22 largest European cross-border groups was examined, the tests in 2010 extended to the main domestic banking groups, covering at least 50% of each country’s system (in Spain 90% was covered).
134 banco de españa
processes under way at the time of the exercise101) and (ii) the information supplied, as in Spain information on credit portfolios (particularly the real estate portfolio) was included, along with information on public support already committed before the stress tests were carried out. As regards the results obtained from the exercise, on the baseline scenario none of the Spanish institutions was below the target set (6% Tier 1 capital) and, in the adverse scenario, only four savings banks failed to meet the 6% minimum.102
actions in 2011
In Spain’s case, the stress test coordinated by the European Banking Authority (EBA) in 2011 also included all the listed banks and savings banks (in all 93% of the system was covered, which was well above the 50% required by the EBA). In this exercise the minimum capital level required was 5% core Tier 1.103 No Spanish institution was finally below this level (the final core Tier 1 for Spanish institutions as a whole came to 8.6%).104
Subsequently, also in 2011, in response to the heightening of financial market tensions, the EU adopted new measures which, in the banking supervision area, centred on the EBA’s performing a recapitalisation exercise before the end of the year. The participation of Spanish institutions in this exercise was limited to the system’s five largest. The arrangements assumed that financial institutions were to hold a temporary capital buffer to restore market confidence. The institutions included in the exercise were to achieve a 9% level of core Tier 1 capital (as defined by the EBA) by June 2012, and to add a buffer for their sovereign debt exposures. The capital needs of the participating Spanish institutions rose to €26,170 million. The Banco de España required them to prepare compliance plans, which were completed in 2012, with all the institutions having capital in excess of the required levels.
D. The 2008-2011 adjustment in figures
Finally, to conclude this section, some of the figures showing the changes taking place in the sector between 2008 and 2011 are set out.
101 �Although the starting date was 31.12.2009, and at that point the majority of the integration processes had not taken place, the target years being 2010 and 2011, the integration processes completed in 2010 were taken into account, along with the public support committed at the time.
102 �Catalunya Caixa (3.9%), Unnim (4.5%), CEISS (5.6%) and Banca Cívica (4.7%). As mentioned earlier, to comply with Royal Decree-Law 2/2011, the first three received support from the FROB in the form of share subscriptions, whereas Banca Cívica raised capital from its stock market flotation. http://www.bde.es/f/webbde/Secciones/Publicaciones/InformesBoletinesRevistas/InformesEstabilidadFinancera/10/Arch/IEF_INTERNET_27-10.pdf
103 �Much higher than the European requirements at that time (2%) and those of Basel III in the year it came into force (4.5%).104 �http://www.bde.es/f/webbde/Secciones/Publicaciones/InformesBoletinesRevistas/InformesEstabilidadFinancera/11/
IEF_NOV2011.pdf y http://www.bde.es/f/webbde/GAP/Secciones/SalaPrensa/IntervencionesPublicas/DelGobernador/mfo150711.pdf
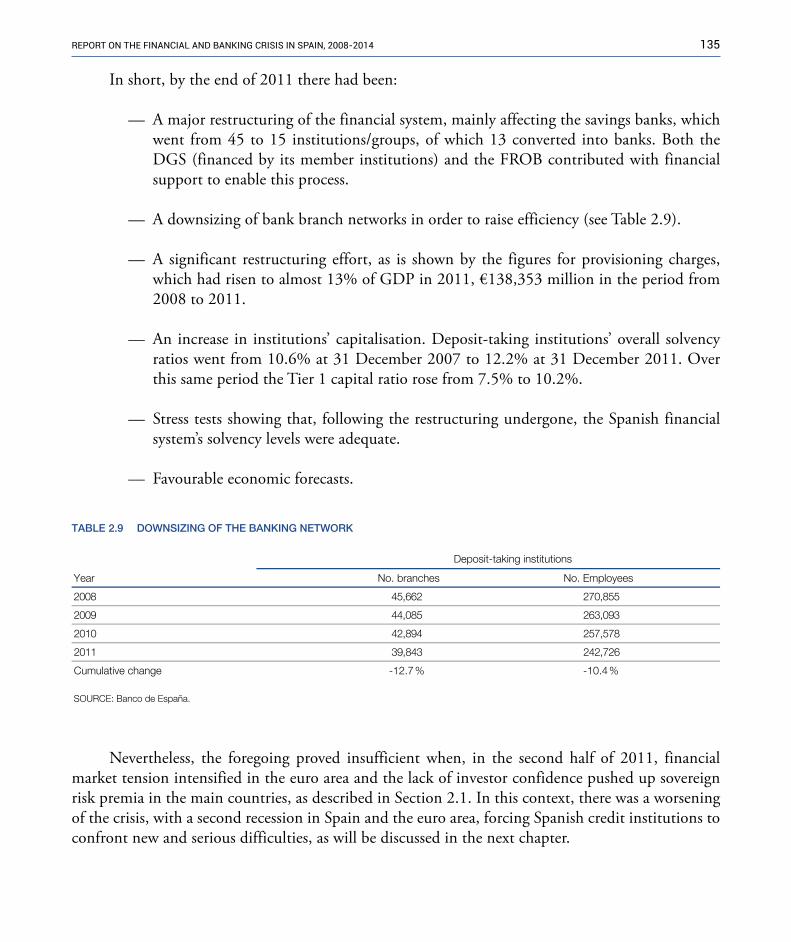
135RepoRt on the financial and banking cRisis in spain, 2008-2014
In short, by the end of 2011 there had been:
— A major restructuring of the financial system, mainly affecting the savings banks, which went from 45 to 15 institutions/groups, of which 13 converted into banks. Both the DGS (financed by its member institutions) and the FROB contributed with financial support to enable this process.
— A downsizing of bank branch networks in order to raise efficiency (see Table 2.9).
— A significant restructuring effort, as is shown by the figures for provisioning charges, which had risen to almost 13% of GDP in 2011, €138,353 million in the period from 2008 to 2011.
— An increase in institutions’ capitalisation. Deposit-taking institutions’ overall solvency ratios went from 10.6% at 31 December 2007 to 12.2% at 31 December 2011. Over this same period the Tier 1 capital ratio rose from 7.5% to 10.2%.
— Stress tests showing that, following the restructuring undergone, the Spanish financial system’s solvency levels were adequate.
— Favourable economic forecasts.
Nevertheless, the foregoing proved insufficient when, in the second half of 2011, financial market tension intensified in the euro area and the lack of investor confidence pushed up sovereign risk premia in the main countries, as described in Section 2.1. In this context, there was a worsening of the crisis, with a second recession in Spain and the euro area, forcing Spanish credit institutions to confront new and serious difficulties, as will be discussed in the next chapter.
No. EmployeesNo. branchesYear
558,072266,548002
390,362580,449002
875,752498,240102
627,242348,931102
Cumulative change
SOURCE: Banco de España.
Deposit-taking institutions
TABLE 2.9 DOWNSIZING OF THE BANKING NETWORK
-12.7 % -10.4 %

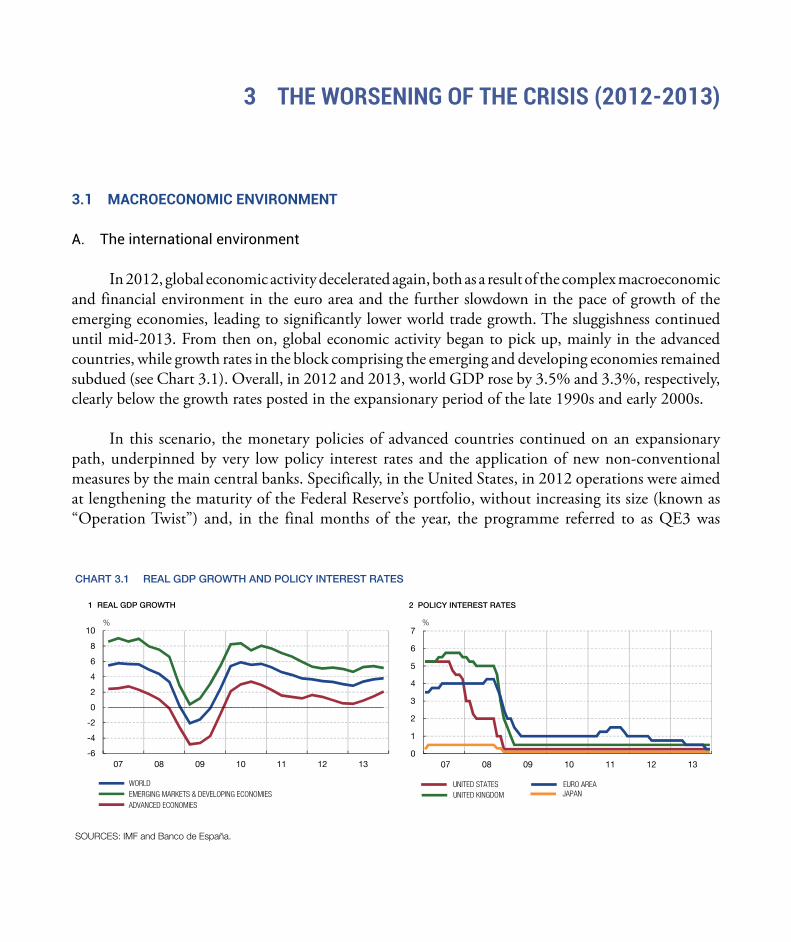
3 THE WORSENING OF THE CRISIS (2012-2013)
3.1 MACROECONOMIC�ENVIRONMENT
A. the international environment
In 2012, global economic activity decelerated again, both as a result of the complex macroeconomic and financial environment in the euro area and the further slowdown in the pace of growth of the emerging economies, leading to significantly lower world trade growth. The sluggishness continued until mid-2013. From then on, global economic activity began to pick up, mainly in the advanced countries, while growth rates in the block comprising the emerging and developing economies remained subdued (see Chart 3.1). Overall, in 2012 and 2013, world GDP rose by 3.5% and 3.3%, respectively, clearly below the growth rates posted in the expansionary period of the late 1990s and early 2000s.
In this scenario, the monetary policies of advanced countries continued on an expansionary path, underpinned by very low policy interest rates and the application of new non-conventional measures by the main central banks. Specifically, in the United States, in 2012 operations were aimed at lengthening the maturity of the Federal Reserve’s portfolio, without increasing its size (known as “Operation Twist”) and, in the final months of the year, the programme referred to as qE3 was
CHART 3.1 REAL GDP GROWTH AND POLICY INTEREST RATES
SOURCES: IMF and Banco de España.
-6
-4
-2
0
2
4
6
8
10
07 08 09 10 11 12 13
WORLD
ADVANCED ECONOMIES EMERGING MARKETS & DEVELOPING ECONOMIES
%
1 REAL GDP GROWTH
0
1
2
3
4
5
6
7
07 08 09 10 11 12 13
UNITED STATES UNITED KINGDOM
EURO AREAJAPAN
%
2 POLICY INTEREST RATES
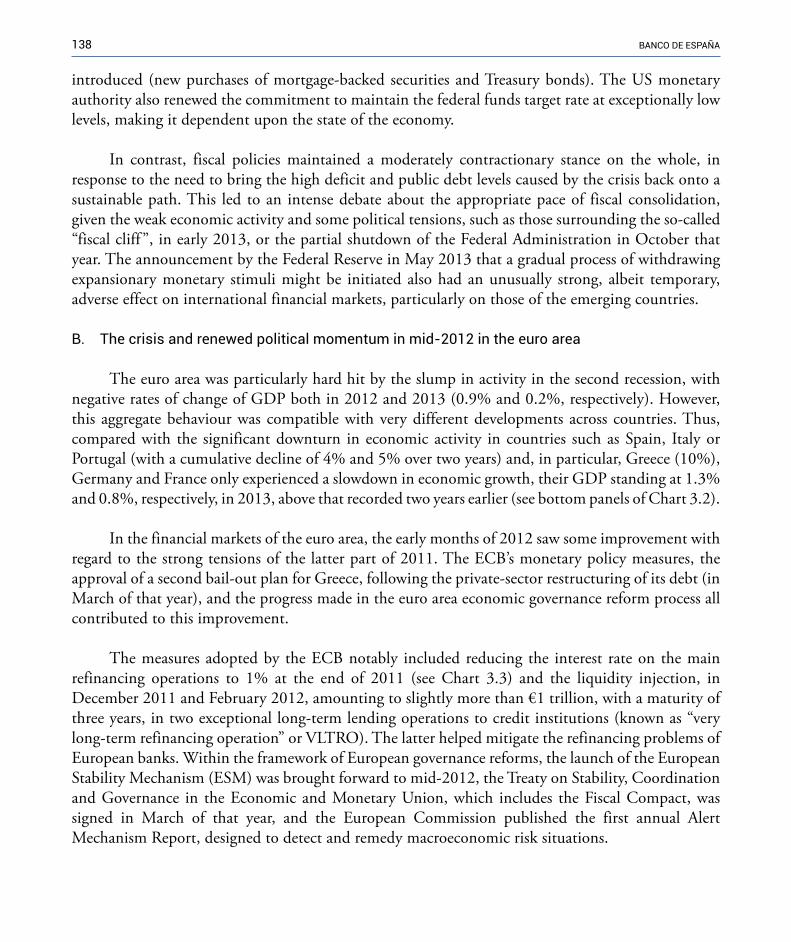
138 banco de españa
introduced (new purchases of mortgage-backed securities and Treasury bonds). The US monetary authority also renewed the commitment to maintain the federal funds target rate at exceptionally low levels, making it dependent upon the state of the economy.
In contrast, fiscal policies maintained a moderately contractionary stance on the whole, in response to the need to bring the high deficit and public debt levels caused by the crisis back onto a sustainable path. This led to an intense debate about the appropriate pace of fiscal consolidation, given the weak economic activity and some political tensions, such as those surrounding the so-called “fiscal cliff ”, in early 2013, or the partial shutdown of the Federal Administration in October that year. The announcement by the Federal Reserve in May 2013 that a gradual process of withdrawing expansionary monetary stimuli might be initiated also had an unusually strong, albeit temporary, adverse effect on international financial markets, particularly on those of the emerging countries.
B. the crisis and renewed political momentum in mid-2012 in the euro area
The euro area was particularly hard hit by the slump in activity in the second recession, with negative rates of change of GDP both in 2012 and 2013 (0.9% and 0.2%, respectively). However, this aggregate behaviour was compatible with very different developments across countries. Thus, compared with the significant downturn in economic activity in countries such as Spain, Italy or Portugal (with a cumulative decline of 4% and 5% over two years) and, in particular, Greece (10%), Germany and France only experienced a slowdown in economic growth, their GDP standing at 1.3% and 0.8%, respectively, in 2013, above that recorded two years earlier (see bottom panels of Chart 3.2).
In the financial markets of the euro area, the early months of 2012 saw some improvement with regard to the strong tensions of the latter part of 2011. The ECB’s monetary policy measures, the approval of a second bail-out plan for Greece, following the private-sector restructuring of its debt (in March of that year), and the progress made in the euro area economic governance reform process all contributed to this improvement.
The measures adopted by the ECB notably included reducing the interest rate on the main refinancing operations to 1% at the end of 2011 (see Chart 3.3) and the liquidity injection, in December 2011 and February 2012, amounting to slightly more than €1 trillion, with a maturity of three years, in two exceptional long-term lending operations to credit institutions (known as “very long-term refinancing operation” or VLTRO). The latter helped mitigate the refinancing problems of European banks. Within the framework of European governance reforms, the launch of the European Stability Mechanism (ESM) was brought forward to mid-2012, the Treaty on Stability, Coordination and Governance in the Economic and Monetary Union, which includes the Fiscal Compact, was signed in March of that year, and the European Commission published the first annual Alert Mechanism Report, designed to detect and remedy macroeconomic risk situations.

139RepoRt on the financial and banking cRisis in spain, 2008-2014
1
2
3
4
5
6
7
2007 2008 2009 2010 2011 2012 2013
3 BANK INTEREST RATES. LENDING TO NON-FINANCIAL CORPORATIONS. LOANS OF LESS THAN €1m
%
CHART 3.2 WORSENING OF THE EURO AREA CRISIS
0
1
2
3
4
5
6
2007 2008 2009 2010 2011 2012 2013
%
4 BANK INTEREST RATES. TIME DEPOSITS
70
75
80
85
90
95
100
105
110
2007 2008 2009 2010 2011 2012 2013
5 CHANGE IN REAL GDP
2008 Q2 = 100
6065707580859095
100105110
2007 2008 2009 2010 2011 2012 2013
2008 Q2 = 100
6 CHANGE IN DOMESTIC DEMAND
0
500
1000
1500
2000
2500
3000
3500
2007 2008 2009 2010 2011 2012 2013
PORTUGAL IRELAND GREECE
1 TEN-YEAR SOVEREIGN SPREADS OVER THE GERMAN BUND
bp
0
100
200
300
400
500
600
2007 2008 2009 2010 2011 2012 2013
FRANCE ITALY SPAIN
NETHERLANDS BELGIUM
bp
2 TEN-YEAR SOVEREIGN SPREADS OVER THE GERMAN BUND (a)
GERMANY FRANCE ITALY SPAIN GREECE PORTUGAL
GERMANY FRANCE ITALY SPAIN
SOURCES: ECB, Eurostat and Banco de España.
a Monthly averages of daily data.
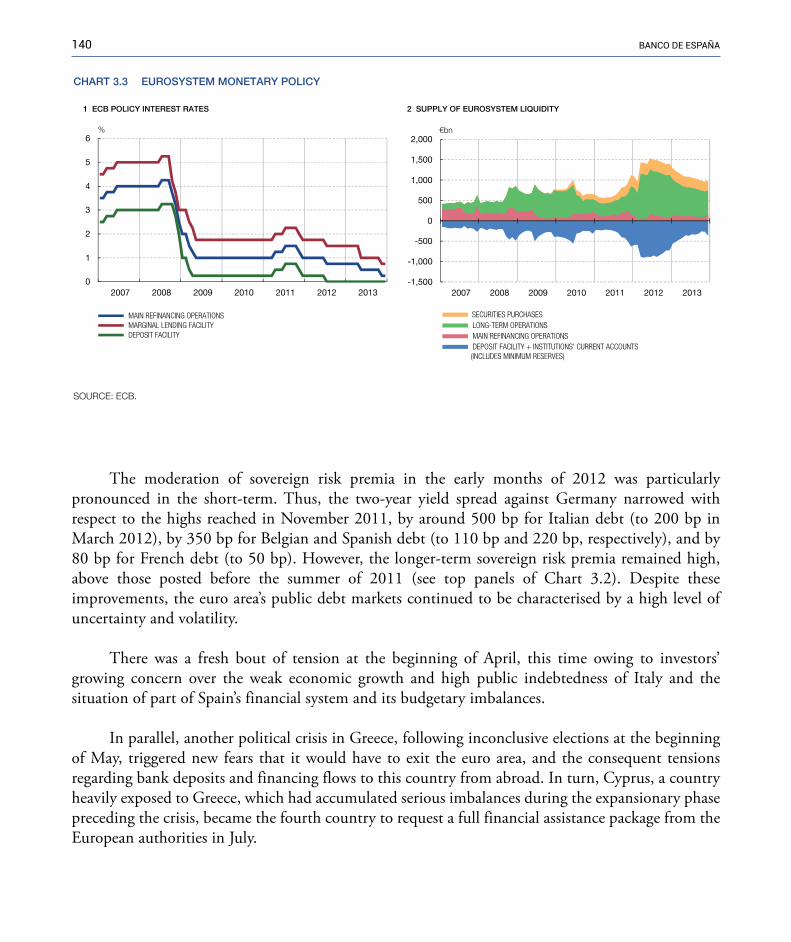
140 banco de españa
The moderation of sovereign risk premia in the early months of 2012 was particularly pronounced in the short-term. Thus, the two-year yield spread against Germany narrowed with respect to the highs reached in November 2011, by around 500 bp for Italian debt (to 200 bp in March 2012), by 350 bp for Belgian and Spanish debt (to 110 bp and 220 bp, respectively), and by 80 bp for French debt (to 50 bp). However, the longer-term sovereign risk premia remained high, above those posted before the summer of 2011 (see top panels of Chart 3.2). Despite these improvements, the euro area’s public debt markets continued to be characterised by a high level of uncertainty and volatility.
There was a fresh bout of tension at the beginning of April, this time owing to investors’ growing concern over the weak economic growth and high public indebtedness of Italy and the situation of part of Spain’s financial system and its budgetary imbalances.
In parallel, another political crisis in Greece, following inconclusive elections at the beginning of May, triggered new fears that it would have to exit the euro area, and the consequent tensions regarding bank deposits and financing flows to this country from abroad. In turn, Cyprus, a country heavily exposed to Greece, which had accumulated serious imbalances during the expansionary phase preceding the crisis, became the fourth country to request a full financial assistance package from the European authorities in July.
CHART 3.3 EUROSYSTEM MONETARY POLICY
SOURCE: ECB.
0
1
2
3
4
5
6
2007 2008 2009 2010 2011 2012 2013
MAIN REFINANCING OPERATIONS MARGINAL LENDING FACILITY DEPOSIT FACILITY
1 ECB POLICY INTEREST RATES
%
-1,500
-1,000
-500
0
500
1,000
1,500
2,000
2007 2008 2009 2010 2011 2012 2013
SECURITIES PURCHASES LONG-TERM OPERATIONS MAIN REFINANCING OPERATIONS DEPOSIT FACILITY + INSTITUTIONS' CURRENT ACCOUNTS (INCLUDES MINIMUM RESERVES)
€bn
2 SUPPLY OF EUROSYSTEM LIQUIDITY
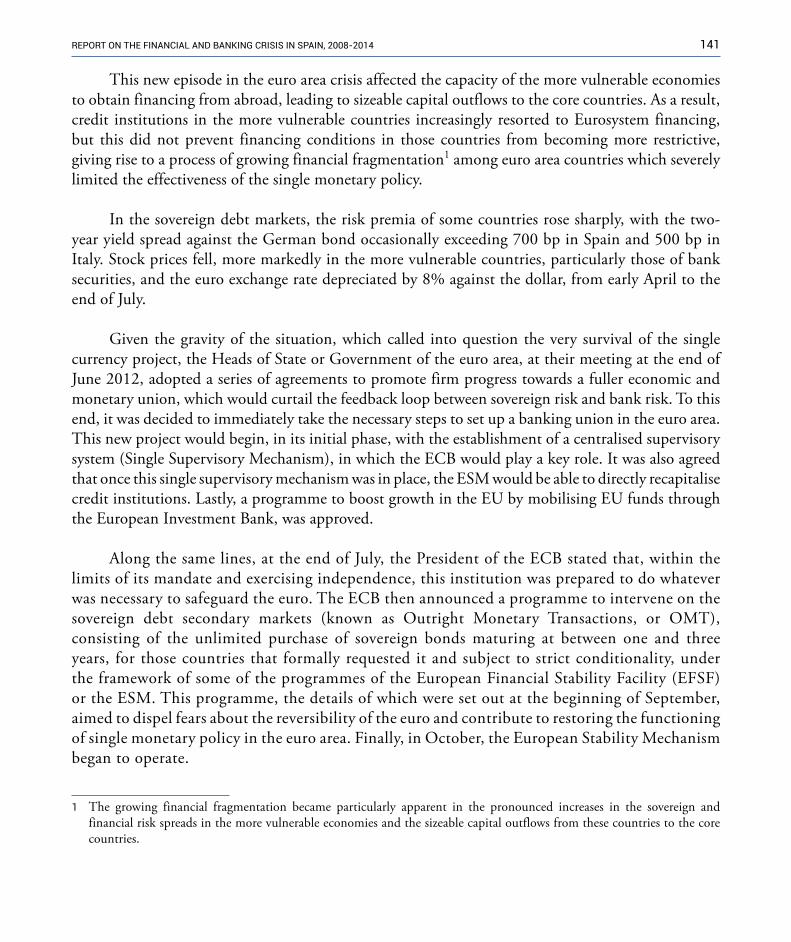
141RepoRt on the financial and banking cRisis in spain, 2008-2014
This new episode in the euro area crisis affected the capacity of the more vulnerable economies to obtain financing from abroad, leading to sizeable capital outflows to the core countries. As a result, credit institutions in the more vulnerable countries increasingly resorted to Eurosystem financing, but this did not prevent financing conditions in those countries from becoming more restrictive, giving rise to a process of growing financial fragmentation1 among euro area countries which severely limited the effectiveness of the single monetary policy.
In the sovereign debt markets, the risk premia of some countries rose sharply, with the two-year yield spread against the German bond occasionally exceeding 700 bp in Spain and 500 bp in Italy. Stock prices fell, more markedly in the more vulnerable countries, particularly those of bank securities, and the euro exchange rate depreciated by 8% against the dollar, from early April to the end of July.
Given the gravity of the situation, which called into question the very survival of the single currency project, the Heads of State or Government of the euro area, at their meeting at the end of June 2012, adopted a series of agreements to promote firm progress towards a fuller economic and monetary union, which would curtail the feedback loop between sovereign risk and bank risk. To this end, it was decided to immediately take the necessary steps to set up a banking union in the euro area. This new project would begin, in its initial phase, with the establishment of a centralised supervisory system (Single Supervisory Mechanism), in which the ECB would play a key role. It was also agreed that once this single supervisory mechanism was in place, the ESM would be able to directly recapitalise credit institutions. Lastly, a programme to boost growth in the EU by mobilising EU funds through the European Investment Bank, was approved.
Along the same lines, at the end of July, the President of the ECB stated that, within the limits of its mandate and exercising independence, this institution was prepared to do whatever was necessary to safeguard the euro. The ECB then announced a programme to intervene on the sovereign debt secondary markets (known as Outright Monetary Transactions, or OMT), consisting of the unlimited purchase of sovereign bonds maturing at between one and three years, for those countries that formally requested it and subject to strict conditionality, under the framework of some of the programmes of the European Financial Stability Facility (EFSF) or the ESM. This programme, the details of which were set out at the beginning of September, aimed to dispel fears about the reversibility of the euro and contribute to restoring the functioning of single monetary policy in the euro area. Finally, in October, the European Stability Mechanism began to operate.
1 �The growing financial fragmentation became particularly apparent in the pronounced increases in the sovereign and financial risk spreads in the more vulnerable economies and the sizeable capital outflows from these countries to the core countries.

142 banco de españa
In 2012 and 2013, the ECB continued to lower policy interest rates, bringing the rate for main refinancing operations down to 0.25% (a historical low at the time), while maintaining a generous supply of long-term liquidity, and issuing indications of the future course of monetary policy (“forward guidance”) in the summer of 2013, announcing that it expected interest rates to remain at their prevailing or lower levels for an extended period of time.
These actions, particularly the potentially unlimited nature of the ECB’s possible intervention on the sovereign debt secondary markets, provided considerable relief for the financial instability situation in the euro area from September 2012. This was felt both in the sovereign debt prices, where yield spreads narrowed significantly, and in corporate bonds, where issues were reactivated. An easing of financial conditions was also observed on the interbank markets, while stock prices recovered. However, the financing conditions in the euro area’s more vulnerable countries remained very tight, with a persistently high level of fragmentation across countries throughout 2013.
C. the Spanish economy
The worsening political situation in Greece in the first half of 2012 heightened tensions in the euro area as whole, as investors’ concern over the risk of reversibility of the single currency grew. Against this background, the recession of the Spanish economy intensified in 2012, revealing great vulnerability arising from the persistent macroeconomic and financial imbalances accumulated in the expansionary phase, the doubts over the soundness of certain parts of the Spanish banking system and the substantial deterioration of public finances and of employment.
In early April 2012, the already tight funding conditions on wholesale markets for Spanish banks became even tighter, influenced by fears of the impact the new recession would have on credit institutions’ balance sheet positions and concerns regarding the feedback loop between sovereign risk and bank risk. At the beginning of May, these fears were to some extent confirmed by the BFA-Bankia group’s request for public recapitalisation.
In parallel, the net outflow of funds abroad, which had already started in mid-2011, began to gather pace, leading to a severe external financing crisis in Spain (see Chart 3.4). In cumulative twelve-month terms, net outflows peaked mid-year (€320 billion, representing 29% of GDP), mainly as a result of the divestment by non-residents of securities issued by resident sectors (€141 billion), and of the decline in interbank deposits held by Spanish credit institutions (€189 billion).
As in other vulnerable euro area countries, these tensions resulted in a substantial increase in the recourse of Spanish credit institutions to Eurosystem financing, which reached €412 billion in August 2012, accounting for 13% of their total assets and 34% of the liquidity provided by the Eurosystem to banks throughout the euro area. Consequently, in the summer months of that year, the Spanish
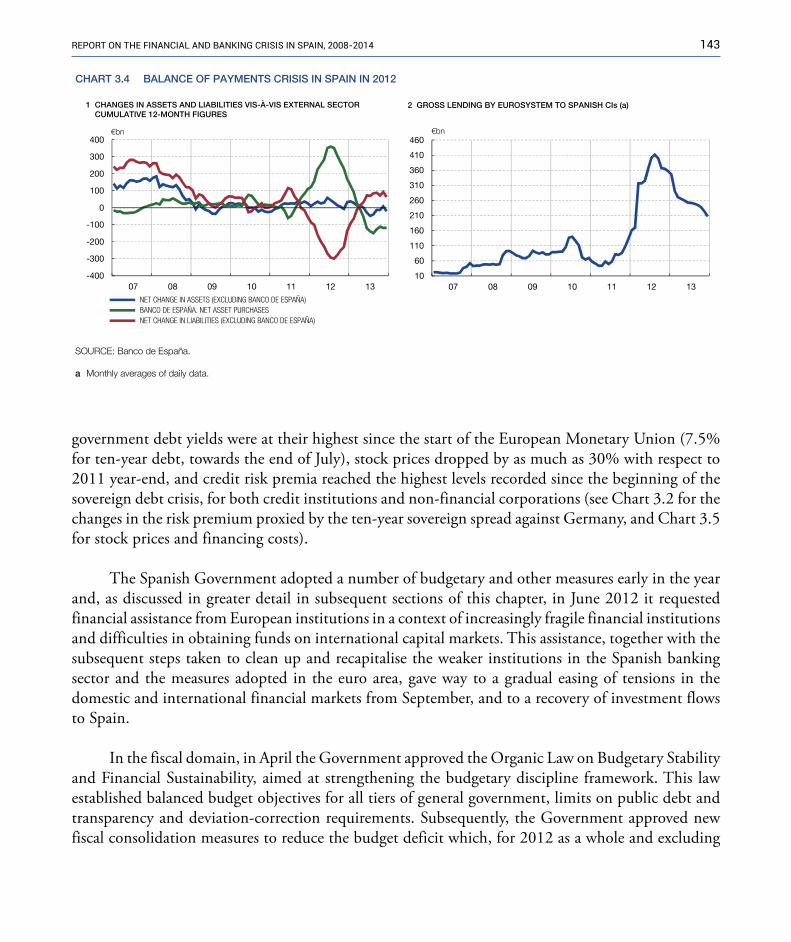
143RepoRt on the financial and banking cRisis in spain, 2008-2014
government debt yields were at their highest since the start of the European Monetary Union (7.5% for ten-year debt, towards the end of July), stock prices dropped by as much as 30% with respect to 2011 year-end, and credit risk premia reached the highest levels recorded since the beginning of the sovereign debt crisis, for both credit institutions and non-financial corporations (see Chart 3.2 for the changes in the risk premium proxied by the ten-year sovereign spread against Germany, and Chart 3.5 for stock prices and financing costs).
The Spanish Government adopted a number of budgetary and other measures early in the year and, as discussed in greater detail in subsequent sections of this chapter, in June 2012 it requested financial assistance from European institutions in a context of increasingly fragile financial institutions and difficulties in obtaining funds on international capital markets. This assistance, together with the subsequent steps taken to clean up and recapitalise the weaker institutions in the Spanish banking sector and the measures adopted in the euro area, gave way to a gradual easing of tensions in the domestic and international financial markets from September, and to a recovery of investment flows to Spain.
In the fiscal domain, in April the Government approved the Organic Law on Budgetary Stability and Financial Sustainability, aimed at strengthening the budgetary discipline framework. This law established balanced budget objectives for all tiers of general government, limits on public debt and transparency and deviation-correction requirements. Subsequently, the Government approved new fiscal consolidation measures to reduce the budget deficit which, for 2012 as a whole and excluding
CHART 3.4 BALANCE OF PAYMENTS CRISIS IN SPAIN IN 2012
10
60
110
160
210
260
310
360
410
460
07 08 09 10 11 12 13
€bn
2 GROSS LENDING BY EUROSYSTEM TO SPANISH CIs (a)
-400
-300
-200
-100
0
100
200
300
400
07 08 09 10 11 12 13
NET CHANGE IN ASSETS (EXCLUDING BANCO DE ESPAÑA) BANCO DE ESPAÑA. NET ASSET PURCHASES NET CHANGE IN LIABILITIES (EXCLUDING BANCO DE ESPAÑA)
€bn
1 CHANGES IN ASSETS AND LIABILITIES VIS-À-VIS EXTERNAL SECTOR CUMULATIVE 12-MONTH FIGURES
SOURCE: Banco de España.
a Monthly averages of daily data.
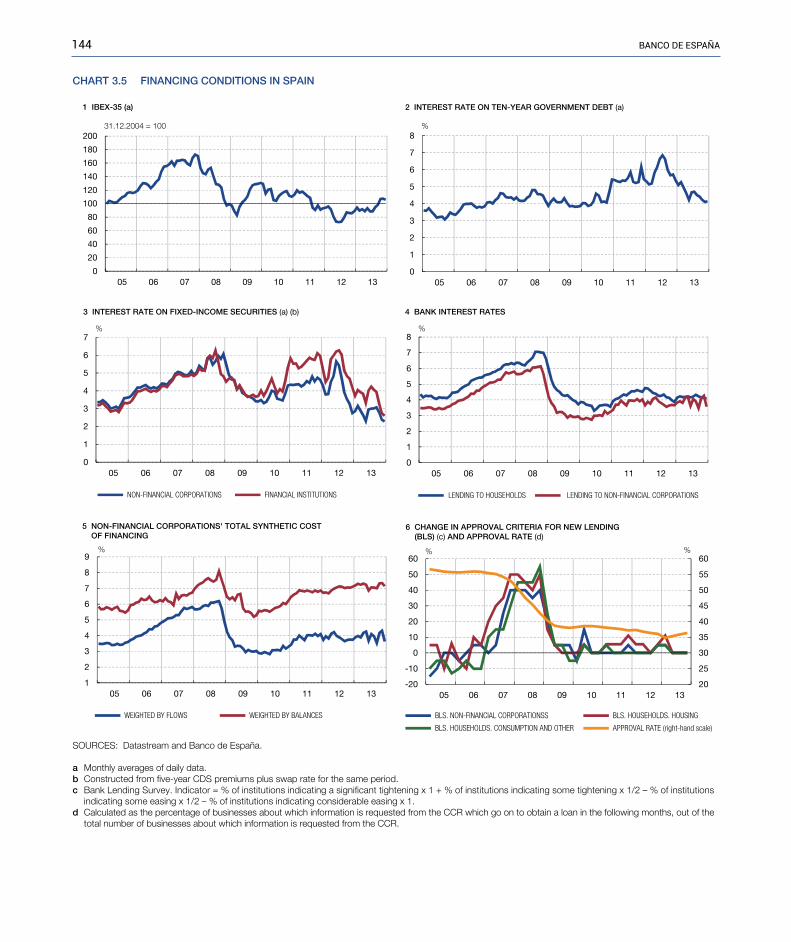
144 banco de españa
0
1
2
3
4
5
6
7
05 06 07 08 09 10 11 12 13
NON-FINANCIAL CORPORATIONS FINANCIAL INSTITUTIONS
3 INTEREST RATE ON FIXED-INCOME SECURITIES (a) (b)
%
CHART 3.5 FINANCING CONDITIONS IN SPAIN
0
1
2
3
4
5
6
7
8
05 06 07 08 09 10 11 12 13
LENDING TO HOUSEHOLDS LENDING TO NON-FINANCIAL CORPORATIONS
%
4 BANK INTEREST RATES
1
2
3
4
5
6
7
8
9
05 06 07 08 09 10 11 12 13
WEIGHTED BY FLOWS WEIGHTED BY BALANCES
5 NON-FINANCIAL CORPORATIONS' TOTAL SYNTHETIC COST OF FINANCING
%
20
25
30
35
40
45
50
55
60
-20
-10
0
10
20
30
40
50
60
05 06 07 08 09 10 11 12 13
BLS. NON-FINANCIAL CORPORATIONSS BLS. HOUSEHOLDS. HOUSING
BLS. HOUSEHOLDS. CONSUMPTION AND OTHER APPROVAL RATE (right-hand scale)
%
6 CHANGE IN APPROVAL CRITERIA FOR NEW LENDING (BLS) (c) AND APPROVAL RATE (d)
%
0
20
40
60
80
100
120
140
160
180
200
05 06 07 08 09 10 11 12 13
1 IBEX-35 (a)
31.12.2004 = 100
0
1
2
3
4
5
6
7
8
05 06 07 08 09 10 11 12 13
%
2 INTEREST RATE ON TEN-YEAR GOVERNMENT DEBT (a)
SOURCES: Datastream and Banco de España.
a Monthly averages of daily data.b Constructed from five-year CDS premiums plus swap rate for the same period.c Bank Lending Survey. Indicator = % of institutions indicating a significant tightening x 1 + % of institutions indicating some tightening x 1/2 – % of institutions
indicating some easing x 1/2 – % of institutions indicating considerable easing x 1.d Calculated as the percentage of businesses about which information is requested from the CCR which go on to obtain a loan in the following months, out of the
total number of businesses about which information is requested from the CCR.
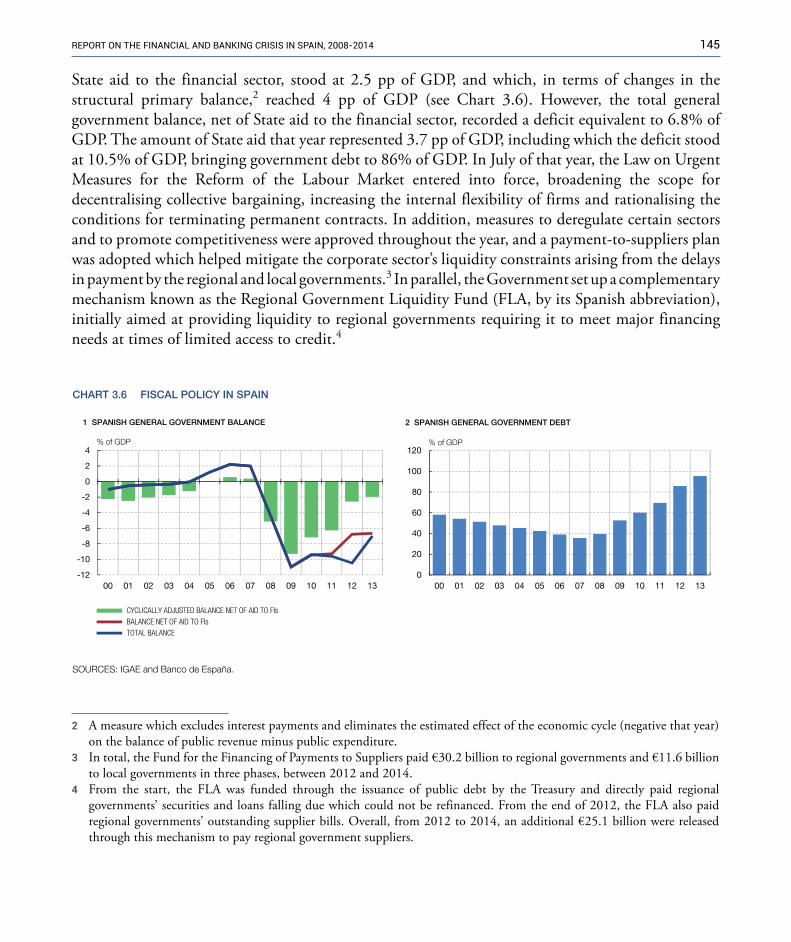
145RepoRt on the financial and banking cRisis in spain, 2008-2014
State aid to the financial sector, stood at 2.5 pp of GDP, and which, in terms of changes in the structural primary balance,2 reached 4 pp of GDP (see Chart 3.6). However, the total general government balance, net of State aid to the financial sector, recorded a deficit equivalent to 6.8% of GDP. The amount of State aid that year represented 3.7 pp of GDP, including which the deficit stood at 10.5% of GDP, bringing government debt to 86% of GDP. In July of that year, the Law on Urgent Measures for the Reform of the Labour Market entered into force, broadening the scope for decentralising collective bargaining, increasing the internal flexibility of firms and rationalising the conditions for terminating permanent contracts. In addition, measures to deregulate certain sectors and to promote competitiveness were approved throughout the year, and a payment-to-suppliers plan was adopted which helped mitigate the corporate sector’s liquidity constraints arising from the delays in payment by the regional and local governments.3 In parallel, the Government set up a complementary mechanism known as the Regional Government Liquidity Fund (FLA, by its Spanish abbreviation), initially aimed at providing liquidity to regional governments requiring it to meet major financing needs at times of limited access to credit.4
CHART 3.6 FISCAL POLICY IN SPAIN
SOURCES: IGAE and Banco de España.
-12
-10
-8
-6
-4
-2
0
2
4
00 01 02 03 04 05 06 07 08 09 10 11 12 13
CYCLICALLY ADJUSTED BALANCE NET OF AID TO FIs BALANCE NET OF AID TO FIs TOTAL BALANCE
% of GDP
1 SPANISH GENERAL GOVERNMENT BALANCE
0
20
40
60
80
100
120
00 01 02 03 04 05 06 07 08 09 10 11 12 13
% of GDP
2 SPANISH GENERAL GOVERNMENT DEBT
2 �A measure which excludes interest payments and eliminates the estimated effect of the economic cycle (negative that year) on the balance of public revenue minus public expenditure.
3 �In total, the Fund for the Financing of Payments to Suppliers paid €30.2 billion to regional governments and €11.6 billion to local governments in three phases, between 2012 and 2014.
4 �From the start, the FLA was funded through the issuance of public debt by the Treasury and directly paid regional governments’ securities and loans falling due which could not be refinanced. From the end of 2012, the FLA also paid regional governments’ outstanding supplier bills. Overall, from 2012 to 2014, an additional €25.1 billion were released through this mechanism to pay regional government suppliers.
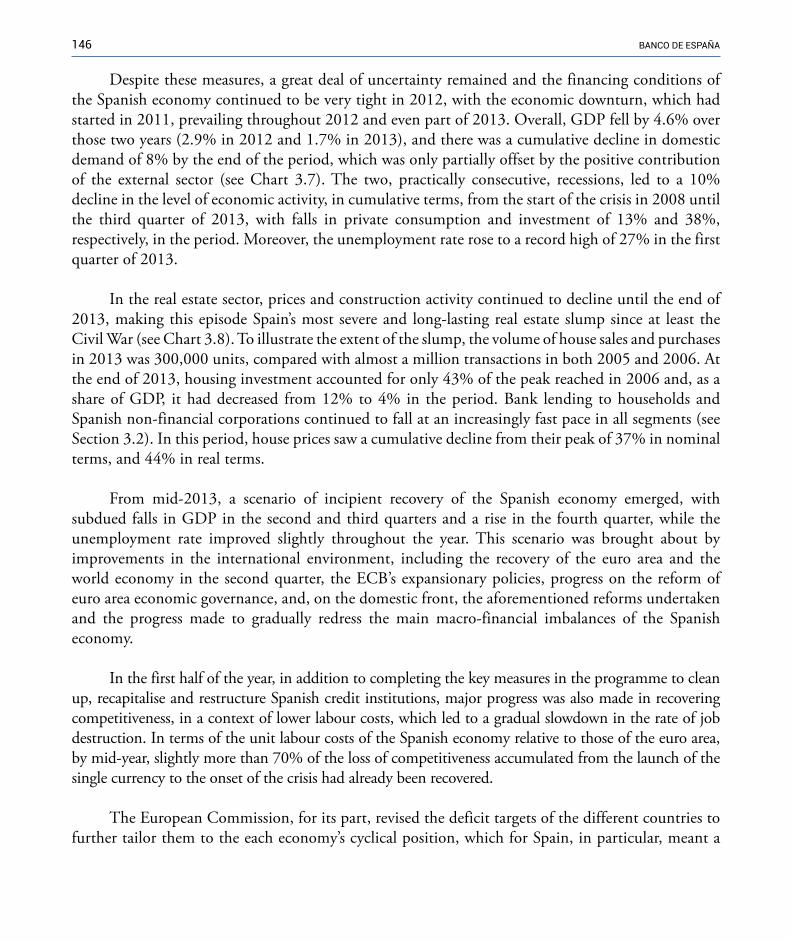
146 banco de españa
Despite these measures, a great deal of uncertainty remained and the financing conditions of the Spanish economy continued to be very tight in 2012, with the economic downturn, which had started in 2011, prevailing throughout 2012 and even part of 2013. Overall, GDP fell by 4.6% over those two years (2.9% in 2012 and 1.7% in 2013), and there was a cumulative decline in domestic demand of 8% by the end of the period, which was only partially offset by the positive contribution of the external sector (see Chart 3.7). The two, practically consecutive, recessions, led to a 10% decline in the level of economic activity, in cumulative terms, from the start of the crisis in 2008 until the third quarter of 2013, with falls in private consumption and investment of 13% and 38%, respectively, in the period. Moreover, the unemployment rate rose to a record high of 27% in the first quarter of 2013.
In the real estate sector, prices and construction activity continued to decline until the end of 2013, making this episode Spain’s most severe and long-lasting real estate slump since at least the Civil War (see Chart 3.8). To illustrate the extent of the slump, the volume of house sales and purchases in 2013 was 300,000 units, compared with almost a million transactions in both 2005 and 2006. At the end of 2013, housing investment accounted for only 43% of the peak reached in 2006 and, as a share of GDP, it had decreased from 12% to 4% in the period. Bank lending to households and Spanish non-financial corporations continued to fall at an increasingly fast pace in all segments (see Section 3.2). In this period, house prices saw a cumulative decline from their peak of 37% in nominal terms, and 44% in real terms.
From mid-2013, a scenario of incipient recovery of the Spanish economy emerged, with subdued falls in GDP in the second and third quarters and a rise in the fourth quarter, while the unemployment rate improved slightly throughout the year. This scenario was brought about by improvements in the international environment, including the recovery of the euro area and the world economy in the second quarter, the ECB’s expansionary policies, progress on the reform of euro area economic governance, and, on the domestic front, the aforementioned reforms undertaken and the progress made to gradually redress the main macro-financial imbalances of the Spanish economy.
In the first half of the year, in addition to completing the key measures in the programme to clean up, recapitalise and restructure Spanish credit institutions, major progress was also made in recovering competitiveness, in a context of lower labour costs, which led to a gradual slowdown in the rate of job destruction. In terms of the unit labour costs of the Spanish economy relative to those of the euro area, by mid-year, slightly more than 70% of the loss of competitiveness accumulated from the launch of the single currency to the onset of the crisis had already been recovered.
The European Commission, for its part, revised the deficit targets of the different countries to further tailor them to the each economy’s cyclical position, which for Spain, in particular, meant a
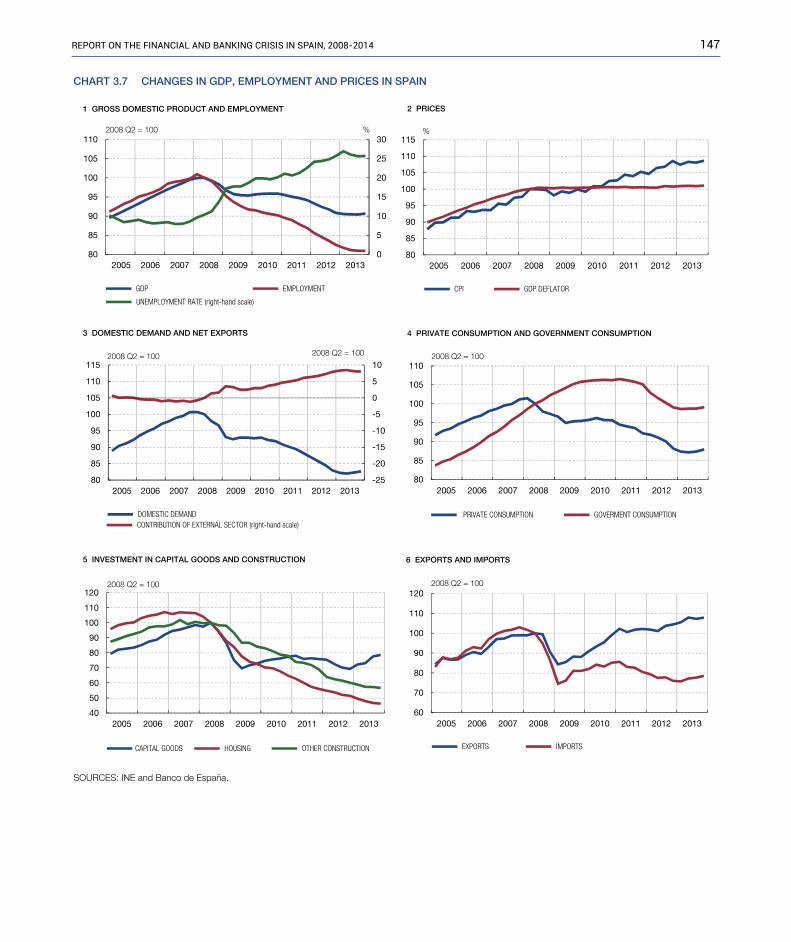
147RepoRt on the financial and banking cRisis in spain, 2008-2014
SOURCES: INE and Banco de España.
CHART 3.7 CHANGES IN GDP, EMPLOYMENT AND PRICES IN SPAIN
0
5
10
15
20
25
30
80
85
90
95
100
105
110
2005 2006 2007 2008 2009 2010 2011 2012 2013
GDP EMPLOYMENT
UNEMPLOYMENT RATE (right-hand scale)
1 GROSS DOMESTIC PRODUCT AND EMPLOYMENT
%2008 Q2 = 100
80
85
90
95
100
105
110
115
2005 2006 2007 2008 2009 2010 2011 2012 2013
CPI GDP DEFLATOR
2 PRICES
%
-25
-20
-15
-10
-5
0
5
10
80
85
90
95
100
105
110
115
2005 2006 2007 2008 2009 2010 2011 2012 2013
DOMESTIC DEMAND CONTRIBUTION OF EXTERNAL SECTOR (right-hand scale)
3 DOMESTIC DEMAND AND NET EXPORTS
2008 Q2 = 100 2008 Q2 = 100
80
85
90
95
100
105
110
2005 2006 2007 2008 2009 2010 2011 2012 2013
PRIVATE CONSUMPTION GOVERMENT CONSUMPTION
4 PRIVATE CONSUMPTION AND GOVERNMENT CONSUMPTION
40
50
60
70
80
90
100
110
120
2005 2006 2007 2008 2009 2010 2011 2012 2013
CAPITAL GOODS HOUSING OTHER CONSTRUCTION
5 INVESTMENT IN CAPITAL GOODS AND CONSTRUCTION
2008 Q2 = 100
60
70
80
90
100
110
120
2005 2006 2007 2008 2009 2010 2011 2012 2013
EXPORTS IMPORTS
6 EXPORTS AND IMPORTS
2008 Q2 = 100
2008 Q2 = 100
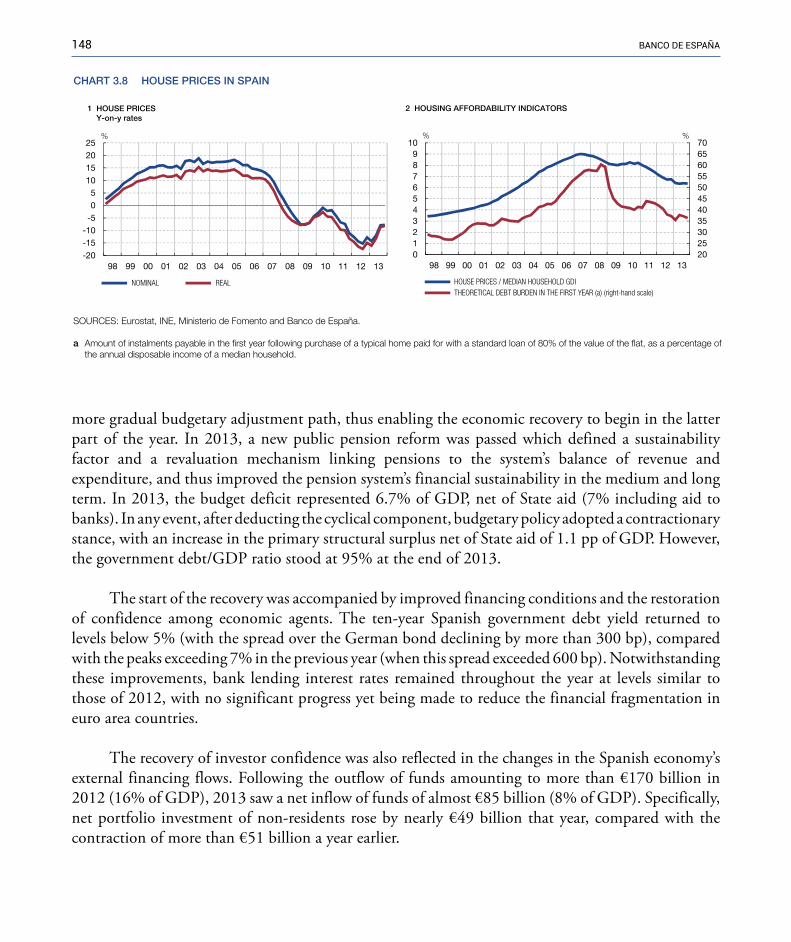
148 banco de españa
more gradual budgetary adjustment path, thus enabling the economic recovery to begin in the latter part of the year. In 2013, a new public pension reform was passed which defined a sustainability factor and a revaluation mechanism linking pensions to the system’s balance of revenue and expenditure, and thus improved the pension system’s financial sustainability in the medium and long term. In 2013, the budget deficit represented 6.7% of GDP, net of State aid (7% including aid to banks). In any event, after deducting the cyclical component, budgetary policy adopted a contractionary stance, with an increase in the primary structural surplus net of State aid of 1.1 pp of GDP. However, the government debt/GDP ratio stood at 95% at the end of 2013.
The start of the recovery was accompanied by improved financing conditions and the restoration of confidence among economic agents. The ten-year Spanish government debt yield returned to levels below 5% (with the spread over the German bond declining by more than 300 bp), compared with the peaks exceeding 7% in the previous year (when this spread exceeded 600 bp). Notwithstanding these improvements, bank lending interest rates remained throughout the year at levels similar to those of 2012, with no significant progress yet being made to reduce the financial fragmentation in euro area countries.
The recovery of investor confidence was also reflected in the changes in the Spanish economy’s external financing flows. Following the outflow of funds amounting to more than €170 billion in 2012 (16% of GDP), 2013 saw a net inflow of funds of almost €85 billion (8% of GDP). Specifically, net portfolio investment of non-residents rose by nearly €49 billion that year, compared with the contraction of more than €51 billion a year earlier.
CHART 3.8 HOUSE PRICES IN SPAIN
-20-15-10-505
10152025
98 99 00 01 02 03 04 05 06 07 08 09 10 11 12 13
NOMINAL REAL
1 HOUSE PRICES Y-on-y rates
%
2025303540455055606570
0123456789
10
98 99 00 01 02 03 04 05 06 07 08 09 10 11 12 13
HOUSE PRICES / MEDIAN HOUSEHOLD GDITHEORETICAL DEBT BURDEN IN THE FIRST YEAR (a) (right-hand scale)
2 HOUSING AFFORDABILITY INDICATORS
% %
SOURCES: Eurostat, INE, Ministerio de Fomento and Banco de España.
a Amount of instalments payable in the first year following purchase of a typical home paid for with a standard loan of 80% of the value of the flat, as a percentage of the annual disposable income of a median household.
149RepoRt on the financial and banking cRisis in spain, 2008-2014
3.2 THE�FINANCIAL�SECTOR
As described in the previous section, in 2012 and early 2013, the macroeconomic situation worsened rapidly, with a 4.2% fall in real GDP in the two years. In parallel, the financial sector became significantly more unstable, with a marked increase in non-performing assets, a significant decline in lending and a growing uncertainty about the solvency of some credit institutions and, by extension, of the banking sector as a whole.
Indeed, there was a sttepening of the decline in lending to households, the contractions sharpening from 2% in 2011 to 5% in 2013, as well as a 5% decrease in loans for house purchases. Likewise, loans to businesses fell from 6% to 13.5% in those years, affecting construction and real estate firms and other types of firms. These declines were accompanied by an increase in the ratio of non-performing loans. The reduction in lending was determined by the need for deleveraging of the household sector as a whole and of non-financial corporations, as well as by the impact of the weak economic outlook on demand and on the credit quality of borrowers. Meanwhile, the difficult financing conditions of Spanish banks on the international markets were reflected in their restrictive lending policies and the maintenance of relatively high lending rates, bearing in mind the notably expansionary monetary policy stance in the Eurosystem. The implementation of bank restructuring plans may also have contributed to curtailing the credit supply at the time.
A. Credit to the resident private sector
In 2012, several economic policy measures were adopted with the aim of reorganising, recapitalising and restructuring the Spanish banking sector.5 These measures included the approval of Royal Decree-Laws 2/2012, of 3 February, and 18/2012, of 11 May, which increased the provisioning requirements for real estate financing. In addition, on 20 July, a Memorandum of Understanding (MoU) on financial sector policy conditionality was signed between Spain and the European Commission, which contained an external financial assistance commitment of up to €100 billion and was accompanied by an exhaustive review of the quality of bank assets.
In 2012 and 2013, the conditions set out in the MoU were met, including the legislative reforms which strengthened the framework for the resolution and recovery of credit institutions, improved transparency in relation to refinancing criteria and the exposure to the real estate sector and reformed the savings banks sector.
The programme of reforms also included the segregation and transfer of the real-estate related troubled assets of institutions receiving State aid to an asset management company for assets arising from bank restructuring (“Sareb”, by its Spanish acronym).
5 �For a detailed explanation of these measures, see Sections 3.4 and 3.5 below.

150 banco de españa
These transfers of troubled assets relating to the real estate sector affected outstanding credit in the Spanish financial system as a whole during this period. The volume fell by more than €324 billion from December 2011 to December 2013, a cumulative decline of 19% over two years. Of this decrease, commercial banks accounted for €62 billion and savings banks for €255 billion6 (these amounts take into account the transfers to the Sareb). These developments are shown in Chart 3.9 below.
By institutional sector, there was a decline in the accumulated outstanding credit in the case of both households (10%) and non-financial corporations (26%). The decline was more pronounced for non-financial corporations, owing to the particular circumstances of the business sector in those crisis years and to the transfer of real estate-related assets to the Sareb (see Chart 3.10).
In the case of lending to households, loans for house purchases fell by a cumulative 8% during those two years. This decline ran parallel to that of house prices, which fell by an additional 14% (see Chart 3.11), while loans for other purposes decreased by more than 20% in the same period. It should be noted that the outstanding balance of such loans, mainly intended for consumption and with relatively short maturities, may rise or fall much faster than loans for house purchases (generally long-term mortgages).
CHART 3.9 LENDING TO THE RESIDENT PRIVATE SECTOR IN SPAIN AND PERCENTAGE OF GDP
60
80
100
120
140
160
180
500
750
1,000
1,250
1,500
1,750
2,000
2000 2001 2002 2003 2004 2005 2006 2007 2008 2009 2010 2011 2012 2013
VOLUME OF LENDING LENDING / GDP (right-hand scale)
€bn %
SOURCES: INE and Banco de España.
6 �From 2010 on, the comparative analysis of commercial banks and savings banks was affected by the reform process in the savings banks sector which started with RDL 11/2010, of 9 July (discussed in Section 3.4 below), and concluded with the conversion of most of the sector into commercial banks. However, a comparative analysis of developments regarding commercial banks and savings banks has been included in the review of the financial sector, purely for illustrative and information purposes. For the purposes of this analysis, the group of savings banks is that comprising the “former savings banks sector”, that is, the institutions whose legal status was once that of savings banks, regardless of whether they were subsequently transformed into banking institutions.
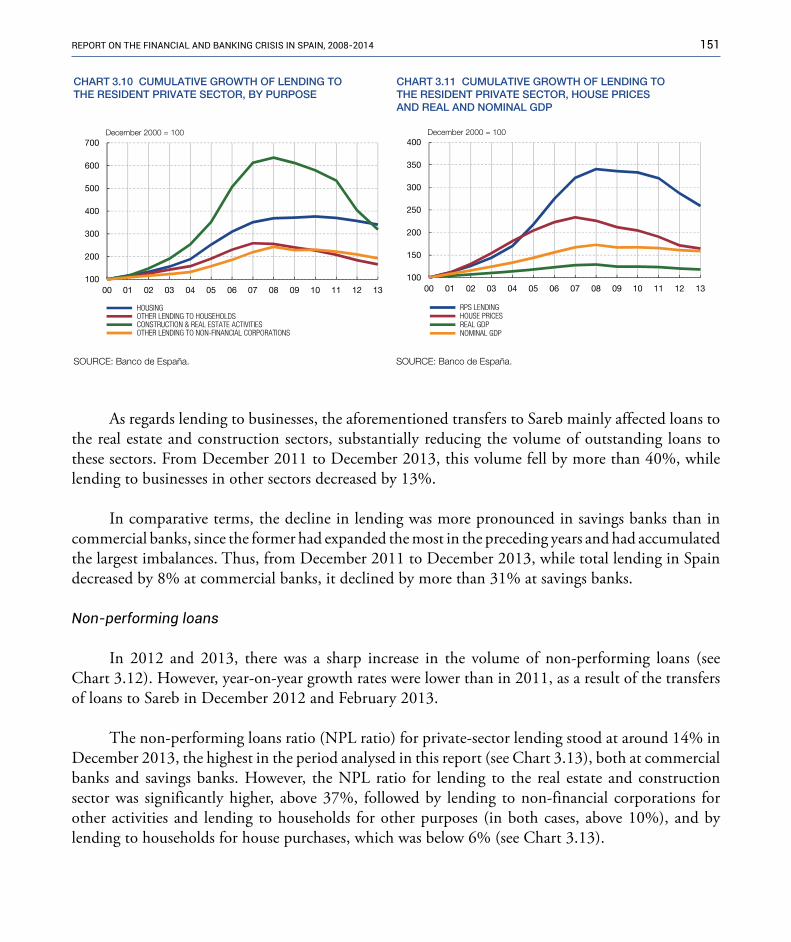
151RepoRt on the financial and banking cRisis in spain, 2008-2014
As regards lending to businesses, the aforementioned transfers to Sareb mainly affected loans to the real estate and construction sectors, substantially reducing the volume of outstanding loans to these sectors. From December 2011 to December 2013, this volume fell by more than 40%, while lending to businesses in other sectors decreased by 13%.
In comparative terms, the decline in lending was more pronounced in savings banks than in commercial banks, since the former had expanded the most in the preceding years and had accumulated the largest imbalances. Thus, from December 2011 to December 2013, while total lending in Spain decreased by 8% at commercial banks, it declined by more than 31% at savings banks.
Non-performing loans
In 2012 and 2013, there was a sharp increase in the volume of non-performing loans (see Chart 3.12). However, year-on-year growth rates were lower than in 2011, as a result of the transfers of loans to Sareb in December 2012 and February 2013.
The non-performing loans ratio (NPL ratio) for private-sector lending stood at around 14% in December 2013, the highest in the period analysed in this report (see Chart 3.13), both at commercial banks and savings banks. However, the NPL ratio for lending to the real estate and construction sector was significantly higher, above 37%, followed by lending to non-financial corporations for other activities and lending to households for other purposes (in both cases, above 10%), and by lending to households for house purchases, which was below 6% (see Chart 3.13).
100
200
300
400
500
600
700
00 01 02 03 04 05 06 07 08 09 10 11 12 13
HOUSING OTHER LENDING TO HOUSEHOLDS CONSTRUCTION & REAL ESTATE ACTIVITIES OTHER LENDING TO NON-FINANCIAL CORPORATIONS
December 2000 = 100
CHART 3.10 CUMULATIVE GROWTH OF LENDING TOTHE RESIDENT PRIVATE SECTOR, BY PURPOSE
CHART 3.11 CUMULATIVE GROWTH OF LENDING TOTHE RESIDENT PRIVATE SECTOR, HOUSE PRICESAND REAL AND NOMINAL GDP
100
150
200
250
300
350
400
00 01 02 03 04 05 06 07 08 09 10 11 12 13
RPS LENDING HOUSE PRICES REAL GDP NOMINAL GDP
December 2000 = 100
SOURCE: Banco de España.SOURCE: Banco de España.
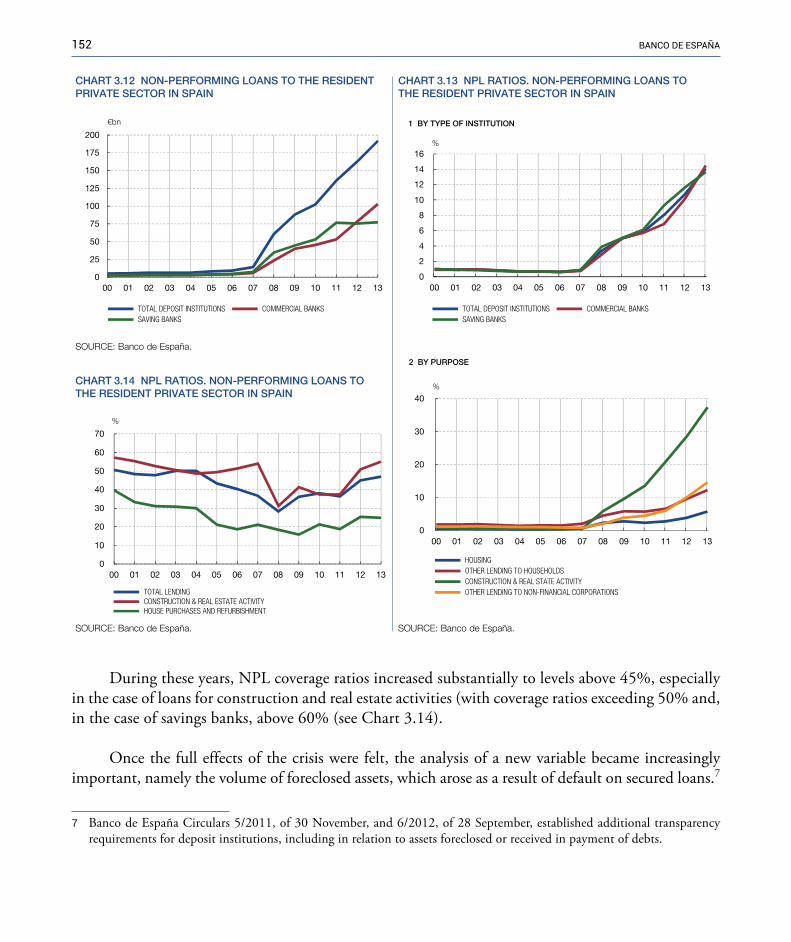
152 banco de españa
During these years, NPL coverage ratios increased substantially to levels above 45%, especially in the case of loans for construction and real estate activities (with coverage ratios exceeding 50% and, in the case of savings banks, above 60% (see Chart 3.14).
Once the full effects of the crisis were felt, the analysis of a new variable became increasingly important, namely the volume of foreclosed assets, which arose as a result of default on secured loans.7
7 �Banco de España Circulars 5/2011, of 30 November, and 6/2012, of 28 September, established additional transparency requirements for deposit institutions, including in relation to assets foreclosed or received in payment of debts.
0
25
50
75
100
125
150
175
200
00 01 02 03 04 05 06 07 08 09 10 11 12 13
TOTAL DEPOSIT INSTITUTIONS COMMERCIAL BANKS SAVING BANKS
TOTAL DEPOSIT INSTITUTIONS COMMERCIAL BANKS SAVING BANKS
€bn
CHART 3.12 NON-PERFORMING LOANS TO THE RESIDENTPRIVATE SECTOR IN SPAIN
CHART 3.13 NPL RATIOS. NON-PERFORMING LOANS TOTHE RESIDENT PRIVATE SECTOR IN SPAIN
0
2
4
6
8
10
12
14
16
00 01 02 03 04 05 06 07 08 09 10 11 12 13
%
1 BY TYPE OF INSTITUTION
0
10
20
30
40
00 01 02 03 04 05 06 07 08 09 10 11 12 13
HOUSING OTHER LENDING TO HOUSEHOLDS CONSTRUCTION & REAL STATE ACTIVITY OTHER LENDING TO NON-FINANCIAL CORPORATIONS
%
2 BY PURPOSE
SOURCE: Banco de España.
SOURCE: Banco de España.
CHART 3.14 NPL RATIOS. NON-PERFORMING LOANS TOTHE RESIDENT PRIVATE SECTOR IN SPAIN
0
10
20
30
40
50
60
70
00 01 02 03 04 05 06 07 08 09 10 11 12 13
TOTAL LENDING CONSTRUCTION & REAL ESTATE ACTIVITY HOUSE PURCHASES AND REFURBISHMENT
%
SOURCE: Banco de España.
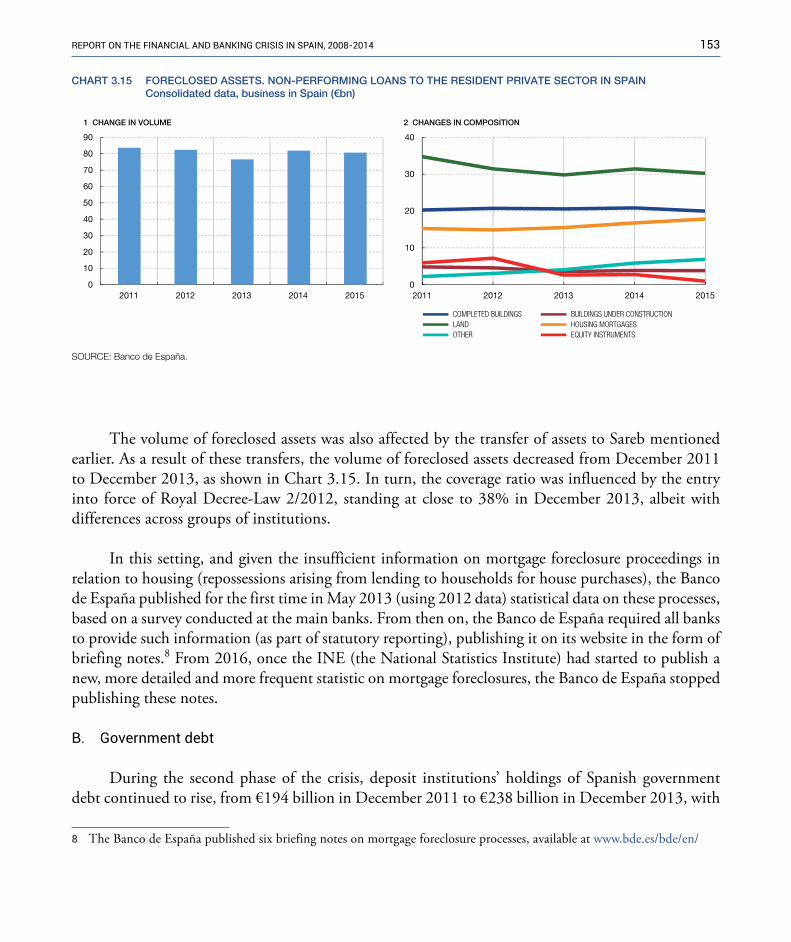
153RepoRt on the financial and banking cRisis in spain, 2008-2014
The volume of foreclosed assets was also affected by the transfer of assets to Sareb mentioned earlier. As a result of these transfers, the volume of foreclosed assets decreased from December 2011 to December 2013, as shown in Chart 3.15. In turn, the coverage ratio was influenced by the entry into force of Royal Decree-Law 2/2012, standing at close to 38% in December 2013, albeit with differences across groups of institutions.
In this setting, and given the insufficient information on mortgage foreclosure proceedings in relation to housing (repossessions arising from lending to households for house purchases), the Banco de España published for the first time in May 2013 (using 2012 data) statistical data on these processes, based on a survey conducted at the main banks. From then on, the Banco de España required all banks to provide such information (as part of statutory reporting), publishing it on its website in the form of briefing notes.8 From 2016, once the INE (the National Statistics Institute) had started to publish a new, more detailed and more frequent statistic on mortgage foreclosures, the Banco de España stopped publishing these notes.
B. Government debt
During the second phase of the crisis, deposit institutions’ holdings of Spanish government debt continued to rise, from €194 billion in December 2011 to €238 billion in December 2013, with
8 �The Banco de España published six briefing notes on mortgage foreclosure processes, available at www.bde.es/bde/en/
0
10
20
30
40
50
60
70
80
90
2011 2012 2013 2014 2015
CHART 3.15 FORECLOSED ASSETS. NON-PERFORMING LOANS TO THE RESIDENT PRIVATE SECTOR IN SPAINConsolidated data, business in Spain (€bn)
SOURCE: Banco de España.
1 CHANGE IN VOLUME 2 CHANGES IN COMPOSITION
0
10
20
30
40
2011 2012 2013 2014 2015
COMPLETED BUILDINGS BUILDINGS UNDER CONSTRUCTION LAND HOUSING MORTGAGES OTHER EQUITY INSTRUMENTS

154 banco de españa
average overall growth of 17.8% in 2012 and 3.8% in 2013 (see Chart 3.16). This increase can be largely explained by the behaviour of savings banks, whose annual rates of change of the volume of government debt on their balance sheets stood at 18.8% and 10.2% in those years. Commercial banks accumulated a substantial volume of government debt in 2012 (13.8%), which, however, was reduced in 2013 (by 8.2%).
The increase in deposit-taking institutions’ holdings of government debt during this period was partly boosted by their use as collateral in the ECB’s liquidity-providing operations with different maturities, and also by the easing of conditions in sovereign debt markets, following the ECB’s announcement in August 2012 that it would launch a secondary markets public sector purchase programme (the so-called Outright Monetary Transactions).
During these years, deposit institutions’ business in Spain, in terms of assets, contracted by around 14%. In the case of savings banks, the decline began in 2012, but not until 2013 in the case of commercial banks. Consequently, the percentage of government debt on financial institutions’ balance sheets continued on the upward trend which had started in the early crisis years, to stand at 8.8% in December 2013 (see Chart 3.17).
The greater growth in the volume of debt held by savings banks and the higher level of deleveraging explain the particularly significant increase in their government debt-to-assets ratio, which rose to 11.6% in December 2013 from 7.2% two years earlier. In the case of commercial banks, the ratio increased by only 1 pp, from 5.5% to 6.5% in two years.
CHART 3.16 SPANISH GENERAL GOVERNMENT DEBTSECURITIES
0
50
100
150
200
250
00 01 02 03 04 05 06 07 08 09 10 11 12 13
TOTAL DEPOSIT INSTITUTIONS COMMERCIAL BANKS SAVINGS BANKS
€bn
CHART 3.17 SPANISH GENERAL GOVERNMENT DEBTSECURITIES AS PERCENTAGE OF TOTAL ASSETS
0
2
4
6
8
10
12
14
00 01 02 03 04 05 06 07 08 09 10 11 12 13
TOTAL INSTITUTIONS COMMERCIAL BANKS SAVINGS BANKS
%
SOURCE: Banco de España. SOURCE: Banco de España.

155RepoRt on the financial and banking cRisis in spain, 2008-2014
C. Deposits and securitisations
In 2012, the volume of total deposits increased somewhat (see Chart 3.18) since, despite the decline in private-sector deposits (see Charts 3.18.3 and 3.19)9, deposits received from the Eurosystem increased significantly from the final quarter of 2011 (with year-on-year rates of change of more than 100% in 2012), to close to €365 billion at the end of 2012 (compared with a volume of less than €70 billion in 2010, see Chart 3.18.2). The higher volume of central bank deposits was accompanied by the strong growth in deposit institutions’ government debt holdings mentioned in the previous section. In any event, the volume of central bank deposits steadied in 2013, albeit at much higher levels than in the earlier preceding period, while private-sector deposits began to recover. In addition, asset securitisations dropped sharply, mainly in the case of commercial banks (see Chart 3.20).
D. Profitability
Royal Decree-Laws 2/2012 and 18/2012 required further efforts to write down loans relating to real estate activity (see Sections 3.4 and 3.5 below). To a large extent, these extraordinary provisions led to a fall in the ROE to -21% in 2012 and to -1.2% in ROA at deposit institutions overall (see Chart 3.21). Net interest income, fee income and operating expenses remained at levels which were relatively similar to those of previous years, although the provisions had a major impact on the final profit or loss for 2012 (see Chart 3.22). The following year, the system overall once again obtained profits, with ROE of 5.2% and ROA of 0.31%.
The full impact of the extraordinary provisions was felt by the business in Spain, particularly at institutions (mainly some savings banks) with a higher portfolio concentration of loans to non-financial corporations in the construction and real estate sectors. For institutions with a greater presence abroad, the improved performance of the foreign business tended to offset that of the business in Spain.
E. Solvency
While institutions had strengthened their solvency in the early crisis phase (2008-2011), the trend reversed in 2012, especially for savings banks (consolidated data, including business abroad, were analysed). The losses reported in 2012 translated into a decrease in institutions’ capital, which was partly reversed the following year (see Chart 3.23). The total capital of the Spanish financial
9 �The sharp decline in lending led to a substantial improvement in deposit institutions’ loan-to-deposit (LTD) ratio, from 143% at 31 December 2011 to 115% at 31 December 2013, despite the slight fall in private-sector deposits, with significant reductions at commercial banks and savings banks (whose ratios dropped from 140% to 112% and 149% to 120%, respectively).

156 banco de españa
CHART 3.18 DEPOSITS AND PERCENTAGE OF TOTAL LIABILITIES
0
20
40
60
80
100
0
500
1,000
1,500
2,000
2,500
2000 2001 2002 2003 2004 2005 2006 2007 2008 2009 2010 2011 2012 2013
€bn %
% o
f lia
bilit
ies
of e
ach
subs
ecto
r
1 TOTAL DEPOSITS
0
4
8
12
16
0
100
200
300
400
00 01 02 03 04 05 06 07 08 09 10 11 12 13
€bn %
% o
f lia
bilit
ies
of e
ach
subs
ecto
r
2 CENTRAL BANK DEPOSITS
0
20
40
60
80
0
200
400
600
800
1,000
1,200
1,400
1,600
00 01 02 03 04 05 06 07 08 09 10 11 12 13
€bn %
% o
f lia
bilit
ies
of e
ach
subs
ecto
r
3 PRIVATE-SECTOR DEPOSITS
CHART 3.19 YEAR-ON-YEAR RATE OF CHANGEOF PRIVATE-SECTOR DEPOSITSTotal deposit institutions
-5
0
5
10
15
20
00 01 02 03 04 05 06 07 08 09 10 11 12 13
%
SOURCE: Banco de España.
SOURCE: Banco de España.
CHART 3.20 SECURITISED ASSETS
0
50
100
150
200
250
300
00 01 02 03 04 05 06 07 08 09 10 11 12 13
TOTAL DEPOSIT INSTITUTIONS COMMERCIAL BANKS SAVINGS BANKS
€bn
SOURCE: Banco de España.
BARS (right-hand scale) TOTAL DEPOSIT INSTITUTIONS COMMERCIAL BANKS SAVINGS BANKS
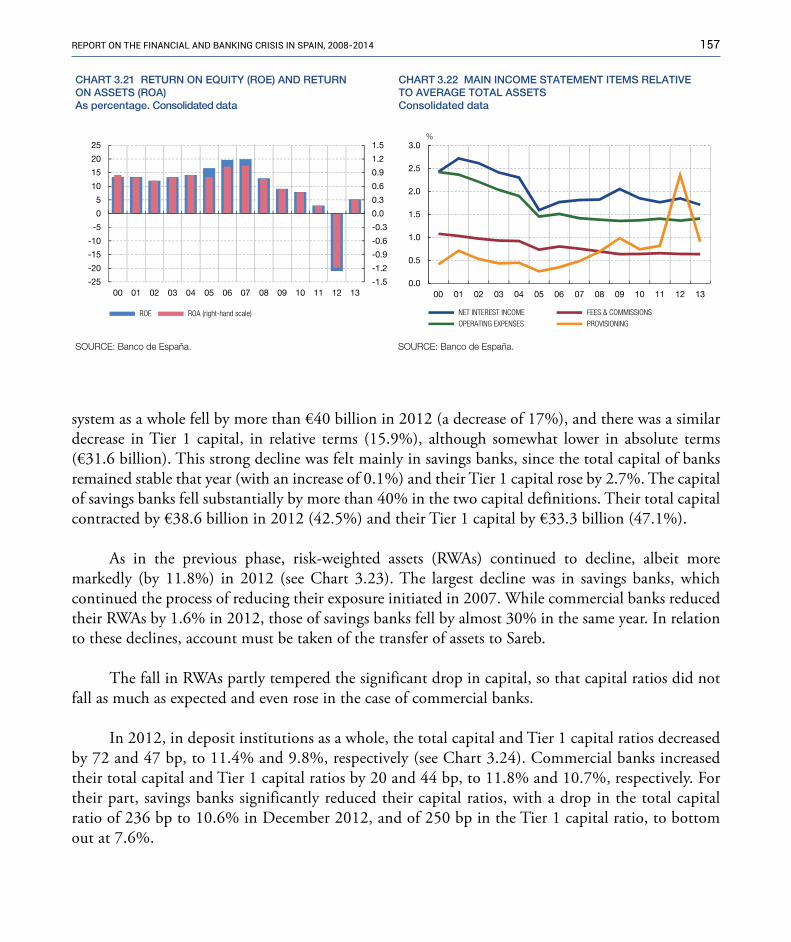
157RepoRt on the financial and banking cRisis in spain, 2008-2014
system as a whole fell by more than €40 billion in 2012 (a decrease of 17%), and there was a similar decrease in Tier 1 capital, in relative terms (15.9%), although somewhat lower in absolute terms (€31.6 billion). This strong decline was felt mainly in savings banks, since the total capital of banks remained stable that year (with an increase of 0.1%) and their Tier 1 capital rose by 2.7%. The capital of savings banks fell substantially by more than 40% in the two capital definitions. Their total capital contracted by €38.6 billion in 2012 (42.5%) and their Tier 1 capital by €33.3 billion (47.1%).
As in the previous phase, risk-weighted assets (RWAs) continued to decline, albeit more markedly (by 11.8%) in 2012 (see Chart 3.23). The largest decline was in savings banks, which continued the process of reducing their exposure initiated in 2007. While commercial banks reduced their RWAs by 1.6% in 2012, those of savings banks fell by almost 30% in the same year. In relation to these declines, account must be taken of the transfer of assets to Sareb.
The fall in RWAs partly tempered the significant drop in capital, so that capital ratios did not fall as much as expected and even rose in the case of commercial banks.
In 2012, in deposit institutions as a whole, the total capital and Tier 1 capital ratios decreased by 72 and 47 bp, to 11.4% and 9.8%, respectively (see Chart 3.24). Commercial banks increased their total capital and Tier 1 capital ratios by 20 and 44 bp, to 11.8% and 10.7%, respectively. For their part, savings banks significantly reduced their capital ratios, with a drop in the total capital ratio of 236 bp to 10.6% in December 2012, and of 250 bp in the Tier 1 capital ratio, to bottom out at 7.6%.
-1.5
-1.2
-0.9
-0.6
-0.3
0.0
0.3
0.6
0.9
1.2
1.5
-25
-20
-15
-10
-5
0
5
10
15
20
25
00 01 02 03 04 05 06 07 08 09 10 11 12 13
ROE ROA (right-hand scale)
CHART 3.21 RETURN ON EQUITY (ROE) AND RETURNON ASSETS (ROA)As percentage. Consolidated data
CHART 3.22 MAIN INCOME STATEMENT ITEMS RELATIVETO AVERAGE TOTAL ASSETSConsolidated data
0.0
0.5
1.0
1.5
2.0
2.5
3.0
00 01 02 03 04 05 06 07 08 09 10 11 12 13
NET INTEREST INCOME FEES & COMMISSIONS OPERATING EXPENSES PROVISIONING
%
SOURCE: Banco de España.SOURCE: Banco de España.
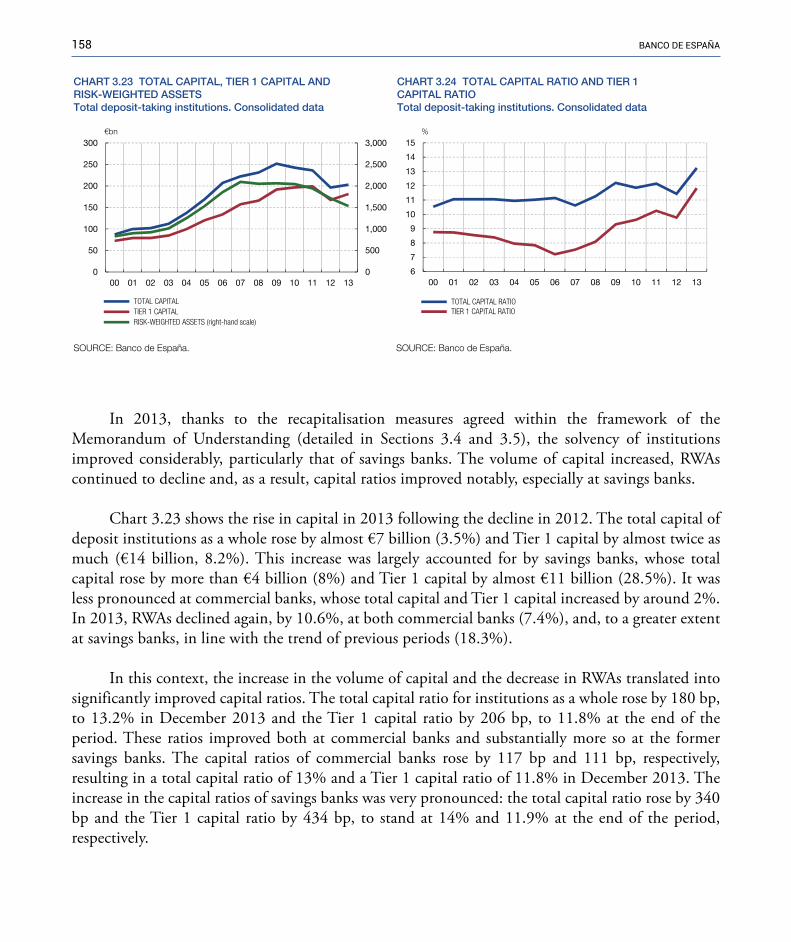
158 banco de españa
In 2013, thanks to the recapitalisation measures agreed within the framework of the Memorandum of Understanding (detailed in Sections 3.4 and 3.5), the solvency of institutions improved considerably, particularly that of savings banks. The volume of capital increased, RWAs continued to decline and, as a result, capital ratios improved notably, especially at savings banks.
Chart 3.23 shows the rise in capital in 2013 following the decline in 2012. The total capital of deposit institutions as a whole rose by almost €7 billion (3.5%) and Tier 1 capital by almost twice as much (€14 billion, 8.2%). This increase was largely accounted for by savings banks, whose total capital rose by more than €4 billion (8%) and Tier 1 capital by almost €11 billion (28.5%). It was less pronounced at commercial banks, whose total capital and Tier 1 capital increased by around 2%. In 2013, RWAs declined again, by 10.6%, at both commercial banks (7.4%), and, to a greater extent at savings banks, in line with the trend of previous periods (18.3%).
In this context, the increase in the volume of capital and the decrease in RWAs translated into significantly improved capital ratios. The total capital ratio for institutions as a whole rose by 180 bp, to 13.2% in December 2013 and the Tier 1 capital ratio by 206 bp, to 11.8% at the end of the period. These ratios improved both at commercial banks and substantially more so at the former savings banks. The capital ratios of commercial banks rose by 117 bp and 111 bp, respectively, resulting in a total capital ratio of 13% and a Tier 1 capital ratio of 11.8% in December 2013. The increase in the capital ratios of savings banks was very pronounced: the total capital ratio rose by 340 bp and the Tier 1 capital ratio by 434 bp, to stand at 14% and 11.9% at the end of the period, respectively.
0
500
1,000
1,500
2,000
2,500
3,000
0
50
100
150
200
250
300
00 01 02 03 04 05 06 07 08 09 10 11 12 13
TOTAL CAPITAL TIER 1 CAPITAL RISK-WEIGHTED ASSETS (right-hand scale)
€bn
CHART 3.24 TOTAL CAPITAL RATIO AND TIER 1 CAPITAL RATIOTotal deposit-taking institutions. Consolidated data
6
7
8
9
10
11
12
13
14
15
00 01 02 03 04 05 06 07 08 09 10 11 12 13
TOTAL CAPITAL RATIO TIER 1 CAPITAL RATIO
%
SOURCE: Banco de España.SOURCE: Banco de España.
CHART 3.23 TOTAL CAPITAL, TIER 1 CAPITAL ANDRISK-WEIGHTED ASSETSTotal deposit-taking institutions. Consolidated data
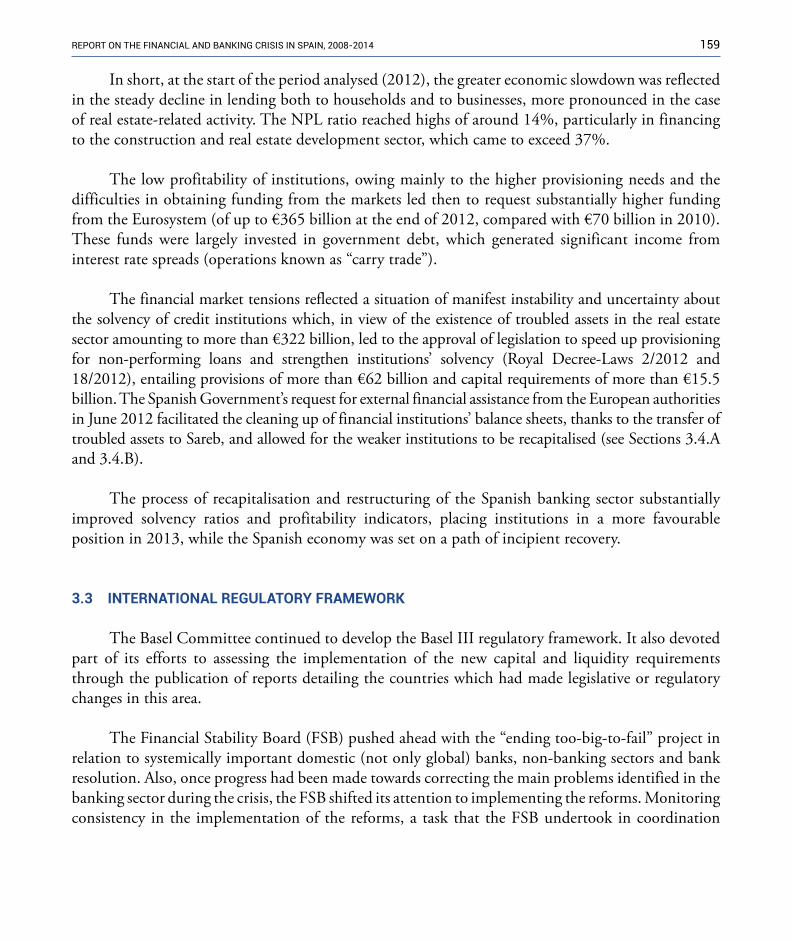
159RepoRt on the financial and banking cRisis in spain, 2008-2014
In short, at the start of the period analysed (2012), the greater economic slowdown was reflected in the steady decline in lending both to households and to businesses, more pronounced in the case of real estate-related activity. The NPL ratio reached highs of around 14%, particularly in financing to the construction and real estate development sector, which came to exceed 37%.
The low profitability of institutions, owing mainly to the higher provisioning needs and the difficulties in obtaining funding from the markets led then to request substantially higher funding from the Eurosystem (of up to €365 billion at the end of 2012, compared with €70 billion in 2010). These funds were largely invested in government debt, which generated significant income from interest rate spreads (operations known as “carry trade”).
The financial market tensions reflected a situation of manifest instability and uncertainty about the solvency of credit institutions which, in view of the existence of troubled assets in the real estate sector amounting to more than €322 billion, led to the approval of legislation to speed up provisioning for non-performing loans and strengthen institutions’ solvency (Royal Decree-Laws 2/2012 and 18/2012), entailing provisions of more than €62 billion and capital requirements of more than €15.5 billion. The Spanish Government’s request for external financial assistance from the European authorities in June 2012 facilitated the cleaning up of financial institutions’ balance sheets, thanks to the transfer of troubled assets to Sareb, and allowed for the weaker institutions to be recapitalised (see Sections 3.4.A and 3.4.B).
The process of recapitalisation and restructuring of the Spanish banking sector substantially improved solvency ratios and profitability indicators, placing institutions in a more favourable position in 2013, while the Spanish economy was set on a path of incipient recovery.
3.3 INTERNATIONAL�REGULATORY�FRAMEWORK
The Basel Committee continued to develop the Basel III regulatory framework. It also devoted part of its efforts to assessing the implementation of the new capital and liquidity requirements through the publication of reports detailing the countries which had made legislative or regulatory changes in this area.
The Financial Stability Board (FSB) pushed ahead with the “ending too-big-to-fail” project in relation to systemically important domestic (not only global) banks, non-banking sectors and bank resolution. Also, once progress had been made towards correcting the main problems identified in the banking sector during the crisis, the FSB shifted its attention to implementing the reforms. Monitoring consistency in the implementation of the reforms, a task that the FSB undertook in coordination

160 banco de españa
with other international committees, sought to prevent regulatory differences which could affect the overall effectiveness of the agreed measures.
In 2012, there were advances in other areas, including: the international regulation of non-banking sectors such as “shadow banking”, for which the regulatory strategy and areas requiring measures to be developed were defined; and the derivatives markets (OTC), where progress was made on the reforms advocated by the G20 (for example, the reduction of bilateral exposures between institutions arising from derivatives.)
A. Basel banking regulation
In June 2011, the Basel Committee on Banking Supervision (BCBS) published the final text of what is known as Basel III, to address the lessons learned from the crisis10 (see section 2.3.A.1). The gradual implementation of these regulations in Europe began in 2013 and will foreseeably be completed by 2019, except in relation to instruments not qualifying as eligible under the new definition of capital, which can be only be partly included until 2023.
In January 2013, the revised short-term liquidity ratio (LCR) regulations were published, which, among other things, increased the number of eligible instruments such as high-quality liquid assets, and reviewed their implementation, which changed from full in 2015 to gradual from 2015 to 2019.
In October 2012, the BCBS published the review of the Core Principles for Effective Banking Supervision, a set of standards which contribute to ensuring sound regulation and prudential supervision of the banking sector. These standards are used by the International Monetary Fund and the World Bank in their Financial Sector Assessment Program (FSAP) to verify the effectiveness of banking supervision systems and practices across countries.
B. other areas of regulatory reform – FSB
During these years, the FSB pressed ahead with its regulatory agenda on several fronts, most notably:
— A framework for the treatment of systemically important institutions (“ending too-big-to-fail”). The FSB made further progress in the development and implementation of a regulatory framework for global systemically important institutions, including global systemically important banks (G-SIBs11), domestic systemically important banks
10 �Basel III: A global regulatory framework for more resilient banks and banking systems - revised version June 2011 – BCBS.11 �For a brief overview of the progress made and remaining issues in the SIFIs project, see Progress and Next Steps Towards
Ending “Too-Big-To-Fail” (TBTF) (September 2013) – FSB.
161RepoRt on the financial and banking cRisis in spain, 2008-2014
(D-SIBs),12 non-banking sector institutions such as insurance firms,13 central counterparty clearing houses (CCPs) (in coordination with the CPMI14 and IOSCO15), or securities firms. The FSB continues to publish a list of global systemically important institutions (G-SIBs) identified annually.16
— Regulation and monitoring of shadow banking. The FSB applied a dual strategy which consisted of: (i) creating a monitoring framework to analyse the risks of shadow banking in greater depth; (ii) developing regulatory measures to address systemic risks identified. In 2013, the FSB presented the G20 with a regulatory policy framework to strengthen the monitoring and regulation of shadow banking entities.17 It also sent a summary of the measures adopted to address the systemic risks that shadow banking may pose to the financial system.18
— OTC derivatives markets. In 2013, the FSB also noted the progress made in ensuring that these derivatives are traded on organised platforms and transactions are reported to central registers (trade repositories). In its progress reports on the implementation of the reforms in OTC derivatives markets, the FSB stressed the lower bilateral exposure between institutions to such transactions, owing to the growing use of centralised clearing through CCPs and, in some cases, to the introduction of minimum capital and buffer requirements, while pointing out that progress was not uniform across jurisdictions.
— Other developments. In April 2012, in response to one of the causes of the crisis,19 the FSB released a set of principles which included criteria for granting residential mortgages, further developing the recommendations previously issued by the Joint Forum.20 The
12 �D-SIB: Domestic Systemically Important Bank. See Extending the G-SIFI Framework to Domestic Systemically Important Banks (April 2012) – BCBS. The Principles published by the BCBS nevertheless allow countries a certain degree of discretion when identifying and implementing measures, in view of the structural features of the different financial systems.
13 �FSB identifies G-SIIs and the Policy Measures that will Apply to Them (July 2013) – FSB.14 �BIS Committee on Payments and Market Infrastructures (CPMI).15 �International Organization of Securities Commission (IOSCO).16 �The FSB publishes the updated lists of G-SIBs annually in Update of Group of Global Systemically Important Banks (G-SIBs).
The list published in 2013 also indicated the capital surcharge corresponding to each G-SIB on the basis of its systemicity. The FSB also supports the setting up of so-called “crisis management groups” (CMG) for most G-SIBs.
17 �Policy Framework for Strengthening Oversight and Regulation of Shadow Banking Entities (FSB, August 2013).18 �An Overview of Policy Recommendations for Shadow Banking (FSB, August 2013).19 �Principles for Sound Residential Mortgage Underwriting Practices (FSB, April 2012).20 �The Joint Forum was set up in 1996 under the auspices of the Basel Committee on Banking Supervision (BCBS), the
International Organisation of Securities Commissions (IOSCO) and the International Association of Insurance Supervisors (IAIS). See Review of the Differentiated Nature and Scope of Financial Regulation-Key Issues and Recommendations (January 2010), Joint Forum.
162 banco de españa
FSB also promoted the formulation of recommendations on the public dissemination of information by the banking industry and continued to strengthen the analysis of the unintended effects of the regulatory reforms in emerging and developing economies.
C. European regulations (2012-2013)
At this stage of the crisis, the European Banking Authority (EBA), established in January 2011, was already fully operational, with well-defined regulatory capacities and powers to: (i) draw up binding regulatory technical standards and (ii) issue guidelines which, although not binding, are to be adopted by national authorities (which must provide an explanation for not doing so).21
The EBA’s work during these two years largely consisted of developing, through technical standards and implementing guidelines, the various mandates contained in the European Directive and Regulation on capital requirements (CRD IV and CRR22). In 2012 and 2013, the EBA completed and submitted around 50 technical standards and published eight sets of guidelines.
The technical standards notably included:
— Own funds. The CRR, which transposed Basel III into European legislation, conferred on the EBA the task of developing the new capital requirements, particularly in relation to the standardisation of supervisory criteria for specific preferential treatment provided for in the law. This resulted in four technical standards which were submitted to the Commission between 2013 and 2014.
— Additional information to be provided by institutions to supervisors. The lack of information on the state of assets in institutions’ balance sheets and on asset encumbrance (which hindered adequate assessment of risks), was one of the weaknesses identified when analysing the causes of the financial crisis. To address this problem, the EBA prepared three implementing standards for institutions to submit detailed information on non-performing mortgage loans and forbearance measures, and on their level of asset encumbrance.
— Remuneration. CRD III and IV proposed measures for monitoring and controlling remuneration in the banking sector, considering that institutions’ incentives policies in the years preceding the crisis had led to excessive risk-taking on their part, and was one of the
21 �The technical standards are submitted by the EBA to the European Commission. Once they are adopted by the Commission, they become directly applicable Commission Regulations. Although the guidelines issued by the EBA are not binding, supervisory authorities must adopt them or else provide an explanation for not doing so.
22 �Directive 2013/56 and Regulation 575/2013, both dated 13.06.2013. See Box 4.1.
163RepoRt on the financial and banking cRisis in spain, 2008-2014
factors contributing to the crisis. Both directives conferred on the EBA the task of developing different aspects of these measures, in the form of technical standards and guidelines. Thus, in 2013 the EBA presented the Commission with a technical standard to identify categories of staff with a material impact on an institution’s risk profile, to which remuneration policies which did not encourage excessive risk-taking would be applied.
The most significant guidelines were those focusing on aspects of the legislation relating to management staff at institutions and control of remuneration.
— Guidelines on the assessment of the suitability of members of the management body and key function holders (EBA/GL/2012/06). Aimed at addressing problems of governance and lack of suitability of managers, both of which contributed to excessive risk-taking and led to critical situations at institutions.
— Guidelines on the data collection exercise regarding high earners (EBA/GL/2012/05). Measures established to monitor remuneration included: inventory of bank staff earning a total remuneration of more than €1 million per year, for subsequent publication. This is one of the elements that enables supervisors to assess, under Pillar 2, if incentives applied by institutions are aligned with their long-term objectives.
— Guidelines on the remuneration benchmarking exercise (EBA/GL/2012/04). Guidelines to conduct the remuneration benchmarking exercise at European institutions. The results of this exercise are part of the tools that the authorities can use to carry out the supervisory review of remuneration policies.
In addition, in 2012 and 2013, the recapitalisation exercise initiated at the end of 2011 was completed. This process began with the publication of an EBA recommendation (EBA/REC/2011/1) urging banks to reach a 9% Core Tier 1 ratio by June 2012, with an additional buffer for sovereign debt exposures. In October 2012, in response to the adverse financial market conditions, the EBA announced that it would issue a new recommendation for institutions to preserve the level of Core Tier 1 capital attained. In July 2013, it published recommendation EBA/REC/2013/03, advising institutions to preserve the level of Core Tier 1 capital they had reached at 30 June 2012, during the transitional period leading to the entry into force of CRD IV - CRR (December 2014).
Also to restore market confidence in the EU banking sector, the EBA issued a new recommendation in October 2013 (EBA/REC/2013/04) urging authorities to undertake asset quality review exercises at institutions under their supervision, specifically of asset classes considered to be high risk. The recommendation aimed to contribute to the adoption of a more uniform supervisory approach when analysing banks’ portfolios, so that the capital levels required to cover actual risks could be properly assessed.
164 banco de españa
3.4 SPANISH�REGULATORY�FRAMEWORK
In the regulatory arena, the first half of 2012 was characterised by write-down of credit institutions’ exposures to the real estate sector. From July 2012, the regulatory initiatives in the banking sector were conditioned by the signature of the Memorandum of Understanding (MoU) between the European and Spanish authorities, under which an independent assessment was made of the Spanish banking sector.
Other legal changes in the period included most notably the Europe-wide approval of the solvency rules set out in Directive 2013/36/EU (CRD IV) and Regulation (EU) No 575/2013 (CRR) and the transposition to Spanish law of the former in Royal Decree-Law 14/2013 of 29 November 2013. Also notable was the publication of Banco de España Circular 6/2012 of 28 September 2012, the main objective of which was to increase the transparency of credit institutions regarding their forbearance transactions and the provisions for them (see Box 3.1).
A. Write-down of exposures to the real estate sector23
In February and May 2012 two royal decree-laws were promulgated for the purpose of reducing the uncertainty persisting over the on-balance-sheet valuation of assets associated with construction and real estate development: Royal Decree-Law 2/2012 of 3 February 2012 on balance sheet clean-up of the financial sector (Royal Decree-Law 2/2012) and Royal Decree-Law 18/2012 of 11 May 2012 on the write-down and sale of financial sector real estate assets (Royal Decree-Law 18/2012).
A.1 The measures introduced by Royal Decree-Law 2/2012 were threefold:24
— Specific provisions for troubled loans: 25 additional specific provisions were set to cover losses on troubled assets derived from construction and real estate development lending (including non-performing and substandard loans26 and foreclosed assets). These provisions varied depending on the type of asset involved:
23 �Section 3.5.A describes the main effects of the application of this legislation.24 �Taking as a reference the outstanding amount of institutions’ on-balance-sheet exposures to the real estate sector as at
31.12.2011.25 �Troubled loans are those credit transactions in which objective factors (e.g. instalments more than 90 days past due) or
subjective factors (e.g. borrower company with high recurring losses) cast doubt on the ability of borrowers to meet their obligations as and when required. Performing loans are those transactions where, in principle, there is no doubt about their repayment.
26 �Defined as credit which, although not in arrears, exhibits weaknesses which may entail future losses exceeding the general provision calculated for performing transactions.

165RepoRt on the financial and banking cRisis in spain, 2008-2014
— 3 February 2012: Royal Decree-Law 2/2012 on balance sheet clean-up of the financial sector.
— 11 May 2012: Royal Decree-Law 18/2012 on the write-down and sale of financial sector real estate assets.
— 20 July 2012: Signature of the Memorandum of Understanding (MoU) between the European Commission and Spain, containing two documents:
• Memorandum on financial-sector policy conditionality, and
• Framework agreement on financial assistance between the European Financial Stability Facility, Spain as beneficiary Member State, the Fund for the Orderly Restructuring of the Banking Sector (FROB, by its Spanish acronym) as guarantor and the Banco de España.
• Legislative measures relating to the MoU:
— 31 August 2012: Royal Decree-Law 24/2012 on restructuring and resolution of credit institutions (later included in Law 9/2012).
— 14 November 2012: Law 9/2012 on restructuring and resolution of credit institutions.
— 15 November 2012: Royal Decree 1559/2012 establishing the legal regime governing asset management companies.
— 22 March 2013: Royal Decree-Law 6/2013 on protection of the holders of certain savings and investment products and other financial measures.
— 27 December 2013: Law 26/2013 on the savings banks and banking foundations.
— 28 September 2012: Banco de España Circular 6/2012 amending Circular 4/2004 of 22 December 2004 on public and confidential financial reporting rules and formats.
— 26 June 2013: Directive 2013/36/EU of the European Parliament and of the Council, on access to the activity of credit institutions and the prudential supervision of credit institutions and investment firms.
— 26 June 2013: Regulation (EU) No 575/2013 of the European Parliament and of the Council, on prudential requirements for credit institutions and investment firms.
— 29 November 2013, Royal Decree-Law 14/2013 on urgent measures for the adaptation of Spanish law to European Union rules on the supervision and solvency of financial institutions.
box 3.1 MAIN LEgAL ChANgES IN SPAIN IN ChRoNoLogICAL oRDER (2012-2013)

166 banco de españa
— 60% in land financing transactions;
— 50% in financing of property developments in progress (excluding developments that continued in progress and were classified as substandard, in which case the provisioning level was 24%);
— up to 50% in the fourth year on the balance sheet (40% for houses of individuals) in the case of foreclosed completed developments and other collateral;
— in other non-performing real estate loans, the provision had to be for 25% of the loan, and in other transactions classified as substandard the provision had to be at least 20% or 24%, depending on whether or not there was collateral.
— Capital surcharge: also, troubled assets linked to land and to developments in progress had to be covered by additional amounts of top-quality capital (core capital).
— Provisions for performing loans:27 performing (current in payment) land, construction and real estate development loans had to be provisioned at one time for 7% of their outstanding amount as at 31.12.2011.28
Credit institutions had to comply with all these requirements during 2012, for which purpose by 31 March they had to submit for approval by the Banco de España a plan detailing the strategies they would pursue to ensure such compliance. The compliance deadline could be extended by 12 months more in the case of institutions that underwent mergers in 2012.29 To encourage such mergers, Royal Decree-Law 2/2012 empowered the FROB to purchase convertible bonds wherever necessary.
A.2 Subsequently, Royal Decree-Law 18/2012 established two additional measures to bolster the balance sheet clean-up:
— First, additional provisions were required to cover performing loans linked to the real estate sector. The provisioning level varied depending on the type of collateral backing the loans, being highest for those lacking collateral or with collateral in the form of land.
27 �See footnote 25.28 �The provisions thus set aside, although classified as general, were for the loans which had served as a basis for their
calculation, and, accordingly, could only be used to cover the needs derived from subsequent reclassifications of these loans or those derived from foreclosure of assets in satisfaction of the loans.
29 �Mergers which, moreover, had to meet certain conditions such as a minimum size of the resulting institution, improvements in corporate governance, household and SME lending targets and objectives for the reduction of exposure to construction and real estate development.
167RepoRt on the financial and banking cRisis in spain, 2008-2014
Institutions had to submit to the Banco de España, no later than 11 June 2012, their plans for complying with this new requirement, including also a programme and a timetable for divestment of assets linked to the real estate sector.
— Second, public limited companies had to be formed to which institutions had to transfer the real estate foreclosed or received in satisfaction of debts relating to land, construction and real estate development. The purpose of this was to isolate such assets and facilitate their sale on the market.30
B. Memorandum of Understanding (MoU) with the European Commission
On 25 June 2012, in view of the situation of the sovereign debt markets and the need to support the restructuring and recapitalisation of the banking sector, the Spanish Government formally requested financial assistance from the European authorities, such assistance being approved by the Eurogroup at the Brussels Summit on 29 June. The MoU between the European Commission and Spain consists of two documents: (i) memorandum of understanding on financial-sector policy conditionality conditions, signed on 23 July and (ii) framework agreement on financial aid, 24 July. The MoU contained a financial assistance commitment of up to €100 billion.
The ultimate objective of the MoU was to support the Spanish banking sector and restore confidence in order to regain access to the international financial markets. For this purpose, the programme had three main components (see Box 3.2):
(i) Determination of the capital needs of each credit institution, which gave rise to a classification of institutions into four groups (groups 0 to 3, based on capital shortfall and whether or not they needed State aid). The basis of this exercise was a top-down test initiated in May and whose results were published on 21 June 2012;
(ii) Establishment of strategies for the recapitalisation, restructuring and/or resolution of the more vulnerable institutions, for which strategies were set depending on the group in which the institution had been classified; and
(iii) Segregation of impaired assets31 of the institutions which received public support for their recapitalisation.
30 �These companies, if they received financing from the contributor, were obliged to sell each year at least 5% of their assets to third parties.
31 �Particularly real estate development loans and assets derived from mortgage foreclosure.

168 banco de españa
Main components of the MoU1
Determination of capital needs. The capital needs of each bank were determined through asset quality analysis and stress tests, taking as a basis the diagnosis resulting from the external assessment tests which were being conducted. The results served to classify banks into four groups:
— Group 0 (banks meeting the required solvency levels and not having any capital shortfall).
— Group 1 (banks already owned by the FROB2).
— Group 2 (banks with capital shortfalls detected in the stress test and which needed State aid to cover them).
— Group 3 (banks with capital shortfalls detected in the stress test and which were able to meet them without State aid).
Recapitalisation, restructuring and/or resolution of the most vulnerable banks
Based on the capital shortfalls detected in the stress tests, a strategy was established for each institution according to the principles of viability, limitation of distortions in competition and minimisation of the taxpayer burden through a burden-sharing system which, in addition to shareholders, affects the holders of hybrid instruments (preference shares) and subordinated debt3 through
voluntary and mandatory subordinated liability exercises.
— Groups 1 and 2: these had to submit restructuring or resolution plans (depending on whether they were viable or not, respectively) which had to be approved by the European Commission before assistance was provided.
— Group 3: Two cases were distinguished: (i) banks planning to increase capital significantly (by more than 2% of risk-weighted assets). These institutions had to issue, as a precautionary measure, convertible bonds which could be subscribed by the FROB and had to be redeemed by 30.6.2013 if they succeeded in raising the envisaged private capital (otherwise, the bonds were to be converted into common shares and the institutions had to submit restructuring plans), and (ii) banks planning to increase capital by less than 2% of risk-weighted assets, which had until 30.6.2013 to achieve their objective (otherwise, they would be recapitalised with State aid, having to submit restructuring plans).
Segregation of impaired assets in banks receiving public support for their recapitalisation, and transfer of the impaired assets to an external asset management company. The transfer would be made taking into account the long-term real economic value of the assets4 and losses realised in the banks at the time of the segregation.
box 3.2 MAIN ELEMENTS oF ThE MEMoRANDUM oF UNDERSTANDINg (MoU)
1 The process of determination of external aid under the MoU for financial system restructuring is described in Section 3.4.B.2.
2 BFA-Bankia, Catalunya Caixa, NCG Banco and Banco de Valencia.
3 Which entails these securities being converted into equity by means of public capital injection or by buying them back at considerable discounts.
4 Which meant the use of more prudent criteria allowing a sustainable market reference avoiding extremes (excessive value due to bubble effects or reduction in value due to crises).
169REPoRt oN thE FINANCIAl AND BANkING CRISIS IN SPAIN, 2008-2014
Other regulatory commitments under the MoU
— Strengthen the solvency of institutions through compliance by all of them with CET1 ratio of 9%.
— Strengthen the governance of savings banks.
— Limit the remuneration of executives and directors of banks receiving State aid.
— Additional transparency exercises on the situation of the sector. Commitment to review and fine tune supervisory procedures in order to strengthen the supervisory framework.
box 3.2 MAIN ELEMENTS oF ThE MEMoRANDUM oF UNDERSTANDINg (MoU) (cont’d)
Additionally, the MoU established horizontal conditionality for the sector as a whole, as follows:
— Strengthen the solvency of institutions such that all of them meet a CET1 ratio of 9%.
— Strengthen the governance of savings banks and limit the remuneration of executives and directors of the institutions which received State aid.
— Conduct additional transparency exercises on the situation of the sector.
The MoU also included the decision to review the Banco de España’s supervision procedures in order to strengthen the supervisory framework.
The pre-defined road map in the MoU was initiated in July 2012 with the provision of the first tranche of assistance, €30 billion,32 and extended over 18 months. Finally, the State aid disbursed, at €41,333 million, was less than the agreed maximum,33 which, as noted above, was €100 billion. Of that amount, €38,833 million were used directly for restructuring certain credit institutions (listed in the following section) and €2.5 billion were used by the FROB to capitalise Sareb.
A delegation from the European Commission and the ECB, in cooperation with the IMF, the EBA and the ESM, periodically monitored compliance with the financial assistance programme and
32 �The FROB, acting as a government agent, channelled the funds to the institutions affected.33 �At present, €6,612 million have been voluntarily repaid.
170 banco de españa
fulfilment of the commitments given. This monitoring was carried out through periodic missions by a delegation of these institutions in Spain.34
Once the stress tests had been carried out to determine the capital needs of the banking sector in general and of each institution in particular, the commitments under the MoU were written into the respective implementing legal provisions listed in Box 3.1, which included most notably those relating to: (i) credit institution restructuring and resolution; (ii) creation of Sareb and (iii) reform of the legal framework for savings banks.
B.1. Stress tests and identification of capital needs35
On 11 May 2012, to strengthen confidence in Spanish credit institutions and determine the sector’s capital needs, the Government entrusted the Ministry of Economic Affairs and Competitiveness with an external analysis at aggregate level (known as a top-down analysis) to assess the resilience of the Spanish banking sector to the severe deterioration affecting the Spanish economy. The results of this exercise were published on 21 June.
Once the MoU had been signed, in early July the aforementioned exercise was supplemented with a second analysis, disaggregated bank by bank (known as a bottom-up analysis), to determine the specific needs of each of them, including a detailed review of the institutions’ asset portfolios. As stated in the press release published by the Banco de España when the test was completed on 31 July 2012, “This process is one of the most relevant steps of a holistic strategy to restore and strengthen the soundness of the Spanish banking sector. It is also an integral part of the Memorandum of Understanding on Financial-Sector Policy Conditionality (MoU) approved by the Eurogroup on 20 July” (Section 3.5.B gives details of these exercises).
B.2 Recapitalisation, restructuring and/or resolution of credit institutions (Royal Decree-Law 24/2012 and subsequent Law 9/2012).
On 31 August 2012, the Government approved Royal Decree-Law 24/2012 on the restructuring and resolution of credit institutions, with immediate effect. It was subsequently replaced by Law 9/2012 of 14 November. This legislation legally recognised the commitments given under the MoU
34 �The monitoring can be divided into two phases. The first phase took place during the programme and the last visit was in December 2013 (it was the fifth and last review). The official communication of the result expressly indicated that “A delegation from the European Commission, in liaison with the European Central Bank, carried out the fifth and last review of the financial sector assistance programme for Spain from 2 December to 13 December 2013”. The second phase was undertaken within the framework of the post-programme visits. The first visit of this type was in April 2014 (report dated 9.4.2014).
35 �Details and results of these tests are described extensively in Section 3.5.B.1 below.

171RepoRt on the financial and banking cRisis in spain, 2008-2014
and strengthened the mechanisms available to the Spanish authorities to reinforce and clean up the financial system.36 Its main features are summarised below.
crisis ManageMent
A strengthened bank crisis management framework was designed which wrote into Spanish law many of the measures included in what was then only a draft of the European bank recovery and resolution directive. Depending on the seriousness of the situation of the distressed bank, the measures available for effective restructuring or orderly resolution, as applicable, were as follows:
(i) Early intervention measures, at the request of the Banco de España, for when a bank failed (or would foreseeably fail) to meet solvency, liquidity, organisational structure or internal control requirements, but would foreseeably be able to return to compliance through its own means or with exceptional financial support.37 The bank had to prepare an action plan describing the measures for ensuring its long-term viability and subject to approval by the Banco de España,38 which, moreover, had to be informed quarterly of its degree of compliance. In this phase, if the bank’s situation deteriorated significantly, the Banco de España could require the provisional replacement of directors.
(ii) Restructuring measures, to be applied to banks requiring public support to ensure their viability but having the capacity to return the State aid received within the legally stipulated time period for each support instrument. A restructuring plan prepared by the bank and subject to the Banco de España’s approval was necessary. The restructuring instruments envisaged were various types of financial support39 and the transfer of assets or liabilities to an asset management company.
(iii) Resolution measures, to be applied to banks considered non-viable but whose winding-up was to be avoided for reasons of public interest. The tools envisaged here were the
36 �This law incorporated the elements of Royal Decree-Law 24/2012 of 31 August 2012 which wrote into Spanish law the commitments under the MoU of July 2012 within the framework of credit institution restructuring and resolution. This Royal Decree-Law was subsequently repealed by Law 9/2012, which thenceforth regulated this area.
37 �Through instruments convertible into shares with a repurchase or maturity period not exceeding two years.38 �It also had to set out, inter alia, specific targets for efficiency, profitability, solvency and liquidity, improvement of corporate
governance, reduction of overhead costs and resizing of productive capacity. If the bank requested public financial support, the FROB had to issue a report prior to the plan being approved by the Banco de España.
39 �Including the granting of guarantees/collateral or loans, purchase of assets or liabilities, recapitalisation through common shares or equity contributions (representing an equity holding based on the bank’s economic value and conferring on the FROB voting rights in the same proportion) or instruments convertible into shares (commonly called “CoCos”, short for contingent convertible bonds), with a maturity not exceeding five years. These instruments would count as Tier 1 capital and core capital without limitation.
172 banco de españa
sale of the business for the transfer of assets and liabilities to a bridge bank or asset management company.40 Once the resolution process had commenced, the Board of Directors had to be replaced. The FROB had to draft a resolution plan setting out, inter alia, the economic valuation of the bank and the arrangements made so that, apart from the bank’s shareholders, the holders of preference shares and subordinated debt would bear a part of the restructuring costs. These plans were subject to approval by the Banco de España and the European Commission in the final instance.
It should be noted that, prior to adopting any restructuring or resolution measure, it was necessary to determine the economic value of the bank (determined by one or more independent experts in accordance with Article 5 of Law 9/2012). This enabled the recognition of the losses derived from application of the instruments to be used and the determination of the advisability of these solutions as alternatives to winding-up, by comparing the loss of value entailed in each alternative. This valuation also served as a basis for the granting of the agreed public financial support.
allocation oF recaPitalisation costs
In accordance with the MoU, to lighten the burden on taxpayers, the law established, in addition to the costs to be borne by stakeholders, members or non-voting equity unit holders (as applicable), mechanisms by which the holders of hybrid capital instruments (preference shares) and subordinated debt, in line with their hybrid nature, would bear a portion of the bank recapitalisation costs. These hybrid instrument burden-sharing exercises entailed a haircut on the nominal value of the securities and their subsequent reinvestment in shares or other equity instruments. These mechanisms, known as “burden-sharing”, could either be voluntary41 or imposed compulsorily by the FROB.42
A special feature of the Spanish case was the large proportion of these instruments (83% of the volume invested) which had been placed with retail investors. The application of this burden-sharing mechanism requiring the holders of preference shares and subordinated debt to bear losses (to contribute to meeting the cost of restructuring those banks receiving public support) revealed, moreover, a problem of inappropriate marketing of a portion of these instruments to retail customers, who were unaware of the risk they were assuming by purchasing these products.
40 �To these instruments should be added the possibility of receiving public support.41 �Such as exchange offers for the bank’s equity instruments; offers to repurchase securities (in cash based on their present
value or reinvestment in shares or other banking product); reduction of the nominal value or early repayment at a value other than nominal amount. Haircuts on the value were applied in accordance with European law on State aid.
42 �Such as postponement, suspension, modification or suppression of certain rights of the holder (interest, reimbursement of principal, maturity and others), repurchase by the bank of the shares in question at the price set by the FROB (market price with haircuts according to EU law on State aid) or reinvestment of that amount in the subscription of shares.

173RepoRt on the financial and banking cRisis in spain, 2008-2014
In most cases, the holders of preference shares and subordinated debt had to exchange their securities for actions of the bank in question, which, being unlisted, had limited (or no) liquidity. As described in Section 3.5.B.4 below, the Spanish authorities took diverse action to ease the burden falling on retail investors and to provide for restitution of damages in those cases in which the information on these hybrids had not functioned properly.
In particular, Royal Decree-Law 6/2013 of 22 March 2013 on the protection of holders of certain saving and investment products and other financial measures (hereafter Royal Decree-Law 6/2013) adopted a number of measures:
— First, to provide liquidity to unlisted shares, the Deposit Guarantee Fund was endowed with the capacity to purchase from retail customers the shares they received in exchange for their investments in bank preference shares and/or subordinated debt. This purchase was at market price. To enable the Deposit Guarantee Fund to carry out these transactions, it was endowed with sufficient funds through an extraordinary contribution by member credit institutions in the amount of 3‰ of the deposits taken (which serve as the basis for calculating contributions to the Deposit Guarantee Fund).
— Second, a hybrid capital and subordinated debt instrument monitoring committee, attached to the Ministry of Economic Affairs and Competitiveness and chaired by the CNMV, was set up and entrusted with analysing the various reasons giving rise to court and out-of-court claims relating to the marketing of these instruments (preference shares and subordinated debt) by the FROB’s investees. Its function, among others, was to determine the basic criteria to be employed by FROB investees in order to offer their customers the option of submitting disputes over hybrid capital and subordinated debt instruments to arbitration, so that they could be duly compensated for the economic loss incurred, in the event of an arbitration decision in favour of those customers.
segregation oF assets to an asset ManageMent coMPany and strengthening oF the Frob’s Powers
To smooth the clean-up of bank balance sheets, the FROB was endowed with the power to oblige banks receiving public support to transfer their troubled assets (real estate loans unlikely to be recovered and foreclosed assets) to an asset management company. Law 9/2012 created Sareb and the Bank Asset Funds (Fondos de Activos Bancarios), which are described below.
An essential part of the strategy was the strengthening of the powers of the FROB. To do so, it was given the form of a State public law entity headed by a governing committee, the members of
174 banco de españa
which were changed upon the entry into force of Law 9/2012, which removed from it the representatives of the Deposit Guarantee Funds. Law 9/2012 delimited its competences and conferred on it public law powers to take administrative action43 with immediate legal effect.
other signiFicant Matters included in law 9/2012
The following are worthy of note:
(i) change in capital requirements, setting a single requirement consisting of core capital of 9%44 to be met by all institutions from 1 January 2013;
(ii) endowment on the Banco de España of powers to authorise credit institutions and impose all manner of sanctions on them (tasks previously shared with the Ministry of Economic Affairs and Competitiveness), and
(iii) setting of a limit of €500,000 on the total fixed compensation received by executive chairpersons, managing directors and managers of institutions receiving State aid that are not majority owned by the FROB.45
B.3 Creation of Sareb
Sociedad de Gestión de Activos Procedentes de la Reestructuración Bancaria (the Spanish asset management company for assets arising from bank restructuring – “Sareb” by its Spanish acronym)46 is regulated by the seventh additional provision of Law 9/2012 and by Royal Decree 1559/2012 of 15 November 2012 establishing the legal regime for asset management companies.
Sareb was formed as a public limited company47 55%-owned by private shareholders48 and 45%-owned by the FROB, for the sole purpose of purchasing, managing and divesting the assets which had to be
43 �These powers were necessary for the execution of restructuring and resolution instruments (determination of value and suspension of contracts and collateral/guarantees, among other things).
44 �According to the EBA definition discussed above.45 �In the case of institutions majority owned by the FROB, the limit was €300,000 (set by Royal Decree-Law 2/2012) and,
furthermore, in 2012 the directors and managers of these institutions could not receive variable remuneration.46 �This company was created in November. Royal Decree-Law 24/2012 of 31 August 2012 had already set guidelines for the
regulation of the asset management company to which nationalised institutions and those subjected to a restructuring or resolution process had to transfer their troubled assets. That Royal Decree-Law was replaced by Law 9/2012, as noted above. Sareb is an entity supervised by the Banco de España (supervision is limited to compliance with the company’s sole purpose and its transparency and governing bodies) and subject to specific accounting rules.
47 �Royal Decree 1559/2012 limits its duration to 15 years.48 �The main subscribers were Banco Santander, CaixaBank, Banco Sabadell and Banco Popular.

175RepoRt on the financial and banking cRisis in spain, 2008-2014
transferred to it by institutions receiving public support, i.e. the institutions which as a result of the bottom-up exercise were classified in group 1 (now nationalised), in group 2 (those which needed State aid) and in group 3 (those which may need public support). The assets transferred were basically those relating to the real estate sector.49 Sareb had the power to create “Bank Asset Funds” structured as separate pools of assets lacking legal personality whose purpose was to serve as Sareb divestment instruments.
A key element in the transfer of assets was their valuation, which had to be performed by the Banco de España on the basis of the valuation reports of independent experts.50 Prior to transfer, institutions had to adjust their valuations.51
The volume of assets initially transferred was €50,782 million,52 with an average haircut of around 53% on the book value. The consideration received by the institutions consisted of Sareb senior bonds guaranteed by the State.
B.4 Reform of the legal framework for savings banks
Law 26/2013 of 27 December 2013 on savings banks and banking foundations fulfilled the commitment given by Spain to its European partners when it requested financial assistance in July 2012.
This Law marked a radical change in the legal regime governing savings banks53 which culminated a regulatory process aimed at ensuring that institutions opting to remain as savings banks returned to their traditional characteristics (strong community and territorial ties) and professionalised their management.
Among the measures adopted to achieve the first objective, Law 26/2013 obliged savings banks which exceeded certain limits, set in terms of their territorial scope or their business volume, to transform themselves into ordinary or banking foundations,54 foregoing their status as a credit
49 �The law established certain requirements to be met, including that the real estate development loans transferred had to exceed €250,000 and the foreclosures had to exceed €100,000.
50 �Taking as a reference the valuations made within the framework of the bottom-up stress test on each bank and the analysis of their portfolios.
51 �In no case could those adjustments be lower than the adjustments applicable in application of the Banco de España Accounting Circular and the royal decree-laws on real estate sector clean-up.
52 �Section 3.5.B.5 below lists this amount by institution.53 �Royal Decree-Law 11/2010, discussed in the previous chapter, was largely the predecessor of the reforms introduced by
Law 26/2013. That royal decree-law offered savings banks the option of adopting the form of a commercial bank to engage in their activity as a credit institution (thus increasing their ability to raise funds) and introduced changes designed to improve the professionalism of their governing bodies.
54 �Transformation into a banking foundation is compulsory when the percentage of ownership of the bank to which the activity pursued by the savings bank was transferred is greater than or equal to 10% or allows it to appoint/dismiss any member of the board of directors.
176 banco de españa
institution and having to devote themselves to their welfare projects. In addition, this Law set certain specific obligations for banking foundations whose percentage of ownership of a credit institution exceeded a certain level.55
The measures introduced by Law 26/2013 to achieve greater professionalism of governing bodies and improve corporate governance included the following: (i) requirements of good repute, experience and good governance to be met by all directors, the majority of whom must be independent; (ii) increase in the number of members designated by depositors56 in the general assembly and the cessation of representation of non-voting equity unit holders;57 (iii) requirement for a full-time executive chairman, the post of which is incompatible with any other remunerated activity, and (iv) requirement for publication of a yearly report on directors’ remuneration complementing the report on corporate governance introduced by Royal Decree-Law 11/2010.
other legal changes
There were two other significant legal changes in this period. The first was to increase the transparency and uniformity of institutions’ accounting policies. Banco de España Circular 6/2012 (amending Banco de España Circular 4/2004) required institutions to disclose in their annual accounts information on their forborne exposures. Furthermore, it introduced precise definitions concerning forbearance transactions which had to be taken into account in estimating possible impairment in accordance with Circular 4/2004.58
The second change (relating to credit institution solvency) was the approval, in June 2013, of Regulation (EU) No 575/2013 (CRR) of 26 June 2013 and Directive 2013/36/EU (CRD IV) (see Box 4.1). This legislation, already mentioned above and to which we will return in the following
55 �Thus, whenever the percentage of ownership reaches 30%, banking foundations must draw up a management protocol and an annual financial plan. If the stake is 50% or more, or control is held, banking foundations have to reinforce this financial plan by including an investment diversification plan and setting up a reserve fund to cater for possible equity needs of the investee (alternatively, a plan to divest from the investee credit institution within a maximum of five years may be submitted).
56 �Greater than or equal to 50%.57 �This is a consequence of the new regime established by the law for non-voting equity units: savings banks which had issued
them had to submit to the Banco de España for approval, within six months from the entry into force of the law, a specific plan for their redemption. After those six months elapsed, non-voting equity units ceased to be eligible as own funds.
58 �The Banco de España considered that the information disclosed by institutions in application of this circular evidenced differences between institutions that might be due to different business profiles, but also to differences in the accounting policies applied. Therefore, the Banco de España (in April 2013) decided to draft a set of criteria which institutions had to take into account in preparing and approving their forbearance policies and in classifying the affected transactions for accounting purposes. These criteria did not constitute new regulation, but rather a reference to be used by institutions in complying with CBE 4/2004.
177RepoRt on the financial and banking cRisis in spain, 2008-2014
chapter, introduced into European banking law the Basel III international accords born out of the response of European regulators to the financial crisis.59
The CRR, being a regulation, was directly applicable in the Member States from January 2014 and the CRDIV, being a directive, had to be transposed into national law, with stepwise application over time for some of the requirements. In order to introduce the required regulatory changes into Spanish law, Royal Decree-Law 14/2013 of 29 November 2013 was promulgated at the end of 2013 on urgent measures for the adaptation of Spanish law to European Union rules on the supervision and solvency of financial institutions.60
3.5 SUPERVISORY�ACTIONS�OF�THE�BANCO�DE�ESPAÑA
The supervisory actions during this period are related to the main legal landmarks discussed in Section 3.4.
A. Write-down of exposures to the real estate sector
As discussed,61 Royal Decree-Laws 2/2012 and 18/2012 forced credit institutions to undertake further balance-sheet write-downs during 2012, which required recording provisions to increase coverage of their exposures to the construction and real estate development sector (especially as regards transactions relating to land and developments under construction, for which there were no valid benchmark prices, given market conditions).
In April 2012 the Banco de España approved the plans submitted by institutions to meet the requirements of Royal Decree-Law 2/2012.62 Overall, the institutions communicated additional provisioning needs totalling €29,077 million and higher “capital principal” (top-quality capital) requirements63 amounting to €15,573 million. To these amounts must be added the extraordinary
59 �They include notably the requirement that institutions hold a higher proportion of high quality capital, the introduction of macroprudential elements through, inter alia, the rule that institutions have high-quality capital buffers to increase their resilience particularly in economic downturns, and an increased role of the requirements relating to liquidity management.
60 �This Royal Decree-Law included most notably: (i) additional measures which the Banco de España could adopt when an institution failed to meet solvency requirements, such as prohibiting or restricting the distribution of dividends or requiring the institution to cease activities that put its soundness at excessive risk, and (ii) changes in limitations on the variable remuneration of managers, basically to limit it to a maximum of 100% of fixed remuneration (save authorisation from the shareholders’ meeting or equivalent body, in which case the limit was 200%).
61 �See Section 3.4.A above.62 �See press release of 17 April 2012.63 �Additional capital required by Royal Decree-Law 2/2012 to shore up the solvency of the institution faced with possible
higher losses due to troubled assets connected to land and developments under construction.
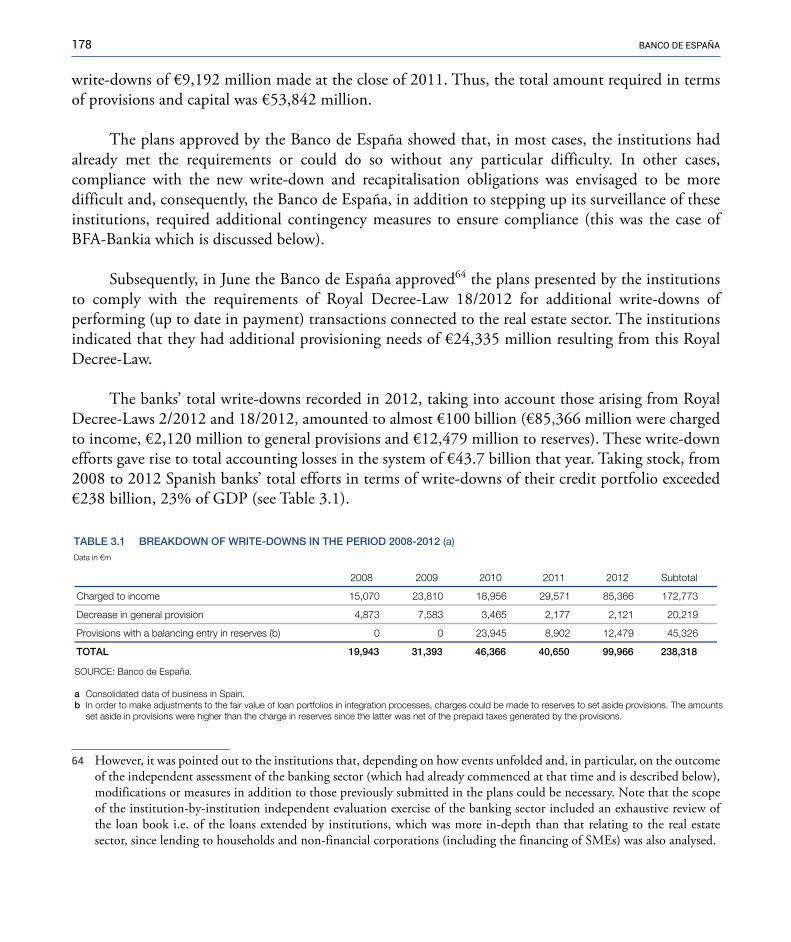
178 banco de españa
write-downs of €9,192 million made at the close of 2011. Thus, the total amount required in terms of provisions and capital was €53,842 million.
The plans approved by the Banco de España showed that, in most cases, the institutions had already met the requirements or could do so without any particular difficulty. In other cases, compliance with the new write-down and recapitalisation obligations was envisaged to be more difficult and, consequently, the Banco de España, in addition to stepping up its surveillance of these institutions, required additional contingency measures to ensure compliance (this was the case of BFA-Bankia which is discussed below).
Subsequently, in June the Banco de España approved64 the plans presented by the institutions to comply with the requirements of Royal Decree-Law 18/2012 for additional write-downs of performing (up to date in payment) transactions connected to the real estate sector. The institutions indicated that they had additional provisioning needs of €24,335 million resulting from this Royal Decree-Law.
The banks’ total write-downs recorded in 2012, taking into account those arising from Royal Decree-Laws 2/2012 and 18/2012, amounted to almost €100 billion (€85,366 million were charged to income, €2,120 million to general provisions and €12,479 million to reserves). These write-down efforts gave rise to total accounting losses in the system of €43.7 billion that year. Taking stock, from 2008 to 2012 Spanish banks’ total efforts in terms of write-downs of their credit portfolio exceeded €238 billion, 23% of GDP (see Table 3.1).
2008 2009 2010 2011 2012 Subtotal
377,271663,58175,92659,81018,32070,51Charged to income
912,02121,2771,2564,3385,7378,4Decrease in general provision
623,54974,21209,8549,3200Provisions with a balancing entry in reserves (b)
813,832669,99056,04663,64393,13349,91LATOT
TABLE 3.1 BREAKDOWN OF WRITE-DOWNS IN THE PERIOD 2008-2012 (a)Data in €m
SOURCE: Banco de España.
a Consolidated data of business in Spain.b In order to make adjustments to the fair value of loan portfolios in integration processes, charges could be made to reserves to set aside provisions. The amounts
set aside in provisions were higher than the charge in reserves since the latter was net of the prepaid taxes generated by the provisions.
64 �However, it was pointed out to the institutions that, depending on how events unfolded and, in particular, on the outcome of the independent assessment of the banking sector (which had already commenced at that time and is described below), modifications or measures in addition to those previously submitted in the plans could be necessary. Note that the scope of the institution-by-institution independent evaluation exercise of the banking sector included an exhaustive review of the loan book i.e. of the loans extended by institutions, which was more in-depth than that relating to the real estate sector, since lending to households and non-financial corporations (including the financing of SMEs) was also analysed.

179RepoRt on the financial and banking cRisis in spain, 2008-2014
B. Actions relating to the MoU entered into by the Spanish Government and the European Commission
B.1 Stress tests and identification of capital needs65
B.1.1 Prior indePendent assessMent oF the sPanish banking systeM (aggregate exercise)
The objective of the external assessment of the Spanish banking sector, decided in May 2012 by the Council of Ministers, was to ascertain, on an aggregate basis, the sector’s ability to withstand particularly adverse economic developments (this exercise was known as a top-down analysis). The Banco de España in coordination with the Ministry of Economic Affairs and Competitiveness, led this assessment of the banking sector, for which purpose two independent international consultants were hired (Roland Berger and Oliver Wyman).
14 banking groups66 representing approximately 90% of the Spanish banking system’s assets took part in the exercise. The analysis of the banking system’s resilience covered three years (2012-2014) which strengthened the severity of the exercise and two macroeconomic scenarios were considered:
— The baseline scenario, which was more likely to happen, under which institutions were required to have a top-quality capital (“core capital”67) ratio of 9% by end-2014.
— The adverse scenario, based on a very severe downturn in the economy,68 with a likelihood of occurring of less than 1%, under which institutions had to have a top-quality (“core capital”) ratio of 6% by end-2014.
The results of this stress test were published on 21 June and limited the capital needs of the banking system as a whole to within a range of €16 billion to €26 billion under the baseline scenario and within a range of €51 billion to €62 billion under the adverse scenario.
65 �These tests have already been discussed in Section 3.4.B.1 above.66 �Santander, BBVA & Unnim, Popular & Pastor, Sabadell & CAM, Bankinter, CaixaBank & Banca Cívica, Bankia-BFA,
KutxaBank, Ibercaja & Caja3 & Liberbank, Unicaja & CEISS, Banco Mare Nostrum, Catalunya Banc, NCG Banco and Banco de Valencia.
67 �This top-quality capital had to meet the EBA’s definition which was slightly more restrictive than the concept of “capital principal” (also top-quality capital required from institutions at that time and introduced by Royal Decree-Law 2/2011).
68 �For example, cumulative declines of 6.5% in GDP for three years (2012-2014), an unemployment rate of 27.2%, additional falls of 25% in house prices and of 60% in land values were considered.
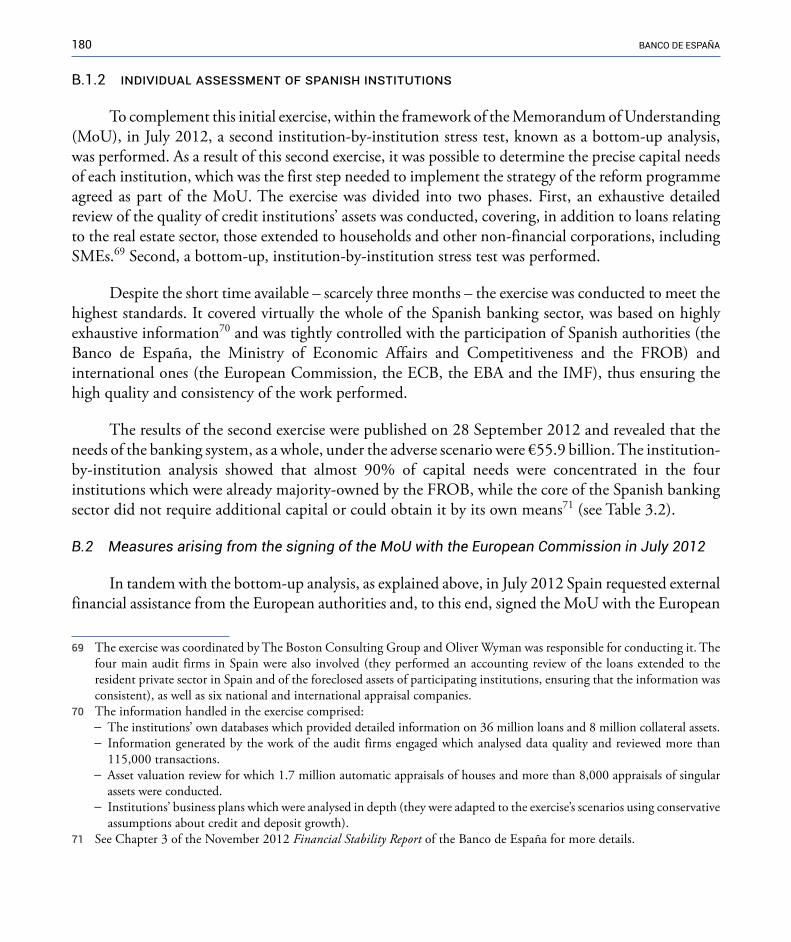
180 banco de españa
B.1.2 individual assessMent oF sPanish institutions
To complement this initial exercise, within the framework of the Memorandum of Understanding (MoU), in July 2012, a second institution-by-institution stress test, known as a bottom-up analysis, was performed. As a result of this second exercise, it was possible to determine the precise capital needs of each institution, which was the first step needed to implement the strategy of the reform programme agreed as part of the MoU. The exercise was divided into two phases. First, an exhaustive detailed review of the quality of credit institutions’ assets was conducted, covering, in addition to loans relating to the real estate sector, those extended to households and other non-financial corporations, including SMEs.69 Second, a bottom-up, institution-by-institution stress test was performed.
Despite the short time available – scarcely three months – the exercise was conducted to meet the highest standards. It covered virtually the whole of the Spanish banking sector, was based on highly exhaustive information70 and was tightly controlled with the participation of Spanish authorities (the Banco de España, the Ministry of Economic Affairs and Competitiveness and the FROB) and international ones (the European Commission, the ECB, the EBA and the IMF), thus ensuring the high quality and consistency of the work performed.
The results of the second exercise were published on 28 September 2012 and revealed that the needs of the banking system, as a whole, under the adverse scenario were €55.9 billion. The institution-by-institution analysis showed that almost 90% of capital needs were concentrated in the four institutions which were already majority-owned by the FROB, while the core of the Spanish banking sector did not require additional capital or could obtain it by its own means71 (see Table 3.2).
B.2 Measures arising from the signing of the MoU with the European Commission in July 2012
In tandem with the bottom-up analysis, as explained above, in July 2012 Spain requested external financial assistance from the European authorities and, to this end, signed the MoU with the European
69 �The exercise was coordinated by The Boston Consulting Group and Oliver Wyman was responsible for conducting it. The four main audit firms in Spain were also involved (they performed an accounting review of the loans extended to the resident private sector in Spain and of the foreclosed assets of participating institutions, ensuring that the information was consistent), as well as six national and international appraisal companies.
70 �The information handled in the exercise comprised: �— �The institutions’ own databases which provided detailed information on 36 million loans and 8 million collateral assets. — �Information generated by the work of the audit firms engaged which analysed data quality and reviewed more than
115,000 transactions. �— �Asset valuation review for which 1.7 million automatic appraisals of houses and more than 8,000 appraisals of singular
assets were conducted. �— �Institutions’ business plans which were analysed in depth (they were adapted to the exercise’s scenarios using conservative
assumptions about credit and deposit growth). 71 �See Chapter 3 of the November 2012 Financial Stability Report of the Banco de España for more details.
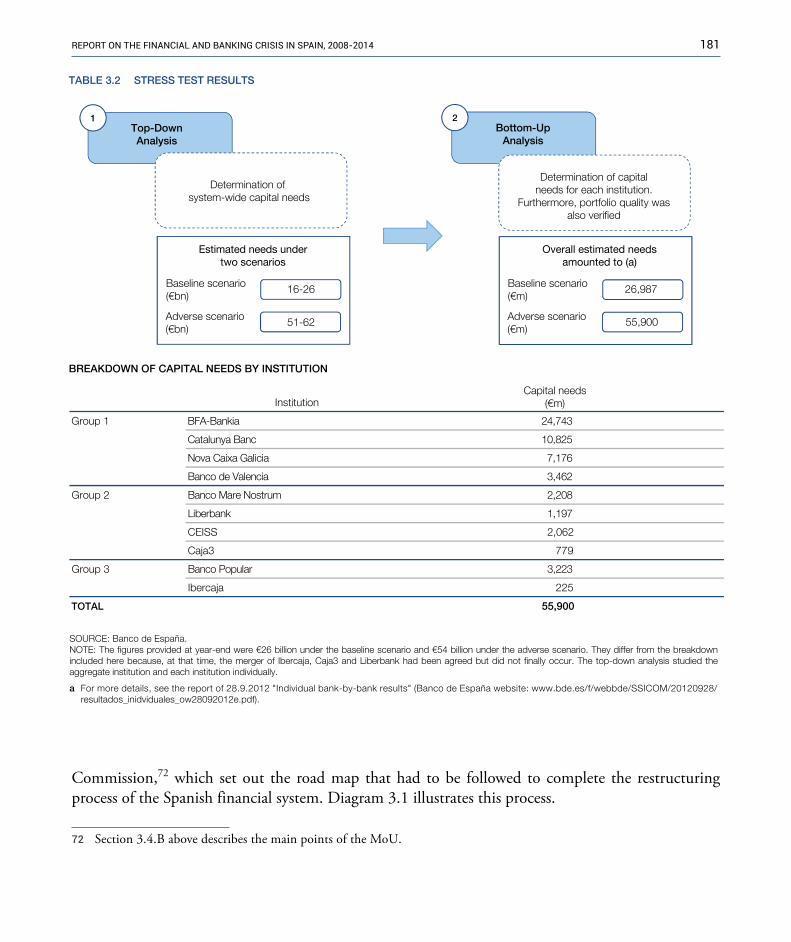
181RepoRt on the financial and banking cRisis in spain, 2008-2014
Commission,72 which set out the road map that had to be followed to complete the restructuring process of the Spanish financial system. Diagram 3.1 illustrates this process.
BREAKDOWN OF CAPITAL NEEDS BY INSTITUTION
Capital needs(€m)Institution
347,42aiknaB-AFBGroup 1
528,01 cnaB aynulataC
671,7 aicilaG axiaC avoN
264,3 aicnelaV ed ocnaB
802,2 murtsoN eraM ocnaBGroup 2
791,1 knabrebiL
CEISS 2,062
Caja3 779
322,3ralupoP ocnaBGroup 3
Ibercaja 225
TOTAL 55,900
TABLE 3.2 STRESS TEST RESULTS
Top-DownAnalysis
Bottom-UpAnalysis
Determination of system-wide capital needs
Determination of capitalneeds for each institution.
Furthermore, portfolio quality wasalso verified
1 2
Estimated needs undertwo scenarios
Baseline scenario(€bn)
16-26
Adverse scenario(€bn)
51-62
Overall estimated needsamounted to (a)
26,987
55,900
SOURCE: Banco de España.NOTE: The figures provided at year-end were €26 billion under the baseline scenario and €54 billion under the adverse scenario. They differ from the breakdown included here because, at that time, the merger of Ibercaja, Caja3 and Liberbank had been agreed but did not finally occur. The top-down analysis studied the aggregate institution and each institution individually.
a For more details, see the report of 28.9.2012 "Individual bank-by-bank results" (Banco de España website: www.bde.es/f/webbde/SSICOM/20120928/ resultados_inidviduales_ow28092012e.pdf).
Baseline scenario(€m)
Adverse scenario(€m)
72 �Section 3.4.B above describes the main points of the MoU.

182 banco de españa
Determination of capital needs of each institution(results of bottom-up analysis)
Classification of institutions into four groups
Group 0: institutions with no capital shortfallGroup 1: institutions already nationalised (owned by the FROB)Group 2: institutions with a shortfall which need State aidGroup 3: institutions with a shortfall which they can cover without State aid
Approval of recapitalisation, restructuring and/orresolution plans of institutions with a shortfall
Banco de Españaand European Commission
Segregation of impaired assets(compulsory for institutions which receive public support)
Granting of public support
DIAGRAM 3.1 PROCESS OF OBTAINING EXTERNAL ASSISTANCE FOR THE RESTRUCTURING OF THE FINANCIAL SYSTEM
SOURCE: Banco de España.
(compulsory for institutions which receive public support)
Burden-sharingby shareholders and holders of preference shares and subordinated debt
"hybrid instrument burden-sharing"
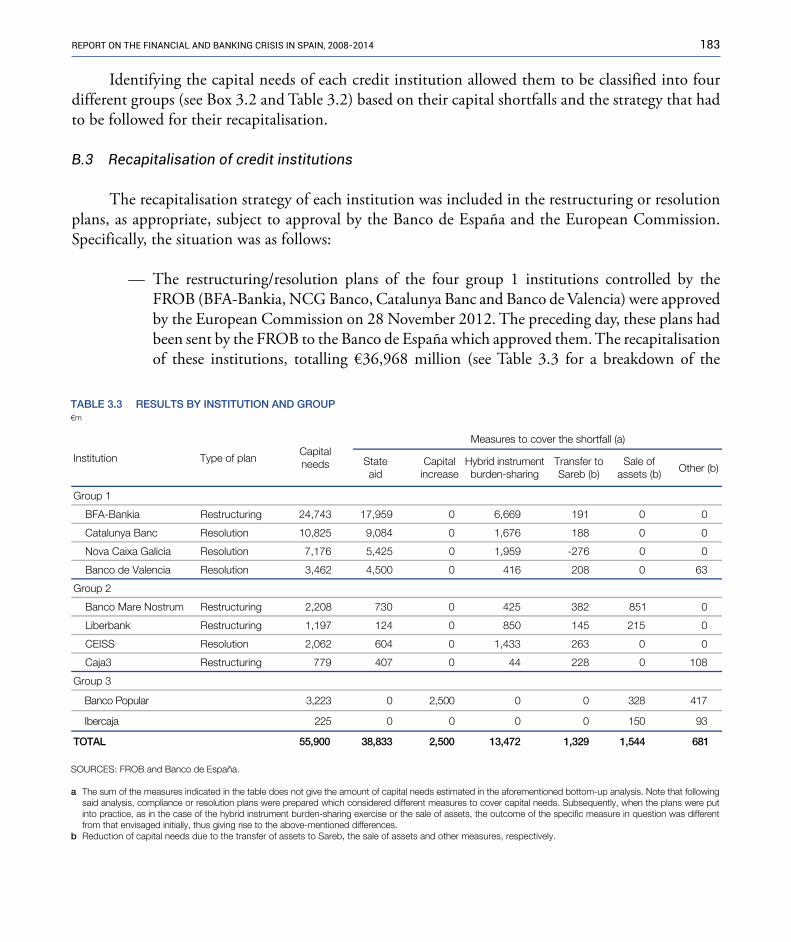
183RepoRt on the financial and banking cRisis in spain, 2008-2014
Identifying the capital needs of each credit institution allowed them to be classified into four different groups (see Box 3.2 and Table 3.2) based on their capital shortfalls and the strategy that had to be followed for their recapitalisation.
B.3 Recapitalisation of credit institutions
The recapitalisation strategy of each institution was included in the restructuring or resolution plans, as appropriate, subject to approval by the Banco de España and the European Commission. Specifically, the situation was as follows:
— The restructuring/resolution plans of the four group 1 institutions controlled by the FROB (BFA-Bankia, NCG Banco, Catalunya Banc and Banco de Valencia) were approved by the European Commission on 28 November 2012. The preceding day, these plans had been sent by the FROB to the Banco de España which approved them. The recapitalisation of these institutions, totalling €36,968 million (see Table 3.3 for a breakdown of the
€m
Stateaid
Capitalincrease
Hybrid instrumentburden-sharing
Transfer toSareb (b)
Sale ofassets (b) Other (b)
Group 1
BFA-Bankia Restructuring 24,743 17,959 0 6,669 191 0 0
Catalunya Banc Resolution 10,825 9,084 0 1,676 188 0 0
Nova Caixa Galicia Resolution 7,176 5,425 0 1,959 -276 0 0
Banco de Valencia Resolution 3,462 4,500 0 416 208 0 63
Group 2
Banco Mare Nostrum Restructuring 2,208 730 0 425 382 851 0
Liberbank Restructuring 1,197 124 0 850 145 215 0
CEISS Resolution 2,062 604 0 1,433 263 0 0
Caja3 Restructuring 779 407 0 44 228 0 108
Group 3
71482300005,20322,3ralupoP ocnaB
390510000522ajacrebI
186445,1923,1274,31005,2338,83009,55LATOT
Measures to cover the shortfall (a)CapitalneedsType of planInstitution
TABLE 3.3 RESULTS BY INSTITUTION AND GROUP
SOURCES: FROB and Banco de España.
a The sum of the measures indicated in the table does not give the amount of capital needs estimated in the aforementioned bottom-up analysis. Note that following said analysis, compliance or resolution plans were prepared which considered different measures to cover capital needs. Subsequently, when the plans were put into practice, as in the case of the hybrid instrument burden-sharing exercise or the sale of assets, the outcome of the specific measure in question was different from that envisaged initially, thus giving rise to the above-mentioned differences.
b Reduction of capital needs due to the transfer of assets to Sareb, the sale of assets and other measures, respectively.
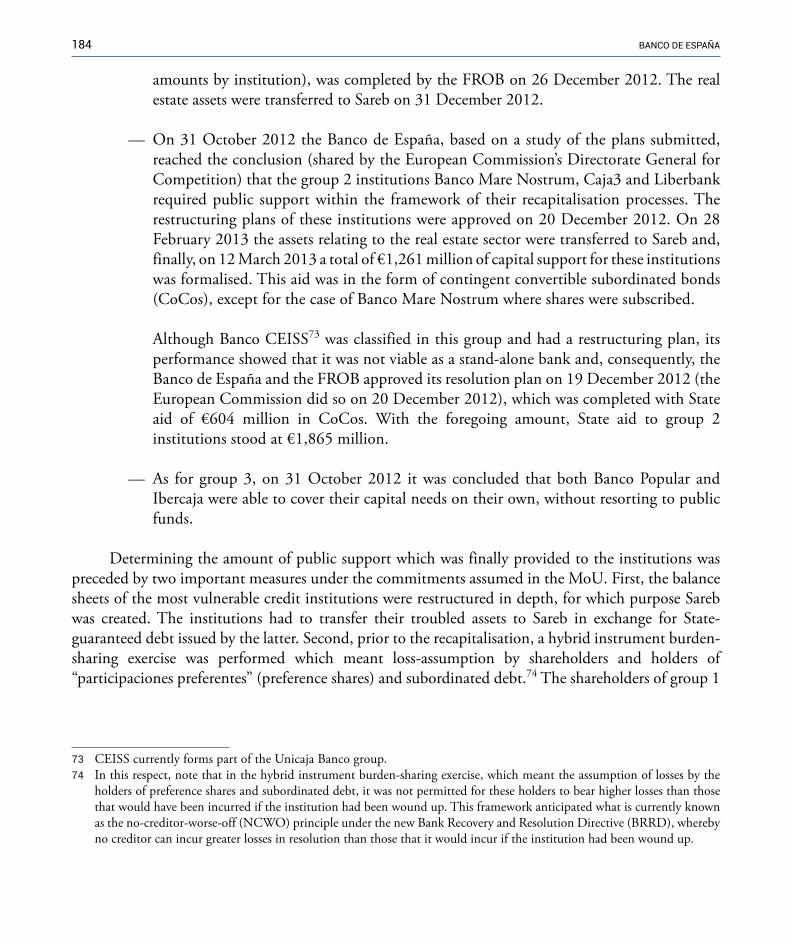
184 banco de españa
amounts by institution), was completed by the FROB on 26 December 2012. The real estate assets were transferred to Sareb on 31 December 2012.
— On 31 October 2012 the Banco de España, based on a study of the plans submitted, reached the conclusion (shared by the European Commission’s Directorate General for Competition) that the group 2 institutions Banco Mare Nostrum, Caja3 and Liberbank required public support within the framework of their recapitalisation processes. The restructuring plans of these institutions were approved on 20 December 2012. On 28 February 2013 the assets relating to the real estate sector were transferred to Sareb and, finally, on 12 March 2013 a total of €1,261 million of capital support for these institutions was formalised. This aid was in the form of contingent convertible subordinated bonds (CoCos), except for the case of Banco Mare Nostrum where shares were subscribed.
Although Banco CEISS73 was classified in this group and had a restructuring plan, its performance showed that it was not viable as a stand-alone bank and, consequently, the Banco de España and the FROB approved its resolution plan on 19 December 2012 (the European Commission did so on 20 December 2012), which was completed with State aid of €604 million in CoCos. With the foregoing amount, State aid to group 2 institutions stood at €1,865 million.
— As for group 3, on 31 October 2012 it was concluded that both Banco Popular and Ibercaja were able to cover their capital needs on their own, without resorting to public funds.
Determining the amount of public support which was finally provided to the institutions was preceded by two important measures under the commitments assumed in the MoU. First, the balance sheets of the most vulnerable credit institutions were restructured in depth, for which purpose Sareb was created. The institutions had to transfer their troubled assets to Sareb in exchange for State-guaranteed debt issued by the latter. Second, prior to the recapitalisation, a hybrid instrument burden-sharing exercise was performed which meant loss-assumption by shareholders and holders of “participaciones preferentes” (preference shares) and subordinated debt.74 The shareholders of group 1
73 �CEISS currently forms part of the Unicaja Banco group.74 �In this respect, note that in the hybrid instrument burden-sharing exercise, which meant the assumption of losses by the
holders of preference shares and subordinated debt, it was not permitted for these holders to bear higher losses than those that would have been incurred if the institution had been wound up. This framework anticipated what is currently known as the no-creditor-worse-off (NCWO) principle under the new Bank Recovery and Resolution Directive (BRRD), whereby no creditor can incur greater losses in resolution than those that it would incur if the institution had been wound up.
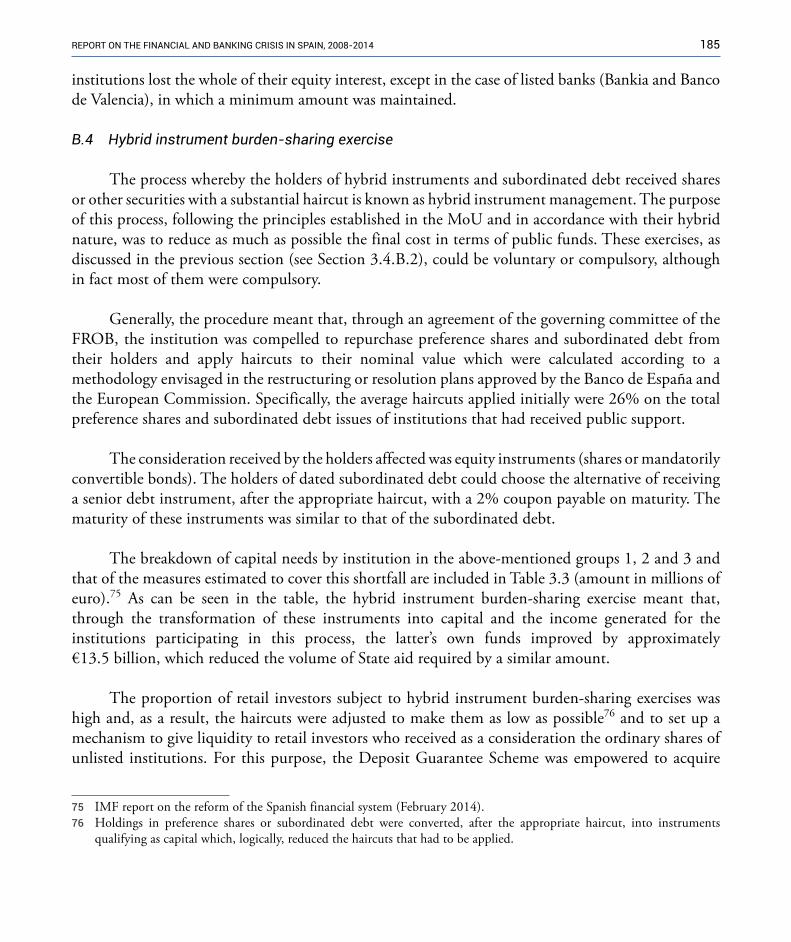
185RepoRt on the financial and banking cRisis in spain, 2008-2014
institutions lost the whole of their equity interest, except in the case of listed banks (Bankia and Banco de Valencia), in which a minimum amount was maintained.
B.4 Hybrid instrument burden-sharing exercise
The process whereby the holders of hybrid instruments and subordinated debt received shares or other securities with a substantial haircut is known as hybrid instrument management. The purpose of this process, following the principles established in the MoU and in accordance with their hybrid nature, was to reduce as much as possible the final cost in terms of public funds. These exercises, as discussed in the previous section (see Section 3.4.B.2), could be voluntary or compulsory, although in fact most of them were compulsory.
Generally, the procedure meant that, through an agreement of the governing committee of the FROB, the institution was compelled to repurchase preference shares and subordinated debt from their holders and apply haircuts to their nominal value which were calculated according to a methodology envisaged in the restructuring or resolution plans approved by the Banco de España and the European Commission. Specifically, the average haircuts applied initially were 26% on the total preference shares and subordinated debt issues of institutions that had received public support.
The consideration received by the holders affected was equity instruments (shares or mandatorily convertible bonds). The holders of dated subordinated debt could choose the alternative of receiving a senior debt instrument, after the appropriate haircut, with a 2% coupon payable on maturity. The maturity of these instruments was similar to that of the subordinated debt.
The breakdown of capital needs by institution in the above-mentioned groups 1, 2 and 3 and that of the measures estimated to cover this shortfall are included in Table 3.3 (amount in millions of euro).75 As can be seen in the table, the hybrid instrument burden-sharing exercise meant that, through the transformation of these instruments into capital and the income generated for the institutions participating in this process, the latter’s own funds improved by approximately €13.5 billion, which reduced the volume of State aid required by a similar amount.
The proportion of retail investors subject to hybrid instrument burden-sharing exercises was high and, as a result, the haircuts were adjusted to make them as low as possible76 and to set up a mechanism to give liquidity to retail investors who received as a consideration the ordinary shares of unlisted institutions. For this purpose, the Deposit Guarantee Scheme was empowered to acquire
75 �IMF report on the reform of the Spanish financial system (February 2014).76 �Holdings in preference shares or subordinated debt were converted, after the appropriate haircut, into instruments
qualifying as capital which, logically, reduced the haircuts that had to be applied.
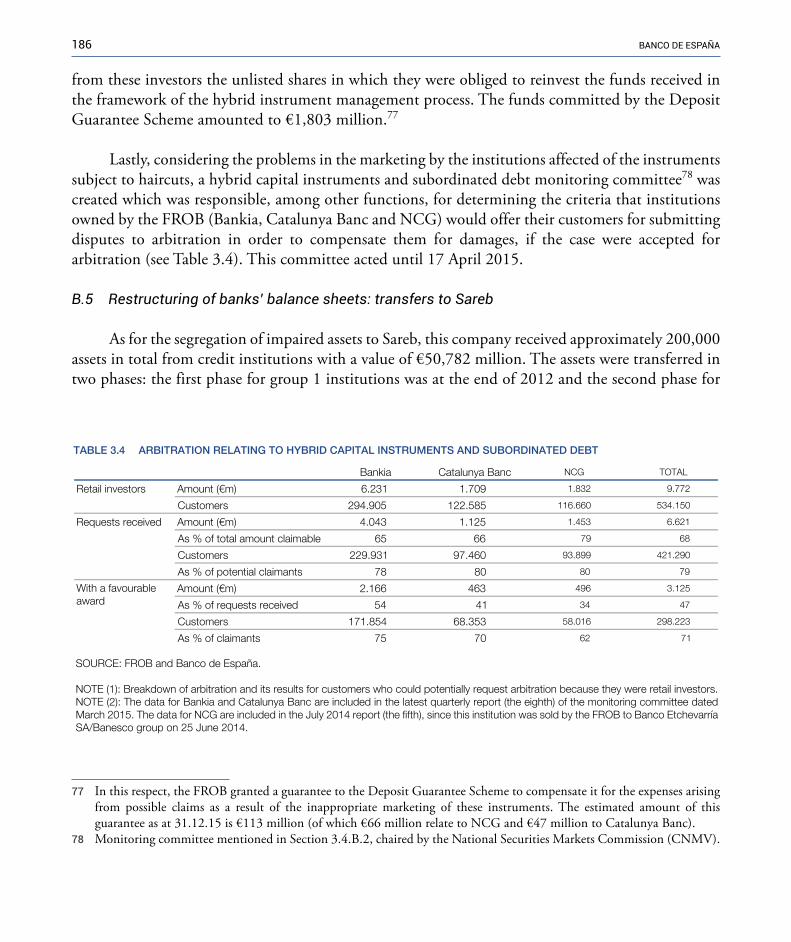
186 banco de españa
from these investors the unlisted shares in which they were obliged to reinvest the funds received in the framework of the hybrid instrument management process. The funds committed by the Deposit Guarantee Scheme amounted to €1,803 million.77
Lastly, considering the problems in the marketing by the institutions affected of the instruments subject to haircuts, a hybrid capital instruments and subordinated debt monitoring committee78 was created which was responsible, among other functions, for determining the criteria that institutions owned by the FROB (Bankia, Catalunya Banc and NCG) would offer their customers for submitting disputes to arbitration in order to compensate them for damages, if the case were accepted for arbitration (see Table 3.4). This committee acted until 17 April 2015.
B.5 Restructuring of banks’ balance sheets: transfers to Sareb
As for the segregation of impaired assets to Sareb, this company received approximately 200,000 assets in total from credit institutions with a value of €50,782 million. The assets were transferred in two phases: the first phase for group 1 institutions was at the end of 2012 and the second phase for
Bankia Catalunya Banc NCG TOTAL
Retail investors Amount (€m) 6.231 1.709 1.832 9.772
585.221509.492Customers 116.660 534.150
Requests received Amount (€m) 4.043 1.125 1.453 6.621
As % of total amount claimable 65 66 79 68
064.79139.922Customers 93.899 421.290
As % of potential claimants 78 80 80 79
Amount (€m) 2.166 463 496 3.125
As % of requests received 54 41 34 47
353.86458.171Customers 58.016 298.223
As % of claimants 75 70 62 71
TABLE 3.4 ARBITRATION RELATING TO HYBRID CAPITAL INSTRUMENTS AND SUBORDINATED DEBT
SOURCE: FROB and Banco de España.
NOTE (1): Breakdown of arbitration and its results for customers who could potentially request arbitration because they were retail investors.NOTE (2): The data for Bankia and Catalunya Banc are included in the latest quarterly report (the eighth) of the monitoring committee dated March 2015. The data for NCG are included in the July 2014 report (the fifth), since this institution was sold by the FROB to Banco Etchevarría SA/Banesco group on 25 June 2014.
With a favourableaward
77 �In this respect, the FROB granted a guarantee to the Deposit Guarantee Scheme to compensate it for the expenses arising from possible claims as a result of the inappropriate marketing of these instruments. The estimated amount of this guarantee as at 31.12.15 is €113 million (of which €66 million relate to NCG and €47 million to Catalunya Banc).
78 �Monitoring committee mentioned in Section 3.4.B.2, chaired by the National Securities Markets Commission (CNMV).
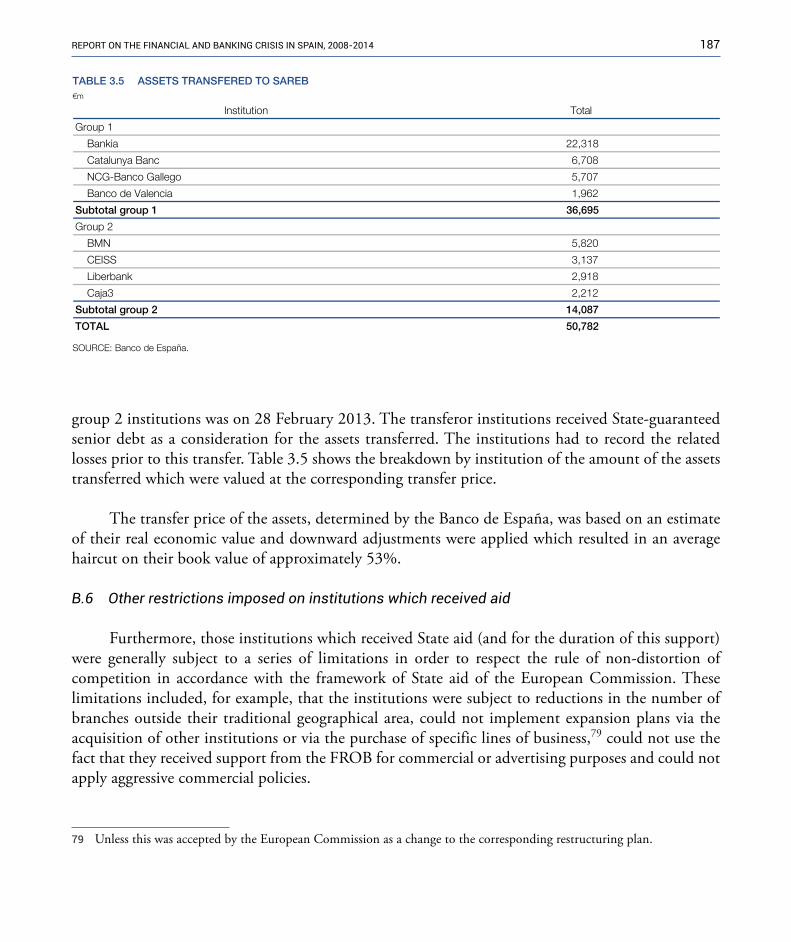
187RepoRt on the financial and banking cRisis in spain, 2008-2014
group 2 institutions was on 28 February 2013. The transferor institutions received State-guaranteed senior debt as a consideration for the assets transferred. The institutions had to record the related losses prior to this transfer. Table 3.5 shows the breakdown by institution of the amount of the assets transferred which were valued at the corresponding transfer price.
The transfer price of the assets, determined by the Banco de España, was based on an estimate of their real economic value and downward adjustments were applied which resulted in an average haircut on their book value of approximately 53%.
B.6 Other restrictions imposed on institutions which received aid
Furthermore, those institutions which received State aid (and for the duration of this support) were generally subject to a series of limitations in order to respect the rule of non-distortion of competition in accordance with the framework of State aid of the European Commission. These limitations included, for example, that the institutions were subject to reductions in the number of branches outside their traditional geographical area, could not implement expansion plans via the acquisition of other institutions or via the purchase of specific lines of business,79 could not use the fact that they received support from the FROB for commercial or advertising purposes and could not apply aggressive commercial policies.
€m
latoTInstitution
Group 1
Bankia 22,318
Catalunya Banc 6,708
NCG-Banco Gallego 5,707
Banco de Valencia 1,962
Subtotal group 1 36,695
Group 2
BMN 5,820
CEISS 3,137
Liberbank 2,918
Caja3 2,212
Subtotal group 2 14,087
TOTAL 50,782
TABLE 3.5 ASSETS TRANSFERED TO SAREB
SOURCE: Banco de España.
79 �Unless this was accepted by the European Commission as a change to the corresponding restructuring plan.
188 banco de españa
B.7 Other commitments assumed in the MoU of July 2012
To comply with the commitment assumed in the MoU of reviewing its supervisory framework, the Banco de España expedited the analysis of its supervisory processes, which was undertaken by an internal committee chaired by the council member Ángel Luis López Roa. This work concluded with the publication on 16 October 2012 of a report entitled “Analysis of the supervisory procedures of the Banco de España and recommendations for their reform”,80 with proposals for improvement which included, most notably, the following:
— Establishment of a standardised framework for the adoption of supervisory measures based on the risk profile of credit institutions.
— On-site continuous monitoring at relevant institutions.
— Formalisation of supervisory conduct.
— Binding microprudential supervision to macroprudential supervision.
Regarding the formalisation of supervisory conduct, the following recommendations, among others, were made: 1) the delivery to the institution of a summary document after each on-site inspection; 2) the preparation of a regular report to the Executive Commission with the findings of the on-going monitoring;81 3) the statement in the written report sent to the Executive Commission of the Banco de España of any possible discrepancies between the inspection report and the proposal sent;82 and, finally, 4) the strengthening of the planning and follow-up of actions.
At the end of September 2013, the Banco de España approved an internal circular on the procedures applied by the Directorate General Banking Supervision including the proposals indicated in the preceding paragraphs.
80 �This report can be found on the Banco de España website: http://www.bde.es/f/webbde/GAP/Secciones/SalaPrensa/ComunicadosBCE/DecisionesPoliticaMonetaria/13/Arc/Fic/Informe_de_la_Comision_interna_en.pdf
81 �Article 13 of Internal Circular 7/2011 of 26 October 2011, in force at that time, indicated that the inspection divisions could prepare a quarterly monitoring report. Likewise, they should update an executive summary on the situation of the institution at least annually and provided that there is a considerable change in the risk assessment.
82 �Article 10 of Internal Circular 7/2011 of 26 October 2011, already provided that the Director General Banking Supervision should inform the Executive Commission of the above-mentioned discrepancy, although it did not specifically state that this should be done in writing in the report sent to the Executive Commission as included in the recommendation.
189RepoRt on the financial and banking cRisis in spain, 2008-2014
C. Actions performed relating to institutions included in group 1 of the MoU
The group 1 institutions were those which received most State aid (see Table 3.3) and when the MoU was approved they were already publicly owned through the FROB.83 The different actions taken in relation to these institutions were performed on the basis of the legal framework provided by: Royal Decree-Law 9/2009 of 26 June 2009 on bank restructuring and strengthening of the capital of credit institutions; Royal Decree-Law 11/2010 of 9 July 2010 on the reform of the savings bank sector; Royal Decree-Law 2/2011 of 18 February 2011, on the strengthening of the solvency of credit institutions; Law 9/2012 of 14 November 2012 on credit institution restructuring and resolution; and Royal Decree Law 6/2013 on the protection of the holders of certain savings and investment products and other financial measures (the latter two pieces of legislation were adopted within the framework of the MoU).
C.1 Additional contingency measures required from BFA-Bankia84
As discussed above in respect of the macroeconomic scenario, in 2011 q4 the incipient downturn in the economic outlook had a strong impact on developments in the real estate market, to which the institution was highly exposed.
In order to strengthen the restructuring of the financial system, in February 2012 Royal Decree-Law 2/2012 was approved, whereby in 2012 it was compulsory to provision €802 million of “capital principal” (top-quality capital) at BFA and €2,257 million of provisions and €872 million of “capital principal” at Bankia.
The plan finally submitted by the group to ensure compliance with the requirements of Royal Decree-Law 2/2012 included measures to conform with this precept and to normalise its financial situation. The Banco de España required, additionally, further measures to rationalise and strengthen the institution’s administration and management structures and to make it more professional, together with a divestment programme.
Differences of criteria arose between the auditors and management of the group in relation to the accounts for the year ending 2011. In May 2012 the group published, without the auditors’ report, the 2011 annual accounts, which were prepared by its administrators and showed losses before taxes of €125 million at the BFA-Bankia group and income of €384 million at the Bankia sub-group.
83 �Table 3.6 at the end of this chapter illustrates the action taken and the aid granted.84 �Certain aspects relating to this group, such as the flotation of Bankia, gave rise to the preliminary proceedings which were
commenced at Central Criminal Court No. 4 of the Spanish National High Court, a proceeding which is currently still in progress. Having regard to these circumstances, the contents of this section do not aim to assess those matters which are subject to investigation within the above-mentioned proceedings.

190 banco de españa
In this situation, on 7 May 2012 the chairman of Bankia submitted his resignation. On 9 May the board of directors appointed a new chairman.
On 14 May 2012 the governing committee of the FROB agreed, at the request of the institution, to convert into capital the €4,465 million of convertible preference shares issued by BFA and acquired by the FROB in 2010, since it was considered unlikely that the institution would be able to redeem or repurchase these preference shares.
At the end of May, the new management of the BFA group restated the 2011 accounts and published them together with the external auditor’s unqualified report. The new accounts showed losses of €2,978 million at Bankia, which meant that the BFA-Bankia group reported losses of €3,318 million, leaving the parent BFA with negative net worth of more than €4,200 million and, consequently, subject to winding-up.
On 27 June 2012, once the conversion into capital of the convertible preference shares was completed, which led to the reduction of BFA’s share capital to zero following the redemption of the shares owned by the seven savings banks that formed the group, the FROB became the sole shareholder of BFA (which also gave it an indirect ownership interest in Bankia of 45.54% through BFA).
During July and August 2012 various events occurred which directly and indirectly affected the BFA group, such as: the enactment of Royal Decree-Law 24/2012, which was subsequently repealed by Law 9/2012 and made the granting of State aid by the FROB conditional upon: the adoption of restructuring or resolution measures; the conducting of a stress test by independent firms on the main credit institutions in the Spanish financial system; and the request for financial support by the Spanish Government, which entailed the signing of the Memorandum of Understanding (MoU) with the above-mentioned requirements.
On 31 August, while the stress test included in the MoU was being performed, the half-yearly accounts as at 30 June 2012 of BFA and Bankia were published, which showed significant losses at both institutions: €2,806 million of loss attributed to the group and a loss of €4,486 million at Bankia. On 3 September the governing committee of the FROB agreed to inject capital of €4,500 million into the BFA-Bankia group in order to restore its levels of regulatory capital through a capital increase at BFA which was subscribed by the FROB.
This increase, which was subject to approval by the Banco de España, the non-objection of the Minister of Finance and Public Administration and the authorisation of the European Commission, was an advance payment of the capital injected later by the FROB within the framework of the MoU.
The stress test ended on 28 September 2012 and the capital needs of the credit institutions analysed were published on the same day. The needs of the BFA group amounted to €13,230 million
191RepoRt on the financial and banking cRisis in spain, 2008-2014
under the baseline scenario and to €24,743 million under the adverse scenario. As a result of these figures, a restructuring plan was prepared that determined, in addition to the group’s capital needs, the measures to which it was committed in order to restore long-term viability, and a business plan covering until 31 December 2017 was drafted which included the group’s financial projections under a baseline macroeconomic scenario and under an adverse one.
In compliance with the provisions of Law 9/2012, since the BFA-Bankia group received public financial support in the terms envisaged in the above-mentioned restructuring plan, before the aid was granted, an economic valuation report was prepared based on the due diligence process and the valuations issued by three independent experts appointed by the FROB. This report estimated a negative value of €10,444 million for BFA and a negative value of €4,148 million for Bankia. In parallel, the same valuers estimated a negative value for Bankia in the case of winding-up proceedings of €49,635 million. BFA’s value differed depending on the value attributed to its holding in Bankia. If the latter was deemed to have a value of zero, BFA had a negative liquidation value of €13,267 million, whereas if the liquidation value calculated for Bankia was used, BFA had a negative liquidation value of €64,092 million.
On 27 November 2012 the Banco de España and the FROB approved the restructuring plan of the BFA-Bankia group and it was approved by the European Commission the day after. This plan envisaged the above-mentioned capital needs of €24,743 million, which would be reduced as a result of the transfer of assets to Sareb and the implementation of burden-sharing. It was estimated that Bankia, which was 48.045%-owned by the FROB through BFA, required a capital injection of €15,500 million. On 3 September 2012 the FROB had agreed urgently to advance public support amounting to €4,500 million to meet the needs revealed by the stress tests arising from the MoU. Subsequently, on 26 December 2012 the FROB carried out another capital increase at BFA amounting to €13,459 million (through a non-monetary contribution comprising securities issued by the European Stability Mechanism).
Consequently, the €24,743 million of capital needs were covered with €17,959 million of State aid and €6,669 million from the hybrid instrument burden-sharing exercise, in addition to the effect of the assets sold to Sareb. €10,620 million of State aid and €4,852 million from the hybrid instrument burden-sharing exercise were earmarked for the capitalisation of Bankia.
On 16 April 2013 the governing committee of the FROB issued a resolution containing the necessary agreements for completing the recapitalisation of the BFA-Bankia group. These agreements, which affected Bankia, comprised a capital reduction by means of a decrease in the nominal value of the shares from two euro to one cent. In order to allow Bankia’s shares to continue to trade following the above-mentioned capital reduction, a reverse share split was also included in the proportion of 100x1 (accordingly shareholders would be entitled to one new share of Bankia for every 100 old
192 banco de españa
shares) and two capital increases. The first capital increase (amounting to €10,700 million) had a preferential subscription right guaranteed by the FROB through its ownership interest of 100% in BFA and the second was for an amount of up to €5,210 million to comply with hybrid capital and subordinated debt instrument management exercises.85
C.2 Catalunya Banc (2010-2014)
In May 2010, Caixa d’Estalvis de Catalunya, Caixa d’Estalvis de Tarragona and Caixa d’Estalvis de Manresa merged, creating a new savings bank (Caixa d’Estalvis de Catalunya, Tarragona i Manresa). The integration plan included aid from the FROB (subscription of convertible preference shares) totalling €1,250 million (FROB I, see Table 2.5).
In 2011, in order to meet capital needs of €1,718 million arising from Royal Decree-Law 2/2011 (achieving a “capital principal” – top-quality capital – ratio of 10%), the institution proposed a restructuring plan including fresh aid from the FROB and corporate restructuring of the group which involved the transfer of practically all of the assets and liabilities, except for those linked to welfare projects, to a newly created bank (Catalunya Banc) through which it would indirectly perform its financial activity.
During June and July 2011 the new bank (Catalunya Banc) was created and the financial business was transferred to it. In September 2011, following the approval by the European Commission of the capital injection, the FROB recapitalised Catalunya Banc with €1,718 million (FROB II, see Table 2.8) which, in light of the valuation of the bank by independent experts, gave it a holding in the institution of 89.79% (the remaining 10.21% remained at the savings bank resulting from the merger).
85 �The events described in this section meant that investors in the flotation of Bankia lost virtually all of their investment based on the share price performance (considering the capital reductions and increases, and the reverse share split, etc.). €1,860 million were invested in the retail segment of the capital increase in July 2011. Bankia compensated its customers in two ways: through the payment of the amounts arising from actions brought with rulings in favour of the customer and through the payment of claims during the voluntary compensation process between February and May 2016. In those cases where there was a favourable ruling or a claim was upheld, the amount invested plus interest was returned as well as court fees, where applicable.
– �In terms of legal action, as at 31 March 2017, 94,466 lawsuits had been filed overall (49.6% of the retail segment) and the total amount claimed was €923 million. Of the judgments handed down for an amount of €966 million only 2.1% were in favour of Bankia. As at 31 March 2007, €1,115 million had been paid (€738 million of principal, €96 million of interest, €55 million of court deposits and €226 million of legal costs, fees and expenses).
– �151,799 claims were received through the voluntary compensation process, of which 6,266 were rejected. The amount to be paid out was €710 million, €700 million were paid (€669 million of principal and €31 million of interest) and €10 million were pending payment.
– �Between the lawsuits and the compensation process, it is estimated that 79.2% of the retail segment has actively claimed their investment.
193RepoRt on the financial and banking cRisis in spain, 2008-2014
In 2012, as a result of the independent assessment of the financial sector, it was estimated that Catalunya Banc had additional capital needs of €10,825 million (under the adverse scenario, see Table 3.3). On 27 December 2012, the FROB and the Banco de España approved the resolution plan of Catalunya Banc, as did the European Commission a day later. The independent experts estimated that the institution had a negative economic value of €6,674 million and a negative liquidation value of €17,846 million.
This plan envisaged adopting various measures: transfer of assets to Sareb; hybrid instrument burden-sharing exercise; division of the institution for management purposes into a core unit comprising the retail business in its territory of origin (Catalonia) and a legacy unit, which would include the other assets and liabilities for divestment purposes; the granting of fresh financial support by the FROB; and its sale.
Before additional assistance was granted by the FROB, in mid-December 2012, the compulsory sale of all Catalunya Banc’s shares, owned by the savings bank resulting from the merger, took place for the token price of €1. At the same time, the preference shares held by the FROB were converted into ordinary shares (€1,250 million) which was followed by the reduction of share capital to zero (the amount of the reduction was earmarked for increasing the institution’s voluntary reserves) and there was a fresh capital increase agreed in the same act whereby the FROB subscribed shares totalling €9,084 million (see Table 3.3) and became the owner of 100% of Catalunya Banc. This operation was part of the financial assistance programme to recapitalise the Spanish banking sector.
Following the hybrid instrument burden-sharing exercise, since the issues were held by retail and wholesale investors, the DGSCI resolved to make a voluntary offer to purchase all the shares received by the retail investors affected as a result of the exchange arising from the hybrid instrument burden-sharing exercise. As a result of these liquidity arrangements offered by the DGSCI, it became a shareholder of Catalunya Banc. As at December 2013, the FROB held 66% of the capital and the DGSCI held 32.4%.
In 2014 these holdings in Catalunya Banc were divested through two competitive processes in order to maximise their value:
— A specific portfolio, the so-called Hercules portfolio, comprising mortgage loans of little marketable value, was sold beforehand to the Blackstone fund; this sale increased the attractiveness of the institution and its possible sale in the second phase. The portfolio was sold for the same amount as its book value, €4,187 million. The operation was structured via the creation of a securitisation special-purpose entity (SPE) whose assets were the above-mentioned portfolio (transferred by Catalunya Banc), and which issued two types of bonds: (i) senior class A bonds, to be subscribed by the investor, and
194 banco de españa
(ii) class B bonds, to be subscribed by the FROB and which were subordinated to the former.
— 98.4% of Catalunya Banc, which was owned by the FROB and the DGSCI, was sold to BBVA for a price of €1,165 million.
The purchase agreements included certain commitments of the FROB and the DGSCI, estimated as at December 2015 to be €561 million and €275 million, respectively (these commitments include €525 million of bonds subscribed in the sale of the Hercules portfolio).
C.3 NCG Banco (2010 -2014)
In June 2010, Caja de Ahorros de Galicia (Caixa Galicia) and Caixa de Aforros de Vigo, Ourense e Pontevedra (Caixanova), began a merger process which led to the creation of Caixa de Aforros de Galicia, Vigo, Ourense e Pontevedra (NovaCaixaGalicia). The integration plan included aid from the FROB (subscription of convertible preference shares) totalling €1,162 million (FROB I, see Table 2.5).
In 2011, in order to meet capital needs of €2,465 million arising from Royal Decree-Law 2/2011 (achieving a “capital principal” – top-quality capital – ratio of 10%), the institution proposed a restructuring plan including fresh aid from the FROB and corporate restructuring of the group which involved the transfer of practically all of the assets and liabilities, except for those linked to welfare projects, to a newly created bank (NCG Banco) through which it would indirectly perform its financial activity.
On 26 September 2011 the Banco de España approved the recapitalisation plan submitted with the corresponding business plan that envisaged fresh aid from the FROB amounting to €2,465 million (FROB II, see Table 2.8). Following the approval by the European Commission of the capital injection, the FROB subscribed ordinary shares of NCG Banco for the above-mentioned amount, which in light of the valuation of the bank by independent experts, was equivalent to a holding in the institution of 93.16% (the remaining 10.26% remained at the savings bank resulting from the merger).
In 2012, as a result of the independent assessment of the financial sector, it was estimated that NCG Banco had additional capital needs of €7,176 million (under the adverse scenario, see Table 3.3). On 27 December 2012, the FROB and the Banco de España approved the resolution plan of NCG Banco, as did the European Commission a day later. The independent experts estimated that the institution had a negative economic value of €3,091 million and a negative liquidation value of €13,079 million. This operation was part of the financial assistance programme to recapitalise the Spanish banking sector.

195RepoRt on the financial and banking cRisis in spain, 2008-2014
This plan envisaged adopting various measures: the sale of NCG Banco’s holding in Banco Gallego; the sale of the EVO business unit (a banking business outside its traditional area); the transfer of assets to Sareb; the hybrid instrument burden-sharing exercise; the restructuring of the business through certain divestments, the restrictions on exercising the activity and the sharp reduction in size, number of employees and offices; the receipt of fresh aid from the FROB; and its subsequent sale.
Considering these measures, the volume of aid granted by the FROB amounted to €5,425 million (see Table 3.3). Before this capital was contributed, in December 2012 share capital was reduced to zero and the preference shares subscribed by the FROB in 2010 were converted, thus making the FROB the sole shareholder of NCG Banco at that time.
In December 2012, the FROB sold 2.59% of NCG Banco’s share capital to private shareholders for €71 million. Subsequently, following the burden-sharing, the FROB’s holding stood at 62.7% and that of the DGSCI at 25.6%. This ownership interest of the DGSCI arose from the use of the liquidity mechanism that it offered to retail investors.
In 2013 a competitive process was implemented to divest the holdings of the FROB and the DGSCI. Additionally, in order to facilitate and ensure the effectiveness of the sale, on 17 January 2014, the Banco de España resolved to replace the Board of Directors of NCG Banco and to appoint the FROB as provisional administrator.
On 25 June 2014, after the national and international authorisations had been obtained, NCG Banco was sold to Banco Etcheverría,S.A./Grupo Banesco, an entity which on 18 December 2013 made the winning bid of €1,003 million (it paid 40% in cash, the remaining 60% was paid in successive instalments and payment was completed in February 2017).
The purchase agreements entered into included certain commitments of the FROB and the DGSCI, estimated as at December 2015 to be €282 million and €115 million, respectively.
C.4 Banco de Valencia (2011-2013)
Another notable case originating in this period was that of Banco de Valencia. On 21 November 2011, the Banco de España resolved to replace the directors of Banco de Valencia with the FROB, at the request of the institution’s own board of directors, owing to its difficult solvency and liquidity situation and the impossibility of finding an immediate viable solution for its future.
To enable Banco de Valencia to continue to pursue its activity while an appropriate resolution strategy was designed and implemented, the FROB provided temporary assistance in the form of capital totalling €998 million (acquiring 90.89% of its shares in the process) and a credit line for
196 banco de españa
€2 billion. In addition, the Banco de España granted financing up to a ceiling of €6 billion in the form of urgent and temporary liquidity assistance.
The independent assessment of the financial sector in 2012 estimated that Banco de Valencia had additional capital needs totalling €3,462 million (under the adverse scenario, see Table 3.3).
On 27 November 2012, the FROB and the Banco de España approved the Resolution Plan for Banco de Valencia (the European Commission did so on 28 November). In their reports, independent experts estimated the entity to have a negative economic value of €2,244.5 million and a negative liquidation value of €6,340.5 million. This plan envisaged the sale of the institution.
Following a competitive process involving the participation of various institutions, and in which the different alternatives and costs of the ensuing scenarios were evaluated, all of the shares of Banco de Valencia owned by the FROB were awarded to CaixaBank. CaixaBank’s bid consisted of the injection by the FROB of capital totalling €4.5 billion into Banco de Valencia (in addition to the €998 million already committed, see Table 3.3) prior to its sale for one euro, guarantees to the purchaser for €165 million and an asset protection scheme (APS) covering 72.5% of the losses of a portfolio valued at €6,424 million, along with the transfer of assets to Sareb and burden-sharing exercises.
Once the conditions precedent envisaged in the agreement with CaixaBank were met, the sale was executed on 28 February 2013. On 29 July 2013, Banco de Valencia was removed from the Banco de España credit institutions register. The Banco de España initiated sanctioning proceedings in 2013 against the directors of Banco de Valencia.
D. other supervisory actions
Leaving to one side the actions arising from compliance with the MoU and the completion of the various restructuring/resolution processes in progress, in 2013 the following actions of the Banco de España are noteworthy:
— Limitations on the distribution of dividends. The Banco de España recommended that credit institutions limit their distribution of dividends during 2013 and that, in any event, cash dividends should not exceed 25% of attributable consolidated profit. This recommendation was maintained in 2014.86
86 �However, it was included that this ceiling may, in exceptional cases, be breached as long as the institution could substantiate a particularly favourable outlook for its margins and a CET1 capital ratio higher, as at 1 January 2014, than 11.5%, i.e. 3.5 pp above the CET1 level set as a benchmark for the comprehensive assessment of the European banking system which the ECB was going to undertake in 2014.
197RepoRt on the financial and banking cRisis in spain, 2008-2014
The criteria developed are summarised below:
(i) Decisions shall be underpinned by an individualised analysis of borrowers’ income sources to determine their ability to repay debt to the institution and any other debt incurred previously (knowledge of borrowers’ track record).
(ii) The conditions (e.g. interest rate, term, grace period) shall be based on realistic payment arrangements in accordance with borrowers’ ability to pay and the general economic situation.
(iii) Institutions shall have sufficiently updated estimates of the value of the existing collateral. Where new collateral is provided, its effectiveness and value must be analysed, taking into account the time taken by and capacity of the institution to liquidate it.
(iv) The decisions adopted shall be periodically reviewed to substantiate their effectiveness and the possible existence of incidents and to assess changing them in view of the results obtained (an internal information system is needed for this analysis).
Loans shall be classified pursuant to the provisions of Annex IX of Circular 4/2004. Loans shall be classified as “substandard” unless there are objective circumstances warranting their classification as “standard” or “doubtful”. However, guidance is also provided on this classification.
Standard: there is objective and verifiable evidence making it highly likely that all the amounts due will be recovered. The following shall be taken into consideration:
1 The inexistence of clauses which prevent, in the short term, borrowers’ actual ability to pay from being assessed, such as the granting of a lengthy grace period.
2 The existence of a debt repayment scheme which ensures adaptation to the demonstrable flow of borrowers’ recurring income, after deduction of that needed to meet any other debt incurred previously. In the case of loans to individuals structured through monthly payment instalments, the proportion of the monthly recurring income used for loan repayment may not exceed 50% of such income.
3 The addition of solvent new guarantors or of new effective collateral.
Doubtful: where the weakness in borrowers’ ability to pay is evident. The following shall be taken into consideration:
1 The provision of new effective collateral or the collection of all outstanding interest without any increase in the previous exposure.
2 The granting of principal repayment grace periods longer than 30 months, unless the contract includes conditions which significantly improve the likelihood of collection.
3 The appropriateness of previous refinancings or restructurings, unless there is evidence of borrowers’ sufficient ability to meet their commitments as and when contractually required.
In general, loans or borrowers shall be reclassified as “standard” if commitments have been met for a minimum of one year from the date the refinancing or restructuring was entered into (six months for loans with monthly instalments and mortgages on borrowers’ principal residence), or when the loan principal has been reduced by at least 10%.
box 3.3 CRITERIA oN REFINANCINg AND RESTRUCTURINg
198 banco de españa
— Review of forbone loans. As described in the section on the regulatory framework, in April 2013 the Banco de España developed a set of criteria that institutions had to take into account in formulating and approving loan forbearance policies and in the accounting classification of the transactions involved (see Box 3.3). The Banco de España had observed differences in the criteria used by the various institutions which needed to be standardised.
After the institutions were notified of these standardised criteria, they were encouraged to review, through an individualised study of their forborne loans, that the latter were properly identified, suitably classified for accounting purposes and that their provisioning was estimated adequately. The Banco de España’s inspection teams verified this process by identifying these loans in the databases used by the institutions as well as their characteristics and accounting classification. This review was supplemented with detailed analyses of borrowers through specific samples and also through the databases used by the institutions.

199RepoRt on the financial and banking cRisis in spain, 2008-2014
Caja Madrid BFA-Bankia (2010) IPS
IPS
IPS
IPS
IPS
IPS
Bancaja
564,4Caja Ávila
951,962424,2217,959564,4564,4-Caja Segovia
Caja Rioja
Caixa Laietana
Caja I. de Canarias
Caja Murcia
519Caixa Penedès
519-Sa Nostra
Caja Granada
Caja Navarra
Caja Canarias
779779Caja Burgos
CajaSol
Caja Guadalajara
Caja Inmaculada
Caja C. de Burgos 407
Caja Badajoz
Caixa Catalunya
250.219,084Caixa Manresa
Caixa Tarragona
Caixa Sabadell
Caixa Terrasa
Caixa Manlleu
Caja España
Caja Duero
Caixa Galicia
Caixanova
Unicaja
Caja Jaén
La Caixa
Caixa Girona
Caja Asturias + CCM
Caja Cantabria 124
Caja Extremadura
BBK + CajaSur 800+
APS 392
Kutxa
60,762
63,062
28,959(2012)
35,527
52,687
41,243
47,518
71,827(2011)
20,686
1,740+
APS 2,049
1,864+
APS 2,049
953+
APS 1,201
953+
APS 1,201
604
9,0525,425
1,645
351,269
44,546
037519
€m
Capital
Totalassets (e)Original savings
bankIntegration
model
Aid
TotalFROB I(a)
FROB II(b) DGS
Subsequent to Law 9/2012 (c)
TABLE 3.6 SUMMARY OF THE AID GRANTED UNTIL 31 DECEMBER 2013
New group
CoCos (d)
BMN (2010)
Banca Cívica (2010)
Caja3 (2010)
407
1,250
-1,250
1,718
1,250
Merger
Merger
Merger
Merger
Merger
Merger
Catalunya Caixa (2010)
568
-568
380
-380
Unnim (2010)
525CEISS (2010)
-525 5251,129
2,4651,162
-1,162
Novacaixagalicia (2010)
1,162
Unicaja (2010)
CaixaBank (2010)
Liberbank (2011)
800+
APS 392
Kutxabank (2011)
Caja Vital

200 banco de españa
Sold toBanco Sabadell (2013)
Sold to CaixaBank (2012)
€m
Capital
— 63,118
— 1,252
— 436
CAM5,249
+APS 3,648
5,249+
APS 3,648
70,805(2011)
1,777+
APS 39212,500
7,942+
APS 6,89833,198 1,135
56,552+
APS 7,290
Banco de Valencia998+
APS 5984,500
5,498+
APS 598
21,501(2012)
Banco Gallego 245 245 4,259(2012)
TOTAL AID1,777
+APS 392
13,498+
APS 598
7,942 (f)+
APS 6,89837,943 (g)
62,295+
APS 7,888
Totalassets (e)
Pollença
Sold toBanco Sabadell (2011)
TOTAL AID FOR SAVINGS BANKS
In addition to the foregoing, when Banco de Valencia was placed under official administration by the Banco de España in November 2011and was subsequently awarded by the FROB to CaixaBank, the following aid was granted:
Nova Caixa Galicia Banco held 99% of Banco Gallego's capital stock, following the subscription of a capital increase.In April 2013 Banco Gallego was auctioned and awarded to Banco Sabadell.
Ibercaja
Ontinyent
Original savingsbank
New group Integrationmodel
Aid
TotalFROB I(a)
FROB II(b) DGS
Subsequent to Law 9/2012 (c)
TABLE 3.6 SUMMARY OF THE AID GRANTED UNTIL 31 DECEMBER 2013 (cont’d)
SOURCES: FROB, DGS and Banco de España.NOTES:1 The amount of the asset protection schemes (APSs) relates to their estimated value as at December 2013 (amounts audited by independent experts).2 Furthermore, as part of the bank divestment process, the FROB granted other guarantees to buyer institutions. The aim of these guarantees, which is habitual in
this type of operation, is to limit the liability of the new purchaser to specific, previously identified contingencies. These contingencies are varied in nature, the most significant being the coverage of future claims for mis-selling of hybrid instruments and errors arising in transfers to Sareb, among others. As at December 2013, guarantees had been granted for the following amounts:
– CEISS: €429 million. – Banco de Valencia: €165 million. – Banco Gallego: €95 million.
a Aid granted in accordance with Royal Decree-Law 9/2009 (FROB I) through subscription of preference shares.b Aid granted in accordance with Royal Decree-Law 2/2011 (FROB II) through subscription of shares.c Contributions made in the framework of the financial assistance programme subsequent to Law 9/2012.d Contingent convertible bonds.e Amount as at 31 December 2013, unless otherwise indicated.f In addition to this amount, the DGSCI paid €1,803 million (€1,001 million at Catalunya Banc and €802 million at NCG Banco). In 2013 the DGSCI resolved to make
a voluntary offer to purchase the shares of the retail investors affected by the hybrid instrument burden-sharing exercise who had become shareholders after the hybrid instrument exchange performed by Catalunya Banc and NCG Banco (see Section 3.5.B.4 of this chapter).
g The sum of these amounts (37,943 + 1,135 = 39,078), minus the amount contributed to Banco Gallego (39,078 – 245 = 38,833), is the State aid shown in Table 3.3.
CoCos (d)
1,135 (g)
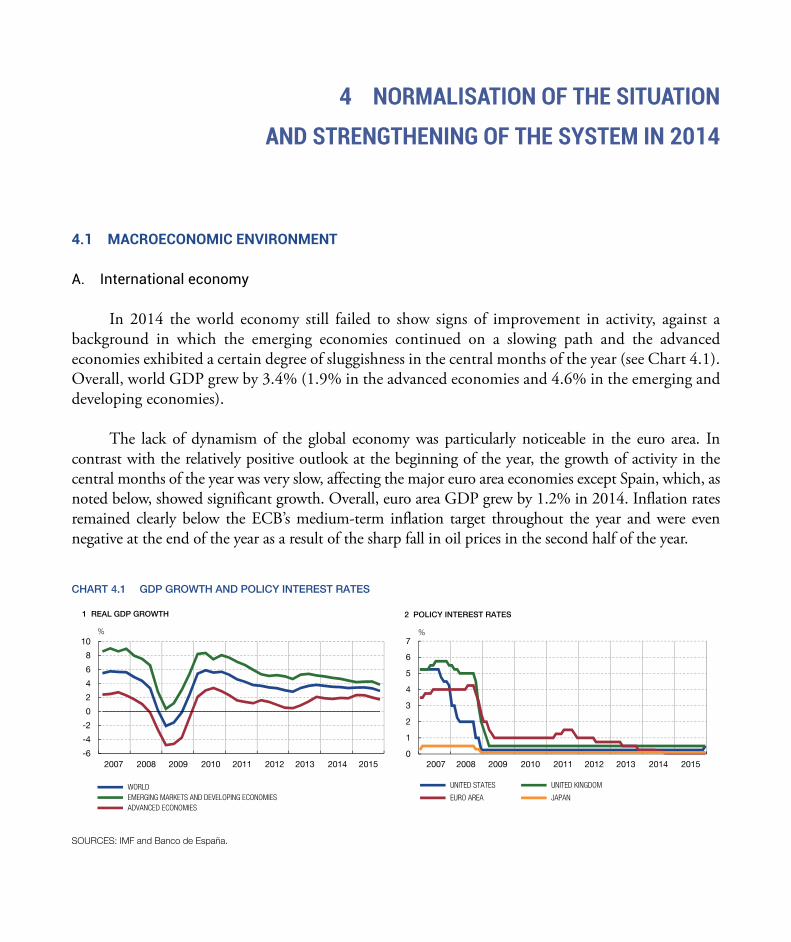
4 NORMALISATION OF THE SITuATION
AND STRENGTHENING OF THE SYSTEM IN 2014
4.1 �MACROECONOMIC�ENVIRONMENT
A. International economy
In 2014 the world economy still failed to show signs of improvement in activity, against a background in which the emerging economies continued on a slowing path and the advanced economies exhibited a certain degree of sluggishness in the central months of the year (see Chart 4.1). Overall, world GDP grew by 3.4% (1.9% in the advanced economies and 4.6% in the emerging and developing economies).
The lack of dynamism of the global economy was particularly noticeable in the euro area. In contrast with the relatively positive outlook at the beginning of the year, the growth of activity in the central months of the year was very slow, affecting the major euro area economies except Spain, which, as noted below, showed significant growth. Overall, euro area GDP grew by 1.2% in 2014. Inflation rates remained clearly below the ECB’s medium-term inflation target throughout the year and were even negative at the end of the year as a result of the sharp fall in oil prices in the second half of the year.
CHART 4.1 GDP GROWTH AND POLICY INTEREST RATES
SOURCES: IMF and Banco de España.
-6
-4
-2
0
2
4
6
8
10
2007 2008 2009 2010 2011 2012 2013 2014 2015 2007 2008 2009 2010 2011 2012 2013 2014 2015
WORLD EMERGING MARKETS AND DEVELOPING ECONOMIES ADVANCED ECONOMIES
%
1 REAL GDP GROWTH
0
1
2
3
4
5
6
7
UNITED STATES UNITED KINGDOM
EURO AREA JAPAN
%
2 POLICY INTEREST RATES

202 banco de españa
In June 2014 the Governing Council of the ECB, in view of the risks to meeting its price target, adopted an extensive package of measures, which was supplemented by various additional measures in September and early 2015 (see Chart 4.2): key interest rates were cut on two occasions, leaving the interest rate on the main refinancing operations at 0.05% and that on the deposit facility in negative territory at –0.2%; a new targeted longer-term refinancing operations (TLTROs) programme was adopted with the aim of stimulating lending to the private sector by participating institutions; the Governing Council of the ECB confirmed its forward guidance that key interest rates would remain at low levels for an extended period of time; and a new asset purchase programme was undertaken (initially, secured bank bonds, which include Spanish covered bonds and asset-backed securities) to make the monetary policy stance more expansionary.
This asset purchase programme was extended in early 2015 through the inclusion of a commitment by the ECB to purchase government debt securities. The highly expansionary monetary policy stance of the euro area contrasted with the first steps in the opposite direction by some central banks, such as the US Federal Reserve and the Bank of England, prompting a depreciation of the euro in the second half of 2014.
These developments were accompanied by significant progress in the institutional design of the euro area which significantly reversed the process of financial fragmentation between the euro area countries. In November 2014 the Single Supervisory Mechanism (SSM), the initial and key step in the sequence leading to the Banking Union, formally came into operation when the ECB took on the supervision of 130 institutions representing 82% of euro area banking assets. Previously the ECB, aided
CHART 4.2 EUROSYSTEM MONETARY POLICY
SOURCE: ECB.
-1
0
1
2
3
4
5
6
07 08 09 10 11 12 13 14 15
MAIN REFINANCING OPERATIONS MARGINAL LENDING FACILITY DEPOSIT FACILITY
1 ECB INTEREST RATES
%
-1,500
-1,000
-500
0
500
1,000
1,500
2,000
07 08 09 10 11 12 13 14 15
SECURITIES PURCHASES LONG-TERM OPERATIONS MAIN REFINANCING OPERATIONS DEPOSIT FACILITY + BANKS' CURRENT ACCOUNT HOLDINGS (INCLUDING MINIMUM RESERVES)
€bn
2 LIQUIDITY PROVISION BY THE EUROSYSTEM
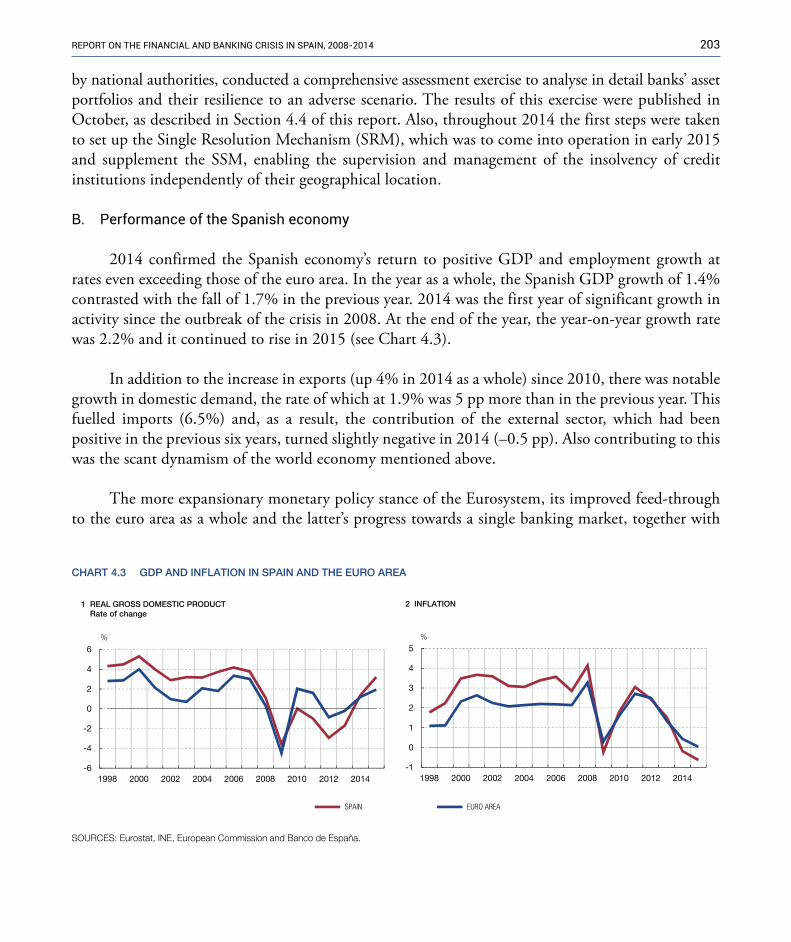
203RepoRt on the financial and banking cRisis in spain, 2008-2014
by national authorities, conducted a comprehensive assessment exercise to analyse in detail banks’ asset portfolios and their resilience to an adverse scenario. The results of this exercise were published in October, as described in Section 4.4 of this report. Also, throughout 2014 the first steps were taken to set up the Single Resolution Mechanism (SRM), which was to come into operation in early 2015 and supplement the SSM, enabling the supervision and management of the insolvency of credit institutions independently of their geographical location.
B. Performance of the Spanish economy
2014 confirmed the Spanish economy’s return to positive GDP and employment growth at rates even exceeding those of the euro area. In the year as a whole, the Spanish GDP growth of 1.4% contrasted with the fall of 1.7% in the previous year. 2014 was the first year of significant growth in activity since the outbreak of the crisis in 2008. At the end of the year, the year-on-year growth rate was 2.2% and it continued to rise in 2015 (see Chart 4.3).
In addition to the increase in exports (up 4% in 2014 as a whole) since 2010, there was notable growth in domestic demand, the rate of which at 1.9% was 5 pp more than in the previous year. This fuelled imports (6.5%) and, as a result, the contribution of the external sector, which had been positive in the previous six years, turned slightly negative in 2014 (–0.5 pp). Also contributing to this was the scant dynamism of the world economy mentioned above.
The more expansionary monetary policy stance of the Eurosystem, its improved feed-through to the euro area as a whole and the latter’s progress towards a single banking market, together with
SOURCES: Eurostat, INE, European Commission and Banco de España.
CHART 4.3 GDP AND INFLATION IN SPAIN AND THE EURO AREA
-6
-4
-2
0
2
4
6
1998 2000 2002 2004 2006 2008 2010 2012 2014
1 REAL GROSS DOMESTIC PRODUCTRate of change
%
-1
0
1
2
3
4
5
1998 2000 2002 2004 2006 2008 2010 2012 2014
2 INFLATION
%
SPAIN EURO AREA
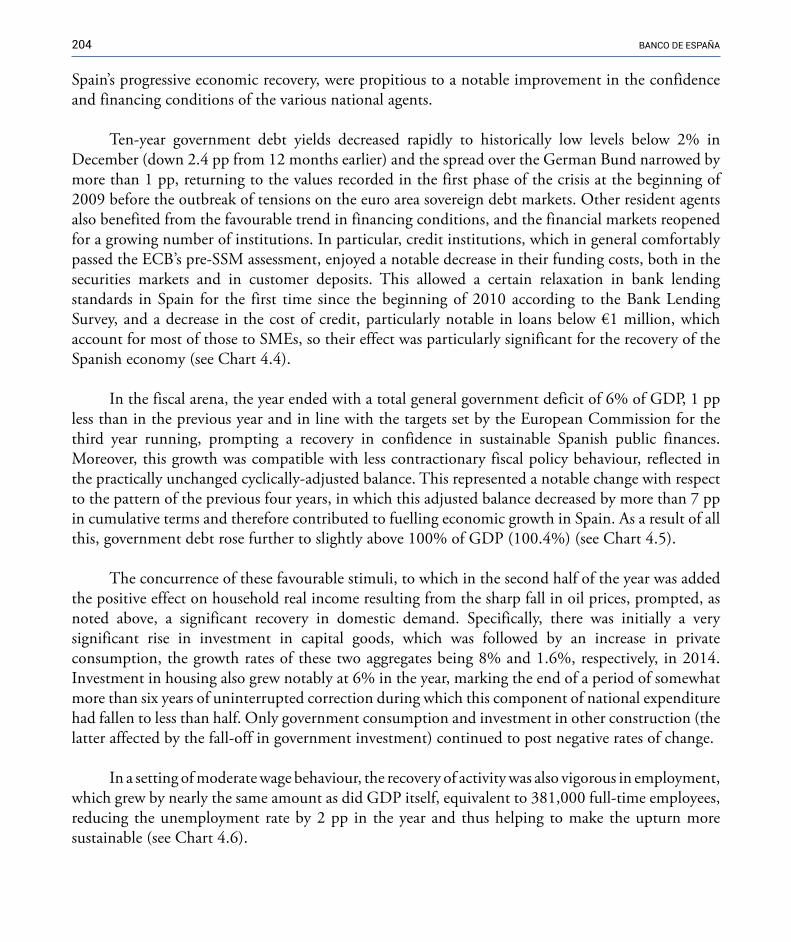
204 banco de españa
Spain’s progressive economic recovery, were propitious to a notable improvement in the confidence and financing conditions of the various national agents.
Ten-year government debt yields decreased rapidly to historically low levels below 2% in December (down 2.4 pp from 12 months earlier) and the spread over the German Bund narrowed by more than 1 pp, returning to the values recorded in the first phase of the crisis at the beginning of 2009 before the outbreak of tensions on the euro area sovereign debt markets. Other resident agents also benefited from the favourable trend in financing conditions, and the financial markets reopened for a growing number of institutions. In particular, credit institutions, which in general comfortably passed the ECB’s pre-SSM assessment, enjoyed a notable decrease in their funding costs, both in the securities markets and in customer deposits. This allowed a certain relaxation in bank lending standards in Spain for the first time since the beginning of 2010 according to the Bank Lending Survey, and a decrease in the cost of credit, particularly notable in loans below €1 million, which account for most of those to SMEs, so their effect was particularly significant for the recovery of the Spanish economy (see Chart 4.4).
In the fiscal arena, the year ended with a total general government deficit of 6% of GDP, 1 pp less than in the previous year and in line with the targets set by the European Commission for the third year running, prompting a recovery in confidence in sustainable Spanish public finances. Moreover, this growth was compatible with less contractionary fiscal policy behaviour, reflected in the practically unchanged cyclically-adjusted balance. This represented a notable change with respect to the pattern of the previous four years, in which this adjusted balance decreased by more than 7 pp in cumulative terms and therefore contributed to fuelling economic growth in Spain. As a result of all this, government debt rose further to slightly above 100% of GDP (100.4%) (see Chart 4.5).
The concurrence of these favourable stimuli, to which in the second half of the year was added the positive effect on household real income resulting from the sharp fall in oil prices, prompted, as noted above, a significant recovery in domestic demand. Specifically, there was initially a very significant rise in investment in capital goods, which was followed by an increase in private consumption, the growth rates of these two aggregates being 8% and 1.6%, respectively, in 2014. Investment in housing also grew notably at 6% in the year, marking the end of a period of somewhat more than six years of uninterrupted correction during which this component of national expenditure had fallen to less than half. Only government consumption and investment in other construction (the latter affected by the fall-off in government investment) continued to post negative rates of change.
In a setting of moderate wage behaviour, the recovery of activity was also vigorous in employment, which grew by nearly the same amount as did GDP itself, equivalent to 381,000 full-time employees, reducing the unemployment rate by 2 pp in the year and thus helping to make the upturn more sustainable (see Chart 4.6).
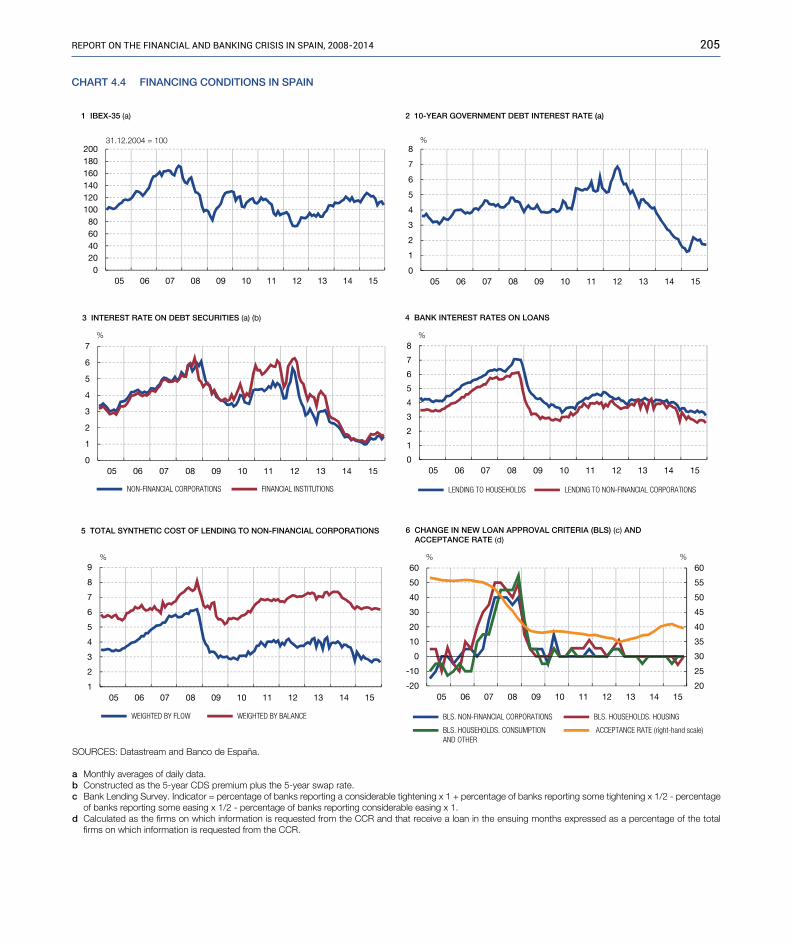
205RepoRt on the financial and banking cRisis in spain, 2008-2014
0
1
2
3
4
5
6
7
05 06 07 08 09 10 11 12 13 14 15
NON-FINANCIAL CORPORATIONS FINANCIAL INSTITUTIONS
3 INTEREST RATE ON DEBT SECURITIES (a) (b)
%
CHART 4.4 FINANCING CONDITIONS IN SPAIN
0
1
2
3
4
5
6
7
8
05 06 07 08 09 10 11 12 13 14 15
LENDING TO HOUSEHOLDS LENDING TO NON-FINANCIAL CORPORATIONS
%
4 BANK INTEREST RATES ON LOANS
1
2
3
4
5
6
7
8
9
05 06 07 08 09 10 11 12 13 14 15
WEIGHTED BY FLOW WEIGHTED BY BALANCE
5 TOTAL SYNTHETIC COST OF LENDING TO NON-FINANCIAL CORPORATIONS
%
20
25
30
35
40
45
50
55
60
-20
-10
0
10
20
30
40
50
60
05 06 07 08 09 10 11 12 13 14 15
BLS. NON-FINANCIAL CORPORATIONS BLS. HOUSEHOLDS. HOUSING
BLS. HOUSEHOLDS. CONSUMPTION AND OTHER
ACCEPTANCE RATE (right-hand scale)
%
6 CHANGE IN NEW LOAN APPROVAL CRITERIA (BLS) (c) AND ACCEPTANCE RATE (d)
%
020406080
100120140160180200
05 06 07 08 09 10 11 12 13 14 15
1 IBEX-35 (a)
31.12.2004 = 100
0
1
2
3
4
5
6
7
8
05 06 07 08 09 10 11 12 13 14 15
%
2 10-YEAR GOVERNMENT DEBT INTEREST RATE (a)
SOURCES: Datastream and Banco de España.
a Monthly averages of daily data.b Constructed as the 5-year CDS premium plus the 5-year swap rate.c Bank Lending Survey. Indicator = percentage of banks reporting a considerable tightening x 1 + percentage of banks reporting some tightening x 1/2 - percentage
of banks reporting some easing x 1/2 - percentage of banks reporting considerable easing x 1.d Calculated as the firms on which information is requested from the CCR and that receive a loan in the ensuing months expressed as a percentage of the total
firms on which information is requested from the CCR.

206 banco de españa
In contrast to what happened in 2010-2011, this time the correction of the imbalances accumulated in the run-up to the crisis was more complete. At the beginning of 2014, more than 70% of the loss of competitiveness recorded in the initial years of the euro area had been corrected, inflation was 0.6 pp below the euro area average and the net lending of the nation had turned positive again in 2013, standing at 2.1% of GDP.
Household and corporate debt had decreased by 24 pp of GDP from the high of 2010. The real estate market adjustment had left the weight of residential investment at 4.1% of GDP, down 8 pp from the previous high and clearly below its historical average. And confidence in the banking sector clean-up was boosted by the good results of Spanish banks in the aforementioned pre-SSM comprehensive assessment in November. Also, as noted above, the situation of public finances had improved, although both the budget deficit and government debt remained high. The improvement was, however, less appreciable in unemployment, with a rate still at 23.7% of the labour force in the fourth quarter of the year, and in the international investment position, which was then a negative net IIP equivalent to 97.5% of GDP (see Chart 4.7).
Against this background, the financing conditions of the Spanish economy in 2014 improved appreciably. The growth in lending to the resident private sector remained negative in the year as a whole, given the sector’s process of deleveraging, but the rate of change rose from –7.2% in December 2013 to –4.8% in the same month of 2014. Residential market prices rose by 1.8% in the year (the first increase since 2007), purchases/sales were more dynamic, increasing by 21%, and housing starts were steady after seven years of declines (see Chart 4.8).
CHART 4.5 FISCAL POLICY IN SPAIN
SOURCES: IGAE and Banco de España.
-12
-10
-8
-6
-4
-2
0
2
4
00 01 02 03 04 05 06 07 08 09 10 11 12 13 14 15
CYCLICALLY-ADJUSTED BALANCE NET OF AID TO FINANCIAL INSTITUTIONS
BALANCE NET OF AID TO FINANCIAL INSTITUTIONS
TOTAL BALANCE
% of GDP
1 SPANISH GENERAL GOVERNMENT BALANCE
0
20
40
60
80
100
120
00 01 02 03 04 05 06 07 08 09 10 11 12 13 14 15
% of GDP
2 SPANISH GENERAL GOVERNMENT DEBT

207RepoRt on the financial and banking cRisis in spain, 2008-2014
SOURCES: INE and Banco de España.
CHART 4.6 GDP, EMPLOYMENT AND PRICES IN SPAIN
0
5
10
15
20
25
30
80
85
90
95
100
105
110
2005 2006 2007 2008 2009 2010 2011 2012 2013 2014 2015
GDP EMPLOYMENT UNEMPLOYMENT RATE (right-hand scale)
1 GROSS DOMESTIC PRODUCT AND EMPLOYMENT
2008 Q2 = 100 %
80
85
90
95
100
105
110
115
2005 2006 2007 2008 2009 2010 2011 2012 2013 2014 2015
CPI GDP DEFLATOR
2 PRICES
2008 Q2 = 100
-25
-20
-15
-10
-5
0
5
10
80
85
90
95
100
105
110
115
2005 2006 2007 2008 2009 2010 2011 2012 2013 2014 2015
NATIONAL DEMAND
CONTRIBUTION FROM EXTERNAL SECTOR (right-hand scale)
3 NATIONAL DEMAND AND NET EXPORTS
2008 Q2 = 1002008 Q2 = 100
80
85
90
95
100
105
110
2005 2006 2007 2008 2009 2010 2011 2012 2013 2014 2015
PRIVATE CONSUMPTION
GOVERNMENT CONSUMPTION
4 PRIVATE CONSUMPTION AND GOVERNMENT CONSUMPTION
2008 Q2 = 100
40
50
60
70
80
90
100
110
120
2005 2006 2007 2008 2009 2010 2011 2012 2013 2014 2015
CAPITAL GOODS HOUSING OTHER CONSTRUCTION
5 INVESTMENT IN CAPITAL GOODS AND IN CONSTRUCTION
2008 Q2 = 100
60
70
80
90
100
110
120
130
2005 2006 2007 2008 2009 2010 2011 2012 2013 2014 2015
EXPORTS IMPORTS
6 EXPORTS AND IMPORTS
2008 Q2 = 100
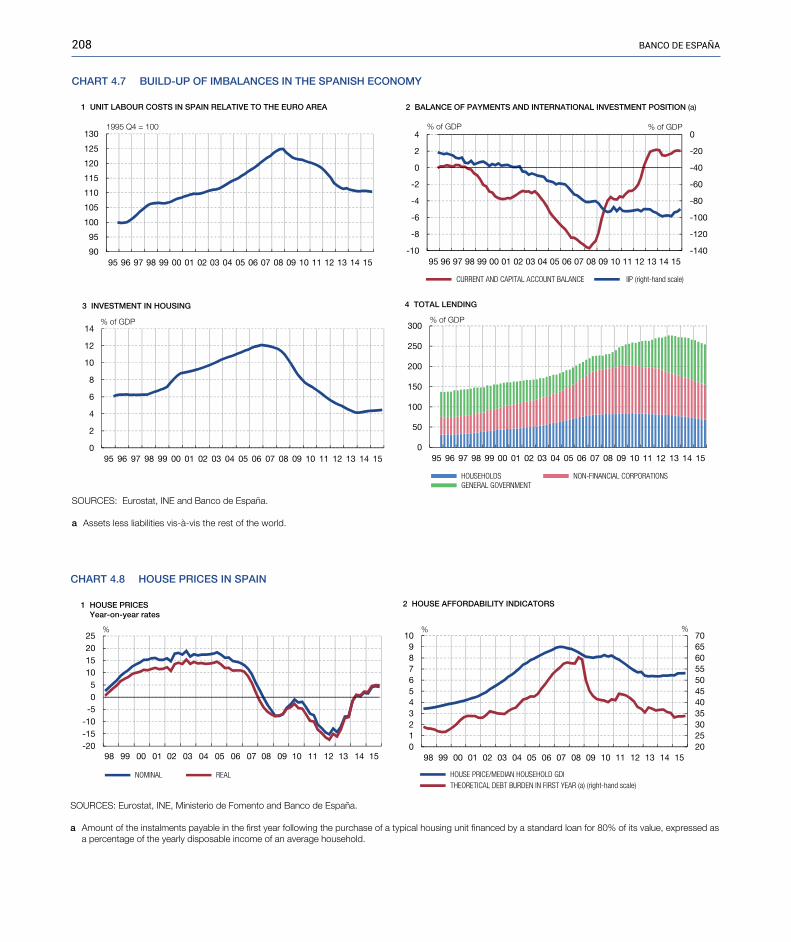
208 banco de españa
CHART 4.7 BUILD-UP OF IMBALANCES IN THE SPANISH ECONOMY
90
95
100
105
110
115
120
125
130
95 96 97 98 99 00 01 02 03 04 05 06 07 08 09 10 11 12 13 14 15
1 UNIT LABOUR COSTS IN SPAIN RELATIVE TO THE EURO AREA
1995 Q4 = 100
0
2
4
6
8
10
12
14
95 96 97 98 99 00 01 02 03 04 05 06 07 08 09 10 11 12 13 14 15
% of GDP
3 INVESTMENT IN HOUSING
0
50
100
150
200
250
300
95 96 97 98 99 00 01 02 03 04 05 06 07 08 09 10 11 12 13 14 15
HOUSEHOLDS NON-FINANCIAL CORPORATIONS GENERAL GOVERNMENT
% of GDP
4 TOTAL LENDING
-140
-120
-100
-80
-60
-40
-20
0
-10
-8
-6
-4
-2
0
2
4
95 96 97 98 99 00 01 02 03 04 05 06 07 08 09 10 11 12 13 14 15
CURRENT AND CAPITAL ACCOUNT BALANCE IIP (right-hand scale)
2 BALANCE OF PAYMENTS AND INTERNATIONAL INVESTMENT POSITION (a)
% of GDP % of GDP
SOURCES: Eurostat, INE and Banco de España.
a Assets less liabilities vis-à-vis the rest of the world.
CHART 4.8 HOUSE PRICES IN SPAIN
-20-15-10-505
10152025
NOMINAL REAL
1 HOUSE PRICESYear-on-year rates
%
2025303540455055606570
0123456789
10
98 99 00 01 02 03 04 05 06 07 08 09 10 11 12 13 14 15
HOUSE PRICE/MEDIAN HOUSEHOLD GDI THEORETICAL DEBT BURDEN IN FIRST YEAR (a) (right-hand scale)
2 HOUSE AFFORDABILITY INDICATORS
% %
SOURCES: Eurostat, INE, Ministerio de Fomento and Banco de España.
a Amount of the instalments payable in the first year following the purchase of a typical housing unit financed by a standard loan for 80% of its value, expressed as a percentage of the yearly disposable income of an average household.
98 99 00 01 02 03 04 05 06 07 08 09 10 11 12 13 14 15

209RepoRt on the financial and banking cRisis in spain, 2008-2014
4.2 FINANCIAL�SECTOR�
In 2014 the solvency and profitability of credit institutions improved notably with respect to the moments of highest uncertainty in previous periods, thanks to the recapitalisation, restructuring and resolution of institutions in distress, the stabilisation of international financial markets and the gradual recovery of activity in Spain. This recovery, combined with the consequent improvement in employment and the continuing low rates of interest, was propitious to a favourable trend in non-performing assets which in turn affected institutions’ balance sheets positively.
A. Credit to the resident private sector and investment in government debt
The deleveraging of the Spanish economy continued throughout 2014. Against this background, the volume of outstanding credit granted by Spanish deposit institutions to the resident private sector decreased by 4.4% year-on-year, the decline being greater for non-financial corporations than for households and, within the former, particularly pronounced in the construction and real estate activities sector (15.6%).
Compared with the pre-crisis levels (December 2007), the stock of credit in December 2014 had decreased by nearly €400 billion, or 22.9%. In these seven years, the most notable decline was in credit to non-financial corporations (36.8%), while credit to households fell less (13%). Within non-financial corporations, the fall was much sharper in the construction and real estate activities sector (56.1%) than in other sectors (16.3%). Charts 4.9 and 4.10 show the behaviour of credit in the period under analysis, including 2015 when the trend held on its downward path.
CHART 4.9 CREDIT TO THE RESIDENT PRIVATE SECTORIN SPAIN, IN ABSOLUTE TERMS AND AS PERCENTAGEOF GDP
60
80
100
120
140
160
180
500
750
1,000
1,250
1,500
1,750
2,000
00 01 02 03 04 05 06 07 08 09 10 11 12 13 14 15
VOLUME OF CREDIT CREDIT / GDP (right-hand scale)
€bn %
SOURCES: INE and Banco de España.
CHART 4.10 CUMULATIVE GROWTH OF CREDIT TO THERESIDENT PRIVATE SECTOR, BY LOAN PURPOSE
100
200
300
400
500
600
700
00 01 02 03 04 05 06 07 08 09 10 11 12 13 14 15
HOUSING OTHER HOUSEHOLD CREDIT CONSTRUCTION AND REAL ESTATE ACTIVITIES OTHER CREDIT TO NON-FINANCIAL CORPORATIONS
December 2000 = 100
SOURCE: Banco de España.
210 banco de españa
A.1. Non-performing loans (NPLs)
2014 was the first year in which the volume of deposit institutions’ NPLs decreased, after reaching an all-time high in 2013. In particular, non-performing assets decreased by more than €24 billion in the year, or 12.7%. Again, the fall was more marked in NPLs to non-financial corporations (14.3%) than in those to households (5.3%). The decrease in the NPLs of the construction and real estate activities sector came close to 20% in 2014. Despite these decreases, the total volume of non-performing assets continued to be well above the pre-crisis level (see Chart 4.11).
As a result of these decreases in the volume of non-performing assets, the NPL ratio for credit to the resident private sector decreased by 1.2 pp to stand at 12.8% at the end of 2014 (see Chart 4.12). The decline was across the board both for households and for non-financial corporations and, despite the larger fall in the latter, their NPL ratio (21.6%) stood above that for household credit (6.6%). Despite the decreases, it should be noted that the NPL ratio remained at higher levels than those before the crisis (which, as described in Chapter 1, were below 1%).
The NPL coverage ratio held at levels similar to those of the previous year, reaching 46.4% in December 2014, 10 pp above the pre-crisis level of December 2007. Charts 4.12 and 4.13 show the NPL and coverage ratios from 2000 to 2015, this latter year being that in which NPLs improved more briskly to stand at around 10%.
B. Government debt
As illustrated in Chart 4.14, government debt holdings by credit institutions continued to increase, reaching a high of €270 billion in 2014 (10.2% of institutions’ total assets), well above the €79 billion at the end of 2007 (2.8% of institutions’ total assets). The upward trend changed in 2015, when the weight of government debt in institutions’ balance sheets decreased by around 0.87 pp (€32 billion, of which 80% were held by the former savings banks). Contributing to this was, among other factors, the commencement of the ECB’s secondary markets public sector asset purchase programme in the opening months of the year.
C. Customer deposits
Deposits decreased by 1.9% in 2014 with respect to the previous year. This fall was mainly due to the decline in deposits from central banks (16.3%) and not so much to deposits from the private sector (0.6%).1
1 �The LTD ratio continued to decrease for deposit institutions as a whole and at 31 December 2014 stood at 109% (109% in commercial banks and 112% in savings banks). This trend continued in 2015 (106%).
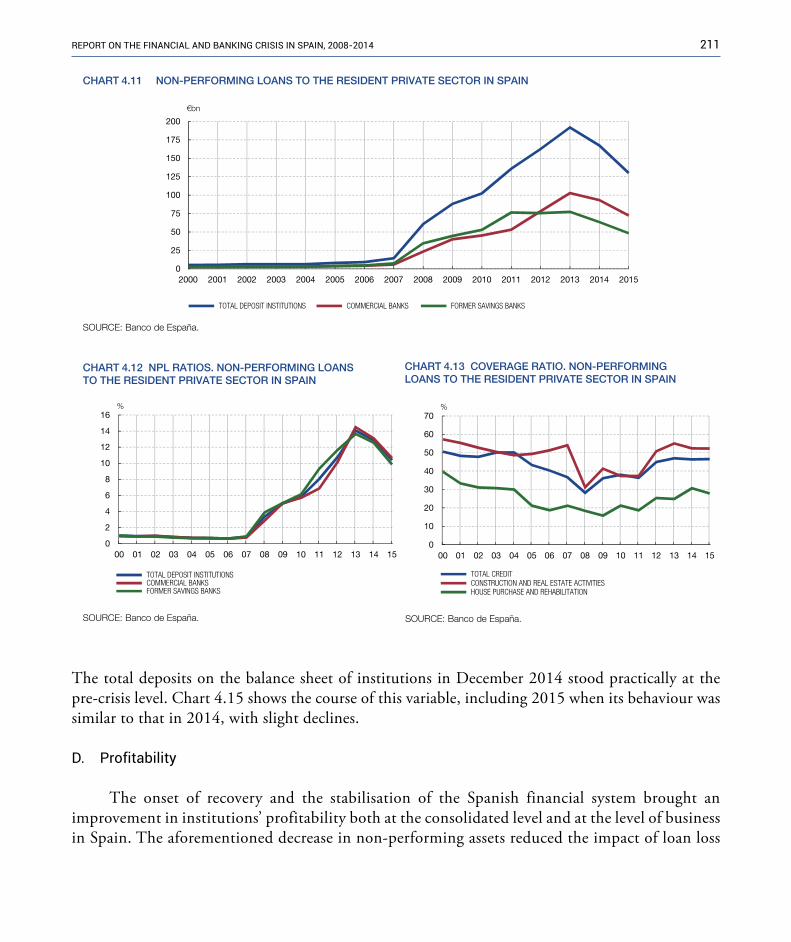
211RepoRt on the financial and banking cRisis in spain, 2008-2014
The total deposits on the balance sheet of institutions in December 2014 stood practically at the pre-crisis level. Chart 4.15 shows the course of this variable, including 2015 when its behaviour was similar to that in 2014, with slight declines.
D. Profitability
The onset of recovery and the stabilisation of the Spanish financial system brought an improvement in institutions’ profitability both at the consolidated level and at the level of business in Spain. The aforementioned decrease in non-performing assets reduced the impact of loan loss
0
25
50
75
100
125
150
175
200
2000 2001 2002 2003 2004 2005 2006 2007 2008 2009 2010 2011 2012 2013 2014 2015
TOTAL DEPOSIT INSTITUTIONS COMMERCIAL BANKS FORMER SAVINGS BANKS
€bn
CHART 4.11 NON-PERFORMING LOANS TO THE RESIDENT PRIVATE SECTOR IN SPAIN
SOURCE: Banco de España.
CHART 4.12 NPL RATIOS. NON-PERFORMING LOANSTO THE RESIDENT PRIVATE SECTOR IN SPAIN
0
2
4
6
8
10
12
14
16
00 01 02 03 04 05 06 07 08 09 10 11 12 13 14 15
TOTAL DEPOSIT INSTITUTIONS COMMERCIAL BANKS FORMER SAVINGS BANKS
%
SOURCE: Banco de España.
CHART 4.13 COVERAGE RATIO. NON-PERFORMINGLOANS TO THE RESIDENT PRIVATE SECTOR IN SPAIN
0
10
20
30
40
50
60
70
00 01 02 03 04 05 06 07 08 09 10 11 12 13 14 15
TOTAL CREDIT CONSTRUCTION AND REAL ESTATE ACTIVITIES HOUSE PURCHASE AND REHABILITATION
%
SOURCE: Banco de España.
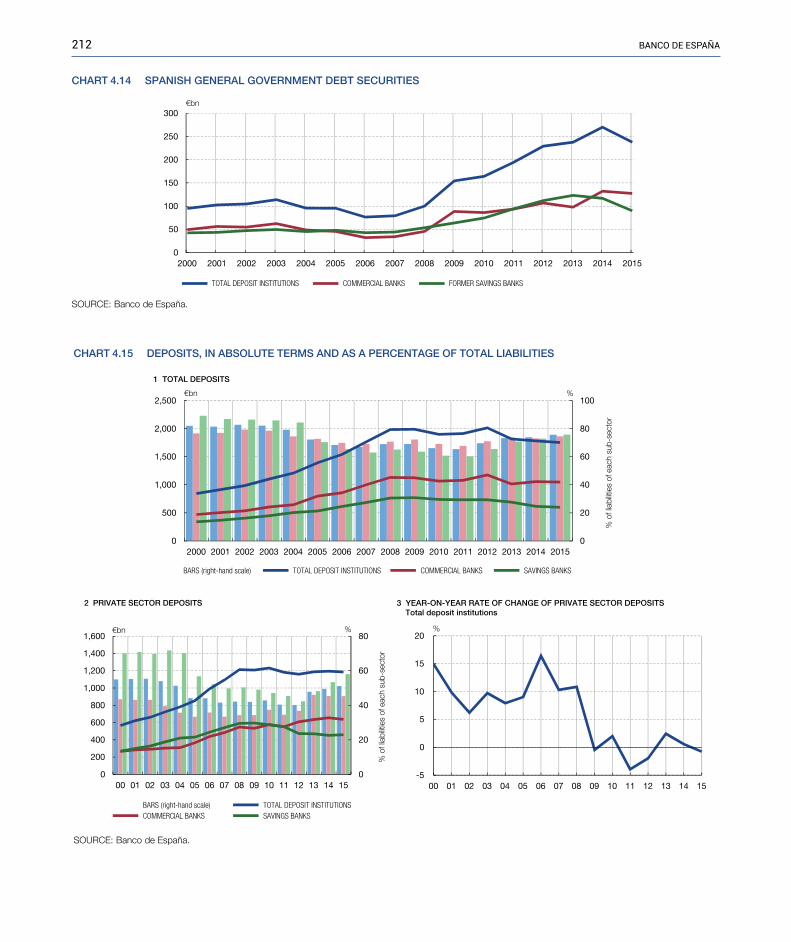
212 banco de españa
CHART 4.14 SPANISH GENERAL GOVERNMENT DEBT SECURITIES
0
50
100
150
200
250
300
2000 2001 2002 2003 2004 2005 2006 2007 2008 2009 2010 2011 2012 2013 2014 2015
TOTAL DEPOSIT INSTITUTIONS COMMERCIAL BANKS FORMER SAVINGS BANKS
€bn
SOURCE: Banco de España.
CHART 4.15 DEPOSITS, IN ABSOLUTE TERMS AND AS A PERCENTAGE OF TOTAL LIABILITIES
0
20
40
60
80
100
0
500
1,000
1,500
2,000
2,500
2000 2001 2002 2003 2004 2005 2006 2007 2008 2009 2010 2011 2012 2013 2014 2015
BARS (right-hand scale) TOTAL DEPOSIT INSTITUTIONS COMMERCIAL BANKS SAVINGS BANKS
€bn %
% o
f lia
bilit
ies
of e
ach
sub-
sect
or
1 TOTAL DEPOSITS
0
20
40
60
80
0
200
400
600
800
1,000
1,200
1,400
1,600
00 01 02 03 04 05 06 07 08 09 10 11 12 13 14 15
BARS (right-hand scale) TOTAL DEPOSIT INSTITUTIONS COMMERCIAL BANKS SAVINGS BANKS
€bn %
% o
f lia
bilit
ies
of e
ach
sub-
sect
or
2 PRIVATE SECTOR DEPOSITS
SOURCE: Banco de España.
3 YEAR-ON-YEAR RATE OF CHANGE OF PRIVATE SECTOR DEPOSITS Total deposit institutions
-5
0
5
10
15
20
00 01 02 03 04 05 06 07 08 09 10 11 12 13 14 15
%
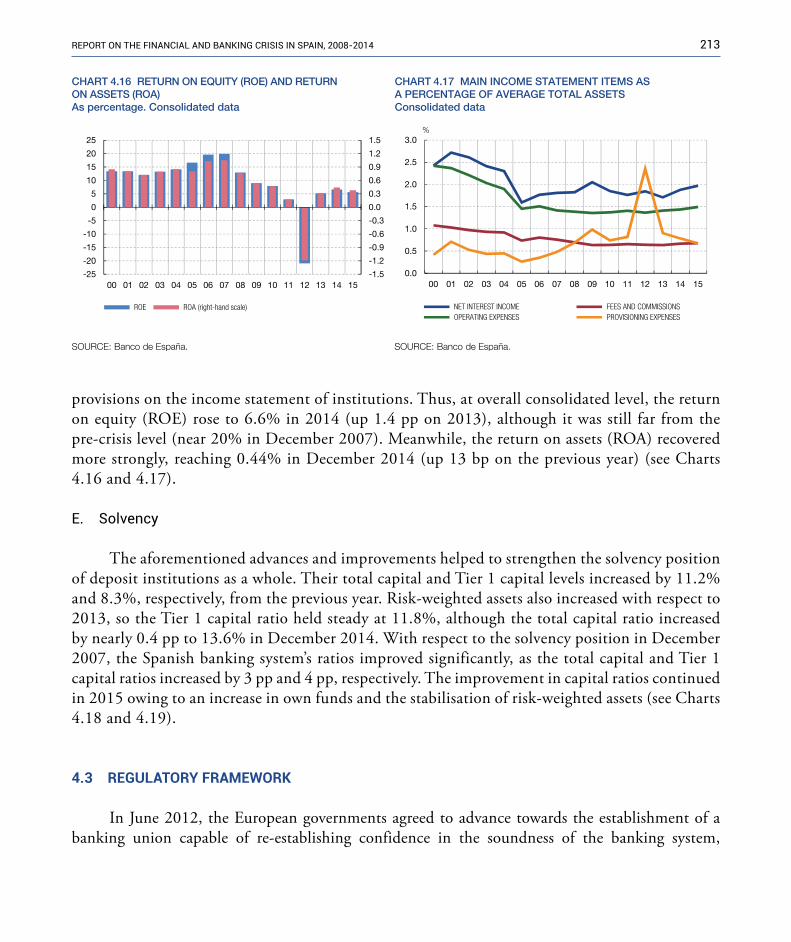
213RepoRt on the financial and banking cRisis in spain, 2008-2014
provisions on the income statement of institutions. Thus, at overall consolidated level, the return on equity (ROE) rose to 6.6% in 2014 (up 1.4 pp on 2013), although it was still far from the pre-crisis level (near 20% in December 2007). Meanwhile, the return on assets (ROA) recovered more strongly, reaching 0.44% in December 2014 (up 13 bp on the previous year) (see Charts 4.16 and 4.17).
E. Solvency
The aforementioned advances and improvements helped to strengthen the solvency position of deposit institutions as a whole. Their total capital and Tier 1 capital levels increased by 11.2% and 8.3%, respectively, from the previous year. Risk-weighted assets also increased with respect to 2013, so the Tier 1 capital ratio held steady at 11.8%, although the total capital ratio increased by nearly 0.4 pp to 13.6% in December 2014. With respect to the solvency position in December 2007, the Spanish banking system’s ratios improved significantly, as the total capital and Tier 1 capital ratios increased by 3 pp and 4 pp, respectively. The improvement in capital ratios continued in 2015 owing to an increase in own funds and the stabilisation of risk-weighted assets (see Charts 4.18 and 4.19).
4.3 REGULATORY�FRAMEWORK�
In June 2012, the European governments agreed to advance towards the establishment of a banking union capable of re-establishing confidence in the soundness of the banking system,
-1.5
-1.2
-0.9
-0.6
-0.3
0.0
0.3
0.6
0.9
1.2
1.5
-25
-20
-15
-10
-5
0
5
10
15
20
25
00 01 02 03 04 05 06 07 08 09 10 11 12 13 14 15
ROE ROA (right-hand scale)
CHART 4.16 RETURN ON EQUITY (ROE) AND RETURNON ASSETS (ROA)As percentage. Consolidated data
SOURCE: Banco de España.
CHART 4.17 MAIN INCOME STATEMENT ITEMS ASA PERCENTAGE OF AVERAGE TOTAL ASSETSConsolidated data
0.0
0.5
1.0
1.5
2.0
2.5
3.0
00 01 02 03 04 05 06 07 08 09 10 11 12 13 14 15
NET INTEREST INCOME FEES AND COMMISSIONS OPERATING EXPENSES PROVISIONING EXPENSES
%
SOURCE: Banco de España.
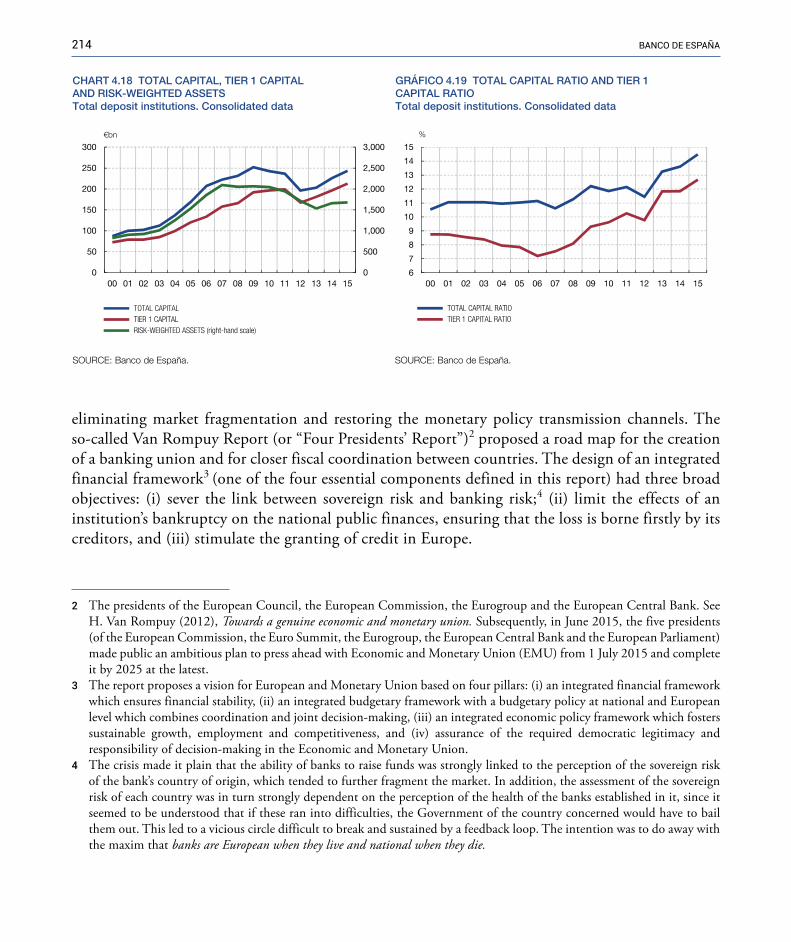
214 banco de españa
eliminating market fragmentation and restoring the monetary policy transmission channels. The so-called Van Rompuy Report (or “Four Presidents’ Report”)2 proposed a road map for the creation of a banking union and for closer fiscal coordination between countries. The design of an integrated financial framework3 (one of the four essential components defined in this report) had three broad objectives: (i) sever the link between sovereign risk and banking risk;4 (ii) limit the effects of an institution’s bankruptcy on the national public finances, ensuring that the loss is borne firstly by its creditors, and (iii) stimulate the granting of credit in Europe.
2 �The presidents of the European Council, the European Commission, the Eurogroup and the European Central Bank. See H. Van Rompuy (2012), Towards a genuine economic and monetary union. Subsequently, in June 2015, the five presidents (of the European Commission, the Euro Summit, the Eurogroup, the European Central Bank and the European Parliament) made public an ambitious plan to press ahead with Economic and Monetary Union (EMU) from 1 July 2015 and complete it by 2025 at the latest.
3 �The report proposes a vision for European and Monetary Union based on four pillars: (i) an integrated financial framework which ensures financial stability, (ii) an integrated budgetary framework with a budgetary policy at national and European level which combines coordination and joint decision-making, (iii) an integrated economic policy framework which fosters sustainable growth, employment and competitiveness, and (iv) assurance of the required democratic legitimacy and responsibility of decision-making in the Economic and Monetary Union.
4 �The crisis made it plain that the ability of banks to raise funds was strongly linked to the perception of the sovereign risk of the bank’s country of origin, which tended to further fragment the market. In addition, the assessment of the sovereign risk of each country was in turn strongly dependent on the perception of the health of the banks established in it, since it seemed to be understood that if these ran into difficulties, the Government of the country concerned would have to bail them out. This led to a vicious circle difficult to break and sustained by a feedback loop. The intention was to do away with the maxim that banks are European when they live and national when they die.
CHART 4.18 TOTAL CAPITAL, TIER 1 CAPITALAND RISK-WEIGHTED ASSETSTotal deposit institutions. Consolidated data
0
500
1,000
1,500
2,000
2,500
3,000
0
50
100
150
200
250
300
00 01 02 03 04 05 06 07 08 09 10 11 12 13 14 15
TOTAL CAPITAL TIER 1 CAPITAL RISK-WEIGHTED ASSETS (right-hand scale)
€bn
SOURCE: Banco de España.
GRÁFICO 4.19 TOTAL CAPITAL RATIO AND TIER 1CAPITAL RATIOTotal deposit institutions. Consolidated data
6
7
8
9
10
11
12
13
14
15
00 01 02 03 04 05 06 07 08 09 10 11 12 13 14 15
TOTAL CAPITAL RATIO TIER 1 CAPITAL RATIO
%
SOURCE: Banco de España.

215RepoRt on the financial and banking cRisis in spain, 2008-2014
The banking union project has three essential pillars: a Single Supervisory Mechanism (SSM), a Single Resolution Mechanism (SRM) and a Common Deposit Guarantee Scheme.5 The foundation on which all this rests is a single legal framework known as the “single rulebook”.
A. Single legal framework (single rulebook)
The aim of the single rulebook is to preserve the single financial services market and limit discretionality in its national application. It has three main features:
i) The implementation of European solvency rules, which transpose the Basel III Accord to European legislation in the form of Regulation (EU) No 575/2013 (capital requirements regulation – CRR), directly applicable in the Member States, and Directive 2013/36/EU (capital requirements directive IV – CRD IV), which has to be transposed to national law by the Member States. The main elements of these rules, which notably strengthen the capital framework of financial institutions so as to limit their likelihood of bankruptcy, are set out in Box 4.1.
ii) European rules on the recovery and resolution of credit institutions and investment firms, set out in Directive 2014/59/EU (bank recovery and resolution directive – BRRD), aimed at reducing the public cost of bank crises and facilitating the orderly resolution of non-viable institutions (see Box 4.2).
iii) Technical standards and guidelines prepared by the European banking authority (EBA), which supplement the aforementioned European rules (see Box 4.3).
B. Single Supervisory Mechanism
In October 2013, the European Council approved Regulation (EU) No 1024/2013 (SSM Regulation) assigning to the ECB specific tasks in the prudential supervision of credit institutions of the participating Member States.
The SSM came into operation on 4 November 2014 with the objectives of ensuring an appropriate supervision and soundness of the European banking system and contributing to financial stability and integration in the euro area. It is structured as an integrated system led by the European Central Bank (ECB) and in which the national competent authorities (NCAs) participate in the prudential supervision of credit institutions.
5 �Currently the SSM and the SRM are functioning, but not the Common Deposit Guarantee Scheme, the structure of which is being discussed in the European framework.
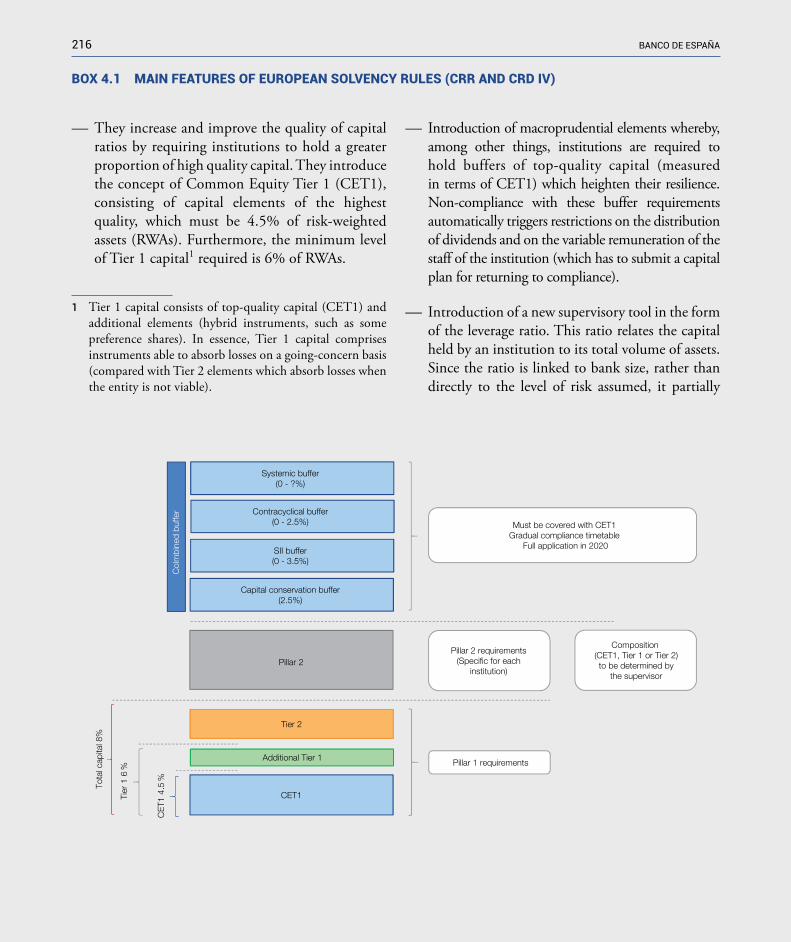
216 banco de españa216 banco de españa
— They increase and improve the quality of capital ratios by requiring institutions to hold a greater proportion of high quality capital. They introduce the concept of Common Equity Tier 1 (CET1), consisting of capital elements of the highest quality, which must be 4.5% of risk-weighted assets (RWAs). Furthermore, the minimum level of Tier 1 capital1 required is 6% of RWAs.
— Introduction of macroprudential elements whereby, among other things, institutions are required to hold buffers of top-quality capital (measured in terms of CET1) which heighten their resilience. Non-compliance with these buffer requirements automatically triggers restrictions on the distribution of dividends and on the variable remuneration of the staff of the institution (which has to submit a capital plan for returning to compliance).
— Introduction of a new supervisory tool in the form of the leverage ratio. This ratio relates the capital held by an institution to its total volume of assets. Since the ratio is linked to bank size, rather than directly to the level of risk assumed, it partially
box 4.1 MAIN FEATURES oF EURoPEAN SoLVENCY RULES (CRR AND CRD IV)
1 �Tier 1 capital consists of top-quality capital (CET1) and additional elements (hybrid instruments, such as some preference shares). In essence, Tier 1 capital comprises instruments able to absorb losses on a going-concern basis (compared with Tier 2 elements which absorb losses when the entity is not viable).
Must be covered with CET1 Gradual compliance timetable
Full application in 2020
Systemic buffer(0 - ?%)
Contracyclical buffer(0 - 2.5%)
SII buffer(0 - 3.5%)
Capital conservation buffer(2.5%)
Col
mbi
ned
buffe
r
Pillar 2 requirements(Specific for each
institution)
Composition (CET1, Tier 1 or Tier 2)to be determined by
the supervisor
Tier 2
Additional Tier 1
CET1
Pillar 1 requirements
Tota
l cap
ital 8
%
Tier
1 6
%
CE
T1 4
.5 %
Pillar 2
box 4.1 MAIN FEATURES oF EURoPEAN SoLVENCY RULES (CRR AND CRD IV) (cont’d)
complements the solvency ratio, a concept linked to the risk assumed by the institution.
— Tightening of liquidity management requirements. Introduction of short-term and long-term liquidity requirements denoted “liquidity coverage ratio” and “net stable funding ratio”, respectively. The first requires an institution to have sufficient high-quality liquid assets for its short-term (one month) fund outflows. The second seeks
to ensure an appropriate funding structure, such that longer-term assets are funded by long-term sources.
— Greater role of elements relating to institutions’ corporate governance (through a requirement that committees prioritise independent decision-making and ensure better risk-taking) and to their remuneration policy (by requiring a remuneration policy in keeping with the risks taken).
217REPoRt oN thE FINANCIAl AND BANkING CRISIS IN SPAIN, 2008-2014
box 4.2 MAIN FEATURES oF EURoPEAN RULES oN RESoLUTIoN (bRRD)
The BRRD establishes a harmonised European resolution framework the main aims of which are to ensure financial system stability, reduce to a minimum the cost of bank crises for the taxpayer and assure the continuity of institutions’ critical functions. This framework is structured in three phases:
— Pre-crisis or preventive phase, in which institutions and authorities plan how to address a critical situation or a potential resolution. This phase includes most notably the following:
i) Preparation of recovery plans by institutions defining the measures they would adopt to re-establish their financial position in a crisis.
ii) Design of resolution plans by resolution authorities establishing the road map to be followed for the resolution of an institution, if necessary. As an integral part of these plans, the
resolution authority carries out two important tasks: resolvability analysis (aimed at identifying and remedying, where applicable, potential obstacles to rapidly executing a potential resolution) and the determination of the minimum requirement for own funds and eligible liabilities (MREL) to be held by institutions to ensure loss absorbency and, where applicable, recapitalisation.
— Early intervention phase, in which the supervisor assumes additional powers supplementing the other supervisory measures at its disposal to intervene in institutions when these show signs of weakness but are still viable.
— Resolution phase, in which it is decided how to manage an institution that has reached the point of non-viability. Once this point has been reached and once private alternatives or other supervisory

218 banco de españa
box 4.2 MAIN FEATURES oF EURoPEAN RULES oN RESoLUTIoN (bRRD) (cont’d)
measures able to prevent this non-viability have been ruled out, the resolution authority assesses whether it is in the public interest to apply resolution tools (otherwise the institution has to be wound up by ordinary insolvency proceedings).
— Additionally, the BRRD defines a wide range of resolution tools available to the resolution authority, such as sale of the business, transfer of assets or liabilities to a bridge institution or to an asset
management company, and internal recapitalisation (bail-in). This latter tool extends to the bank’s creditors the obligation to absorb losses (together with shareholders) and is a keystone of the resolution framework. A golden rule in applying this measure is to take into account the no creditor worse off principle, i.e. that no creditor will incur greater losses than would have been incurred if the institution had been wound up under normal insolvency proceedings.
BANCo DE ESPAñA218
box 4.3 EURoPEAN CoMMITTEE RULES
From the regulatory standpoint, the EBA was not particularly affected by the entry into operation of the Single Supervisory Mechanism in November 2014. In fact its regulatory role gained strength from the approval of new EU legislation containing EBA mandates for the technical development of certain matters. Thus the bank recovery and resolution directive, the deposit guarantee systems directive, the mortgage market directive and the payment systems directive entrust the EBA to draft both technical standards and implementation guidelines.
The EBA’s work on technical standards included two important areas requiring attention: the validation of internal risk models and the development of the resolution directive.
— Model validation
The reason for this work is that appreciable disparities had been detected in the calculation of
risk weighted assets by credit institutions through their internal models (credit risk and market models), leading to a lack of market confidence in their reliability and to potential problems of competitive equality among European institutions. As a result, in this period the technical standards and the work envisaged in the CRDIV on comparability exercises were finalised and the internal model assessment methodology standards (finally published in June 2016) were developed.
— Resolution of institutions
The entry into force in 2014 of the bank recovery and resolution directive (BRRD) marked for the EBA the initiation of the development of the various technical standards mandated by the directive, which were largely completed in this period. Noteworthy are the implementing standards on contents and assessment of bank
box 4.3 EURoPEAN CoMMITTEE RULES (cont’d)
recovery plans and the standard on criteria relating to the method for setting the minimum requirement for own funds and eligible liabilities (MREL). The EBA standard seeks to harmonise assessment by the authorities.
The most noteworthy guidelines are described below:
— Guidelines on the security of Internet payments (EBA/GL/2014/12).
Prepared as the implementation of the payment services directive, they set minimum requirements on the security of Internet payments which are obligatory for payment services providers and must be evaluated by supervisory authorities.
— Guidelines on common procedures and methodologies for the supervisory review and evaluation process (EBA/GL/2014/13).
These guidelines, which specify the common procedures and methodologies for the supervisory review and evaluation process, are applicable to all supervisory authorities, including the SSM.
— Guidelines on product oversight and governance arrangements for retail banking products (EBA/GL/2015/18).
These guidelines fall within the function of consumer protection entrusted to the EBA which has been increasing in importance in recent years.
The centralisation of the data reported by institutions through the FINREP and COREP templates was achieved in 2014 upon the completion of the common reporting templates whose preparation was initiated by the CEBS in 2004. This represented an enormous improvement in the level of information on bank operations available to supervisors, with the consequent increase in their ability to analyse the true health of banks.
In 2015 the EBA started to adapt the FINREP templates to the new IFRS 9 accounting standard.
Finally, the strengthening of market discipline was another of the priorities addressed in this two-year period through the consolidation of the transparency exercises initiated in 2013 as a tool intended to complement stress tests.
219REPoRt oN thE FINANCIAl AND BANkING CRISIS IN SPAIN, 2008-2014
As a preparatory step to the start-up of the SSM, the ECB, in collaboration with the NCAs, conducted a comprehensive assessment of the main banking groups in the euro area. This exercise, which included a detailed review of the assets on bank balance sheets and a stress test, aimed to make the position of European banks more transparent and identify the actions which might be needed to strengthen their solvency. The details of this exercise are included in the following section.
The SSM Regulation defines the role of the ECB. In accordance with this regulation, the banks of the countries participating in the SSM are divided into two groups: significant and less significant. Classification of an institution as significant is based on criteria of size (whether the value of its assets exceeds €30 billion), economic importance (whether its assets exceed 20% of national GDP, unless its
220 banco de españa
assets are below €5 billion), level of cross-border activity, whether it receives direct assistance from the European Stability Mechanism and, finally, whether it is one of the three main credit institutions of the country in question. Institutions’ classifications are reviewed at least annually.The ECB directly supervises the former and indirectly supervises the latter,6 the national supervisors being entrusted with their direct supervision. Furthermore, the ECB, in cooperation with the NCAs, has powers in respect of the so-called “common procedures” applying to significant and less significant banks, which basically include the granting or withdrawal of banking licences and the authorisation of qualifying holdings.
Although the start-up of the SSM meant that the ECB became responsible for supervisory decisions regarding significant banks, the Banco de España and the other national authorities participate in the decision-making process through their representation on the SSM’s Supervisory Board and, ultimately, on the ECB’s Governing Council (see Diagram 4.1).
Additionally, from a practical standpoint, the national authorities play an essential role in the supervision of significant banks in two ways: continuous monitoring and on-site inspections. Continuous supervision is carried out by joint supervisory teams (JSTs) consisting of ECB and NCA professionals who are responsible for day-to-day supervisory activity at significant banks. On-site inspection is carried out through specific on-site inspection visits by ECB and NCA professionals (generally different from those forming the JSTs, although one or two of their members may participate).
As regards less significant banks, the Banco de España continues to be responsible for their direct surveillance. The ECB, in cooperation with the Banco de España and the other NCAs, works to ensure the uniform and consistent application of supervisory practices to these banks.
Lastly, the Banco de España continues to have supervisory powers in the areas of prevention of money laundering, bank customer protection and the supervision of banking foundations and other non-bank financial institutions.
C Single Resolution Mechanism
The Single Resolution Mechanism (SRM) is the second pillar of the Banking Union and has a dual objective: (i) to centralise resolution decision-making7 through a Single Resolution Board (SRB) and (ii) to ensure consistent resolution financing practices through a Single Resolution Fund (SRF).
6 �In this respect, the ECB monitors the supervision of less significant banks by the NCAs and may decide to supervise directly any bank of the Member States participating in the SSM in order to ensure that supervisory rules are applied consistently.
7 �The SRM complements the SSM in that it meets the need to prevent Member States from separately adopting potentially contradictory decisions for the resolution of banking groups which may affect the overall costs of resolution. It did not seem reasonable to have, on the one hand, a supranational body directly supervising significant banks and, on the other, national resolution authorities taking measures which might not be compatible with a Europe-wide perspective.
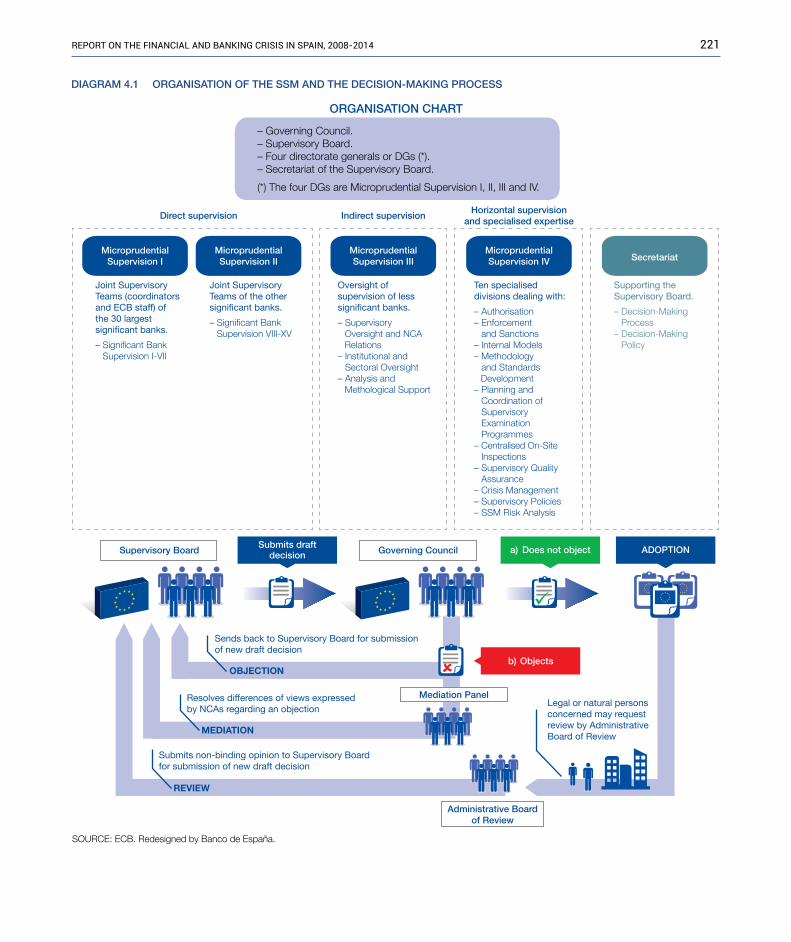
221RepoRt on the financial and banking cRisis in spain, 2008-2014
SOURCE: ECB. Redesigned by Banco de España.
DIAGRAM 4.1 ORGANISATION OF THE SSM AND THE DECISION-MAKING PROCESS
Direct supervision
Supervisory Board
Administrative Boardof Review
Sends back to Supervisory Board for submissionof new draft decision
Governing Council
Indirect supervisionHorizontal supervision
and specialised expertise
MicroprudentialSupervision I
MicroprudentialSupervision II
MicroprudentialSupervision III
MicroprudentialSupervision IV Secretariat
Joint Supervisory Teams (coordinators and ECB staff) of the 30 largest significant banks.
– Significant Bank Supervision I-VII
Joint Supervisory Teams of the other significant banks.
– Significant Bank Supervision VIII-XV
Oversight of supervision of less significant banks.
– Supervisory Oversight and NCA Relations– Institutional and Sectoral Oversight– Analysis and Methological Support
Ten specialised divisions dealing with:
– Authorisation– Enforcement and Sanctions– Internal Models– Methodology and Standards Development– Planning and Coordination of Supervisory Examination Programmes– Centralised On-Site Inspections– Supervisory Quality Assurance– Crisis Management– Supervisory Policies– SSM Risk Analysis
Supporting the Supervisory Board.
– Decision-Making Process– Decision-Making Policy
Submits draftdecision a) Does not object
b) Objects
ADOPTION
OBJECTION
Resolves differences of views expressedby NCAs regarding an objection
Legal or natural personsconcerned may requestreview by AdministrativeBoard of Review
MEDIATION
Submits non-binding opinion to Supervisory Boardfor submission of new draft decision
REVIEW
Mediation Panel
ORGANISATION CHART
– Governing Council.– Supervisory Board.– Four directorate generals or DGs (*).– Secretariat of the Supervisory Board.
(*) The four DGs are Microprudential Supervision I, II, III and IV.

222 banco de españa
The SRM is governed by Regulation (EU) No 806/2014 of 15 July 2014. The SRM, fully operational since 1 January 2016, is also structured as an integrated system led by the SRB, of which the national resolution authorities of the participating Member States form part. The scope of Regulation 806/2014 is linked to that of the SSM Regulation.
Thus the SRB is responsible for adopting all resolution decisions for banks directly supervised by the ECB, for other cross-border groups of less significant institutions and for any other less significant institution in which it has been decided to use the SRF.8
In Spain, the institutional framework for resolution purposes (stipulated in Law 11/2015 of 18 July 2015 which transposes the resolution directive, i.e. the BRRD, into Spanish law) distinguishes between preventive resolution functions, which in the case of credit institutions are entrusted to the Banco de España9 (which carries them out separately from its supervisory functions) and executive resolution functions, which are assigned to the FROB.10
The SRF is a supranational fund financed by bank contributions. It is envisaged that in eight years’ time it will hold a volume of funds equal to at least 1% of the covered deposits of credit institutions authorised in the Member States of the Banking Union (estimated amount of approximately €55 billion).
D. key Spanish legislation in this period
Box 4.4 sets out the regulatory provisions in Spanish law derived from the aforementioned European legislation and from the new framework of supervisory powers in place following the start-up of the SSM and the SRM.
European solvency legislation and the new supervisory power allocation under the SSM are set forth in Law 10/2014 of 26 June 2014 on the regulation, supervision and solvency of credit institutions and in its implementing rules and regulations (Royal Decree 84/2015 of 13 February 2015 and Banco de España Circular 2/2016 of 2 February 2016).
Law 11/2015 of 18 June 2015 on the recovery and resolution of credit institutions and investment firms and its implementing royal decree (Royal Decree 1012/2015 of 6 November 2015)
��8 ��Nevertheless, the regulation allows the SRB to assume authority over any institution in order to ensure consistent application of the resolution rules set in EU legislation.
��9 �In the case of investment firms, the preventive resolution functions are assigned to the CNMV.10 �This law also changed the composition of the FROB’s Governing Committee, on which the Banco de España sits with
four members out of the total of eleven, although it does not sit on the core committee which takes decisions affecting the State Budget.

box 4.4 MAIN LEgAL ChANgES IN SPAIN DERIVED FRoM ThE EURoPEAN REgULAToRY FRAMEwoRk, IN ChRoNoLogICAL oRDER
— 26 June 2014: Law 10/2014 on the regulation, supervision and solvency of credit institutions.
— 13 February 2015: Royal Decree 84/2015 implementing Law 10/2014 of 26 June 2014 on regulation, supervision and solvency of credit institutions.
— 18 June 2015: Law 11/2015 on the recovery and resolution of credit institutions and investment firms.
— 6 November 2015: Royal Decree 1012/2015 implementing Law 11/2015 of 18 June 2015 on
the recovery and resolution of credit institutions and investment firms and amending Royal Decree 2606/1996 of 20 December 1966 on credit institution deposit guarantee funds.
— 2 February 2016: Banco de España Circular 2/2016 to credit institutions on supervision and solvency, which completes the adaptation of Spanish law to Directive 2013/36/EU and to Regulation (EU) No 575/2013.
wrote into Spanish law the new resolution framework established by the directive on the recovery and resolution of credit institutions and investment firms, thus repealing nearly all of Law 9/2012 referred to in the preceding chapter, which had already transposed to Spanish law some of that directive.
4.4 ACTIONS�TAKEN�TO�RESTRUCTURE�THE�SPANISH�FINANCIAL�SYSTEM�(2014-2015)
A. Sale of FRoB and DGSCI investees
As a result of the capital injections and hybrid instrument burden-sharing exercises described in the preceding chapter, at 31 December 2013 the holdings of the FROB and the DGSCI in the institutions receiving State aid were as shown in Table 4.1 below.
In 2014 the sale of the FROB and DGSCI holdings in NCG Banco was completed, as, in 2015, was the sale of those in Catalunya Banc.11 Thus the resolution of both institutions was deemed to
11 Section 3.5.C describes the supervisory actions taken at these banks.
223REPoRt oN thE FINANCIAl AND BANkING CRISIS IN SPAIN, 2008-2014
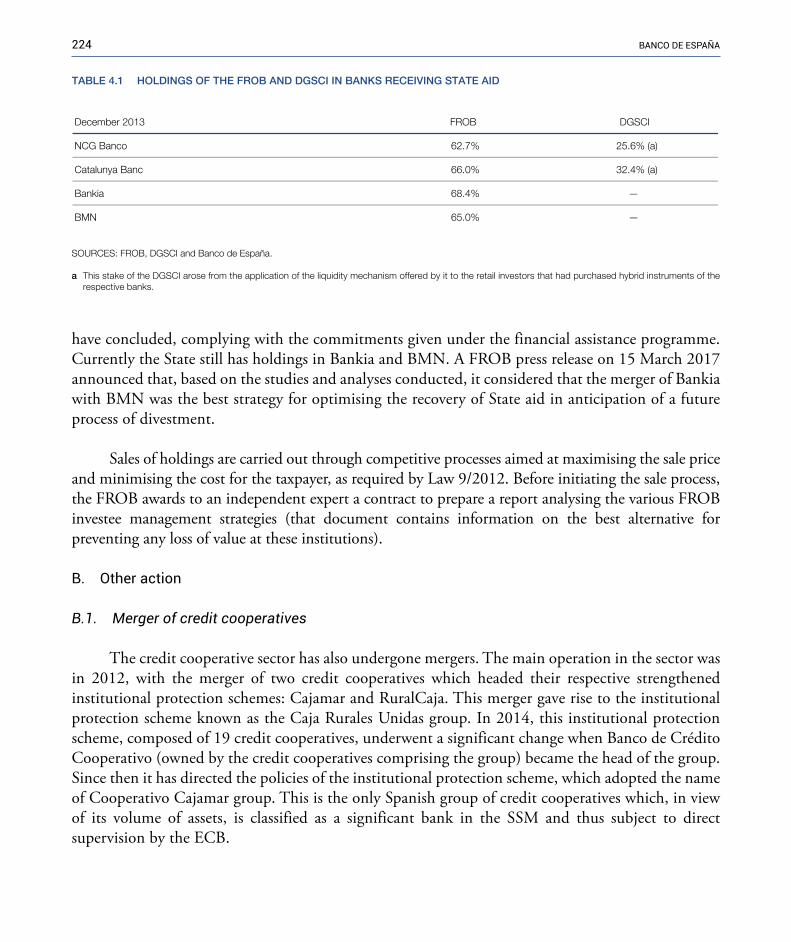
224 banco de españa
have concluded, complying with the commitments given under the financial assistance programme. Currently the State still has holdings in Bankia and BMN. A FROB press release on 15 March 2017 announced that, based on the studies and analyses conducted, it considered that the merger of Bankia with BMN was the best strategy for optimising the recovery of State aid in anticipation of a future process of divestment.
Sales of holdings are carried out through competitive processes aimed at maximising the sale price and minimising the cost for the taxpayer, as required by Law 9/2012. Before initiating the sale process, the FROB awards to an independent expert a contract to prepare a report analysing the various FROB investee management strategies (that document contains information on the best alternative for preventing any loss of value at these institutions).
B. other action
B.1. Merger of credit cooperatives
The credit cooperative sector has also undergone mergers. The main operation in the sector was in 2012, with the merger of two credit cooperatives which headed their respective strengthened institutional protection schemes: Cajamar and RuralCaja. This merger gave rise to the institutional protection scheme known as the Caja Rurales Unidas group. In 2014, this institutional protection scheme, composed of 19 credit cooperatives, underwent a significant change when Banco de Crédito Cooperativo (owned by the credit cooperatives comprising the group) became the head of the group. Since then it has directed the policies of the institutional protection scheme, which adopted the name of Cooperativo Cajamar group. This is the only Spanish group of credit cooperatives which, in view of its volume of assets, is classified as a significant bank in the SSM and thus subject to direct supervision by the ECB.
DGSCIBORFDecember 2013
)a( %6.52%7.26 ocnaB GCN
)a( %4.23%0.66cnaB aynulataC
Bankia —%4.86
BMN —%0.56
TABLE 4.1 HOLDINGS OF THE FROB AND DGSCI IN BANKS RECEIVING STATE AID
SOURCES: FROB, DGSCI and Banco de España.
a This stake of the DGSCI arose from the application of the liquidity mechanism offered by it to the retail investors that had purchased hybrid instruments of the respective banks.

225RepoRt on the financial and banking cRisis in spain, 2008-2014
B.2. Investigation of alleged irregular operations
The FROB initiated or was represented in various criminal cases analysing or investigating alleged offences involving real estate transactions or the remuneration of former managers of financial institutions which received State aid. The Banco de España referred to the public prosecution service or the relevant court, as appropriate, several transactions suspected of constituting offences, various of which are under investigation, mostly by the National High Court. Detailed information on these legal actions is given in Annex 1 of this report.
C. Pre-SSM comprehensive assessment12 of the banking sector in November 2014
At the end of 2013, despite the efforts made from the onset of the crisis by credit institutions (which had raised capital of €225 billion) and Governments (which had injected €275 billion),13 totalling 5% of European GDP, weaknesses in terms of financial market fragmentation persisted throughout Europe.
Against this background, the ECB, in close cooperation with the Banco de España and the other NCAs, conducted a detailed assessment of the euro area banking system before assuming responsibility for supervision in November 2014. The comprehensive assessment encompassed 130 institutions from 19 countries, representing 81.6% of the total assets of the institutions which came under the supervision of the Single Supervisory Mechanism. Of these institutions, 15 were Spanish and represented more than 90% of the total assets of deposit institutions in Spain.
The purpose of this assessment was threefold: 1) increase the transparency of European banks’ balance sheets so that their solvency can be more readily evaluated; 2) strengthen these balance sheets by correcting any shortcomings identified, and 3) raise confidence in the European banking system.
The exercise comprised two distinct phases:14
— The asset quality review (AqR), carried out in accordance with the methodology prepared by the ECB. The result of this phase consisted of a series of adjustments to the
12 For more details, see Chapter 4 of the Banco de España’s Financial Stability Report of November 2014.13 �Note from the European Central Bank: “Note: Comprehensive Assessment, October 2013”, https://www.ecb.europa.eu/
pub/pdf/other/notecomprehensiveassessment201310en.pdf14 �Taking into account that the asset assessment and the stress test overlapped in time, an additional exercise, centrally
controlled by the ECB, was carried out to check how well the results of the two phases of the exercise were integrated with each other (so-called join-up test). This was done to ensure that the results of the asset assessment were appropriately taken into account in the stress tests.
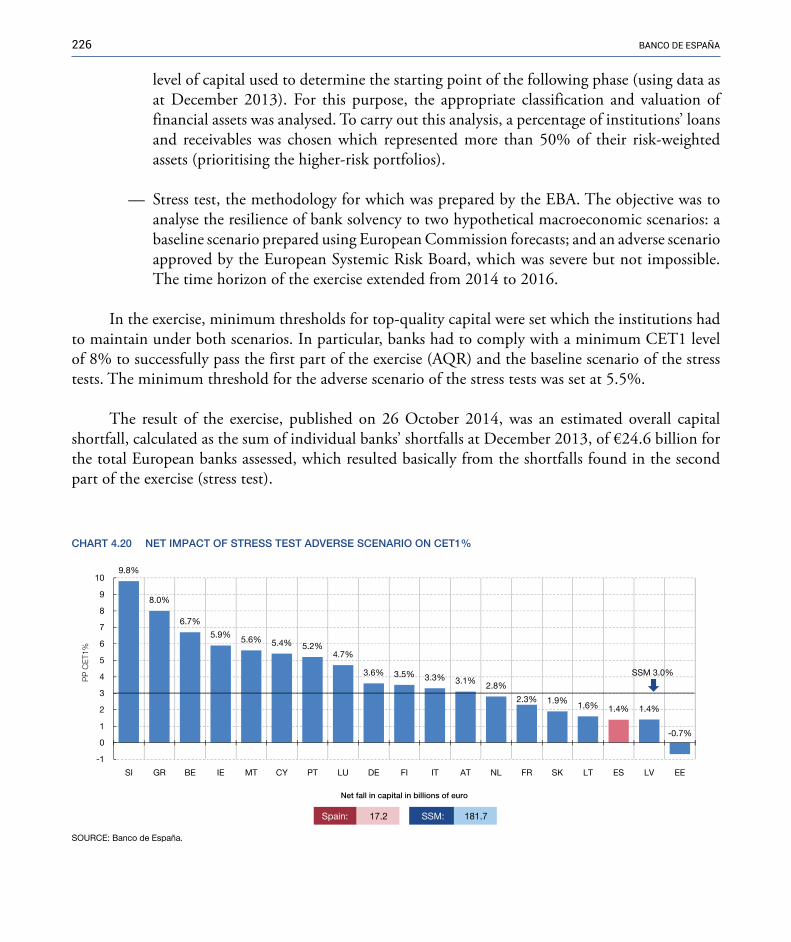
226 banco de españa
level of capital used to determine the starting point of the following phase (using data as at December 2013). For this purpose, the appropriate classification and valuation of financial assets was analysed. To carry out this analysis, a percentage of institutions’ loans and receivables was chosen which represented more than 50% of their risk-weighted assets (prioritising the higher-risk portfolios).
— Stress test, the methodology for which was prepared by the EBA. The objective was to analyse the resilience of bank solvency to two hypothetical macroeconomic scenarios: a baseline scenario prepared using European Commission forecasts; and an adverse scenario approved by the European Systemic Risk Board, which was severe but not impossible. The time horizon of the exercise extended from 2014 to 2016.
In the exercise, minimum thresholds for top-quality capital were set which the institutions had to maintain under both scenarios. In particular, banks had to comply with a minimum CET1 level of 8% to successfully pass the first part of the exercise (AqR) and the baseline scenario of the stress tests. The minimum threshold for the adverse scenario of the stress tests was set at 5.5%.
The result of the exercise, published on 26 October 2014, was an estimated overall capital shortfall, calculated as the sum of individual banks’ shortfalls at December 2013, of €24.6 billion for the total European banks assessed, which resulted basically from the shortfalls found in the second part of the exercise (stress test).
Spain: 17.2 SSM: 181.7
CHART 4.20 NET IMPACT OF STRESS TEST ADVERSE SCENARIO ON CET1%
9.8%
8.0%
6.7%
5.9% 5.6% 5.4% 5.2%4.7%
3.6% 3.5% 3.3% 3.1% 2.8%
2.3% 1.9% 1.6% 1.4% 1.4%
-0.7%
-1
0
1
2
3
4
5
6
7
8
9
10
SI GR BE IE MT CY PT LU DE FI IT AT NL FR SK LT ES LV EE
SOURCE: Banco de España.
PP
CE
T1%
SSM 3.0%
Net fall in capital in billions of euro

227RepoRt on the financial and banking cRisis in spain, 2008-2014
Nevertheless, in 2014 many European credit institutions had already adopted measures to strengthen their solvency in anticipation of the results of these tests. In fact the participating banks had increased their capital by around €40.5 billion, so only 13 institutions had to adopt additional measures to remedy a shortfall of around €9.5 billion.
The results of the exercise for Spanish banks were satisfactory and better than the average. Thus Chart 4.20 shows that the relative impact of the adverse scenario was more marked for the aggregate of SSM banks than for Spanish banks. Only one Spanish bank had a capital shortfall at December 2013, although it was very small (€32 million) and, moreover, was covered by the bank itself15 before the results for the year were reported.
Similarly, in the first part of the comprehensive assessment, i.e. the phase in which the appropriate classification and valuation of financial assets was analysed (AqR), the resulting capital adjustment at Spanish banks was the lowest out of all the SSM countries, as reflected in Chart 4.21.
The results of the comprehensive assessment reflected the process of clean-up, reform and restructuring of the Spanish banking system carried out in the preceding years and showed that the balance sheets and solvency positions of Spanish banks would allow them to face the challenges awaiting in the short- and medium-term.16
15 It increased its capital by around €640 million.16 �See Banco de España press release on the results of the AqR, http://www.bde.es/f/webbde/GAP/Secciones/SalaPrensa/
NotasInformativas/14/Arc/Fic/presbe2014_48en.pdf
Spain:
SOURCE: Banco de España.
2.2 SSM: 33.8
CHART 4.21 NET IMPACT OF AQR ON CET1%
Net impact in billions of euro
2.9%
2.2%2.1%
0.9% 0.9% 0.9% 0.9%0.7%
0.6% 0.6%0.5% 0.5%
0.4% 0.4%0.3% 0.3%
0.2% 0.2% 0.1%0
0.5
1.0
1.5
2.0
2.5
3.0
GR CY SI LV EE PT AT IT MT SK FI BE NL LT IE DE LU FE ES
PP
CE
T1%
SSM

5 OVERVIEW OF THE CRISIS
5.1 �APPRAISAL�OF�THE�RESTRUCTURING�PROCESS
The Spanish banking system withstood reasonably well the first effects of the international financial crisis in mid-2007 when the subprime crisis erupted in the United States, assisted, among other factors, by the Spanish supervisory practice that required that special investment vehicles be included on institutions’ balance sheets. It was not until 2009 that some credit institutions’ solvency became adversely affected, as the crisis heightened in the wake of the rapid deterioration of the international financial markets and, in a recessionary environment, the imbalances that had built up in Spain during the previous upturn were revealed. In the upswing the high growth of credit to the private sector, its concentration in the real estate sector (see Table 1.1) and the growing recourse to wholesale funding rather than retail deposits to finance credit growth, put the banking sector and the Spanish economy in a highly vulnerable position.
The supervisory instruments available at the time, developed with an essentially microprudential approach – strengthened in the case of Spain by the countercyclical provisions, which helped reduce the cost of the adjustment – proved insufficient and the vulnerabilities that had built up began to emerge. And this in a setting in which the institutional architecture of the euro area was still incomplete. In this respect, important lessons in financial supervision and regulation may be drawn from the crisis, affecting both the international and the domestic sphere.
In the international arena, events have shown the importance of strengthening and coordinating prudential regulation, which over the period was reformed in three main areas: redefinition and strengthening of the microprudential framework; introduction of a separate framework for systemically important financial institutions; and development of a new macroprudential regulatory framework addressing systemic risk. As described in this report, the new regulations imposed greater requirements on financial institutions ‒ capital ratios and countercyclical buffers, among others ‒ and also introduced new instruments for early identification of financial risks.
It was also necessary to adapt the international institutions to what was now a globalised economy and a highly interconnected international financial system. This need was especially acute in the case of the European Union, which during those years rolled out a reform of its economic and financial architecture, with the introduction, for example, of the European Stability Mechanism
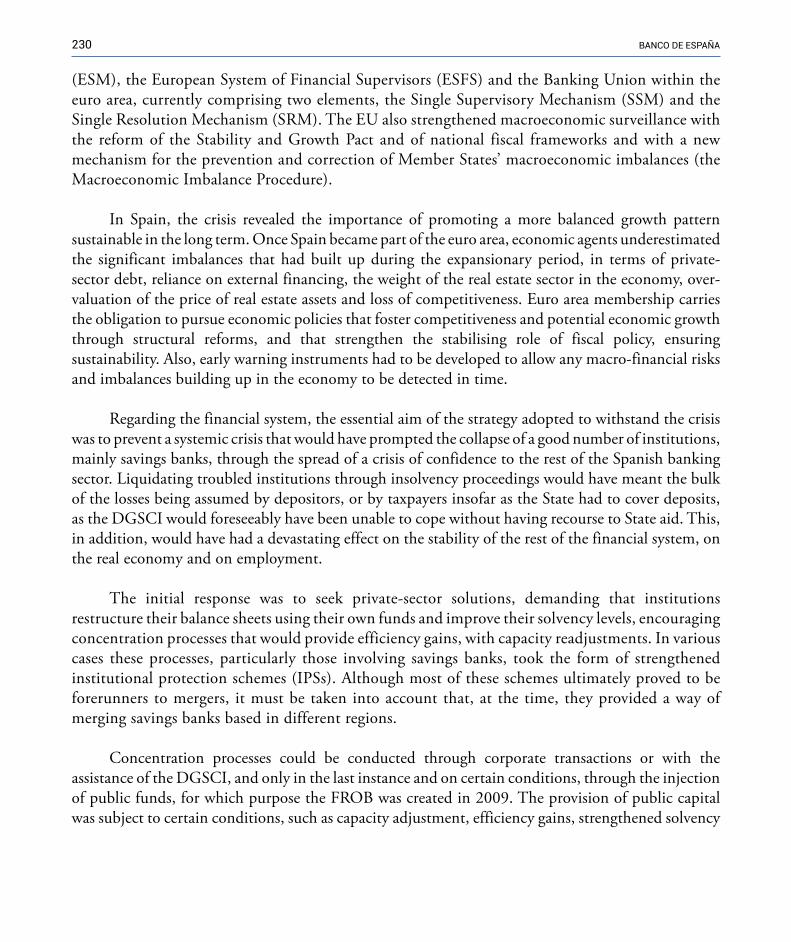
230 banco de españa
(ESM), the European System of Financial Supervisors (ESFS) and the Banking Union within the euro area, currently comprising two elements, the Single Supervisory Mechanism (SSM) and the Single Resolution Mechanism (SRM). The EU also strengthened macroeconomic surveillance with the reform of the Stability and Growth Pact and of national fiscal frameworks and with a new mechanism for the prevention and correction of Member States’ macroeconomic imbalances (the Macroeconomic Imbalance Procedure).
In Spain, the crisis revealed the importance of promoting a more balanced growth pattern sustainable in the long term. Once Spain became part of the euro area, economic agents underestimated the significant imbalances that had built up during the expansionary period, in terms of private-sector debt, reliance on external financing, the weight of the real estate sector in the economy, over-valuation of the price of real estate assets and loss of competitiveness. Euro area membership carries the obligation to pursue economic policies that foster competitiveness and potential economic growth through structural reforms, and that strengthen the stabilising role of fiscal policy, ensuring sustainability. Also, early warning instruments had to be developed to allow any macro-financial risks and imbalances building up in the economy to be detected in time.
Regarding the financial system, the essential aim of the strategy adopted to withstand the crisis was to prevent a systemic crisis that would have prompted the collapse of a good number of institutions, mainly savings banks, through the spread of a crisis of confidence to the rest of the Spanish banking sector. Liquidating troubled institutions through insolvency proceedings would have meant the bulk of the losses being assumed by depositors, or by taxpayers insofar as the State had to cover deposits, as the DGSCI would foreseeably have been unable to cope without having recourse to State aid. This, in addition, would have had a devastating effect on the stability of the rest of the financial system, on the real economy and on employment.
The initial response was to seek private-sector solutions, demanding that institutions restructure their balance sheets using their own funds and improve their solvency levels, encouraging concentration processes that would provide efficiency gains, with capacity readjustments. In various cases these processes, particularly those involving savings banks, took the form of strengthened institutional protection schemes (IPSs). Although most of these schemes ultimately proved to be forerunners to mergers, it must be taken into account that, at the time, they provided a way of merging savings banks based in different regions.
Concentration processes could be conducted through corporate transactions or with the assistance of the DGSCI, and only in the last instance and on certain conditions, through the injection of public funds, for which purpose the FROB was created in 2009. The provision of public capital was subject to certain conditions, such as capacity adjustment, efficiency gains, strengthened solvency
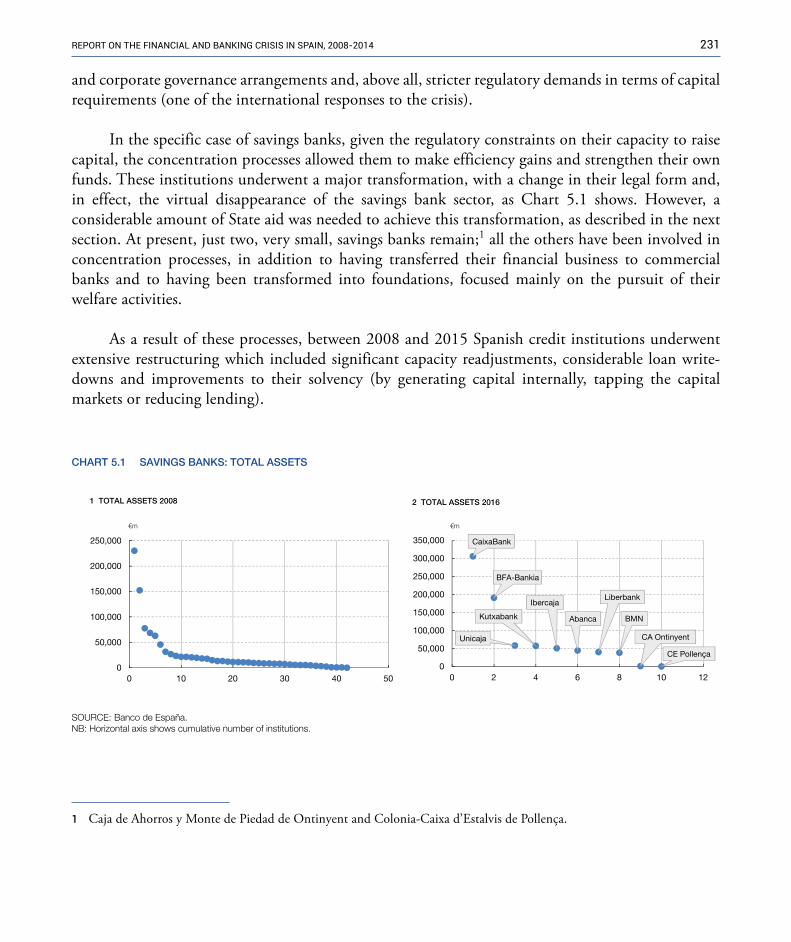
231RepoRt on the financial and banking cRisis in spain, 2008-2014
and corporate governance arrangements and, above all, stricter regulatory demands in terms of capital requirements (one of the international responses to the crisis).
In the specific case of savings banks, given the regulatory constraints on their capacity to raise capital, the concentration processes allowed them to make efficiency gains and strengthen their own funds. These institutions underwent a major transformation, with a change in their legal form and, in effect, the virtual disappearance of the savings bank sector, as Chart 5.1 shows. However, a considerable amount of State aid was needed to achieve this transformation, as described in the next section. At present, just two, very small, savings banks remain;1 all the others have been involved in concentration processes, in addition to having transferred their financial business to commercial banks and to having been transformed into foundations, focused mainly on the pursuit of their welfare activities.
As a result of these processes, between 2008 and 2015 Spanish credit institutions underwent extensive restructuring which included significant capacity readjustments, considerable loan write-downs and improvements to their solvency (by generating capital internally, tapping the capital markets or reducing lending).
1 Caja de Ahorros y Monte de Piedad de Ontinyent and Colonia-Caixa d’Estalvis de Pollença.
CHART 5.1 SAVINGS BANKS: TOTAL ASSETS
0
50,000
100,000
150,000
200,000
250,000
0 10 20 30 40 50
1 TOTAL ASSETS 2008
€m
CaixaBank
BFA-Bankia
Unicaja
Kutxabank
Ibercaja
Abanca
Liberbank
BMN
CA Ontinyent
CE Pollença
0
50,000
100,000
150,000
200,000
250,000
300,000
350,000
0 2 4 6 8 10 12
2 TOTAL ASSETS 2016
€m
SOURCE: Banco de España. NB: Horizontal axis shows cumulative number of institutions.
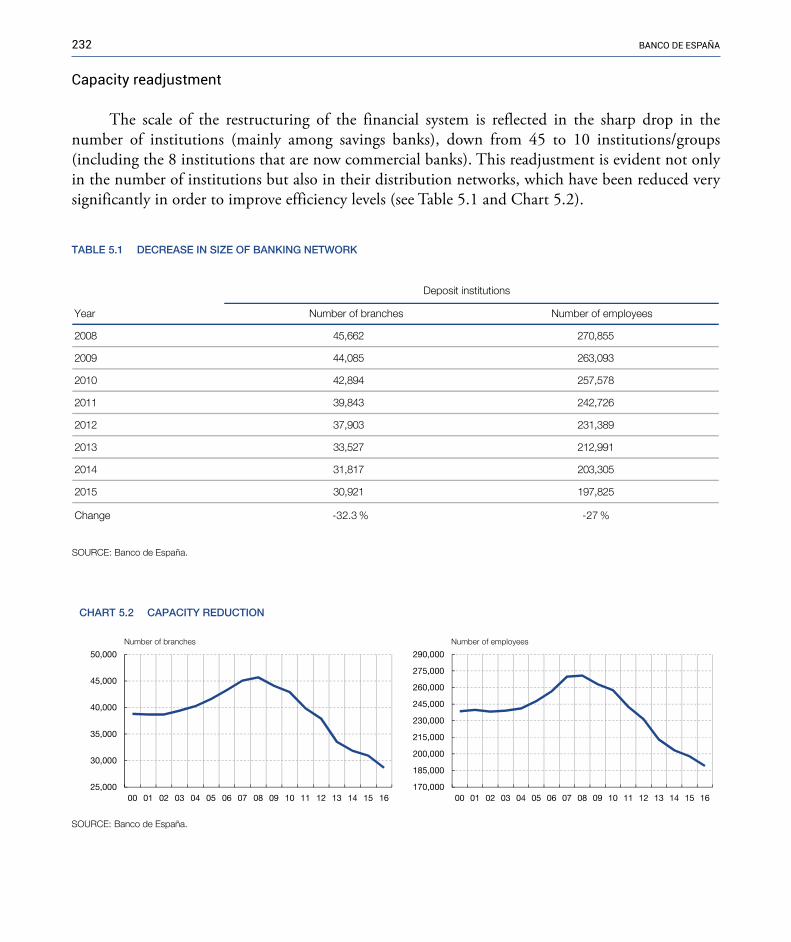
232 banco de españa
Capacity readjustment
The scale of the restructuring of the financial system is reflected in the sharp drop in the number of institutions (mainly among savings banks), down from 45 to 10 institutions/groups (including the 8 institutions that are now commercial banks). This readjustment is evident not only in the number of institutions but also in their distribution networks, which have been reduced very significantly in order to improve efficiency levels (see Table 5.1 and Chart 5.2).
Number of employees Number of branchesYear
558,072266,548002
390,362580,449002
875,752498,240102
627,242348,931102
983,132309,732102
199,212725,333102
503,302718,134102
528,791129,035102
-27 %-32.3 %Change
Deposit institutions
TABLE 5.1 DECREASE IN SIZE OF BANKING NETWORK
SOURCE: Banco de España.
CHART 5.2 CAPACITY REDUCTION
25,000
30,000
35,000
40,000
45,000
50,000
00 01 02 03 04 05 06 07 08 09 10 11 12 13 14 15 16
Number of branches
170,000
185,000
200,000
215,000
230,000
245,000
260,000
275,000
290,000
00 01 02 03 04 05 06 07 08 09 10 11 12 13 14 15 16
Number of employees
SOURCE: Banco de España.
233RepoRt on the financial and banking cRisis in spain, 2008-2014
loan write-downs
Major efforts were made to restructure bank balance sheets as a result of the asset impairment caused by the crisis, using institutions’ own funds and, especially, through loan loss provisions: almost €300 billion2 between 2008 and 2015 (which is almost 20% of total credit to the resident sector at the time of the outbreak of the crisis and 28% of 2015 GDP) (see Table 5.2 and the left-hand panel of Chart 5.3). Part of these write-downs were recognised as incurred losses on the relevant loans, which explains part of the decrease in the outstanding credit balance on bank balance sheets (see Table 5.3 and the right-hand panel of Chart 5.3).
2 �The changes made in 2015 owing to the new FINREP statements mean that, for the purposes of comparison, the 2015 figures have had to be adjusted.
TABLE 5.2 LOAN WRITE-DOWNS. TOTAL DEPOSIT INSTITUTIONS. BUSINESS IN SPAIN
€m
SOURCE: Banco de España.
2008 2009 2010 2011 2012 2013 2014 2015
Charged to incomestatement 15,070 38,880 57,836 87,407 172,773 199,124 217,114 229,073
Decrease in generalprovisions
4,874 12,456 15,921 18,099 20,219 23,245 23,245 23,501
Charged to reserves 0 0 23,945 32,847 45,326 45,561 45,967 45,967
TOTALS 19,944 51,336 97,702 138,353 238,318 267,930 286,326 298,541
Year-by-year figures 19,944 31,392 46,366 40,651 99,965 29,612 18,396 12,215
Cumulative figures from 31/12/2007 to 31/12/2015
CHART 5.3 LOAN WRITE-DOWNS. TOTAL DEPOSIT INSTITUTIONS
19,944
51,336
97,702
138,353
238,318
267,930
286,326 298,541
0
50,000
100,000
150,000
200,000
250,000
300,000
2008 2009 2010 2011 2012 2013 2014 2015
1 BUILD-UP OF PROVISIONS
€m
990,000
1,190,000
1,390,000
1,590,000
1,790,000
1,990,000
04 05 06 07 08 09 10 11 12 13 14 15 16
2 LENDING
€m
SOURCE: Banco de España.

234 banco de españa
Regarding the breakdown of these write-downs by sector, while the proportion of write-downs against income was very similar for both commercial and savings banks (each accounting for approximately 46% of the total), in the case of write-downs against reserves there was a considerable difference (of the total written down against reserves, savings banks accounted for 81%, in line with the scale of mergers in the sector, and commercial banks for the other 19%).
Enhanced solvency
Together with the efforts made to downsize networks and write down loans, the increase in capitalisation is also noteworthy: the overall solvency ratio of deposit institutions rose from 10.6% at 31 December 2007 to 13.6% at 31 December 2014; in the same period, Tier I capital rose from 7.5% to 11.8% (see Chart 4.19).
Determining factors in the change in Tier 1 capital include, on the positive side, the capital support obtained from the FROB and the DGSCI (see Table 5.5) and, on the negative side, the write-downs made against reserves (see Table 5.2). However, capital increases subscribed by shareholders are also significant in the period analysed in this report, as shown in Table 5.4.
2008 2009 2010 2011 2012 2013 2014 2015
Balance 1,795 1,777 1,782 1,715 1,538 1,392 1,328 1,274
Change in year -18 +5 -67 -177 -146 -64 -54
Lending (other resident sectors)
TABLE 5.3 DEPOSIT INSTITUTIONS. CREDIT TO OTHER RESIDENT SECTORS
€m
SOURCE: Banco de España.
TABLE 5.4 CAPITAL INCREASES AT DEPOSIT INSTITUTIONS (a)
€m
2007 2008 2009 2010 2011 2012 2013 2014 TOTAL
Capital increases 3,848 8,395 1,044 5,845 6,851 14,269 3,975 5,395 49,622
SOURCE: Banco de España.
a Only considering capital increases that entailed the entry of “new” funds. For example, conversions of hybrid instruments that were issued before the period analysed are not included.

235RepoRt on the financial and banking cRisis in spain, 2008-2014
In this setting it is important to note, as will be seen in the next section, that all aid provided by the FROB and the DGSCI was directed to groups of savings banks. Banco Gallego and Banco de Valencia, the only two commercial banks to receive assistance, were majority-owned by Novacaixagalicia and BFA-Bankia, respectively.
5.2 SUMMARY�OF�THE�FINANCIAL�SYSTEM�SUPPORT�MEASURES
The FROB was created, in 2009, to serve as a channel for the necessary State aid and to manage the process; it has been pivotal in the instrumentation of the necessary financial support3 and has seen its powers strengthened since its inception. The DGSCI4 has also helped fund the cost of restructuring the sector through institutions’ own contributions, i.e. private-sector contributions.
Several stages may be distinguished in the restructuring process that began in 2009, each marked by regulatory changes driven by the changing circumstances of the crisis unfolding.
The FROB provided its first assistance in 2010 when it supported the savings banks’ concentration processes by subscribing preference shares (FROB I),5 but when the sovereign debt crisis spread across the euro area and economic activity deteriorated in 2011, new support measures (FROB II) were needed to boost confidence in the solvency of the Spanish banking system.6 Nevertheless, these efforts, accompanied in the first half of 2012 by regulatory changes aimed at furthering balance sheet restructuring, proved insufficient to restore financial stability.
In view of the growing contagion between sovereign and bank risk, in June 2012 the Spanish Government applied to the ESM for financial assistance, subject to strict conditionality, for recapitalisation and restructuring of a significant number of institutions.7 During this third stage, the FROB injected capital into nine banking groups and subscribed shares of Sareb, the asset management
3 �Prior to creation of the FROB, State aid was granted in 2008, in response to financial market tensions, through the programme for purchase of high-quality assets (Fund for the Acquisition of Financial Assets, FAFA) and the programme providing guarantees for new bond issues, both now defunct. In 2012 a new guarantee programme was reintroduced, as a result of sovereign debt market tensions and the difficulties gaining access to the wholesale funding markets facing some institutions. These measures entailed no net cost for the State.
4 �The three sectoral Deposit Guarantee Schemes (for savings banks, commercial banks and credit cooperatives, respectively) were replaced in 2011 by the present DGSCI, whose chief function is still to guarantee deposits, up to a limit of €100,000 per depositor per institution. This function also allows it to take measures to support the resolution of credit institutions.
5 �For more details on these measures and the institutions concerned, see Banco de España (2016), “Briefing note on public financial assistance in the restructuring of the Spanish banking sector”, September.
6 Diagram 5.1 at the end of this chapter sets out chronologically the main measures taken.7 See the Memorandum of Understanding on financial-sector policy conditionality, signed in July 2012.
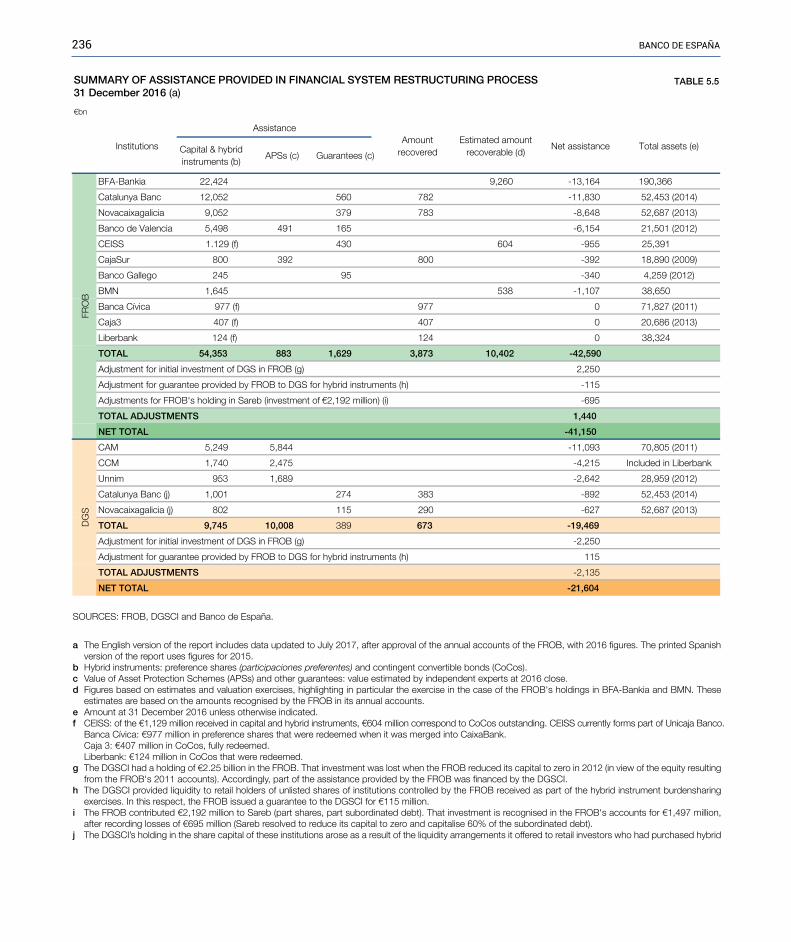
236 banco de españa
SOURCES: FROB, DGSCI and Banco de España.
a The English version of the report includes data updated to July 2017, after approval of the annual accounts of the FROB, with 2016 figures. The printed Spanish version of the report uses figures for 2015.
b Hybrid instruments: preference shares (participaciones preferentes) and contingent convertible bonds (CoCos).c Value of Asset Protection Schemes (APSs) and other guarantees: value estimated by independent experts at 2016 close.d Figures based on estimates and valuation exercises, highlighting in particular the exercise in the case of the FROB's holdings in BFA-Bankia and BMN. These
estimates are based on the amounts recognised by the FROB in its annual accounts.e Amount at 31 December 2016 unless otherwise indicated.f CEISS: of the €1,129 million received in capital and hybrid instruments, €604 million correspond to CoCos outstanding. CEISS currently forms part of Unicaja Banco.
Banca Cívica: €977 million in preference shares that were redeemed when it was merged into CaixaBank.Caja 3: €407 million in CoCos, fully redeemed.Liberbank: €124 million in CoCos that were redeemed.
g The DGSCI had a holding of €2.25 billion in the FROB. That investment was lost when the FROB reduced its capital to zero in 2012 (in view of the equity resulting from the FROB's 2011 accounts). Accordingly, part of the assistance provided by the FROB was financed by the DGSCI.
h The DGSCI provided liquidity to retail holders of unlisted shares of institutions controlled by the FROB received as part of the hybrid instrument burdensharing exercises. In this respect, the FROB issued a guarantee to the DGSCI for €115 million.
i The FROB contributed €2,192 million to Sareb (part shares, part subordinated debt). That investment is recognised in the FROB's accounts for €1,497 million, after recording losses of €695 million (Sareb resolved to reduce its capital to zero and capitalise 60% of the subordinated debt).
j The DGSCI’s holding in the share capital of these institutions arose as a result of the liquidity arrangements it offered to retail investors who had purchased hybrid
Capital & hybrid instruments (b)
APSs (c) Guarantees (c)
663,091 461,31-062,9424,22aiknaB-AFB
)4102( 354,25038,11-287065250,21cnaB aynulataC
)3102( 786,25846,8-387973250,9aicilagaxiacavoN
)2102( 105,12451,6-561194894,5aicnelaV ed ocnaB
193,52 559-406034)f( 921.1 SSIEC
)9002( 098,81293-008293008ruSajaC
)2102( 952,4043-59542ogellaG ocnaB
056,83 701,1-835546,1NMB
)1102( 728,170779)f( 779 acivíC acnaB
)3102( 686,020704)f( 704 3ajaC
423,83 0421)f( 421 knabrebiL
TOTAL 54,353 883 1,629 3,873 10,402 -42,590
052,2)g( BORF ni SGD fo tnemtsevni laitini rof tnemtsujdA
511-)h( stnemurtsni dirbyh rof SGD ot BORF yb dedivorp eetnaraug rof tnemtsujdA
Adjustments for FROB's holding in Sareb (investment of €2,192 million) (i) -695
TOTAL ADJUSTMENTS 1,440
NET TOTAL -41,150
)1102( 508,07390,11-448,5942,5MAC
knabrebiL ni dedulcnI512,4-574,2047,1MCC
)2102( 959,82246,2-986,1359minnU
)4102( 354,25298-383472100,1)j( cnaB aynulataC
)3102( 786,25726-092511208)j( aicilagaxiacavoN
TOTAL 9,745 10,008 389 964,91-376
052,2-)g( BORF ni SGD fo tnemtsevni laitini rof tnemtsujdA
511)h( stnemurtsni dirbyh rof SGD ot BORF yb dedivorp eetnaraug rof tnemtsujdA
TOTAL ADJUSTMENTS -2,135
NET TOTAL -21,604
Assistance
FRO
BD
GS
Net assistance Total assets (e)InstitutionsAmount
recoveredEstimated amount
recoverable (d)
SUMMARY OF ASSISTANCE PROVIDED IN FINANCIAL SYSTEM RESTRUCTURING PROCESS31 December 2016 (a)
TABLE 5.5
€bn

237RepoRt on the financial and banking cRisis in spain, 2008-2014
company created in 2012 as part of the conditionality required to segregate the real estate asset and loan portfolios from the institutions receiving support. Both the FROB and Sareb are managed by their respective governing bodies. The Banco de España forms part of the Governing Committee of the FROB, with four of a total of eleven members, but not of the core committee where the decisions affecting the State Budget are taken (see Section 4.3.C). In the case of Sareb, the Banco de España supervises its compliance with its sole purpose, its transparency and its governing bodies.
Since 20098 a total of fourteen institutions have received capital support, for a total of €64,098 million (see Table 5.6), of which €54,353 million corresponds to the FROB and €9,745 million to the DGSCI (see Table 5.5), although part of these funds have been recovered through redemptions and sale or resolution of institutions: in total, €4,546 million (see Table 5.6), of which €3,873 million corresponds to the FROB and €673 million to the DGSCI (see Table 5.5). Thus, the difference between these two items (€64,098 million of aid less €4,546 million of reimbursements) results in total financial assistance provided in the form of capital in the period analysed in this report of €59,552 million at the end of 2016 (5.3% of 2016 GDP).
In accordance with the approximation made by the Spanish Court of Auditors in its recent audit report,9 the estimate of these funds should include, in addition to the capital contributions indicated, the provisions set aside to meet the costs that may arise from guarantees provided in the concentration and sale processes, which amount, on an updated estimate, to €10,891 million in the case of the APSs and to €2,018 million for other guarantees (some of which already enforced, see Table 5.6). It would also be necessary to deduct the value of the assets owned by the FROB and whose
8 �The English version of the report includes data updated to July 2017, after approval of the annual accounts of the FROB, with 2016 figures. The printed Spanish version of the report uses figures for 2015.
9 �“Informe de fiscalización del proceso de reestructuración bancaria, ejercicios 2009 a 2015”. The report estimates the cost of the restructuring process at €60,718 million; this figure includes other income and expense items not set out in detail in Table 5.5.
Total before adjustments (I) 64,098 10,891 2,018 4,546 10,402 -62,059Total adjustments (II) -695NET GRAND TOTAL (I) + (II) 64,098 10,891 2,018 4,546 10,402 -62,754
FROB + DGSCI
Assistance
TABLE 5.6 SUMMARY OF NET ASSISTANCE, FROB + DGSCI 31 December 2016 (a)
€m
Capital & hybridinstruments
(1)
APSs(2)
Guarantees(3)
Net assistance(4) + (5) - (1) - (2) - (3)
Amountrecovered
(4)
Estimatedamount
recoverable (5)
SOURCES: FROB, DGSCI and Banco de España.
a The English version of the report includes data updated to July 2017, after approval of the annual accounts of the FROB, with 2016 figures. The printed Spanish version of the report uses figures for 2015.
238 banco de españa
sale or resolution could generate future income, with an estimated value at the end of 2016 of €10,402 million. As Table 5.6 shows, adjusting for these items, the funds used to support the financial system, in terms of the funds contributed by the FROB and by the industry through the DGSCI, would be an estimated €62,754 million10 (5.6% of GDP) at the end of 2016, with €41,150 million corresponding to the FROB and €21,604 million to the DGSCI (see Table 5.5). Naturally, this cost does not include the losses borne by former shareholders or by holders of preference shares (participaciones preferentes) or subordinated debt holders, as a consequence of the hybrid instrument burden-sharing exercises that formed part of the financial assistance agreement with the ESM, and nor does it include interest obtained and expenses incurred.
The higher government debt caused by these interventions was estimated, at the end of 2016, at €51,512 million, in accordance with Eurostat data published in April 2017.11 When comparing this figure with the net total assistance provided (€62,754 million; see Tables 5.5 and 5.6), it should be noted that the government debt figure does not include the funds furnished by the DGSCI prior to 2012, when it was classified outside the general government sector, and nor does it include the provisions set aside for the guarantees provided (save for public funds that have been committed or paid as a result of enforcement). Net income12 generated by the assistance provided, through fees for guarantees, interest and dividends, and sales or reprivatisations, has also been deducted from the government debt figure. Lastly it should be noted that government debt is a gross concept, so it takes no account of the value of the assets that are still owned by the FROB and whose resolution could provide income in the future.
10 �This figure is the sum of the net funds provided to the financial system (€62,059 million), plus the adjustment for the FROB’s initial investment in Sareb (€695 million). That initial investment amounted to €2,192 million and is recognised on the FROB’s 2016 balance sheet for €1,497 million. This explains the adjustments reflected in Tables 5.5 and 5.6.
11 �The increase in government debt has been updated using end-2016 figures (€51,512 million) with respect to the printed Spanish version that included end-2015 figures (€50,312 million). The digital version of this report published on the Banco de España website has updated the net amount of aid reflected in Table 5.6 following the approval by the FROB of its 2016 accounts.
12 This figure includes income from the FAFA and from the programmes providing guarantees for bank debt issues.
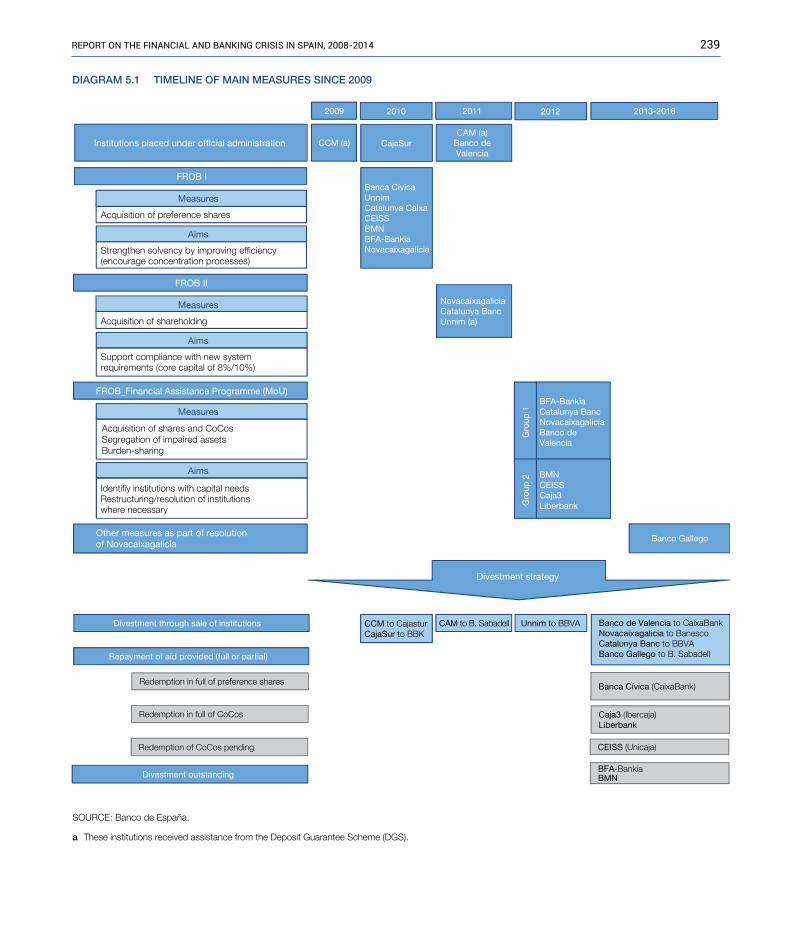
239RepoRt on the financial and banking cRisis in spain, 2008-2014
DIAGRAM 5.1 TIMELINE OF MAIN MEASURES SINCE 2009
Institutions placed under official administration
2009 2010 2011 2012 2013-2016
CCM (a) CajaSurCAM (a)
Banco deValencia
Banca CívicaUnnimCatalunya CaixaCEISSBMNBFA-BankiaNovacaixagalicia
FROB I
Measures
Acquisition of preference shares
Aims
Strengthen solvency by improving efficiency(encourage concentration processes)
FROB II
Measures
Acquisition of shareholding
Aims
Support compliance with new systemrequirements (core capital of 8%/10%)
NovacaixagaliciaCatalunya BancUnnim (a)
FROB_Financial Assistance Programme (MoU)
Other measures as part of resolutionof Novacaixagalicia
Measures
Acquisition of shares and CoCosSegregation of impaired assetsBurden-sharing
Aims
Identifiy institutions with capital needsRestructuring/resolution of institutions where necessary
BFA-BankiaCatalunya BancNovacaixagaliciaBanco de Valencia
Gro
up 1
BMNCEISSCaja3LiberbankG
roup
2
Divestment strategy
Divestment through sale of institutions CCM to CajasturCajaSur to BBK
CAM to B. Sabadell Unnim to BBVA Banco de Valencia to CaixaBankNovacaixagalicia to BanescoCatalunya Banc to BBVABanco Gallego to B. SabadellRepayment of aid provided (full or partial)
Redemption in full of preference shares Banca Cívica (CaixaBank)
Redemption in full of CoCos Caja3 (Ibercaja)Liberbank
CEISS (Unicaja)Redemption of CoCos pending
Divestment outstandingBFA-BankiaBMN
SOURCE: Banco de España.
a These institutions received assistance from the Deposit Guarantee Scheme (DGS).
Banco Gallego

ANNEX 1: COOPERATION AND INITIATIVES
OF THE BANCO DE ESPAñA WITH THE COuRTS
A1.1 CooperAtion�with�the�Courts
The Banco de España’s cooperation with the courts is regulated in its Internal Rules approved by a Resolution of 28 March 2000, Article 20 of which expressly specifies the way in which the Banco de España has to meet this duty of cooperation with the judicial authorities.
This cooperation intensified particularly from 2011, when the Banco de España began to receive an increasing number of requests from public prosecution services and courts (largely, although not exclusively, from the Public Prosecutor´s anti-corruption unit and the National High Court’s central criminal section) within the framework of criminal proceedings in which credit institutions’ officers were under investigation. These requests asked the Banco de España to cooperate in various ways:
i) in view of the eminently technical matters arising, it was asked to appoint experts to analyse the transactions investigated in the proceedings,
(ii) subpoenas of employees were received calling on them to act as witnesses or expert witnesses, and
(iii) considerable documentation was requested, generally relating to supervisory actions at the institutions under court investigation.
In early 2013, given the number and complexity of the court requests for cooperation in relation to the acts of credit institutions and their senior officers, a special service to attend to them had to be set up within the Banco de España’s legal department.
In this respect:
— Considering only criminal proceedings, from 2011 to March 2017 the Banco de España received 126 requests from public prosecution services and criminal courts, which gave rise to the remittance of 502 reports and notes drafted by Banking

242 banco de españa
Supervision, of 277 copies of specifically requested employee e-mails and of 1,560 documents of other types, relating to the supervision of institutions or to action taken to meet those requests.
— Also, in the same period the Banco de España received a further 50 court requests in response to which 45 employees declared as witnesses, 44 employees as expert witnesses (regarding reports previously drafted in their supervisory work) and 35 employees as legal experts appointed in the proceedings themselves to issue reports on specifically required matters. Finally, a further six employees attended to other requests for cooperation or technical assistance from the public prosecution service.
A1.2 �remittAnCe�by�the�bAnCo�de�espAñA�And�the�Frob�to�the�publiC��proseCution�serviCe�And�the�Courts�oF�trAnsACtions�suspeCted��oF�hAving�CriminAl�signiFiCAnCe
Between 2010 and 2016, the Executive Commission of the Banco de España resolved on seven occasions to send to the public prosecution service or the courts, as applicable, a total of 70 transactions suspected of constituting an offence, in relation to six credit institutions. Those transactions are being investigated in at least twelve preliminary proceedings, mostly in the National High Court.
For its part, the FROB has played an active role in detecting and analysing transactions of possible criminal significance by credit institutions receiving State aid and also in taking legal action against misconduct. Thus reviews were conducted on a total of 102 transactions of institutions relating to real estate transactions and remuneration practices, as a result of which finally 57 forensic reports were forwarded to the public prosecutor’s special anti-organised crime and anti-corruption unit. The FROB is currently represented in 21 criminal cases, mostly being heard in the National High Court. Notably, ten of these cases were initiated by the FROB through the administrators designated by it at investees and another five cases were brought as a result of forensic reports remitted by it to the public prosecution service.
annex 2. banco de españa
pUblications on the cRisis
Since 2011 the Banco de España’s website has a specific section called “The restructuring of the banking sector in Spain” where the information on the restructuring process published by the Banco de España and other national and international bodies is located. Listed below are the main publications of the Banco de España which have served as a basis for the preparation of this report. All the documentation is available on the Bank’s website.
2000-2014 Annual Report of the Banco de España.2000-2014 Financial Stability Report.2000-2014 Report on Banking Supervision in Spain.11/12/2014 Statement by the Banco de España Executive Commission (on the action of the Banco de España in
the formation of BFA_Bankia) (press release).05/12/2014 Statement by the Banco de España (Expert report on the Bankia case, press release).25/11/2014 La construcción de la Unión Bancaria en la UE (295 KB) (article in the Boletín Económico).19/11/2014 Testimony by the Governor of the Banco de España (Luis M. Linde) before the Senate Budgetary
Committee.13/11/2014 Mortgage foreclosure processes (briefing note).01/11/2014 The countercyclical capital buffer in Spain: an exploratory analysis of key guiding indicators (article
in the Financial Stability Journal).31/10/2014 Evolución de los principales grupos bancarios españoles (2009-2014) (table).26/10/2014 Results of the comprehensive assessment of the banking sector (press release).26/10/2014 Press conference address by the Governor. Presentation of the results of the comprehensive assessment
of the euro area banking system (press release).22/10/2014 Evolución y determinantes del consumo de la UEM durante la crisis (309 KB) (article in the Boletín
Económico).22/10/2014 A disaggregated analysis of the determinants of the increase in lending rate spreads in Spain during
the crisis (289 KB) (article in the Ecoonomic Bulletin).01/10/2014 Testimony by the governor of the Banco de España (Luis M. Linde) before the Parliamentary Budget
Committee.23/09/2014 Los flujos migratorios en España durante la crisis (169 KB) (article in the Boletín Económico).23/07/2014 Los vínculos entre crisis bancarias y soberanas en las economías emergentes (163 KB) (article in the
Boletín Económico).

244 banco de españa
23/07/2014 Impact of restructuring plans on lending to non-financial corporations (157 KB) (article in the Economic Bulletin).
23/07/2014 The new revaluation and sustainability factor of the Spanish pension system (176 KB) (article in the Economic Bulletin).
23/07/2014 La participación de las pymes y de las grandes empresas europeas en el comercio internacional de bienes (140 KB) (article in the Boletín Económico).
24/06/2014 A disaggregated analysis of recent developments in lending to corporations (136 KB) (article in the Economic Bulletin)
24/06/2014 Un análisis del comportamiento reciente de la inversión en equipo y de sus determinantes (170 KB) (article in the Boletín Económico).
24/06/2014 Testimony by the Chairman of the Governing Committee of the FROB before the Parliamentary Committee on Economic Affairs and Competitiveness (appearance in the name of the FROB).
17/06/2014 Testimony by the Governor of the Banco de España before the Parliamentary Committee on the Economy and Competitiveness in connection with the presentation of the Banco de España Annual Report.
12/06/2014 Nota informativa sobre ayudas públicas en el proceso de reestructuración del sistema bancario español (2009-2013).
06/06/2014 The Banco de España strengthens supervision of information transparency and the market conduct of banks (press release).
02/06/2014 Testimony by the Governor of the Banco de Espana (Luis M. Linde) before the Special Senate Committee for the Development of Internationalisation.
27/05/2014 Una comparación de la respuesta del sector exterior en las dos últimas recesiones (161 KB) (article in the Boletín Económico).
19/05/2014 Residential mortgage foreclosure processess (briefing note).01/05/2014 Sovereign risk and financial stability (article in the Financial Stability Journal).23/04/2014 Assessment of external imbalances and country risk perception (199 KB) (article in the Economic
Bulletin).25/03/2014 The world economy faced with a change in scenario. Developments, Outlook and risks (406 KB)
(article in the Economic Bulletin).18/03/2014 Application of Circular 4/2004 to transactions restructured as a result of refinancing agreements
envisaged in the Insolvency Law (press release).11/03/2014 Amendment to Banco Ceiss resolution plan approved (press release).25/02/2014 ECB action and the Spanish economy during the first fifteen years of the euro (191 KB) (article in
the Economic Bulletin).21/02/2014 Statement by the Banco de España on credit institutions’ dividend policy in 2014 (press release).18/02/2014 Draft Law on regulation, supervision and solvency of credit institutions (briefing note).05/02/2014 Testimony by the Chairman of the Governing Committee of the FROB before the Parliamentary
Committee on Economic Affairs and Competitiveness (appearance in the name of the FROB).22/01/2014 Bank lending to Spanish corporations in terms of their size. An analysis based on the joint exploitation
of information from the CCR and the CBI (220 KB) (article in the Economic Bulletin).
245RepoRt on the financial and banking cRisis in spain, 2008-2014
22/01/2014 El impacto de la inversión exterior directa sobre la productividad y el empleo del sector manufacturero español (2001-2010) (372 KB) (article in the Boletín Económico).
14/01/2014 Joint press release FROB-Banco de España: Sale of Caja Rural Comarcal de Mota del Cuervo within the framework of its resolution process (press release).
27/12/2013 La fragmentación financiera en la zona del euro durante la crisis (287 KB) (article in the Boletín Económico).
27/12/2013 Un análisis del endeudamiento de las familias a partir de la encuesta del Eurosistema sobre la situación financiera y el consumo de los hogares de 2010 (191 KB) (article in the Boletín Económico).
27/12/2013 Recent developments in non-financial corporations’ mark-ups (173 KB) (article in the Economic Bulletin).
04/12/2013 Testimony by the Chairman of the Governing Committee of the FROB before the Senate Committee on Economic Affairs and Competitiveness (appearance in the name of the FROB).
03/12/2013 The tax treatment of deferred tax assets (briefing note).29/11/2013 The Banco de España opens to public consultation a draft circular on the allocation of unused
general provisions (press release).27/11/2013 Private-sector deleveraging channels: an international comparison (216 KB) (article in the Economic
Bulletin).27/11/2013 El funcionamiento del sistema judicial: nueva evidencia comparada (244 KB) (article in the Boletín
Económico).25/11/2013 Testimony by the Governor of the Banco de España, Luis M. Linde, before the Senate Budgetary
Committee.01/11/2013 Spanish dynamic provisions: main numerical features (article in the Financial Stability Journal).01/11/2013 La transposición de Basilea III a la legislación europea (article in the Revista de Estabilidad Financiera).23/10/2013 An analysis of the situation of lending in Spain (211 KB) (article in the Economic Bulletin).04/10/2013 Testimony by the Governor of the Banco de España (Luis M. Linde) before the Parliamentary
Budget Committee.01/10/2013 Updating of Directorate General Banking Supervision procedures (press release).26/09/2013 Changes in household saving and consumption in Spain during the crisis (152 KB) (article in the
Economic Bulletin).26/09/2013 The 2012 labour reform: an initial analysis of some of its effects on the labour market (326 KB)
(article in the Economic Bulletin).10/09/2013 Testimony of the chairman of the Governing Committee of the FROB before the parliamentary
subcommittee on bank restructuring and financial clean-up (appearance in the name of the FROB).02/09/2013 Public financial assistance in the recapitalisation of the Spanish banking system (2009-2013)
(briefing note).23/07/2013 The European Central Bank’s response to the crisis (180 KB) (article in the Economic Bulletin).23/07/2013 Developments in Spanish public debt since the start of the crisis (232 KB) (article in the Economic
Bulletin).23/07/2013 Variation in the cyclical sensitivity of Spanish inflation: an initial approximation (177 KB) (article
in the Economic Bulletin).
246 banco de españa
23/07/2013 Ajuste de los desequilibrios macroeconómicos en la UEM (220 KB) (article in the Boletín Económico).27/06/2013 Statement by the Banco de España on the dividend distribution policy of credit institutions (press
release).26/06/2013 The Banco de España calls on credit institutions to review whether their floor clauses conform to
Ruling 241/2013 by the Supreme Court (press release).26/06/2013 Evolución del desajuste educativo entre la oferta y la demanda de trabajo en España (192 KB) (article
in the Boletín Económico).26/06/2013 Esquemas de apoyo financiero a las pymes en España (145 KB) (article in the Economic Bulletin).20/06/2013 Testimony by the Governor of the Banco de España before the Parliamentary Committee on
Economic Affairs and Competitiveness in connection with the presentation of the Banco de España Annual Report.
31/05/2013 Presentation of the Annual Report. Governor’s address to the Governing Council of the Banco de España (speech).
29/05/2013 Bank deposits in April 2013 (briefing note).29/05/2013 The export activity and non-price competitiveness of European firms (184 KB) (article in the
Economic Bulletin). 10/05/2013 Amendment of the resolution plan for Banco CEISS approved (press release).10/05/2013 The new statistics on mortgage foreclosure processes (briefing note).09/05/2013 Briefing note on the Financial Stability Report: loan refinancing and contrasting of the stress test
conducted by Oliver Wyman in 2012.01/05/2013 Top-down stress tests as a macro-prudential tool: methodology and practical application (article in
the Financial Stability Journal).30/04/2013 Criteria for the application of Circular 4/2004 in respect of loan refinancing and restructuring (press
release).23/04/2013 The new Budgetary Stability Law (164 KB) (article in the Economic Bulletin).26/03/2013 Un análisis de las diferencias entre entidades en la evolución del crédito al sector privado durante la
crisis (140 KB) (article in the Boletín Económico).27/02/2013 El ajuste de los mercados laborales europeos desde el inicio de la crisis (172 KB) (article in the Boletín
Económico).27/02/2013 Statistical effects on Spanish credit institutions’ balance sheets of the recent restructuring and
recapitalisation (138 KB) (article in the Economic Bulletin).27/02/2013 Cambios en el capital bancario y evolución del crédito: una aproximación microeconómica (139 KB)
(article in the Boletín Económico).23/01/2013 Evolución reciente de la población en España y proyecciones a corto y largo plazo (161 KB) (article
in the Boletín Económico). 23/01/2013 Spanish non-financial corporations’ debt since the start of the crisis. A disaggregated analysis (128 KB)
(article in the Economic Bulletin).23/01/2013 Las medidas de política monetaria no convencionales del BCE a lo largo de la crisis (275 KB) (article
in the Boletín Económico).08/01/2013 Banco de España banking supervision organisation and procedures. Statement by the Banco de
España Executive Commission (press release).

247RepoRt on the financial and banking cRisis in spain, 2008-2014
28/12/2012 An estimation of the impact changes in the minimum wage have on employment (162 KB) (article in the Economic Bulletin).
26/12/2012 Briefing note on the sale of Banco de Valencia.20/12/2012 The recapitalisation plans for all banks requiring injections of public funds have been approved
(press release).28/11/2012 The EC’s approval marks the finalisation of the plans for the banks in which the FROB has a majority
stake (press release).28/11/2012 El impacto de la crisis económica sobre la industria española (145 KB) (article in the Boletín
Económico).27/11/2012 The Banco de España approves the plans for the banks in which the FROB has a majority stake
(press release).21/11/2012 Testimony by the Governor before the Senate Budget Committee in connection with the draft State
Budget.02/11/2012 The Financial Stability Board updates the list of global systemically important banks (press release).31/10/2012 Cost of the Spanish banking sector solvency tests (press release).31/10/2012 Information regarding the assessment of the recapitalization plans as foreseen by the Memorandum
of Understanding (MoU) (press release).23/10/2012 La evolución del balance agregado de las entidades de crédito españolas a lo largo de la crisis (145 KB)
(article in the Boletín Económico).23/10/2012 Dispersión salarial en España: Resultados a partir de datos de la Seguridad Social (166 KB) (article in
the Boletín Económico).16/10/2012 Análisis de los procedimientos supervisores del Banco de España y recomendaciones de reforma
(report of the Comisión Interna).04/10/2012 Testimony by the Governor of de Banco de España (Luis M. Linde) before the Parliamentary Budget
Committee in connection with the draft State Budget.03/10/2012 Statement on the European banking recapitalisation plan (press release).28/09/2012 Oliver Wyman estimates the Spanish banking system’s capital needs at close to €60 billion (press release).28/09/2012 Presentation of the Deputy Governor (Fernando Restoy). Results of the independent evaluation of
the Spanish banking sector.26/09/2012 Analysis of recent changes in bank deposits in Spain (140 KB) (article in the Economic Bulletin).26/09/2012 Nuevas herramientas para la gobernanza económica global: marco para el crecimiento y supervisión
de desequilibrios (341 KB) (article in the Boletín Económico).25/09/2012 Royal Decree-Law 24/2012 on restructuring and resolution of credit institutions (briefing note).22/09/2012 The capital needs of Spanish banks will be known on 28 September 2012 (press release).19/09/2012 Changes in Spanish bank deposits (briefing note).05/09/2012 Statement by the Banco de España [regarding the liquidity situation in the Spanish financial system]
(press release).31/07/2012 Independent valuation of the Spanish banking system (press release).23/07/2012 El empleo en la UEM en 2011 (153 KB) (article in the Boletín Económico).23/07/2012 Un análisis sectorial de la relación entre la actividad y el empleo en la economía española (146 KB)
(article in the Boletín Económico).
248 banco de españa
23/07/2012 The adjustment of the external imbalance in the Spanish economy (193 KB) (article in the Economic Bulletin).
17/07/2012 Testimony by the Governor of the Banco de España (Luis M. Linde) before the Parliamentary Committee on Economic Affairs and Competitiveness.
11/07/2012 Statement on the implementation of the European bank recapitalisation (press release).06/07/2012 The FROB strengthens its management bodies (press release).27/06/2012 Sectoral change and implications for occupational mismatch in Spain (143 KB) (article in the Economic
Bulletin).27/06/2012 El ciclo económico y la inversión en intangibles de las empresas españolas (132 KB) (article in the
Boletín Económico).27/06/2012 El mecanismo de asistencia financiera para la recapitalización bancaria en la UEM (110 KB) (article
in the Boletín Económico).21/06/2012 Presentación del subgobernador (Fernando Restoy). Resultados de la evaluación sobre las necesidades
de capital del sector bancario español.08/06/2012 Methodology of the appraisers of the Spanish financial system (press release).30/05/2012 Governor’s (Miguel Á. Fernández Ordóñez) testimony before the Senate Budgetary Committee.29/05/2012 Statement by the Banco de España (early departure by the Governor to smooth the ongoing approval
of banks’ recapitalisation plans) (press release).21/05/2012 Spanish bank balance sheets to be valued by Roland Berger and Oliver Wyman (press release).09/05/2012 Statement on BFA-Bankia (conversion of FROB securities into equity) (press release).17/04/2012 Testimony by the Governor (Miguel Á. Fernández Ordóñez) before the Parliamentary Committee
on Budget.17/04/2012 The Banco de España approves credit institutions’ plans to comply with Royal Decree-Law 2/2012
on the balance-sheet clean-up of the financial sector (press release).27/03/2012 Nuevo marco de vigilancia de los desequilibrios macroeconómicos de la UE (196 KB) (article in the
Boletín Económico).28/02/2012 El impacto de la crisis financiera en los mercados laborales de las economías desarrolladas (217 KB)
(article in the Boletín Económico).23/01/2012 El informe anual de crecimiento 2012 y el Semestre Europeo: nuevos mecanismos y prioridades de
política económica en la UE (138 KB) (article in the Boletín Económico).23/01/2012 La respuesta de las empresas exportadoras españolas a los cambios del comercio mundial (2008-2010)
(167 KB) (article in the Boletín Económico).26/12/2011 Competitiveness indicators: the importance of an efficient allocation of resources (146 KB) (article
in the Economic Bulletin).08/12/2011 Statement on the European bank recapitalisation plan (final figures) (press release).30/11/2011 La tasa de ahorro durante la crisis económica: el papel de las expectativas de desempleo y de la
financiación (225 KB) (article in the Boletín Económico).30/11/2011 Labour flows in the EU at the beginning of the crisis (180 KB) (article in the Economic Bulletin).21/11/2011 The Banco de España replaces the directors of Banco de Valencia at the request of its Board of
Directors (press release).01/11/2011 Los ejercicios de estrés test: experiencia reciente y reflexiones sobre su futuro (article in the Revista de
Estabilidad Financiera).

249RepoRt on the financial and banking cRisis in spain, 2008-2014
31/10/2011 Una actualización de la situación patrimonial de las familias en España, Estados Unidos e Italia a partir de los resultados de encuestas financieras (176 KB) (article in the Boletín Económico).
27/10/2011 Statement on the European bank recapitalisation plan (press release).30/09/2011 The Banco de España takes stock of the financial system recapitalisation process envisaged under
RD-l 2/2011 (press release).30/09/2011 Presentation by the Governor (Miguel Á. Fernández Ordóñez): Restructuring of the financial sector.
Results of the recapitalisation process.28/09/2011 Los efectos de las condiciones hipotecarias sobre el consumo de los hogares propietarios de vivienda:
una estimación a partir de la EFF (105 KB) (article in the Boletín Económico).28/09/2011 The reform of the fiscal framework in Spain: constitutional limits and the new public spending
growth rule (194 KB) (article in the Economic Bulletin).28/09/2011 El mercado español de deuda del Estado: desarrollos desde el inicio de la crisis (214 KB) (article in
the Boletín Económico).28/09/2011 The process of economic adjustment following financial crises: a historical perspective (192 KB)
(article in the Economic Bulletin).05/08/2011 Reformas de los sistemas de pensiones en algunos países de la UEM (215 KB) (article in the Boletín
Económico).05/08/2011 Los rendimientos salariales y la evolución reciente del nivel educativo (150 KB) (article in the Boletín
Económico).22/07/2011 The Banco de España, at the request of the Board of Directors of CAM, has replaced the institution’s
directors in order to capitalise it and initiate a competitive procedure for its sale (press release).21/07/2011 Note on the state of the implementation of Royal Decree-Law 2/2011 on recapitalisation following
the stock market listings of CaixaBank, Bankia and Banca Cívica (press release).15/07/2011 No Spanish bank is required to increase its capital as a result of the EBA stress test (press release).21/06/2011 Governor’s (Miguel Á. Fernández Ordóñez) testimony before the Parliamentary Committee on
Economic and Financial Affairs - Presentation of the Annual Report, 2010.31/05/2011 Los desequilibrios globales y el reequilibrio de la economía mundial (170 KB) (article in the Boletín
Económico).31/05/2011 La evolución de la cuota de exportación de los productos españoles en la última década: el papel de
la especialización comercial y de la competitividad (193 KB) (article in the Boletín Económico).06/05/2011 El comportamiento de la tasa de actividad durante la última fase recesiva (142 KB) (article in the
Boletín Económico).28/04/2011 Institutions send their recapitalisation plans to the Banco de España (press release).14/04/2011 The Banco de España approves institutions’ strategies for complying with the capital requirements
of Royal Decree-Law 2/2011 (press release).30/03/2011 The Banco de España requires the institutions making up Banco Base to submit their new strategies
(press release).23/03/2011 Note on the process of restructuring and strengthening of savings banks. Situation as of March 2011
(briefing note).10/03/2011 The Banco de España informs 12 banks they must increase their capital to comply with the Royal
Decree-Law (press release).
250 banco de españa
04/03/2011 El comportamiento de los flujos brutos de capital internacional y su respuesta en los períodos de crisis (144 KB) (article in the Boletín Económico).
04/03/2011 El crédito comercial en España: importancia relativa y evolución reciente (101 KB) (article in the Boletín Económico).
04/03/2011 Wage adjustment to shocks in Spain (147 KB) (article in the Economic Bulletin).21/02/2011 Documento «Evolución y reforma de las cajas de ahorros» (report).21/02/2011 The Royal Decree-Law enacted by the government strengthens financial system solvency and will
enable restructuring to be completed (press release).21/02/2011 Presentation delivered by the governor (Miguel Á. Fernández Ordóñez) “The restructuring of the
Spanish banking sector and the Royal Decree-Law for the reinforcement of the financial system”.04/02/2011 El ajuste del consumo duradero y no duradero en España durante la crisis económica (165 KB)
(article in the Boletín Económico).04/02/2011 La reforma de la gobernanza económica en la UEM (182 KB) (article in the Boletín Económico).30/12/2010 La renta disponible de los hogares de la UEM (111 KB) (article in the Boletín Económico).30/12/2010 The residential investment adjustment in Spain: the current situation (152 KB) (article in the
Economic Bulletin).23/11/2010 Appearance of Governor (Miguel Á. Fernández Ordóñez) before the Committee on Budgetary
Affairs of the Senate.01/11/2010 La ampliación de los diferenciales soberanos en la zona del euro durante la crisis (128 KB) (article in
the Boletín Económico).01/11/2010 La incidencia del desempleo en los hogares (125 KB) (article in the Boletín Económico).01/11/2010 Nuevos requerimientos de información sobre el mercado hipotecario: un análisis del loan to value
(article in the Revista de Estabilidad Financiera).01/11/2010 Las nuevas medidas de Basilea III en materia de capital (article in the Revista de Estabilidad Financiera).05/10/2010 Testimony by the Governor, Miguel Á. Fernández Ordóñez, before the Parliamentary Budget
Committee in relation to the draft State Budget for 2011.01/10/2010 La evolución de los beneficios y la rentabilidad empresarial durante la crisis económica (107 KB)
(article in the Boletín Económico).30/09/2010 A possible role for asymmetrical standing facilities in liquidity management (104 KB) (article in the
Economic Bulletin).30/09/2010 El apoyo público al sector financiero en la zona del euro durante la crisis (145 KB) (article in the
Boletín Económico).06/08/2010 La evolución en España de los programas públicos de apoyo financiero al sector privado durante la
crisis (101 KB) (article in the Boletín Económico).06/08/2010 El contenido informativo de las encuestas de opinión en períodos de crisis económica (172 KB)
(article in the Boletín Económico).23/07/2010 Las pruebas de resistencia de la UE confirman la solidez del sector bancario español (press release).30/06/2010 La evolución cíclica de la inversión residencial: algunos hechos estilizados (155 KB) (article in the
Boletín Económico).30/06/2010 Evolución reciente de la financiación a sociedades no financieras en España (124 KB) (article in the
Boletín Económico).
251RepoRt on the financial and banking cRisis in spain, 2008-2014
30/06/2010 Los efectos de la estabilidad laboral sobre el ahorro y la riqueza de los hogares españoles (102 KB) (article in the Boletín Económico).
29/06/2010 El Banco de España aprueba la integración de Caixanova y Caixa Galicia (press release).29/06/2010 El Banco de España aprueba la integración en un SIP de CAM, Cajastur, Caja Cantabria y Caja
de Extremadura (press release).29/06/2010 El Banco de España aprueba la integración en un SIP de Caja Madrid, Bancaja, Caixa Laietana, Caja
Insular de Canarias, Caja de Ávila, Caja de Segovia y Caja Rioja (press release).29/06/2010 El Banco de España aprueba la integración en un SIP de Caja Murcia, Caixa Penedés, Sa Nostra y
Caja Granada (press release).29/06/2010 Progress report on the restructuring of the Spanish savings banks (briefing note).22/06/2010 Testimony of the Governor of the Banco de España to the Parliamentary Committee on Economic
and Financial Affairs on the occasion of the presentation of the 2009 Annual Report.26/05/2010 El Banco de España somete a consulta la modificación de su Circular Contable (press release).22/05/2010 The Banco de España replaces the directors of CajaSur (press release).01/05/2010 Cyclical migration patterns (115 KB) (article in the Economic Bulletin).01/05/2010 Debt of Spanish non-financial corporations. Development over time and comparison with the euro
area (145 KB) (article in the Economic Bulletin).01/05/2010 El empleo en la UEM en 2009 (118 KB) (article in the Boletín Económico).01/04/2010 Las reformas microeconómicas en el área del euro (220 KB) (article in the Boletín Económico).30/03/2010 Employment fluctuations in a dual labour market (109 KB) (article in the Economic Bulletin).30/03/2010 La financiación del comercio y la evolución del comercio internacional durante la crisis (150 KB)
(article in the Boletín Económico).25/03/2010 El Banco de España aprueba la integración de Caixa Manlleu, Sabadell y Terrassa (press release).25/03/2010 El Banco de España aprueba la integración de Caixa Catalunya, Manresa y Tarragona (press release).25/03/2010 El Banco de España aprueba la integración de Caja Duero y Caja España (press release).17/02/2010 El Banco de España publica la Guía del proceso de revisión de capital (press release).04/01/2010 Evolución de la composición de la cartera financiera de los hogares en España en el contexto de la
crisis financiera internacional (130 KB) (article in the Boletín Económico).04/01/2010 A comparison of recent real estate cycles in Spain, the United States and the United Kingdom (124 KB)
(article in the Economic Bulletin).30/12/2009 Determinantes principales de la decisión de exportar de las empresas españolas (137 KB) (article in
the Boletín Económico).23/11/2009 Governor’s (Miguel Á. Fernández Ordóñez) testimony before the Senate Budgetary Committee.03/11/2009 El Banco de España aprueba el proyecto presentado por Caja Castilla-La Mancha para su integración
con Cajastur (press release).02/11/2009 International debt markets after the financial crisis (171 KB) (article in the Economic Bulletin).20/10/2009 Determinantes y características de las empresas de alto crecimiento en España (133 KB) (article in
the Boletín Económico).06/10/2009 Governor’s (Miguel Á. Fernández Ordóñez) testimony before the Parliamentary Budget Committee.30/07/2009 The functioning of the labour market and unemployment growth in Spain (193 KB) (article in the
Economic Bulletin).
252 banco de españa
29/07/2009 El Banco de España aprueba el plan de actuación presentado por Unicaja y CajaSur para afrontar su proceso de integración (press release).
14/07/2009 La Comisión Rectora del FROB celebra su primera reunión (press release).23/06/2009 Appearance of the Governor (Miguel Á. Fernández Ordóñez) before the Parliamentary Committee
on Financial Affairs - Presentation of the Annual Report, 2008.01/06/2009 Nuevo convenio de cooperación entre la Comisión Nacional del Mercado de Valores y el Banco de
España (adaptación a Directiva MiFID y Basilea II) (press release).01/06/2009 La instrumentación de la política monetaria del Eurosistema y la crisis financiera (215 KB) (article
in the Boletín Económico).01/05/2009 Una aproximación a las características de las empresas exportadoras españolas (147 KB) (article in
the Boletín Económico).01/05/2009 Survey of non-financial corporations on conditions of access to credit (116 KB) (article in the
Economic Bulletin).01/05/2009 The economic and financial crisis, policy responses and their impact on public finances. A global
perspective (204 KB) (article in the Economic Bulletin).29/04/2009 La creación de empleo de las empresas pequeñas en España (127 KB) (article in the Boletín Económico).22/04/2009 Comunicado del Banco de España (desmentido de una supuesta lista de siete cajas de ahorros en
problemas) (press release).02/04/2009 Testimony of the Governor (Miguel Á. Fernández Ordóñez) before the Parliamentary Committee on
Financial Affairs o explain the recent decisions adopted in relation to CCM.29/03/2009 Banco de España replaces directors of the Caja Castilla La Mancha (press release).02/03/2009 La encuesta sobre formación de salarios de las empresas españolas: nueva evidencia sobre la relación
entre precios y salarios, y la respuesta de las empresas a perturbaciones económicas (119 KB) (article in the Boletín Económico).
25/02/2009 Comparecencia del gobernador (Miguel Á. Fernández Ordóñez) ante la Comisión de Economía y Hacienda del Congreso para informar de la gestión desarrollada por el Banco de España para el Fondo para la Adquisición de Activos Financieros y del análisis de los flujos de crédito.
01/02/2009 The challenges the international financial crisis poses for the Spanish economy (140 KB) (article in the Economic Bulletin).
05/01/2009 European labour market reforms in the period 2000-2006 (144 KB) (article in the Economic Bulletin).26/12/2008 La inversión empresarial en España y la posición financiera de las empresas (143 KB) (article in the
Boletín Económico).26/12/2008 Changes in the loan-deposit gap and in its funding in the current decade (123 KB) (article in the
Economic Bulletin).28/11/2008 Las consecuencias de la indiciación salarial sobre la inflación (135 KB) (article in the Boletín
Económico).26/11/2008 El Banco de España aprueba una revisión de la Circular Contable (reforma cobertura genérica)
(press release).19/11/2008 Appearance of Governor Miguel Á Fernández Ordóñez before the Committee on Budgetary Affairs
of the Senate.01/11/2008 El papel del modelo «originar para distribuir» en la crisis financiera de 2007 (article in the Revista de
Estabilidad Financiera).
253RepoRt on the financial and banking cRisis in spain, 2008-2014
07/10/2008 Testimony of the Governor of the Banco de España (Miguel Á. Fernández Ordóñez) to the Parliamentary Budget Committee.
30/07/2008 Una primera estimación del impacto económico de una reducción de las cargas administrativas en España (149 KB) (article in the Boletín Económico).
30/07/2008 El precio de la vivienda y la reasignación sectorial del empleo: evidencia internacional (251 KB) (article in the Boletín Económico).
24/06/2008 Appearance of the Governor (Miguel Á. Fernández Ordóñez) before the Parliamentary Committee on Financial Affairs. Presentation of the Annual Report, 2007.
17/06/2008 Acuerdo de cooperación sobre estabilidad financiera transfronteriza (press release).01/06/2008 Una aproximación al componente transitorio del saldo público en España (article in the Boletín
Económico).23/05/2008 El Banco de España aprueba la nueva Circular sobre Recursos Propios de las Entidades de Crédito
(press release).01/05/2008 Regulación e innovación en la reciente crisis financiera (article in the Revista de Estabilidad Financiera).01/05/2008 La titulización de activos por parte de las entidades de crédito: el modelo español en el contexto
internacional y su tratamiento desde el punto de vista de la regulación prudencial (article in the Revista de Estabilidad Financiera).
02/04/2008 Las entidades de depósito españolas afrontan desde una posición de solidez el período de turbulen-cias financieras internacionales (press release).
20/02/2008 El Banco de España reitera la solidez y solvencia del sector bancario español (press release).01/12/2007 Evolución reciente de la tasa de actividad de la economía española y retos futuros (114 KB) (article
in the Boletín Económico).01/12/2007 La titulización en España: principales características (116 KB) (article in the Boletín Económico).23/11/2007 Appearance of Governor (Miguel Á. Fernández Ordóñez) before the Committee on Budgetary
Affairs of the Senate.09/10/2007 Testimony of the Governor (Miguel Á. Fernández Ordóñez) to the Parliamentary Budget Committee.27/09/2007 Appearance of the Governor (Miguel Á. Fernández Ordóñez) before the Committee on Financial
Affairs of the Senate to assess the economic situation in the face of financial market instability.18/09/2007 Testimony of the Governor (Miguel Á. Fernández Ordóñez) to the Parliamentary Committee on
Financial Affairs.17/09/2007 Comunicado del Banco de España (Desmentido de las publicaciones del presidente de Northern
Rock sobre la ELA a entidades españolas) (press release).25/06/2007 El Banco de España aprueba los primeros modelos avanzados para el cálculo de los requerimientos
de recursos propios (press release).01/04/2007 La respuesta a la consulta del Ministerio de Economía y Hacienda en cumplimiento del artículo 8.2
de la Ley General de Estabilidad Presupuestaria y la difusión de las proyecciones macroeconómicas del Banco de España (132 KB) (article in the Boletín Económico).
01/02/2007 Un análisis intertemporal de los saldos de la balanza por cuenta corriente de los países de la zona del euro (280 KB) (article in the Boletín Económico).
08/01/2007 Estimates of the potential growth rate of the Spanish economy (118 KB) (article in the Economic Bulletin).
29/12/2006 Arranca el proceso consultivo de la nueva circular de solvencia (press release).

254 banco de españa
01/12/2006 El Banco de España y la evaluación del sistema financiero (article in the Notas de Estabilidad Financiera).30/10/2006 La cuota de los productos españoles en los mercados internacionales (138 KB) (article in the Boletín
Económico).30/10/2006 Competencia y ajustes de precios en España y en el área del euro (127 KB) (article in the Boletín
Económico).29/09/2006 Actualización de las estimaciones de la tasa de desempleo estructural de la economía española (109 KB)
(article in the Boletín Económico).30/07/2006 Características de la reciente expansión inmobiliaria en una perspectiva de medio plazo (124 KB)
(article in the Boletín Económico).30/07/2006 Macroeconomic divergences between euro area countries: size, causes and implications (125 KB)
(article in the Economic Bulletin).29/06/2006 House prices in Spain: is the evidence of overvaluation robust? (75 KB) (article in the Economic
Bulletin).29/06/2006 Una nota teórica sobre el papel del acceso al crédito en el comportamiento del precio de la vivienda
(67 KB) (article in the Boletín Económico).21/06/2006 El Banco de España aumenta la transparencia supervisora a través de Internet (press release).01/05/2006 La posición relativa de la banca española en el contexto europeo (article in the Revista de Estabilidad
Financiera).28/04/2006 La posición financiera de las pequeñas empresas españolas (74 KB) (article in the Boletín Económico).28/03/2006 La construcción en España (104 KB) (article in the Boletín Económico).28/03/2006 La interacción entre el precio de la vivienda y el crédito a hogares destinado a su adquisición (54 KB)
(article in the Boletín Económico).28/03/2006 La financiación del déficit exterior de la economía española (104 KB) (article in the Boletín Económico).28/12/2005 Nuevos instrumentos de titulización de pasivos empresariales: características e implicaciones (86 KB)
(article in the Boletín Económico).28/11/2005 Inflation differentials in the euro area: the case of the Spanish economy (95 KB) (article in the
Economic Bulletin).01/11/2005 El FSAP, un instrumento para la estabilidad y el desarrollo (article in the Revista de Estabilidad Financiera).28/10/2005 Heterogeneidad en los mercados de trabajo regionales (97 KB) (article in the Boletín Económico).29/09/2005 Las decisiones de gasto de las familias españolas y sus principales determinantes (95 KB) (article in
the Boletín Económico).29/07/2005 El Banco de España permitirá computar como recursos propios de primera categoría las participaciones
preferentes con step up moderados (press release).29/07/2005 La evolución del endeudamiento de las Administraciones Públicas: 2000-2004 (68 KB) (article in
the Boletín Económico).30/05/2005 Efectos de la riqueza inmobiliaria sobre el consumo: resultados a partir de la Encuesta Financiera de
las Familias (77 KB) (article in the Boletín Económico).30/05/2005 Indicadores de accesibilidad y esfuerzo en el mercado de la vivienda (77 KB) (article in the Boletín
Económico).28/04/2005 The wealth of Spanish households: a microeconomic comparison with the United States, Italy and
the United Kingdom (112 KB) (article in the Economic Bulletin).
255RepoRt on the financial and banking cRisis in spain, 2008-2014
28/04/2005 Inflación, productividad y márgenes sectoriales (62 KB) (article in the Boletín Económico).28/03/2005 Los determinantes de la financiación de las sociedades no financieras españolas (83 KB) (article in
the Boletín Económico).28/02/2005 Inmigración: desarrollos recientes y consecuencias económicas (78 KB) (article in the Boletín Económico).28/01/2005 Un indicador sintético de presión financiera para las empresas españolas (135 KB) (article in the
Boletín Económico).22/12/2004 El Banco de España aprueba la nueva Circular Contable (press release).13/12/2004 Nota informativa del Banco de España (Decisión sobre el cargo de prejubilaciones y jubilaciones
anticipadas contra las reservas de libre disposición) (press release).01/12/2004 Las implicaciones del endeudamiento de los hogares sobre el consumo privado (61 KB) (article in the
Boletín Económico).01/12/2004 Las series de stock de capital humano y tecnológico en los indicadores de convergencia real (73 KB)
(article in the Boletín Económico).24/11/2004 Governor’s J. Caruana testimony before the Senate Budgetary Committee.01/11/2004 Survey of Household Finances (EFF): description, methods, and preliminary results (200 KB)
(article in the Economic Bulletin).01/11/2004 La presión financiera y el comportamiento reciente de la inversión productiva privada en España
(137 KB) (article in the Boletín Económico).26/10/2004 El Banco de España distribuye el borrador de la nueva Circular Contable (press release).13/10/2004 Testimony by the Governor J. Caruana before the Parliamentary Budget Committee in connection
with the draft State Budget for 2005. 30/06/2004 Testimony by the Governor J. Caruana of the Banco de España before the Parliamentary Committee on
Economic Affairs and Competitiveness in connection with the presentation of the Banco de España Annual Report.
01/06/2004 The effects of EU enlargement on the Spanish economy: productive structures and trade flows (125 KB)(article in the Economic Bulletin).
01/06/2004 La carga financiera de las familias españolas: un primer análisis desagregado (113 KB) (article in the Boletín Económico).
01/05/2004 Estabilidad financiera y el diseño de la política monetaria (89 KB) (article in the Boletín Económico).01/04/2004 Créditos hipotecarios a tipo de interés fijo frente a tipo variable: comparación de riesgos e implicaciones
macroeconómicas (160 KB) (article in the Boletín Económico).01/03/2004 La evolución de la composición de los pasivos de las sociedades no financieras españolas (145 KB)
(article in the Boletín Económico).05/01/2004 Demanda de trabajo, contratos temporales y factores financieros (46 KB) (article in the Boletín Económico).27/11/2003 Governor’s J. Caruana testimony before the Senate Budgetary Committee.26/11/2003 El impacto de la situación financiera de las empresas sobre la inversión y el empleo (67 KB) (article
in the Boletín Económico).07/10/2003 Testimony by the Governor, J. Caruana, before the Parliamentary Budget Committee.25/09/2003 House prices in Spain (92 KB) (article in the Economic Bulletin).25/09/2003 The determinants of competitiveness and its indicators for the Spanish economy (227 KB) (article
in the Economic Bulletin).
256 banco de españa
18/06/2003 Testimony by the Governor, J. Caruana of the Banco de España before the Parliamentary Committee on Economic Affairs and Competitiveness in connection with the publication of the Annual Report.
26/05/2003 La nueva reforma del IRPF. Principales modificaciones y análisis de sus efectos (250 KB) (article in the Boletín Económico).
26/05/2003 Comparative analysis of export demand for manufactures in the euro area countries (218 KB) (article in the Economic Bulletin).
24/04/2003 Determinantes del crecimiento del crédito a los hogares en España (167 KB) (article in the Boletín Económico).
24/04/2003 Algunas características del crecimiento de la economía española en la década de los noventa desde una perspectiva sectorial (102 KB) (article in the Boletín Económico).
26/03/2003 ¿Aprovechan los hogares la revalorización de su riqueza inmobiliaria para financiar un aumento del consumo? (132 KB) (article in the Boletín Económico).
22/01/2003 Los efectos de las modificaciones de las condiciones financieras sobre el comportamiento de las empresas españolas (54 KB) (article in the Boletín Económico).
16/10/2002 El subgobernador del Banco de España afirma que las inversiones en América Latina no cuestionan la «rentabilidad, saneamiento y estabilidad» de la banca española (press release).
11/10/2002 Jaime Caruana alerta contra una reacción excesiva ante la crisis de algunos países latinoamericanos (press release).
08/10/2002 Testimony by the Governor, J. Caruana, before the Parliamentary Budget Committee.08/05/2002 Testimony by the Governor of the Banco de España, J. Caruana, before the Parliamentary Committee
on Economic Affairs.01/03/2002 La provisión para insolvencias en las entidades de crédito. Presente, futuro y pasado (article in the
Notas de Estabilidad Financiera).14/11/2001 Governor’s (J. Caruana) testimony before the Senate Budgetary Committee.20/11/2000 Governor’s (J. Caruana) testimony before the Senate Budgetary Committee.


