How large companies around the world communicate the impact of their non-financial activities Report on the Scope and Quality of CSR Reports from the World’s Largest Companies 2016 Edition www.CSRSmonitor.org
Transcript
How large companies around the worldcommunicate the impact of their
non-financial activities
Report on the Scope and Quality ofCSR Reports from the World’s Largest Companies
2016 Editionwww.CSRSmonitor.org
CSR-Sustainability Monitor®
2016 Edition
Principal InvestigatorS. Prakash Sethi, PhD
University Distinguished Professor, The City University of New York
Senior Fellow, Weissman Center for International Business,
Zicklin School of Business, Baruch College, The City University of New York (CUNY)
Weissman Center for International BusinessBaruch College, The City University of New York
Terrence F. Martell, PhD
Director, Saxe Distinguished Professor of Finance
Mert Demir, PhD
Director of Research
Lene Skou
Deputy Director
Weissman Center for International Business Mission Statement
The mission of the Weissman Center for International Business is
to provide meaningful international educational experiences for
Baruch undergraduate and graduate students, support scholarly
research and teaching with an international business perspective,
and contribute to the economic life of New York City.
• This edition’s sample consists of companies that published a CSR report (standalone or integrated) during calendaryear 2014 that were listed in the 2014 Fortune 250 orFortune Global 250, that were listed in the top 100 ofMSCI’s Emerging Markets Index in 2014, or that wereincluded in the previous version of the CSR-S Monitor.
• Reports are scored based on the scope of coverage,specificity of detail, and degree of external verification ofinformation disclosed by a company regarding its policies,implementation and outcomes across 11 “ContextualElements,” including Environment, Labor Relations, Human Rights, Anti-corruption, Supply-chain Management, and Integrity Assurance.
• The Integrity Assurance Element in the Monitor coverswhether, and to what degree, the information in acompany’s report is verified by a third party or parties.
• The full sample consists of 629 companies from 20 industries and 43 HQ locations across nine regions; the largest share of our sample comes from (in order ofsize) North America, Western Europe, and East Asia.
• The largest industry groups in our sample areManufacturing; Finance and Insurance; Mining, Quarrying,and Oil and Gas Extraction; and Information Services.
• Information including company profiles and all scores, as well as additional research and informationabout the Monitor, is available on our website,www.CSRSmonitor.org.
• The top five companies for the 2016 edition of the CSR-SMonitor are, in order: Endesa S.A., Barrick GoldCorporation, Ford Motor Company, Acer Incorporated, and Bayerische Motoren Werke Aktiengesellschaft (BMW).
• Western Europe has the highest median score of our three Large Sample Size regions, followed by East Asia and then North America.
• The industries of the 10 highest-scoring companies includeUtilities; Mining, Quarrying, and Oil and Gas Extraction;Automobile Manufacturing; Electronics Manufacturing;Construction Material Manufacturing; and Other Services.They are variously headquartered in North America,Western Europe, East Asia, and Latin America & theCaribbean.
• Companies from Goods-Producing industries tend to scorehigher than companies from Service-Providing industries.
• Scores range from 4.50 to 80.50 out of 100, which indicates a large disparity in the comprehensiveness and specificity of information different companies aredisclosing when they decide to publish a CSR report. Note that a company’s overall score is a sum of itsweighted scores on the 11 Contextual Elements; company scores do not influence one another in any way.
• Environment secured its place as the most commonlyreported Contextual Element, with more than 99 percentof reports including at least some level of disclosure.
• North American companies excel at reporting onPhilanthropy & Community Involvement issues –particularly with regard to the ways companies engagewith employees in their philanthropic activities whencompared to other Large Sample Size regions.
• Overall only 47 percent of reports utilized a publicaccounting/auditing firm or a specialized integrityassurance provider, and only 42 percent provided acorresponding statement of assurance (a slight increasefrom 43 percent of reports and 36 percent with astatement from the 2014 edition of the CSR-S Monitor).Western European companies in particular are much better in this area, with 72 percent listing an integrityassurance provider – especially compared to NorthAmerican companies, of which only 22 percent did so (up from 65 percent of Western European and 21 percentof North American companies in the 2014 edition). East Asian companies still tend to favor “third-partyreviews” by academics or other CSR experts.
Sample and Scoring Methodology Information Findings
Highlights
4CSR-Sustainability Monitor®
The Scope and Quality of CSR Reports from the World’s Largest Companies
2016 Edition
Due to growing public concerns regarding environmental, social, and governance (ESG) matters in the past two decades,corporations around the world have increasingly started to take measures to assess the impacts and risks of their businessactivities and to communicate their assessment of these activitiesto their various stakeholders. Among S&P 500 companies, the rate of reporting on ESG activities has risen from 20 percent to 82 percent in just a matter of five years between 2011 and 2016.1 Corporate Social Responsibility (CSR) reportshave increasingly become a medium for such communication,supported by both nonregulatory and regulatory measuresaround the world. Organizations such as the UN Global Compact(UNGC), the Global Reporting Initiative (GRI), and others haveled the way for greater disclosure by outlining reportingprinciples and guidelines to help companies in the reportpreparation process. Despite the growth in CSR reporting and presence of publicly available guidelines for reporting, lack of standardization and of a unified regulatory andsupervisory landscape has created wide discrepancies inreporting practices as well as in the content and quality of information provided in these reports, making it hard for stakeholders to analyze these reports and comparecompanies based on the information provided.
To address this issue, various regulatory bodies around the worldhave stepped in to try to organize and regulate this new field by endorsing or mandating sustainability reporting. Currently, 37 countries and the European Union incorporate some level of CSR disclosure through government or exchange-imposedregulations, a 12 percent increase from 2012.2 However, insteadof stabilizing the reporting environment, the divergence inpolicies has resulted in a wide variety of approaches, which only serves to exacerbate stakeholder concerns about thecomparability of CSR reports. The result is a need to harmonizethese corporate responsibility efforts and build bridges betweenthe different reporting frameworks. Driven by the growingdemand from stakeholders for comprehensive, detailed, andaccurate information on a company’s ESG impacts and risks, the focus of management has shifted from just catering to theinformation needs of a highly concentrated group of social andpolitical actors to meeting the needs of different beneficiaries as a way to align sustainability with business and social strategy,and thereby attaining the “license to operate.” Accordingly,companies have extended their focus well beyond the walls ofthe company to include a broader ecosystem of noncompany
actors in the upstream and downstream supply chain. Thisbroader perspective brings with it a greater focus on reportingas part of a proactive compliance/management strategy dealingwith a range of relevant CSR risks locally and internationally.
Investor focus has also moved from a “values-driven” nicheperspective to a more mainstream risk-driven perspective. In this mainstream view, the focus is on differentiatingcompanies based on their ESG risk and impact profiles. Investors,particularly institutional investors such as pension funds, areincreasingly translating these risks into financial impacts on the company and integrating them into their investmentdecision-making processes;3 however, over the recent years, alarge majority of investors have increasingly become unsatisfiedwith the quality as well as materiality of information providedby companies in their CSR reports.4 Once again, limitedstandardization and lack of comparability prevent CSR reportsfrom reaching their full potential as communication andstakeholder engagement tools.
The CSR-S MonitorThe CSR-Sustainability Monitor (or the CSR-S Monitor, or just theMonitor) is a modified content analysis–based system that allowsfor individual company CSR reports to be analyzed based on aset of common components. The Monitor has been developed by researchers at the Weissman Center for International Businessat Baruch College in order to improve comparability of CSRreports and thus enable their full potential. It aims to level the playing field by providing a framework for disclosure ofcredible, reliable, and high-quality ESG information. In thisrespect, the CSR-S Monitor measures only the breadth, depth,and degree of verification of the information provided by acompany in its CSR report. It does not represent an assessment or ranking of a company’s actual performance or activities in the area of CSR as documented in their report or otherwise.
The effectiveness of a company’s CSR reporting depends, toa large extent, on the level of credibility that the company’simportant stakeholders attach to it.5 That is why the CSR-SMonitor, in its screening process, also measures the degree towhich the reporting company provides integrity assurance as tothe accuracy and completeness of the information it is disclosing.The CSR-S Monitor is the product of the Weissman Center forInternational Business at the Zicklin School of Business, BaruchCollege, The City University of New York.
Emerging Trends in Corporate Social Responsibility Reporting
1 Governance & Accountability Institute, Inc. (2017). Flash report: 82% of the S&P 500 companies published corporate sustainability reports in 2016. Retrieved June 07, 2017 from http://www.ga-institute.com/press-releases/article/flash-report-82-of-the-sp-500-companies-published-corporate-sustainability-reports-in-2016.html
2 The Hauser Center for Nonprofit Organizations; Initiative for Responsible Investment. (2014). Current corporate social responsibility disclosure efforts by national governments and stock exchanges. Retrieved July 1, 2014 from http://hausercenter.org/iriwp content/uploads/2011/08/CSR-Disclosure-Updates-4-18-14.pdf
3 The Principles for Responsible Investment (PRI, 2014) announced that total signatory assets under management grew to more than US$45 trillion by the end of April 2014. Retrieved July 3, 2014 from http://www.unpri.org/about-pri/
4 PwC. (2014). Investor survey, winter/spring series, Sustainability goes mainstream: Insight into investor views. Retrieved July 1, 2014 fromhttp://www.pwc.com/en_US/us/pwc-investor-resource-institute/publications/ assets/pwc-sustainability-goes-mainstream-investor-views.pdf
5 Sethi, S. P., Martell, T. F., & Demir, M. (2015). Enhancing the role and effectiveness of corporate social responsibility (CSR) reports: The missing element of content verification and integrity assurance. Journal of Business Ethics, 1-24. doi:10.1007/s10551-015-2862-3
5CSR-Sustainability Monitor®
Population SelectionWe drew our sample of companies based on four criteria, whichwere chosen in order to forward our goals of tracking trends inCSR reporting over time as well as ensuring that we are coveringmany of the world’s largest corporations:
1) Every company listed in the Fortune 250 for 2014 (the 250 largest companies in the United States)
2) Every company listed in the Fortune Global 250 for 2014 (the 250 largest companies in the world)
3) Every company listed in the top 100 of MSCI’s Emerging Market Index in 20146
4) Every company whose report was scored in the previous (2014) edition of the Monitor
The number of companies that met at least one of the fourcriteria was 793, and those companies constitute our initialpopulation.
Identifying and Scoring CSR Reports After selecting our population, we collect CSR reports from thechosen companies.7 Our goal is to focus specifically on the CSRreport as a single unit, and our scoring procedure was designedwith that in mind. Otherwise, we would not be able to make fair comparisons between CSR reports and other types of CSRinformation publications. We use a number of criteria in ourselection process. First, in order for a report to qualify as validand be scored, it must have been published during calendar year2014 with a defined reporting period (usually but not exclusivelythe company’s fiscal year 2013), be written in English (or have an official English translation available), and be presented as acohesive unit. Most commonly, companies publish their reportsas standalone “CSR Reports” or “Sustainability Reports” (namingand dating conventions varied greatly and were not factors inreport selection). If they choose instead to publish an integratedCSR/annual report or website-based CSR report that theyexplicitly identify as their CSR publication, we also accept that,provided it meets our other criteria defined above (from nowon, the term “CSR report” will refer to the full set of valid reporttypes). We only score one report from each company, and in the case of multiple published pieces we give priority to astandalone report. If a CSR report has additional supportingdocuments published alongside it, we do count those. However,we do not follow links within CSR reports to other parts of acompany’s website (such as the investor relations page) or otherreports (such as the annual report). We do not accept as validreports websites with CSR information updated at unknown ormultiple intervals, or that were otherwise not identified asreports. Likewise, PDF publications that were published asquarterly or other updates are not counted.
The content (or lack thereof) of a CSR report does not factorinto the decision to accept it as valid or not. As long as it meetsour criteria, we accept and score a report even if it only covers afew of our Contextual Elements. In total, we found 629 valid CSRreports from 43 different HQ locations and 20 industries (at the2-digit North American Industry Classification System [NAICS]code level), all of which were subsequently analyzed. Locationand industry classification information is taken from LexisNexis’Corporate Affiliations database (hereafter “CorporateAffiliations”) and supplemented by Gale’s Business Insights:Essentials database.
Company Background InformationThe majority of background information about the companiesis drawn from the Corporate Affiliations database. From there we take the official company name (Corporate Affiliationsconverts non-English characters in company names to Englishcharacters, so our list does as well), location of headquarters,and NAICS codes, including primary and secondary industries.The tables and charts in this report are organized using thisinformation.
We define the various regions with a modified version of the World Bank’s designations; specifically, we split Oceania(Australia and New Zealand) from the East Asia and Pacificregion and Western Europe from the Europe and Central Asiaregion.8 We make these modifications in order to ensure thatour data more accurately reflects the significant differences inthe history and culture of CSR reporting within those regions.
There is one significant exception to our use of CorporateAffiliations data: due to diverse types of corporate structure and their methodology for assigning NAICS codes, CorporateAffiliations lists the primary industry for many parent companies to be Management of Companies and Enterprises(NAICS code 55), specifically as types of holding companies, while their subsidiaries are assigned more specific NAICS codes.9 Listing a large number and wide variety of companiesunder this industry would not have accurately categorized their impacts as described in their CSR reports. It would prevent effective comparisons of their CSR reports with their true competitors.
To solve this problem we look to another database, Gale’sBusiness Insights: Essentials database (hereafter referred to asGale).10 All companies listed under NAICS code 55 by CorporateAffiliations were rechecked on Gale’s database. As a result, thesize of our Management of Companies and Enterprises industrydrops from 182 companies to only 31, with the other 151distributed to the 2-digit NAICS code assigned by Gale. Gale’sindustry code information was also used in 11 additional cases where a company could not be found in the CorporateAffiliations database.
The Scope and Quality of CSR Reports from the World’s Largest Companies
2016 Edition
The CSR-S Monitor Research Methodology
6 Source: MSCI7 There is no widely accepted definition of a CSR report. We use the term in its broadest sense to describe reporting
on various economic, governance, environmental, and social activities and impacts of a company.8 World Bank. (2014). Country classifications. Data retrieved March 1, 2014 from http://data.worldbank.org/about/country-and-lending-groups 9 http://www.census.gov/eos/www/naics/10 Gale uses a two-step process to determine primary industry codes. If a company provides its primary industry, Gale uses it.
If it is not provided, Gale assigns the primary NAICS code based on the company’s main line of business.
6CSR-Sustainability Monitor®
Under the direction of University Distinguished Professor S. Prakash Sethi at Baruch College, the CSR-S Monitor uses aproprietary rubric to score each CSR report, which is thoroughlyexamined by multiple analysts. The rubric categorizes thecontent of each CSR report into 11 sections called “ContextualElements,” which cover the most common relevant areas of CSRand sustainability. The scoring criteria within each Element vary,but always follow a general pattern of looking for a combinationof the scope of coverage and depth of information provided bythe company regarding policies, implementation andoutcomes.11 Scores on the 11 Contextual Elements are presentedas percentages in this report and on our website; however, forthe purpose of calculating a company’s Overall Score (and byextension, Rank), we apply weights in the following manner:
We assign the numerical weight for each contextual elementabove based on the average amount of information provided on each topic in a CSR report, modulated by The Monitor’sevaluation of the significance of some particular topics such asIntegrity Assurance. The work of each analyst is independentlyverified to ensure that the evaluation metric is consistentlyemployed. The scores are then analyzed to enhance consistencyin the scoring system. This year we found that greater than 50percent of analyzed reports had at least some level of coveragefor all of the 11 Contextual Elements, showing that our 11Elements are the topics considered most relevant by the vastmajority of companies producing CSR reports (see Table 1).Six of the Elements had little change in coverage rate comparedto our 2014 edition, while the remaining five saw somewhatlarger differences.
The Scope and Quality of CSR Reports from the World’s Largest Companies
2016 Edition
The CSR-S Monitor Scoring Methodology
11 Sethi, S.P., Rovenpor, J. L., & Demir, M. (2017). Enhancing the quality of reporting in corporate social responsibility guidance documents: The roles of ISO 26000, Global Reporting Initiative and CSR-Sustainability Monitor. Business and Society Review. 122 (2), 139-163.
TABLE 1: Characteristics of CSR Reports by Contextual Element (2016 Edition Sample Size: 629 companies)
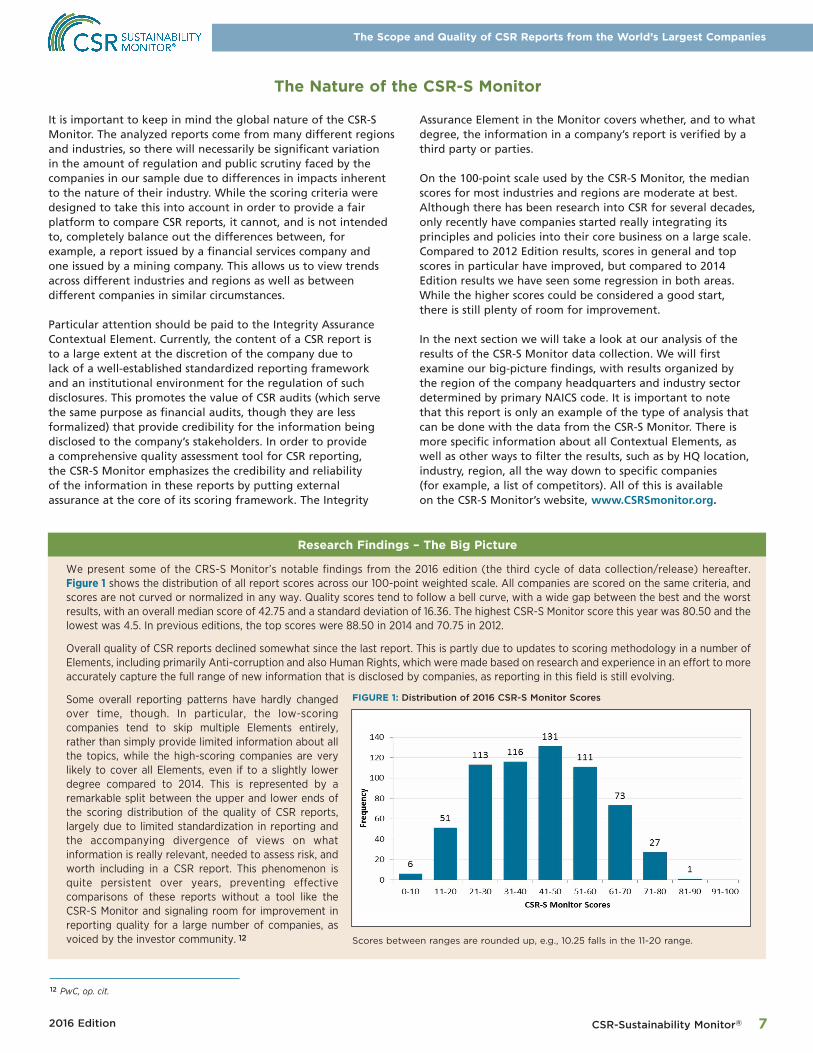
We present some of the CRS-S Monitor’s notable findings from the 2016 edition (the third cycle of data collection/release) hereafter.Figure 1 shows the distribution of all report scores across our 100-point weighted scale. All companies are scored on the same criteria, andscores are not curved or normalized in any way. Quality scores tend to follow a bell curve, with a wide gap between the best and the worstresults, with an overall median score of 42.75 and a standard deviation of 16.36. The highest CSR-S Monitor score this year was 80.50 and thelowest was 4.5. In previous editions, the top scores were 88.50 in 2014 and 70.75 in 2012.
Overall quality of CSR reports declined somewhat since the last report. This is partly due to updates to scoring methodology in a number ofElements, including primarily Anti-corruption and also Human Rights, which were made based on research and experience in an effort to moreaccurately capture the full range of new information that is disclosed by companies, as reporting in this field is still evolving.
Some overall reporting patterns have hardly changedover time, though. In particular, the low-scoringcompanies tend to skip multiple Elements entirely,rather than simply provide limited information about allthe topics, while the high-scoring companies are verylikely to cover all Elements, even if to a slightly lowerdegree compared to 2014. This is represented by aremarkable split between the upper and lower ends ofthe scoring distribution of the quality of CSR reports,largely due to limited standardization in reporting andthe accompanying divergence of views on whatinformation is really relevant, needed to assess risk, andworth including in a CSR report. This phenomenon isquite persistent over years, preventing effectivecomparisons of these reports without a tool like theCSR-S Monitor and signaling room for improvement inreporting quality for a large number of companies, asvoiced by the investor community. 12
7CSR-Sustainability Monitor®
It is important to keep in mind the global nature of the CSR-SMonitor. The analyzed reports come from many different regionsand industries, so there will necessarily be significant variationin the amount of regulation and public scrutiny faced by thecompanies in our sample due to differences in impacts inherentto the nature of their industry. While the scoring criteria weredesigned to take this into account in order to provide a fairplatform to compare CSR reports, it cannot, and is not intendedto, completely balance out the differences between, forexample, a report issued by a financial services company and one issued by a mining company. This allows us to view trendsacross different industries and regions as well as betweendifferent companies in similar circumstances.
Particular attention should be paid to the Integrity AssuranceContextual Element. Currently, the content of a CSR report is to a large extent at the discretion of the company due to lack of a well-established standardized reporting framework and an institutional environment for the regulation of suchdisclosures. This promotes the value of CSR audits (which servethe same purpose as financial audits, though they are lessformalized) that provide credibility for the information beingdisclosed to the company’s stakeholders. In order to providea comprehensive quality assessment tool for CSR reporting, the CSR-S Monitor emphasizes the credibility and reliability of the information in these reports by putting external assurance at the core of its scoring framework. The Integrity
Assurance Element in the Monitor covers whether, and to whatdegree, the information in a company’s report is verified by athird party or parties.
On the 100-point scale used by the CSR-S Monitor, the medianscores for most industries and regions are moderate at best.Although there has been research into CSR for several decades,only recently have companies started really integrating itsprinciples and policies into their core business on a large scale.Compared to 2012 Edition results, scores in general and topscores in particular have improved, but compared to 2014Edition results we have seen some regression in both areas.While the higher scores could be considered a good start, there is still plenty of room for improvement.
In the next section we will take a look at our analysis of theresults of the CSR-S Monitor data collection. We will firstexamine our big-picture findings, with results organized by the region of the company headquarters and industry sectordetermined by primary NAICS code. It is important to note that this report is only an example of the type of analysis thatcan be done with the data from the CSR-S Monitor. There ismore specific information about all Contextual Elements, as well as other ways to filter the results, such as by HQ location,industry, region, all the way down to specific companies (for example, a list of competitors). All of this is available on the CSR-S Monitor’s website, www.CSRSmonitor.org.
The Scope and Quality of CSR Reports from the World’s Largest Companies
2016 Edition
The Nature of the CSR-S Monitor
Research Findings – The Big Picture
FIGURE 1: Distribution of 2016 CSR-S Monitor Scores
Scores between ranges are rounded up, e.g., 10.25 falls in the 11-20 range.
12 PwC, op. cit.
8CSR-Sustainability Monitor®
In the tables and figures to follow we provide an overview ofthe current state of CSR reporting across various regions of theworld. Approximately 91 percent of the analyzed reports in oursample are mainly from three regions: North America, WesternEurope, and East Asia. We have designated these regions asLarge Sample Size and the remaining six regions, with 9 percent of the analyzed reports, as Small Sample Size. Much of our regional analysis is split along these lines in order to provide a fairer look at the numbers.
Table 2-A breaks down the results from our three Large SampleSize regions, ordered by the number of reports analyzed.Western Europe preserves its place as the highest scorer, withthe highest median score and the most companies in the Top 25 ranks overall, despite having 38 fewer reports analyzedcompared to North America. Unlike all other regions, reportingin Western Europe is not concentrated in a few locations, but is dispersed across the region. Top-scoring companies are also spread out, with Spain having three companies in thetop 25, France and Germany each having two, and Luxembourg,Netherlands, Switzerland, and the United Kingdom with one each.
While North American companies are still lagging behind theirWestern European counterparts, at the top of the scale theyhave closed the gap since the previous report. Seven NorthAmerican companies ranked in the Top 25 (including four in theTop 10, and two in the Top 3), compared to only two of the Top25 in the 2012 Report and six in 2014, a fairly consistent progressfor the largest sample size region. Apart from Canadiancompany Barrick Gold Corporation (rank 2 overall in 2016), the other six are from the United States. That is more than anyother individual HQ location, but there were also many morecompanies in the sample from the United States than anywhereelse. And while well represented in the Top 25, the United Statesalso had 15 of the Bottom 25 companies. These two results pointto significant variation in reporting practices among the UScompanies in particular, due probably again to (1) lack ofstandardization in CSR reporting in the US yet (2) growing public and regulatory pressure for more sustainable andresponsible business practices at home and abroad. Despite thegrowing number of companies reporting on their CSR practicesin the major US indices, these statistics underline a lack of abroad consensus on disclosure content as the main driver of thisdisparity in reporting. This poses a major challenge to companiesas well as their stakeholders and highlights the value a certainlevel of standardization in the CSR reporting process could
provide. At this point, we would like to reemphasize our mainargument: considering that so many companies now recognizethe importance of having a CSR report, the degree of quality of their disclosures is emerging as the next big issue. The CSR-SMonitor proactively attempts to resolve this issue by providingan analytic framework for the systematic evaluation of thequality of CSR reports that can be used by companies as well as by their various stakeholders in their decision making.
Notably, the HQ locations included in the East Asia region aremuch more diverse in terms of economic development, sharingsome traits with both Large and Small Sample Size regions. The East Asia region includes locations such as Japan (fromwhich a majority of our East Asian companies originate), China (with its many large, state-owned enterprises), and otheremerging economies such as Thailand, Indonesia, and Malaysia.
Table 2-B shows the results from Small Sample Size regions.Unlike their Large Sample Size counterparts, in which a range of medium-to-large companies publish reports, reportingcompanies from the Small Sample Size regions are more oftenamong the largest and most influential globally, such as Brazil’sPetrobras and Russia’s Gazprom, or at least within their localarea. As a result, these companies make up a larger percentageof their respective regional samples with regard to their size and economic impact (revenues), but only reflect a small sampleof all the companies operating in the respective regions.
In many cases, even if the region covers a broad geographicarea, CSR reports are concentrated in a small part of the region. For example, all 12 reports from the Sub-Saharan Africa region came from South African companies. This isbecause South Africa is a business hub for the region and is something of a pioneer in the area of CSR reporting, as reflected in the King Report on Corporate Governance.13
Additionally, the Johannesburg Stock Exchange, along withBrazil’s BM&F Bovespa (Brazil is another example of a countrythat contributes heavily to the reporting in a Small Sample Sizeregion), are known for being at the forefront of sustainabilitypolicies for exchanges, and many companies from these SmallSample Size regions are producing reports of high quality.14
In fact, the Sub-Saharan Africa regional median outperformedthe overall median by 3.75 points. Even more impressive, despite having only 10 companies in our sample and with only eight companies listed in the Fortune Global 250 for 2014,Latin America & the Caribbean had three companies ranked inthe Top 25 of the CSR-S Monitor (CEMEX, VALE, and Ecopetrol).
The Scope and Quality of CSR Reports from the World’s Largest Companies
2016 Edition
Research Findings – Region-Based
13 Visser, W., Tolhurst, N. (2010). The World Guide to CSR: A Country-by-Country Analysis of Corporate Sustainability and Responsibility. Sheffield: Greenleaf.
14 Global Reporting Initiative. (2013). Carrots and Sticks: Sustainability Reporting Policies Worldwide–Today’s Best Practice, Tomorrow’s Trends. Retrieved April 15, 2014 from https://www.globalreporting.org/resourcelibrary/carrots-and-sticks.pdf
9CSR-Sustainability Monitor®
Though there is stillconsiderable room forimprovement across allregions in general, as seen in Figure 2, the topscorers for almost allregions (the exceptionbeing Middle East & North Africa) performedmore than a standarddeviation better than theoverall median of 42.75.The top scorers for allthree Large Sample Sizeregions performed betterthan two standarddeviations above themedian.
The Scope and Quality of CSR Reports from the World’s Largest Companies
2016 Edition
TABLE 2-A: CSR-S Monitor Scores by Region of Company Headquarters (Large Sample Size Regions)
TABLE 2-B: CSR-S Monitor Scores by Region of Company Headquarters (Small Sample Size Regions)
FIGURE 2: CSR-S Monitor Scores: Medians and Top Performers’ scores by Region of Company Headquarters
10CSR-Sustainability Monitor®
The background information we drew for each of the 629companies in our sample includes a set of 6-digit NAICS codesthat describe the various operations engaged in by eachcompany. These industry classifications inform our understandingof each company and give us context as to the scope of itsoperations, as many companies we look at do work in multipleindustries and are integrated in various ways.
Each company has been categorized by only its primary code at the 2-digit level (such as Construction or Utilities). We have also divided the results between Goods-Producing and Service-Providing industries, known as “SupersectorGroups” (see “Industries by Supersector and NAICS code” by the US Bureau of Labor Statistics).15 Analysis by primary 2-digit NAICS code is helpful for explaining big-picture findingsbut is too simplistic to capture the full scope of our results,since so many companies do business in multiple sectors (and
thus their reports should cover multiple sectors as well). The more specific 6-digit NAICS codes and secondary NAICScodes are available on our website (www.CSRSmonitor.org)for more detailed analysis.
Apart from using the Supersector Groups, we do not aggregate any sectors, but we do divide the classification of the Manufacturing sector into three separate sectors (based on the 2-digit NAICS code assigned to each, denoted as Manufacturing-31, -32, and -33). The Retail Trade sector andTransportation and Warehousing sector also contain multiple 2-digit NAICS codes, but we found that the differences withinthose sectors are not significant enough from a CSR perspectiveto warrant separate analysis. In total our sample containedcompanies from 20 different sectors; we have chosen to lookmore closely at the 13 that had a sample size of 10 or more CSR reports, as seen in Tables 3-A and 3-B.
The Scope and Quality of CSR Reports from the World’s Largest Companies
2016 Edition
Research Findings – Industry-Based
TABLE 3-A: CSR-S Monitor Scores for Goods-Producing Industries with 10 or More Reports Analyzed (Primary NAICS Code, 2-Digit Level)
TABLE 3-B: CSR-S Monitor Scores for Service-Providing Industries with 10 or More Reports Analyzed (Primary NAICS Code, 2-Digit Level)
15 United States Bureau of Labor Statistics. (2013). BLS Handbook of Methods. Washington, D.C.: U.S. Bureau of Labor Statistics, Division of Information Services.
11CSR-Sustainability Monitor®
In our analysis, we identified some significant differences bothbetween and across industry Supersector Groups. Specifically,Goods-Producing companies continue to have higher scores ingeneral, with Mining, Quarrying, and Oil and Gas Extraction and Manufacturing-31 (which includes mainly food/beverages,textiles, and tobacco manufacturing) having the two highestmedian scores across all industries, with other manufacturingindustries not far behind. Goods-Producing companies alsodominate the Top 25 overall rankings. Service-Providingcompanies tend to have somewhat lower scores, with theexception of the Information industry companies.
These results echo the trend that has been seen over theprevious years. Hence, we revisit our argument that whileGoods-Producing companies often receive much more negativeattention for their environmental and social practices, whencompanies are subject to increased scrutiny in both theregulatory and reputational sense, they may disclose moreinformation to address those areas of potential liability in their CSR reports, since they know they are important to
stakeholders.16,17 Moreover, ESG risks and impacts in, forexample, extractive industries are better understood andquantified compared to other industries, making it easier forcompanies operating in this industry to disclose more in-depthand comprehensive information about relevant issues.18 It isworth mentioning again that the CSR reports are being scoredon the quality of disclosure, not on performance.
Figure 3 shows the median scores for the six industries with the most reports, as well as the score and overall rank for thetop scorer in each industry. These six industries account for about 67% of our total sample of reporting companies. One interesting note is that despite having the second-highestnumber of companies, the Finance and Insurance industry has no companies in the Top 25, while the other five industries onthis list all have at least one. The top scorer in the Finance andInsurance industry, ING Groep N.V., is only ranked 43rd. This indicates a potential for a company in the Finance andInsurance industry to really separate itself from the pack with a good showing in future reports.
The Scope and Quality of CSR Reports from the World’s Largest Companies
2016 Edition
FIGURE 3: CSR-S Monitor Scores: Medians and Top Performers of The Industries (By Primary 2-Digit NAICS Code) With the Most Analyzed Reports
16 Deegan, C. (2002). The legitimizing effect of social and environmental disclosures: A theoretical foundation. Accounting, Auditing & Accountability Journal, 15(3), 282-311. Retrieved April 15, 2014 from http://search.proquest.com/docview/211212442
17 Sethi, S. P., Martell, T. F., & Demir, M. (2016). Building corporate reputation through Corporate Social Responsibility (CSR) reports: The case of extractive industries. Corporate Reputation Review, 19(3), 219-243.
18 Rogers, J. (2013). 4 signs of sustainability from oil, gas and mining companies [Web log comment]. Retrieved April 15, 2014 from http://www.greenbiz.com/blog/2013/11/05/4-sustainability-trends-oil-gas-mining
12CSR-Sustainability Monitor®
Table 4 gives a list of our Top 10 companies, along with theirbackground information and results from the 2014 CSR-SMonitor. The first thing to note is that companies from LargeSample Size regions dominate the top ranks. However, whilethere are certainly regional trends in CSR reporting, it is clearthat top performers can come from any location. In fact, the two East Asian companies on the Top 10 list are from Taiwanand South Korea, which are both categorized as emergingmarkets. These two companies had the highest scores of all Top 10 companies on Integrity Assurance as well.
Second, the 2016 Top 10 list shows some remarkable differencescompared to the 2014 Top 10 list. Table 4 includes the 2014 CSR-S Monitor score and overall rank for each of this year’s Top 10 companies. Only four companies repeat a Top 10performance. While there is clearly an advantage to havingstrong experience from previous years of writing reports, thesuccess of Acer shows that large improvements are very possible.In particular, 6 of the 10 companies in this year’s Top 10 list arenewcomers, suggesting that while high-quality CSR reporting has become a common practice for a group of companies, the field is very dynamic and companies are quick to follow best practices and challenge the leaders.
Third, we’ll take a look at the industries. The majority ofcompanies in our Top 10 are Goods-Producing rather thanService-Providing. Manufacturing is the most representedindustry on the list, though it is the broadest category with thelargest overall sample size as well. More specifically, AutomobileManufacturing and Electronics Manufacturing have multiple Top10 scorers. Only one of the Top 10 companies is extraction-based,but it holds position 2 on the list. The only Service-Providingcompanies in the Top 10 are Alcatel-Lucent (Other Services-81)and Endesa (Utilities-22).
We also include the 2016 CSR-S Monitor Integrity AssuranceContextual Element scores in this table. With the exception ofFord, the scores for the Top 10 companies on this Element aremuch higher than the median for this Element, which is only13.33%. In fact, the integrity assurance scores for five of theother nine companies are considerably higher than the median(see Table 4). Since Integrity Assurance is a major factor forstakeholders in determining the credibility of CSR reports, it is good to see that so many high-scoring companies consider it an integral part of their CSR reports.
The Scope and Quality of CSR Reports from the World’s Largest Companies
2016 Edition
Research Findings – The Top 10 Companies
TABLE 4: Top 10 Company Information and 2014 Edition Comparison
13CSR-Sustainability Monitor®
The Scope and Quality of CSR Reports from the World’s Largest Companies
2016 Edition
CSR-S Monitor Website Database
For more information about the CSR-S Monitor, please visit ourwebsite: www.CSRSmonitor.org. The site includes a searchabledatabase of all company scores for the last two editions of theproject (2016 and 2014 editions), including overall scores andscores for each of the 11 Contextual Elements for every companyin our sample. It also features tools to filter and comparecompany scores with one another, or with industry, HQ location,
or regional groups. In addition to the database, the websitealso includes full industry classification information forcompanies operating under more than a single NAICS code,more information about the project’s methodology, and furtherexamples of how our data may be used in the form of industryreports. There is also additional information about the project’sprincipal investigators and other contributors.
Our analysis of CSR reports published by the world’s largestcompanies in the year 2014 reveals a consistent pattern ofconsiderable variation in the content and quality of the reports.Given the limited standardization and still mostly voluntarynature of reporting in this field, this finding is expected andseems to be becoming the norm of CSR reporting around theworld, despite the efforts of various international organizations,governments, industry groups, market regulators, and nonprofitsto establish a common language among reporting companies.That being said, how the new EU directive on nonfinancialreporting will work out among the leaders of sustainabilityreporting will be an interesting topic to investigate in thecoming years.
An effective management of CSR impacts and risks offers variousbenefits to companies, especially to those that are under greaterpublic scrutiny and more publicly visible. These benefits includebetter reputation, more favorable regulatory treatment by localauthorities, endorsements from nongovernmental groups, betteraccess to finance, and higher market valuations. Companies,however, need to utilize a more comprehensive and completeapproach to disclosure of their efforts and achievements, as well as their limitations and shortcomings, to reap all theaforementioned benefits from CSR. The rapidly evolving nature of CSR can further incentivize companies to go beyondexpectations to position themselves as leaders among their peers and thereby gain a competitive edge.
As the demand for substantive and material CSR informationincreases and companies respond to this demand by issuing CSR reports, the quality and credibility of these disclosuresemerges as the next big issue. Unfortunately, the general lack of regulatory oversight, along with limited standardization,causes a level of distrust among stakeholders towards thesedisclosures and the information therein.
While companies can overcome this issue by attaining externalassurance—the nonfinancial counterpart to financial audits—ontheir reports from a recognized independent provider such as a Big 4 accounting firm, the trend towards CSR assurance is stillat a nascent level, particularly among North American and EastAsian companies, suggesting a long road ahead to achieve areasonable level of alignment on their approaches to this matter.
Companies, on the other hand, seem to increasingly rely onavailable CSR reporting guidelines such as the Global ReportingInitiative (GRI) or International Integrated Reporting Council(IIRC), which can be considered a “shortcut” at best in achievingmore credibility. While companies have become more likely to follow some sort of reporting guidelines, the dispersion inreporting quality even among companies within a single industrygroup still persists over time, attesting to the importantdistinction between just the mere “act” versus the “quality”of reporting. GRI and IIRC, as well as most other frameworks,provide companies with guidelines to prepare CSR reports, yet fall short of overcoming the distrust issue due to their sole emphasis on the preparation process of CSR reports, without similar focus on ex post assessment to ensure robustimplementation and degree of verification of the end product.
At this point, the CSR-S Monitor comes to help by providingstakeholders, including a company’s competitors as well asinternal corporate accountability officers, an external andindependent evaluation tool to assess the quality of theinformation provided in a CSR report along with the scope of the accompanying external assurance, if any. We believe that as more companies see an improved CSR profile as a driver of financial and nonfinancial success, as well as a source of competitive advantage, there will be a shift in focus that will result in companies placing a higher priority on their CSRreport’s information quality.
Conclusion
Notes
The MSCI data contained herein is the property of MSCI Inc.(MSCI). MSCI, its affiliates and its information providers make no warranties with respect to any such data. The MSCI data
contained herein is used under license and may not be furtherused, distributed or disseminated without the express writtenconsent of MSCI.
Acknowledgements: 2016 CSR-S Monitor Team
Research AnalystsAlex Schwarz, Lead AnalystDanhua Zhang, Senior Analyst
Communications ConsultantPat Sloan, Principal, Sloan Hunt Communications, New York
Website DesignVitaly Berdyakov, IT Coordinator, Weissman Center for International Business, Baruch College
ResearchLouise Klusek, Information Service Librarian, Newman Library, Baruch CollegeRita Ormsby, Information Service Librarian, Newman Library, Baruch CollegeRyan Phillips, Information Service Librarian, Newman Library, Baruch College