BS/03.1959 ENGLISH ONLY EXPERT COMMITTEE ON BIOLOGICAL STANDARDIZATION Geneva, 17-21 February 2003 Report on the WHO Collaborative Study to Establish an International Standard for HAV RNA Nucleic Acid Amplification Technology (NAT) Assays J Saldanha 1,2 , A Heath 2 , N Lelie 3 , G Pisani 4 and M-Y Yu 5 1 National Institute for Biological Standards and Control, Blanche Lane, South Mimms, Herts. EN6 3 QG, UK; 2 Present address- Canadian Blood Services, 1800 Alta Vista, Ottawa, ON, K1G 4J5; 3 VQC Laboratory, CLB Diagnostic Division, Jan Steenstraat 1, 1816 CT Alkmaar, The Netherlands; 4 Laboratory of Immunology, Istituto Superiore di Sanita, Viale Regina Elena 229, 00161 Rome, Italy; 5 Division of Haematology, OBRR/CBER/FDA, 1401 Rockville Pike, Rockville, MD, USA Summary Sixteen laboratories from ten different countries participated in an international collaborative study to evaluate candidate materials for the first WHO International Standard for hepatitis A virus (HAV) RNA nucleic acid amplification technology (NAT) assays. Five candidate materials were analysed in this study; materials AA and BB were lyophilised, while materials CC, DD and EE were liquid preparations. Samples were diluted in pooled plasma or pooled cryo-poor plasma (sample EE). Serial dilutions of the candidates were tested by each laboratory in four independent assays and the results analysed statistically. The mean log 10 ‘equivalents’/ml were 5.29 for sample AA, 5.07 for sample BB, 4.99 for sample CC, 5.40 for sample DD and 4.08 for sample EE. Based on this study, sample AA is proposed as the first International Standard for HAV RNA NAT assays. The code number of this preparation is 00/560. As each vial of this preparation contains the equivalent of 0.5ml of material, it is proposed that the proposed potency, based on the study of each vial of the proposed International Standard would be 50,000 IU/vial ie which is equivalent to 100,000 International Units (IU)/ml when a vial is reconstituted in 0.5ml
Transcript
BS/03.1959ENGLISH ONLY
EXPERT COMMITTEE ON BIOLOGICAL STANDARDIZATIONGeneva, 17-21 February 2003
Report on the WHO Collaborative Study to Establish anInternational Standard for HAV RNA Nucleic Acid Amplification
Technology (NAT) Assays
J Saldanha1,2, A Heath2, N Lelie3, G Pisani4 and M-Y Yu5
1National Institute for Biological Standards and Control, Blanche Lane, SouthMimms, Herts. EN6 3 QG, UK; 2Present address- Canadian Blood Services, 1800
Alta Vista, Ottawa, ON, K1G 4J5; 3VQC Laboratory, CLB Diagnostic Division, JanSteenstraat 1, 1816 CT Alkmaar, The Netherlands; 4Laboratory of Immunology,
Istituto Superiore di Sanita, Viale Regina Elena 229, 00161 Rome, Italy; 5Division ofHaematology, OBRR/CBER/FDA, 1401 Rockville Pike, Rockville, MD, USA
Summary
Sixteen laboratories from ten different countries participated in an internationalcollaborative study to evaluate candidate materials for the first WHO InternationalStandard for hepatitis A virus (HAV) RNA nucleic acid amplification technology(NAT) assays. Five candidate materials were analysed in this study; materials AA andBB were lyophilised, while materials CC, DD and EE were liquid preparations.Samples were diluted in pooled plasma or pooled cryo-poor plasma (sample EE).Serial dilutions of the candidates were tested by each laboratory in four independentassays and the results analysed statistically. The mean log10 ‘equivalents’/ml were5.29 for sample AA, 5.07 for sample BB, 4.99 for sample CC, 5.40 for sample DDand 4.08 for sample EE. Based on this study, sample AA is proposed as the firstInternational Standard for HAV RNA NAT assays. The code number of thispreparation is 00/560. As each vial of this preparation contains the equivalent of 0.5mlof material, it is proposed that the proposed potency, based on the study of each vialof the proposed International Standard would be 50,000 IU/vial ie which is equivalentto 100,000 International Units (IU)/ml when a vial is reconstituted in 0.5ml
Introduction
Nucleic acid amplification techniques (NAT), such as the polymerase chain reaction(PCR), are now routinely used to screen for viral contaminants of blood and bloodproducts. Such tests can reduce the risk of ‘window-period’ donations (i.e. donationsfrom individuals who have been infected with a blood borne virus but have notseroconvertd at the time of donation). These test complement existing immunoassays,such as anti-HCV and anti-HIV assays and HBsAg assays.
For fractionated blood products, validated viral inactivation steps, such as solvent-detergent treatment and pasteurisation, are included during the manufacturing processto ensure the safety of the final products. International Standards for HCV, HIV-1,HBV and human parvovirus B19 have already been established. The establishment ofthe first International Standard for HCV RNA NAT assays (96/790) in 1997 enabledthe introduction, on 1st July 1999, of the European Medicines Evaluation Agency’s(EMEA) requirement for testing of plasma pools for further manufacture for HCVRNA by NAT with a assay that was able to routinely detect a reagent containing 100IU/ml HCV RNA. Enveloped blood borne viruses, such as HCV, HIV-1 and HBV,are now routinely screened for by serological and NAT assays by the majority ofplasma manufacturers and the current inactivation steps have been shown to beeffective against enveloped viruses.
However, immunoassays for anti-B19 and anti-HAV are not very useful for detectionof these viruses and, moreover, non-enveloped viruses are much more difficult toinactivate than enveloped viruses using current inactivation methods. HAV RNA canbe detected in a few plasma pools and there have been occasional transmissions.Blood product manufacturers have therefore considered the use of NAT assays for thedetection of B19 and HAV in blood. Unlike HCV and HIV-1, for which commercialNAT assays are readily available, for HAV RNA detection in-house assays arepredominant with the accompanying variations in sensitivity and specificity. At the12th SoGAT meeting on 17th November 2000 (SoGAT XII, Draft Minutes, 2000) theworking group decided to establish an International Standard for HAV RNA NATassays. Such a standard would be assigned a defined unitage and could be used tocalibrate the working reagents currently in use. This collaborative study was designedto evaluate five candidate materials and to quantitate the RNA content of each sample.
Materials
Five candidate materials (2 lyophilised and 3 liquid preparations) were analysed inthis study. The two lyophilised materials, AA and BB, were prepared from the samebatch of material (a wild type isolate derived from human plasma) and containedapproximately 105 genome equivalents/ml. The remaining three samples (CC, DD andEE) were all liquid preparations with concentrations of approximately 106 genomeequivalents/ml for CC (CLB, The Netherlands), 105 genome equivalents/ml for DD(ISS, Italy) and 2 x 10⁴ genome equivalents/ml for sample EE (CBER, USA). SampleCC was prepared from HAV extracted from BSC-1 cells infected with HAV strainHM175/18F. Sample DD was prepared from virus isolated from the faeces oftamarins infected with HAV strain HM175. Sample EE was also prepared from a wildtype isolate (derived from human plasma). Samples AA-DD were prepared by
diluting the virus in pooled human plasma while sample EE was diluted in cryo-poorhuman plasma.
Lyophilisation of samples AA and BB.Samples AA and BB were prepared from the same starting material. Briefly,approximately 190ml of high titre HAV RNA was added to 1.9 litres pooled plasma.The plasma was anti-HCV and anti-HIV negative. In addition, PCR assays on theplasma for HCV RNA, HIV-1 RNA, HAV RNA and parvovirus B19 DNA werenegative. The diluted material was divided into two 1 litre aliquots and frozen in dryice. Each 1 litre aliquot was freeze-dried in separate run to give materials AA and BBby Q1 Biotech who are accredited for GLP.
For freeze-drying, one aliquot was thawed at 37oC with agitation until the sample hadjust thawed out. Thereafter, the sample was kept at 0oC. Approximately 2000 vialswere filled with 0.5ml of sample. The cvs of the fill volume for samples AA and BBwere 0.29% and 0.39% respectively.
The vials were supplied by Adelphi Tubes (cat. no. VC002-13C) and were washedwithout detergent prior to sterilisation by oven baking at 180oC for 3 hours. Rubberseals (from Adelphi Tubes, cat. no. FD13) were immersed in 95% ethanol, 5%methanol for a minimum of 1 hour followed by autoclaving. The seals were placed ontop of the filled vials, which were then loaded into the freeze-drier.
The shelves of the freeze-drier were pre-cooled to -40oC prior to loading the vials.The temperature was maintained at -40oC for at least 3 hours in the absence of anyvacuum. After this initial period, a maximum vacuum was applied, whilst maintainingshelf temperature at -40oC, for a period of 90 hours. The condenser temperature wasat or below -70oC. After this period, the temperature was raised from -40oC to +20oCover 20 hours while maintaining maximum vacuum. Once at +20oC, the freeze-dryingchamber was back filled with N2 and the vials sealed within the freeze-drier. Amoisture trap was positioned between the N2 and the freeze-drier to ensure dryness. N2gas with less than 5ppm O2 was used. The vials were removed from the freeze-drier,crimp sealed with aluminum overseals and stored at -20oC.
Design of the StudyParticipants were sent 4 vials of each material which were to be stored at -70oC onreceipt. Participants were requested to reconstitute the two lyophilised preparationsAA and BB in 0.5ml of deionised, RNAse-free water immediately before use. Thevials were to be shaken gently over a period of about 20 minutes to dissolve thecontents. The liquid candidate standards were to be thawed immediately before use.
Participants are requested to perform four independent assays for HAV RNA of thesamples on different days, preferably one week apart using a fresh vial of eachmaterial for each independent assay. For each assay, dilutions of all candidatematerials were to be tested at the same time so that the HAV RNA content of eachpreparation could be determined. Participants were requested to prepare dilutions inthe sample diluent normally used in their assay system.
Qualitative assaysFor the first assay, participants were requested to test ten-fold dilutions of the samplesin order to determine the RNA end-point. In subsequent assays, a minimum of two half-log10 dilutions (1:3.2 dilution) on either side of the end-point (minimum total of fivehalf-log dilutions assayed for each sample) were to be tested in order to obtain a moreaccurate value for the end-point. For all assays, it was sufficient to perform only asingle PCR test for each dilution. However, if a laboratory performed replicate tests,these results were reported separately.
Quantitative assaysParticipants were required to test all samples concurrently, using a fresh vial of materialfor each assay run. If dilutions of the samples were tested, the diluent normally used inthe assay method was recommended.
ParticipantsPanels were sent to 23 laboratories and results were returned by 16 laboratories in 10countries which included 5 EU Official Medicinal Control laboratories (OMCLs), 3reference laboratories, 7 blood product manufacturers and 1 transfusion centre. Thelist of participants is shown in table 1.
Throughout this report, a code number allocated at random and not necessarilyrepresenting the order of listing in table 1 refers to participants. Data sheets and amethod form were provided so that all relevant information could be recorded.
Statistical Methods
For each laboratory and assay method, data from all assays were pooled to give anumber of positive out of number tested at each dilution step. A single “end-point” foreach such dilution series was calculated using the method of maximum likelihood(Collet, 1991). The calculations were carried out using the statistical package GLIM(Francis et al, 1993). This model assumes that the probability of a positive result at agiven dilution follows a Poisson distribution (with the mean given by the expectednumber of “copies” in the sample tested), and that a single “copy” will result in apositive result. The only factor affecting the proportion of positive results is thusassumed to be the diluting out of the sample in the dilution series.
The estimated end-point is the equivalent to the dilution at which there is an averageof a single copy per sample tested, or the dilution at which 63% of samples tested arepositive. The calculated end-point is used to give an estimated “copies per ml” afterfor correcting for equivalent volume of the test sample. The estimates referred to, as“PCR detectable units/ml” are not necessarily directly equivalent to a genuine copynumber/ml or genome equivalent number/ml.
In cases where duplicates have been reported in an assay, they have been treated as iffrom independent assays. For example, a laboratory reporting “++” in each of fourassays would be taken to have a proportion of 8/8 positive overall. Where a single testwas reported as +/- it was treated as positive.
Stability studies on candidate sample AAPreliminary stability studies were done on the lyophilised candidate sample AA. Vialsof the sample were incubated in temperature controlled environments (+4oC, +20oC,+37oC and +45oC), removed at specific times, reconstituted in 0.5ml RNAse-freewater and tested using an in-house LightCycler quantitative assay. The RocheLightCycler RNA Amplification Kit SYBR Green 1was used for amplification anddetection of the samples. RNA was extracted from samples using the QIAamp miniDNA extraction kit with modifications. Vials of sample AA stored at –20oC wereextracted and amplified in parallel. Duplicate samples were extracted and assayed inparallel for each time point/temperature.
Results
Data ReceivedData were received from 16 laboratories. Table 2 summarises the assays used by the16 laboratories. In-house qualitative assays were used by 15 of the laboratories, and aquantitative assay (commercial LightCycler assay) by one laboratory (lab 16). Bothsingle and nested pairs of primers were used and the primers chosen were fromdifferent regions of the genome (table 2). The laboratory mean estimates from thoselaboratories performing qualitative assays are based on the single estimate from the“number positive out of number tested” dilution series, as described in the statisticalmethods. For the quantitative assays from lab 16, the laboratory mean estimate isbased on two assays from each of three ampoules for each sample, and is thus a meanof 6 assays.
Data AnalysisLaboratory 4 obtained a single negative result testing the neat sample EE. Otherresults were all positive down to a 1.0 log10 dilution, and 2/3 positive at 1.5 log10. Thelaboratory noted that the negative result at neat was “probably due to inhibition”. Thissingle negative result was excluded from the calculations. A single negative was alsoobtained for the 1.0 log10 dilution of sample AA, which was not consistent with otherresults (4/4 positive at 2.0 log10 dilution) and gave a statistically poor fit to the data.This single negative result was also excluded from the analysis for sample AA.
Laboratory 8 used a different dilution series from the 0.5 log10 steps requested in thestudy protocol (series of 0.0, 0.7, 1.0, 1.7, 2.0, 2.4, 3.1 and 4.0 log10 were used).Results appeared generally more variable than for other laboratories. All results forsample EE were negative, starting from neat. No estimate for sample EE couldtherefore be obtained. For sample AA, the results from assay 4 appeared inconsistent,giving negatives at 0.7 log10 and subsequent dilutions, whilst assays 1 to 3 werepositive down to and including the 1.7 log10 dilution. The results from assay 4 wereexcluded from the calculations for sample AA. For sample BB, assays 1 to 3 gavenegative results at the 0.7 and 1.0 log10 dilutions, but positive at neat and 1.7 log10.Assay 4 was positive down to 2.4 log10. There was a significantly poor fit to thePoisson model. Only data from the 1.7 log10 and subsequent dilutions were used in thecalculations for sample BB. This laboratory also noted that they had detected PCRinhibitors in samples AA and BB, which may explain the inconsistent results withthese samples.
Estimates of PCR detectable units/ml or genome equivalents/mlThe estimates of PCR detectable units/ml obtained from the qualitative assays, and theestimates of genome equivalents/ml obtained from the quantitative assays are shownin table 3. The estimates are also shown in histogram form in figures 1a – 1e forsamples AA to EE respectively. Each box represents the estimate from one laboratoryand is labeled with the laboratory code number.
From inspection of the figures it is clear that there is considerable variation betweenlaboratories. Some individual laboratories give results that are inconsistent with otherlaboratories. In particular, the results from laboratory 8 are low, especially for samplesCC, DD, and EE (all tests were negative for EE). The results for the quantitativeassays from laboratory 16 are within the range of results obtained from the differentqualitative assays performed by the other laboratories, although they were generally inthe upper half of the overall distribution.
The overall means for each sample are given in table 4, along with the standarddeviation and range of estimates between laboratories. The overall means arepresented with and without the results from laboratory 8. For laboratories thatfollowed the recommended layout for the qualitative assays, 95% confidence intervalsfor an individual laboratory estimate were from around 0.5 log10 to 0.8 log10 PCRdetectable units/ml in overall width. This reflects the degree of uncertainty inherent inany laboratory estimate. Excluding laboratory 8, there is a range of around 2.0 logbetween estimates from the different laboratories. This suggests that the differencebetween laboratories is due in part to real differences in sensitivity between assaymethods, and not just a result of low assay precision.
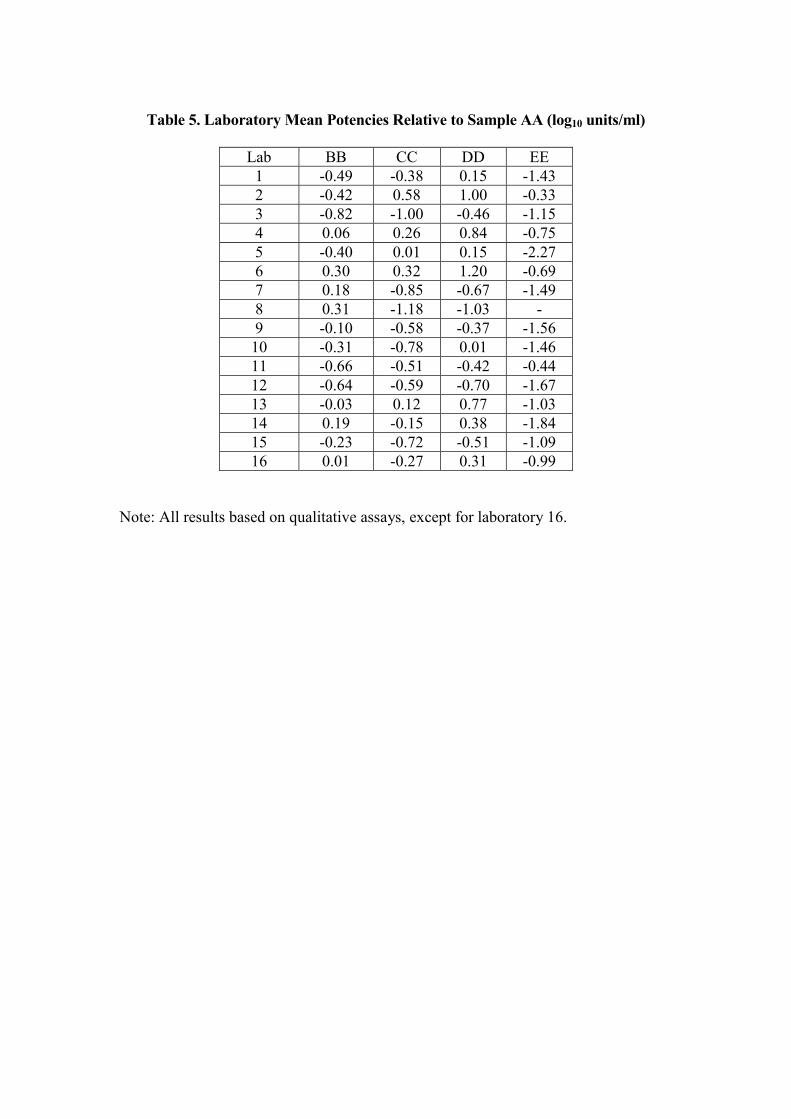
Relative PotenciesThe potencies of samples BB, CC, DD and EE obtained for each laboratory wereexpressed relative to sample AA. The potencies are shown in table 5, and plotted infigures 2a – 2d respectively. The horizontal scale is log10 ‘units’/ml. The overallmeans, along with standard deviations and ranges are given in table 6.
The variation between laboratories has been reduced, with the standard deviations intable 6 being lower than those in table 4, except for sample EE, which is similar.
Stability studies on candidate sample AAThe titres of sample AA analysed at the different temperatures and time points areshown in table 7. Half-log dilutions of samples AA stored at –20oC were amplifiedand used to construct a standard curve from which the titres were calculated. Theconcentration of HAV in sample AA (stored at –20oC) was taken as 105 IU/ml. Thefigures indicate that sample AA is stable at +20oC for at least 1 month with little lossof titre. The material is also stable at +37oC for 1 week. However, at elevatedtemperatures (+37oC and +45oC) the samples became progressively more difficult toreconstitute (more than 8 weeks at +37oC and more than 1 weeks at +45oC). Thefigures indicate a drop in titre with progressive incubation at +20oC, but given theinherent variability in in-house quantitative assays in general further studies arenecessary. The observed drop in titres at higher temperatures may be related toproblems with redissolving the samples rather than to true degradation. The studysuggests that the candidate has acceptable stability. Real time studies on the first HCV
International Standard for NAT assays (96/790) showed no loss of titre over threeyears for samples stored at –20oC (Saldanha et al, In Press). Accelerated degradationand real time stability studies on vials of sample AA stored at +4oC and +20oC arecontinuing.
As for the other NAT International Standards, the Instructions for Use indicate that ifall of the reconstituted material is not used immediately, it may be aliquoted intosuitable volumes and stored at –70oC.
Conclusions and Recommendations
There appears to be an inherent variability in the assays used (all were in-houseassays) and this is reflected in the spread of results. However, comparison with theprevious studies to establish International Standards for HCV RNA, HBV DNA andparvovirus B19 DNA show that the ranges (log10 PCR detectable units/ml or genomeequivalents/ml) are not very different (between log10 1.5-2.5, excluding the outliers ineach study).
The results of the study were discussed by the participants at the fifteenth meeting ofSoGAT on 30th May 2002, in Athens, Greece (SoGAT XV, Draft Minutes, 2002) andthey agreed that sample AA should be recommended as the first HAV RNAInternational Standard and assigned a potency of 50,000 IU/vial which is equivalent to100,000 IU/ml when vials are reconstituted in 0.5ml. It is anticipated that sample BB,which was produced from the same bulk material as the proposed standard, would indue course be considered as the next candidate standard, subject to satisfactoryongoing stability testing.
References
Collet D. 1991. Modeling binary data. Chapman Hall, London
Francis B, Green M and Payne C (eds) 1993. The GLIM system, Release 4 Manual,Oxford Science Publications, Clarendon Press, Oxford
WHO International Working Group on the Standardisation of Genomic AmplificationTechniques for the Virological Safety Testing of Blood and Blood Products (SoGAT)2000. Draft Minutes of the 12th Meeting of 17th November 2000, NIBSC, SouthMimms, UK
Saldanha J, Heath A and the Collaborative Study Group. Collaborative Study toCalibrate HCV Genotypes 2-6 against the HCV International Standard, 96/790(genotype 1), Vox Sanguinis, In Press
WHO International Working Group on the Standardisation of Genomic AmplificationTechniques for the Virological Safety Testing of Blood and Blood Products (SoGAT)2002. Draft Minutes of the 15th Meeting of 30th May 2002, National HellenicResearch Foundation, Athens, Greece
Table 1. List of participants
Dr. J. Albrecht/Dr. K. LoNational Genetics Institute2440 S. Sepulveda Blvd.Suite 135Los Angeles CA 90064USA
A. ClelandSNBTS/PCR UnitRoyal Dick Veterinary SchoolUniversity of EdinburghSummerhall, Edinburgh EH9 1QH UK
Dr. M.ChudyVirology Department/Molecular PathologyPaul Ehrlich InstitutPaul Ehrlich Str. 51-5963225 LangenGermany
Dr. T. Cuypers/ M. KoppelmanCLBPlesmanlaan 1251066 CX AmsterdamThe Netherlands
Dr. R. Fang/Dr. T. SchloitheCSL Bioplasma189-209 Camp RoadBroadmeadowsVictoria 3047Australia
Dr. V. Ferre/Dr. N. AlemanLaboatoire de VirologieCentre Hospitalier Universitaire de Nantes9 Quai Moncousu44093 Nantes CEDEX 1France
Dr. T. GartnerOctapharmaGeorge-Spyer-HausPaul-Ehrlich-Strasse 42-4460596 FrankfurtGermany
Dr. P. GrossBaxter AGMolecular BiologyIndustriestrasse 20A-1220 ViennaAustria
Dr. Y. Katsubayashi/Dr. K. Sotoyama/Dr. N.KimuraQuality Control DepartmentJapanese Red Cross Plasma FractionationCenter1007-31 Izumisawa Chitose Hokkaido 066-8610 Japan
B. Mason/Dr. MW YuFDA/CBERBuilding 29, room 30329 Lincoln DriveBethesda MD 20892USA
Dr. Y. OkadaDept. of Bacterial-Blood ProductsNational Institute of Infectious DiseasesGakuen 4-7-1, Musashimurayama-siTokyo Japan
Dr. G. Pisani/Dr. G. GentiliLaboratory of ImmunologyIstituto Superiore di SanitaViale Regina Elena 22900161 RomeItaly
Prof. Roth/Dr. S BuhrBlutspendedienst Hessen des DRK Molekulare VirusdiagnostikSandhofstrasse 160528 FrankfurtGermany
Dr. J. SaldanhaDivision of VirologyNIBSCBlanche LaneSouth MimmsHerts. EN6 3QG, UK
Dr. I. ThomasScientific Institute of Public Health14 Rue J. Wytsman1050 BrusselsBelgium
Dr. T. WeimerAventis Behring GmbHDepartment of VirologyEmil-von-Behring-Strasse 7635041 Marburg, Germany
Table 2. Protocols used by participants for HAV assays
� Excluding laboratory 8. (N.B. laboratory 8 did not get an estimate for EE, with alltests negative.)
Table 7. Calculated titres (log10 IU/ml) for the samples from the accelerateddegradation study. Duplicate samples (1 and 2) were analysed at various timepoints and temperatures. Log10 –0.5 and –1.0 dilutions were assayed.