Page 1
REPORT
Photonics Ecosystem in Europe
Carried out in collaboration by EPIC and TEMATYS
April 2013
TEMATYS 6, Cité de Trévise - 75009 Paris - France Email: [email protected] EPIC 17, Rue Hamelin - 75016 Paris - France 14 Rue de la Science - 1040 Brussels - Belgium Email: [email protected]
Page 2
EPIC Report April 2013 – page 2
Photonics Ecosystem in Europe
CONTENT
1 EXECUTIVE SUMMARY .......................................................................................... 4
2 OBJECTIVES OF THE STUDY .................................................................................. 5
3 EUROPEAN PHOTONICS INDUSTRY .......................................................................... 6
3.1 Total revenue and staff ................................................................................... 6
3.2 Company size breakdown ................................................................................. 7
3.3 Expected staff growth ..................................................................................... 8
4 STATISTICAL ANALYSIS OF EUROPEAN COMPANIES ..................................................... 9
4.1 Breakdown of European companies along value chains and final markets ....................... 9
4.2 Breakdown of final markets by country .............................................................. 11
4.3 Turnover and Staff Analysis ............................................................................. 12
4.4 Purchase, Manufacturing and Sales Analysis ......................................................... 13
5 OTHER STATISTICAL RESULTS .............................................................................. 16
5.1 Photonics clusters ........................................................................................ 16
5.2 Participation in EU Programs ........................................................................... 17
5.3 Education .................................................................................................. 18
6 CONCLUSION ABOUT THE SURVEY ......................................................................... 19
7 ANNEX: DETAILS ABOUT THE SURVEY .................................................................... 20
Page 3
EPIC Report April 2013 – page 3
Photonics Ecosystem in Europe
FIGURES
Figure 1 : Progress of the study ..................................................................................... 5
Figure 2 : Types of photonics systems with the corresponding European revenues* ...................... 6
Figure 3 : Breakdown of the total number of companies by company size ................................. 7
Figure 4 : Breakdown of the total number of employees by company size ................................. 7
Figure 5 : Expected Photonics Staff Growth by 2015 (Surfaces are proportional to staff) ............... 8
Figure 6 : European Photonics companies across the value chains ........................................... 9
Figure 7 : European Photonics companies by type of systems ................................................. 9
Figure 8 : European Photonics companies by final markets .................................................. 10
Figure 9 : Ratio of Photonics turnover over global turnover ................................................. 10
Figure 10 : Turnover vs. Staff for European companies ...................................................... 12
Figure 11 : Sales performed in Europe ........................................................................... 13
Figure 12 : Manufacturing in Europe ............................................................................. 14
Figure 13 : Purchases in Europe ................................................................................... 14
Figure 14 : Staff, Manufacturing, Purchase and Sales analysis .............................................. 15
Figure 15 : Cluster membership ................................................................................... 16
Figure 16 : Cluster Size Breakdown .............................................................................. 16
Figure 17 : Percentage of organizations participating in EU programs in the last 3 years ............. 17
Figure 18 : Percentage of organizations which consider participating in EU programs ................. 17
Figure 19 : Percentage of students expected to find a job within a year ................................. 18
Figure 20 : Breakdown of respondents by type of organization ............................................. 20
Figure 21 : Breakdown of respondents by country ............................................................. 20
Page 4
EPIC Report April 2013 – page 4
Photonics Ecosystem in Europe
1 EXECUTIVE SUMMARY
Objective
The work carried out in collaboration by EPIC and TEMATYS aims to release European Photonics
Ecosystem Report, Database, and Map.
Main results
European Revenue (2012) 65,8 Billion €
European Staff (2012) 377 000
Expected Staff Growth by 2015 60 000
The main results of the study are the following:
Small companies (<20 empl.) are the seed for the future. They represent 60% of the total
number of companies, 6% of the total employment but 15% of the expected growth.
Medium-size companies (20-500 empl.) are the most important source for employment.
They represent 36% of the total number of companies, 40% of the total employment but 55%
of the expected growth!
Big companies (> 500 empl.) provide a stable base for the industry. They represent only
4% of the total number of companies but 53% of the total employment and 30% of the
expected growth.
Turnover and Staff analysis highlights the high ratio in Photonics companies (between 150
and 250k€/employee) which is mainly linked to a high skilled workforce, and is
homogeneous across all companies.
Breakdown of European companies along value chains and markets are the nice surprises of
the study: Photonics industry in Europe clearly tends to diversify in terms of final
markets and technologies.
Moreover, with manufacturing capacities mainly implemented inside Europe and sales
outside Europe, Photonics industry presents a very competitive aspect, offering strong
potential for sustainable European employment.
Expected benefits
This report highlights the importance and benefit of mapping and statistics on the entire European
Photonics industry by providing:
Shared results for employment, revenues, manufacturing and growth as well as positioning
in key value chains and final markets,
Decision & communication tools for European, national and regional authorities, and for
companies to analyze market deployment, diversification and other new opportunities.
Page 5
EPIC Report April 2013 – page 5
Photonics Ecosystem in Europe
2 OBJECTIVES OF THE STUDY
The objectives of the Mapping of European Photonics are the following:
Analysis of value chains and final markets in Europe,
Statistics on European Photonics companies,
Relevant data for European Policies.
The progress of the study is presented in Figure 1.
Figure 1 : Progress of the study
Page 6
EPIC Report April 2013 – page 6
Photonics Ecosystem in Europe
3 EUROPEAN PHOTONICS INDUSTRY
3.1 TOTAL REVENUE AND STAFF
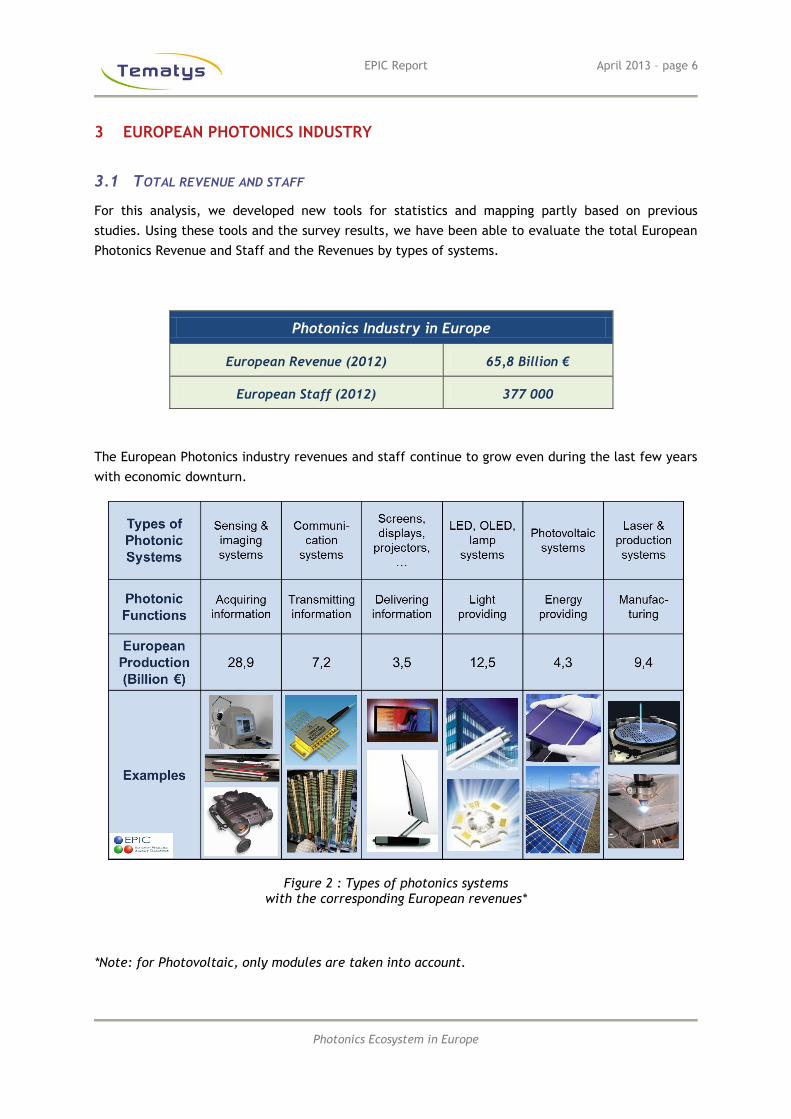
For this analysis, we developed new tools for statistics and mapping partly based on previous
studies. Using these tools and the survey results, we have been able to evaluate the total European
Photonics Revenue and Staff and the Revenues by types of systems.
Photonics Industry in Europe
European Revenue (2012) 65,8 Billion €
European Staff (2012) 377 000
The European Photonics industry revenues and staff continue to grow even during the last few years
with economic downturn.
Figure 2 : Types of photonics systems with the corresponding European revenues*
*Note: for Photovoltaic, only modules are taken into account.
Page 7
EPIC Report April 2013 – page 7
Photonics Ecosystem in Europe
3.2 COMPANY SIZE BREAKDOWN
We present in Figure 3 the breakdown of the total number of Photonics companies (estimated at
3500) and in Figure 4 the breakdown of the total number of employees by company size.
Figure 3 : Breakdown of the total number of companies by company size
Figure 4 : Breakdown of the total number of employees by company size
Very small companies represent 60% of the total while their employees represent 6% of the total
number of employees. On the other hand, big companies represent around 4% of the total while
their employees represent 53% of the total.
Number of Companies
Number of Employees
Page 8
EPIC Report April 2013 – page 8
Photonics Ecosystem in Europe
3.3 EXPECTED STAFF GROWTH
The table below shows the total number of Photonics employees by company size.
Company size
(employees)
Total Number
of Photonics Employees
(2012)
Expected Growth
by 2015
< 20 22 000 40 %
20 - 100 49 000 26 %
100 - 500 105 000 20 %
> 500 201 000 9 %
TOTAL 377 000 60 000
Photonics industry will continue to create jobs at a high rate in the coming years. Note that the rate
of job creation is inversely proportional to the size of the company. Considering the overall number
of job creations, medium-sized companies’ amount is the highest. In addition, small companies
represent 6% of the total employment but 15% of the growth.
Figure 5 : Expected Photonics Staff Growth by 2015 (Surfaces are proportional to staff)
Page 9
EPIC Report April 2013 – page 9
Photonics Ecosystem in Europe
4 STATISTICAL ANALYSIS OF EUROPEAN COMPANIES
4.1 BREAKDOWN OF EUROPEAN COMPANIES ALONG VALUE CHAINS AND FINAL MARKETS
The results concerning the value chain are rather surprising. In particular, the share of Photonics
components is greater than expected (see Figure 6).
Figure 6 : European Photonics companies across the value chains
In Figure 7, we see that the share of sensing and imaging systems together remains the largest,
away from other photonic systems. Moreover, the share of energy providing systems tends to
decrease due to the economic difficulties in this sector.
Figure 7 : European Photonics companies by type of systems
Page 10
EPIC Report April 2013 – page 10
Photonics Ecosystem in Europe
One of the nice surprises of the study is the breakdown of final markets with a fairly uniform
distribution (See Figure 8). This is a clear difference with last results: Photonics industry in Europe
clearly tends to diversify.
Figure 8 : European Photonics companies by final markets
Diversification is a reality for Photonics industry as a whole. But, most of companies stay few
diversified in terms of market (their main market represents more than 50% of their business) and
also in terms of technologies.
Moreover, 58% of companies are specialized in Photonics (>80% of revenues in Photonics). On the
other side, Photonics is a small part of the revenue for 24% of the companies which corresponds to
large and medium-large firms.
Figure 9 : Ratio of Photonics turnover over global turnover
Page 11
EPIC Report April 2013 – page 11
Photonics Ecosystem in Europe
4.2 BREAKDOWN OF FINAL MARKETS BY COUNTRY
We present in the map below the breakdown of final markets by country.
Map: Breakdown of European companies final markets by Country
Page 12
EPIC Report April 2013 – page 12
Photonics Ecosystem in Europe
4.3 TURNOVER AND STAFF ANALYSIS
Figure 10 : Turnover vs. Staff for European companies
Figure 10 compares staff and turnover. We can draw 3 main conclusions.
Strong homogeneity in the turnover-over-staff ratio
The high ratio in Photonics companies (between 150 and 250k€/occupied people) is mainly linked to
a high skilled workforce, and is homogeneous across all companies.
Aggregation point
One area clearly appears in Figure 10, around 30 employees and the corresponding revenues: 5 M€.
This corresponds to a “value gap” in Photonics small companies, from European and techno-driven,
to international and market-driven.
Three main areas
Considering the steps in the value chain, the analysis lay-out:
Final integrators (> 300 employees till 5000, depending on the final market),
Components and systems manufacturers (30 to 300 employees),
Prototyping & test (under 30 employees).
Page 13
EPIC Report April 2013 – page 13
Photonics Ecosystem in Europe
4.4 PURCHASE, MANUFACTURING AND SALES ANALYSIS
We asked companies the percentage of purchase, manufacturing and sales implemented in Europe
and outside Europe. The numbers confirm the high interest of Photonic industry for a sustainable
local growth.
Photonic products are mainly manufactured within Europe, (around 75% of manufacturing
staff of the companies are working in Europe). As sustainable employment in manufacturing
represents a key issue for European growth policies, Photonics industry could play a key role
due to the high level of qualification of the Staff involved in Photonic products and photonic
systems.
Concerning purchases, even if low cost countries develop their market shares on basic
materials and components (filters, glasses, …) even more sophisticated products
(Photovoltaic modules…), around 50% of purchases done by European companies is still
purchased in Europe, guaranteeing durable independency for this industry.
Last but not least, Photonic companies are less exposed to European crisis due to their
strong exposure to foreign markets (more than 50% of sales are done outside Europe in
dynamic markets: mainly Asia and America).
Figure 11 : Sales performed in Europe
Page 14
EPIC Report April 2013 – page 14
Photonics Ecosystem in Europe
Figure 12 : Manufacturing in Europe
Figure 13 : Purchases in Europe
Page 15
EPIC Report April 2013 – page 15
Photonics Ecosystem in Europe
Figure 14 summarizes these data. Compared to older industries, whose manufacturing capacities
and purchases are mainly implemented outside Europe and sales inside Europe, the photonic
industry presents a very competitive aspect, offering strong potential for sustainable European
employment.
Figure 14 : Staff, Manufacturing, Purchase and Sales analysis
Page 16
EPIC Report April 2013 – page 16
Photonics Ecosystem in Europe
5 OTHER STATISTICAL RESULTS
5.1 PHOTONICS CLUSTERS
Figure 15 presents the percentage of organizations that are member of a cluster.
Figure 15 : Cluster membership
The cluster size breakdown is shown in Figure 16.
Figure 16 : Cluster Size Breakdown
Photonics clusters are much diversified: from big clusters to small (often recent) ones.
Page 17
EPIC Report April 2013 – page 17
Photonics Ecosystem in Europe
5.2 PARTICIPATION IN EU PROGRAMS
We present below in Figure 17 the percentage of organizations which participated in EU programs in
the last 3 years and in Figure 18 the percentage which consider participating in EU programs.
The results show that less than one half of companies participated in EU programs while 90% of R&D
organizations participated. More than 80% of organizations consider participating in EU programs
except the resellers.
Figure 17 : Percentage of organizations participating in EU programs in the last 3 years
Figure 18 : Percentage of organizations which consider participating in EU programs
Page 18
EPIC Report April 2013 – page 18
Photonics Ecosystem in Europe
5.3 EDUCATION
We present below the results of the survey for the percentage of students expected to find a job
within a year.
For 71% of respondents, more than half of the students find a job within a year. The situation is
rather good considering that this survey takes place during an economic downturn.
Figure 19 : Percentage of students expected to find a job within a year
Page 19
EPIC Report April 2013 – page 19
Photonics Ecosystem in Europe
6 CONCLUSION ABOUT THE SURVEY
With a short questionnaire, we were able to draft some perspective and key figures of the industry
in terms of:
Turnover, employment, growth,
Manufacturing workforce, sales of the companies,
Positioning in value chains and final markets.
This report highlights the importance and benefit of mapping and statistics on the entire European
Photonics industry by providing very interesting results:
Shared results at the European level for econometric analysis and monitoring of activities:
o Data for Employment, Revenues and Growth from the whole industry,
o Complete data to understand the key value chains and final markets in Europe,
o The first attempt to map specialties by European regions.
Decision Tools:
o For European policy to support technologies considering the capacity of the
European photonics industry to build sustainable jobs around these technologies,
o For clusters towards national and regional authorities to draft strategic roadmap,
considering local strengths,
o For companies to analyze new opportunities for market deployment or
diversification.
Communication tools:
o For European associations, to “market” Photonic companies towards end-users and
integrators,
o For clusters, to help them in policy partnership,
o For companies, as the database and map can be used to improve the visibility of
European Photonics industry.
Page 20
EPIC Report April 2013 – page 20
Photonics Ecosystem in Europe
7 ANNEX: DETAILS ABOUT THE SURVEY
We present below the breakdown of respondents by type of organization and by country. Note that
the total number of answers is: 447.
Figure 20 : Breakdown of respondents by type of organization
Figure 21 : Breakdown of respondents by country