38
www.sintef.no SINTEF Materials and Chemistry Marine Environmental Technology Oil in Ice - JIP REPORT
| Date post: | 31-Aug-2018 |
| Category: |
Documents |
| Upload: | nguyenmien |
| View: | 212 times |
| Download: | 0 times |
www.sintef.no
SINTEF Materials and ChemistryMarine Environmental Technology
Oil in Ice - JIP
REPORT


Funding Partners
R&D Partners
Cooperating Partners
Preface SINTEF has in cooperation with SL Ross Environmental Research Ltd and DF Dickins Associates LLC on behalf of the oil companies AGIP KCO, Chevron, ConocoPhillips, Shell, Statoil and Total initiated an extensive R&D program; Joint industry program on oil spill contingency for Arctic and ice covered waters. This program was a 3-year program initiated in September 2006 and finalized in December 2009.
The objectives of the program were; • To improve our ability to protect the Arctic environment against oil spills. • To provide improved basis for oil spill related decision-making: • To advance the state-of-the-art in Arctic oil spill response.
The program consisted of the following projects: • P 1: Fate and Behaviour of Oil Spills in Ice • P 2: In Situ Burning of Oil Spills in Ice • P 3: Mechanical Recovery of Oil Spills in Ice • P 4: Use of Dispersants on Oil Spills in Ice • P 5: Remote Sensing of Oil Spills in Ice • P 6: Oil Spill Response Guide • P 7: Program Administration • P 8: Field Experiments, Large-Scale Field Experiments in the Barents Sea • P 9: Oil Distribution and Bioavailability
The program has received additional financial support from the Norwegian Research Council related to technology development (ending December 2010) and financial in kind support from a number of cooperating partners that are presented below. This report presents results from one of the activities under this program. Stein Erik Sørstrøm Program Coordinator ([email protected])


2
3
TABLE OF CONTENTS PAGE
1 Introduction ............................................................................................................................4
2 Objectives ................................................................................................................................5 2.1 P1 Oil weathering ...........................................................................................................5 2.2 P2 In situ burning............................................................................................................5
3 Background - Fate and behaviour of oil spills in ice...........................................................6 3.1 The behaviour of oil spill in open water .........................................................................6 3.2 The behaviour of an oil spill in ice .................................................................................6
4 Experimental...........................................................................................................................8 4.1 Background monitoring before and during the oil release..............................................8 4.2 Oil releases....................................................................................................................10
4.2.1 Release conditions.............................................................................................10 4.2.2 Release of 7 m3 Troll crude oil (Slick P1.2,). ...................................................10 4.2.3 Release of 2 m3 Troll crude oil (Slick P1.1) .....................................................11
4.3 Sampling of oil for physical/chemical analysis ............................................................11 4.4 Physical and chemical analysis of sampled oil .............................................................13 4.5 Testing of ignitability of weathered oil.........................................................................13 4.6 In situ burning of free-floating oil in ice.......................................................................14
5 Results and discussion..........................................................................................................15 5.1 Wind and ice drift in the experimental period ..............................................................15 5.2 Weathering of oil spills in ice (Slick P1.2, 7 m3)..........................................................16
5.2.1 Oil release .........................................................................................................16 5.2.2 Spreading of oil in ice .......................................................................................17 5.2.3 Concentrations of oil under ice .........................................................................21 5.2.4 Weathering properties of an oil slick in ice ......................................................22
5.3 Termination of experiment ...........................................................................................24 5.4 In situ-burning of free floating oil slick in ice (P1.1, 2 m3)..........................................25
5.4.1 Spreading of oil in ice .......................................................................................25 5.4.2 Concentrations of oil under ice .........................................................................25
5.5 In situ burning of oil in ice (release P1.1 – 2 m3) .........................................................26 5.6 Collection of residue – quantification of burning effectiveness ...................................28 5.7 Field testing of ignitability using the laboratory burning cell.......................................28
6 Conclusions ...........................................................................................................................30 6.1 Weathering of oil spills in ice .......................................................................................30 6.2 In situ-burning of free floating oil slicks in ice.............................................................30
7 References .............................................................................................................................31
Appendix A: FEX2009 -Weathering properties and ISB effectiveness.................................34

4
1 Introduction The large-scale field experiment (FEX 2009) took place in the marginal ice zone in the Barents Sea north east of Hopen island (N77.6, E30.9) in the period May 9th to May 25th 2009. The experiments involved 3 vessels with ice capabilities, 2 aircrafts, 1 helicopter, 4 remote sensing satellites, 25 scientists and engineers plus a crew of approximately 75 persons on the vessels and aircraft. During the experimental period of 16 days 11 different tests were carried out in 6 different projects. The experiments involved a total release of 20 m3stabilized crude oil. • Of this 11,5 m3 was treated by in situ burning and 2,5 m3 by dispersants. The remaining 7 m3
were used for studying oil weathering in ice and was treated by dispersants at the end of the experiment.
• A total release of 5 m3 of emulsified oil (50 % water content) was used for testing of new technology for mechanical recovery and reused in 4 different experiments.
The trials included studies of oil slick drift, tests of new mechanical recovery equipment (Singsaas et al., 2010), in situ burning of oil in broken ice, use of oil spill dispersants on oil weathered in high ice concentrations (Daling et al., 2010), and remote sensing systems for monitoring of oil spreading among the ice (Babiker et al., 2010). These offshore tests marked the final stage in the R&D program “Joint industry program on oil spill contingency for Arctic and ice covered waters”. The field test demonstrated that ice can assist in confining a spill and reduce further spreading and weathering of oil by acting as a natural boom and protective barrier. The released oil was effectively recovered and treated by combining different response technologies in different ice conditions during the field trial. The field trial also verified the laboratory testing and confirmed a longer "window of opportunity" i.e. the time the different clean-up technologies can be used effectively, compared to an open water scenario. This is an important input in response planning. This report describes the activities connected to studies of weathering properties of oil in ice and in situ burning of free floating oil slicks in ice. Some of the metocean measurements (e.g. wind, temperatures, currents etc.) are also included, but these results will be discussed more in detail in Faksness et al., 2010.
5
2 Objectives The main objectives for the activities included in this report are listed below.
2.1 P1 Oil weathering The main objective has been to generate new knowledge on behaviour of oil spill in ice for a wide range of oil types. This data was used to develop new and improved algorithms describing oil weathering for selected oil-in-ice scenarios. These algorithms have been implemented into the SINTEF oil weathering model in order to give more accurate predictions of oil weathering in ice needed for oil spill contingency planning.
2.2 P2 In situ burning The main objective for the studies of burning properties has been to map ignitability of oil spills as a function of weathering using a wide range of oil types with different properties and chemical composition. This knowledge has been used to implement new algorithms to predict the window of opportunity for in situ burning into the SINTEF Oil Weathering Model (OWM).
6
3 Background - Fate and behaviour of oil spills in ice This chapter contains a brief overview of weathering processes of marine oil spills in open water and in ice. More background material regarding weathering of oil spills in ice and possible response options can be found elsewhere (e.g. Dickins and Buist, 1999, Fingas and Hollebone, 2003, Dickins, 2004 and Brandvik et al., 2006).
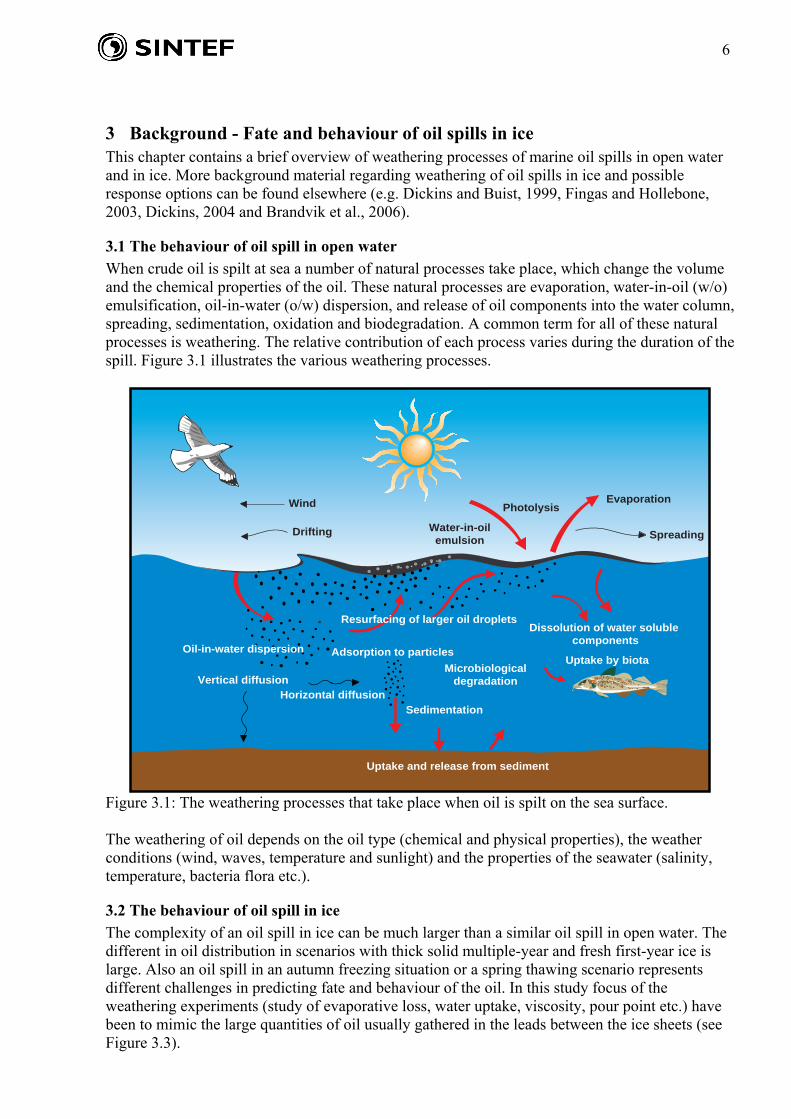
3.1 The behaviour of oil spill in open water When crude oil is spilt at sea a number of natural processes take place, which change the volume and the chemical properties of the oil. These natural processes are evaporation, water-in-oil (w/o) emulsification, oil-in-water (o/w) dispersion, and release of oil components into the water column, spreading, sedimentation, oxidation and biodegradation. A common term for all of these natural processes is weathering. The relative contribution of each process varies during the duration of the spill. Figure 3.1 illustrates the various weathering processes.
Uptake by biota
Dissolution of water soluble components
Sedimentation
Adsorption to particles
Resurfacing of larger oil droplets
Horizontal diffusion
MicrobiologicaldegradationVertical diffusion
Wind
Drifting Water-in-oilemulsion
PhotolysisEvaporation
Spreading
Oil-in-water dispersion
Uptake and release from sediment
Figure 3.1: The weathering processes that take place when oil is spilt on the sea surface. The weathering of oil depends on the oil type (chemical and physical properties), the weather conditions (wind, waves, temperature and sunlight) and the properties of the seawater (salinity, temperature, bacteria flora etc.).
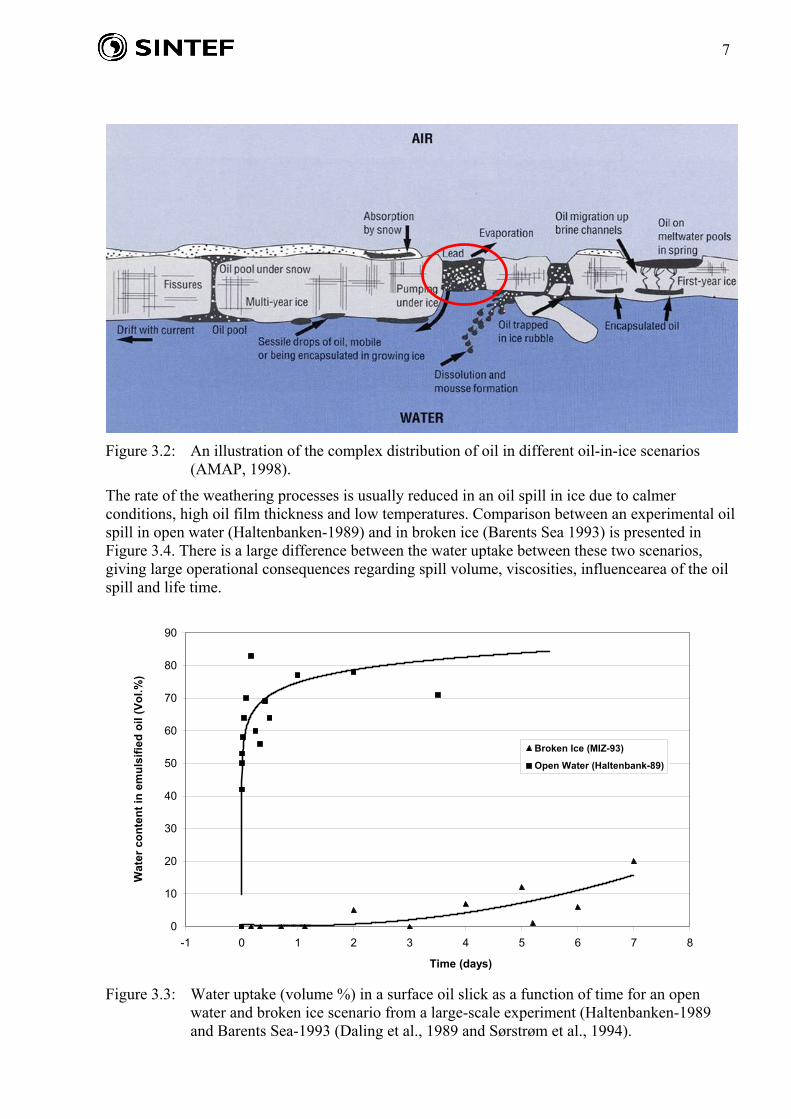
3.2 The behaviour of oil spill in ice The complexity of an oil spill in ice can be much larger than a similar oil spill in open water. The different in oil distribution in scenarios with thick solid multiple-year and fresh first-year ice is large. Also an oil spill in an autumn freezing situation or a spring thawing scenario represents different challenges in predicting fate and behaviour of the oil. In this study focus of the weathering experiments (study of evaporative loss, water uptake, viscosity, pour point etc.) have been to mimic the large quantities of oil usually gathered in the leads between the ice sheets (see Figure 3.3).
7
Figure 3.2: An illustration of the complex distribution of oil in different oil-in-ice scenarios
(AMAP, 1998).
The rate of the weathering processes is usually reduced in an oil spill in ice due to calmer conditions, high oil film thickness and low temperatures. Comparison between an experimental oil spill in open water (Haltenbanken-1989) and in broken ice (Barents Sea 1993) is presented in Figure 3.4. There is a large difference between the water uptake between these two scenarios, giving large operational consequences regarding spill volume, viscosities, influencearea of the oil spill and life time.
0
10
20
30
40
50
60
70
80
90
-1 0 1 2 3 4 5 6 7 8
Time (days)
Wat
er c
onte
nt in
em
ulsi
fied
oil (
Vol.%
)
Broken Ice (MIZ-93)
Open Water (Haltenbank-89)
Figure 3.3: Water uptake (volume %) in a surface oil slick as a function of time for an open
water and broken ice scenario from a large-scale experiment (Haltenbanken-1989 and Barents Sea-1993 (Daling et al., 1989 and Sørstrøm et al., 1994).

8
4 Experimental An overview of the experimental program during field experiments 2009 (FEX2009) is given in Table 4.1 below. The complete field plan is available for more detailed information (Sørstrøm et al., 2009). The names of the different experimental oil releases relate to the different projects they were a part of. In this report the focus is on the following experimental oil releases;
1. P1.1: In situ-burning of free-floating or uncontained oil in ice (2 m3) 2. P1.2: Weathering processes of oil in ice (7 m3)
Table 4.1: Overall time schedule for large-scale field experiments 2009 (FEX 2009) TIME SCHEDULE
Lance Mobilization, Longyearbyen 9 10 11 12 13 14 15 16 17 18 19 20 21 22 23
14 days Transport to position 2 d
P1.1, 2 m3 + burn 3 d
P1.2, 7 m3 50-70% ice 10 d
P4.1, 0,5m3 50-70% ice 6 h
P4.2, 2m3 50-70% ice 1-2 d
P5,Remote sensing 10 d
P9, Proc. .and biology 10 d
Transport to port 2 d
24 - 25
4.1 Background monitoring before and during the oil release Monitoring the background values of relevant environmental parameters was performed before the releases of the experimental oil spills were initiated. This monitoring was performed for 12 hours before the oil was released. Monitoring parameters were:
1. Concentration of water soluble components under the ice: a. Manual water sampling (1 L) – extraction/analysis. b. On-line oil-in-water monitoring (UVF) instruments (3 meters depth under the ice,
three different locations). c. High volume water sampling (100-300 L). d. Semi permeable membrane device (SPMD) simulating adsorption by biota
2. Underwater currents (in two locations, at several different depths). 3. Wind (strength/direction, from metocean station onboard RV Lance). 4. Air/water temperature (from metocean station onboard RV Lance). 5. Waves in the ice field were measured by accelerometers on the ice (1 location). 6. Spreading of oil and ice floes in the experimental area (GPS positioning of 10 ice floes).
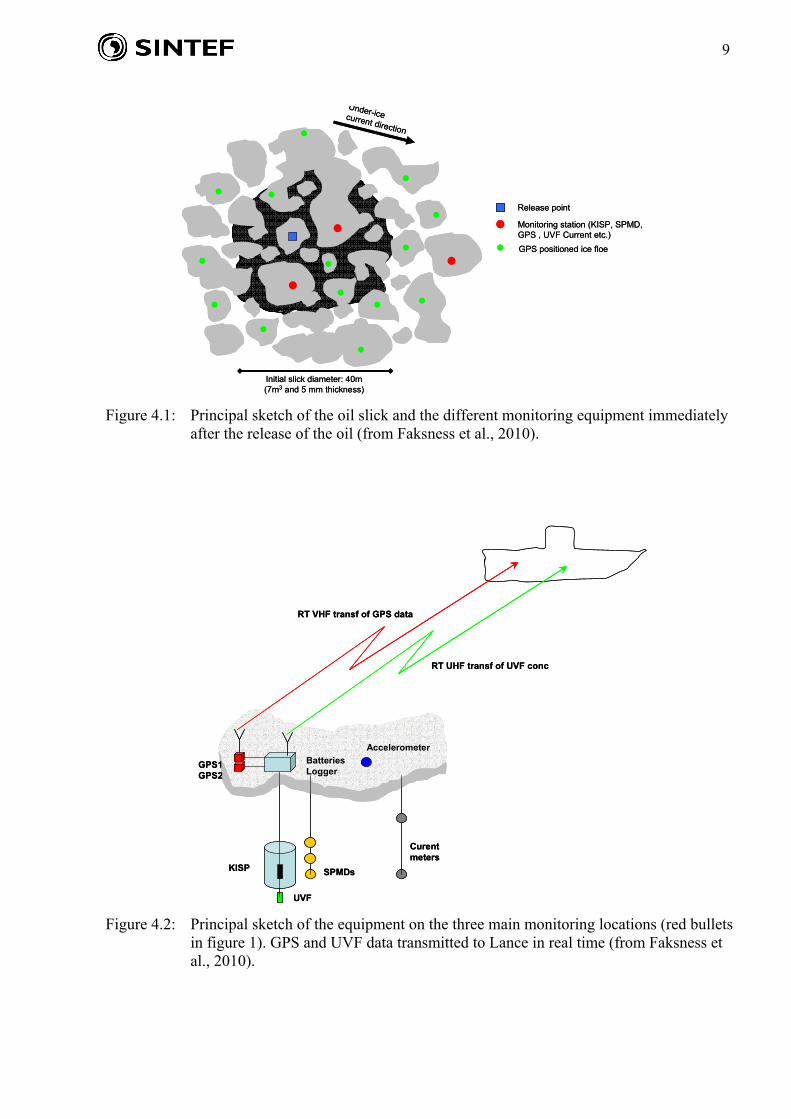
This extensive monitoring was covered by the activity in Project 9 “Oil distribution and bio-availability” within this JIP and is described in more detail in Faksness et al., 2010. An overview of activity 1b and 6 (from the list above) is briefly included in this report, since it is relevant for the weathering processes and in situ burning of free floating oil in ice. The organising of the GPS receivers on the ice relative to the oil slick and a principal sketch of the equipment on the ice are presented in the next two figures (Figure 4.1 and Figure 4.2).
9
Release point
GPS positioned ice floe
Initial slick diameter: 40m (7m3 and 5 mm thickness)
Under-icecurrent direction
Monitoring station (KISP, SPMD, GPS , UVF Current etc.)
Release point
GPS positioned ice floe
Initial slick diameter: 40m (7m3 and 5 mm thickness)
Under-icecurrent direction
Monitoring station (KISP, SPMD, GPS , UVF Current etc.)
Figure 4.1: Principal sketch of the oil slick and the different monitoring equipment immediately
after the release of the oil (from Faksness et al., 2010).
SPMDs
Curentmeters
KISP
UVF
GPS1GPS2
BatteriesLogger
Accelerometer
RT UHF transf of UVF conc
RT VHF transf of GPS data
SPMDs
Curentmeters
KISP
UVF
GPS1GPS2
BatteriesLogger
Accelerometer
RT UHF transf of UVF conc
RT VHF transf of GPS data
Figure 4.2: Principal sketch of the equipment on the three main monitoring locations (red bullets
in figure 1). GPS and UVF data transmitted to Lance in real time (from Faksness et al., 2010).
10
4.2 Oil releases The criteria for the releases are given in the release permit from the Norwegian environmental authorities (SFT, 2009).
4.2.1 Release conditions We were aiming for ice coverage of 50-70%. However, after the oil was released on May 15th, 2009 we had ice coverage of approximately 70-90%, and based on the weather forecast we expected the ice field to open up during the coming week. This did not occur and we experienced higher ice coverage than planned during the experimental period. The field experiment was performed under the following conditions: • Seawater temperature around freezing (-1.8°C). • Air temperature varied between -2 and -10°C. • 24 hours of sunlight at this latitude in May. • Good visibility (no fog), a few light snow showers of 3-4 hours duration. • A wind speed generally between 5-10 m/s, peaking at 15-20 m/s during a passing low
pressure on the 17th and 18th of May. • The horizontal/vertical movement of the ice floes and their pitch and roll was very limited
due to the generally high ice coverage (2-10 cm and 1-2°). • The drift of the ice was large in periods due to strong winds of up to 100 cm/s.
More details regarding the meteorological, oceanographic and ice conditions can be found in Faksness et al., 2010. The oil type used was Troll B crude, which is a naphthenic crude oil with a low pour point. For this reason, no solidification of the oil in the ice was either expected or observed during the field experiment.
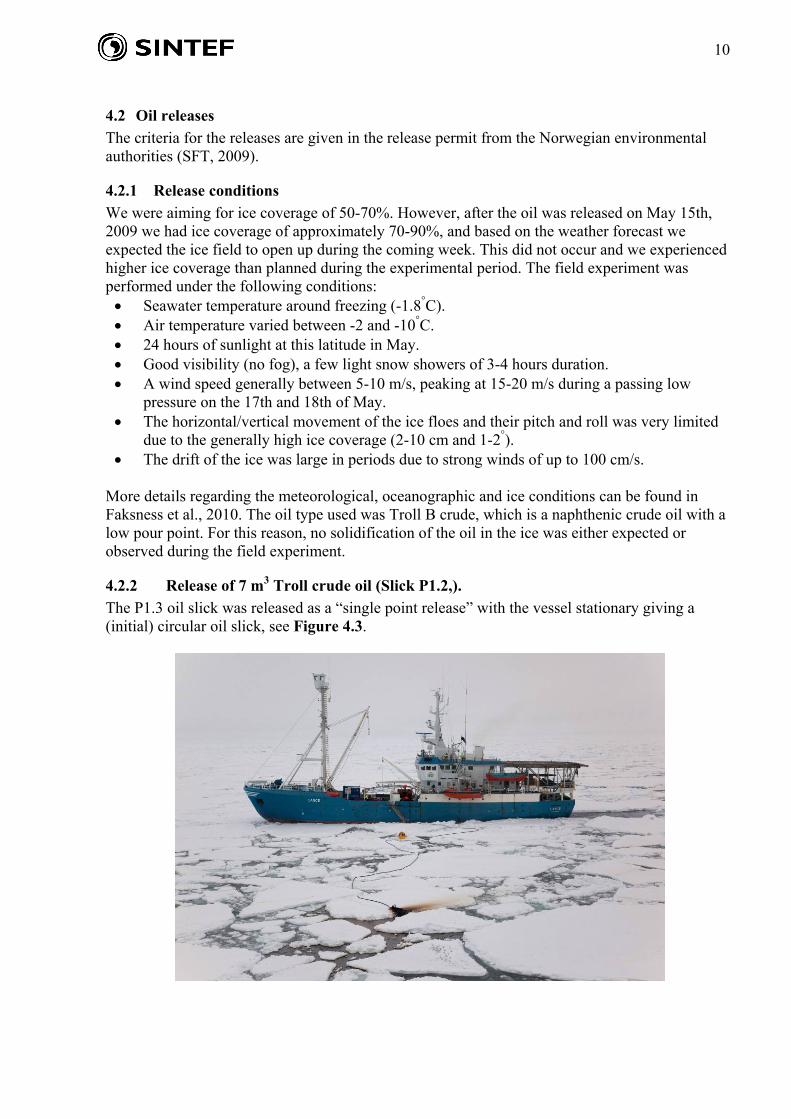
4.2.2 Release of 7 m3 Troll crude oil (Slick P1.2,). The P1.3 oil slick was released as a “single point release” with the vessel stationary giving a (initial) circular oil slick, see Figure 4.3.
11
Figure 4.3: Release of 7 m3 Troll crude oil (Slick P1.2 on May 15th 2009). Both RV Lance, the release hose, the overflow chamber and the initial oil slick in the ice is shown in the figure.
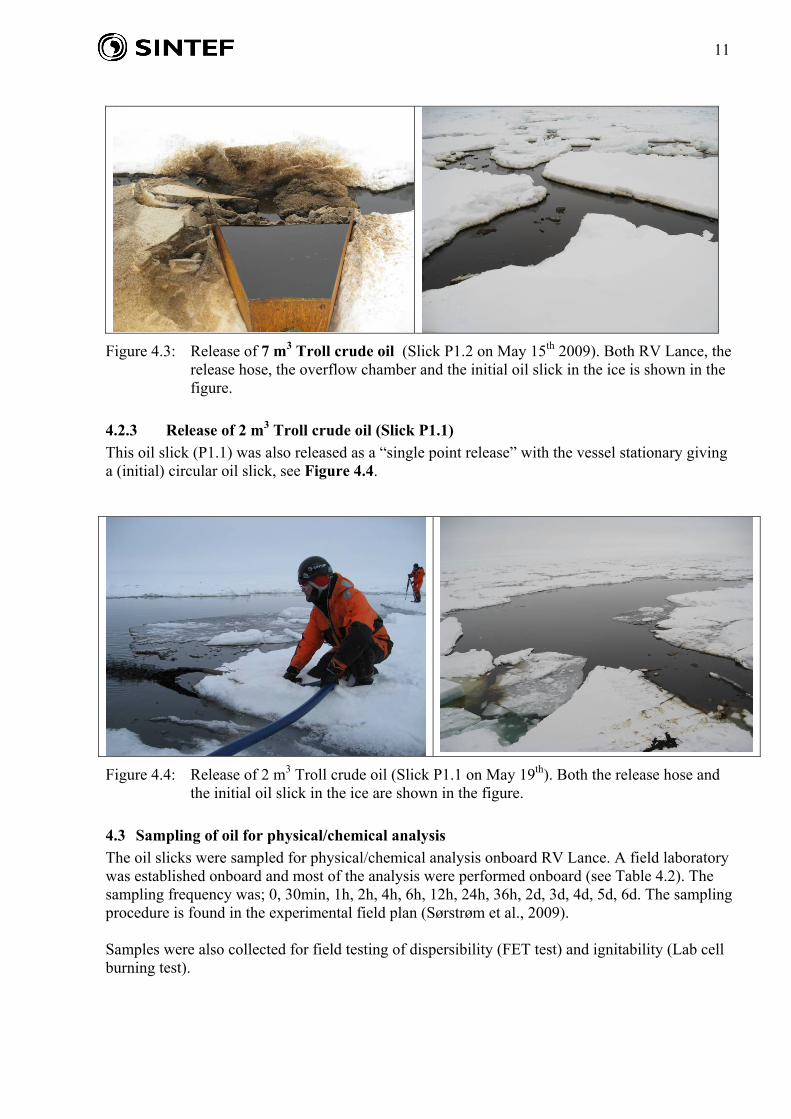
4.2.3 Release of 2 m3 Troll crude oil (Slick P1.1) This oil slick (P1.1) was also released as a “single point release” with the vessel stationary giving a (initial) circular oil slick, see Figure 4.4.
Figure 4.4: Release of 2 m3 Troll crude oil (Slick P1.1 on May 19th). Both the release hose and the initial oil slick in the ice are shown in the figure.
4.3 Sampling of oil for physical/chemical analysis The oil slicks were sampled for physical/chemical analysis onboard RV Lance. A field laboratory was established onboard and most of the analysis were performed onboard (see Table 4.2). The sampling frequency was; 0, 30min, 1h, 2h, 4h, 6h, 12h, 24h, 36h, 2d, 3d, 4d, 5d, 6d. The sampling procedure is found in the experimental field plan (Sørstrøm et al., 2009). Samples were also collected for field testing of dispersibility (FET test) and ignitability (Lab cell burning test).
12
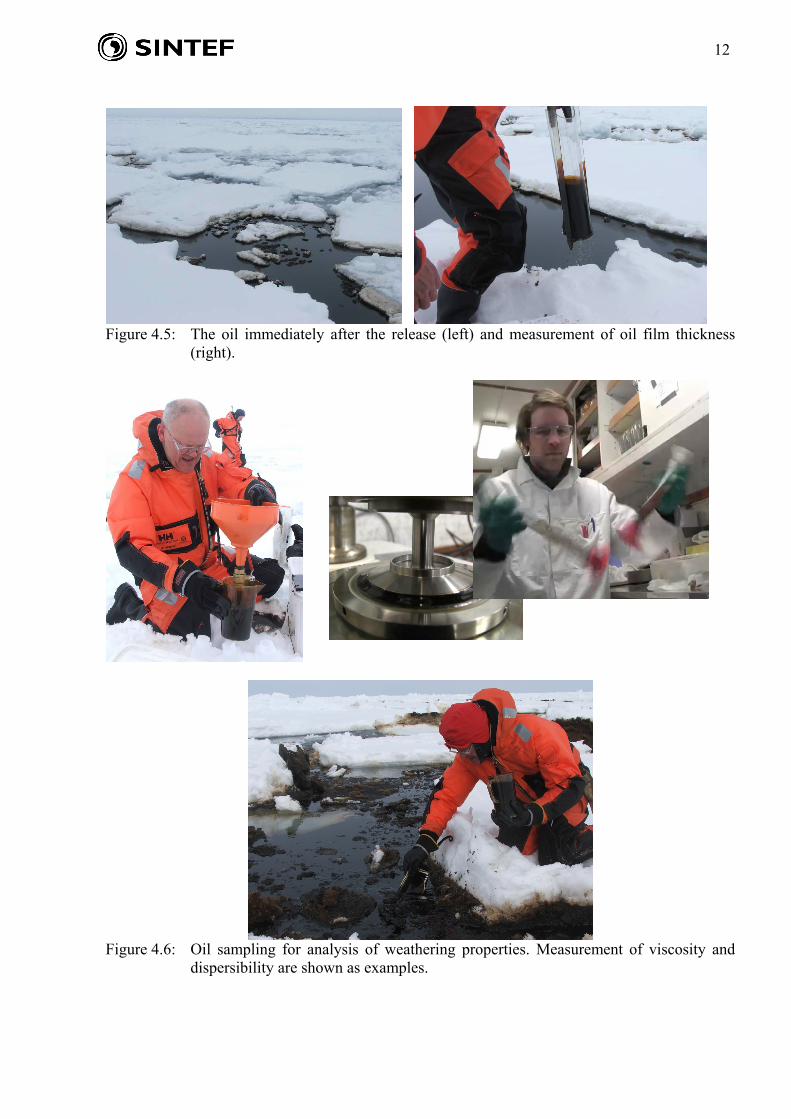
Figure 4.5: The oil immediately after the release (left) and measurement of oil film thickness
(right).
Figure 4.6: Oil sampling for analysis of weathering properties. Measurement of viscosity and
dispersibility are shown as examples.
13
4.4 Physical and chemical analysis of sampled oil
Table 4.2 Physical/chemical properties, units and methods Property Unit Method
Viscosity of weathered oil cP (or mPas) at shear rate 10 or 100 s-1 at 3-6 ºC Daling et al. (2003)
Water content of w/o-emulsion Volume % Daling et al. (2003) Density of water free oil g/ml at 15.5 ºC ASTM D4052-91 Evaporative loss Weight % Daling et al. (2003) Flash point of water free oil ºC ASTM D93-90 Pour point of water free oil ºC ASTM D97-87
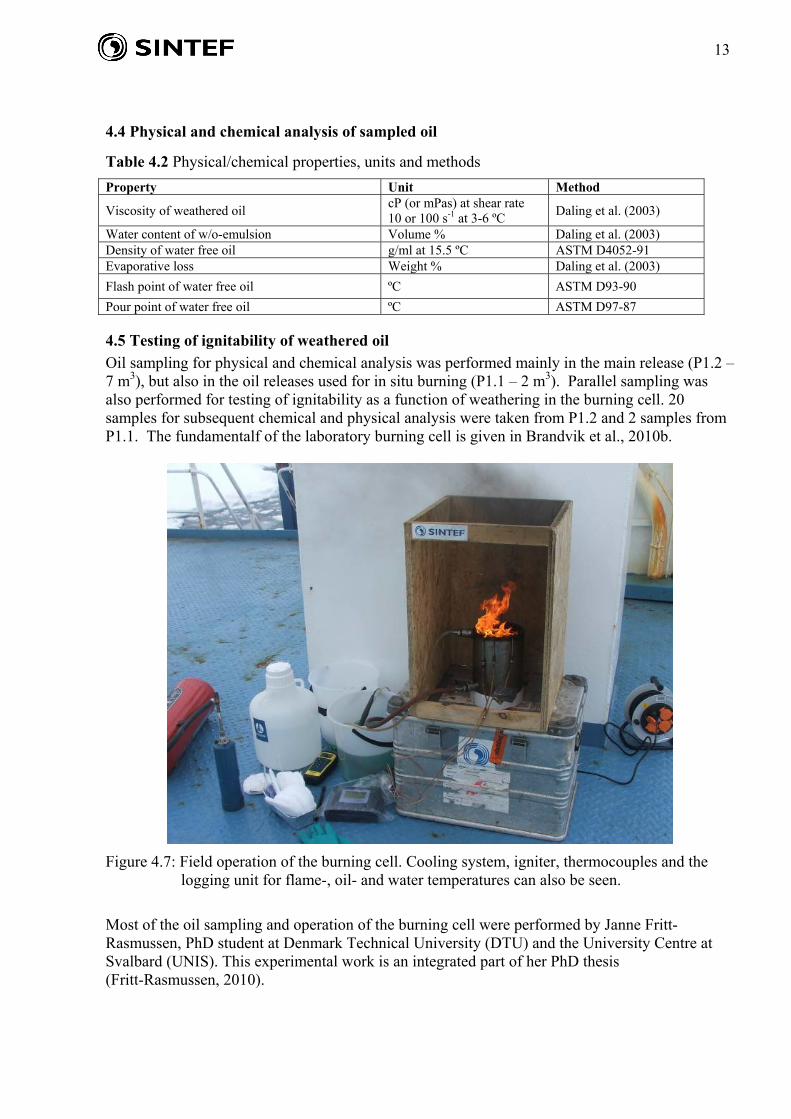
4.5 Testing of ignitability of weathered oil Oil sampling for physical and chemical analysis was performed mainly in the main release (P1.2 – 7 m3), but also in the oil releases used for in situ burning (P1.1 – 2 m3). Parallel sampling was also performed for testing of ignitability as a function of weathering in the burning cell. 20 samples for subsequent chemical and physical analysis were taken from P1.2 and 2 samples from P1.1. The fundamentalf of the laboratory burning cell is given in Brandvik et al., 2010b.
Figure 4.7: Field operation of the burning cell. Cooling system, igniter, thermocouples and the
logging unit for flame-, oil- and water temperatures can also be seen.
Most of the oil sampling and operation of the burning cell were performed by Janne Fritt-Rasmussen, PhD student at Denmark Technical University (DTU) and the University Centre at Svalbard (UNIS). This experimental work is an integrated part of her PhD thesis (Fritt-Rasmussen, 2010).

14
4.6 In situ burning of free-floating oil in ice The thick parts of the oil slick (several millimetres) were ignited with plastic bags (500 ml) with gelled gasoline added 4% emulsion breaker (Alcopol O60). The plastic bags were ignited with a hand held butane burner. Personnel safety is always important when performing in situ burning of oil spills in ice. A “safe job analysis” was performed before the oil was burned to discuss and agree on wind direction, safe distances, safety zones and evacuation routes out of the area. Alaska Clean Seas (ACS) operational manual for in situ burning operations was used as a basis for this operation. This manual is prepared for ACS by SL Ross Environmental Research. The helicopter was also in the air all times during the burning operation and could be called upon for assistance.
15
5 Results and discussion The main results from the weathering and in situ burning activities during the field experiments in 2009 (FEX2009) are included in this section. Burning of oil in fire-resistant booms is described in a separate report (Potter and Buist, 2010) and the details regarding operational aspects are covered by the field report (Sørstrøm et al., 2010a).
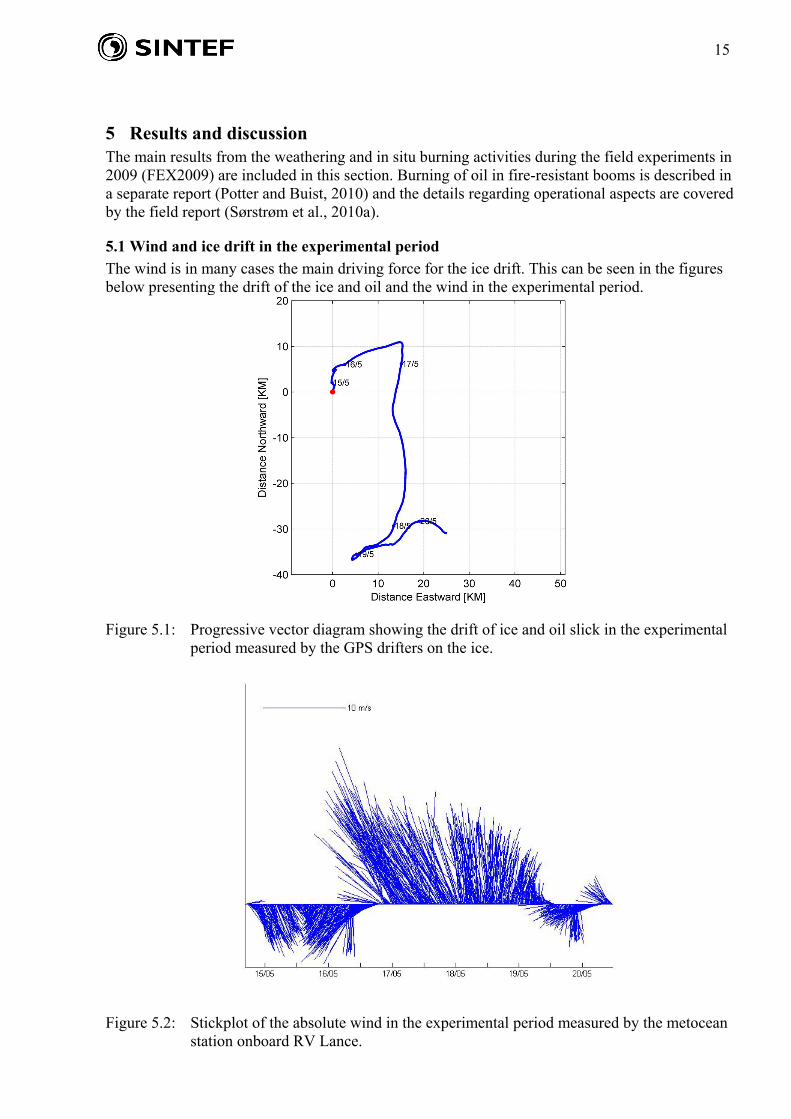
5.1 Wind and ice drift in the experimental period The wind is in many cases the main driving force for the ice drift. This can be seen in the figures below presenting the drift of the ice and oil and the wind in the experimental period.
Figure 5.1: Progressive vector diagram showing the drift of ice and oil slick in the experimental
period measured by the GPS drifters on the ice.
Figure 5.2: Stickplot of the absolute wind in the experimental period measured by the metocean station onboard RV Lance.
16
5.2 Weathering of oil spills in ice (Slick P1.2, 7 m3) The P1.2 experimental oil slick was the largest oil release during the field experiment (FEX2009) and was mainly used to study weathering processes, oil drift and spreading. This main oil spill was also used for remote sensing of oil in ice from satellites and airplanes (Babiker et al., 2010).
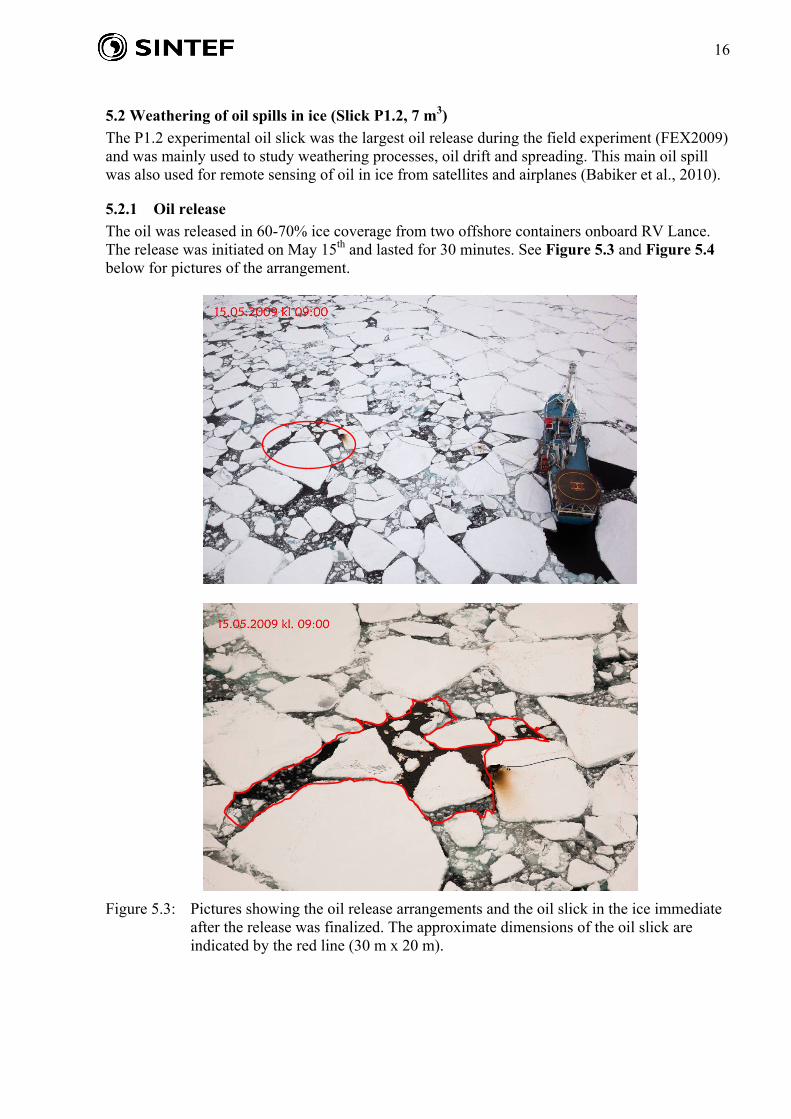
5.2.1 Oil release The oil was released in 60-70% ice coverage from two offshore containers onboard RV Lance. The release was initiated on May 15th and lasted for 30 minutes. See Figure 5.3 and Figure 5.4 below for pictures of the arrangement.
Figure 5.3: Pictures showing the oil release arrangements and the oil slick in the ice immediate
after the release was finalized. The approximate dimensions of the oil slick are indicated by the red line (30 m x 20 m).
17
G10
G9
G8
G7
G6
G5G4
G3
G2
G1
77,9180
77,9185
77,9190
77,9195
77,9200
77,9205
30,9330 30,9350 30,9370 30,9390 30,9410 30,9430 30,9450 30,9470
Longitude (East)
Latit
ude
(Nor
th)
GPS
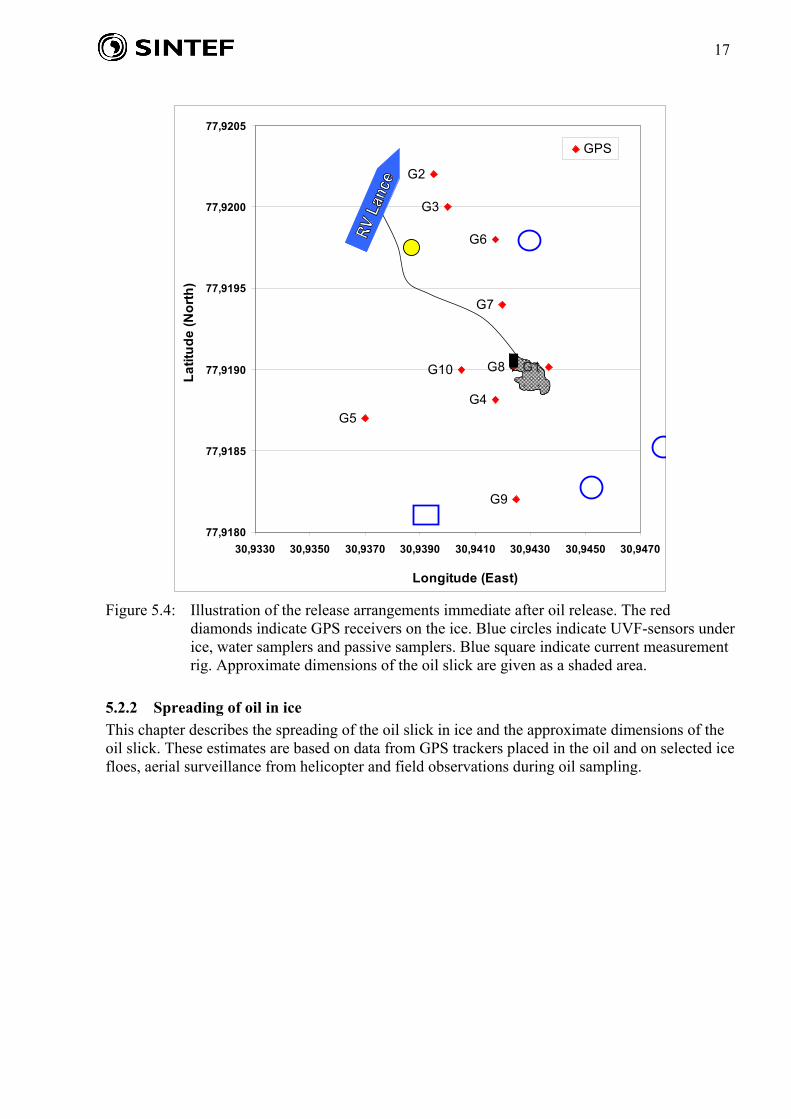
Figure 5.4: Illustration of the release arrangements immediate after oil release. The red
diamonds indicate GPS receivers on the ice. Blue circles indicate UVF-sensors under ice, water samplers and passive samplers. Blue square indicate current measurement rig. Approximate dimensions of the oil slick are given as a shaded area.
5.2.2 Spreading of oil in ice This chapter describes the spreading of the oil slick in ice and the approximate dimensions of the oil slick. These estimates are based on data from GPS trackers placed in the oil and on selected ice floes, aerial surveillance from helicopter and field observations during oil sampling.

18
G1
G3 G4
G5
G7 G8
G9
G10
77,9715
77,9720
77,9725
77,9730
77,9735
77,9740
77,9745
77,9750
77,9755
31,4382 31,4403 31,4424 31,4445 31,4466
Longitude (East)
Latit
ude
(Nor
th)
GPS
100 meter
Figure 5.5: 1 day after the oil release (May 16th 2009): The red diamonds indicate GPS receivers
on the ice. Blue circles indicate UVF-sensors, water samplers and passive samplers. Blue square indicate current measurement rig. Approximate dimensions of the oil slick are given as a shaded area.
19
G1G3
G4
G5
G8G9
G10
77,8342
77,8352
77,8362
77,8372
77,8382
77,8392
77,8402
31,4898 31,4918 31,4938 31,4958 31,4978 31,4998
Longitude (East)
Latit
ude
(Nor
th)
GPS
300 meter
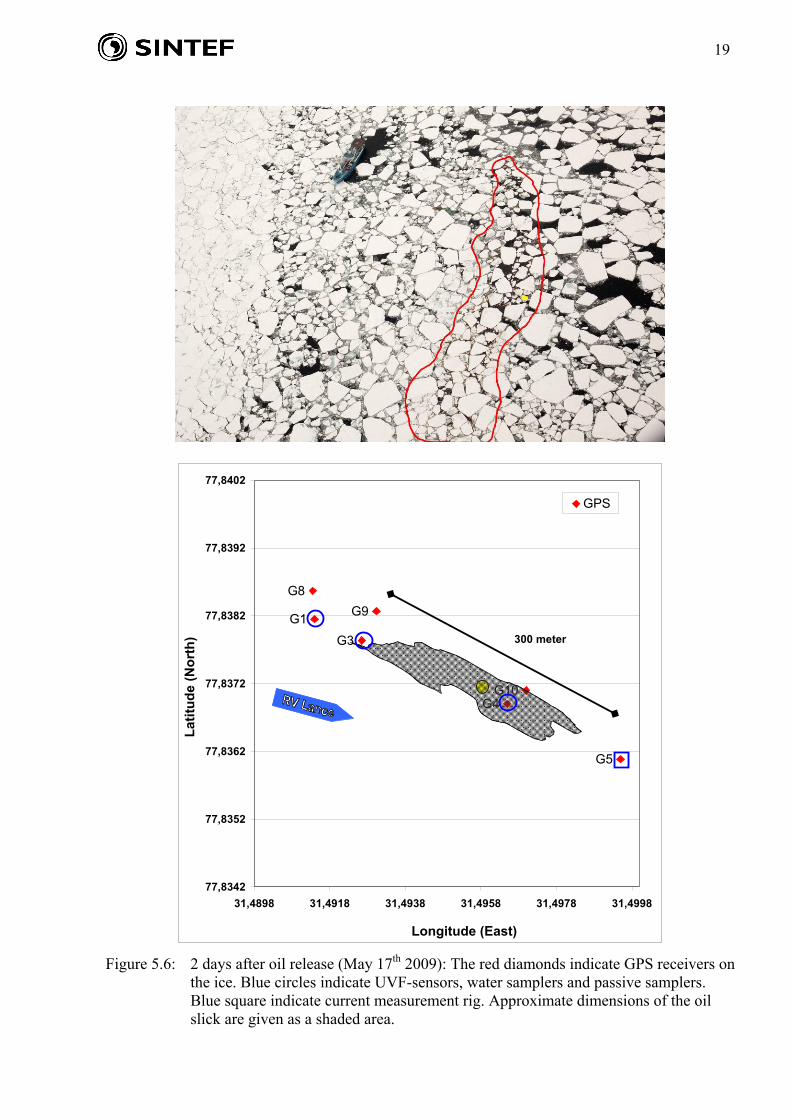
Figure 5.6: 2 days after oil release (May 17th 2009): The red diamonds indicate GPS receivers on
the ice. Blue circles indicate UVF-sensors, water samplers and passive samplers. Blue square indicate current measurement rig. Approximate dimensions of the oil slick are given as a shaded area.

20
G1G3
G4
G5
G8
G9
G10
77,6030
77,6050
77,6070
77,6090
77,6110
77,6130
77,6150
77,6170
77,6190
31,4548 31,4598 31,4648 31,4698 31,4748 31,4798 31,4848
Longitude (East)
Latit
ude
(Nor
th)
GPS
1000 meter
Figure 5.7: 3 days after oil release (May 18th 2009): The red diamonds indicate GPS receivers on
the ice. Blue circles indicate UVF-sensors, water samplers and passive samplers. Blue square indicate current measurement rig. Approximate dimensions of the oil slick are given as a shaded area.
21
G10
G8
G7
G5
G4G1
77,5790
77,5800
77,5810
77,5820
77,5830
77,5840
77,5850
77,5860
77,5870
77,5880
77,5890
77,5900
31,8300 31,8400 31,8500 31,8600 31,8700 31,8800 31,8900 31,9000
Longitude (East)
Latit
ude
(Nor
th)
GPS
3000 meter
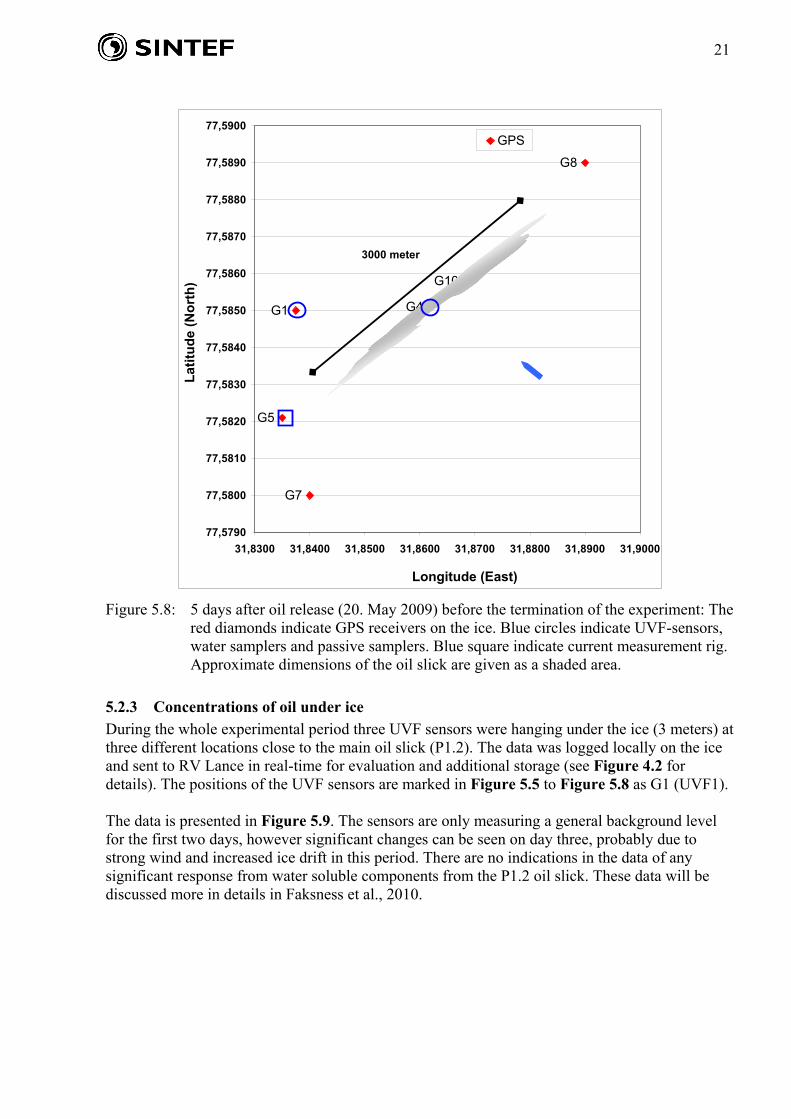
Figure 5.8: 5 days after oil release (20. May 2009) before the termination of the experiment: The
red diamonds indicate GPS receivers on the ice. Blue circles indicate UVF-sensors, water samplers and passive samplers. Blue square indicate current measurement rig. Approximate dimensions of the oil slick are given as a shaded area.
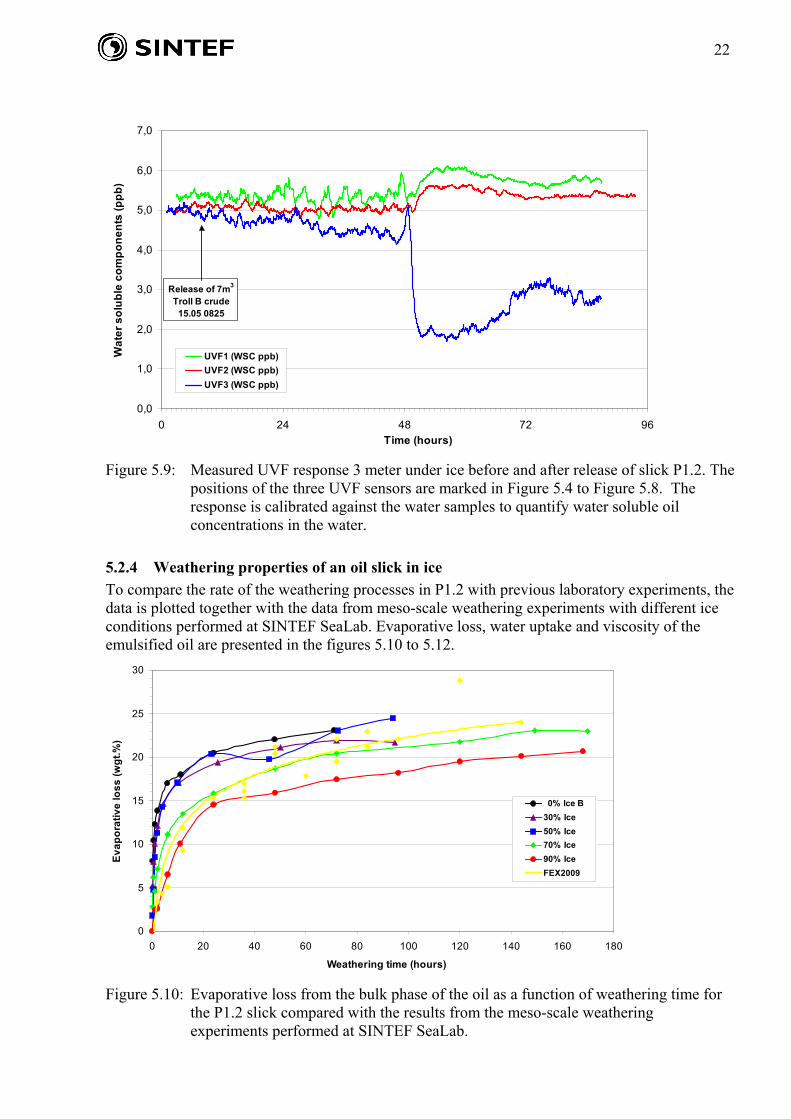
5.2.3 Concentrations of oil under ice During the whole experimental period three UVF sensors were hanging under the ice (3 meters) at three different locations close to the main oil slick (P1.2). The data was logged locally on the ice and sent to RV Lance in real-time for evaluation and additional storage (see Figure 4.2 for details). The positions of the UVF sensors are marked in Figure 5.5 to Figure 5.8 as G1 (UVF1). The data is presented in Figure 5.9. The sensors are only measuring a general background level for the first two days, however significant changes can be seen on day three, probably due to strong wind and increased ice drift in this period. There are no indications in the data of any significant response from water soluble components from the P1.2 oil slick. These data will be discussed more in details in Faksness et al., 2010.
22
0,0
1,0
2,0
3,0
4,0
5,0
6,0
7,0
0 24 48 72Time (hours)
Wat
er s
olub
le c
ompo
nent
s (p
pb)
96
UVF1 (WSC ppb)UVF2 (WSC ppb)UVF3 (WSC ppb)
Release of 7m3
Troll B crude15.05 0825
Figure 5.9: Measured UVF response 3 meter under ice before and after release of slick P1.2. The
positions of the three UVF sensors are marked in Figure 5.4 to Figure 5.8. The response is calibrated against the water samples to quantify water soluble oil concentrations in the water.
5.2.4 Weathering properties of an oil slick in ice To compare the rate of the weathering processes in P1.2 with previous laboratory experiments, the data is plotted together with the data from meso-scale weathering experiments with different ice conditions performed at SINTEF SeaLab. Evaporative loss, water uptake and viscosity of the emulsified oil are presented in the figures 5.10 to 5.12.
0
5
10
15
20
25
30
0 20 40 60 80 100 120 140 160 18
Weathering time (hours)
Evap
orat
ive
loss
(wgt
.%)
0
0% Ice B30% Ice50% Ice70% Ice90% IceFEX2009
Figure 5.10: Evaporative loss from the bulk phase of the oil as a function of weathering time for
the P1.2 slick compared with the results from the meso-scale weathering experiments performed at SINTEF SeaLab.
23
0
10
20
30
40
50
60
70
80
90
100
0 20 40 60 80 100 120 140 160 180
Weathering time (hours)
Wat
er c
onte
nt (
vol.%
) 0% Ice30% Ice50% Ice70% Ice90% IceFEX2009
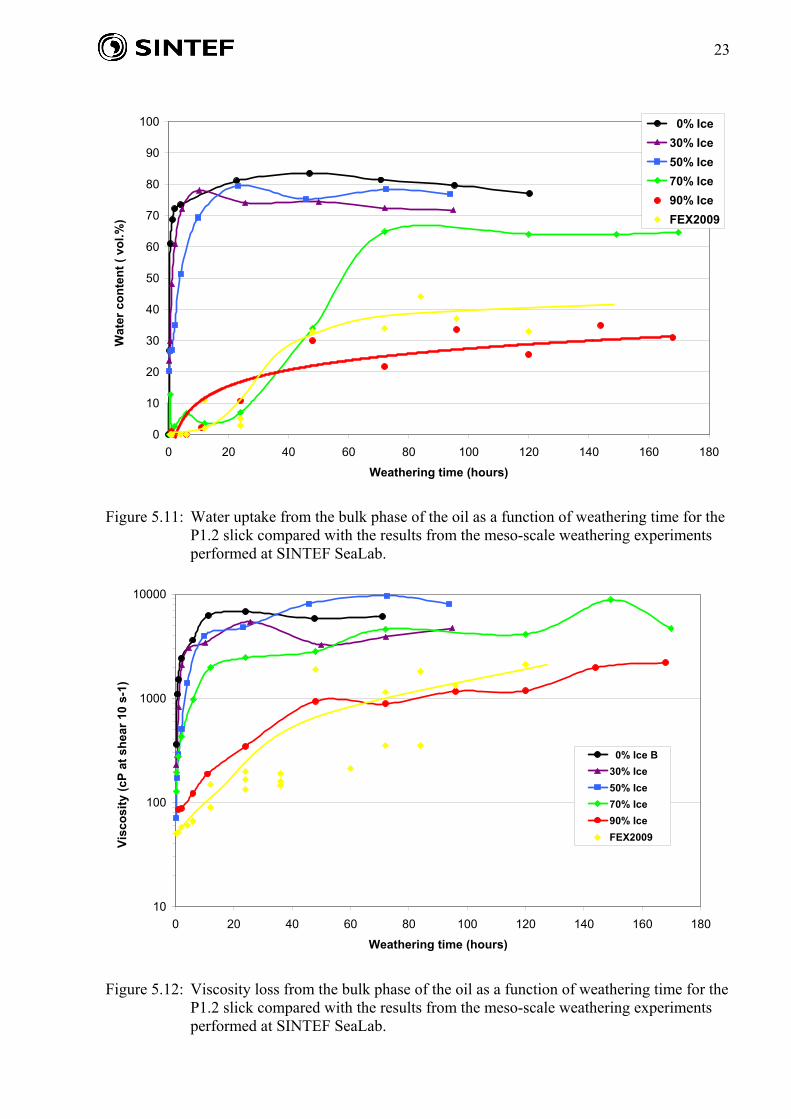
Figure 5.11: Water uptake from the bulk phase of the oil as a function of weathering time for the P1.2 slick compared with the results from the meso-scale weathering experiments performed at SINTEF SeaLab.
10
100
1000
10000
0 20 40 60 80 100 120 140 160 180
Weathering time (hours)
Visc
osity
(cP
at s
hear
10
s-1)
0% Ice B30% Ice50% Ice70% Ice90% IceFEX2009
Figure 5.12: Viscosity loss from the bulk phase of the oil as a function of weathering time for the P1.2 slick compared with the results from the meso-scale weathering experiments performed at SINTEF SeaLab.

24
5.3 Termination of experiment The main strategy for the termination of the P1.2 experiment was to collect the remaining part of the oil slick by mechanical recovery. However, after six days the oil was so mixed with slush that both mechanical recovery and in situ burning were evaluated as not effective. Reference is made to the 2009 field report for details (Sørstrøm et al., 2010a). For this reason the remaining oil was treated with dispersant. Additional energy was added by the side thrusters on RV Lance and by the water jet from a MOB boat operated from RV Lance. The dispersant was applied very successfully from RV Lance with a new manoeuvrable spray arm. This new application platform was developed as a part of this JIP (see Daling et al., 2010 for details).
25
5.4 In situ-burning of free floating oil slick in ice (P1.1, 2 m3) This chapter describes the results from an in situ burning experiment of free floating oil slick in ice performed during the large-scale field experiments.
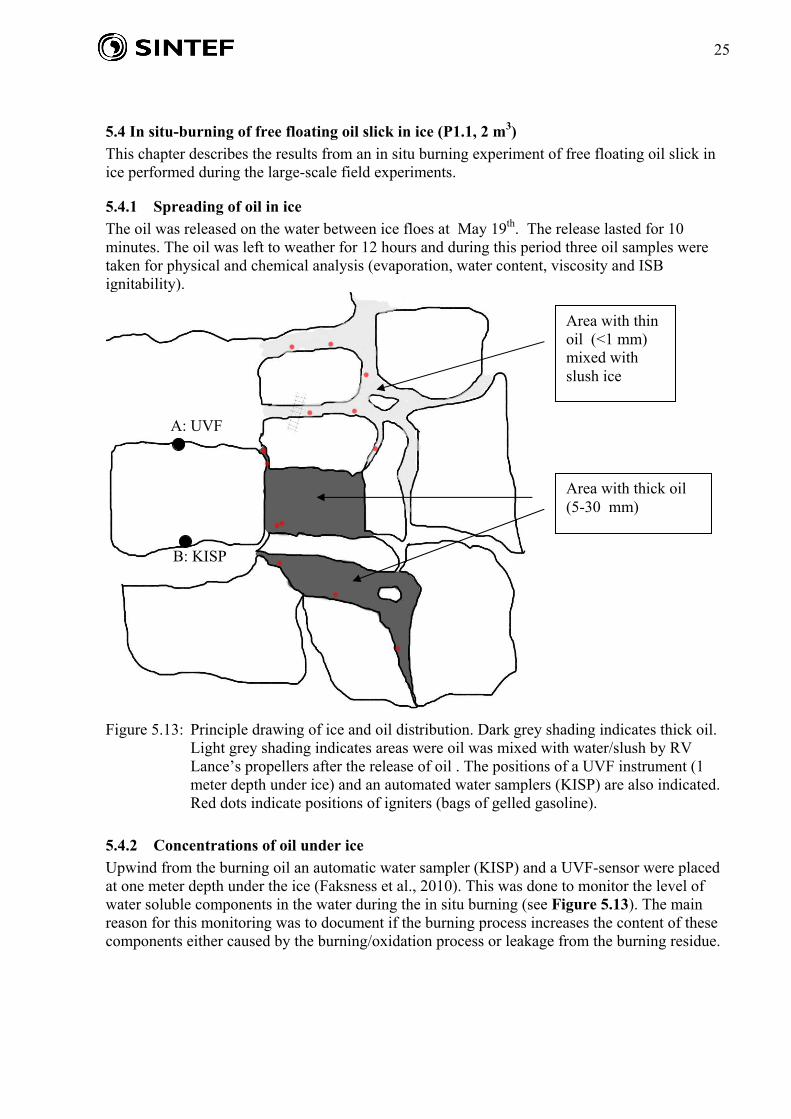
5.4.1 Spreading of oil in ice The oil was released on the water between ice floes at May 19th. The release lasted for 10 minutes. The oil was left to weather for 12 hours and during this period three oil samples were taken for physical and chemical analysis (evaporation, water content, viscosity and ISB ignitability).
Area with thin oil (<1 mm) mixed with slush ice
Figure 5.13: Principle drawing of ice and oil distribution. Dark grey shading indicates thick oil. Light grey shading indicates areas were oil was mixed with water/slush by RV Lance’s propellers after the release of oil . The positions of a UVF instrument (1 meter depth under ice) and an automated water samplers (KISP) are also indicated. Red dots indicate positions of igniters (bags of gelled gasoline).
5.4.2 Concentrations of oil under ice Upwind from the burning oil an automatic water sampler (KISP) and a UVF-sensor were placed at one meter depth under the ice (Faksness et al., 2010). This was done to monitor the level of water soluble components in the water during the in situ burning (see Figure 5.13). The main reason for this monitoring was to document if the burning process increases the content of these components either caused by the burning/oxidation process or leakage from the burning residue.
Area with thick oil (5-30 mm)
A: UVF
B: KISP
26
0,0
1,0
2,0
3,0
4,0
5,0
6,0
7,0
96 102 108 114 120Time (hours since release of P1.2)
Wat
er s
olub
le c
ompo
nent
s (p
pb)
UVF1 (WSC ppb)
Release of 2m3 for ISB ISB of 2m3
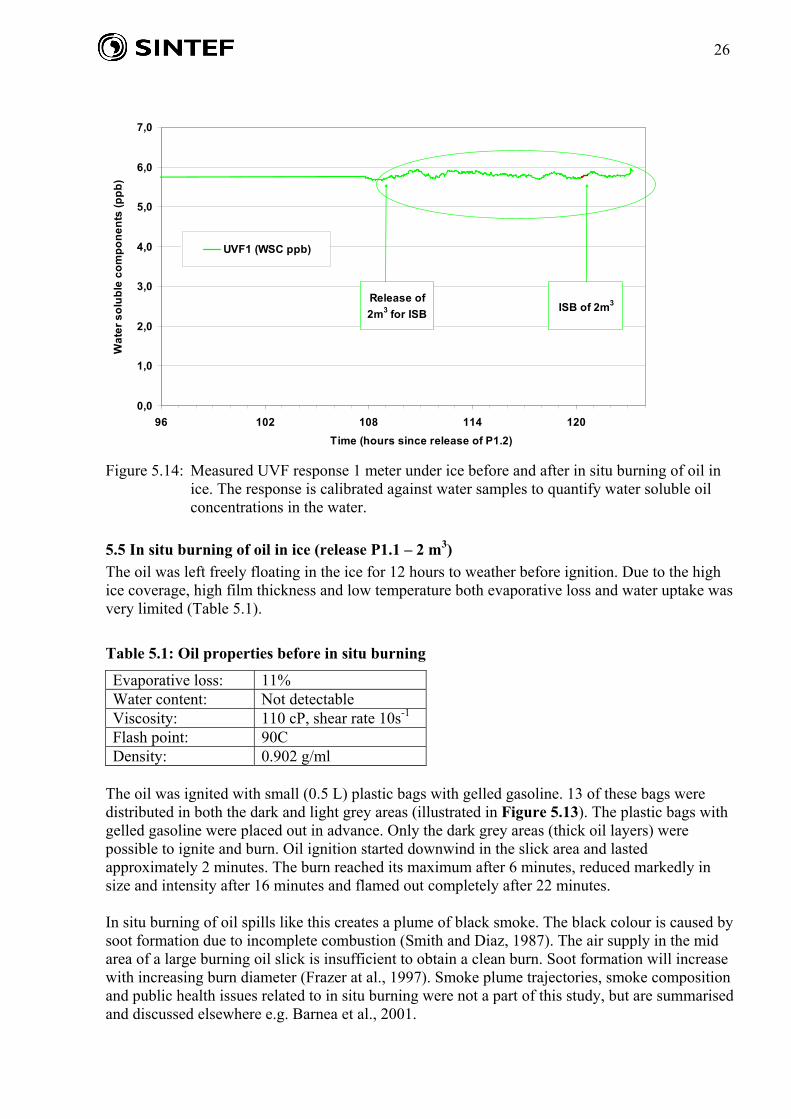
Figure 5.14: Measured UVF response 1 meter under ice before and after in situ burning of oil in
ice. The response is calibrated against water samples to quantify water soluble oil concentrations in the water.
5.5 In situ burning of oil in ice (release P1.1 – 2 m3) The oil was left freely floating in the ice for 12 hours to weather before ignition. Due to the high ice coverage, high film thickness and low temperature both evaporative loss and water uptake was very limited (Table 5.1).
Table 5.1: Oil properties before in situ burning
Evaporative loss: 11% Water content: Not detectable Viscosity: 110 cP, shear rate 10s-1 Flash point: 90C Density: 0.902 g/ml
The oil was ignited with small (0.5 L) plastic bags with gelled gasoline. 13 of these bags were distributed in both the dark and light grey areas (illustrated in Figure 5.13). The plastic bags with gelled gasoline were placed out in advance. Only the dark grey areas (thick oil layers) were possible to ignite and burn. Oil ignition started downwind in the slick area and lasted approximately 2 minutes. The burn reached its maximum after 6 minutes, reduced markedly in size and intensity after 16 minutes and flamed out completely after 22 minutes. In situ burning of oil spills like this creates a plume of black smoke. The black colour is caused by soot formation due to incomplete combustion (Smith and Diaz, 1987). The air supply in the mid area of a large burning oil slick is insufficient to obtain a clean burn. Soot formation will increase with increasing burn diameter (Frazer at al., 1997). Smoke plume trajectories, smoke composition and public health issues related to in situ burning were not a part of this study, but are summarised and discussed elsewhere e.g. Barnea et al., 2001.

27
Figure 5.15: In situ burning of 2m3 weathered free floating Troll B in high ice coverage. The total
burn time was 22 minutes. The picture is taken after eleven minutes and is representative for peak intensity.
Figure 5.16: After collection of residue the area was treated with bark to immobilise any small
quantities of remaining residue. The waste bags with collected residue and adsorption pads can also be seen in the photo.
28
5.6 Collection of residue – quantification of burning effectiveness After the in situ burning was completed and the residue and the area in general were cooled down, the work collecting the residue was initiated. The residue from naphtenic crudes like Troll B does not solidify even at this low temperature due to the low wax content. The liquid nature of the residue was a challenge for the collection of the residue using adsorption pads. After the residue was collected, the area was treated with adsorbents (pine bark) to immobilise any small volumes of remaining residue (see figure Figure 5.16) left in the area. A rough estimate of the amount of residue left, when leaving the area is 3%, in this case 60 litres. This unrecoverable volume of residue consists of small pockets or droplets of oil melted into the edges of the ice floes. Based on the amount of collected residue, the in situ burning effectiveness was calculated to approximate 95%.
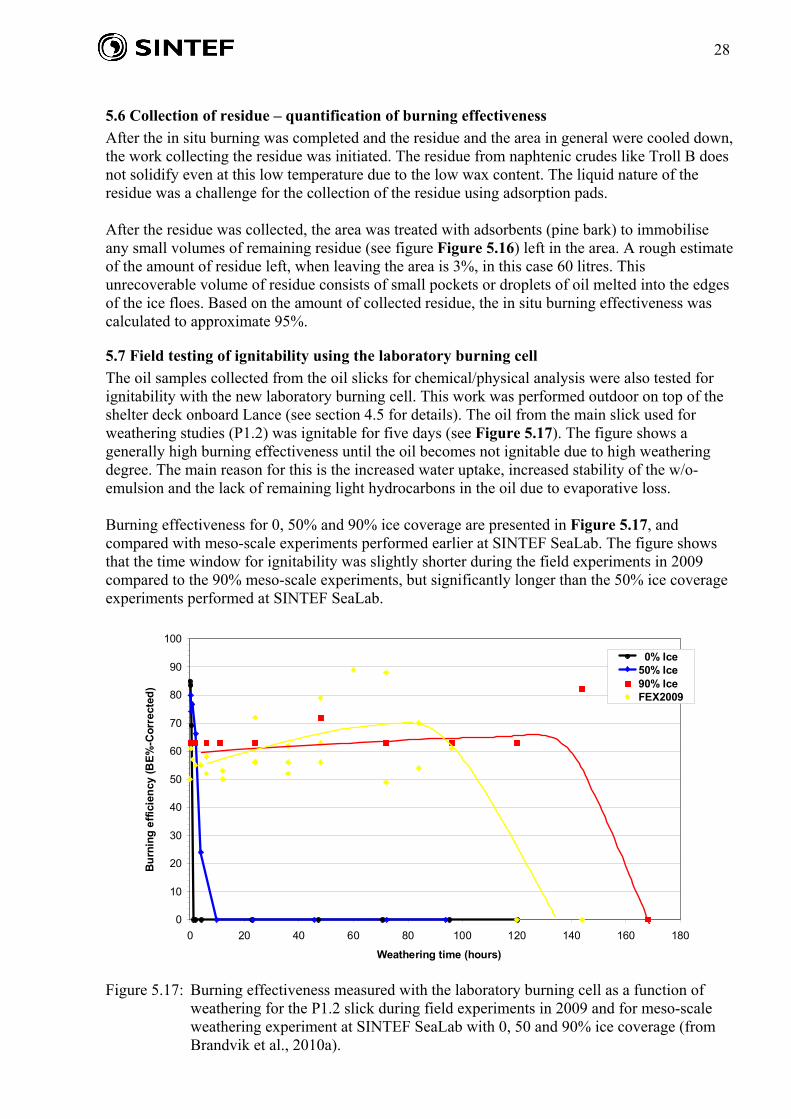
5.7 Field testing of ignitability using the laboratory burning cell The oil samples collected from the oil slicks for chemical/physical analysis were also tested for ignitability with the new laboratory burning cell. This work was performed outdoor on top of the shelter deck onboard Lance (see section 4.5 for details). The oil from the main slick used for weathering studies (P1.2) was ignitable for five days (see Figure 5.17). The figure shows a generally high burning effectiveness until the oil becomes not ignitable due to high weathering degree. The main reason for this is the increased water uptake, increased stability of the w/o-emulsion and the lack of remaining light hydrocarbons in the oil due to evaporative loss. Burning effectiveness for 0, 50% and 90% ice coverage are presented in Figure 5.17, and compared with meso-scale experiments performed earlier at SINTEF SeaLab. The figure shows that the time window for ignitability was slightly shorter during the field experiments in 2009 compared to the 90% meso-scale experiments, but significantly longer than the 50% ice coverage experiments performed at SINTEF SeaLab.
0
10
20
30
40
50
60
70
80
90
100
0 20 40 60 80 100 120 140 160 18
Weathering time (hours)
Bur
ning
effi
cien
cy (B
E%-C
orre
cted
)
0
0% Ice50% Ice90% IceFEX2009
Figure 5.17: Burning effectiveness measured with the laboratory burning cell as a function of
weathering for the P1.2 slick during field experiments in 2009 and for meso-scale weathering experiment at SINTEF SeaLab with 0, 50 and 90% ice coverage (from Brandvik et al., 2010a).

29
The main objective with the laboratory burning cell is not to measure absolute values for burning effectiveness (BE%), but to measure if the weathered oil is ignitable or not. The absolute burning effectiveness measured with the burning cell is dependant on both the design of the cell and experimental conditions. The data generated is used to predict the time window for in situ burning as a function of weathering, see Brandvik et al., 2010b for details. Figure 5.18 below shows how the ignitability of the weathered oil in the P1.2 slick drops from “Ignitable” after four days (96 hours) and becomes “NOT Ignitable” after 5 days. Similar measurements of Ignitability from meso-scale experiments with Troll B from SINTEF Sealab are also shown in the figure below.
0
100
0 20 40 60 80 100 120 140 160 180
Weathering time (hours)
0% Ice50% Ice90% IceFEX2009
Ignitable N
OT Ignitable
Figure 5.18: Ignitability measured with the laboratory burning cell as a function of weathering for
the P1.2 slick and meso-scale basin experiments with 0, 50 and 90% ice coverage. The absolute numbers, which are a function of conditions in the cell, are replayed with the classification “Ignitable” or “NOT Ignitable”.
The measured ignitability and burning effectiveness from the large scale field experiments both with the large oil slick (P1.2, 7 m3) and the smaller slick (P1.1, 2 m3) show good correlation with corresponding results from the meso scale basing studies performed at SINTEF SeaLab (0%, 50% and 90% ice coverage).
30
6 Conclusions The main conclusions from the weathering and in situ burning of uncontained oil slick from the field experiment in 2009 are presented below.
6.1 Weathering of oil spills in ice • Strong wind (10-15 m/s) on the third day gave a drift of the dense ice field of approximately
40 km/day. This illustrates the dynamics even in oil-in-ice scenarios with high ice coverage (70-90 ice coverage).
• In situ measurements of water soluble components around the oil captured in ice indicate no increase in the levels of petrogenic hydrocarbons.
• Weathering properties from the large-scale experiment performed in the Barents Sea have been compared to results from meso-scale basin experiments performed at SINTEF Sea Lab.
• Comparison showed that field data from Barents Sea (70-90% ice coverage) corresponds well with data from the meso-scale basin at similar ice coverage (evaporative loss, water uptake and viscosity of emulsified oil).
• This confirms that the results from the oil in ice weathering experiments performed in the meso-scale basins can be interpreted as reflecting realistic conditions.
• The extensive data from the basins studies are described in a separate report (Brandvik et al., 2010a) and is used to improve SINTEF Oil Weathering Model’s capability to predict weathering properties of oil spills in ice.
• This study verifies earlier findings and confirms that weathering of oil in ice is significantly slower compared to weathering in open water.
• The reduced weathering gives enhanced response effectiveness and extended window of opportunity for several response methods (especially dispersants and in situ burning).
The metrological, oceanographic and environmental monitoring data are discussed more in details in Faksness et al., 2010.
6.2 In situ-burning of free floating oil slicks in ice • A new laboratory cell for testing ignitability of weathered oil samples has been developed as
a part of this oil in ice JIP. • The laboratory burning cell has been used to test ignitability versus weathering for a wide
range of oil types to generate data for predicting the time window for using in situ burning. • Testing of ignitability on the main experimental oil slick (P1.2, 7 m3) showed that the oil
was ignitable up to day five. This was also confirmed by trying to ignite the oil in the ice on day 5.
• The smaller oil slick (P1.1, 2 m3) was ignitable in the laboratory cell after 12 hours and was ignited and burned with high effectiveness in the ice.
• Comparison with ignitability measured during weathering experiments in meso scale basins show good correlation with the findings from field experiments.
• The time window for ignitability was slightly shorter during field experiments compared to the 90% ice-scenario in meso-scale basin at SINTEF SeaLab, but significantly longer than the 50% ice coverage experiments performed at SINTEF SeaLab.
• These results verifies that ignitability of a large scale oil spill in ice can be related to the classification from the burning cell (Ignitable or NOT ignitable).
• This observation is in agreement with earlier studies verifying classifications from the laboratory burning cell by burning experiments in larger scale (200-450 L) performed at SINTEFs field research station in Svea, Svalbard.

31
The work with constructing and verification of the laboratory burning cell is described in details in another oil in ice JIP report (Brandvik et al., 2010b).
7 References AMAP, 1998: Arctic Pollution Issues. ISBN 82-7655-061-4. Arctic Monitoring and Assessment
Programme (AMAP), Oslo, Norway. Babiker, M., K. Kloster and S. Sandven 2010: The utilisation of satellite images for the oil in ice
experiment in the Barents Sea in May 2009. Oil in Ice JIP Report no: 29. SINTEF, Trondheim, Norway.
Barnea, N., Holloway, C., Kirn, L., Orme, P. 2001: A Case Study in Public Health Risk
Assessment and Communication During the New Carissa In Situ Burning. Proceedings of the 2001 Oil Spill Conference, API publication No. 4710, American Petroleum Institute, Washington, D.C., 79-83 pp, 2001.
Brandvik, P.J., Sørheim, K.R., Singsaas, I. and Reed, M. 2006: Short state-of-the-art report on oil
spills in ice-infested waters. JIP report no: 1, SINTEF Trondheim, Norway, 2006. Brandvik, P.J., Myrhaug J.L., Daling, P.S., Leirvik, F. and Fritt-Rasmussen, J. 2010a: Meso-scale
weathering of oil as a function of ice conditions, oil properties, dispersibility and in situ burnability of weathered oil as a function of time. Oil in Ice JIP Report no: 19. SINTEF, Trondheim, Norway.
Brandvik et al., 2010b: Using a small-scale laboratory burning cell to measure ignitability for in-
situ burning of oil spills as a function of weathering. AMOP 2010, in Preparation. Daling, P.S., P.J. Brandvik and I.K. Almås, 1989: Weathering of surface oil- experimental oil spill
at Haltenbanken, 1989. Data report SINTEF/IKU report no 22.1934.00/03/89. Trondheim, Norway.
Daling P.S., M.Ø. Moldestad, Ø. Johansen, A. Lewis and J. Rødal, 2003: Norwegian Testing of
Emulsion properties at Sea - The importance of Oil Type and Release Conditions, Spill Science & Technology Bulletin, 8:2: 123-136, 2003
Daling, P.S., A. Holumsnes, C. Rasmussen, P.J. Brandvik and F. Leirvik 2010: Development and
testing of a containerized dispersant spray system for use in cold and ice-covered area. Oil in Ice JIP Report no: 12. SINTEF, Trondheim, Norway.
Dickins, D.F., 2004: Advancing Oil Spill Response in Ice Covered Waters, report prepared by DF
Dickins Associates Ltd. for the Prince William Sound Oil Spill Recovery Institute (OSRI), Cordova, AK (published in conjunction with the US Arctic Research Commission, Washington, DC).
Dickins, D.F. and Buist, I, 1999: Oil Spill Countermeasures for Ice Covered Waters. Journal of
Pure and Applied Chemistry, Vol. 71, No.1, London. Faksness, L-G, R.L. Daae, and P.J.Brandvik, 2010: “Monitoring of Oil in Water and MetOcean
Interactions During a Large Scale Oil in Ice Experiment in the Barents Sea”. In Proceedings of the Thirty-third AMOP Technical Seminar on Environmental Contamination and Response, Environment Canada, Ottawa, Ontario (in Press).

32
Fingas, M.F., and Hollebone, B.P. 2003: Review of Behaviour of Oil in Freezing Environments.
Marine Pollution Bulletin 47, 333-340. Fraser, J., Buist, I., and Mullin, J. V., 1997: Review of the Literature on Soot Production During
In Situ Burning of Oil. Arctic and Marine Oilspill Program (AMOP) Technical Seminar, 20th. Volume 2. Proceedings. June 11-13, 1997, Vancouver, British Columbia, Canada, Environment Canada, Ottawa, Ontario, 1365-1405 pp, 1997.
Fritt-Rasmussen, J, 2010: Ignitability and In-situ burning effectiveness of oil spills as a function of
oil type and weathering. PhD-thesis at the Arctic Technology Center, Denmarks Technical University, Copenhagen, Denmark (in Preparation).
Potter S. and I. Buist 2010: Test of fire-resistant boom in low concentrations of drift ice. Oil in Ice
JIP Report no: 27. SINTEF, Trondheim, Norway. Singsaas I., K.R. Sørheim, R.L. Daae, B. Johansen, L. Solsberg 2010: Testing of oil skimmers via
field experiments in the Barents Sea, May 2009. Oil in Ice JIP Report no: 21. SINTEF, Trondheim, Norway.
SFT, 2009: Release permit from the Norwegian Environmental Authorities (Norwegian Pollution
Control Authority - SFT). Dated: 1. April 2009. SFT Journal no: 2008/456-22 86 (In Norwegian).
Smith, N. K. and Diaz, A., 1987: In-Place Burning of Crude Oils in Broken Ice. Proceedings of
the 1987 Oil Spill Conference, API publication No. 4352, American Petroleum Institute, Washington, D.C., 383-387 pp.
Sørstrøm, S.E., Ø. Johansen, S. Vefsnmo, S.M. Løvås, B.O. Johannessen, S. Løset, P. Sveum, G. Chantalle, P.J. Brandvik, I. Singsaas and H.V. Jensen,1994: Experimental Oil Spill in the Marginal Ice Zone, April 1993 (MIZ-93). Final Report. SINTEF/IKU, Trondheim (in Norwegian).
Sørstrøm S.E., 2009: Joint industry program on oil spill contingency for Arctic and ice covered
waters. Activities, resources and safety procedures during the 2009 offshore field experiment. SINTEF report, Trondheim, Norway.
Sørstrøm S.E. 2010a: Field activity report from FEX2009 to the Norwegian Environmental
Authorities (Norwegian Pollution Control Authority - SFT). Oil in Ice JIP Report no: 25. SINTEF, Trondheim, Norway. (in Norwegian).
Sørstrøm, S.E., P.J. Brandvik, I. Buist, P. Daling, D. Dickins, L.G. Faksness, S. Potter, J. Fritt-
Rasmussen, and I. Singsaas, 2010b: Joint Industry Program on Oil Spill Contingency for Arctic and Ice-covered Waters. Summary report, Oil in Ice JIP Report no: 32, SINTEF. Trondheim, Norway.

33
34
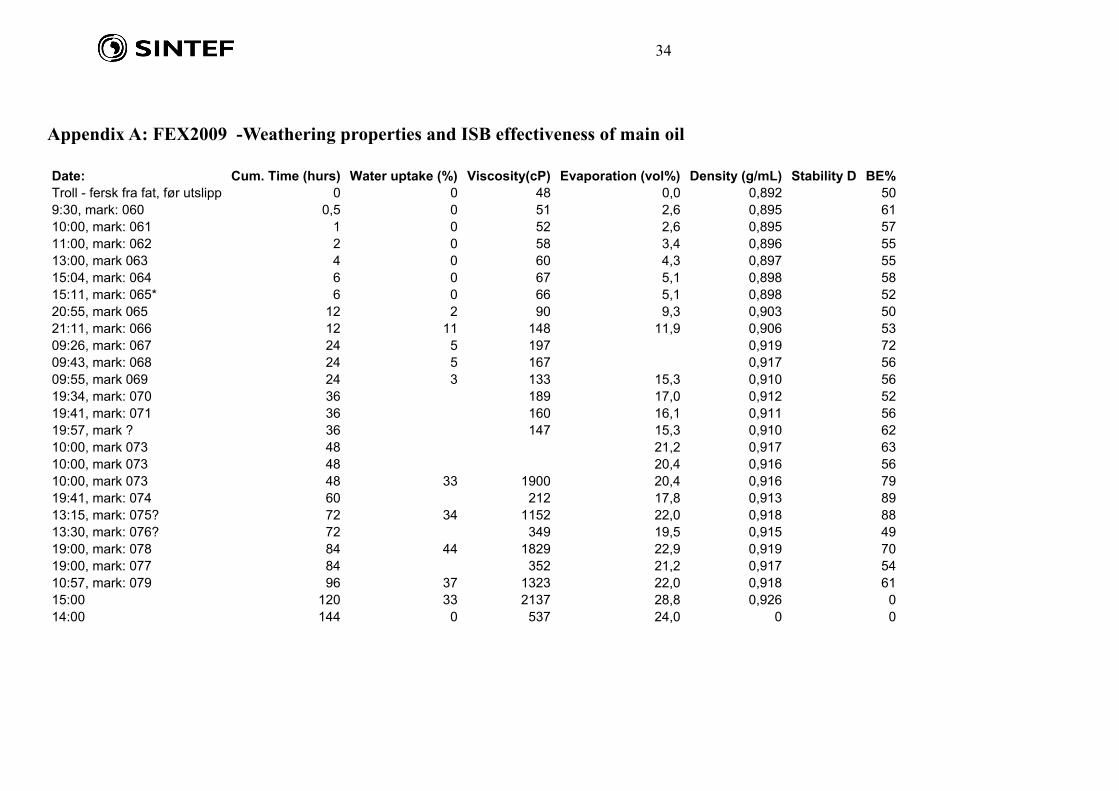
Appendix A: FEX2009 -Weathering properties and ISB effectiveness of main oil Date: Cum. Time (hurs) Water uptake (%) Viscosity(cP) Evaporation (vol%) Density (g/mL) Stability D BE%Troll - fersk fra fat, før utslipp 0 0 48 0,0 0,892 509:30, mark: 060 0,5 0 51 2,6 0,895 6110:00, mark: 061 1 0 52 2,6 0,895 5711:00, mark: 062 2 0 58 3,4 0,896 5513:00, mark 063 4 0 60 4,3 0,897 5515:04, mark: 064 6 0 67 5,1 0,898 5815:11, mark: 065* 6 0 66 5,1 0,898 5220:55, mark 065 12 2 90 9,3 0,903 5021:11, mark: 066 12 11 148 11,9 0,906 5309:26, mark: 067 24 5 197 0,919 7209:43, mark: 068 24 5 167 0,917 5609:55, mark 069 24 3 133 15,3 0,910 5619:34, mark: 070 36 189 17,0 0,912 5219:41, mark: 071 36 160 16,1 0,911 5619:57, mark ? 36 147 15,3 0,910 6210:00, mark 073 48 21,2 0,917 6310:00, mark 073 48 20,4 0,916 5610:00, mark 073 48 33 1900 20,4 0,916 7919:41, mark: 074 60 212 17,8 0,913 8913:15, mark: 075? 72 34 1152 22,0 0,918 8813:30, mark: 076? 72 349 19,5 0,915 4919:00, mark: 078 84 44 1829 22,9 0,919 7019:00, mark: 077 84 352 21,2 0,917 5410:57, mark: 079 96 37 1323 22,0 0,918 6115:00 120 33 2137 28,8 0,926 014:00 144 0 537 24,0 0 0


