55
Table of Contents 1 | Page
| Date post: | 26-Dec-2015 |
| Category: |
Documents |
| Upload: | vubon-minu |
| View: | 1,034 times |
| Download: | 2 times |

Table of Contents
1 | P a g e

Executive Summary
The case ‘The Timken Company’ is about the acquisition of the Torrington from ‘Ingersoll-Rand’ by the
Timken Company. Torrington produces the best quality bearing while the Timken has many wings where
bearing is an important division of their business. Both these companies has 5% of product and 80% of
customers redundancy. After the acquisition Timken will be world’s third largest bearing company.
The main point of this case is how the payment for this acquisition will be made. Expected value of this
acquisition is estimated $800 million. How Timken will pay this large amount is the main question here.
Timken can borrow or can issue stock for this amount. But this large debt will affect Timken’s leverage
ratio, as well as Timken’s investment grading in the market. Another option for Timken is to offer stock
in exchange for the purchase. But still Timken will be needing cash for this acquisition to be complete.
However we have found several circumstances of the financing opportunities for this acquisition which
will affect the value of Timken. we analyzed various risk related to these financing like Interest Rate Risk,
Overall Business Risk, Financial Risk, Degree of Financial Leverage, and Bankruptcy Risk, Du point ratio.
After calculating the NPV of the financing options we have run simulation technique for the potential
investment. We have tried to focus on the best option for the acquisition that will increase the value of
the firm most.
2 | P a g e

Introduction
Objective of the study
Usually we gather theoretical knowledge from course material. But it is also very much important to
relate that theoretical knowledge with practical situation. The basic objective of conducting this case
analysis is applying our theoretical knowledge in practical situation. The objective behind conducting this
study is as follows:
To analyze the ‘The Timken Company’ scenario
To analyze the acquisition of Torrington from Ingersoll Rand
Analyze the financing of the acquisition
Finding out the synergy of the acquisition
Scope of the study
The study topic allows us to analyze the cases named “The Timken Company” We have gone through
the case thoroughly, analyzed the problems of this company and tried to find out solutions of these
problems. Finally we have reached recommendations that will help to take the decision. Some external
information has been used for lack of information provided.
Methodology
For preparing our report we went through the text and information collected from case and applied our
sense of finance which we gained from different course especially from corporate finance and capital
budgeting to evaluate and justify our assigned topic. All the data used in this report have been gathered
from the case. Financial techniques taught in our BBA and MBA courses have been used here. Some
reasonable assumptions have been made because of lack of information provided.
3 | P a g e
To analyze and solving the problem Free cash flow method.
Crystal ball software is to complete the simulation analysis
Limitations of the study
The limitations of the study are defined by the extensive of the facts covered by the study and those
that left out. Learning all functions, moods of business, risk factors and protective covenants were quite
tough within specified time framework. There was also time constraint. While attempting to solve the
problem we have to assume some factors. The analysis could have been better if those data were
provided
Case Briefing
The Timken Company is one of the largest bearing companies in the industry. The company was
established in 1898 by Henry Timken. During the long life of the company the company faced many ups
and downs in the life cycle. In 1982 the company suffered its first loss since depression for the increasing
amount of competition. During the year followed the company engaged in joint venture. In 2002 the
company decided to acquire ‘Torrington’ Company from ‘Ingersoll-Rand’. This acquisition would make
The Timken Company world’s third largest bearing company.
Through the acquisition the Timken Company would be able to produce bearing with lower cost,
Timken’s worldwide brand value and world class distribution will produce high quality bearing with
lowest possible cost. Potential annual cost saving from the consolidating manufacturing facilities is
expected to be $80 million.
4 | P a g e

The main challenge for The Timken Company is how the acquisition will be paid. Timken has two options
for the financing of this acquisition:
1. Issuing debt; but this debt issue will affect the Timken’s leverage ratio enough to virtually
guarantee that Timken would lose its investment grade rating.
Equity issuance; Timken’s last issuance occurred in 1987,for this huge analysis is needed for the
issuance and the no. of share issuance will have to be double since it’s last issuance to raise the
amount needed.
Both this for the cash payment or they can
2. Offer stock along with the cash payment for this acquisition
Participators of the Acquisition
The Timken Company
As a global industrial technology leader, Timken apply deep knowledge of metallurgy, friction
management and power transmission to improve the reliability and efficiency of machinery all around
the world.
They engineer, manufacture and market mechanical components and high-performance steel. Their
bearings, engineered-steel bars and tubes -- as well as transmissions, gearboxes, chain and related
products and services -- support diversified markets worldwide.
With $4.3 billion sales in 2013 and approximately 19,000 people operating from 28 countries, Timken
makes the world more productive and keeps industry in motion.
5 | P a g e
The Ingersoll Rand
With a history dating back to 1871, Ingersoll Rand and its family of brands represents a proven history in
construction and mining, industrial and commercial markets.
Through acquisitions, innovations and customer focus, today's Ingersoll Rand offers market-leading
solutions and services that enable customers to create progress through a variety of industries and
markets that touch everyday life.
Ingersoll Rand (NYSE:IR) advances the quality of life by creating comfortable, sustainable and efficient
environments. Their people and their family of brands—including Club Car®, Ingersoll Rand®, Thermo
King® and Trane®—work together to enhance the quality and comfort of air in homes and buildings;
transport and protect food and perishables; and increase industrial productivity and efficiency. They are
a global business committed to a world of sustainable progress and enduring results.
Torrington
Torrington is best known for its Torrington needle bearings and Torrington thrust bearings. All
Torrington bearings are made using special lubrication and duplex cutting in order to ensure that they
are all the same size, which helps reduce friction and makes the bearing assembly last much longer.
Torrington is somewhat more expensive than some of its competitors, however, none of them compare
in quality and longevity to Torrington
6 | P a g e
Economic Analysis:
Like a battered champion in a heavyweight boxing match, the U.S. economy rose, staggered, took a knee
then resumed fighting in 2002. The roaring recovery of early January gave way to fear of a ‘doubledip’
recession by midsummer. But by fall it appeared the U.S. economy had weathered a second recession
GDP
GDP growth in the first quarter of 2002 caught everyone by surprise. GDP jumped a staggering 5% in the
first quarter after a respectable 2.7% in 2001:4. Coming out of the 1990 recession the U.S. conomy grew
2.3%, 1.0% and 2.2% in the first three quarters after the recession ended. While large growth rates are
not uncommon after a severe recession such as 1981, 5% growth is unusual coming out of such a
shallow recession as we had in 2001. The massive interest rate cuts enacted by the Federal Reserve
during 2001 were finally showing up in the data in the form of spending.
Stock Market
After the recession of late 2001, the U.S. stock market appeared to recover its legs in early 2002. In early
March, the Dow Jones Industrial Average was at 10,700 –only 7% lower than its all-time peak.
The massive flight to safety drove up prices on bonds and drove down bond yields. Suddenly, earning 1-
2% on a savings account didn’t look too bad. Savings deposits at banks jumped a staggering 22% from
2001:10-2002:10 as households moved assets out of the equity markets into safe, liquid assets. This
provided the funds in the banking system to finance consumer durables and housing in the second half
of 2002.
Consumption
If historians look back at 2002 and try to explain how the U.S. recovered from the 2001 recession they
will clearly see that it was on the backs of the U.S. consumer. Fueled by low interest rates and the
mortgage-refinancing boom during the summer, consumer spending grew at impressive quarterly rates
7 | P a g e
(annualized) of 4%, 2.2%, 1.22% and 2.95% over the past year. Quarter to quarter, real personal
consumption expenditures increased 4.2 percent in the third quarter, compared with an increase of 1.8
percent in the second quarter. Durable goods boom waned by the end of the year raising concerns that
whatever consumption growth we saw in 2002 could disappear as we move into 2003.
Investment
After six consecutive quarters of negative growth, gross private investment finally showed some life in
the first half of the year but turned negative again in the third quarter. Non-residential investment
contracted during the first half the year. Residential investment grew respectably in the first half but fell
off during the third quarter. Inventories jumped 2.6% and 1.3% in the first half of the year after six
quarters of contraction as businesses rebuilt good stocks in the belief that the recession was over.
Government expending & Taxes
Standard economic wisdom suggests that the federal government should increase spending during a
recession to dampen the decline in output. From 2001:3-2002:3, the U.S. government clearly did its part
(due also in no small part to the war on terrorism). Real federal government spending increased from
$568.9 billion in 2001:3 to $613.1 billion in 2002:3 – a 7.7% increase for the period. However, almost
80% of that ($35 billion) went to national defense. Whether or not defense spending aimed at fighting
terrorism stimulates the U.S. economy is an open question. Transfer payments increased 9.8% during
the same period as more people relied on welfare and unemployment compensation to get them
through tough economic times.
Inflation & Unemployment
Inflation remained well under control in 2002. The Consumer Price Index increased a mere 1.5% from
2001:9-2002:9. The GDP deflator, a broader measure of inflation increased a mere 1% over 2002. As a
result, low inflation gives the monetary and fiscal authorities substantial room to pursue expansionary
policies if need be. The unemployment rate increased through the first half of 2002 hitting 6% for the
first time since 1994. However, by the fall of 2002, the unemployment rate began dropping and was at
5.7% by October 2002. The median duration of unemployment also climbed in the first half of the year
8 | P a g e
to 11.7 weeks before falling to 9.6 in October. This is nearly double the 6 weeks duration observed in the
last year of the nineties expansion
Industry Analysis
Porter’s 5 forces Analysis
Porters five forces model is a helpful tool to assess the relative attractiveness and risks inherent in an
industry. So with porters five forces model it will be attempted to analyze different components of
riskiness of this industry.
Figure: Porter’s five forces Bearing Industry
9 | P a g e
Threat of new entrants: Low
Rivalry among existing competitor:
High
Threat of substitute products:
Low
Bargaining power of buyers:
Moderate
Bargaining power of sellers: Moderate
Threats of new entrants: Low
Market is segmented to large companies. These company comprise of majority of the total
market
Required huge capital investment
Brand image is required
Rivalry among existing firms: High
There are some major competitors exists in the market
Severe economic and competitive pressure
Increasing demand of the existing firms
Threat of substitute products: Low
No proper substitute products exist; bearing is very important elements for automotive &
mechanical industry; substitute is not a strong option for this industries.
Bargaining power of buyers: Moderate
High switching cost
Low cost products available in the market
Threat of dumping by foreign producers
Bargaining power of suppliers: Moderate
Availability of suppliers in the market
No scope for forward integration
High maintenance of raw materials are required
10 | P a g e

Company Analysis
The company was founded by Henry Timken in St. Louis in 1899 and incorporated as The Timken Roller
Bearing Axle Company. In 1898, Henry Timken obtained a patent for the tapered roller bearing. Timken
influences the fundamentals of motion through the creation, transfer and control of power. Imagine the
possibilities and multitude of applications where power must be generated, transferred or monitored.
For more than 100 years, Timken has refined the science of managing friction. From Ploeisti, Romania to
Bangalore, India and beyond, Timken operates 9 technology and engineering centers dedicated to
developing solutions for customers’ toughest application problems.
Market Segments
Timken serve many diverse market segments, including aerospace, automotive, construction, consumer,
defense, energy, industrial equipment, health, heavy industry, machine tool, positioning control, power
generation and rail.
Joint Ventures
o CoLinx, LLC – Greenville, SC, U.S.A. (PTplace.com)
o S.E. SETCO Service Co. – Norcross, GA, U.S.A.
o Timken XEMC (Hunan) Bearings Co., Ltd. – Xiangtan, China
11 | P a g e
Strategic Analysis
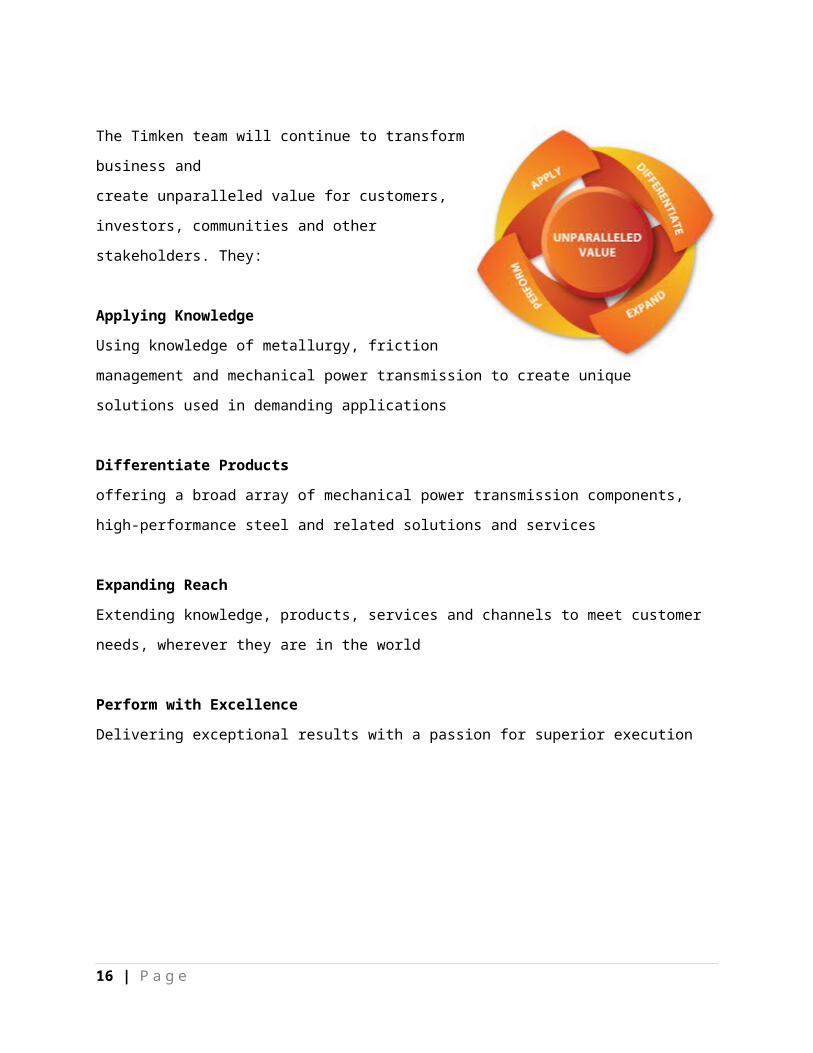
The Timken team will continue to transform business and
create unparalleled value for customers, investors,
communities and other stakeholders. They:
Applying Knowledge
Using knowledge of metallurgy, friction management and
mechanical power transmission to create unique solutions
used in demanding applications
Differentiate Products
offering a broad array of mechanical power transmission components, high-performance steel and
related solutions and services
Expanding Reach
Extending knowledge, products, services and channels to meet customer needs, wherever they are in
the world
Perform with Excellence
Delivering exceptional results with a passion for superior execution
SWOT Analysis
12 | P a g e

Strength
Custom-Made products for the buyers
Sharing 80% customer with Torrington
Familiar industry of both the acquirer and acquired firm
Acquisition will reduce the production cost
Weakness
Issuing debt for acquisition will affect the leverage ratio of Timken
High debt to equity ratio
Higher price of Torrington’s products relative to market
Opportunity
Strong brand value in the market
Acquisition will set the stage for international growth
International distribution network
Market leadership will give the opportunity to negotiate with suppliers and sellers
13 | P a g e
Threat
Non-favorable bearing industry policy
Threat of dumping by foreign producers
Highly competitive market
14 | P a g e
Ratio Analysis
Computation of Financial Ratios
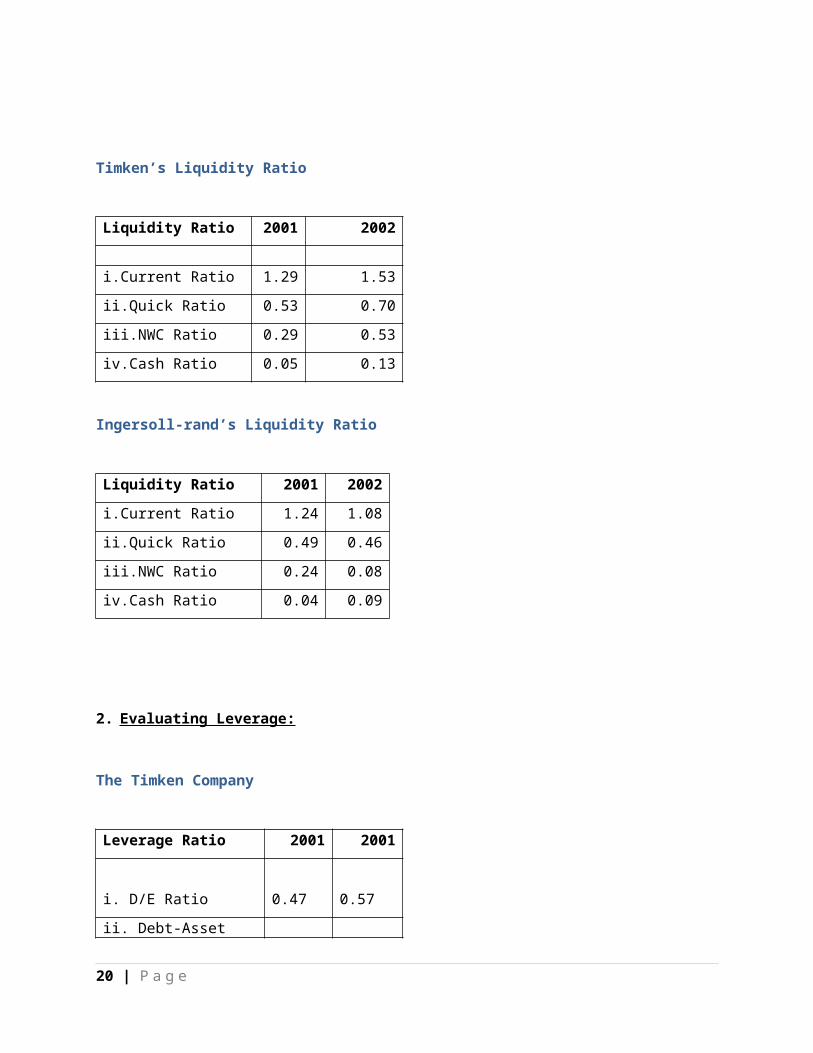
1. Evaluating Internal Liquidity:
Internal liquidity (solvency) ratios are intended to indicate the ability of the firm to meet future short-
term financial obligations.
a. Current Ratio: Clearly the best known liquidity measure is the current ratio, which examines the
relationship between current assets and current liabilities. In our analysis we have found current
ratio of The Timken Company is 1.53 and of Ingersoll-Rand is 1.08 for the year 2002.This means
that Timken does have liquid funds to cover their immediate needs more than Ingersoll-Rand
b. Quick Ratio: the quick ratio relates current liabilities to only relatively liquid current assets (cash
items and account receivable). In 2002 Timken quick ratio was 0.7 and Ingersoll-rands was .46
c. NWC Ratio: This ratio measures company’s net working capital available to run its day to day
activities. In 2002 Timken had NWC ratio 0.53 and Ingersoll-rand .08
d. Cash Ratio: The most conservative liquidity ratio is the cash ratio, which relates the firm’s cash
and short-term marketable securities to its current liabilities. In 2002 Timken’s cash ratio was
0.13 and Ingersoll-rand’s was 0.09 which indicates lower liquidity solvency
Timken’s Liquidity Ratio
Liquidity Ratio 2001 2002
i.Current Ratio 1.29 1.53
ii.Quick Ratio 0.53 0.70
iii.NWC Ratio 0.29 0.53
iv.Cash Ratio 0.05 0.13
15 | P a g e
Ingersoll-rand’s Liquidity Ratio
Liquidity Ratio 2001 2002
i.Current Ratio 1.24 1.08
ii.Quick Ratio 0.49 0.46
iii.NWC Ratio 0.24 0.08
iv.Cash Ratio 0.04 0.09
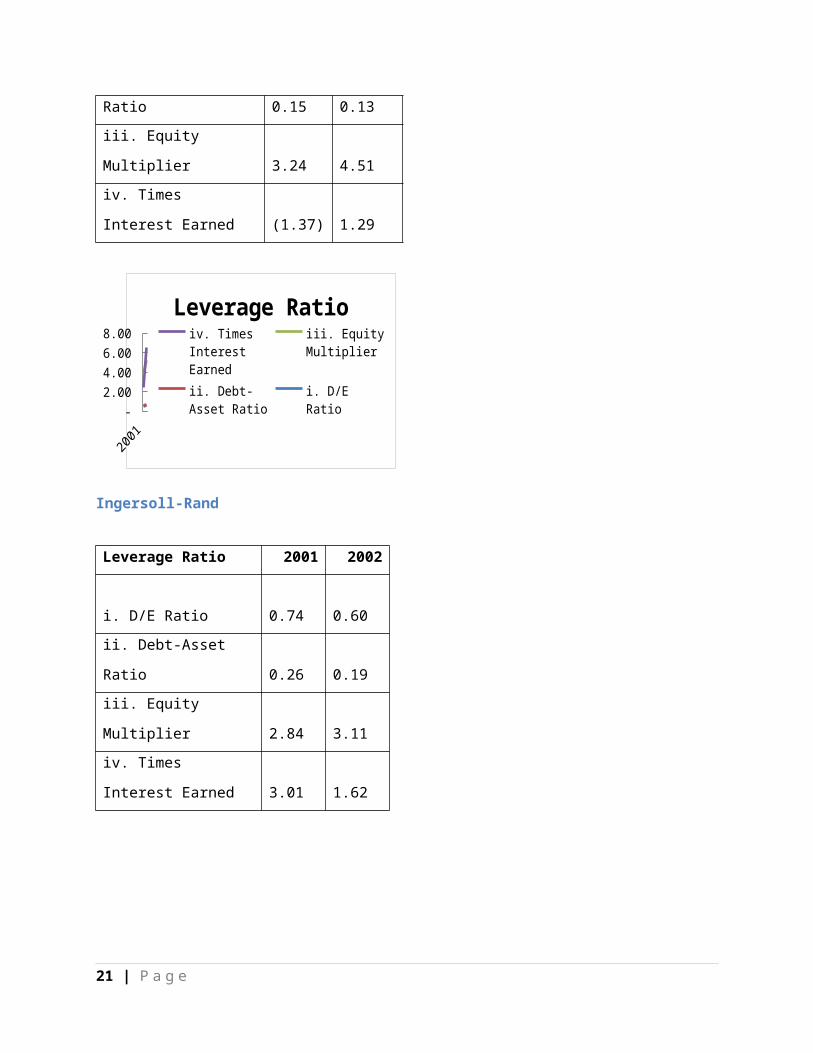
2. Evaluating Leverage:
The Timken Company
Leverage Ratio 2001 2001
i. D/E Ratio
0.47
0.57
ii. Debt-Asset Ratio
0.15
0.13
iii. Equity Multiplier
3.24
4.51
iv. Times Interest Earned
(1.37)
1.29
2001 2001 -
1.00 2.00 3.00 4.00 5.00 6.00 7.00
Leverage Ratioiv. Times Interest Earnediii. Equity Mul-tiplierii. Debt-Asset Ra-tioi. D/E Ratio
16 | P a g e
Ingersoll-Rand
Leverage Ratio 2001 2002
i. D/E Ratio
0.74
0.60
ii. Debt-Asset Ratio
0.26
0.19
iii. Equity Multiplier
2.84
3.11
iv. Times Interest Earned
3.01
1.62
- 2.00 4.00 6.00 8.00
Leverage Ratioiv. Times In-terest Earned
iii. Equity Mul-tiplier
ii. Debt-Asset Ratio
i. D/E Ratio
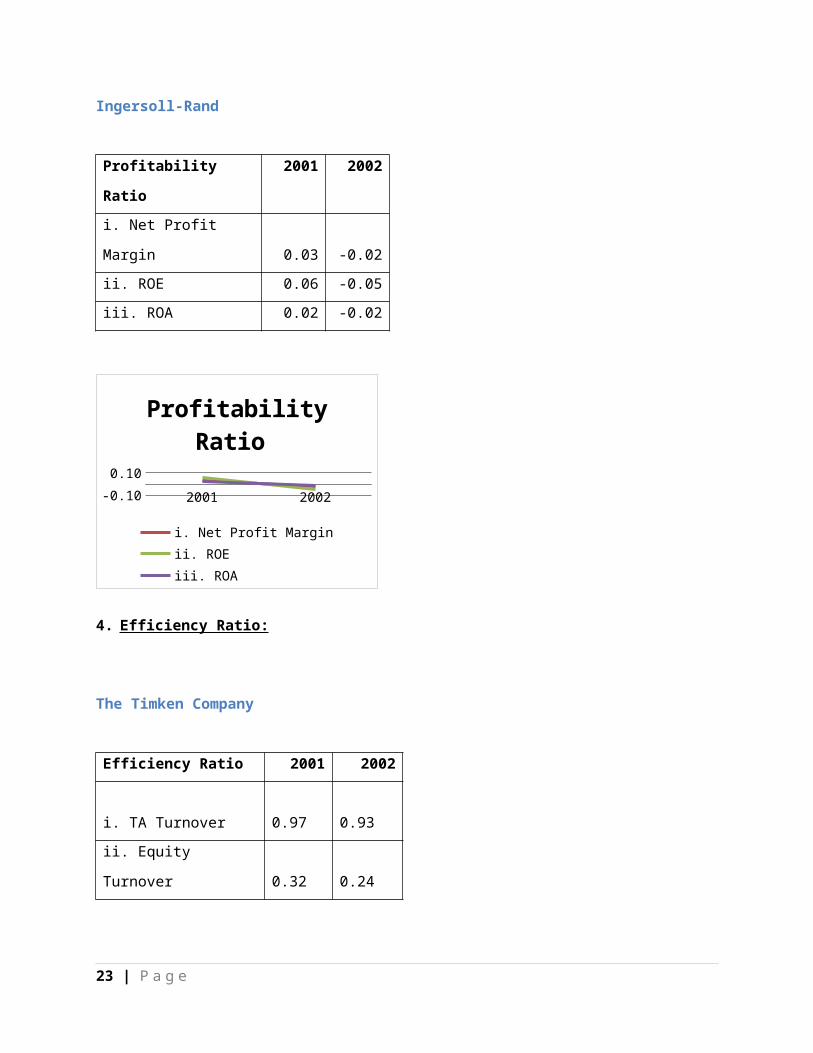
3. Profitability Ratios:
The Timken Company
Profitability Ratio 2001 2002
i. Net Profit Margin -0.02 0.02
ii. ROE -0.05 0.06
iii. ROA -0.02 0.01
17 | P a g e

2001 2002
-0.10
-0.05
0.00
0.05
0.10
Profitability Ratio
i. Net Profit Marginii. ROEiii. ROA
Ingersoll-Rand
Profitability Ratio 2001 2002
i. Net Profit Margin 0.03 -0.02
ii. ROE 0.06 -0.05
iii. ROA 0.02 -0.02
2001 2002
-0.10
-0.05
0.00
0.05
0.10
Profitability Ratio
i. Net Profit Marginii. ROEiii. ROA
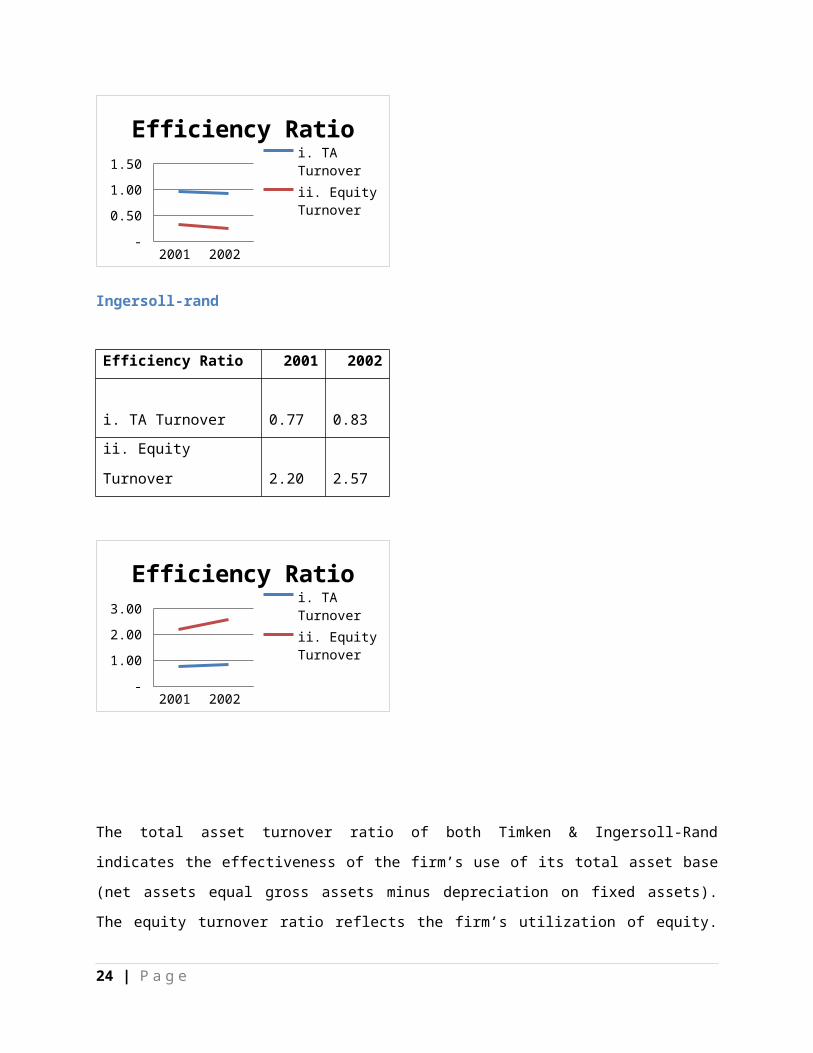
4. Efficiency Ratio:
The Timken Company
18 | P a g e
Efficiency Ratio 2001 2002
i. TA Turnover
0.97
0.93
ii. Equity Turnover
0.32
0.24
2001 2002 -
0.20 0.40 0.60 0.80 1.00 1.20
Efficiency Ratio
i. TA Turnoverii. Equity Turnover
Ingersoll-rand
Efficiency Ratio 2001 2002
i. TA Turnover
0.77
0.83
ii. Equity Turnover
2.20
2.57
2001 2002 -
0.50 1.00 1.50 2.00 2.50 3.00
Efficiency Ratio
i. TA Turnoverii. Equity Turnover
19 | P a g e
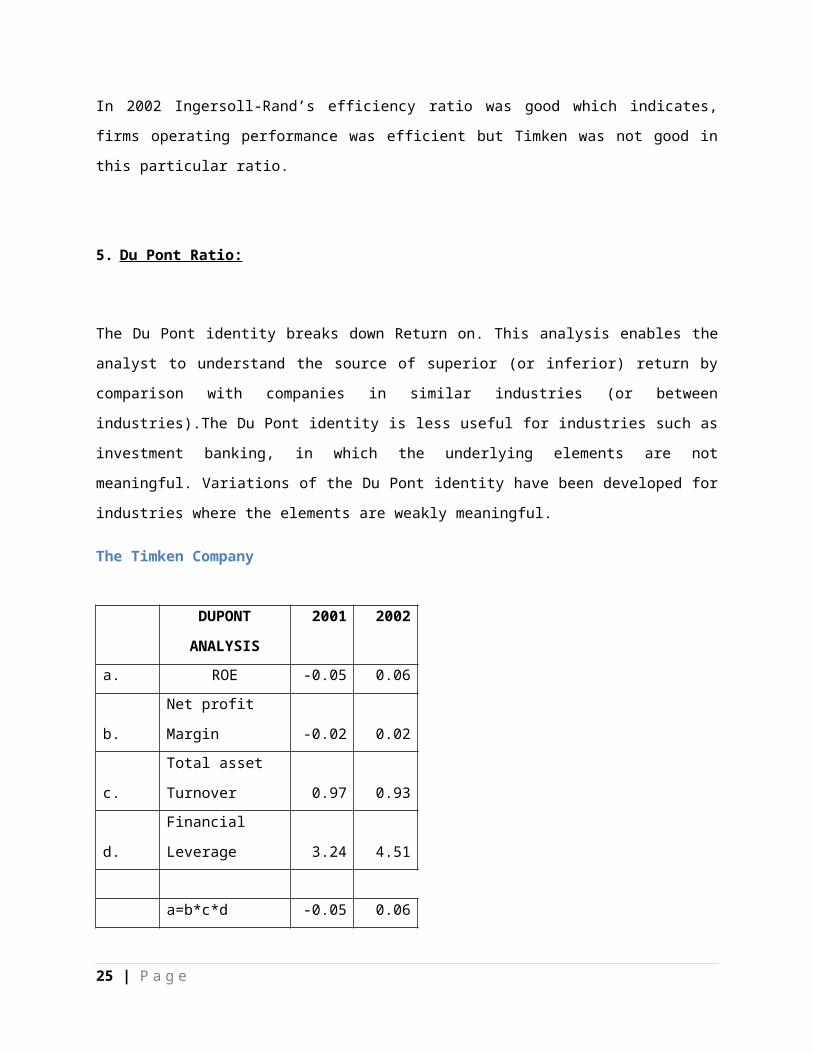
The total asset turnover ratio of both Timken & Ingersoll-Rand indicates the effectiveness of the firm’s
use of its total asset base (net assets equal gross assets minus depreciation on fixed assets). The equity
turnover ratio reflects the firm’s utilization of equity. In 2002 Ingersoll-Rand’s efficiency ratio was good
which indicates, firms operating performance was efficient but Timken was not good in this particular
ratio.
5. Du Pont Ratio:
The Du Pont identity breaks down Return on. This analysis enables the analyst to understand the source
of superior (or inferior) return by comparison with companies in similar industries (or between
industries).The Du Pont identity is less useful for industries such as investment banking, in which the
underlying elements are not meaningful. Variations of the Du Pont identity have been developed for
industries where the elements are weakly meaningful.
The Timken Company
DUPONT ANALYSIS 2001 2002
a. ROE -0.05 0.06
b. Net profit Margin -0.02 0.02
c.
Total asset
Turnover 0.97 0.93
d. Financial Leverage 3.24 4.51
a=b*c*d -0.05 0.06
20 | P a g e
2001 2002
-1.00
0.00
1.00
2.00
3.00
4.00
5.00
Dupont ratio
ROENet profit MarginTotal asset TurnoverFinancial LeverageSeries5a=b*c*d
Ingersoll-Rand
DUPONT ANALYSIS 2001 2002
a. ROE 0.06 -0.05
b. Net profit Margin 0.03 -0.02
c.
Total asset
Turnover 0.77 0.83
d. Financial Leverage 2.84 3.11
a=b*c*d 0.06 -0.05
2001 2002 -0.50
0.00
0.50
1.00
1.50
2.00
2.50
3.00
3.50
Dupont ratio
ROENet profit MarginTotal asset TurnoverFinancial LeverageSeries5a=b*c*d
21 | P a g e

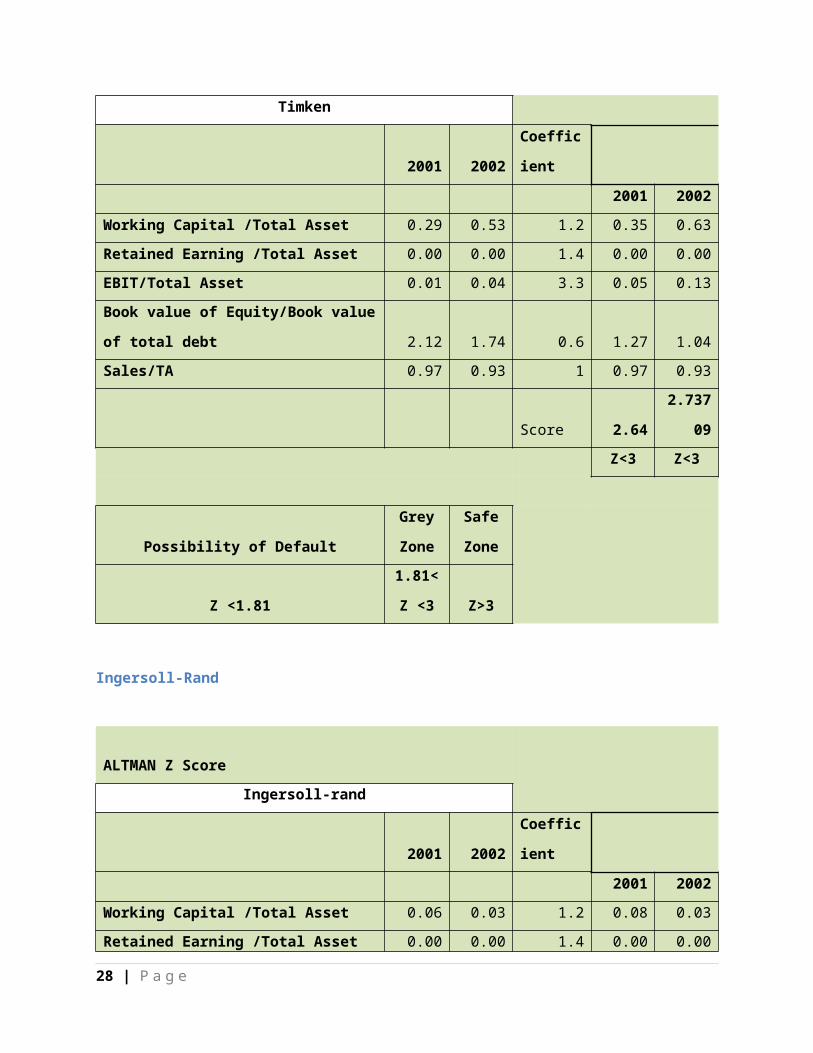
6. ALTMAN Z Score Analysis:
The Z-score formula for predicting bankruptcy can be used to predict the probability that a firm will go
into bankruptcy within two years. Z-scores are used to predict corporate defaults and an easy-to-
calculate control measure for the financial distress status of companies in academic studies. The Z-score
uses multiple corporate income and balance sheet values to measure the financial health of a company.
As Zoot is a private equity firm so we have used Z score estimation for private firms. Here
Z score Bankruptcy Model:
Z = 0.717T1 + 0.847T2 + 3.107T3 + 0.420T4 + 0.998T5
The Timken Company
ALTMAN Z Score
Timken
2001 2002
Coefficien
t
2001 2002
Working Capital /Total Asset 0.29 0.53 1.2 0.35 0.63
Retained Earning /Total Asset 0.00 0.00 1.4 0.00 0.00
EBIT/Total Asset 0.01 0.04 3.3 0.05 0.13
Book value of Equity/Book value of total
debt 2.12 1.74 0.6 1.27 1.04
Sales/TA 0.97 0.93 1 0.97 0.93
Score 2.64 2.73709
Z<3 Z<3
Possibility of Default
Grey
Zone
Safe
Zone
Z <1.81 1.81<Z Z>3
22 | P a g e
<3
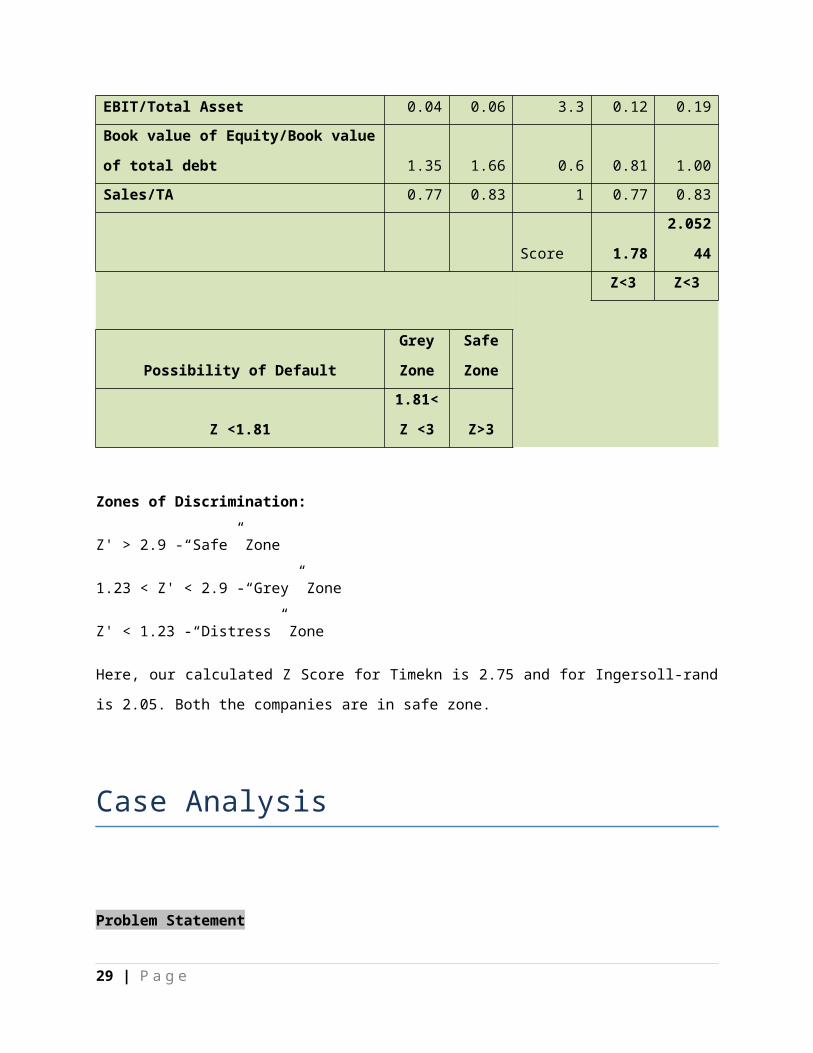
Ingersoll-Rand
ALTMAN Z Score
Ingersoll-rand
2001 2002
Coefficien
t
2001 2002
Working Capital /Total Asset 0.06 0.03 1.2 0.08 0.03
Retained Earning /Total Asset 0.00 0.00 1.4 0.00 0.00
EBIT/Total Asset 0.04 0.06 3.3 0.12 0.19
Book value of Equity/Book value of total
debt 1.35 1.66 0.6 0.81 1.00
Sales/TA 0.77 0.83 1 0.77 0.83
Score 1.78 2.05244
Z<3 Z<3
Possibility of Default
Grey
Zone
Safe
Zone
Z <1.81
1.81<Z
<3 Z>3
Zones of Discrimination:
Z' > 2.9 -“Safe” Zone
1.23 < Z' < 2.9 -“Grey” Zone
Z' < 1.23 -“Distress” Zone
23 | P a g e
Here, our calculated Z Score for Timekn is 2.75 and for Ingersoll-rand is 2.05. Both the companies are in
safe zone.
Case Analysis
Problem Statement
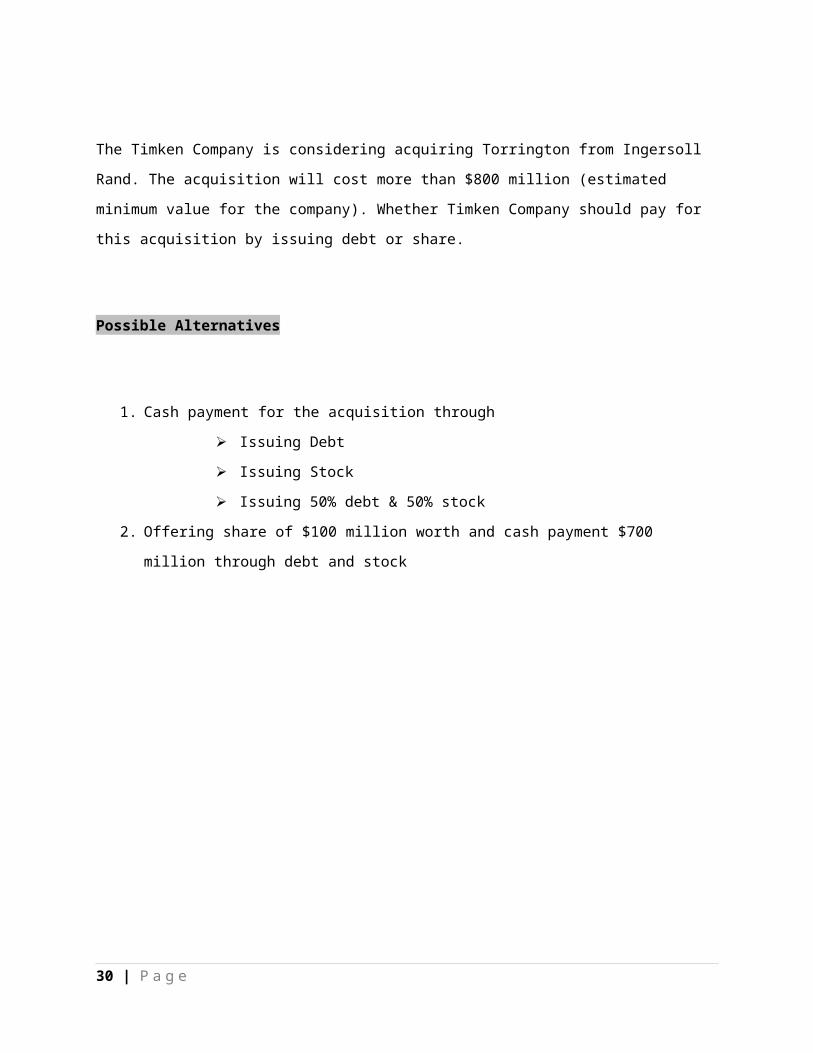
The Timken Company is considering acquiring Torrington from Ingersoll Rand. The acquisition will cost
more than $800 million (estimated minimum value for the company). Whether Timken Company should
pay for this acquisition by issuing debt or share.
Possible Alternatives
1. Cash payment for the acquisition through
Issuing Debt
Issuing Stock
Issuing 50% debt & 50% stock
2. Offering share of $100 million worth and cash payment $700 million through debt and stock
24 | P a g e
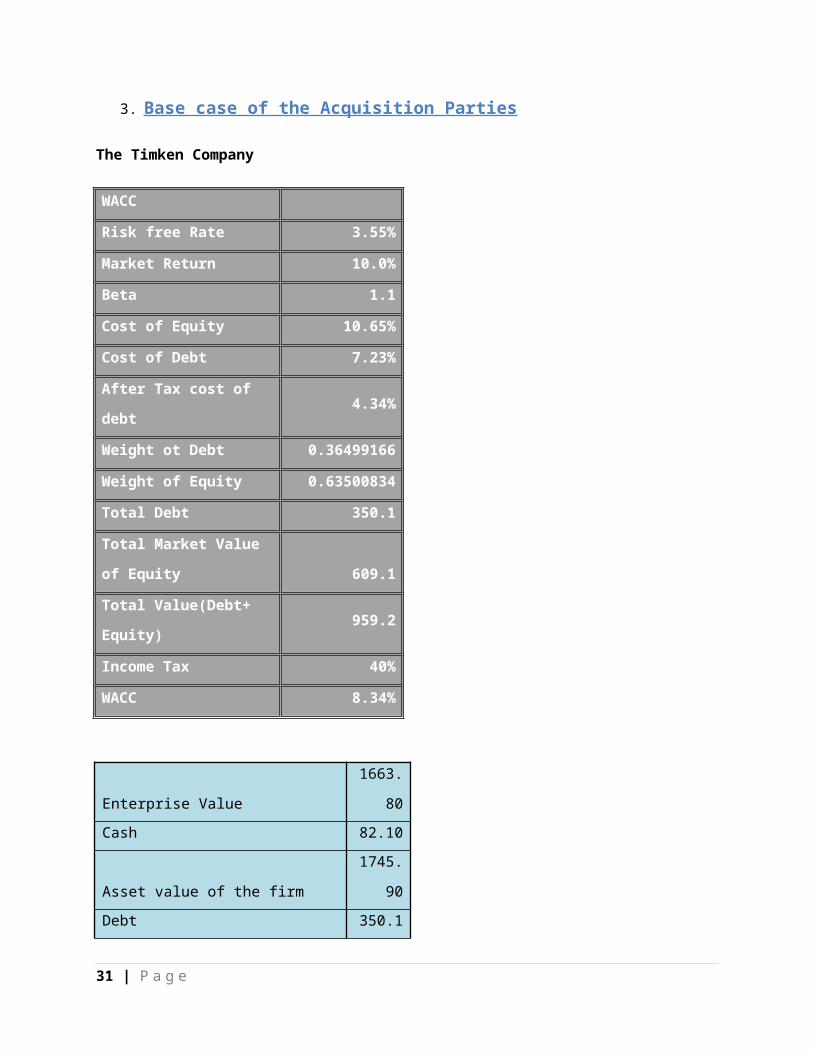
3. Base case of the Acquisition Parties
The Timken Company
WACC
Risk free Rate 3.55%
Market Return 10.0%
Beta 1.1
Cost of Equity 10.65%
Cost of Debt 7.23%
After Tax cost of debt 4.34%
Weight ot Debt 0.36499166
Weight of Equity 0.63500834
Total Debt 350.1
Total Market Value of
Equity 609.1
Total Value(Debt+ Equity) 959.2
Income Tax 40%
WACC 8.34%
Enterprise Value 1663.80
Cash 82.10
Asset value of the firm 1745.90
Debt 350.10
Equity value of the firm 1395.80
No of shares outstanding 63.40
Equity Value Per Share 22.02
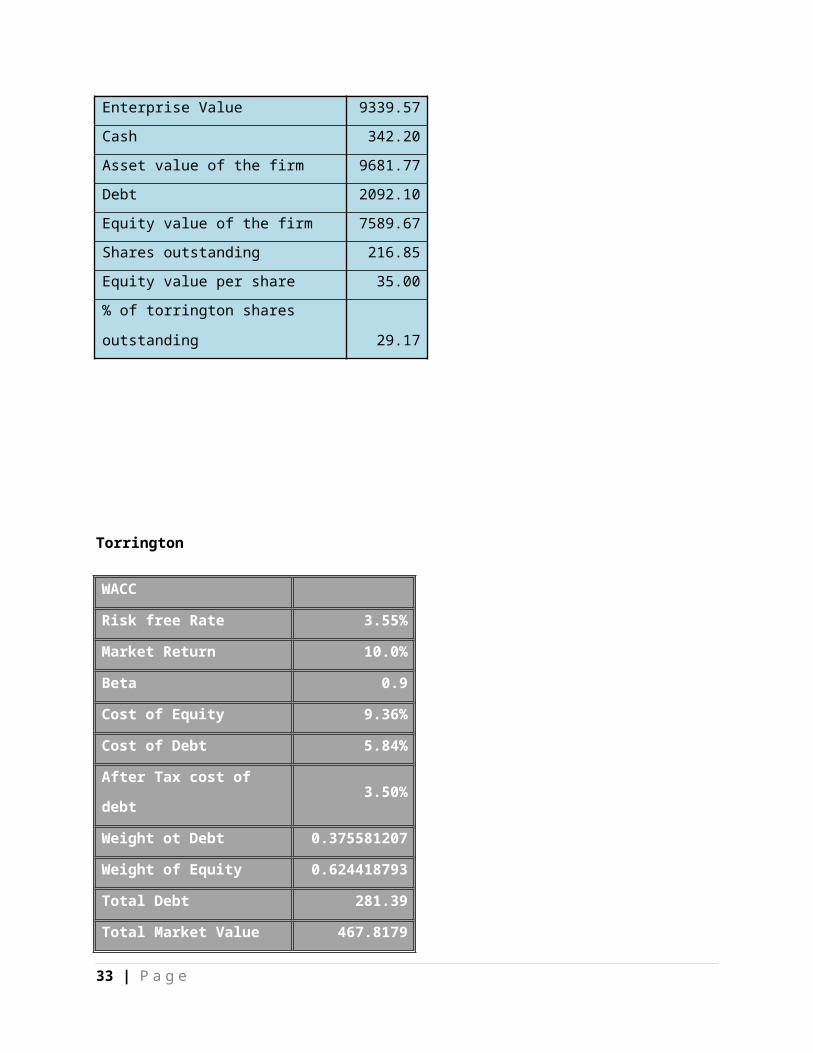
Ingersoll-Rand Company
25 | P a g e

WACC
Risk free Rate 3.55%
Market Return 10.0%
Beta 1.2
Cost of Equity 11.29%
Cost of Debt 5.84%
After Tax cost of debt 3.50%
Weight ot Debt 0.375581207
Weight of Equity 0.624418793
Total Debt 2092.10
Total Market Value of Equity 3478.2
Total Value(Debt+ Equity) 5570.30
Income Tax 40%
WACC 8.37%
Enterprise Value 9339.57
Cash 342.20
Asset value of the firm 9681.77
Debt 2092.10
Equity value of the firm 7589.67
Shares outstanding 216.85
Equity value per share 35.00
% of torrington shares outstanding 29.17
Torrington
26 | P a g e

WACC
Risk free Rate 3.55%
Market Return 10.0%
Beta 0.9
Cost of Equity 9.36%
Cost of Debt 5.84%
After Tax cost of debt 3.50%
Weight ot Debt 0.375581207
Weight of Equity 0.624418793
Total Debt 281.39
Total Market Value of Equity 467.8179
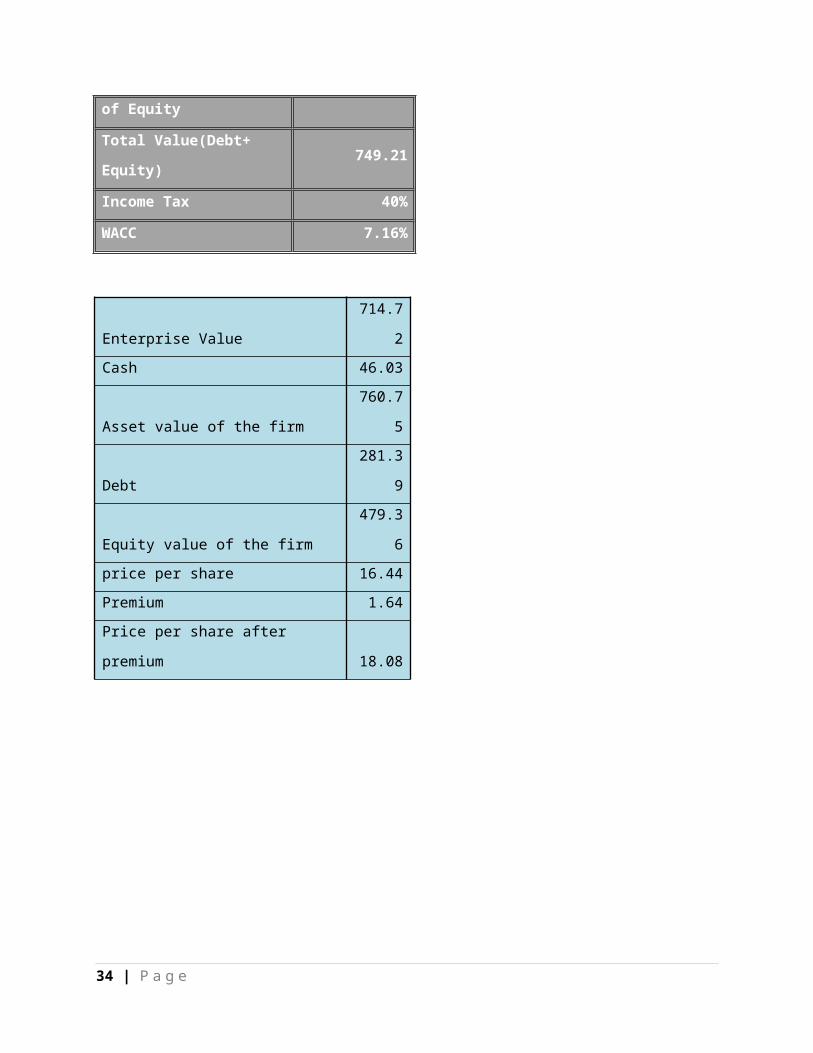
Total Value(Debt+ Equity) 749.21
Income Tax 40%
WACC 7.16%
Enterprise Value 714.72
Cash 46.03
Asset value of the firm 760.75
Debt 281.39
Equity value of the firm 479.36
price per share 16.44
Premium 1.64
Price per share after premium 18.08
27 | P a g e
Synergy
Synergy is the combined value of the acquired and acquire firm. There are four sources of synergy
1. Revenue enhancement
2. Cost savings
3. Operating expense savings
4. Capital expenditure savings
Synergy of the acquisition in three situations; a) Base b) Best & c) Worst are given below
Assumptions for the base cases are:
Base Case
Revenue Enhancement 3.00%
Cost Savings 3.85%
Capex Savings 2.00%
Terminal Revenue Enhancement 2.00%
Terminal Cost Savings 1.50%
Discount rate for Revenue enhance 9.00%
Discount rate for cost savings 10.00%
Discount rate for capex savings 8.00%
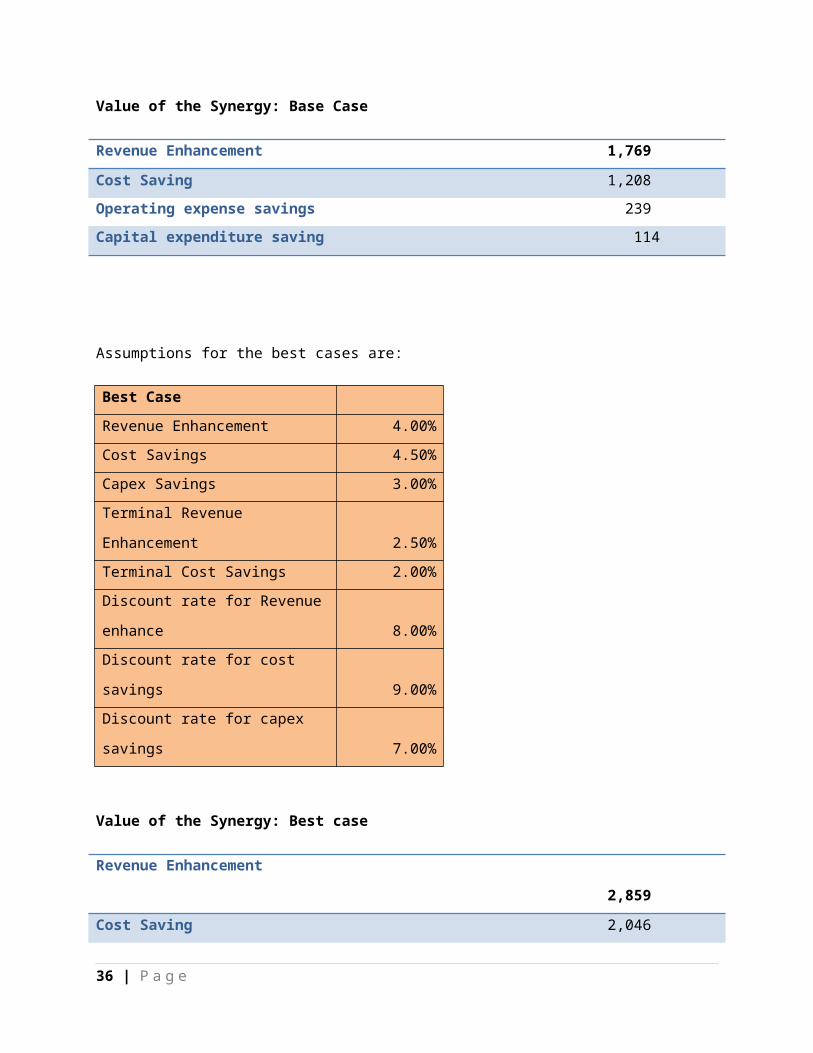
Value of the Synergy: Base Case
Revenue Enhancement 1,769
Cost Saving 1,208
Operating expense savings 239
Capital expenditure saving 114
28 | P a g e
Assumptions for the best cases are:
Best Case
Revenue Enhancement 4.00%
Cost Savings 4.50%
Capex Savings 3.00%
Terminal Revenue Enhancement 2.50%
Terminal Cost Savings 2.00%
Discount rate for Revenue enhance 8.00%
Discount rate for cost savings 9.00%
Discount rate for capex savings 7.00%
Value of the Synergy: Best case
Revenue Enhancement
2,859
Cost Saving 2,046
Operating expense savings 407
Capital expenditure saving 182
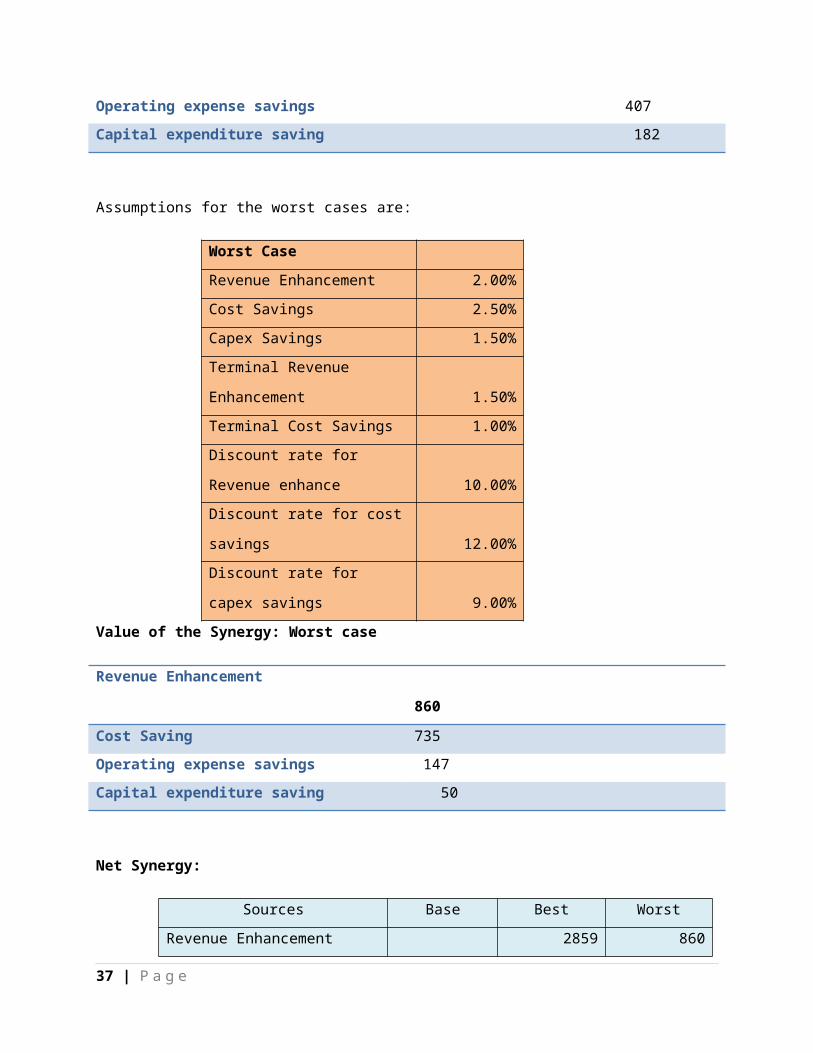
Assumptions for the worst cases are:
Worst Case
Revenue Enhancement 2.00%
Cost Savings 2.50%
Capex Savings 1.50%
Terminal Revenue Enhancement 1.50%
Terminal Cost Savings 1.00%
Discount rate for Revenue
enhance 10.00%
Discount rate for cost savings 12.00%
Discount rate for capex savings 9.00%
29 | P a g e
Value of the Synergy: Worst case
Revenue Enhancement
860
Cost Saving 735
Operating expense savings 147
Capital expenditure saving 50
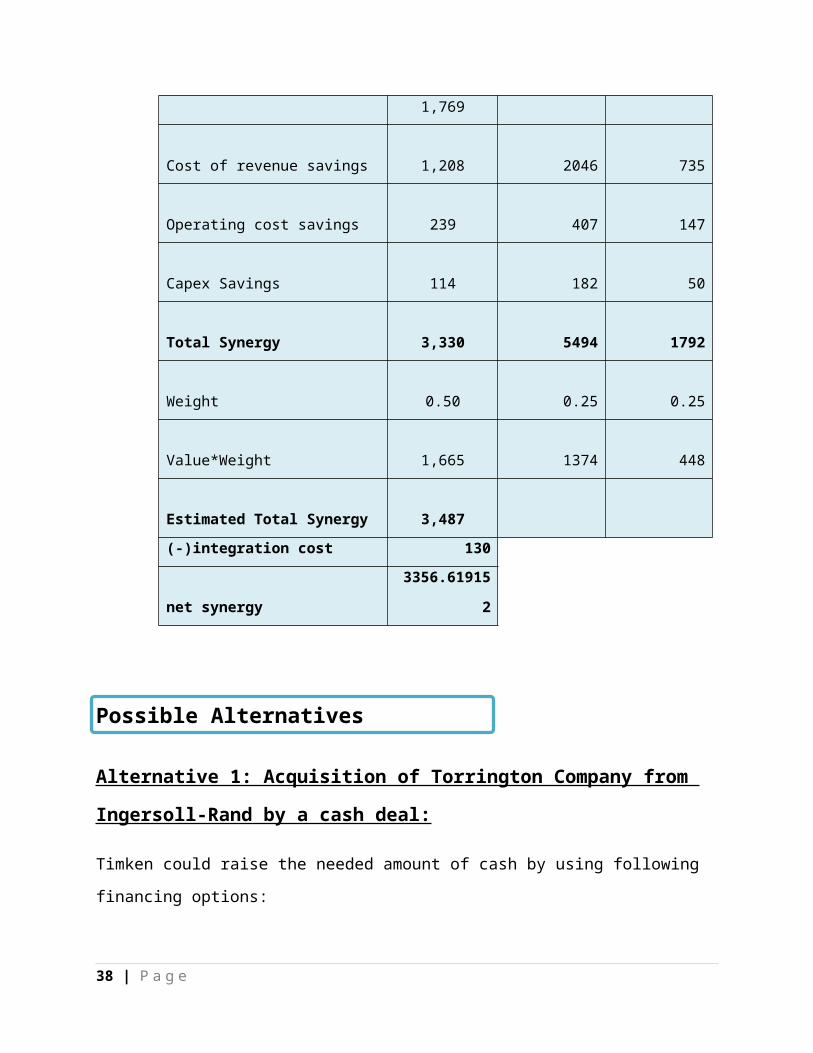
Net Synergy:
Sources Base Best Worst
Revenue Enhancement
1,7
69 2859 860
Cost of revenue savings
1,2
08 2046 735
Operating cost savings
2
39 407 147
Capex Savings
1
14 182 50
Total Synergy
3,3
30 5494 1792
Weight
0.
50
0.
25
0.
25
Value*Weight
1,6
65 1374 448
Estimated Total Synergy
3,4
87
(-)integration cost 130
net synergy 3356.619152
30 | P a g e
Alternative 1: Acquisition of Torrington Company from Ingersoll-Rand by a cash
deal:
Timken could raise the needed amount of cash by using following financing options:
Financing Options:
a) Raising $800 million for the cash deal by issuing shares to the public
b) Raising $800 million for the cash deal with a debt offering
c) Raising $800 million with a combination of debt and equity financing(50:50 ratio)
By using these three alternatives Timken could raise its needed amount of cash for the
acquisition. In each of the cases, Timken’s capital structure will be altered. The optimal capital
structure will ensure Timken with highest amount of Net Acquisition Value (NAV) and highest
equity value per share.
31 | P a g e
Possible Alternatives

WACC Calculation
for the combined
firm:
32 | P a g e
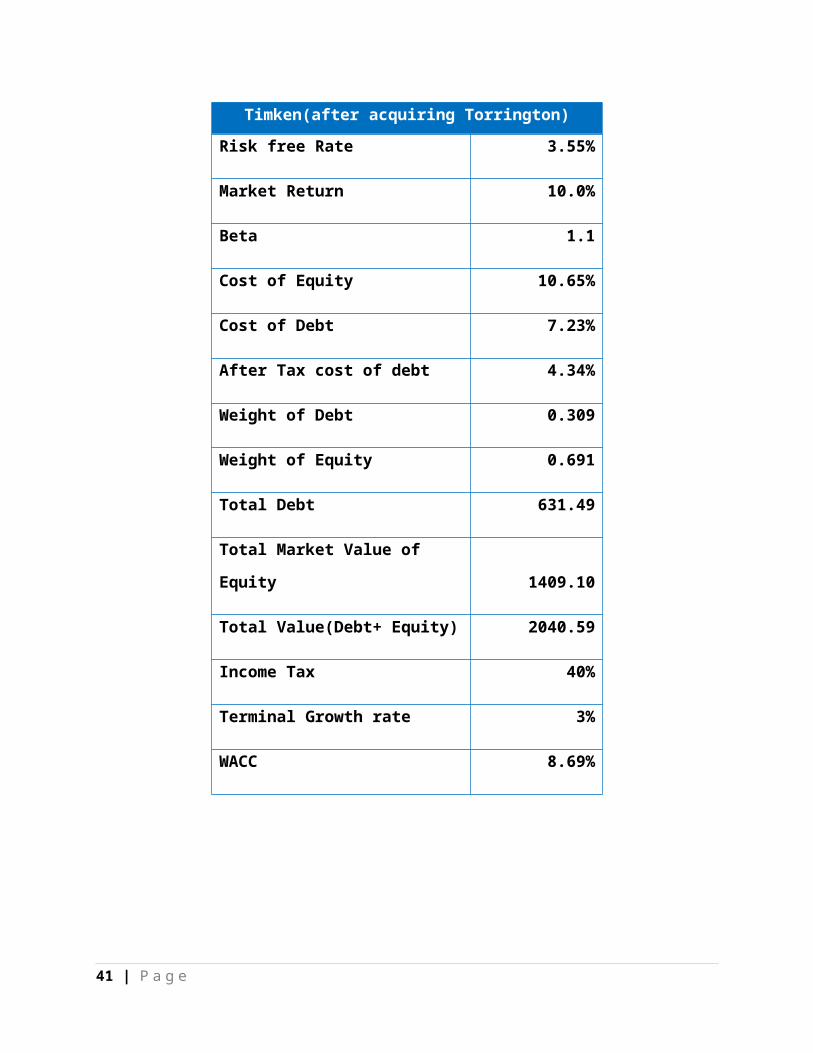
Financing Option A: Raising $800 million for the cash deal by issuing shares to the public
Timken(after acquiring Torrington)
Risk free Rate 3.55%
Market Return 10.0%
Beta 1.1
Cost of Equity 10.65%
Cost of Debt 7.23%
After Tax cost of debt 4.34%
Weight of Debt 0.309
Weight of Equity 0.691
Total Debt 631.49
Total Market Value of Equity 1409.10
Total Value(Debt+ Equity) 2040.59
Income Tax 40%
Terminal Growth rate 3%
WACC 8.69%
Here, Timken will raise $800 million by issuing shares to the public. So they will issue 42.11 new shares
at current market price which is 19 to raise $800 for the cash deal. As a result, Timken’s numbers of
outstanding shares will become 105.51 (64.2+42.11).
By adding the values of Timken and Torrington we can get combined value of Timken after aquiring
Torrington.
33 | P a g e
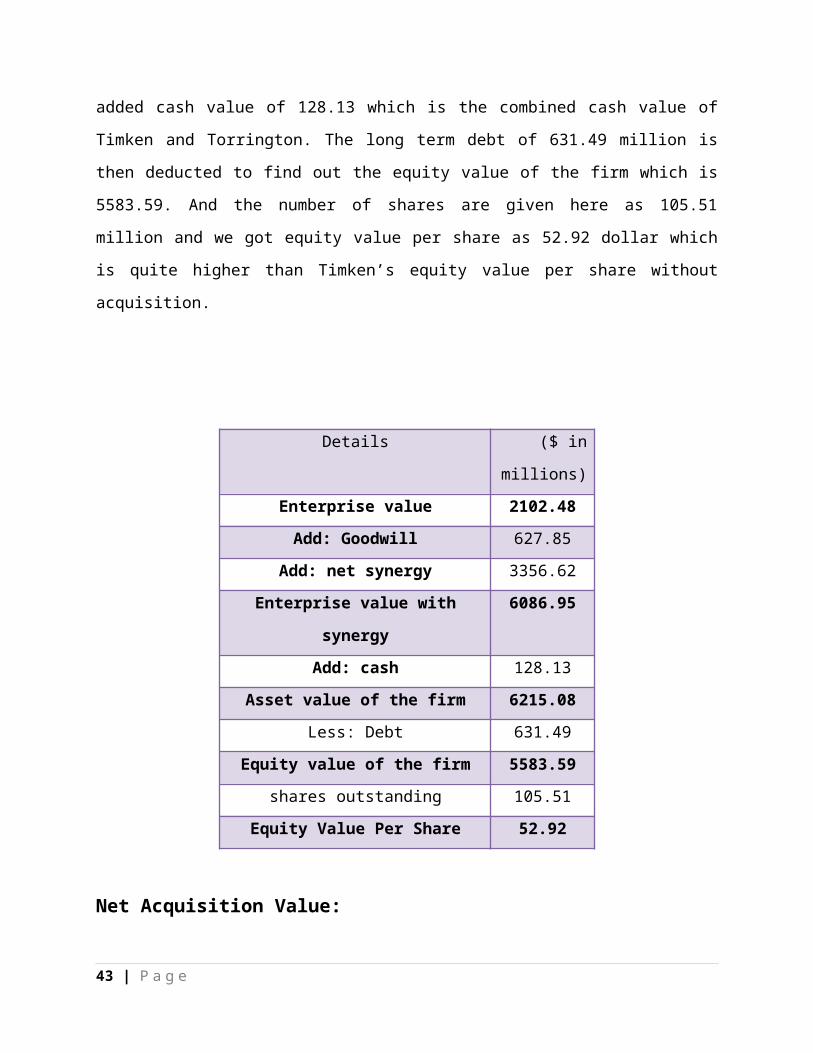
Here we get enterprise value as 2102.48 million and after adding goodwill and net synergy
value we get 6086.95. Here goodwill is determined by deducting the market value of land and
property of Torrington from purchase price (800-172.15=627.85).Then we have added cash
value of 128.13 which is the combined cash value of Timken and Torrington. The long term debt
of 631.49 million is then deducted to find out the equity value of the firm which is 5583.59. And
the number of shares are given here as 105.51 million and we got equity value per share as
52.92 dollar which is quite higher than Timken’s equity value per share without acquisition.
Details ($ in millions)
Enterprise value 2102.48
Add: Goodwill 627.85
Add: net synergy 3356.62
Enterprise value with synergy 6086.95
Add: cash 128.13
Asset value of the firm 6215.08
Less: Debt 631.49
Equity value of the firm 5583.59
shares outstanding 105.51
Equity Value Per Share 52.92
34 | P a g e

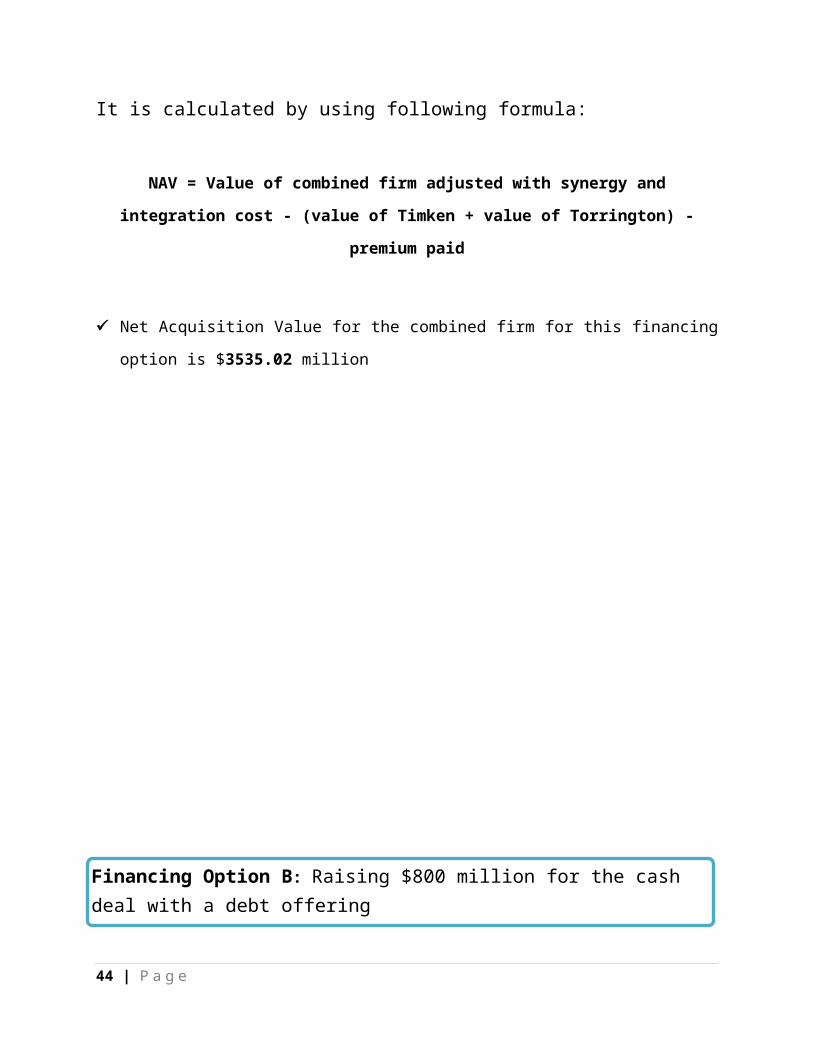
Net Acquisition Value:
It is calculated by using following formula:
NAV = Value of combined firm adjusted with synergy and integration cost - (value of Timken +
value of Torrington) - premium paid
Net Acquisition Value for the combined firm for this financing option is $3535.02 million
35 | P a g e
Financing Option B: Raising $800 million for the cash deal with a debt offering
WACC Calculation for the combined firm:
Here, Timken will raise $800 million with a debt offering. So their total debt will increase by 800 million
and will become 1431.49 million. By adding the values of Timken and Torrington we can get combined
value of Timken after aquiring Torrington.
36 | P a g e
Timken(after acquiring Torrington)
Risk free Rate 3.55%
Market Return 12.0%
Beta 1.2
Cost of Equity 13.69%
Cost of Debt 10.84%
After Tax cost of debt 6.50%
Weight of Debt 0.702
Weight of Equity 0.298
Total Debt 1431.49
Total Market Value of Equity 609.10
Total Value(Debt+ Equity) 2040.59
Income Tax 40%
Terminal Growth rate 3%
WACC 11.65%
Here we get enterprise value as 1407.216 million and after adding goodwill and net synergy
value we get 5391.68. Here goodwill is determined by deducting the market value of land and
property of Torrington from purchase price (800-172.15=627.85).Then we have added cash
value of 128.13 which is the combined cash value of Timken and Torrington. The long term debt
of 1431.49 million is then deducted to find out the equity value of the firm which is 4088.328.
And the number of shares are given here as 63.4 million and we got equity value per share as
64.48 dollar which is quite higher than Timken’s equity value per share without acquisition and
financing option A. But in this option, Timken will be forced to borrow the money at “high-
yield” rates which will lead to non- investment grade rating and that is not good for the
company.
Details ($ in millions)
Enterprise value 1407.216
Add: Goodwill 627.8535
Add: net synergy 3356.619
Enterprise value with synergy 5391.688
Add: cash 128.13
Asset value of the firm 5519.816
Less: Debt 1431.49
Equity value of the firm 4088.328
shares outstanding 63.4
Equity Value Per Share 64.48468
37 | P a g e
Net Acquisition Value:
NAV = Value of combined firm adjusted with synergy and integration cost - (value of Timken +
value of Torrington) - premium paid
Net Acquisition Value for the combined firm for this financing option is $2109 million which
is lower than the previous financing option. So it will not maximize Timken’s value
WACC Calculation
for the combined
firm:
Here, Timken will raise $800
million with a combination of
debt and equity financing where
they will issue shares worth of
38 | P a g e
Financing Option C: Raising $800 million with a combination of debt and equity financing (50:50 ratio)
Timken(after acquiring Torrington)
Risk free Rate 3.55%
Market Return 10.0%
Beta 1.1
Cost of Equity 10.65%
Cost of Debt 7.69%
After Tax cost of debt 4.61%
Weight of Debt 0.505
Weight of Equity 0.495
Total Debt 1031.49
Total Market Value of Equity 1009.10
Total Value(Debt+ Equity) 2040.59
Income Tax 40%
Terminal Growth rate 3%
WACC 7.60%

400 million with a debt offering of 400 million. So their total debt will increase by 400 million and will
become 1031.49 million. Equity will also increase by 400 million and will become 1009.10. For raising
400 million Timken will issue new shares of 21.05 at current market price which is 19. By adding the
values of Timken and Torrington we can get combined value of Timken after aquiring Torrington.
Here we get enterprise value as 2587.49 million and after adding goodwill and net synergy
value we get 6571.97. Here goodwill is determined by deducting the market value of land and
property of Torrington from purchase price (800-172.15=627.85).Then we have added cash
value of 128.13 which is the combined cash value of Timken and Torrington. The long term debt
of 1031.49 million is then deducted to find out the equity value of the firm which is 5668.607.
And the number of shares are given here as 84.45 million and we got equity value per share as
67.12 dollar which is quite higher than Timken’s equity value per share without acquisition and
financing option A as well as B.
Details ($ in millions)
Enterprise value 2587.494
Add: Goodwill 627.8535
Add: net synergy 3356.619
Enterprise value with synergy 6571.966
Add: cash 128.13
Asset value of the firm 6700.094
Less: Debt 1031.49
Equity value of the firm 5668.607
shares outstanding 84.45263
Equity Value Per Share 67.12173
39 | P a g e
Net Acquisition Value:
NAV = Value of combined firm adjusted with synergy and integration cost - (value of Timken +
value of Torrington) - premium paid
Net Acquisition Value for the combined firm for this financing option is $3655 million which
is higher than previous financing options.
Alternative 2: Acquisition of Torrington Company from Ingersoll-Rand by stock offering to Ingersoll-
Rand:
Timken could acquire Torrington by offering its stocks to Ingersoll. For this purpose Timken could issue
$400 million equity and $300 million debt and could make the payment of $700 million in cash. As well
as it can offer its stocks worth $100 million. In our case study analysis the new shares that Torrington
would get have been calculated through exchange ratio.
Exchange ratio:
New shares of target firm = α × Old shares of acquiring firm
(1-α)
Exchange ratio = New shares of target firm
Old shares of target firm
40 | P a g e
Here α has been calculated by dividing the purchase price $800 million of Torrington by the after
acquisition equity value of the firm with stock and cash offering of $5770.58 million. New shares
exchanged for existing shares of Timken Company to Ingersoll would be $1.11805204. Total shares
outstanding would be the addition of new shares with the old shares by 63.4+1.11= 64.52 shares.
Exchange ratio comes from the new shares 1.11 divided by the existing shares of Torrington of 29.17.
Here Torrington’s shares have been calculated assuming the accordance with the sales percentage of
13.45% of Ingersoll Company. Thus 29.17 shares have been calculated by the percentage of Torrington’s
sales of Ingersoll company out of Ingersoll’s share outstanding shares of 216.85.
Assumptions for the combined firm:
Timken(after
acquiring Torrington)
Terminal Growth rate 3%
WACC 7.59%
Risk free Rate 3.55%
Market Return 10.0%
Beta 1%
Cost of Debt 7.69%
Income Tax 40%
WACC Calculation for the combined firm:
WACC
Risk free Rate 3.55%
Market Return 10.0%
Beta 1
41 | P a g e

Cost of Equity 10.00%
Cost of Debt 7.69%
After Tax cost of debt 4.61%
Weight ot Debt 0.5060816
Weight of Equity 0.4939184
Total Debt 931.49
Total Market Value of Equity 909.10
Total Value(Debt+ Equity) 1840.59
Income Tax 40%
WACC 7.27%
Here additional $300 million debt has been added with existing $631.49 million debt. As well as new
equity has been added by $400 million shares with existing equity of Timken of $609.1 million. As $100
million worth shares would be given to Ingersoll equivalent amount would be deducted from the total
value of equity.
Here we get enterprise value as $2777.21 million and after adding goodwill and net synergy value we
get $3356.619. Here goodwill is determined by deducting the market value of land and property of
Torrington from purchase price ($800-$172.15=$627.85).Then we have added cash value of $128.13
which is the combined cash value of Timken and Torrington. The long term debt of $931.49 million is
then deducted to find out the equity value of the firm which is $5770.58. And the number of shares are
given here as 63.4 million plus the new shares found from equity issuing worth of ($400/19=21.05)
million and we got equity value per share as $69.6596 which is quite highest than Timken’s equity value
per share without acquisition and cash financing options. In this option, Timken will be able to borrow
the money at “lower-yield” rates which will enable Timken to keep its existing investment grade rating
and that is good for the company.
42 | P a g e
Enterprise Value 2777.21
(+)Goodwill 627.8535
(+)net synergy 3356.619
Enterprise value with synergy 6761.683
(+)cash 128.13
Asset value of the firm 6889.81
(-)Debt 931.49
Equity value of the firm 5958.32
shares outstanding 85.53485
Equity Value Per Share 69.6596
Recommendation
At the last of our analysis we would like to recommend that Timken should acquire Torrington
form Ingersoll-Rand.
Positives:
It will increase market share within Global Industry from 7% to 11%
Will become 3rd largest producer of Bearings in the World
5 % overlap in product offerings and 80% consumer overlap
Expected annual cost savings of $80 million annually by 2007
Financing method:
Optimal capital structure is the combination of debt and equity. Timken should acquire
Torrington by a cash deal of $700 million and the additional $100 million worth of shares
will be issued directly to Ingersoll-Rand as consideration for Torrington with an exchange
ratio of .038:1 where 1.12 shares will be issued as new shares.
43 | P a g e
Equity value per share will be $89.44 and Net Acquisition value will be $3755 million which
is the highest among all other alternatives.
Cash deal of $700 million will be financed by raising equity of $400 million and a debt deal
of $300 million
44 | P a g e


