82
REPORT TO THE LEGISLATURE GAS-FIRED POWER PLANT NOx EMISSION CONTROLS AND RELATED ENVIRONMENTAL IMPACTS Stationary Source Division May 2004 State of California
REPORT TO THE LEGISLATURE
GAS-FIRED POWER PLANT NOx EMISSION CONTROLS AND RELATED ENVIRONMENTAL
IMPACTS
Stationary Source Division
May 2004
State of California

State of California AIR RESOURCES BOARD
Report to the Legislature
Gas-Fired Power Plant NOx Emission Controls and Related Environmental Impacts
May 2004
Prepared by
Stationary Source Division
This report has been prepared by the staff of the Air Resources Board. Publication does not signify that the contents reflect the views and policies of the Air Resources Board, nor does mention of trade names or commercial products constitute endorsement or recommendation for use.
Prepared by
Air Resources Board Staff
Primary Author Stephanie Kato, Air Resources Engineer
Contributing Stationary Source Division Staff Merrin Bueto, Air Pollution Specialist
Chris Gallenstein, Air Pollution Specialist
Stationary Source Division Management Review Beverly Werner, Manager
Regulatory Assistance Section
Michael J. Tollstrup, Chief Project Assessment Branch
Robert D. Barham, Ph.D., Assistant Chief Stationary Source Division
Peter D. Venturini, Chief Stationary Source Division

TABLE OF CONTENTS
I. EXECUTIVE SUMMARY....................................................................................................... 1
II. CALIFORNIA POWER GENERATION AND AIR QUALITY PROFILE......................... 5 A. Power Generation in California...................................................................................... 5 B. Power Plant NOx Emissions........................................................................................... 6 C. Regulation of Emissions.................................................................................................. 7
III. EMISSION CONTROL METHODS..................................................................................... 9 A. Selective Catalytic Reduction......................................................................................... 9
1. Technology Description............................................................................................. 9 2. Emission Performance ............................................................................................10 3. Concurrent Reduction of CO and VOC Emissions .............................................13
a. Technology Description.....................................................................................13 b. Emission Performance ......................................................................................13
B. SCONOxÔ Catalytic Absorption System...................................................................14 1. Technology Description...........................................................................................14 2. Emission Performance ............................................................................................16
C. Turbine-Integrated Controls..........................................................................................19 1. Lean Premix Combustors .......................................................................................19
a. Technology Description.....................................................................................19 b. Emission Performance ......................................................................................19
2. Xonon Cool CombustionÔ Catalytic Combustor.................................................20 a. Technology Description.....................................................................................20 b. Emission Performance ......................................................................................21 c. Commercial Availability .....................................................................................22
3. Low Emission Combustor Liner.............................................................................23 a. Technology Description.....................................................................................23 b. Emission Performance ......................................................................................23 c. Commercial Availability .....................................................................................24
D. Zero-SlipÔ Ammonia Reduction Technology............................................................24 1. Technology Description...........................................................................................24 2. Emission Performance ............................................................................................24
IV. ENVIRONMENTAL IMPACTS ...........................................................................................26 A. Selective Catalytic Reduction.......................................................................................26
1. Ammonia Slip............................................................................................................26 2. Ammonia Handling and Storage............................................................................29 3. Spent Catalyst Waste ..............................................................................................31
B. SCONOx Catalytic Absorption System.......................................................................32 1. Spent Catalyst Waste ..............................................................................................32 2. Catalyst Regeneration System...............................................................................32 3. Catalyst Washing .....................................................................................................32
V. CONTROL COST INFORMATION....................................................................................34
VI. REFERENCES.....................................................................................................................37
APPENDICES
Appendix A: Emission Controls Required for Power Plant Gas Turbines Appendix B: Emission Source Test Results for Power Plant Gas Turbines Appendix C: Area Designations for State PM2.5 Ambient Air Quality Standard Appendix D: Comment Letters
LIST OF TABLES
Table II-1. California Generation (Operational plant of 0.1 MW and greater) ................... 5 Table II-2. California Power Generating Turbine NOx Emission Control Technologies.. 7 Table II-3. Summary of BACT for Gas Turbine Power Plants of 50 MW and Greater..... 8 Table III-1. Typical Operating Temperatures for SCR Catalysts.......................................10 Table III-2. Recent NOx Limits for Gas Turbine Power Plants Using SCR.....................10 Table III-3. NOx Limits for Combined-Cycle and Cogeneration Gas Turbine Power
Plants Using SCONOx......................................................................................................16 Table III-4. NOx Emissions from Gas Turbines with Lean Premix Combustors .............19 Table III-5. NOx Limits for Combined-Cycle/Cogeneration Gas Turbine Power Plants
Using Xonon........................................................................................................................21 Table III-6. U.S. EPA ETV Program Verification Statement of Xonon NOx Control
Performance........................................................................................................................21 Table IV-1. Toxic Air Contaminants, Hazardous Air Pollutants, and Criteria Pollutants
from Natural Gas Combustion in Turbines.....................................................................26 Table IV-2. Hazardous Material Laws, Ordinances, Regulations, and Standards .........30 Table IV-3. Post-Combustion NOx Control Technologies for Gas Turbine Power Plants
Approved by the California Energy Commission since 1997* ....................................31 Table V-1. Estimated Average Cost of Post-Combustion Control Technology for a 500-
MW Combined-Cycle Gas Turbine Power Plant Meeting BACT................................34 Table V-2. Selective Catalytic Reduction Cost Estimates for a Simple-Cycle Gas
Turbine Power Plant Meeting BACT...............................................................................35 Table V-3. SCONOx Cost Estimates for Combined-Cycle and Cogeneration Gas
Turbine Power Plants Under 50 MW...............................................................................35 Table V-4. Control Cost Estimates for Turbine-Integrated NOx Control Technologies.36
LIST OF FIGURES
Figure II-1. California In-State Fuel-Fired Generation........................................................... 5 Figure II-2. 2002 Statewide Estimated Annual Average NOx Emissions from Stationary
Sources.................................................................................................................................. 6
Figure III-1. Cross-Section of SCONOx System..................................................................16 Figure III-2. Schematic of Xonon Cool Combustion Technology System........................20 Figure IV-1. Year 2000 Ammonia Inventory for South Coast AQMD (tons per day)......28 Figure IV-2. Year 2000 Ammonia Inventory for San Joaquin Valley APCD (tons per
day).......................................................................................................................................29
ACRONYMS
ARB or Board ATC BACT CAPCOA CEC CEMS CEQA CH4
CO CO2 CTG DB district or air district DLN gr gr/dscf H2
H2O HHV HRSG HSC lb/day lb/hr lb/MMBtu lb/MWh MMBtu/hr MW N2 NH3
NO NO2 NOx NSR O2 OEM PM10 PM2.5 ppmvd RATA RCRA SCR San Joaquin Valley APCD scf SIP South Coast AQMD SOx TAC tpd U.S. EPA VOC
California Air Resources Board Authority to Construct best available control technology California Air Pollution Control Officers Association California Energy Commission continuous emission monitoring system California Environmental Quality Act methane carbon monoxide carbon dioxide combustion turbine generator duct burners air pollution control or air quality management district dry low-NOx combustors grains grains per dry standard cubic feet molecular hydrogen water higher heating value heat recovery steam generator California Health and Safety Code pounds per day pounds per hour pounds per million British Thermal Units pounds per megawatt-hour million British Thermal Units per hour megawatts molecular nitrogen ammonia nitric oxide nitrogen dioxide oxides of nitrogen New Source Review oxygen original equipment manufacturer particulate matter 10 micrometers in diameter and smaller particulate matter 2.5 micrometers in diameter and smaller parts per million by volume on a dry basis relative accuracy test audit Resource Conservation and Recovery Act selective catalytic reduction San Joaquin Valley Air Pollution Control District standard cubic feet State Implementation Plan South Coast Air Quality Management District oxides of sulfur toxic air contaminant tons per day United States Environmental Protection Agency volatile organic compound

I. EXECUTIVE SUMMARY
In the Supplemental Report of the 2003 Budget Act 2003-04 Fiscal Year, the Legislature directed the State Air Resources Board (ARB or Board) to investigate and provide a one-time report to the Governor and the Legislature by March 1, 2004, on control technologies that reduce oxides of nitrogen (NOx) emissions from gas-fired power plants and that do not use or produce toxic or hazardous materials or create other environmental impacts. The directive was included as Item 3900-001-0001 in the Budget Act Report and states the following:
“Power Plant Emission Control Systems. On or before March 1, 2004, the Air Resources Board shall report to the Legislature and the Governor on the benefits, detriments, and advisability of using technologies that reduce or eliminate NOx emissions from gas-fired power plants and that do not use or produce toxic or hazardous materials or create other significant adverse environmental impacts. This report shall be prepared in consultation with the appropriate policy and fiscal committees of the Legislature, air districts, and the public.”
Stakeholder Participation
As stated, the Legislature required the ARB to develop this report in consultation with the appropriate policy and fiscal committees of the Legislature, air districts, and the public. Staff made conscious efforts to ensure that the appropriate stakeholders were aware of, and had an opportunity to participate in, the report development process. ARB staff’s public outreach efforts involved contact and/or interaction with:
• Government agencies (California Legislature, California Energy Commission, California air pollution control and air quality management districts, California Independent System Operator, United States Environmental Protection Agency);
• Industry (basic equipment vendors, energy consultants, emission control equipment vendors, power producers);
• Organizations (Institute of Clean Air Companies, Independent Energy Producers, American Lung Association of California, Natural Resources Defense Council, California Council for Environmental and Economic Balance); and
• other interested parties.
Staff contacted over 400 affected parties (including individuals and organizations) by one or more of the following means: telephone, electronic mail, or regular mail. In addition, staff developed and regularly updated (with list serve notification) a web page (http://www.arb.ca.gov/energy/noxlegrpt.htm) describing the report, its status, and contact information. Primary outreach activities included:
• site visit to a power plant to observe a gas turbine equipped with the SCONOxÔ catalytic absorption system;
• survey of 20 NOx emission control system vendors requesting environmental impact and cost data for gas turbine power plants [Note: feedback via survey was limited to
1

five respondents representing selective catalytic reduction (SCR), Xonon Cool CombustionÔ catalytic combustor, Low Emissions Combustor Liner, and SCONOx];
• survey of power plant operators to obtain feedback on the performance and operation of SCR;
• discussion of the report with representatives of the California Air Pollution Control Officers Association (CAPCOA); and
• Public Consultation Meeting.
A draft of the report was made available for public comment prior to finalization.
Scope of the Report
Considering the Legislature’s intent and consulting with affected stakeholders, ARB staff determined that the report should focus on a particular segment of the power generation sector. The following summarizes the major components:
• Electrical generating units at fossil gas-fired power plants may consist of boilers, turbines, or reciprocating engines. Recent activity in the electrical generation sector in California has consisted primarily of the construction of large new power plants comprised of simple- or combined-cycle turbines fueled by natural gas. For the purposes of this report, gas-fired power plants are defined to include new installations of natural gas-fired turbine electrical generating power facilities with capacities of 50 megawatts (MW) and greater.
• California has one of the most effective New Source Review programs in the country, with requirements for advanced emission control technology on new and expanding sources as its foundation. Therefore, this report focuses on NOx control technologies that can meet or assist in meeting emission levels currently established as best available control technology (BACT) by California air regulatory agencies. The current BACT level for NOx emissions from natural gas-fired electrical generation turbines is £2.0 parts per million by volume on a dry basis at 15 percent oxygen (ppmvd at 15% O2) and £3.0 ppmvd at 15% O2 for cogeneration/combined-cycle and simple-cycle power plants, respectively.
Use of the Report
This report is intended to be used strictly as an informational document, providing an overview of available NOx emission control technologies for natural gas-fired turbine power plants (herein “gas turbines”) and a description of some of the auxiliary environmental impacts that may be considered when evaluating power plant projects. The report is not intended to establish new BACT emission levels or certify or validate any emission levels purported to be achieved at various facilities. In addition, the report is not intended to be used as a substitute for a California Environmental Quality Act (CEQA) review or any other environmental analysis required by a regulatory agency in accordance with applicable laws, ordinances, regulations, or standards.
2
Findings
This report does not include conclusions or recommendations. Instead, it provides information that can be used as a starting point in conducting more detailed site-specific analyses of the environmental advantages and disadvantages of control technologies that reduce NOx emissions from natural gas-fired power plants. The research performed and data collected to complete this report have provided the following findings for further consideration in conducting such evaluations:
Emission Control Methods and BACT • The SCONOx catalytic absorption system produces beneficial NOx, carbon
monoxide (CO), and volatile organic compound (VOC) emission reductions without the associated environmental impacts from ammonia use and can achieve emission levels required as BACT in California. At this time, the system has been demonstrated on smaller turbine applications (=43 MW).
• Selective catalytic reduction (SCR) in conjunction with an oxidation catalyst produces beneficial and comparable NOx, CO, and VOC emission reductions as SCONOx and can achieve emission levels required as BACT in California. Auxiliary environmental impacts from SCR are associated with the use of ammonia.
• Lean premix combustors are effective up-front pollution prevention devices but cannot currently achieve the level of NOx emissions required as BACT in California.
• Lean premix combustors in conjunction with SCONOx or SCR have demonstrated the ability to achieve the progressive NOx emission levels required as BACT in California.
• The Xonon Cool Combustion system has shown to be an effective pollution prevention device that can achieve NOx emission levels required as BACT in California for both simple-cycle and combined cycle gas turbine power plants without the associated environmental impacts from ammonia use; however, the technology has limited applications at this time.
• The Low Emission Combustor III Liner is a relatively new aftermarket pollution prevention device without the associated environmental impacts from ammonia use. Initial installations have shown the ability to achieve sub-5 ppmvd NOx emission levels, which may satisfy BACT requirements in some cases. A testing and validation program is under way to refine the device to achieve NOx emissions equivalent to BACT without the need for post-combustion emission control. Currently, the technology is more marketable as a retrofit control technology. It is limited to specific turbine types but is expanding its base.
3

Environmental Impacts • Where ammonia and particulate matter emissions are a concern, elimination or
minimization of ammonia slip or application of an ammonia catalyst is an option.
• Depending on the types and quantities of constituents, spent SCR catalysts may be considered hazardous wastes. However, there are programs in place to manage the catalysts by recycling components or disposing of the catalysts in approved landfills.
• With respect to the hazards associated with anhydrous and aqueous ammonia, it appears there is no compelling reason not to use SCR for NOx emission control unless there are unusual circumstances specific to a power plant site that would deem ammonia use a high-risk alternative.
Cost of Control • Available cost data indicates that SCR used in conjunction with an oxidation
catalyst costs less than SCONOx for the same level of emissions reduction. More detailed cost comparison information is presented in Chapter V.
4
II. CALIFORNIA POWER GENERATION AND AIR QUALITY PROFILE
A. Power Generation in California
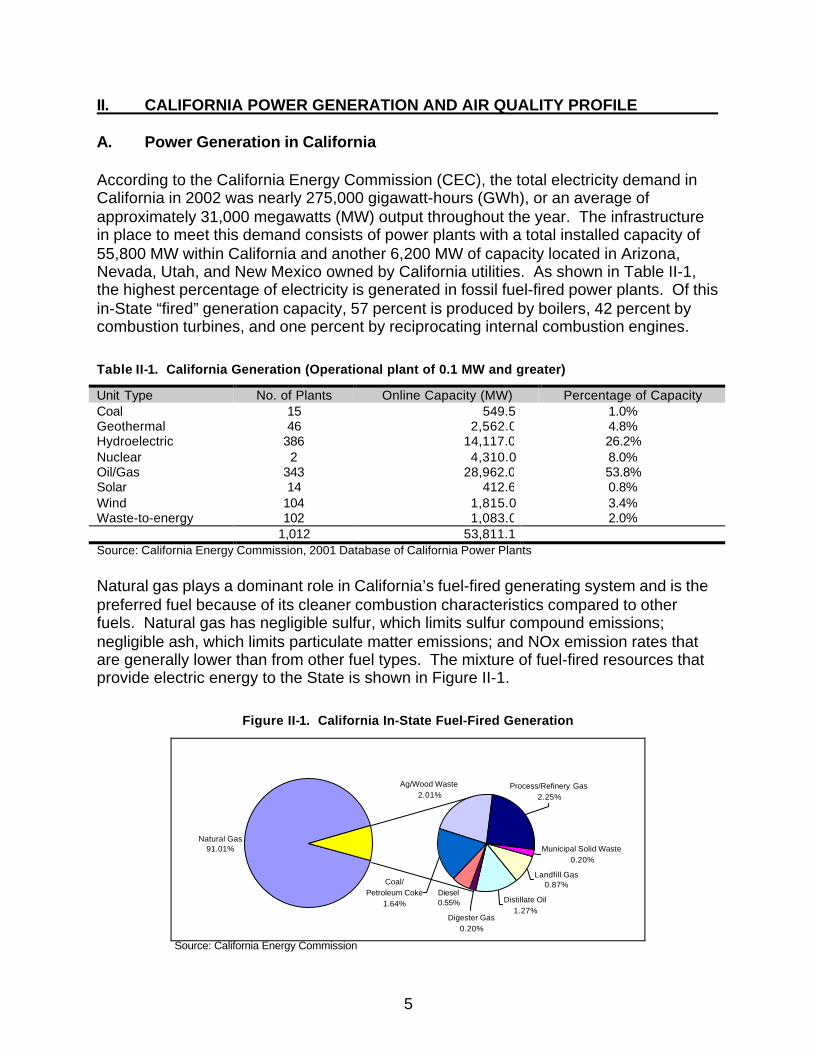
According to the California Energy Commission (CEC), the total electricity demand in California in 2002 was nearly 275,000 gigawatt-hours (GWh), or an average of approximately 31,000 megawatts (MW) output throughout the year. The infrastructure in place to meet this demand consists of power plants with a total installed capacity of 55,800 MW within California and another 6,200 MW of capacity located in Arizona, Nevada, Utah, and New Mexico owned by California utilities. As shown in Table II-1, the highest percentage of electricity is generated in fossil fuel-fired power plants. Of this in-State “fired” generation capacity, 57 percent is produced by boilers, 42 percent by combustion turbines, and one percent by reciprocating internal combustion engines.
Table II-1. California Generation (Operational plant of 0.1 MW and greater)
Unit Type No. of Plants Online Capacity (MW) Percentage of Capacity Coal 15 549.5 1.0% Geothermal 46 2,562.0 4.8% Hydroelectric 386 14,117.0 26.2% Nuclear 2 4,310.0 8.0% Oil/Gas 343 28,962.0 53.8% Solar 14 412.6 0.8% Wind 104 1,815.0 3.4% Waste-to-energy 102 1,083.0 2.0%
1,012 53,811.1 Source: California Energy Commission, 2001 Database of California Power Plants
Natural gas plays a dominant role in California’s fuel-fired generating system and is the preferred fuel because of its cleaner combustion characteristics compared to other fuels. Natural gas has negligible sulfur, which limits sulfur compound emissions; negligible ash, which limits particulate matter emissions; and NOx emission rates that are generally lower than from other fuel types. The mixture of fuel-fired resources that provide electric energy to the State is shown in Figure II-1.
Figure II-1. California In-State Fuel-Fired Generation
Ag/Wood Waste Process/Refinery Gas 2.01% 2.25%
Natural Gas 91.01% Municipal Solid Waste
0.20%
Landfill Gas Coal/ 0.87%
Petroleum Coke Diesel Distillate Oil1.64% 0.55%
1.27% Digester Gas
0.20%
Source: California Energy Commission
5
The passage of Assembly Bill 1890 (Statutes of 1996, Chapter 854) deregulated the electric utility industry in California and prompted an increase in new power plant construction. The majority of these projects have consisted of large plants (500 MW and greater) producing electricity using stationary combustion turbines fueled with natural gas and equipped with state-of-the-art air pollution control technologies. Since 1999, the CEC has approved power plant applications totalling 15,767 MW—of these, 8,311 MW have come online since 2000. Additional projects amounting to about 5,200 MW are currently under review at the CEC; another 780 MW have been publicly announced.
B. Power Plant NOx Emissions
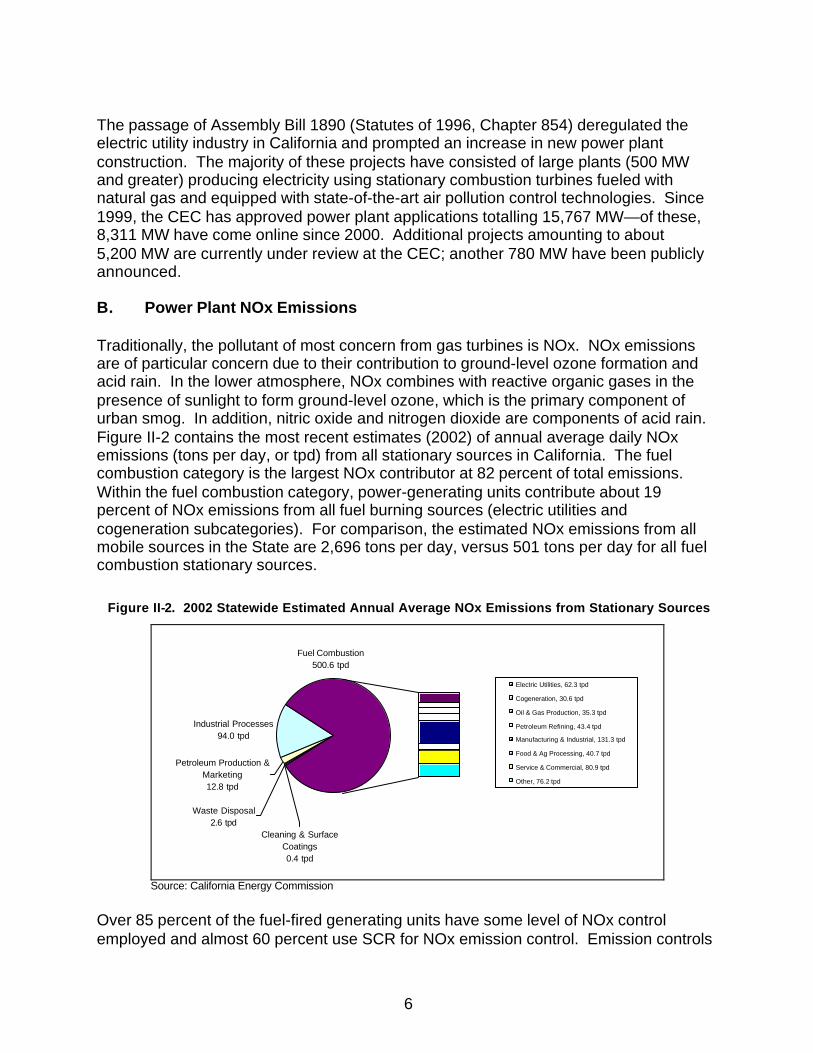
Traditionally, the pollutant of most concern from gas turbines is NOx. NOx emissions are of particular concern due to their contribution to ground-level ozone formation and acid rain. In the lower atmosphere, NOx combines with reactive organic gases in the presence of sunlight to form ground-level ozone, which is the primary component of urban smog. In addition, nitric oxide and nitrogen dioxide are components of acid rain. Figure II-2 contains the most recent estimates (2002) of annual average daily NOx emissions (tons per day, or tpd) from all stationary sources in California. The fuel combustion category is the largest NOx contributor at 82 percent of total emissions. Within the fuel combustion category, power-generating units contribute about 19 percent of NOx emissions from all fuel burning sources (electric utilities and cogeneration subcategories). For comparison, the estimated NOx emissions from all mobile sources in the State are 2,696 tons per day, versus 501 tons per day for all fuel combustion stationary sources.
Figure II-2. 2002 Statewide Estimated Annual Average NOx Emissions from Stationary Sources
Waste Disposal 2.6 tpd
Cleaning & Surface Coatings 0.4 tpd
Petroleum Production & Marketing 12.8 tpd
Industrial Processes 94.0 tpd
Fuel Combustion 500.6 tpd
Electric Utilities, 62.3 tpd
Cogeneration, 30.6 tpd
Oil & Gas Production, 35.3 tpd
Petroleum Refining, 43.4 tpd
Manufacturing & Industrial, 131.3 tpd
Food & Ag Processing, 40.7 tpd
Service & Commercial, 80.9 tpd
Other, 76.2 tpd
Source: California Energy Commission
Over 85 percent of the fuel-fired generating units have some level of NOx control employed and almost 60 percent use SCR for NOx emission control. Emission controls
6

employed on fuel-fired turbines are summarized in Table II-2. Approximately 93 percent of turbines have some level of NOx control.
Table II-2. California Power Generating Turbine NOx Emission Control Technologies
Type of Control System Gas Turbines
No. of Units Capacity (MW)
Selective Catalytic Reduction or SCR (includes units 183 8,620.0 that have other up-front controls such as DLN) SCONOx 3 68.8 Xonon Cool Combustion 1 1.5 Dry Low-NOx Combustors 31 1,427.9 Steam Injection 17 970.8 Water Injection 138 2,296.0 Uncontrolled 27 517.9
400 13,903 Source: Air Resources Board Power Plant Database
C. Regulation of Emissions
Air quality regulations limit emissions from new pollutant sources through performance standards and requirements to obtain emission reductions from existing sources through the use of retrofit technologies. Regulations require the installation of control devices, fuel use restrictions, operational limits, offsetting of emission increases, and caps on total emissions from a source.
New Source Review and Best Available Control Technology
New Source Review (called NSR) is a preconstruction permitting program that regulates new and existing sources that emit or have the potential to emit any pollutant (or precursor) above specific thresholds for which there is a State or federal ambient air quality standard. Best available control technology (BACT) is the cornerstone of the program—requiring a new or expanded source to meet the most stringent emission level achievable by current technology. NSR rules allow growth while minimizing emissions. Emission increases that remain after the application of BACT are offset with reductions in emissions at existing sources to result in no net increase in emissions.
In 1999, the Board adopted the Guidance for Power Plant Siting and Best Available Control Technology. The guidance is a non-regulatory document intended to assist the local air quality management and air pollution control districts (air districts) in making permitting decisions as they participate in the CEC’s power plant siting process. The guidance helps ensure that new gas turbine power plants employ BACT and are constructed and operated in a way that eliminates or minimizes adverse air quality impacts. The BACT emission levels recommended by ARB staff in the guidance are summarized in Table II-3. Using the guidance as a benchmark, the emission control technologies described in this report are those that have the ability to meet or are an integral component in meeting California BACT emission levels for natural gas-fired turbine power plants. It should be noted that the recommended BACT emission levels in Table II-3 were considered to be contemporaneous with the publishing of ARB’s
7

guidance and are subject to change if operational data or advances in technology demonstrate that lower levels have been achieved or are achievable at a reasonable cost. Since adoption of the guidance, ARB staff believes electrical generation gas turbines can meet lower levels.
Table II-3. Summary of BACT for Gas Turbine Power Plants of 50 MW and Greater
NOx CO VOC PM10 SOx NH3 Combined-Cycle and Cogeneration Configurations 2.5 ppmvd @ 6 ppmvd @ 2 ppmvd @ Emission limit corresponding to £5 ppmvd @
15% O2, 1-hour 15% O2, 3-hour 15% O2, 1-hour natural gas with fuel sulfur 15% O2 rolling average rolling average rolling average content £1 gr/100 scf OR 2.0 ppmvd OR 0.0027 @ 15% O2, 3- lb/MMBtu
hour rolling (HHV) average
Simple-Cycle Configurations 5 ppmvd @ 6 ppmvd @ 2 ppmvd @ Emission limit corresponding to £5 ppmvd @
15% O2, 3-hour 15% O2, 3-hour 15% O2, 3-hour natural gas with fuel sulfur 15% O2 rolling average rolling average rolling average content £1 gr/100 scf
OR 0.0027 lb/MMBtu
(HHV)
8
III. EMISSION CONTROL METHODS
This chapter focuses on five pollutant control technologies that reduce NOx emissions from electrical generation natural gas-fired turbines. For each control technology, a description of how the device works and a summary of emission performance capabilities are provided. As mentioned previously, the control technologies described in this chapter are those that have the ability to meet or that facilitate meeting the ARB’s recommended BACT emission levels for power plant gas turbines.
A. Selective Catalytic Reduction
Selective catalytic reduction (SCR) of NOx using ammonia as the reducing agent was first patented in the United States in the 1950s. In California, SCR is the most widely developed and applied post-combustion NOx control technology for power plants. The Institute of Clean Air Companies (ICAC) reports that more than 100 systems have been installed in combined-cycle gas turbine applications in the United States since 1986.
1. Technology Description
Selective catalytic reduction is a post-combustion control technology capable of reducing NOx emissions by about 80 to 95 percent. Selective catalytic reduction systems selectively reduce NOx by combining ammonia (NH3) and oxygen (O2) with NOx in the turbine exhaust gas in the presence of a catalyst to form molecular nitrogen (N2) and water (H2O). The primary chemical reactions are shown below.
Chemistry of the SCR Process 4NO + 4NH3 + O2 ® 4N2 + 6H2O 2NO2 + 4NH3 + O2 ® 3N2 + 6H2O
The catalyst, comprised of parallel plates or honeycomb structures, is installed in the form of rectangular modules, downstream of the gas turbine in simple-cycle configurations and into the heat recovery steam generator (HRSG) portion of the gas turbine downstream of the superheater in combined-cycle and cogeneration configurations. A typical SCR system is comprised of an ammonia storage tank, vaporization and injection equipment for ammonia, a booster fan for the flue gas, a SCR reactor with catalyst, and instrumentation and control equipment.
The turbine exhaust gas must contain a minimum amount of oxygen and be within a particular temperature range in order for the SCR system to operate properly. The temperature range is dictated by the catalyst, which is typically made from noble metals, base metal oxides, or zeolite-based material. Typical temperature ranges for SCR catalysts are shown in Table III-1. Keeping the exhaust gas temperature within these ranges is important. If it drops below, the reaction efficiency becomes too low and increased amounts of NOx and ammonia will be released out the stack. If the reaction temperature gets too high, the catalyst may begin to decompose. Turbine exhaust gas
9
is generally in excess of 1000 °F. Heat recovery steam generators cool the exhaust gases before they reach the catalyst by extracting energy from the hot turbine exhaust gases and creating steam for use in other industrial processes or to turn a steam turbine. In simple-cycle power plants where no heat recovery is accomplished, high temperature catalysts that can operate at temperatures up to 1050 °F, are an option.
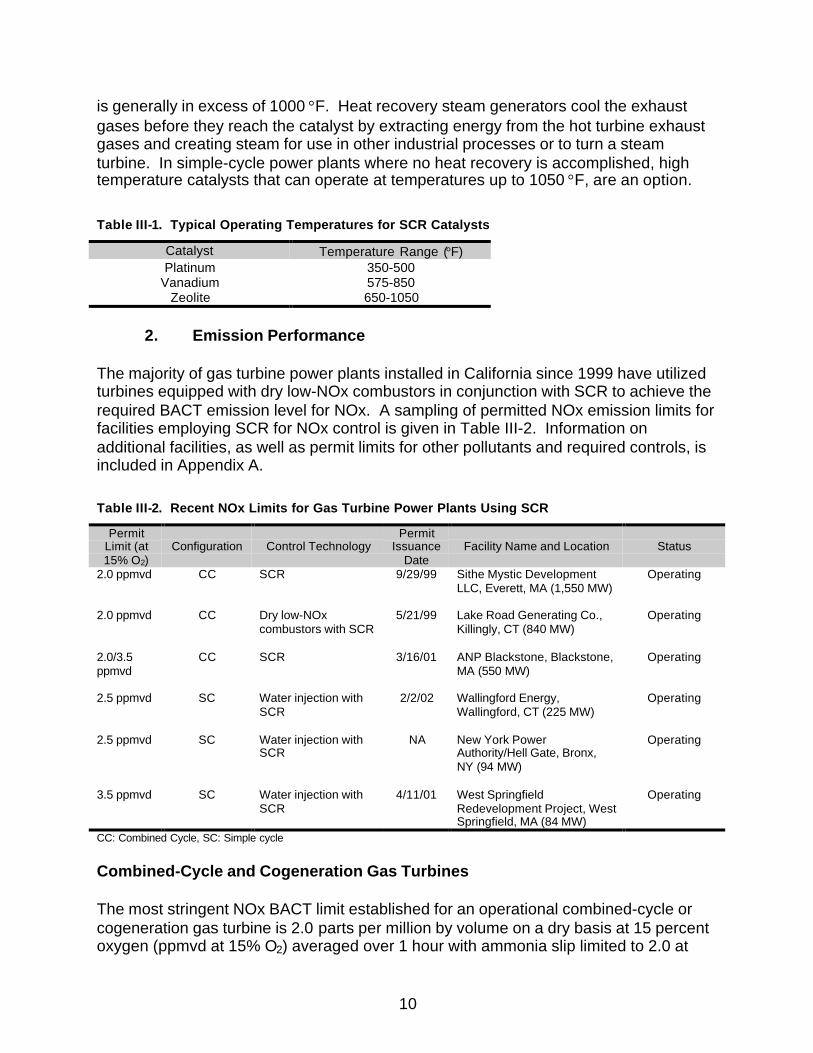
Table III-1. Typical Operating Temperatures for SCR Catalysts
Catalyst Temperature Range (°F) Platinum 350-500
Vanadium 575-850 Zeolite 650-1050
2. Emission Performance
The majority of gas turbine power plants installed in California since 1999 have utilized turbines equipped with dry low-NOx combustors in conjunction with SCR to achieve the required BACT emission level for NOx. A sampling of permitted NOx emission limits for facilities employing SCR for NOx control is given in Table III-2. Information on additional facilities, as well as permit limits for other pollutants and required controls, is included in Appendix A.
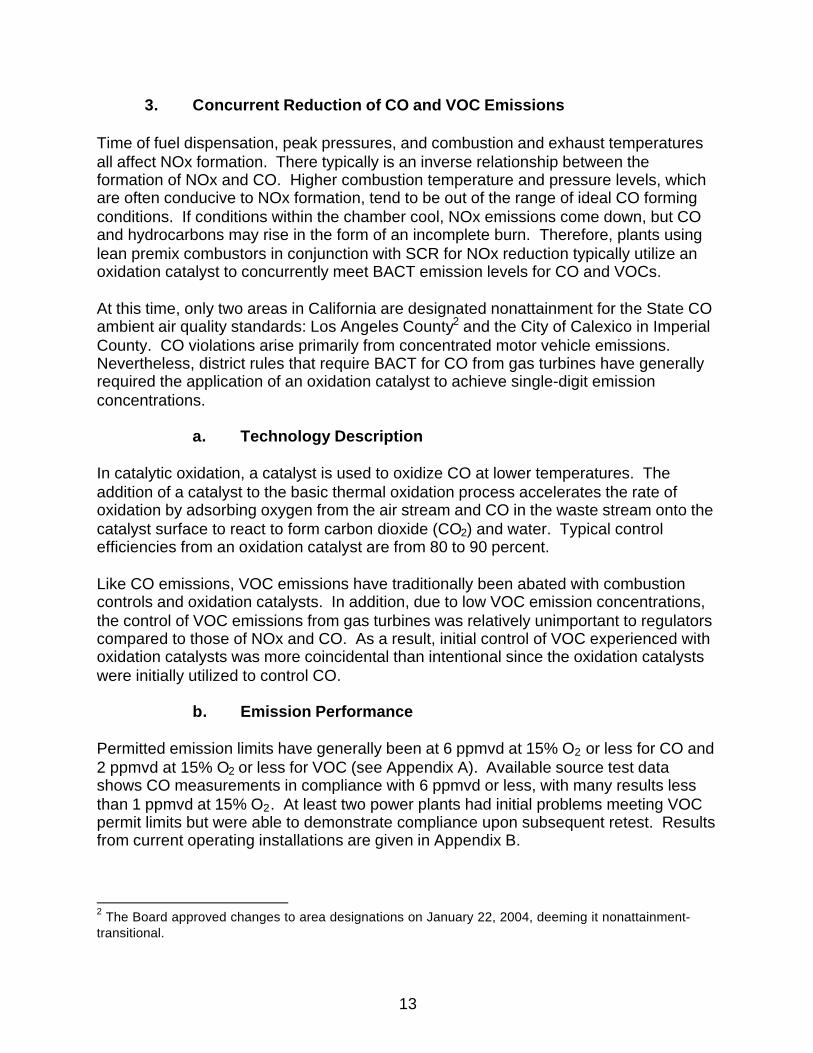
Table III-2. Recent NOx Limits for Gas Turbine Power Plants Using SCR
Permit Permit Limit (at Configuration Control Technology Issuance Facility Name and Location Status 15% O2) Date
2.0 ppmvd CC SCR 9/29/99 Sithe Mystic Development LLC, Everett, MA (1,550 MW)
Operating
2.0 ppmvd CC Dry low-NOx combustors with SCR
5/21/99 Lake Road Generating Co., Killingly, CT (840 MW)
Operating
2.0/3.5 ppmvd
CC SCR 3/16/01 ANP Blackstone, Blackstone, MA (550 MW)
Operating
2.5 ppmvd SC Water injection with SCR
2/2/02 Wallingford Energy, Wallingford, CT (225 MW)
Operating
2.5 ppmvd SC Water injection with SCR
NA New York Power Authority/Hell Gate, Bronx, NY (94 MW)
Operating
3.5 ppmvd SC Water injection with SCR
4/11/01 West Springfield Redevelopment Project, West Springfield, MA (84 MW)
Operating
CC: Combined Cycle, SC: Simple cycle
Combined-Cycle and Cogeneration Gas Turbines
The most stringent NOx BACT limit established for an operational combined-cycle or cogeneration gas turbine is 2.0 parts per million by volume on a dry basis at 15 percent oxygen (ppmvd at 15% O2) averaged over 1 hour with ammonia slip limited to 2.0 at
10

15% O2. This NOx emission level was first achieved at ANP Blackstone in Blackstone, Massachusetts, on two 180-MW ABB GT-24 gas turbines equipped with SCR. These units have been operating since mid-2001.
On April 16, 2003, the South Coast Air Quality Management District (South Coast AQMD) established new BACT emission levels for combined-cycle and cogeneration gas turbines of 2.0 ppmvd NOx and 3.0 ppmvd CO at 15% O2, 1-hour average. The BACT levels were determined to be achieved-in-practice based on operating data from the ANP Blackstone site. Source test data from 2001 and 2002 accepted by the Massachusetts Department of Environmental Protection showed compliance with the permit limits, except for a July 2001 50-percent load test on Unit 2 that exceeded the PM10 limit. Unit 2 was retested in December 2001 and was well below the limit. Results of certified continuous emissions monitoring system (CEMS) data available from U.S. EPA’s Acid Rain web site for the first three quarters of 2002 showed NOx in compliance with the 2.0 ppmvd limit with very few exceptions during over 2,300 hours of operation of Unit 1 and over 3,700 hours of Unit 2. More exceedances were observed during the first year of operation; however portions may have been representative of commissioning activities.
Emission test data results for ANP Blackstone as well as other similar power plants indicate compliance with NOx emissions of 2.5 ppmvd at 15% O2 or less through the application of SCR in conjunction with dry low-NOx combustors. Available source test data results are summarized in Appendix B Table B-1.
Simple-Cycle Gas Turbines
The most stringent NOx BACT limit for an operational simple-cycle gas turbine is 2.5 ppmvd at 15% O2 averaged over 1 hour with ammonia slip limited to 6 ppmvd at 15% O2 averaged over 3 hours. This NOx limit is required in the permit for Wallingford Energy in Wallingford, Connecticut, on five 45-MW GE LM6000 gas turbines. The turbines are equipped with water injection and SCR for NOx control and have been operating since 2001. The Connecticut Department of Environmental Protection stated that the facility had initial problems meeting the NOx and ammonia slip limits concurrently, but reported that those problems have been fixed and the units now run in compliance.
Emission test data for similar power plants indicate compliance with NOx emissions of 5 ppmvd at 15% O2 and less through the application of SCR in conjunction with water/steam injection or dry low-NOx combustors. Source test data results available from representative plants are included in Appendix B Table B-2.
11

It should be noted that most recent simple-cycle gas turbine power plant installations are comprised of single or multiple aeroderivative-type turbines.1 Aeroderivative turbines have lower exhaust temperatures (about 750-975 °F) than their larger industrial frame turbine counterparts (as high as about 1100 °F); therefore frame turbines are a common choice for combined-cycle and cogeneration plants because of the superior thermal efficiency. As a result, there is much less experience with application of SCR on industrial frame turbines in simple-cycle configuration.
Exhaust air cooling has been used on many simple-cycle aeroderivative turbine applications to lower exhaust gas temperatures below 900 °F, so a vanadium catalyst can be used (less expensive than zeolite). Air cooling is not as widely used on frame machines. Although theoretically feasible, SCR system suppliers and power plant proponents report it is not practical to cool an 1100 °F exhaust down to the range where a combined-cycle system catalyst operates. The higher volume of air added creates the need for flow straightening devices/baffles due to mixing/stratification issues. No major technical feasibility issues have been cited from using high-temperature SCR with a minimal level of exhaust cooling. The ARB’s Guidance for Power Plant Siting and Best Available Control Technology states case-by-case BACT determinations may be warranted for simple-cycle gas turbines with higher exhaust temperatures (i.e., industrial frame turbines).
Operator Experience
ARB staff conducted a phone survey of gas turbine power plant operators in the State at sites employing SCR for NOx reduction. ARB staff contacted 46 facilities and received feedback from the representatives of 32 sites. The purpose of the survey was to obtain feedback on the overall performance of SCR systems. In terms of emissions, operators reported that the SCR systems have been performing as guaranteed by the manufacturers. In the majority of responses, the catalyst has lasted considerably longer than the three-year guarantees that are typical in today’s market—the average catalyst life was about nine years, with the longest going on 16 years. Over half of the operators cited no environmental issues or concerns with the SCR system. About one-third of the operators stated the most significant environmental concern with the SCR system is dealing with ammonia (both aqueous and anhydrous); though of these, no one reported any major incidences with ammonia handling and storage or experienced problems with system operation. There were concerns expressed regarding ammonia slip emissions, and the creation of a new pollutant (i.e., secondary particulate matter) from the attempt to reduce NOx (see discussion in Chapter IV). Lastly, a couple of operators relayed concerns about spent catalyst disposal and maintaining consistency and accuracy in emissions and measurement due to the low levels required to meet BACT in California.
1 As the name suggests, aeroderivative turbines were adapted to land applications from aircraft engine designs. Because there are weight and size limitations for aircraft, aeroderivative turbines tend to be lighter weight. Industrial frame-type turbines tend to be larger, more rugged, and better suited to base-load operation.
12
3. Concurrent Reduction of CO and VOC Emissions
Time of fuel dispensation, peak pressures, and combustion and exhaust temperatures all affect NOx formation. There typically is an inverse relationship between the formation of NOx and CO. Higher combustion temperature and pressure levels, which are often conducive to NOx formation, tend to be out of the range of ideal CO forming conditions. If conditions within the chamber cool, NOx emissions come down, but CO and hydrocarbons may rise in the form of an incomplete burn. Therefore, plants using lean premix combustors in conjunction with SCR for NOx reduction typically utilize an oxidation catalyst to concurrently meet BACT emission levels for CO and VOCs.
At this time, only two areas in California are designated nonattainment for the State CO ambient air quality standards: Los Angeles County2 and the City of Calexico in Imperial County. CO violations arise primarily from concentrated motor vehicle emissions. Nevertheless, district rules that require BACT for CO from gas turbines have generally required the application of an oxidation catalyst to achieve single-digit emission concentrations.
a. Technology Description
In catalytic oxidation, a catalyst is used to oxidize CO at lower temperatures. The addition of a catalyst to the basic thermal oxidation process accelerates the rate of oxidation by adsorbing oxygen from the air stream and CO in the waste stream onto the catalyst surface to react to form carbon dioxide (CO2) and water. Typical control efficiencies from an oxidation catalyst are from 80 to 90 percent.
Like CO emissions, VOC emissions have traditionally been abated with combustion controls and oxidation catalysts. In addition, due to low VOC emission concentrations, the control of VOC emissions from gas turbines was relatively unimportant to regulators compared to those of NOx and CO. As a result, initial control of VOC experienced with oxidation catalysts was more coincidental than intentional since the oxidation catalysts were initially utilized to control CO.
b. Emission Performance
Permitted emission limits have generally been at 6 ppmvd at 15% O2 or less for CO and 2 ppmvd at 15% O2 or less for VOC (see Appendix A). Available source test data shows CO measurements in compliance with 6 ppmvd or less, with many results less than 1 ppmvd at 15% O2. At least two power plants had initial problems meeting VOC permit limits but were able to demonstrate compliance upon subsequent retest. Results from current operating installations are given in Appendix B.
2 The Board approved changes to area designations on January 22, 2004, deeming it nonattainment-transitional.
13

B. SCONOx™ Catalytic Absorption System
SCONOx is a post-combustion, multi-pollutant control technology, originally developed by Goal Line Environmental Technologies (now EmeraChem LLC).3 Alstom Power offers SCONOx for commercial sale and is the primary supplier for larger turbine installations. WahlcoMetroflex is also a supplier of SCONOx. The technology is capable of reducing emissions by approximately 90-95 percent for NOx and 90 percent for CO. Control efficiency for VOCs has varied, although there may be potential to control VOC up to 90 percent. The VOC emission guarantee is determined on a case-by-case basis based on the constituents in the exhaust gas.
1. Technology Description
The SCONOx system uses a single catalyst to remove NOx, CO, and VOC emissions in the turbine exhaust gas by oxidizing nitrogen oxide (NO) to nitrogen dioxide (NO2), CO to CO2, and hydrocarbons to CO2 and water, and then absorbing NO2 onto the catalytic surface using a potassium carbonate (K2CO3) absorber coating. The potassium carbonate coating reacts with NO2 to form potassium nitrites and nitrates, which are deposited onto the catalyst surface. SCONOx does not use ammonia; therefore there are no ammonia emissions from this catalyst system. The reactions are shown below.
Chemistry of the SCONOx Process NO + 1/2O2 ® NO2
CO + 1/2O2 ® CO2
CH2O + O2 ® CO2 + H2O 2NO2 + K2CO3 ® CO2 + KNO2 + KNO3
The SCONOx system is installed downstream of the gas turbine after the HRSG; whereas the SCR catalyst is installed within the HRSG in combined-cycle and cogeneration power plants. The optimal temperature window for operation of the SCONOx catalyst is from 300-700 °F. Therefore, the system is not currently offered for simple-cycle configurations.
Regeneration Cycle
When all of the potassium carbonate absorber coating has been converted to nitrogen compounds, NOx can no longer be absorbed and the catalyst must be regenerated. Regeneration is accomplished by passing a dilute hydrogen reducing gas (H2) across the surface of the catalyst in the absence of oxygen. Hydrogen in the gas reacts with the nitrites and nitrates to form water and molecular nitrogen. Carbon dioxide in the gas
3 SCONOxÔ is the trade name originally used by Goal Line. EMxÔ is the second-generation of the SCONOx technology available through EmeraChem. Because the operating principle is the same, this report uses SCONOx to describe applications of both the original SCONOx catalyst and the improved EMx catalyst.
14
reacts with the potassium nitrite and nitrates to form potassium carbonate, which is the absorbing surface coating on the catalyst.
Regeneration Reaction KNO2 + KNO3 + 4H2 + CO2 ® K2CO3 + 4H2O(g) + N2
The regeneration gas is produced by reacting natural gas with a carrier gas (such as steam) over a steam reforming catalyst. The reformer catalyst initiates the conversion of methane (CH4) to hydrogen. The reformer catalyst is located upstream of the SCONOx catalyst in a steam reformer reactor. The SCONOx reactor is composed of modules that contain multiple sections. Each section has a set of louvers that alternately close and seal each section of the module front and back for regeneration.
During regeneration, the operation of the SCONOx catalyst at temperatures below 500 °F may produce small amounts of hydrogen sulfide. Operation of the catalyst at temperatures above 500 °F may result in small amounts of sulfur dioxides. These emissions are typically below 5 percent of the Public Utilities Commission’s set limit for sulfur.
SCOSOx® Catalyst
The SCONOx catalyst is sensitive to contamination by sulfur in the combustion fuel. The SCOSOx catalyst is provided in conjunction with the SCONOx system as a “guard bed” to remove sulfur compounds from the gas turbine exhaust stream. It is nearly identical to the SCONOx catalyst, except that it favors sulfur compound adsorption. The SCOSOx catalyst blocks are placed upstream of the SCONOx catalyst. The SCOSOx system uses the same oxidation/absorption and regeneration cycle as the SCONOx system. The regeneration gas used for the SCONOx and SCOSOx catalysts is the same, allowing them to be regenerated simultaneously.
A typical SCONOx system is comprised of a catalyst rack and reactor housing with SCONOx and SCOSOx catalysts, catalyst module inlet and outlet dampers, regeneration gas production and distribution system, regeneration gas condensing and scrubbing system (optional), catalyst removal system, and instrumentation and control equipment.
15

Figure III-1. Cross-Section of SCONOx System
Photo: Courtesy of Alstom Power
2. Emission Performance
The SCONOx system is installed at a total of seven sites in the United States. The permitted NOx emission limits for these facilities are given in Table III-3. Additional information on emission limits and controls is summarized in Appendix A Table A-1. Results from selected installations are described below.
Table III-3. NOx Limits for Combined-Cycle and Cogeneration Gas Turbine Power Plants Using SCONOx
Permit Limit (at 15% O2)
Control Technology Size (MW)
Online Date Facility Name and Location Status
9 ppmvd Water injection with 32 12/28/96 Federal Cogeneration, Los No longer in SCONOx Angeles, CA service
2.5 ppmvd, Dry low-NOx combustors 6.2 07/1/99 Wyeth Bio Pharma #1 Operating 15.0 ppmvd (oil) with SCONOx (Genetics Institute),
Andover, MA
2.5 ppmvd SCONOx 26 July 01 University of California San Operating Diego, San Diego, CA
2.5 ppmvd SCONOx 43 June 02 City of Redding Power Operating Plant, Redding, CA
2.5 ppmvd, Dry low-NOx combustors 5.9 2003 Wyeth Bio Pharma #2, Operating 15.0 ppmvd (oil) with SCONOx Andover, MA
2.5 ppmvd, Dry low-NOx combustors 5.2 NA Montefiore Hospital, Bronx, NA 15.0 ppmvd (oil) with SCONOx NY
4 ppmvd target SCONOx 8 Installed Los Angeles International Control system June 01 Airport, Los Angeles, CA shut down
16

Installation Experience
Federal Cogeneration
SCONOx was first demonstrated commercially at Federal Cogeneration in Los Angeles commencing on December 28, 1996. The facility consisted of a 32-MW General Electric LM2500 gas turbine at a cogeneration plant. Initially, six months of CEMS data from June to December 1997 were reviewed by the United States Environmental Protection Agency (U.S. EPA) and the South Coast AQMD. In a March 23, 1998, letter, the U.S. EPA deemed 2.0 ppmvd NOx at 15% O2 averaged over 3 hours as demonstrated in practice. The South Coast AQMD subsequently determined BACT as 2.5 ppmvd NOx at 15% O2 averaged over 1 hour.4 Operating data from Federal Cogeneration set a precedent that future combined-cycle and cogeneration gas turbine projects subject to BACT must consider 2.5 ppmvd when making their BACT determination for NOx emissions. The SCONOx system is no longer in operation at this site, because the entire plant shutdown in 2003 due to market factors.
Wyeth Bio Pharma (Genetics Institute) Unit 1
The system serving the Unit 1 generating turbine at Wyeth Bio Pharma in Andover, Massachusetts, has been in operation since July 1, 1999. This installation operates at 650 °F to treat the exhaust gases from a Solar Taurus 60 gas turbine (6.2 MW) at a cogeneration plant. Natural gas is the primary fuel; however, the turbine is also permitted to use distillate fuel, which is fired during curtailment periods. Initially, when the turbine operated for long periods of time using oil, the SCONOx catalyst experienced sulfur masking problems that reduced the effectiveness of the NOx reductions. The masking was reversible, but required washing of the catalyst and therefore, shutdown of the turbine. The conditional permit included an 18-month commissioning period wherein the facility could continue to fine-tune the system to achieve the 2.5 and 15.0 ppmvd NOx at 15% O2 limits when firing natural gas and distillate fuel, respectively. During that time, EmeraChem made modifications to the SCONOx system such that oil usage no longer adversely affects the catalyst. The Massachusetts Department of Environmental Protection reports that the turbine is meeting its permit limits when firing natural gas and oil.
University of California San Diego
The system at the University of California San Diego has been in operation since July 2001. This installation operates at 420 °F to treat the exhaust gases from two Solar SoLoNOx Titan 130S gas turbines (26 MW) at a cogeneration plant. Initially, the facility was under a variance with the San Diego County Air Pollution Control District—the turbines passed the start-up source test, but failed their Relative Accuracy Test Audit
4 NOx limits of 2.0 and 2.5 ppmvd at 15% O2 with 3- and 1-hour averaging times, respectively, are generally recognized by California regulatory agencies as equivalent.
17
(RATA).5 The facility installed a multi-point probe and subsequently passed the test. The plant operator reports that the permit limits are being met, but that maintenance is more extensive than originally estimated. Quarterly CEMS reports from October 2002 through September 2003 indicate no excess NOx emissions. The plant operator reports NOx measurements meet the 2.5 ppmvd at 15% O2 permit limit between catalyst washings, which are currently conducted about every four months. During the wash process, the plant is down for about three days. The facility has determined that emission levels are best met when all three layers of catalyst are washed, not just the leading layer. Overall, the facility is pleased with the emissions performance, and they attribute the more frequent washing to the engineering design of the regeneration system (e.g., gas leaks and inefficiencies in regenerating sulfur from the SCOSOx guard bed). Based on experience from this site, EmeraChem has improved the regeneration system design.
City of Redding
The system at the City of Redding Power Plant in Redding, California, has been in operation since June 2002 and has accumulated approximately 8,300 hours of run time. This installation operates at 600 °F to treat the exhaust gases from an Alstom Power GTX 100 gas turbine (43 MW) at a combined-cycle plant. Redding Power owns the dampers but has a 15-year lease agreement on the catalyst from Alstom. As such, Alstom is in charge of ongoing catalyst maintenance. The Shasta County Air Quality Management District reports that there have been no major compliance issues in meeting the 2.5 ppmvd at 15% O2 NOx permit limit. To date, the SCONOx catalyst has required washing about three times per year, and the SCOSOx catalyst has not yet required washing. The wash process is generally completed over a weekend. The SCONOx reactor contains three layers of SCONOx catalyst. Since installation, the leading layer of SCONOx catalyst has been replaced—the second and third layers are the originals.
Los Angeles International Airport
The system at the Los Angeles International Airport is currently shut down and is the subject of litigation. This installation proposed to treat the exhaust gases from two Allison 501-KB5 dual fuel turbines (4 MW each). Natural gas was the primary fuel with fuel oil used as backup only. The turbines are existing units that fall under an emissions cap and have exhaust emissions of 40 ppmvd at 15% O2. The system was proposed as a voluntary control measure; therefore BACT was not required. However, NOx emissions after treatment with SCONOx were targeted at 4 ppmvd at 15% O2.
5 The RATA is essentially an on-site analyzer comparison test between the CEMS analyzers and those used by a RATA testing company. Both systems sample the same source and the results are subjected to statistical analysis and compared. The average accuracy of the CEMS analyzer relative to the RATA analyzer must be within a specific percentage.
18

C. Turbine-Integrated Controls
The control technologies described in this section are integrated into the basic turbine equipment. While these technologies cannot currently meet California NOx BACT requirements on their own, they are pollution prevention devices that help achieve BACT emission levels by reducing the creation and amount of pollutants that would otherwise be released prior to post-combustion treatment.
1. Lean Premix Combustors
a. Technology Description
The combustor is the space inside the gas turbine where fuel and compressed air are burned. Conventional combustors are diffusion controlled—meaning fuel and air are injected into the combustor separately and mix in small, localized zones. These zones burn hot and produce more NOx. In contrast, lean premix combustors (also often referred to as dry low-NOx combustors, or DLN, which GE pioneered in the early 1990s) minimize combustion temperatures by providing a lean premixed air/fuel mixture, where air and fuel are mixed before entering the combustor. This minimizes fuel-rich pockets and allows the excess air to act as a heat sink. The lower temperatures reduce NOx formation.
b. Emission Performance
At this time, GE Power Systems is the only manufacturer to offer a large frame-type gas turbine with DLN combustors that can achieve single-digit NOx emissions (i.e., £9 ppmvd at 15% O2). Other power systems manufacturers sell gas turbines equipped with lean premix combustors, but those units emit NOx in the 15-25 ppmvd range. Table III-4 contains a sampling of gas turbines that are available with lean premix combustors and their corresponding exhaust NOx emission levels. The reader should note that an aftermarket combustor is available that can achieve single-digit NOx emissions (see discussion in Section III.C.3.).
Table III-4. NOx Emissions from Gas Turbines with Lean Premix Combustors
OEM Gas Turbine Model Approximate
Output (MW)
Typical NOx Emissions (ppmvd at 15% O2)
Solar Turbines SoLoNOx Titan 130S 13 <15 Pratt & Whitney FT4-C Twin Pac 49 15 GE LM6000 48 25 GE Frame 7-1E/EA 85 9/25 GE Frame 7-1FA 171.7 9 Alstom Power GT24B 188 <25 Alstom Power GT26B 280.9 <25
Lean premix combustors alone cannot yet meet the current 2.5 ppmvd or less BACT requirement for NOx—prompting the need for post-combustion control systems such as
19
SCR and SCONOx. However, reduction of NOx emissions at the outset via lean premix turbines has facilitated achieving the low NOx levels currently required as BACT in California and elsewhere in the United States. Emission source test results from three GE Frame 7FA-type gas turbines equipped with DLN combustors are included in Appendix B Table B-2. Measured average emissions were less than 8 ppmvd NOx, less than 1.5 ppmvd CO, and less than 1 ppmvd VOC at 15% O2.
2. Xonon Cool Combustion™ Catalytic Combustor
Catalytica Energy Systems (spun-off from Catalytica, Inc. in December 2000 as a stand-alone public entity) first discovered and began applying for patents for its Xonon Cool Combustion technology in the late 1980s. Xonon utilizes a catalyst integrated into the gas turbine combustor to limit temperature below the temperature where NOx is formed. It also yields low CO and VOC emissions.
Each Xonon combustor is customized to the particular turbine model and application and is defined through a collaborative effort with the turbine original equipment manufacturer (OEM) to integrate the hardware into the design. Xonon is currently only commercially available from Kawasaki Gas Turbines-Americas on a small 1.4 MW gas turbine.
a. Technology Description
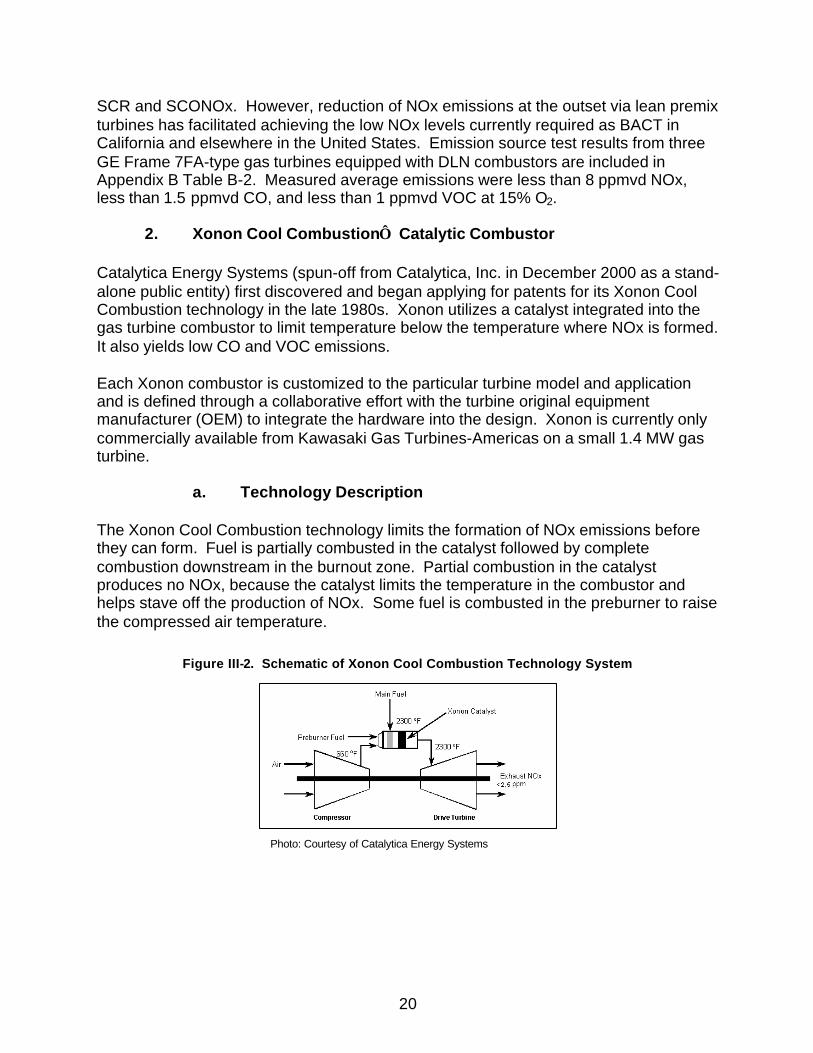
The Xonon Cool Combustion technology limits the formation of NOx emissions before they can form. Fuel is partially combusted in the catalyst followed by complete combustion downstream in the burnout zone. Partial combustion in the catalyst produces no NOx, because the catalyst limits the temperature in the combustor and helps stave off the production of NOx. Some fuel is combusted in the preburner to raise the compressed air temperature.
Figure III-2. Schematic of Xonon Cool Combustion Technology System
Photo: Courtesy of Catalytica Energy Systems
20

b. Emission Performance
Xonon is installed or under construction at a total of five sites in the United States. The permitted NOx emission limits for these facilities are given in Table III-5. Results from operating installations are described below.
Table III-5. NOx Limits for Combined-Cycle/Cogeneration Gas Turbine Power Plants Using Xonon
Permit Limit (at 15% O2)
Control Technology Online Date Facility Name and Location Status
5 ppmvd Xonon cool combustion 1999 Silicon Valley Power, Santa Clara, CA (1.4 MW)
Operating
20 ppmvd Xonon cool combustion Nov. 2002 Sonoma Development Center, Eldridge, CA (1.4 MW)
Operating
3.0 ppmvd Xonon cool combustion Nov. 2003 Plains Exploration & Production Company (1.4 MW)
Operating
NA Xonon cool combustion NA Pacific Union College, Angwin, CA (1.4 MW)
Under construction
3 ppmvd Xonon cool combustion NA Readers Digest Association, Pleasantville, NY (1.4 MW)
Under construction
Silicon Valley Power
The Xonon system was first designed into the combustor of a 1.4 MW Kawasaki Model M1A-13A gas turbine and began operating at Silicon Valley Power in Santa Clara, California, in 1999. Since its installation, the turbine has operated as a demonstration of Xonon’s performance and as a development and test unit in support of commercial program initiatives for customers. More than 18,000 hours of Xonon performance data has been accumulated on the demonstration unit.
Performance claims have been verified by the U.S. EPA through the Environmental Technology Verification (ETV) Program. U.S. EPA reviewed test results from the Silicon Valley Power facility conducted in July 2000 and verified the NOx emission results given in Table III-6.
Table III-6. U.S. EPA ETV Program Verification Statement of Xonon NOx Control Performance
Ambient Temperature Range
Percent of Full Turbine Load Range
Mean Outlet NOx Concentration ppmvd @
15% O2
Confidence Interval on Mean Outlet NOx ppmvd at 15% O2
59-77 °F 98-99% 1.13 0.026
Half-Width of 95%
The ARB also analyzed performance claims through its Equipment and Process Precertification Program. The ARB staff reviewed NOx and CO CEMS data from June 15, 1999 to December 16, 1999, from the same facility. Data reviewed included
21
15-minute and 1-hour rolling average emission values, including startup and shutdown periods. After evaluating all the test data, ARB staff concluded that Xonon achieved a NOx level of 2.5 ppmvd at 15% O2 and a CO level of 6.0 ppmvd at 15% O2, over a 1-hour rolling average at 98 percent or greater operating load of design capacity.
Sonoma Developmental Center
This system was a retrofit and has been operating since November 2002 in Eldridge, California. This installation consists of a Kawasaki MIA-13X (1.5 MW) gas turbine at a cogeneration plant. The modification did not trigger New Source Review, so the previous BACT limits were retained: 20 ppmvd NOx and 50 ppmvd CO at 15% O2, averaged over 3 consecutive hours. The expected performance was 3 ppmvd NOx and 10 ppmvd CO. The manufacturer reports that the unit has consistently achieved continuous NOx emission levels below the emission target—on the average, NOx emissions are under 2.0 ppmvd at 15% O2.
Plains Exploration & Production Company
This system was a new installation and represents the first complete commercial installation. It has been operating since November 2003 in San Luis Obispo, California. This installation consists of a Kawasaki GPB15X (1.4 MW) gas turbine at a cogeneration plant. The permitted limits are 3.0 ppmvd NOx, 10.0 ppmvd CO, and 2.0 ppmvd VOC at 15% O2, over a 3-hour rolling average. The manufacturer reports that the unit has consistently achieved continuous NOx emission levels below the permit limit—on the average, NOx emissions are around 0.8 ppmvd at 15% O2.
c. Commercial Availability
As a result of a collaborative agreement announced in December 2000, Kawasaki Gas Turbines-Americas markets and sells a GPB15X generator package including a 1.4-MW M1A-13X gas turbine equipped with Xonon. Kawasaki will provide a performance guarantee for NOx of 3.0 ppmvd and 10.0 ppmvd at 15% O2 on a continuous basis over a 70-100 percent turbine operating load.
On April 25, 2001, Catalytica Energy Systems announced the shipment of full-size, pre-commercial Xonon catalyst modules to GE Power Systems. The modules have been undergoing testing at Nuovo Pignone (a GE Power Systems business) in Florence, Italy, in support of commercial delivery of GE10 gas turbines (11.3 MW) equipped with Xonon. Currently, there is no firm timeline for commercial delivery of a GE10 turbine with Xonon.
In October 2001, Catalytica Energy Systems entered into an agreement with Solar Turbines for adaptation of Xonon to the Solar Taurus 70 gas turbine. The first Xonon test module was delivered to Solar in December 2002 in preparation for initial testing during 2003.
22
3. Low Emissions Combustor (LEC-IIITM) Liner
Power Systems Manufacturing LLC, a subsidiary of San Jose, California based Calpine Corporation, has developed its proprietary Low Emissions Combustor III (LEC-IIITM) liner that produces single-digit NOx and CO emissions without post-combustion controls.
a. Technology Description
The LEC-IIITM liner is a patented aftermarket system designed to be a “drop-in” replacement for existing GE frame gas turbine combustors outfitted with either diffusion or DLN combustors. Power System’s lean, premixed combustion design involves premixing of fuel and air in the combustion system through innovative fuel gas injection methods and liner design. A forward-cooling flow venturi (the flame holder) in the combustion liner injects spent cooling air directly into the liner’s head end premixing chamber—reducing CO spikes at machine part load conditions. In addition, efficient cooling of the combustion liner is achieved through effusion cooling, where over 5,000 dimensionally controlled holes arrayed around the head end of the liner eliminate the need for thermal barrier coating. This improves cooling air requirements, aides in fuel/air mixing, and provides a more uniform thermal environment. The liner design allows for excellent heat transfer performance, low metal temperatures, and reduced NOx and CO emissions.
b. Emission Performance
The LEC-IIITM liner system was first installed in an existing 70-MW GE Frame 7EA gas turbine at TransAlta Cogeneration in Alberta, Canada, in 2001. Prior to the retrofit, the lowest emission levels from the turbine were reported at 17 ppmvd NOx and 14 ppmvd CO at 15% O2. After installation of the LEC system, emission levels of 6 ppmvd NOx and 2.5 ppmvd CO (average) at 15% O2 were measured. The turbine has since undergone a 24,000-hour major overhaul, which included removal and return of the hardware to the manufacturer for refurbishment. Reinstallation is planned for September 2004.
The second installation of the LEC-IIITM liner system occurred in March 2003 at Dow Chemical’s Power 8 facility in Freeport, Texas, on an 83-MW GE Frame 7EA gas turbine. The manufacturer offered an 8-ppmvd NOx guarantee with a design target of 5 ppmvd at 15% O2. Testing was conducted in April 2003 and emission levels of 4.75 ppmvd NOx at 15% O2 were reported while the turbine was operated without duct burners. During duct burner firing, NOx emissions were between 6.75 to 9.09 ppmvd at 15% O2, all with CO emissions below 1 ppmvd at 15% O2. NOx emissions over the entire premixed operation gas turbine load range were below 5 ppmvd at 15% 02
Two additional units will go into service in Texas in 2004.
23

c. Commercial Availability
The product is offered commercially for the GE Frame 7E/EA (85.4 MW) and GE 6B (42.1 MW) turbines. The guaranteed NOx and CO emission concentrations in the exhaust are 5 ppmvd at 15% O2 for both pollutants. The system is under development for the Siemens Westinghouse 501D5 gas turbine (173 MW). Additional development programs in 2004 involve the use of hydrogen-fuel blending to help drive emissions down to 2 ppm NOx as well as continued work on LEC systems for the GE 7FA (170 MW) and Siemens Westinghouse 501FD2 (283 MW) machines.
D. Zero-Slip™ Ammonia Reduction Technology
A new control technology called Zero-Slip technology has been developed for simultaneous control of NOx and ammonia emissions from combined-cycle gas turbine power plants. This system is being jointly demonstrated and offered for commercial sale by Cormetech and Mitsubishi Power Systems.
1. Technology Description
The system consists of a layer of conventional SCR catalyst followed by the Zero-Slip catalyst. Ammonia is injected into the combustion turbine exhaust through the ammonia injection grid (AIG). The exhaust continues through an optional static mixer to reduce non-uniformities and then flows through the SCR and Zero-Slip catalysts. Vendors report ammonia slip reduction to zero with NOx reductions of 90 percent and higher. The Zero-Slip catalyst consists of layers for both denitration and ammonia oxidation balanced to achieve zero ammonia slip. The net reactions are shown below.
Zero-Slip™ Catalyst Reaction NO + NH3 + 1/4O2 ® N2 + 3/2H2O
NH3 + 5/4O2 ® NO + 3/2H2O
2. Emission Performance
The first commercial demonstration of the Zero-Slip system is currently in operation at Paramount Petroleum Corporation, located in Paramount, California, within the jurisdiction of the South Coast AQMD. Paramount Petroleum is a natural gas-fired cogeneration plant consisting of a 7.5-MW Solar Taurus 70S gas turbine equipped with dry low-NOx combustors and a duct-fired HRSG. Emission controls include an oxidation catalyst, SCR catalyst, and the Zero-Slip catalyst. The turbine’s permitted emission limits are 2.5 ppmvd NOx, 6 ppmvd CO, 2 ppmvd VOC, and 5 ppmvd ammonia, at 15% O2 averaged over 60 minutes. The plant has been online for approximately one year.
Initial startup source tests measured VOC emissions in excess of the permitted limit. The facility was granted a variance by the South Coast AQMD and has conducted a
24

series of follow-up tests to pinpoint the problem. Measurements taken across each catalyst in the series showed a possible recombining of hydrocarbons across the various catalyst beds—particularly a consistent VOC emissions increase across the Zero-Slip catalyst. However after further investigation, facility representatives found lube oil contamination in the turbine and duct burner and determined this to be the likely cause of the problem. The contamination is being corrected and the facility anticipates they will have source test results in April 2004. Although VOC emissions initially exceeded permit levels due to the suspect contamination, CO and NOx emissions levels have been below permit limits. In addition, the NH3 emission level was measured at 0.1 ppmvd or less, which is also well below the permit level of 5 ppmvd.
25

IV. ENVIRONMENTAL IMPACTS
This chapter is intended to provide an overview of potential environmental impacts associated with the use of NOx emission control technologies for gas-fired turbines. While characterized as the cleanest of all the fossil fuels, the combustion of natural gas itself produces both criteria and toxic air pollutants (see Table IV-1). The impacts described herein are those environmental effects directly related to the use of the NOx control equipment.
NOx emission control technologies that are integrated into the combustion turbine itself can be considered pollution prevention equipment, because they reduce or eliminate the creation and amount of pollutants that would otherwise be released into the environment. The reduction of pollutants up-front lessens the hazards to public health and the environment associated with the release of such substances. ARB staff did not identify any substantial auxiliary environmental impacts from controls that are built into the combustion turbine unit. Therefore, the discussion focuses on potential environmental impacts associated with the post-combustion control systems, SCR and the SCONOx catalytic absorption system.
Table IV-1. Toxic Air Contaminants, Hazardous Air Pollutants, and Criteria Pollutants from Natural Gas Combustion in Turbines
TAC/HAP Adverse Health Effects Chlorine Formaldehyde
Respiratory, eye, and skin irritant; possible asthma exacerbation. Eye and respiratory irritant, asthma exacerbation, decreased pulmonary function, probable carcinogen.
Benzene Nickel Manganese Cobalt
Hematotoxic, carcinogen. Respiratory irritant, dermatitis, asthma. Neurotoxicity, developmental toxicity. Respiratory irritant, cardiac effects, immunological effects.
Chromium
Toluene Acetaldehyde
Contact dermatitis, skin and nasal irritant, bronchitis, asthma, developmental effects, carcinogen. Respiratory and eye irritant, central nervous system depressant. Respiratory irritant, possible asthma exacerbation, probable carcinogen.
N-Hexane M-Xylenem O-Xylene
Ethylbenzene
Mild central nervous system effects, polyneuropathy. Respiratory, eye, nose, and throat irritant; central nervous system depressant; possible gastrointestinal effects. Respiratory, eye, nose, and throat irritant; central nervous system depressant.
Criteria Pollutant Adverse Health Effects Ozone (precursors, NOx and Eye and respiratory irritant, asthma exacerbation, bronchitis, lung damage. VOC) Oxides of nitrogen Respiratory irritant, immunosuppressant, asthma exacerbation. Carbon monoxide Headache, irritability, impaired judgement and memory, breathlessness, aggravation of angina
and other cardiovascular diseases, developmental toxicity. Particulate matter Respiratory irritant; high levels associated with increased incidence of cardiovascular and lung
failure in elderly, asthma in children.
A. Selective Catalytic Reduction
1. Ammonia Slip
As described in Chapter III, SCR uses ammonia as a reducing agent in the process of controlling NOx emissions from gas turbines. The portion of the unreacted ammonia passing through the catalyst and emitted out of the exhaust stack is called “ammonia slip.”
26

Ammonia as a Toxic Air Emission
Ammonia is not a federal hazardous air pollutant or a State identified toxic air contaminant. However, due to acute and chronic non-cancer health effects, ammonia is potentially regulated under air district risk management programs. Such programs may include toxic New Source Review rules or policies and the requirements of the Air Toxics “Hot Spots” Program (California Health and Safety Code §44360 et seq.). Ammonia is listed under the Hot Spots Program, and therefore, sources are required to report the quantity of ammonia they routinely release into the air. Gas turbines using SCR typically have been limited to 10 ppmvd at 15% O2 ammonia slip. However, levels as low as 2 ppmvd at 15% O2 have been proposed and guaranteed by control vendors, and the ARB recommends that air districts evaluate slip limits of 5 ppmvd at 15% O2 or less.
Ammonia as a PM2.5 Precursor
Ammonia reacts with other pollutants to produce particulate matter. Ambient fine particulate matter (known as PM2.5) is composed of a mixture of particles directly emitted into the air and particles formed in air from the chemical transformation of gaseous pollutants (secondary particles). Principle types of secondary particles are ammonium sulfate and ammonium nitrate, which form in air from gaseous emissions of sulfur oxides and NOx, reacting with ammonia.
With the exception of the South Coast AQMD, ammonia is not currently regulated by air district New Source Review rules. New Source Review rules regulate criteria pollutants and their regulatory precursors. Although ammonia is recognized to contribute to ambient particulate matter concentrations, it is not listed in any California New Source Review rule as a precursor to PM10. As a result, air districts have regulated ammonia since the mid-1980s under nuisance and toxic air contaminant rules.
Prompted by the promulgation of new national ambient air quality standards for PM2.5 in 1997 and the establishment of a new State annual PM2.5 standard in June 2002 (effective July 5, 2003), the ARB has been working to assess the extent of and primary source contributors to the fine particulate matter problem in California.
PM2.5 Nonattainment Areas
Under the federal Clean Air Act, states must develop plans, known as State Implementation Plans (SIPs), describing how and when they will attain the national ambient air quality standards. State PM2.5 area designation recommendations are due to U.S. EPA in February 2004 and U.S. EPA will finalize designations by December 2004. A nonattainment designation means that the State must submit its SIP to U.S. EPA within three years after final designations are made (in 2007). ARB will recommend four nonattainment areas for the federal PM2.5 standards: South Coast, San Joaquin Valley, San Diego, and the City of Calexico.
27

State law does not require air districts to prepare plans for attaining PM standards, but does require that they adopt rules and regulations to attain them as expeditiously as possible. On January 22, 2004, the Board adopted new State area designations for PM2.5 and changes to existing State area designations for ozone, CO, and sulfates. The only attainment area for PM2.5 is the Lake County Air Basin (see Appendix C for PM2.5 area designations for all California air basins).
Ammonia Inventory
Most regions with air quality concerns have already estimated emissions for the particulate matter precursor gases—NOx, oxides of sulfur (SOx), and VOC—however they do not have estimates of ammonia emissions. The ARB has been working on developing a comprehensive ammonia inventory, and has developed preliminary emission inventories from most potential ammonia sources in the State. Most of the potentially significant sources of ammonia are area-wide sources such as livestock, fertilizer application, and soils.
Regarding ammonia slip from power plant NOx emission controls, the estimates show this to be a relatively minor source of ammonia. For example, in the South Coast, the power plant related ammonia emissions are estimated at 0.6 tons per day, or 0.3 percent of the total ammonia emissions (see Figure IV-1). In the San Joaquin Valley, the power plant related ammonia emissions are approximately 0.6 tons per day, or 0.2 percent of the total ammonia emissions (see Figure IV-2).
Figure IV-1. Year 2000 Ammonia Inventory for South Coast AQMD (tons per day)
0
10
20
30
40
50
60
70
NH
3 , tp
d
Livestock Soil Fertilizer Domestic Mobile Industrial Waste Native Animals
} NOx Control
Source: Final 1997 Gridded Ammonia Emission Inventory Update for the South Coast Air Basin; prepared by AVES, ENVIRON, and others for the South Coast AQMD; August 2000.
28
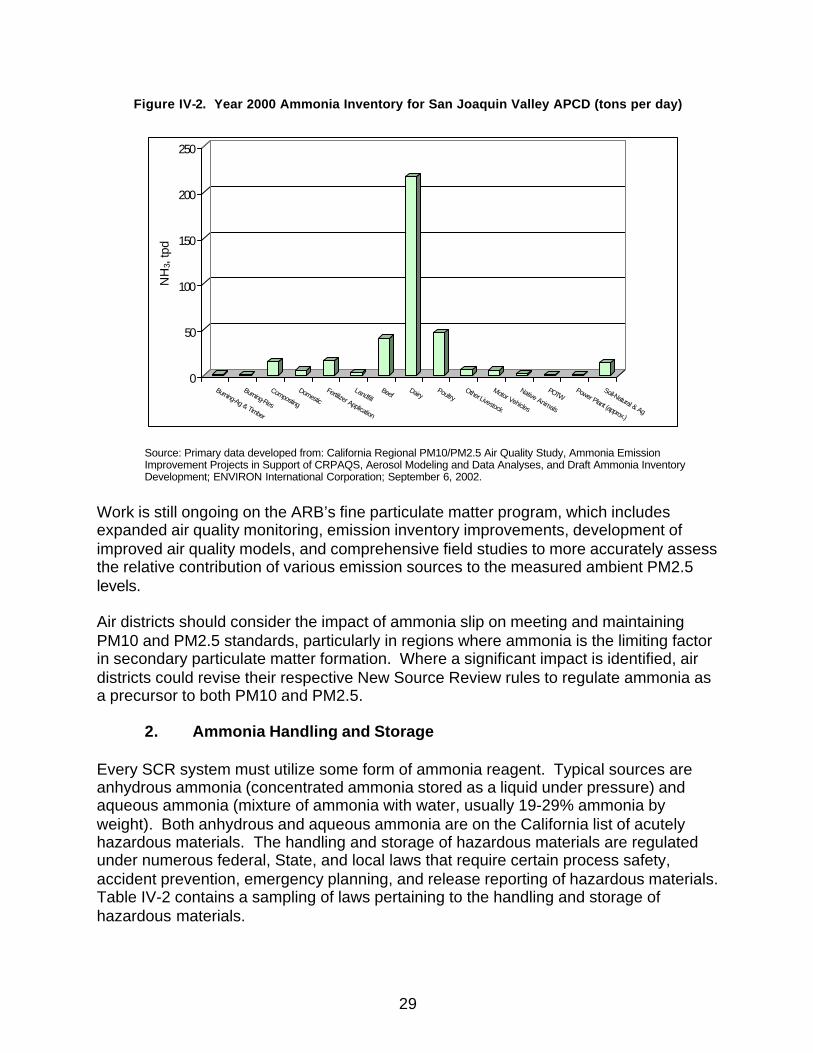
Figure IV-2. Year 2000 Ammonia Inventory for San Joaquin Valley APCD (tons per day)
0
50
100
150
200
250 N
H3,
tpd
Burning-Ag & Timber
Burning-Res
Composting
Domestic
Fertilizer Application
Landfill Beef
Dairy Poultry
Other Livestock
Motor Vehicles
Native Animals
POTW Power Plant (approx.)
Soil-Natural & Ag
Source: Primary data developed from: California Regional PM10/PM2.5 Air Quality Study, Ammonia Emission Improvement Projects in Support of CRPAQS, Aerosol Modeling and Data Analyses, and Draft Ammonia Inventory Development; ENVIRON International Corporation; September 6, 2002.
Work is still ongoing on the ARB’s fine particulate matter program, which includes expanded air quality monitoring, emission inventory improvements, development of improved air quality models, and comprehensive field studies to more accurately assess the relative contribution of various emission sources to the measured ambient PM2.5 levels.
Air districts should consider the impact of ammonia slip on meeting and maintaining PM10 and PM2.5 standards, particularly in regions where ammonia is the limiting factor in secondary particulate matter formation. Where a significant impact is identified, air districts could revise their respective New Source Review rules to regulate ammonia as a precursor to both PM10 and PM2.5.
2. Ammonia Handling and Storage
Every SCR system must utilize some form of ammonia reagent. Typical sources are anhydrous ammonia (concentrated ammonia stored as a liquid under pressure) and aqueous ammonia (mixture of ammonia with water, usually 19-29% ammonia by weight). Both anhydrous and aqueous ammonia are on the California list of acutely hazardous materials. The handling and storage of hazardous materials are regulated under numerous federal, State, and local laws that require certain process safety, accident prevention, emergency planning, and release reporting of hazardous materials. Table IV-2 contains a sampling of laws pertaining to the handling and storage of hazardous materials.
29
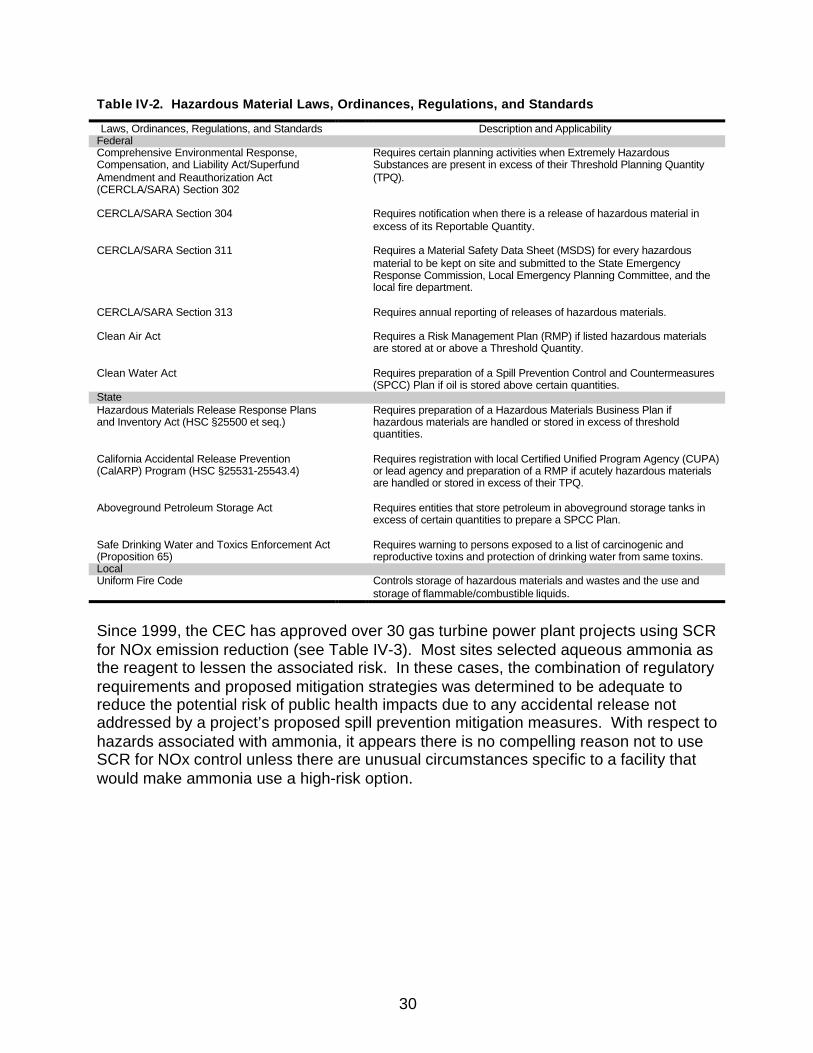
Table IV-2. Hazardous Material Laws, Ordinances, Regulations, and Standards
Laws, Ordinances, Regulations, and Standards Federal Comprehensive Environmental Response, Compensation, and Liability Act/Superfund Amendment and Reauthorization Act (CERCLA/SARA) Section 302
CERCLA/SARA Section 304
CERCLA/SARA Section 311
CERCLA/SARA Section 313
Clean Air Act
Clean Water Act
Description and Applicability
Requires certain planning activities when Extremely Hazardous Substances are present in excess of their Threshold Planning Quantity (TPQ).
Requires notification when there is a release of hazardous material in excess of its Reportable Quantity.
Requires a Material Safety Data Sheet (MSDS) for every hazardous material to be kept on site and submitted to the State Emergency Response Commission, Local Emergency Planning Committee, and the local fire department.
Requires annual reporting of releases of hazardous materials.
Requires a Risk Management Plan (RMP) if listed hazardous materials are stored at or above a Threshold Quantity.
Requires preparation of a Spill Prevention Control and Countermeasures (SPCC) Plan if oil is stored above certain quantities.
State Hazardous Materials Release Response Plans and Inventory Act (HSC §25500 et seq.)
California Accidental Release Prevention (CalARP) Program (HSC §25531-25543.4)
Aboveground Petroleum Storage Act
Safe Drinking Water and Toxics Enforcement Act (Proposition 65) Local Uniform Fire Code
Requires preparation of a Hazardous Materials Business Plan if hazardous materials are handled or stored in excess of threshold quantities.
Requires registration with local Certified Unified Program Agency (CUPA) or lead agency and preparation of a RMP if acutely hazardous materials are handled or stored in excess of their TPQ.
Requires entities that store petroleum in aboveground storage tanks in excess of certain quantities to prepare a SPCC Plan.
Requires warning to persons exposed to a list of carcinogenic and reproductive toxins and protection of drinking water from same toxins.
Controls storage of hazardous materials and wastes and the use and storage of flammable/combustible liquids.
Since 1999, the CEC has approved over 30 gas turbine power plant projects using SCR for NOx emission reduction (see Table IV-3). Most sites selected aqueous ammonia as the reagent to lessen the associated risk. In these cases, the combination of regulatory requirements and proposed mitigation strategies was determined to be adequate to reduce the potential risk of public health impacts due to any accidental release not addressed by a project’s proposed spill prevention mitigation measures. With respect to hazards associated with ammonia, it appears there is no compelling reason not to use SCR for NOx control unless there are unusual circumstances specific to a facility that would make ammonia use a high-risk option.
30

Table IV-3. Post-Combustion NOx Control Technologies for Gas Turbine Power Plants Approved by the California Energy Commission since 1997*
Project
Sutter Power Plant Los Medanos Delta Moss Landing La Paloma High Desert Elk Hills Blythe Phase I Henrietta Peaker Los Esteros Tracy Peaker Pico Power Magnolia SMUD Cosumnes Pastoria Metcalf City of Vernon Mountainview Western Midway-Sunset Otay Mesa
Three Mountain Contra Costa Russell City Palomar Escondido East Altamont Inland Empire San Joaquin Valley Energy Center
Size (MW) 540 555 887
1,060 1,124 830 500 520 96 180 169 147 328 500 750 600 134
1,056 500 510
500 530 600 546
1,100 670
1,087
Air District
Feather River Bay Area Bay Area Monterey San Joaquin Valley Mojave Desert San Joaquin Valley Mojave Desert San Joaquin Valley Bay Area San Joaquin Valley Bay Area South Coast Sacramento San Joaquin Valley Bay Area South Coast South Coast San Joaquin Valley San Diego
Shasta Bay Area Bay Area San Diego Bay Area South Coast San Joaquin Valley
NOx Control Technology
SCR SCR SCR SCR SCR SCR SCR SCR SCR SCR SCR SCR SCR SCR SCR SCR SCR SCR SCR
SCONOx or SCR SCR SCR SCR SCR SCR SCR SCR
Ammonia Source
Anhydrous Aqueous
Anhydrous Aqueous Aqueous Aqueous Aqueous Aqueous Aqueous Aqueous Aqueous Aqueous Aqueous Aqueous Aqueous Aqueous Aqueous Aqueous Aqueous
Aqueous (if SCR)
Aqueous Aqueous Aqueous Aqueous
Anhydrous Aqueous Aqueous
Status
Operating since July 2001 Operating since July 2001 Operating since May 2002 Operating since July 2002 Operating since March 2003 Operating since April 2003 Operating since July 2003 Operating since October 2003 Operating since July 2002 Operating since March 2003 Operating since June 2003 Under construction Under construction Under construction Under construction Under construction Under construction Re-financing project On hold Construction on hold
On hold Construction on hold On hold Financing project On hold On hold On hold
*Does not include emergency peaker projects.
3. Spent Catalyst Waste
Once the activity level of the SCR catalyst has sufficiently diminished, it must be removed and replaced with fresh material. The generator has the option of either disposing the spent catalyst in a landfill or having a third party recycle it. Some catalyst manufacturers offer a disposal service for spent catalyst. Typically, they either reactivate the catalyst for reuse or recycle catalyst components for other uses. Where spent catalyst cannot be reactivated or recycled, it is disposed of in approved landfills.
Typical SCR catalysts are composed of the base metals titanium and vanadium. Although vanadium is not a federal Resource Conservation and Recovery Act (RCRA)6
hazardous waste constituent, it is on the California list of hazardous waste constituents. Therefore, the generator must assess the vanadium concentration of the spent catalyst and determine whether it fails the California toxicity characteristic (22 California Code of Regulations §66261.24). As a non-RCRA hazardous waste, the spent catalyst would be subject to hazardous waste handling requirements while in California.
6 RCRA gave U.S. EPA the authority to control hazardous waste from "cradle-to-grave." This includes the generation, transportation, treatment, storage, and disposal of hazardous waste. RCRA also set forth a framework for the management of non-hazardous wastes.
31
The general handling and disposal requirements for RCRA and non-RCRA wastes are the same while the waste is in the State, but the handling and disposal requirements are different when the waste is taken out-of-state. A registered hazardous waste transporter must haul the waste while in the State, but once out of the State, non-RCRA wastes can be hauled by common carrier. Many states allow non-RCRA waste to be disposed of in non-hazardous landfills or non-hazardous treatment facilities (like recyclers), though some require hazardous wastes to retain the designation of the state of origin.
B. SCONOx Catalytic Absorption System
1. Spent Catalyst Waste
The SCONOx catalyst is a platinum-based substrate with a potassium carbonate coating. Platinum is not listed as a hazardous constituent in either the federal or State list of hazardous waste constituents. Therefore, it would not be regulated as a hazardous waste unless the catalyst carried some other kind of hazardous constituent. As the catalyst contains a precious metal (platinum) component that yields a salvage value, a management program for the catalyst can include the repurchase of the spent catalyst by the manufacturer.
2. Catalyst Regeneration System
As described in Chapter III, the regeneration cycle of the SCONOx catalyst is accomplished by passing a controlled mixture of regeneration gases across the surface of the catalyst in the absence of oxygen. The catalyst is regenerated by introducing natural gas with steam as the carrier gas to a steam reforming catalyst and then to the SCONOx catalyst. The reforming catalyst initiates the conversion of methane in the natural gas to hydrogen, and the conversion is completed over the SCONOx catalyst. Parasitic steam and natural gas quantities for a 500-MW combined-cycle power plant are estimated to have minor overall impacts at three (3) percent and less than one (1) percent of total plant requirements, respectively.
3. Catalyst Washing
The SCOSOx guard bed catalyst is not 100 percent effective in the capture of sulfur compounds, so it is necessary to wash the SCONOx catalyst to remove masking compounds. The washing process uses de-ionized water and potassium carbonate solution to rejuvenate the catalyst to its original level of activity and prevent the need for frequent replacement. The process includes removal of the SCONOx catalyst from the HRSG, washing of the catalyst on-site, and re-installation of the washed catalyst. EmeraChem estimates that the leading layer of SCONOx catalyst will require washing every 8,000 hours of operation, or about once per year for a baseload plant—though experience at the facilities described in Chapter III indicates more frequent washing may be needed to fully optimize NOx reduction. The time interval required to wash the
32

leading layer of SCONOx catalyst is estimated at two to three days. The remaining charge of catalyst is washed every 24,000 hours, or every three years. The waste stream of wash solution is caustic but is not considered a hazardous waste. It can be neutralized and disposed of in a public sewer system. For power plants that do not have ready on site access to a public sewer system, other options exist, including but not limited to, disposal of wastewater to land or surface water if allowed by applicable water quality regulations or transport of the wastewater to an off-site disposal facility or public sewer system that would accept the wastewater.
Alstom Power estimated the annual wash water requirement for a typical 500-MW gas turbine combined-cycle power plant is approximately 12,000 gallons of de-ionized water. This represents less than one (1) percent of a power plant’s total water use. For example, factoring the loss of water from evaporation, drift, and blowdown, total makeup water requirements for a typical 500-MW combined-cycle power plant using wet cooling towers is about 250 gallons per MWh, or 3 million gallons per day. For dry cooling, the consumptive water use is estimated to be 50 gallons per MWh, or 600,000 gallons per day.
33

V. CONTROL COST INFORMATION
Emission levels considered “achieved-in-practice” may be required as BACT in California without consideration of the cost of the control technologies needed to achieve them. However, most air districts in California are required to consider more stringent control technologies than those achieved-in-practice. The more stringent controls must be both technologically feasible and cost effective.
The data provided in this chapter is for informational purposes and contains a compilation of capital cost and operation/maintenance (O&M) cost estimates from various sources, including CEC siting case documents, local air district BACT analyses, control system vendors, and environmental consultants. As a general rule, vendors consider certain cost numbers as proprietary, which prevents a detailed and completely equitable cost breakdown analysis. The cost values should only be used for relative comparison purposes. They are not intended to be basis for detailed engineering, marketing, or policy decisions. The respective control technology vendor should be consulted for the most accurate cost information based on site-specific characteristics.
Table V-1 contains averaged cost values for SCONOx and SCR for a 500-MW combined-cycle power plant consisting of two combustion gas turbines and one steam turbine meeting BACT requirements.7 Where available, the cost of an oxidation catalyst is included with the SCR system for comparable evaluation with SCONOx’s multi-pollutant reduction capabilities. Cost figures show that the SCR/oxidation catalyst package is less than the SCONOx system.
Table V-1. Estimated Average Cost of Post-Combustion Control Technology for a 500-MW Combined-Cycle Gas Turbine Power Plant Meeting BACT
Capital Cost Annual O&M Cost ($) ($)
SCR/CO SCONOx SCR/CO SCONOx 6,259,857 20,747,637 1,355,253 3,027,653
Table V-2 contains cost values for SCR at a simple-cycle gas turbine power plant meeting BACT. As mentioned in Chapter III, the SCONOx system is not available for use in simple-cycle configurations because the turbine exhaust temperatures are outside the effective range of the control technology.
7 The SCONOx system has not been installed at a 500-MW power plant to date. The estimated average cost is based upon a scaling up of the technology.
34

Table V-2. Selective Catalytic Reduction Cost Estimates for a Simple-Cycle Gas Turbine Power Plant Meeting BACT
Estimate 1 (April 2001) Estimate 2 (December 2003)
Output (MW)
49
48
Turbine Make/Model
Pratt & Whitney FT4-C TwinPac GE LM6000
Capital Cost for SCR/CO ($)
1,391,000 (w/o CO) 1,500,000
Annual O&M Cost for SCR/CO ($)
427,560
-
Table V-3 contains cost values for SCONOx at smaller combined-cycle/cogeneration facilities. The first two estimates represent generic power plants meeting BACT requirements. The last two entries consist of O&M cost data provided by two actual SCONOx installations.
Table V-3. SCONOx Cost Estimates for Combined-Cycle and Cogeneration Gas Turbine Power Plants Under 50 MW
Estimate 1 (February 2004)
Output (MW) 5.2
Turbine Make/Model
Solar Taurus 60
Capital Cost ($)
950,000
Annual O&M Cost
Fuel and steam use + approx. $12,000 for catalyst washing
Notes
•Regeneration fuel is 0.6% of fuel input •Steam use is 1,050 lb/hr
Estimate 2 (February 2004)
14 Solar Titan 130 1,650,000 Fuel and steam use + approx. $25,000 for catalyst washing
•Regeneration fuel is 0.6% of fuel input •Steam use is 2,370 lb/hr
Actual Installation (City of Redding)
43 Alstom GTX100 - $138,000 (approx. $69,000 per wash event at 2 washes per year)
•SCONOx catalyst in/out labor, $25,000 •SCONOx catalyst wash, $33,000 •Reformer catalyst in/out labor, $3,000 •Reformer catalyst wash, $8,000
Actual Installation (U.C. San Diego)
26 Solar SoLoNOx Titan 130S
- $240,0000 (approx. $80,000 per wash event at 3 washes per year)
•Potassium carbonate solution, $8,000/turbine •Labor, $25,0000/engine •Cost of replaced grid power, $6,000/day
Table V-4 contains cost estimates for the turbine-integrated NOx control technologies— Xonon and Low Emissions Combustor liner. As described in Chapter III, the Xonon combustor is built into the original turbine equipment. Therefore, the cost includes the complete gas turbine generator package. The Low Emissions Combustor liner is an aftermarket, drop-in device and does not include the cost of the gas turbine generator unit.
35

Table V-4. Control Cost Estimates for Turbine-Integrated NOx Control Technologies
Control
Xonon Cool Combustion
Low Emissions Combustor III Low Emissions Combustor III
Turbine Make
Kawasaki
GE 7EA
GE 6B
Output (MW) 1.4
85.4
42.1
Turbine Model
GPB15X
PG7121EA
PG6581B
Installed Cost ($)
1.27 million
2.0 million
1.75 million
Installed Cost Includes
Complete gas turbine package. Fuel gas compressor, HRSG, etc. not included. Retrofit dry, lean premix combustion system
Retrofit dry, lean premix combustion system
Annual O&M Annual O&M Cost Cost ($) Includes
1.1¢/kWhe Modules, overhauls, scheduled maintenance.
No increment over OEM DLN system
No increment over OEM DLN system
36

VI. REFERENCES
2003 Almanac Emission Projection Data: 2002 Estimated Annual Average Emissions Statewide. California Air Resources Board. 24 November 2003 <http://www.arb.ca.gov/emisinv/emsmain/emsmain.htm>.
Alstom Power Inc. “City of Redding SCONOxÔ Installation Unit #5 CCGT.” Alstom Power Inc. 14 November 2003.
Altobelli, Marc. Personal communication (telephone conversation), Marc Altobelli, Massachusetts Department of Environmental Protection, to Stephanie Kato, ARB. 9 March 2004.
“Ambient Air Quality Impact Report: Elk Hills Power Plant—Western Kern County (San Joaquin Valley).” Elk Hills Power Plant, LLC. August 2000.
Bell, Ross. Personal communication (telephone conversation), Ross Bell, Shasta County Air Quality Management District, to Stephanie Kato, ARB. 8 March 2004.
Best Available Control Technology (BACT) Main Page. 17 December 2003. South Coast Air Quality Management District. 14 January 2004 <http://www.aqmd.gov/bact/>.
Caithness Blythe II LLC. Application for Certification for Blythe Energy Project Phase II. Volume 1. New York: Caithness Blythe II LLC, February 2002.
California Air Resources Board. Evaluation of the Air Quality Performance Claims for the Catalytica Energy Systems, Inc. XononÔ Cool Combustion Technology, Sacramento: ARB, June 2002.
California Air Resources Board. Guidance for the Permitting of Electrical Generation Technologies, Sacramento: ARB, July 2002.
California Air Resources Board. Guidance for Power Plant Siting and Best Available Control Technology, Sacramento: ARB, September 1999.
California Air Resources Board. Characterization of Ambient PM10 and PM2.5 in California. Technical Report. Sacramento: ARB, December 2001.
California Air Resources Board. 2002 Annual Report on the Air Resources Board’s Fine Particulate Matter Program. Sacramento: ARB, April 2003.
California Energy Resources Conservation and Development Commission. 2003 Environmental Performance Report. Staff Draft Report. 100-03-010SD. Sacramento: CEC, June 2003.
37

California Energy Resources Conservation and Development Commission. Final Staff Assessment: Otay Mesa Generating Project. 99-AFC-5. Sacramento: CEC, 12 October 2000.
Christman, June. Letter from June Christman, Paramount Petroleum, to Mike Tollstrup, ARB. 15 January 2004.
Conroy, Patrick and Jeffrey Benoit. “Gas-Fired Turbine Power Plant NOx Control Technology and Environmental Impact Survey Response.” E-mail from Patrick Conroy, Power Systems Manufacturing, to Stephanie Kato, ARB. 29 December 2003.
Dana, Fusato. “Re: CARB Power Plant NOx Control Survey.” E-mail from Fusato Dana, Mitsubishi Heavy Industries, to Stephanie Kato, ARB. 30 December 2003.
DeCicco, Steven. “Submittal: CARB Power Plant NOx Control Survey.” E-mail from Steven DeCicco, EmeraChem, to Stephanie Kato, ARB. 9 February 2004.
Dilliott, John. Personal communication (telephone conversation), John Dilliott, University of California San Diego, to Stephanie Kato, ARB. 29 January 2004.
EmeraChem. 2002. EmeraChem. January 2004 <http://www.emerachem.com>.
EmeraChem. Technology Update: SCONOx (EMx) for Gas Turbines & Diesel Engines. Presentation. February 2003.
Gaffney, Patrick. “Ammonia Emissions & Powerplants.” E-mail from Patrick Gaffney, ARB, to Stephanie Kato, ARB. 18 December 2003.
Gas Turbine World 2003 GTW Handbook. Volume 23. Fairfield: Pequot Publishing Inc., 2003.
Hastings, Thomas W., Akira Hattori, Kozo Iida, and Masashi Kiyosawa. Zero Ammonia Slip Technology for Combined Cycle Gas Turbine Exhaust. POWER-GEN International 2003 Conference, Las Vegas, Nevada. 9-11 December 2003.
Hunsaker, Larry. “Re: Turbine Toxics Data.” E-mail from Larry Hunsaker, ARB, to Stephanie Kato, ARB. 20 November 2003.
Iskandar, Reda. “CARB Power Plant NOx Control Survey.” E-mail from Reda Iskandar, Cormetech, to Stephanie Kato, ARB. 18 January 2004.
Kuck, Noel. “Re: Questions on SCONOx Parasitic Needs.” E-mail from Noel Kuck, Alstom Power, to Stephanie Kato, ARB. 9 February 2004.
38
Kuck, Noel. “SCONOx Wash Costs.” E-mail from Noel Kuck, Alstom Power, to Chris Gallenstein, ARB. 17 November 2003.
Lim, Kenneth. “Re: Sonoma Hospital w/ Xonon.” E-mail from Kenneth Lim, Bay Area Air Quality Management District, to Stephanie Kato, ARB. 23 January 2004.
Modesto Irrigation District and CH2MHill. Application for Small Power Plant Exemption: MID Electric Generation Station. Sacramento: CH2MHill, April 2003.
Nystrom, Marcella. “Re: Area Designations.” E-mail from Marcella Nystrom, ARB, to Stephanie Kato, ARB. 6 February 2004.
Reyes, Boris E. NOx Abatement Technology for Stationary Gas Turbine Power Plants: An Overview of Selective Catalytic Reduction (SCR) and Catalytic Absorption (SCONOxÔ) Emission Control Systems. SCONOx White Paper. 19 September 2002.
SCR Committee. White Paper: Selective Catalytic Reduction (SCR) Control of NOx Emissions. Institute of Clean Air Companies, Inc.: November 1997.
Smith, Justin. “Re: Follow-up on Power Plant NOx Controls Survey.” E-mail from Justin Smith, Kawasaki Gas Turbines Americas, to Stephanie Kato, ARB. 28 January 2004.
Stettler, James. “Re: Fwd: Spent Catalyst Waste.” E-mail from James Stettler, California Department of Toxic Substances Control, to Stephanie Kato, ARB. 28 January 2004.
Stettler, James. “Re: Ammonia.” E-mail from James Stettler, California Department of Toxic Substances Control, to Stephanie Kato, ARB. 30 January 2004.
Swiggard, Scott B. Letter from Scott B. Swiggard, Professional Environmental, Health and Safety Consulting, to Spencer Hurley, Dow Chemical Company, USA. 15 April 2003.
Tran, Thai. “Re: Some followup on LAX turbines.” E-mail from Thai Tran, South Coast Air Quality Management District, to Stephanie Kato, ARB. 22 and 23 January 2004.
United States Environmental Protection Agency. Environmental Technology Verification Report: Catalytica Combustion Systems, Inc. XononÔ Flameless Combustion System. Research Triangle Park: U.S. EPA, December 2000.
Xiao, S. and V. Martling. “Reducing Gas Turbine NOx and CO Emissions Through Improved Combustor Design.” Power Systems Manufacturing, LLC. 29 December 2003 <http://www.powermfg.com/images/Combustor.pdf>.
39

Xonon Cool Combustion: Technology, Applications, and Commercialization. Catalytica Energy Systems. 14 January 2004 <http://www.catalyticaenergy.com/xonon/ index.html>.
40

APPENDIX A
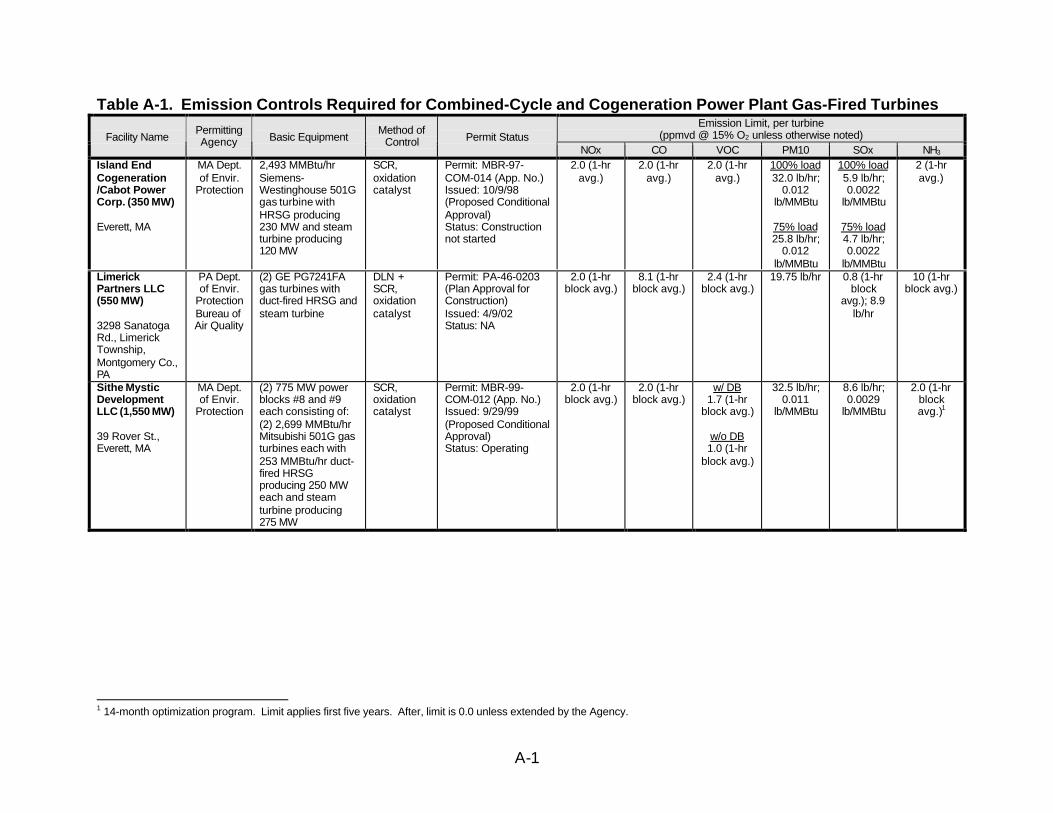
Table A-1. Emission Controls Required for Combined-Cycle and Cogeneration Power Plant Gas-Fired Turbines Emission Limit, per turbine
(ppmvd @ 15% O2 unless otherwise noted)Facility Name Permitting Agency Basic Equipment
Method of Control Permit Status
NOx CO VOC PM10 SOx NH3
Island End Cogeneration /Cabot Power Corp. (350 MW)
Everett, MA
MA Dept. of Envir.
Protection
2,493 MMBtu/hr Siemens-Westinghouse 501G gas turbine with HRSG producing 230 MW and steam turbine producing 120 MW
SCR, oxidation catalyst
Permit: MBR-97-COM-014 (App. No.) Issued: 10/9/98 (Proposed Conditional Approval) Status: Construction not started
2.0 (1-hr avg.)
2.0 (1-hr avg.)
2.0 (1-hr avg.)
100% load 32.0 lb/hr;
0.012 lb/MMBtu
75% load 25.8 lb/hr;
0.012 lb/MMBtu
100% load 5.9 lb/hr; 0.0022
lb/MMBtu
75% load 4.7 lb/hr; 0.0022
lb/MMBtu
2 (1-hr avg.)
Limerick Partners LLC (550 MW)
3298 Sanatoga Rd., Limerick Township, Montgomery Co., PA
PA Dept. of Envir.
Protection Bureau of Air Quality
(2) GE PG7241FA gas turbines with duct-fired HRSG and steam turbine
DLN + SCR, oxidation catalyst
Permit: PA-46-0203 (Plan Approval for Construction) Issued: 4/9/02 Status: NA
2.0 (1-hr block avg.)
8.1 (1-hr block avg.)
2.4 (1-hr block avg.)
19.75 lb/hr 0.8 (1-hr block
avg.); 8.9 lb/hr
10 (1-hr block avg.)
Sithe Mystic Development LLC (1,550 MW)
39 Rover St., Everett, MA
MA Dept. of Envir.
Protection
(2) 775 MW power blocks #8 and #9 each consisting of: (2) 2,699 MMBtu/hr Mitsubishi 501G gas turbines each with 253 MMBtu/hr duct-fired HRSG producing 250 MW each and steam turbine producing 275 MW
SCR, oxidation catalyst
Permit: MBR-99-COM-012 (App. No.) Issued: 9/29/99 (Proposed Conditional Approval) Status: Operating
2.0 (1-hr block avg.)
2.0 (1-hr block avg.)
w/ DB 1.7 (1-hr
block avg.)
w/o DB 1.0 (1-hr
block avg.)
32.5 lb/hr; 0.011
lb/MMBtu
8.6 lb/hr; 0.0029
lb/MMBtu
2.0 (1-hr block avg.)1
1 14-month optimization program. Limit applies first five years. After, limit is 0.0 unless extended by the Agency.
A-1

Table A-1. Emission Controls Required for Combined-Cycle and Cogeneration Power Plant Gas-Fired Turbines Emission Limit, per turbine
(ppmvd @ 15% O2 unless otherwise noted)Facility Name Permitting Agency Basic Equipment
Method of Control Permit Status
NOx CO VOC PM10 SOx NH3
Rhode Island State Energy Partners L.P. (535 MW)
Intersection of Shun Pike and Simmons Lake Dr., Johnston, RI
RI Dept. of Envir.
Mangmnt., Office of
Air Resources
(2) 2,009 MMBtu/hr Westinghouse 501F gas turbines with 306 MMBtu/hr duct-fired HRSG producing 186 MW each and steam turbine(s)
DLN + SCR Permit: RI-PSD-6 Issued: 5/3/00 Status: Under construction, expected to complete late 2002
2.0 (1-hr avg.)
w/ DB 17.8 (1-hr
avg.)
w/o DB 15.9 (1-hr
avg.)
w/ DB 2.9 (1-hr
avg.)
w/o DB 2.0 (1-hr
avg.)
w/ DB 21.0 lb/hr;
0.009 lb/MMBtu
w/o DB 18.3 lb/hr;
0.009 lb/MMBtu
w/ DB 11.8 lb/hr;
0.0054 lb/MMBtu
w/o DB 10.85 lb/hr;
0.0054 lb/MMBtu
5 (1-hr avg.)
Turlock Irrigation District /Walnut Energy Center (250 MW)
Near intersection of W. Main St. and Washington Rd., Turlock, CA
San Joaquin Valley APCD
(2) 1,047 MMBtu/hr GE Frame 7EA gas turbines producing 84 MW each and steam turbine producing 100 MW
DLN + SCR, oxidation catalyst
Permit: N-2246-3-0, N-2246-4-0 Issued: 6/30/03 Status: Expected commercial operation Mar.’06
2.0 (1-hr avg.)2
4.0 (3-hr rolling avg.)
1.4 (3-hr rolling avg.)
7.0 lb/hr; 0.0067
lb/MMBtu
0.0010 lb/MMBtu
10 (24-hr rolling avg.)
ANP Blackstone (550 MW)
Elm St., Blackstone, MA
MA Dept. of Envir.
Protection
(2) ABB GT-24 gas turbines with unfired HRSG producing 180 MW each (210 w/ steam aug.) and steam turbine producing 190 MW (170 MW w/ steam aug.)
SCR, oxidation catalyst
Permit: 118969 (Transmittal No.) Issued: 3/16/01 (Final Approval) Status: Operating since June ’01 (Unit 1), July ’01 (Unit 2)
2.0 (1-hr block avg.)
steam aug. 3.5 (1-hr
block avg.)
50% load 20.0 (1-hr block avg.)
75% load 4.0 (1-hr
block avg.)
100% load + steam
aug. 3.0 (1-hr
block avg.)
50% load 2.5 (1-hr
block avg.)
75% load 1.4 (1-hr
block avg.)
100% load + steam
aug. 3.5 (1-hr
block avg.)
0.012 lb/MMBtu
0.0023 lb/MMBtu
2.0 (1-hr block avg.)
2 Allowance for short-term excursions as a result of transient load conditions limited to 10 hours per rolling 12-month period. Maximum 1-hour NOx shall not exceed 30 ppmvd @ 15% O2.
A-2

Table A-1. Emission Controls Required for Combined-Cycle and Cogeneration Power Plant Gas-Fired Turbines Emission Limit, per turbine
(ppmvd @ 15% O2 unless otherwise noted)Facility Name Permitting Agency Basic Equipment
Method of Control Permit Status
NOx CO VOC PM10 SOx NH3
ANP Bellingham Energy Company (550 MW)
Bellingham, MA
MA Dept. of Envir.
Protection
(2) 1,815 MMBtu/hr ABB GT-24 gas turbines with unfired HRSG producing 180 MW each (210 MW w/ steam aug.) and (2) steam turbines producing 190 MW (170 MW w/ steam aug.)
SCR, oxidation catalyst
Permit: 118970 (Transmittal No.) Issued: 4/10/02 (Final Approval) Status: Operating
2.0 (1-hr block avg.)
steam aug. 3.5 (1-hr
block avg.)
50% load 20.0 (1-hr block avg.)
75% load 4.0 (1-hr
block avg.)
100% load + steam
aug. 3.0 (1-hr
block avg.)
50% load 2.5 (1-hr
block avg.)
75% load 1.4 (1-hr
block avg.)
100% load + steam
aug. 3.5 (1-hr
block avg.)
0.012 lb/MMBtu
0.002 lb/MMBtu
2.0 (1-hr block avg.)
AERA/Western Midway Sunset (510 MW)
Crocker Springs Rd., Fellows, CA
San Joaquin Valley APCD
(2) GE Frame 7F or (2) Westinghouse 501F gas turbines with HRSG producing 170 MW each and steam turbine producing 170 MW
DLN + SCR, oxidation catalyst
Permit: S-1135-313-0, S-1135-4-0 Issued: Status: Construction on hold
w/ GE 2.0 (1-hr
avg.)
w/ Westng. 2.5 (1-hr
avg.)
6 (1-hr avg.)
w/ GE 1.4 (3-hr
avg.)
w/ Westng. 1.5 (3-hr
avg.)
9.4 lb/hr w/ GE 3.8 lb/hr
w/ Westng. 3.9 lb/hr
10 (24-hr avg.)
Lake Road Generating Company (840 MW)
Lake Rd., Killingly, CT
CT Dept. of Envir.
Protection
(3) 2,181 MMBtu/hr ABB GT-24 gas turbines and steam turbines
DLN + SCR, oxidation catalyst
Permit: 0068 Issued: 5/21/99 (Draft Permit) Status: Operating
2.0 (3-hr block avg.)
100% load 3.0 (1-hr
block avg.)
75% load 4.0 (1-hr
block avg.)
50% load 20.0 (1-hr block avg.)
0.0017 lb/MMBtu; 3.08 lb/hr
21.8 lb/hr; 0.0122
lb/MMBtu
4.73 lb/hr; 0.0026
lb/MMBtu
10.0 (3-hr block avg.)3
3 After first year of operation, data to be reviewed and limit revised to reflect actual emissions.
A-3
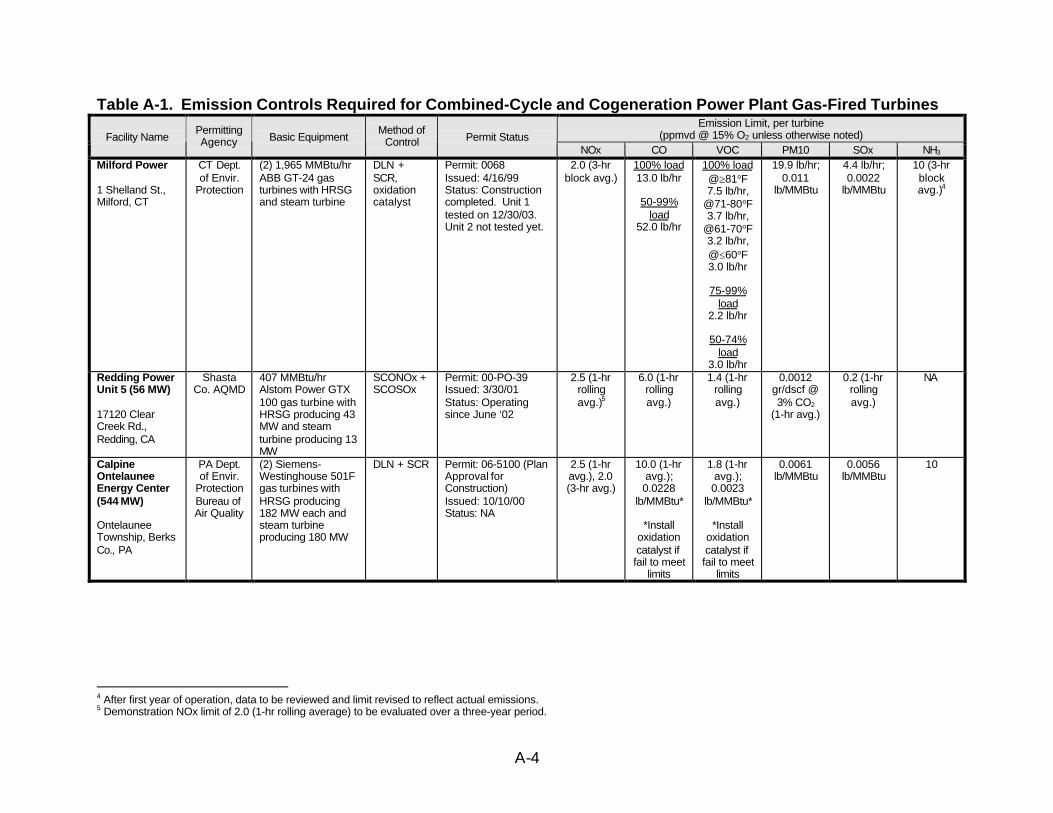
Table A-1. Emission Controls Required for Combined-Cycle and Cogeneration Power Plant Gas-Fired Turbines Emission Limit, per turbine
(ppmvd @ 15% O2 unless otherwise noted)Facility Name Permitting Agency Basic Equipment
Method of Control Permit Status
NOx CO VOC PM10 SOx NH3
Milford Power
1 Shelland St., Milford, CT
CT Dept. of Envir.
Protection
(2) 1,965 MMBtu/hr ABB GT-24 gas turbines with HRSG and steam turbine
DLN + SCR, oxidation catalyst
Permit: 0068 Issued: 4/16/99 Status: Construction completed. Unit 1 tested on 12/30/03. Unit 2 not tested yet.
2.0 (3-hr block avg.)
100% load 13.0 lb/hr
50-99% load
52.0 lb/hr
100% load @³81°F 7.5 lb/hr,
@71-80°F 3.7 lb/hr,
@61-70°F 3.2 lb/hr, @£60°F 3.0 lb/hr
75-99% load
2.2 lb/hr
50-74% load
3.0 lb/hr
19.9 lb/hr; 0.011
lb/MMBtu
4.4 lb/hr; 0.0022
lb/MMBtu
10 (3-hr block avg.)4
Redding Power Unit 5 (56 MW)
17120 Clear Creek Rd., Redding, CA
Shasta Co. AQMD
407 MMBtu/hr Alstom Power GTX 100 gas turbine with HRSG producing 43 MW and steam turbine producing 13 MW
SCONOx + SCOSOx
Permit: 00-PO-39 Issued: 3/30/01 Status: Operating since June ‘02
2.5 (1-hr rolling avg.)5
6.0 (1-hr rolling avg.)
1.4 (1-hr rolling avg.)
0.0012 gr/dscf @ 3% CO2
(1-hr avg.)
0.2 (1-hr rolling avg.)
NA
Calpine Ontelaunee Energy Center (544 MW)
Ontelaunee Township, Berks Co., PA
PA Dept. of Envir.
Protection Bureau of Air Quality
(2) Siemens-Westinghouse 501F gas turbines with HRSG producing 182 MW each and steam turbine producing 180 MW
DLN + SCR Permit: 06-5100 (Plan Approval for Construction) Issued: 10/10/00 Status: NA
2.5 (1-hr avg.), 2.0 (3-hr avg.)
10.0 (1-hr avg.); 0.0228
lb/MMBtu*
*Install oxidation catalyst if fail to meet
limits
1.8 (1-hr avg.); 0.0023
lb/MMBtu*
*Install oxidation catalyst if fail to meet
limits
0.0061 lb/MMBtu
0.0056 lb/MMBtu
10
4 After first year of operation, data to be reviewed and limit revised to reflect actual emissions.5 Demonstration NOx limit of 2.0 (1-hr rolling average) to be evaluated over a three-year period.
A-4

Table A-1. Emission Controls Required for Combined-Cycle and Cogeneration Power Plant Gas-Fired Turbines Emission Limit, per turbine
(ppmvd @ 15% O2 unless otherwise noted)Facility Name Permitting Agency Basic Equipment
Method of Control Permit Status
NOx CO VOC PM10 SOx NH3
Cogen Technologies Linden Venture L.P. (180.6 MW)
within Tosco Bayway Refinery, Railroad and Chemico Ave., Linden, NJ
NJ Dept. of Envir.
Protection
1,954.6 MMBtu/hr GE PG7241 (FA) gas turbine with unfired HRSG producing 180.6 MW
DLN + SCR, oxidation catalyst
Permit: 000002, Facility ID 40955 Issued: 5/9/01 Status: NA
2.5 (1-hr avg.)
2 (1-hr avg.)
1.2 (1-hr avg.)
51.8 (1-hr avg.)
1.44 (1-hr avg.)
10 (3-hr rolling avg. based on a 1-hr block
avg.)
University of California San Diego (26 MW)
9500 Gilman Dr., San Diego, CA
San Diego Co. APCD
(2) 148.64 MMBtu/hr Solar SoLoNOx Titan 130S gas turbines producing 12.894 MW each (aka Unit 100 and Unit 200)
SCONOx + SCOSOx
Permit: 974480, 974481 Issued: 4/16/02 Status: Operating since July ‘01
2.5 (3-hr rolling avg.)
5.0 - - - NA
Wyeth Bio Pharma Unit 1 (6.2 MW)
One Burtt Rd., Andover, MA
MA Dept. of Envir.
Protection
76 MMBtu/hr Solar Taurus Model 60 gas turbine with 17.8 MMBtu/hr duct-fired HRSG producing 6.2 MW
DLN + SCONOx + SCOSOx
Permit: MBR-98-COM-001 (Final Approval) Issued: 9/4/02 Status: Operating since July 1999
nat. gas 2.5 (1-hr
avg.) oil
15.0 (1-hr avg.)
5.0 (1-hr avg.)
- 0.010 lb/MMBtu
Fuel oil sulfur
content £0.0015%
S by weight
NA
Wyeth Bio Pharma Unit 2 (5.9 MW)
One Burtt Rd., Andover, MA
MA Dept. of Envir.
Protection
68.1 MMBtu/hr Solar Taurus Model 60 gas turbine with 18.8 MMBtu/hr duct-fired HRSG producing 5.9 MW
DLN + SCONOx + SCOSOx6
Permit: MBR-01-COM-053 (Conditional Approval) Issued: 2/28/02 Status: Operating
nat. gas 2.5 (1-hr
avg.) oil
15.0 (1-hr avg.)
2.0 (1-hr avg.)
0.028 lb/MMBtu
nat. gas 0.020
lb/MMBtu oil
0.0360 lb/MMBtu
Fuel oil sulfur
content £0.005% S by weight
NA
6 Approval includes an 18-month optimization period to consistently maintain the NOx limits specified, with a goal of attaining 9 ppmvd NOx and 2.0 ppmvd CO at 15% O2 while combusting fuel oil. If permit limits cannot be met, the applicant may replace with an SCR system and oxidation catalyst meeting: 2.5 (gas) and 9.0 (oil) ppmvd NOx; 2.0 ppmvd CO; 3.0 ppmvd NH3 with a goal of 2.0 ppmvd; all at 15% O2.
A-5
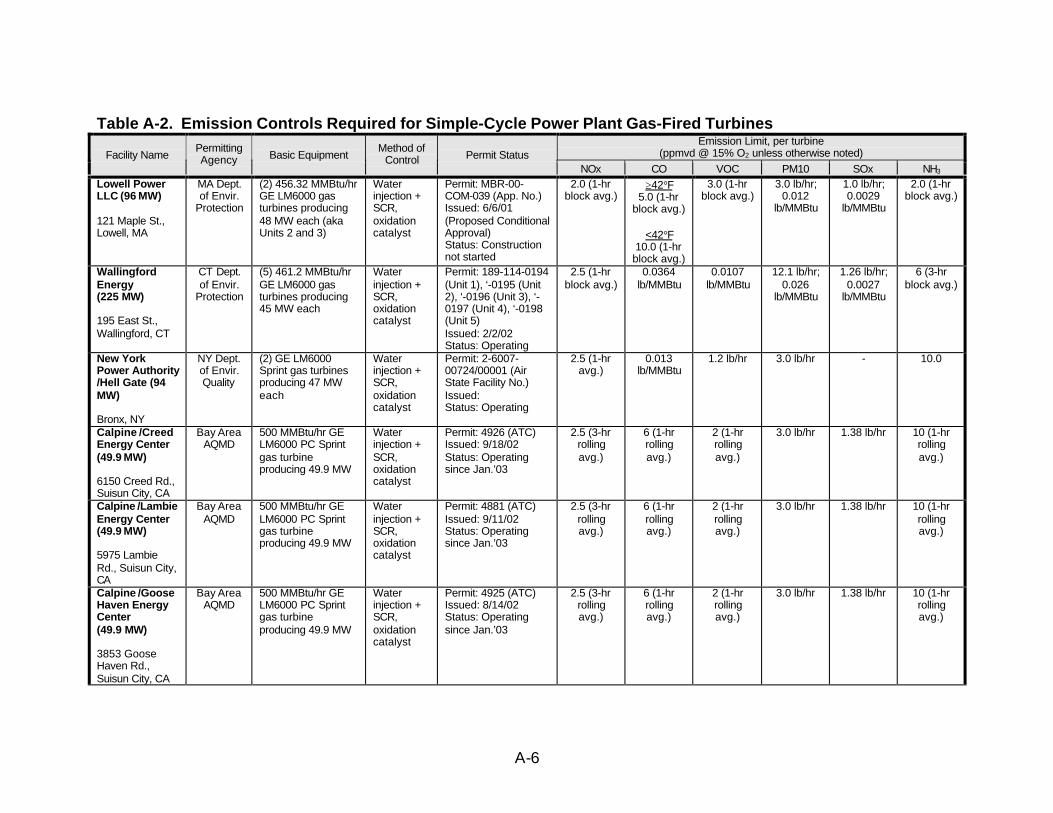
Table A-2. Emission Controls Required for Simple-Cycle Power Plant Gas-Fired Turbines Emission Limit, per turbine
(ppmvd @ 15% O2 unless otherwise noted)Facility Name Permitting Agency Basic Equipment
Method of Control Permit Status
NOx CO VOC PM10 SOx NH3
Lowell Power LLC (96 MW)
121 Maple St., Lowell, MA
MA Dept. of Envir.
Protection
(2) 456.32 MMBtu/hr GE LM6000 gas turbines producing 48 MW each (aka Units 2 and 3)
Water injection + SCR, oxidation catalyst
Permit: MBR-00-COM-039 (App. No.) Issued: 6/6/01 (Proposed Conditional Approval) Status: Construction not started
2.0 (1-hr block avg.)
³42°F 5.0 (1-hr
block avg.)
<42°F 10.0 (1-hr block avg.)
3.0 (1-hr block avg.)
3.0 lb/hr; 0.012
lb/MMBtu
1.0 lb/hr; 0.0029
lb/MMBtu
2.0 (1-hr block avg.)
Wallingford Energy (225 MW)
195 East St., Wallingford, CT
CT Dept. of Envir.
Protection
(5) 461.2 MMBtu/hr GE LM6000 gas turbines producing 45 MW each
Water injection + SCR, oxidation catalyst
Permit: 189-114-0194 (Unit 1), ‘-0195 (Unit 2), ‘-0196 (Unit 3), ‘-0197 (Unit 4), ‘-0198 (Unit 5) Issued: 2/2/02 Status: Operating
2.5 (1-hr block avg.)
0.0364 lb/MMBtu
0.0107 lb/MMBtu
12.1 lb/hr; 0.026
lb/MMBtu
1.26 lb/hr; 0.0027
lb/MMBtu
6 (3-hr block avg.)
New York Power Authority /Hell Gate (94 MW)
Bronx, NY
NY Dept. of Envir. Quality
(2) GE LM6000 Sprint gas turbines producing 47 MW each
Water injection + SCR, oxidation catalyst
Permit: 2-6007-00724/00001 (Air State Facility No.) Issued: Status: Operating
2.5 (1-hr avg.)
0.013 lb/MMBtu
1.2 lb/hr 3.0 lb/hr - 10.0
Calpine /Creed Energy Center (49.9 MW)
6150 Creed Rd., Suisun City, CA
Bay Area AQMD
500 MMBtu/hr GE LM6000 PC Sprint gas turbine producing 49.9 MW
Water injection + SCR, oxidation catalyst
Permit: 4926 (ATC) Issued: 9/18/02 Status: Operating since Jan.’03
2.5 (3-hr rolling avg.)
6 (1-hr rolling avg.)
2 (1-hr rolling avg.)
3.0 lb/hr 1.38 lb/hr 10 (1-hr rolling avg.)
Calpine /Lambie Energy Center (49.9 MW)
5975 Lambie Rd., Suisun City, CA
Bay Area AQMD
500 MMBtu/hr GE LM6000 PC Sprint gas turbine producing 49.9 MW
Water injection + SCR, oxidation catalyst
Permit: 4881 (ATC) Issued: 9/11/02 Status: Operating since Jan.’03
2.5 (3-hr rolling avg.)
6 (1-hr rolling avg.)
2 (1-hr rolling avg.)
3.0 lb/hr 1.38 lb/hr 10 (1-hr rolling avg.)
Calpine /Goose Haven Energy Center (49.9 MW)
3853 Goose Haven Rd., Suisun City, CA
Bay Area AQMD
500 MMBtu/hr GE LM6000 PC Sprint gas turbine producing 49.9 MW
Water injection + SCR, oxidation catalyst
Permit: 4925 (ATC) Issued: 8/14/02 Status: Operating since Jan.’03
2.5 (3-hr rolling avg.)
6 (1-hr rolling avg.)
2 (1-hr rolling avg.)
3.0 lb/hr 1.38 lb/hr 10 (1-hr rolling avg.)
A-6
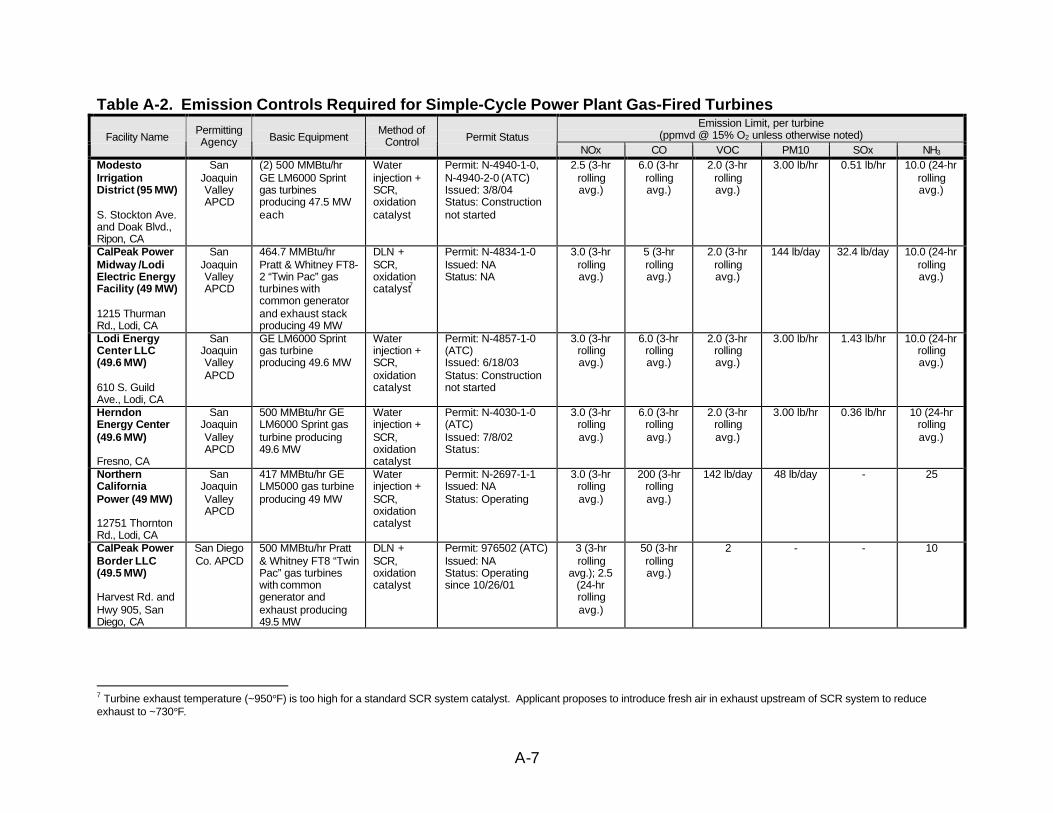
Table A-2. Emission Controls Required for Simple-Cycle Power Plant Gas-Fired Turbines Emission Limit, per turbine
(ppmvd @ 15% O2 unless otherwise noted)Facility Name Permitting Agency Basic Equipment
Method of Control Permit Status
NOx CO VOC PM10 SOx NH3
Modesto Irrigation District (95 MW)
S. Stockton Ave. and Doak Blvd., Ripon, CA
San Joaquin Valley APCD
(2) 500 MMBtu/hr GE LM6000 Sprint gas turbines producing 47.5 MW each
Water injection + SCR, oxidation catalyst
Permit: N-4940-1-0, N-4940-2-0 (ATC) Issued: 3/8/04 Status: Construction not started
2.5 (3-hr rolling avg.)
6.0 (3-hr rolling avg.)
2.0 (3-hr rolling avg.)
3.00 lb/hr 0.51 lb/hr 10.0 (24-hr rolling avg.)
CalPeak Power Midway /Lodi Electric Energy Facility (49 MW)
1215 Thurman Rd., Lodi, CA
San Joaquin Valley APCD
464.7 MMBtu/hr Pratt & Whitney FT8-2 “Twin Pac” gas turbines with common generator and exhaust stack producing 49 MW
DLN + SCR, oxidation catalyst7
Permit: N-4834-1-0 Issued: NA Status: NA
3.0 (3-hr rolling avg.)
5 (3-hr rolling avg.)
2.0 (3-hr rolling avg.)
144 lb/day 32.4 lb/day 10.0 (24-hr rolling avg.)
Lodi Energy Center LLC (49.6 MW)
610 S. Guild Ave., Lodi, CA
San Joaquin Valley APCD
GE LM6000 Sprint gas turbine producing 49.6 MW
Water injection + SCR, oxidation catalyst
Permit: N-4857-1-0 (ATC) Issued: 6/18/03 Status: Construction not started
3.0 (3-hr rolling avg.)
6.0 (3-hr rolling avg.)
2.0 (3-hr rolling avg.)
3.00 lb/hr 1.43 lb/hr 10.0 (24-hr rolling avg.)
Herndon Energy Center (49.6 MW)
Fresno, CA
San Joaquin Valley APCD
500 MMBtu/hr GE LM6000 Sprint gas turbine producing 49.6 MW
Water injection + SCR, oxidation catalyst
Permit: N-4030-1-0 (ATC) Issued: 7/8/02 Status:
3.0 (3-hr rolling avg.)
6.0 (3-hr rolling avg.)
2.0 (3-hr rolling avg.)
3.00 lb/hr 0.36 lb/hr 10 (24-hr rolling avg.)
Northern California Power (49 MW)
12751 Thornton Rd., Lodi, CA
San Joaquin Valley APCD
417 MMBtu/hr GE LM5000 gas turbine producing 49 MW
Water injection + SCR, oxidation catalyst
Permit: N-2697-1-1 Issued: NA Status: Operating
3.0 (3-hr rolling avg.)
200 (3-hr rolling avg.)
142 lb/day 48 lb/day - 25
CalPeak Power Border LLC (49.5 MW)
Harvest Rd. and Hwy 905, San Diego, CA
San Diego Co. APCD
500 MMBtu/hr Pratt & Whitney FT8 “Twin Pac” gas turbines with common generator and exhaust producing 49.5 MW
DLN + SCR, oxidation catalyst
Permit: 976502 (ATC) Issued: NA Status: Operating since 10/26/01
3 (3-hr rolling
avg.); 2.5 (24-hr rolling avg.)
50 (3-hr rolling avg.)
2 - - 10
7 Turbine exhaust temperature (~950°F) is too high for a standard SCR system catalyst. Applicant proposes to introduce fresh air in exhaust upstream of SCR system to reduce exhaust to ~730°F.
A-7

Table A-2. Emission Controls Required for Simple-Cycle Power Plant Gas-Fired Turbines
Facility Name
CalPeak Power Panoche (49.4 MW)
43699 W. Panoche Rd., Firebaugh, CA
Permitting Agency
San Joaquin Valley APCD
Basic Equipment
Pratt & Whitney FT8 “Twin Pac” gas turbines with common generator and exhaust producing 49.4 MW
Method of Control
DLN + SCR, oxidation catalyst
Permit Status
Permit: C-3811-1-0, C-3811-2-0 (ATC) Issued: 4/26/01 Status: Operating since Dec.’01
NOx CO 3.4 (3-hr 6.8 (3-hr
rolling rolling avg.) avg.)
Emission Limit, per turbine (ppmvd @ 15% O2 unless otherwise noted)
VOC PM10 SOx 2.0 (3-hr 1.62 lb/hr 0.71 lb/hr
rolling (3-hr (3-hr avg.) rolling rolling
avg.) avg.)
NH3
10 (3-hr rolling avg.)
West Springfield Redevelopment Project (84 MW)
existing West Springfield Station, West Springfield, MA
MA Dept. of Envir.
Protection
(2) 462.6 MMBtu/hr GE LM6000 gas turbines producing 42 MW each
Water injection + SCR, oxidation catalyst
Permit: 1-B00-038 (App. No.) Issued: 4/11/01 (Conditional Approval), 6/23/03 (Final Approval) Status: Operating
3.5 (1-hr block avg.)8
³42°F 5.0 (1-hr
block avg.)
<42°F 10.0 (1-hr block avg.)
3.0 (1-hr block avg.)
3.0 lb/hr; 0.008
lb/MMBtu
1.0 lb/hr; 0.0029
lb/MMBtu
7.0 (1-hr block avg.)
Wellhead Power Gates LLC (45.4 MW)
San Joaquin Valley APCD
436 MMBtu/hr GE LM6000 gas turbine producing 45.4 MW
Water or steam injection + SCR,
Permit: C-3843-1-0 (ATC) Issued: 8/30/01 Status: Operating
3.5 (3-hr rolling avg.)
6.0 (1-hr rolling avg.)
2.0 (1-hr rolling avg.)
2.88 lb/hr 1.26 lb/hr 10 (1-hr rolling avg.)
Huron, CA oxidation catalyst
E.I. Colton LLC (48 MW)
2040 Aqua Mansa Rd., Colton, CA
South Coast AQMD
456.5 MMBtu/hr GE LM6000 Sprint gas turbine producing 48 MW
Water injection + SCR, oxidation catalyst
Permit: 406065 Issued: 11/26/02 Status: NA
3.5 (3-hr rolling avg.)
6 (3-hr rolling avg.)
2 (3-hr rolling avg.)
3.33 lb/hr 0.162 lb/hr 5 (3-hr rolling avg.)
Gilroy Energy Center Phase I (135 MW)
at the Calpine Gilroy Power Plant, Gilroy, CA
Bay Area AQMD
(3) 467.6 MMBtu/hr GE LM6000PC gas turbines producing 45 MW each
Water injection or DLN + SCR, oxidation catalyst
Permit: NA Issued: 5/21/01 Status: Operating
5 (1-hr rolling avg.)
6 (3-hr rolling avg.)
2 (3-hr rolling avg.)
2.5 lb/hr 0.33 lb/hr 10 (3-hr rolling avg.)
Wildflower Energy /Indigo (135 MW)
19th Ave., Palm Springs, CA
South Coast AQMD
(3) 450 MMBtu/hr GE LM6000 Enhanced Sprint gas turbines producing 45 MW each
Steam or water injection + SCR, oxidation catalyst
Permit: 127299 (ATC) Issued: 7/13/01 Status: Operating since 7/26/01
5 (1-hr rolling avg.)
6 (1-hr rolling avg.)
2 6.8 lb/MMscf
0.32 lb/MMscf
5 (1-hr rolling avg.)
8 Conditional Approval stated that system was to be designed to achieve 2 ppm limits for NOx and ammonia, but that upon completion of an optimization program, new limits may need to be established if consistent compliance cannot be maintained. The levels listed herein are the final established emission limits for NOx and ammonia.
A-8
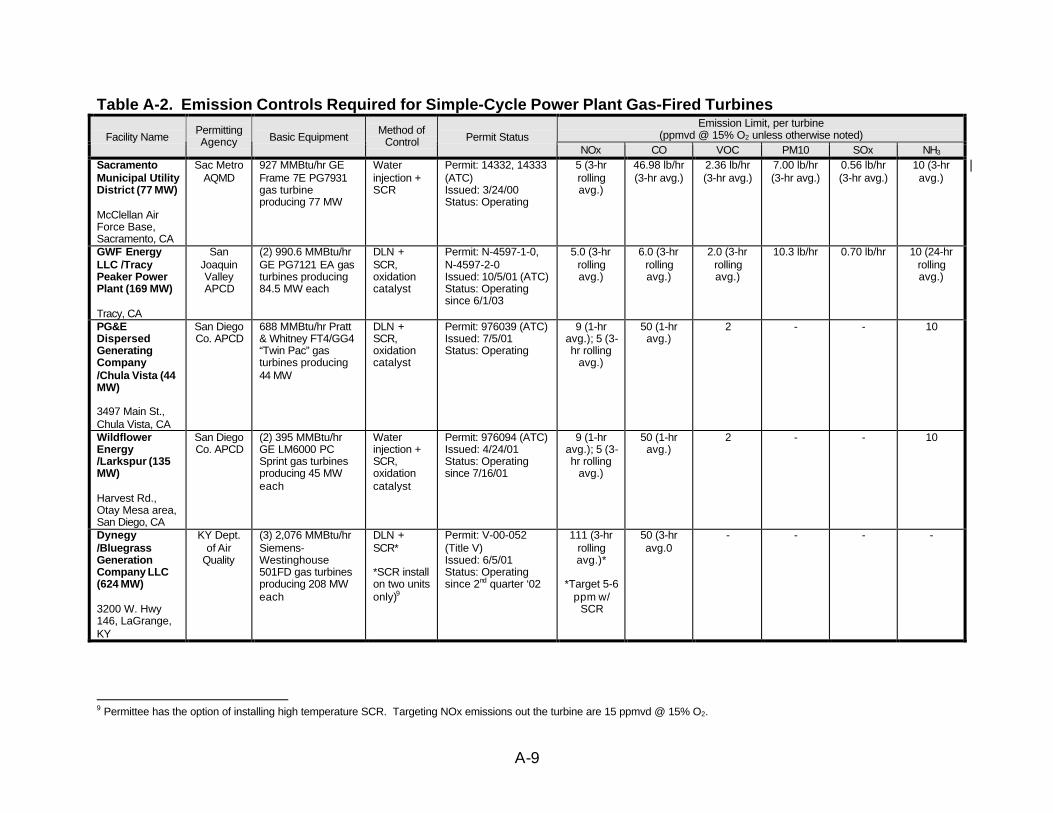
Table A-2. Emission Controls Required for Simple-Cycle Power Plant Gas-Fired Turbines Emission Limit, per turbine
(ppmvd @ 15% O2 unless otherwise noted)Facility Name Permitting Agency Basic Equipment
Method of Control Permit Status
NOx CO VOC PM10 SOx NH3
Sacramento Municipal Utility District (77 MW)
McClellan Air Force Base, Sacramento, CA
Sac Metro AQMD
927 MMBtu/hr GE Frame 7E PG7931 gas turbine producing 77 MW
Water injection + SCR
Permit: 14332, 14333 (ATC) Issued: 3/24/00 Status: Operating
5 (3-hr rolling avg.)
46.98 lb/hr (3-hr avg.)
2.36 lb/hr (3-hr avg.)
7.00 lb/hr (3-hr avg.)
0.56 lb/hr (3-hr avg.)
10 (3-hr avg.)
GWF Energy LLC /Tracy Peaker Power Plant (169 MW)
Tracy, CA
San Joaquin Valley APCD
(2) 990.6 MMBtu/hr GE PG7121 EA gas turbines producing 84.5 MW each
DLN + SCR, oxidation catalyst
Permit: N-4597-1-0, N-4597-2-0 Issued: 10/5/01 (ATC) Status: Operating since 6/1/03
5.0 (3-hr rolling avg.)
6.0 (3-hr rolling avg.)
2.0 (3-hr rolling avg.)
10.3 lb/hr 0.70 lb/hr 10 (24-hr rolling avg.)
PG&E Dispersed Generating Company /Chula Vista (44 MW)
3497 Main St., Chula Vista, CA
San Diego Co. APCD
688 MMBtu/hr Pratt & Whitney FT4/GG4 “Twin Pac” gas turbines producing 44 MW
DLN + SCR, oxidation catalyst
Permit: 976039 (ATC) Issued: 7/5/01 Status: Operating
9 (1-hr avg.); 5 (3-hr rolling
avg.)
50 (1-hr avg.)
2 - - 10
Wildflower Energy /Larkspur (135 MW)
Harvest Rd., Otay Mesa area, San Diego, CA
San Diego Co. APCD
(2) 395 MMBtu/hr GE LM6000 PC Sprint gas turbines producing 45 MW each
Water injection + SCR, oxidation catalyst
Permit: 976094 (ATC) Issued: 4/24/01 Status: Operating since 7/16/01
9 (1-hr avg.); 5 (3-hr rolling
avg.)
50 (1-hr avg.)
2 - - 10
Dynegy /Bluegrass Generation Company LLC (624 MW)
3200 W. Hwy 146, LaGrange, KY
KY Dept. of Air
Quality
(3) 2,076 MMBtu/hr Siemens-Westinghouse 501FD gas turbines producing 208 MW each
DLN + SCR*
*SCR install on two units only)9
Permit: V-00-052 (Title V) Issued: 6/5/01 Status: Operating since 2nd quarter ‘02
111 (3-hr rolling avg.)*
*Target 5-6 ppm w/
SCR
50 (3-hr avg.0
- - - -
9 Permittee has the option of installing high temperature SCR. Targeting NOx emissions out the turbine are 15 ppmvd @ 15% O2.
A-9
APPENDIX B

Table B-1. Emission Source Test Results for Combined-Cycle and Cogeneration Power Plant Gas Turbines Average Measured Emissions, per turbine
Method (ppmvd @ 15% O2 unless otherwise noted)Permitting ofFacility Name Basic Equipment Date TestedAgency PM10Control NOx CO VOC NH3(lb/hr) ANP Blackstone MA Dept. (2) ABB GT-24 gas SCR, CTG1 1.5 <0.1 0.4 0.767 0.07 (550 MW) of Envir. turbines with unfired oxidation 6/5-7/2001
Protection HRSG producing 180 catalyst 82% load Elm St., MW each (210 MW w/ 75% load 1.6 <0.1 0.2 0.433 0.06 Blackstone, MA steam aug.) and steam 50% load 1.4 0.5 0.2 0.800 0.08
turbine producing 190 CTG2 MW (170 MW w/ steam 7/11-12/2001aug.) 1.6 <0.1 0.4 2.83 <0.02
75% load 82% load
1.5 <0.1 0.4 3.30 0.02 50% load 1.7 0.8 0.4 19.2 0.2
CTG2 12/5-6/2001 82% load 1.4 <0.1 0.1 - 0.05 50% load - - - 2.50 -(retest for (front half
PM10) only) CTG1 1.6 0.3 0.1 - 0.1
2/11-12/2002 87% load 5/15/2002 1.6 (CTG1) 0.3 (CTG1) 0.1 (CTG1) - 0.1 (CTG1) 87% load 1.6 (CTG2) 0.0 (CTG2) 0.1 (CTG2) 0.1 (CTG2)
Elk Hills Power San 5/20/2003 2.29 (CTG1) 0.47 (CTG1) <0.80 (CTG1) 9.56 (CTG1) 0.07 (CTG1) LLC (500 MW) Joaquin 100% load w/o 2.40 (CTG2) 0.05 (CTG2) <0.80 (CTG2) 11.45 (CTG2) 0.10 (CTG2)
Valley DB 4026 Skyline Rd., APCD 5/21/2003 1.56 (CTG1) 0.57 (CTG1) <0.65 (CTG1) 8.22 (CTG1) 0.28 (CTG1) Tupman, CA 100% load w/ 1.89 (CTG2) 0.00 (CTG2) <0.67 (CTG2) 10.99 (CTG2) 0.58 (CTG2)
DB High Desert Mojave (3) Siemens- 4/5/2003 2.39 (CTG1) 0.17 (CTG1) 0.38 (CTG1) 16.50 (CTG1) 5.38 (CTG1) Power Project Desert Westinghouse 501F gas 2.99 (CTG3) 0.25 (CTG3) 1.06 (CTG3) 16.43 (CTG3) 0.95 (CTG3) LLC (830 MW) AQMD turbines with HRSG CTG2
producing 190 MW each 4/7/2003 2.38 0.0629 0.57 9.15 6.54 Victorville, CA and steam turbine CTG3
producing 330 MW 4/30/2003 (retest) 2.41 - - - -
Los Medanos Bay Area (2) 1,929 MMBtu/hr GE DLN + 7/19-8/24/2001 2.115 (CTG1) 0.046 (CTG1) 10.12 (CTG1) 3.53; 0.00232 0.09 (CTG1) Energy Center AQMD Frame 7FA PG7241 gas SCR, full load w/ DB 1.648 (CTG2) 0.043 (CTG2) 1.714 (CTG2) lb/MMBtu 0.13 (CTG2) (555 MW) turbines with 333 oxidation (CTG1)
MMBtu/hr duct-fired catalyst Pittsburg, CA HRSG producing 170 2.31; 0.00150
MW each and (2) steam lb/MMBtu turbines producing 90 (CTG2) MW each 60% load - 0.045 (CTG1) 2.64 (CTG1) - -
0.042 (CTG2) 0.74 (CTG2)
B-1

Table B-1. Emission Source Test Results for Combined-Cycle and Cogeneration Power Plant Gas Turbines Average Measured Emissions, per turbine (ppmvd @ 15% O2 unless otherwise noted)
Facility Name Permitting Agency Basic Equipment
Method of
Control Date Tested
NOx CO VOC PM10 (lb/hr) NH3
CTG1 12/19-20/2001
0.68 <0.04 - - NAUniversity of California San Diego (26 MW)
9500 Gilman Dr., San Diego, CA
San Diego Co. APCD
(2) 148.64 MMBtu/hr Solar SoLoNOx Titan 130S gas turbines producing 12.894 MW each (aka Unit 100 and Unit 200)
SCONOx + SCOSOx CTG2
12/23/2001 1.01 <0.04 - - NA
Wyeth Bio Pharma #1 /Genetics Institute (5 MW)
Andover, MA
MA Dept. of Envir.
Protection
Solar Taurus 60 gas turbine with duct-fired HRSG producing 5 MW
SCONOx + SCOSOx
2/14-17/2000
6/25-29/2001 full load w/ DB
2.36 (CTG1) 2.20 (CTG2)
0.12 (CTG1) 0.04 (CTG2)
1.51 (CTG1) 1.23 (CTG2)
2.661 (CTG1) 2.242 (CTG2)
7.93 (CTG1) 12.77 (CTG2)
90% load w/o DB
2.447 (CTG2) 0.343 (CTG2) 4.66 (CTG2) - -
80% load w/o DB
2.233 (CTG2) 0.143 (CTG2) 2.74 (CTG2) - -
70% load w/o DB
2.228 (CTG2) 0.125 (CTG2) 1.81 (CTG2) - -
8/30-31/2001 full load w/ DB (retest for VOC
and NH3)
- - 0.44 (CTG1) 0.32 (CTG2)
- <0.05 (CTG1) 7.92 (CTG2)
10/15-16/2001 100% load w/o DB (retest for
VOC) - -0.21 (CTG1) 0.14 (CTG2) - -
90% load w/o DB
- - 0.19 (CTG1) 0.55 (CTG2)
- -
80% load w/o DB
- - 0.21 (CTG1) 0.26 (CTG2)
- -
Sutter Power Plant (540 MW)
5029 S. Township Rd., Yuba City, CA
Feather River AQMD
(2) 1,900 MMBtu/hr Westinghouse 501F gas turbines with 170 MMBtu/hr duct-fired HRSG producing 170 MW each and steam turbine producing 160 MW
DLN + SCR, oxidation catalyst
70% load w/o DB
- - 0.18 (CTG1) 0.25 (CTG2)
B-2
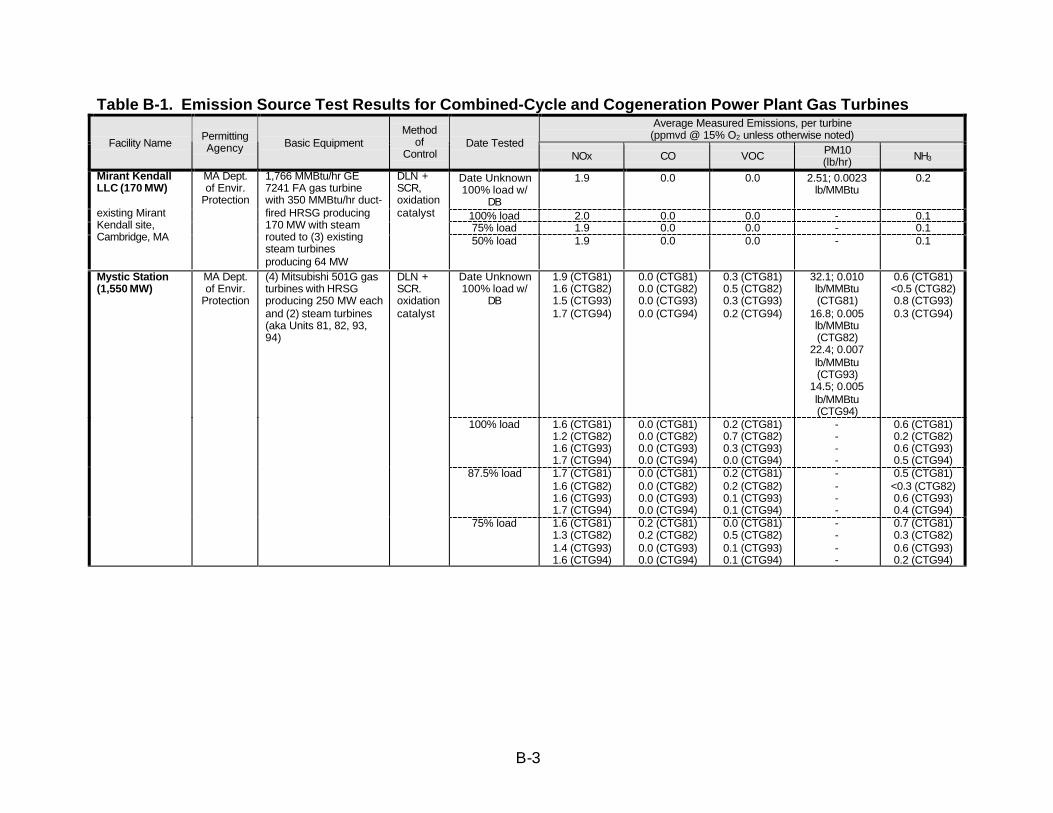
Table B-1. Emission Source Test Results for Combined-Cycle and Cogeneration Power Plant Gas Turbines Average Measured Emissions, per turbine (ppmvd @ 15% O2 unless otherwise noted)
Facility Name Permitting Agency Basic Equipment
Method of
Control Date Tested
NOx CO VOC PM10 (lb/hr) NH3
Date Unknown 100% load w/
DB
1.9 0.0 0.0 2.51; 0.0023 lb/MMBtu
0.2
100% load 2.0 0.0 0.0 - 0.1 75% load 1.9 0.0 0.0 - 0.1
Mirant Kendall LLC (170 MW)
existing Mirant Kendall site, Cambridge, MA
MA Dept. of Envir.
Protection
1,766 MMBtu/hr GE 7241 FA gas turbine with 350 MMBtu/hr duct-fired HRSG producing 170 MW with steam routed to (3) existing steam turbines producing 64 MW
DLN + SCR, oxidation catalyst
50% load 1.9 0.0 0.0 - 0.1
Date Unknown 100% load w/
DB
1.9 (CTG81) 1.6 (CTG82) 1.5 (CTG93) 1.7 (CTG94)
0.0 (CTG81) 0.0 (CTG82) 0.0 (CTG93) 0.0 (CTG94)
0.3 (CTG81) 0.5 (CTG82) 0.3 (CTG93) 0.2 (CTG94)
32.1; 0.010 lb/MMBtu (CTG81)
16.8; 0.005 lb/MMBtu (CTG82)
22.4; 0.007 lb/MMBtu (CTG93)
14.5; 0.005 lb/MMBtu (CTG94)
0.6 (CTG81) <0.5 (CTG82) 0.8 (CTG93) 0.3 (CTG94)
100% load 1.6 (CTG81) 1.2 (CTG82) 1.6 (CTG93) 1.7 (CTG94)
0.0 (CTG81) 0.0 (CTG82) 0.0 (CTG93) 0.0 (CTG94)
0.2 (CTG81) 0.7 (CTG82) 0.3 (CTG93) 0.0 (CTG94)
----
0.6 (CTG81) 0.2 (CTG82) 0.6 (CTG93) 0.5 (CTG94)
87.5% load 1.7 (CTG81) 1.6 (CTG82) 1.6 (CTG93) 1.7 (CTG94)
0.0 (CTG81) 0.0 (CTG82) 0.0 (CTG93) 0.0 (CTG94)
0.2 (CTG81) 0.2 (CTG82) 0.1 (CTG93) 0.1 (CTG94)
----
0.5 (CTG81) <0.3 (CTG82) 0.6 (CTG93) 0.4 (CTG94)
Mystic Station (1,550 MW)
MA Dept. of Envir.
Protection
(4) Mitsubishi 501G gas turbines with HRSG producing 250 MW each and (2) steam turbines (aka Units 81, 82, 93, 94)
DLN + SCR. oxidation catalyst
75% load 1.6 (CTG81) 1.3 (CTG82) 1.4 (CTG93) 1.6 (CTG94)
0.2 (CTG81) 0.2 (CTG82) 0.0 (CTG93) 0.0 (CTG94)
0.0 (CTG81) 0.5 (CTG82) 0.1 (CTG93) 0.1 (CTG94)
----
0.7 (CTG81) 0.3 (CTG82) 0.6 (CTG93) 0.2 (CTG94)
B-3
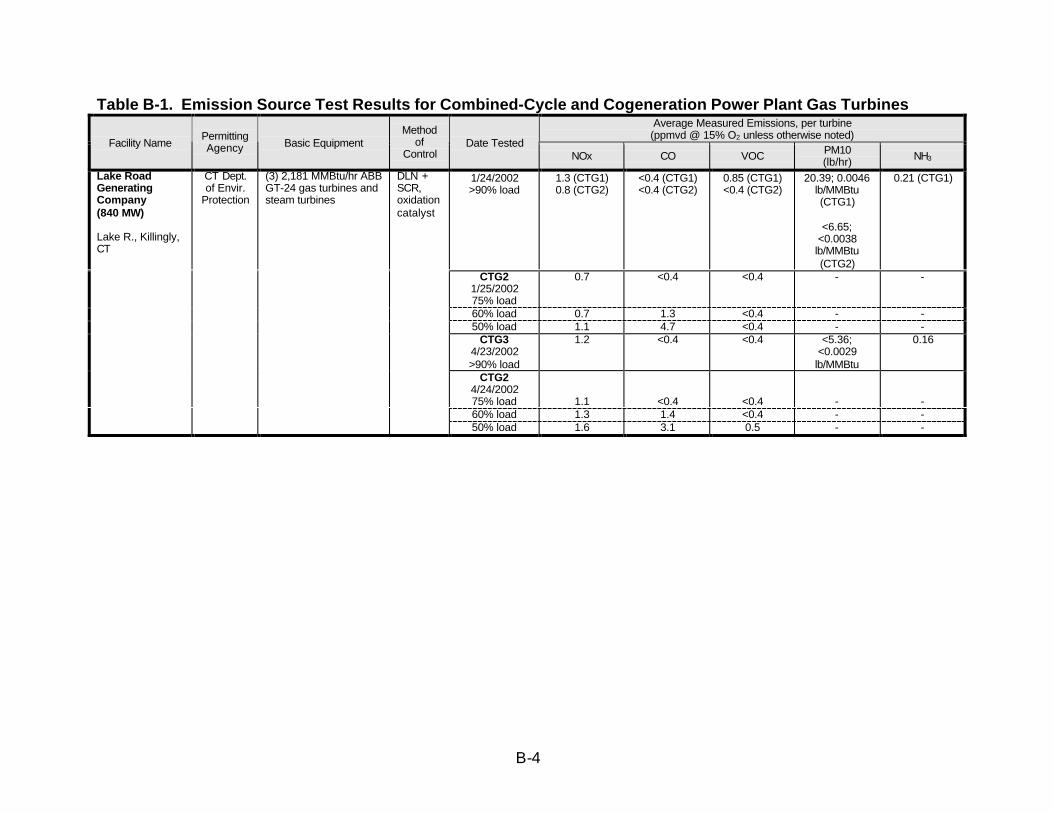
Table B-1. Emission Source Test Results for Combined-Cycle and Cogeneration Power Plant Gas Turbines Average Measured Emissions, per turbine (ppmvd @ 15% O2 unless otherwise noted)
Facility Name Permitting Agency Basic Equipment
Method of
Control Date Tested
NOx CO VOC PM10 (lb/hr) NH3
1/24/2002 >90% load
1.3 (CTG1) 0.8 (CTG2)
<0.4 (CTG1) <0.4 (CTG2)
0.85 (CTG1) <0.4 (CTG2)
20.39; 0.0046 lb/MMBtu (CTG1)
<6.65; <0.0038 lb/MMBtu (CTG2)
0.21 (CTG1)
CTG2 1/25/2002 75% load
0.7 <0.4 <0.4 - -
60% load 0.7 1.3 <0.4 - -50% load 1.1 4.7 <0.4 - -
CTG3 4/23/2002 >90% load
1.2 <0.4 <0.4 <5.36; <0.0029 lb/MMBtu
0.16
CTG2 4/24/2002 75% load 1.1 <0.4 <0.4 - -60% load 1.3 1.4 <0.4 - -
Lake Road Generating Company (840 MW)
Lake R., Killingly, CT
CT Dept. of Envir.
Protection
(3) 2,181 MMBtu/hr ABB GT-24 gas turbines and steam turbines
DLN + SCR, oxidation catalyst
50% load 1.6 3.1 0.5 - -
B-4

Table B-2. Emission Source Test Results for Simple-Cycle Power Plant Gas Turbines Average Measured Emissions, per turbine
Method (ppmvd @ 15% O2 unless otherwise noted)PermittingFacility Name Agency Basic Equipment of
Control Date Tested
NOx CO VOC PM10 (lb/hr) NH3
New York Power NY Dept. (2) GE LM6000 Sprint Water 10/3-4/2001 2.2 (CTG1) 0.1 (CTG1) - - 9.6 (CTG1) Authority /Hell of Envir. gas turbines producing injection 100% load 2.1 (CTG2) 0.1 (CTG2) 13.5 (CTG2) Gate (94 MW)
Bronx, NY
Quality 47 MW each + SCR, oxidation catalyst
90% load
80% load
2.1 (CTG1) 1.9 (CTG2) 2.0 (CTG1)
0.1 (CTG1) 0.0 (CTG2) 0.1 (CTG1)
-
-
-
-
-
-1.7 (CTG2) 0.0 (CTG2)
65% load 2.0 (CTG1) 0.1 (CTG1) - - -2.0 (CTG2) 0.0 (CTG2)
11/27/2001 2.3 (CTG2) 0.2 (CTG2) - - 3.4 (CTG2) (retest for NH3)
Calpine /Lambie Bay Area 500 MMBtu/hr GE Water 1/15-17/2003 2.45 1.71 0.61 1.90 1.50 Energy Center AQMD LM6000 PC Sprint gas injection (49.9 MW) turbine producing 49.9 + SCR,
MW oxidation 5975 Lambie Rd., catalyst Suisun City, CA Calpine /Creed Bay Area 500 MMBtu/hr GE Water 1/29-2/1/2003 1.53 1.28 0.14 2.18 0.76 Energy Center AQMD LM6000 PC Sprint gas injection (49.9 MW) turbine producing 49.9 + SCR,
MW oxidation 6150 Creed Rd., catalyst Suisun City, CA Calpine /Goose Bay Area 500 MMBtu/hr GE Water 1/22-24/2003 2.41 1.59 0.84 1.97 0.42 Haven Energy AQMD LM6000 PC Sprint gas injection Center (49.9 MW) turbine producing 49.9 + SCR,
MW oxidation 3853 Goose catalyst Haven Rd., Suisun City, CA Northern San 417 MMBtu/hr GE Steam July 2000 2.75 11.5 - 0.629 24.49 California Power Joaquin LM5000 gas turbine injection (49 MW) Valley producing 49 MW + SCR,
APCD oxidation 12751 Thornton catalyst Rd., Lodi, CA CalPeak Power San Diego 500 MMBtu/hr Pratt & DLN + 11/9/2001 1.88 6.3 2.28 - 3.36 Border LLC Co. APCD Whitney FT8 “Twin Pac” SCR, (49.5 MW) gas turbines with oxidation
common generator and catalyst Harvest Rd., San exhaust producing 49.5 Diego, CA MW
B-5
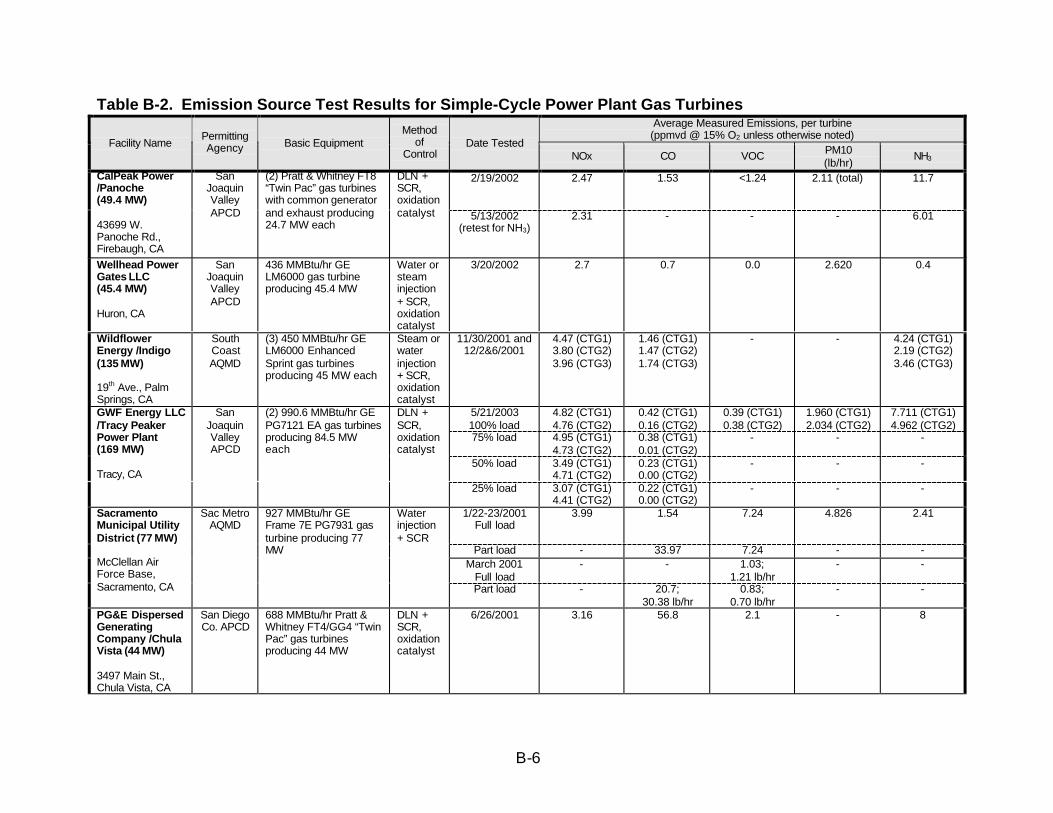
Table B-2. Emission Source Test Results for Simple-Cycle Power Plant Gas Turbines Average Measured Emissions, per turbine (ppmvd @ 15% O2 unless otherwise noted)
Facility Name Permitting Agency Basic Equipment
Method of
Control Date Tested
NOx CO VOC PM10 (lb/hr)
NH3
2/19/2002 2.47 1.53 <1.24 2.11 (total) 11.7CalPeak Power /Panoche (49.4 MW)
43699 W. Panoche Rd., Firebaugh, CA
San Joaquin Valley APCD
(2) Pratt & Whitney FT8 “Twin Pac” gas turbines with common generator and exhaust producing 24.7 MW each
DLN + SCR, oxidation catalyst 5/13/2002
(retest for NH3) 2.31 - - - 6.01
Wellhead Power Gates LLC (45.4 MW)
Huron, CA
San Joaquin Valley APCD
436 MMBtu/hr GE LM6000 gas turbine producing 45.4 MW
Water or steam injection + SCR, oxidation catalyst
3/20/2002 2.7 0.7 0.0 2.620 0.4
Wildflower Energy /Indigo (135 MW)
19th Ave., Palm Springs, CA
South Coast AQMD
(3) 450 MMBtu/hr GE LM6000 Enhanced Sprint gas turbines producing 45 MW each
Steam or water injection + SCR, oxidation catalyst
11/30/2001 and 12/2&6/2001
4.47 (CTG1) 3.80 (CTG2) 3.96 (CTG3)
1.46 (CTG1) 1.47 (CTG2) 1.74 (CTG3)
- - 4.24 (CTG1) 2.19 (CTG2) 3.46 (CTG3)
5/21/2003 100% load
4.82 (CTG1) 4.76 (CTG2)
0.42 (CTG1) 0.16 (CTG2)
0.39 (CTG1) 0.38 (CTG2)
1.960 (CTG1) 2.034 (CTG2)
7.711 (CTG1) 4.962 (CTG2)
75% load 4.95 (CTG1) 4.73 (CTG2)
0.38 (CTG1) 0.01 (CTG2)
- - -
50% load 3.49 (CTG1) 4.71 (CTG2)
0.23 (CTG1) 0.00 (CTG2)
- - -
GWF Energy LLC /Tracy Peaker Power Plant (169 MW)
Tracy, CA
San Joaquin Valley APCD
(2) 990.6 MMBtu/hr GE PG7121 EA gas turbines producing 84.5 MW each
DLN + SCR, oxidation catalyst
25% load 3.07 (CTG1) 4.41 (CTG2)
0.22 (CTG1) 0.00 (CTG2)
- - -
1/22-23/2001 Full load
3.99 1.54 7.24 4.826 2.41
Part load - 33.97 7.24 - -March 2001
Full load - - 1.03;
1.21 lb/hr - -
Sacramento Municipal Utility District (77 MW)
McClellan Air Force Base, Sacramento, CA
Sac Metro AQMD
927 MMBtu/hr GE Frame 7E PG7931 gas turbine producing 77 MW
Water injection + SCR
Part load - 20.7; 30.38 lb/hr
0.83; 0.70 lb/hr
- -
PG&E Dispersed Generating Company /Chula Vista (44 MW)
3497 Main St., Chula Vista, CA
San Diego Co. APCD
688 MMBtu/hr Pratt & Whitney FT4/GG4 “Twin Pac” gas turbines producing 44 MW
DLN + SCR, oxidation catalyst
6/26/2001 3.16 56.8 2.1 - 8
B-6

Table B-2. Emission Source Test Results for Simple-Cycle Power Plant Gas Turbines Average Measured Emissions, per turbine (ppmvd @ 15% O2 unless otherwise noted)
Facility Name Permitting Agency Basic Equipment
Method of
Control Date Tested
NOx CO VOC PM10 (lb/hr)
NH3
CTG1 2/1,4,5/2002
3.46 0.62 0.37 - 1.45
CTG2 2/7-8/2002
3.27 0.70 0.79 - 1.33
Gilroy Energy Center Phase I (135 MW)
at the Calpine Gilroy Power Plant, Gilroy, CA
Bay Area AQMD
(3) 467.6 MMBtu/hr GE LM6000PC gas turbines producing 45 MW each
Water injection or DLN + SCR, oxidation catalyst
CTG3 3/14-15/2002
3.62 0.49 0.24 - 0.87
8/28/2001 4.49 (CTG1) 4.56 (CTG2)
38.24 (CTG1) 47.81 (CTG2)
<0.96 (CTG1) <0.96 (CTG2)
- 37.4 (CTG1) 36.6 (CTG2)
CTG1 1/18/2002
4.16 12.8 <1.00 - 1.33
Wildflower Energy /Larkspur (135 MW)
Harvest Rd., Otay Mesa area, San Diego, CA
San Diego Co. APCD
(2) 395 MMBtu/hr GE LM6000 PC Sprint gas turbines producing 45 MW each
Water injection + SCR, oxidation catalyst CTG2
12/20/2001 3.39 14.6 <0.96 - 1.4
10/7/2000 100% load
7.58 0.24 0.11 - NA
85% load 6.18 0.31 0.17 - NA 70% load 6.34 0.42 0.33 - NA
Tampa Electric Company /Polk Power Station (165 MW)
Mulberry, Polk Co., FL
FL Dept. of Envir.
Protection
1,600 MMBtu/hr GE PG7241FA gas turbine producing 165 MW
DLN
50% load 5.30 1.31 0.41 - NA
CTG1 7/9/2001
6.79 0.49 <0.81 3.52 NASunrise Power Company Phase I (320 MW)
Kern Co., CA
San Joaquin Valley APCD
(2) GE Frame 7FA gas turbines producing 165 MW each
DLN
CTG2 7/12/2001
6.38 0.47 <0.76 1.91 NA
B-7

APPENDIX C

Table C-1. Area Designations for State PM2.5 Ambient Air Quality Standard
Air Basin Area Included Designation Mojave Desert Central San Bernardino County (portion of San N
Bernardino County within the federal Modified AQMA for ozone)
Mountain Counties Plumas County N Sacramento Valley Butte and Sacramento counties, portion of Placer N
County within air basin Salton Sea Imperial County N San Diego Entire air basin N San Francisco Bay Entire air basin N Area San Joaquin Valley Entire air basin N South Central Coast Ventura County (including Anacapa and San N
Nicolas islands) South Coast Entire air basin (including San Clemente and N
Santa Catalina islands)
Lake County Entire air basin A
Great Basin Valleys Entire air basin U Lake Tahoe Entire air basin U Mojave Desert Portion of Kern County, portion of Los Angeles U (remainder) County, portion of Riverside County within air
basin Mountain Counties Amador, Calaveras, Mariposa, Nevada, Sierra, U (remainder) and Tuolumne counties; portion of El Dorado
County; portion of Placer County within air basin North Central Coast Entire air basin U North Coast Entire air basin U Northeast Plateau Entire air basin U Sacramento Valley Colusa, Glenn, Shasta, Sutter, Tehama, Yolo, and U (remainder) Yuba counties; portion of Solano County within air
basin Salton Sea Portion of Riverside County within air basin U (remainder) South Central Cost San Luis Obispo and Santa Barbara counties U (remainder) (including San Miguel, Santa Barbara, Santa
Cruz, and Santa Rosa islands) A = Attainment; indicates no violations of the State standard in the area during the previous three years. N = Nonattainment; indicates at least one violation of the State standard in the area during the previous three years. U = Unclassified; indicates data are not sufficient for determining attainment or nonattainment.
APPENDIX D

Comment Letter 1 from Mitsubishi Power Systems, Inc.
Subject: RE: noxlegrpt Draft Report Available for Comment Date: Wed, 31 Mar 2004 14:25:23 -0800 From: "Fusato Dana" <[email protected]> To: <[email protected]> CC: <[email protected]>
Merrin,
Thank you for sending us the draft copy of the report. I have read the copy and have only one comment.
Page 23 of the draft, 2nd sentence. Please correct the sentence to read: "Ammonia is injected into the combustion turbine exhaust through the ammonia injection grid (AIG)."
Thanks Fusato Dana Sr Sales & Marketing Administrator Mitsubishi Power Systems, Inc. 100 Bayview Circle, Suite 4000 Newport Beach, CA 92660
D-1
Comment Letter 2 from Lindh & Associates
Subject: noxlegrpt Draft Report Date: Thu, 25 Mar 2004 08:49:04 -0800 From: "Chuck Solt" <[email protected]> To: <[email protected]> CC: "Stephanie Kato" <[email protected]>,
"Michael Tollstrup" <[email protected]>
I would like to make 2 comments on the report:
Under “Findings” (Page 3), I suggest changing as shown:
The Xonon Cool Combustion system has shown to be an effective pollution prevention device that can achieve NOx emission levels required as BACT in California for simple-cycle gas turbine power plants without the associated environmental impacts from ammonia use; however, the technology has limited applications at this time.
My understanding was that the primary issue of the document is to examine the environmental benefits of using a NOx control technology that does not use ammonia. To that end, I suggest you compare the total ammonia emissions in California with the ammonia slip from SCR.
Thank you for your consideration.
Chuck Solt J C Solt Lindh & Associates
D-2
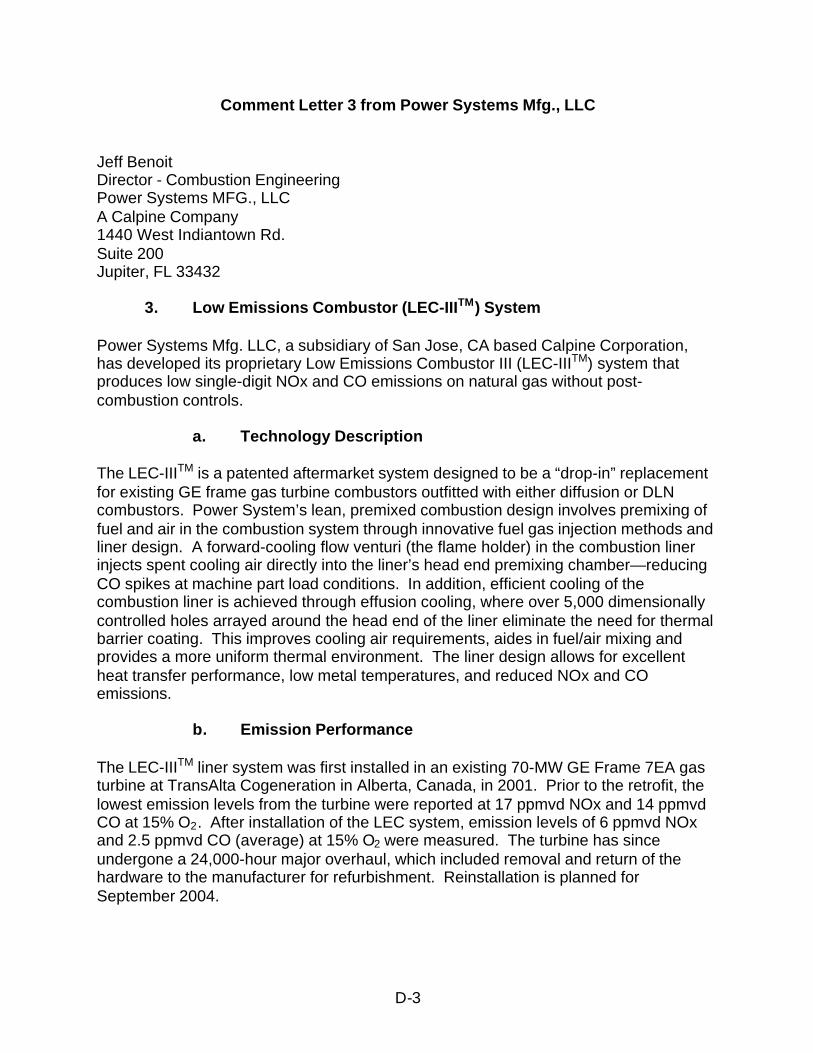
Comment Letter 3 from Power Systems Mfg., LLC
Jeff Benoit Director - Combustion Engineering Power Systems MFG., LLC A Calpine Company 1440 West Indiantown Rd. Suite 200 Jupiter, FL 33432
3. Low Emissions Combustor (LEC-IIITM) System
Power Systems Mfg. LLC, a subsidiary of San Jose, CA based Calpine Corporation, has developed its proprietary Low Emissions Combustor III (LEC-IIITM) system that produces low single-digit NOx and CO emissions on natural gas without post-combustion controls.
a. Technology Description
The LEC-IIITM is a patented aftermarket system designed to be a “drop-in” replacement for existing GE frame gas turbine combustors outfitted with either diffusion or DLN combustors. Power System’s lean, premixed combustion design involves premixing of fuel and air in the combustion system through innovative fuel gas injection methods and liner design. A forward-cooling flow venturi (the flame holder) in the combustion liner injects spent cooling air directly into the liner’s head end premixing chamber—reducing CO spikes at machine part load conditions. In addition, efficient cooling of the combustion liner is achieved through effusion cooling, where over 5,000 dimensionally controlled holes arrayed around the head end of the liner eliminate the need for thermal barrier coating. This improves cooling air requirements, aides in fuel/air mixing and provides a more uniform thermal environment. The liner design allows for excellent heat transfer performance, low metal temperatures, and reduced NOx and CO emissions.
b. Emission Performance
The LEC-IIITM liner system was first installed in an existing 70-MW GE Frame 7EA gas turbine at TransAlta Cogeneration in Alberta, Canada, in 2001. Prior to the retrofit, the lowest emission levels from the turbine were reported at 17 ppmvd NOx and 14 ppmvd CO at 15% O2. After installation of the LEC system, emission levels of 6 ppmvd NOx and 2.5 ppmvd CO (average) at 15% O2 were measured. The turbine has since undergone a 24,000-hour major overhaul, which included removal and return of the hardware to the manufacturer for refurbishment. Reinstallation is planned for September 2004.
D-3
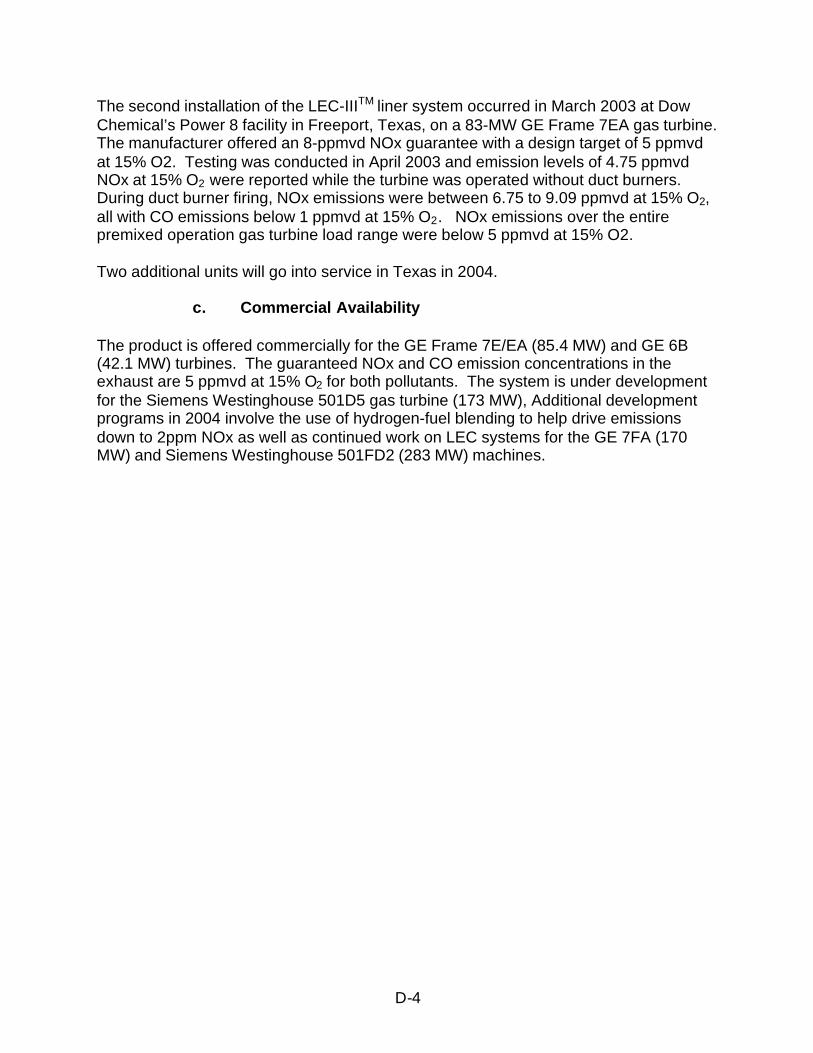
The second installation of the LEC-IIITM liner system occurred in March 2003 at Dow Chemical’s Power 8 facility in Freeport, Texas, on a 83-MW GE Frame 7EA gas turbine. The manufacturer offered an 8-ppmvd NOx guarantee with a design target of 5 ppmvd at 15% O2. Testing was conducted in April 2003 and emission levels of 4.75 ppmvd NOx at 15% O2 were reported while the turbine was operated without duct burners. During duct burner firing, NOx emissions were between 6.75 to 9.09 ppmvd at 15% O2, all with CO emissions below 1 ppmvd at 15% O2. NOx emissions over the entire premixed operation gas turbine load range were below 5 ppmvd at 15% O2.
Two additional units will go into service in Texas in 2004.
c. Commercial Availability
The product is offered commercially for the GE Frame 7E/EA (85.4 MW) and GE 6B (42.1 MW) turbines. The guaranteed NOx and CO emission concentrations in the exhaust are 5 ppmvd at 15% O2 for both pollutants. The system is under development for the Siemens Westinghouse 501D5 gas turbine (173 MW), Additional development programs in 2004 involve the use of hydrogen-fuel blending to help drive emissions down to 2ppm NOx as well as continued work on LEC systems for the GE 7FA (170 MW) and Siemens Westinghouse 501FD2 (283 MW) machines.
D-4
Comment Letter 4 from Sacramento Municipal Utility District
Subject: Gas-Fired Power Plant NOx Emissions - Draft Report to the Legislature (March 2004) Date: Wed, 7 Apr 2004 14:18:31 -0700 From: "Stu Husband" <[email protected]> To: <[email protected]> CC: "Ross Gould" <[email protected]>
Ms. Bueto:
Thank you for the opportunity to comment on the referenced draft report. SMUD owns and controls approximately 500 MW of gas-fired generation capacity in the greater Sacramento area. Our comments focus primarily on pages A-9 and B-6 of the draft report. On those pages, information is presented for SMUD's 77 MW gas turbine generator located at McClellan Park (formerly McClellan Air Force Base). Please note that this is an industrial frame natural gas-fired gas turbine in simple cycle configuration with water injection NOx control technology, and was originally installed in 1986. In 2000, SMUD retrofit the unit with SCR to reduce NOx emissions and increase permitted operational flexibility. Due to performance problems with the original SCR installation, the unit's SCR system is currently being rebuilt including catalyst replacement. Hence, this facility does not meet the intended scope of the report stated on page 2 as being "new" power plant installations. From that perspective, SMUD believes that it may not be appropriate to include information for the McClellan turbine facility in this report.
However, in lieu of deleting the McClellan turbine facility from the report, the following comments pertain to the table columns presenting CO and VOC information. On Table A-2 (page A-9), emission limits for CO and VOC are listed as 23 ppm and 2 ppm, respectively. This is not correct. Our air permit does not contain CO or VOC concentration emission limits. For CO and VOC, our air permit contains mass emission limits only. These are 46.98 lb/hr CO and 2.36 lb/hr VOC, both on a 3-hr average basis.
On Table B-2 (page B-6), CO and VOC source test results are presented in concentration units. Although not specified in the table, the first set of CO/VOC values (1.54 ppm CO / 7.24 ppm VOC) was at full load operation and the second set of values (33.97 ppm CO / 19.24 ppm VOC) was at part load operation. Due to problems with the initial source testing conducted on 1/22-23/2001, SMUD did not believe these results were representative and the unit was retested in March 2001 with the following results:
* CO part load - 20.7 ppm corrected and 30.38 lb/hr * VOC part load - 0.83 ppm corrected and 0.70 lb/hr * VOC full load - 1.03 ppm corrected and 1.21 lb/hr
Other comments for your consideration are as follows:
D-5

* Pages 31-32, Catalyst Washing - The report presumes disposal of catalyst wash wastewater in a public sewer system. Many power plants do not have ready access on site to a public sewer system. In this case, options could include disposal of wastewater to land or surface water if allowed by applicable water quality regulations. This option may be constrained due to stringent water quality release criteria, particularly where NPDES surface water discharge permits are involved. Another option could be to transport the wastewater to an off-site disposal facility or public sewer system that will accept the wastewater.
Please do not hesitate to contact me if there are any questions on these comments.
Stu Husband Regulatory Compliance Coordinator, Power Generation Sacramento Municipal Utility District 6201 S Street, MS-B355 Sacramento, CA 95817-1899
D-6

Comment Letter 5 from South Coast Air Quality Management District
Subject: NOx Controls Report Date: Wed, 7 Apr 2004 13:41:47 -0700 From: "Howard Lange" <[email protected]> To: <[email protected]>
In the discussion of ammonia impacts, it would be useful to explain what is included in the various non-agricultural categories depicted in Figure IV-1, i.e., mobile, industrial, soil, waste, domestic. If ammonia inventory from NOx controls is such a tiny fraction of total ammonia inventory even in non-agricultural areas, as this figure suggests, it would seem that we should not be placing much emphasis on ammonia limits on sources that use ammonia for NOx control. In the permits reflected in Appendix A, the trend seems to be toward increasingly more stringent ammonia limits. Is this really productive in most cases? Perhaps the report could provide a little more guidance on this.
Howard B. Lange, Air Quality Engineer South Coast Air Quality Management District 21865 Copley Drive, Diamond Bar, CA 91765-4182
D-7
Comment Letter 6 from Catalytica Energy Systems
Subject: [Fwd: FW: Leg Report] Date: Tue, 13 Apr 2004 16:03:30 -0700 From: Beverly Werner <[email protected]> To: Merrin Bueto <[email protected]>
Subject: RE: FW: Leg Report Date: Tue, 13 Apr 2004 13:57:29 -0700 From: [email protected] To: [email protected] CC: [email protected]
• The Xonon Cool Combustion system has shown to be an effective pollution prevention device that can achieve NOx emission levels required as BACT in California for both simple-cycle and combined cycle gas turbine power plants without the associated environmental impacts from ammonia use; however, the technology has limited applications at this time.
Each Xonon combustor is customized to the particular turbine model and application and is defined through a collaborative effort with the turbine original equipment manufacturer (OEM) to integrate the hardware into the design. Xonon is currently only commercially available from Kawasaki Gas Turbines-Americas on a small 1.4 MW gas turbine.
The Xonon system was first designed into the combustor of a 1.4 MW Kawasaki Model M1A-13A gas turbine and began operating at Silicon Valley Power Coporation in Santa Clara, California, in 1999. Since its installation, the turbine has operated as a demonstration of Xonon’s performance and as a development and test unit in support of commercial program initiatives for customers. More than 18,000 hours of Xonon performance data has been accumulated on the demonstration unit.
As a result of a collaborative agreement announced in December 2000, Kawasaki Gas Turbines-Americas markets and sells a GPB15X generator package including a 1.4-MW M1A-13X gas turbine equipped with Xonon. Kawasaki will provide a performance guarantee for NOx of 3.0 ppmvd and 10.0 ppmvd at 15% O2 on a continuous basis over a 70-100 percent turbine operating load.
D-8

Comment Letter 7 from California Council for Environmental and Economic Balance (CCEEB)
CALIFORNIA COUNCIL FOR ENVIRONMENTAL AND ECONOMIC BALANCE
COMMENTS REGARDING ARB’S DRAFT REPORT TO THE LEGISLATURE:
GAS-FIRED POWER PLANT NOx EMISSION CONTROLS AND RELATED ENVIRONMENTAL IMPACTS
(March 2004 ARB Draft) (Comments Submitted April 13, 2004)
The California Council for Environmental and Economic Balance (“CCEEB”) is a nonprofit, nonpartisan coalition of business, labor and public leaders that works to advance policies that protect public health and the environment while also allowing for economic growth. Some of CCEEB’s members own and operate power plants in California. Following are CCEEB’s comments regarding the March 2004 draft of the Air Resources Board’s (“ARB’s”) Report to the Legislature: Gas-Fired Power Plant NOx Emission Controls and Related Environmental Impacts.
1. General Comment
The draft report is a well-written and well-organized document.
2. Caveats
ARB indicates (at Pages 2 and 3 of the draft) that the report:
a. “is not intended to establish new BACT emission levels or certify or validate any emission levels purported to be achieved at various facilities.”
b. “does not include conclusions or recommendations.”
c. “provides information that can be used as a starting point in conducting more detailed site-specific analyses of the environmental advantages and disadvantages of control technologies that reduce NOx emissions from natural gas-fired power plants.”
CCEEB supports the inclusion of these important caveats in the report.
3. Proposed Finding regarding SCONOx
A. BACT Emission Levels
D-9
As explained below, CCEEB has strong concerns regarding how the draft report characterizes the ability of SCONOx to meet Best Available Control Technology (“BACT”) emission limitations for power plants. As context for this section, we emphasize that a key element of whether a technology meets a BACT limit is the “achieved in practice” element. This element ensures that a technology will reliably meet the BACT emission limitation for the application in question so that the high compliance costs will not be wasted.
At the first bullet on Page 3, ARB proposes to state that:
“The SCONOx catalytic absorption system produces beneficial NOx, carbon monoxide (CO), and volatile organize compound (VOC) emission reductions without the associated environmental impacts from ammonia use and can achieve emissions levels required as BACT in California.”
Similarly, at Page 9, ARB proposes to state:
“(…) the control technologies described in this chapter are those that have the ability to meet or that facilitate meeting the ARB’s recommended BACT emission levels for power plant gas turbines.”
Our concern is that these statements could mislead a reader (including Legislators and staff of the State Legislature) into believing that SCONOx will work reliably in meeting BACT and in its operation for all power plant situations – which is not the case. We appreciated that this is not ARB’s intent, but it is critical that a report to the Legislature be transparent as to what is really the current status of the technology for meeting BACT limits.
Table III-3 on Page 16 and the text on Pages 16 and 17 include useful information regarding SCONOx. They note that the “SCONOx system is installed at a total of seven sites in the United States.” The use of SCONOx at these plants involves the generation of from 43 MW down to 5.2 MW (i.e., smaller applications). At Pages 16 and 17, ARB includes a discussion of the installation experience at these plants. What is missing from the Executive Summary finding and the related text of the report is a discussion of the lack of experience (and BACT determinations) for use of SCONOx in larger applications. In the CEC’s power plant licensing process, significant issues have arisen as to the reliability and scope of vendor guarantees for SCONOx for larger utility-grade operations.
CCEEB urges ARB to clarify in both the Executive Summary and the supporting text of the report that SCONOx has been demonstrated to meet BACT for some applications but has not been shown to meet BACT for all power plant applications including larger applications. On a related note, we support ARB’s inclusion of the statement on Page 33 that the “SCONOx system is not available for use in simple-cycle configurations because the turbine exhaust temperatures are outside the effective range of the control technology.”
Please note that our comments in this area are not intended as a criticism of SCONOx. CCEEB recognizes the benefits of SCONOx for the commercial applications for which it has been demonstrated to meet BACT levels (and for which a vendor will provide a guarantee to that
D-10
effect). Our concern is that future legislative and regulatory requirements for controls for new power plants must tied to emission levels that have been “achieved in practice” for the application in question. This is necessary to assure that large environmental compliance investments made during the construction of new power plants are not wasted. It is critical that the Legislature understand the complete picture in this area.
B. Environmental Impacts
As noted above, at the first bullet on Page 3, ARB proposes to state that:
“The SCONOx catalytic absorption system produces beneficial NOx, carbon monoxide (CO), and volatile organize compound (VOC) emission reductions without the associated environmental impacts from ammonia use and can achieve emissions levels required as BACT in California.”
In addition to the concerns raised above, we are concerned that from reading this proposed finding and the other proposed findings in the Executive Summary, a person might conclude that there are no environmental impact issues associated with SCONOx. With regard to both the findings and the text regarding environmental issues associated with SCONOx at Pages 31-32, we suggest that ARB may want to add information regarding the handling of hydrogen and potential emissions of H2S and SO2.
4. The Differences in Cost of Controls
In the last bullet on Page 4, ARB proposed to state that:
“Available cost data indicates that SCR used in conjunction with an oxidation catalyst costs less than SCONOx for the same level of emission reduction.”
In the supporting text on Page 33, ARB proposes to state that:
“Cost figures show that the SCR/oxidation catalyst package is less than the SCONOx system.”
First, CCEEB supports inclusions of such statements in the report. It is important that the Legislature be aware of the cost differences. Second, we note that the two statements are accurate, but they do not convey that the estimated cost differences are substantial. In Table V-1, the data indicates that for a 500-MW combined-cycle gas turbine power plant, the capital cost for SCONOx may be over three times as much as SCR/CO (i.e., $20,747,637 for SCONOx and $6,259,857 for SCR/CO). The table indicates that the annual operation and maintenance costs for SCONOx may be over double same costs for SCR/CO (i.e., $3,027,653 per year for SCONOx and $1,355,253 per year for SCR/CO).
We suggest that ARB be more explicit regarding the cost differences. One way to accomplish this would be to insert the word “significantly” before the word “less” in the two above-quoted sentences.
D-11
Also, with regarding to Table V-1, the table is labeled as “Estimated Average Cost of Post-Combustion Control Technology for a 500-MW Combined-Cycle Gas Turbine Power Plant meeting BACT.” As noted previously, the text and Table III-3 on Page 16 indicates that the “SCONOx system is installed at a total of seven sites in the United States.” The seven plants are plants with 43 MW or less (i.e., plants that are much smaller than 500 MW plants). Based on that information, we expect that the “estimated average cost of post-combustion control technology for a 500-MW Combined-Cycle Gas Turbine” is based on a scaling up of costs for SCONOx for smaller plants – and there are no real cost numbers for installed SCONOx for a 500-MW power plant. Assuming this is the case, we recommend that ARB note this clearly and note that the estimates are hypothetical numbers based on scaled-up data, and that inclusion of the table does not imply that a 500-MW combined cycle gas turbine power plant meeting BACT limits with SCONOx exists.
5. Stratospheric Ozone Depletion
In the second paragraph on Page 6, the draft report states that NOx emissions are of particular concern due to their contribution to “ground-level ozone formation, stratospheric ozone depletion, and acid rain.” Our understanding is that NOx is not a compound that is regulated as a stratospheric ozone-depleting compound. (Please see http://www.epa.gov/ozone/ods.html.) Further, the issue of stratospheric ozone depletion is beyond the scope of the requested report. CCEEB suggests that ARB delete the reference to stratospheric ozone depletion from this sentence.
CCEEB appreciates ARB’s consideration of these comments. If you have any questions, please contact Cindy Tuck at (916) 442-4249.
D-12

Comment Letter 8 from Florida Power & Light Group
Subject: Gas Fired NOx emissions controls draft report. Date: Tue, 13 Apr 2004 13:52:29 -0400 From: [email protected] To: [email protected]
My name is Kyle Boudreaux and I work for FPL Group, Juno Beach, FL. A subsidiary of our company, FPL Energy, owns a gas fired power plant in Blythe, CA. In addition, our corporation has developed numerous gas fired power plants in several states outside of Florida and have re-powered several of our Florida facilities to run on natural gas. We have been recognized by Innovest for the past three years as the top performer in environmental excellence among electric utilities in the US. Everyone of our environmental experts that I showed your draft document to agreed with the majority of the information in your report. The individuals who prepared this report for the California Air Resources Board did an excellent job. The document is obviously the result of a well designed plan to research and gather information on NOx controls for gas fired power plants. The only suggestion I received for a possible improvement is related to SCONOX technology and large combustion turbines. The report seems to indicate that SCONOX is a commercially viable and technically feasible technology. We have not found this to be the case for large combustion turbines in our fleet. Typically, the reaction chambers are complex, the maintenance costs are high and we are not aware of the technology being proven to work on larger units. We know that the technology is being developed and there is a permit application in process for one of these units in San Joaquin County, but we do not feel SCONOX has reached the level of reliability and economic feasibility as other technologies for these larger turbines.
Thank You,
Kyle Boudreaux Sr Environmental Specialist Environmental Services
D-13
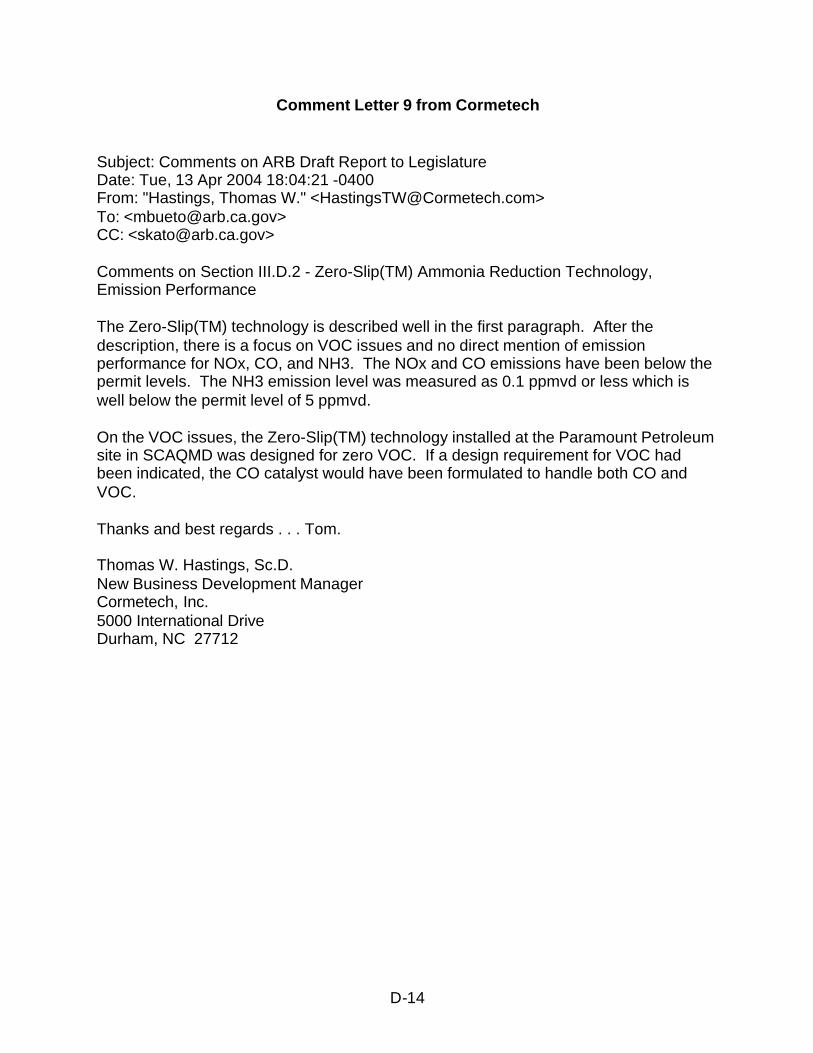
Comment Letter 9 from Cormetech
Subject: Comments on ARB Draft Report to Legislature Date: Tue, 13 Apr 2004 18:04:21 -0400 From: "Hastings, Thomas W." <[email protected]> To: <[email protected]> CC: <[email protected]>
Comments on Section III.D.2 - Zero-Slip(TM) Ammonia Reduction Technology, Emission Performance
The Zero-Slip(TM) technology is described well in the first paragraph. After the description, there is a focus on VOC issues and no direct mention of emission performance for NOx, CO, and NH3. The NOx and CO emissions have been below the permit levels. The NH3 emission level was measured as 0.1 ppmvd or less which is well below the permit level of 5 ppmvd.
On the VOC issues, the Zero-Slip(TM) technology installed at the Paramount Petroleum site in SCAQMD was designed for zero VOC. If a design requirement for VOC had been indicated, the CO catalyst would have been formulated to handle both CO and VOC.
Thanks and best regards . . . Tom.
Thomas W. Hastings, Sc.D. New Business Development Manager Cormetech, Inc. 5000 International Drive Durham, NC 27712
D-14


