Page 1
March 31, 2016
AERIAL ASSESSMENT OF THE RIPARIAN AREAS OF THE VERMILION RIVER AB, AND ITS MAJOR TRIBUTARIES
North Saskatchewan Watershed Alliance
RE
PO
RT
Report Number: 1534932
Distribution:
One electronic copy to North Saskatchewan Watershed Alliance
One electronic copy to Golder Associates Ltd.
Submitted to:
David Trew and Marilou Montemayor North Saskatchewan Watershed Alliance Unit 202, 9440 - 49 Street NW Edmonton, AB T6B 2M9
Page 2
VERMILION RIVER AB, RIPARIAN INVENTORY AND ASSESSMENT
March 2016 Report No. 1534932 i
Page 3
VERMILION RIVER AB, RIPARIAN INVENTORY AND ASSESSMENT
March 2016 Report No. 1534932 ii
Table of Contents
1.0 INTRODUCTION .................................................................................................................................................... 1
1.1 Background Information ............................................................................................................................ 1
2.0 METHODS ............................................................................................................................................................. 4
2.1 Data Acquisition and Compilation ............................................................................................................. 4
2.1.1 Digital Base Data ................................................................................................................................ 4
2.1.2 Aerial Imagery, LiDAR and Video........................................................................................................ 4
2.2 Riparian Mapping ...................................................................................................................................... 6
2.2.1 Terrain ................................................................................................................................................. 6
2.2.2 River Reach Determination ................................................................................................................. 6
2.2.3 Vegetation ........................................................................................................................................... 7
2.2.4 Riparian Health ................................................................................................................................... 8
2.3 Analysis .................................................................................................................................................. 10
2.3.1 Terrain Analysis and Drainage Area Updates ................................................................................... 10
2.3.2 Pre-Disturbance Vegetation Cover.................................................................................................... 10
2.3.3 Landcover Change ............................................................................................................................ 10
3.0 RESULTS ............................................................................................................................................................ 11
3.1 Terrain .................................................................................................................................................... 11
3.2 River Reach Determination ..................................................................................................................... 11
3.3 Vegetation .............................................................................................................................................. 11
3.4 Riparian Health ....................................................................................................................................... 15
3.5 Terrain Analysis and Drainage Area Updates ......................................................................................... 18
3.6 Pre-Disturbance Vegetation Cover ......................................................................................................... 19
3.7 Landcover Change ................................................................................................................................. 20
4.0 DISCUSSION AND RECOMMENDATIONS ........................................................................................................ 21
4.1 Riparian Health ....................................................................................................................................... 21
4.2 Field Surveys .......................................................................................................................................... 22
4.3 Prioritization of Areas for Restoration and Conservation ........................................................................ 22
4.4 Additional Tributaries to be Mapped ....................................................................................................... 23
Page 4
VERMILION RIVER AB, RIPARIAN INVENTORY AND ASSESSMENT
March 2016 Report No. 1534932 iii
5.0 CONCLUSION ..................................................................................................................................................... 24
TABLES
Table 1: Major Watercourses in Vermillion River Watershed .......................................................................................... 1
Table 2: Vegetation Classification Categories ................................................................................................................. 7
Table 3: Adjacent Land-use Categories .......................................................................................................................... 8
Table 4: Riparian Health Status Categories used in the ACA Methodology (ACA 2009) for Riparian Lands ................ 10
Table 5: Reach Breaks in Study Area ........................................................................................................................... 12
Table 6: Riparian Health Score and Length by Drainage within the Vermilion River Watershed ................................... 15
Table 7: Landcover Change Analysis within the Vermilion River Watershed between 1990 and 2010. ........................ 20
Table 8: Advantages and Disadvantages of Using Stereo Digital Imagery Compared to Aerial Videography............... 21
FIGURES
Figure 1: Vermillion River Watershed .............................................................................................................................. 2
Figure 2: Flight Plan for Collection of Digital Multispectral (RGB) Imagery ..................................................................... 5
Figure 3: Vermilion River Watershed Riparian Health Summary ................................................................................... 15
Figure 4: Riparian Health Score Summaries for Birch, Campbell, Cotton and Deer Creek Drainages .......................... 16
Figure 5: Riparian Health Score Summaries for Holden, Irish, Lamont, Marwayne, Mundare and Stretton Creek Drainages ..................................................................................................................................................... 17
Figure 6: Riparian Health Score Summaries for Vermilion River, Warwick and Waskwei Creek Drainages ................. 18
APPENDICES
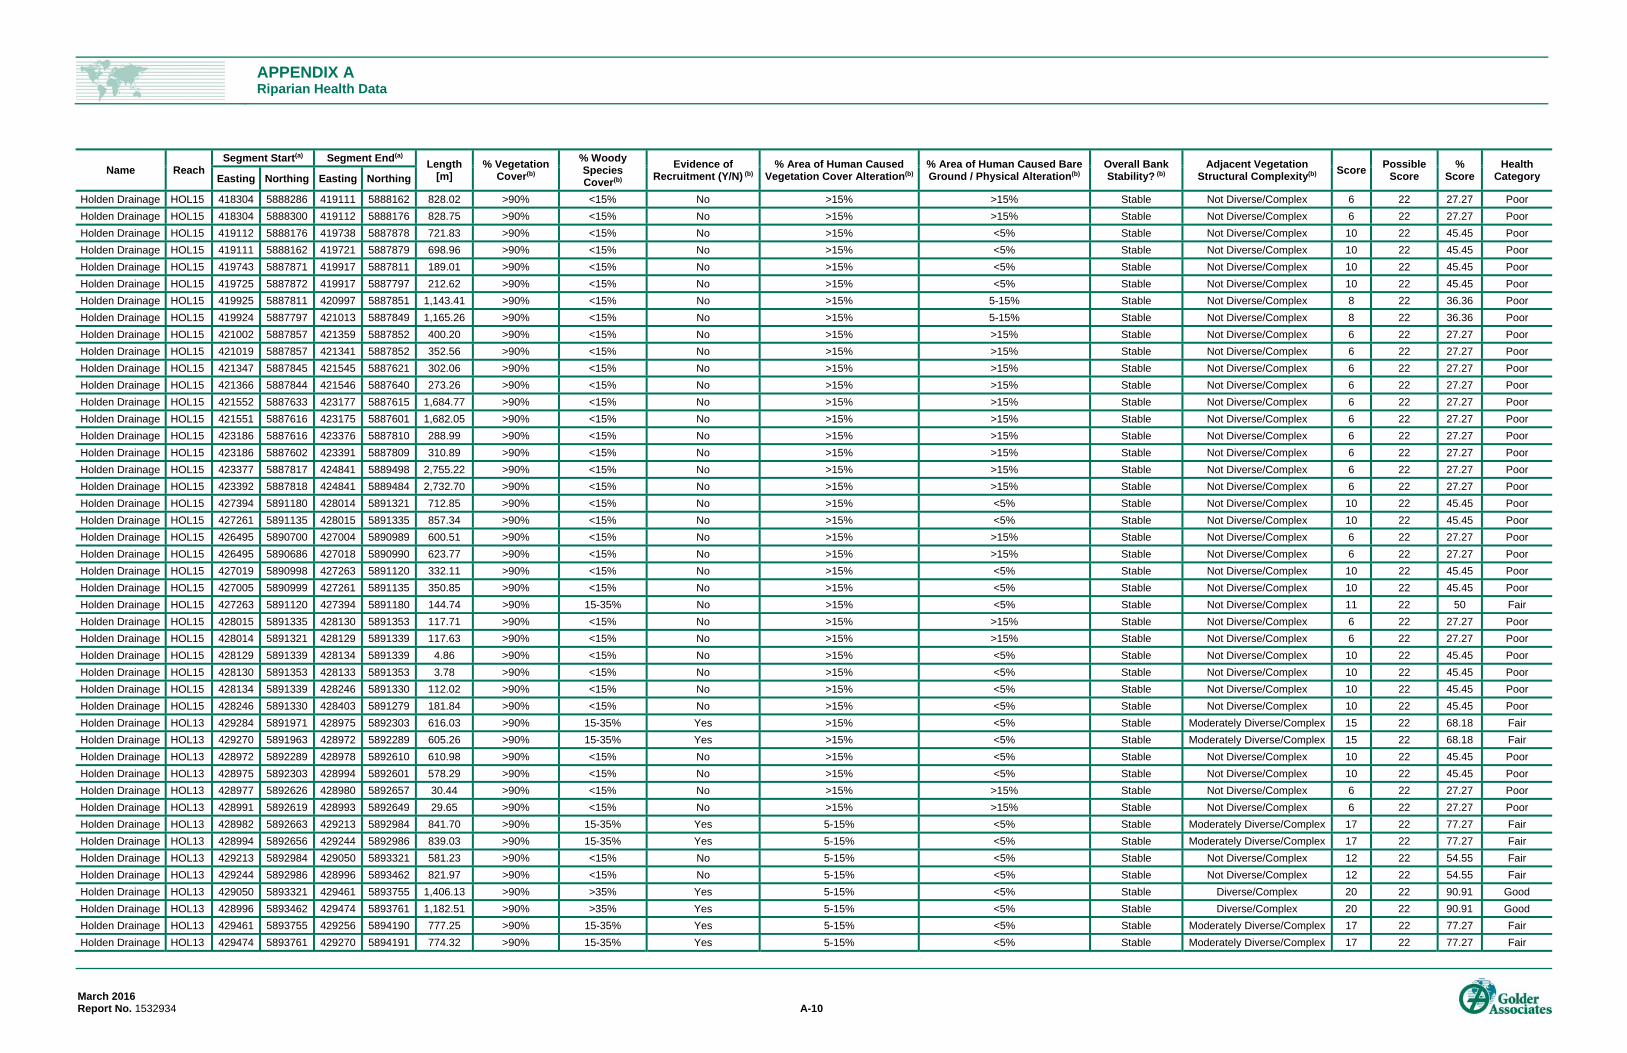
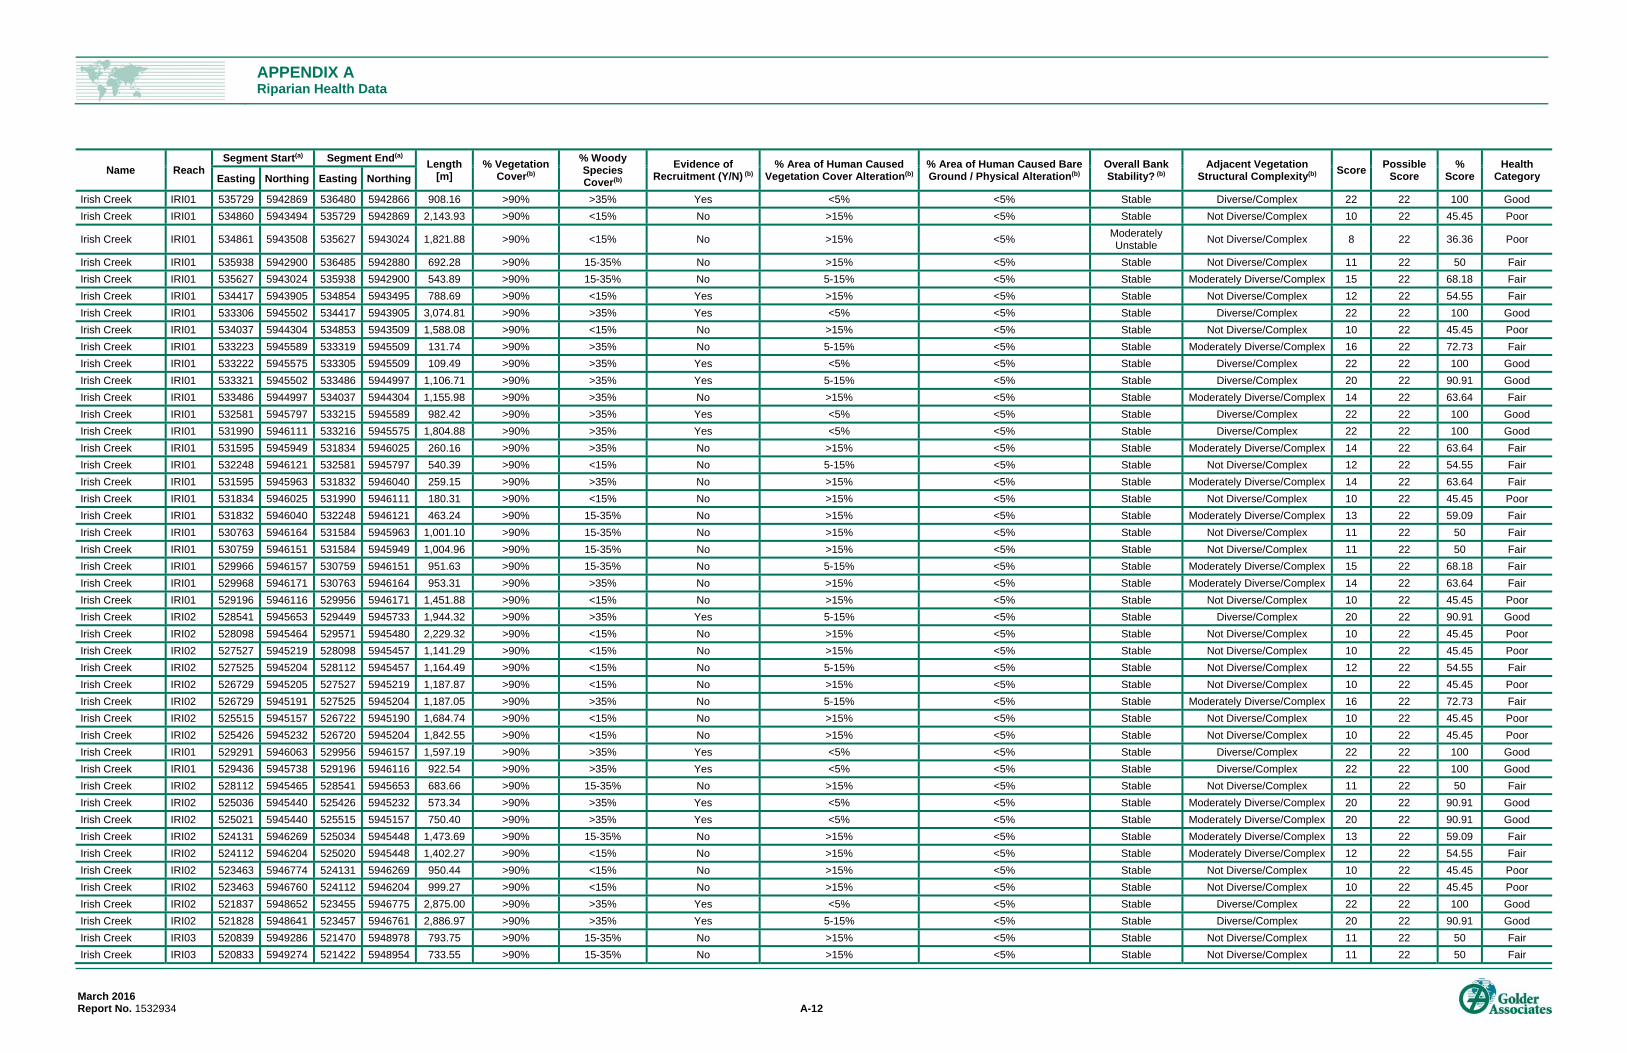
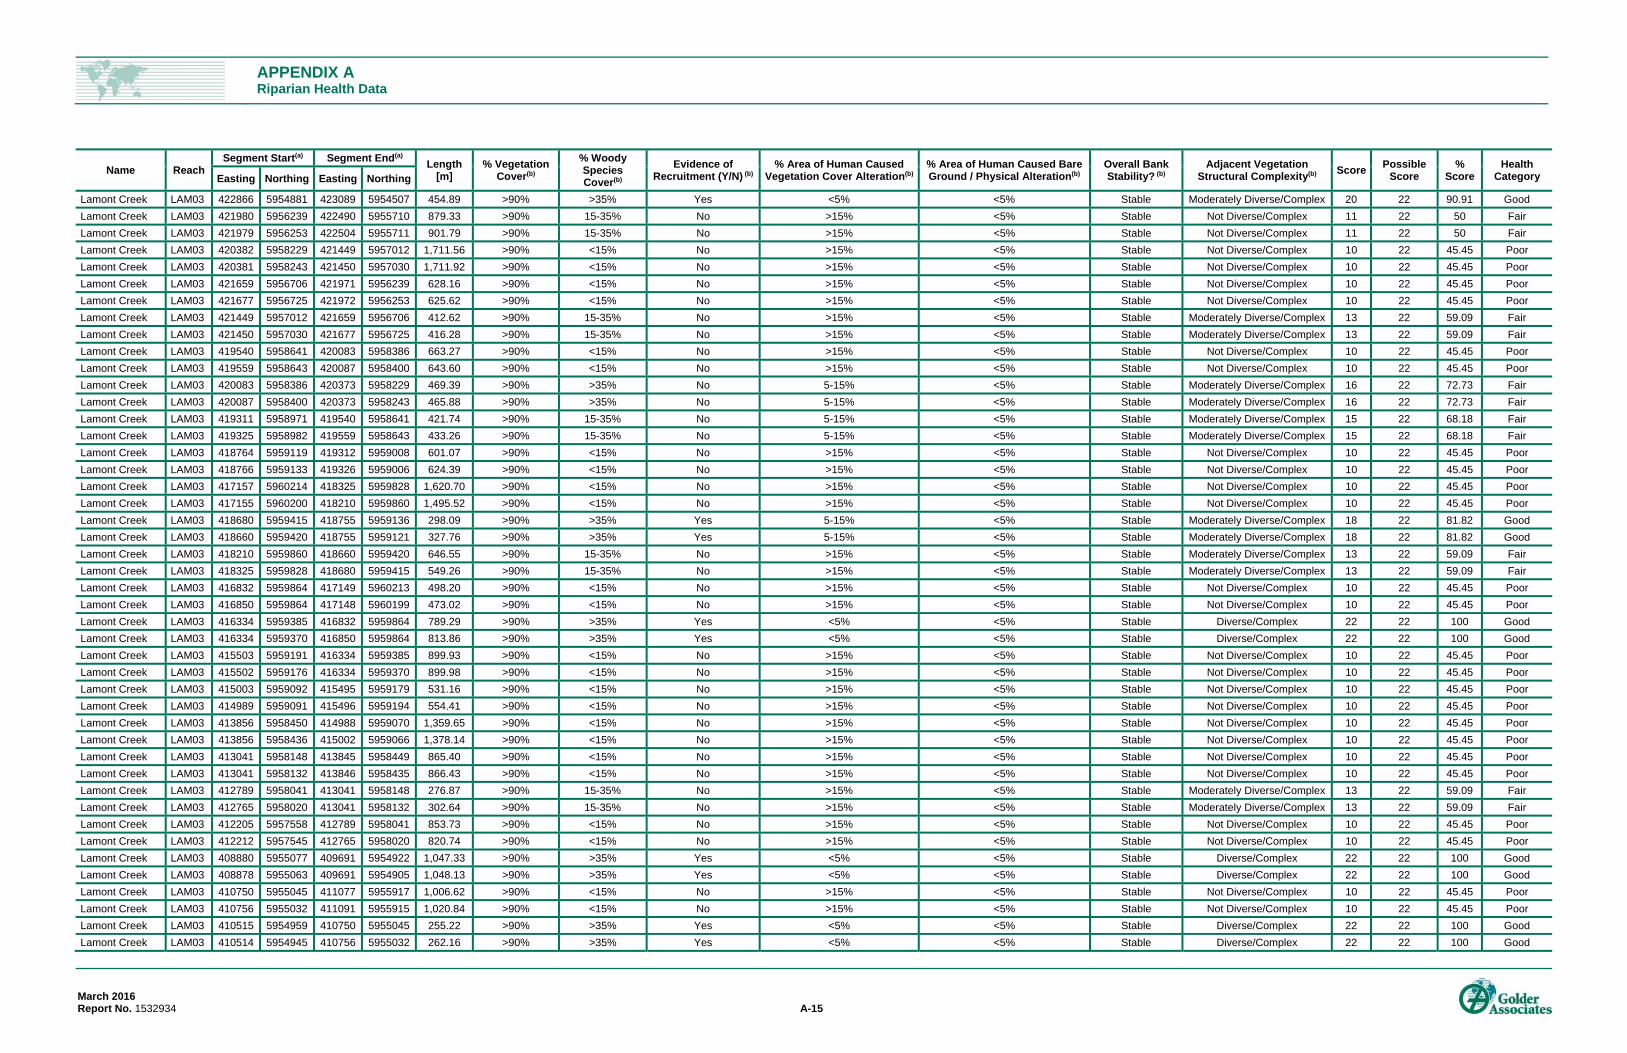
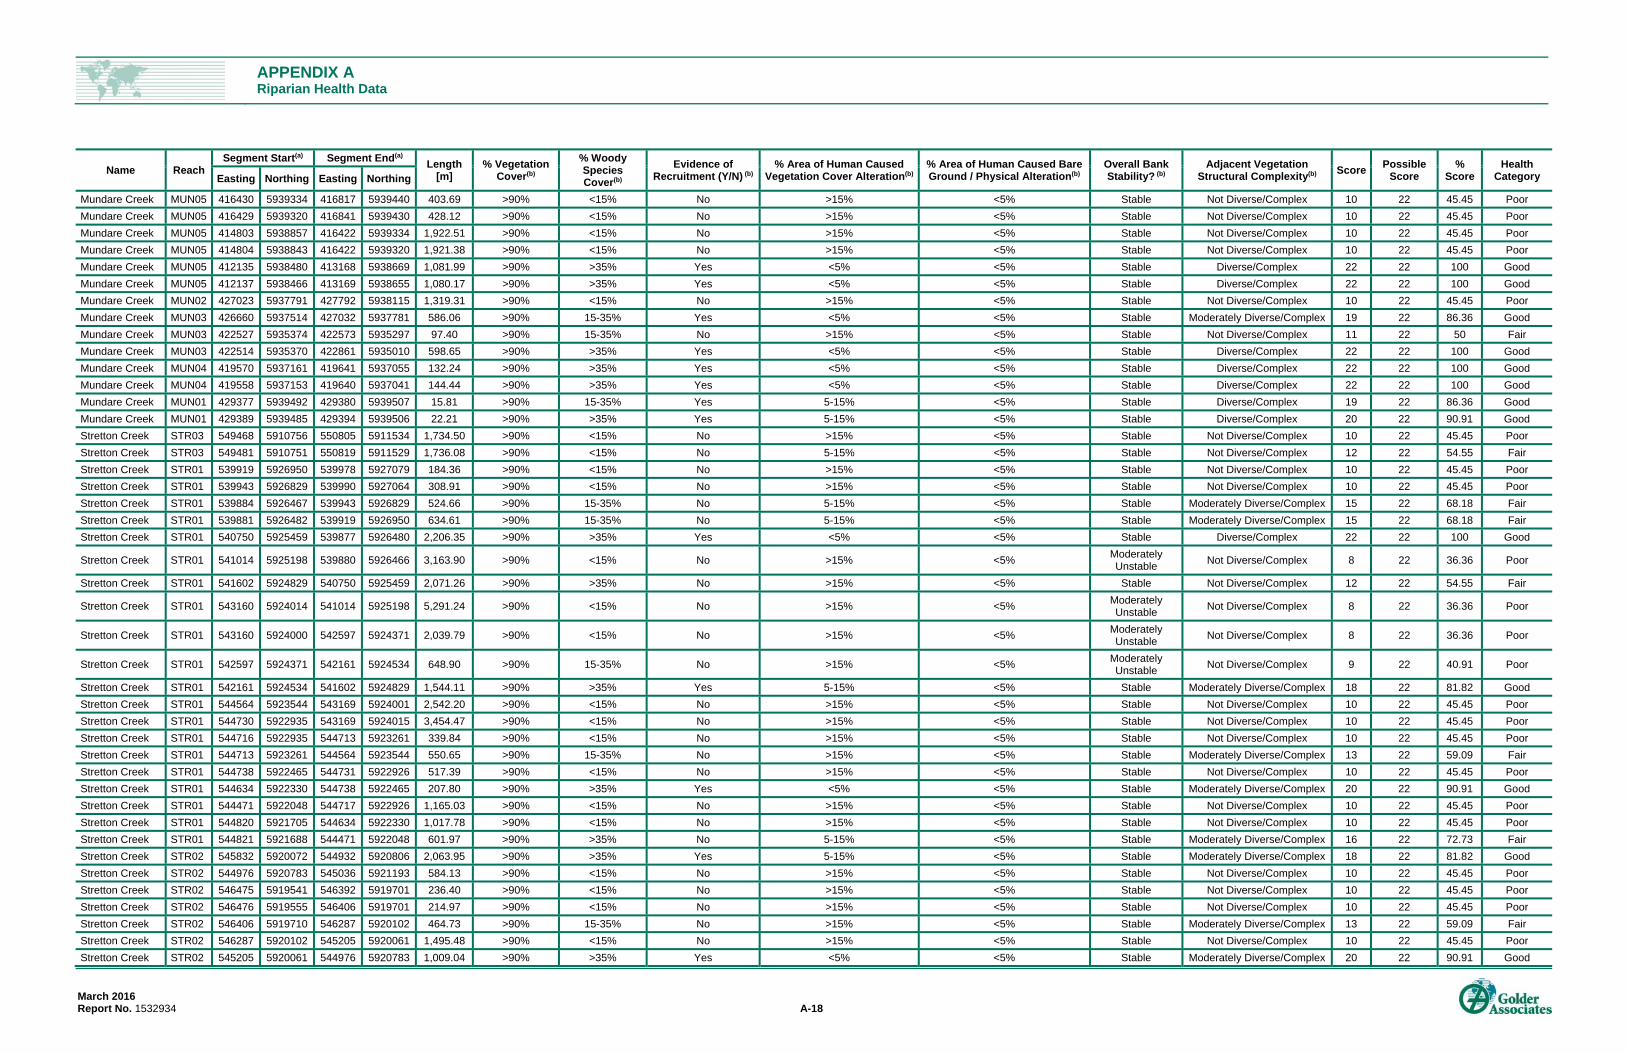
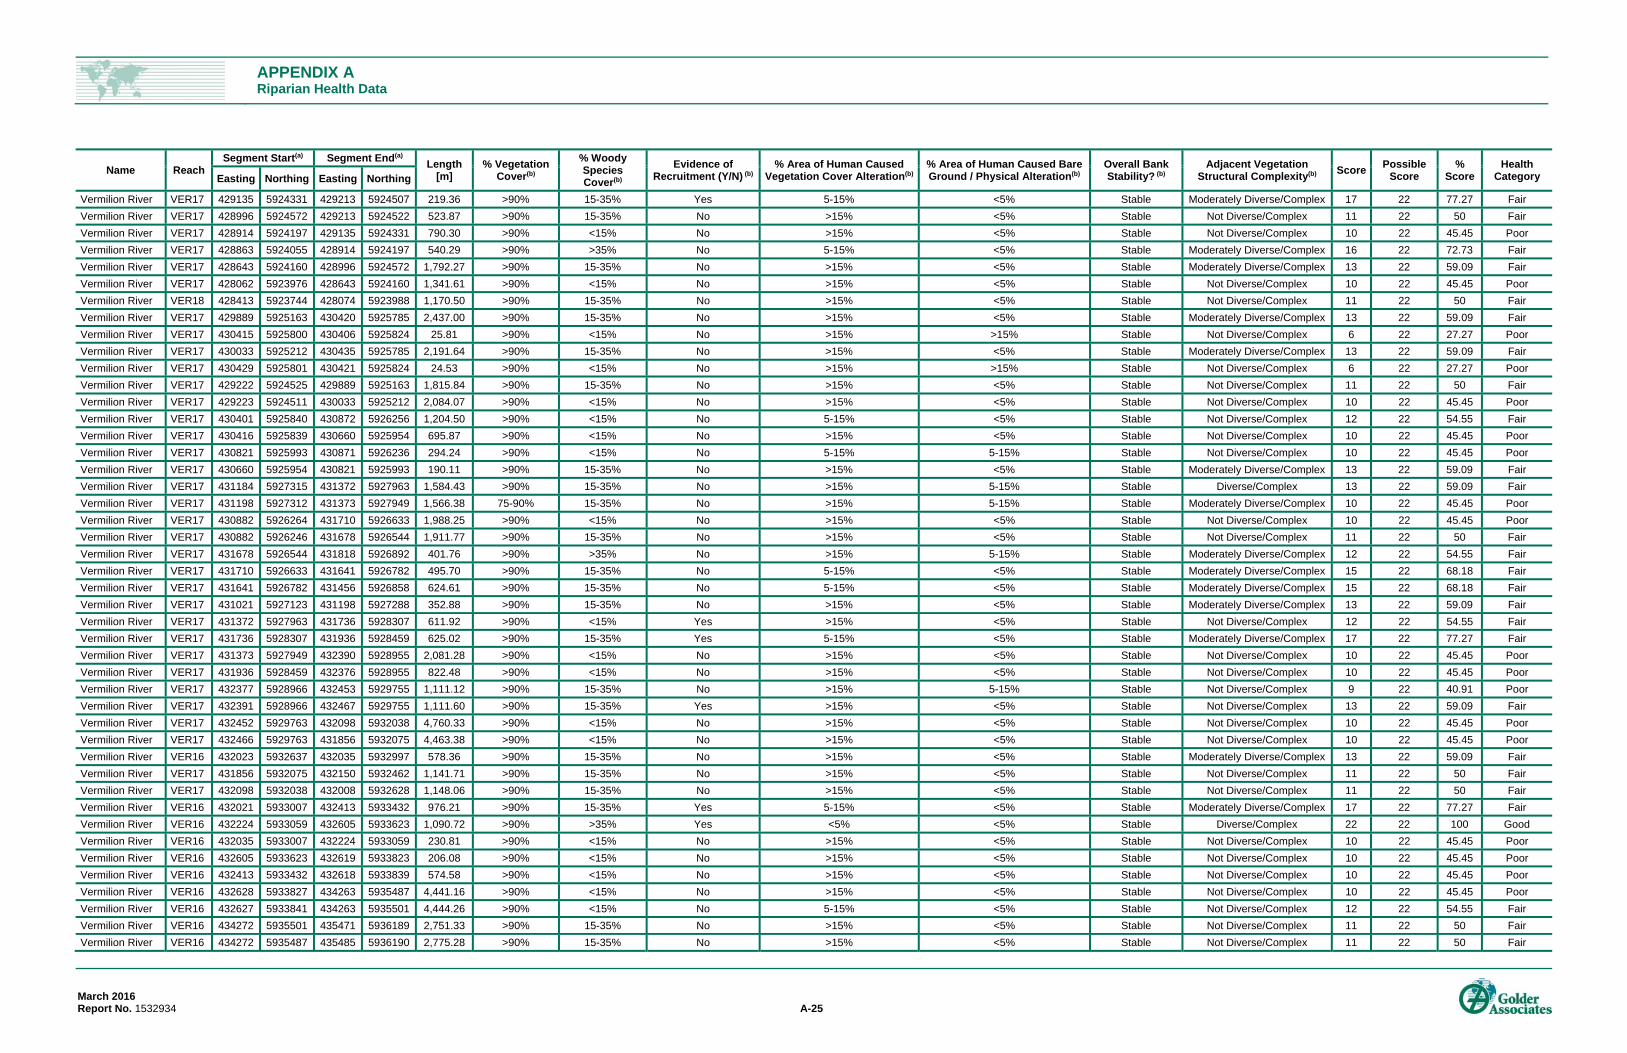
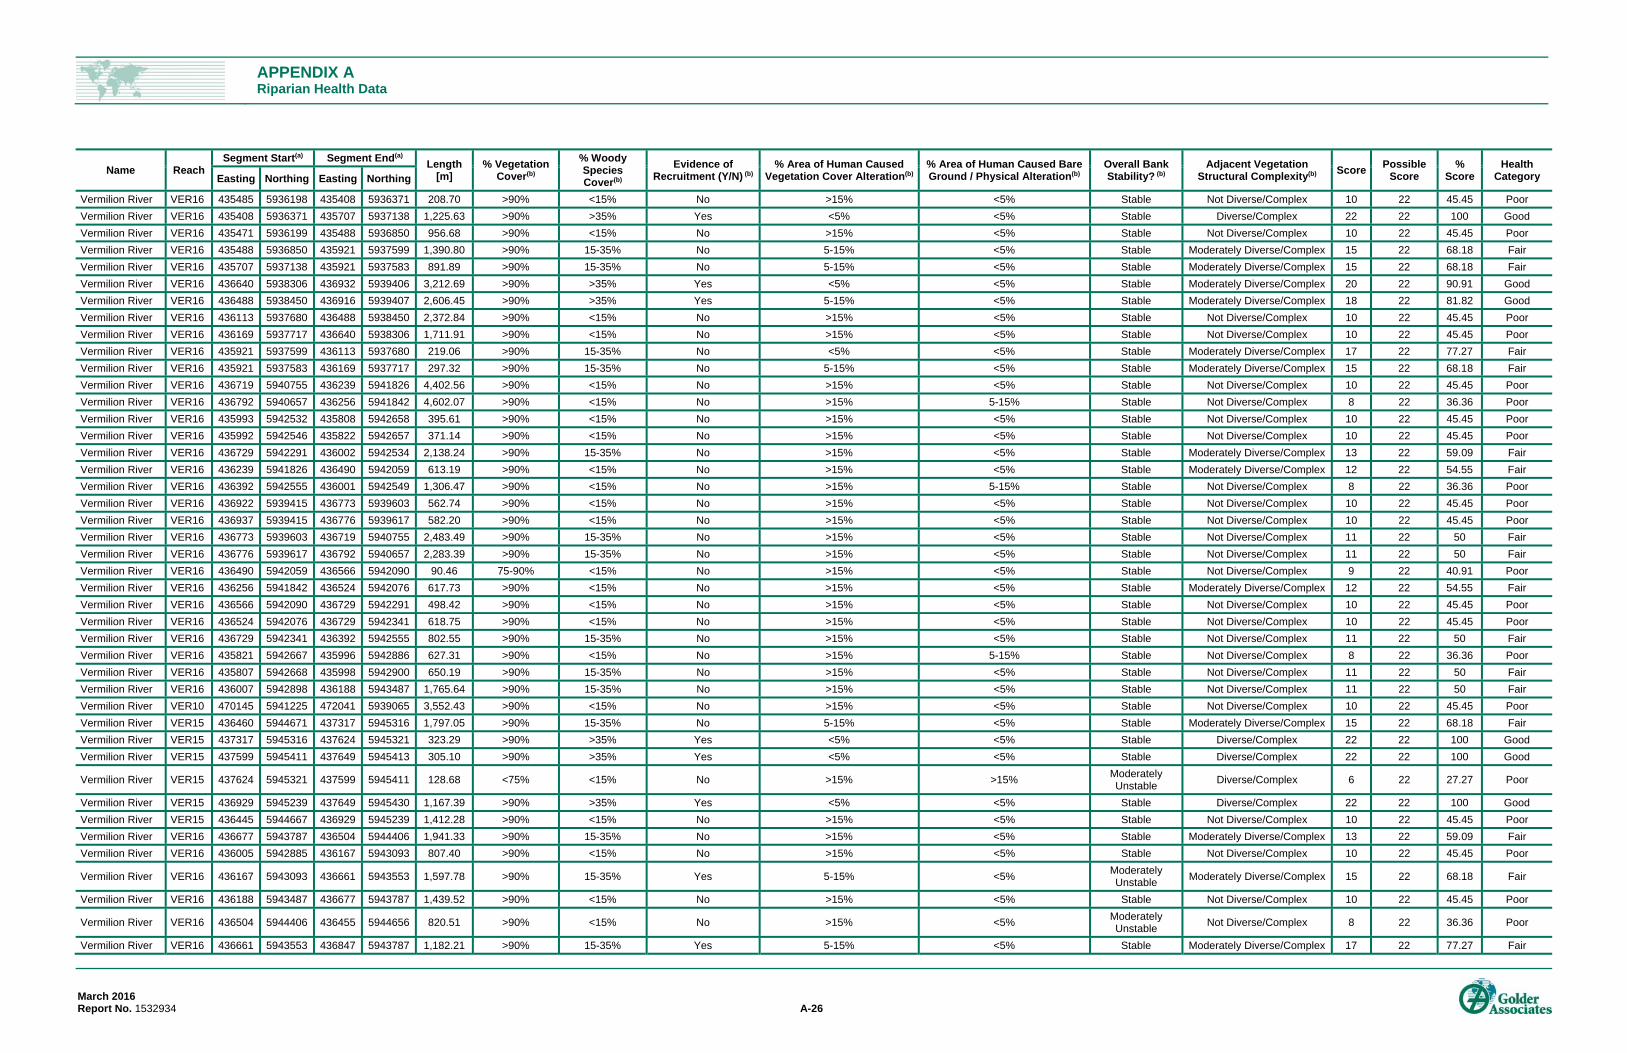
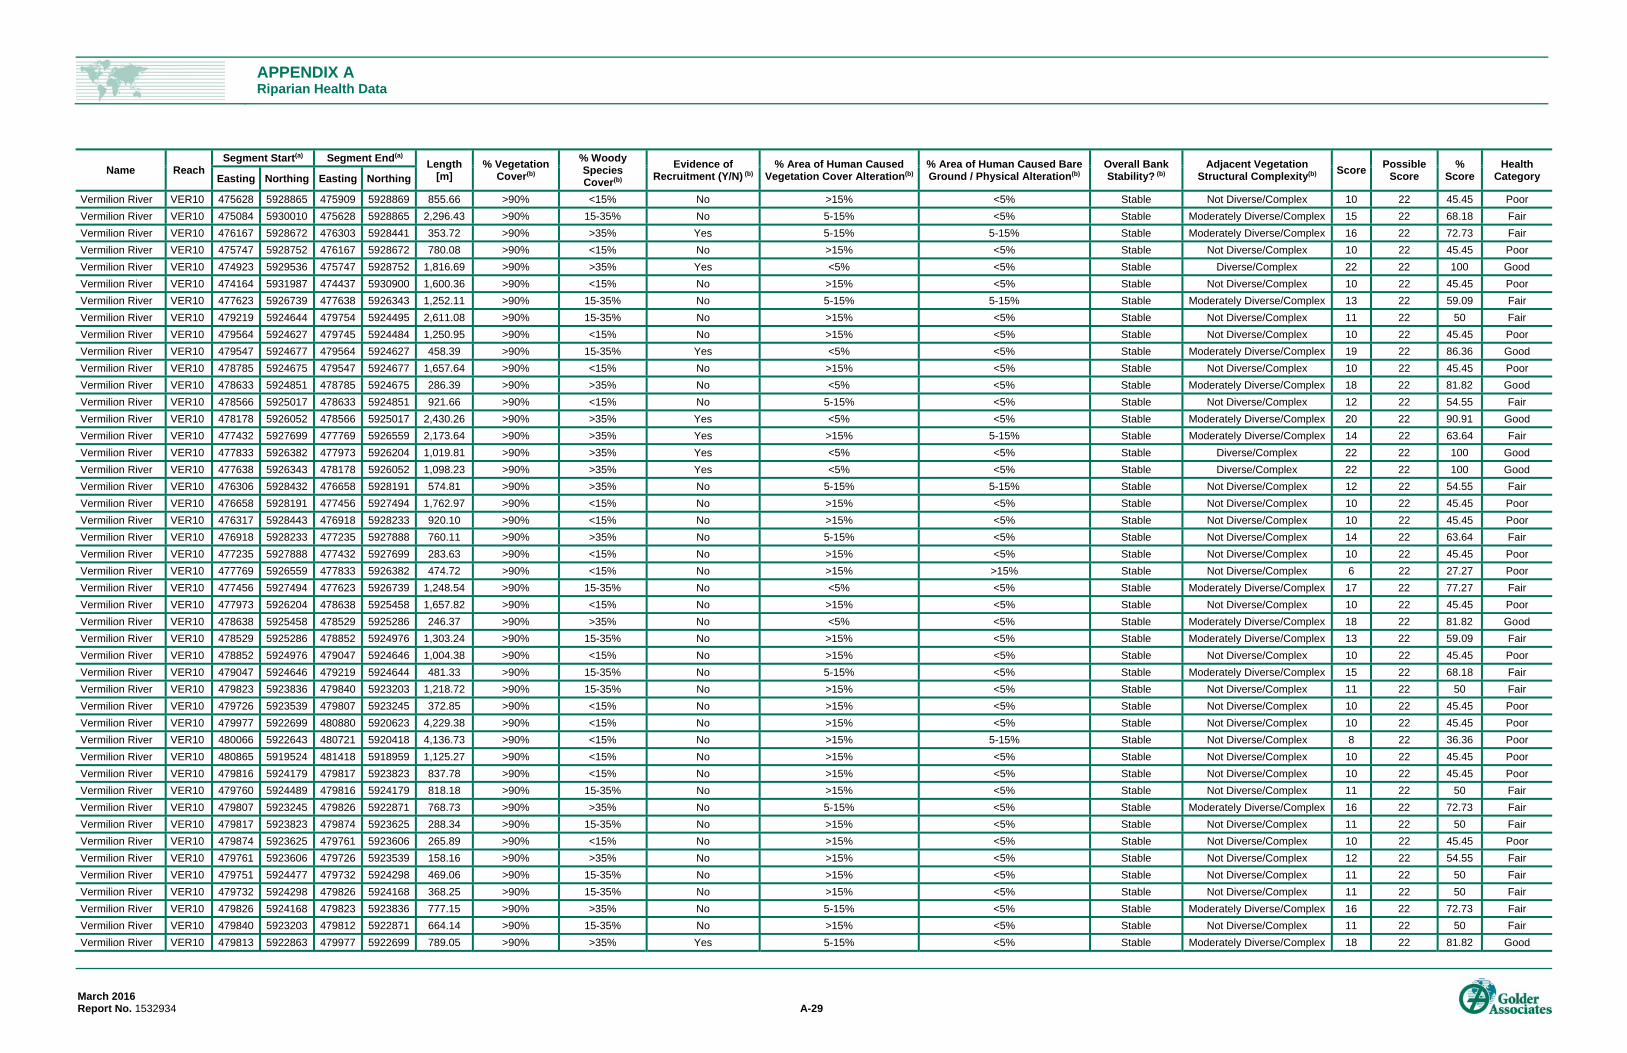
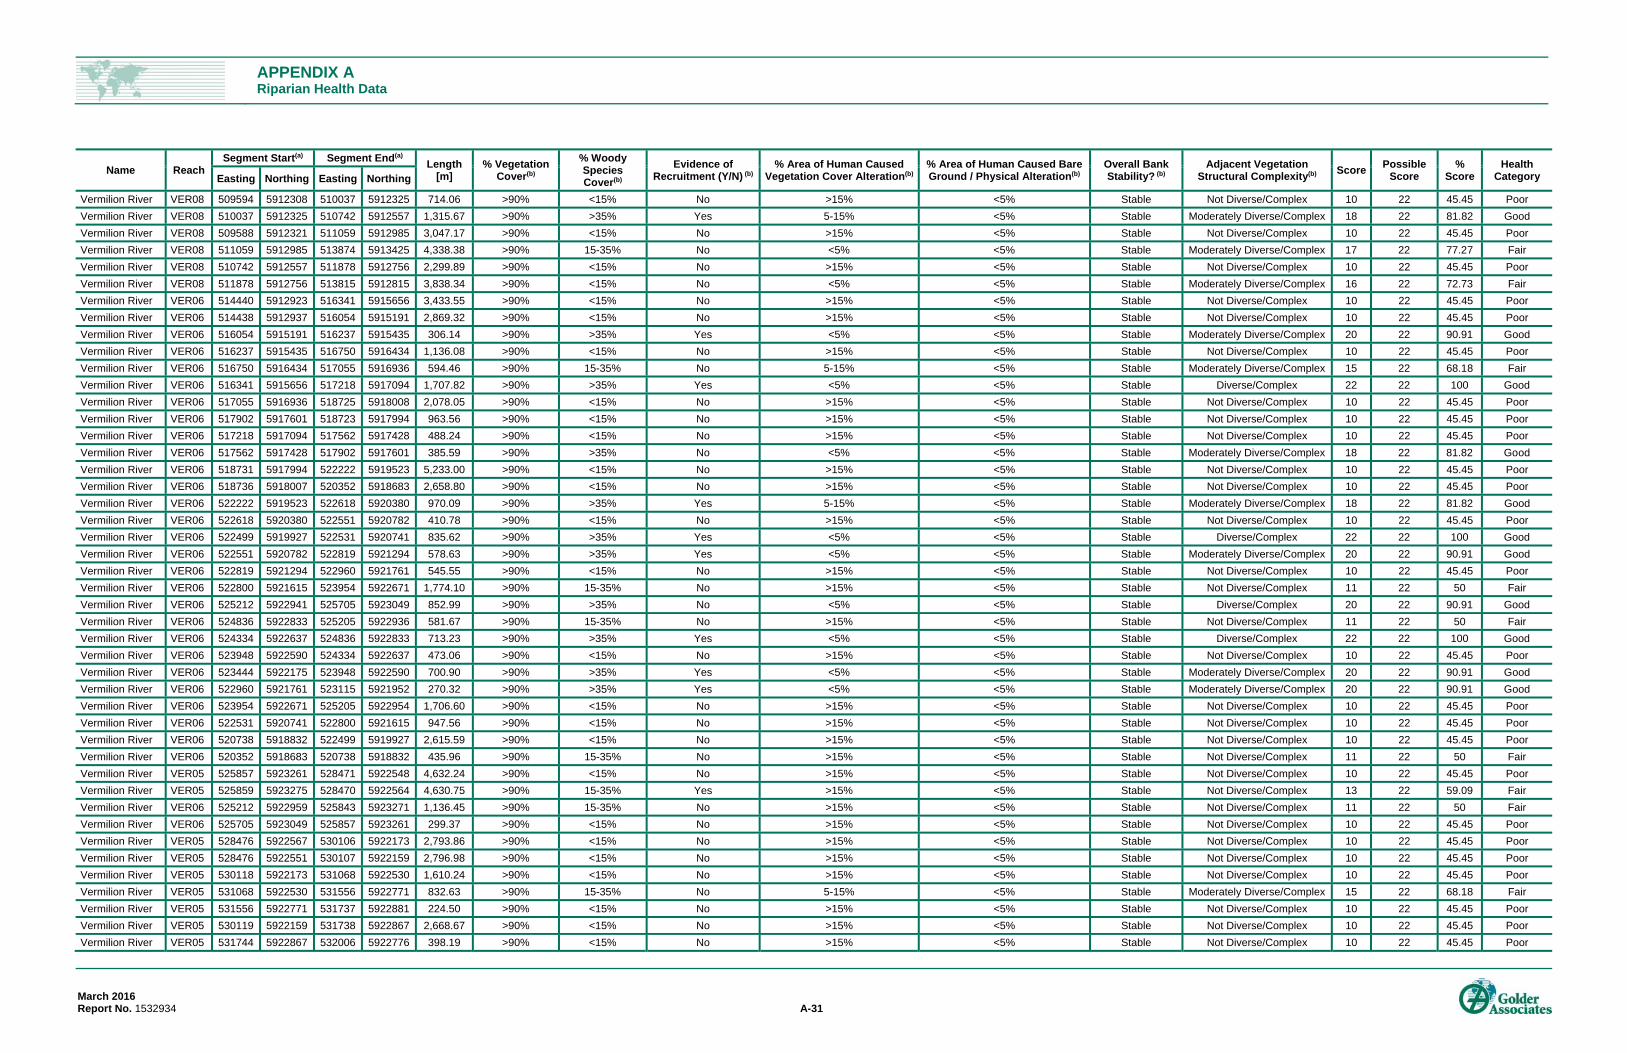
APPENDIX A
Riparian Health Information by River Reach
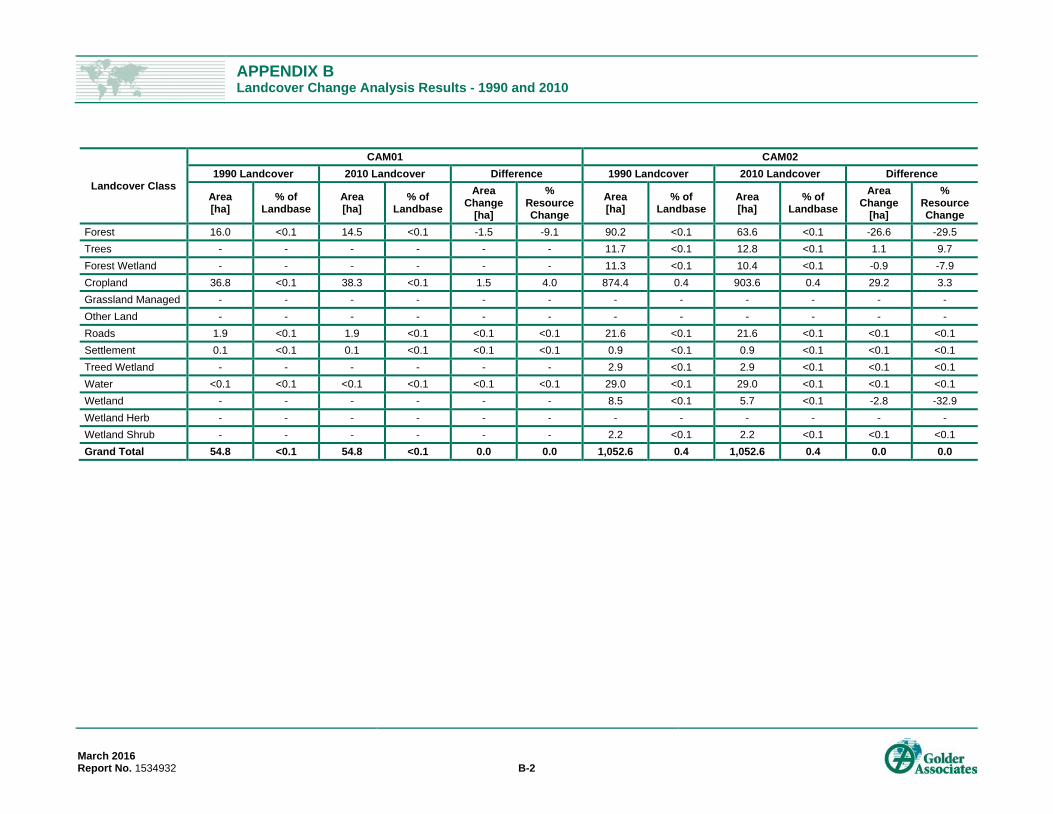
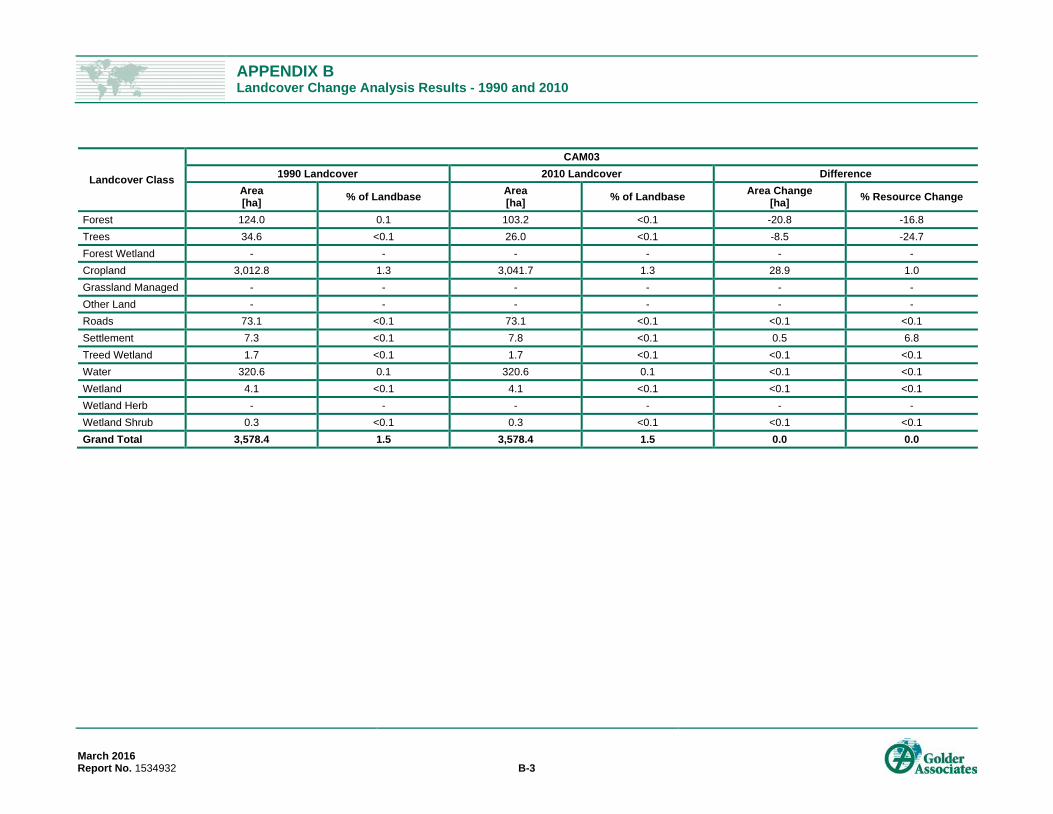
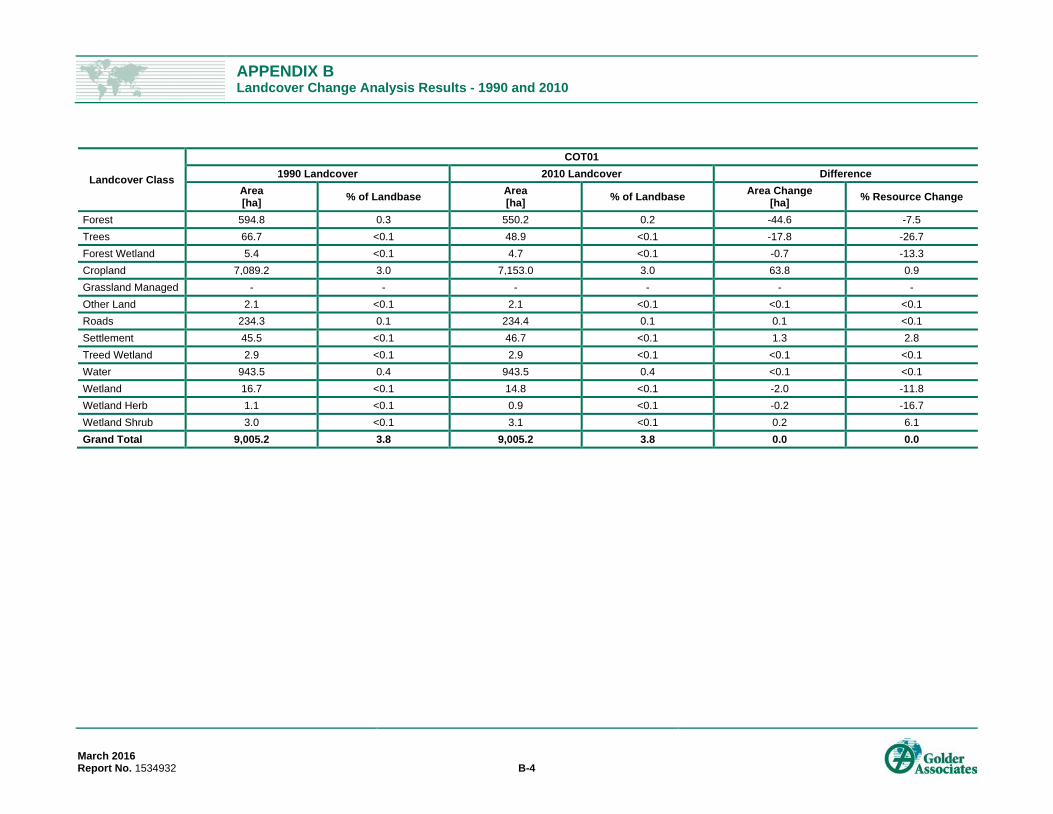
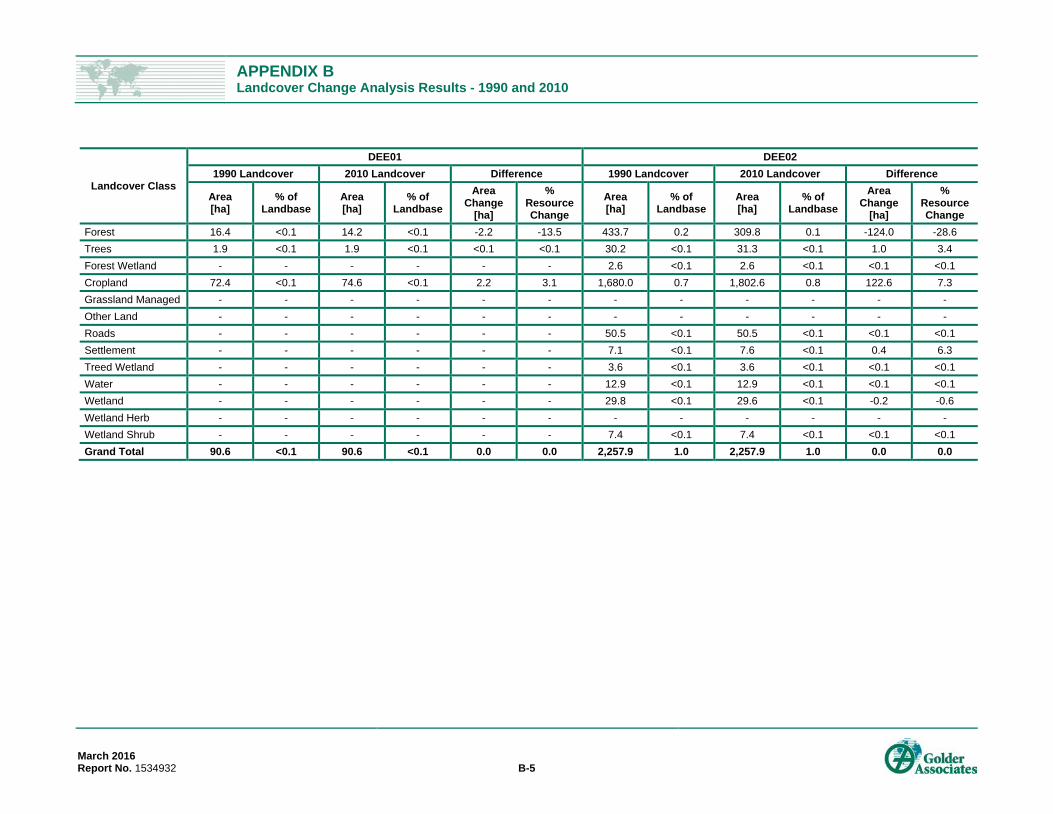
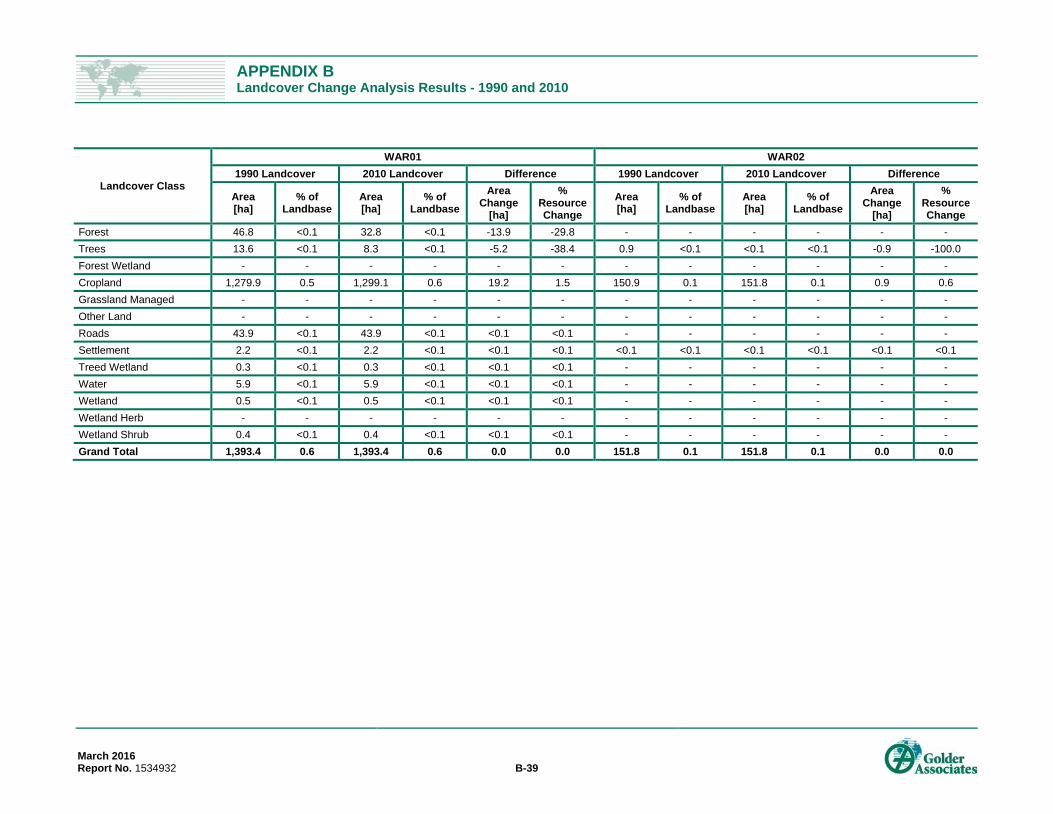
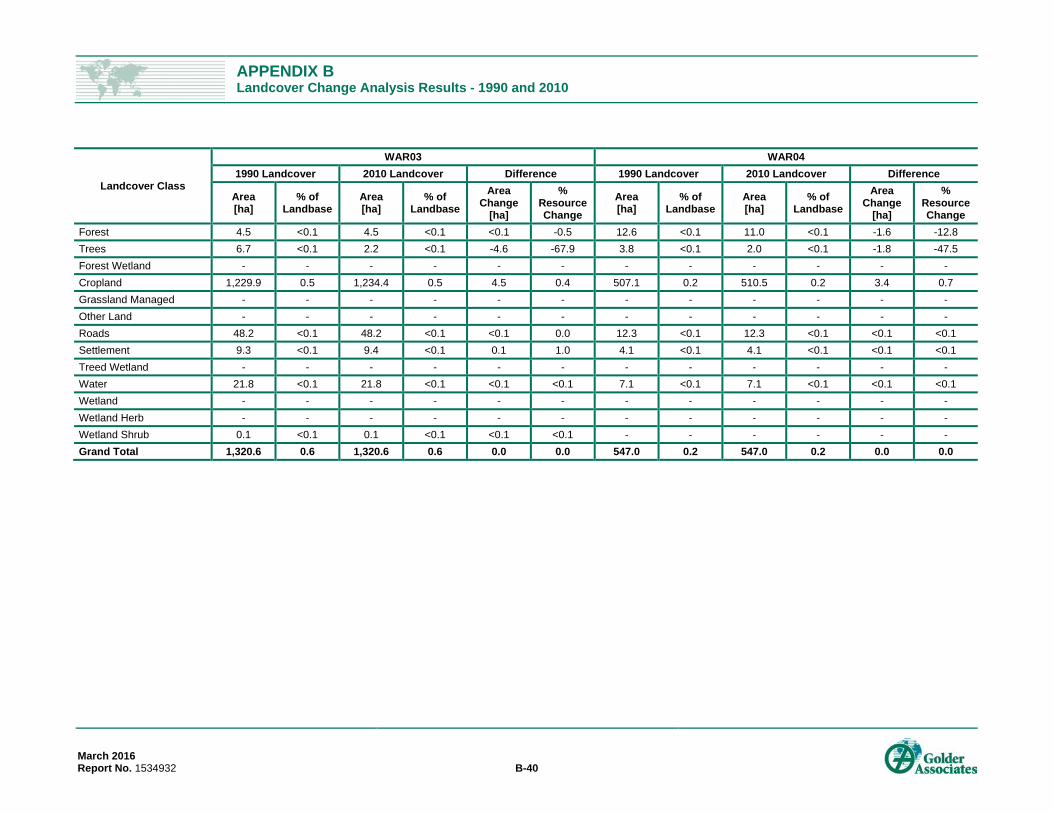
APPENDIX BLandcover Change Results between 1990 and 2010 by River Reach
Attachment 1Riparian Health Maps Scale 1:20000
Attachment 2Riparian Health Maps Scale 1:5000
Attachment 3Landcover Change Maps
Page 5
VERMILION RIVER AB, RIPARIAN INVENTORY AND ASSESSMENT
March 2016 Report No. 1534932 1
1.0 INTRODUCTION
Golder Associates Ltd. (Golder) was contracted by the North Saskatchewan Watershed Alliance (NSWA) to
complete an Aerial Assessment of Riparian Areas of the Vermilion River, AB and its Major Tributaries. The focus
of the assessment is five-fold, including:
1) Delineation of lotic riparian areas and floodplains of the Vermilion River and riparian areas of its major
tributaries.
2) Assess the condition of all riparian areas in the watershed using a rapid method or methods.
3) Identify intact areas for conservation and/or protection.
4) Identify degraded areas for restoration.
5) Prioritize degraded areas for restoration.
1.1 Background Information
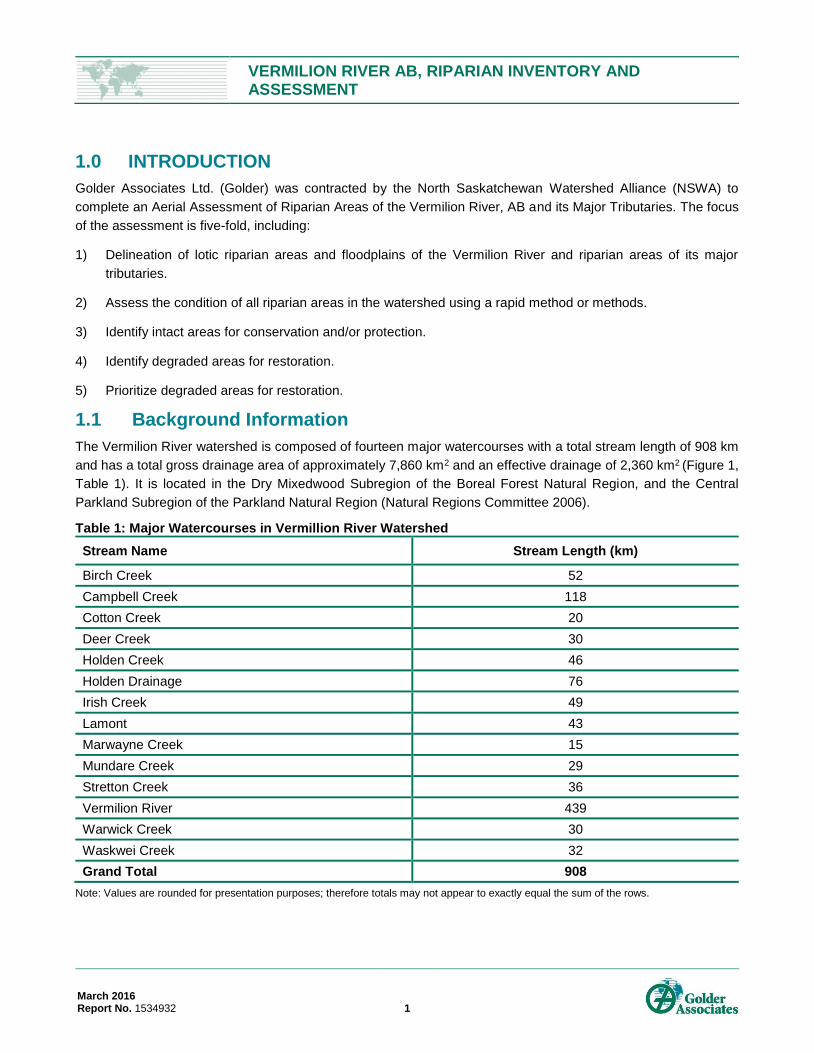
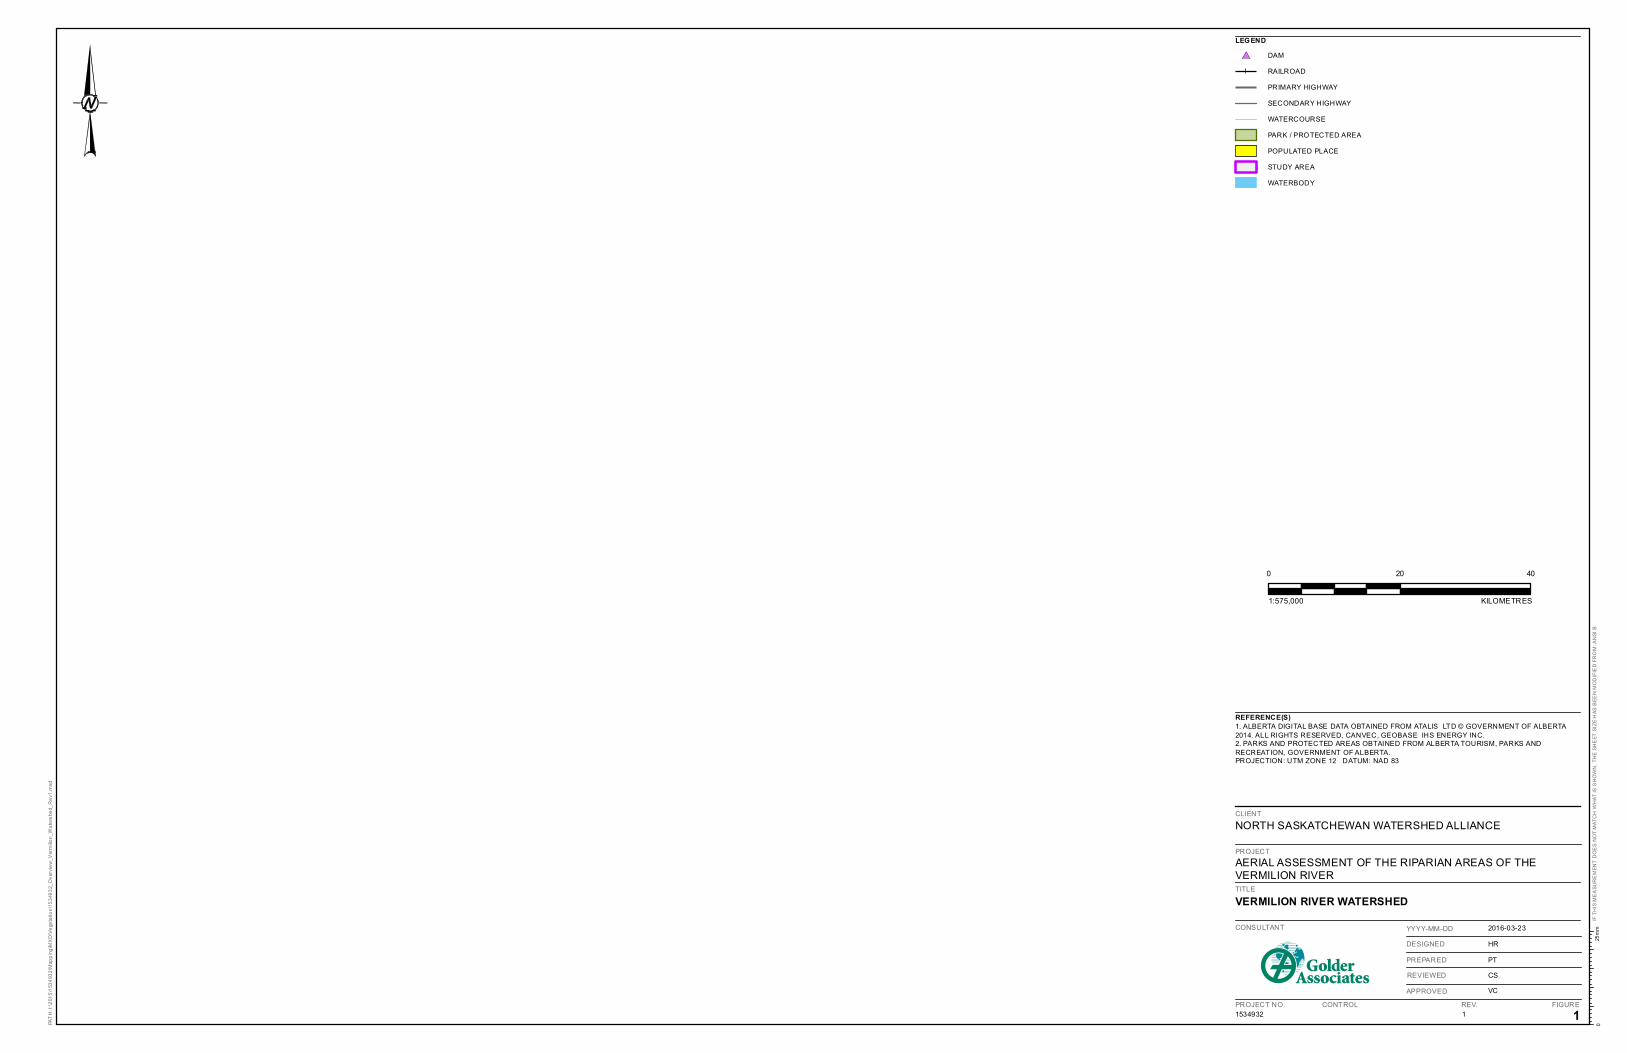
The Vermilion River watershed is composed of fourteen major watercourses with a total stream length of 908 km
and has a total gross drainage area of approximately 7,860 km2 and an effective drainage of 2,360 km2 (Figure 1,
Table 1). It is located in the Dry Mixedwood Subregion of the Boreal Forest Natural Region, and the Central
Parkland Subregion of the Parkland Natural Region (Natural Regions Committee 2006).
Table 1: Major Watercourses in Vermillion River Watershed
Stream Name Stream Length (km)
Birch Creek 52
Campbell Creek 118
Cotton Creek 20
Deer Creek 30
Holden Creek 46
Holden Drainage 76
Irish Creek 49
Lamont 43
Marwayne Creek 15
Mundare Creek 29
Stretton Creek 36
Vermilion River 439
Warwick Creek 30
Waskwei Creek 32
Grand Total 908
Note: Values are rounded for presentation purposes; therefore totals may not appear to exactly equal the sum of the rows.
Page 6
#*
#*
BATTLE RIVER
ÃÄ
13
ÃÄ
29ÃÄ
41
ÃÄ
16
ÃÄ
29
ÃÄ
45
ÃÄ
14
ÃÄ
15
ÃÄ
41
ÃÄ
36
ÃÄ
16
ÃÄ
36
ÃÄ
26
ÃÄ
41
ÃÄ
29
ÃÄ
14
ÃÄ
45
UV645
UV870
UV854
UV893UV626
UV897
UV893
UV855
UV619
UV881
UV857
UV897
UV834UV881
UV631
UV645
UV854
UV870
UV855
UV859
UV870
UV894
UV609
UV641UV640
UV870
UV834
UV652
LOWERTHERIEN
LAKE
WHITNEYLAKE
BAXTERLAKE
NORTH SASKATCHEWAN RIVER
DUSTYLAKE THOMAS
LAKE
VERNONLAKE
CAMPBELLLAKEGENEVA
LAKE
WAVYLAKE
WATTLAKE
RAFTLAKE
WEEKSLAKE
TWINLAKE
KEHIWINLAKE
PASATCHAWLAKES
WHITFORDLAKE
BIRCHLAKE
ELIZALAKE
SADDLELAKE
PLAINLAKE
AKASULAKE
FROGLAKE
BEAVERHILLLAKE
VERMILION LAKESBENS
LAKE
STRETTON CREEK
BUFFALO CREEK
BIRCH CREEK
VERMILION RIVER
EGG CREEK
WASK
WEI C
REEK
IRISH CREEK
GRIZZLY BEAR CREEK
VERMILION RIVER
IRON
CRE
EK
DRIEDMEAT CREEK
DEER CREEKCAMPBELL CREEK
COTTON CREEK
HOLDEN DRAINAGE
LAMONT CREEK
MUNDARE CREEK
WARWICK
CREE
K
HOLDEN CREEK
MARWAYNE CREEK
LLOYDMINSTER
DAYSLAND
ELKPOINT
KILLAM
MUNDARE
SEDGEWICK
TOFIELD
TWOHILLS
VEGREVILLE
VERMILION
VIKING
ANDREW
BAWLF
CHIPMAN
DEWBERRY
HOLDEN
INNISFREE
IRMA
KITSCOTY
LOUGHEED
MANNVILLE
MARWAYNE
MYRNAM
ROSALIND
RYLEY
STROME
WILLINGDON
WAINWRIGHT
ST. PAUL
UV881Victoria
Settlement NA
BeaverhillLake HeritageRangeland NA
Beaverhill NAVermilionProvincialPark
Whitney LakesProvincial Park
Vermilion Dam
Morecambe Structure
PATH
: I:\20
15\15
3493
2\Map
ping\M
XD\Ve
getat
ion\15
3493
2_Ov
erview
_Verm
ilion_
Wate
rshed
_Rev
1.mxd
KEY MAP
IF TH
IS M
EASU
REME
NT D
OES
NOT M
ATCH
WHA
T IS
SHOW
N, T
HE S
HEET
SIZ
E HAS
BEE
N MO
DIFIE
D FR
OM: A
NSI B
25mm
0
0 20 40
1:575,000 KILOMETRES
CLIENTNORTH SASKATCHEWAN WATERSHED ALLIANCE
REFERENCE(S)1. ALBERTA DIGITAL BASE DATA OBTAINED FROM ATALIS LTD © GOVERNMENT OF ALBERTA2014. ALL RIGHTS RESERVED, CANVEC, GEOBASE IHS ENERGY INC.2. PARKS AND PROTECTED AREAS OBTAINED FROM ALBERTA TOURISM, PARKS ANDRECREATION, GOVERNMENT OF ALBERTA.PROJECTION: UTM ZONE 12 DATUM: NAD 83
PROJECTAERIAL ASSESSMENT OF THE RIPARIAN AREAS OF THEVERMILION RIVERTITLEVERMILION RIVER WATERSHED
1534932 1 1
2016-03-23HRPTCSVC
CONSULTANT
PROJECT NO. CONTROL REV. FIGURE
YYYY-MM-DDDESIGNEDPREPAREDREVIEWEDAPPROVED
LEGEND#* DAM
RAILROADPRIMARY HIGHWAYSECONDARY HIGHWAYWATERCOURSEPARK / PROTECTED AREAPOPULATED PLACESTUDY AREAWATERBODY
!(
!(
!(
!(
Edmonton
FortMcMurray
Calgary
GrandePrairie
Page 7
VERMILION RIVER AB, RIPARIAN INVENTORY AND ASSESSMENT
March 2016 Report No. 1534932 3
In the Dry Mixedwood Subregion, the mean annual temperature is 1.1°C, with mean summer and winter
temperatures of 15.9°C and -16.8°C respectively, with a mean annual precipitation value of 461 mm. The Central
Parkland Subregion is climatically and ecologically a transition zone between boreal forest and grassland
environments. In the Central Parkland Subregion, mean annual, summer and winter temperatures are 2.3°C,
16.5°C and -14.7°C respectively. Mean annual precipitation is 441 mm (Natural Regions Committee 2006).
The Vermilion River watershed has been altered considerably over the last 100 years. There has been extensive
drainage of wetlands to allow the expansion of agriculture, transportation and municipal and industrial development
within the watershed.
The Vermilion River watershed has a long history of drainage programs to improve agricultural production. Some
of the programs have been authorized by licenses, but other drainage projects have proceeded without proper
authorization of the Vermilion River Operations Review Stakeholder Committee (VRORSC 2000). The VRORSC
(2000) report states that the cumulative impact of drainage in the upper watershed may have increased the
frequency and intensity of flooding in the middle reaches of the Vermilion River. Drainage may have also reduced
the natural storage of water, thereby reducing the duration of water flow. The VRORSC (2000) report suggests
that in late summer and fall, water levels in the lower reaches of the river have been reduced, and occasionally
stop altogether.
Golder (2009) provided a formal evaluation of the hydrologic impacts of the drainage of areas in the Vermilion
River Basin. The Holden Drainage District, Morecambe Structure and Vermilion Dam were evaluated and further
details of the effects of drainage ditches and structures within the Vermilion River watershed are discussed in
Golder (2009).
The Holden Drainage District was established in 1918 as a local authority to assist farmers in draining low-lying
lands to increase agricultural production. The cumulative impacts of drainage in the upper reaches of the Vermilion
River Basin may have increased the frequency and intensity of flooding in the middle reaches of the river
(Golder 2009).
In 1974 the Government of Alberta responded to flooding that caused extensive damage by channelizing the
Vermilion Lakes and the Vermilion River at Vegreville and by installing a water management structure at
Morecambe (NSWA 2012). The Morecambe structure was constructed in 1976 as a flood management tool and it
allows pre-release of water from Vermilion Lakes to reduce the impact of major summer rainfall events in the
Vermilion Lakes basin (VRORSC 2000). However, the Morecambe structure has also increased the risk that areas
downstream will have dry channels after dry winters (NSWA 2012). Operation of the Morecambe structure in 1983
and 1990 resulted in the flooding of downstream landowners and damage to hay crops (VRORSC 2000). In 1991
there were issues when pre-release to reduce water levels upstream was thought to increase flooding downstream
(Golder 2009). The structure was not operated from 1991 to 2004 but it was in operation in spring and summer of
2005 and 2006 (Golder 2009).
The Vermilion Dam was constructed in 1980-81 to replace an existing dam that provided a recreation reservoir
and a crossing of the river for Highway 41. The dam provides no flood control potential and the only controlled
water releases are through a small sluice gate that provides riparian flows (Golder 2009).
Page 8
VERMILION RIVER AB, RIPARIAN INVENTORY AND ASSESSMENT
March 2016 Report No. 1534932 4
2.0 METHODS
2.1 Data Acquisition and Compilation
2.1.1 Digital Base Data
Golder staff collected and reviewed resource-related background data for the project, including data on hydrology,
river morphology, effective drainage areas, surficial geology and bedrock geology. Where possible, provincial data
distributed by AltaLIS Ltd. was used as base data. Effective drainage areas were obtained from Agriculture and
Agri-Food Canada and geology data was obtained from the Alberta Geological Survey.
2.1.2 Aerial Imagery, LiDAR and Video
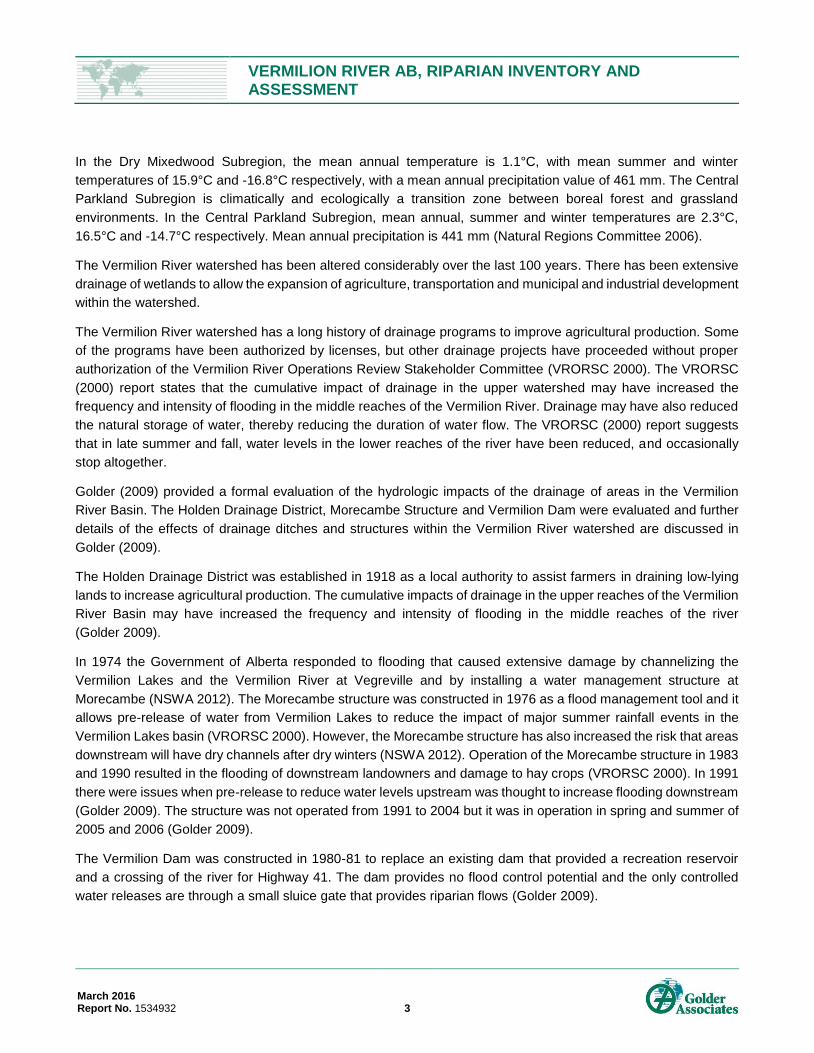
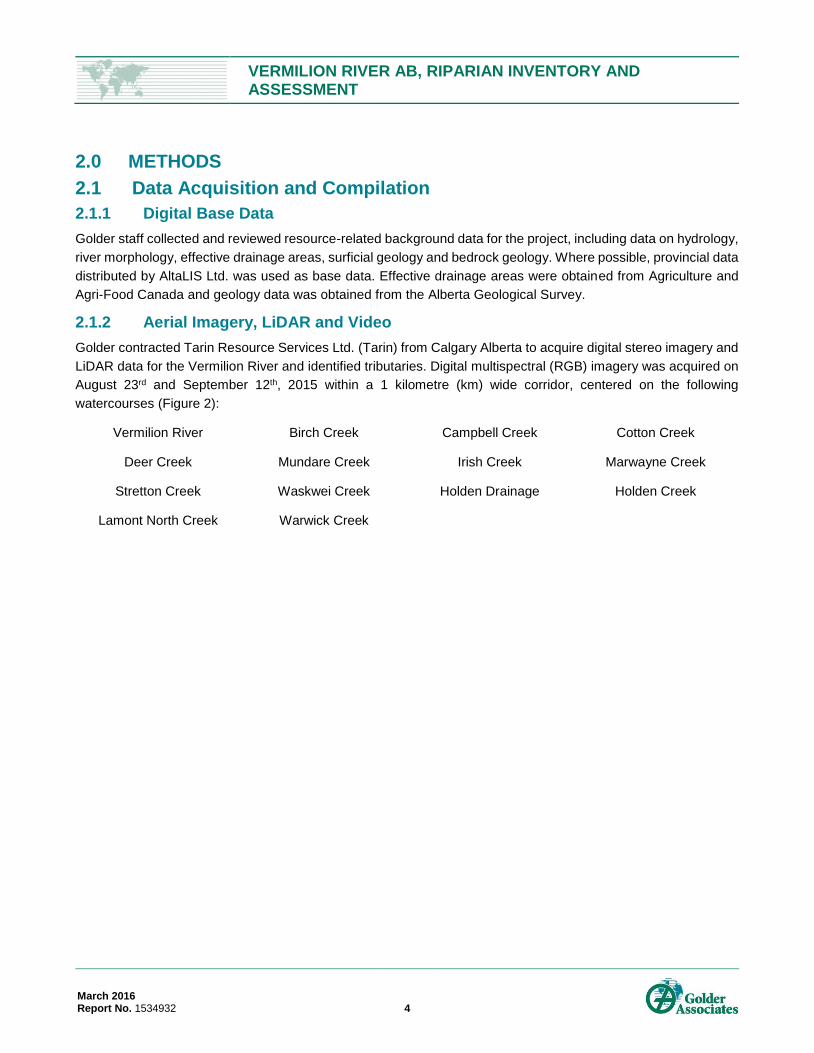
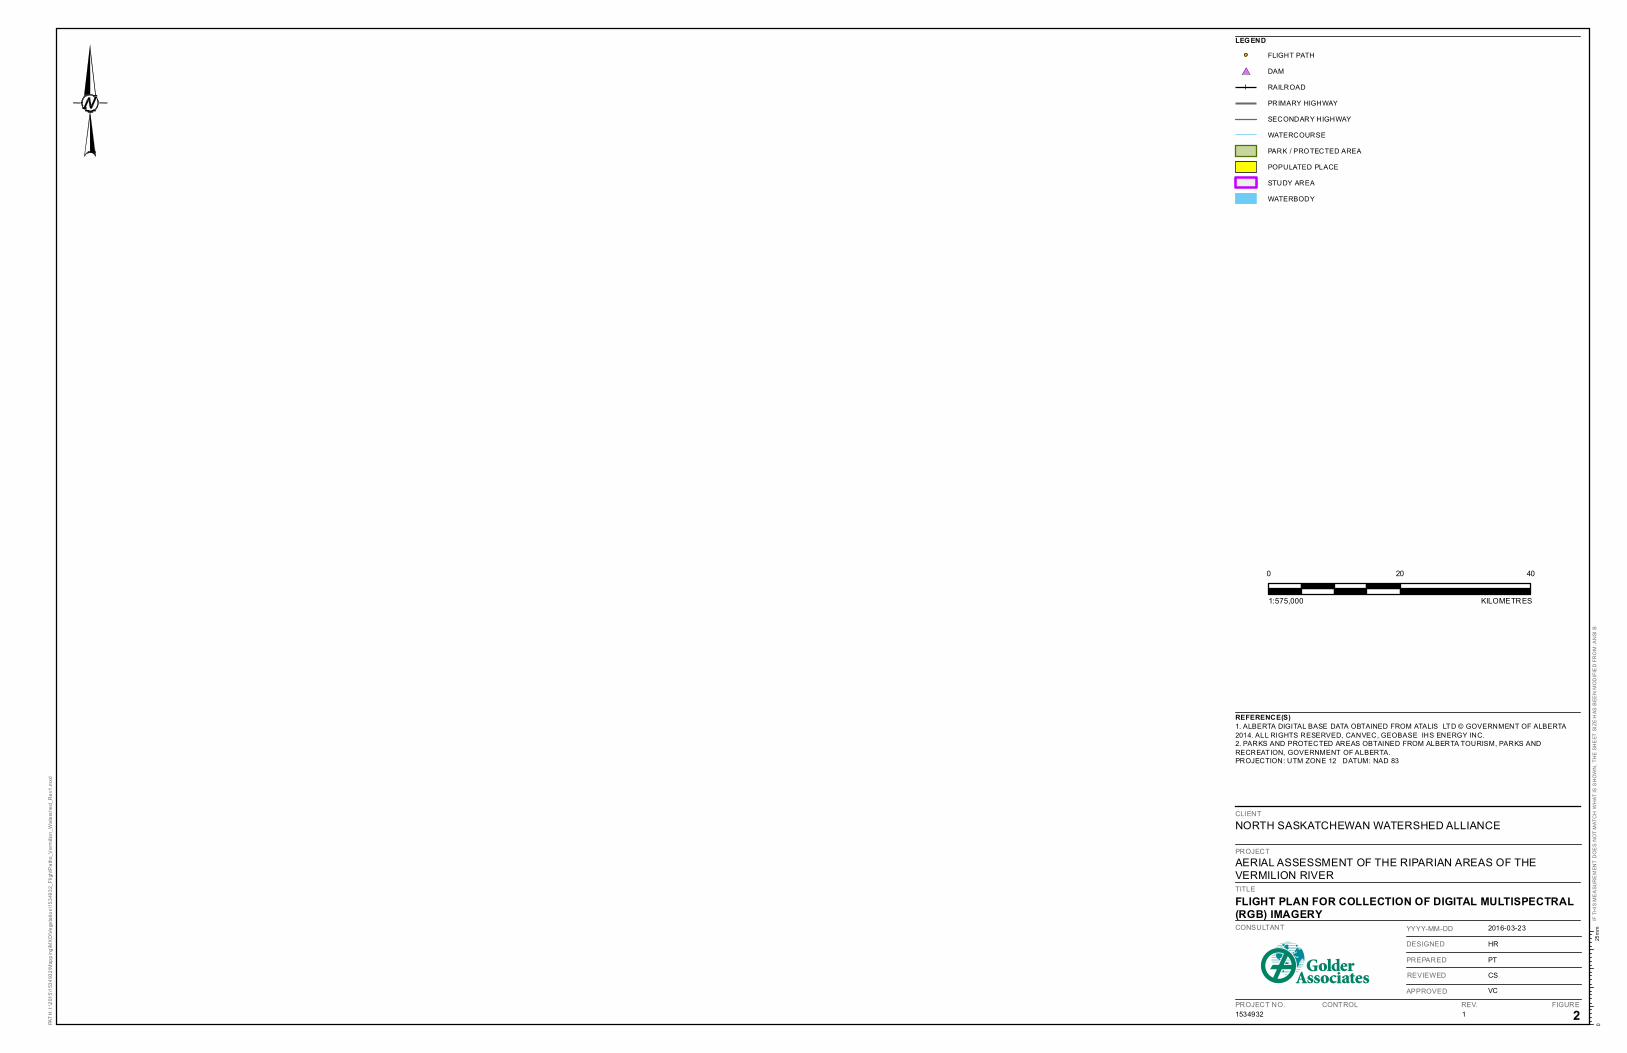
Golder contracted Tarin Resource Services Ltd. (Tarin) from Calgary Alberta to acquire digital stereo imagery and
LiDAR data for the Vermilion River and identified tributaries. Digital multispectral (RGB) imagery was acquired on
August 23rd and September 12th, 2015 within a 1 kilometre (km) wide corridor, centered on the following
watercourses (Figure 2):
Vermilion River Birch Creek Campbell Creek Cotton Creek
Deer Creek Mundare Creek Irish Creek Marwayne Creek
Stretton Creek
Lamont North Creek
Waskwei Creek
Warwick Creek
Holden Drainage Holden Creek
Page 9
#*
#*
BATTLE RIVER
ÃÄ
13
ÃÄ
29ÃÄ
41
ÃÄ
16
ÃÄ
29
ÃÄ
45
ÃÄ
14
ÃÄ
15
ÃÄ
41
ÃÄ
36
ÃÄ
16
ÃÄ
36
ÃÄ
26
ÃÄ
41
ÃÄ
29
ÃÄ
14
ÃÄ
45
UV645
UV870
UV854
UV893UV626
UV897
UV893
UV855
UV619
UV881
UV857
UV897
UV834UV881
UV631
UV645
UV854
UV870
UV855
UV859
UV870
UV894
UV609
UV641UV640
UV870
UV834
UV652
LOWERTHERIEN
LAKE
WHITNEYLAKE
BAXTERLAKE
NORTH SASKATCHEWAN RIVER
DUSTYLAKE THOMAS
LAKE
VERNONLAKE
CAMPBELLLAKEGENEVA
LAKE
WAVYLAKE
WATTLAKE
RAFTLAKE
WEEKSLAKE
TWINLAKE
KEHIWINLAKE
PASATCHAWLAKES
WHITFORDLAKE
BIRCHLAKE
ELIZALAKE
SADDLELAKE
PLAINLAKE
AKASULAKE
FROGLAKE
BEAVERHILLLAKE
VERMILION LAKESBENS
LAKE
STRETTON CREEK
BUFFALO CREEK
BIRCH CREEK
VERMILION RIVER
EGG CREEK
WASK
WEI C
REEK
IRISH CREEK
GRIZZLY BEAR CREEK
VERMILION RIVER
IRON
CRE
EK
DRIEDMEAT CREEK
DEER CREEKCAMPBELL CREEK
COTTON CREEK
HOLDEN DRAINAGE
LAMONT CREEK
MUNDARE CREEK
WARWICK
CREE
K
HOLDEN CREEK
MARWAYNE CREEK
LLOYDMINSTER
DAYSLAND
ELKPOINT
KILLAM
MUNDARE
SEDGEWICK
TOFIELD
TWOHILLS
VEGREVILLE
VERMILION
VIKING
ANDREW
BAWLF
CHIPMAN
DEWBERRY
HOLDEN
INNISFREE
IRMA
KITSCOTY
LOUGHEED
MANNVILLE
MARWAYNE
MYRNAM
ROSALIND
RYLEY
STROME
WILLINGDON
WAINWRIGHT
ST. PAUL
UV881Victoria
Settlement NA
BeaverhillLake HeritageRangeland NA
Beaverhill NAVermilionProvincialPark
Whitney LakesProvincial Park
Vermilion Dam
Morecambe Structure
PATH
: I:\20
15\15
3493
2\Map
ping\M
XD\Ve
getat
ion\15
3493
2_Fli
ghtP
aths_
Verm
ilion_
Wate
rshed
_Rev
1.mxd
KEY MAP
IF TH
IS M
EASU
REME
NT D
OES
NOT M
ATCH
WHA
T IS
SHOW
N, T
HE S
HEET
SIZ
E HAS
BEE
N MO
DIFIE
D FR
OM: A
NSI B
25mm
0
0 20 40
1:575,000 KILOMETRES
CLIENTNORTH SASKATCHEWAN WATERSHED ALLIANCE
REFERENCE(S)1. ALBERTA DIGITAL BASE DATA OBTAINED FROM ATALIS LTD © GOVERNMENT OF ALBERTA2014. ALL RIGHTS RESERVED, CANVEC, GEOBASE IHS ENERGY INC.2. PARKS AND PROTECTED AREAS OBTAINED FROM ALBERTA TOURISM, PARKS ANDRECREATION, GOVERNMENT OF ALBERTA.PROJECTION: UTM ZONE 12 DATUM: NAD 83
PROJECTAERIAL ASSESSMENT OF THE RIPARIAN AREAS OF THEVERMILION RIVERTITLEFLIGHT PLAN FOR COLLECTION OF DIGITAL MULTISPECTRAL(RGB) IMAGERY
1534932 1 2
2016-03-23HRPTCSVC
CONSULTANT
PROJECT NO. CONTROL REV. FIGURE
YYYY-MM-DDDESIGNEDPREPAREDREVIEWEDAPPROVED
LEGENDFLIGHT PATH
#* DAMRAILROADPRIMARY HIGHWAYSECONDARY HIGHWAYWATERCOURSEPARK / PROTECTED AREAPOPULATED PLACESTUDY AREAWATERBODY
!(
!(
!(
!(
Edmonton
FortMcMurray
Calgary
GrandePrairie
Page 10
VERMILION RIVER AB, RIPARIAN INVENTORY AND ASSESSMENT
March 2016 Report No. 1534932 6
The digital stereo imagery was rectified for use in Golder’s softcopy mapping system (PurVIEW and ArcGIS).
The imagery was acquired at a 30 centimetre (cm) resolution, allowing for mapping at scales of 1:5,000 and greater
(e.g., 1:1,000, 1:500). This allows the mapper to define small but significant features of the landscape. The LiDAR
data was obtained by Tarin from AltaLIS Ltd. at a 15 metre (m) resolution.
The orthoimagery delivered in tiles (tif format) by Tarin were merged into a single dataset and converted to a highly
compressed format (ecw) that allows for efficient analysis in a GIS environment.
2.2 Riparian Mapping
2.2.1 Terrain
Riparian areas were delineated at scales ranging from 1:2,500 to 1:500. Initially the reach or floodplain was
delineated at a scale of 1:2,500 and then the mapper zoomed in to scales as large as 1:500 to better delineate
floodplain boundaries and significant features on the floodplain.
For the Vermilion River, the full extent of the floodplain was mapped. In some areas, the floodplain was only 140 m
wide (e.g., headwaters of Vermilion River) and in others up to almost 3 km wide (e.g., near Bens Lake). Within the
floodplain, the river and any waterbodies were delineated separately where possible. For example, upstream of
Bens Lake the Vermilion River is too narrow to delineate separately, but downstream of the Vermilion Lakes, the
river ranges from 15 to 35 m in width and can be delineated as a separate feature. The Vermilion Lakes were
delineated separately, as were other water bodies such as Bens Lake, Vermilion Park Lake and the southern part
of Watt Lake.
Due to issues related to scale, the creeks within the tributaries were not mapped as separate polygons and
therefore the mapped floodplain contains the actual creek and any fluvial terraces adjacent to the creeks. Areas
of open water or lakes, generally associated with beaver dams, were also delineated if large enough at a scale of
1:5,000. In some headwater areas, there are sections where there is currently no riparian flow and the fluvial
channel is cultivated. These areas were mapped as fluvial but are considered moderately well to imperfectly
drained.
The Vermilion River downstream of Vermilion Lakes meanders across the floodplain and therefore there are
numerous oxbows and oxbow lakes within the Vermilion River valley. These were delineated where possible and
identified by a line feature. Oxbows are also found within some of the tributaries and they were delineated where
they were visible at a scale of 1:5,000.
The side slopes or valley walls of the Vermilion River and tributaries were not included in the riparian mapping,
however, they can have an impact on riparian health. For example, landslides and slumping due to river bank
erosion introduce sediment into the water. To acknowledge this, a point was added wherever evidence of
substantial landslides or slumps adjacent to the Vermilion River or the tributary creeks was observed.
There are numerous beaver dams within the Vermilion River watershed. These were identified by a line along the
length of the beaver dam to identify areas that are currently flooded or have been flooded by beaver activity. The
beaver ponds were also delineated separately where they are of significant size at a scale of 1:5,000.
2.2.2 River Reach Determination
The mapping developed as part of the terrain assessment (Section 2.2.1) identified generally homogeneous
reaches (i.e., sections of river or creek with similar geomorphological characteristics). Reach breaks were identified
qualitatively by considering:
Page 11
VERMILION RIVER AB, RIPARIAN INVENTORY AND ASSESSMENT
March 2016 Report No. 1534932 7
changes in channel planform geometry, including channel width and sinuosity, which often corresponded to
locations of changes in channel slope or entrenchment;
channel confluences which resulted in a substantial increase in drainage area;
extended reaches characterized by frequent beaver dams and ponds; and
man-made, in-stream ponds greater than 100 m long.
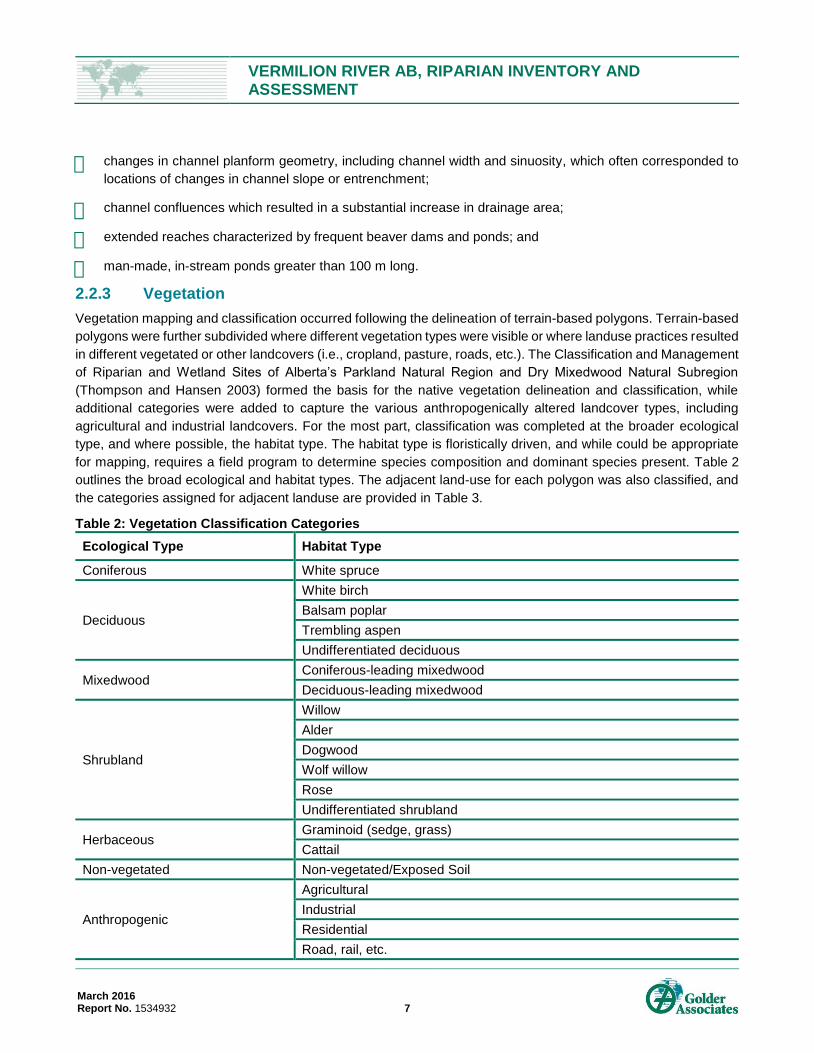
2.2.3 Vegetation
Vegetation mapping and classification occurred following the delineation of terrain-based polygons. Terrain-based
polygons were further subdivided where different vegetation types were visible or where landuse practices resulted
in different vegetated or other landcovers (i.e., cropland, pasture, roads, etc.). The Classification and Management
of Riparian and Wetland Sites of Alberta’s Parkland Natural Region and Dry Mixedwood Natural Subregion
(Thompson and Hansen 2003) formed the basis for the native vegetation delineation and classification, while
additional categories were added to capture the various anthropogenically altered landcover types, including
agricultural and industrial landcovers. For the most part, classification was completed at the broader ecological
type, and where possible, the habitat type. The habitat type is floristically driven, and while could be appropriate
for mapping, requires a field program to determine species composition and dominant species present. Table 2
outlines the broad ecological and habitat types. The adjacent land-use for each polygon was also classified, and
the categories assigned for adjacent landuse are provided in Table 3.
Table 2: Vegetation Classification Categories
Ecological Type Habitat Type
Coniferous White spruce
Deciduous
White birch
Balsam poplar
Trembling aspen
Undifferentiated deciduous
Mixedwood Coniferous-leading mixedwood
Deciduous-leading mixedwood
Shrubland
Willow
Alder
Dogwood
Wolf willow
Rose
Undifferentiated shrubland
Herbaceous Graminoid (sedge, grass)
Cattail
Non-vegetated Non-vegetated/Exposed Soil
Anthropogenic
Agricultural
Industrial
Residential
Road, rail, etc.
Page 12
VERMILION RIVER AB, RIPARIAN INVENTORY AND ASSESSMENT
March 2016 Report No. 1534932 8
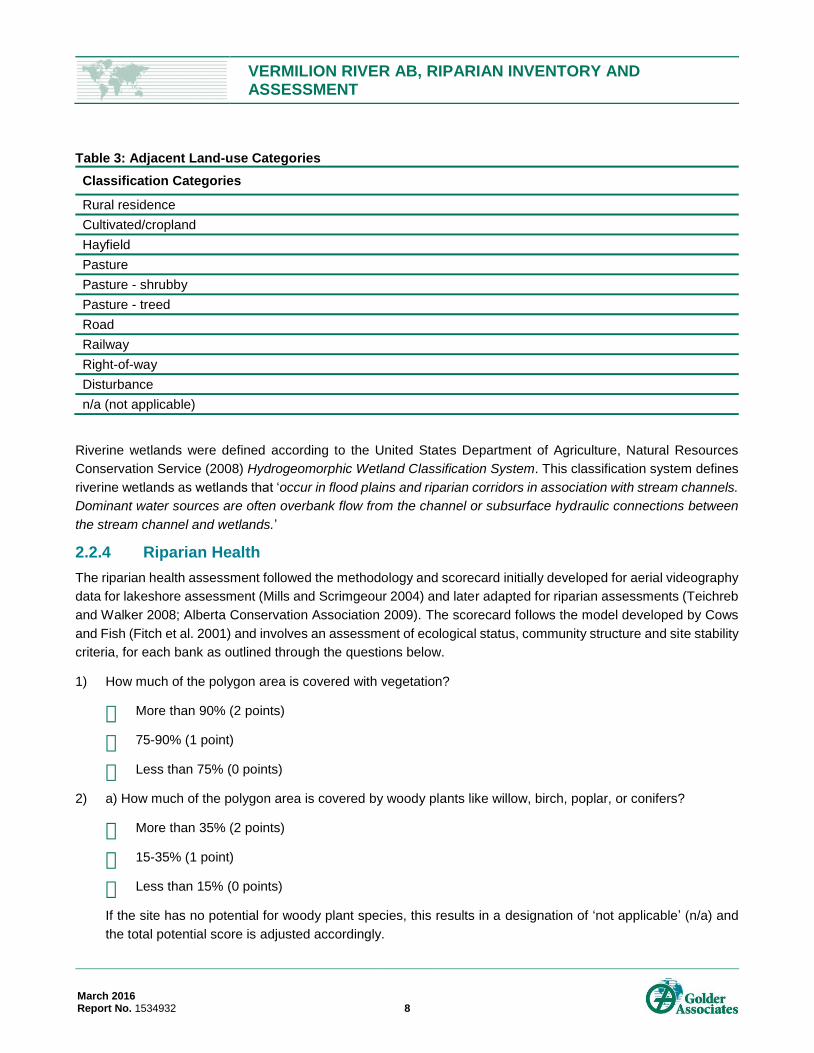
Table 3: Adjacent Land-use Categories
Classification Categories
Rural residence
Cultivated/cropland
Hayfield
Pasture
Pasture - shrubby
Pasture - treed
Road
Railway
Right-of-way
Disturbance
n/a (not applicable)
Riverine wetlands were defined according to the United States Department of Agriculture, Natural Resources
Conservation Service (2008) Hydrogeomorphic Wetland Classification System. This classification system defines
riverine wetlands as wetlands that ‘occur in flood plains and riparian corridors in association with stream channels.
Dominant water sources are often overbank flow from the channel or subsurface hydraulic connections between
the stream channel and wetlands.’
2.2.4 Riparian Health
The riparian health assessment followed the methodology and scorecard initially developed for aerial videography
data for lakeshore assessment (Mills and Scrimgeour 2004) and later adapted for riparian assessments (Teichreb
and Walker 2008; Alberta Conservation Association 2009). The scorecard follows the model developed by Cows
and Fish (Fitch et al. 2001) and involves an assessment of ecological status, community structure and site stability
criteria, for each bank as outlined through the questions below.
1) How much of the polygon area is covered with vegetation?
More than 90% (2 points)
75-90% (1 point)
Less than 75% (0 points)
2) a) How much of the polygon area is covered by woody plants like willow, birch, poplar, or conifers?
More than 35% (2 points)
15-35% (1 point)
Less than 15% (0 points)
If the site has no potential for woody plant species, this results in a designation of ‘not applicable’ (n/a) and
the total potential score is adjusted accordingly.
Page 13
VERMILION RIVER AB, RIPARIAN INVENTORY AND ASSESSMENT
March 2016 Report No. 1534932 9
b) Is there observable evidence of recruitment or persistence of woody species in the polygon?
Yes (2 points)
No (0 points)
If the site has no potential for woody plant species, this results in a designation of ‘not applicable’ (n/a) and
the total potential score is adjusted accordingly.
3) How much of the polygon area shows visual signs of human-caused alteration of the vegetation community?
Less than 5% (2 points)
5-15% (1 point)
More than 15% (0 points)
4) How much of the polygon area shows visual signs of human-caused bare ground and physical alterations?
Less than 5% (4 points)
5-15% (2 point)
More than 15% (0 points)
5) How would you categorize the current, overall bank stability within the polygon?
Stable (4 points)
Moderately unstable (2 point)
Highly unstable (0 points)
6) Which picture does most of the polygon look like?
Picture A (4 points)
Combination of A and B (2 point)
Page 14
VERMILION RIVER AB, RIPARIAN INVENTORY AND ASSESSMENT
March 2016 Report No. 1534932 10
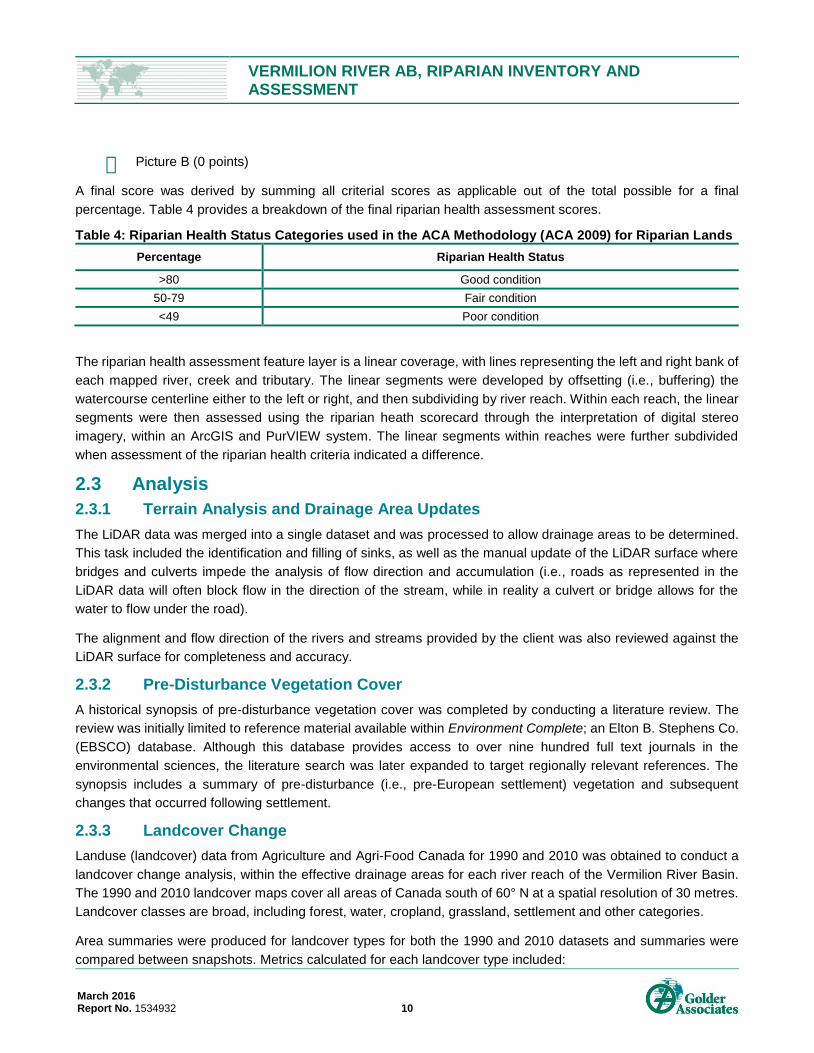
Picture B (0 points)
A final score was derived by summing all criterial scores as applicable out of the total possible for a final
percentage. Table 4 provides a breakdown of the final riparian health assessment scores.
Table 4: Riparian Health Status Categories used in the ACA Methodology (ACA 2009) for Riparian Lands
Percentage Riparian Health Status
>80 Good condition
50-79 Fair condition
<49 Poor condition
The riparian health assessment feature layer is a linear coverage, with lines representing the left and right bank of
each mapped river, creek and tributary. The linear segments were developed by offsetting (i.e., buffering) the
watercourse centerline either to the left or right, and then subdividing by river reach. Within each reach, the linear
segments were then assessed using the riparian heath scorecard through the interpretation of digital stereo
imagery, within an ArcGIS and PurVIEW system. The linear segments within reaches were further subdivided
when assessment of the riparian health criteria indicated a difference.
2.3 Analysis
2.3.1 Terrain Analysis and Drainage Area Updates
The LiDAR data was merged into a single dataset and was processed to allow drainage areas to be determined.
This task included the identification and filling of sinks, as well as the manual update of the LiDAR surface where
bridges and culverts impede the analysis of flow direction and accumulation (i.e., roads as represented in the
LiDAR data will often block flow in the direction of the stream, while in reality a culvert or bridge allows for the
water to flow under the road).
The alignment and flow direction of the rivers and streams provided by the client was also reviewed against the
LiDAR surface for completeness and accuracy.
2.3.2 Pre-Disturbance Vegetation Cover
A historical synopsis of pre-disturbance vegetation cover was completed by conducting a literature review. The
review was initially limited to reference material available within Environment Complete; an Elton B. Stephens Co.
(EBSCO) database. Although this database provides access to over nine hundred full text journals in the
environmental sciences, the literature search was later expanded to target regionally relevant references. The
synopsis includes a summary of pre-disturbance (i.e., pre-European settlement) vegetation and subsequent
changes that occurred following settlement.
2.3.3 Landcover Change
Landuse (landcover) data from Agriculture and Agri-Food Canada for 1990 and 2010 was obtained to conduct a
landcover change analysis, within the effective drainage areas for each river reach of the Vermilion River Basin.
The 1990 and 2010 landcover maps cover all areas of Canada south of 60° N at a spatial resolution of 30 metres.
Landcover classes are broad, including forest, water, cropland, grassland, settlement and other categories.
Area summaries were produced for landcover types for both the 1990 and 2010 datasets and summaries were
compared between snapshots. Metrics calculated for each landcover type included:
Page 15
VERMILION RIVER AB, RIPARIAN INVENTORY AND ASSESSMENT
March 2016 Report No. 1534932 11
area of each ecosystem in 1990 and 2010 within each reach and within the Vermilion River watershed as a
whole;
proportion (%) in 1990 and 2010 within each reach and within the Vermilion River watershed as a whole;
difference in area and proportion (%) between 1990 and 2010 within each reach and within the Vermilion
River watershed as a whole; and
proportion (%) of landcover change within each reach and within the Vermilion River watershed as a whole.
The proportion (%) of landcover change, referred to as % of resource, was calculated using the following formula:
(2010 area [ha] − 1990 area [ha])
1990 area [ha] × 100 = % 𝑜𝑓 𝑟𝑒𝑠𝑜𝑢𝑟𝑐𝑒
Positive values of % landcover represent an increase in a landcover type between 1990 and 2010 at the scale of
analysis being evaluated, whereas negative values represent a decrease in the landcover type.
3.0 RESULTS
3.1 Terrain
The results of the terrain mapping are provided as polygon data, showing classified fluvial floodplain features in
an ESRI ArcGIS 10.2 geodatabase. The terrain polygons served as the basis for the vegetation classification.
Point feature files, identifying beaver dams, oxbows, and landslide/instability locations, are also provided in an
ESRI ArcGIS 10.2 geodatabase.
3.2 River Reach Determination
River reaches are provided as attributed polyline features within the ArcGIS geodatabase, and are also presented
in Table 5, which provides the stream name, assigned reach designation, and a brief characterization of the reach.
Table 5 also indicates if flow from the indicated reach meets that from another reach at their downstream
confluence, and the designation of the next downstream reach.
3.3 Vegetation
The results of the terrain mapping are provided as polygon data, showing classified fluvial floodplain features in
an ESRI ArcGIS 10.2 geodatabase. The terrain polygons served as the basis for the vegetation classification.
Riverine wetlands are identified within the geodatabase.
Page 16
VERMILION RIVER AB, RIPARIAN INVENTORY AND ASSESSMENT
March 2016 Report No. 1534932 12
Table 5: Reach Breaks in Study Area
Stream Name Reach Description Confluence with
Reach Downstream Reach
Reach Start Reach End Reach Lengthb
(km) Easting Northing Easting Northing
Birch Creek BIR01 Well defined irregularly meandering channel, beaver affected VER10 VER09 480028 5908446 484270 5914837 18
Birch Creek BIR02 Small defined reach, beaver affected - BIR01 461424 5926978 480028 5908446 34
Campbell Creek CAM01 Irregular meandering channel VER06 VER05 525198 5923837 525855 5923267 2
Campbell Creek CAM02 Defined channel with a series of beaver impoundments - CAM01 522513 5925929 525198 5923837 5
Campbell Creek CAM03 Poorly defined channel - CAM02 518237 5927483 522513 5925929 5
Cotton Creek COT01 Small defined channel, beaver affected VER14 VER13 448804 5934108 445722 5949056 20
Deer Creek DEE01 Irregular meandering channel VER05 VER04 533333 5927693 533599 5926922 2
Deer Creek DEE02 Defined channel, beaver affected - DEE01 527354 5931992 533333 5927693 11
Deer Creek DEE03 Small Lake - DEE02 526115 5932487 527354 5931992 1
Deer Creek DEE04 Short defined channel connecting lakes - DEE03 525982 5932637 526115 5932487 <1
Deer Creek DEE05 Small Lake - DEE04 525341 5933565 525982 5932637 1
Deer Creek DEE06 Poorly defined channel - DEE05 516133 5936770 525341 5933565 13
Holden Creek HOL01 Drainage ditch VER19 VER18 429229 5901333 430142 5902522 4
Holden Creek HOL02 Drainage ditch HOL11 HOL01 423650 5895705 429229 5901333 15
Holden Creek HOL03 Man-made impoundment - HOL02 423398 5895606 423650 5895705 <1
Holden Creek HOL04 Drainage ditch - HOL03 423000 5895228 423398 5895606 1
Holden Creek HOL05 Man-made impoundment - HOL04 421777 5895345 423000 5895228 1
Holden Creek HOL06 Drainage ditch - HOL05 417927 5895844 421777 5895345 5
Holden Creek HOL07 Man-made impoundment - HOL06 417364 5896000 417927 5895844 1
Holden Creek HOL08 Drainage ditch - HOL07 415502 5895304 417364 5896000 3
Holden Creek HOL09 Drainage ditch HOL10 HOL08 414133 5896363 415502 5895304 2
Holden Creek HOL10 Drainage ditch HOL09 HOL08 409793 5891435 415502 5895304 15
Holden Drainage HOL11 Drainage ditch HOL02 HOL01 429344 5895584 429229 5901333 9
Holden Drainage HOL12 Beaver affected reach - HOL11 429209 5894310 429344 5895584 2
Holden Drainage HOL13 Drainage ditch - HOL12 429271 5891907 429209 5894310 5
Holden Drainage HOL14 Man-made impoundment - HOL13 429235 5891371 429271 5891907 1
Holden Drainage HOL15 Drainage ditch - HOL14 414199 5887714 429235 5891371 19
Holden Drainage HOL16 Drainage ditch - HOL15 405956 5887740 414199 5887714 9
Holden Drainage HOL17 Drainage ditch HOL18 HOL16 405215 5887486 405956 5887740 1
Holden Drainage HOL18 Drainage ditch HOL17 HOL16 406414 5885147 405956 5887740 3
Holden Drainage HOL19 Drainage ditch HOL20 HOL18 407918 5880452 406414 5885147 6
Holden Drainage HOL20 Drainage ditch HOL19 HOL18 407789 5884253 406414 5885147 2
Holden Drainage HOL21 Drainage ditch HOL16 HOL15 412584 5871590 414199 5887714 19
Page 17
VERMILION RIVER AB, RIPARIAN INVENTORY AND ASSESSMENT
March 2016 Report No. 1534932 13
Table 5: Reach Breaks in Study Area
Stream Name Reach Description Confluence with
Reach Downstream Reach
Reach Start Reach End Reach Lengthb
(km) Easting Northing Easting Northing
Irish Creek IRI01 Irregular meandering channel VER02 VER01 529443 5945735 538163 5942103 17
Irish Creek IRI02 Small defined channel, beaver affected - IRI01 521787 5948706 529443 5945735 13
Irish Creek IRI03 Small defined channel - IRI02 514392 5955114 521787 5948706 11
Irish Creek IRI04 Small defined channel, beaver affected - IRI03 508856 5959967 514392 5955114 8
Lamont LAM01 Small defined channel WAR02 WAR01 429900 5946315 432029 5945761 4
Lamont LAM02 Meandering channel; beaver affected - LAM01 408782 5954161 429900 5946315 38
Marwayne Creek MAR01 Irregular meandering channel VER03 VER02 540965 5929542 540626 5928888 1
Marwayne Creek MAR02 Defined channel, beaver affected - - 544175 5928918 540965 5929542 10
Marwayne Creek MAR03 Small defined channel - - 546477 5927805 544175 5928918 4
Mundare MUN01 Defined channel - WAR03 427807 5938110 429383 5939489 3
Mundare MUN02 Beaver affected reach - MUN01 427026 5937784 427807 5938110 1
Mundare MUN03 Well defined meandering channel - VER13 422521 5935371 427026 5937784 10
Mundare MUN04 Beaver affected reach - MUN03 419564 5937157 422521 5935371 4
Mundare MUN05 Poorly defined channel - MUN04 412136 5938473 419564 5937157 11
Stretton Creek STR01 Irregular meandering channel VER04 VER03 544884 5921588 539991 5927074 15
Stretton Creek STR02 Defined channel, beaver affected - STR01 550119 5915291 544884 5921588 12
Stretton Creek STR03 Small defined channel - STR02 549475 5910753 550119 5915291 8
Vermilion River VER01 Irregular meandering channel NSR 538163 5942103 543897 5945829 13
Vermilion River VER02 Irregular meandering channel IRI01 VER01 540626 5928888 538163 5942103 27
Vermilion River VER03 Irregular meandering channel MAR01 VER02 539991 5927074 540626 5928888 5
Vermilion River VER04 Irregular meandering channel STR01 VER03 533599 5926922 539991 5927074 18
Vermilion River VER05 Irregular meandering channel DEE01 VER04 525855 5923267 533599 5926922 21
Vermilion River VER06 Generally straight reach CAM01 VER05 514442 5912930 525855 5923267 19
Vermilion River VER07 Irregular meandering channel - VER06 509284 5912418 514442 5912930 9
Vermilion River VER08 Man-made impoundment - VER07 504111 5912937 509284 5912418 8
Vermilion River VER09 Irregular meandering channel - VER08 484270 5914837 504111 5912937 46
Vermilion River VER10 Irregular meandering channel BIR01 VER09 468529 5944164 484270 5914837 65
Vermilion River VER11 Defined channel with a series of wetlands and pools - VER10 451906 5950687 468529 5944164 19
Vermilion River VER12 Defined channel with slight bends - VER11 448809 5950147 451906 5950687 4
Vermilion River VER13 Wetland - VER12 445722 5949056 448809 5950147 4
Vermilion River VER14 Straight reach COT01 VER13 443060 5948238 445722 5949056 3
Vermilion River VER15 Irregular meandering channel - VER14 436453 5944667 443060 5948238 16
Vermilion River VER16 Irregular meandering channel WAR01 VER15 432013 5932634 436453 5944667 35
Page 18
VERMILION RIVER AB, RIPARIAN INVENTORY AND ASSESSMENT
March 2016 Report No. 1534932 14
Table 5: Reach Breaks in Study Area
Stream Name Reach Description Confluence with
Reach Downstream Reach
Reach Start Reach End Reach Lengthb
(km) Easting Northing Easting Northing
Vermilion River VER17 Irregular meandering channel WAS01 VER16 428065 5923988 432013 5932634 25
Vermilion River VER18 Irregular meandering channel - VER17 429980 5916136 428065 5923988 27
Vermilion River VER19 Irregular meandering channel HOL01 VER18 430142 5902522 429980 5916136 43
Vermilion River VER20 Irregular meandering channel VER20 HOL01 438350 5887867 430142 5902522 34
Warwick WAR01 Well defined meandering channel VER16 VER15 432029 5945761 436453 5944667 14
Warwick WAR02 Beaver affected reach LAM01 WAR01 431657 5943212 432029 5945761 5
Warwick WAR03 Defined channel - WAR02 429383 5939489 431657 5943212 11
Waskwei Creek WAS01 Well defined meandering channel - VER16 425922 5923190 428065 5923988 5
Waskwei Creek WAS02 Beaver affected reach - WAS01 420394 5920455 425922 5923190 10
Waskwei Creek WAS03 Poorly defined channel - WAS02 411010 5914670 420394 5920455 18
a Start and end coordinates are displayed Universal Transvers Mercator (UTM) coordinate system, NAD83 Projection, Zone 12U.
b Note: Values are rounded for presentation purposes; therefore totals may not appear to exactly equal the sum of the rows.
Page 19
VERMILION RIVER AB, RIPARIAN INVENTORY AND ASSESSMENT
March 2016 Report No. 1534932 15
3.4 Riparian Health
Results from the aerial assessment and evaluation of riparian health through use of the scorecard showed that
19% of the riparian areas in the Vermilion River watershed are in good condition, 27% are in fair condition and
54% are in poor condition (Figure 3). Detailed spatial maps of riparian health for the Vermillion River watershed
are available from the NSWA. Table 6 outlines the riparian health score by drainage and within the Vermilion River
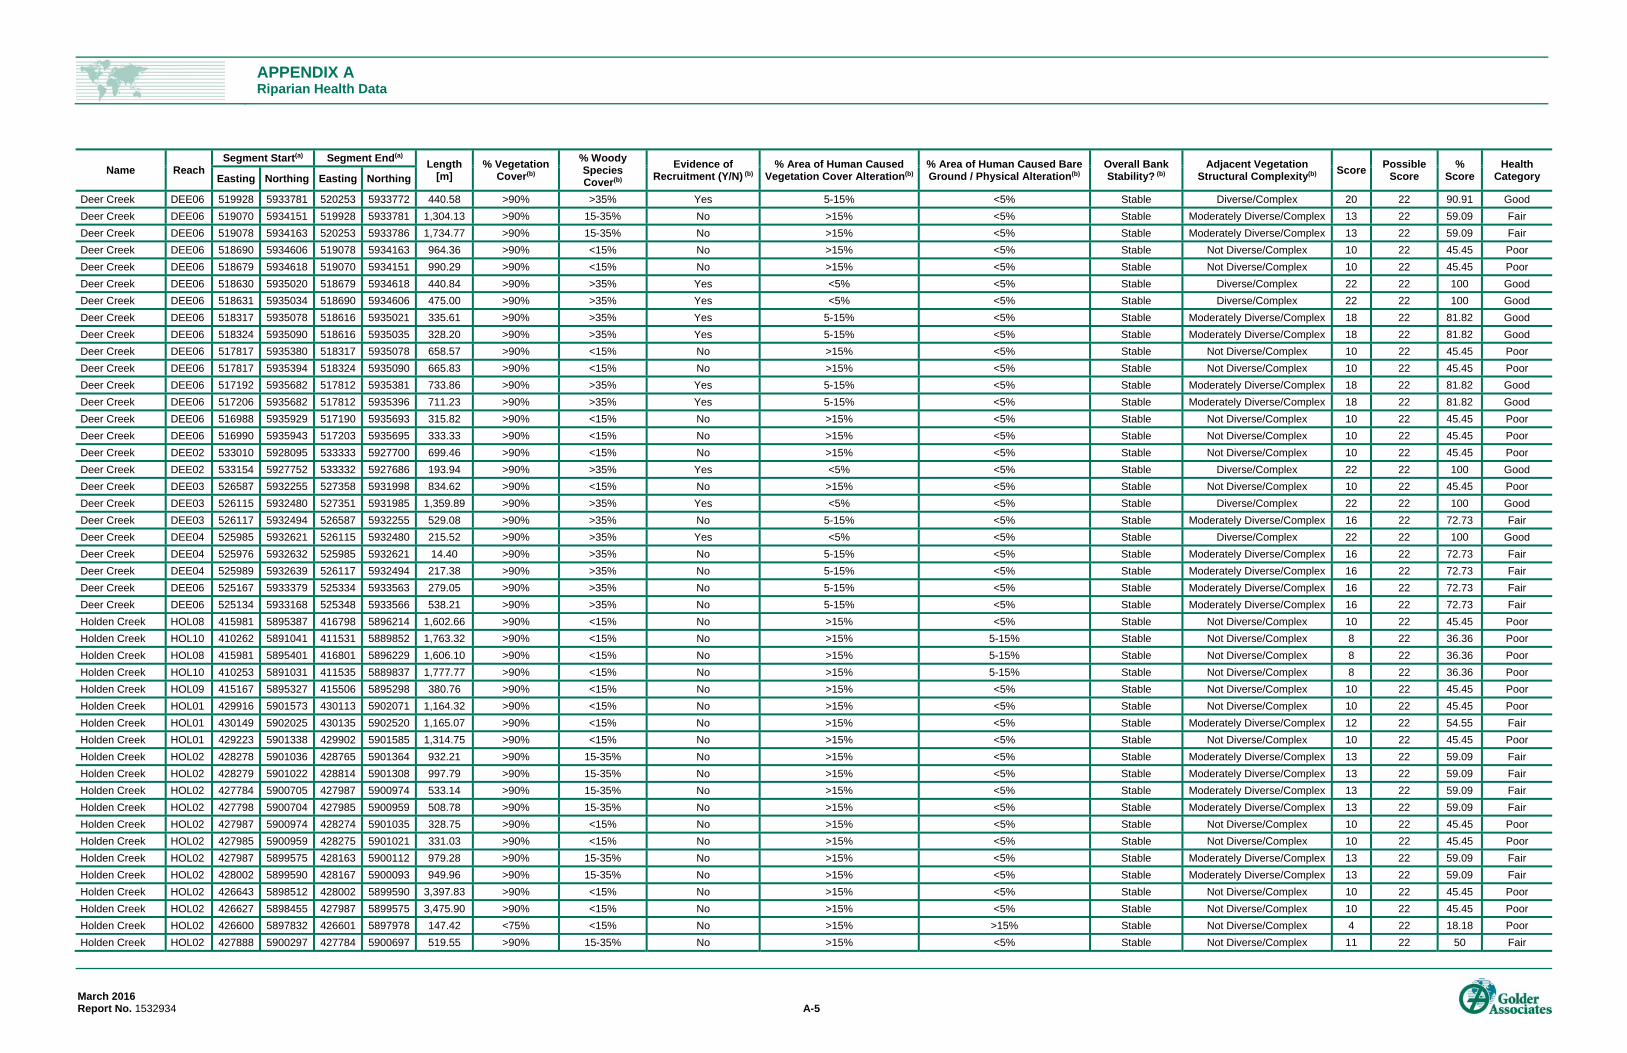
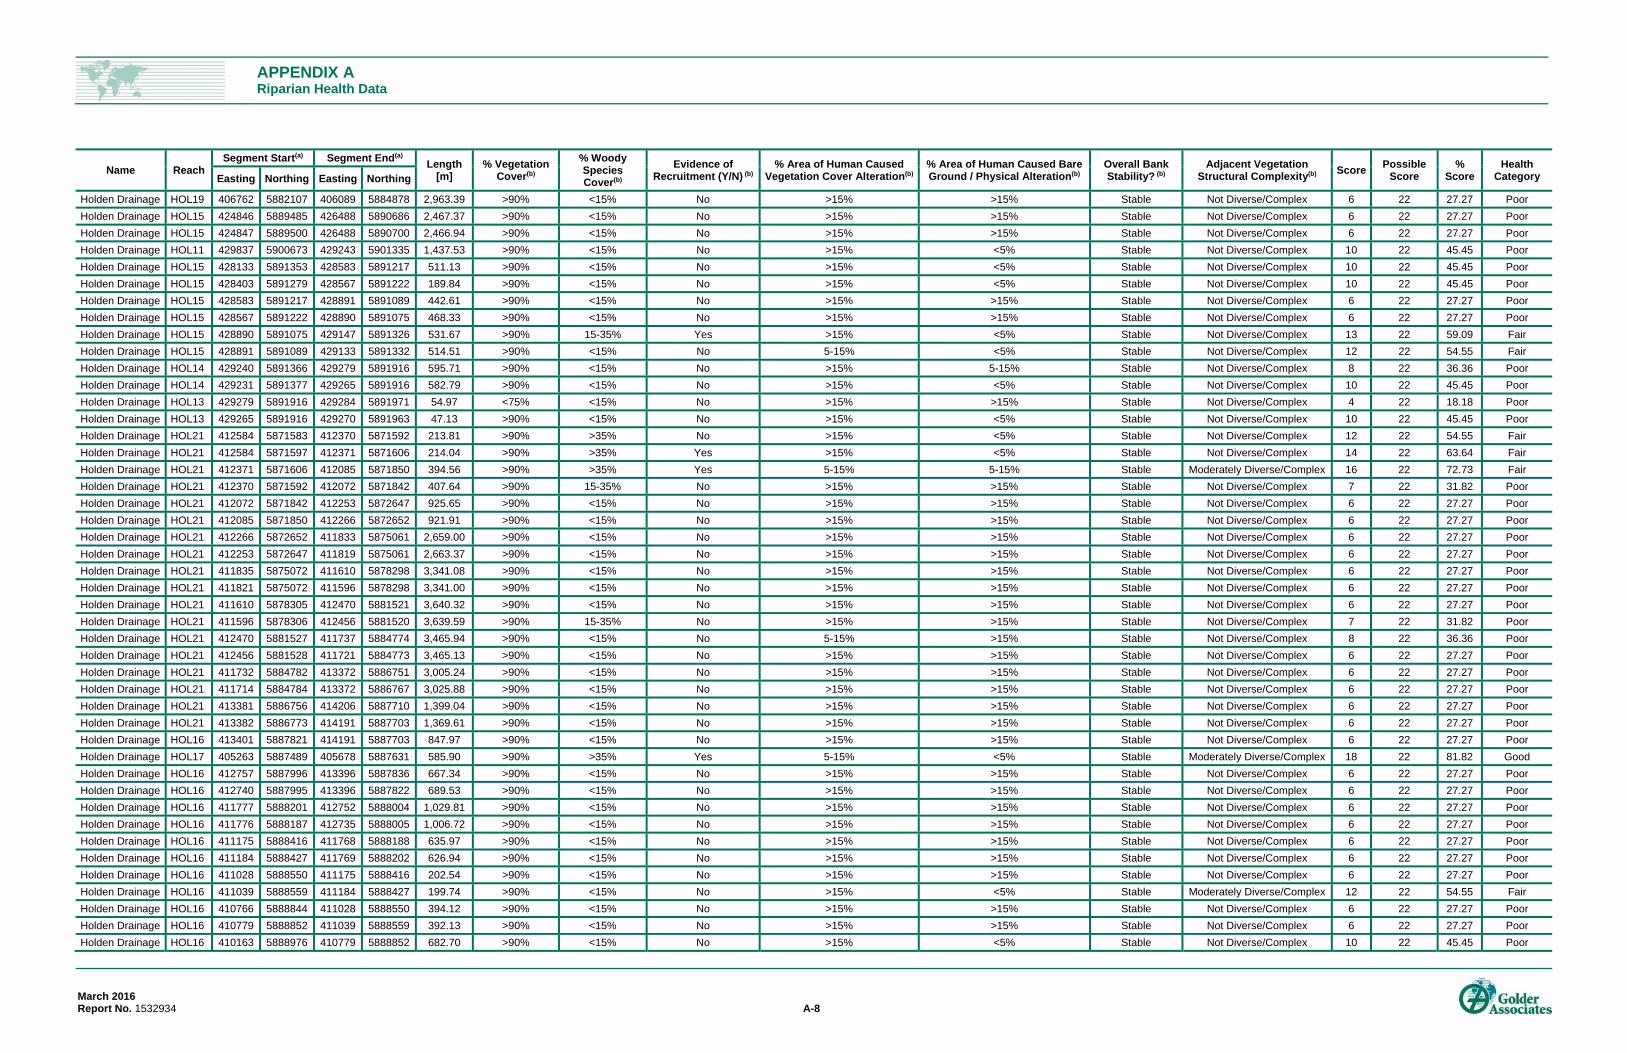
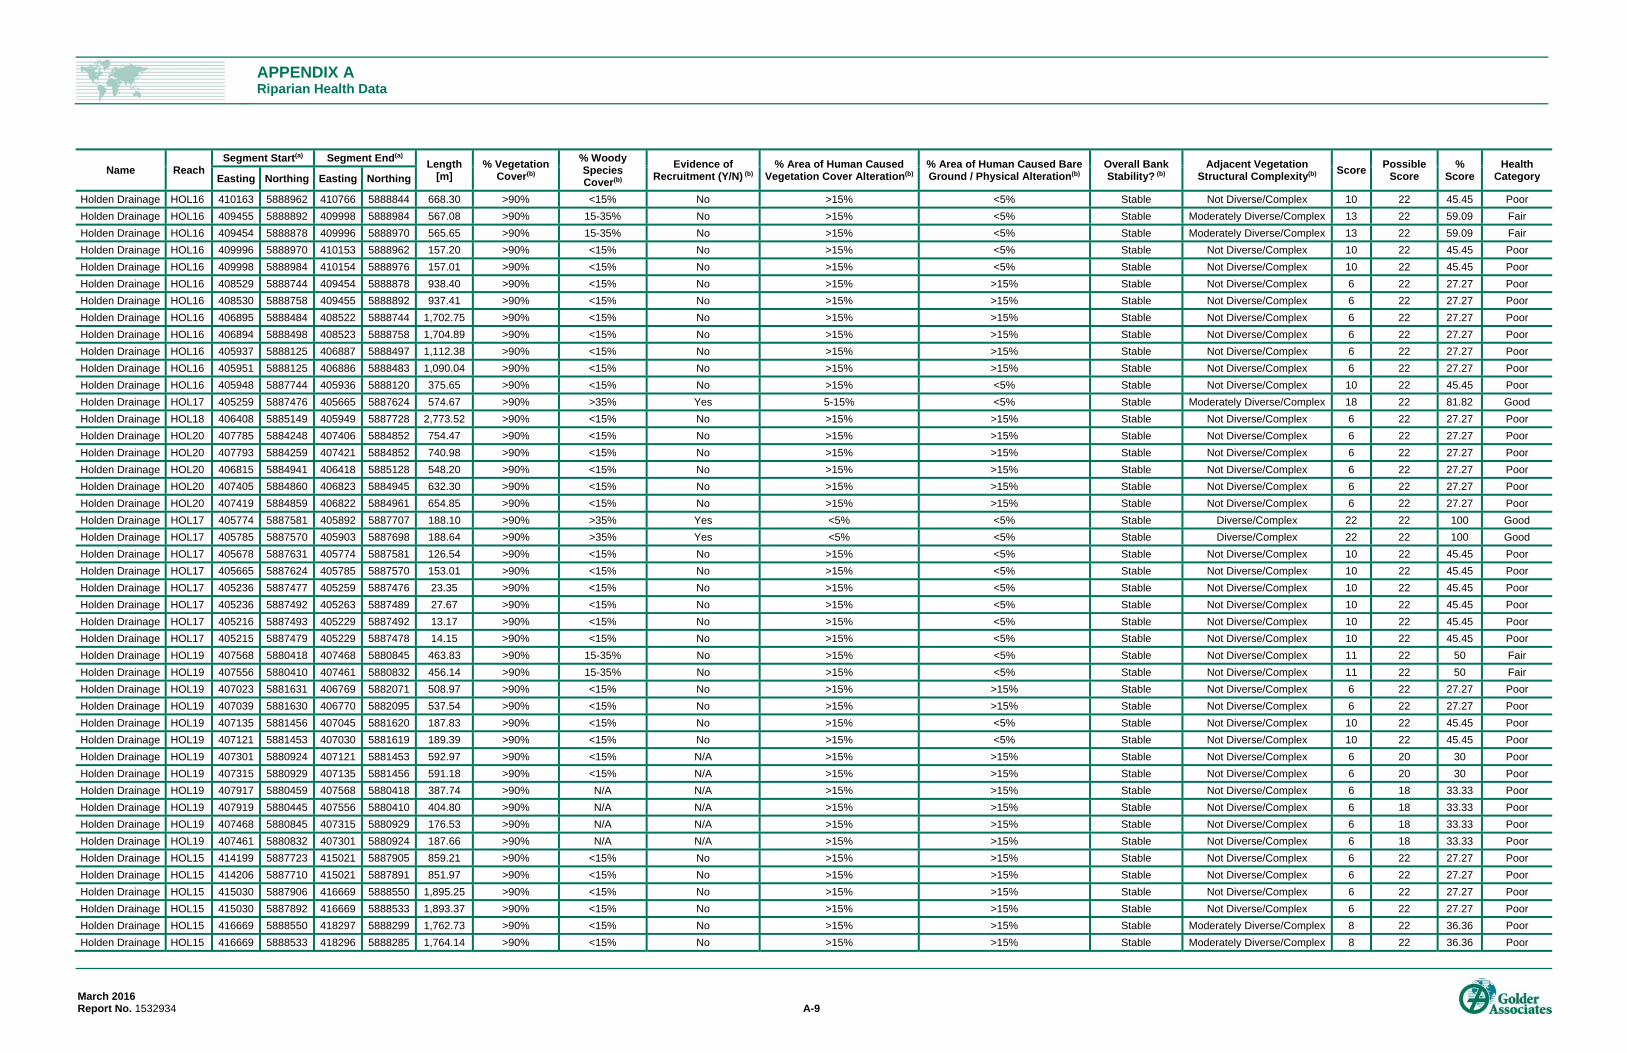
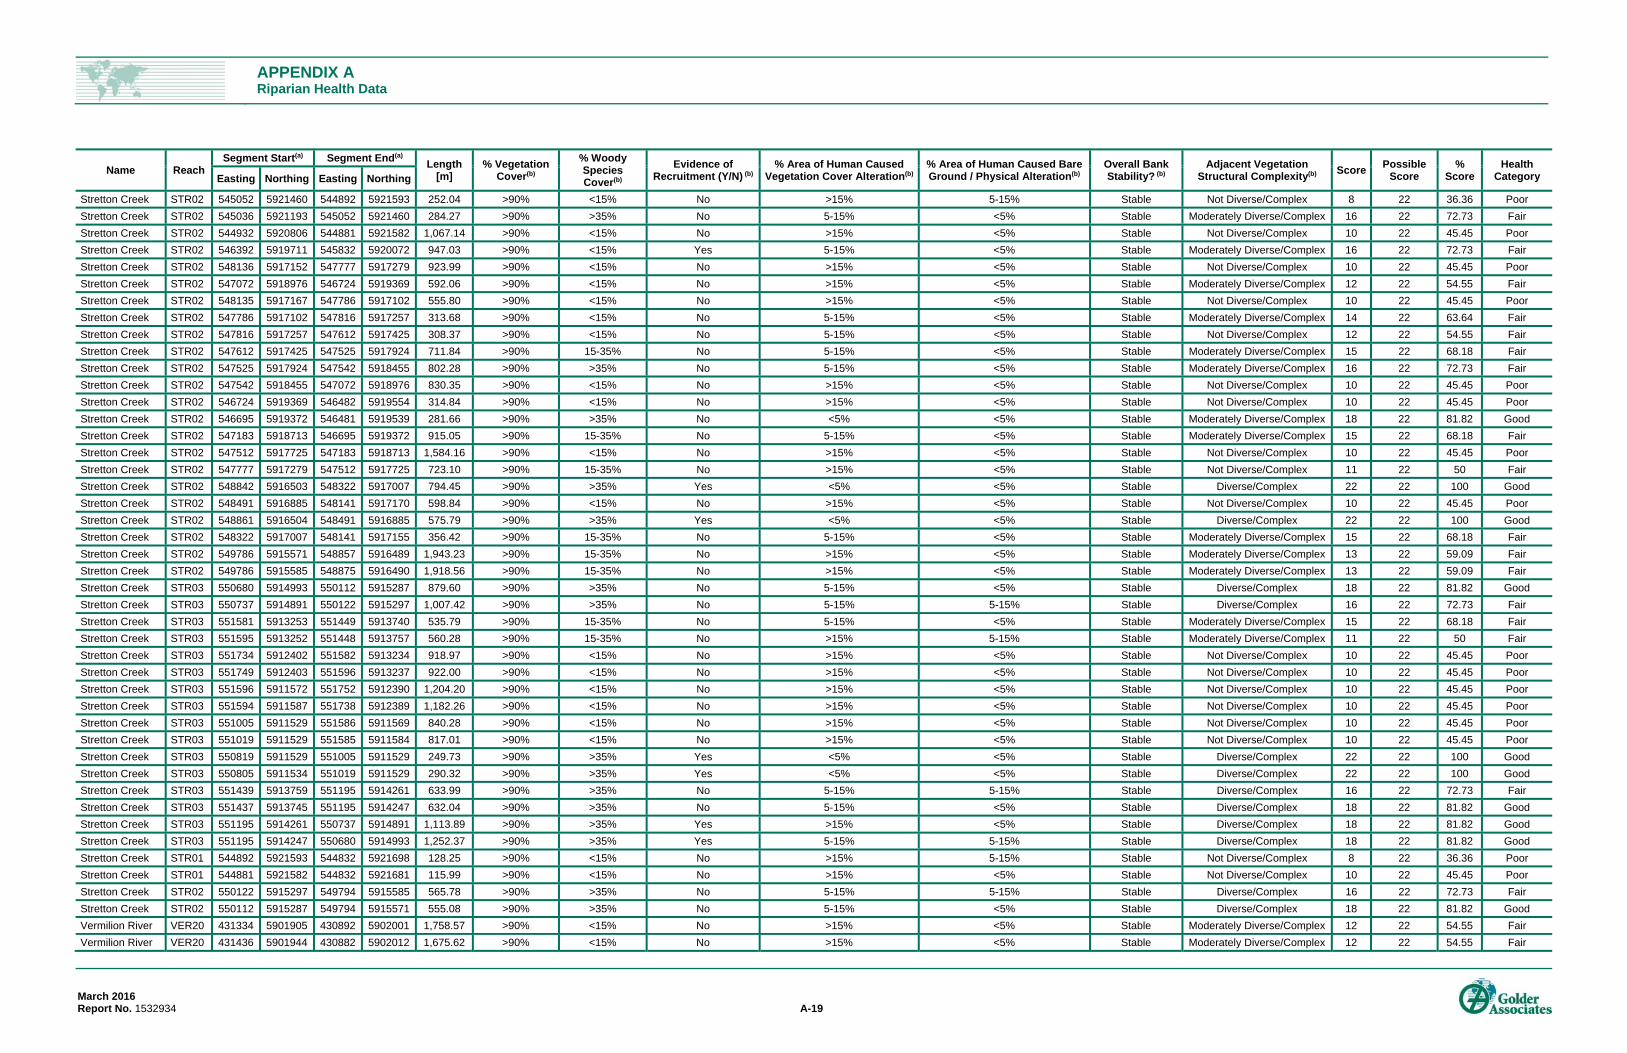
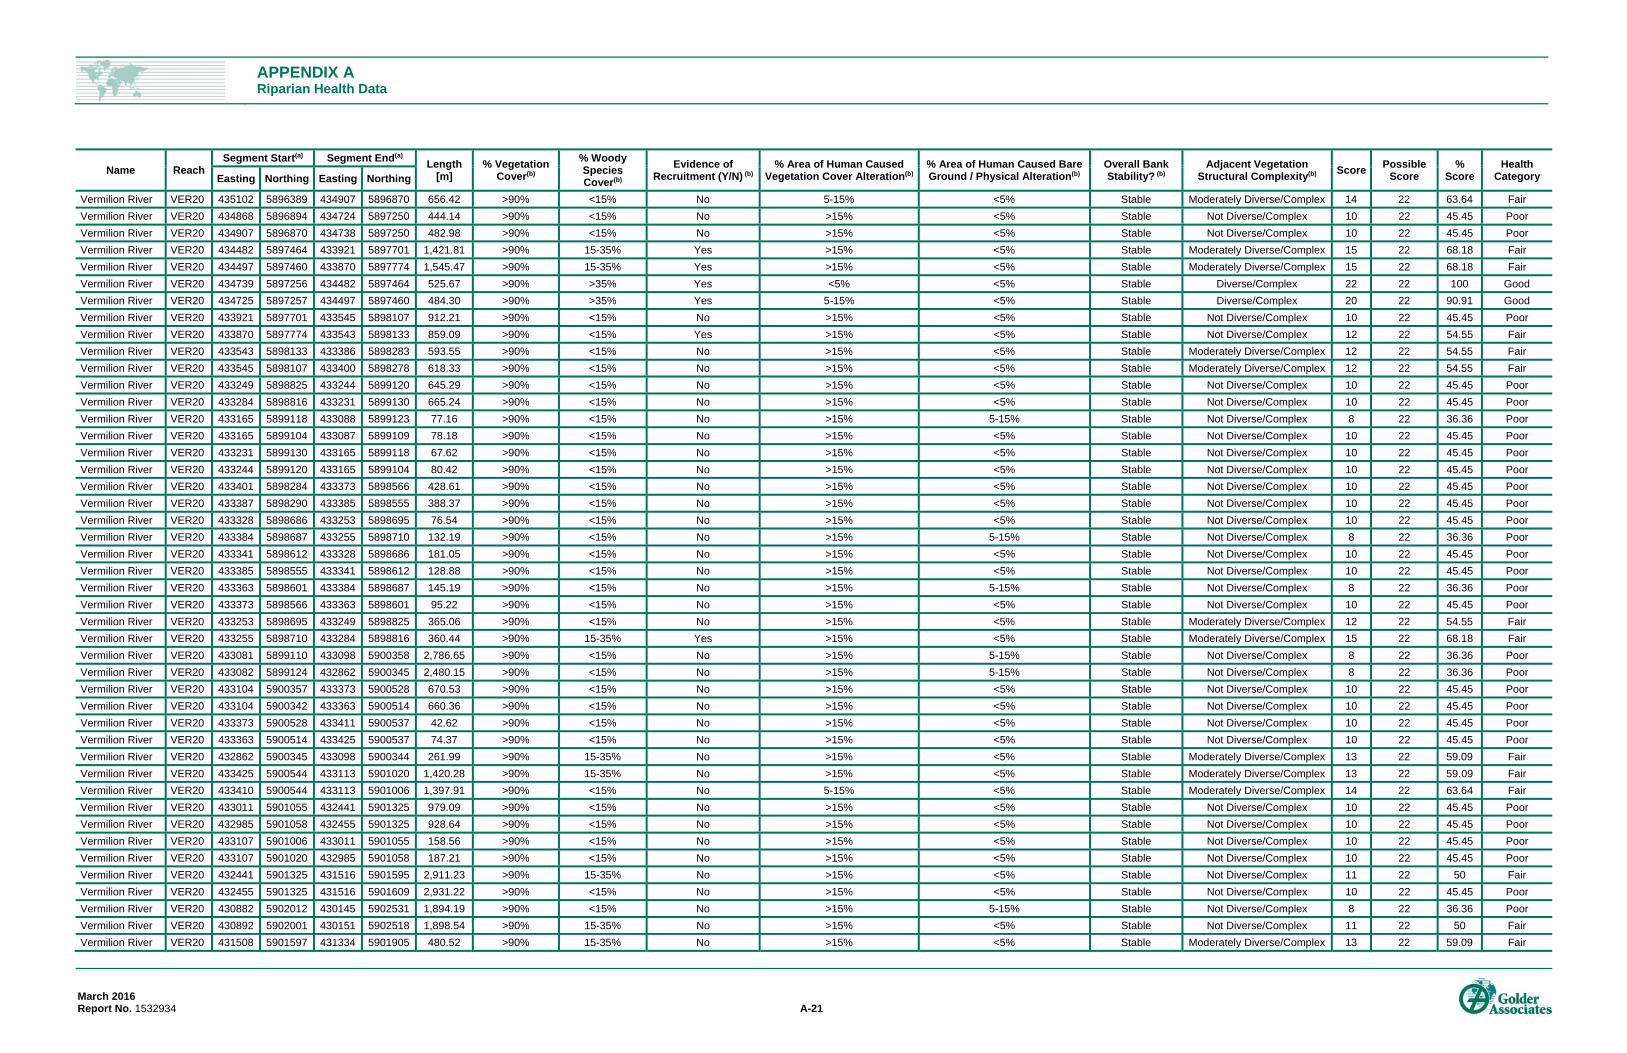
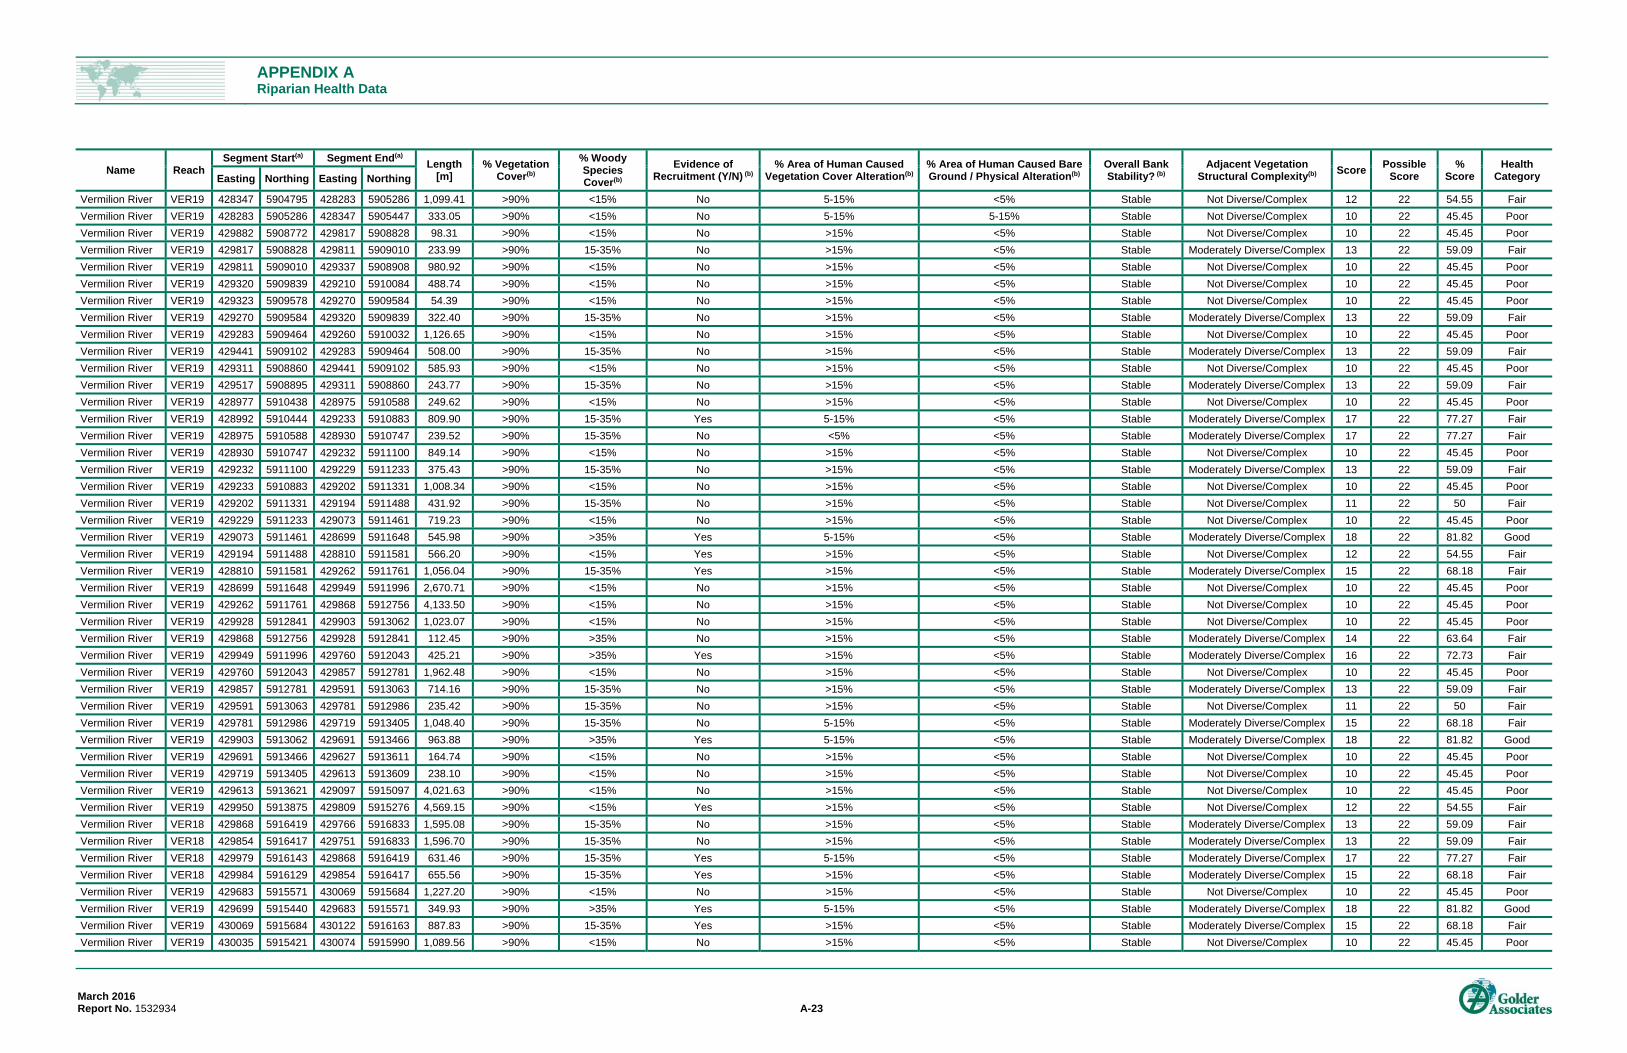
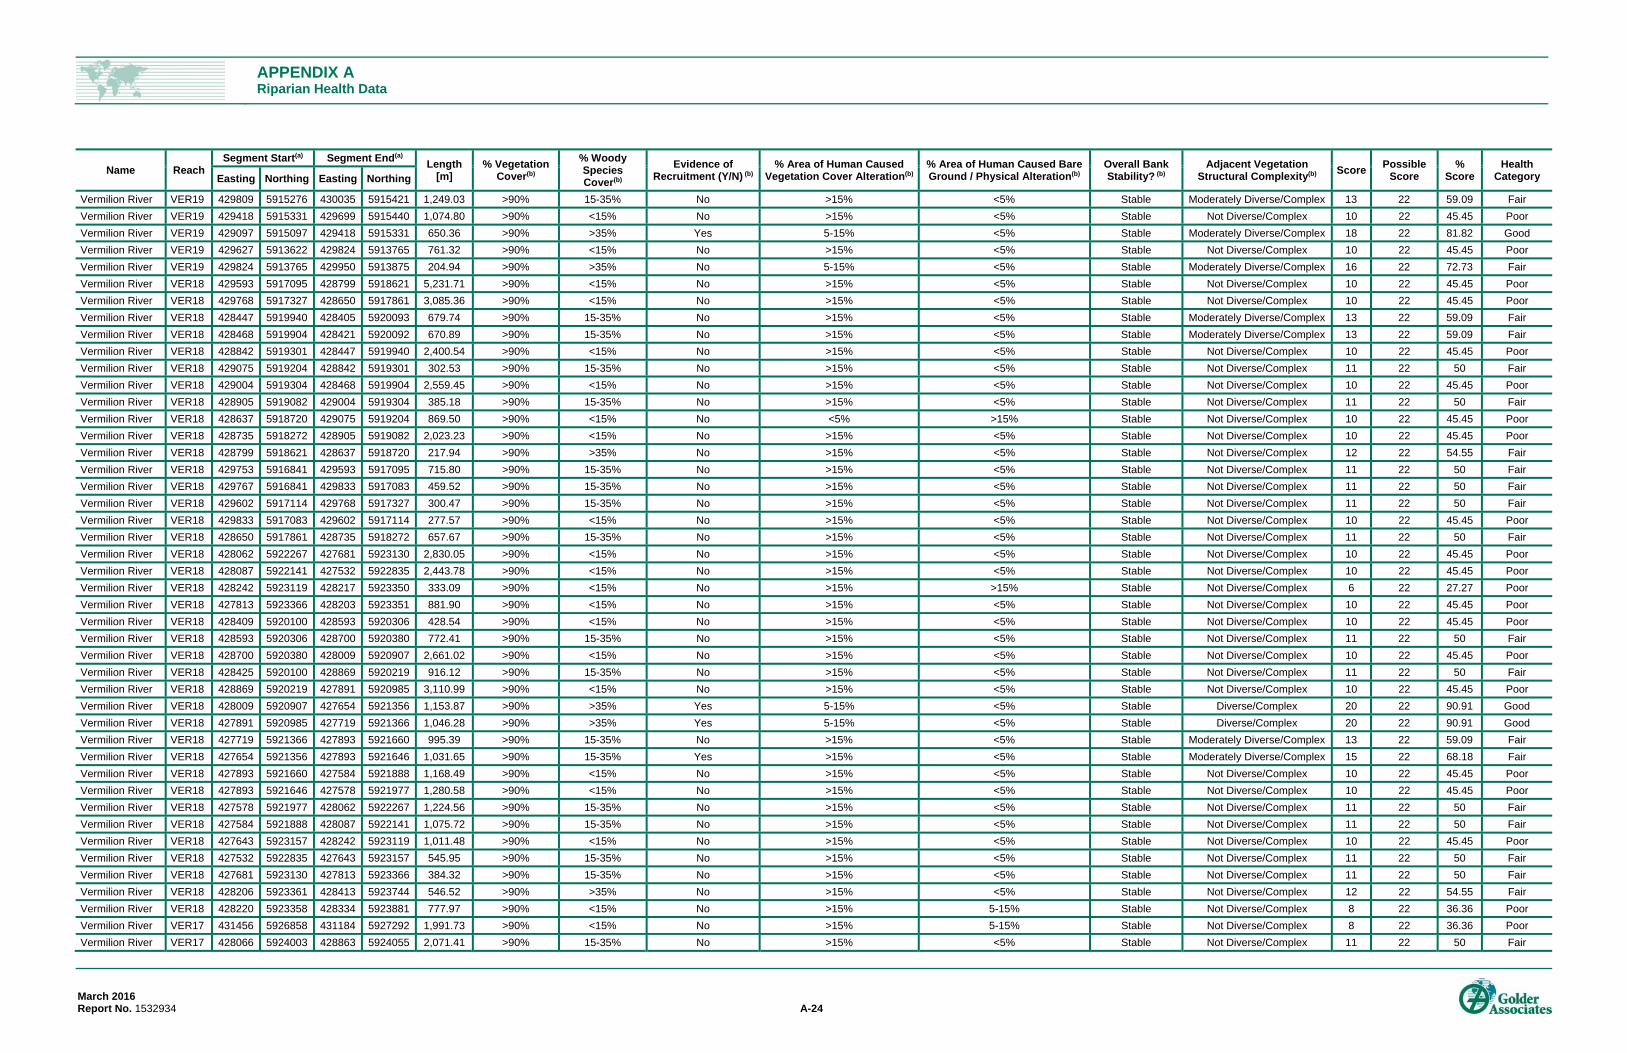
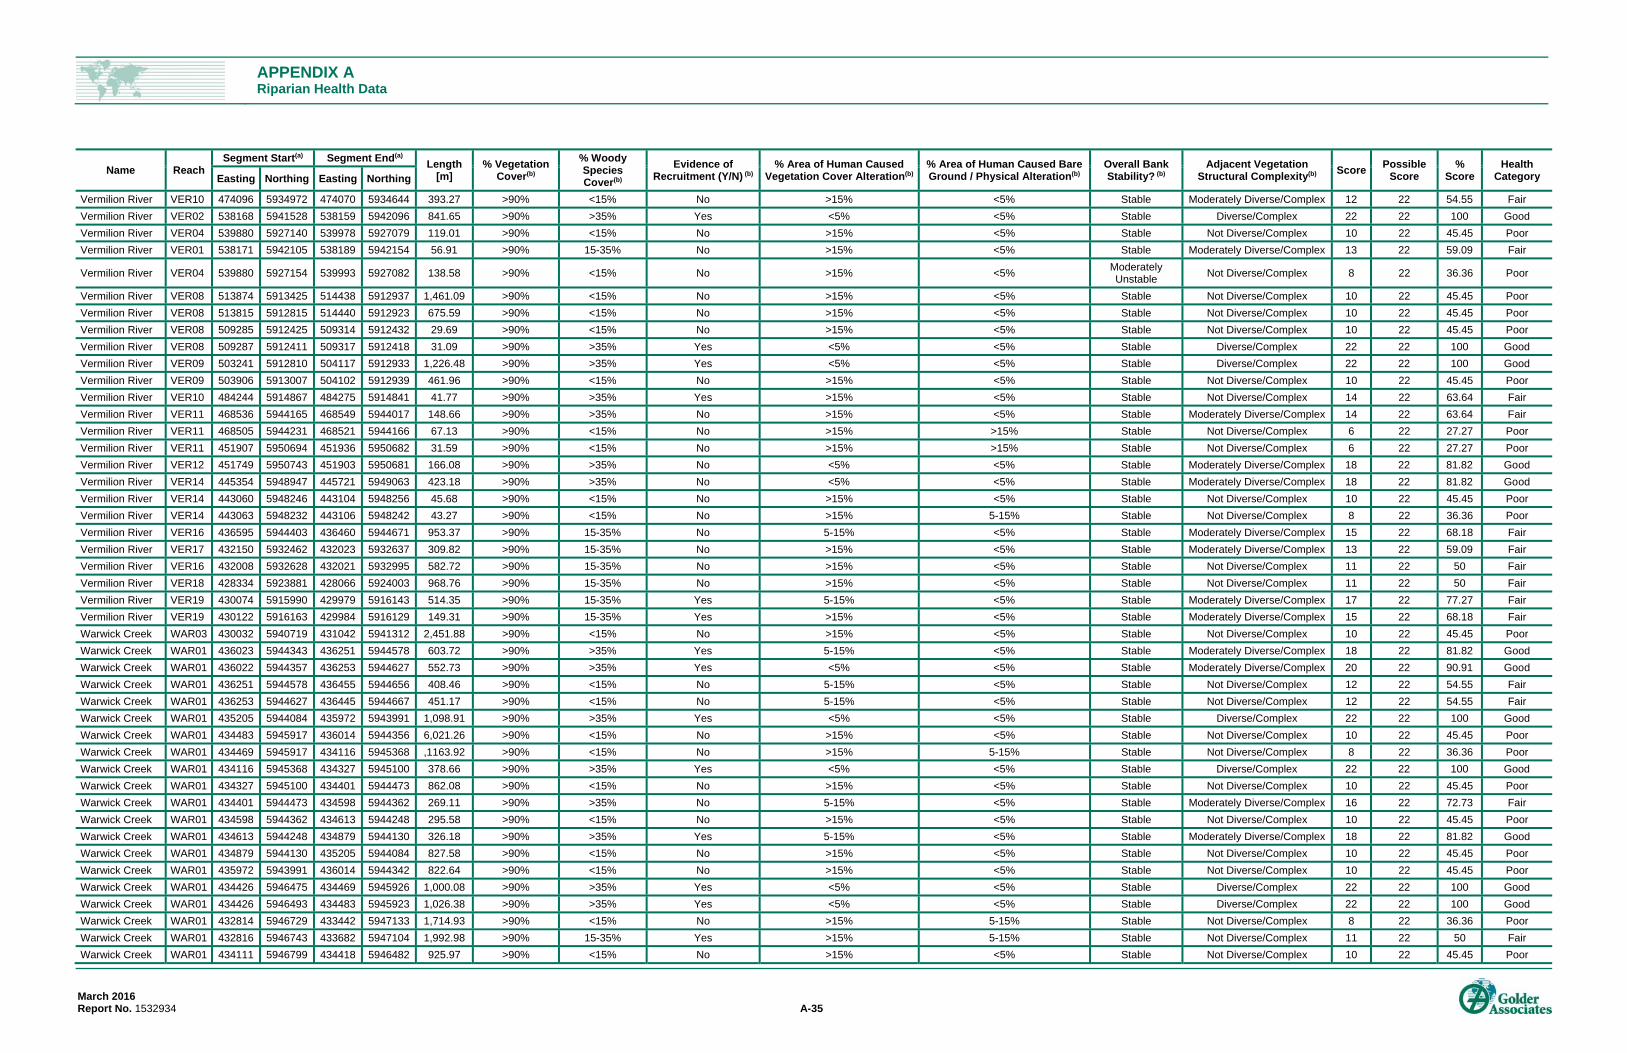
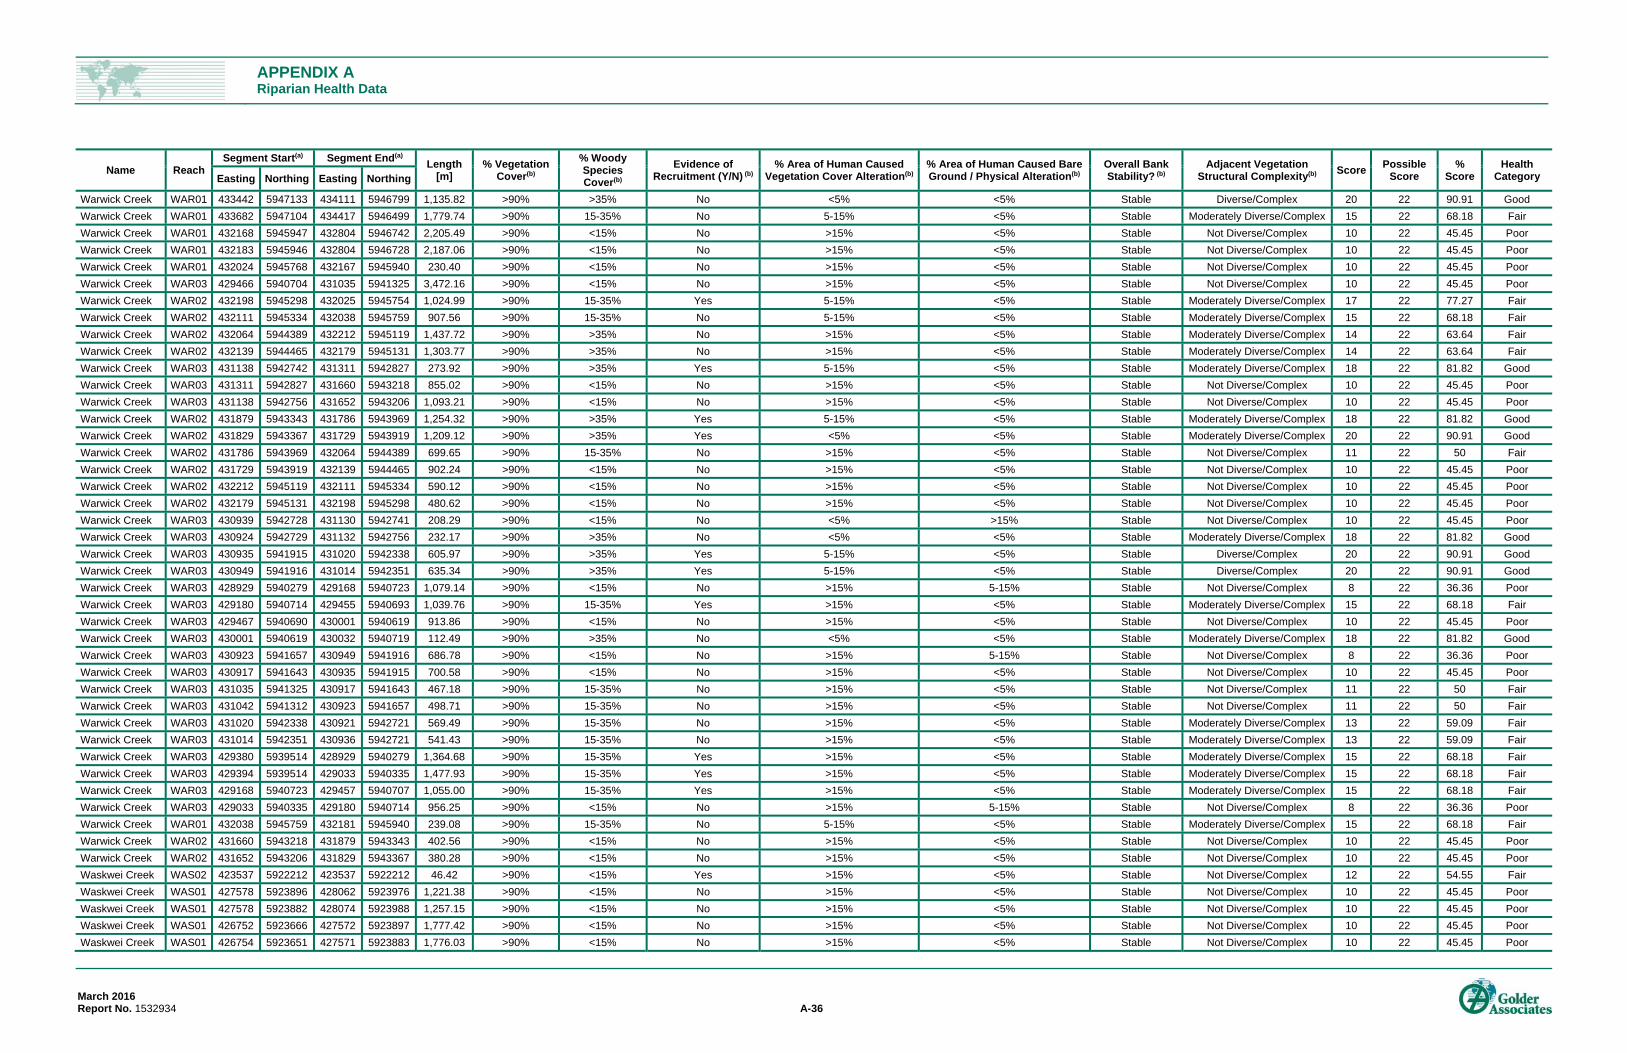
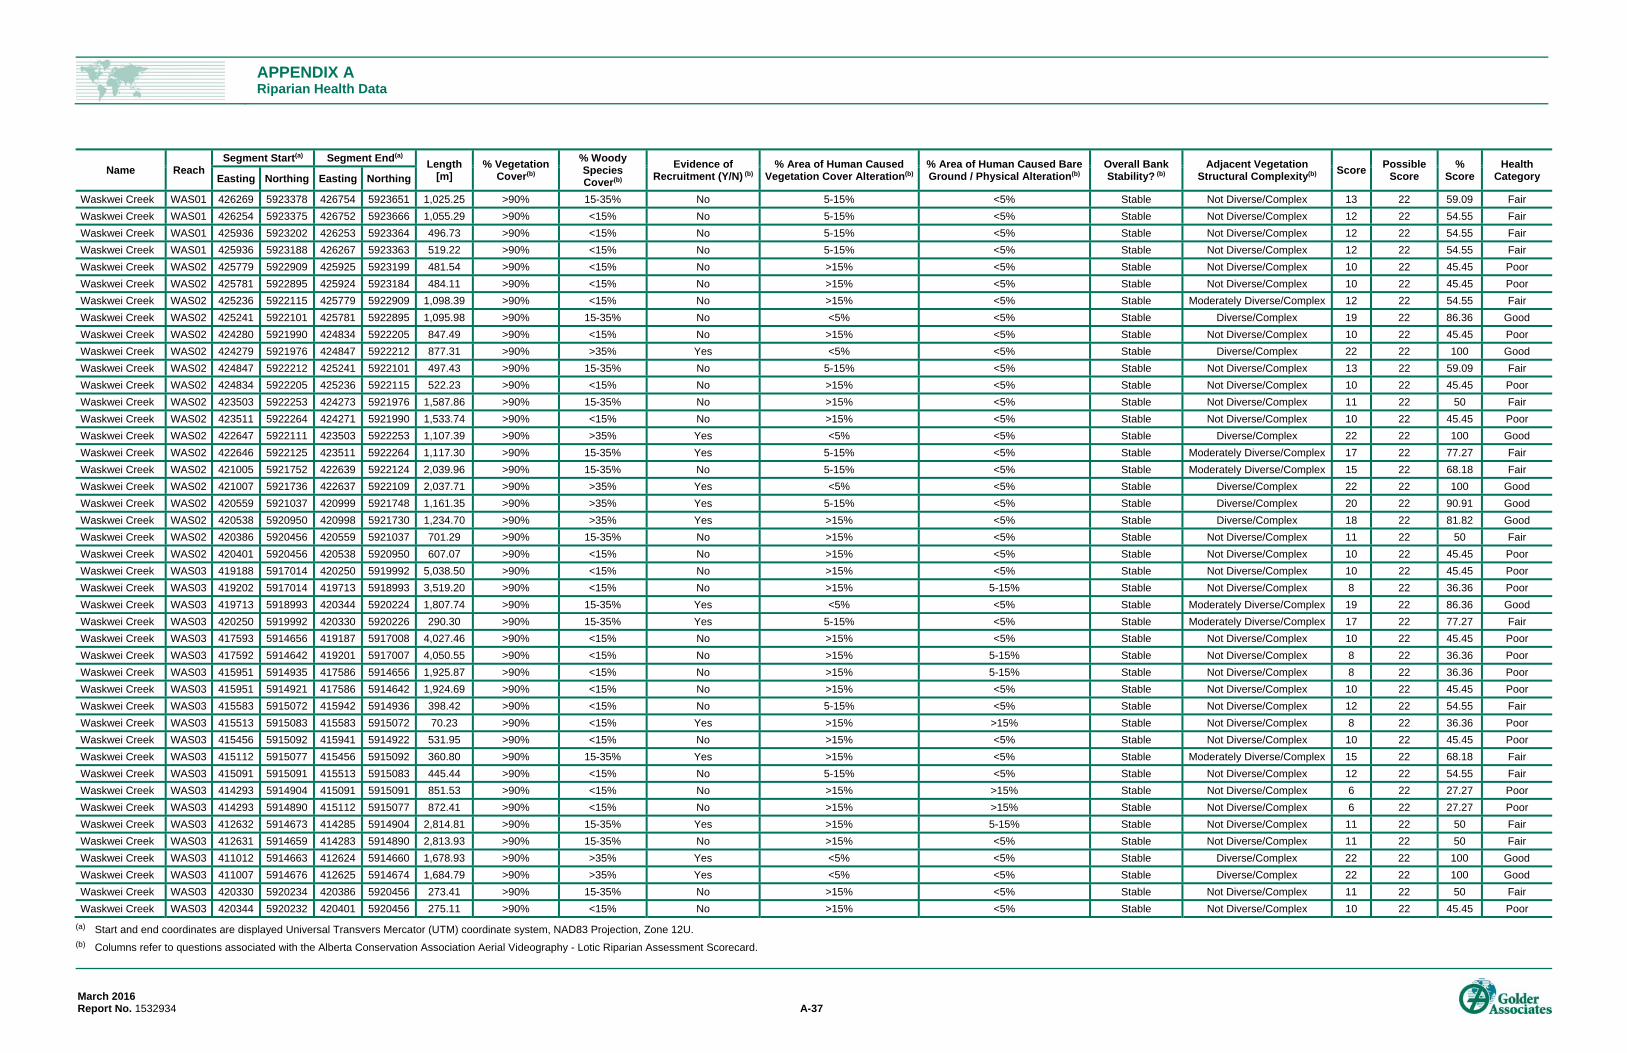
watershed as a whole. Appendix A presents the results of all riparian health scores by segment within each river
reach. Where drainages intersected roads, the riparian line segment was broken and the road portion of the
riparian health line was not assigned a health score. These road segments were excluded from the results
presented in Table 6 and Appendix A. The actual riparian health maps will be provided in two standalone
documents (Attachment 1, scale 1:20000 and Attachment 2, scale 1:5000).
Figure 3: Vermilion River Watershed Riparian Health Summary
Overall riparian health trend varies between drainages, with the Birch Creek drainage having the highest overall
proportion of riparian areas with a ‘good’ health score of 57%, compared to the lowest ‘good’ health score of 8%
in both the Holden and Lamont Creek Drainages. The latter also have the highest overall proportions of riparian
areas with a ‘poor’ health score. Figure 4 to Figure 6 depict riparian health scores by drainage.
Table 6: Riparian Health Score and Length by Drainage within the Vermilion River Watershed
Drainage
Good Fair Poor Total Drainage Length (km)a
% of drainage kma
% of drainage kma
% of drainage kma
Birch Creek 57 59 21 22 21 22 103
Campbell Creek 29 7 29 7 42 10 23
Cotton Creek 22 8 49 19 29 11 38
Deer Creek 35 21 14 8 51 30 59
Holden Creek 8 20 10 24 81 193 237
Irish Creek 43 42 25 24 33 32 97
Lamont Creek 8 7 16 13 76 65 85
Vermilion Watershed
Good Fair Poor
Page 20
VERMILION RIVER AB, RIPARIAN INVENTORY AND ASSESSMENT
March 2016 Report No. 1534932 16
Table 6: Riparian Health Score and Length by Drainage within the Vermilion River Watershed
Drainage
Good Fair Poor Total Drainage Length (km)a
% of drainage kma
% of drainage kma
% of drainage kma
Marwayne Creek 24 7 24 7 53 15 29
Mundare Creek 34 20 25 14 41 24 58
Stretton Creek 19 14 28 20 53 37 71
Vermilion River 14 121 33 287 53 468 876
Warwick Creek 17 10 29 18 54 32 60
Waskwei Creek 20 13 28 18 53 34 64
Grand Total 19 347 27 481 54 973 1801
a – km value represents both right and left stream bank distances.
Figure 4: Riparian Health Score Summaries for Birch, Campbell, Cotton and Deer Creek Drainages
Birch Creek Drainage
Good Fair Poor
Campbell Creek Drainage
Good Fair Poor
Cotton Creek Drainage
Good Fair Poor
Deer Creek Drainage
Good Fair Poor
Page 21
VERMILION RIVER AB, RIPARIAN INVENTORY AND ASSESSMENT
March 2016 Report No. 1534932 17
Figure 5: Riparian Health Score Summaries for Holden, Irish, Lamont, Marwayne, Mundare and Stretton Creek Drainages
Holden Creek Drainage
Good Fair Poor
Irish Creek Drainage
Good Fair Poor
Lamont Creek Drainage
Good Fair Poor
Marwayne Creek Drainage
Good Fair Poor
Mundare Creek Drainage
Good Fair Poor
Stretton Creek Drainage
Good Fair Poor
Page 22
VERMILION RIVER AB, RIPARIAN INVENTORY AND ASSESSMENT
March 2016 Report No. 1534932 18
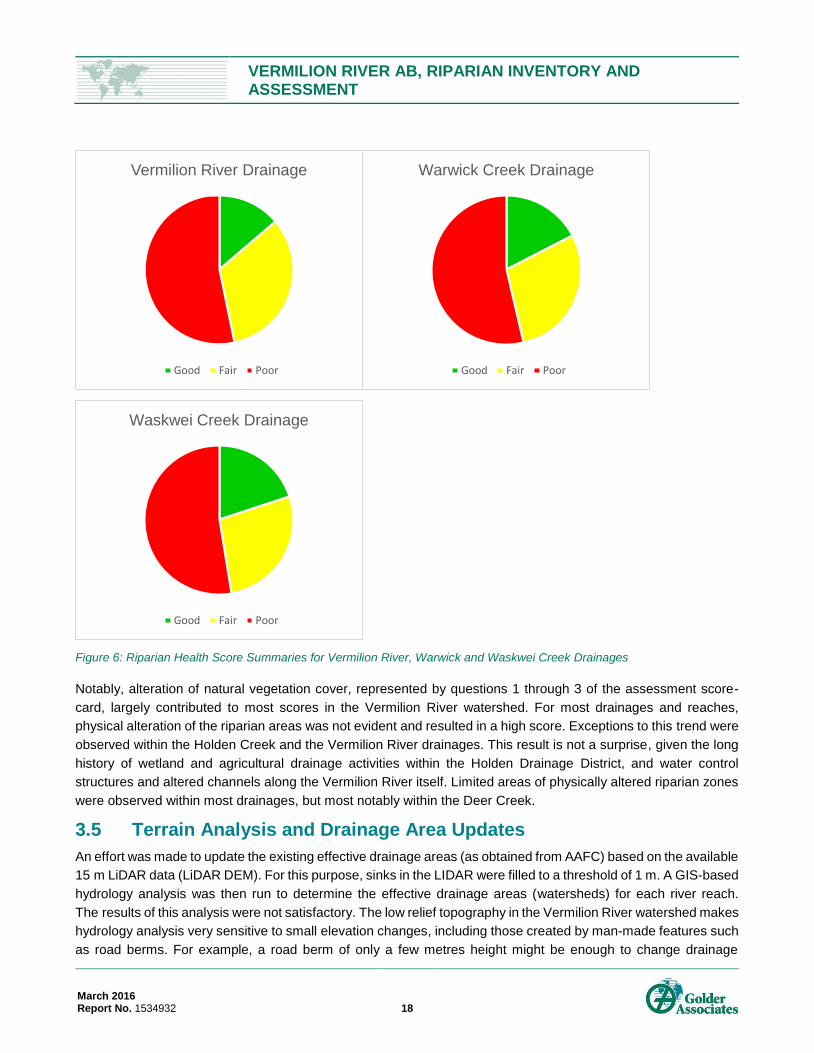
Figure 6: Riparian Health Score Summaries for Vermilion River, Warwick and Waskwei Creek Drainages
Notably, alteration of natural vegetation cover, represented by questions 1 through 3 of the assessment score-
card, largely contributed to most scores in the Vermilion River watershed. For most drainages and reaches,
physical alteration of the riparian areas was not evident and resulted in a high score. Exceptions to this trend were
observed within the Holden Creek and the Vermilion River drainages. This result is not a surprise, given the long
history of wetland and agricultural drainage activities within the Holden Drainage District, and water control
structures and altered channels along the Vermilion River itself. Limited areas of physically altered riparian zones
were observed within most drainages, but most notably within the Deer Creek.
3.5 Terrain Analysis and Drainage Area Updates
An effort was made to update the existing effective drainage areas (as obtained from AAFC) based on the available
15 m LiDAR data (LiDAR DEM). For this purpose, sinks in the LIDAR were filled to a threshold of 1 m. A GIS-based
hydrology analysis was then run to determine the effective drainage areas (watersheds) for each river reach.
The results of this analysis were not satisfactory. The low relief topography in the Vermilion River watershed makes
hydrology analysis very sensitive to small elevation changes, including those created by man-made features such
as road berms. For example, a road berm of only a few metres height might be enough to change drainage
Vermilion River Drainage
Good Fair Poor
Warwick Creek Drainage
Good Fair Poor
Waskwei Creek Drainage
Good Fair Poor
Page 23
VERMILION RIVER AB, RIPARIAN INVENTORY AND ASSESSMENT
March 2016 Report No. 1534932 19
direction. On the ground, many of these features include bridges and culverts that preserve natural drainage
patterns. In other cases, drainage patterns are changed. Because features such as bridges and culverts are not
represented in the LiDAR DEM, the GIS-based hydrology analysis will not provide accurate results without
extensive ground truthing. It was therefore decided to discount the results of the GIS analysis and instead conduct
all further analysis based on the published AAFC effective drainage areas datasets. However, GIS-based
hydrology analysis was used to break down the AAFC effective drainage areas for the individual river reaches. In
these cases, the topography was visually checked for man-made features likely to change drainage patterns.
Where those exist, some manual changes were made by Golder’s hydrologists to take into account their effects
on drainage patterns.
3.6 Pre-Disturbance Vegetation Cover
The Vermilion River watershed is located within the Central Parkland and Dry Mixedwood Natural Subregions of
Alberta (Natural Regions Committee 2006). Urbanization and agricultural practices have resulted in few remaining
areas of contiguous vegetation, which generally occur on sites unsuitable for arable agriculture (or production of
annual crops) (Natural Regions Committee 2006). Grasslands were the first areas used for agriculture, followed
by forested areas with the advent of the bulldozer in 1945 (Bird 1961).
Historically, the Aspen Parkland was a mosaic of two major plant communities: aspen forest and grassland, with
fescue prairie originally found in the transition from grassland to forest (Moss and Campbell 1947; Coupland and
Brayshaw 1953). The interface between the two communities fluctuated due to weather, fire and anthropogenic
factors. Early records indicate that the fluctuation between forest and grassland existed prior to the implementation
of agricultural practices. In the past, the succession from grassland to forest community was prevented by grazing
and browsing by elk and bison (Bird 1961).
Moss (1944) and Moss and Campbell (1947) indicated that the grasslands were dominated by rough fescue
(Festuca hallii). Rough fescue, porcupine grass (Stipa spartea) and June grass (Koeleria cristata) were the most
abundant grassland species, accounting for 53% of the basal cover. The sedges Carex stenophylla,
C.pensylvanica, and C.obtusata made up an additional 25% of the cover (Coupland and Brayshaw 1953). At the
landscape level, native plant populations of remnant grasslands in the Aspen Parkland contributed greatly to
species diversity (Vujnovic 2002).
The forested area of the parkland varied from isolated patches to dense stands of predominantly trembling aspen
(Populus tremuloides). Balsam poplar (Populus balsamifera) and willow communities were also present in areas
with poorly drained soils (Bird 1961).
Historically, wetlands in the Aspen Parkland consisted of small shallow open water areas with emergent vegetation
(sloughs), and wet treeless areas with abundant grasses, cattails and rushes (marshes) (Bird 1961). Many of these
wetlands were likely drained or modified with increased agricultural development.
Fire played a significant role in the vegetation of Aspen Parkland prior to European settlement (Nelson and England
1971). Annual burning led to increased numbers of grass, sedge and forb species (Anderson and Bailey, 1979).
With increased development, remnant native vegetation became isolated, and interspersed within cultivated fields,
grazed pastures, roads, and human settlements, and difficult to burn (Archibold and Wilson 1980; Romo 2003).
As the frequency of fire/burning declined, forested vegetation (aspen) advanced onto adjacent grasslands
(Coupland and Maini 1959; Bailey and Wroe 1974; Scheffler 1976). Fire suppression altered the structure,
Page 24
VERMILION RIVER AB, RIPARIAN INVENTORY AND ASSESSMENT
March 2016 Report No. 1534932 20
function, and composition of grasslands and fescue prairie remnants from their natural (pre-settlement) state
resulting in the reduction of native plant biodiversity (Hobbs and Huenneke 1992).
As development continued, and the demand for roads increased, road allowances altered or removed remnants
of native vegetation and led to the introduction of weeds and exotic species (Bird 1961). The remaining native
vegetation was restricted to patches of aspen-grassland mosaic within cultivated lands. Furthermore, extensive
agricultural activities have resulted in wetland drainage and modification. Following settlement in the Vermilion
watershed, wetland drainage activities in the headwaters were extensive. The Holden Drainage District was
established in 1918 as a local authority to assist farmers in draining low-lying lands to increase agricultural
production. This resulted in the drainage and alteration of numerous wetlands, and associated wetland vegetation,
and the development of drainage infrastructure typically dominated by non-native, agronomic species.
3.7 Landcover Change
The amount of different landcover types present in the Vermilion River watershed changed between 1990 and
2010 (Table 7), driven primarily by an increase in anthropogenic footprint between 1990 and 2010. Landcover type
change in this analysis is primarily associated with agricultural cropland, settlement areas and roads. For each
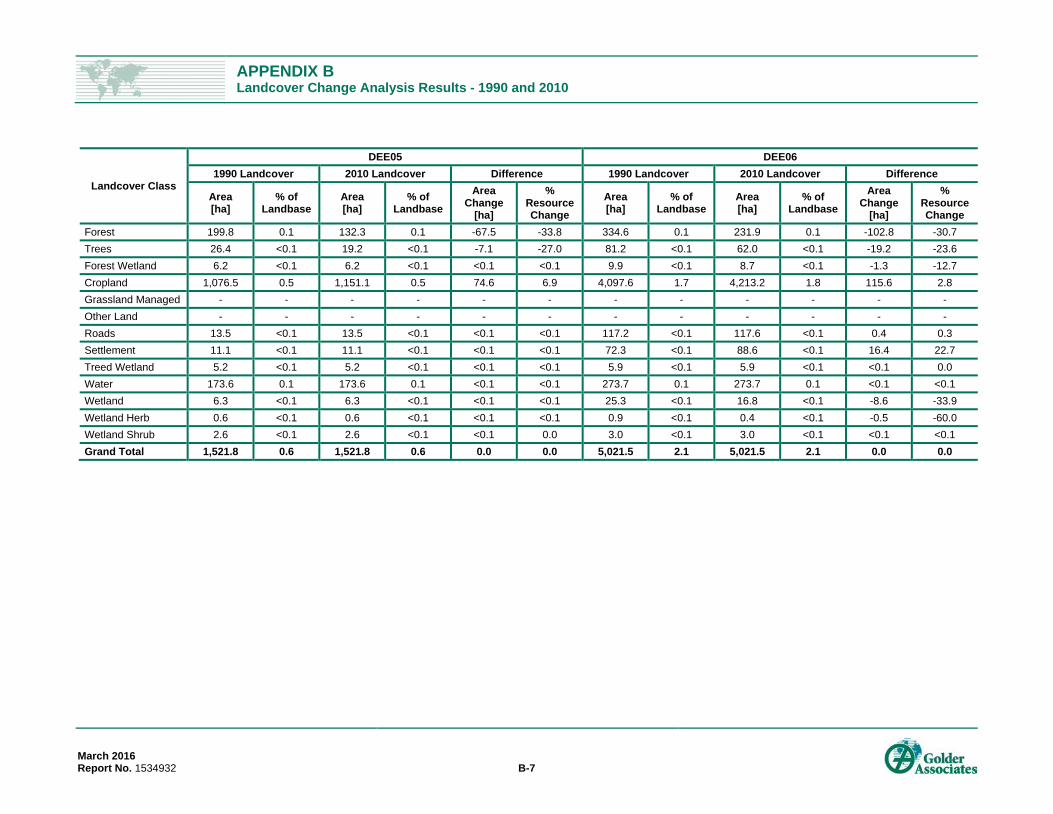
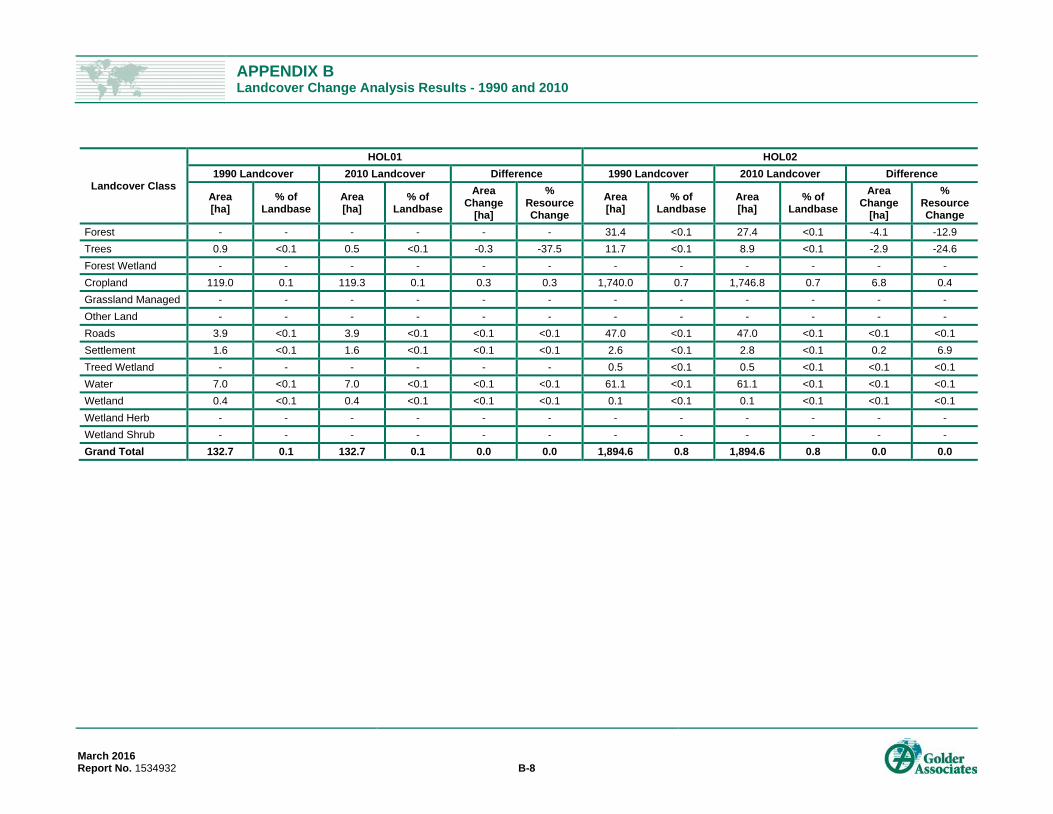
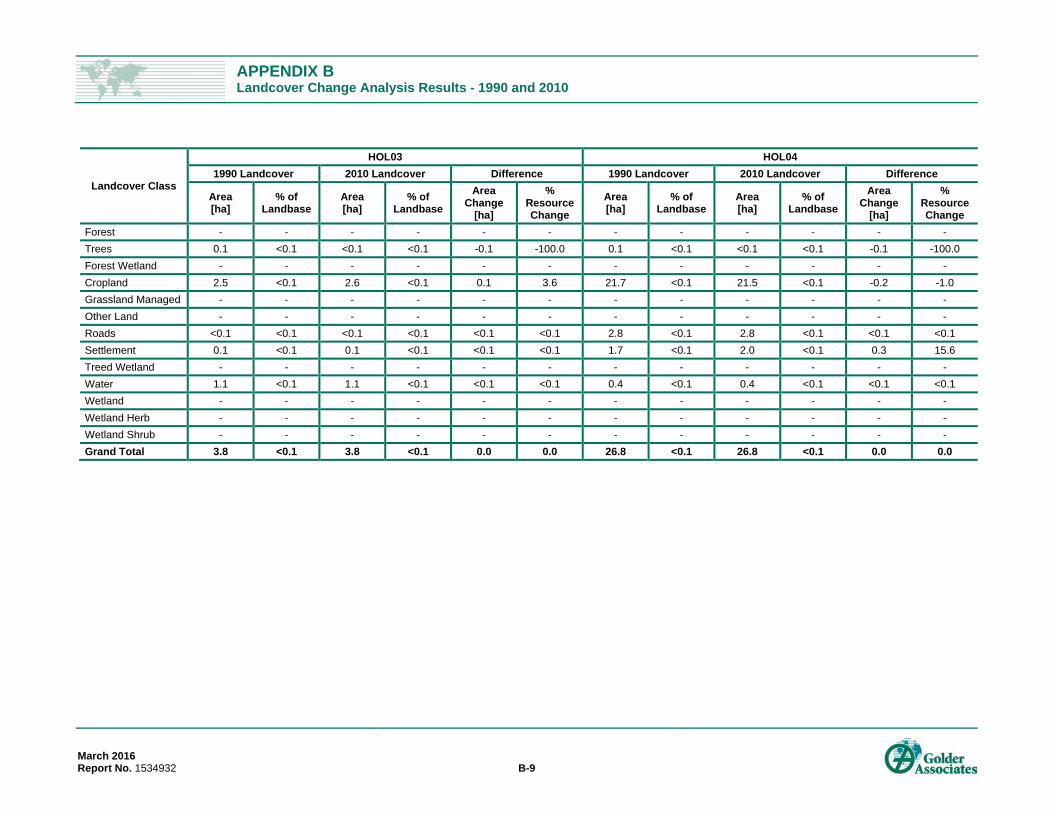
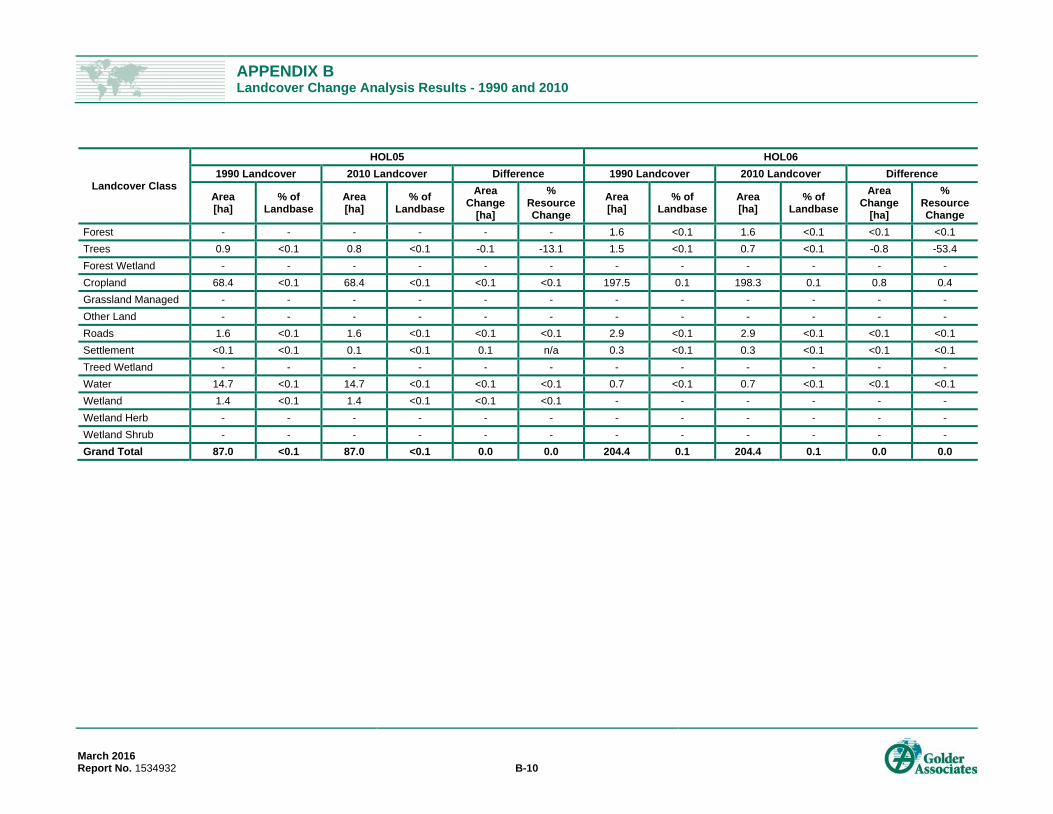
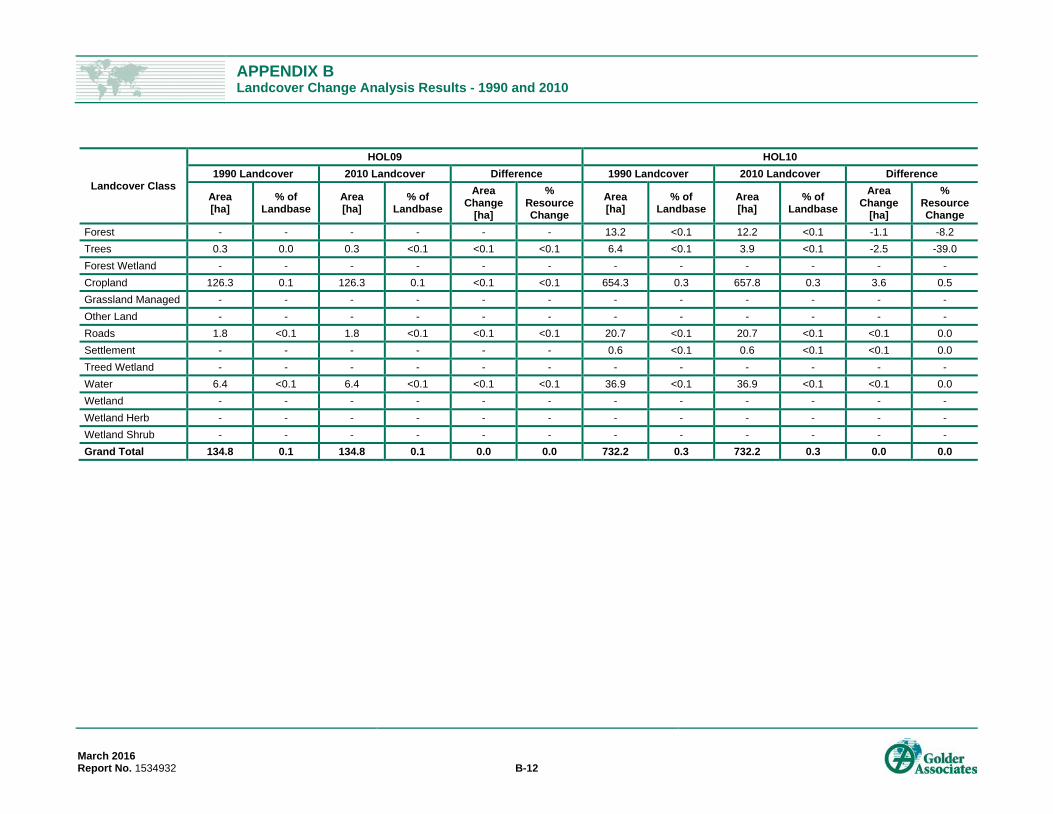
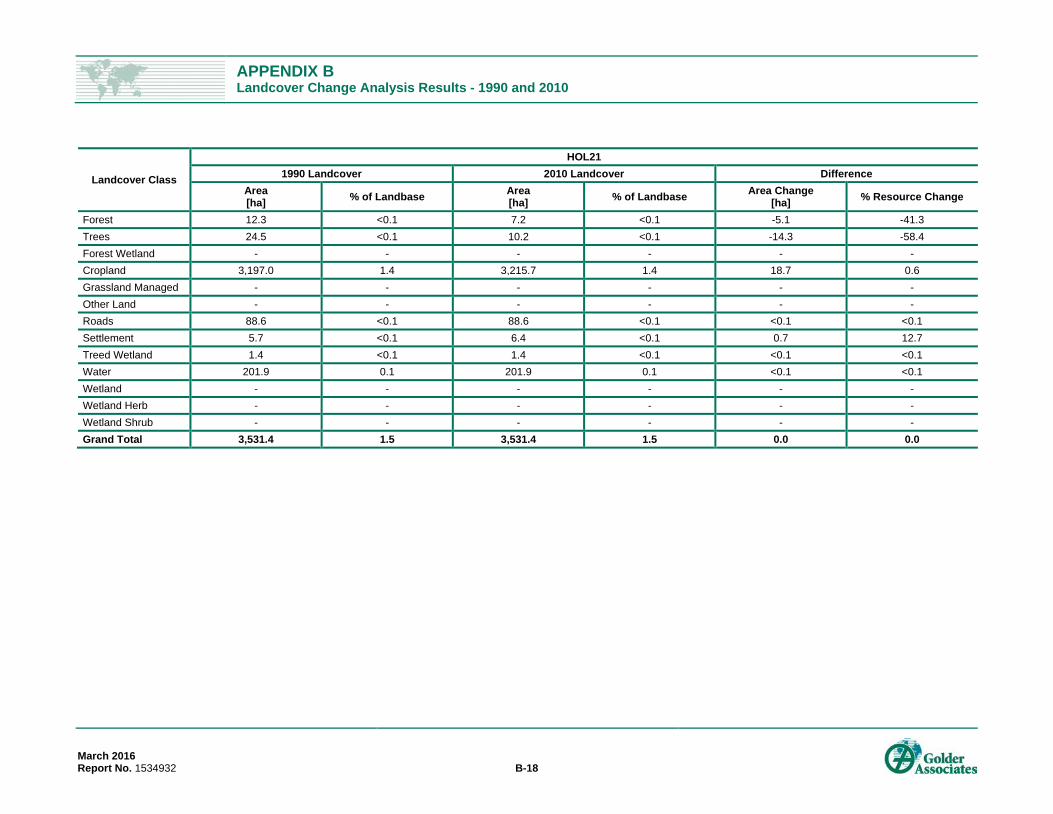
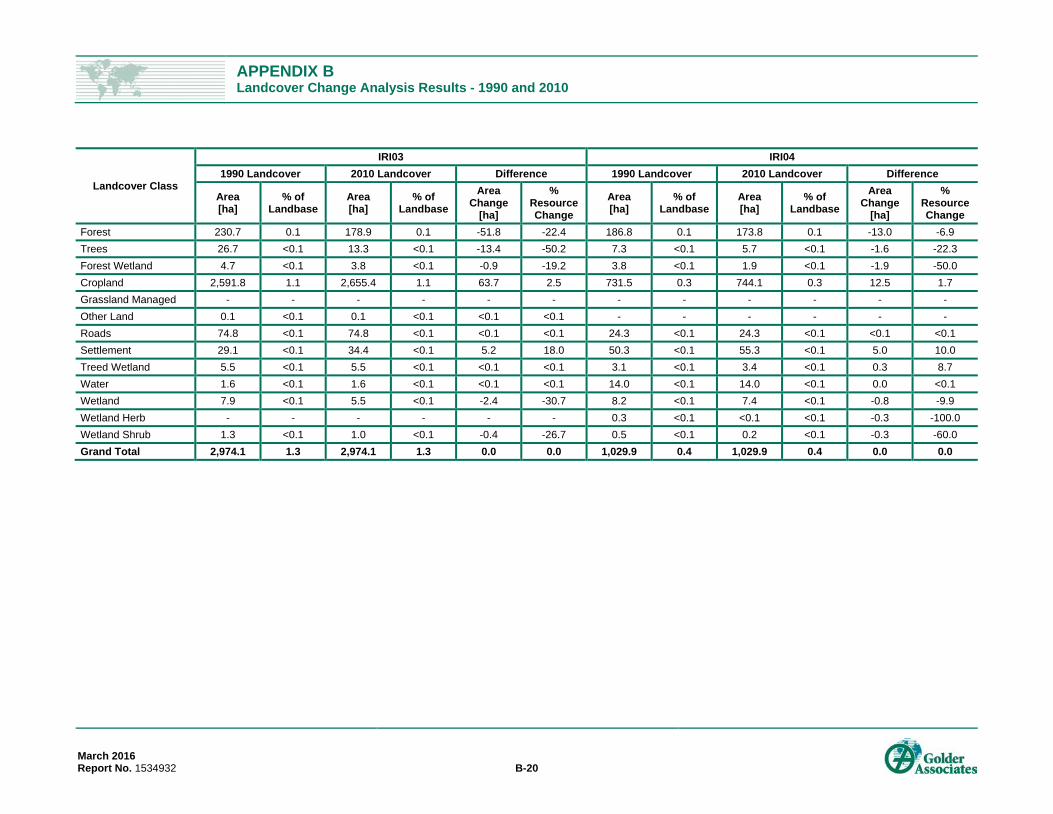
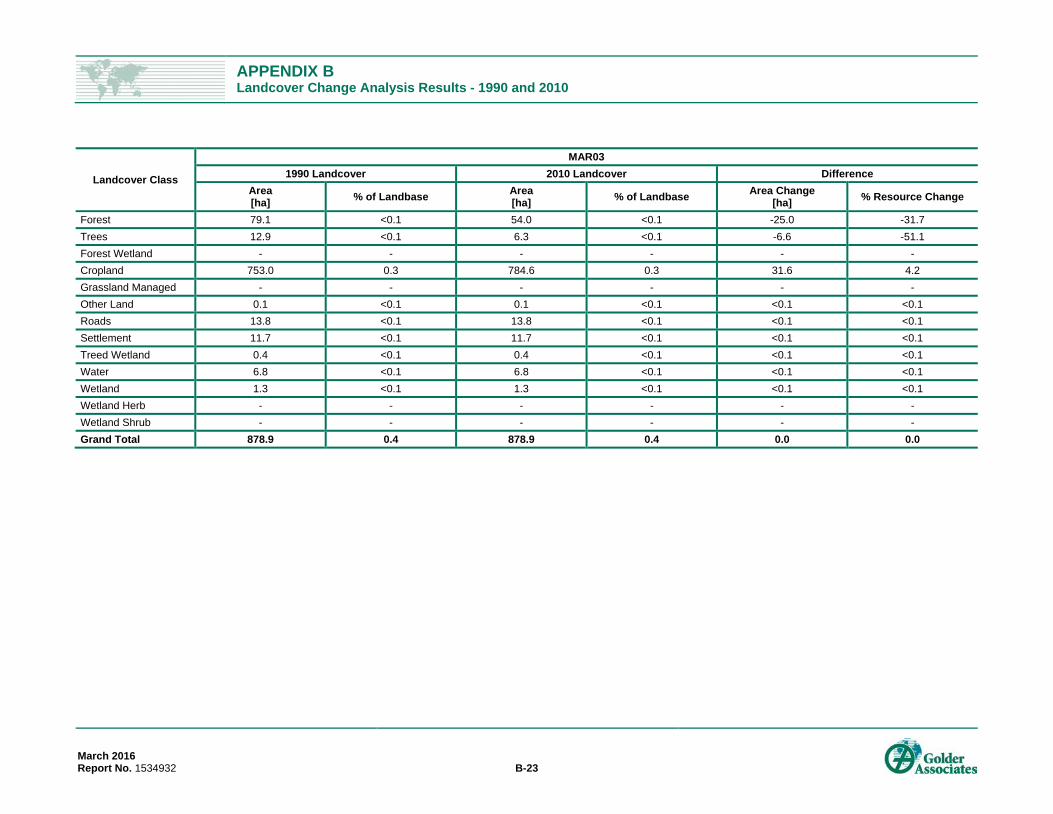
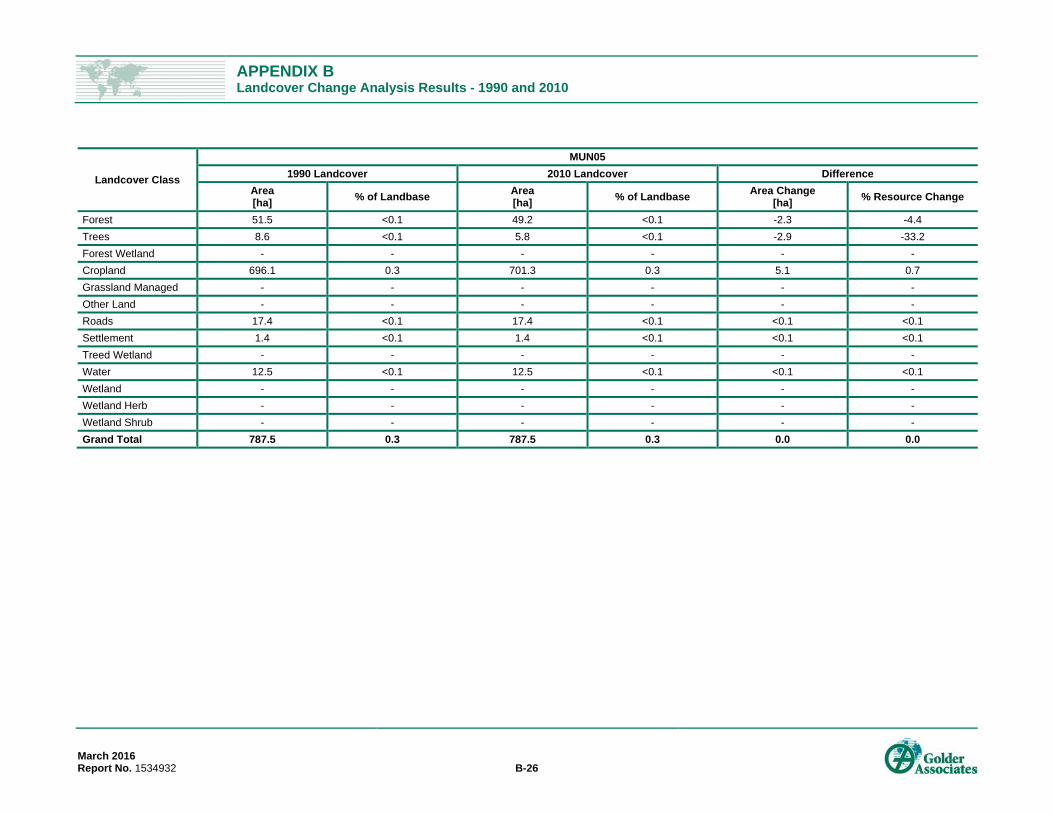
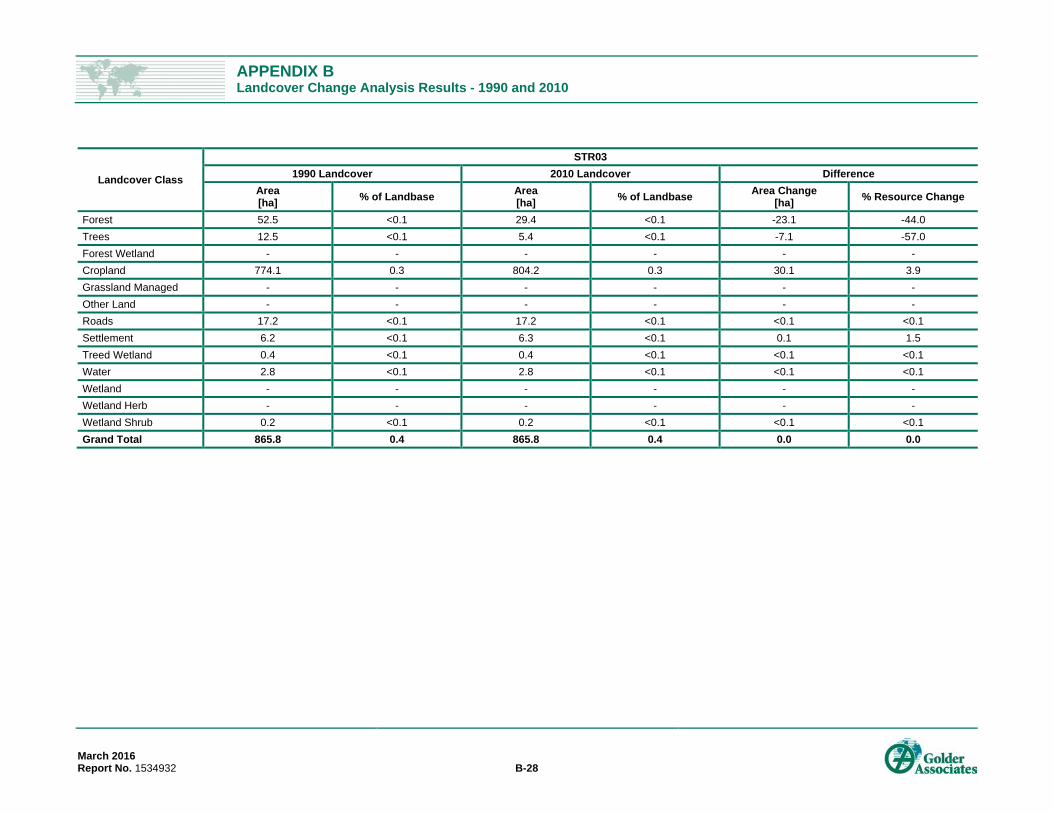
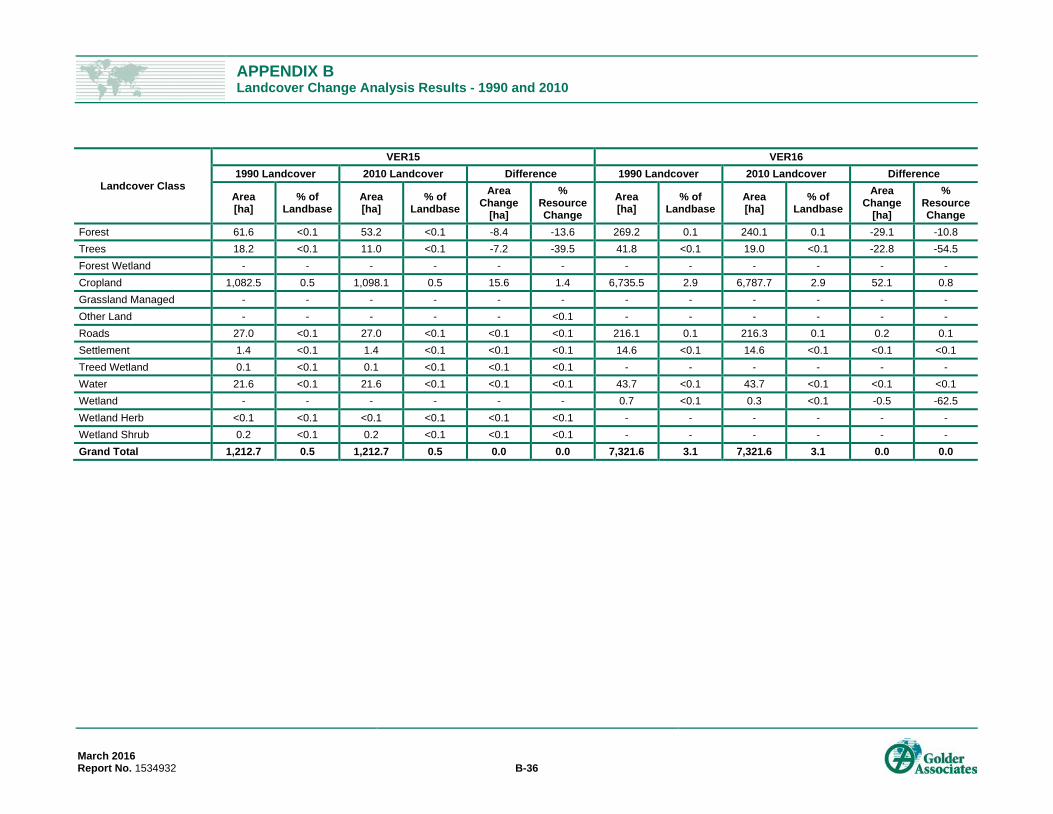
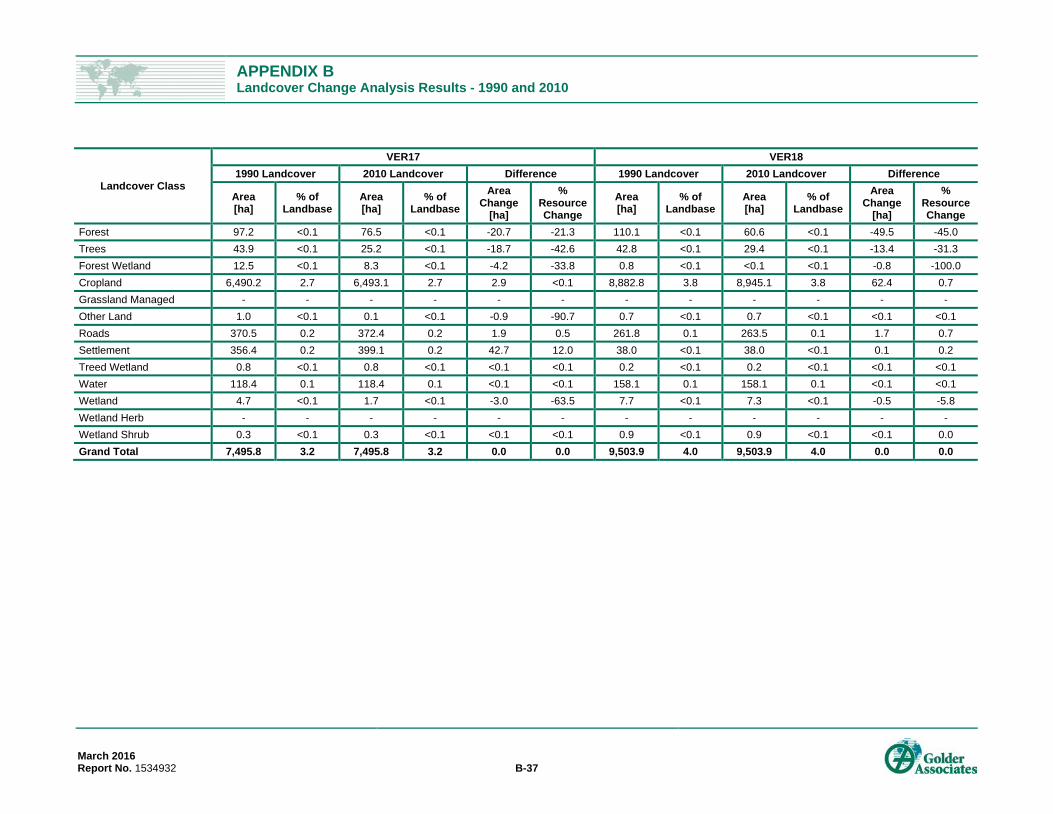
drainage reach, each landcover type area from the 1990 and 2010 datasets is summarized in Appendix B.
Table 7: Landcover Change Analysis within the Vermilion River Watershed between 1990 and 2010.
Landcover Type Landcover Class
1990 Landcover 2010 Landcover Difference
Area (ha)
% of Landbase
Area (ha)
% of Landbase
Area Change (ha)
% Resource Change
Upland Forest 22043 9 17458 7 -4586 -21
Trees 2262 1 1751 <1 -511 -23
Wetland and Open Water
Treed Wetland 296 <1 296 <1 <1 <1
Water 6653 2 6653 3 0 <1
Wetland 1082 <1 934 <1 -149 -14
Wetland Herb 25 <1 16 <1 -9 -35
Wetland Shrub 321 <1 317 <1 -5 -2
Forest Wetland 696 <1 610 <1 -86 -12
Anthropogenic
Cropland 193924 82 198920 84 4996 3
Grassland Managed
18 <1 18 <1
<1 <1
Other Land 11 <1 10 <1 -1 -11
Roads 6336 3 6402 3 66 1
Settlement 2468 1 2753 1 285 12
Grand Total 236136 100 236136 100 n/a n/a
Note: Some numbers are rounded for presentation purposes. Therefore, it may appear that the totals do not equal the sum of the individual values.
n/a = not applicable.
Forest landcover decreased by 4,586 ha (21%), and treed landcover decreased by 511 ha, (23%) between 1990
and 2010 (Table 7), as anthropogenic landcover types increased in the study area. Cropland landcover was the
largest anthropogenic landcover change in area, increasing by 4,496 ha (3%) between 1990 and 2010, followed
by settlement landcover type which increased by 285 ha (12%) (Table 7). The low percent of resource change for
the cropland landcover type, 3%, is due to the Vermilion River watershed being in a highly agricultural landscape,
representing 82% of the watershed in 1990 and 84% in 2010. Road landcover also increased in area 66 ha (1%)
Page 25
VERMILION RIVER AB, RIPARIAN INVENTORY AND ASSESSMENT
March 2016 Report No. 1534932 21
between 1990 and 2010. The greatest decreases in forest and treed landcover types, with corresponding
increases in cropland and settlement landcover types, occurred within the Vermilion River and Deer Creek
drainages (Appendix B).
All wetland landcover types decreased between 1990 and 2010, with a 149 ha (14%) decrease in wetland
landcover and an 86 ha (12%) decrease in forest wetland landcover. The open water landcover type remained the
same between 1990 and 2010, at 6,653 ha. The Vermilion River drainage had the greatest decrease in wetland
landcover types, with lesser decreases in the Birch Creek, Lamont Creek, Deer Creek and Irish Creek drainages
(Appendix B). No change in wetland areas were observed in the Holden Creek, Mundare Creek, Stretton Creek,
Warwick Creek and Waskwei Creek drainages between 1990 and 2010, though no detectable wetland landcover
types were mapped in either the 1990 or 2010 datasets (Appendix B). The actual landcover change maps will be
provided in a standalone document (Attachment 3).
4.0 DISCUSSION AND RECOMMENDATIONS
4.1 Riparian Health
This project has shown that the use of stereo digital aerial imagery interpreted through a GIS system, can be
effective in providing a broad scale riparian assessment at a watershed-level scale. The use of stereo digital
imagery is a deviation from past aerial riparian health assessment methods, which used aerial videography in
conjunction with a lotic riparian assessment scorecard. The use of stereo digital imagery had several advantages
over the use of georeferenced low-level videography, as well as some disadvantages, summarized in Table 8.
Table 8: Advantages and Disadvantages of Using Stereo Digital Imagery Compared to Aerial Videography
Advantages Disadvantages
High resolution of stereo imagery allowing for
interpretation and assessment at a fine scale
Additional uses beyond aerial health assessment
(i.e., vegetation mapping, terrain feature
identification, future change analysis)
Higher cost of stereo digital imagery
More stringent condition requirements for
acquiring the imagery (i.e., cloud cover) limiting
timeline for obtaining data
Unless video imagery is collected at the same
time, lack of accessible graphic representation of
riparian areas for stakeholders and landowners
Both assessment methods would benefit from the addition of a ground-based field survey. Further details around
this recommendation are provided in section 4.2.
Results from the aerial assessment and evaluation of riparian health showed that 19% of the riparian areas within
the Vermilion River watershed are in good condition, 27% are in fair condition and 54% are in poor condition. The
Vermilion River watershed results are similar to those found in the Battle River watershed, where the majority of
the riparian areas assessed were scored as being in ‘poor’ health (Teichreb and Walker 2008). These results are
likely not surprising, given the level of anthropogenic modification of riparian zones, in a largely agricultural setting.
It should be noted that riparian health may have been under estimated for areas that were historically grasslands,
as the riparian health assessment methodology was initially developed for lakeshore assessments (Mills and
Scrimgeour 2004) and modified for riparian assessments (Teichreb and Walker 2008; Alberta Conservation
Association 2009)
Page 26
VERMILION RIVER AB, RIPARIAN INVENTORY AND ASSESSMENT
March 2016 Report No. 1534932 22
4.2 Field Surveys
Ground-based field assessments are recommended to enhance the aerial assessment product and achieve
several objectives, including:
ground-truthing of terrain and vegetation mapping, and vegetation community characterization; and
establishing riparian health baseline conditions.
As noted in section 2.2.3, vegetation classification occurred primarily at the habitat level, following Thompson and
Hanson (2003). Where possible, tree species were identified and used to classify the community type, but
identification of shrub, herbaceous and graminoid vegetation types, based on the dominant species, was not
possible. A ground-truthing field program, where site-specific basic terrain and ecological data collection occurs,
would assist in refining the vegetation classification to a finer, community level. The ground-truthing and collection
of ecological data would also assist in the confirmation and extent of riverine wetlands. Given the late summer
date of aerial imagery collection, particularly in a drier than normal year that was 2015, there is potential that some
wetlands within the floodplain were not captured or the mapped extents may not fully reflect the ground conditions.
A ground-based field assessment program, stratified over various landcover or vegetation types, including
wetlands, across the Vermilion River watershed would greatly enhance the final product and level of accuracy.
An aerial riparian health assessment cannot replace ground-based field assessments, as a number of key metrics
that are evaluated during ground-based assessments cannot be evaluated remotely. The aerial assessment
methodology, however, provides a record of the current status of the riparian areas within an area, and can serve
as a coarse filter to evaluate large areas such as the Vermilion River watershed, to identify priority areas for further
survey. A well-designed ground-based assessment would provide greater precision and measurement of riparian
health being able to assess a more complete set of criteria, but only over relatively small areas. A survey program
for the ground-based collection of riparian health data is recommended in priority areas, either for conservation or
restoration purposes, as well as for verification of aerial assessment criteria. For example, with leaf-on imagery,
the vegetation in tree and woody dominated areas can obscure accurate observations of ground level conditions.
Confirmation of key criteria such as bare soil or physical alterations or evidence of woody species recruitment can
be used to appropriately identify areas for conservation or restoration priority.
The recommended methods for ground-based field assessments would be the Alberta Riparian Habitat
Management Society, Riparian Health Assessment. This methodology has been used in Alberta for over 20 years
and over 5,000 sites have been evaluated using these methods (Clare and Sass 2012). The methodology involves
an assessment of ecological status, community structure, site stability and flood control and water use where
applicable (i.e., large rivers). Similar to the remote assessment, for each criterion, a score is assigned based on
points assigned to designated relative classes. A final score is derived by summing all criterial scores as applicable
out of the total possible for a final percentage. The collection of this data would serve as a baseline against which
future re-measurement could occur. This would allow for an evaluation of conservation and restoration practices,
to determine if current practices are effective, and identify areas where improvements could be made.
4.3 Prioritization of Areas for Restoration and Conservation
Using the final health scores, riparian segments within drainages and reaches can be identified and prioritized for
either restoration or conservation management practices. The scores of ‘fair’ and ‘poor’ riparian health condition
can certainly identify areas for restoration opportunities, while areas of ‘good’ riparian health condition can be
prioritized for conservation.
Page 27
VERMILION RIVER AB, RIPARIAN INVENTORY AND ASSESSMENT
March 2016 Report No. 1534932 23
Based on the results of the aerial riparian health assessment, the following drainages have reach segments with
a predominantly poor riparian health status:
Deer Creek;
Holden Creek;
Lamont Creek;
Marwayne Creek;
Stretton Creek;
Vermilion River;
Warwick Creek; and
Waskwei Creek.
Areas of poor riparian health status could be a priority for restoration, however the associated investment could
be large, particularly in areas where the riparian channels have been extensively physically altered or with
structures on the watercourses, such as the Holden Creek and Vermilion River drainages. Focusing efforts on
areas of ‘fair’ riparian health within these drainages may provide an initial area of focus for restoration purposes.
Of course, consultation, cooperation and buy-in from the landowners on a restoration program would be a key
requirement in order for such a program to be a success. When appropriate, individual reach segments to be
prioritized for restoration can be identified through review of the riparian health figures (Figure 4 to Figure 6) or
through review of the ArcGIS riparian health geodatabase.
Opportunities for conservation appear to primarily be situated within the Birch Creek and Irish Creek drainages.
These drainages have the highest proportions of riparian areas with a ‘good’ health rating. Other drainages that
may have potential for conservation opportunities include the Cotton Creek and Mundare Creek drainages. The
Cotton Creek drainage has 22% of riparian areas with a ‘good’ health rating and 49% with a ‘fair’ health rating,
while the Mundare Creek drainage has 34% of riparian areas with a ‘good’ health rating and 25% with a ‘fair’ health
rating. Additionally, prioritization of the conservation of areas of ‘good’ riparian health status within overall
degraded drainages, such as the Holden Creek and Vermilion River drainages, should also be considered. Given
the highly degraded nature of the riparian zones within these drainages, conservation of areas currently in good
health against additional degradation would be beneficial. Reaches within the Holden Creek drainage currently
with a ‘good’ riparian health rating are predominantly located within HOL2, HOL10, HOL11 and HOL17. Reaches
within the Vermilion River drainage currently with a ‘good’ riparian health rating are distributed throughout the
drainage, with some larger segments located within VER1, VER2, VER4, VER8 and VER11. Again, identifying
landowners who are open and amenable to riparian conservation opportunities will be a key step in implementing
conservation management practices. When appropriate, individual reach segments to be prioritized for
conservation can be identified through review of the riparian health figures (Figure 4 to Figure 6) or through review
of the ArcGIS riparian health geodatabase.
4.4 Additional Tributaries to be Mapped
The mapping completed for this project includes the Vermilion River and many of its major tributaries. There are
a number of additional tributaries that were not included in this project but may be considered in the future.
Page 28
VERMILION RIVER AB, RIPARIAN INVENTORY AND ASSESSMENT
March 2016 Report No. 1534932 24
5.0 CONCLUSION
This report, in conjunction with the delivery of ArcGIS spatial geodatabases delivered separately, presents the
results of an aerial assessment of riparian areas of the Vermilion River, and a number of its major tributaries.
In particular, this study delineated the lotic riparian areas and floodplains of the Vermilion River and its major
tributaries, assessed the condition the mapped riparian areas in the watershed using a rapid method, identified
intact areas for conservation and/or protection and identified and prioritized degraded areas for restoration.
The Vermilion River watershed has been extensively altered over the last 100 years. There has been extensive
drainage of wetlands to allow the expansion of agriculture, transportation and municipal and industrial development
within the watershed. Some of the programs have been authorized by licenses, but other drainage projects have
proceeded without proper authorization. The cumulative impact of drainage in the upper watershed may have
increased the frequency and intensity of flooding in the middle reaches of the Vermilion River. Drainage may have
also reduced the natural storage of water, thereby reducing the duration of water flow. Physical alteration of the
Vermilion Lakes and the Vermilion River at Vegreville, and various water management structures, were
constructed as flood management tools to reduce the impact of major summer rainfall events in the Vermilion
Lakes basin. Substantial change in the vegetation types and extent from pre-European settlement were also
summarized. The results of a landcover change analysis between 1990 and 2010 indicate that land-use change
is still ongoing, and is driven primarily by an increase in anthropogenic footprint and a corresponding decrease in
forested and wetland landcover types.
This project has shown that the use of stereo digital aerial imagery, interpreted through a GIS system, can be
effective in providing a broad scale riparian assessment at a watershed-level scale. The use of stereo digital
imagery is a variation from past aerial riparian health assessment methods, which used aerial videography in
conjunction with a lotic riparian assessment scorecard. Results from the aerial assessment and evaluation of
riparian health showed that only 19% of the riparian areas within the Vermilion River watershed are in good
condition, while 27% are in fair condition and 54% are in poor condition. The Vermilion River watershed results
are similar to those found in the Battle River watershed, where the majority of the riparian areas assessed were
scored as being in ‘poor’ health (Teichreb and Walker 2008). These results are likely not surprising, given the level
of anthropogenic modification of riparian zones, in a largely agricultural setting.
The results of this aerial riparian health assessment cannot replace ground-based field assessments. The aerial
assessment methodology, however, provides a record of the current status of the riparian areas within an area,
and can serve as a coarse-filter to evaluate large areas such as the Vermilion River watershed, to identify priority
areas for further survey. A field survey program for the ground-based collection of riparian health data is
recommended in priority areas, either for conservation or restoration purposes, as well as for verification of aerial
assessment criteria and vegetation classification. The recommended methods for ground-based assessments
would follow the Alberta Riparian Habitat Management Society, Riparian Health Assessment which has been
extensively used in Alberta over 20 years.
Using the final health scores, preliminary drainages and reaches were identified and prioritized for either
restoration or conservation management practices. Scores of ‘fair’ and ‘poor’ riparian health condition can identify
areas for restoration opportunities, while areas of ‘good’ riparian health condition can be prioritized for
conservation. Identifying landowners who are open and amenable to riparian conservation opportunities will be a
key step in the process of implementing restoration and conservation practices. When appropriate, individual reach
segments to be prioritized for conservation or restoration can be identified through review of the ArcGIS riparian
health geodatabase.
Page 29
VERMILION RIVER AB, RIPARIAN INVENTORY AND ASSESSMENT
March 2016 Report No. 1534932 25
LITERATURE CITED
Alberta Conservation Association. 2009. Aerial videography assessment for selected reaches of the South Heart
and West Prairie Rivers, Alberta. 26 pp.
Anderson, H.G., and A.W. Bailey. 1979. Effects of annual burning on grassland in the Aspen Parkland of east-
central Alberta. Can. J. Bot. 58: 985-996.
Archibold, O. W. and M.R. Wilson. 1980. The natural vegetation of Saskatchewan prior to agricultural settlement.
Can. J. Bot. 58:2031-2042.
Bailey, A.W. and R.A. Wroe. 1974. Aspen invasion in a portion of the Alberta Parklands. J. Range Manage. 27:263-
266.
Bird, R.D. 1961. Ecology of the Aspen Parkland of Western Canada in Relation to Land Use. Canada Department
of Agriculture – Research Branch, Ottawa.
Clare, S. and G. Sass. 2012. Riparian Lands in Alberta: Current State, conservation tools, and management
approaches. Edmonton: Report prepared for Riparian Land Conservation & Management Team, Alberta Water
Council.
Coupland, R. T., and T. C. Brayshaw. 1953. The fescue grassland in Saskatchewan. Ecology 34: 386-405.
Coupland, R. T., and J. S. Maini. 1959. Woodland invasion of western Canadian grasslands. IX Int. Bot. Congr.
Proc. 11, IIA, Montreal, P.Q.
Fitch, L., B.W. Adams, and G. Hale, Eds. 2001. Riparian health assessment for streams and small rivers – field
workbook. Lethbridge, AB: Cows and Fish program. 86 pp.
Golder Associates Ltd. (Golder). 2009. Vermilion River Water Supply and Demand Study. Report submitted to
Edmonton: North Saskatchewan Watershed Alliance.
Hobbs, R.J. and L.F. Huenneke. 1992. Disturbance, diversity and invasion: Implications for conservation. Conserv.
Biol. 6:324-337.
Mills, B. and G. Scrimgeour. 2004. The Effectiveness of Aerial Videography to Characterize Lakeshore Condition.
Data Report (D-2005-017) produced by Alberta Conservation Association, Edmonton, Canada. 52 pp + App.
Moss, E. H. 1944. The prairie and associated vegetation of southwestern Alberta. Canadian J. Res., C, 22:11-31.
Moss, E. H., and J. A. Campbell. 1947. The fescue grassland of Alberta. Canadian J. Res., C, 25:209-227.
NSWA (North Saskatchewan Watershed Alliance). 2012. Vermilion River Watershed Management Plan. The North
Saskatchewan Watershed Alliance Society, Edmonton, Alberta. Available at: http://nswa.ab.ca
NRC (Natural Regions Committee). 2006. Natural Regions and Subregions of Alberta. Compiled by D.J. Downing
and W.W. Pettapiece. Government of Alberta. Pub. No. T/852.
USDA NRCS (United States Department of Agriculture, Natural Resources Conservation Service). 2008.
Hydrogeomorphic Wetland Classification System: An Overview and Modification to Better Meet the Needs of
the Natural Resources Conservation Service. Technical Note No. 190-8-76, February 2008.
Page 30
VERMILION RIVER AB, RIPARIAN INVENTORY AND ASSESSMENT
March 2016 Report No. 1534932 26
Nelson, J.G. and R.E. England. 1971. Some comments on the causes and effects of fire in the northern grasslands
area of Canada and the nearby United States, ca.1750-1900. Can. Geogr. 15:295-306.
Romo, J.T. 2003. Reintroducing fire for conservation of Fescue Prairie Association remnants in the northern Great
Plains. Can. Field-Natur. 117:89-99.
Scheffler, E.J. 1976. Aspen forest vegetation in a portion of the east-central Alberta parklands. M.Sc. thesis,
University of Alberta. Edmonton, AB.
Teichreb, C. and G. Walker. 2008. Aerial videographic health and integrity assessment of the riparian management
area for selected reaches of the Battle River. Alberta Environment Technical Report. 23pp.
Thompson, William H. and Paul L. Hansen. 2003. Classification and management of riparian and wetland sites of
Alberta’s Parkland Natural Region and Dry Mixedwood Natural Subregion. Bitterroot Restoration, Inc.
Prepared for the Alberta Riparian Habitat Management Program- Cows and Fish, Lethbridge, Alberta.
340 pages.
VRORSC (Vermilion River Operations Review Stakeholder Committee). 2000. Recommendation Report on the
Future Operation of the Vermilion River Water System. December 2000. Available at:
https://www.nswa.ab.ca/sites/default/files/documents/VROAC%20Recommendations%20Report%20-
%20Dec2000.pdf
Vujnovic, K., R. Wein and M. Dale. 2002. Predicting plant species diversity in response to disturbance magnitude
in grassland remnants of central Alberta. Canadian Journal of Botany [serial online]. May 2002; 80(5):504-
511.
Page 31
VERMILION RIVER AB, RIPARIAN INVENTORY AND ASSESSMENT
March 2016 Report No. 1534932
Report Signature Page
GOLDER ASSOCIATES LTD.
Valerie Coenen, B.Sc. Nathan Schmidt, Ph.D., P.Eng.
Senior Terrestrial Ecologist Principal, Senior Water Resources Engineer
Anne Sommerville PhD. M.Sc. Dennis O’Leary, B.A.
Terrain Scientist Senior Terrain Scientist
Golder, Golder Associates and the GA globe design are trademarks of Golder Associates Corporation.
https://capws.golder.com/sites/p1534932vermillionriparianproject/multiuser report/1534932_vermilion_final_20160331.docx
Page 32
VERMILION RIVER AB, RIPARIAN INVENTORY AND ASSESSMENT
March 2016 Report No. 1534932
APPENDIX A Riparian Health Information by River Reach
Page 33
APPENDIX A Riparian Health Data
March 2016 Report No. 1532934 A-1
Name Reach Segment Start(a) Segment End(a) Length
[m] % Vegetation
Cover(b) % Woody Species Cover(b)
Evidence of Recruitment (Y/N) (b)
% Area of Human Caused Vegetation Cover Alteration(b)
% Area of Human Caused Bare Ground / Physical Alteration(b)
Overall Bank Stability? (b)
Adjacent Vegetation Structural Complexity(b) Score Possible
Score %
Score Health
Category Easting Northing Easting Northing
Birch Creek BIR02 461719 5926031 462122 5923354 2,765.10 >90% >35% Yes <5% <5% Stable Moderately Diverse/Complex 20 22 90.91 Good Birch Creek BIR02 461731 5926038 462136 5923361 2,765.88 >90% <15% No >15% <5% Stable Not Diverse/Complex 10 22 45.45 PoorBirch Creek BIR01 484279 5914538 484267 5914828 581.36 >90% <15% No <5% <5% Stable Not Diverse/Complex 14 22 63.64 FairBirch Creek BIR01 484050 5914477 484256 5914841 1,004.62 >90% <15% No <5% <5% Stable Not Diverse/Complex 14 22 63.64 FairBirch Creek BIR01 484267 5914136 484050 5914477 507.06 >90% >35% Yes <5% <5% Stable Diverse/Complex 22 22 100 GoodBirch Creek BIR01 484094 5914463 484279 5914538 371.73 >90% >35% Yes <5% <5% Stable Moderately Diverse/Complex 20 22 90.91 GoodBirch Creek BIR01 484196 5913966 484267 5914136 274.84 >90% <15% No 5-15% <5% Stable Not Diverse/Complex 12 22 54.55 FairBirch Creek BIR01 484303 5913714 484094 5914463 1,199.93 >90% <15% No >15% <5% Stable Not Diverse/Complex 10 22 45.45 PoorBirch Creek BIR01 483727 5913388 484303 5913714 850.97 >90% >35% Yes <5% <5% Stable Diverse/Complex 22 22 100 GoodBirch Creek BIR01 483895 5913219 483727 5913388 346.19 >90% <15% No 5-15% <5% Stable Not Diverse/Complex 12 22 54.55 FairBirch Creek BIR01 483661 5913021 483895 5913219 365.67 >90% >35% Yes <5% <5% Stable Diverse/Complex 22 22 100 GoodBirch Creek BIR01 483780 5913443 484185 5913586 593.63 >90% <15% Yes >15% <5% Stable Not Diverse/Complex 12 22 54.55 FairBirch Creek BIR01 483647 5913022 483780 5913443 793.29 >90% >35% Yes <5% <5% Stable Diverse/Complex 22 22 100 GoodBirch Creek BIR01 484185 5913586 484196 5913966 559.60 >90% >35% Yes <5% <5% Stable Diverse/Complex 22 22 100 GoodBirch Creek BIR01 483843 5910652 483174 5911095 1,221.70 >90% >35% Yes 5-15% <5% Stable Moderately Diverse/Complex 18 22 81.82 Good Birch Creek BIR01 483028 5911681 483660 5913014 2,712.80 >90% >35% Yes <5% <5% Stable Moderately Diverse/Complex 20 22 90.91 Good Birch Creek BIR01 483685 5909695 483540 5910103 855.89 >90% <15% No >15% <5% Stable Not Diverse/Complex 10 22 45.45 PoorBirch Creek BIR01 483542 5909665 483685 5909695 189.11 >90% >35% Yes <5% <5% Stable Diverse/Complex 22 22 100 GoodBirch Creek BIR01 483528 5909665 483658 5909944 714.80 >90% 15-35% No >15% <5% Stable Not Diverse/Complex 11 22 50 FairBirch Creek BIR01 483658 5909944 483480 5910017 212.74 >90% >35% Yes <5% <5% Stable Moderately Diverse/Complex 20 22 90.91 GoodBirch Creek BIR01 483540 5910103 483869 5910692 1,067.51 >90% 15-35% No <5% <5% Stable Moderately Diverse/Complex 17 22 77.27 Fair Birch Creek BIR01 483869 5910692 483028 5911681 2,385.83 >90% <15% No >15% <5% Stable Not Diverse/Complex 10 22 45.45 PoorBirch Creek BIR01 483358 5912723 483645 5913012 549.63 >90% <15% No >15% <5% Stable Not Diverse/Complex 10 22 45.45 PoorBirch Creek BIR01 483397 5912449 483358 5912723 301.07 >90% >35% Yes <5% <5% Stable Moderately Diverse/Complex 20 22 90.91 GoodBirch Creek BIR01 483132 5912316 483397 5912449 647.00 >90% <15% No >15% <5% Stable Not Diverse/Complex 10 22 45.45 PoorBirch Creek BIR01 483263 5912145 483132 5912316 280.13 >90% >35% Yes <5% <5% Stable Diverse/Complex 22 22 100 GoodBirch Creek BIR01 482883 5911596 483263 5912145 1,182.59 >90% <15% No >15% <5% Stable Not Diverse/Complex 10 22 45.45 PoorBirch Creek BIR01 483248 5911333 482883 5911596 652.17 >90% >35% Yes <5% <5% Stable Diverse/Complex 22 22 100 GoodBirch Creek BIR01 483174 5911095 483248 5911333 314.15 >90% <15% No >15% <5% Stable Not Diverse/Complex 10 22 45.45 PoorBirch Creek BIR01 483480 5910017 483843 5910652 1,145.12 >90% 15-35% Yes <5% <5% Stable Moderately Diverse/Complex 19 22 86.36 Good Birch Creek BIR01 483472 5909474 483526 5909657 200.33 >90% >35% Yes <5% <5% Stable Diverse/Complex 22 22 100 GoodBirch Creek BIR01 483473 5909460 483540 5909657 221.99 >90% >35% Yes <5% <5% Stable Diverse/Complex 22 22 100 GoodBirch Creek BIR01 482565 5909374 483467 5909474 1,682.57 >90% <15% No >15% <5% Stable Not Diverse/Complex 10 22 45.45 PoorBirch Creek BIR01 481846 5908796 483467 5909460 3,150.31 >90% 15-35% Yes <5% <5% Stable Diverse/Complex 21 22 95.45 GoodBirch Creek BIR01 482053 5908974 482158 5909239 431.90 >90% <15% No >15% <5% Stable Not Diverse/Complex 10 22 45.45 PoorBirch Creek BIR01 482158 5909239 482565 5909374 621.43 >90% <15% No <5% <5% Stable Moderately Diverse/Complex 16 22 72.73 FairBirch Creek BIR01 481847 5908810 482053 5908974 406.03 >90% 15-35% No <5% <5% Stable Diverse/Complex 19 22 86.36 GoodBirch Creek BIR01 480855 5908125 481838 5908809 1,518.51 >90% >35% No <5% <5% Stable Moderately Diverse/Complex 18 22 81.82 Good Birch Creek BIR01 480643 5908065 481838 5908795 1,808.09 >90% >35% No <5% <5% Stable Moderately Diverse/Complex 18 22 81.82 Good Birch Creek BIR01 480225 5908313 480643 5908065 809.47 >90% <15% No <5% >15% Stable Not Diverse/Complex 10 22 45.45 PoorBirch Creek BIR01 480224 5908327 480855 5908125 1,091.80 >90% <15% No 5-15% 5-15% Stable Not Diverse/Complex 10 22 45.45 PoorBirch Creek BIR02 479631 5908348 480024 5908440 429.36 >90% <15% No >15% <5% Stable Not Diverse/Complex 10 22 45.45 PoorBirch Creek BIR02 479637 5908365 480032 5908452 430.69 >90% <15% No >15% <5% Stable Not Diverse/Complex 10 22 45.45 PoorBirch Creek BIR02 477965 5908358 479637 5908365 1,829.21 >90% <15% No >15% <5% Stable Not Diverse/Complex 10 22 45.45 PoorBirch Creek BIR02 478971 5908232 479631 5908348 683.23 >90% <15% No 5-15% <5% Stable Moderately Diverse/Complex 14 22 63.64 Fair
Page 34
APPENDIX A Riparian Health Data
March 2016 Report No. 1532934 A-2
Name Reach Segment Start(a) Segment End(a) Length
[m] % Vegetation
Cover(b) % Woody Species Cover(b)
Evidence of Recruitment (Y/N) (b)
% Area of Human Caused Vegetation Cover Alteration(b)
% Area of Human Caused Bare Ground / Physical Alteration(b)
Overall Bank Stability? (b)
Adjacent Vegetation Structural Complexity(b) Score Possible
Score %
Score Health
Category Easting Northing Easting Northing
Birch Creek BIR02 476172 5907523 476991 5907756 1,113.00 >90% <15% No 5-15% <5% Stable Not Diverse/Complex 12 22 54.55 FairBirch Creek BIR02 476171 5907509 477103 5907850 1,295.05 >90% 15-35% No 5-15% <5% Stable Not Diverse/Complex 13 22 59.09 FairBirch Creek BIR02 477103 5907850 477854 5908266 872.69 >90% >35% No <5% <5% Stable Moderately Diverse/Complex 18 22 81.82 GoodBirch Creek BIR02 476991 5907756 477965 5908358 1,206.30 >90% >35% No <5% <5% Stable Moderately Diverse/Complex 18 22 81.82 Good Birch Creek BIR02 477854 5908266 478539 5908392 795.06 >90% <15% No >15% <5% Stable Not Diverse/Complex 10 22 45.45 PoorBirch Creek BIR02 478539 5908392 478971 5908232 493.23 >90% 15-35% No <5% <5% Stable Moderately Diverse/Complex 17 22 77.27 Fair Birch Creek BIR02 475356 5908111 476167 5907537 1,434.66 >90% 15-35% No >15% <5% Stable Not Diverse/Complex 11 22 50 FairBirch Creek BIR02 475355 5908097 476167 5907510 1,446.02 >90% 15-35% No >15% <5% Stable Not Diverse/Complex 11 22 50 FairBirch Creek BIR02 471929 5909290 474092 5908779 2,454.79 >90% 15-35% Yes <5% <5% Stable Diverse/Complex 21 22 95.45 GoodBirch Creek BIR02 471924 5909277 474200 5908677 2,655.01 >90% 15-35% Yes <5% <5% Stable Moderately Diverse/Complex 19 22 86.36 Good Birch Creek BIR02 471373 5909725 471495 5909566 203.06 >90% <15% No >15% <5% Stable Not Diverse/Complex 10 22 45.45 PoorBirch Creek BIR02 471495 5909566 471661 5909444 211.42 >90% >35% Yes <5% <5% Stable Diverse/Complex 22 22 100 GoodBirch Creek BIR02 471387 5909725 471682 5909445 417.75 >90% >35% Yes <5% <5% Stable Diverse/Complex 22 22 100 GoodBirch Creek BIR02 471682 5909445 471929 5909290 293.20 >90% <15% No >15% <5% Stable Not Diverse/Complex 10 22 45.45 PoorBirch Creek BIR02 471661 5909444 471924 5909277 313.27 >90% <15% No >15% <5% Stable Not Diverse/Complex 10 22 45.45 PoorBirch Creek BIR02 474092 5908779 475346 5908110 1,993.31 >90% <15% No >15% <5% Stable Not Diverse/Complex 10 22 45.45 PoorBirch Creek BIR02 474200 5908677 475347 5908096 1,829.92 >90% 15-35% Yes 5-15% <5% Stable Moderately Diverse/Complex 17 22 77.27 Fair Birch Creek BIR02 470344 5910752 471387 5909732 1,487.31 >90% 15-35% Yes <5% <5% Stable Moderately Diverse/Complex 19 22 86.36 Good Birch Creek BIR02 470335 5910741 471373 5909733 1,474.50 >90% 15-35% Yes <5% <5% Stable Moderately Diverse/Complex 19 22 86.36 Good Birch Creek BIR02 467974 5916430 470338 5910758 6,804.53 >90% >35% Yes <5% <5% Stable Diverse/Complex 22 22 100 GoodBirch Creek BIR02 467959 5916431 470329 5910747 6,820.83 >90% >35% Yes <5% <5% Stable Diverse/Complex 22 22 100 GoodBirch Creek BIR02 466312 5918390 467972 5916438 2,677.22 >90% >35% Yes <5% <5% Stable Diverse/Complex 22 22 100 GoodBirch Creek BIR02 466144 5918972 467958 5916439 3,284.51 >90% >35% Yes <5% <5% Stable Diverse/Complex 22 22 100 GoodBirch Creek BIR02 465620 5922227 466065 5919441 3,030.74 >90% >35% Yes <5% <5% Stable Diverse/Complex 22 22 100 GoodBirch Creek BIR02 465974 5921053 466079 5919442 1,704.43 >90% 15-35% No <5% <5% Stable Moderately Diverse/Complex 17 22 77.27 Fair Birch Creek BIR02 463426 5923238 465067 5922818 1,740.47 >90% 15-35% Yes <5% <5% Stable Diverse/Complex 21 22 95.45 GoodBirch Creek BIR02 463426 5923223 465076 5922804 1,749.50 >90% 15-35% Yes <5% <5% Stable Diverse/Complex 21 22 95.45 GoodBirch Creek BIR02 462136 5923361 463417 5923237 1,436.67 >90% 15-35% No >15% <5% Stable Not Diverse/Complex 11 22 50 FairBirch Creek BIR02 461431 5926980 461728 5926045 1,021.40 >90% 15-35% No >15% <5% Stable Not Diverse/Complex 11 22 50 FairBirch Creek BIR02 461417 5926976 461716 5926037 1,025.71 >90% >35% Yes >15% <5% Stable Not Diverse/Complex 14 22 63.64 FairBirch Creek BIR02 462646 5923126 463417 5923223 784.10 >90% <15% No <5% <5% Stable Not Diverse/Complex 14 22 63.64 FairBirch Creek BIR02 462122 5923354 462646 5923126 668.70 >90% <15% No <5% <5% Stable Moderately Diverse/Complex 16 22 72.73 FairBirch Creek BIR02 465076 5922804 465620 5922227 829.64 >90% >35% No >15% <5% Stable Not Diverse/Complex 12 22 54.55 FairBirch Creek BIR02 465076 5922818 465637 5922179 899.98 >90% 15-35% No >15% <5% Stable Not Diverse/Complex 11 22 50 FairBirch Creek BIR02 465637 5922179 465974 5921053 1,275.61 >90% 15-35% Yes <5% <5% Stable Diverse/Complex 21 22 95.45 GoodBirch Creek BIR02 466065 5919436 466144 5918972 479.61 >90% >35% Yes 5-15% <5% Stable Moderately Diverse/Complex 18 22 81.82 Good Birch Creek BIR02 466079 5919436 466312 5918390 1,088.48 >90% <15% No >15% <5% Stable Not Diverse/Complex 10 22 45.45 PoorBirch Creek BIR01 480032 5908452 480217 5908325 257.72 >90% <15% No >15% <5% Stable Not Diverse/Complex 10 22 45.45 PoorBirch Creek BIR01 480024 5908440 480217 5908309 264.45 >90% <15% No >15% <5% Stable Not Diverse/Complex 10 22 45.45 PoorCampbell Creek CAM01 525209 5923829 525866 5923477 1,303.64 >90% <15% No >15% <5% Stable Moderately Diverse/Complex 12 22 54.55 Fair Campbell Creek CAM01 525210 5923844 525869 5923463 1,344.31 >90% <15% No >15% <5% Stable Moderately Diverse/Complex 12 22 54.55 Fair Campbell Creek CAM01 525869 5923463 525859 5923275 523.99 >90% <15% No >15% <5% Stable Not Diverse/Complex 10 22 45.45 Poor Campbell Creek CAM01 525866 5923477 525843 5923271 548.55 >90% <15% No >15% <5% Stable Not Diverse/Complex 10 22 45.45 Poor Campbell Creek CAM03 518230 5927481 518642 5927256 505.11 >90% <15% No >15% <5% Stable Not Diverse/Complex 10 22 45.45 Poor Campbell Creek CAM03 518244 5927485 518646 5927270 491.13 >90% <15% No >15% <5% Stable Moderately Diverse/Complex 12 22 54.55 Fair
Page 35
APPENDIX A Riparian Health Data
March 2016 Report No. 1532934 A-3
Name Reach Segment Start(a) Segment End(a) Length
[m] % Vegetation
Cover(b) % Woody Species Cover(b)
Evidence of Recruitment (Y/N) (b)
% Area of Human Caused Vegetation Cover Alteration(b)
% Area of Human Caused Bare Ground / Physical Alteration(b)
Overall Bank Stability? (b)
Adjacent Vegetation Structural Complexity(b) Score Possible
Score %
Score Health
Category Easting Northing Easting Northing
Campbell Creek CAM03 518663 5927253 520280 5926773 1,728.72 >90% <15% No >15% <5% Stable Not Diverse/Complex 10 22 45.45 Poor Campbell Creek CAM03 518661 5927268 520281 5926787 1,731.52 >90% <15% No >15% <5% Stable Not Diverse/Complex 10 22 45.45 Poor Campbell Creek CAM03 520287 5926787 521050 5927094 886.56 >90% <15% No >15% <5% Stable Not Diverse/Complex 10 22 45.45 Poor Campbell Creek CAM03 520287 5926773 521119 5927064 957.82 >90% <15% No >15% <5% Stable Not Diverse/Complex 10 22 45.45 Poor Campbell Creek CAM03 521119 5927064 521586 5926606 681.25 >90% >35% Yes 5-15% <5% Stable Diverse/Complex 20 22 90.91 Good Campbell Creek CAM03 521050 5927094 521604 5926608 775.45 >90% >35% Yes <5% <5% Stable Diverse/Complex 22 22 100 Good Campbell Creek CAM03 521604 5926608 521912 5926269 473.03 >90% <15% No >15% <5% Stable Not Diverse/Complex 10 22 45.45 Poor Campbell Creek CAM03 521586 5926606 521911 5926255 495.05 >90% <15% No >15% <5% Stable Not Diverse/Complex 10 22 45.45 Poor Campbell Creek CAM03 521923 5926269 522363 5926006 528.86 >90% <15% No >15% <5% Stable Not Diverse/Complex 10 22 45.45 Poor Campbell Creek CAM03 521922 5926255 522349 5926006 507.73 >90% <15% No >15% <5% Stable Not Diverse/Complex 10 22 45.45 Poor Campbell Creek CAM02 522505 5925926 523555 5924532 2,086.72 >90% >35% Yes <5% <5% Stable Diverse/Complex 22 22 100 Good Campbell Creek CAM02 522515 5925935 522926 5925329 755.71 >90% <15% No >15% <5% Stable Not Diverse/Complex 10 22 45.45 Poor Campbell Creek CAM02 522926 5925329 523555 5924546 1,317.72 >90% >35% Yes 5-15% <5% Stable Diverse/Complex 20 22 90.91 Good Campbell Creek CAM02 523978 5924238 524538 5923972 863.21 >90% >35% Yes <5% <5% Stable Diverse/Complex 22 22 100 Good Campbell Creek CAM02 523956 5924249 524521 5923955 894.05 >90% >35% Yes <5% <5% Stable Diverse/Complex 22 22 100 Good Campbell Creek CAM02 523563 5924532 523956 5924249 554.70 >90% 15-35% No >15% <5% Stable Not Diverse/Complex 11 22 50 Fair Campbell Creek CAM02 523564 5924546 523978 5924238 588.41 >90% 15-35% No 5-15% <5% Stable Not Diverse/Complex 13 22 59.09 Fair Campbell Creek CAM02 524538 5923972 525200 5923844 1,270.91 >90% 15-35% No 5-15% <5% Stable Moderately Diverse/Complex 15 22 68.18 Fair Campbell Creek CAM02 524521 5923955 525201 5923830 1,280.47 >90% <15% No >15% <5% Stable Moderately Diverse/Complex 12 22 54.55 Fair Campbell Creek CAM03 522349 5925997 522505 5925926 185.25 >90% >35% Yes <5% <5% Stable Diverse/Complex 22 22 100 Good Campbell Creek CAM03 522363 5925997 522515 5925935 173.54 >90% <15% No >15% <5% Stable Not Diverse/Complex 10 22 45.45 Poor Cotton Creek COT01 446916 5936868 447422 5939270 2,649.10 >90% >35% Yes 5-15% <5% Stable Moderately Diverse/Complex 18 22 81.82 Good Cotton Creek COT01 446972 5937645 447439 5939270 1813.70 >90% >35% Yes 5-15% <5% Stable Moderately Diverse/Complex 18 22 81.82 Good Cotton Creek COT01 445870 5948175 445831 5948830 714.29 >90% <15% No >15% <5% Stable Not Diverse/Complex 10 22 45.45 Poor Cotton Creek COT01 445884 5948175 445845 5948823 707.49 >90% <15% No >15% <5% Stable Not Diverse/Complex 10 22 45.45 Poor Cotton Creek COT01 445831 5948830 445718 5949049 273.19 >90% 15-35% No 5-15% <5% Stable Moderately Diverse/Complex 15 22 68.18 Fair Cotton Creek COT01 445845 5948823 445732 5949053 283.39 >90% 15-35% No 5-15% <5% Stable Moderately Diverse/Complex 15 22 68.18 Fair Cotton Creek COT01 446043 5947011 445869 5948168 1,616.24 >90% >35% No 5-15% <5% Stable Not Diverse/Complex 14 22 63.64 Fair Cotton Creek COT01 446125 5946739 445883 5948168 1,905.77 >90% <15% No >15% <5% Stable Not Diverse/Complex 10 22 45.45 Poor Cotton Creek COT01 445997 5943798 446271 5945744 2,305.78 >90% <15% No >15% <5% Stable Not Diverse/Complex 10 22 45.45 Poor Cotton Creek COT01 446442 5943294 446286 5945743 3,107.08 >90% 15-35% No >15% <5% Stable Not Diverse/Complex 11 22 50 Fair Cotton Creek COT01 446871 5940528 446426 5941599 1,507.40 >90% 15-35% No >15% <5% Stable Not Diverse/Complex 11 22 50 Fair Cotton Creek COT01 446996 5940465 446448 5941606 1,658.39 >90% 15-35% No >15% <5% Stable Not Diverse/Complex 11 22 50 Fair Cotton Creek COT01 447964 5935688 447149 5936037 1,059.77 >90% 15-35% Yes >15% <5% Stable Moderately Diverse/Complex 15 22 68.18 Fair Cotton Creek COT01 448836 5935188 447163 5936037 2,423.58 >90% <15% No >15% <5% Stable Not Diverse/Complex 10 22 45.45 Poor Cotton Creek COT01 448771 5934861 448822 5935182 328.94 >90% >35% Yes <5% <5% Stable Diverse/Complex 22 22 100 Good Cotton Creek COT01 448783 5934855 448836 5935188 341.92 >90% >35% Yes 5-15% <5% Stable Diverse/Complex 20 22 90.91 Good Cotton Creek COT01 448822 5935182 448702 5935620 477.24 >90% <15% No >15% <5% Stable Not Diverse/Complex 10 22 45.45 Poor Cotton Creek COT01 448702 5935620 447964 5935688 892.33 >90% >35% No >15% <5% Stable Not Diverse/Complex 12 22 54.55 Fair Cotton Creek COT01 447148 5936044 446916 5936868 900.74 >90% 15-35% Yes 5-15% 5-15% Stable Moderately Diverse/Complex 15 22 68.18 Fair Cotton Creek COT01 447162 5936044 446972 5937645 1,734.48 >90% 15-35% No 5-15% <5% Stable Not Diverse/Complex 13 22 59.09 Fair Cotton Creek COT01 447417 5939277 446871 5940528 1,777.20 >90% >35% Yes <5% <5% Stable Moderately Diverse/Complex 20 22 90.91 Good Cotton Creek COT01 446426 5941599 446658 5942108 579.01 >90% >35% Yes 5-15% <5% Stable Moderately Diverse/Complex 18 22 81.82 Good Cotton Creek COT01 447435 5939276 446996 5940465 1,636.11 >90% >35% No 5-15% <5% Stable Moderately Diverse/Complex 16 22 72.73 Fair Cotton Creek COT01 446448 5941606 446672 5942089 550.23 >90% >35% Yes 5-15% <5% Stable Moderately Diverse/Complex 18 22 81.82 Good
Page 36
APPENDIX A Riparian Health Data
March 2016 Report No. 1532934 A-4
Name Reach Segment Start(a) Segment End(a) Length
[m] % Vegetation
Cover(b) % Woody Species Cover(b)
Evidence of Recruitment (Y/N) (b)
% Area of Human Caused Vegetation Cover Alteration(b)
% Area of Human Caused Bare Ground / Physical Alteration(b)
Overall Bank Stability? (b)
Adjacent Vegetation Structural Complexity(b) Score Possible
Score %
Score Health
Category Easting Northing Easting Northing
Cotton Creek COT01 446672 5942089 446656 5942500 412.91 >90% <15% No >15% <5% Stable Not Diverse/Complex 10 22 45.45 Poor Cotton Creek COT01 446658 5942108 446642 5942500 392.87 >90% <15% No >15% <5% Stable Not Diverse/Complex 10 22 45.45 Poor Cotton Creek COT01 446643 5942509 446577 5942822 350.83 >90% >35% No <5% <5% Stable Moderately Diverse/Complex 18 22 81.82 Good Cotton Creek COT01 446577 5942822 445997 5943798 1,584.89 >90% 15-35% No >15% <5% Stable Not Diverse/Complex 11 22 50 Fair Cotton Creek COT01 446657 5942509 446442 5943294 1,134.09 >90% >35% No 5-15% <5% Stable Moderately Diverse/Complex 16 22 72.73 Fair Cotton Creek COT01 446269 5945751 446043 5947011 1,559.45 >90% <15% Yes >15% 5-15% Stable Not Diverse/Complex 10 22 45.45 Poor Cotton Creek COT01 446284 5945751 446125 5946739 1,268.62 >90% >35% No >15% <5% Stable Not Diverse/Complex 12 22 54.55 Fair Deer Creek DEE06 516129 5936764 516983 5935931 1,369.22 >90% <15% No >15% <5% Stable Not Diverse/Complex 10 22 45.45 Poor Deer Creek DEE06 516137 5936776 516982 5935945 1,360.39 >90% <15% No >15% <5% Stable Not Diverse/Complex 10 22 45.45 Poor Deer Creek DEE01 533874 5927137 533593 5926929 675.73 >90% <15% No >15% <5% Stable Not Diverse/Complex 10 22 45.45 Poor Deer Creek DEE01 533333 5927700 533609 5926932 2,050.94 >90% <15% No >15% <5% Stable Not Diverse/Complex 10 22 45.45 Poor Deer Creek DEE01 533332 5927686 533874 5927137 1,359.15 >90% >35% Yes <5% <5% Stable Diverse/Complex 22 22 100 Good Deer Creek DEE02 533072 5928237 533010 5928095 174.74 >90% >35% No <5% <5% Stable Moderately Diverse/Complex 18 22 81.82 Good Deer Creek DEE02 532514 5928560 533154 5927752 1,434.66 >90% >35% Yes 5-15% <5% Stable Diverse/Complex 20 22 90.91 Good Deer Creek DEE02 532517 5928575 533072 5928237 753.35 >90% <15% No >15% <5% Stable Not Diverse/Complex 10 22 45.45 Poor Deer Creek DEE02 532169 5929294 532514 5928560 942.25 >90% >35% Yes <5% <5% Stable Diverse/Complex 22 22 100 Good Deer Creek DEE02 532184 5929295 532517 5928575 922.52 >90% >35% Yes <5% <5% Stable Diverse/Complex 22 22 100 Good Deer Creek DEE02 531817 5930139 532007 5929734 723.47 >90% <15% No >15% <5% Stable Not Diverse/Complex 10 22 45.45 Poor Deer Creek DEE02 531831 5930142 532029 5929740 715.16 >90% <15% No >15% <5% Stable Not Diverse/Complex 10 22 45.45 Poor Deer Creek DEE02 531772 5930392 531817 5930139 290.02 >90% >35% Yes <5% <5% Stable Diverse/Complex 22 22 100 Good Deer Creek DEE02 531771 5930406 531831 5930142 310.92 >90% >35% Yes <5% <5% Stable Diverse/Complex 22 22 100 Good Deer Creek DEE02 532007 5929734 532164 5929303 536.69 >90% >35% Yes <5% <5% Stable Diverse/Complex 22 22 100 Good Deer Creek DEE02 532029 5929740 532180 5929303 548.34 >90% >35% Yes 5-15% <5% Stable Diverse/Complex 20 22 90.91 Good Deer Creek DEE02 531496 5930386 531763 5930407 310.92 >90% 15-35% No <5% <5% Stable Moderately Diverse/Complex 17 22 77.27 Fair Deer Creek DEE02 531338 5930074 531763 5930393 784.41 >90% <15% No >15% <5% Stable Not Diverse/Complex 10 22 45.45 Poor Deer Creek DEE02 530546 5929660 531496 5930386 1,678.35 >90% <15% No >15% <5% Stable Not Diverse/Complex 10 22 45.45 Poor Deer Creek DEE02 530079 5929696 531338 5930074 1,944.61 >90% >35% Yes <5% <5% Stable Diverse/Complex 22 22 100 Good Deer Creek DEE02 530078 5929710 530546 5929660 739.63 >90% 15-35% No 5-15% <5% Stable Moderately Diverse/Complex 15 22 68.18 Fair Deer Creek DEE02 527351 5931985 530063 5929696 4,230.09 >90% >35% Yes <5% <5% Stable Diverse/Complex 22 22 100 Good Deer Creek DEE02 528853 5930814 530064 5929710 2,049.03 >90% 15-35% Yes <5% <5% Stable Diverse/Complex 21 22 95.45 Good Deer Creek DEE02 527358 5931998 528853 5930814 2,173.38 >90% <15% No >15% <5% Stable Not Diverse/Complex 10 22 45.45 Poor Deer Creek DEE05 525816 5933049 525989 5932639 449.93 >90% >35% No 5-15% <5% Stable Moderately Diverse/Complex 16 22 72.73 Fair Deer Creek DEE05 525616 5933555 525816 5933049 546.91 >90% >35% Yes <5% <5% Stable Diverse/Complex 22 22 100 Good Deer Creek DEE05 525348 5933566 525976 5932632 1,332.02 >90% >35% No 5-15% <5% Stable Moderately Diverse/Complex 16 22 72.73 Fair Deer Creek DEE05 525334 5933563 525616 5933555 375.22 >90% >35% No 5-15% <5% Stable Moderately Diverse/Complex 16 22 72.73 Fair Deer Creek DEE06 524640 5932955 525134 5933168 735.15 >90% <15% No >15% <5% Stable Not Diverse/Complex 10 22 45.45 Poor Deer Creek DEE06 523522 5933380 525167 5933379 2,457.13 >90% <15% No >15% <5% Stable Not Diverse/Complex 10 22 45.45 Poor Deer Creek DEE06 523523 5933366 524334 5933096 1,097.28 >90% <15% No >15% <5% Stable Not Diverse/Complex 10 22 45.45 Poor Deer Creek DEE06 524334 5933096 524640 5932955 386.43 >90% >35% No 5-15% <5% Stable Moderately Diverse/Complex 16 22 72.73 Fair Deer Creek DEE06 522344 5933650 523514 5933365 1,546.38 >90% <15% No >15% <5% Stable Not Diverse/Complex 10 22 45.45 Poor Deer Creek DEE06 522344 5933665 523515 5933379 1,546.37 >90% <15% No >15% <5% Stable Not Diverse/Complex 10 22 45.45 Poor Deer Creek DEE06 521245 5933877 522338 5933651 1,175.12 >90% <15% No >15% >15% Stable Moderately Diverse/Complex 8 22 36.36 Poor Deer Creek DEE06 521247 5933905 522337 5933666 1,157.64 >90% <15% No >15% >15% Stable Not Diverse/Complex 6 22 27.27 Poor Deer Creek DEE06 520264 5933763 521245 5933877 1,204.88 >90% <15% No >15% <5% Stable Not Diverse/Complex 10 22 45.45 Poor Deer Creek DEE06 520262 5933789 521247 5933905 1,229.63 >90% <15% No >15% <5% Stable Not Diverse/Complex 10 22 45.45 Poor
Page 37
APPENDIX A Riparian Health Data
March 2016 Report No. 1532934 A-5
Name Reach Segment Start(a) Segment End(a) Length
[m] % Vegetation
Cover(b) % Woody Species Cover(b)
Evidence of Recruitment (Y/N) (b)
% Area of Human Caused Vegetation Cover Alteration(b)
% Area of Human Caused Bare Ground / Physical Alteration(b)
Overall Bank Stability? (b)
Adjacent Vegetation Structural Complexity(b) Score Possible
Score %
Score Health
Category Easting Northing Easting Northing
Deer Creek DEE06 519928 5933781 520253 5933772 440.58 >90% >35% Yes 5-15% <5% Stable Diverse/Complex 20 22 90.91 Good Deer Creek DEE06 519070 5934151 519928 5933781 1,304.13 >90% 15-35% No >15% <5% Stable Moderately Diverse/Complex 13 22 59.09 Fair Deer Creek DEE06 519078 5934163 520253 5933786 1,734.77 >90% 15-35% No >15% <5% Stable Moderately Diverse/Complex 13 22 59.09 Fair Deer Creek DEE06 518690 5934606 519078 5934163 964.36 >90% <15% No >15% <5% Stable Not Diverse/Complex 10 22 45.45 Poor Deer Creek DEE06 518679 5934618 519070 5934151 990.29 >90% <15% No >15% <5% Stable Not Diverse/Complex 10 22 45.45 Poor Deer Creek DEE06 518630 5935020 518679 5934618 440.84 >90% >35% Yes <5% <5% Stable Diverse/Complex 22 22 100 Good Deer Creek DEE06 518631 5935034 518690 5934606 475.00 >90% >35% Yes <5% <5% Stable Diverse/Complex 22 22 100 Good Deer Creek DEE06 518317 5935078 518616 5935021 335.61 >90% >35% Yes 5-15% <5% Stable Moderately Diverse/Complex 18 22 81.82 Good Deer Creek DEE06 518324 5935090 518616 5935035 328.20 >90% >35% Yes 5-15% <5% Stable Moderately Diverse/Complex 18 22 81.82 Good Deer Creek DEE06 517817 5935380 518317 5935078 658.57 >90% <15% No >15% <5% Stable Not Diverse/Complex 10 22 45.45 Poor Deer Creek DEE06 517817 5935394 518324 5935090 665.83 >90% <15% No >15% <5% Stable Not Diverse/Complex 10 22 45.45 Poor Deer Creek DEE06 517192 5935682 517812 5935381 733.86 >90% >35% Yes 5-15% <5% Stable Moderately Diverse/Complex 18 22 81.82 Good Deer Creek DEE06 517206 5935682 517812 5935396 711.23 >90% >35% Yes 5-15% <5% Stable Moderately Diverse/Complex 18 22 81.82 Good Deer Creek DEE06 516988 5935929 517190 5935693 315.82 >90% <15% No >15% <5% Stable Not Diverse/Complex 10 22 45.45 Poor Deer Creek DEE06 516990 5935943 517203 5935695 333.33 >90% <15% No >15% <5% Stable Not Diverse/Complex 10 22 45.45 Poor Deer Creek DEE02 533010 5928095 533333 5927700 699.46 >90% <15% No >15% <5% Stable Not Diverse/Complex 10 22 45.45 Poor Deer Creek DEE02 533154 5927752 533332 5927686 193.94 >90% >35% Yes <5% <5% Stable Diverse/Complex 22 22 100 Good Deer Creek DEE03 526587 5932255 527358 5931998 834.62 >90% <15% No >15% <5% Stable Not Diverse/Complex 10 22 45.45 Poor Deer Creek DEE03 526115 5932480 527351 5931985 1,359.89 >90% >35% Yes <5% <5% Stable Diverse/Complex 22 22 100 Good Deer Creek DEE03 526117 5932494 526587 5932255 529.08 >90% >35% No 5-15% <5% Stable Moderately Diverse/Complex 16 22 72.73 Fair Deer Creek DEE04 525985 5932621 526115 5932480 215.52 >90% >35% Yes <5% <5% Stable Diverse/Complex 22 22 100 Good Deer Creek DEE04 525976 5932632 525985 5932621 14.40 >90% >35% No 5-15% <5% Stable Moderately Diverse/Complex 16 22 72.73 Fair Deer Creek DEE04 525989 5932639 526117 5932494 217.38 >90% >35% No 5-15% <5% Stable Moderately Diverse/Complex 16 22 72.73 Fair Deer Creek DEE06 525167 5933379 525334 5933563 279.05 >90% >35% No 5-15% <5% Stable Moderately Diverse/Complex 16 22 72.73 Fair Deer Creek DEE06 525134 5933168 525348 5933566 538.21 >90% >35% No 5-15% <5% Stable Moderately Diverse/Complex 16 22 72.73 Fair Holden Creek HOL08 415981 5895387 416798 5896214 1,602.66 >90% <15% No >15% <5% Stable Not Diverse/Complex 10 22 45.45 Poor Holden Creek HOL10 410262 5891041 411531 5889852 1,763.32 >90% <15% No >15% 5-15% Stable Not Diverse/Complex 8 22 36.36 Poor Holden Creek HOL08 415981 5895401 416801 5896229 1,606.10 >90% <15% No >15% 5-15% Stable Not Diverse/Complex 8 22 36.36 Poor Holden Creek HOL10 410253 5891031 411535 5889837 1,777.77 >90% <15% No >15% 5-15% Stable Not Diverse/Complex 8 22 36.36 Poor Holden Creek HOL09 415167 5895327 415506 5895298 380.76 >90% <15% No >15% <5% Stable Not Diverse/Complex 10 22 45.45 Poor Holden Creek HOL01 429916 5901573 430113 5902071 1,164.32 >90% <15% No >15% <5% Stable Not Diverse/Complex 10 22 45.45 Poor Holden Creek HOL01 430149 5902025 430135 5902520 1,165.07 >90% <15% No >15% <5% Stable Moderately Diverse/Complex 12 22 54.55 Fair Holden Creek HOL01 429223 5901338 429902 5901585 1,314.75 >90% <15% No >15% <5% Stable Not Diverse/Complex 10 22 45.45 Poor Holden Creek HOL02 428278 5901036 428765 5901364 932.21 >90% 15-35% No >15% <5% Stable Moderately Diverse/Complex 13 22 59.09 Fair Holden Creek HOL02 428279 5901022 428814 5901308 997.79 >90% 15-35% No >15% <5% Stable Moderately Diverse/Complex 13 22 59.09 Fair Holden Creek HOL02 427784 5900705 427987 5900974 533.14 >90% 15-35% No >15% <5% Stable Moderately Diverse/Complex 13 22 59.09 Fair Holden Creek HOL02 427798 5900704 427985 5900959 508.78 >90% 15-35% No >15% <5% Stable Moderately Diverse/Complex 13 22 59.09 Fair Holden Creek HOL02 427987 5900974 428274 5901035 328.75 >90% <15% No >15% <5% Stable Not Diverse/Complex 10 22 45.45 Poor Holden Creek HOL02 427985 5900959 428275 5901021 331.03 >90% <15% No >15% <5% Stable Not Diverse/Complex 10 22 45.45 Poor Holden Creek HOL02 427987 5899575 428163 5900112 979.28 >90% 15-35% No >15% <5% Stable Moderately Diverse/Complex 13 22 59.09 Fair Holden Creek HOL02 428002 5899590 428167 5900093 949.96 >90% 15-35% No >15% <5% Stable Moderately Diverse/Complex 13 22 59.09 Fair Holden Creek HOL02 426643 5898512 428002 5899590 3,397.83 >90% <15% No >15% <5% Stable Not Diverse/Complex 10 22 45.45 Poor Holden Creek HOL02 426627 5898455 427987 5899575 3,475.90 >90% <15% No >15% <5% Stable Not Diverse/Complex 10 22 45.45 Poor Holden Creek HOL02 426600 5897832 426601 5897978 147.42 <75% <15% No >15% >15% Stable Not Diverse/Complex 4 22 18.18 Poor Holden Creek HOL02 427888 5900297 427784 5900697 519.55 >90% 15-35% No >15% <5% Stable Not Diverse/Complex 11 22 50 Fair
Page 38
APPENDIX A Riparian Health Data
March 2016 Report No. 1532934 A-6
Name Reach Segment Start(a) Segment End(a) Length
[m] % Vegetation
Cover(b) % Woody Species Cover(b)
Evidence of Recruitment (Y/N) (b)
% Area of Human Caused Vegetation Cover Alteration(b)
% Area of Human Caused Bare Ground / Physical Alteration(b)
Overall Bank Stability? (b)
Adjacent Vegetation Structural Complexity(b) Score Possible
Score %
Score Health
Category Easting Northing Easting Northing
Holden Creek HOL02 427902 5900300 427798 5900696 516.97 >90% 15-35% No >15% <5% Stable Not Diverse/Complex 11 22 50 Fair Holden Creek HOL02 428168 5900215 427888 5900297 380.07 >90% <15% No >15% <5% Stable Not Diverse/Complex 10 22 45.45 Poor Holden Creek HOL02 428182 5900224 427902 5900300 375.13 >90% <15% No >15% <5% Stable Not Diverse/Complex 10 22 45.45 Poor Holden Creek HOL02 428163 5900112 428168 5900215 161.26 >90% >35% No >15% <5% Stable Moderately Diverse/Complex 14 22 63.64 Fair Holden Creek HOL02 428167 5900093 428182 5900224 193.21 >90% >35% No >15% <5% Stable Moderately Diverse/Complex 14 22 63.64 Fair Holden Creek HOL02 426601 5897978 426627 5898455 662.23 >90% 15-35% No >15% <5% Stable Moderately Diverse/Complex 13 22 59.09 Fair Holden Creek HOL02 426612 5897919 426643 5898512 796.54 >90% 15-35% No >15% 5-15% Stable Moderately Diverse/Complex 11 22 50 Fair Holden Creek HOL02 426584 5897483 426600 5897832 604.30 >90% <15% No >15% <5% Stable Moderately Diverse/Complex 12 22 54.55 Fair Holden Creek HOL02 426599 5897482 426612 5897915 688.00 >90% <15% No >15% 5-15% Stable Moderately Diverse/Complex 10 22 45.45 Poor Holden Creek HOL02 426566 5896238 426580 5897476 1,693.26 >90% <15% No >15% <5% Stable Not Diverse/Complex 10 22 45.45 Poor Holden Creek HOL02 426571 5896210 426596 5897476 1,701.89 >90% <15% No >15% <5% Stable Not Diverse/Complex 10 22 45.45 Poor Holden Creek HOL02 424949 5896071 426561 5896224 2,338.03 >90% <15% No >15% <5% Stable Not Diverse/Complex 10 22 45.45 Poor Holden Creek HOL02 424951 5896085 426560 5896238 2,347.18 >90% <15% No >15% <5% Stable Not Diverse/Complex 10 22 45.45 Poor Holden Creek HOL02 424660 5895892 424937 5896089 382.70 >90% <15% No >15% <5% Stable Not Diverse/Complex 10 22 45.45 Poor Holden Creek HOL02 424615 5895855 424660 5895892 58.74 >90% >35% Yes <5% <5% Stable Diverse/Complex 22 22 100 Good Holden Creek HOL02 424684 5895892 424937 5896074 355.00 >90% <15% No >15% <5% Stable Not Diverse/Complex 10 22 45.45 Poor Holden Creek HOL02 424624 5895844 424684 5895892 77.46 >90% >35% Yes 5-15% <5% Stable Diverse/Complex 20 22 90.91 Good Holden Creek HOL02 423648 5895712 424615 5895855 1,109.52 >90% <15% No >15% <5% Stable Not Diverse/Complex 10 22 45.45 Poor Holden Creek HOL02 423657 5895700 424624 5895844 1,110.32 >90% <15% No >15% <5% Stable Not Diverse/Complex 10 22 45.45 Poor Holden Creek HOL03 423380 5895606 423648 5895712 288.16 <75% <15% No >15% >15% Stable Not Diverse/Complex 4 22 18.18 Poor Holden Creek HOL04 423343 5895547 423354 5895569 24.64 >90% <15% No >15% 5-15% Stable Not Diverse/Complex 8 22 36.36 Poor Holden Creek HOL04 423359 5895577 423380 5895606 35.90 >90% <15% No >15% 5-15% Stable Not Diverse/Complex 8 22 36.36 Poor Holden Creek HOL03 423390 5895595 423657 5895700 286.65 <75% <15% No >15% >15% Stable Not Diverse/Complex 4 22 18.18 Poor Holden Creek HOL04 423356 5895542 423367 5895561 22.47 >90% <15% No >15% 5-15% Stable Not Diverse/Complex 8 22 36.36 Poor Holden Creek HOL04 423372 5895572 423390 5895595 29.72 >90% <15% No >15% 5-15% Stable Not Diverse/Complex 8 22 36.36 Poor Holden Creek HOL04 423311 5895473 423336 5895535 68.09 >90% <15% No >15% >15% Stable Not Diverse/Complex 6 22 27.27 Poor Holden Creek HOL04 423311 5895455 423348 5895527 83.89 >90% <15% No >15% >15% Stable Not Diverse/Complex 6 22 27.27 Poor Holden Creek HOL04 423007 5895233 423302 5895468 421.15 >90% <15% No >15% 5-15% Stable Not Diverse/Complex 8 22 36.36 Poor Holden Creek HOL04 423000 5895221 423302 5895454 427.97 >90% <15% No >15% 5-15% Stable Not Diverse/Complex 8 22 36.36 Poor Holden Creek HOL05 421776 5895338 423000 5895221 1,385.28 >90% <15% No >15% <5% Stable Not Diverse/Complex 10 22 45.45 Poor Holden Creek HOL05 421779 5895352 423007 5895233 1,390.13 >90% <15% No >15% <5% Stable Not Diverse/Complex 10 22 45.45 Poor Holden Creek HOL06 421246 5895396 421675 5895354 468.90 >90% <15% No >15% <5% Stable Not Diverse/Complex 10 22 45.45 Poor Holden Creek HOL06 421248 5895382 421675 5895340 467.14 >90% <15% No >15% <5% Stable Not Diverse/Complex 10 22 45.45 Poor Holden Creek HOL06 420742 5895436 421246 5895396 584.83 >90% <15% No >15% >15% Stable Not Diverse/Complex 6 22 27.27 Poor Holden Creek HOL06 420734 5895424 421248 5895382 594.40 >90% <15% No >15% 5-15% Stable Not Diverse/Complex 8 22 36.36 Poor Holden Creek HOL06 420062 5895967 420742 5895436 1,162.71 >90% <15% No >15% <5% Stable Not Diverse/Complex 10 22 45.45 Poor Holden Creek HOL06 420063 5895953 420734 5895424 1,154.27 >90% <15% No >15% <5% Stable Not Diverse/Complex 10 22 45.45 Poor Holden Creek HOL06 418423 5895854 420055 5895953 1,722.90 >90% >35% Yes 5-15% <5% Stable Moderately Diverse/Complex 18 22 81.82 Good Holden Creek HOL06 418423 5895869 420056 5895967 1,723.49 >90% >35% Yes 5-15% <5% Stable Moderately Diverse/Complex 18 22 81.82 Good Holden Creek HOL06 417927 5895837 418416 5895852 530.29 >90% <15% No 5-15% 5-15% Stable Not Diverse/Complex 10 22 45.45 Poor Holden Creek HOL06 417928 5895851 418416 5895867 529.34 >90% <15% No >15% <5% Stable Not Diverse/Complex 10 22 45.45 Poor Holden Creek HOL07 417359 5895994 417836 5895852 506.03 >90% <15% No >15% <5% Stable Not Diverse/Complex 10 22 45.45 Poor Holden Creek HOL07 417368 5896005 417898 5895853 560.01 >90% <15% No >15% <5% Stable Not Diverse/Complex 10 22 45.45 Poor Holden Creek HOL08 416814 5896230 417368 5896005 725.01 >90% <15% No >15% <5% Stable Not Diverse/Complex 10 22 45.45 Poor Holden Creek HOL08 416814 5896216 417349 5896004 701.53 >90% <15% No >15% <5% Stable Not Diverse/Complex 10 22 45.45 Poor
Page 39
APPENDIX A Riparian Health Data
March 2016 Report No. 1532934 A-7
Name Reach Segment Start(a) Segment End(a) Length
[m] % Vegetation
Cover(b) % Woody Species Cover(b)
Evidence of Recruitment (Y/N) (b)
% Area of Human Caused Vegetation Cover Alteration(b)
% Area of Human Caused Bare Ground / Physical Alteration(b)
Overall Bank Stability? (b)
Adjacent Vegetation Structural Complexity(b) Score Possible
Score %
Score Health
Category Easting Northing Easting Northing
Holden Creek HOL08 415489 5895375 415981 5895387 517.33 >90% 15-35% Yes >15% <5% Stable Moderately Diverse/Complex 15 22 68.18 Fair Holden Creek HOL08 415482 5895395 415981 5895401 518.28 >90% 15-35% Yes >15% <5% Stable Moderately Diverse/Complex 15 22 68.18 Fair Holden Creek HOL08 415490 5895299 415482 5895395 107.87 >90% <15% No >15% <5% Stable Not Diverse/Complex 10 22 45.45 Poor Holden Creek HOL08 415501 5895311 415489 5895375 75.51 >90% <15% No >15% <5% Stable Not Diverse/Complex 10 22 45.45 Poor Holden Creek HOL09 415167 5895341 415490 5895299 358.62 >90% <15% No >15% <5% Stable Not Diverse/Complex 10 22 45.45 Poor Holden Creek HOL10 415391 5894431 415506 5895298 1,685.50 >90% >35% Yes 5-15% <5% Stable Diverse/Complex 20 22 90.91 Good Holden Creek HOL10 415405 5894429 415501 5895311 1,713.36 >90% >35% Yes 5-15% <5% Stable Diverse/Complex 20 22 90.91 Good Holden Creek HOL10 415147 5894259 415389 5894422 303.06 >90% <15% No >15% <5% Stable Not Diverse/Complex 10 22 45.45 Poor Holden Creek HOL10 415145 5894242 415404 5894422 327.58 >90% <15% No >15% <5% Stable Not Diverse/Complex 10 22 45.45 Poor Holden Creek HOL10 414389 5894381 415139 5894254 972.30 >90% <15% No >15% <5% Stable Not Diverse/Complex 10 22 45.45 Poor Holden Creek HOL10 414376 5894367 415138 5894238 982.66 >90% <15% No >15% <5% Stable Not Diverse/Complex 10 22 45.45 Poor Holden Creek HOL10 414807 5893255 414310 5893941 1,063.51 >90% >35% Yes <5% <5% Stable Diverse/Complex 22 22 100 Good Holden Creek HOL10 414836 5893367 414316 5893961 962.34 >90% >35% Yes <5% <5% Stable Diverse/Complex 22 22 100 Good Holden Creek HOL10 414316 5893961 414376 5894367 741.22 >90% >35% Yes 5-15% <5% Stable Moderately Diverse/Complex 18 22 81.82 Good Holden Creek HOL10 414310 5893941 414389 5894381 789.31 >90% >35% Yes 5-15% <5% Stable Moderately Diverse/Complex 18 22 81.82 Good Holden Creek HOL10 413788 5891223 414807 5893255 3,217.29 >90% <15% No >15% <5% Stable Not Diverse/Complex 10 22 45.45 Poor Holden Creek HOL10 413802 5891224 414836 5893367 3,331.68 >90% <15% No >15% <5% Stable Not Diverse/Complex 10 22 45.45 Poor Holden Creek HOL10 413621 5890411 413788 5891214 1,421.89 >90% <15% No >15% <5% Stable Not Diverse/Complex 10 22 45.45 Poor Holden Creek HOL10 413639 5890427 413802 5891214 1,405.33 >90% <15% No >15% <5% Stable Not Diverse/Complex 10 22 45.45 Poor Holden Creek HOL10 413443 5890092 413621 5890411 581.37 >90% >35% Yes <5% <5% Stable Diverse/Complex 22 22 100 Good Holden Creek HOL10 413443 5890072 413639 5890427 624.71 >90% >35% Yes <5% <5% Stable Diverse/Complex 22 22 100 Good Holden Creek HOL10 413324 5890046 413436 5890084 119.22 >90% >35% No <5% <5% Stable Moderately Diverse/Complex 18 22 81.82 Good Holden Creek HOL10 413305 5890013 413437 5890070 146.10 >90% >35% No 5-15% <5% Stable Moderately Diverse/Complex 16 22 72.73 Fair Holden Creek HOL10 413236 5889959 413324 5890046 125.06 >90% <15% No >15% <5% Stable Not Diverse/Complex 10 22 45.45 Poor Holden Creek HOL10 413229 5889939 413305 5890013 107.87 >90% >35% No 5-15% <5% Stable Moderately Diverse/Complex 16 22 72.73 Fair Holden Creek HOL10 411801 5889541 413236 5889959 1,633.16 >90% <15% No >15% <5% Stable Not Diverse/Complex 10 22 45.45 Poor Holden Creek HOL10 411802 5889524 413229 5889939 1,622.78 >90% <15% No >15% <5% Stable Not Diverse/Complex 10 22 45.45 Poor Holden Creek HOL10 411651 5889695 411794 5889545 214.06 >90% <15% Yes >15% <5% Stable Not Diverse/Complex 12 22 54.55 Fair Holden Creek HOL10 411643 5889677 411794 5889529 217.27 >90% <15% No >15% <5% Stable Not Diverse/Complex 10 22 45.45 Poor Holden Creek HOL10 411535 5889837 411643 5889677 200.19 >90% 15-35% No <5% <5% Stable Not Diverse/Complex 15 22 68.18 Fair Holden Creek HOL10 411531 5889852 411651 5889695 206.69 >90% 15-35% No <5% <5% Stable Not Diverse/Complex 15 22 68.18 Fair Holden Creek HOL01 429917 5901587 430149 5902025 1,054.21 >90% <15% No >15% <5% Stable Not Diverse/Complex 10 22 45.45 Poor Holden Creek HOL01 430113 5902071 430151 5902518 1,072.96 >90% <15% No >15% <5% Stable Moderately Diverse/Complex 12 22 54.55 Fair Holden Creek HOL09 415127 5895328 415159 5895327 31.59 >90% <15% No >15% <5% Stable Not Diverse/Complex 10 22 45.45 Poor Holden Creek HOL09 415128 5895342 415159 5895341 30.89 >90% <15% No >15% <5% Stable Not Diverse/Complex 10 22 45.45 Poor Holden Creek HOL02 428765 5901364 429223 5901338 915.51 >90% <15% No >15% <5% Stable Not Diverse/Complex 10 22 45.45 Poor Holden Creek HOL01 429243 5901335 429902 5901571 1,299.82 >90% <15% No >15% <5% Stable Not Diverse/Complex 10 22 45.45 Poor Holden Creek HOL02 428814 5901308 429233 5901324 861.37 >90% <15% No >15% <5% Stable Not Diverse/Complex 10 22 45.45 Poor Holden Creek HOL06 421683 5895355 421779 5895352 96.41 >90% <15% No >15% <5% Stable Not Diverse/Complex 10 22 45.45 Poor Holden Creek HOL06 421683 5895341 421776 5895338 94.52 >90% <15% No >15% <5% Stable Not Diverse/Complex 10 22 45.45 Poor Holden Creek HOL07 417836 5895852 417927 5895837 92.81 >90% <15% No 5-15% 5-15% Stable Not Diverse/Complex 10 22 45.45 Poor Holden Creek HOL07 417898 5895853 417928 5895851 30.28 >90% <15% No >15% <5% Stable Not Diverse/Complex 10 22 45.45 Poor Holden Creek HOL08 417349 5896004 417359 5895994 13.69 >90% <15% No >15% <5% Stable Not Diverse/Complex 10 22 45.45 Poor Holden Drainage HOL18 406423 5885147 405963 5887740 2,787.20 >90% <15% No >15% >15% Stable Not Diverse/Complex 6 22 27.27 PoorHolden Drainage HOL19 406761 5882084 406072 5884878 2,989.09 >90% <15% No >15% >15% Stable Not Diverse/Complex 6 22 27.27 Poor
Page 40
APPENDIX A Riparian Health Data
March 2016 Report No. 1532934 A-8
Name Reach Segment Start(a) Segment End(a) Length
[m] % Vegetation
Cover(b) % Woody Species Cover(b)
Evidence of Recruitment (Y/N) (b)
% Area of Human Caused Vegetation Cover Alteration(b)
% Area of Human Caused Bare Ground / Physical Alteration(b)
Overall Bank Stability? (b)
Adjacent Vegetation Structural Complexity(b) Score Possible
Score %
Score Health
Category Easting Northing Easting Northing
Holden Drainage HOL19 406762 5882107 406089 5884878 2,963.39 >90% <15% No >15% >15% Stable Not Diverse/Complex 6 22 27.27 PoorHolden Drainage HOL15 424846 5889485 426488 5890686 2,467.37 >90% <15% No >15% >15% Stable Not Diverse/Complex 6 22 27.27 PoorHolden Drainage HOL15 424847 5889500 426488 5890700 2,466.94 >90% <15% No >15% >15% Stable Not Diverse/Complex 6 22 27.27 PoorHolden Drainage HOL11 429837 5900673 429243 5901335 1,437.53 >90% <15% No >15% <5% Stable Not Diverse/Complex 10 22 45.45 PoorHolden Drainage HOL15 428133 5891353 428583 5891217 511.13 >90% <15% No >15% <5% Stable Not Diverse/Complex 10 22 45.45 PoorHolden Drainage HOL15 428403 5891279 428567 5891222 189.84 >90% <15% No >15% <5% Stable Not Diverse/Complex 10 22 45.45 PoorHolden Drainage HOL15 428583 5891217 428891 5891089 442.61 >90% <15% No >15% >15% Stable Not Diverse/Complex 6 22 27.27 PoorHolden Drainage HOL15 428567 5891222 428890 5891075 468.33 >90% <15% No >15% >15% Stable Not Diverse/Complex 6 22 27.27 PoorHolden Drainage HOL15 428890 5891075 429147 5891326 531.67 >90% 15-35% Yes >15% <5% Stable Not Diverse/Complex 13 22 59.09 Fair Holden Drainage HOL15 428891 5891089 429133 5891332 514.51 >90% <15% No 5-15% <5% Stable Not Diverse/Complex 12 22 54.55 Fair Holden Drainage HOL14 429240 5891366 429279 5891916 595.71 >90% <15% No >15% 5-15% Stable Not Diverse/Complex 8 22 36.36 PoorHolden Drainage HOL14 429231 5891377 429265 5891916 582.79 >90% <15% No >15% <5% Stable Not Diverse/Complex 10 22 45.45 PoorHolden Drainage HOL13 429279 5891916 429284 5891971 54.97 <75% <15% No >15% >15% Stable Not Diverse/Complex 4 22 18.18 PoorHolden Drainage HOL13 429265 5891916 429270 5891963 47.13 >90% <15% No >15% <5% Stable Not Diverse/Complex 10 22 45.45 PoorHolden Drainage HOL21 412584 5871583 412370 5871592 213.81 >90% >35% No >15% <5% Stable Not Diverse/Complex 12 22 54.55 FairHolden Drainage HOL21 412584 5871597 412371 5871606 214.04 >90% >35% Yes >15% <5% Stable Not Diverse/Complex 14 22 63.64 FairHolden Drainage HOL21 412371 5871606 412085 5871850 394.56 >90% >35% Yes 5-15% 5-15% Stable Moderately Diverse/Complex 16 22 72.73 Fair Holden Drainage HOL21 412370 5871592 412072 5871842 407.64 >90% 15-35% No >15% >15% Stable Not Diverse/Complex 7 22 31.82 PoorHolden Drainage HOL21 412072 5871842 412253 5872647 925.65 >90% <15% No >15% >15% Stable Not Diverse/Complex 6 22 27.27 PoorHolden Drainage HOL21 412085 5871850 412266 5872652 921.91 >90% <15% No >15% >15% Stable Not Diverse/Complex 6 22 27.27 PoorHolden Drainage HOL21 412266 5872652 411833 5875061 2,659.00 >90% <15% No >15% >15% Stable Not Diverse/Complex 6 22 27.27 PoorHolden Drainage HOL21 412253 5872647 411819 5875061 2,663.37 >90% <15% No >15% >15% Stable Not Diverse/Complex 6 22 27.27 PoorHolden Drainage HOL21 411835 5875072 411610 5878298 3,341.08 >90% <15% No >15% >15% Stable Not Diverse/Complex 6 22 27.27 PoorHolden Drainage HOL21 411821 5875072 411596 5878298 3,341.00 >90% <15% No >15% >15% Stable Not Diverse/Complex 6 22 27.27 PoorHolden Drainage HOL21 411610 5878305 412470 5881521 3,640.32 >90% <15% No >15% >15% Stable Not Diverse/Complex 6 22 27.27 PoorHolden Drainage HOL21 411596 5878306 412456 5881520 3,639.59 >90% 15-35% No >15% >15% Stable Not Diverse/Complex 7 22 31.82 Poor Holden Drainage HOL21 412470 5881527 411737 5884774 3,465.94 >90% <15% No 5-15% >15% Stable Not Diverse/Complex 8 22 36.36 Poor Holden Drainage HOL21 412456 5881528 411721 5884773 3,465.13 >90% <15% No >15% >15% Stable Not Diverse/Complex 6 22 27.27 PoorHolden Drainage HOL21 411732 5884782 413372 5886751 3,005.24 >90% <15% No >15% >15% Stable Not Diverse/Complex 6 22 27.27 PoorHolden Drainage HOL21 411714 5884784 413372 5886767 3,025.88 >90% <15% No >15% >15% Stable Not Diverse/Complex 6 22 27.27 PoorHolden Drainage HOL21 413381 5886756 414206 5887710 1,399.04 >90% <15% No >15% >15% Stable Not Diverse/Complex 6 22 27.27 PoorHolden Drainage HOL21 413382 5886773 414191 5887703 1,369.61 >90% <15% No >15% >15% Stable Not Diverse/Complex 6 22 27.27 PoorHolden Drainage HOL16 413401 5887821 414191 5887703 847.97 >90% <15% No >15% >15% Stable Not Diverse/Complex 6 22 27.27 PoorHolden Drainage HOL17 405263 5887489 405678 5887631 585.90 >90% >35% Yes 5-15% <5% Stable Moderately Diverse/Complex 18 22 81.82 Good Holden Drainage HOL16 412757 5887996 413396 5887836 667.34 >90% <15% No >15% >15% Stable Not Diverse/Complex 6 22 27.27 PoorHolden Drainage HOL16 412740 5887995 413396 5887822 689.53 >90% <15% No >15% >15% Stable Not Diverse/Complex 6 22 27.27 PoorHolden Drainage HOL16 411777 5888201 412752 5888004 1,029.81 >90% <15% No >15% >15% Stable Not Diverse/Complex 6 22 27.27 PoorHolden Drainage HOL16 411776 5888187 412735 5888005 1,006.72 >90% <15% No >15% >15% Stable Not Diverse/Complex 6 22 27.27 PoorHolden Drainage HOL16 411175 5888416 411768 5888188 635.97 >90% <15% No >15% >15% Stable Not Diverse/Complex 6 22 27.27 PoorHolden Drainage HOL16 411184 5888427 411769 5888202 626.94 >90% <15% No >15% >15% Stable Not Diverse/Complex 6 22 27.27 PoorHolden Drainage HOL16 411028 5888550 411175 5888416 202.54 >90% <15% No >15% >15% Stable Not Diverse/Complex 6 22 27.27 PoorHolden Drainage HOL16 411039 5888559 411184 5888427 199.74 >90% <15% No >15% <5% Stable Moderately Diverse/Complex 12 22 54.55 Fair Holden Drainage HOL16 410766 5888844 411028 5888550 394.12 >90% <15% No >15% >15% Stable Not Diverse/Complex 6 22 27.27 PoorHolden Drainage HOL16 410779 5888852 411039 5888559 392.13 >90% <15% No >15% >15% Stable Not Diverse/Complex 6 22 27.27 PoorHolden Drainage HOL16 410163 5888976 410779 5888852 682.70 >90% <15% No >15% <5% Stable Not Diverse/Complex 10 22 45.45 Poor
Page 41
APPENDIX A Riparian Health Data
March 2016 Report No. 1532934 A-9
Name Reach Segment Start(a) Segment End(a) Length
[m] % Vegetation
Cover(b) % Woody Species Cover(b)
Evidence of Recruitment (Y/N) (b)
% Area of Human Caused Vegetation Cover Alteration(b)
% Area of Human Caused Bare Ground / Physical Alteration(b)
Overall Bank Stability? (b)
Adjacent Vegetation Structural Complexity(b) Score Possible
Score %
Score Health
Category Easting Northing Easting Northing
Holden Drainage HOL16 410163 5888962 410766 5888844 668.30 >90% <15% No >15% <5% Stable Not Diverse/Complex 10 22 45.45 PoorHolden Drainage HOL16 409455 5888892 409998 5888984 567.08 >90% 15-35% No >15% <5% Stable Moderately Diverse/Complex 13 22 59.09 Fair Holden Drainage HOL16 409454 5888878 409996 5888970 565.65 >90% 15-35% No >15% <5% Stable Moderately Diverse/Complex 13 22 59.09 Fair Holden Drainage HOL16 409996 5888970 410153 5888962 157.20 >90% <15% No >15% <5% Stable Not Diverse/Complex 10 22 45.45 PoorHolden Drainage HOL16 409998 5888984 410154 5888976 157.01 >90% <15% No >15% <5% Stable Not Diverse/Complex 10 22 45.45 PoorHolden Drainage HOL16 408529 5888744 409454 5888878 938.40 >90% <15% No >15% >15% Stable Not Diverse/Complex 6 22 27.27 PoorHolden Drainage HOL16 408530 5888758 409455 5888892 937.41 >90% <15% No >15% >15% Stable Not Diverse/Complex 6 22 27.27 PoorHolden Drainage HOL16 406895 5888484 408522 5888744 1,702.75 >90% <15% No >15% >15% Stable Not Diverse/Complex 6 22 27.27 PoorHolden Drainage HOL16 406894 5888498 408523 5888758 1,704.89 >90% <15% No >15% >15% Stable Not Diverse/Complex 6 22 27.27 PoorHolden Drainage HOL16 405937 5888125 406887 5888497 1,112.38 >90% <15% No >15% >15% Stable Not Diverse/Complex 6 22 27.27 PoorHolden Drainage HOL16 405951 5888125 406886 5888483 1,090.04 >90% <15% No >15% >15% Stable Not Diverse/Complex 6 22 27.27 PoorHolden Drainage HOL16 405948 5887744 405936 5888120 375.65 >90% <15% No >15% <5% Stable Not Diverse/Complex 10 22 45.45 PoorHolden Drainage HOL17 405259 5887476 405665 5887624 574.67 >90% >35% Yes 5-15% <5% Stable Moderately Diverse/Complex 18 22 81.82 Good Holden Drainage HOL18 406408 5885149 405949 5887728 2,773.52 >90% <15% No >15% >15% Stable Not Diverse/Complex 6 22 27.27 PoorHolden Drainage HOL20 407785 5884248 407406 5884852 754.47 >90% <15% No >15% >15% Stable Not Diverse/Complex 6 22 27.27 PoorHolden Drainage HOL20 407793 5884259 407421 5884852 740.98 >90% <15% No >15% >15% Stable Not Diverse/Complex 6 22 27.27 PoorHolden Drainage HOL20 406815 5884941 406418 5885128 548.20 >90% <15% No >15% >15% Stable Not Diverse/Complex 6 22 27.27 PoorHolden Drainage HOL20 407405 5884860 406823 5884945 632.30 >90% <15% No >15% >15% Stable Not Diverse/Complex 6 22 27.27 PoorHolden Drainage HOL20 407419 5884859 406822 5884961 654.85 >90% <15% No >15% >15% Stable Not Diverse/Complex 6 22 27.27 PoorHolden Drainage HOL17 405774 5887581 405892 5887707 188.10 >90% >35% Yes <5% <5% Stable Diverse/Complex 22 22 100 Good Holden Drainage HOL17 405785 5887570 405903 5887698 188.64 >90% >35% Yes <5% <5% Stable Diverse/Complex 22 22 100 Good Holden Drainage HOL17 405678 5887631 405774 5887581 126.54 >90% <15% No >15% <5% Stable Not Diverse/Complex 10 22 45.45 PoorHolden Drainage HOL17 405665 5887624 405785 5887570 153.01 >90% <15% No >15% <5% Stable Not Diverse/Complex 10 22 45.45 PoorHolden Drainage HOL17 405236 5887477 405259 5887476 23.35 >90% <15% No >15% <5% Stable Not Diverse/Complex 10 22 45.45 PoorHolden Drainage HOL17 405236 5887492 405263 5887489 27.67 >90% <15% No >15% <5% Stable Not Diverse/Complex 10 22 45.45 PoorHolden Drainage HOL17 405216 5887493 405229 5887492 13.17 >90% <15% No >15% <5% Stable Not Diverse/Complex 10 22 45.45 PoorHolden Drainage HOL17 405215 5887479 405229 5887478 14.15 >90% <15% No >15% <5% Stable Not Diverse/Complex 10 22 45.45 PoorHolden Drainage HOL19 407568 5880418 407468 5880845 463.83 >90% 15-35% No >15% <5% Stable Not Diverse/Complex 11 22 50 Fair Holden Drainage HOL19 407556 5880410 407461 5880832 456.14 >90% 15-35% No >15% <5% Stable Not Diverse/Complex 11 22 50 Fair Holden Drainage HOL19 407023 5881631 406769 5882071 508.97 >90% <15% No >15% >15% Stable Not Diverse/Complex 6 22 27.27 PoorHolden Drainage HOL19 407039 5881630 406770 5882095 537.54 >90% <15% No >15% >15% Stable Not Diverse/Complex 6 22 27.27 PoorHolden Drainage HOL19 407135 5881456 407045 5881620 187.83 >90% <15% No >15% <5% Stable Not Diverse/Complex 10 22 45.45 PoorHolden Drainage HOL19 407121 5881453 407030 5881619 189.39 >90% <15% No >15% <5% Stable Not Diverse/Complex 10 22 45.45 PoorHolden Drainage HOL19 407301 5880924 407121 5881453 592.97 >90% <15% N/A >15% >15% Stable Not Diverse/Complex 6 20 30 PoorHolden Drainage HOL19 407315 5880929 407135 5881456 591.18 >90% <15% N/A >15% >15% Stable Not Diverse/Complex 6 20 30 PoorHolden Drainage HOL19 407917 5880459 407568 5880418 387.74 >90% N/A N/A >15% >15% Stable Not Diverse/Complex 6 18 33.33 PoorHolden Drainage HOL19 407919 5880445 407556 5880410 404.80 >90% N/A N/A >15% >15% Stable Not Diverse/Complex 6 18 33.33 PoorHolden Drainage HOL19 407468 5880845 407315 5880929 176.53 >90% N/A N/A >15% >15% Stable Not Diverse/Complex 6 18 33.33 PoorHolden Drainage HOL19 407461 5880832 407301 5880924 187.66 >90% N/A N/A >15% >15% Stable Not Diverse/Complex 6 18 33.33 PoorHolden Drainage HOL15 414199 5887723 415021 5887905 859.21 >90% <15% No >15% >15% Stable Not Diverse/Complex 6 22 27.27 PoorHolden Drainage HOL15 414206 5887710 415021 5887891 851.97 >90% <15% No >15% >15% Stable Not Diverse/Complex 6 22 27.27 PoorHolden Drainage HOL15 415030 5887906 416669 5888550 1,895.25 >90% <15% No >15% >15% Stable Not Diverse/Complex 6 22 27.27 PoorHolden Drainage HOL15 415030 5887892 416669 5888533 1,893.37 >90% <15% No >15% >15% Stable Not Diverse/Complex 6 22 27.27 PoorHolden Drainage HOL15 416669 5888550 418297 5888299 1,762.73 >90% <15% No >15% >15% Stable Moderately Diverse/Complex 8 22 36.36 Poor Holden Drainage HOL15 416669 5888533 418296 5888285 1,764.14 >90% <15% No >15% >15% Stable Moderately Diverse/Complex 8 22 36.36 Poor
Page 42
APPENDIX A Riparian Health Data
March 2016 Report No. 1532934 A-10
Name Reach Segment Start(a) Segment End(a) Length
[m] % Vegetation
Cover(b) % Woody Species Cover(b)
Evidence of Recruitment (Y/N) (b)
% Area of Human Caused Vegetation Cover Alteration(b)
% Area of Human Caused Bare Ground / Physical Alteration(b)
Overall Bank Stability? (b)
Adjacent Vegetation Structural Complexity(b) Score Possible
Score %
Score Health
Category Easting Northing Easting Northing
Holden Drainage HOL15 418304 5888286 419111 5888162 828.02 >90% <15% No >15% >15% Stable Not Diverse/Complex 6 22 27.27 PoorHolden Drainage HOL15 418304 5888300 419112 5888176 828.75 >90% <15% No >15% >15% Stable Not Diverse/Complex 6 22 27.27 PoorHolden Drainage HOL15 419112 5888176 419738 5887878 721.83 >90% <15% No >15% <5% Stable Not Diverse/Complex 10 22 45.45 PoorHolden Drainage HOL15 419111 5888162 419721 5887879 698.96 >90% <15% No >15% <5% Stable Not Diverse/Complex 10 22 45.45 PoorHolden Drainage HOL15 419743 5887871 419917 5887811 189.01 >90% <15% No >15% <5% Stable Not Diverse/Complex 10 22 45.45 PoorHolden Drainage HOL15 419725 5887872 419917 5887797 212.62 >90% <15% No >15% <5% Stable Not Diverse/Complex 10 22 45.45 PoorHolden Drainage HOL15 419925 5887811 420997 5887851 1,143.41 >90% <15% No >15% 5-15% Stable Not Diverse/Complex 8 22 36.36 Poor Holden Drainage HOL15 419924 5887797 421013 5887849 1,165.26 >90% <15% No >15% 5-15% Stable Not Diverse/Complex 8 22 36.36 Poor Holden Drainage HOL15 421002 5887857 421359 5887852 400.20 >90% <15% No >15% >15% Stable Not Diverse/Complex 6 22 27.27 PoorHolden Drainage HOL15 421019 5887857 421341 5887852 352.56 >90% <15% No >15% >15% Stable Not Diverse/Complex 6 22 27.27 PoorHolden Drainage HOL15 421347 5887845 421545 5887621 302.06 >90% <15% No >15% >15% Stable Not Diverse/Complex 6 22 27.27 PoorHolden Drainage HOL15 421366 5887844 421546 5887640 273.26 >90% <15% No >15% >15% Stable Not Diverse/Complex 6 22 27.27 PoorHolden Drainage HOL15 421552 5887633 423177 5887615 1,684.77 >90% <15% No >15% >15% Stable Not Diverse/Complex 6 22 27.27 PoorHolden Drainage HOL15 421551 5887616 423175 5887601 1,682.05 >90% <15% No >15% >15% Stable Not Diverse/Complex 6 22 27.27 PoorHolden Drainage HOL15 423186 5887616 423376 5887810 288.99 >90% <15% No >15% >15% Stable Not Diverse/Complex 6 22 27.27 PoorHolden Drainage HOL15 423186 5887602 423391 5887809 310.89 >90% <15% No >15% >15% Stable Not Diverse/Complex 6 22 27.27 PoorHolden Drainage HOL15 423377 5887817 424841 5889498 2,755.22 >90% <15% No >15% >15% Stable Not Diverse/Complex 6 22 27.27 PoorHolden Drainage HOL15 423392 5887818 424841 5889484 2,732.70 >90% <15% No >15% >15% Stable Not Diverse/Complex 6 22 27.27 PoorHolden Drainage HOL15 427394 5891180 428014 5891321 712.85 >90% <15% No >15% <5% Stable Not Diverse/Complex 10 22 45.45 PoorHolden Drainage HOL15 427261 5891135 428015 5891335 857.34 >90% <15% No >15% <5% Stable Not Diverse/Complex 10 22 45.45 PoorHolden Drainage HOL15 426495 5890700 427004 5890989 600.51 >90% <15% No >15% >15% Stable Not Diverse/Complex 6 22 27.27 PoorHolden Drainage HOL15 426495 5890686 427018 5890990 623.77 >90% <15% No >15% >15% Stable Not Diverse/Complex 6 22 27.27 PoorHolden Drainage HOL15 427019 5890998 427263 5891120 332.11 >90% <15% No >15% <5% Stable Not Diverse/Complex 10 22 45.45 PoorHolden Drainage HOL15 427005 5890999 427261 5891135 350.85 >90% <15% No >15% <5% Stable Not Diverse/Complex 10 22 45.45 PoorHolden Drainage HOL15 427263 5891120 427394 5891180 144.74 >90% 15-35% No >15% <5% Stable Not Diverse/Complex 11 22 50 Fair Holden Drainage HOL15 428015 5891335 428130 5891353 117.71 >90% <15% No >15% >15% Stable Not Diverse/Complex 6 22 27.27 PoorHolden Drainage HOL15 428014 5891321 428129 5891339 117.63 >90% <15% No >15% >15% Stable Not Diverse/Complex 6 22 27.27 PoorHolden Drainage HOL15 428129 5891339 428134 5891339 4.86 >90% <15% No >15% <5% Stable Not Diverse/Complex 10 22 45.45 PoorHolden Drainage HOL15 428130 5891353 428133 5891353 3.78 >90% <15% No >15% <5% Stable Not Diverse/Complex 10 22 45.45 PoorHolden Drainage HOL15 428134 5891339 428246 5891330 112.02 >90% <15% No >15% <5% Stable Not Diverse/Complex 10 22 45.45 PoorHolden Drainage HOL15 428246 5891330 428403 5891279 181.84 >90% <15% No >15% <5% Stable Not Diverse/Complex 10 22 45.45 PoorHolden Drainage HOL13 429284 5891971 428975 5892303 616.03 >90% 15-35% Yes >15% <5% Stable Moderately Diverse/Complex 15 22 68.18 Fair Holden Drainage HOL13 429270 5891963 428972 5892289 605.26 >90% 15-35% Yes >15% <5% Stable Moderately Diverse/Complex 15 22 68.18 Fair Holden Drainage HOL13 428972 5892289 428978 5892610 610.98 >90% <15% No >15% <5% Stable Not Diverse/Complex 10 22 45.45 PoorHolden Drainage HOL13 428975 5892303 428994 5892601 578.29 >90% <15% No >15% <5% Stable Not Diverse/Complex 10 22 45.45 PoorHolden Drainage HOL13 428977 5892626 428980 5892657 30.44 >90% <15% No >15% >15% Stable Not Diverse/Complex 6 22 27.27 PoorHolden Drainage HOL13 428991 5892619 428993 5892649 29.65 >90% <15% No >15% >15% Stable Not Diverse/Complex 6 22 27.27 PoorHolden Drainage HOL13 428982 5892663 429213 5892984 841.70 >90% 15-35% Yes 5-15% <5% Stable Moderately Diverse/Complex 17 22 77.27 Fair Holden Drainage HOL13 428994 5892656 429244 5892986 839.03 >90% 15-35% Yes 5-15% <5% Stable Moderately Diverse/Complex 17 22 77.27 Fair Holden Drainage HOL13 429213 5892984 429050 5893321 581.23 >90% <15% No 5-15% <5% Stable Not Diverse/Complex 12 22 54.55 Fair Holden Drainage HOL13 429244 5892986 428996 5893462 821.97 >90% <15% No 5-15% <5% Stable Not Diverse/Complex 12 22 54.55 Fair Holden Drainage HOL13 429050 5893321 429461 5893755 1,406.13 >90% >35% Yes 5-15% <5% Stable Diverse/Complex 20 22 90.91 Good Holden Drainage HOL13 428996 5893462 429474 5893761 1,182.51 >90% >35% Yes 5-15% <5% Stable Diverse/Complex 20 22 90.91 Good Holden Drainage HOL13 429461 5893755 429256 5894190 777.25 >90% 15-35% Yes 5-15% <5% Stable Moderately Diverse/Complex 17 22 77.27 Fair Holden Drainage HOL13 429474 5893761 429270 5894191 774.32 >90% 15-35% Yes 5-15% <5% Stable Moderately Diverse/Complex 17 22 77.27 Fair
Page 43
APPENDIX A Riparian Health Data
March 2016 Report No. 1532934 A-11
Name Reach Segment Start(a) Segment End(a) Length
[m] % Vegetation
Cover(b) % Woody Species Cover(b)
Evidence of Recruitment (Y/N) (b)
% Area of Human Caused Vegetation Cover Alteration(b)
% Area of Human Caused Bare Ground / Physical Alteration(b)
Overall Bank Stability? (b)
Adjacent Vegetation Structural Complexity(b) Score Possible
Score %
Score Health
Category Easting Northing Easting Northing
Holden Drainage HOL12 429204 5894315 429089 5894639 413.66 >90% <15% No >15% <5% Stable Not Diverse/Complex 10 22 45.45 PoorHolden Drainage HOL12 429218 5894310 429098 5894625 402.39 >90% <15% No >15% <5% Stable Not Diverse/Complex 10 22 45.45 PoorHolden Drainage HOL12 429098 5894625 429451 5895079 787.51 >90% <15% No >15% <5% Stable Moderately Diverse/Complex 12 22 54.55 Fair Holden Drainage HOL12 429089 5894639 429447 5895066 754.88 >90% <15% No >15% <5% Stable Moderately Diverse/Complex 12 22 54.55 Fair Holden Drainage HOL11 429505 5895959 429494 5897432 1,979.72 >90% <15% No >15% 5-15% Stable Not Diverse/Complex 8 22 36.36 Poor Holden Drainage HOL11 429510 5895946 429508 5897430 1,993.79 >90% <15% No >15% 5-15% Stable Not Diverse/Complex 8 22 36.36 Poor Holden Drainage HOL11 429351 5895575 429510 5895946 789.02 >90% >35% Yes 5-15% <5% Stable Diverse/Complex 20 22 90.91 Good Holden Drainage HOL11 429345 5895591 429505 5895959 789.02 >90% >35% Yes 5-15% <5% Stable Diverse/Complex 20 22 90.91 Good Holden Drainage HOL11 429492 5897442 429360 5897916 506.68 >90% <15% No >15% <5% Stable Not Diverse/Complex 10 22 45.45 PoorHolden Drainage HOL11 429507 5897439 429326 5897931 565.47 >90% <15% No >15% <5% Stable Not Diverse/Complex 10 22 45.45 PoorHolden Drainage HOL11 429360 5897916 429185 5898051 322.66 >90% >35% Yes 5-15% <5% Stable Moderately Diverse/Complex 18 22 81.82 Good Holden Drainage HOL11 429326 5897931 429196 5898043 257.95 >90% >35% Yes 5-15% <5% Stable Moderately Diverse/Complex 18 22 81.82 Good Holden Drainage HOL11 429196 5898043 429274 5898095 101.01 >90% <15% No >15% <5% Stable Not Diverse/Complex 10 22 45.45 PoorHolden Drainage HOL11 429185 5898051 429282 5898130 135.07 >90% <15% No >15% <5% Stable Not Diverse/Complex 10 22 45.45 PoorHolden Drainage HOL11 429282 5898130 429330 5898146 52.95 >90% >35% Yes <5% <5% Stable Moderately Diverse/Complex 20 22 90.91 Good Holden Drainage HOL11 429274 5898095 429332 5898131 75.48 >90% >35% Yes <5% <5% Stable Moderately Diverse/Complex 20 22 90.91 Good Holden Drainage HOL11 429330 5898146 429849 5899486 1,885.28 >90% <15% No >15% <5% Stable Not Diverse/Complex 10 22 45.45 PoorHolden Drainage HOL11 429332 5898131 429863 5899485 1,904.14 >90% <15% No >15% <5% Stable Not Diverse/Complex 10 22 45.45 PoorHolden Drainage HOL11 429849 5899490 429848 5899839 349.28 >90% <15% No >15% >15% Stable Not Diverse/Complex 6 22 27.27 PoorHolden Drainage HOL11 429863 5899490 429861 5899846 356.06 >90% <15% No >15% >15% Stable Not Diverse/Complex 6 22 27.27 PoorHolden Drainage HOL11 429848 5899839 429825 5900666 1,370.03 >90% <15% No >15% <5% Stable Not Diverse/Complex 10 22 45.45 PoorHolden Drainage HOL11 429861 5899846 429839 5900666 1,363.95 >90% <15% No >15% <5% Stable Not Diverse/Complex 10 22 45.45 PoorHolden Drainage HOL11 429823 5900673 429233 5901324 1,424.83 >90% <15% No >15% <5% Stable Not Diverse/Complex 10 22 45.45 PoorHolden Drainage HOL12 429451 5895079 429351 5895575 730.91 >90% >35% Yes 5-15% <5% Stable Diverse/Complex 20 22 90.91 Good Holden Drainage HOL12 429447 5895066 429345 5895591 766.24 >90% >35% Yes 5-15% <5% Stable Diverse/Complex 20 22 90.91 Good Holden Drainage HOL13 429254 5894200 429204 5894315 150.17 >90% <15% No >15% <5% Stable Not Diverse/Complex 10 22 45.45 PoorHolden Drainage HOL13 429268 5894200 429218 5894310 145.88 >90% <15% No >15% <5% Stable Not Diverse/Complex 10 22 45.45 PoorHolden Drainage HOL15 429147 5891326 429240 5891366 102.03 >90% <15% No >15% 5-15% Stable Not Diverse/Complex 8 22 36.36 PoorHolden Drainage HOL15 429133 5891332 429231 5891377 109.35 >90% <15% No >15% <5% Stable Not Diverse/Complex 10 22 45.45 PoorHolden Drainage HOL16 413402 5887835 414199 5887723 856.75 >90% <15% No >15% >15% Stable Not Diverse/Complex 6 22 27.27 PoorHolden Drainage HOL17 405892 5887707 405948 5887744 67.55 >90% <15% No >15% <5% Stable Not Diverse/Complex 10 22 45.45 PoorHolden Drainage HOL17 405903 5887698 405949 5887728 54.74 >90% <15% No >15% >15% Stable Not Diverse/Complex 6 22 27.27 PoorHolden Drainage HOL19 406077 5884886 406408 5885149 496.37 >90% <15% No >15% >15% Stable Not Diverse/Complex 6 22 27.27 PoorHolden Drainage HOL20 406815 5884957 406423 5885147 545.25 >90% <15% No >15% >15% Stable Not Diverse/Complex 6 22 27.27 PoorHolden Drainage HOL16 405963 5887740 405950 5888119 378.64 >90% <15% No >15% >15% Stable Not Diverse/Complex 6 22 27.27 PoorHolden Drainage HOL19 406094 5884885 406418 5885128 474.03 >90% <15% No >15% >15% Stable Not Diverse/Complex 6 22 27.27 PoorIrish Creek IRI05 510118 5959569 511399 5958322 1,863.58 >90% >35% Yes <5% <5% Stable Diverse/Complex 22 22 100 Good Irish Creek IRI05 510699 5959104 511413 5958322 1,085.85 >90% <15% No >15% <5% Stable Not Diverse/Complex 10 22 45.45 Poor Irish Creek IRI01 537758 5942151 538159 5942096 865.52 >90% >35% Yes <5% <5% Stable Diverse/Complex 22 22 100 Good Irish Creek IRI01 536497 5942864 537554 5942271 1,865.23 >90% >35% Yes <5% <5% Stable Diverse/Complex 22 22 100 Good
Irish Creek IRI01 537606 5942340 538154 5942111 1,377.32 >90% <15% No >15% 5-15% Moderately Unstable Not Diverse/Complex 6 22 27.27 Poor
Irish Creek IRI01 537554 5942271 537758 5942151 686.14 >90% <15% No >15% <5% Stable Not Diverse/Complex 10 22 45.45 Poor Irish Creek IRI01 536496 5942879 537033 5942735 686.81 >90% >35% Yes 5-15% <5% Stable Diverse/Complex 20 22 90.91 Good
Irish Creek IRI01 537033 5942735 537606 5942340 1,263.81 >90% <15% Yes >15% <5% Moderately Unstable Not Diverse/Complex 10 22 45.45 Poor
Page 44
APPENDIX A Riparian Health Data
March 2016 Report No. 1532934 A-12
Name Reach Segment Start(a) Segment End(a) Length
[m] % Vegetation
Cover(b) % Woody Species Cover(b)
Evidence of Recruitment (Y/N) (b)
% Area of Human Caused Vegetation Cover Alteration(b)
% Area of Human Caused Bare Ground / Physical Alteration(b)
Overall Bank Stability? (b)
Adjacent Vegetation Structural Complexity(b) Score Possible
Score %
Score Health
Category Easting Northing Easting Northing
Irish Creek IRI01 535729 5942869 536480 5942866 908.16 >90% >35% Yes <5% <5% Stable Diverse/Complex 22 22 100 Good Irish Creek IRI01 534860 5943494 535729 5942869 2,143.93 >90% <15% No >15% <5% Stable Not Diverse/Complex 10 22 45.45 Poor
Irish Creek IRI01 534861 5943508 535627 5943024 1,821.88 >90% <15% No >15% <5% Moderately Unstable Not Diverse/Complex 8 22 36.36 Poor
Irish Creek IRI01 535938 5942900 536485 5942880 692.28 >90% 15-35% No >15% <5% Stable Not Diverse/Complex 11 22 50 Fair Irish Creek IRI01 535627 5943024 535938 5942900 543.89 >90% 15-35% No 5-15% <5% Stable Moderately Diverse/Complex 15 22 68.18 Fair Irish Creek IRI01 534417 5943905 534854 5943495 788.69 >90% <15% Yes >15% <5% Stable Not Diverse/Complex 12 22 54.55 Fair Irish Creek IRI01 533306 5945502 534417 5943905 3,074.81 >90% >35% Yes <5% <5% Stable Diverse/Complex 22 22 100 Good Irish Creek IRI01 534037 5944304 534853 5943509 1,588.08 >90% <15% No >15% <5% Stable Not Diverse/Complex 10 22 45.45 Poor Irish Creek IRI01 533223 5945589 533319 5945509 131.74 >90% >35% No 5-15% <5% Stable Moderately Diverse/Complex 16 22 72.73 Fair Irish Creek IRI01 533222 5945575 533305 5945509 109.49 >90% >35% Yes <5% <5% Stable Diverse/Complex 22 22 100 Good Irish Creek IRI01 533321 5945502 533486 5944997 1,106.71 >90% >35% Yes 5-15% <5% Stable Diverse/Complex 20 22 90.91 Good Irish Creek IRI01 533486 5944997 534037 5944304 1,155.98 >90% >35% No >15% <5% Stable Moderately Diverse/Complex 14 22 63.64 Fair Irish Creek IRI01 532581 5945797 533215 5945589 982.42 >90% >35% Yes <5% <5% Stable Diverse/Complex 22 22 100 Good Irish Creek IRI01 531990 5946111 533216 5945575 1,804.88 >90% >35% Yes <5% <5% Stable Diverse/Complex 22 22 100 Good Irish Creek IRI01 531595 5945949 531834 5946025 260.16 >90% >35% No >15% <5% Stable Moderately Diverse/Complex 14 22 63.64 Fair Irish Creek IRI01 532248 5946121 532581 5945797 540.39 >90% <15% No 5-15% <5% Stable Not Diverse/Complex 12 22 54.55 Fair Irish Creek IRI01 531595 5945963 531832 5946040 259.15 >90% >35% No >15% <5% Stable Moderately Diverse/Complex 14 22 63.64 Fair Irish Creek IRI01 531834 5946025 531990 5946111 180.31 >90% <15% No >15% <5% Stable Not Diverse/Complex 10 22 45.45 Poor Irish Creek IRI01 531832 5946040 532248 5946121 463.24 >90% 15-35% No >15% <5% Stable Moderately Diverse/Complex 13 22 59.09 Fair Irish Creek IRI01 530763 5946164 531584 5945963 1,001.10 >90% 15-35% No >15% <5% Stable Not Diverse/Complex 11 22 50 Fair Irish Creek IRI01 530759 5946151 531584 5945949 1,004.96 >90% 15-35% No >15% <5% Stable Not Diverse/Complex 11 22 50 Fair Irish Creek IRI01 529966 5946157 530759 5946151 951.63 >90% 15-35% No 5-15% <5% Stable Moderately Diverse/Complex 15 22 68.18 Fair Irish Creek IRI01 529968 5946171 530763 5946164 953.31 >90% >35% No >15% <5% Stable Moderately Diverse/Complex 14 22 63.64 Fair Irish Creek IRI01 529196 5946116 529956 5946171 1,451.88 >90% <15% No >15% <5% Stable Not Diverse/Complex 10 22 45.45 Poor Irish Creek IRI02 528541 5945653 529449 5945733 1,944.32 >90% >35% Yes 5-15% <5% Stable Diverse/Complex 20 22 90.91 Good Irish Creek IRI02 528098 5945464 529571 5945480 2,229.32 >90% <15% No >15% <5% Stable Not Diverse/Complex 10 22 45.45 Poor Irish Creek IRI02 527527 5945219 528098 5945457 1,141.29 >90% <15% No >15% <5% Stable Not Diverse/Complex 10 22 45.45 Poor Irish Creek IRI02 527525 5945204 528112 5945457 1,164.49 >90% <15% No 5-15% <5% Stable Not Diverse/Complex 12 22 54.55 Fair Irish Creek IRI02 526729 5945205 527527 5945219 1,187.87 >90% <15% No >15% <5% Stable Not Diverse/Complex 10 22 45.45 Poor Irish Creek IRI02 526729 5945191 527525 5945204 1,187.05 >90% >35% No 5-15% <5% Stable Moderately Diverse/Complex 16 22 72.73 Fair Irish Creek IRI02 525515 5945157 526722 5945190 1,684.74 >90% <15% No >15% <5% Stable Not Diverse/Complex 10 22 45.45 Poor Irish Creek IRI02 525426 5945232 526720 5945204 1,842.55 >90% <15% No >15% <5% Stable Not Diverse/Complex 10 22 45.45 Poor Irish Creek IRI01 529291 5946063 529956 5946157 1,597.19 >90% >35% Yes <5% <5% Stable Diverse/Complex 22 22 100 Good Irish Creek IRI01 529436 5945738 529196 5946116 922.54 >90% >35% Yes <5% <5% Stable Diverse/Complex 22 22 100 Good Irish Creek IRI02 528112 5945465 528541 5945653 683.66 >90% 15-35% No >15% <5% Stable Not Diverse/Complex 11 22 50 Fair Irish Creek IRI02 525036 5945440 525426 5945232 573.34 >90% >35% Yes <5% <5% Stable Moderately Diverse/Complex 20 22 90.91 Good Irish Creek IRI02 525021 5945440 525515 5945157 750.40 >90% >35% Yes <5% <5% Stable Moderately Diverse/Complex 20 22 90.91 Good Irish Creek IRI02 524131 5946269 525034 5945448 1,473.69 >90% 15-35% No >15% <5% Stable Moderately Diverse/Complex 13 22 59.09 Fair Irish Creek IRI02 524112 5946204 525020 5945448 1,402.27 >90% <15% No >15% <5% Stable Moderately Diverse/Complex 12 22 54.55 Fair Irish Creek IRI02 523463 5946774 524131 5946269 950.44 >90% <15% No >15% <5% Stable Not Diverse/Complex 10 22 45.45 Poor Irish Creek IRI02 523463 5946760 524112 5946204 999.27 >90% <15% No >15% <5% Stable Not Diverse/Complex 10 22 45.45 Poor Irish Creek IRI02 521837 5948652 523455 5946775 2,875.00 >90% >35% Yes <5% <5% Stable Diverse/Complex 22 22 100 Good Irish Creek IRI02 521828 5948641 523457 5946761 2,886.97 >90% >35% Yes 5-15% <5% Stable Diverse/Complex 20 22 90.91 Good Irish Creek IRI03 520839 5949286 521470 5948978 793.75 >90% 15-35% No >15% <5% Stable Not Diverse/Complex 11 22 50 Fair Irish Creek IRI03 520833 5949274 521422 5948954 733.55 >90% 15-35% No >15% <5% Stable Not Diverse/Complex 11 22 50 Fair
Page 45
APPENDIX A Riparian Health Data
March 2016 Report No. 1532934 A-13
Name Reach Segment Start(a) Segment End(a) Length
[m] % Vegetation
Cover(b) % Woody Species Cover(b)
Evidence of Recruitment (Y/N) (b)
% Area of Human Caused Vegetation Cover Alteration(b)
% Area of Human Caused Bare Ground / Physical Alteration(b)
Overall Bank Stability? (b)
Adjacent Vegetation Structural Complexity(b) Score Possible
Score %
Score Health
Category Easting Northing Easting Northing
Irish Creek IRI03 520191 5949421 520839 5949286 797.18 >90% >35% No 5-15% <5% Stable Moderately Diverse/Complex 16 22 72.73 Fair Irish Creek IRI03 520189 5949407 520833 5949274 793.71 >90% >35% No 5-15% <5% Stable Moderately Diverse/Complex 16 22 72.73 Fair Irish Creek IRI03 521470 5948978 521794 5948707 453.19 >90% >35% No <5% <5% Stable Diverse/Complex 20 22 90.91 Good Irish Creek IRI03 521422 5948954 521781 5948701 502.75 >90% >35% Yes <5% <5% Stable Diverse/Complex 22 22 100 Good Irish Creek IRI03 519501 5950270 520181 5949407 1,264.00 >90% >35% Yes <5% <5% Stable Diverse/Complex 22 22 100 Good Irish Creek IRI03 519516 5950268 520183 5949421 1,242.45 >90% >35% Yes <5% <5% Stable Diverse/Complex 22 22 100 Good Irish Creek IRI03 518554 5951345 519516 5950268 1,598.72 >90% <15% No >15% 5-15% Stable Not Diverse/Complex 8 22 36.36 Poor Irish Creek IRI03 518554 5951331 519501 5950270 1,574.85 >90% <15% No >15% 5-15% Stable Not Diverse/Complex 8 22 36.36 Poor Irish Creek IRI03 517949 5951861 518539 5951345 963.05 >90% <15% No >15% <5% Stable Not Diverse/Complex 10 22 45.45 Poor Irish Creek IRI03 517934 5951863 518538 5951331 985.71 >90% <15% No >15% <5% Stable Not Diverse/Complex 10 22 45.45 Poor Irish Creek IRI03 517768 5952145 517946 5951872 331.94 >90% <15% No >15% <5% Stable Not Diverse/Complex 10 22 45.45 Poor Irish Creek IRI03 517760 5952133 517932 5951871 319.40 >90% <15% No >15% <5% Stable Not Diverse/Complex 10 22 45.45 Poor Irish Creek IRI03 517007 5952915 517768 5952145 1,129.03 >90% >35% Yes 5-15% <5% Stable Moderately Diverse/Complex 18 22 81.82 Good Irish Creek IRI03 516997 5952904 517760 5952133 1,130.93 >90% >35% Yes <5% <5% Stable Moderately Diverse/Complex 20 22 90.91 Good Irish Creek IRI03 516668 5953220 516997 5952904 480.67 >90% 15-35% No 5-15% <5% Stable Not Diverse/Complex 13 22 59.09 Fair Irish Creek IRI03 516667 5953234 517007 5952915 493.17 >90% <15% No >15% <5% Stable Not Diverse/Complex 10 22 45.45 Poor Irish Creek IRI03 516552 5953474 516655 5953236 274.48 >90% >35% Yes <5% <5% Stable Diverse/Complex 22 22 100 Good Irish Creek IRI03 516541 5953463 516655 5953221 285.35 >90% >35% Yes <5% 5-15% Stable Diverse/Complex 20 22 90.91 Good Irish Creek IRI03 515026 5954906 515890 5954153 1,214.03 >90% <15% No >15% <5% Stable Not Diverse/Complex 10 22 45.45 Poor Irish Creek IRI03 515027 5954892 515886 5954137 1,211.11 >90% <15% No >15% <5% Stable Not Diverse/Complex 10 22 45.45 Poor Irish Creek IRI03 516191 5953785 516552 5953474 506.16 >90% <15% No >15% <5% Stable Not Diverse/Complex 10 22 45.45 Poor Irish Creek IRI03 515886 5954137 516312 5953707 647.72 >90% >35% No <5% <5% Stable Not Diverse/Complex 16 22 72.73 Fair Irish Creek IRI03 515890 5954153 516191 5953785 503.92 >90% 15-35% No 5-15% <5% Stable Moderately Diverse/Complex 15 22 68.18 Fair Irish Creek IRI03 516312 5953707 516541 5953463 353.73 >90% <15% No >15% <5% Stable Not Diverse/Complex 10 22 45.45 Poor Irish Creek IRI03 514423 5955078 515017 5954906 795.95 >90% 15-35% No 5-15% <5% Stable Moderately Diverse/Complex 15 22 68.18 Fair Irish Creek IRI03 514405 5955080 515017 5954892 821.75 >90% >35% Yes <5% <5% Stable Diverse/Complex 22 22 100 Good Irish Creek IRI05 513394 5956337 514398 5955118 1,599.46 >90% 15-35% No >15% <5% Stable Moderately Diverse/Complex 13 22 59.09 Fair Irish Creek IRI05 513395 5956322 514387 5955110 1,585.61 >90% >35% Yes <5% <5% Stable Diverse/Complex 22 22 100 Good Irish Creek IRI05 513076 5956609 513383 5956338 411.13 >90% <15% No 5-15% <5% Stable Not Diverse/Complex 12 22 54.55 Fair Irish Creek IRI05 512280 5957478 513076 5956609 1,204.60 >90% >35% Yes <5% <5% Stable Diverse/Complex 22 22 100 Good Irish Creek IRI05 511755 5957796 513383 5956324 2,269.14 >90% >35% Yes <5% <5% Stable Diverse/Complex 22 22 100 Good Irish Creek IRI05 511755 5957811 512280 5957478 653.44 >90% 15-35% Yes 5-15% <5% Stable Moderately Diverse/Complex 17 22 77.27 Fair Irish Creek IRI05 511414 5958312 511741 5957815 609.20 >90% >35% Yes 5-15% <5% Stable Moderately Diverse/Complex 18 22 81.82 Good Irish Creek IRI05 511400 5958311 511743 5957800 633.48 >90% >35% Yes <5% <5% Stable Diverse/Complex 22 22 100 Good Irish Creek IRI05 509335 5959798 510103 5959569 918.86 >90% >35% Yes <5% <5% Stable Diverse/Complex 22 22 100 Good Irish Creek IRI05 509342 5959811 509735 5959734 491.12 >90% >35% Yes <5% <5% Stable Diverse/Complex 22 22 100 Good Irish Creek IRI05 510116 5959583 510699 5959104 802.01 >90% >35% No 5-15% <5% Stable Diverse/Complex 18 22 81.82 Good Irish Creek IRI05 508850 5959965 509335 5959798 588.05 >90% 15-35% No >15% <5% Stable Moderately Diverse/Complex 13 22 59.09 Fair Irish Creek IRI05 508863 5959971 509342 5959811 579.05 >90% 15-35% No >15% <5% Stable Moderately Diverse/Complex 13 22 59.09 Fair Irish Creek IRI05 509735 5959734 510103 5959583 421.16 >90% <15% No >15% <5% Stable Not Diverse/Complex 10 22 45.45 Poor Irish Creek IRI02 529571 5945480 529436 5945738 403.83 >90% >35% Yes <5% <5% Stable Diverse/Complex 22 22 100 Good Irish Creek IRI01 529449 5945733 529291 5946063 769.95 >90% >35% Yes 5-15% <5% Stable Diverse/Complex 20 22 90.91 Good Irish Creek IRI03 514398 5955118 514413 5955094 28.96 >90% 15-35% No >15% <5% Stable Moderately Diverse/Complex 13 22 59.09 Fair Irish Creek IRI03 514387 5955110 514397 5955093 19.39 >90% >35% Yes <5% <5% Stable Diverse/Complex 22 22 100 Good
Irish Creek IRI01 538154 5942111 538176 5942160 57.20 >90% <15% No >15% 5-15% Moderately Unstable Not Diverse/Complex 6 22 27.27 Poor
Page 46
APPENDIX A Riparian Health Data
March 2016 Report No. 1532934 A-14
Name Reach Segment Start(a) Segment End(a) Length
[m] % Vegetation
Cover(b) % Woody Species Cover(b)
Evidence of Recruitment (Y/N) (b)
% Area of Human Caused Vegetation Cover Alteration(b)
% Area of Human Caused Bare Ground / Physical Alteration(b)
Overall Bank Stability? (b)
Adjacent Vegetation Structural Complexity(b) Score Possible
Score %
Score Health
Category Easting Northing Easting Northing
Irish River IRI02 521794 5948707 521813 5948679 33.49 >90% >35% No <5% <5% Stable Diverse/Complex 20 22 90.91 Good Irish River IRI02 521803 5948669 521781 5948701 38.65 >90% >35% Yes <5% <5% Stable Diverse/Complex 22 22 100 Good Lamont Creek LAM03 411096 5955931 412185 5957540 2,530.36 >90% <15% No >15% <5% Stable Not Diverse/Complex 10 22 45.45 PoorLamont Creek LAM03 411081 5955932 412187 5957555 2,553.69 >90% <15% No >15% <5% Stable Not Diverse/Complex 10 22 45.45 PoorLamont Creek LAM01 431564 5945949 432025 5945754 1,043.09 >90% <15% No >15% <5% Stable Not Diverse/Complex 10 22 45.45 PoorLamont Creek LAM01 431581 5945949 432024 5945768 1,021.92 >90% <15% No >15% <5% Stable Not Diverse/Complex 10 22 45.45 PoorLamont Creek LAM01 431182 5946016 431569 5945958 722.77 >90% 15-35% No 5-15% <5% Stable Moderately Diverse/Complex 15 22 68.18 Fair Lamont Creek LAM01 431184 5946030 431583 5945956 745.63 >90% <15% No >15% <5% Stable Not Diverse/Complex 10 22 45.45 PoorLamont Creek LAM01 429903 5946310 431174 5946016 2,533.88 >90% <15% No >15% <5% Stable Not Diverse/Complex 10 22 45.45 PoorLamont Creek LAM01 429898 5946323 431174 5946030 2,537.32 >90% <15% No >15% <5% Stable Not Diverse/Complex 10 22 45.45 PoorLamont Creek LAM03 428636 5947837 429543 5946502 1,883.49 >90% <15% No >15% <5% Stable Not Diverse/Complex 10 22 45.45 PoorLamont Creek LAM03 427956 5948127 429546 5946516 2,855.00 >90% <15% No >15% <5% Stable Not Diverse/Complex 10 22 45.45 PoorLamont Creek LAM03 427955 5948113 428636 5947837 968.90 >90% 15-35% No >15% <5% Stable Not Diverse/Complex 11 22 50 Fair Lamont Creek LAM03 427958 5948889 427947 5948127 988.58 >90% <15% No >15% 5-15% Stable Not Diverse/Complex 8 22 36.36 PoorLamont Creek LAM03 427958 5948903 427946 5948113 1,032.32 >90% <15% No >15% <5% Stable Not Diverse/Complex 10 22 45.45 PoorLamont Creek LAM03 428124 5949231 427967 5948906 451.38 >90% <15% No >15% <5% Stable Not Diverse/Complex 10 22 45.45 PoorLamont Creek LAM03 428138 5949231 427966 5948891 474.42 >90% <15% No >15% <5% Stable Not Diverse/Complex 10 22 45.45 PoorLamont Creek LAM03 427979 5949630 428125 5949239 566.23 >90% >35% No 5-15% <5% Stable Moderately Diverse/Complex 16 22 72.73 Fair Lamont Creek LAM03 427977 5949645 428139 5949238 591.43 >90% >35% No 5-15% <5% Stable Moderately Diverse/Complex 16 22 72.73 Fair Lamont Creek LAM03 427416 5950848 427970 5949632 1,878.54 >90% <15% No >15% <5% Stable Not Diverse/Complex 10 22 45.45 PoorLamont Creek LAM03 427426 5950859 427969 5949648 1,866.24 >90% <15% No >15% <5% Stable Not Diverse/Complex 10 22 45.45 PoorLamont Creek LAM03 427191 5951333 427416 5950848 785.68 >90% >35% Yes 5-15% <5% Stable Moderately Diverse/Complex 18 22 81.82 Good Lamont Creek LAM03 427199 5951346 427426 5950859 788.66 >90% >35% No >15% <5% Stable Not Diverse/Complex 12 22 54.55 FairLamont Creek LAM03 426393 5952045 426900 5952068 622.87 >90% 15-35% No >15% <5% Stable Not Diverse/Complex 11 22 50 Fair Lamont Creek LAM03 426392 5952059 426907 5952082 632.68 >90% <15% No >15% <5% Stable Not Diverse/Complex 10 22 45.45 PoorLamont Creek LAM03 427204 5951725 427199 5951346 512.26 >90% 15-35% No >15% <5% Stable Not Diverse/Complex 11 22 50 Fair Lamont Creek LAM03 427204 5951739 427191 5951333 548.71 >90% <15% No >15% <5% Stable Not Diverse/Complex 10 22 45.45 PoorLamont Creek LAM03 427215 5952085 427204 5951739 716.56 >90% <15% No >15% >15% Stable Not Diverse/Complex 6 22 27.27 PoorLamont Creek LAM03 427210 5952099 427204 5951725 765.60 >90% <15% No >15% >15% Stable Not Diverse/Complex 6 22 27.27 PoorLamont Creek LAM03 426900 5952068 427007 5952047 351.79 >90% >35% No >15% <5% Stable Moderately Diverse/Complex 14 22 63.64 Fair Lamont Creek LAM03 426907 5952082 426991 5952054 326.94 >90% 15-35% No >15% <5% Stable Not Diverse/Complex 11 22 50 Fair Lamont Creek LAM03 427007 5952047 427215 5952085 231.92 >90% <15% No >15% <5% Stable Not Diverse/Complex 10 22 45.45 PoorLamont Creek LAM03 426991 5952054 427210 5952099 245.76 >90% <15% No >15% <5% Stable Not Diverse/Complex 10 22 45.45 PoorLamont Creek LAM03 424774 5952305 426385 5952045 1,898.28 >90% <15% No >15% <5% Stable Not Diverse/Complex 10 22 45.45 PoorLamont Creek LAM03 424774 5952319 426386 5952059 1,899.23 >90% <15% No >15% <5% Stable Not Diverse/Complex 10 22 45.45 PoorLamont Creek LAM03 424651 5952478 424767 5952320 212.54 >90% <15% No >15% 5-15% Stable Not Diverse/Complex 8 22 36.36 PoorLamont Creek LAM03 424637 5952478 424765 5952306 233.69 >90% 15-35% No >15% 5-15% Stable Not Diverse/Complex 9 22 40.91 PoorLamont Creek LAM03 423575 5953722 424636 5952487 1,976.36 >90% <15% No >15% <5% Stable Not Diverse/Complex 10 22 45.45 PoorLamont Creek LAM03 423575 5953736 424650 5952487 1,996.80 >90% <15% No >15% <5% Stable Not Diverse/Complex 10 22 45.45 PoorLamont Creek LAM03 423089 5954507 423567 5953721 984.54 >90% <15% No >15% <5% Stable Not Diverse/Complex 10 22 45.45 PoorLamont Creek LAM03 422883 5954880 423567 5953735 1,416.10 >90% <15% No >15% <5% Stable Not Diverse/Complex 10 22 45.45 PoorLamont Creek LAM03 422636 5955285 422866 5954881 475.42 >90% <15% No >15% <5% Stable Not Diverse/Complex 10 22 45.45 PoorLamont Creek LAM03 422653 5955286 422883 5954880 476.41 >90% <15% No >15% <5% Stable Not Diverse/Complex 10 22 45.45 PoorLamont Creek LAM03 422490 5955701 422636 5955285 450.23 >90% 15-35% No 5-15% <5% Stable Not Diverse/Complex 13 22 59.09 Fair Lamont Creek LAM03 422505 5955701 422653 5955286 451.42 >90% 15-35% No 5-15% <5% Stable Not Diverse/Complex 13 22 59.09 Fair
Page 47
APPENDIX A Riparian Health Data
March 2016 Report No. 1532934 A-15
Name Reach Segment Start(a) Segment End(a) Length
[m] % Vegetation
Cover(b) % Woody Species Cover(b)
Evidence of Recruitment (Y/N) (b)
% Area of Human Caused Vegetation Cover Alteration(b)
% Area of Human Caused Bare Ground / Physical Alteration(b)
Overall Bank Stability? (b)
Adjacent Vegetation Structural Complexity(b) Score Possible
Score %
Score Health
Category Easting Northing Easting Northing
Lamont Creek LAM03 422866 5954881 423089 5954507 454.89 >90% >35% Yes <5% <5% Stable Moderately Diverse/Complex 20 22 90.91 Good Lamont Creek LAM03 421980 5956239 422490 5955710 879.33 >90% 15-35% No >15% <5% Stable Not Diverse/Complex 11 22 50 Fair Lamont Creek LAM03 421979 5956253 422504 5955711 901.79 >90% 15-35% No >15% <5% Stable Not Diverse/Complex 11 22 50 Fair Lamont Creek LAM03 420382 5958229 421449 5957012 1,711.56 >90% <15% No >15% <5% Stable Not Diverse/Complex 10 22 45.45 PoorLamont Creek LAM03 420381 5958243 421450 5957030 1,711.92 >90% <15% No >15% <5% Stable Not Diverse/Complex 10 22 45.45 PoorLamont Creek LAM03 421659 5956706 421971 5956239 628.16 >90% <15% No >15% <5% Stable Not Diverse/Complex 10 22 45.45 PoorLamont Creek LAM03 421677 5956725 421972 5956253 625.62 >90% <15% No >15% <5% Stable Not Diverse/Complex 10 22 45.45 PoorLamont Creek LAM03 421449 5957012 421659 5956706 412.62 >90% 15-35% No >15% <5% Stable Moderately Diverse/Complex 13 22 59.09 Fair Lamont Creek LAM03 421450 5957030 421677 5956725 416.28 >90% 15-35% No >15% <5% Stable Moderately Diverse/Complex 13 22 59.09 Fair Lamont Creek LAM03 419540 5958641 420083 5958386 663.27 >90% <15% No >15% <5% Stable Not Diverse/Complex 10 22 45.45 PoorLamont Creek LAM03 419559 5958643 420087 5958400 643.60 >90% <15% No >15% <5% Stable Not Diverse/Complex 10 22 45.45 PoorLamont Creek LAM03 420083 5958386 420373 5958229 469.39 >90% >35% No 5-15% <5% Stable Moderately Diverse/Complex 16 22 72.73 Fair Lamont Creek LAM03 420087 5958400 420373 5958243 465.88 >90% >35% No 5-15% <5% Stable Moderately Diverse/Complex 16 22 72.73 Fair Lamont Creek LAM03 419311 5958971 419540 5958641 421.74 >90% 15-35% No 5-15% <5% Stable Moderately Diverse/Complex 15 22 68.18 Fair Lamont Creek LAM03 419325 5958982 419559 5958643 433.26 >90% 15-35% No 5-15% <5% Stable Moderately Diverse/Complex 15 22 68.18 Fair Lamont Creek LAM03 418764 5959119 419312 5959008 601.07 >90% <15% No >15% <5% Stable Not Diverse/Complex 10 22 45.45 PoorLamont Creek LAM03 418766 5959133 419326 5959006 624.39 >90% <15% No >15% <5% Stable Not Diverse/Complex 10 22 45.45 PoorLamont Creek LAM03 417157 5960214 418325 5959828 1,620.70 >90% <15% No >15% <5% Stable Not Diverse/Complex 10 22 45.45 PoorLamont Creek LAM03 417155 5960200 418210 5959860 1,495.52 >90% <15% No >15% <5% Stable Not Diverse/Complex 10 22 45.45 PoorLamont Creek LAM03 418680 5959415 418755 5959136 298.09 >90% >35% Yes 5-15% <5% Stable Moderately Diverse/Complex 18 22 81.82 Good Lamont Creek LAM03 418660 5959420 418755 5959121 327.76 >90% >35% Yes 5-15% <5% Stable Moderately Diverse/Complex 18 22 81.82 Good Lamont Creek LAM03 418210 5959860 418660 5959420 646.55 >90% 15-35% No >15% <5% Stable Moderately Diverse/Complex 13 22 59.09 Fair Lamont Creek LAM03 418325 5959828 418680 5959415 549.26 >90% 15-35% No >15% <5% Stable Moderately Diverse/Complex 13 22 59.09 Fair Lamont Creek LAM03 416832 5959864 417149 5960213 498.20 >90% <15% No >15% <5% Stable Not Diverse/Complex 10 22 45.45 PoorLamont Creek LAM03 416850 5959864 417148 5960199 473.02 >90% <15% No >15% <5% Stable Not Diverse/Complex 10 22 45.45 PoorLamont Creek LAM03 416334 5959385 416832 5959864 789.29 >90% >35% Yes <5% <5% Stable Diverse/Complex 22 22 100 Good Lamont Creek LAM03 416334 5959370 416850 5959864 813.86 >90% >35% Yes <5% <5% Stable Diverse/Complex 22 22 100 Good Lamont Creek LAM03 415503 5959191 416334 5959385 899.93 >90% <15% No >15% <5% Stable Not Diverse/Complex 10 22 45.45 PoorLamont Creek LAM03 415502 5959176 416334 5959370 899.98 >90% <15% No >15% <5% Stable Not Diverse/Complex 10 22 45.45 PoorLamont Creek LAM03 415003 5959092 415495 5959179 531.16 >90% <15% No >15% <5% Stable Not Diverse/Complex 10 22 45.45 PoorLamont Creek LAM03 414989 5959091 415496 5959194 554.41 >90% <15% No >15% <5% Stable Not Diverse/Complex 10 22 45.45 PoorLamont Creek LAM03 413856 5958450 414988 5959070 1,359.65 >90% <15% No >15% <5% Stable Not Diverse/Complex 10 22 45.45 PoorLamont Creek LAM03 413856 5958436 415002 5959066 1,378.14 >90% <15% No >15% <5% Stable Not Diverse/Complex 10 22 45.45 PoorLamont Creek LAM03 413041 5958148 413845 5958449 865.40 >90% <15% No >15% <5% Stable Not Diverse/Complex 10 22 45.45 PoorLamont Creek LAM03 413041 5958132 413846 5958435 866.43 >90% <15% No >15% <5% Stable Not Diverse/Complex 10 22 45.45 PoorLamont Creek LAM03 412789 5958041 413041 5958148 276.87 >90% 15-35% No >15% <5% Stable Moderately Diverse/Complex 13 22 59.09 Fair Lamont Creek LAM03 412765 5958020 413041 5958132 302.64 >90% 15-35% No >15% <5% Stable Moderately Diverse/Complex 13 22 59.09 Fair Lamont Creek LAM03 412205 5957558 412789 5958041 853.73 >90% <15% No >15% <5% Stable Not Diverse/Complex 10 22 45.45 PoorLamont Creek LAM03 412212 5957545 412765 5958020 820.74 >90% <15% No >15% <5% Stable Not Diverse/Complex 10 22 45.45 PoorLamont Creek LAM03 408880 5955077 409691 5954922 1,047.33 >90% >35% Yes <5% <5% Stable Diverse/Complex 22 22 100 Good Lamont Creek LAM03 408878 5955063 409691 5954905 1,048.13 >90% >35% Yes <5% <5% Stable Diverse/Complex 22 22 100 Good Lamont Creek LAM03 410750 5955045 411077 5955917 1,006.62 >90% <15% No >15% <5% Stable Not Diverse/Complex 10 22 45.45 PoorLamont Creek LAM03 410756 5955032 411091 5955915 1,020.84 >90% <15% No >15% <5% Stable Not Diverse/Complex 10 22 45.45 PoorLamont Creek LAM03 410515 5954959 410750 5955045 255.22 >90% >35% Yes <5% <5% Stable Diverse/Complex 22 22 100 Good Lamont Creek LAM03 410514 5954945 410756 5955032 262.16 >90% >35% Yes <5% <5% Stable Diverse/Complex 22 22 100 Good
Page 48
APPENDIX A Riparian Health Data
March 2016 Report No. 1532934 A-16
Name Reach Segment Start(a) Segment End(a) Length
[m] % Vegetation
Cover(b) % Woody Species Cover(b)
Evidence of Recruitment (Y/N) (b)
% Area of Human Caused Vegetation Cover Alteration(b)
% Area of Human Caused Bare Ground / Physical Alteration(b)
Overall Bank Stability? (b)
Adjacent Vegetation Structural Complexity(b) Score Possible
Score %
Score Health
Category Easting Northing Easting Northing
Lamont Creek LAM03 409999 5955085 410505 5954959 537.30 >90% <15% No >15% <5% Stable Not Diverse/Complex 10 22 45.45 PoorLamont Creek LAM03 410005 5955072 410505 5954945 531.84 >90% <15% No >15% <5% Stable Not Diverse/Complex 10 22 45.45 PoorLamont Creek LAM03 409691 5954922 409999 5955085 355.40 >90% >35% No <5% <5% Stable Moderately Diverse/Complex 18 22 81.82 Good Lamont Creek LAM03 409691 5954905 410005 5955072 362.10 >90% >35% No 5-15% <5% Stable Moderately Diverse/Complex 16 22 72.73 Fair Lamont Creek LAM03 408668 5954532 408871 5955077 592.25 >90% <15% No >15% <5% Stable Not Diverse/Complex 10 22 45.45 PoorLamont Creek LAM03 408684 5954545 408872 5955063 558.52 >90% <15% No >15% <5% Stable Not Diverse/Complex 10 22 45.45 PoorLamont Creek LAM03 408777 5954156 408668 5954532 423.17 >90% >35% No 5-15% <5% Stable Moderately Diverse/Complex 16 22 72.73 Fair Lamont Creek LAM03 408786 5954167 408684 5954545 424.66 >90% >35% Yes <5% <5% Stable Moderately Diverse/Complex 20 22 90.91 Good Lamont Creek LAM03 429556 5946515 429898 5946323 490.09 >90% <15% No >15% <5% Stable Not Diverse/Complex 10 22 45.45 PoorLamont Creek LAM03 429558 5946501 429903 5946310 493.02 >90% <15% No >15% <5% Stable Not Diverse/Complex 10 22 45.45 PoorMarwayne Creek MAR03 545459 5927931 544765 5928284 990.06 >90% <15% No >15% <5% Stable Not Diverse/Complex 10 22 45.45 Poor Marwayne Creek MAR03 546174 5928154 544768 5928298 1,993.61 >90% <15% No >15% <5% Stable Not Diverse/Complex 10 22 45.45 Poor Marwayne Creek MAR01 540614 5929164 540631 5928898 440.65 >90% 15-35% No >15% <5% Stable Not Diverse/Complex 11 22 50 Fair Marwayne Creek MAR01 540628 5929163 540636 5928882 458.86 >90% 15-35% No >15% <5% Stable Not Diverse/Complex 11 22 50 Fair Marwayne Creek MAR02 541158 5929869 540972 5929542 467.97 >90% >35% No <5% <5% Stable Moderately Diverse/Complex 18 22 81.82 Good Marwayne Creek MAR02 541459 5930050 540958 5929541 1,113.31 >90% <15% No >15% <5% Stable Not Diverse/Complex 10 22 45.45 Poor Marwayne Creek MAR02 541473 5930048 541158 5929869 642.99 >90% 15-35% No >15% <5% Stable Not Diverse/Complex 11 22 50 Fair Marwayne Creek MAR01 540821 5929208 540628 5929173 355.58 >90% <15% Yes >15% <5% Stable Not Diverse/Complex 12 22 54.55 Fair Marwayne Creek MAR02 542414 5930655 541268 5930978 1,790.23 >90% <15% No >15% <5% Stable Not Diverse/Complex 10 22 45.45 Poor Marwayne Creek MAR02 541461 5930843 541473 5930055 2,734.17 >90% >35% Yes 5-15% <5% Stable Diverse/Complex 20 22 90.91 Good Marwayne Creek MAR02 543743 5929669 543117 5929645 967.99 >90% <15% No >15% <5% Stable Not Diverse/Complex 10 22 45.45 Poor Marwayne Creek MAR02 543779 5929607 543118 5929631 1,033.80 >90% <15% No >15% 5-15% Stable Not Diverse/Complex 8 22 36.36 Poor Marwayne Creek MAR03 544544 5928590 544174 5928911 743.93 >90% >35% No <5% <5% Stable Moderately Diverse/Complex 18 22 81.82 Good Marwayne Creek MAR03 544527 5928587 544176 5928925 768.97 >90% >35% No 5-15% <5% Stable Moderately Diverse/Complex 16 22 72.73 Fair Marwayne Creek MAR03 546483 5927809 546180 5928157 633.56 >90% <15% No >15% <5% Stable Not Diverse/Complex 10 22 45.45 Poor Marwayne Creek MAR03 546471 5927802 546190 5928144 607.73 >90% <15% No >15% <5% Stable Not Diverse/Complex 10 22 45.45 Poor Marwayne Creek MAR03 546183 5928142 545968 5928253 340.21 >90% <15% No >15% 5-15% Stable Not Diverse/Complex 8 22 36.36 Poor Marwayne Creek MAR03 545968 5928253 545459 5927931 675.52 >90% 15-35% No >15% <5% Stable Moderately Diverse/Complex 13 22 59.09 Fair Marwayne Creek MAR03 544754 5928299 544562 5928585 410.95 >90% <15% No >15% <5% Stable Not Diverse/Complex 10 22 45.45 Poor Marwayne Creek MAR03 544755 5928285 544530 5928583 447.78 >90% <15% No >15% <5% Stable Not Diverse/Complex 10 22 45.45 Poor Marwayne Creek MAR02 544199 5929405 543962 5929626 559.94 >90% <15% No >15% <5% Stable Not Diverse/Complex 10 22 45.45 Poor Marwayne Creek MAR02 544185 5929405 543779 5929607 816.15 >90% 15-35% No >15% <5% Stable Not Diverse/Complex 11 22 50 Fair Marwayne Creek MAR02 543962 5929626 543743 5929669 345.01 >90% >35% Yes <5% <5% Stable Diverse/Complex 22 22 100 Good Marwayne Creek MAR02 543110 5929631 542626 5930203 1,016.32 >90% <15% No >15% <5% Stable Not Diverse/Complex 10 22 45.45 Poor Marwayne Creek MAR02 543110 5929645 542640 5930205 995.21 >90% <15% No >15% <5% Stable Not Diverse/Complex 10 22 45.45 Poor Marwayne Creek MAR02 542640 5930205 542414 5930655 692.73 >90% 15-35% No >15% <5% Stable Not Diverse/Complex 11 22 50 Fair Marwayne Creek MAR02 542626 5930203 542357 5930528 513.99 >90% 15-35% No >15% <5% Stable Moderately Diverse/Complex 13 22 59.09 Fair Marwayne Creek MAR02 542357 5930528 541461 5930843 1,685.85 >90% <15% No >15% <5% Stable Not Diverse/Complex 10 22 45.45 Poor Marwayne Creek MAR02 540914 5930815 541444 5930052 1,477.30 >90% >35% Yes <5% <5% Stable Diverse/Complex 22 22 100 Good Marwayne Creek MAR02 541268 5930978 540914 5930815 996.77 >90% 15-35% No >15% <5% Stable Not Diverse/Complex 11 22 50 Fair Marwayne Creek MAR01 540958 5929541 540614 5929175 783.29 >90% <15% No >15% <5% Stable Not Diverse/Complex 10 22 45.45 Poor Marwayne Creek MAR01 540972 5929542 540821 5929208 430.01 >90% >35% No <5% <5% Stable Moderately Diverse/Complex 18 22 81.82 Good Marwayne Creek MAR02 544176 5928925 544185 5929398 659.34 >90% >35% No 5-15% <5% Stable Moderately Diverse/Complex 16 22 72.73 Fair Marwayne Creek MAR02 544174 5928911 544199 5929398 682.95 >90% >35% No <5% <5% Stable Moderately Diverse/Complex 18 22 81.82 Good Mundare Creek MUN05 413176 5938669 414796 5938858 1,724.72 >90% >35% Yes <5% <5% Stable Not Diverse/Complex 18 22 81.82 Good
Page 49
APPENDIX A Riparian Health Data
March 2016 Report No. 1532934 A-17
Name Reach Segment Start(a) Segment End(a) Length
[m] % Vegetation
Cover(b) % Woody Species Cover(b)
Evidence of Recruitment (Y/N) (b)
% Area of Human Caused Vegetation Cover Alteration(b)
% Area of Human Caused Bare Ground / Physical Alteration(b)
Overall Bank Stability? (b)
Adjacent Vegetation Structural Complexity(b) Score Possible
Score %
Score Health
Category Easting Northing Easting Northing
Mundare Creek MUN05 413175 5938655 414795 5938844 1,724.22 >90% >35% Yes <5% <5% Stable Not Diverse/Complex 18 22 81.82 Good Mundare Creek MUN01 429065 5938958 429377 5939492 870.31 >90% 15-35% Yes 5-15% <5% Stable Diverse/Complex 19 22 86.36 Good Mundare Creek MUN01 429389 5939485 429126 5938970 798.03 >90% >35% Yes 5-15% <5% Stable Diverse/Complex 20 22 90.91 Good Mundare Creek MUN01 427802 5938116 428943 5938868 2,275.81 >90% >35% No 5-15% <5% Stable Moderately Diverse/Complex 16 22 72.73 Fair Mundare Creek MUN01 427800 5938102 428970 5938863 2,304.51 >90% >35% Yes 5-15% <5% Stable Diverse/Complex 20 22 90.91 Good Mundare Creek MUN01 428970 5938863 429126 5938970 216.54 >90% <15% No >15% 5-15% Stable Moderately Diverse/Complex 10 22 45.45 Poor Mundare Creek MUN01 428943 5938868 429065 5938958 158.79 >90% <15% No >15% <5% Stable Moderately Diverse/Complex 12 22 54.55 Fair Mundare Creek MUN03 426815 5936321 427023 5937791 2,166.10 >90% <15% No >15% <5% Stable Not Diverse/Complex 10 22 45.45 Poor Mundare Creek MUN02 427032 5937781 427793 5938101 1,310.23 >90% 15-35% Yes <5% <5% Stable Moderately Diverse/Complex 19 22 86.36 Good Mundare Creek MUN03 426829 5936321 426660 5937514 1,567.51 >90% <15% No >15% <5% Stable Not Diverse/Complex 10 22 45.45 Poor Mundare Creek MUN03 426694 5935846 426815 5936313 872.25 >90% <15% No >15% <5% Stable Not Diverse/Complex 10 22 45.45 Poor Mundare Creek MUN03 426707 5935838 426829 5936313 880.42 >90% <15% No >15% <5% Stable Not Diverse/Complex 10 22 45.45 Poor Mundare Creek MUN03 426143 5935989 426694 5935846 761.99 >90% >35% Yes 5-15% <5% Stable Moderately Diverse/Complex 18 22 81.82 Good Mundare Creek MUN03 426141 5935975 426707 5935838 775.64 >90% 15-35% Yes 5-15% <5% Stable Moderately Diverse/Complex 17 22 77.27 Fair Mundare Creek MUN03 425055 5935526 426136 5935989 1,463.37 >90% <15% No >15% <5% Stable Not Diverse/Complex 10 22 45.45 Poor Mundare Creek MUN03 425069 5935528 426136 5935975 1,438.85 >90% <15% No >15% <5% Stable Not Diverse/Complex 10 22 45.45 Poor Mundare Creek MUN03 424958 5935055 425055 5935526 563.76 >90% >35% No <5% <5% Stable Diverse/Complex 20 22 90.91 Good Mundare Creek MUN03 425027 5935210 425069 5935528 362.94 >90% 15-35% No 5-15% <5% Stable Moderately Diverse/Complex 15 22 68.18 Fair Mundare Creek MUN03 424490 5934438 424958 5935055 1,252.94 >90% <15% No >15% <5% Stable Not Diverse/Complex 10 22 45.45 Poor Mundare Creek MUN03 424490 5934423 425027 5935210 1,477.71 >90% <15% No >15% <5% Stable Not Diverse/Complex 10 22 45.45 Poor Mundare Creek MUN03 422870 5935023 423802 5934607 1,306.85 >90% <15% No >15% <5% Stable Not Diverse/Complex 10 22 45.45 Poor Mundare Creek MUN03 423771 5934648 424483 5934420 845.41 >90% >35% Yes >15% <5% Stable Not Diverse/Complex 14 22 63.64 Fair Mundare Creek MUN03 422869 5935009 423501 5934922 741.16 >90% >35% No >15% <5% Stable Moderately Diverse/Complex 14 22 63.64 Fair Mundare Creek MUN03 423501 5934922 423771 5934648 500.64 >90% <15% No >15% <5% Stable Not Diverse/Complex 10 22 45.45 Poor Mundare Creek MUN03 423802 5934607 424482 5934435 778.66 >90% 15-35% No >15% <5% Stable Moderately Diverse/Complex 13 22 59.09 Fair Mundare Creek MUN04 421268 5936481 422514 5935370 1,841.65 >90% >35% Yes <5% <5% Stable Diverse/Complex 22 22 100 Good Mundare Creek MUN04 421268 5936495 422510 5935597 1,620.97 >90% <15% No >15% <5% Stable Not Diverse/Complex 10 22 45.45 Poor Mundare Creek MUN04 419975 5936941 421261 5936495 1,402.95 >90% 15-35% No >15% <5% Stable Moderately Diverse/Complex 13 22 59.09 Fair Mundare Creek MUN04 419646 5937041 421261 5936480 1,768.63 >90% >35% Yes <5% <5% Stable Diverse/Complex 22 22 100 Good Mundare Creek MUN04 419647 5937055 419975 5936941 366.59 >90% >35% Yes <5% <5% Stable Diverse/Complex 22 22 100 Good Mundare Creek MUN03 422573 5935297 422861 5935024 484.37 >90% <15% No >15% <5% Stable Not Diverse/Complex 10 22 45.45 Poor Mundare Creek MUN04 422510 5935597 422527 5935374 239.07 >90% 15-35% No >15% <5% Stable Not Diverse/Complex 11 22 50 Fair Mundare Creek MUN05 419040 5937417 419570 5937161 642.84 >90% >35% Yes <5% <5% Stable Diverse/Complex 22 22 100 Good Mundare Creek MUN05 419036 5937404 419558 5937153 635.59 >90% >35% Yes <5% <5% Stable Diverse/Complex 22 22 100 Good Mundare Creek MUN05 418058 5939230 419245 5938954 2,120.34 >90% <15% Yes >15% <5% Stable Not Diverse/Complex 12 22 54.55 Fair Mundare Creek MUN05 419272 5939180 419153 5938378 848.98 >90% 15-35% No >15% <5% Stable Not Diverse/Complex 11 22 50 Fair Mundare Creek MUN05 418057 5939216 419091 5939461 1,237.72 >90% <15% No >15% <5% Stable Not Diverse/Complex 10 22 45.45 Poor Mundare Creek MUN05 419091 5939461 419272 5939180 609.98 >90% 15-35% No <5% <5% Stable Moderately Diverse/Complex 17 22 77.27 Fair Mundare Creek MUN05 419245 5938954 419166 5938372 607.95 >90% 15-35% No >15% <5% Stable Not Diverse/Complex 11 22 50 Fair Mundare Creek MUN05 418907 5937944 419036 5937404 638.62 >90% <15% No >15% <5% Stable Not Diverse/Complex 10 22 45.45 Poor Mundare Creek MUN05 418906 5937924 419040 5937417 595.95 >90% <15% No >15% <5% Stable Not Diverse/Complex 10 22 45.45 Poor Mundare Creek MUN05 419153 5938378 418907 5937944 528.82 >90% >35% Yes 5-15% <5% Stable Moderately Diverse/Complex 18 22 81.82 Good Mundare Creek MUN05 419166 5938372 418906 5937924 547.67 >90% >35% Yes 5-15% <5% Stable Moderately Diverse/Complex 18 22 81.82 Good Mundare Creek MUN05 416817 5939440 418051 5939229 1,280.64 >90% >35% Yes >15% <5% Stable Moderately Diverse/Complex 16 22 72.73 Fair Mundare Creek MUN05 416841 5939430 418051 5939215 1,256.46 >90% >35% Yes >15% <5% Stable Moderately Diverse/Complex 16 22 72.73 Fair
Page 50
APPENDIX A Riparian Health Data
March 2016 Report No. 1532934 A-18
Name Reach Segment Start(a) Segment End(a) Length
[m] % Vegetation
Cover(b) % Woody Species Cover(b)
Evidence of Recruitment (Y/N) (b)
% Area of Human Caused Vegetation Cover Alteration(b)
% Area of Human Caused Bare Ground / Physical Alteration(b)
Overall Bank Stability? (b)
Adjacent Vegetation Structural Complexity(b) Score Possible
Score %
Score Health
Category Easting Northing Easting Northing
Mundare Creek MUN05 416430 5939334 416817 5939440 403.69 >90% <15% No >15% <5% Stable Not Diverse/Complex 10 22 45.45 Poor Mundare Creek MUN05 416429 5939320 416841 5939430 428.12 >90% <15% No >15% <5% Stable Not Diverse/Complex 10 22 45.45 Poor Mundare Creek MUN05 414803 5938857 416422 5939334 1,922.51 >90% <15% No >15% <5% Stable Not Diverse/Complex 10 22 45.45 Poor Mundare Creek MUN05 414804 5938843 416422 5939320 1,921.38 >90% <15% No >15% <5% Stable Not Diverse/Complex 10 22 45.45 Poor Mundare Creek MUN05 412135 5938480 413168 5938669 1,081.99 >90% >35% Yes <5% <5% Stable Diverse/Complex 22 22 100 Good Mundare Creek MUN05 412137 5938466 413169 5938655 1,080.17 >90% >35% Yes <5% <5% Stable Diverse/Complex 22 22 100 Good Mundare Creek MUN02 427023 5937791 427792 5938115 1,319.31 >90% <15% No >15% <5% Stable Not Diverse/Complex 10 22 45.45 Poor Mundare Creek MUN03 426660 5937514 427032 5937781 586.06 >90% 15-35% Yes <5% <5% Stable Moderately Diverse/Complex 19 22 86.36 Good Mundare Creek MUN03 422527 5935374 422573 5935297 97.40 >90% 15-35% No >15% <5% Stable Not Diverse/Complex 11 22 50 Fair Mundare Creek MUN03 422514 5935370 422861 5935010 598.65 >90% >35% Yes <5% <5% Stable Diverse/Complex 22 22 100 Good Mundare Creek MUN04 419570 5937161 419641 5937055 132.24 >90% >35% Yes <5% <5% Stable Diverse/Complex 22 22 100 Good Mundare Creek MUN04 419558 5937153 419640 5937041 144.44 >90% >35% Yes <5% <5% Stable Diverse/Complex 22 22 100 Good Mundare Creek MUN01 429377 5939492 429380 5939507 15.81 >90% 15-35% Yes 5-15% <5% Stable Diverse/Complex 19 22 86.36 Good Mundare Creek MUN01 429389 5939485 429394 5939506 22.21 >90% >35% Yes 5-15% <5% Stable Diverse/Complex 20 22 90.91 Good Stretton Creek STR03 549468 5910756 550805 5911534 1,734.50 >90% <15% No >15% <5% Stable Not Diverse/Complex 10 22 45.45 Poor Stretton Creek STR03 549481 5910751 550819 5911529 1,736.08 >90% <15% No 5-15% <5% Stable Not Diverse/Complex 12 22 54.55 Fair Stretton Creek STR01 539919 5926950 539978 5927079 184.36 >90% <15% No >15% <5% Stable Not Diverse/Complex 10 22 45.45 Poor Stretton Creek STR01 539943 5926829 539990 5927064 308.91 >90% <15% No >15% <5% Stable Not Diverse/Complex 10 22 45.45 Poor Stretton Creek STR01 539884 5926467 539943 5926829 524.66 >90% 15-35% No 5-15% <5% Stable Moderately Diverse/Complex 15 22 68.18 Fair Stretton Creek STR01 539881 5926482 539919 5926950 634.61 >90% 15-35% No 5-15% <5% Stable Moderately Diverse/Complex 15 22 68.18 Fair Stretton Creek STR01 540750 5925459 539877 5926480 2,206.35 >90% >35% Yes <5% <5% Stable Diverse/Complex 22 22 100 Good
Stretton Creek STR01 541014 5925198 539880 5926466 3,163.90 >90% <15% No >15% <5% Moderately Unstable Not Diverse/Complex 8 22 36.36 Poor
Stretton Creek STR01 541602 5924829 540750 5925459 2,071.26 >90% >35% No >15% <5% Stable Not Diverse/Complex 12 22 54.55 Fair
Stretton Creek STR01 543160 5924014 541014 5925198 5,291.24 >90% <15% No >15% <5% Moderately Unstable Not Diverse/Complex 8 22 36.36 Poor
Stretton Creek STR01 543160 5924000 542597 5924371 2,039.79 >90% <15% No >15% <5% Moderately Unstable Not Diverse/Complex 8 22 36.36 Poor
Stretton Creek STR01 542597 5924371 542161 5924534 648.90 >90% 15-35% No >15% <5% Moderately Unstable Not Diverse/Complex 9 22 40.91 Poor
Stretton Creek STR01 542161 5924534 541602 5924829 1,544.11 >90% >35% Yes 5-15% <5% Stable Moderately Diverse/Complex 18 22 81.82 Good Stretton Creek STR01 544564 5923544 543169 5924001 2,542.20 >90% <15% No >15% <5% Stable Not Diverse/Complex 10 22 45.45 Poor Stretton Creek STR01 544730 5922935 543169 5924015 3,454.47 >90% <15% No >15% <5% Stable Not Diverse/Complex 10 22 45.45 Poor Stretton Creek STR01 544716 5922935 544713 5923261 339.84 >90% <15% No >15% <5% Stable Not Diverse/Complex 10 22 45.45 Poor Stretton Creek STR01 544713 5923261 544564 5923544 550.65 >90% 15-35% No >15% <5% Stable Moderately Diverse/Complex 13 22 59.09 Fair Stretton Creek STR01 544738 5922465 544731 5922926 517.39 >90% <15% No >15% <5% Stable Not Diverse/Complex 10 22 45.45 Poor Stretton Creek STR01 544634 5922330 544738 5922465 207.80 >90% >35% Yes <5% <5% Stable Moderately Diverse/Complex 20 22 90.91 Good Stretton Creek STR01 544471 5922048 544717 5922926 1,165.03 >90% <15% No >15% <5% Stable Not Diverse/Complex 10 22 45.45 Poor Stretton Creek STR01 544820 5921705 544634 5922330 1,017.78 >90% <15% No >15% <5% Stable Not Diverse/Complex 10 22 45.45 Poor Stretton Creek STR01 544821 5921688 544471 5922048 601.97 >90% >35% No 5-15% <5% Stable Moderately Diverse/Complex 16 22 72.73 Fair Stretton Creek STR02 545832 5920072 544932 5920806 2,063.95 >90% >35% Yes 5-15% <5% Stable Moderately Diverse/Complex 18 22 81.82 Good Stretton Creek STR02 544976 5920783 545036 5921193 584.13 >90% <15% No >15% <5% Stable Not Diverse/Complex 10 22 45.45 Poor Stretton Creek STR02 546475 5919541 546392 5919701 236.40 >90% <15% No >15% <5% Stable Not Diverse/Complex 10 22 45.45 Poor Stretton Creek STR02 546476 5919555 546406 5919701 214.97 >90% <15% No >15% <5% Stable Not Diverse/Complex 10 22 45.45 Poor Stretton Creek STR02 546406 5919710 546287 5920102 464.73 >90% 15-35% No >15% <5% Stable Moderately Diverse/Complex 13 22 59.09 Fair Stretton Creek STR02 546287 5920102 545205 5920061 1,495.48 >90% <15% No >15% <5% Stable Not Diverse/Complex 10 22 45.45 Poor Stretton Creek STR02 545205 5920061 544976 5920783 1,009.04 >90% >35% Yes <5% <5% Stable Moderately Diverse/Complex 20 22 90.91 Good
Page 51
APPENDIX A Riparian Health Data
March 2016 Report No. 1532934 A-19
Name Reach Segment Start(a) Segment End(a) Length
[m] % Vegetation
Cover(b) % Woody Species Cover(b)
Evidence of Recruitment (Y/N) (b)
% Area of Human Caused Vegetation Cover Alteration(b)
% Area of Human Caused Bare Ground / Physical Alteration(b)
Overall Bank Stability? (b)
Adjacent Vegetation Structural Complexity(b) Score Possible
Score %
Score Health
Category Easting Northing Easting Northing
Stretton Creek STR02 545052 5921460 544892 5921593 252.04 >90% <15% No >15% 5-15% Stable Not Diverse/Complex 8 22 36.36 Poor Stretton Creek STR02 545036 5921193 545052 5921460 284.27 >90% >35% No 5-15% <5% Stable Moderately Diverse/Complex 16 22 72.73 Fair Stretton Creek STR02 544932 5920806 544881 5921582 1,067.14 >90% <15% No >15% <5% Stable Not Diverse/Complex 10 22 45.45 Poor Stretton Creek STR02 546392 5919711 545832 5920072 947.03 >90% <15% Yes 5-15% <5% Stable Moderately Diverse/Complex 16 22 72.73 Fair Stretton Creek STR02 548136 5917152 547777 5917279 923.99 >90% <15% No >15% <5% Stable Not Diverse/Complex 10 22 45.45 Poor Stretton Creek STR02 547072 5918976 546724 5919369 592.06 >90% <15% No >15% <5% Stable Moderately Diverse/Complex 12 22 54.55 Fair Stretton Creek STR02 548135 5917167 547786 5917102 555.80 >90% <15% No >15% <5% Stable Not Diverse/Complex 10 22 45.45 Poor Stretton Creek STR02 547786 5917102 547816 5917257 313.68 >90% <15% No 5-15% <5% Stable Moderately Diverse/Complex 14 22 63.64 Fair Stretton Creek STR02 547816 5917257 547612 5917425 308.37 >90% <15% No 5-15% <5% Stable Not Diverse/Complex 12 22 54.55 Fair Stretton Creek STR02 547612 5917425 547525 5917924 711.84 >90% 15-35% No 5-15% <5% Stable Moderately Diverse/Complex 15 22 68.18 Fair Stretton Creek STR02 547525 5917924 547542 5918455 802.28 >90% >35% No 5-15% <5% Stable Moderately Diverse/Complex 16 22 72.73 Fair Stretton Creek STR02 547542 5918455 547072 5918976 830.35 >90% <15% No >15% <5% Stable Not Diverse/Complex 10 22 45.45 Poor Stretton Creek STR02 546724 5919369 546482 5919554 314.84 >90% <15% No >15% <5% Stable Not Diverse/Complex 10 22 45.45 Poor Stretton Creek STR02 546695 5919372 546481 5919539 281.66 >90% >35% No <5% <5% Stable Moderately Diverse/Complex 18 22 81.82 Good Stretton Creek STR02 547183 5918713 546695 5919372 915.05 >90% 15-35% No 5-15% <5% Stable Moderately Diverse/Complex 15 22 68.18 Fair Stretton Creek STR02 547512 5917725 547183 5918713 1,584.16 >90% <15% No >15% <5% Stable Not Diverse/Complex 10 22 45.45 Poor Stretton Creek STR02 547777 5917279 547512 5917725 723.10 >90% 15-35% No >15% <5% Stable Not Diverse/Complex 11 22 50 Fair Stretton Creek STR02 548842 5916503 548322 5917007 794.45 >90% >35% Yes <5% <5% Stable Diverse/Complex 22 22 100 Good Stretton Creek STR02 548491 5916885 548141 5917170 598.84 >90% <15% No >15% <5% Stable Not Diverse/Complex 10 22 45.45 Poor Stretton Creek STR02 548861 5916504 548491 5916885 575.79 >90% >35% Yes <5% <5% Stable Diverse/Complex 22 22 100 Good Stretton Creek STR02 548322 5917007 548141 5917155 356.42 >90% 15-35% No 5-15% <5% Stable Moderately Diverse/Complex 15 22 68.18 Fair Stretton Creek STR02 549786 5915571 548857 5916489 1,943.23 >90% 15-35% No >15% <5% Stable Moderately Diverse/Complex 13 22 59.09 Fair Stretton Creek STR02 549786 5915585 548875 5916490 1,918.56 >90% 15-35% No >15% <5% Stable Moderately Diverse/Complex 13 22 59.09 Fair Stretton Creek STR03 550680 5914993 550112 5915287 879.60 >90% >35% No 5-15% <5% Stable Diverse/Complex 18 22 81.82 Good Stretton Creek STR03 550737 5914891 550122 5915297 1,007.42 >90% >35% No 5-15% 5-15% Stable Diverse/Complex 16 22 72.73 Fair Stretton Creek STR03 551581 5913253 551449 5913740 535.79 >90% 15-35% No 5-15% <5% Stable Moderately Diverse/Complex 15 22 68.18 Fair Stretton Creek STR03 551595 5913252 551448 5913757 560.28 >90% 15-35% No >15% 5-15% Stable Moderately Diverse/Complex 11 22 50 Fair Stretton Creek STR03 551734 5912402 551582 5913234 918.97 >90% <15% No >15% <5% Stable Not Diverse/Complex 10 22 45.45 Poor Stretton Creek STR03 551749 5912403 551596 5913237 922.00 >90% <15% No >15% <5% Stable Not Diverse/Complex 10 22 45.45 Poor Stretton Creek STR03 551596 5911572 551752 5912390 1,204.20 >90% <15% No >15% <5% Stable Not Diverse/Complex 10 22 45.45 Poor Stretton Creek STR03 551594 5911587 551738 5912389 1,182.26 >90% <15% No >15% <5% Stable Not Diverse/Complex 10 22 45.45 Poor Stretton Creek STR03 551005 5911529 551586 5911569 840.28 >90% <15% No >15% <5% Stable Not Diverse/Complex 10 22 45.45 Poor Stretton Creek STR03 551019 5911529 551585 5911584 817.01 >90% <15% No >15% <5% Stable Not Diverse/Complex 10 22 45.45 Poor Stretton Creek STR03 550819 5911529 551005 5911529 249.73 >90% >35% Yes <5% <5% Stable Diverse/Complex 22 22 100 Good Stretton Creek STR03 550805 5911534 551019 5911529 290.32 >90% >35% Yes <5% <5% Stable Diverse/Complex 22 22 100 Good Stretton Creek STR03 551439 5913759 551195 5914261 633.99 >90% >35% No 5-15% 5-15% Stable Diverse/Complex 16 22 72.73 Fair Stretton Creek STR03 551437 5913745 551195 5914247 632.04 >90% >35% No 5-15% <5% Stable Diverse/Complex 18 22 81.82 Good Stretton Creek STR03 551195 5914261 550737 5914891 1,113.89 >90% >35% Yes >15% <5% Stable Diverse/Complex 18 22 81.82 Good Stretton Creek STR03 551195 5914247 550680 5914993 1,252.37 >90% >35% Yes 5-15% 5-15% Stable Diverse/Complex 18 22 81.82 Good Stretton Creek STR01 544892 5921593 544832 5921698 128.25 >90% <15% No >15% 5-15% Stable Not Diverse/Complex 8 22 36.36 Poor Stretton Creek STR01 544881 5921582 544832 5921681 115.99 >90% <15% No >15% <5% Stable Not Diverse/Complex 10 22 45.45 Poor Stretton Creek STR02 550122 5915297 549794 5915585 565.78 >90% >35% No 5-15% 5-15% Stable Diverse/Complex 16 22 72.73 Fair Stretton Creek STR02 550112 5915287 549794 5915571 555.08 >90% >35% No 5-15% <5% Stable Diverse/Complex 18 22 81.82 Good Vermilion River VER20 431334 5901905 430892 5902001 1,758.57 >90% <15% No >15% <5% Stable Moderately Diverse/Complex 12 22 54.55 Fair Vermilion River VER20 431436 5901944 430882 5902012 1,675.62 >90% <15% No >15% <5% Stable Moderately Diverse/Complex 12 22 54.55 Fair
Page 52
APPENDIX A Riparian Health Data
March 2016 Report No. 1532934 A-20
Name Reach Segment Start(a) Segment End(a) Length
[m] % Vegetation
Cover(b) % Woody Species Cover(b)
Evidence of Recruitment (Y/N) (b)
% Area of Human Caused Vegetation Cover Alteration(b)
% Area of Human Caused Bare Ground / Physical Alteration(b)
Overall Bank Stability? (b)
Adjacent Vegetation Structural Complexity(b) Score Possible
Score %
Score Health
Category Easting Northing Easting Northing
Vermilion River VER08 504117 5912933 509287 5912411 7,660.34 >90% >35% Yes <5% <5% Stable Diverse/Complex 22 22 100 Good Vermilion River VER09 497431 5914026 503337 5913114 11,459.71 >90% <15% No >15% <5% Stable Not Diverse/Complex 10 22 45.45 Poor Vermilion River VER06 523115 5921952 523444 5922175 499.43 >90% <15% No >15% <5% Stable Moderately Diverse/Complex 12 22 54.55 Fair Vermilion River VER05 532022 5923802 532922 5926061 5,001.61 >90% <15% No >15% 5-15% Stable Not Diverse/Complex 8 22 36.36 Poor Vermilion River VER17 431818 5926892 431021 5927123 2,454.19 >90% <15% No >15% <5% Stable Not Diverse/Complex 10 22 45.45 PoorVermilion River VER10 472029 5939056 472669 5938253 1,818.62 >90% 15-35% No >15% <5% Stable Not Diverse/Complex 11 22 50 Fair Vermilion River VER09 484901 5914841 488396 5913740 8,028.97 >90% <15% No >15% <5% Stable Not Diverse/Complex 10 22 45.45 PoorVermilion River VER01 543298 5944921 543903 5945832 1,656.62 >90% >35% Yes <5% <5% Stable Diverse/Complex 22 22 100 Good Vermilion River VER20 438355 5887873 438207 5888215 378.99 >90% <15% N/A >15% >15% Stable Not Diverse/Complex 6 20 30 PoorVermilion River VER20 438345 5887862 438200 5888202 376.01 >90% <15% N/A >15% <5% Stable Not Diverse/Complex 10 20 50 FairVermilion River VER20 437963 5888403 437773 5889140 788.18 >90% <15% No >15% <5% Stable Not Diverse/Complex 10 22 45.45 PoorVermilion River VER20 437956 5888382 437772 5889125 788.61 >90% <15% No >15% <5% Stable Not Diverse/Complex 10 22 45.45 PoorVermilion River VER20 437535 5889687 437203 5890491 886.85 >90% <15% No >15% <5% Stable Not Diverse/Complex 10 22 45.45 PoorVermilion River VER20 437522 5889682 437191 5890485 885.55 >90% <15% No >15% <5% Stable Not Diverse/Complex 10 22 45.45 PoorVermilion River VER20 438207 5888215 437963 5888403 316.25 >90% 15-35% No >15% <5% Stable Moderately Diverse/Complex 13 22 59.09 Fair Vermilion River VER20 438200 5888202 437956 5888382 309.18 >90% <15% No >15% <5% Stable Moderately Diverse/Complex 12 22 54.55 Fair Vermilion River VER20 437773 5889140 437535 5889687 669.02 >90% <15% Yes >15% <5% Stable Moderately Diverse/Complex 14 22 63.64 Fair Vermilion River VER20 437772 5889125 437522 5889682 685.56 >90% <15% No >15% <5% Stable Not Diverse/Complex 10 22 45.45 PoorVermilion River VER20 437203 5890491 437196 5890506 17.17 <75% N/A N/A >15% >15% Stable Not Diverse/Complex 4 18 22.22 PoorVermilion River VER20 437191 5890485 437182 5890504 20.65 <75% N/A N/A >15% >15% Stable Not Diverse/Complex 4 18 22.22 PoorVermilion River VER20 437196 5890506 437105 5890676 197.44 >90% <15% No >15% <5% Stable Not Diverse/Complex 10 22 45.45 PoorVermilion River VER20 437182 5890504 437090 5890677 201.65 >90% <15% No >15% <5% Stable Not Diverse/Complex 10 22 45.45 PoorVermilion River VER20 437103 5890683 436515 5891951 1,530.68 >90% <15% No >15% <5% Stable Not Diverse/Complex 10 22 45.45 PoorVermilion River VER20 436515 5891951 436499 5892000 60.55 75-90% N/A N/A >15% >15% Stable Not Diverse/Complex 5 18 27.78 Poor Vermilion River VER20 437088 5890683 436623 5892399 2,030.68 >90% <15% No >15% <5% Stable Not Diverse/Complex 10 22 45.45 PoorVermilion River VER20 436623 5892399 436656 5892420 39.69 <75% <15% N/A >15% >15% Stable Not Diverse/Complex 4 20 20 PoorVermilion River VER20 436656 5892420 437179 5893114 1,110.97 >90% <15% No >15% >15% Stable Not Diverse/Complex 6 22 27.27 PoorVermilion River VER20 437179 5893114 437207 5893292 215.47 >90% 15-35% No >15% <5% Stable Moderately Diverse/Complex 13 22 59.09 Fair Vermilion River VER20 436499 5892000 436471 5893937 3,553.00 >90% <15% No >15% 5-15% Stable Not Diverse/Complex 8 22 36.36 Poor Vermilion River VER20 437207 5893292 436453 5893939 1,749.60 >90% <15% No >15% 5-15% Stable Not Diverse/Complex 8 22 36.36 Poor Vermilion River VER20 436451 5893949 436378 5894786 1,355.65 >90% <15% No 5-15% <5% Stable Moderately Diverse/Complex 14 22 63.64 Fair Vermilion River VER20 436466 5893948 436392 5894793 1,363.68 >90% <15% No 5-15% <5% Stable Moderately Diverse/Complex 14 22 63.64 Fair Vermilion River VER20 436392 5894793 436242 5895147 812.99 >90% <15% No >15% <5% Stable Not Diverse/Complex 10 22 45.45 PoorVermilion River VER20 436378 5894786 436243 5895132 797.95 >90% <15% No >15% <5% Stable Not Diverse/Complex 10 22 45.45 PoorVermilion River VER20 436237 5895133 436177 5895266 154.90 >90% <15% No >15% <5% Stable Not Diverse/Complex 10 22 45.45 PoorVermilion River VER20 436238 5895147 436193 5895263 131.13 >90% <15% No >15% <5% Stable Not Diverse/Complex 10 22 45.45 PoorVermilion River VER20 436193 5895263 436205 5895414 163.86 >90% <15% No >15% <5% Stable Not Diverse/Complex 10 22 45.45 PoorVermilion River VER20 436177 5895266 436188 5895410 156.62 >90% <15% No >15% <5% Stable Not Diverse/Complex 10 22 45.45 PoorVermilion River VER20 436188 5895410 435486 5896133 1,763.12 >90% <15% No >15% <5% Stable Not Diverse/Complex 10 22 45.45 PoorVermilion River VER20 436205 5895414 435484 5896148 1,780.09 >90% <15% No >15% <5% Stable Moderately Diverse/Complex 12 22 54.55 Fair Vermilion River VER20 435484 5896148 435216 5896249 758.45 >90% <15% No >15% <5% Stable Not Diverse/Complex 10 22 45.45 PoorVermilion River VER20 435486 5896133 435206 5896237 770.01 >90% <15% No >15% <5% Stable Not Diverse/Complex 10 22 45.45 PoorVermilion River VER20 435206 5896237 435090 5896381 321.10 >90% <15% No <5% <5% Stable Moderately Diverse/Complex 16 22 72.73 Fair Vermilion River VER20 435216 5896249 435102 5896389 317.08 >90% <15% No <5% <5% Stable Moderately Diverse/Complex 16 22 72.73 Fair Vermilion River VER20 435090 5896381 434868 5896894 703.87 >90% <15% No 5-15% <5% Stable Moderately Diverse/Complex 14 22 63.64 Fair
Page 53
APPENDIX A Riparian Health Data
March 2016 Report No. 1532934 A-21
Name Reach Segment Start(a) Segment End(a) Length
[m] % Vegetation
Cover(b) % Woody Species Cover(b)
Evidence of Recruitment (Y/N) (b)
% Area of Human Caused Vegetation Cover Alteration(b)
% Area of Human Caused Bare Ground / Physical Alteration(b)
Overall Bank Stability? (b)
Adjacent Vegetation Structural Complexity(b) Score Possible
Score %
Score Health
Category Easting Northing Easting Northing
Vermilion River VER20 435102 5896389 434907 5896870 656.42 >90% <15% No 5-15% <5% Stable Moderately Diverse/Complex 14 22 63.64 Fair Vermilion River VER20 434868 5896894 434724 5897250 444.14 >90% <15% No >15% <5% Stable Not Diverse/Complex 10 22 45.45 PoorVermilion River VER20 434907 5896870 434738 5897250 482.98 >90% <15% No >15% <5% Stable Not Diverse/Complex 10 22 45.45 PoorVermilion River VER20 434482 5897464 433921 5897701 1,421.81 >90% 15-35% Yes >15% <5% Stable Moderately Diverse/Complex 15 22 68.18 Fair Vermilion River VER20 434497 5897460 433870 5897774 1,545.47 >90% 15-35% Yes >15% <5% Stable Moderately Diverse/Complex 15 22 68.18 Fair Vermilion River VER20 434739 5897256 434482 5897464 525.67 >90% >35% Yes <5% <5% Stable Diverse/Complex 22 22 100 Good Vermilion River VER20 434725 5897257 434497 5897460 484.30 >90% >35% Yes 5-15% <5% Stable Diverse/Complex 20 22 90.91 Good Vermilion River VER20 433921 5897701 433545 5898107 912.21 >90% <15% No >15% <5% Stable Not Diverse/Complex 10 22 45.45 PoorVermilion River VER20 433870 5897774 433543 5898133 859.09 >90% <15% Yes >15% <5% Stable Not Diverse/Complex 12 22 54.55 FairVermilion River VER20 433543 5898133 433386 5898283 593.55 >90% <15% No >15% <5% Stable Moderately Diverse/Complex 12 22 54.55 Fair Vermilion River VER20 433545 5898107 433400 5898278 618.33 >90% <15% No >15% <5% Stable Moderately Diverse/Complex 12 22 54.55 Fair Vermilion River VER20 433249 5898825 433244 5899120 645.29 >90% <15% No >15% <5% Stable Not Diverse/Complex 10 22 45.45 PoorVermilion River VER20 433284 5898816 433231 5899130 665.24 >90% <15% No >15% <5% Stable Not Diverse/Complex 10 22 45.45 PoorVermilion River VER20 433165 5899118 433088 5899123 77.16 >90% <15% No >15% 5-15% Stable Not Diverse/Complex 8 22 36.36 PoorVermilion River VER20 433165 5899104 433087 5899109 78.18 >90% <15% No >15% <5% Stable Not Diverse/Complex 10 22 45.45 PoorVermilion River VER20 433231 5899130 433165 5899118 67.62 >90% <15% No >15% <5% Stable Not Diverse/Complex 10 22 45.45 PoorVermilion River VER20 433244 5899120 433165 5899104 80.42 >90% <15% No >15% <5% Stable Not Diverse/Complex 10 22 45.45 PoorVermilion River VER20 433401 5898284 433373 5898566 428.61 >90% <15% No >15% <5% Stable Not Diverse/Complex 10 22 45.45 PoorVermilion River VER20 433387 5898290 433385 5898555 388.37 >90% <15% No >15% <5% Stable Not Diverse/Complex 10 22 45.45 PoorVermilion River VER20 433328 5898686 433253 5898695 76.54 >90% <15% No >15% <5% Stable Not Diverse/Complex 10 22 45.45 PoorVermilion River VER20 433384 5898687 433255 5898710 132.19 >90% <15% No >15% 5-15% Stable Not Diverse/Complex 8 22 36.36 PoorVermilion River VER20 433341 5898612 433328 5898686 181.05 >90% <15% No >15% <5% Stable Not Diverse/Complex 10 22 45.45 PoorVermilion River VER20 433385 5898555 433341 5898612 128.88 >90% <15% No >15% <5% Stable Not Diverse/Complex 10 22 45.45 PoorVermilion River VER20 433363 5898601 433384 5898687 145.19 >90% <15% No >15% 5-15% Stable Not Diverse/Complex 8 22 36.36 PoorVermilion River VER20 433373 5898566 433363 5898601 95.22 >90% <15% No >15% <5% Stable Not Diverse/Complex 10 22 45.45 PoorVermilion River VER20 433253 5898695 433249 5898825 365.06 >90% <15% No >15% <5% Stable Moderately Diverse/Complex 12 22 54.55 Fair Vermilion River VER20 433255 5898710 433284 5898816 360.44 >90% 15-35% Yes >15% <5% Stable Moderately Diverse/Complex 15 22 68.18 Fair Vermilion River VER20 433081 5899110 433098 5900358 2,786.65 >90% <15% No >15% 5-15% Stable Not Diverse/Complex 8 22 36.36 Poor Vermilion River VER20 433082 5899124 432862 5900345 2,480.15 >90% <15% No >15% 5-15% Stable Not Diverse/Complex 8 22 36.36 Poor Vermilion River VER20 433104 5900357 433373 5900528 670.53 >90% <15% No >15% <5% Stable Not Diverse/Complex 10 22 45.45 PoorVermilion River VER20 433104 5900342 433363 5900514 660.36 >90% <15% No >15% <5% Stable Not Diverse/Complex 10 22 45.45 PoorVermilion River VER20 433373 5900528 433411 5900537 42.62 >90% <15% No >15% <5% Stable Not Diverse/Complex 10 22 45.45 PoorVermilion River VER20 433363 5900514 433425 5900537 74.37 >90% <15% No >15% <5% Stable Not Diverse/Complex 10 22 45.45 PoorVermilion River VER20 432862 5900345 433098 5900344 261.99 >90% 15-35% No >15% <5% Stable Moderately Diverse/Complex 13 22 59.09 Fair Vermilion River VER20 433425 5900544 433113 5901020 1,420.28 >90% 15-35% No >15% <5% Stable Moderately Diverse/Complex 13 22 59.09 Fair Vermilion River VER20 433410 5900544 433113 5901006 1,397.91 >90% <15% No 5-15% <5% Stable Moderately Diverse/Complex 14 22 63.64 Fair Vermilion River VER20 433011 5901055 432441 5901325 979.09 >90% <15% No >15% <5% Stable Not Diverse/Complex 10 22 45.45 PoorVermilion River VER20 432985 5901058 432455 5901325 928.64 >90% <15% No >15% <5% Stable Not Diverse/Complex 10 22 45.45 PoorVermilion River VER20 433107 5901006 433011 5901055 158.56 >90% <15% No >15% <5% Stable Not Diverse/Complex 10 22 45.45 PoorVermilion River VER20 433107 5901020 432985 5901058 187.21 >90% <15% No >15% <5% Stable Not Diverse/Complex 10 22 45.45 PoorVermilion River VER20 432441 5901325 431516 5901595 2,911.23 >90% 15-35% No >15% <5% Stable Not Diverse/Complex 11 22 50 Fair Vermilion River VER20 432455 5901325 431516 5901609 2,931.22 >90% <15% No >15% <5% Stable Not Diverse/Complex 10 22 45.45 PoorVermilion River VER20 430882 5902012 430145 5902531 1,894.19 >90% <15% No >15% 5-15% Stable Not Diverse/Complex 8 22 36.36 Poor Vermilion River VER20 430892 5902001 430151 5902518 1,898.54 >90% 15-35% No >15% <5% Stable Not Diverse/Complex 11 22 50 Fair Vermilion River VER20 431508 5901597 431334 5901905 480.52 >90% 15-35% No >15% <5% Stable Moderately Diverse/Complex 13 22 59.09 Fair
Page 54
APPENDIX A Riparian Health Data
March 2016 Report No. 1532934 A-22
Name Reach Segment Start(a) Segment End(a) Length
[m] % Vegetation
Cover(b) % Woody Species Cover(b)
Evidence of Recruitment (Y/N) (b)
% Area of Human Caused Vegetation Cover Alteration(b)
% Area of Human Caused Bare Ground / Physical Alteration(b)
Overall Bank Stability? (b)
Adjacent Vegetation Structural Complexity(b) Score Possible
Score %
Score Health
Category Easting Northing Easting Northing
Vermilion River VER20 431510 5901610 431436 5901944 582.28 >90% 15-35% No >15% <5% Stable Moderately Diverse/Complex 13 22 59.09 Fair Vermilion River VER19 430135 5902520 429930 5902671 287.33 >90% <15% No >15% <5% Stable Not Diverse/Complex 10 22 45.45 PoorVermilion River VER19 430145 5902531 429930 5902685 297.12 >90% <15% No >15% <5% Stable Not Diverse/Complex 10 22 45.45 PoorVermilion River VER19 429917 5902671 429518 5902585 456.58 >90% 15-35% No >15% <5% Stable Moderately Diverse/Complex 13 22 59.09 Fair Vermilion River VER19 429518 5902585 429004 5902753 2,591.66 >90% 15-35% No >15% <5% Stable Not Diverse/Complex 11 22 50 Fair Vermilion River VER19 429004 5902753 428932 5902861 158.00 75-90% <15% No >15% 5-15% Stable Not Diverse/Complex 7 22 31.82 Poor Vermilion River VER19 428932 5902861 428544 5903548 1,757.36 >90% <15% No >15% <5% Stable Not Diverse/Complex 10 22 45.45 PoorVermilion River VER19 429350 5903110 428519 5903609 3,476.21 >90% 15-35% No >15% <5% Stable Not Diverse/Complex 11 22 50 Fair Vermilion River VER19 428544 5903548 428709 5903921 1,073.24 >90% <15% No >15% <5% Stable Not Diverse/Complex 10 22 45.45 PoorVermilion River VER19 428519 5903609 428723 5903920 1,091.42 >90% 15-35% Yes >15% <5% Stable Moderately Diverse/Complex 15 22 68.18 Fair Vermilion River VER19 429918 5902685 429350 5903110 1,449.52 >90% 15-35% Yes >15% <5% Stable Not Diverse/Complex 13 22 59.09 Fair Vermilion River VER19 428723 5903930 428728 5904243 917.66 >90% <15% No >15% <5% Stable Not Diverse/Complex 10 22 45.45 PoorVermilion River VER19 428728 5904243 428803 5904388 177.23 >90% >35% Yes >15% <5% Stable Moderately Diverse/Complex 16 22 72.73 Fair Vermilion River VER19 428709 5903931 428490 5904522 1,447.52 >90% <15% No >15% <5% Stable Not Diverse/Complex 10 22 45.45 PoorVermilion River VER19 428490 5904522 428236 5904538 370.82 >90% 15-35% No >15% <5% Stable Not Diverse/Complex 11 22 50 Fair Vermilion River VER19 428236 5904538 428347 5904795 339.53 >90% <15% No >15% 5-15% Stable Not Diverse/Complex 8 22 36.36 PoorVermilion River VER19 428803 5904388 428213 5904953 1,495.85 >90% <15% No >15% <5% Stable Not Diverse/Complex 10 22 45.45 PoorVermilion River VER19 428213 5904953 428434 5905406 1,069.41 >90% <15% No >15% <5% Stable Not Diverse/Complex 10 22 45.45 PoorVermilion River VER19 428347 5905447 428642 5905702 1,039.98 >90% <15% No 5-15% <5% Stable Not Diverse/Complex 12 22 54.55 Fair Vermilion River VER19 429190 5906642 429401 5907016 569.04 >90% 15-35% Yes >15% <5% Stable Moderately Diverse/Complex 15 22 68.18 Fair Vermilion River VER19 429401 5907016 429168 5907151 343.09 >90% <15% No >15% <5% Stable Not Diverse/Complex 10 22 45.45 PoorVermilion River VER19 429009 5906467 429190 5906642 697.95 >90% <15% No >15% <5% Stable Not Diverse/Complex 10 22 45.45 PoorVermilion River VER19 428969 5906347 429009 5906467 135.13 >90% >35% No >15% <5% Stable Moderately Diverse/Complex 14 22 63.64 Fair Vermilion River VER19 428742 5906374 429153 5907152 2,053.48 >90% <15% No >15% <5% Stable Not Diverse/Complex 10 22 45.45 PoorVermilion River VER19 428695 5906221 428742 5906374 200.32 >90% 15-35% Yes >15% <5% Stable Moderately Diverse/Complex 15 22 68.18 Fair Vermilion River VER19 428682 5906295 428969 5906347 421.98 >90% 15-35% No >15% <5% Stable Not Diverse/Complex 11 22 50 Fair Vermilion River VER19 428728 5905971 428828 5906181 352.70 >90% 15-35% No >15% <5% Stable Moderately Diverse/Complex 13 22 59.09 Fair Vermilion River VER19 428465 5905778 428695 5906221 1,217.26 >90% <15% No 5-15% <5% Stable Not Diverse/Complex 12 22 54.55 Fair Vermilion River VER19 428642 5905702 428465 5905778 198.85 >90% 15-35% No 5-15% <5% Stable Moderately Diverse/Complex 15 22 68.18 Fair Vermilion River VER19 429107 5907952 429517 5908895 4,206.74 >90% <15% No >15% <5% Stable Not Diverse/Complex 10 22 45.45 PoorVermilion River VER19 429318 5907368 429246 5907719 1,271.85 >90% 15-35% Yes >15% <5% Stable Moderately Diverse/Complex 15 22 68.18 Fair Vermilion River VER19 429260 5910032 428974 5910427 1,290.16 >90% >35% Yes <5% <5% Stable Diverse/Complex 22 22 100 Good Vermilion River VER19 429210 5910084 428991 5910434 1,406.44 >90% >35% Yes <5% <5% Stable Diverse/Complex 22 22 100 Good Vermilion River VER19 429337 5908908 429323 5909578 1,196.34 >90% 15-35% No >15% <5% Stable Moderately Diverse/Complex 13 22 59.09 Fair Vermilion River VER19 429031 5907687 429107 5907952 1,090.99 >90% <15% No >15% <5% Stable Not Diverse/Complex 10 22 45.45 PoorVermilion River VER19 429602 5908429 429882 5908772 854.89 >90% 15-35% Yes >15% <5% Stable Not Diverse/Complex 13 22 59.09 Fair Vermilion River VER19 429267 5907972 429602 5908429 2,166.12 >90% <15% No >15% <5% Stable Not Diverse/Complex 10 22 45.45 PoorVermilion River VER19 429246 5907719 429267 5907972 624.56 >90% 15-35% Yes >15% <5% Stable Moderately Diverse/Complex 15 22 68.18 Fair Vermilion River VER19 429316 5907180 429318 5907368 216.52 75-90% <15% No >15% >15% Stable Not Diverse/Complex 5 22 22.73 PoorVermilion River VER19 429171 5907163 429316 5907180 166.47 >90% 15-35% Yes >15% <5% Stable Moderately Diverse/Complex 15 22 68.18 Fair Vermilion River VER19 429305 5907361 429031 5907687 644.91 >90% 15-35% No >15% <5% Stable Moderately Diverse/Complex 13 22 59.09 Fair Vermilion River VER19 429156 5907163 429305 5907361 376.77 >90% <15% No >15% <5% Stable Not Diverse/Complex 10 22 45.45 PoorVermilion River VER19 428828 5906181 428682 5906295 212.12 >90% <15% No >15% <5% Stable Not Diverse/Complex 10 22 45.45 PoorVermilion River VER19 428626 5905546 428728 5905971 1,435.80 >90% <15% No >15% <5% Stable Not Diverse/Complex 10 22 45.45 PoorVermilion River VER19 428434 5905406 428626 5905546 471.85 >90% 15-35% No >15% <5% Stable Moderately Diverse/Complex 13 22 59.09 Fair
Page 55
APPENDIX A Riparian Health Data
March 2016 Report No. 1532934 A-23
Name Reach Segment Start(a) Segment End(a) Length
[m] % Vegetation
Cover(b) % Woody Species Cover(b)
Evidence of Recruitment (Y/N) (b)
% Area of Human Caused Vegetation Cover Alteration(b)
% Area of Human Caused Bare Ground / Physical Alteration(b)
Overall Bank Stability? (b)
Adjacent Vegetation Structural Complexity(b) Score Possible
Score %
Score Health
Category Easting Northing Easting Northing
Vermilion River VER19 428347 5904795 428283 5905286 1,099.41 >90% <15% No 5-15% <5% Stable Not Diverse/Complex 12 22 54.55 Fair Vermilion River VER19 428283 5905286 428347 5905447 333.05 >90% <15% No 5-15% 5-15% Stable Not Diverse/Complex 10 22 45.45 Poor Vermilion River VER19 429882 5908772 429817 5908828 98.31 >90% <15% No >15% <5% Stable Not Diverse/Complex 10 22 45.45 PoorVermilion River VER19 429817 5908828 429811 5909010 233.99 >90% 15-35% No >15% <5% Stable Moderately Diverse/Complex 13 22 59.09 Fair Vermilion River VER19 429811 5909010 429337 5908908 980.92 >90% <15% No >15% <5% Stable Not Diverse/Complex 10 22 45.45 PoorVermilion River VER19 429320 5909839 429210 5910084 488.74 >90% <15% No >15% <5% Stable Not Diverse/Complex 10 22 45.45 PoorVermilion River VER19 429323 5909578 429270 5909584 54.39 >90% <15% No >15% <5% Stable Not Diverse/Complex 10 22 45.45 PoorVermilion River VER19 429270 5909584 429320 5909839 322.40 >90% 15-35% No >15% <5% Stable Moderately Diverse/Complex 13 22 59.09 Fair Vermilion River VER19 429283 5909464 429260 5910032 1,126.65 >90% <15% No >15% <5% Stable Not Diverse/Complex 10 22 45.45 PoorVermilion River VER19 429441 5909102 429283 5909464 508.00 >90% 15-35% No >15% <5% Stable Moderately Diverse/Complex 13 22 59.09 Fair Vermilion River VER19 429311 5908860 429441 5909102 585.93 >90% <15% No >15% <5% Stable Not Diverse/Complex 10 22 45.45 PoorVermilion River VER19 429517 5908895 429311 5908860 243.77 >90% 15-35% No >15% <5% Stable Moderately Diverse/Complex 13 22 59.09 Fair Vermilion River VER19 428977 5910438 428975 5910588 249.62 >90% <15% No >15% <5% Stable Not Diverse/Complex 10 22 45.45 PoorVermilion River VER19 428992 5910444 429233 5910883 809.90 >90% 15-35% Yes 5-15% <5% Stable Moderately Diverse/Complex 17 22 77.27 Fair Vermilion River VER19 428975 5910588 428930 5910747 239.52 >90% 15-35% No <5% <5% Stable Moderately Diverse/Complex 17 22 77.27 Fair Vermilion River VER19 428930 5910747 429232 5911100 849.14 >90% <15% No >15% <5% Stable Not Diverse/Complex 10 22 45.45 PoorVermilion River VER19 429232 5911100 429229 5911233 375.43 >90% 15-35% No >15% <5% Stable Moderately Diverse/Complex 13 22 59.09 Fair Vermilion River VER19 429233 5910883 429202 5911331 1,008.34 >90% <15% No >15% <5% Stable Not Diverse/Complex 10 22 45.45 PoorVermilion River VER19 429202 5911331 429194 5911488 431.92 >90% 15-35% No >15% <5% Stable Not Diverse/Complex 11 22 50 Fair Vermilion River VER19 429229 5911233 429073 5911461 719.23 >90% <15% No >15% <5% Stable Not Diverse/Complex 10 22 45.45 PoorVermilion River VER19 429073 5911461 428699 5911648 545.98 >90% >35% Yes 5-15% <5% Stable Moderately Diverse/Complex 18 22 81.82 Good Vermilion River VER19 429194 5911488 428810 5911581 566.20 >90% <15% Yes >15% <5% Stable Not Diverse/Complex 12 22 54.55 FairVermilion River VER19 428810 5911581 429262 5911761 1,056.04 >90% 15-35% Yes >15% <5% Stable Moderately Diverse/Complex 15 22 68.18 Fair Vermilion River VER19 428699 5911648 429949 5911996 2,670.71 >90% <15% No >15% <5% Stable Not Diverse/Complex 10 22 45.45 PoorVermilion River VER19 429262 5911761 429868 5912756 4,133.50 >90% <15% No >15% <5% Stable Not Diverse/Complex 10 22 45.45 PoorVermilion River VER19 429928 5912841 429903 5913062 1,023.07 >90% <15% No >15% <5% Stable Not Diverse/Complex 10 22 45.45 PoorVermilion River VER19 429868 5912756 429928 5912841 112.45 >90% >35% No >15% <5% Stable Moderately Diverse/Complex 14 22 63.64 Fair Vermilion River VER19 429949 5911996 429760 5912043 425.21 >90% >35% Yes >15% <5% Stable Moderately Diverse/Complex 16 22 72.73 Fair Vermilion River VER19 429760 5912043 429857 5912781 1,962.48 >90% <15% No >15% <5% Stable Not Diverse/Complex 10 22 45.45 PoorVermilion River VER19 429857 5912781 429591 5913063 714.16 >90% 15-35% No >15% <5% Stable Moderately Diverse/Complex 13 22 59.09 Fair Vermilion River VER19 429591 5913063 429781 5912986 235.42 >90% 15-35% No >15% <5% Stable Not Diverse/Complex 11 22 50 Fair Vermilion River VER19 429781 5912986 429719 5913405 1,048.40 >90% 15-35% No 5-15% <5% Stable Moderately Diverse/Complex 15 22 68.18 Fair Vermilion River VER19 429903 5913062 429691 5913466 963.88 >90% >35% Yes 5-15% <5% Stable Moderately Diverse/Complex 18 22 81.82 Good Vermilion River VER19 429691 5913466 429627 5913611 164.74 >90% <15% No >15% <5% Stable Not Diverse/Complex 10 22 45.45 PoorVermilion River VER19 429719 5913405 429613 5913609 238.10 >90% <15% No >15% <5% Stable Not Diverse/Complex 10 22 45.45 PoorVermilion River VER19 429613 5913621 429097 5915097 4,021.63 >90% <15% No >15% <5% Stable Not Diverse/Complex 10 22 45.45 PoorVermilion River VER19 429950 5913875 429809 5915276 4,569.15 >90% <15% Yes >15% <5% Stable Not Diverse/Complex 12 22 54.55 Fair Vermilion River VER18 429868 5916419 429766 5916833 1,595.08 >90% 15-35% No >15% <5% Stable Moderately Diverse/Complex 13 22 59.09 Fair Vermilion River VER18 429854 5916417 429751 5916833 1,596.70 >90% 15-35% No >15% <5% Stable Moderately Diverse/Complex 13 22 59.09 Fair Vermilion River VER18 429979 5916143 429868 5916419 631.46 >90% 15-35% Yes 5-15% <5% Stable Moderately Diverse/Complex 17 22 77.27 Fair Vermilion River VER18 429984 5916129 429854 5916417 655.56 >90% 15-35% Yes >15% <5% Stable Moderately Diverse/Complex 15 22 68.18 Fair Vermilion River VER19 429683 5915571 430069 5915684 1,227.20 >90% <15% No >15% <5% Stable Not Diverse/Complex 10 22 45.45 PoorVermilion River VER19 429699 5915440 429683 5915571 349.93 >90% >35% Yes 5-15% <5% Stable Moderately Diverse/Complex 18 22 81.82 Good Vermilion River VER19 430069 5915684 430122 5916163 887.83 >90% 15-35% Yes >15% <5% Stable Moderately Diverse/Complex 15 22 68.18 Fair Vermilion River VER19 430035 5915421 430074 5915990 1,089.56 >90% <15% No >15% <5% Stable Not Diverse/Complex 10 22 45.45 Poor
Page 56
APPENDIX A Riparian Health Data
March 2016 Report No. 1532934 A-24
Name Reach Segment Start(a) Segment End(a) Length
[m] % Vegetation
Cover(b) % Woody Species Cover(b)
Evidence of Recruitment (Y/N) (b)
% Area of Human Caused Vegetation Cover Alteration(b)
% Area of Human Caused Bare Ground / Physical Alteration(b)
Overall Bank Stability? (b)
Adjacent Vegetation Structural Complexity(b) Score Possible
Score %
Score Health
Category Easting Northing Easting Northing
Vermilion River VER19 429809 5915276 430035 5915421 1,249.03 >90% 15-35% No >15% <5% Stable Moderately Diverse/Complex 13 22 59.09 Fair Vermilion River VER19 429418 5915331 429699 5915440 1,074.80 >90% <15% No >15% <5% Stable Not Diverse/Complex 10 22 45.45 PoorVermilion River VER19 429097 5915097 429418 5915331 650.36 >90% >35% Yes 5-15% <5% Stable Moderately Diverse/Complex 18 22 81.82 Good Vermilion River VER19 429627 5913622 429824 5913765 761.32 >90% <15% No >15% <5% Stable Not Diverse/Complex 10 22 45.45 PoorVermilion River VER19 429824 5913765 429950 5913875 204.94 >90% >35% No 5-15% <5% Stable Moderately Diverse/Complex 16 22 72.73 Fair Vermilion River VER18 429593 5917095 428799 5918621 5,231.71 >90% <15% No >15% <5% Stable Not Diverse/Complex 10 22 45.45 PoorVermilion River VER18 429768 5917327 428650 5917861 3,085.36 >90% <15% No >15% <5% Stable Not Diverse/Complex 10 22 45.45 PoorVermilion River VER18 428447 5919940 428405 5920093 679.74 >90% 15-35% No >15% <5% Stable Moderately Diverse/Complex 13 22 59.09 Fair Vermilion River VER18 428468 5919904 428421 5920092 670.89 >90% 15-35% No >15% <5% Stable Moderately Diverse/Complex 13 22 59.09 Fair Vermilion River VER18 428842 5919301 428447 5919940 2,400.54 >90% <15% No >15% <5% Stable Not Diverse/Complex 10 22 45.45 PoorVermilion River VER18 429075 5919204 428842 5919301 302.53 >90% 15-35% No >15% <5% Stable Not Diverse/Complex 11 22 50 Fair Vermilion River VER18 429004 5919304 428468 5919904 2,559.45 >90% <15% No >15% <5% Stable Not Diverse/Complex 10 22 45.45 PoorVermilion River VER18 428905 5919082 429004 5919304 385.18 >90% 15-35% No >15% <5% Stable Not Diverse/Complex 11 22 50 Fair Vermilion River VER18 428637 5918720 429075 5919204 869.50 >90% <15% No <5% >15% Stable Not Diverse/Complex 10 22 45.45 PoorVermilion River VER18 428735 5918272 428905 5919082 2,023.23 >90% <15% No >15% <5% Stable Not Diverse/Complex 10 22 45.45 PoorVermilion River VER18 428799 5918621 428637 5918720 217.94 >90% >35% No >15% <5% Stable Not Diverse/Complex 12 22 54.55 FairVermilion River VER18 429753 5916841 429593 5917095 715.80 >90% 15-35% No >15% <5% Stable Not Diverse/Complex 11 22 50 Fair Vermilion River VER18 429767 5916841 429833 5917083 459.52 >90% 15-35% No >15% <5% Stable Not Diverse/Complex 11 22 50 Fair Vermilion River VER18 429602 5917114 429768 5917327 300.47 >90% 15-35% No >15% <5% Stable Not Diverse/Complex 11 22 50 Fair Vermilion River VER18 429833 5917083 429602 5917114 277.57 >90% <15% No >15% <5% Stable Not Diverse/Complex 10 22 45.45 PoorVermilion River VER18 428650 5917861 428735 5918272 657.67 >90% 15-35% No >15% <5% Stable Not Diverse/Complex 11 22 50 Fair Vermilion River VER18 428062 5922267 427681 5923130 2,830.05 >90% <15% No >15% <5% Stable Not Diverse/Complex 10 22 45.45 PoorVermilion River VER18 428087 5922141 427532 5922835 2,443.78 >90% <15% No >15% <5% Stable Not Diverse/Complex 10 22 45.45 PoorVermilion River VER18 428242 5923119 428217 5923350 333.09 >90% <15% No >15% >15% Stable Not Diverse/Complex 6 22 27.27 PoorVermilion River VER18 427813 5923366 428203 5923351 881.90 >90% <15% No >15% <5% Stable Not Diverse/Complex 10 22 45.45 PoorVermilion River VER18 428409 5920100 428593 5920306 428.54 >90% <15% No >15% <5% Stable Not Diverse/Complex 10 22 45.45 PoorVermilion River VER18 428593 5920306 428700 5920380 772.41 >90% 15-35% No >15% <5% Stable Not Diverse/Complex 11 22 50 Fair Vermilion River VER18 428700 5920380 428009 5920907 2,661.02 >90% <15% No >15% <5% Stable Not Diverse/Complex 10 22 45.45 PoorVermilion River VER18 428425 5920100 428869 5920219 916.12 >90% 15-35% No >15% <5% Stable Not Diverse/Complex 11 22 50 Fair Vermilion River VER18 428869 5920219 427891 5920985 3,110.99 >90% <15% No >15% <5% Stable Not Diverse/Complex 10 22 45.45 PoorVermilion River VER18 428009 5920907 427654 5921356 1,153.87 >90% >35% Yes 5-15% <5% Stable Diverse/Complex 20 22 90.91 Good Vermilion River VER18 427891 5920985 427719 5921366 1,046.28 >90% >35% Yes 5-15% <5% Stable Diverse/Complex 20 22 90.91 Good Vermilion River VER18 427719 5921366 427893 5921660 995.39 >90% 15-35% No >15% <5% Stable Moderately Diverse/Complex 13 22 59.09 Fair Vermilion River VER18 427654 5921356 427893 5921646 1,031.65 >90% 15-35% Yes >15% <5% Stable Moderately Diverse/Complex 15 22 68.18 Fair Vermilion River VER18 427893 5921660 427584 5921888 1,168.49 >90% <15% No >15% <5% Stable Not Diverse/Complex 10 22 45.45 PoorVermilion River VER18 427893 5921646 427578 5921977 1,280.58 >90% <15% No >15% <5% Stable Not Diverse/Complex 10 22 45.45 PoorVermilion River VER18 427578 5921977 428062 5922267 1,224.56 >90% 15-35% No >15% <5% Stable Not Diverse/Complex 11 22 50 Fair Vermilion River VER18 427584 5921888 428087 5922141 1,075.72 >90% 15-35% No >15% <5% Stable Not Diverse/Complex 11 22 50 Fair Vermilion River VER18 427643 5923157 428242 5923119 1,011.48 >90% <15% No >15% <5% Stable Not Diverse/Complex 10 22 45.45 PoorVermilion River VER18 427532 5922835 427643 5923157 545.95 >90% 15-35% No >15% <5% Stable Not Diverse/Complex 11 22 50 Fair Vermilion River VER18 427681 5923130 427813 5923366 384.32 >90% 15-35% No >15% <5% Stable Not Diverse/Complex 11 22 50 Fair Vermilion River VER18 428206 5923361 428413 5923744 546.52 >90% >35% No >15% <5% Stable Not Diverse/Complex 12 22 54.55 FairVermilion River VER18 428220 5923358 428334 5923881 777.97 >90% <15% No >15% 5-15% Stable Not Diverse/Complex 8 22 36.36 PoorVermilion River VER17 431456 5926858 431184 5927292 1,991.73 >90% <15% No >15% 5-15% Stable Not Diverse/Complex 8 22 36.36 Poor Vermilion River VER17 428066 5924003 428863 5924055 2,071.41 >90% 15-35% No >15% <5% Stable Not Diverse/Complex 11 22 50 Fair
Page 57
APPENDIX A Riparian Health Data
March 2016 Report No. 1532934 A-25
Name Reach Segment Start(a) Segment End(a) Length
[m] % Vegetation
Cover(b) % Woody Species Cover(b)
Evidence of Recruitment (Y/N) (b)
% Area of Human Caused Vegetation Cover Alteration(b)
% Area of Human Caused Bare Ground / Physical Alteration(b)
Overall Bank Stability? (b)
Adjacent Vegetation Structural Complexity(b) Score Possible
Score %
Score Health
Category Easting Northing Easting Northing
Vermilion River VER17 429135 5924331 429213 5924507 219.36 >90% 15-35% Yes 5-15% <5% Stable Moderately Diverse/Complex 17 22 77.27 Fair Vermilion River VER17 428996 5924572 429213 5924522 523.87 >90% 15-35% No >15% <5% Stable Not Diverse/Complex 11 22 50 Fair Vermilion River VER17 428914 5924197 429135 5924331 790.30 >90% <15% No >15% <5% Stable Not Diverse/Complex 10 22 45.45 PoorVermilion River VER17 428863 5924055 428914 5924197 540.29 >90% >35% No 5-15% <5% Stable Moderately Diverse/Complex 16 22 72.73 Fair Vermilion River VER17 428643 5924160 428996 5924572 1,792.27 >90% 15-35% No >15% <5% Stable Moderately Diverse/Complex 13 22 59.09 Fair Vermilion River VER17 428062 5923976 428643 5924160 1,341.61 >90% <15% No >15% <5% Stable Not Diverse/Complex 10 22 45.45 PoorVermilion River VER18 428413 5923744 428074 5923988 1,170.50 >90% 15-35% No >15% <5% Stable Not Diverse/Complex 11 22 50 Fair Vermilion River VER17 429889 5925163 430420 5925785 2,437.00 >90% 15-35% No >15% <5% Stable Moderately Diverse/Complex 13 22 59.09 Fair Vermilion River VER17 430415 5925800 430406 5925824 25.81 >90% <15% No >15% >15% Stable Not Diverse/Complex 6 22 27.27 PoorVermilion River VER17 430033 5925212 430435 5925785 2,191.64 >90% 15-35% No >15% <5% Stable Moderately Diverse/Complex 13 22 59.09 Fair Vermilion River VER17 430429 5925801 430421 5925824 24.53 >90% <15% No >15% >15% Stable Not Diverse/Complex 6 22 27.27 PoorVermilion River VER17 429222 5924525 429889 5925163 1,815.84 >90% 15-35% No >15% <5% Stable Not Diverse/Complex 11 22 50 Fair Vermilion River VER17 429223 5924511 430033 5925212 2,084.07 >90% <15% No >15% <5% Stable Not Diverse/Complex 10 22 45.45 PoorVermilion River VER17 430401 5925840 430872 5926256 1,204.50 >90% <15% No 5-15% <5% Stable Not Diverse/Complex 12 22 54.55 Fair Vermilion River VER17 430416 5925839 430660 5925954 695.87 >90% <15% No >15% <5% Stable Not Diverse/Complex 10 22 45.45 PoorVermilion River VER17 430821 5925993 430871 5926236 294.24 >90% <15% No 5-15% 5-15% Stable Not Diverse/Complex 10 22 45.45 Poor Vermilion River VER17 430660 5925954 430821 5925993 190.11 >90% 15-35% No >15% <5% Stable Moderately Diverse/Complex 13 22 59.09 Fair Vermilion River VER17 431184 5927315 431372 5927963 1,584.43 >90% 15-35% No >15% 5-15% Stable Diverse/Complex 13 22 59.09 Fair Vermilion River VER17 431198 5927312 431373 5927949 1,566.38 75-90% 15-35% No >15% 5-15% Stable Moderately Diverse/Complex 10 22 45.45 Poor Vermilion River VER17 430882 5926264 431710 5926633 1,988.25 >90% <15% No >15% <5% Stable Not Diverse/Complex 10 22 45.45 PoorVermilion River VER17 430882 5926246 431678 5926544 1,911.77 >90% 15-35% No >15% <5% Stable Not Diverse/Complex 11 22 50 Fair Vermilion River VER17 431678 5926544 431818 5926892 401.76 >90% >35% No >15% 5-15% Stable Moderately Diverse/Complex 12 22 54.55 Fair Vermilion River VER17 431710 5926633 431641 5926782 495.70 >90% 15-35% No 5-15% <5% Stable Moderately Diverse/Complex 15 22 68.18 Fair Vermilion River VER17 431641 5926782 431456 5926858 624.61 >90% 15-35% No 5-15% <5% Stable Moderately Diverse/Complex 15 22 68.18 Fair Vermilion River VER17 431021 5927123 431198 5927288 352.88 >90% 15-35% No >15% <5% Stable Moderately Diverse/Complex 13 22 59.09 Fair Vermilion River VER17 431372 5927963 431736 5928307 611.92 >90% <15% Yes >15% <5% Stable Not Diverse/Complex 12 22 54.55 FairVermilion River VER17 431736 5928307 431936 5928459 625.02 >90% 15-35% Yes 5-15% <5% Stable Moderately Diverse/Complex 17 22 77.27 Fair Vermilion River VER17 431373 5927949 432390 5928955 2,081.28 >90% <15% No >15% <5% Stable Not Diverse/Complex 10 22 45.45 PoorVermilion River VER17 431936 5928459 432376 5928955 822.48 >90% <15% No >15% <5% Stable Not Diverse/Complex 10 22 45.45 PoorVermilion River VER17 432377 5928966 432453 5929755 1,111.12 >90% 15-35% No >15% 5-15% Stable Not Diverse/Complex 9 22 40.91 Poor Vermilion River VER17 432391 5928966 432467 5929755 1,111.60 >90% 15-35% Yes >15% <5% Stable Not Diverse/Complex 13 22 59.09 Fair Vermilion River VER17 432452 5929763 432098 5932038 4,760.33 >90% <15% No >15% <5% Stable Not Diverse/Complex 10 22 45.45 PoorVermilion River VER17 432466 5929763 431856 5932075 4,463.38 >90% <15% No >15% <5% Stable Not Diverse/Complex 10 22 45.45 PoorVermilion River VER16 432023 5932637 432035 5932997 578.36 >90% 15-35% No >15% <5% Stable Moderately Diverse/Complex 13 22 59.09 Fair Vermilion River VER17 431856 5932075 432150 5932462 1,141.71 >90% 15-35% No >15% <5% Stable Not Diverse/Complex 11 22 50 Fair Vermilion River VER17 432098 5932038 432008 5932628 1,148.06 >90% 15-35% No >15% <5% Stable Not Diverse/Complex 11 22 50 Fair Vermilion River VER16 432021 5933007 432413 5933432 976.21 >90% 15-35% Yes 5-15% <5% Stable Moderately Diverse/Complex 17 22 77.27 Fair Vermilion River VER16 432224 5933059 432605 5933623 1,090.72 >90% >35% Yes <5% <5% Stable Diverse/Complex 22 22 100 Good Vermilion River VER16 432035 5933007 432224 5933059 230.81 >90% <15% No >15% <5% Stable Not Diverse/Complex 10 22 45.45 PoorVermilion River VER16 432605 5933623 432619 5933823 206.08 >90% <15% No >15% <5% Stable Not Diverse/Complex 10 22 45.45 PoorVermilion River VER16 432413 5933432 432618 5933839 574.58 >90% <15% No >15% <5% Stable Not Diverse/Complex 10 22 45.45 PoorVermilion River VER16 432628 5933827 434263 5935487 4,441.16 >90% <15% No >15% <5% Stable Not Diverse/Complex 10 22 45.45 PoorVermilion River VER16 432627 5933841 434263 5935501 4,444.26 >90% <15% No 5-15% <5% Stable Not Diverse/Complex 12 22 54.55 Fair Vermilion River VER16 434272 5935501 435471 5936189 2,751.33 >90% 15-35% No >15% <5% Stable Not Diverse/Complex 11 22 50 Fair Vermilion River VER16 434272 5935487 435485 5936190 2,775.28 >90% 15-35% No >15% <5% Stable Not Diverse/Complex 11 22 50 Fair
Page 58
APPENDIX A Riparian Health Data
March 2016 Report No. 1532934 A-26
Name Reach Segment Start(a) Segment End(a) Length
[m] % Vegetation
Cover(b) % Woody Species Cover(b)
Evidence of Recruitment (Y/N) (b)
% Area of Human Caused Vegetation Cover Alteration(b)
% Area of Human Caused Bare Ground / Physical Alteration(b)
Overall Bank Stability? (b)
Adjacent Vegetation Structural Complexity(b) Score Possible
Score %
Score Health
Category Easting Northing Easting Northing
Vermilion River VER16 435485 5936198 435408 5936371 208.70 >90% <15% No >15% <5% Stable Not Diverse/Complex 10 22 45.45 PoorVermilion River VER16 435408 5936371 435707 5937138 1,225.63 >90% >35% Yes <5% <5% Stable Diverse/Complex 22 22 100 Good Vermilion River VER16 435471 5936199 435488 5936850 956.68 >90% <15% No >15% <5% Stable Not Diverse/Complex 10 22 45.45 PoorVermilion River VER16 435488 5936850 435921 5937599 1,390.80 >90% 15-35% No 5-15% <5% Stable Moderately Diverse/Complex 15 22 68.18 Fair Vermilion River VER16 435707 5937138 435921 5937583 891.89 >90% 15-35% No 5-15% <5% Stable Moderately Diverse/Complex 15 22 68.18 Fair Vermilion River VER16 436640 5938306 436932 5939406 3,212.69 >90% >35% Yes <5% <5% Stable Moderately Diverse/Complex 20 22 90.91 Good Vermilion River VER16 436488 5938450 436916 5939407 2,606.45 >90% >35% Yes 5-15% <5% Stable Moderately Diverse/Complex 18 22 81.82 Good Vermilion River VER16 436113 5937680 436488 5938450 2,372.84 >90% <15% No >15% <5% Stable Not Diverse/Complex 10 22 45.45 PoorVermilion River VER16 436169 5937717 436640 5938306 1,711.91 >90% <15% No >15% <5% Stable Not Diverse/Complex 10 22 45.45 PoorVermilion River VER16 435921 5937599 436113 5937680 219.06 >90% 15-35% No <5% <5% Stable Moderately Diverse/Complex 17 22 77.27 Fair Vermilion River VER16 435921 5937583 436169 5937717 297.32 >90% 15-35% No 5-15% <5% Stable Moderately Diverse/Complex 15 22 68.18 Fair Vermilion River VER16 436719 5940755 436239 5941826 4,402.56 >90% <15% No >15% <5% Stable Not Diverse/Complex 10 22 45.45 PoorVermilion River VER16 436792 5940657 436256 5941842 4,602.07 >90% <15% No >15% 5-15% Stable Not Diverse/Complex 8 22 36.36 Poor Vermilion River VER16 435993 5942532 435808 5942658 395.61 >90% <15% No >15% <5% Stable Not Diverse/Complex 10 22 45.45 PoorVermilion River VER16 435992 5942546 435822 5942657 371.14 >90% <15% No >15% <5% Stable Not Diverse/Complex 10 22 45.45 PoorVermilion River VER16 436729 5942291 436002 5942534 2,138.24 >90% 15-35% No >15% <5% Stable Moderately Diverse/Complex 13 22 59.09 Fair Vermilion River VER16 436239 5941826 436490 5942059 613.19 >90% <15% No >15% <5% Stable Moderately Diverse/Complex 12 22 54.55 Fair Vermilion River VER16 436392 5942555 436001 5942549 1,306.47 >90% <15% No >15% 5-15% Stable Not Diverse/Complex 8 22 36.36 Poor Vermilion River VER16 436922 5939415 436773 5939603 562.74 >90% <15% No >15% <5% Stable Not Diverse/Complex 10 22 45.45 PoorVermilion River VER16 436937 5939415 436776 5939617 582.20 >90% <15% No >15% <5% Stable Not Diverse/Complex 10 22 45.45 PoorVermilion River VER16 436773 5939603 436719 5940755 2,483.49 >90% 15-35% No >15% <5% Stable Not Diverse/Complex 11 22 50 Fair Vermilion River VER16 436776 5939617 436792 5940657 2,283.39 >90% 15-35% No >15% <5% Stable Not Diverse/Complex 11 22 50 Fair Vermilion River VER16 436490 5942059 436566 5942090 90.46 75-90% <15% No >15% <5% Stable Not Diverse/Complex 9 22 40.91 Poor Vermilion River VER16 436256 5941842 436524 5942076 617.73 >90% <15% No >15% <5% Stable Moderately Diverse/Complex 12 22 54.55 Fair Vermilion River VER16 436566 5942090 436729 5942291 498.42 >90% <15% No >15% <5% Stable Not Diverse/Complex 10 22 45.45 PoorVermilion River VER16 436524 5942076 436729 5942341 618.75 >90% <15% No >15% <5% Stable Not Diverse/Complex 10 22 45.45 PoorVermilion River VER16 436729 5942341 436392 5942555 802.55 >90% 15-35% No >15% <5% Stable Not Diverse/Complex 11 22 50 Fair Vermilion River VER16 435821 5942667 435996 5942886 627.31 >90% <15% No >15% 5-15% Stable Not Diverse/Complex 8 22 36.36 PoorVermilion River VER16 435807 5942668 435998 5942900 650.19 >90% 15-35% No >15% <5% Stable Not Diverse/Complex 11 22 50 Fair Vermilion River VER16 436007 5942898 436188 5943487 1,765.64 >90% 15-35% No >15% <5% Stable Not Diverse/Complex 11 22 50 Fair Vermilion River VER10 470145 5941225 472041 5939065 3,552.43 >90% <15% No >15% <5% Stable Not Diverse/Complex 10 22 45.45 PoorVermilion River VER15 436460 5944671 437317 5945316 1,797.05 >90% 15-35% No 5-15% <5% Stable Moderately Diverse/Complex 15 22 68.18 Fair Vermilion River VER15 437317 5945316 437624 5945321 323.29 >90% >35% Yes <5% <5% Stable Diverse/Complex 22 22 100 Good Vermilion River VER15 437599 5945411 437649 5945413 305.10 >90% >35% Yes <5% <5% Stable Diverse/Complex 22 22 100 Good
Vermilion River VER15 437624 5945321 437599 5945411 128.68 <75% <15% No >15% >15% Moderately Unstable Diverse/Complex 6 22 27.27 Poor
Vermilion River VER15 436929 5945239 437649 5945430 1,167.39 >90% >35% Yes <5% <5% Stable Diverse/Complex 22 22 100 Good Vermilion River VER15 436445 5944667 436929 5945239 1,412.28 >90% <15% No >15% <5% Stable Not Diverse/Complex 10 22 45.45 PoorVermilion River VER16 436677 5943787 436504 5944406 1,941.33 >90% 15-35% No >15% <5% Stable Moderately Diverse/Complex 13 22 59.09 Fair Vermilion River VER16 436005 5942885 436167 5943093 807.40 >90% <15% No >15% <5% Stable Not Diverse/Complex 10 22 45.45 Poor
Vermilion River VER16 436167 5943093 436661 5943553 1,597.78 >90% 15-35% Yes 5-15% <5% Moderately Unstable Moderately Diverse/Complex 15 22 68.18 Fair
Vermilion River VER16 436188 5943487 436677 5943787 1,439.52 >90% <15% No >15% <5% Stable Not Diverse/Complex 10 22 45.45 Poor
Vermilion River VER16 436504 5944406 436455 5944656 820.51 >90% <15% No >15% <5% Moderately Unstable Not Diverse/Complex 8 22 36.36 Poor
Vermilion River VER16 436661 5943553 436847 5943787 1,182.21 >90% 15-35% Yes 5-15% <5% Stable Moderately Diverse/Complex 17 22 77.27 Fair
Page 59
APPENDIX A Riparian Health Data
March 2016 Report No. 1532934 A-27
Name Reach Segment Start(a) Segment End(a) Length
[m] % Vegetation
Cover(b) % Woody Species Cover(b)
Evidence of Recruitment (Y/N) (b)
% Area of Human Caused Vegetation Cover Alteration(b)
% Area of Human Caused Bare Ground / Physical Alteration(b)
Overall Bank Stability? (b)
Adjacent Vegetation Structural Complexity(b) Score Possible
Score %
Score Health
Category Easting Northing Easting Northing
Vermilion River VER16 436847 5943787 436599 5944188 1,102.21 >90% <15% No >15% <5% Stable Not Diverse/Complex 10 22 45.45 PoorVermilion River VER16 436599 5944188 436595 5944403 368.61 >90% >35% No 5-15% <5% Stable Moderately Diverse/Complex 16 22 72.73 Fair Vermilion River VER15 438298 5945808 438800 5945624 1,437.81 >90% 15-35% No 5-15% <5% Stable Not Diverse/Complex 13 22 59.09 Fair Vermilion River VER15 438300 5945663 438814 5945627 1,639.98 >90% 15-35% No 5-15% <5% Stable Not Diverse/Complex 13 22 59.09 Fair Vermilion River VER15 438893 5945903 439054 5946752 2,377.49 >90% <15% No >15% <5% Stable Not Diverse/Complex 10 22 45.45 PoorVermilion River VER15 439167 5945980 439299 5947317 3,394.59 >90% <15% No >15% <5% Stable Not Diverse/Complex 10 22 45.45 PoorVermilion River VER15 437658 5945411 438197 5945418 686.42 >90% >35% Yes 5-15% <5% Stable Moderately Diverse/Complex 18 22 81.82 Good Vermilion River VER15 438197 5945418 438285 5945338 136.48 >90% <15% No >15% <5% Stable Not Diverse/Complex 10 22 45.45 PoorVermilion River VER15 438285 5945338 438300 5945663 499.16 >90% >35% No <5% <5% Stable Moderately Diverse/Complex 18 22 81.82 Good Vermilion River VER15 437658 5945425 438298 5945808 1,501.02 >90% >35% No 5-15% <5% Stable Moderately Diverse/Complex 16 22 72.73 Fair Vermilion River VER15 438800 5945624 438901 5945897 1,164.04 >90% 15-35% No 5-15% <5% Stable Moderately Diverse/Complex 15 22 68.18 Fair Vermilion River VER15 438814 5945627 438919 5945902 1,163.08 >90% 15-35% No 5-15% <5% Stable Moderately Diverse/Complex 15 22 68.18 Fair Vermilion River VER15 438911 5945907 439167 5945980 375.21 >90% 15-35% No <5% <5% Stable Moderately Diverse/Complex 17 22 77.27 Fair Vermilion River VER15 439054 5946752 439183 5947016 1,053.80 >90% 15-35% No >15% <5% Stable Not Diverse/Complex 11 22 50 Fair Vermilion River VER15 439183 5947016 439299 5947339 366.67 >90% <15% No >15% <5% Stable Moderately Diverse/Complex 12 22 54.55 Fair Vermilion River VER15 439311 5947349 442372 5948311 4,172.67 >90% <15% No >15% <5% Stable Not Diverse/Complex 10 22 45.45 PoorVermilion River VER15 439309 5947328 441498 5948020 3,003.80 >90% <15% No >15% <5% Stable Not Diverse/Complex 10 22 45.45 PoorVermilion River VER14 443118 5948256 444218 5948339 1,115.74 >90% <15% No >15% >15% Stable Not Diverse/Complex 6 22 27.27 PoorVermilion River VER14 443118 5948242 444219 5948325 1,116.16 >90% <15% No >15% 5-15% Stable Not Diverse/Complex 8 22 36.36 Poor Vermilion River VER15 442307 5948308 443063 5948232 919.16 >90% <15% No >15% 5-15% Stable Not Diverse/Complex 8 22 36.36 PoorVermilion River VER15 442579 5948235 443060 5948246 621.59 >90% <15% No >15% <5% Stable Not Diverse/Complex 10 22 45.45 PoorVermilion River VER15 442372 5948311 442579 5948235 227.67 >90% 15-35% No 5-15% <5% Stable Not Diverse/Complex 13 22 59.09 Fair Vermilion River VER15 441498 5948020 442307 5948308 1,108.27 >90% >35% No 5-15% <5% Stable Not Diverse/Complex 14 22 63.64 Fair Vermilion River VER14 444990 5948674 445718 5949049 869.09 >90% >35% Yes <5% <5% Stable Moderately Diverse/Complex 20 22 90.91 Good Vermilion River VER14 444228 5948326 444990 5948674 842.55 >90% <15% No >15% <5% Stable Not Diverse/Complex 10 22 45.45 PoorVermilion River VER14 444228 5948340 445354 5948947 1,291.28 >90% <15% No >15% 5-15% Stable Not Diverse/Complex 8 22 36.36 Poor Vermilion River VER13 445732 5949053 446137 5949357 540.50 >90% 15-35% No <5% <5% Stable Moderately Diverse/Complex 17 22 77.27 Fair Vermilion River VER13 445721 5949063 446709 5949660 1,197.91 >90% >35% No <5% <5% Stable Moderately Diverse/Complex 18 22 81.82 Good Vermilion River VER13 446137 5949357 446826 5949720 786.24 >90% >35% Yes 5-15% <5% Stable Moderately Diverse/Complex 18 22 81.82 Good Vermilion River VER13 446826 5949720 447339 5950061 623.05 >90% <15% No >15% >15% Stable Not Diverse/Complex 6 22 27.27 PoorVermilion River VER13 446709 5949660 447350 5950076 773.49 >90% <15% No >15% >15% Stable Not Diverse/Complex 6 22 27.27 PoorVermilion River VER13 447339 5950061 448797 5950151 2,149.86 >90% >35% No <5% <5% Stable Diverse/Complex 20 22 90.91 Good Vermilion River VER13 447350 5950076 448811 5950156 2,156.80 >90% >35% No 5-15% <5% Stable Moderately Diverse/Complex 16 22 72.73 Fair Vermilion River VER12 448797 5950151 450727 5951016 2,448.12 >90% <15% No >15% >15% Stable Not Diverse/Complex 6 22 27.27 PoorVermilion River VER12 448811 5950156 450727 5951032 2,430.84 >90% <15% No >15% >15% Stable Not Diverse/Complex 6 22 27.27 PoorVermilion River VER12 450742 5951024 451749 5950743 1,304.25 >90% <15% No >15% >15% Stable Not Diverse/Complex 6 22 27.27 PoorVermilion River VER12 450742 5951039 451907 5950694 1,473.46 >90% <15% No >15% >15% Stable Not Diverse/Complex 6 22 27.27 PoorVermilion River VER11 451903 5950681 452718 5950172 972.28 >90% >35% No <5% <5% Stable Moderately Diverse/Complex 18 22 81.82 Good Vermilion River VER11 451936 5950682 452700 5950197 916.89 >90% 15-35% No 5-15% <5% Stable Moderately Diverse/Complex 15 22 68.18 Fair Vermilion River VER11 452718 5950172 455462 5949695 2,810.68 >90% <15% No >15% >15% Stable Not Diverse/Complex 6 22 27.27 PoorVermilion River VER11 452700 5950197 455466 5949709 2,834.92 >90% <15% No >15% >15% Stable Not Diverse/Complex 6 22 27.27 PoorVermilion River VER11 455471 5949693 456121 5949512 675.59 >90% <15% No >15% >15% Stable Not Diverse/Complex 6 22 27.27 PoorVermilion River VER11 455475 5949707 456015 5949555 560.76 >90% <15% No >15% >15% Stable Not Diverse/Complex 6 22 27.27 PoorVermilion River VER11 456121 5949512 457516 5949506 1,397.20 >90% >35% No 5-15% <5% Stable Moderately Diverse/Complex 16 22 72.73 Fair Vermilion River VER11 456015 5949555 458155 5949518 2,149.46 >90% >35% No 5-15% <5% Stable Moderately Diverse/Complex 16 22 72.73 Fair
Page 60
APPENDIX A Riparian Health Data
March 2016 Report No. 1532934 A-28
Name Reach Segment Start(a) Segment End(a) Length
[m] % Vegetation
Cover(b) % Woody Species Cover(b)
Evidence of Recruitment (Y/N) (b)
% Area of Human Caused Vegetation Cover Alteration(b)
% Area of Human Caused Bare Ground / Physical Alteration(b)
Overall Bank Stability? (b)
Adjacent Vegetation Structural Complexity(b) Score Possible
Score %
Score Health
Category Easting Northing Easting Northing
Vermilion River VER11 458679 5949324 461239 5948639 2,712.52 >90% >35% Yes <5% <5% Stable Diverse/Complex 22 22 100 Good Vermilion River VER11 458772 5949285 461219 5948684 2,570.07 >90% >35% Yes <5% <5% Stable Diverse/Complex 22 22 100 Good Vermilion River VER11 461219 5948684 462029 5948299 907.10 >90% <15% No >15% <5% Stable Not Diverse/Complex 10 22 45.45 PoorVermilion River VER11 461239 5948639 462026 5948285 869.57 >90% 15-35% No >15% <5% Stable Not Diverse/Complex 11 22 50 Fair Vermilion River VER11 458155 5949518 458772 5949285 667.30 >90% <15% No >15% <5% Stable Not Diverse/Complex 10 22 45.45 PoorVermilion River VER11 457516 5949506 458679 5949324 1,201.20 >90% <15% No >15% <5% Stable Not Diverse/Complex 10 22 45.45 PoorVermilion River VER11 463116 5947545 464525 5946907 1,551.23 >90% >35% No 5-15% <5% Stable Moderately Diverse/Complex 16 22 72.73 Fair Vermilion River VER11 465664 5946007 466792 5945474 1,251.40 >90% >35% Yes <5% <5% Stable Diverse/Complex 22 22 100 Good Vermilion River VER10 468521 5944166 468641 5943727 478.64 >90% <15% No >15% >15% Stable Not Diverse/Complex 6 22 27.27 PoorVermilion River VER11 462036 5948297 464517 5946930 2,883.48 >90% 15-35% No >15% <5% Stable Not Diverse/Complex 11 22 50 Fair Vermilion River VER10 468549 5944017 468650 5943738 316.80 >90% <15% No <5% >15% Stable Not Diverse/Complex 10 22 45.45 PoorVermilion River VER11 466970 5945359 468536 5944165 2,028.91 >90% >35% No >15% <5% Stable Moderately Diverse/Complex 14 22 63.64 Fair Vermilion River VER11 467202 5945010 468505 5944231 1,532.12 >90% >35% Yes <5% <5% Stable Diverse/Complex 22 22 100 Good Vermilion River VER11 466792 5945474 467202 5945010 628.76 >90% <15% Yes >15% <5% Stable Not Diverse/Complex 12 22 54.55 FairVermilion River VER11 465609 5946059 466970 5945359 1,540.03 >90% 15-35% No 5-15% <5% Stable Not Diverse/Complex 13 22 59.09 Fair Vermilion River VER11 464525 5946907 465664 5946007 1,582.11 >90% <15% No >15% >15% Stable Not Diverse/Complex 6 22 27.27 PoorVermilion River VER11 464517 5946930 465609 5946059 1,527.12 >90% <15% No >15% >15% Stable Not Diverse/Complex 6 22 27.27 PoorVermilion River VER11 462035 5948282 463116 5947545 1,344.57 >90% <15% No >15% <5% Stable Not Diverse/Complex 10 22 45.45 PoorVermilion River VER10 468646 5943720 469358 5942308 1,867.65 >90% <15% No >15% <5% Stable Not Diverse/Complex 10 22 45.45 PoorVermilion River VER10 468655 5943731 469377 5942308 1,877.06 >90% <15% No >15% <5% Stable Not Diverse/Complex 10 22 45.45 PoorVermilion River VER10 469353 5942301 470133 5941217 1,993.53 >90% <15% No >15% <5% Stable Not Diverse/Complex 10 22 45.45 PoorVermilion River VER10 469371 5942301 470139 5941231 1,978.18 >90% <15% No >15% <5% Stable Moderately Diverse/Complex 12 22 54.55 Fair Vermilion River VER10 470139 5941209 470920 5940262 1,494.07 >90% <15% No >15% <5% Stable Not Diverse/Complex 10 22 45.45 PoorVermilion River VER10 471309 5940008 472027 5939064 1,570.57 >90% <15% No >15% <5% Stable Not Diverse/Complex 10 22 45.45 PoorVermilion River VER10 472045 5939055 473024 5938383 2,360.94 >90% 15-35% No >15% <5% Stable Not Diverse/Complex 11 22 50 Fair Vermilion River VER10 470920 5940262 471309 5940008 470.14 >90% 15-35% No >15% <5% Stable Not Diverse/Complex 11 22 50 Fair Vermilion River VER10 473024 5938383 473337 5938251 353.64 >90% <15% No >15% 5-15% Stable Not Diverse/Complex 8 22 36.36 PoorVermilion River VER10 472669 5938253 473329 5938240 910.19 >90% <15% No >15% <5% Stable Not Diverse/Complex 10 22 45.45 PoorVermilion River VER10 473335 5938234 473912 5936625 2,222.93 >90% <15% No >15% <5% Stable Not Diverse/Complex 10 22 45.45 PoorVermilion River VER10 473912 5936625 473951 5935817 1,217.32 >90% >35% No >15% <5% Stable Moderately Diverse/Complex 14 22 63.64 Fair Vermilion River VER10 473345 5938244 473927 5936625 2,232.47 >90% <15% No >15% <5% Stable Not Diverse/Complex 10 22 45.45 PoorVermilion River VER10 473879 5936057 473965 5935816 396.73 >90% <15% No >15% <5% Stable Not Diverse/Complex 10 22 45.45 PoorVermilion River VER10 473927 5936625 473879 5936057 821.88 >90% 15-35% No >15% <5% Stable Not Diverse/Complex 11 22 50 Fair Vermilion River VER10 473958 5935046 473700 5933474 3,456.35 >90% <15% No >15% <5% Stable Not Diverse/Complex 10 22 45.45 PoorVermilion River VER10 474070 5934644 473713 5933461 2,926.77 >90% <15% No >15% <5% Stable Not Diverse/Complex 10 22 45.45 PoorVermilion River VER10 473713 5933461 473970 5932580 1,143.62 >90% >35% Yes 5-15% <5% Stable Moderately Diverse/Complex 18 22 81.82 Good Vermilion River VER10 473700 5933474 473955 5932580 1,156.11 >90% >35% Yes 5-15% <5% Stable Moderately Diverse/Complex 18 22 81.82 Good Vermilion River VER10 473951 5935809 473958 5935046 1,022.69 >90% 15-35% No >15% <5% Stable Moderately Diverse/Complex 13 22 59.09 Fair Vermilion River VER10 473973 5932570 474164 5931987 1,186.63 >90% >35% Yes <5% <5% Stable Diverse/Complex 22 22 100 Good Vermilion River VER10 474102 5932157 474109 5931897 719.98 >90% >35% Yes <5% <5% Stable Moderately Diverse/Complex 20 22 90.91 Good Vermilion River VER10 473958 5932570 474102 5932157 658.36 >90% <15% No >15% <5% Stable Not Diverse/Complex 10 22 45.45 PoorVermilion River VER10 474109 5931897 474923 5929536 4,114.10 >90% <15% No >15% <5% Stable Not Diverse/Complex 10 22 45.45 PoorVermilion River VER10 474437 5930900 475084 5930010 1,707.08 >90% 15-35% No <5% <5% Stable Not Diverse/Complex 15 22 68.18 Fair Vermilion River VER10 476131 5928711 476314 5928451 416.59 >90% <15% No >15% 5-15% Stable Not Diverse/Complex 8 22 36.36 PoorVermilion River VER10 475909 5928869 476131 5928711 368.14 >90% >35% Yes <5% <5% Stable Diverse/Complex 22 22 100 Good
Page 61
APPENDIX A Riparian Health Data
March 2016 Report No. 1532934 A-29
Name Reach Segment Start(a) Segment End(a) Length
[m] % Vegetation
Cover(b) % Woody Species Cover(b)
Evidence of Recruitment (Y/N) (b)
% Area of Human Caused Vegetation Cover Alteration(b)
% Area of Human Caused Bare Ground / Physical Alteration(b)
Overall Bank Stability? (b)
Adjacent Vegetation Structural Complexity(b) Score Possible
Score %
Score Health
Category Easting Northing Easting Northing
Vermilion River VER10 475628 5928865 475909 5928869 855.66 >90% <15% No >15% <5% Stable Not Diverse/Complex 10 22 45.45 PoorVermilion River VER10 475084 5930010 475628 5928865 2,296.43 >90% 15-35% No 5-15% <5% Stable Moderately Diverse/Complex 15 22 68.18 Fair Vermilion River VER10 476167 5928672 476303 5928441 353.72 >90% >35% Yes 5-15% 5-15% Stable Moderately Diverse/Complex 16 22 72.73 Fair Vermilion River VER10 475747 5928752 476167 5928672 780.08 >90% <15% No >15% <5% Stable Not Diverse/Complex 10 22 45.45 PoorVermilion River VER10 474923 5929536 475747 5928752 1,816.69 >90% >35% Yes <5% <5% Stable Diverse/Complex 22 22 100 Good Vermilion River VER10 474164 5931987 474437 5930900 1,600.36 >90% <15% No >15% <5% Stable Not Diverse/Complex 10 22 45.45 PoorVermilion River VER10 477623 5926739 477638 5926343 1,252.11 >90% 15-35% No 5-15% 5-15% Stable Moderately Diverse/Complex 13 22 59.09 Fair Vermilion River VER10 479219 5924644 479754 5924495 2,611.08 >90% 15-35% No >15% <5% Stable Not Diverse/Complex 11 22 50 Fair Vermilion River VER10 479564 5924627 479745 5924484 1,250.95 >90% <15% No >15% <5% Stable Not Diverse/Complex 10 22 45.45 PoorVermilion River VER10 479547 5924677 479564 5924627 458.39 >90% 15-35% Yes <5% <5% Stable Moderately Diverse/Complex 19 22 86.36 Good Vermilion River VER10 478785 5924675 479547 5924677 1,657.64 >90% <15% No >15% <5% Stable Not Diverse/Complex 10 22 45.45 PoorVermilion River VER10 478633 5924851 478785 5924675 286.39 >90% >35% No <5% <5% Stable Moderately Diverse/Complex 18 22 81.82 Good Vermilion River VER10 478566 5925017 478633 5924851 921.66 >90% <15% No 5-15% <5% Stable Not Diverse/Complex 12 22 54.55 Fair Vermilion River VER10 478178 5926052 478566 5925017 2,430.26 >90% >35% Yes <5% <5% Stable Moderately Diverse/Complex 20 22 90.91 Good Vermilion River VER10 477432 5927699 477769 5926559 2,173.64 >90% >35% Yes >15% 5-15% Stable Moderately Diverse/Complex 14 22 63.64 Fair Vermilion River VER10 477833 5926382 477973 5926204 1,019.81 >90% >35% Yes <5% <5% Stable Diverse/Complex 22 22 100 Good Vermilion River VER10 477638 5926343 478178 5926052 1,098.23 >90% >35% Yes <5% <5% Stable Diverse/Complex 22 22 100 Good Vermilion River VER10 476306 5928432 476658 5928191 574.81 >90% >35% No 5-15% 5-15% Stable Not Diverse/Complex 12 22 54.55 Fair Vermilion River VER10 476658 5928191 477456 5927494 1,762.97 >90% <15% No >15% <5% Stable Not Diverse/Complex 10 22 45.45 PoorVermilion River VER10 476317 5928443 476918 5928233 920.10 >90% <15% No >15% <5% Stable Not Diverse/Complex 10 22 45.45 PoorVermilion River VER10 476918 5928233 477235 5927888 760.11 >90% >35% No 5-15% <5% Stable Not Diverse/Complex 14 22 63.64 Fair Vermilion River VER10 477235 5927888 477432 5927699 283.63 >90% <15% No >15% <5% Stable Not Diverse/Complex 10 22 45.45 PoorVermilion River VER10 477769 5926559 477833 5926382 474.72 >90% <15% No >15% >15% Stable Not Diverse/Complex 6 22 27.27 PoorVermilion River VER10 477456 5927494 477623 5926739 1,248.54 >90% 15-35% No <5% <5% Stable Moderately Diverse/Complex 17 22 77.27 Fair Vermilion River VER10 477973 5926204 478638 5925458 1,657.82 >90% <15% No >15% <5% Stable Not Diverse/Complex 10 22 45.45 PoorVermilion River VER10 478638 5925458 478529 5925286 246.37 >90% >35% No <5% <5% Stable Moderately Diverse/Complex 18 22 81.82 Good Vermilion River VER10 478529 5925286 478852 5924976 1,303.24 >90% 15-35% No >15% <5% Stable Moderately Diverse/Complex 13 22 59.09 Fair Vermilion River VER10 478852 5924976 479047 5924646 1,004.38 >90% <15% No >15% <5% Stable Not Diverse/Complex 10 22 45.45 PoorVermilion River VER10 479047 5924646 479219 5924644 481.33 >90% 15-35% No 5-15% <5% Stable Moderately Diverse/Complex 15 22 68.18 Fair Vermilion River VER10 479823 5923836 479840 5923203 1,218.72 >90% 15-35% No >15% <5% Stable Not Diverse/Complex 11 22 50 Fair Vermilion River VER10 479726 5923539 479807 5923245 372.85 >90% <15% No >15% <5% Stable Not Diverse/Complex 10 22 45.45 PoorVermilion River VER10 479977 5922699 480880 5920623 4,229.38 >90% <15% No >15% <5% Stable Not Diverse/Complex 10 22 45.45 PoorVermilion River VER10 480066 5922643 480721 5920418 4,136.73 >90% <15% No >15% 5-15% Stable Not Diverse/Complex 8 22 36.36 Poor Vermilion River VER10 480865 5919524 481418 5918959 1,125.27 >90% <15% No >15% <5% Stable Not Diverse/Complex 10 22 45.45 PoorVermilion River VER10 479816 5924179 479817 5923823 837.78 >90% <15% No >15% <5% Stable Not Diverse/Complex 10 22 45.45 PoorVermilion River VER10 479760 5924489 479816 5924179 818.18 >90% 15-35% No >15% <5% Stable Not Diverse/Complex 11 22 50 Fair Vermilion River VER10 479807 5923245 479826 5922871 768.73 >90% >35% No 5-15% <5% Stable Moderately Diverse/Complex 16 22 72.73 Fair Vermilion River VER10 479817 5923823 479874 5923625 288.34 >90% 15-35% No >15% <5% Stable Not Diverse/Complex 11 22 50 Fair Vermilion River VER10 479874 5923625 479761 5923606 265.89 >90% <15% No >15% <5% Stable Not Diverse/Complex 10 22 45.45 PoorVermilion River VER10 479761 5923606 479726 5923539 158.16 >90% >35% No >15% <5% Stable Not Diverse/Complex 12 22 54.55 FairVermilion River VER10 479751 5924477 479732 5924298 469.06 >90% 15-35% No >15% <5% Stable Not Diverse/Complex 11 22 50 Fair Vermilion River VER10 479732 5924298 479826 5924168 368.25 >90% 15-35% No >15% <5% Stable Not Diverse/Complex 11 22 50 Fair Vermilion River VER10 479826 5924168 479823 5923836 777.15 >90% >35% No 5-15% <5% Stable Moderately Diverse/Complex 16 22 72.73 Fair Vermilion River VER10 479840 5923203 479812 5922871 664.14 >90% 15-35% No >15% <5% Stable Not Diverse/Complex 11 22 50 Fair Vermilion River VER10 479813 5922863 479977 5922699 789.05 >90% >35% Yes 5-15% <5% Stable Moderately Diverse/Complex 18 22 81.82 Good
Page 62
APPENDIX A Riparian Health Data
March 2016 Report No. 1532934 A-30
Name Reach Segment Start(a) Segment End(a) Length
[m] % Vegetation
Cover(b) % Woody Species Cover(b)
Evidence of Recruitment (Y/N) (b)
% Area of Human Caused Vegetation Cover Alteration(b)
% Area of Human Caused Bare Ground / Physical Alteration(b)
Overall Bank Stability? (b)
Adjacent Vegetation Structural Complexity(b) Score Possible
Score %
Score Health
Category Easting Northing Easting Northing
Vermilion River VER10 480747 5920433 480588 5919754 1,147.91 >90% <15% No >15% <5% Stable Not Diverse/Complex 10 22 45.45 PoorVermilion River VER10 480831 5919388 481416 5918940 1,282.94 >90% 15-35% No >15% <5% Stable Not Diverse/Complex 11 22 50 Fair Vermilion River VER10 480588 5919754 480831 5919388 471.77 >90% >35% No >15% <5% Stable Moderately Diverse/Complex 14 22 63.64 Fair Vermilion River VER10 480880 5920623 480747 5920433 881.93 >90% 15-35% No >15% <5% Stable Moderately Diverse/Complex 13 22 59.09 Fair Vermilion River VER10 480721 5920418 480865 5919524 1,728.42 >90% 15-35% No >15% <5% Stable Not Diverse/Complex 11 22 50 Fair Vermilion River VER10 479827 5922862 480066 5922643 1,787.13 >90% >35% Yes >15% <5% Stable Moderately Diverse/Complex 16 22 72.73 Fair Vermilion River VER10 481423 5918933 483013 5916068 7,526.74 >90% <15% No >15% 5-15% Stable Not Diverse/Complex 8 22 36.36 Poor Vermilion River VER10 481426 5918950 483012 5916083 7,525.72 >90% <15% No >15% 5-15% Stable Not Diverse/Complex 8 22 36.36 Poor Vermilion River VER10 483021 5916070 483571 5915205 2,762.66 >90% <15% No >15% <5% Stable Not Diverse/Complex 10 22 45.45 PoorVermilion River VER09 484631 5914785 486377 5913697 4,702.00 >90% <15% No >15% <5% Stable Not Diverse/Complex 10 22 45.45 PoorVermilion River VER10 483825 5915003 484256 5914841 1,096.80 >90% <15% No >15% <5% Stable Moderately Diverse/Complex 12 22 54.55 Fair Vermilion River VER10 483571 5915205 483825 5915003 414.03 >90% >35% No >15% <5% Stable Moderately Diverse/Complex 14 22 63.64 Fair Vermilion River VER10 483021 5916085 484244 5914867 4,256.07 >90% <15% No >15% <5% Stable Not Diverse/Complex 10 22 45.45 PoorVermilion River VER09 487726 5913782 488395 5913726 1,369.95 >90% <15% No >15% <5% Stable Not Diverse/Complex 10 22 45.45 PoorVermilion River VER09 484275 5914841 484901 5914841 931.37 >90% >35% Yes >15% <5% Stable Not Diverse/Complex 14 22 63.64 FairVermilion River VER09 484267 5914828 484631 5914785 541.01 >90% 15-35% No >15% <5% Stable Not Diverse/Complex 11 22 50 Fair Vermilion River VER09 486377 5913697 487364 5913654 1,374.11 >90% >35% Yes <5% <5% Stable Diverse/Complex 22 22 100 Good Vermilion River VER09 487364 5913654 487726 5913782 984.84 >90% >35% Yes 5-15% <5% Stable Moderately Diverse/Complex 18 22 81.82 Good Vermilion River VER09 490934 5912050 493196 5911827 4,319.92 >90% <15% No >15% 5-15% Stable Not Diverse/Complex 8 22 36.36 Poor Vermilion River VER09 490030 5912995 490748 5912079 2,710.58 >90% >35% Yes <5% <5% Stable Moderately Diverse/Complex 20 22 90.91 Good Vermilion River VER09 490748 5912079 493197 5911813 4,536.49 >90% <15% No 5-15% <5% Stable Not Diverse/Complex 12 22 54.55 Fair Vermilion River VER09 488402 5913725 489607 5913014 2,867.36 >90% >35% Yes <5% <5% Stable Moderately Diverse/Complex 20 22 90.91 Good Vermilion River VER09 488405 5913739 489119 5913307 1,977.83 >90% >35% No 5-15% <5% Stable Moderately Diverse/Complex 16 22 72.73 Fair Vermilion River VER09 489119 5913307 490239 5912976 2,632.96 >90% >35% No >15% 5-15% Stable Moderately Diverse/Complex 12 22 54.55 Fair Vermilion River VER09 489607 5913014 490030 5912995 1,459.98 >90% 15-35% No >15% 5-15% Stable Not Diverse/Complex 9 22 40.91 Poor Vermilion River VER09 490239 5912976 490583 5912471 731.26 >90% 15-35% No >15% <5% Stable Not Diverse/Complex 11 22 50 Fair Vermilion River VER09 490583 5912471 490934 5912050 1,906.70 >90% >35% No 5-15% <5% Stable Moderately Diverse/Complex 16 22 72.73 Fair
Vermilion River VER09 493204 5911812 495907 5911244 5,216.86 >90% <15% No >15% 5-15% Moderately Unstable Not Diverse/Complex 6 22 27.27 Poor
Vermilion River VER09 493205 5911826 496482 5911568 6,708.95 >90% <15% No 5-15% 5-15% Moderately Unstable Not Diverse/Complex 8 22 36.36 Poor
Vermilion River VER09 496482 5911568 496587 5911766 757.27 >90% >35% No >15% <5% Stable Not Diverse/Complex 12 22 54.55 FairVermilion River VER09 495907 5911244 496772 5912228 3,202.03 >90% >35% Yes 5-15% <5% Stable Diverse/Complex 20 22 90.91 Good Vermilion River VER09 496587 5911766 497421 5914026 4,477.41 >90% <15% No >15% <5% Stable Not Diverse/Complex 10 22 45.45 PoorVermilion River VER09 496772 5912228 497020 5913718 2,865.13 >90% 15-35% No >15% <5% Stable Not Diverse/Complex 11 22 50 Fair Vermilion River VER09 497200 5913987 497421 5914012 222.66 >90% <15% No >15% <5% Stable Not Diverse/Complex 10 22 45.45 PoorVermilion River VER09 497020 5913718 497200 5913987 437.28 >90% >35% Yes <5% <5% Stable Diverse/Complex 22 22 100 Good Vermilion River VER08 504102 5912939 509285 5912425 7,674.75 >90% <15% No >15% <5% Stable Not Diverse/Complex 10 22 45.45 PoorVermilion River VER09 497430 5914012 497939 5914335 1,215.75 >90% <15% No >15% <5% Stable Not Diverse/Complex 10 22 45.45 PoorVermilion River VER09 497939 5914335 498914 5914712 1,283.83 >90% >35% Yes >15% <5% Stable Moderately Diverse/Complex 16 22 72.73 Fair Vermilion River VER09 498914 5914712 500712 5913807 4,749.99 >90% <15% No >15% <5% Stable Not Diverse/Complex 10 22 45.45 PoorVermilion River VER09 500712 5913807 501525 5913445 1,007.93 >90% 15-35% No >15% <5% Stable Not Diverse/Complex 11 22 50 Fair Vermilion River VER09 501525 5913445 503241 5912810 3,769.56 >90% <15% No <5% <5% Stable Moderately Diverse/Complex 16 22 72.73 Fair Vermilion River VER09 503337 5913114 503906 5913007 1,313.61 >90% 15-35% No <5% <5% Stable Moderately Diverse/Complex 17 22 77.27 Fair Vermilion River VER08 509314 5912432 509574 5912321 302.95 75-90% <15% No >15% >15% Stable Not Diverse/Complex 5 22 22.73 PoorVermilion River VER08 509317 5912418 509579 5912307 304.63 >90% 15-35% No >15% 5-15% Stable Not Diverse/Complex 9 22 40.91 Poor
Page 63
APPENDIX A Riparian Health Data
March 2016 Report No. 1532934 A-31
Name Reach Segment Start(a) Segment End(a) Length
[m] % Vegetation
Cover(b) % Woody Species Cover(b)
Evidence of Recruitment (Y/N) (b)
% Area of Human Caused Vegetation Cover Alteration(b)
% Area of Human Caused Bare Ground / Physical Alteration(b)
Overall Bank Stability? (b)
Adjacent Vegetation Structural Complexity(b) Score Possible
Score %
Score Health
Category Easting Northing Easting Northing
Vermilion River VER08 509594 5912308 510037 5912325 714.06 >90% <15% No >15% <5% Stable Not Diverse/Complex 10 22 45.45 PoorVermilion River VER08 510037 5912325 510742 5912557 1,315.67 >90% >35% Yes 5-15% <5% Stable Moderately Diverse/Complex 18 22 81.82 Good Vermilion River VER08 509588 5912321 511059 5912985 3,047.17 >90% <15% No >15% <5% Stable Not Diverse/Complex 10 22 45.45 PoorVermilion River VER08 511059 5912985 513874 5913425 4,338.38 >90% 15-35% No <5% <5% Stable Moderately Diverse/Complex 17 22 77.27 Fair Vermilion River VER08 510742 5912557 511878 5912756 2,299.89 >90% <15% No >15% <5% Stable Not Diverse/Complex 10 22 45.45 PoorVermilion River VER08 511878 5912756 513815 5912815 3,838.34 >90% <15% No <5% <5% Stable Moderately Diverse/Complex 16 22 72.73 Fair Vermilion River VER06 514440 5912923 516341 5915656 3,433.55 >90% <15% No >15% <5% Stable Not Diverse/Complex 10 22 45.45 PoorVermilion River VER06 514438 5912937 516054 5915191 2,869.32 >90% <15% No >15% <5% Stable Not Diverse/Complex 10 22 45.45 PoorVermilion River VER06 516054 5915191 516237 5915435 306.14 >90% >35% Yes <5% <5% Stable Moderately Diverse/Complex 20 22 90.91 Good Vermilion River VER06 516237 5915435 516750 5916434 1,136.08 >90% <15% No >15% <5% Stable Not Diverse/Complex 10 22 45.45 PoorVermilion River VER06 516750 5916434 517055 5916936 594.46 >90% 15-35% No 5-15% <5% Stable Moderately Diverse/Complex 15 22 68.18 Fair Vermilion River VER06 516341 5915656 517218 5917094 1,707.82 >90% >35% Yes <5% <5% Stable Diverse/Complex 22 22 100 Good Vermilion River VER06 517055 5916936 518725 5918008 2,078.05 >90% <15% No >15% <5% Stable Not Diverse/Complex 10 22 45.45 PoorVermilion River VER06 517902 5917601 518723 5917994 963.56 >90% <15% No >15% <5% Stable Not Diverse/Complex 10 22 45.45 PoorVermilion River VER06 517218 5917094 517562 5917428 488.24 >90% <15% No >15% <5% Stable Not Diverse/Complex 10 22 45.45 PoorVermilion River VER06 517562 5917428 517902 5917601 385.59 >90% >35% No <5% <5% Stable Moderately Diverse/Complex 18 22 81.82 Good Vermilion River VER06 518731 5917994 522222 5919523 5,233.00 >90% <15% No >15% <5% Stable Not Diverse/Complex 10 22 45.45 PoorVermilion River VER06 518736 5918007 520352 5918683 2,658.80 >90% <15% No >15% <5% Stable Not Diverse/Complex 10 22 45.45 PoorVermilion River VER06 522222 5919523 522618 5920380 970.09 >90% >35% Yes 5-15% <5% Stable Moderately Diverse/Complex 18 22 81.82 Good Vermilion River VER06 522618 5920380 522551 5920782 410.78 >90% <15% No >15% <5% Stable Not Diverse/Complex 10 22 45.45 PoorVermilion River VER06 522499 5919927 522531 5920741 835.62 >90% >35% Yes <5% <5% Stable Diverse/Complex 22 22 100 Good Vermilion River VER06 522551 5920782 522819 5921294 578.63 >90% >35% Yes <5% <5% Stable Moderately Diverse/Complex 20 22 90.91 Good Vermilion River VER06 522819 5921294 522960 5921761 545.55 >90% <15% No >15% <5% Stable Not Diverse/Complex 10 22 45.45 PoorVermilion River VER06 522800 5921615 523954 5922671 1,774.10 >90% 15-35% No >15% <5% Stable Not Diverse/Complex 11 22 50 Fair Vermilion River VER06 525212 5922941 525705 5923049 852.99 >90% >35% No <5% <5% Stable Diverse/Complex 20 22 90.91 Good Vermilion River VER06 524836 5922833 525205 5922936 581.67 >90% 15-35% No >15% <5% Stable Not Diverse/Complex 11 22 50 Fair Vermilion River VER06 524334 5922637 524836 5922833 713.23 >90% >35% Yes <5% <5% Stable Diverse/Complex 22 22 100 Good Vermilion River VER06 523948 5922590 524334 5922637 473.06 >90% <15% No >15% <5% Stable Not Diverse/Complex 10 22 45.45 PoorVermilion River VER06 523444 5922175 523948 5922590 700.90 >90% >35% Yes <5% <5% Stable Moderately Diverse/Complex 20 22 90.91 Good Vermilion River VER06 522960 5921761 523115 5921952 270.32 >90% >35% Yes <5% <5% Stable Moderately Diverse/Complex 20 22 90.91 Good Vermilion River VER06 523954 5922671 525205 5922954 1,706.60 >90% <15% No >15% <5% Stable Not Diverse/Complex 10 22 45.45 PoorVermilion River VER06 522531 5920741 522800 5921615 947.56 >90% <15% No >15% <5% Stable Not Diverse/Complex 10 22 45.45 PoorVermilion River VER06 520738 5918832 522499 5919927 2,615.59 >90% <15% No >15% <5% Stable Not Diverse/Complex 10 22 45.45 PoorVermilion River VER06 520352 5918683 520738 5918832 435.96 >90% 15-35% No >15% <5% Stable Not Diverse/Complex 11 22 50 Fair Vermilion River VER05 525857 5923261 528471 5922548 4,632.24 >90% <15% No >15% <5% Stable Not Diverse/Complex 10 22 45.45 PoorVermilion River VER05 525859 5923275 528470 5922564 4,630.75 >90% 15-35% Yes >15% <5% Stable Not Diverse/Complex 13 22 59.09 Fair Vermilion River VER06 525212 5922959 525843 5923271 1,136.45 >90% 15-35% No >15% <5% Stable Not Diverse/Complex 11 22 50 Fair Vermilion River VER06 525705 5923049 525857 5923261 299.37 >90% <15% No >15% <5% Stable Not Diverse/Complex 10 22 45.45 PoorVermilion River VER05 528476 5922567 530106 5922173 2,793.86 >90% <15% No >15% <5% Stable Not Diverse/Complex 10 22 45.45 PoorVermilion River VER05 528476 5922551 530107 5922159 2,796.98 >90% <15% No >15% <5% Stable Not Diverse/Complex 10 22 45.45 PoorVermilion River VER05 530118 5922173 531068 5922530 1,610.24 >90% <15% No >15% <5% Stable Not Diverse/Complex 10 22 45.45 PoorVermilion River VER05 531068 5922530 531556 5922771 832.63 >90% 15-35% No 5-15% <5% Stable Moderately Diverse/Complex 15 22 68.18 Fair Vermilion River VER05 531556 5922771 531737 5922881 224.50 >90% <15% No >15% <5% Stable Not Diverse/Complex 10 22 45.45 PoorVermilion River VER05 530119 5922159 531738 5922867 2,668.67 >90% <15% No >15% <5% Stable Not Diverse/Complex 10 22 45.45 PoorVermilion River VER05 531744 5922867 532006 5922776 398.19 >90% <15% No >15% <5% Stable Not Diverse/Complex 10 22 45.45 Poor
Page 64
APPENDIX A Riparian Health Data
March 2016 Report No. 1532934 A-32
Name Reach Segment Start(a) Segment End(a) Length
[m] % Vegetation
Cover(b) % Woody Species Cover(b)
Evidence of Recruitment (Y/N) (b)
% Area of Human Caused Vegetation Cover Alteration(b)
% Area of Human Caused Bare Ground / Physical Alteration(b)
Overall Bank Stability? (b)
Adjacent Vegetation Structural Complexity(b) Score Possible
Score %
Score Health
Category Easting Northing Easting Northing
Vermilion River VER05 531744 5922881 531994 5922792 386.23 >90% <15% No >15% <5% Stable Not Diverse/Complex 10 22 45.45 PoorVermilion River VER05 532921 5926070 532742 5926550 587.63 >90% >35% Yes >15% <5% Stable Moderately Diverse/Complex 16 22 72.73 Fair Vermilion River VER05 532089 5923620 532908 5926062 5,525.71 >90% <15% No >15% 5-15% Stable Not Diverse/Complex 8 22 36.36 Poor Vermilion River VER05 532055 5923239 531941 5923623 910.74 >90% <15% No >15% <5% Stable Not Diverse/Complex 10 22 45.45 PoorVermilion River VER05 531994 5922792 532100 5923332 842.65 >90% >35% No 5-15% <5% Stable Not Diverse/Complex 14 22 63.64 Fair Vermilion River VER05 532100 5923332 532089 5923620 471.97 >90% >35% No 5-15% <5% Stable Moderately Diverse/Complex 16 22 72.73 Fair Vermilion River VER05 531941 5923623 532022 5923802 351.59 >90% 15-35% No 5-15% <5% Stable Moderately Diverse/Complex 15 22 68.18 Fair Vermilion River VER05 532006 5922776 532055 5923239 585.24 >90% >35% Yes <5% <5% Stable Diverse/Complex 22 22 100 Good Vermilion River VER05 532731 5926427 533293 5927063 2,240.98 >90% <15% No >15% <5% Stable Not Diverse/Complex 10 22 45.45 PoorVermilion River VER05 533436 5926994 533599 5926915 285.94 >90% >35% Yes 5-15% <5% Stable Moderately Diverse/Complex 18 22 81.82 Good Vermilion River VER05 533293 5927063 533593 5926929 492.77 >90% >35% No >15% <5% Stable Moderately Diverse/Complex 14 22 63.64 Fair Vermilion River VER05 532948 5927000 533436 5926994 734.29 >90% 15-35% No >15% <5% Stable Moderately Diverse/Complex 13 22 59.09 Fair Vermilion River VER05 532544 5926520 532948 5927000 917.66 >90% <15% No >15% <5% Stable Not Diverse/Complex 10 22 45.45 PoorVermilion River VER05 532627 5926477 532544 5926520 488.61 >90% >35% Yes <5% <5% Stable Moderately Diverse/Complex 20 22 90.91 Good Vermilion River VER05 532742 5926550 532627 5926477 155.16 >90% <15% No >15% <5% Stable Not Diverse/Complex 10 22 45.45 PoorVermilion River VER05 532906 5926070 532731 5926427 451.67 >90% >35% Yes >15% <5% Stable Moderately Diverse/Complex 16 22 72.73 Fair Vermilion River VER04 533599 5926915 534331 5926235 1,849.69 >90% >35% Yes 5-15% <5% Stable Moderately Diverse/Complex 18 22 81.82 Good Vermilion River VER04 534054 5926703 534373 5926358 802.14 >90% >35% Yes 5-15% <5% Stable Moderately Diverse/Complex 18 22 81.82 Good Vermilion River VER04 534373 5926358 534345 5926231 499.30 >90% <15% No >15% <5% Stable Not Diverse/Complex 10 22 45.45 PoorVermilion River VER04 533609 5926932 534054 5926703 570.33 >90% <15% No >15% 5-15% Stable Not Diverse/Complex 8 22 36.36 PoorVermilion River VER04 534559 5925759 535137 5925262 965.85 >90% >35% Yes >15% <5% Stable Moderately Diverse/Complex 16 22 72.73 Fair Vermilion River VER04 535137 5925262 535825 5924940 2,181.44 >90% <15% No >15% <5% Stable Not Diverse/Complex 10 22 45.45 PoorVermilion River VER04 536411 5924747 536612 5924671 546.44 >90% >35% No 5-15% <5% Stable Not Diverse/Complex 14 22 63.64 Fair Vermilion River VER04 537098 5924761 537948 5925666 2,150.71 >90% >35% Yes <5% <5% Stable Diverse/Complex 22 22 100 Good Vermilion River VER04 537949 5926036 538477 5926364 1,210.25 >90% >35% Yes <5% <5% Stable Diverse/Complex 22 22 100 Good Vermilion River VER04 534626 5925882 535504 5925085 2,963.39 >90% >35% Yes 5-15% <5% Stable Diverse/Complex 20 22 90.91 Good Vermilion River VER04 539576 5927142 539872 5927140 462.71 >90% <15% Yes >15% <5% Stable Not Diverse/Complex 12 22 54.55 FairVermilion River VER04 539340 5927115 539626 5927274 423.27 >90% >35% Yes <5% <5% Stable Moderately Diverse/Complex 20 22 90.91 Good Vermilion River VER04 539626 5927274 539872 5927154 338.82 >90% <15% No >15% <5% Stable Not Diverse/Complex 10 22 45.45 PoorVermilion River VER04 539259 5926940 539340 5927115 244.08 >90% 15-35% No >15% 5-15% Stable Not Diverse/Complex 9 22 40.91 Poor Vermilion River VER04 539218 5926859 539259 5926940 537.31 >90% >35% No 5-15% <5% Stable Moderately Diverse/Complex 16 22 72.73 Fair Vermilion River VER04 538745 5926948 539576 5927142 2,286.05 >90% >35% No 5-15% <5% Stable Moderately Diverse/Complex 16 22 72.73 Fair Vermilion River VER04 538776 5927089 539218 5926859 1,077.70 >90% <15% No >15% <5% Stable Not Diverse/Complex 10 22 45.45 PoorVermilion River VER04 538429 5926180 538442 5926725 1,127.85 >90% >35% Yes <5% <5% Stable Moderately Diverse/Complex 20 22 90.91 Good Vermilion River VER04 538442 5926725 538776 5927089 542.59 >90% >35% Yes 5-15% <5% Stable Moderately Diverse/Complex 18 22 81.82 Good Vermilion River VER04 538477 5926364 538745 5926948 1,321.81 >90% >35% No >15% <5% Stable Moderately Diverse/Complex 14 22 63.64 Fair Vermilion River VER04 537948 5925666 537949 5926036 1,084.44 >90% >35% Yes 5-15% >15% Stable Not Diverse/Complex 12 22 54.55 Fair Vermilion River VER04 537728 5925887 538429 5926180 1,501.71 >90% 15-35% No >15% <5% Stable Not Diverse/Complex 11 22 50 Fair Vermilion River VER04 536965 5925036 537728 5925887 3,586.27 >90% >35% Yes <5% <5% Stable Diverse/Complex 22 22 100 Good Vermilion River VER04 536839 5924932 537098 5924761 1,021.04 >90% 15-35% Yes 5-15% <5% Stable Moderately Diverse/Complex 17 22 77.27 Fair Vermilion River VER04 536312 5924831 536965 5925036 968.73 >90% 15-35% No >15% <5% Stable Not Diverse/Complex 11 22 50 Fair Vermilion River VER04 535842 5924940 536312 5924831 1,646.30 >90% >35% Yes 5-15% <5% Stable Moderately Diverse/Complex 18 22 81.82 Good Vermilion River VER04 535825 5924940 535812 5924631 376.06 >90% 15-35% Yes >15% <5% Stable Not Diverse/Complex 13 22 59.09 Fair Vermilion River VER04 535812 5924631 536016 5924701 222.20 >90% >35% No <5% <5% Stable Moderately Diverse/Complex 18 22 81.82 Good Vermilion River VER04 536016 5924701 536136 5924704 408.46 >90% 15-35% No <5% <5% Stable Moderately Diverse/Complex 17 22 77.27 Fair
Page 65
APPENDIX A Riparian Health Data
March 2016 Report No. 1532934 A-33
Name Reach Segment Start(a) Segment End(a) Length
[m] % Vegetation
Cover(b) % Woody Species Cover(b)
Evidence of Recruitment (Y/N) (b)
% Area of Human Caused Vegetation Cover Alteration(b)
% Area of Human Caused Bare Ground / Physical Alteration(b)
Overall Bank Stability? (b)
Adjacent Vegetation Structural Complexity(b) Score Possible
Score %
Score Health
Category Easting Northing Easting Northing
Vermilion River VER04 536136 5924704 536411 5924747 555.50 >90% <15% No <5% <5% Stable Not Diverse/Complex 14 22 63.64 Fair Vermilion River VER04 536612 5924671 536839 5924932 368.48 >90% <15% No >15% <5% Stable Not Diverse/Complex 10 22 45.45 PoorVermilion River VER04 535504 5925085 535842 5924940 531.88 >90% <15% No >15% <5% Stable Not Diverse/Complex 10 22 45.45 PoorVermilion River VER04 534342 5926226 534626 5925882 581.98 >90% 15-35% No >15% <5% Stable Not Diverse/Complex 11 22 50 Fair Vermilion River VER04 534329 5926230 534559 5925759 934.61 >90% >35% Yes <5% <5% Stable Diverse/Complex 22 22 100 Good
Vermilion River VER03 539990 5927064 540975 5928419 3,679.15 >90% <15% No >15% <5% Moderately Unstable Not Diverse/Complex 8 22 36.36 Poor
Vermilion River VER03 539993 5927082 540852 5927764 2,349.37 >90% <15% No >15% <5% Moderately Unstable Not Diverse/Complex 8 22 36.36 Poor
Vermilion River VER03 540861 5928566 540618 5928889 812.49 >90% 15-35% No 5-15% <5% Moderately Unstable Moderately Diverse/Complex 13 22 59.09 Fair
Vermilion River VER02 540631 5928898 540341 5929195 466.54 >90% <15% No >15% <5% Moderately Unstable Not Diverse/Complex 8 22 36.36 Poor
Vermilion River VER02 540618 5928889 540325 5929198 477.43 >90% <15% No >15% 5-15% Moderately Unstable Not Diverse/Complex 6 22 27.27 Poor
Vermilion River VER03 540852 5927764 540861 5928566 1,516.99 >90% >35% Yes <5% <5% Stable Diverse/Complex 22 22 100 Good
Vermilion River VER03 540975 5928419 540636 5928882 1,014.02 >90% >35% Yes 5-15% <5% Moderately Unstable Moderately Diverse/Complex 16 22 72.73 Fair
Vermilion River VER02 540324 5929207 540051 5929503 768.34 >90% >35% No >15% <5% Stable Moderately Diverse/Complex 14 22 63.64 Fair Vermilion River VER02 538862 5930017 538199 5930815 1,866.29 >90% >35% Yes >15% <5% Stable Moderately Diverse/Complex 16 22 72.73 Fair Vermilion River VER02 539615 5929418 539042 5930138 2,046.05 >90% >35% Yes <5% <5% Stable Diverse/Complex 22 22 100 Good Vermilion River VER02 539561 5933758 539898 5934300 758.44 >90% <15% No >15% <5% Stable Not Diverse/Complex 10 22 45.45 PoorVermilion River VER02 539669 5933719 539902 5934287 844.75 >90% 15-35% No 5-15% <5% Stable Not Diverse/Complex 13 22 59.09 Fair Vermilion River VER02 538834 5932992 539669 5933719 1,564.74 >90% >35% Yes <5% <5% Stable Diverse/Complex 22 22 100 Good Vermilion River VER02 538997 5933284 539561 5933758 1,233.98 >90% 15-35% Yes >15% <5% Stable Moderately Diverse/Complex 15 22 68.18 Fair
Vermilion River VER02 538217 5932696 538834 5932992 1,509.96 >90% <15% No >15% <5% Moderately Unstable Not Diverse/Complex 8 22 36.36 Poor
Vermilion River VER02 537834 5932366 538217 5932696 631.04 >90% >35% No <5% <5% Moderately Unstable Moderately Diverse/Complex 16 22 72.73 Fair
Vermilion River VER02 537797 5932398 538997 5933284 2,535.80 >90% <15% No >15% <5% Stable Not Diverse/Complex 10 22 45.45 PoorVermilion River VER02 537666 5931292 537797 5932398 2,480.44 >90% >35% Yes <5% <5% Stable Moderately Diverse/Complex 20 22 90.91 Good Vermilion River VER02 537673 5931372 537834 5932366 2,327.53 >90% <15% No >15% <5% Stable Not Diverse/Complex 10 22 45.45 PoorVermilion River VER02 539042 5930138 537673 5931372 3,320.65 >90% >35% No >15% <5% Stable Moderately Diverse/Complex 14 22 63.64 Fair Vermilion River VER02 540339 5929205 539615 5929418 1,316.22 >90% <15% No >15% 5-15% Stable Not Diverse/Complex 8 22 36.36 Poor Vermilion River VER02 540051 5929503 539737 5929430 336.89 >90% 15-35% No >15% <5% Stable Moderately Diverse/Complex 13 22 59.09 Fair Vermilion River VER02 539737 5929430 539594 5929339 261.86 >90% 15-35% No <5% <5% Stable Moderately Diverse/Complex 17 22 77.27 Fair Vermilion River VER02 539594 5929339 538862 5930017 1,764.03 >90% >35% Yes <5% <5% Stable Diverse/Complex 22 22 100 Good Vermilion River VER02 538199 5930815 537666 5931292 1,572.13 >90% <15% No >15% <5% Stable Not Diverse/Complex 10 22 45.45 PoorVermilion River VER02 539908 5934289 540264 5935312 1,626.16 >90% >35% No 5-15% <5% Stable Moderately Diverse/Complex 16 22 72.73 Fair Vermilion River VER02 539903 5934302 539647 5935818 2,553.30 >90% <15% No >15% <5% Stable Not Diverse/Complex 10 22 45.45 Poor
Vermilion River VER02 540264 5935312 539659 5935825 951.47 >90% <15% No >15% <5% Moderately Unstable Not Diverse/Complex 8 22 36.36 Poor
Vermilion River VER02 539655 5935832 539243 5936488 1,239.15 >90% <15% No >15% <5% Moderately Unstable Not Diverse/Complex 8 22 36.36 Poor
Vermilion River VER02 539243 5936488 538582 5937165 1,401.13 >90% >35% Yes <5% <5% Stable Diverse/Complex 22 22 100 Good
Vermilion River VER02 538582 5937165 537740 5938047 1,881.38 >90% <15% No >15% 5-15% Moderately Unstable Not Diverse/Complex 6 22 27.27 Poor
Vermilion River VER02 539343 5935965 538998 5936518 1,214.04 >90% <15% No >15% <5% Moderately Unstable Diverse/Complex 12 22 54.55 Fair
Page 66
APPENDIX A Riparian Health Data
March 2016 Report No. 1532934 A-34
Name Reach Segment Start(a) Segment End(a) Length
[m] % Vegetation
Cover(b) % Woody Species Cover(b)
Evidence of Recruitment (Y/N) (b)
% Area of Human Caused Vegetation Cover Alteration(b)
% Area of Human Caused Bare Ground / Physical Alteration(b)
Overall Bank Stability? (b)
Adjacent Vegetation Structural Complexity(b) Score Possible
Score %
Score Health
Category Easting Northing Easting Northing
Vermilion River VER02 538546 5936904 538094 5937551 1,150.81 >90% >35% No >15% <5% Stable Moderately Diverse/Complex 14 22 63.64 Fair
Vermilion River VER02 538998 5936518 538546 5936904 755.71 >90% 15-35% Yes 5-15% <5% Moderately Unstable Moderately Diverse/Complex 15 22 68.18 Fair
Vermilion River VER02 539644 5935824 539343 5935965 395.51 >90% 15-35% No 5-15% <5% Stable Not Diverse/Complex 13 22 59.09 Fair Vermilion River VER02 537767 5937461 537730 5938057 656.62 >90% 15-35% No >15% 5-15% Stable Not Diverse/Complex 9 22 40.91 Poor
Vermilion River VER02 538094 5937551 537767 5937461 369.87 >90% <15% No >15% <5% Moderately Unstable Not Diverse/Complex 8 22 36.36 Poor
Vermilion River VER02 537735 5938065 537505 5938367 592.58 >90% <15% No >15% <5% Stable Not Diverse/Complex 10 22 45.45 Poor
Vermilion River VER01 539757 5944020 540071 5944332 710.26 >90% >35% No 5-15% <5% Moderately Unstable Moderately Diverse/Complex 14 22 63.64 Fair
Vermilion River VER02 537796 5940630 538038 5941499 1,481.71 >90% <15% No >15% <5% Stable Not Diverse/Complex 10 22 45.45 PoorVermilion River VER01 538192 5942160 538871 5942761 2,177.78 >90% >35% Yes <5% <5% Stable Diverse/Complex 22 22 100 Good
Vermilion River VER01 538179 5942165 538854 5942315 1,333.62 >90% <15% No >15% <5% Moderately Unstable Not Diverse/Complex 8 22 36.36 Poor
Vermilion River VER01 538854 5942315 538790 5942566 497.02 >90% >35% Yes <5% <5% Stable Diverse/Complex 22 22 100 Good Vermilion River VER01 538871 5942761 538906 5942975 803.10 >90% <15% No >15% <5% Stable Not Diverse/Complex 10 22 45.45 PoorVermilion River VER01 538906 5942975 539768 5943184 1,517.31 >90% >35% Yes <5% <5% Stable Diverse/Complex 22 22 100 Good
Vermilion River VER01 539768 5943184 539920 5943890 977.44 >90% >35% No >15% <5% Moderately Unstable Moderately Diverse/Complex 12 22 54.55 Fair
Vermilion River VER01 539920 5943890 540812 5943962 1,865.48 >90% <15% No >15% <5% Moderately Unstable Not Diverse/Complex 8 22 36.36 Poor
Vermilion River VER01 540812 5943962 541700 5944783 1,369.67 >90% >35% Yes <5% <5% Stable Diverse/Complex 22 22 100 Good Vermilion River VER01 541700 5944783 542236 5944723 936.04 >90% <15% No >15% <5% Stable Not Diverse/Complex 10 22 45.45 PoorVermilion River VER01 542236 5944723 542631 5944828 443.65 >90% >35% Yes <5% <5% Stable Diverse/Complex 22 22 100 Good Vermilion River VER01 542631 5944828 543149 5945135 916.17 >90% >35% Yes 5-15% <5% Stable Moderately Diverse/Complex 18 22 81.82 Good Vermilion River VER01 543149 5945135 543298 5944921 340.61 >90% 15-35% No >15% 5-15% Stable Not Diverse/Complex 9 22 40.91 Poor Vermilion River VER01 543159 5945159 543890 5945827 1,972.14 >90% >35% No >15% >15% Stable Moderately Diverse/Complex 10 22 45.45 Poor Vermilion River VER01 542933 5945076 543159 5945159 347.41 >90% >35% No 5-15% <5% Highly Unstable Moderately Diverse/Complex 12 22 54.55 Fair Vermilion River VER01 542628 5944842 542933 5945076 569.29 >90% 15-35% No >15% <5% Stable Moderately Diverse/Complex 13 22 59.09 Fair
Vermilion River VER01 541661 5944745 542628 5944842 1,444.45 >90% <15% No 5-15% <5% Moderately Unstable Not Diverse/Complex 10 22 45.45 Poor
Vermilion River VER01 541051 5944137 541661 5944745 981.33 >90% >35% Yes <5% <5% Stable Diverse/Complex 22 22 100 Good
Vermilion River VER01 540516 5944229 541051 5944137 768.84 >90% <15% No >15% <5% Moderately Unstable Not Diverse/Complex 8 22 36.36 Poor
Vermilion River VER01 538790 5942566 538622 5942898 619.25 >90% <15% No >15% <5% Stable Not Diverse/Complex 10 22 45.45 Poor
Vermilion River VER01 538622 5942898 538781 5943126 315.19 >90% >35% Yes <5% <5% Moderately Unstable Diverse/Complex 20 22 90.91 Good
Vermilion River VER01 538781 5943126 539747 5943333 2,032.35 >90% >35% Yes 5-15% <5% Stable Moderately Diverse/Complex 18 22 81.82 Good
Vermilion River VER01 539747 5943333 539757 5944020 880.47 >90% >35% No 5-15% <5% Moderately Unstable Moderately Diverse/Complex 14 22 63.64 Fair
Vermilion River VER01 540071 5944332 540516 5944229 522.99 >90% >35% Yes <5% <5% Moderately Unstable Diverse/Complex 20 22 90.91 Good
Vermilion River VER02 537745 5938055 537443 5939112 1,406.67 >90% <15% No >15% <5% Stable Not Diverse/Complex 10 22 45.45 PoorVermilion River VER02 537505 5938367 537632 5940054 1,819.40 >90% >35% Yes <5% <5% Stable Diverse/Complex 22 22 100 Good Vermilion River VER02 537443 5939112 537796 5940630 1,666.03 >90% 15-35% No >15% <5% Stable Not Diverse/Complex 11 22 50 Fair Vermilion River VER02 538038 5941499 538171 5942105 1,004.66 >90% 15-35% No >15% <5% Stable Moderately Diverse/Complex 13 22 59.09 Fair Vermilion River VER02 537632 5940054 538168 5941528 2,286.57 >90% 15-35% No 5-15% 5-15% Stable Not Diverse/Complex 11 22 50 Fair Vermilion River VER10 473965 5935808 474096 5934972 1,171.29 >90% <15% No >15% <5% Stable Not Diverse/Complex 10 22 45.45 Poor
Page 67
APPENDIX A Riparian Health Data
March 2016 Report No. 1532934 A-35
Name Reach Segment Start(a) Segment End(a) Length
[m] % Vegetation
Cover(b) % Woody Species Cover(b)
Evidence of Recruitment (Y/N) (b)
% Area of Human Caused Vegetation Cover Alteration(b)
% Area of Human Caused Bare Ground / Physical Alteration(b)
Overall Bank Stability? (b)
Adjacent Vegetation Structural Complexity(b) Score Possible
Score %
Score Health
Category Easting Northing Easting Northing
Vermilion River VER10 474096 5934972 474070 5934644 393.27 >90% <15% No >15% <5% Stable Moderately Diverse/Complex 12 22 54.55 Fair Vermilion River VER02 538168 5941528 538159 5942096 841.65 >90% >35% Yes <5% <5% Stable Diverse/Complex 22 22 100 Good Vermilion River VER04 539880 5927140 539978 5927079 119.01 >90% <15% No >15% <5% Stable Not Diverse/Complex 10 22 45.45 PoorVermilion River VER01 538171 5942105 538189 5942154 56.91 >90% 15-35% No >15% <5% Stable Moderately Diverse/Complex 13 22 59.09 Fair
Vermilion River VER04 539880 5927154 539993 5927082 138.58 >90% <15% No >15% <5% Moderately Unstable Not Diverse/Complex 8 22 36.36 Poor
Vermilion River VER08 513874 5913425 514438 5912937 1,461.09 >90% <15% No >15% <5% Stable Not Diverse/Complex 10 22 45.45 PoorVermilion River VER08 513815 5912815 514440 5912923 675.59 >90% <15% No >15% <5% Stable Not Diverse/Complex 10 22 45.45 PoorVermilion River VER08 509285 5912425 509314 5912432 29.69 >90% <15% No >15% <5% Stable Not Diverse/Complex 10 22 45.45 PoorVermilion River VER08 509287 5912411 509317 5912418 31.09 >90% >35% Yes <5% <5% Stable Diverse/Complex 22 22 100 Good Vermilion River VER09 503241 5912810 504117 5912933 1,226.48 >90% >35% Yes <5% <5% Stable Diverse/Complex 22 22 100 Good Vermilion River VER09 503906 5913007 504102 5912939 461.96 >90% <15% No >15% <5% Stable Not Diverse/Complex 10 22 45.45 PoorVermilion River VER10 484244 5914867 484275 5914841 41.77 >90% >35% Yes >15% <5% Stable Not Diverse/Complex 14 22 63.64 FairVermilion River VER11 468536 5944165 468549 5944017 148.66 >90% >35% No >15% <5% Stable Moderately Diverse/Complex 14 22 63.64 Fair Vermilion River VER11 468505 5944231 468521 5944166 67.13 >90% <15% No >15% >15% Stable Not Diverse/Complex 6 22 27.27 PoorVermilion River VER11 451907 5950694 451936 5950682 31.59 >90% <15% No >15% >15% Stable Not Diverse/Complex 6 22 27.27 PoorVermilion River VER12 451749 5950743 451903 5950681 166.08 >90% >35% No <5% <5% Stable Moderately Diverse/Complex 18 22 81.82 Good Vermilion River VER14 445354 5948947 445721 5949063 423.18 >90% >35% No <5% <5% Stable Moderately Diverse/Complex 18 22 81.82 Good Vermilion River VER14 443060 5948246 443104 5948256 45.68 >90% <15% No >15% <5% Stable Not Diverse/Complex 10 22 45.45 PoorVermilion River VER14 443063 5948232 443106 5948242 43.27 >90% <15% No >15% 5-15% Stable Not Diverse/Complex 8 22 36.36 PoorVermilion River VER16 436595 5944403 436460 5944671 953.37 >90% 15-35% No 5-15% <5% Stable Moderately Diverse/Complex 15 22 68.18 Fair Vermilion River VER17 432150 5932462 432023 5932637 309.82 >90% 15-35% No >15% <5% Stable Moderately Diverse/Complex 13 22 59.09 Fair Vermilion River VER16 432008 5932628 432021 5932995 582.72 >90% 15-35% No >15% <5% Stable Not Diverse/Complex 11 22 50 Fair Vermilion River VER18 428334 5923881 428066 5924003 968.76 >90% 15-35% No >15% <5% Stable Not Diverse/Complex 11 22 50 Fair Vermilion River VER19 430074 5915990 429979 5916143 514.35 >90% 15-35% Yes 5-15% <5% Stable Moderately Diverse/Complex 17 22 77.27 Fair Vermilion River VER19 430122 5916163 429984 5916129 149.31 >90% 15-35% Yes >15% <5% Stable Moderately Diverse/Complex 15 22 68.18 Fair Warwick Creek WAR03 430032 5940719 431042 5941312 2,451.88 >90% <15% No >15% <5% Stable Not Diverse/Complex 10 22 45.45 PoorWarwick Creek WAR01 436023 5944343 436251 5944578 603.72 >90% >35% Yes 5-15% <5% Stable Moderately Diverse/Complex 18 22 81.82 Good Warwick Creek WAR01 436022 5944357 436253 5944627 552.73 >90% >35% Yes <5% <5% Stable Moderately Diverse/Complex 20 22 90.91 Good Warwick Creek WAR01 436251 5944578 436455 5944656 408.46 >90% <15% No 5-15% <5% Stable Not Diverse/Complex 12 22 54.55 Fair Warwick Creek WAR01 436253 5944627 436445 5944667 451.17 >90% <15% No 5-15% <5% Stable Not Diverse/Complex 12 22 54.55 Fair Warwick Creek WAR01 435205 5944084 435972 5943991 1,098.91 >90% >35% Yes <5% <5% Stable Diverse/Complex 22 22 100 Good Warwick Creek WAR01 434483 5945917 436014 5944356 6,021.26 >90% <15% No >15% <5% Stable Not Diverse/Complex 10 22 45.45 PoorWarwick Creek WAR01 434469 5945917 434116 5945368 ,1163.92 >90% <15% No >15% 5-15% Stable Not Diverse/Complex 8 22 36.36 PoorWarwick Creek WAR01 434116 5945368 434327 5945100 378.66 >90% >35% Yes <5% <5% Stable Diverse/Complex 22 22 100 Good Warwick Creek WAR01 434327 5945100 434401 5944473 862.08 >90% <15% No >15% <5% Stable Not Diverse/Complex 10 22 45.45 PoorWarwick Creek WAR01 434401 5944473 434598 5944362 269.11 >90% >35% No 5-15% <5% Stable Moderately Diverse/Complex 16 22 72.73 Fair Warwick Creek WAR01 434598 5944362 434613 5944248 295.58 >90% <15% No >15% <5% Stable Not Diverse/Complex 10 22 45.45 PoorWarwick Creek WAR01 434613 5944248 434879 5944130 326.18 >90% >35% Yes 5-15% <5% Stable Moderately Diverse/Complex 18 22 81.82 Good Warwick Creek WAR01 434879 5944130 435205 5944084 827.58 >90% <15% No >15% <5% Stable Not Diverse/Complex 10 22 45.45 PoorWarwick Creek WAR01 435972 5943991 436014 5944342 822.64 >90% <15% No >15% <5% Stable Not Diverse/Complex 10 22 45.45 PoorWarwick Creek WAR01 434426 5946475 434469 5945926 1,000.08 >90% >35% Yes <5% <5% Stable Diverse/Complex 22 22 100 Good Warwick Creek WAR01 434426 5946493 434483 5945923 1,026.38 >90% >35% Yes <5% <5% Stable Diverse/Complex 22 22 100 Good Warwick Creek WAR01 432814 5946729 433442 5947133 1,714.93 >90% <15% No >15% 5-15% Stable Not Diverse/Complex 8 22 36.36 PoorWarwick Creek WAR01 432816 5946743 433682 5947104 1,992.98 >90% 15-35% Yes >15% 5-15% Stable Not Diverse/Complex 11 22 50 Fair Warwick Creek WAR01 434111 5946799 434418 5946482 925.97 >90% <15% No >15% <5% Stable Not Diverse/Complex 10 22 45.45 Poor
Page 68
APPENDIX A Riparian Health Data
March 2016 Report No. 1532934 A-36
Name Reach Segment Start(a) Segment End(a) Length
[m] % Vegetation
Cover(b) % Woody Species Cover(b)
Evidence of Recruitment (Y/N) (b)
% Area of Human Caused Vegetation Cover Alteration(b)
% Area of Human Caused Bare Ground / Physical Alteration(b)
Overall Bank Stability? (b)
Adjacent Vegetation Structural Complexity(b) Score Possible
Score %
Score Health
Category Easting Northing Easting Northing
Warwick Creek WAR01 433442 5947133 434111 5946799 1,135.82 >90% >35% No <5% <5% Stable Diverse/Complex 20 22 90.91 Good Warwick Creek WAR01 433682 5947104 434417 5946499 1,779.74 >90% 15-35% No 5-15% <5% Stable Moderately Diverse/Complex 15 22 68.18 Fair Warwick Creek WAR01 432168 5945947 432804 5946742 2,205.49 >90% <15% No >15% <5% Stable Not Diverse/Complex 10 22 45.45 PoorWarwick Creek WAR01 432183 5945946 432804 5946728 2,187.06 >90% <15% No >15% <5% Stable Not Diverse/Complex 10 22 45.45 PoorWarwick Creek WAR01 432024 5945768 432167 5945940 230.40 >90% <15% No >15% <5% Stable Not Diverse/Complex 10 22 45.45 PoorWarwick Creek WAR03 429466 5940704 431035 5941325 3,472.16 >90% <15% No >15% <5% Stable Not Diverse/Complex 10 22 45.45 PoorWarwick Creek WAR02 432198 5945298 432025 5945754 1,024.99 >90% 15-35% Yes 5-15% <5% Stable Moderately Diverse/Complex 17 22 77.27 Fair Warwick Creek WAR02 432111 5945334 432038 5945759 907.56 >90% 15-35% No 5-15% <5% Stable Moderately Diverse/Complex 15 22 68.18 Fair Warwick Creek WAR02 432064 5944389 432212 5945119 1,437.72 >90% >35% No >15% <5% Stable Moderately Diverse/Complex 14 22 63.64 Fair Warwick Creek WAR02 432139 5944465 432179 5945131 1,303.77 >90% >35% No >15% <5% Stable Moderately Diverse/Complex 14 22 63.64 Fair Warwick Creek WAR03 431138 5942742 431311 5942827 273.92 >90% >35% Yes 5-15% <5% Stable Moderately Diverse/Complex 18 22 81.82 Good Warwick Creek WAR03 431311 5942827 431660 5943218 855.02 >90% <15% No >15% <5% Stable Not Diverse/Complex 10 22 45.45 PoorWarwick Creek WAR03 431138 5942756 431652 5943206 1,093.21 >90% <15% No >15% <5% Stable Not Diverse/Complex 10 22 45.45 PoorWarwick Creek WAR02 431879 5943343 431786 5943969 1,254.32 >90% >35% Yes 5-15% <5% Stable Moderately Diverse/Complex 18 22 81.82 Good Warwick Creek WAR02 431829 5943367 431729 5943919 1,209.12 >90% >35% Yes <5% <5% Stable Moderately Diverse/Complex 20 22 90.91 Good Warwick Creek WAR02 431786 5943969 432064 5944389 699.65 >90% 15-35% No >15% <5% Stable Not Diverse/Complex 11 22 50 Fair Warwick Creek WAR02 431729 5943919 432139 5944465 902.24 >90% <15% No >15% <5% Stable Not Diverse/Complex 10 22 45.45 PoorWarwick Creek WAR02 432212 5945119 432111 5945334 590.12 >90% <15% No >15% <5% Stable Not Diverse/Complex 10 22 45.45 PoorWarwick Creek WAR02 432179 5945131 432198 5945298 480.62 >90% <15% No >15% <5% Stable Not Diverse/Complex 10 22 45.45 PoorWarwick Creek WAR03 430939 5942728 431130 5942741 208.29 >90% <15% No <5% >15% Stable Not Diverse/Complex 10 22 45.45 PoorWarwick Creek WAR03 430924 5942729 431132 5942756 232.17 >90% >35% No <5% <5% Stable Moderately Diverse/Complex 18 22 81.82 Good Warwick Creek WAR03 430935 5941915 431020 5942338 605.97 >90% >35% Yes 5-15% <5% Stable Diverse/Complex 20 22 90.91 Good Warwick Creek WAR03 430949 5941916 431014 5942351 635.34 >90% >35% Yes 5-15% <5% Stable Diverse/Complex 20 22 90.91 Good Warwick Creek WAR03 428929 5940279 429168 5940723 1,079.14 >90% <15% No >15% 5-15% Stable Not Diverse/Complex 8 22 36.36 PoorWarwick Creek WAR03 429180 5940714 429455 5940693 1,039.76 >90% 15-35% Yes >15% <5% Stable Moderately Diverse/Complex 15 22 68.18 Fair Warwick Creek WAR03 429467 5940690 430001 5940619 913.86 >90% <15% No >15% <5% Stable Not Diverse/Complex 10 22 45.45 PoorWarwick Creek WAR03 430001 5940619 430032 5940719 112.49 >90% >35% No <5% <5% Stable Moderately Diverse/Complex 18 22 81.82 Good Warwick Creek WAR03 430923 5941657 430949 5941916 686.78 >90% <15% No >15% 5-15% Stable Not Diverse/Complex 8 22 36.36 PoorWarwick Creek WAR03 430917 5941643 430935 5941915 700.58 >90% <15% No >15% <5% Stable Not Diverse/Complex 10 22 45.45 PoorWarwick Creek WAR03 431035 5941325 430917 5941643 467.18 >90% 15-35% No >15% <5% Stable Not Diverse/Complex 11 22 50 Fair Warwick Creek WAR03 431042 5941312 430923 5941657 498.71 >90% 15-35% No >15% <5% Stable Not Diverse/Complex 11 22 50 Fair Warwick Creek WAR03 431020 5942338 430921 5942721 569.49 >90% 15-35% No >15% <5% Stable Moderately Diverse/Complex 13 22 59.09 Fair Warwick Creek WAR03 431014 5942351 430936 5942721 541.43 >90% 15-35% No >15% <5% Stable Moderately Diverse/Complex 13 22 59.09 Fair Warwick Creek WAR03 429380 5939514 428929 5940279 1,364.68 >90% 15-35% Yes >15% <5% Stable Moderately Diverse/Complex 15 22 68.18 Fair Warwick Creek WAR03 429394 5939514 429033 5940335 1,477.93 >90% 15-35% Yes >15% <5% Stable Moderately Diverse/Complex 15 22 68.18 Fair Warwick Creek WAR03 429168 5940723 429457 5940707 1,055.00 >90% 15-35% Yes >15% <5% Stable Moderately Diverse/Complex 15 22 68.18 Fair Warwick Creek WAR03 429033 5940335 429180 5940714 956.25 >90% <15% No >15% 5-15% Stable Not Diverse/Complex 8 22 36.36 PoorWarwick Creek WAR01 432038 5945759 432181 5945940 239.08 >90% 15-35% No 5-15% <5% Stable Moderately Diverse/Complex 15 22 68.18 Fair Warwick Creek WAR02 431660 5943218 431879 5943343 402.56 >90% <15% No >15% <5% Stable Not Diverse/Complex 10 22 45.45 PoorWarwick Creek WAR02 431652 5943206 431829 5943367 380.28 >90% <15% No >15% <5% Stable Not Diverse/Complex 10 22 45.45 PoorWaskwei Creek WAS02 423537 5922212 423537 5922212 46.42 >90% <15% Yes >15% <5% Stable Not Diverse/Complex 12 22 54.55 Fair Waskwei Creek WAS01 427578 5923896 428062 5923976 1,221.38 >90% <15% No >15% <5% Stable Not Diverse/Complex 10 22 45.45 PoorWaskwei Creek WAS01 427578 5923882 428074 5923988 1,257.15 >90% <15% No >15% <5% Stable Not Diverse/Complex 10 22 45.45 PoorWaskwei Creek WAS01 426752 5923666 427572 5923897 1,777.42 >90% <15% No >15% <5% Stable Not Diverse/Complex 10 22 45.45 PoorWaskwei Creek WAS01 426754 5923651 427571 5923883 1,776.03 >90% <15% No >15% <5% Stable Not Diverse/Complex 10 22 45.45 Poor
Page 69
APPENDIX A Riparian Health Data
March 2016 Report No. 1532934 A-37
Name Reach Segment Start(a) Segment End(a) Length
[m] % Vegetation
Cover(b) % Woody Species Cover(b)
Evidence of Recruitment (Y/N) (b)
% Area of Human Caused Vegetation Cover Alteration(b)
% Area of Human Caused Bare Ground / Physical Alteration(b)
Overall Bank Stability? (b)
Adjacent Vegetation Structural Complexity(b) Score Possible
Score %
Score Health
Category Easting Northing Easting Northing
Waskwei Creek WAS01 426269 5923378 426754 5923651 1,025.25 >90% 15-35% No 5-15% <5% Stable Not Diverse/Complex 13 22 59.09 Fair Waskwei Creek WAS01 426254 5923375 426752 5923666 1,055.29 >90% <15% No 5-15% <5% Stable Not Diverse/Complex 12 22 54.55 Fair Waskwei Creek WAS01 425936 5923202 426253 5923364 496.73 >90% <15% No 5-15% <5% Stable Not Diverse/Complex 12 22 54.55 Fair Waskwei Creek WAS01 425936 5923188 426267 5923363 519.22 >90% <15% No 5-15% <5% Stable Not Diverse/Complex 12 22 54.55 Fair Waskwei Creek WAS02 425779 5922909 425925 5923199 481.54 >90% <15% No >15% <5% Stable Not Diverse/Complex 10 22 45.45 PoorWaskwei Creek WAS02 425781 5922895 425924 5923184 484.11 >90% <15% No >15% <5% Stable Not Diverse/Complex 10 22 45.45 PoorWaskwei Creek WAS02 425236 5922115 425779 5922909 1,098.39 >90% <15% No >15% <5% Stable Moderately Diverse/Complex 12 22 54.55 Fair Waskwei Creek WAS02 425241 5922101 425781 5922895 1,095.98 >90% 15-35% No <5% <5% Stable Diverse/Complex 19 22 86.36 Good Waskwei Creek WAS02 424280 5921990 424834 5922205 847.49 >90% <15% No >15% <5% Stable Not Diverse/Complex 10 22 45.45 PoorWaskwei Creek WAS02 424279 5921976 424847 5922212 877.31 >90% >35% Yes <5% <5% Stable Diverse/Complex 22 22 100 Good Waskwei Creek WAS02 424847 5922212 425241 5922101 497.43 >90% 15-35% No 5-15% <5% Stable Not Diverse/Complex 13 22 59.09 Fair Waskwei Creek WAS02 424834 5922205 425236 5922115 522.23 >90% <15% No >15% <5% Stable Not Diverse/Complex 10 22 45.45 PoorWaskwei Creek WAS02 423503 5922253 424273 5921976 1,587.86 >90% 15-35% No >15% <5% Stable Not Diverse/Complex 11 22 50 Fair Waskwei Creek WAS02 423511 5922264 424271 5921990 1,533.74 >90% <15% No >15% <5% Stable Not Diverse/Complex 10 22 45.45 PoorWaskwei Creek WAS02 422647 5922111 423503 5922253 1,107.39 >90% >35% Yes <5% <5% Stable Diverse/Complex 22 22 100 Good Waskwei Creek WAS02 422646 5922125 423511 5922264 1,117.30 >90% 15-35% Yes 5-15% <5% Stable Moderately Diverse/Complex 17 22 77.27 Fair Waskwei Creek WAS02 421005 5921752 422639 5922124 2,039.96 >90% 15-35% No 5-15% <5% Stable Moderately Diverse/Complex 15 22 68.18 Fair Waskwei Creek WAS02 421007 5921736 422637 5922109 2,037.71 >90% >35% Yes <5% <5% Stable Diverse/Complex 22 22 100 Good Waskwei Creek WAS02 420559 5921037 420999 5921748 1,161.35 >90% >35% Yes 5-15% <5% Stable Diverse/Complex 20 22 90.91 Good Waskwei Creek WAS02 420538 5920950 420998 5921730 1,234.70 >90% >35% Yes >15% <5% Stable Diverse/Complex 18 22 81.82 GoodWaskwei Creek WAS02 420386 5920456 420559 5921037 701.29 >90% 15-35% No >15% <5% Stable Not Diverse/Complex 11 22 50 Fair Waskwei Creek WAS02 420401 5920456 420538 5920950 607.07 >90% <15% No >15% <5% Stable Not Diverse/Complex 10 22 45.45 PoorWaskwei Creek WAS03 419188 5917014 420250 5919992 5,038.50 >90% <15% No >15% <5% Stable Not Diverse/Complex 10 22 45.45 PoorWaskwei Creek WAS03 419202 5917014 419713 5918993 3,519.20 >90% <15% No >15% 5-15% Stable Not Diverse/Complex 8 22 36.36 PoorWaskwei Creek WAS03 419713 5918993 420344 5920224 1,807.74 >90% 15-35% Yes <5% <5% Stable Moderately Diverse/Complex 19 22 86.36 Good Waskwei Creek WAS03 420250 5919992 420330 5920226 290.30 >90% 15-35% Yes 5-15% <5% Stable Moderately Diverse/Complex 17 22 77.27 Fair Waskwei Creek WAS03 417593 5914656 419187 5917008 4,027.46 >90% <15% No >15% <5% Stable Not Diverse/Complex 10 22 45.45 PoorWaskwei Creek WAS03 417592 5914642 419201 5917007 4,050.55 >90% <15% No >15% 5-15% Stable Not Diverse/Complex 8 22 36.36 PoorWaskwei Creek WAS03 415951 5914935 417586 5914656 1,925.87 >90% <15% No >15% 5-15% Stable Not Diverse/Complex 8 22 36.36 PoorWaskwei Creek WAS03 415951 5914921 417586 5914642 1,924.69 >90% <15% No >15% <5% Stable Not Diverse/Complex 10 22 45.45 PoorWaskwei Creek WAS03 415583 5915072 415942 5914936 398.42 >90% <15% No 5-15% <5% Stable Not Diverse/Complex 12 22 54.55 Fair Waskwei Creek WAS03 415513 5915083 415583 5915072 70.23 >90% <15% Yes >15% >15% Stable Not Diverse/Complex 8 22 36.36 PoorWaskwei Creek WAS03 415456 5915092 415941 5914922 531.95 >90% <15% No >15% <5% Stable Not Diverse/Complex 10 22 45.45 PoorWaskwei Creek WAS03 415112 5915077 415456 5915092 360.80 >90% 15-35% Yes >15% <5% Stable Moderately Diverse/Complex 15 22 68.18 Fair Waskwei Creek WAS03 415091 5915091 415513 5915083 445.44 >90% <15% No 5-15% <5% Stable Not Diverse/Complex 12 22 54.55 Fair Waskwei Creek WAS03 414293 5914904 415091 5915091 851.53 >90% <15% No >15% >15% Stable Not Diverse/Complex 6 22 27.27 PoorWaskwei Creek WAS03 414293 5914890 415112 5915077 872.41 >90% <15% No >15% >15% Stable Not Diverse/Complex 6 22 27.27 PoorWaskwei Creek WAS03 412632 5914673 414285 5914904 2,814.81 >90% 15-35% Yes >15% 5-15% Stable Not Diverse/Complex 11 22 50 Fair Waskwei Creek WAS03 412631 5914659 414283 5914890 2,813.93 >90% 15-35% No >15% <5% Stable Not Diverse/Complex 11 22 50 Fair Waskwei Creek WAS03 411012 5914663 412624 5914660 1,678.93 >90% >35% Yes <5% <5% Stable Diverse/Complex 22 22 100 Good Waskwei Creek WAS03 411007 5914676 412625 5914674 1,684.79 >90% >35% Yes <5% <5% Stable Diverse/Complex 22 22 100 Good Waskwei Creek WAS03 420330 5920234 420386 5920456 273.41 >90% 15-35% No >15% <5% Stable Not Diverse/Complex 11 22 50 Fair Waskwei Creek WAS03 420344 5920232 420401 5920456 275.11 >90% <15% No >15% <5% Stable Not Diverse/Complex 10 22 45.45 Poor
(a) Start and end coordinates are displayed Universal Transvers Mercator (UTM) coordinate system, NAD83 Projection, Zone 12U. (b) Columns refer to questions associated with the Alberta Conservation Association Aerial Videography - Lotic Riparian Assessment Scorecard.
Page 70
VERMILION RIVER AB, RIPARIAN INVENTORY AND ASSESSMENT
March 2016 Report No. 1534932
APPENDIX B Landcover Change Results between 1990 and 2010 by River Reach
Page 71
APPENDIX B Landcover Change Analysis Results - 1990 and 2010
Landcover Class
BIR01 BIR02 1990 Landcover 2010 Landcover Difference 1990 Landcover 2010 Landcover Difference
Area [ha]
% of Landbase
Area [ha]
% of Landbase
Area Change
[ha]
% Resource Change
Area [ha]
% of Landbase
Area [ha]
% of Landbase
Area Change
[ha]
% Resource Change
Forest 191.3 <0.1 154.7 0.1 -36.6 -19.1 1,037.1 0.4 928.6 0.4 -108.5 -10.5 Trees 34.1 <0.1 30.2 <0.1 -3.9 -11.4 87.5 <0.1 63.5 <0.1 -24.0 -27.5 Forest Wetland 31.2 <0.1 27.4 <0.1 -3.9 -12.4 306.3 0.1 296.0 0.1 -10.3 -3.4 Cropland 2,229.5 0.9 2,275.2 1.0 45.7 2.0 6,048.8 2.6 6,212.0 2.6 163.3 2.7 Grassland Managed - - - - - - - - - - - - Other Land 0.1 <0.1 0.1 <0.1 <0.1 0.0 2.3 <0.1 1.9 <0.1 -0.4 -15.8 Roads 102.0 <0.1 106.1 <0.1 4.1 4.0 243.6 0.1 245.6 0.1 2.0 0.8 Settlement 31.0 <0.1 31.7 <0.1 0.6 2.1 99.2 <0.1 106.8 <0.1 7.5 7.6 Treed Wetland 19.4 <0.1 19.4 <0.1 <0.1 0.0 30.6 <0.1 30.6 <0.1 <0.1 <0.1 Water 54.3 <0.1 54.3 <0.1 <0.1 0.0 146.9 0.1 146.9 0.1 <0.1 <0.1 Wetland 66.2 <0.1 60.2 <0.1 -6.0 -9.1 166.0 0.1 137.0 0.1 -29.0 -17.5 Wetland Herb 0.3 <0.1 0.3 <0.1 <0.1 0.0 0.3 <0.1 0.3 <0.1 <0.1 <0.1 Wetland Shrub 22.2 <0.1 22.2 <0.1 <0.1 0.0 110.8 <0.1 110.2 <0.1 -0.6 -0.6 Grand Total 2,781.7 1.2 2,781.7 1.2 0.0 0.0 8,279.3 3.5 8,279.3 3.5 0.0 0.0
March 2016 Report No. 1534932 B-1
Page 72
APPENDIX B Landcover Change Analysis Results - 1990 and 2010
Landcover Class
CAM01 CAM02 1990 Landcover 2010 Landcover Difference 1990 Landcover 2010 Landcover Difference
Area [ha]
% of Landbase
Area [ha]
% of Landbase
Area Change
[ha]
% Resource Change
Area [ha]
% of Landbase
Area [ha]
% of Landbase
Area Change
[ha]
% Resource Change
Forest 16.0 <0.1 14.5 <0.1 -1.5 -9.1 90.2 <0.1 63.6 <0.1 -26.6 -29.5 Trees - - - - - - 11.7 <0.1 12.8 <0.1 1.1 9.7 Forest Wetland - - - - - - 11.3 <0.1 10.4 <0.1 -0.9 -7.9 Cropland 36.8 <0.1 38.3 <0.1 1.5 4.0 874.4 0.4 903.6 0.4 29.2 3.3 Grassland Managed - - - - - - - - - - - - Other Land - - - - - - - - - - - - Roads 1.9 <0.1 1.9 <0.1 <0.1 <0.1 21.6 <0.1 21.6 <0.1 <0.1 <0.1 Settlement 0.1 <0.1 0.1 <0.1 <0.1 <0.1 0.9 <0.1 0.9 <0.1 <0.1 <0.1 Treed Wetland - - - - - - 2.9 <0.1 2.9 <0.1 <0.1 <0.1 Water <0.1 <0.1 <0.1 <0.1 <0.1 <0.1 29.0 <0.1 29.0 <0.1 <0.1 <0.1 Wetland - - - - - - 8.5 <0.1 5.7 <0.1 -2.8 -32.9 Wetland Herb - - - - - - - - - - - - Wetland Shrub - - - - - - 2.2 <0.1 2.2 <0.1 <0.1 <0.1 Grand Total 54.8 <0.1 54.8 <0.1 0.0 0.0 1,052.6 0.4 1,052.6 0.4 0.0 0.0
March 2016 Report No. 1534932 B-2
Page 73
APPENDIX B Landcover Change Analysis Results - 1990 and 2010
Landcover Class
CAM03 1990 Landcover 2010 Landcover Difference
Area [ha] % of Landbase Area
[ha] % of Landbase Area Change [ha] % Resource Change
Forest 124.0 0.1 103.2 <0.1 -20.8 -16.8 Trees 34.6 <0.1 26.0 <0.1 -8.5 -24.7 Forest Wetland - - - - - - Cropland 3,012.8 1.3 3,041.7 1.3 28.9 1.0 Grassland Managed - - - - - - Other Land - - - - - - Roads 73.1 <0.1 73.1 <0.1 <0.1 <0.1 Settlement 7.3 <0.1 7.8 <0.1 0.5 6.8 Treed Wetland 1.7 <0.1 1.7 <0.1 <0.1 <0.1 Water 320.6 0.1 320.6 0.1 <0.1 <0.1 Wetland 4.1 <0.1 4.1 <0.1 <0.1 <0.1 Wetland Herb - - - - - - Wetland Shrub 0.3 <0.1 0.3 <0.1 <0.1 <0.1 Grand Total 3,578.4 1.5 3,578.4 1.5 0.0 0.0
March 2016 Report No. 1534932 B-3
Page 74
APPENDIX B Landcover Change Analysis Results - 1990 and 2010
Landcover Class
COT01 1990 Landcover 2010 Landcover Difference
Area [ha] % of Landbase Area
[ha] % of Landbase Area Change [ha] % Resource Change
Forest 594.8 0.3 550.2 0.2 -44.6 -7.5 Trees 66.7 <0.1 48.9 <0.1 -17.8 -26.7 Forest Wetland 5.4 <0.1 4.7 <0.1 -0.7 -13.3 Cropland 7,089.2 3.0 7,153.0 3.0 63.8 0.9 Grassland Managed - - - - - - Other Land 2.1 <0.1 2.1 <0.1 <0.1 <0.1 Roads 234.3 0.1 234.4 0.1 0.1 <0.1 Settlement 45.5 <0.1 46.7 <0.1 1.3 2.8 Treed Wetland 2.9 <0.1 2.9 <0.1 <0.1 <0.1 Water 943.5 0.4 943.5 0.4 <0.1 <0.1 Wetland 16.7 <0.1 14.8 <0.1 -2.0 -11.8 Wetland Herb 1.1 <0.1 0.9 <0.1 -0.2 -16.7 Wetland Shrub 3.0 <0.1 3.1 <0.1 0.2 6.1 Grand Total 9,005.2 3.8 9,005.2 3.8 0.0 0.0
March 2016 Report No. 1534932 B-4
Page 75
APPENDIX B Landcover Change Analysis Results - 1990 and 2010
Landcover Class
DEE01 DEE02 1990 Landcover 2010 Landcover Difference 1990 Landcover 2010 Landcover Difference
Area [ha]
% of Landbase
Area [ha]
% of Landbase
Area Change
[ha]
% Resource Change
Area [ha]
% of Landbase
Area [ha]
% of Landbase
Area Change
[ha]
% Resource Change
Forest 16.4 <0.1 14.2 <0.1 -2.2 -13.5 433.7 0.2 309.8 0.1 -124.0 -28.6 Trees 1.9 <0.1 1.9 <0.1 <0.1 <0.1 30.2 <0.1 31.3 <0.1 1.0 3.4 Forest Wetland - - - - - - 2.6 <0.1 2.6 <0.1 <0.1 <0.1 Cropland 72.4 <0.1 74.6 <0.1 2.2 3.1 1,680.0 0.7 1,802.6 0.8 122.6 7.3 Grassland Managed - - - - - - - - - - - - Other Land - - - - - - - - - - - - Roads - - - - - - 50.5 <0.1 50.5 <0.1 <0.1 <0.1 Settlement - - - - - - 7.1 <0.1 7.6 <0.1 0.4 6.3 Treed Wetland - - - - - - 3.6 <0.1 3.6 <0.1 <0.1 <0.1 Water - - - - - - 12.9 <0.1 12.9 <0.1 <0.1 <0.1 Wetland - - - - - - 29.8 <0.1 29.6 <0.1 -0.2 -0.6 Wetland Herb - - - - - - - - - - - - Wetland Shrub - - - - - - 7.4 <0.1 7.4 <0.1 <0.1 <0.1 Grand Total 90.6 <0.1 90.6 <0.1 0.0 0.0 2,257.9 1.0 2,257.9 1.0 0.0 0.0
March 2016 Report No. 1534932 B-5
Page 76
APPENDIX B Landcover Change Analysis Results - 1990 and 2010
Landcover Class
DEE03 DEE04 1990 Landcover 2010 Landcover Difference 1990 Landcover 2010 Landcover Difference
Area [ha]
% of Landbase
Area [ha]
% of Landbase
Area Change
[ha]
% Resource Change
Area [ha]
% of Landbase
Area [ha]
% of Landbase
Area Change
[ha]
% Resource Change
Forest 85.2 <0.1 68.7 <0.1 -16.5 -19.4 5.6 <0.1 4.5 <0.1 -1.2 -20.6 Trees 1.4 <0.1 1.7 <0.1 0.3 24.8 - - - - - - Forest Wetland 0.9 <0.1 0.9 <0.1 <0.1 <0.1 - - - - - - Cropland 137.0 0.1 153.2 0.1 16.2 11.8 0.9 <0.1 2.0 <0.1 1.2 132.0 Grassland Managed - - - - - - - - - - - - Other Land - - - - - - - - - - - - Roads - - - - - - - - - - - - Settlement 0.1 <0.1 0.1 <0.1 <0.1 <0.1 - - - - - - Treed Wetland 0.1 <0.1 0.1 <0.1 <0.1 <0.1 - - - - - - Water 27.6 <0.1 27.6 <0.1 <0.1 <0.1 0.5 <0.1 0.5 <0.1 <0.1 <0.1 Wetland 0.2 <0.1 0.2 <0.1 <0.1 <0.1 - - - - - - Wetland Herb - - - - - - - - - - - - Wetland Shrub 0.2 <0.1 0.2 <0.1 <0.1 <0.1 - - - - - - Grand Total 252.6 0.1 252.6 0.1 0.0 0.0 7.0 <0.1 7.0 <0.1 0.0 0.0
March 2016 Report No. 1534932 B-6
Page 77
APPENDIX B Landcover Change Analysis Results - 1990 and 2010
Landcover Class
DEE05 DEE06 1990 Landcover 2010 Landcover Difference 1990 Landcover 2010 Landcover Difference
Area [ha]
% of Landbase
Area [ha]
% of Landbase
Area Change
[ha]
% Resource Change
Area [ha]
% of Landbase
Area [ha]
% of Landbase
Area Change
[ha]
% Resource Change
Forest 199.8 0.1 132.3 0.1 -67.5 -33.8 334.6 0.1 231.9 0.1 -102.8 -30.7 Trees 26.4 <0.1 19.2 <0.1 -7.1 -27.0 81.2 <0.1 62.0 <0.1 -19.2 -23.6 Forest Wetland 6.2 <0.1 6.2 <0.1 <0.1 <0.1 9.9 <0.1 8.7 <0.1 -1.3 -12.7 Cropland 1,076.5 0.5 1,151.1 0.5 74.6 6.9 4,097.6 1.7 4,213.2 1.8 115.6 2.8 Grassland Managed - - - - - - - - - - - - Other Land - - - - - - - - - - - - Roads 13.5 <0.1 13.5 <0.1 <0.1 <0.1 117.2 <0.1 117.6 <0.1 0.4 0.3 Settlement 11.1 <0.1 11.1 <0.1 <0.1 <0.1 72.3 <0.1 88.6 <0.1 16.4 22.7 Treed Wetland 5.2 <0.1 5.2 <0.1 <0.1 <0.1 5.9 <0.1 5.9 <0.1 <0.1 0.0 Water 173.6 0.1 173.6 0.1 <0.1 <0.1 273.7 0.1 273.7 0.1 <0.1 <0.1 Wetland 6.3 <0.1 6.3 <0.1 <0.1 <0.1 25.3 <0.1 16.8 <0.1 -8.6 -33.9 Wetland Herb 0.6 <0.1 0.6 <0.1 <0.1 <0.1 0.9 <0.1 0.4 <0.1 -0.5 -60.0 Wetland Shrub 2.6 <0.1 2.6 <0.1 <0.1 0.0 3.0 <0.1 3.0 <0.1 <0.1 <0.1 Grand Total 1,521.8 0.6 1,521.8 0.6 0.0 0.0 5,021.5 2.1 5,021.5 2.1 0.0 0.0
March 2016 Report No. 1534932 B-7
Page 78
APPENDIX B Landcover Change Analysis Results - 1990 and 2010
Landcover Class
HOL01 HOL02 1990 Landcover 2010 Landcover Difference 1990 Landcover 2010 Landcover Difference
Area [ha]
% of Landbase
Area [ha]
% of Landbase
Area Change
[ha]
% Resource Change
Area [ha]
% of Landbase
Area [ha]
% of Landbase
Area Change
[ha]
% Resource Change
Forest - - - - - - 31.4 <0.1 27.4 <0.1 -4.1 -12.9 Trees 0.9 <0.1 0.5 <0.1 -0.3 -37.5 11.7 <0.1 8.9 <0.1 -2.9 -24.6 Forest Wetland - - - - - - - - - - - - Cropland 119.0 0.1 119.3 0.1 0.3 0.3 1,740.0 0.7 1,746.8 0.7 6.8 0.4 Grassland Managed - - - - - - - - - - - - Other Land - - - - - - - - - - - - Roads 3.9 <0.1 3.9 <0.1 <0.1 <0.1 47.0 <0.1 47.0 <0.1 <0.1 <0.1 Settlement 1.6 <0.1 1.6 <0.1 <0.1 <0.1 2.6 <0.1 2.8 <0.1 0.2 6.9 Treed Wetland - - - - - - 0.5 <0.1 0.5 <0.1 <0.1 <0.1 Water 7.0 <0.1 7.0 <0.1 <0.1 <0.1 61.1 <0.1 61.1 <0.1 <0.1 <0.1 Wetland 0.4 <0.1 0.4 <0.1 <0.1 <0.1 0.1 <0.1 0.1 <0.1 <0.1 <0.1 Wetland Herb - - - - - - - - - - - - Wetland Shrub - - - - - - - - - - - - Grand Total 132.7 0.1 132.7 0.1 0.0 0.0 1,894.6 0.8 1,894.6 0.8 0.0 0.0
March 2016 Report No. 1534932 B-8
Page 79
APPENDIX B Landcover Change Analysis Results - 1990 and 2010
Landcover Class
HOL03 HOL04 1990 Landcover 2010 Landcover Difference 1990 Landcover 2010 Landcover Difference
Area [ha]
% of Landbase
Area [ha]
% of Landbase
Area Change
[ha]
% Resource Change
Area [ha]
% of Landbase
Area [ha]
% of Landbase
Area Change
[ha]
% Resource Change
Forest - - - - - - - - - - - - Trees 0.1 <0.1 <0.1 <0.1 -0.1 -100.0 0.1 <0.1 <0.1 <0.1 -0.1 -100.0 Forest Wetland - - - - - - - - - - - - Cropland 2.5 <0.1 2.6 <0.1 0.1 3.6 21.7 <0.1 21.5 <0.1 -0.2 -1.0 Grassland Managed - - - - - - - - - - - - Other Land - - - - - - - - - - - - Roads <0.1 <0.1 <0.1 <0.1 <0.1 <0.1 2.8 <0.1 2.8 <0.1 <0.1 <0.1 Settlement 0.1 <0.1 0.1 <0.1 <0.1 <0.1 1.7 <0.1 2.0 <0.1 0.3 15.6 Treed Wetland - - - - - - - - - - - - Water 1.1 <0.1 1.1 <0.1 <0.1 <0.1 0.4 <0.1 0.4 <0.1 <0.1 <0.1 Wetland - - - - - - - - - - - - Wetland Herb - - - - - - - - - - - - Wetland Shrub - - - - - - - - - - - - Grand Total 3.8 <0.1 3.8 <0.1 0.0 0.0 26.8 <0.1 26.8 <0.1 0.0 0.0
March 2016 Report No. 1534932 B-9
Page 80
APPENDIX B Landcover Change Analysis Results - 1990 and 2010
Landcover Class
HOL05 HOL06 1990 Landcover 2010 Landcover Difference 1990 Landcover 2010 Landcover Difference
Area [ha]
% of Landbase
Area [ha]
% of Landbase
Area Change
[ha]
% Resource Change
Area [ha]
% of Landbase
Area [ha]
% of Landbase
Area Change
[ha]
% Resource Change
Forest - - - - - - 1.6 <0.1 1.6 <0.1 <0.1 <0.1 Trees 0.9 <0.1 0.8 <0.1 -0.1 -13.1 1.5 <0.1 0.7 <0.1 -0.8 -53.4 Forest Wetland - - - - - - - - - - - - Cropland 68.4 <0.1 68.4 <0.1 <0.1 <0.1 197.5 0.1 198.3 0.1 0.8 0.4 Grassland Managed - - - - - - - - - - - - Other Land - - - - - - - - - - - - Roads 1.6 <0.1 1.6 <0.1 <0.1 <0.1 2.9 <0.1 2.9 <0.1 <0.1 <0.1 Settlement <0.1 <0.1 0.1 <0.1 0.1 n/a 0.3 <0.1 0.3 <0.1 <0.1 <0.1 Treed Wetland - - - - - - - - - - - - Water 14.7 <0.1 14.7 <0.1 <0.1 <0.1 0.7 <0.1 0.7 <0.1 <0.1 <0.1 Wetland 1.4 <0.1 1.4 <0.1 <0.1 <0.1 - - - - - - Wetland Herb - - - - - - - - - - - - Wetland Shrub - - - - - - - - - - - - Grand Total 87.0 <0.1 87.0 <0.1 0.0 0.0 204.4 0.1 204.4 0.1 0.0 0.0
March 2016 Report No. 1534932 B-10
Page 81
APPENDIX B Landcover Change Analysis Results - 1990 and 2010
Landcover Class
HOL07 HOL08 1990 Landcover 2010 Landcover Difference 1990 Landcover 2010 Landcover Difference
Area [ha]
% of Landbase
Area [ha]
% of Landbase
Area Change
[ha]
% Resource Change
Area [ha]
% of Landbase
Area [ha]
% of Landbase
Area Change
[ha]
% Resource Change
Forest - - - - - - - - - - - - Trees - - - - - - 0.5 <0.1 0.4 <0.1 -0.1 -20.0 Forest Wetland - - - - - - - - - - - - Cropland 20.7 <0.1 20.7 <0.1 <0.1 <0.1 161.7 <0.1 161.8 <0.2 0.1 0.1 Grassland Managed - - - - - - - - - - - - Other Land - - - - - - - - - - - - Roads - - - - - - 3.3 <0.1 3.3 <0.1 <0.1 <0.1 Settlement - - - - - - 0.8 <0.1 0.8 <0.1 <0.1 <0.1 Treed Wetland - - - - - - - - - - - - Water 7.9 <0.1 7.9 <0.1 <0.1 <0.1 34.3 <0.1 34.3 <0.1 <0.1 <0.1 Wetland - - - - - - 0.1 <0.1 0.1 <0.1 <0.1 <0.1 Wetland Herb - - - - - - - - - - - - Wetland Shrub - - - - - - - - - - - - Grand Total 28.6 <0.1 28.6 <0.1 0.0 0.0 200.7 0.1 200.7 0.1 0.0 0.0
March 2016 Report No. 1534932 B-11
Page 82
APPENDIX B Landcover Change Analysis Results - 1990 and 2010
Landcover Class
HOL09 HOL10 1990 Landcover 2010 Landcover Difference 1990 Landcover 2010 Landcover Difference
Area [ha]
% of Landbase
Area [ha]
% of Landbase
Area Change
[ha]
% Resource Change
Area [ha]
% of Landbase
Area [ha]
% of Landbase
Area Change
[ha]
% Resource Change
Forest - - - - - - 13.2 <0.1 12.2 <0.1 -1.1 -8.2 Trees 0.3 0.0 0.3 <0.1 <0.1 <0.1 6.4 <0.1 3.9 <0.1 -2.5 -39.0 Forest Wetland - - - - - - - - - - - - Cropland 126.3 0.1 126.3 0.1 <0.1 <0.1 654.3 0.3 657.8 0.3 3.6 0.5 Grassland Managed - - - - - - - - - - - - Other Land - - - - - - - - - - - - Roads 1.8 <0.1 1.8 <0.1 <0.1 <0.1 20.7 <0.1 20.7 <0.1 <0.1 0.0 Settlement - - - - - - 0.6 <0.1 0.6 <0.1 <0.1 0.0 Treed Wetland - - - - - - - - - - - - Water 6.4 <0.1 6.4 <0.1 <0.1 <0.1 36.9 <0.1 36.9 <0.1 <0.1 0.0 Wetland - - - - - - - - - - - - Wetland Herb - - - - - - - - - - - - Wetland Shrub - - - - - - - - - - - - Grand Total 134.8 0.1 134.8 0.1 0.0 0.0 732.2 0.3 732.2 0.3 0.0 0.0
March 2016 Report No. 1534932 B-12
Page 83
APPENDIX B Landcover Change Analysis Results - 1990 and 2010
Landcover Class
HOL11 HOL12 1990 Landcover 2010 Landcover Difference 1990 Landcover 2010 Landcover Difference
Area [ha]
% of Landbase
Area [ha]
% of Landbase
Area Change
[ha]
% Resource Change
Area [ha]
% of Landbase
Area [ha]
% of Landbase
Area Change
[ha]
% Resource Change
Forest 10.8 <0.1 10.5 <0.1 -0.3 -2.9 - - - - - - Trees 6.4 <0.1 1.9 <0.1 -4.5 -70.5 0.7 <0.1 0.6 <0.1 -0.1 -13.7 Forest Wetland - - - - - - - - - - - - Cropland 1,048.9 0.4 1,051.5 0.4 2.5 0.2 47.2 <0.1 47.3 <0.1 0.1 0.2 Grassland Managed - - - - - - - - - - - - Other Land - - - - - - - - - - - - Roads 36.8 <0.1 38.7 <0.1 1.9 5.3 0.3 <0.1 0.3 <0.1 <0.1 <0.1 Settlement 9.4 <0.1 9.8 <0.1 0.4 3.8 - - - - - - Treed Wetland - - - - - - - - - - - - Water 46.0 <0.1 46.0 <0.1 <0.1 <0.1 0.3 <0.1 0.3 <0.1 <0.1 <0.1 Wetland 0.1 <0.1 0.1 <0.1 <0.1 <0.1 - - - - - - Wetland Herb - - - - - - - - - - - - Wetland Shrub - - - - - - - - - - - - Grand Total 1,158.4 0.5 1,158.4 0.5 0.0 0.0 48.5 <0.1 48.5 <0.1 0.0 0.0
March 2016 Report No. 1534932 B-13
Page 84
APPENDIX B Landcover Change Analysis Results - 1990 and 2010
Landcover Class
HOL13 HOL14 1990 Landcover 2010 Landcover Difference 1990 Landcover 2010 Landcover Difference
Area [ha]
% of Landbase
Area [ha]
% of Landbase
Area Change
[ha]
% Resource Change
Area [ha]
% of Landbase
Area [ha]
% of Landbase
Area Change
[ha]
% Resource Change
Forest - - - - - - 2.6 <0.1 2.6 <0.1 <0.1 <0.1 Trees 1.4 <0.1 1.0 <0.1 -0.3 -25.4 1.0 <0.1 0.2 <0.1 -0.8 -83.1 Forest Wetland - - - - - - - - - - - - Cropland 182.1 0.1 182.3 0.1 0.3 0.1 480.4 0.2 481.2 0.2 0.8 0.2 Grassland Managed - - - - - - - - - - - - Other Land - - - - - - - - - - - - Roads 6.8 <0.1 6.8 <0.1 <0.1 <0.1 16.2 <0.1 16.2 <0.1 <0.1 <0.1 Settlement 9.1 <0.1 9.2 <0.1 0.1 1.0 0.4 <0.1 0.4 <0.1 <0.1 <0.1 Treed Wetland - - - - - - - - - - - - Water 38.6 <0.1 38.6 <0.1 <0.1 <0.1 28.4 <0.1 28.4 <0.1 <0.1 <0.1 Wetland 0.3 <0.1 0.3 <0.1 <0.1 <0.1 - - - - - - Wetland Herb - - - - - - - - - - - - Wetland Shrub - - - - - - - - - - - - Grand Total 238.1 0.1 238.1 0.1 0.0 0.0 529.0 0.2 529.0 0.2 0.0 0.0
March 2016 Report No. 1534932 B-14
Page 85
APPENDIX B Landcover Change Analysis Results - 1990 and 2010
Landcover Class
HOL15 HOL16 1990 Landcover 2010 Landcover Difference 1990 Landcover 2010 Landcover Difference
Area [ha]
% of Landbase
Area [ha]
% of Landbase
Area Change
[ha]
% Resource Change
Area [ha]
% of Landbase
Area [ha]
% of Landbase
Area Change
[ha]
% Resource Change
Forest 3.0 <0.1 <0.1 <0.1 -3.0 -100.0 0.1 <0.1 0.1 <0.1 <0.1 <0.1 Trees 5.5 <0.1 3.3 <0.1 -2.3 -40.6 0.8 <0.1 0.7 <0.1 -0.1 -11.4 Forest Wetland 1.4 <0.1 1.4 <0.1 <0.1 <0.1 - - - - - - Cropland 1,513.4 0.6 1,518.4 0.6 4.9 0.3 490.8 0.2 490.9 0.2 0.1 <0.1 Grassland Managed - - - - - - - - - - - - Other Land - - - - - - - - - - - - Roads 57.8 <0.1 57.8 <0.1 <0.1 <0.1 22.8 <0.1 22.8 <0.1 <0.1 <0.1 Settlement 1.7 <0.1 2.0 <0.1 0.3 15.7 0.3 <0.1 0.3 <0.1 <0.1 <0.1 Treed Wetland 0.1 <0.1 0.1 <0.1 <0.1 <0.1 - - - - - - Water 103.3 <0.1 103.3 <0.1 <0.1 <0.1 73.5 <0.1 73.5 <0.1 <0.1 <0.1 Wetland 0.2 <0.1 0.2 <0.1 <0.1 <0.1 - - - - - - Wetland Herb - - - - - - - - - - - - Wetland Shrub - - - - - - - - - - - - Grand Total 1,686.3 0.7 1,686.3 0.7 0.0 0.0 588.2 0.2 588.2 0.2 0.0 0.0
March 2016 Report No. 1534932 B-15
Page 86
APPENDIX B Landcover Change Analysis Results - 1990 and 2010
Landcover Class
HOL17 HOL18 1990 Landcover 2010 Landcover Difference 1990 Landcover 2010 Landcover Difference
Area [ha]
% of Landbase
Area [ha]
% of Landbase
Area Change
[ha]
% Resource Change
Area [ha]
% of Landbase
Area [ha]
% of Landbase
Area Change
[ha]
% Resource Change
Forest 0.8 <0.1 0.7 <0.1 -0.1 -9.9 5.8 <0.1 2.8 <0.1 -2.9 -50.9 Trees - - - - - - 2.3 <0.1 1.6 <0.1 -0.6 -28.0 Forest Wetland - - - - - - - - - - - - Cropland 25.4 0.0 25.5 <0.1 0.1 0.3 382.8 0.2 386.3 0.2 3.6 0.9 Grassland Managed - - - - - - - - - - - - Other Land - - - - - - - - - - - - Roads 0.9 <0.1 0.9 <0.1 <0.1 <0.1 7.2 <0.1 7.2 <0.1 <0.1 <0.1 Settlement - - - - - - 0.1 <0.1 0.1 <0.1 <0.1 <0.1 Treed Wetland - - - - - - - - - - - - Water <0.1 <0.1 <0.1 <0.1 <0.1 <0.1 28.5 <0.1 28.5 <0.1 <0.1 <0.1 Wetland - - - - - - - - - - - - Wetland Herb - - - - - - - - - - - - Wetland Shrub - - - - - - - - - - - - Grand Total 27.1 <0.1 27.1 <0.1 0.0 0.0 426.7 0.2 426.7 0.2 0.0 0.0
March 2016 Report No. 1534932 B-16
Page 87
APPENDIX B Landcover Change Analysis Results - 1990 and 2010
Landcover Class
HOL19 HOL20 1990 Landcover 2010 Landcover Difference 1990 Landcover 2010 Landcover Difference
Area [ha]
% of Landbase
Area [ha]
% of Landbase
Area Change
[ha]
% Resource Change
Area [ha]
% of Landbase
Area [ha]
% of Landbase
Area Change
[ha]
% Resource Change
Forest - - - - - - - - - - - - Trees 1.0 <0.1 0.5 <0.1 -0.5 -47.9 0.1 <0.1 <0.1 <0.1 -0.1 -100.0 Forest Wetland - - - - - - - - - - - - Cropland 502.6 0.2 503.0 0.2 0.5 0.1 92.4 <0.1 92.5 <0.1 0.1 0.1 Grassland Managed - - - - - - - - - - - - Other Land - - - - - - - - - - - - Roads 12.1 <0.1 12.1 <0.1 <0.1 <0.1 5.6 <0.1 5.6 <0.1 <0.1 <0.1 Settlement 0.3 <0.1 0.3 <0.1 <0.1 <0.1 0.2 <0.1 0.2 <0.1 <0.1 <0.1 Treed Wetland - - - - - - - - - - - - Water 8.5 <0.1 8.5 <0.1 <0.1 <0.1 2.0 <0.1 2.0 <0.1 <0.1 <0.1 Wetland - - - - - - - - - - - - Wetland Herb - - - - - - - - - - - - Wetland Shrub - - - - - - - - - - - - Grand Total 524.5 0.2 524.5 0.2 0.0 0.0 100.3 <0.1 100.3 <0.1 0.0 0.0
March 2016 Report No. 1534932 B-17
Page 88
APPENDIX B Landcover Change Analysis Results - 1990 and 2010
Landcover Class
HOL21 1990 Landcover 2010 Landcover Difference
Area [ha] % of Landbase Area
[ha] % of Landbase Area Change [ha] % Resource Change
Forest 12.3 <0.1 7.2 <0.1 -5.1 -41.3 Trees 24.5 <0.1 10.2 <0.1 -14.3 -58.4 Forest Wetland - - - - - - Cropland 3,197.0 1.4 3,215.7 1.4 18.7 0.6 Grassland Managed - - - - - - Other Land - - - - - - Roads 88.6 <0.1 88.6 <0.1 <0.1 <0.1 Settlement 5.7 <0.1 6.4 <0.1 0.7 12.7 Treed Wetland 1.4 <0.1 1.4 <0.1 <0.1 <0.1 Water 201.9 0.1 201.9 0.1 <0.1 <0.1 Wetland - - - - - - Wetland Herb - - - - - - Wetland Shrub - - - - - - Grand Total 3,531.4 1.5 3,531.4 1.5 0.0 0.0
March 2016 Report No. 1534932 B-18
Page 89
APPENDIX B Landcover Change Analysis Results - 1990 and 2010
Landcover Class
IRI01 IRI02 1990 Landcover 2010 Landcover Difference 1990 Landcover 2010 Landcover Difference
Area [ha]
% of Landbase
Area [ha]
% of Landbase
Area Change
[ha]
% Resource Change
Area [ha]
% of Landbase
Area [ha]
% of Landbase
Area Change
[ha]
% Resource Change
Forest 315.0 0.1 278.8 0.1 -36.2 -11.5 166.5 0.1 125.1 0.1 -41.4 -24.9 Trees 34.2 <0.1 23.1 <0.1 -11.1 -32.5 33.2 <0.1 19.5 <0.1 -13.7 -41.3 Forest Wetland 3.0 <0.1 2.8 <0.1 -0.2 -7.0 6.1 <0.1 5.8 <0.1 -0.3 -4.4 Cropland 3,334.2 1.4 3,376.5 1.4 42.3 1.3 2,629.0 1.1 2,683.4 1.1 54.4 2.1 Grassland Managed - - - - - - - - - - - - Other Land - - - - - - - - - - - - Roads 107.9 <0.1 107.9 <0.1 <0.1 <0.1 87.6 <0.1 89.7 <0.1 2.2 2.5 Settlement 29.0 <0.1 35.1 <0.1 6.0 20.8 23.7 <0.1 24.7 <0.1 1.0 4.3 Treed Wetland 3.1 <0.1 3.1 <0.1 <0.1 <0.1 4.9 <0.1 4.9 <0.1 <0.1 <0.1 Water 24.3 <0.1 24.3 <0.1 <0.1 <0.1 13.6 <0.1 13.6 <0.1 <0.1 <0.1 Wetland 97.5 <0.1 96.8 <0.1 -0.7 -0.7 18.2 <0.1 16.1 <0.1 -2.2 -11.8 Wetland Herb 0.2 <0.1 0.2 <0.1 <0.1 <0.1 0.1 <0.1 0.1 <0.1 <0.1 <0.1 Wetland Shrub 1.3 <0.1 1.3 <0.1 <0.1 <0.1 0.5 <0.1 0.5 <0.1 <0.1 <0.1 Grand Total 3,949.8 1.7 3,949.8 1.7 0.0 0.0 2,983.5 1.3 2,983.5 1.3 0.0 0.0
March 2016 Report No. 1534932 B-19
Page 90
APPENDIX B Landcover Change Analysis Results - 1990 and 2010
Landcover Class
IRI03 IRI04 1990 Landcover 2010 Landcover Difference 1990 Landcover 2010 Landcover Difference
Area [ha]
% of Landbase
Area [ha]
% of Landbase
Area Change
[ha]
% Resource Change
Area [ha]
% of Landbase
Area [ha]
% of Landbase
Area Change
[ha]
% Resource Change
Forest 230.7 0.1 178.9 0.1 -51.8 -22.4 186.8 0.1 173.8 0.1 -13.0 -6.9 Trees 26.7 <0.1 13.3 <0.1 -13.4 -50.2 7.3 <0.1 5.7 <0.1 -1.6 -22.3 Forest Wetland 4.7 <0.1 3.8 <0.1 -0.9 -19.2 3.8 <0.1 1.9 <0.1 -1.9 -50.0 Cropland 2,591.8 1.1 2,655.4 1.1 63.7 2.5 731.5 0.3 744.1 0.3 12.5 1.7 Grassland Managed - - - - - - - - - - - - Other Land 0.1 <0.1 0.1 <0.1 <0.1 <0.1 - - - - - - Roads 74.8 <0.1 74.8 <0.1 <0.1 <0.1 24.3 <0.1 24.3 <0.1 <0.1 <0.1 Settlement 29.1 <0.1 34.4 <0.1 5.2 18.0 50.3 <0.1 55.3 <0.1 5.0 10.0 Treed Wetland 5.5 <0.1 5.5 <0.1 <0.1 <0.1 3.1 <0.1 3.4 <0.1 0.3 8.7 Water 1.6 <0.1 1.6 <0.1 <0.1 <0.1 14.0 <0.1 14.0 <0.1 0.0 <0.1 Wetland 7.9 <0.1 5.5 <0.1 -2.4 -30.7 8.2 <0.1 7.4 <0.1 -0.8 -9.9 Wetland Herb - - - - - - 0.3 <0.1 <0.1 <0.1 -0.3 -100.0 Wetland Shrub 1.3 <0.1 1.0 <0.1 -0.4 -26.7 0.5 <0.1 0.2 <0.1 -0.3 -60.0 Grand Total 2,974.1 1.3 2,974.1 1.3 0.0 0.0 1,029.9 0.4 1,029.9 0.4 0.0 0.0
March 2016 Report No. 1534932 B-20
Page 91
APPENDIX B Landcover Change Analysis Results - 1990 and 2010
Landcover Class
LAM01 LAM02 1990 Landcover 2010 Landcover Difference 1990 Landcover 2010 Landcover Difference
Area [ha]
% of Landbase
Area [ha]
% of Landbase
Area Change
[ha]
% Resource Change
Area [ha]
% of Landbase
Area [ha]
% of Landbase
Area Change
[ha]
% Resource Change
Forest - - - - - - 262.2 0.1 222.1 0.1 -40.1 -15.3 Trees 1.9 <0.1 0.3 <0.1 -1.6 -85.6 79.9 <0.1 66.4 <0.1 -13.5 -16.9 Forest Wetland - - - - - - 4.6 <0.1 0.1 <0.1 -4.5 -98.5 Cropland 137.4 0.1 139.0 0.1 1.6 1.2 8,360.3 3.5 8,429.4 3.6 69.1 0.8 Grassland Managed - - - - - - - - - - - - Other Land - - - - - - 0.3 <0.1 0.3 <0.1 <0.1 <0.1 Roads 7.4 <0.1 7.4 <0.1 <0.1 <0.1 268.7 0.1 269.0 0.1 0.3 0.1 Settlement 0.2 <0.1 0.2 <0.1 <0.1 <0.1 19.2 <0.1 19.2 <0.1 0.1 0.5 Treed Wetland - - - - - - 4.4 <0.1 4.3 <0.1 -0.1 -2.0 Water 0.1 <0.1 0.1 <0.1 <0.1 <0.1 261.1 0.1 261.1 0.1 <0.1 <0.1 Wetland - - - - - - 12.4 <0.1 1.2 <0.1 -11.3 -90.6 Wetland Herb - - - - - - 3.2 <0.1 3.2 <0.1 <0.1 <0.1 Wetland Shrub - - - - - - 7.3 <0.1 7.3 <0.1 <0.1 <0.1 Grand Total 146.9 0.1 146.9 0.1 0.0 0.0 9,283.4 3.9 9,283.4 3.9 0.0 0.0
March 2016 Report No. 1534932 B-21
Page 92
APPENDIX B Landcover Change Analysis Results - 1990 and 2010
Landcover Class
MAR01 MAR02 1990 Landcover 2010 Landcover Difference 1990 Landcover 2010 Landcover Difference
Area [ha]
% of Landbase
Area [ha]
% of Landbase
Area Change
[ha]
% Resource Change
Area [ha]
% of Landbase
Area [ha]
% of Landbase
Area Change
[ha]
% Resource Change
Forest 4.4 <0.1 1.8 <0.1 -2.6 -59.1 1,11.7 <0.1 46.3 <0.1 -65.4 -58.5 Trees 0.9 <0.1 0.5 <0.1 -0.3 -38.9 29.8 <0.1 23.4 <0.1 -6.4 -21.4 Forest Wetland - - - - - - 1.2 <0.1 1.2 <0.1 <0.1 <0.1 Cropland 31.8 <0.1 34.7 <0.1 3.0 9.3 2,186.1 0.9 2,252.7 1.0 66.7 3.0 Grassland Managed - - - - - - - - - - - - Other Land - - - - - - - - - - - - Roads 0.7 <0.1 0.7 <0.1 <0.1 0.0 72.2 <0.1 72.2 <0.1 <0.1 <0.1 Settlement 0.2 <0.1 0.2 <0.1 <0.1 0.0 46.3 <0.1 53.0 <0.1 6.6 14.3 Treed Wetland - - - - - - 1.5 <0.1 1.5 <0.1 <0.1 <0.1 Water - - - - - - 10.4 <0.1 10.4 <0.1 <0.1 <0.1 Wetland - - - - - - 1.2 <0.1 1.2 <0.1 <0.1 <0.1 Wetland Herb - - - - - - 1.9 <0.1 0.4 <0.1 -1.5 -81.0 Wetland Shrub - - - - - - 0.4 <0.1 0.4 <0.1 <0.1 <0.1 Grand Total 38.0 <0.1 38.0 <0.1 0.0 0.0 2,462.7 1.0 2,462.7 1.0 0.0 0.0
March 2016 Report No. 1534932 B-22
Page 93
APPENDIX B Landcover Change Analysis Results - 1990 and 2010
Landcover Class
MAR03 1990 Landcover 2010 Landcover Difference
Area [ha] % of Landbase Area
[ha] % of Landbase Area Change [ha] % Resource Change
Forest 79.1 <0.1 54.0 <0.1 -25.0 -31.7 Trees 12.9 <0.1 6.3 <0.1 -6.6 -51.1 Forest Wetland - - - - - - Cropland 753.0 0.3 784.6 0.3 31.6 4.2 Grassland Managed - - - - - - Other Land 0.1 <0.1 0.1 <0.1 <0.1 <0.1 Roads 13.8 <0.1 13.8 <0.1 <0.1 <0.1 Settlement 11.7 <0.1 11.7 <0.1 <0.1 <0.1 Treed Wetland 0.4 <0.1 0.4 <0.1 <0.1 <0.1 Water 6.8 <0.1 6.8 <0.1 <0.1 <0.1 Wetland 1.3 <0.1 1.3 <0.1 <0.1 <0.1 Wetland Herb - - - - - - Wetland Shrub - - - - - - Grand Total 878.9 0.4 878.9 0.4 0.0 0.0
March 2016 Report No. 1534932 B-23
Page 94
APPENDIX B Landcover Change Analysis Results - 1990 and 2010
Landcover Class
MUN01 MUN02 1990 Landcover 2010 Landcover Difference 1990 Landcover 2010 Landcover Difference
Area [ha]
% of Landbase
Area [ha]
% of Landbase
Area Change
[ha]
% Resource Change
Area [ha]
% of Landbase
Area [ha]
% of Landbase
Area Change
[ha]
% Resource Change
Forest 19.8 <0.1 9.5 <0.1 -10.4 -52.2 81.3 <0.1 70.9 <0.1 -10.4 -12.8 Trees 0.7 <0.1 2.3 <0.1 1.6 248.4 20.7 <0.1 15.9 <0.1 -4.7 -22.9 Forest Wetland - - - - - - - - - - - - Cropland 87.0 <0.1 95.7 <0.1 8.7 10.0 1,173.8 0.5 1,188.8 0.5 15.0 1.3 Grassland Managed - - - - - - - - - - - - Other Land - - - - - - - - - - - - Roads 2.5 <0.1 2.5 <0.1 <0.1 <0.1 33.5 <0.1 33.7 <0.1 0.2 0.6 Settlement 0.6 <0.1 0.6 <0.1 <0.1 <0.1 2.8 <0.1 2.8 <0.1 <0.1 <0.1 Treed Wetland - - - - - - - - - - - - Water 3.5 <0.1 3.5 <0.1 <0.1 <0.1 43.2 <0.1 43.2 <0.1 <0.1 <0.1 Wetland - - - - - - - - - - - - Wetland Herb - - - - - - - - - - - - Wetland Shrub - - - - - - - - - - - - Grand Total 114.1 <0.1 114.1 <0.1 0.0 0.0 1,355.3 0.6 1,355.3 0.6 0.0 0.0
March 2016 Report No. 1534932 B-24
Page 95
APPENDIX B Landcover Change Analysis Results - 1990 and 2010
Landcover Class
MUN03 MUN04 1990 Landcover 2010 Landcover Difference 1990 Landcover 2010 Landcover Difference
Area [ha]
% of Landbase
Area [ha]
% of Landbase
Area Change
[ha]
% Resource Change
Area [ha]
% of Landbase
Area [ha]
% of Landbase
Area Change
[ha]
% Resource Change
Forest 120.2 0.1 113.1 <0.1 -7.1 -5.9 34.4 <0.1 28.4 <0.1 -6.0 -17.6 Trees 17.9 <0.1 12.7 <0.1 -5.1 -28.8 2.4 <0.1 2.5 <0.1 0.1 5.6 Forest Wetland - - - - - - - - - - - - Cropland 1,508.4 0.6 1,520.6 0.6 12.1 0.8 324.5 0.1 330.5 0.1 5.9 1.8 Grassland Managed - - - - - - - - - - - - Other Land - - - - - - - - - - - - Roads 64.6 <0.1 64.7 <0.1 0.1 0.1 12.0 <0.1 12.0 <0.1 <0.1 <0.1 Settlement 12.7 <0.1 12.7 <0.1 <0.1 <0.1 0.2 <0.1 0.2 <0.1 <0.1 <0.1 Treed Wetland 0.3 <0.1 0.3 <0.1 <0.1 <0.1 - - - - - - Water 16.8 <0.1 16.8 <0.1 <0.1 <0.1 2.0 0.0 2.0 <0.1 <0.1 <0.1 Wetland 0.1 <0.1 0.1 <0.1 <0.1 <0.1 - - - - - - Wetland Herb - - - - - - - - - - - - Wetland Shrub - - - - - - - - - - - - Grand Total 1,740.8 0.7 1,740.8 0.7 0.0 0.0 375.5 0.2 375.5 0.2 0.0 0.0
March 2016 Report No. 1534932 B-25
Page 96
APPENDIX B Landcover Change Analysis Results - 1990 and 2010
Landcover Class
MUN05 1990 Landcover 2010 Landcover Difference
Area [ha] % of Landbase Area
[ha] % of Landbase Area Change [ha] % Resource Change
Forest 51.5 <0.1 49.2 <0.1 -2.3 -4.4 Trees 8.6 <0.1 5.8 <0.1 -2.9 -33.2 Forest Wetland - - - - - - Cropland 696.1 0.3 701.3 0.3 5.1 0.7 Grassland Managed - - - - - - Other Land - - - - - - Roads 17.4 <0.1 17.4 <0.1 <0.1 <0.1 Settlement 1.4 <0.1 1.4 <0.1 <0.1 <0.1 Treed Wetland - - - - - - Water 12.5 <0.1 12.5 <0.1 <0.1 <0.1 Wetland - - - - - - Wetland Herb - - - - - - Wetland Shrub - - - - - - Grand Total 787.5 0.3 787.5 0.3 0.0 0.0
March 2016 Report No. 1534932 B-26
Page 97
APPENDIX B Landcover Change Analysis Results - 1990 and 2010
Landcover Class
STR01 STR02 1990 Landcover 2010 Landcover Difference 1990 Landcover 2010 Landcover Difference
Area [ha]
% of Landbase
Area [ha]
% of Landbase
Area Change
[ha]
% Resource Change
Area [ha]
% of Landbase
Area [ha]
% of Landbase
Area Change
[ha]
% Resource Change
Forest 146.1 0.1 75.1 <0.1 -71.0 -48.6 159.1 0.1 74.2 <0.1 -84.9 -53.4 Trees 20.1 <0.1 19.8 <0.1 -0.2 -1.1 66.0 <0.1 48.2 <0.1 -17.8 -26.9 Forest Wetland - - - - - - - - - - - - Cropland 2,164.7 0.9 2,235.9 0.9 71.2 3.3 4,133.6 1.8 4,235.9 1.8 102.3 2.5 Grassland Managed - - - - - - - - - - - - Other Land 0.1 <0.1 0.1 <0.1 <0.1 <0.1 - - - - - - Roads 56.1 <0.1 56.1 <0.1 <0.1 <0.1 136.6 0.1 136.6 0.1 <0.1 <0.1 Settlement 7.5 <0.1 7.5 <0.1 <0.1 <0.1 27.5 <0.1 27.9 <0.1 0.4 1.3 Treed Wetland 2.2 <0.1 2.2 <0.1 <0.1 <0.1 4.1 <0.1 4.1 <0.1 <0.1 <0.1 Water 7.6 <0.1 7.6 <0.1 <0.1 <0.1 11.7 <0.1 11.7 <0.1 <0.1 <0.1 Wetland 5.7 <0.1 5.7 <0.1 <0.1 <0.1 5.0 <0.1 5.0 <0.1 <0.1 <0.1 Wetland Herb - - - - - - 0.1 <0.1 0.1 <0.1 <0.1 <0.1 Wetland Shrub 1.0 <0.1 1.0 <0.1 <0.1 <0.1 1.5 <0.1 1.5 <0.1 <0.1 <0.1 Grand Total 2,411.0 1.0 2,411.0 1.0 0.0 0.0 4,545.2 1.9 4,545.2 1.9 0.0 0.0
March 2016 Report No. 1534932 B-27
Page 98
APPENDIX B Landcover Change Analysis Results - 1990 and 2010
Landcover Class
STR03 1990 Landcover 2010 Landcover Difference
Area [ha] % of Landbase Area
[ha] % of Landbase Area Change [ha] % Resource Change
Forest 52.5 <0.1 29.4 <0.1 -23.1 -44.0 Trees 12.5 <0.1 5.4 <0.1 -7.1 -57.0 Forest Wetland - - - - - - Cropland 774.1 0.3 804.2 0.3 30.1 3.9 Grassland Managed - - - - - - Other Land - - - - - - Roads 17.2 <0.1 17.2 <0.1 <0.1 <0.1 Settlement 6.2 <0.1 6.3 <0.1 0.1 1.5 Treed Wetland 0.4 <0.1 0.4 <0.1 <0.1 <0.1 Water 2.8 <0.1 2.8 <0.1 <0.1 <0.1 Wetland - - - - - - Wetland Herb - - - - - - Wetland Shrub 0.2 <0.1 0.2 <0.1 <0.1 <0.1 Grand Total 865.8 0.4 865.8 0.4 0.0 0.0
March 2016 Report No. 1534932 B-28
Page 99
APPENDIX B Landcover Change Analysis Results - 1990 and 2010
Landcover Class
VER01 VER02 1990 Landcover 2010 Landcover Difference 1990 Landcover 2010 Landcover Difference
Area [ha]
% of Landbase
Area [ha]
% of Landbase
Area Change
[ha]
% Resource Change
Area [ha]
% of Landbase
Area [ha]
% of Landbase
Area Change
[ha]
% Resource Change
Forest 704.5 0.3 590.1 0.2 -114.5 -16.2 799.9 0.3 677.3 0.3 -122.6 -15.3 Trees 41.7 <0.1 45.8 <0.1 4.0 9.6 112.7 <0.1 95.6 <0.1 -17.1 -15.2 Forest Wetland 1.8 <0.1 1.8 <0.1 <0.1 <0.1 1.3 <0.1 1.3 <0.1 <0.1 <0.1 Cropland 3,485.8 1.5 3,595.9 1.5 1,10.2 3.2 7,301.6 3.1 7,433.0 3.1 131.3 1.8 Grassland Managed 18.2 <0.1 18.2 <0.1 <0.1 <0.1 - - - - - - Other Land - - - - - - 0.2 <0.1 0.2 <0.1 <0.1 <0.1 Roads 110.3 <0.1 110.4 <0.1 0.1 0.1 224.1 0.1 224.5 0.1 0.4 0.2 Settlement 39.5 <0.1 39.6 <0.1 0.2 0.5 126.2 0.1 134.7 0.1 8.5 6.7 Treed Wetland 0.8 <0.1 0.8 <0.1 <0.1 <0.1 5.3 <0.1 5.3 <0.1 <0.1 <0.1 Water 18.8 <0.1 18.8 <0.1 <0.1 <0.1 41.3 <0.1 41.3 <0.1 <0.1 <0.1 Wetland 28.5 <0.1 28.5 <0.1 <0.1 <0.1 63.8 <0.1 63.7 <0.1 -0.1 -0.1 Wetland Herb - - - - - - 0.7 <0.1 0.3 <0.1 -0.4 -62.5 Wetland Shrub 7.5 <0.1 7.5 <0.1 <0.1 <0.1 18.0 <0.1 18.0 <0.1 <0.1 <0.1 Grand Total 4,457.4 1.9 4,457.4 1.9 0.0 0.0 8,695.1 3.7 8,695.1 3.7 0.0 0.0
March 2016 Report No. 1534932 B-29
Page 100
APPENDIX B Landcover Change Analysis Results - 1990 and 2010
Landcover Class
VER03 VER04 1990 Landcover 2010 Landcover Difference 1990 Landcover 2010 Landcover Difference
Area [ha]
% of Landbase
Area [ha]
% of Landbase
Area Change
[ha]
% Resource Change
Area [ha]
% of Landbase
Area [ha]
% of Landbase
Area Change
[ha]
% Resource Change
Forest 117.9 <0.1 103.4 <0.1 -14.5 -12.3 992.7 0.4 709.7 0.3 -283.1 -28.5 Trees 11.6 <0.1 9.9 <0.1 -1.6 -14.2 105.3 <0.1 78.2 <0.1 -27.2 -25.8 Forest Wetland - - - - - - 15.9 <0.1 15.7 <0.1 -0.2 -1.1 Cropland 598.6 0.3 614.7 0.3 16.0 2.7 6,467.7 2.7 6,750.8 2.9 283.1 4.4 Grassland Managed - - - - - - - - - - - - Other Land - - - - - - - - - - - - Roads 5.7 <0.1 5.7 <0.1 <0.1 <0.1 189.7 0.1 196.4 0.1 6.7 3.6 Settlement 0.9 <0.1 1.0 <0.1 0.1 10.5 101.0 <0.1 123.7 0.1 22.7 22.4 Treed Wetland 1.1 <0.1 1.1 <0.1 <0.1 <0.1 17.5 <0.1 17.5 <0.1 <0.1 <0.1 Water 8.0 <0.1 8.0 <0.1 <0.1 <0.1 139.5 0.1 139.5 0.1 <0.1 <0.1 Wetland 2.3 <0.1 2.3 <0.1 <0.1 <0.1 29.9 <0.1 29.0 <0.1 -0.9 -3.0 Wetland Herb - - - - - - 1.6 <0.1 0.4 <0.1 -1.3 -77.8 Wetland Shrub 2.1 <0.1 2.1 <0.1 <0.1 <0.1 8.0 <0.1 8.0 <0.1 <0.1 <0.1 Grand Total 748.1 0.3 748.1 0.3 0.0 0.0 8,068.8 3.4 8,068.8 3.4 0.0 0.0
March 2016 Report No. 1534932 B-30
Page 101
APPENDIX B Landcover Change Analysis Results - 1990 and 2010
Landcover Class
VER05 VER06 1990 Landcover 2010 Landcover Difference 1990 Landcover 2010 Landcover Difference
Area [ha]
% of Landbase
Area [ha]
% of Landbase
Area Change
[ha]
% Resource Change
Area [ha]
% of Landbase
Area [ha]
% of Landbase
Area Change
[ha]
% Resource Change
Forest 642.8 0.3 432.1 0.2 -210.7 -32.8 761.0 0.3 626.1 0.3 -134.9 -17.7 Trees 118.2 0.1 105.8 <0.1 -12.4 -10.5 51.1 <0.1 53.0 <0.1 1.9 3.7 Forest Wetland 1.4 <0.1 1.4 <0.1 <0.1 <0.1 5.2 <0.1 1.1 <0.1 -4.1 -79.3 Cropland 6,432.4 2.7 6,650.9 2.8 218.6 3.4 3,658.3 1.5 3,801.6 1.6 143.3 3.9 Grassland Managed - - - - - - - - - - - - Other Land 0.2 <0.1 0.2 <0.1 <0.1 <0.1 - - - - - - Roads 165.9 0.1 166.1 0.1 0.2 0.1 81.6 <0.1 81.6 <0.1 <0.1 <0.1 Settlement 74.5 <0.1 78.8 <0.1 4.3 5.8 11.9 <0.1 11.9 <0.1 <0.1 <0.1 Treed Wetland 10.6 <0.1 10.6 <0.1 <0.1 <0.1 16.6 <0.1 16.6 <0.1 <0.1 <0.1 Water 133.5 0.1 133.5 0.1 <0.1 <0.1 48.6 <0.1 48.6 <0.1 <0.1 <0.1 Wetland 25.5 <0.1 25.5 <0.1 <0.1 <0.1 41.9 <0.1 35.7 <0.1 -6.1 -14.6 Wetland Herb 1.0 <0.1 1.0 <0.1 <0.1 <0.1 - - - - - - Wetland Shrub 9.3 <0.1 9.3 <0.1 <0.1 <0.1 11.7 <0.1 11.7 <0.1 <0.1 <0.1 Grand Total 7,615.1 3.2 7,615.1 3.2 0.0 0.0 4,687.8 2.0 4,687.8 2.0 0.0 0.0
March 2016 Report No. 1534932 B-31
Page 102
APPENDIX B Landcover Change Analysis Results - 1990 and 2010
Landcover Class
VER07 VER08 1990 Landcover 2010 Landcover Difference 1990 Landcover 2010 Landcover Difference
Area [ha]
% of Landbase
Area [ha]
% of Landbase
Area Change
[ha]
% Resource Change
Area [ha]
% of Landbase
Area [ha]
% of Landbase
Area Change
[ha]
% Resource Change
Forest 265.3 0.1 182.2 0.1 -83.1 -31.3 218.6 0.1 185.7 0.1 -32.9 -15.1 Trees 39.1 <0.1 31.1 <0.1 -8.0 -20.4 18.9 <0.1 13.1 <0.1 -5.8 -30.6 Forest Wetland 8.3 <0.1 7.4 <0.1 -0.9 -10.9 - - - - - - Cropland 1,658.1 0.7 1,703.0 0.7 44.9 2.7 1,585.0 0.7 1,561.4 0.7 -23.6 -1.5 Grassland Managed - - - - - - - - - - - - Other Land 0.1 <0.1 0.1 <0.1 <0.1 <0.1 0.1 <0.1 0.1 <0.1 <0.1 <0.1 Roads 169.5 0.1 169.5 0.1 <0.1 <0.1 90.9 <0.1 90.9 <0.1 <0.1 <0.1 Settlement 293.0 0.1 349.0 0.1 56.1 19.1 115.0 <0.1 178.7 0.1 63.7 55.4 Treed Wetland 9.9 <0.1 9.9 <0.1 <0.1 <0.1 0.5 <0.1 0.5 <0.1 <0.1 <0.1 Water 27.2 <0.1 27.2 <0.1 <0.1 <0.1 233.0 0.1 233.0 0.1 <0.1 <0.1 Wetland 25.1 <0.1 19.7 <0.1 -5.4 -21.5 14.4 <0.1 14.0 <0.1 -0.5 -3.1 Wetland Herb 4.7 <0.1 1.2 <0.1 -3.5 -75.1 1.3 <0.1 1.0 <0.1 -0.4 -26.7 Wetland Shrub 7.2 <0.1 7.2 <0.1 <0.1 <0.1 2.7 <0.1 2.1 <0.1 -0.6 -23.3 Grand Total 2,507.5 1.1 2,507.5 1.1 0.0 0.0 2,280.3 1.0 2,280.3 1.0 0.0 0.0
March 2016 Report No. 1534932 B-32
Page 103
APPENDIX B Landcover Change Analysis Results - 1990 and 2010
Landcover Class
VER09 VER10 1990 Landcover 2010 Landcover Difference 1990 Landcover 2010 Landcover Difference
Area [ha]
% of Landbase
Area [ha]
% of Landbase
Area Change
[ha]
% Resource Change
Area [ha]
% of Landbase
Area [ha]
% of Landbase
Area Change
[ha]
% Resource Change
Forest 1,435.8 0.6 1,123.0 0.5 -312.8 -21.8 4,106.6 1.7 2,812.0 1.2 -1,294.6 -31.5 Trees 158.7 0.1 138.7 0.1 -20.1 -12.6 306.8 0.1 249.9 0.1 -56.9 -18.6 Forest Wetland 24.9 <0.1 21.1 <0.1 -3.9 -15.5 86.5 <0.1 76.8 <0.1 -9.7 -11.2 Cropland 16,596.1 7.0 16,926.4 7.2 330.2 2.0 22,272.3 9.4 23,629.2 10.0 1,356.8 6.1 Grassland Managed - - - - - - - - - - - - Other Land 0.4 <0.1 0.4 <0.1 <0.1 <0.1 1.3 <0.1 1.3 <0.1 <0.1 <0.1 Roads 441.6 0.2 464.4 0.2 22.8 5.2 680.2 0.3 695.8 0.3 15.6 2.3 Settlement 100.2 <0.1 100.8 <0.1 0.6 0.6 71.7 <0.1 71.9 <0.1 0.2 0.3 Treed Wetland 29.1 <0.1 29.1 <0.1 <0.1 <0.1 59.3 <0.1 59.3 <0.1 <0.1 <0.1 Water 200.9 0.1 200.9 0.1 <0.1 <0.1 325.4 0.1 325.4 0.1 <0.1 <0.1 Wetland 105.9 <0.1 89.0 <0.1 -16.8 -15.9 181.7 0.1 170.4 0.1 -11.3 -6.2 Wetland Herb 0.5 <0.1 0.5 <0.1 <0.1 <0.1 - - - - - - Wetland Shrub 28.3 <0.1 28.2 <0.1 -0.1 -0.3 26.3 <0.1 26.3 <0.1 <0.1 <0.1 Grand Total 19,122.5 8.1 19,122.5 8.1 0.0 0.0 28,118.2 11.9 28,118.2 11.9 0.0 0.0
March 2016 Report No. 1534932 B-33
Page 104
APPENDIX B Landcover Change Analysis Results - 1990 and 2010
Landcover Class
VER11 VER12 1990 Landcover 2010 Landcover Difference 1990 Landcover 2010 Landcover Difference
Area [ha]
% of Landbase
Area [ha]
% of Landbase
Area Change
[ha]
% Resource Change
Area [ha]
% of Landbase
Area [ha]
% of Landbase
Area Change
[ha]
% Resource Change
Forest 5,126.7 2.2 4,507.1 1.9 -619.6 -12.1 219.1 0.1 166.5 0.1 -52.6 -24.0 Trees 165.7 0.1 119.7 0.1 -46.0 -27.8 23.6 <0.1 15.7 <0.1 -7.9 -33.4 Forest Wetland 134.0 0.1 98.7 <0.1 -35.3 -26.3 - - - - - - Cropland 12,789.0 5.4 13,509.7 5.7 720.7 5.6 1,027.6 0.4 1,066.7 0.5 39.1 3.8 Grassland Managed - - - - - - - - - - - - Other Land 1.3 <0.1 1.3 <0.1 <0.1 <0.1 - - - - - - Roads 520.3 0.2 520.3 0.2 <0.1 <0.1 90.1 <0.1 90.7 <0.1 0.5 0.6 Settlement 273.9 0.1 279.9 0.1 6.0 2.2 154.5 0.1 179.6 0.1 25.1 16.3 Treed Wetland 25.2 <0.1 25.1 0.0 -0.1 -0.4 8.6 <0.1 7.9 <0.1 -0.7 -8.3 Water 1015.9 0.4 1015.9 0.4 <0.1 <0.1 41.7 <0.1 41.7 <0.1 <0.1 <0.1 Wetland 48.6 <0.1 22.8 <0.1 -25.7 -53.0 0.9 <0.1 0.9 <0.1 <0.1 <0.1 Wetland Herb 1.6 <0.1 1.4 <0.1 -0.3 -16.7 1.6 <0.1 1.3 <0.1 -0.3 -16.7 Wetland Shrub 16.9 <0.1 17.2 <0.1 0.2 1.5 11.7 <0.1 8.4 <0.1 -3.3 -28.3 Grand Total 20,119.1 8.5 20,119.1 8.5 0.0 0.0 1,579.4 0.7 1,579.4 0.7 0.0 0.0
March 2016 Report No. 1534932 B-34
Page 105
APPENDIX B Landcover Change Analysis Results - 1990 and 2010
Landcover Class
VER13 VER14 1990 Landcover 2010 Landcover Difference 1990 Landcover 2010 Landcover Difference
Area [ha]
% of Landbase
Area [ha]
% of Landbase
Area Change
[ha]
% Resource Change
Area [ha]
% of Landbase
Area [ha]
% of Landbase
Area Change
[ha]
% Resource Change
Forest 424.2 0.2 391.5 0.2 -32.7 -7.7 87.9 <0.1 65.0 <0.1 -22.9 -26.1 Trees 24.1 <0.1 25.9 <0.1 1.8 7.3 19.4 <0.1 12.8 <0.1 -6.6 -34.1 Forest Wetland 2.3 <0.1 1.5 <0.1 -0.8 -34.6 2.0 <0.1 1.3 0.0 -0.6 -31.8 Cropland 1,816.5 0.8 1,849.7 0.8 33.1 1.8 2,405.3 1.0 2,445.1 1.0 39.8 1.7 Grassland Managed - - - - - - - - - - - - Other Land - - - - - - - - - - - - Roads 61.5 <0.1 61.5 <0.1 <0.1 <0.1 70.4 <0.1 70.6 <0.1 0.2 0.3 Settlement 18.7 <0.1 19.6 <0.1 0.9 4.8 3.6 <0.1 3.7 <0.1 0.1 2.1 Treed Wetland 5.1 <0.1 5.1 <0.1 <0.1 0.0 0.8 <0.1 0.8 <0.1 <0.1 <0.1 Water 346.5 0.1 346.5 0.1 <0.1 <0.1 417.6 0.2 417.6 0.2 <0.1 <0.1 Wetland 5.5 <0.1 3.2 <0.1 -2.2 -41.0 11.0 <0.1 1.1 <0.1 -9.9 -90.2 Wetland Herb 2.4 <0.1 2.4 <0.1 <0.1 <0.1 0.3 <0.1 0.3 <0.1 <0.1 <0.1 Wetland Shrub 3.6 <0.1 3.6 <0.1 <0.1 <0.1 0.5 <0.1 0.5 <0.1 <0.1 <0.1 Grand Total 2,710.5 1.1 2,710.5 1.1 0.0 0.0 3,018.8 1.3 3,018.8 1.3 0.0 0.0
March 2016 Report No. 1534932 B-35
Page 106
APPENDIX B Landcover Change Analysis Results - 1990 and 2010
Landcover Class
VER15 VER16 1990 Landcover 2010 Landcover Difference 1990 Landcover 2010 Landcover Difference
Area [ha]
% of Landbase
Area [ha]
% of Landbase
Area Change
[ha]
% Resource Change
Area [ha]
% of Landbase
Area [ha]
% of Landbase
Area Change
[ha]
% Resource Change
Forest 61.6 <0.1 53.2 <0.1 -8.4 -13.6 269.2 0.1 240.1 0.1 -29.1 -10.8 Trees 18.2 <0.1 11.0 <0.1 -7.2 -39.5 41.8 <0.1 19.0 <0.1 -22.8 -54.5 Forest Wetland - - - - - - - - - - - - Cropland 1,082.5 0.5 1,098.1 0.5 15.6 1.4 6,735.5 2.9 6,787.7 2.9 52.1 0.8 Grassland Managed - - - - - - - - - - - - Other Land - - - - - <0.1 - - - - - - Roads 27.0 <0.1 27.0 <0.1 <0.1 <0.1 216.1 0.1 216.3 0.1 0.2 0.1 Settlement 1.4 <0.1 1.4 <0.1 <0.1 <0.1 14.6 <0.1 14.6 <0.1 <0.1 <0.1 Treed Wetland 0.1 <0.1 0.1 <0.1 <0.1 <0.1 - - - - - - Water 21.6 <0.1 21.6 <0.1 <0.1 <0.1 43.7 <0.1 43.7 <0.1 <0.1 <0.1 Wetland - - - - - - 0.7 <0.1 0.3 <0.1 -0.5 -62.5 Wetland Herb <0.1 <0.1 <0.1 <0.1 <0.1 <0.1 - - - - - - Wetland Shrub 0.2 <0.1 0.2 <0.1 <0.1 <0.1 - - - - - - Grand Total 1,212.7 0.5 1,212.7 0.5 0.0 0.0 7,321.6 3.1 7,321.6 3.1 0.0 0.0
March 2016 Report No. 1534932 B-36
Page 107
APPENDIX B Landcover Change Analysis Results - 1990 and 2010
Landcover Class
VER17 VER18 1990 Landcover 2010 Landcover Difference 1990 Landcover 2010 Landcover Difference
Area [ha]
% of Landbase
Area [ha]
% of Landbase
Area Change
[ha]
% Resource Change
Area [ha]
% of Landbase
Area [ha]
% of Landbase
Area Change
[ha]
% Resource Change
Forest 97.2 <0.1 76.5 <0.1 -20.7 -21.3 110.1 <0.1 60.6 <0.1 -49.5 -45.0 Trees 43.9 <0.1 25.2 <0.1 -18.7 -42.6 42.8 <0.1 29.4 <0.1 -13.4 -31.3 Forest Wetland 12.5 <0.1 8.3 <0.1 -4.2 -33.8 0.8 <0.1 <0.1 <0.1 -0.8 -100.0 Cropland 6,490.2 2.7 6,493.1 2.7 2.9 <0.1 8,882.8 3.8 8,945.1 3.8 62.4 0.7 Grassland Managed - - - - - - - - - - - - Other Land 1.0 <0.1 0.1 <0.1 -0.9 -90.7 0.7 <0.1 0.7 <0.1 <0.1 <0.1 Roads 370.5 0.2 372.4 0.2 1.9 0.5 261.8 0.1 263.5 0.1 1.7 0.7 Settlement 356.4 0.2 399.1 0.2 42.7 12.0 38.0 <0.1 38.0 <0.1 0.1 0.2 Treed Wetland 0.8 <0.1 0.8 <0.1 <0.1 <0.1 0.2 <0.1 0.2 <0.1 <0.1 <0.1 Water 118.4 0.1 118.4 0.1 <0.1 <0.1 158.1 0.1 158.1 0.1 <0.1 <0.1 Wetland 4.7 <0.1 1.7 <0.1 -3.0 -63.5 7.7 <0.1 7.3 <0.1 -0.5 -5.8 Wetland Herb - - - - - - - - - - - - Wetland Shrub 0.3 <0.1 0.3 <0.1 <0.1 <0.1 0.9 <0.1 0.9 <0.1 <0.1 0.0 Grand Total 7,495.8 3.2 7,495.8 3.2 0.0 0.0 9,503.9 4.0 9,503.9 4.0 0.0 0.0
March 2016 Report No. 1534932 B-37
Page 108
APPENDIX B Landcover Change Analysis Results - 1990 and 2010
Landcover Class
VER19 VER20 1990 Landcover 2010 Landcover Difference 1990 Landcover 2010 Landcover Difference
Area [ha]
% of Landbase
Area [ha]
% of Landbase
Area Change
[ha]
% Resource Change
Area [ha]
% of Landbase
Area [ha]
% of Landbase
Area Change
[ha]
% Resource Change
Forest 178.4 0.1 132.8 0.1 -45.6 -25.6 9.6 <0.1 7.3 <0.1 -2.3 -23.5 Trees 43.6 <0.1 30.3 <0.1 -13.3 -30.4 12.1 <0.1 8.0 <0.1 -4.1 -33.8 Forest Wetland 0.1 <0.1 0.1 <0.1 <0.1 <0.1 - - - - - - Cropland 6,629.7 2.8 6,684.5 2.8 54.8 0.8 2,157.7 0.9 2,164.0 0.9 6.4 0.3 Grassland Managed - - - - - - - - - - - - Other Land 0.5 <0.1 0.5 <0.1 <0.1 <0.1 - - - - - - Roads 151.6 0.1 155.6 0.1 4.1 2.7 55.7 <0.1 55.7 <0.1 <0.1 <0.1 Settlement 16.5 <0.1 16.5 <0.1 <0.1 <0.1 1.7 <0.1 1.7 <0.1 <0.1 <0.1 Treed Wetland 0.6 <0.1 0.6 <0.1 <0.1 <0.1 - - - - - - Water 81.6 <0.1 81.6 <0.1 <0.1 <0.1 40.0 <0.1 40.0 <0.1 <0.1 <0.1 Wetland 0.1 <0.1 0.1 <0.1 <0.1 <0.1 0.7 <0.1 0.7 <0.1 <0.1 <0.1 Wetland Herb - - - - - - - - - - - - Wetland Shrub - - - - - - - - - - - - Grand Total 7,102.5 3.0 7,102.5 3.0 0.0 0.0 2,277.5 1.0 2,277.5 1.0 0.0 0.0
March 2016 Report No. 1534932 B-38
Page 109
APPENDIX B Landcover Change Analysis Results - 1990 and 2010
Landcover Class
WAR01 WAR02 1990 Landcover 2010 Landcover Difference 1990 Landcover 2010 Landcover Difference
Area [ha]
% of Landbase
Area [ha]
% of Landbase
Area Change
[ha]
% Resource Change
Area [ha]
% of Landbase
Area [ha]
% of Landbase
Area Change
[ha]
% Resource Change
Forest 46.8 <0.1 32.8 <0.1 -13.9 -29.8 - - - - - - Trees 13.6 <0.1 8.3 <0.1 -5.2 -38.4 0.9 <0.1 <0.1 <0.1 -0.9 -100.0 Forest Wetland - - - - - - - - - - - - Cropland 1,279.9 0.5 1,299.1 0.6 19.2 1.5 150.9 0.1 151.8 0.1 0.9 0.6 Grassland Managed - - - - - - - - - - - - Other Land - - - - - - - - - - - - Roads 43.9 <0.1 43.9 <0.1 <0.1 <0.1 - - - - - - Settlement 2.2 <0.1 2.2 <0.1 <0.1 <0.1 <0.1 <0.1 <0.1 <0.1 <0.1 <0.1 Treed Wetland 0.3 <0.1 0.3 <0.1 <0.1 <0.1 - - - - - - Water 5.9 <0.1 5.9 <0.1 <0.1 <0.1 - - - - - - Wetland 0.5 <0.1 0.5 <0.1 <0.1 <0.1 - - - - - - Wetland Herb - - - - - - - - - - - - Wetland Shrub 0.4 <0.1 0.4 <0.1 <0.1 <0.1 - - - - - - Grand Total 1,393.4 0.6 1,393.4 0.6 0.0 0.0 151.8 0.1 151.8 0.1 0.0 0.0
March 2016 Report No. 1534932 B-39
Page 110
APPENDIX B Landcover Change Analysis Results - 1990 and 2010
Landcover Class
WAR03 WAR04 1990 Landcover 2010 Landcover Difference 1990 Landcover 2010 Landcover Difference
Area [ha]
% of Landbase
Area [ha]
% of Landbase
Area Change
[ha]
% Resource Change
Area [ha]
% of Landbase
Area [ha]
% of Landbase
Area Change
[ha]
% Resource Change
Forest 4.5 <0.1 4.5 <0.1 <0.1 -0.5 12.6 <0.1 11.0 <0.1 -1.6 -12.8 Trees 6.7 <0.1 2.2 <0.1 -4.6 -67.9 3.8 <0.1 2.0 <0.1 -1.8 -47.5 Forest Wetland - - - - - - - - - - - - Cropland 1,229.9 0.5 1,234.4 0.5 4.5 0.4 507.1 0.2 510.5 0.2 3.4 0.7 Grassland Managed - - - - - - - - - - - - Other Land - - - - - - - - - - - - Roads 48.2 <0.1 48.2 <0.1 <0.1 0.0 12.3 <0.1 12.3 <0.1 <0.1 <0.1 Settlement 9.3 <0.1 9.4 <0.1 0.1 1.0 4.1 <0.1 4.1 <0.1 <0.1 <0.1 Treed Wetland - - - - - - - - - - - - Water 21.8 <0.1 21.8 <0.1 <0.1 <0.1 7.1 <0.1 7.1 <0.1 <0.1 <0.1 Wetland - - - - - - - - - - - - Wetland Herb - - - - - - - - - - - - Wetland Shrub 0.1 <0.1 0.1 <0.1 <0.1 <0.1 - - - - - - Grand Total 1,320.6 0.6 1,320.6 0.6 0.0 0.0 547.0 0.2 547.0 0.2 0.0 0.0
March 2016 Report No. 1534932 B-40
Page 111
APPENDIX B Landcover Change Analysis Results - 1990 and 2010
Landcover Class
WAR05 1990 Landcover 2010 Landcover Difference
Area [ha] % of Landbase Area
[ha] % of Landbase Area Change [ha] % Resource Change
Forest 33.8 <0.1 31.7 <0.1 -2.2 -6.4 Trees 7.3 <0.1 5.8 <0.1 -1.6 -21.5 Forest Wetland - - - - - - Cropland 331.6 0.1 335.0 0.1 3.4 1.0 Grassland Managed - - - - - - Other Land - - - - - - Roads 19.0 <0.1 19.1 <0.1 0.1 0.5 Settlement 56.5 <0.1 56.7 <0.1 0.2 0.4 Treed Wetland - - - - - - Water 15.6 <0.1 15.6 <0.1 <0.1 <0.1 Wetland - - - - - - Wetland Herb - - - - - - Wetland Shrub - - - - - - Grand Total 463.9 0.2 463.9 0.2 0.0 0.0
March 2016 Report No. 1534932 B-41
Page 112
APPENDIX B Landcover Change Analysis Results - 1990 and 2010
Landcover Class
WAS01 WAS02 1990 Landcover 2010 Landcover Difference 1990 Landcover 2010 Landcover Difference
Area [ha]
% of Landbase
Area [ha]
% of Landbase
Area Change
[ha]
% Resource Change
Area [ha]
% of Landbase
Area [ha]
% of Landbase
Area Change
[ha]
% Resource Change
Forest 5.2 <0.1 1.6 <0.1 -3.6 -68.9 50.1 <0.1 34.0 <0.1 -16.0 -32.0 Trees 1.3 <0.1 1.1 <0.1 -0.1 -8.8 4.1 <0.1 5.9 <0.1 1.8 44.6 Forest Wetland - - - - - - - - - - - - Cropland 104.5 <0.1 108.2 <0.1 3.7 3.5 360.3 0.2 374.5 0.2 14.2 3.9 Grassland Managed - - - - - - - - - - - - Other Land - - - - - - - - - - - - Roads 3.6 <0.1 3.6 <0.1 <0.1 <0.1 7.8 <0.1 7.8 <0.1 <0.1 <0.1 Settlement 1.0 <0.1 1.0 <0.1 <0.1 <0.1 2.6 <0.1 2.6 <0.1 <0.1 <0.1 Treed Wetland - - - - - - - - - - - - Water - - - - - - 7.0 <0.1 7.0 <0.1 <0.1 <0.1 Wetland - - - - - - - - - - - - Wetland Herb - - - - - - - - - - - - Wetland Shrub - - - - - - - - - - - - Grand Total 115.5 <0.1 115.5 <0.1 0.0 0.0 431.8 0.2 431.8 0.2 0.0 0.0
March 2016 Report No. 1534932 B-42
Page 113
APPENDIX B Landcover Change Analysis Results - 1990 and 2010
Landcover Class
WAS03 1990 Landcover 2010 Landcover Difference
Area [ha] % of Landbase Area
[ha] % of Landbase Area Change [ha] % Resource Change
Forest 29.3 <0.1 28.1 <0.1 -1.2 -4.2 Trees 8.0 <0.1 3.5 <0.1 -4.5 -56.6 Forest Wetland - - - - - - Cropland 839.5 0.4 845.2 0.4 5.7 0.7 Grassland Managed - - - - - - Other Land - - - - - - Roads 23.0 <0.1 23.0 <0.1 <0.1 <0.1 Settlement 1.4 <0.1 1.4 <0.1 <0.1 <0.1 Treed Wetland 0.1 <0.1 0.1 <0.1 <0.1 <0.1 Water 18.5 <0.1 18.5 <0.1 <0.1 <0.1 Wetland - - - - - - Wetland Herb - - - - - - Wetland Shrub - - - - - - Grand Total 919.7 0.4 919.7 0.4 0.0 0.0
March 2016 Report No. 1534932 B-43
Page 114
VERMILION RIVER AB, RIPARIAN INVENTORY AND ASSESSMENT
March 2016 Report No. 1534932
ATTACHMENT 1 Riparian Health Maps Scale 1:20000
Page 115
VERMILION RIVER AB, RIPARIAN INVENTORY AND ASSESSMENT
March 2016 Report No. 1534932
ATTACHMENT 2 Riparian Health Maps Scale 1:5000
Page 116
VERMILION RIVER AB, RIPARIAN INVENTORY AND ASSESSMENT
March 2016 Report No. 1534932
ATTACHMENT 3 Landcover Change Maps
Page 117
Golder Associates Ltd.
16820 107 Avenue
Edmonton, Alberta
Canada T5P 4C3
T: +1 (780) 483 3499
Caption Text