28
Avon Catchment Council Report for IWM 004 - Transport Assets Inventory of Water Corporation Pipelines in the Avon River Basin June 2007
Avon Catchment Council
Report for IWM 004 TransportAssets
Inventory of Water CorporationPipelines in the Avon River
Basin
June 2007

61/17052/66612 IWM 004 Transport AssetsInventory of Water Corporation Pipelines in the Avon River Basin

61/17052/66612 IWM 004 Transport AssetsInventory of Water Corporation Pipelines in the Avon River Basin
Contents
1. Introduction 1
1.1 Background 1
1.2 Objective 1
1.3 Management Action Target 1
2. Background Impact of Salinity on Pipeline Assets 2
3. Data Sources 3
3.1 Land Monitor 3
3.2 Pipelines 5
3.3 Complementary Data 5
4. Methodology 6
5. Results 7
5.1 Entire Pipe Network 7
5.2 Analysis of Reticulation and Distribution Pipelines 10
5.3 Analysis of ‘Peripheral’ Scheme Areas Affected by Salinity 14
5.4 Extent and Location of Steel and Concrete Pipes 16
6. Discussion 17
7. References 19
Table IndexTable 31 Extent of Land Monitor coverage in the Avon River
Basin 4Table 51 Breakdown of Pipes Affected by Salinity That
developed Post 1995 9Table 52 Top 6 LGAs in terms of % of pipes located in saline
areas that developed post 1995 13Table 53 Length of PVC, MDPE & HDPE Pipe in Selected
Shires in the ARB 16

61/17052/66612 IWM 004 Transport AssetsInventory of Water Corporation Pipelines in the Avon River Basin
Figure IndexFigure 51 Water Corporation Pipelines in the Avon River
Basin 8Figure 52 Avon River Basin – Peripheral Pipelines Located In
Saline Areas 15
AppendicesA Length of Pipe Impacted by Salinity – Shires of the Avon River
BasinB Length of Distribution and Reticulation Pipes Impacted by Salinity
– Shires of the Avon River Basin

161/17052/66612 IWM 004 Transport AssetsInventory of Water Corporation Pipelines in the Avon River Basin
1. Introduction
1.1 BackgroundGHD were contracted by the Avon Catchment Council (ACC) to deliver the 20052006Investment Plan Project; Protection of Transport Assets IWM004.
The scope of this project includes an assessment of the impact of salinity on transportassets within the Avon River basin and the development of options to better managethe impacts of salinity on roads, rail and airfields. The project includes geographic andtechnical aspects associated with the impact and management of salinity on keyregional transport assets.
Outputs from the Protection of Transport Assets project include:
» An Inventory of transport assets.
» A detailed assessment of roads at risk of salinity.
» An assessment of the impact of salinity on culvert materials and design.
» The development of a monitoring program.
» The provision of technical assistance in the development of demonstration sitesthroughout the region and the provision of associated extension material.
1.2 ObjectiveGHD agreed to undertake a desktop analysis of salinity impacts Water Corporationpipelines in the region.
Presented is an inventory of water distribution assets within the Avon River basin and adesktop assessment of pipelines located in areas affected by salinity, according to theLand Monitor dataset. The analysis includes the Water Corporation distribution (majorarterial pipelines) and reticulation pipelines (peripheral lines that service individualproperties).
Development of the inventory of water distribution assets within the Avon River basinhas included the following components:
• Liaison with Water Corporation to obtain spatial data describing their schemenetwork.
• Geographic assessment (via GIS) of water distribution assets at risk of salinityusing the land monitor risk assessment tool. Assessment was undertaken at aregional scale and reported at a Local Government Authority scale.
1.3 Management Action TargetCompletion of the Desktop Assessment of the Impact of Salinity on Water DistributionAssets does not respond to a specific Management Action Target but was produced atthe request of the Avon Catchment Council.
261/17052/66612 IWM 004 Transport AssetsInventory of Water Corporation Pipelines in the Avon River Basin
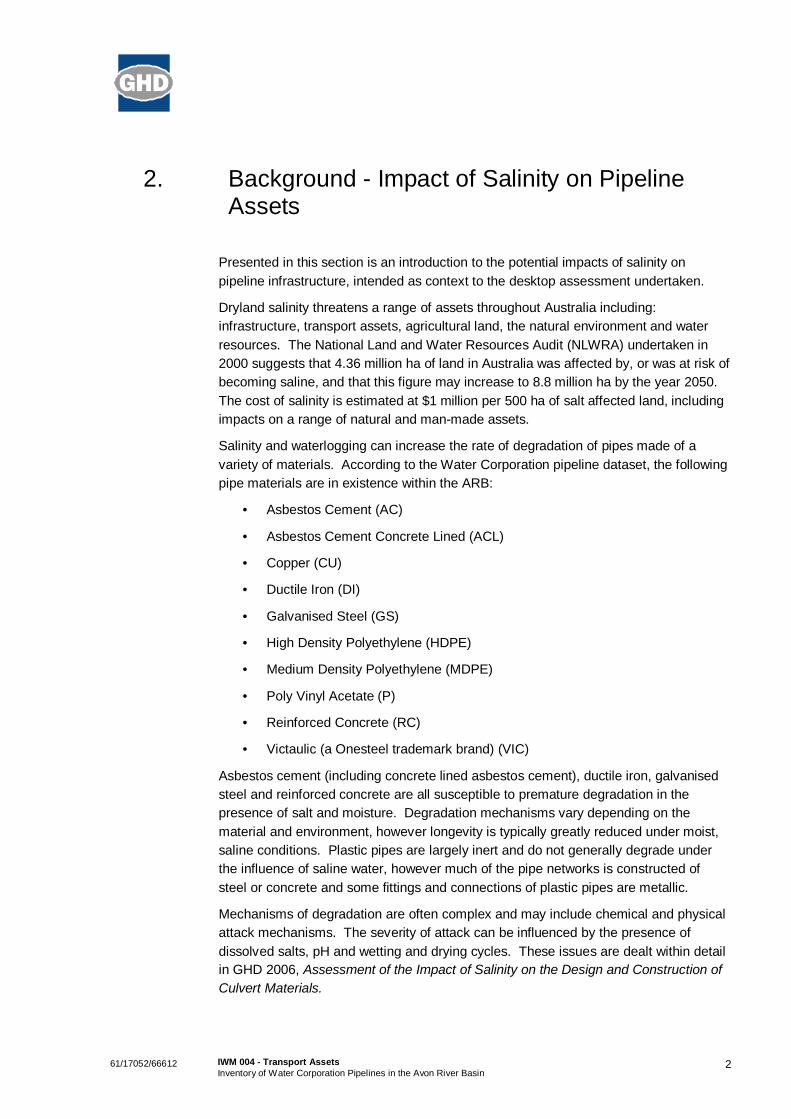
2. Background Impact of Salinity on PipelineAssets
Presented in this section is an introduction to the potential impacts of salinity onpipeline infrastructure, intended as context to the desktop assessment undertaken.
Dryland salinity threatens a range of assets throughout Australia including:infrastructure, transport assets, agricultural land, the natural environment and waterresources. The National Land and Water Resources Audit (NLWRA) undertaken in2000 suggests that 4.36 million ha of land in Australia was affected by, or was at risk ofbecoming saline, and that this figure may increase to 8.8 million ha by the year 2050.The cost of salinity is estimated at $1 million per 500 ha of salt affected land, includingimpacts on a range of natural and manmade assets.
Salinity and waterlogging can increase the rate of degradation of pipes made of avariety of materials. According to the Water Corporation pipeline dataset, the followingpipe materials are in existence within the ARB:
• Asbestos Cement (AC)
• Asbestos Cement Concrete Lined (ACL)
• Copper (CU)
• Ductile Iron (DI)
• Galvanised Steel (GS)
• High Density Polyethylene (HDPE)
• Medium Density Polyethylene (MDPE)
• Poly Vinyl Acetate (P)
• Reinforced Concrete (RC)
• Victaulic (a Onesteel trademark brand) (VIC)
Asbestos cement (including concrete lined asbestos cement), ductile iron, galvanisedsteel and reinforced concrete are all susceptible to premature degradation in thepresence of salt and moisture. Degradation mechanisms vary depending on thematerial and environment, however longevity is typically greatly reduced under moist,saline conditions. Plastic pipes are largely inert and do not generally degrade underthe influence of saline water, however much of the pipe networks is constructed ofsteel or concrete and some fittings and connections of plastic pipes are metallic.
Mechanisms of degradation are often complex and may include chemical and physicalattack mechanisms. The severity of attack can be influenced by the presence ofdissolved salts, pH and wetting and drying cycles. These issues are dealt within detailin GHD 2006, Assessment of the Impact of Salinity on the Design and Construction ofCulvert Materials.

361/17052/66612 IWM 004 Transport AssetsInventory of Water Corporation Pipelines in the Avon River Basin
3. Data Sources
Documentation of data used in the desktop assessment of Water Corporation pipelinesat risk of salinity is presented in this section.
Primary data sets used in the analysis include:
» Land Monitor: Presence of salinity (19871992 and 19951998) supplied by theDepartment of Land Information (DLI) and sourced from the Department ofAgriculture.
» Pipelines: Distribution mains and reticulation mains that comprise the Goldfieldsand Agricultural Water Supply (G&AWS) Scheme, supplied by the WaterCorporation of WA.
A number of complementary data sets were employed to enhance the desktopassessment of those pipelines at risk of salinity, including:
» Digital aerial photography digital terrain model (DTM developed by GHD) derivedfrom 10 m contour data,
» Surface water hydrology
» Local Government Authority boundaries.
These data sets were sourced from the Department of Agriculture. Limited metadatawas provided with data sourced from the Department of Agriculture, therefore theintegrity of data sets sourced from this organisation cannot be guaranteed.
3.1 Land MonitorLand Monitor is a digital data set derived from interpretation of satellite imagery used toidentify areas currently impacted by salinity, in addition to Valley Hazard Mapping.
Land Monitor is the result of a multidisciplinary approach involving multidate satelliteimagery, geographic data (cadastre, hydrogeology, soils, contours) and ground truthingthat has generated a tool for mapping, monitoring and predicting landscape scaleissues related farming practices in rural areas. The area covered by Land Monitoranalysis is 24 million hectares and is generated at a fine scale of 25 m pixels (Spiesand Woodgate, 2005).
A combination of bands 4, 5 and 7 are used to investigate sequences of spring andsummer data from the period 1988 – 2000 for optimal salt detection (Caccetta et al.,2000). To ensure that nonsaline or areas of low productivity are not misinterpreted assaline, three consecutive years of imagery are used to identify areas that consistentlymap as saline (Allen and Beetson, 1999). The end result is a broadscale salinity mapthat can be further used to predict the spread of salinity and identify areas at risk ofsalinity in rural areas where ground mapping is costly and time consuming.
The Land Monitor project has produced a digital coverage of saltaffected land formuch of the southwest agricultural area of Western Australia.

461/17052/66612 IWM 004 Transport AssetsInventory of Water Corporation Pipelines in the Avon River Basin
Land Monitor assessment of salinity does not distinguish between areas of salinity andother areas of consistently low vegetative cover, such as white sand, buildings, damsand roaded catchments, which leads to potential misinterpretation. In an attempt toremove this “noise” from the Land Monitor data, the predicted area impacted by salinitywas clipped to the areas within 2 metre elevation above of the flow path, as describedfor Valley Hazard Mapping. The resulting modified Land Monitor salinity coverage isconsidered more likely to represent areas impacted by valley floor salinity.
Previous assessment of the Land Monitor salinity coverage has indicated an 80%accuracy. It is considered that the Land Monitor data provides a reasonableinterpretation of salinity on a large scale, such as over the extent of the Avon Riverbasin or a similar large catchment. (Caccetta et al., 2000)
The Land Monitor data set is considered to be a first pass assessment of waterdistribution assets at risk of salinity.
The most recent Land Monitor data set does not cover the entire Avon River Basin.Table 31 provides details of those localities not completely covered by Land Monitor.The majority of the area not covered by land monitor data is located in the east of thecatchment.
Table 31 Extent of Land Monitor coverage in the Avon River Basin
Shire Name Proportion of Shirewithin ARB
Proportion of areawithin ARB covered byLand Monitor data
Coolgardie 31% 0%
Dundas 1% 0%
Kondinin 100% 57%
Lake Grace 96% 99%
Mukinbudin 92% 87%
Ravensthorpe 4% 46%
Westonia 99% 49%
Yilgarn 88% 26%
561/17052/66612 IWM 004 Transport AssetsInventory of Water Corporation Pipelines in the Avon River Basin
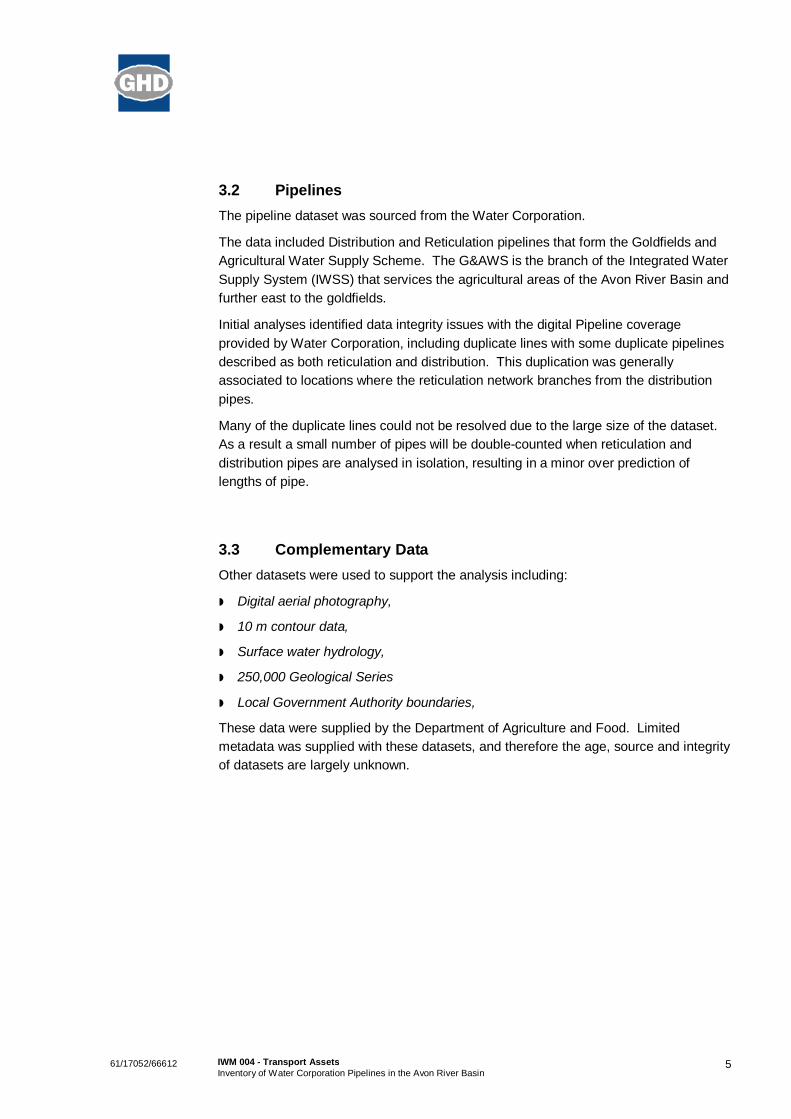
3.2 PipelinesThe pipeline dataset was sourced from the Water Corporation.
The data included Distribution and Reticulation pipelines that form the Goldfields andAgricultural Water Supply Scheme. The G&AWS is the branch of the Integrated WaterSupply System (IWSS) that services the agricultural areas of the Avon River Basin andfurther east to the goldfields.
Initial analyses identified data integrity issues with the digital Pipeline coverageprovided by Water Corporation, including duplicate lines with some duplicate pipelinesdescribed as both reticulation and distribution. This duplication was generallyassociated to locations where the reticulation network branches from the distributionpipes.
Many of the duplicate lines could not be resolved due to the large size of the dataset.As a result a small number of pipes will be doublecounted when reticulation anddistribution pipes are analysed in isolation, resulting in a minor over prediction oflengths of pipe.
3.3 Complementary DataOther datasets were used to support the analysis including:
» Digital aerial photography,
» 10 m contour data,
» Surface water hydrology,
» 250,000 Geological Series
» Local Government Authority boundaries,
These data were supplied by the Department of Agriculture and Food. Limitedmetadata was supplied with these datasets, and therefore the age, source and integrityof datasets are largely unknown.

661/17052/66612 IWM 004 Transport AssetsInventory of Water Corporation Pipelines in the Avon River Basin
4. Methodology
The purpose of the Water Corporation pipeline inventory analysis is to determine theextent and spatial location of those water distribution assets, including reticulation anddistribution pipelines, currently impacted by or at risk of becoming impacted by salinity.
Spatial analysis was undertaken using the ESRI ARC GIS 9 series platform.
The areas currently impacted by salinity as described by the Land Monitor dataset,including recent saline areas (19951998) and older saline areas (19871992), wereamalgamated. This amalgamated dataset was clipped to remove areas that LandMonitor suggests are impacted by salinity, which occur outside of the Valley FloorHazard area, two metres elevation above stream height. Areas designated as salineby Land Monitor, located more than two metres above stream height were removed asthey were often considered to represent areas of high reflectivity that were not salineland (e.g. shed roofs, sand seams). Thus, their inclusion would give a falserepresentation of the extent of salinity.
This amalgamated dataset describing the “current area of salinity” was used in theanalysis for determining the length of water distribution assets likely to be currentlyimpacted by salinity. The result is considered to be a relatively conservative estimateof the area impacted by salinity within the Avon River basin.
761/17052/66612 IWM 004 Transport AssetsInventory of Water Corporation Pipelines in the Avon River Basin
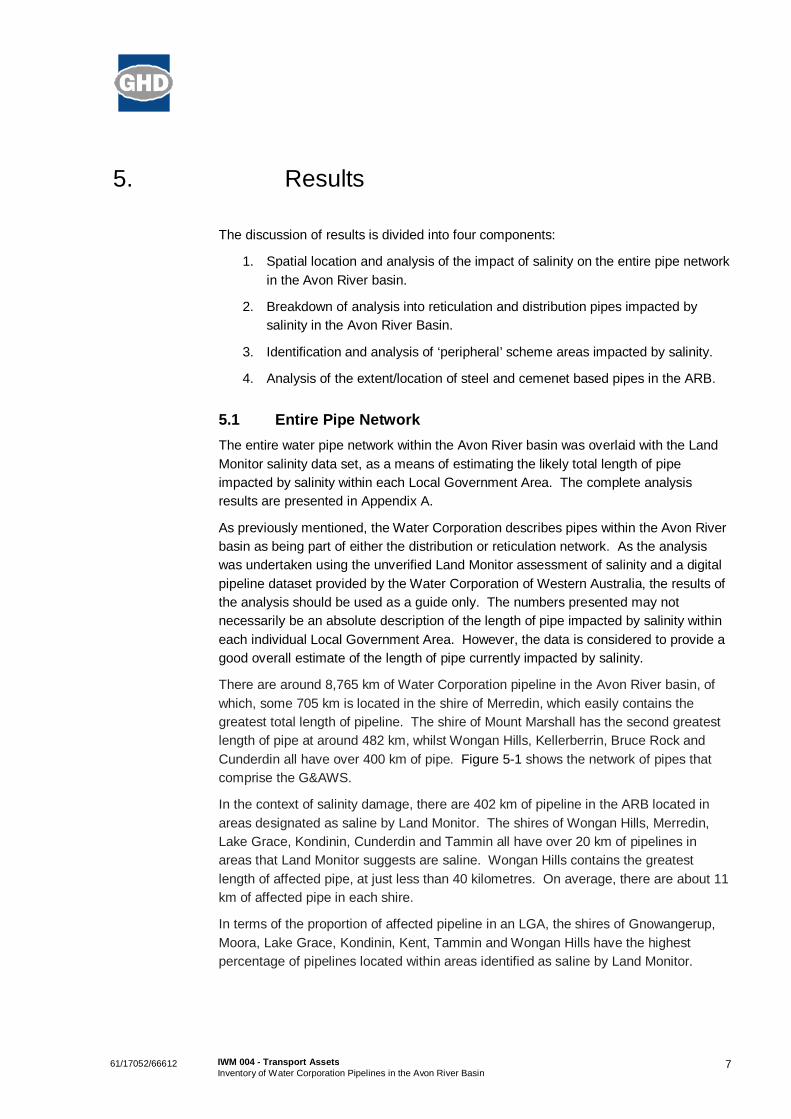
5. Results
The discussion of results is divided into four components:
1. Spatial location and analysis of the impact of salinity on the entire pipe networkin the Avon River basin.
2. Breakdown of analysis into reticulation and distribution pipes impacted bysalinity in the Avon River Basin.
3. Identification and analysis of ‘peripheral’ scheme areas impacted by salinity.
4. Analysis of the extent/location of steel and cemenet based pipes in the ARB.
5.1 Entire Pipe NetworkThe entire water pipe network within the Avon River basin was overlaid with the LandMonitor salinity data set, as a means of estimating the likely total length of pipeimpacted by salinity within each Local Government Area. The complete analysisresults are presented in Appendix A.
As previously mentioned, the Water Corporation describes pipes within the Avon Riverbasin as being part of either the distribution or reticulation network. As the analysiswas undertaken using the unverified Land Monitor assessment of salinity and a digitalpipeline dataset provided by the Water Corporation of Western Australia, the results ofthe analysis should be used as a guide only. The numbers presented may notnecessarily be an absolute description of the length of pipe impacted by salinity withineach individual Local Government Area. However, the data is considered to provide agood overall estimate of the length of pipe currently impacted by salinity.
There are around 8,765 km of Water Corporation pipeline in the Avon River basin, ofwhich, some 705 km is located in the shire of Merredin, which easily contains thegreatest total length of pipeline. The shire of Mount Marshall has the second greatestlength of pipe at around 482 km, whilst Wongan Hills, Kellerberrin, Bruce Rock andCunderdin all have over 400 km of pipe. Figure 51 shows the network of pipes thatcomprise the G&AWS.
In the context of salinity damage, there are 402 km of pipeline in the ARB located inareas designated as saline by Land Monitor. The shires of Wongan Hills, Merredin,Lake Grace, Kondinin, Cunderdin and Tammin all have over 20 km of pipelines inareas that Land Monitor suggests are saline. Wongan Hills contains the greatestlength of affected pipe, at just less than 40 kilometres. On average, there are about 11km of affected pipe in each shire.
In terms of the proportion of affected pipeline in an LGA, the shires of Gnowangerup,Moora, Lake Grace, Kondinin, Kent, Tammin and Wongan Hills have the highestpercentage of pipelines located within areas identified as saline by Land Monitor.

861/17052/66612 IWM 004 Transport AssetsInventory of Water Corporation Pipelines in the Avon River Basin
Figure 51 Water Corporation Pipelines in the Avon River Basin

961/17052/66612 IWM 004 Transport AssetsInventory of Water Corporation Pipelines in the Avon River Basin
Each of the aforementioned shires has at least 8% of its pipelines located in areasdesignated as saline. The average shire has 5% of the pipelines within its boundarylocated within areas designated as saline by Land Monitor. An analysis of thetemporal progression of salinity was also undertaken to highlight shires where salinityimpacting pipelines is an emerging problem.
Table 51 Breakdown of Pipes Affected by Salinity That developed Post 1995
Total Length ofPipe in Saline
Areas thatDeveloped Post1995 (metres)
Total Length ofPipe In SalineAreas (metres)
Percentage of AllPipe in Saline Areasthat Developed Post
1995
Shire of Yilgarn 9461 11731 81%Shire of Westonia 9129 12729 72%Shire of Nungarin 8298 14856 56%Shire of Narembeen 8448 15472 55%Shire of Mukinbudin 966 1983 49%Shire of Victoria Plains 40 86 47%Shire of Merredin 15523 34644 45%Shire of Wyalkatchem 3286 7608 43%Shire of Trayning 7603 18059 42%Shire of Bruce Rock 6586 15795 42%Shire of Tammin 8280 20013 41%Shire of Quairading 3036 8592 35%Shire of Kellerberrin 6659 18981 35%Shire of Dalwallinu 2798 9348 30%Shire of Kent 2451 10484 23%Shire of Lake Grace 5013 23922 21%Shire of WonganBallidu 7799 39831 20%Shire of Mount Marshall 338 1791 19%Shire of Koorda 1851 10957 17%Shire of Cunderdin 4669 28478 16%Shire of Moora 874 5904 15%Shire of Gnowangerup 345 2578 13%Shire of Kondinin 2898 21709 13%Shire of Dowerin 972 8965 11%Shire of Beverley 237 2242 11%Shire of Northam 649 7618 9%Shire of York 121 1735 7%Shire of Goomalling 1165 17280 7%Shire of Corrigin 456 6804 7%Shire of Wickepin 858 13512 6%Shire of Brookton 78 1578 5%Shire of Kulin 185 6697 3%Town of Northam 0 176 0%Shire of Coolgardie 0 0 #DIV/0!Shire of Cuballing #N/A #N/A #N/AShire of Dumbleyung #N/A #N/A #N/AShire of Pingelly 0 0 #DIV/0!Shire of Toodyay 0 0 #DIV/0!
Top 5 shires in terms of percentage of pipes in saline areas that developed post 1995.Top 6 shires in terms of total length of pipe in saline areas.

1061/17052/66612 IWM 004 Transport AssetsInventory of Water Corporation Pipelines in the Avon River Basin
The above table indicates that shires located in the eastern reaches of the ARB haveexperienced a considerable rise in the prevalence of salinity since 1995. Salinity haslargely expressed itself in the shires of Yilgarn, Westonia, Mukinbudin, Nungarin andNarembeen, in the period of time post 1995. Of the pipes located in saline areas in theshire of Yilgarn, 81% are situated in areas that have only become saline since 1995.Given that the shires of Yilgarn and Mukinbudin currently have some of the lowestpercentages of salinityaffected pipes, there is potential that these shires willexperience an increase in the effects of salinity on Water Corporation assets in thefuture.
Table 51 suggests that salinity in the southern and western parts of the catchment hasreached a more developed state than the northeastern reaches. Pipelines in salinityaffected areas that developed post 1995 in the shires of Kulin, Brookton and Wickepinaccount for 6 %, or less of the total length of pipes located in saline areas in theseshires.
Whilst the above trends are based on a relatively cursory analysis, they are generallyconsistent with expectations, based on existing knowledge. For example, in thewestern portion of the catchment, Land Monitor analysis suggests that salinitydeveloped reasonably early in comparison to the eastern areas of the Avon RiverBasin. This is to be expected given the area was cleared earlier than the easternwheatbelt and it had a comparatively shallow depth to groundwater at the time ofclearing.
In summary, the above data analysis indicates that salinity impacts water distributionassets to different extents in different areas of the ARB. LGAs located within the NorthEast of the Avon River Basin generally experience emerging issues associated withsalinity impacting water distribution assets, whilst within the west and the southernparts of the Avon River basin, salinity is more likely to be reaching equilibrium. LGAsin the southern and western reaches of the catchment generally possess a greaterproportion of pipeline that is affected by salinity.
5.2 Analysis of Reticulation and Distribution PipelinesAs previously mentioned, the pipelines that constitute the G&AWS are divided intodistribution and reticulation pipelines. Distribution pipelines comprise major pipes thatform the backbone of the delivery network. Conversely, reticulation pipelines aresmaller pipes that branch from the distribution pipes and deliver water to more specificlocations, sometimes to only one landholder at the limit of their extent.
A breakdown of the pipeline analysis is thought to be of value in that it provides an ideaof the spatial distribution of the reticulation and distribution network. In addition, thisanalysis highlights those LGAs that have a significant length of reticulation pipeslocated in areas affected by salinity.
The output of this analysis is presented in Appendix B, and an abridged version of thisinformation is presented overleaf.

1161/17052/66612 IWM 004 Transport AssetsInventory of Water Corporation Pipelines in the Avon River Basin
Top 6 Shires by total length of pipe in LGA Top 5 shires by either total length, or percentage of pipe in salt affected areas
Total Length ofPipe in LGA (m)
Total Length ofPipe Affected by
Salinity (m)
% of Pipes InSaline Areas
Total Length ofPipe in LGA (m)
Total Length ofPipe Affected by
Salinity (m)
% of Pipes InSaline Areas
Shire of Beverley 8706 17 0% 62605 2226 4%Shire of Brookton 29928 1520 5% 17589 58 0%Shire of Bruce Rock 57441 695 1% 414982 15100 4%Shire of Coolgardie 76995 0 0% 14 0 0%Shire of Corrigin 18949 404 2% 76139 6400 8%Shire of Cunderdin 124316 15206 12% 297121 13272 4%Shire of Dalwallinu 54983 1971 4% 146299 7377 5%Shire of Dowerin 77124 2050 3% 311804 6915 2%Shire of Gnowangerup 8176 2578 32% #N/A #N/A #N/AShire of Goomalling 55421 5906 11% 228930 11374 5%Shire of Kellerberrin 95749 8638 9% 327069 10343 3%Shire of Kent 102087 10208 10% 6590 276 4%Shire of Kondinin 34729 472 1% 253307 21237 8%Shire of Koorda 54440 2639 5% 180075 8318 5%Shire of Kulin 63356 600 1% 208339 6097 3%Shire of Lake Grace 179466 14224 8% 77841 9698 12%Shire of Merredin 117335 6618 6% 587569 28026 5%Shire of Moora #N/A #N/A #N/A 58568 5904 10%Shire of Mount Marshall 3091 0 0% 479403 1791 0%Shire of Mukinbudin #N/A #N/A #N/A 325161 1983 1%Shire of Narembeen 17440 1500 9% 233484 13972 6%Shire of Northam 100387 2655 3% 214854 4963 2%Shire of Nungarin 5110 125 2% 228248 14731 6%Shire of Pingelly 4154 0 0% 24154 0 0%Shire of Quairading 86131 2818 3% 191813 5774 3%Shire of Tammin 26488 9522 36% 187513 10490 6%Shire of Toodyay #N/A #N/A #N/A 22532 0 0%Shire of Trayning 65155 8025 12% 276471 10035 4%Shire of Victoria Plains 1102 0 0% 3074 86 3%Shire of Westonia 132476 8886 7% 107573 3843 4%Shire of Wickepin 75840 5217 7% 142420 8295 6%Shire of WonganBallidu 67378 3210 5% 408728 36621 9%Shire of Wyalkatchem 8074 116 1% 276762 7491 3%Shire of Yilgarn 237734 9548 4% 157242 2183 1%Shire of York 23559 485 2% 129341 1250 1%Town of Northam #N/A #N/A #N/A 88730 176 0%AVERAGE of LGAs 62916 3933 6% 192924 7894 4%SUM of LGAs 2013320 125853 6% 6752341 276305 4%
Distribution Pipelines Reticulation Pipelines

1261/17052/66612 IWM 004 Transport AssetsInventory of Water Corporation Pipelines in the Avon River Basin
In terms of distribution pipes, the shires of Tammin, Gnowangerup, Cunderdin,Trayning, and Goomalling have the highest percentage of pipes located in areasdesignated as saline by Land Monitor. 36 % of the distribution pipes in Tammin lie insaline areas, 34 % in Gnowangerup and 12 % in Cunderdin. When considering themagnitude of distribution pipes affected, Cunderdin contains the most pipes in salineareas, at 15.2 km. The shires of Kent, Lake Grace, Tammin and Yilgarn also havesignificant lengths of Water Corporation pipe in saline areas. The location ofdistribution pipes in saline areas is a concern in that these pipes are necessary todistribute water to reticulation networks further down the line. Thus, their functionalityis not restricted to the immediate areas that they serve, but rather, extends to areas‘downstream’.
It should be noted that a large proportion of the distribution pipes located in salineareas (according to Land Monitor data) in the shires of Tammin and Cunderdin aremore than likely located in the saltaffected sites adjacent to the Great EasternHighway. Concrete supports are generally employed to raise the pipes in this areaabove the level of saline flows, and as such, the accelerated degradation of the pipesthemselves as a result of saline conditions, is usually not such a pressing concern.However, the decay of the supports is heightened under such conditions and theirmaintenance/ replacement is a further action required of the Water Corporation. Alsoan issue where pipelines go underground at road crossings and for scour valve pits.Also deterioration of thrust blocks at change of direction.
The LGAs that present the greatest length of reticulation pipe in saline areas,according to Land Monitor, include:
1. Wongan Hills (36.6 km)
2. Merredin (28 km)
3. Kondinin (21.24 km)
4. Bruce Rock (15 km)
5. Nungarin (14.7 km)
The following shires have the greatest percentage of their reticulation pipes located inareas designated as saline by Land Monitor:
1. Lake Grace (12%)
2. Moora (10%)
3. Wongan Hills (9%)
4. Corrigin (8%)
5. Kondinin (8%)
The most significant inference that can be gleaned from the above analysis, inconjunction with Table 51, is that there appears to be potential for salinity to encroachon a significant length of reticulation pipe in the future.

1361/17052/66612 IWM 004 Transport AssetsInventory of Water Corporation Pipelines in the Avon River Basin
The above figures show that both Bruce Rock and Merredin already have more than15 km of reticulation pipe located in saline areas, and yet, when these figures areviewed in percentage terms, they represent a relatively small proportion of all pipeswithin each LGA. If salinity in these shires develops in a comparable way to the shiresof Lake Grace, Moora and Wongan Hills, then it is reasonable to assume that asignificant length of reticulation pipes will become affected by salinity.
Further evidence for the potential advancement of saltaffected pipes stems from thefact that, as Table 52 indicates, salinity in some shires is developing at a different rateto others.
Table 52 Top 6 LGAs in terms of % of pipes located in saline areas thatdeveloped post 1995
Top 6 LGAs by % of pipes in saline areas that developed post 1995
DISTRIBUTION PIPES RETICULATION PIIPES
Bruce Rock 90 Westonia 87
Yilgarn 91 Yilgarn 79
Westonia 65 Narembeen 58
Merredin 64 Nungarin 56
Nungarin 60 Trayning 56
Tammin 49 Mukinbudin 49
Importantly, the shires that have developed a large proportion of their salinity post1995 currently don’t have significant proportions of their pipelines located in salineareas. For example, 87% of Westonia’s reticulation pipelines that are located insalinityaffected areas are in sites that only became saline after 1995. This suggeststhat salinity is still progressing in this LGA and has the potential to increase further. Atpresent, only four percent of the reticulation pipes in the Westonia shire are affected bysalinity. If this figure were to increase to a figure of eight percent (which is consistentwith shires that experience advanced salinity) this presents a further 3.8 km of pipethat would be situated in saline areas.
The above comparisons assume that the experience of shires with welldevelopedsalinity will similarly translate to those LGAs where salinity is only just beginning toexpress itself. To some degree, this is a reasonable extrapolation, but ultimately, thelength of pipe in a given LGA that will be placed at risk of saline degradation, will bedependent upon: the equilibrium level of salinity in the concerned catchments and thelocation of the pipe within the LGA (i.e. whether pipes are located in the valley floors,which are prone to salinisation, or if they are located higher up in their respectivecatchments).

1461/17052/66612 IWM 004 Transport AssetsInventory of Water Corporation Pipelines in the Avon River Basin
5.3 Analysis of ‘Peripheral’ Scheme Areas Affected by SalinityThe identification of outlying, peripheral scheme areas is a somewhat subjectiveexercise, but the following criteria were applied in an attempt to formalise the processof selecting lengths of pipe to be classified as ‘peripheral’:
• The concerned pipe is a reticulation main;
• The pipe should be at the end of a line and not supply water to subsequentpipelines, which in turn service additional users; and
• The pipe should be a considerable distance from a distribution main.
Eight sites that contain a significant area of salinity, in addition to a length of pipelineidentified as ‘peripheral’ are presented in Figure 52 overleaf. These sites are locatedin the shires of Lake Grace, Kondinin, Narembeen, Merredin, Trayning, Koorda,Wongan – Ballidu and Goomalling.
A large proportion of the pipes in the locations displayed in Figure 52 are eitherasbestos cement or steel, both of which are susceptible to accelerated degradation insaline conditions. A large majority of the asbestos cement pipes in question wereinstalled in the 1960’s and 1970’s, although in Kondinin, most of the asbestos cementpipes were installed in 1955. Steel pipes are generally of the same vintage but inWongan Hills, some of the steel pipes located in the area highlighted in Figure 52were installed in 1919.
In most cases, some pipelines were constructed more recently in each of thehighlighted areas (whether these pipes were replacing old ones, or simply extendingthe network is unclear). As a general rule, these new pipes are made of PVC orMDPE, which are less susceptible to degradation in the adverse conditions presentedby saline sites. The majority of the peripheral reticulation pipe network identified inKondinin consists of PVC and MDPE pipes.
Interestingly, the life expectancy of the Water Corporation pipes, (which is included asan attribute in the Water Corporation pipeline data that was supplied to GHD) aspredicted by the Water Corp, does not vary according to the location of the pipe.Therefore, pipes located in saline areas are given the same estimated life expectancyas those located high up in a catchment, away from rising groundwater. The analysisundertaken as part of this study may enable the life expectancy of pipes in saline areasto be revised accordingly. This is considered to be important data to be captured in theWater Corporation asset management systems.

1561/17052/66612 IWM 004 Transport AssetsInventory of Water Corporation Pipelines in the Avon River Basin Figure 52 Avon River Basin – Peripheral Pipelines Located In Saline Areas

1661/17052/66612 IWM 004 Transport AssetsInventory of Water Corporation Pipelines in the Avon River Basin
5.4 Extent and Location of Steel and Concrete Pipes
5.4.1 Reticulation Pipes
The majority (78.7%) of reticulation pipes are comprised of steel or cementbasedpipes. This equates to some 5628.8 km of pipe network. Around 1529 km, or 21.3%of reticulation pipeline is PVC, HDPE or MDPE pipe.
The distribution of plastic reticulation pipes across the ARB would best be described asa ‘smattering’. There are significant lengths of PVC, HDPE and MDPE pipe in theshires of Mount Marshall, Mukinbudin, Kondinin, Wongan Hills, Westonia, Merredinand Narembeen as evidenced in Table 53.
Table 53 Length of PVC, MDPE & HDPE Pipe in Selected Shires in the ARB
Shire Length of PVC, MDPE, HDPE Pipe in LGA(km)
Kondinin 129
Merredin 114
Mount Marshall 220
Mukinbudin 110
Narembeen 60
Westonia 53
Wongan Hills 110
There appears to be a general trend toward the replacement of steel and concretereticulation pipes with pipes that are likely to achieve greater longevity. The aboveshires, which contain the majority of PVC, MDPE and HDPE pipelines are generallylocated on the margins of the scheme and the pipes have been installed relativelyrecently. However, these pipes are obviously not suitable for use in some applicationse.g. highpressure applications.
1761/17052/66612 IWM 004 Transport AssetsInventory of Water Corporation Pipelines in the Avon River Basin
6. Discussion
Water distribution assets in the Avon River Basin are extensive and very important tothe economy, livelihood and standard of living in the region.
Damage to pipeline assets associated with salinity and rising water tables can besevere and potentially costly in terms of the replacement and maintenance of pipelines.The extent of salinity within the region is generally accepted to be increasing andconsequently, the length of pipe likely to be impacted by salinity in the future is alsoanticipated to increase.
There are approximately 8,765 km of pipelines within the Avon River basin, of which,402 km (4.6 %) are situated in areas described as saline by the Land Monitor dataset.Approximately 126 km of distribution pipelines are located in areas impacted by salinity(according to Land Monitor data) and a further 276 km of reticulation pipelines are inareas considered to be saline.
The Local Government Authorities of Lake Grace, Merredin, WonganBallidu,Kondinin, Cunderdin, Narembeen and Tammin are the worst impacted in terms of thelength of Water Corporation pipelines intersecting Land Monitor saline areas. In termsof the proportion of pipelines affected in an LGA, Gnowangerup, Kondinin, Kent,Moora, Lake Grace, Tammin and WonganBallidu are the worst affected.
The analysis also indicates that shires located east of the medium watershed(including Yilgarn, Westonia, Mukinbudin, Narembeen and Nungarin) haveexperienced a significant increase in the impact of salinity on pipelines post 1995.However, to date, a relatively low proportion of pipes in these shires have beenimpacted by salinity in comparison to other LGAs.
The desktop analysis undertaken relies heavily on the Land Monitor data set, which isderived from the interpretation of satellite imagery. This data has inherent errors,which should be taken into account when considering outcomes from the analysis.
There are a number of areas of peripheral scheme that intersect sites identified assaline by Land Monitor. The viability of these lengths of pipeline, in light of theirmaintenance costs is somewhat questionable, given that they serve relatively fewpeople. Some parts of the pipelines that were labelled peripheral consist of plasticpipes that are largely resistant to the adverse environmental conditions associated withsaline sites. Whether this course of action is a strategy of the Water Corporation isunknown.
The vast majority of pipes within the ARB are made of materials that are susceptible topremature degradation in the presence of salt and moisture. There appears to havebeen a trend toward the installation of plastic pipes that are largely immune to theaction of salt in recent years. However, these pipes still only account for just over 20% of all pipes in the region.

1861/17052/66612 IWM 004 Transport AssetsInventory of Water Corporation Pipelines in the Avon River Basin
This analysis has indicated that salinity presents a significant threat to the longevity ofpipelines in the ARB and that the length of pipe affected by saline flows and risingwater tables is expected to increase in coming years.

1961/17052/66612 IWM 004 Transport AssetsInventory of Water Corporation Pipelines in the Avon River Basin
7. References
Allen & B. Beetson (1999) The Land Monitor Project; A Multiagency project of theWestern Australian Salinity Action Plan supported by the Natural Heritage Trust.Proceedings of WALIS Forum 1999, Perth, WA, March 1999, pp. 7477.
Caccetta, P. A., Allan, A. and Watson, I. (2000), The Land Monitor project,Proceedings of the Tenth Australasian Remote Sensing Conference.
GHD 2006. Assessment of the Impact of Salinity on the Design and Construction ofCulvert Materials, Avon Catchment Council, Northam WA.
McRobert, J., Foley, G., The Impacts of Waterlogging and Salinity on Road Assets: aWestern Australian Case Study, 1999, ARRB Transport Research, Vermont SouthVictoria
Salinity and Rising Water Tables – Risk to Road Assets, 2004, prepared by ARRBTransport Research for Austroads, Sydney NSW
Spies, B. and Woodgate, P. (2005). Salinity mapping methods in the Australiancontext. Department of the Environment and Heritage; Agriculture, Fisheries andForestry, June, 2005.
61/17052/66612 IWM 004 Transport AssetsInventory of Water Corporation Pipelines in the Avon River Basin
Appendix A
Length of Pipe Impacted by Salinity –Shires of the Avon River Basin

61/17052/66612 IWM 004 Transport AssetsInventory of Water Corporation Pipelines in the Avon River Basin
Total Length ofPipeline (metres)
Total Length ofPipe In SalineAreas (metres)
Percentage ofPipes in Saline
Areas
Shire of Beverley 71311 2242 3%Shire of Brookton 47516 1578 3%Shire of Bruce Rock 472423 15795 3%Shire of Coolgardie 77009 0 0%Shire of Corrigin 95088 6804 7%Shire of Cuballing #N/A #N/A #N/AShire of Cunderdin 421437 28478 7%Shire of Dalwallinu 201281 9348 5%Shire of Dowerin 388928 8965 2%Shire of Dumbleyung #N/A #N/A #N/AShire of Gnowangerup 8176 2578 32%Shire of Goomalling 284352 17280 6%Shire of Kellerberrin 422818 18981 4%Shire of Kent 108677 10484 10%Shire of Kondinin 288036 21709 8%Shire of Koorda 234515 10957 5%Shire of Kulin 271694 6697 2%Shire of Lake Grace 257308 23922 9%Shire of Merredin 704903 34644 5%Shire of Moora 58568 5904 10%Shire of Mount Marshall 482494 1791 0%Shire of Mukinbudin 325161 1983 1%Shire of Narembeen 250924 15472 6%Shire of Northam 315240 7618 2%Shire of Nungarin 233358 14856 6%Shire of Pingelly 28309 0 0%Shire of Quairading 277944 8592 3%Shire of Tammin 214001 20013 9%Shire of Toodyay 22532 0 0%Shire of Trayning 341626 18059 5%Shire of Victoria Plains 4176 86 2%Shire of Westonia 240049 12729 5%Shire of Wickepin 218260 13512 6%Shire of WonganBallidu 476107 39831 8%Shire of Wyalkatchem 284836 7608 3%Shire of Yilgarn 394976 11731 3%Shire of York 152900 1735 1%Town of Northam 88730 176 0%All LGAs 8765661 402158 5%
Top 7 Shires by Percentage of Pipeline Located in Land Monitor Saline Areas

61/17052/66612 IWM 004 Transport AssetsInventory of Water Corporation Pipelines in the Avon River Basin
Appendix B
Length of Distribution and ReticulationPipes Impacted by Salinity – Shires of theAvon River Basin

61/17052/66612 IWM 004 Transport AssetsInventory of Water Corporation Pipelines in the Avon River Basin
SHIRE Total Salinity1987 1992
Salinity1995 1998
TotalSalinity
% after1995 Total Salinity
1987 1992Salinity
1995 1998Total
Salinity% after1995
Shire of Beverley 8706 17 0 17 0% 62605 1988 237 2226 11%Shire of Brookton 29928 1442 78 1520 5% 17589 58 0 58 0%Shire of Bruce Rock 57441 72 623 695 90% 414982 9136 5964 15100 39%Shire of Coolgardie 76995 0 0 0 #DIV/0! 14 0 0 0 ~Shire of Corrigin 18949 241 163 404 40% 76139 6106 293 6400 5%Shire of Cunderdin 124316 12626 2580 15206 17% 297121 11183 2090 13272 16%Shire of Dalwallinu 54983 1655 316 1971 16% 146299 4895 2483 7377 34%Shire of Dowerin 77124 1963 88 2050 4% 311804 6031 884 6915 13%Shire of Gnowangerup 8176 2233 345 2578 13% #N/A #N/A #N/A #N/A #N/AShire of Goomalling 55421 5669 237 5906 4% 228930 10446 928 11374 8%Shire of Kellerberrin 95749 6167 2470 8638 29% 327069 6155 4189 10343 40%Shire of Kent 102087 7758 2450 10208 24% 6590 276 1 276 0%Shire of Kondinin 34729 301 171 472 36% 253307 18510 2727 21237 13%Shire of Koorda 54440 2451 188 2639 7% 180075 6655 1663 8318 20%Shire of Kulin 63356 575 25 600 4% 208339 5937 160 6097 3%Shire of Lake Grace 179466 12002 2222 14224 16% 77841 6908 2791 9698 29%Shire of Merredin 117335 2362 4256 6618 64% 587569 16758 11267 28026 40%Shire of Moora #N/A #N/A #N/A #N/A #N/A 58568 5029 874 5904 15%Shire of Mount Marshall 3091 0 0 0 ~ 479403 1454 338 1791 19%Shire of Mukinbudin #N/A #N/A #N/A #N/A #N/A 325161 1017 966 1983 49%Shire of Narembeen 17440 1150 350 1500 23% 233484 5874 8098 13972 58%Shire of Northam 100387 2422 232 2655 9% 214854 4547 416 4963 8%Shire of Nungarin 5110 50 75 125 60% 228248 6508 8223 14731 56%Shire of Pingelly 4154 0 0 0 ~ 24154 0 0 0 ~Shire of Quairading 86131 1741 1077 2818 38% 191813 3815 1959 5774 34%Shire of Tammin 26488 4810 4713 9522 49% 187513 6923 3567 10490 34%Shire of Toodyay #N/A #N/A #N/A #N/A #N/A 22532 0 0 0 ~Shire of Trayning 65155 6018 2006 8025 25% 276471 4438 5596 10035 56%Shire of Victoria Plains 1102 0 0 0 ~ 3074 46 40 86 47%Shire of Westonia 132476 3094 5791 8886 65% 107573 505 3338 3843 87%Shire of Wickepin 75840 4759 458 5217 9% 142420 7895 400 8295 5%Shire of WonganBallidu 67378 3160 50 3210 2% 408728 28872 7749 36621 21%Shire of Wyalkatchem 8074 116 0 116 0% 276762 4206 3286 7491 44%Shire of Yilgarn 237734 1801 7747 9548 81% 157242 469 1714 2183 79%Shire of York 23559 443 42 485 9% 129341 1171 79 1250 6%Town of Northam #N/A #N/A #N/A #N/A #N/A 88730 176 0 176 0%AVERAGE 62916 2722 1211 3933 26% 192924 5542 2352 7894 28%
RETICULATION PIPELINESWater Corporation Pipelines Distribution and Reticulation Pipelines in Saline Areas
DISTRIBUTION PIPELINES


