31
Oracle Enterprise Gateway 1 / 31 An Oracle White Paper May 2011 Monitoring and Reporting with Oracle Enterprise Gateway
Oracle Enterprise Gateway
1 / 31
An Oracle White Paper May 2011
Monitoring and Reporting with Oracle Enterprise Gateway

Oracle Enterprise Gateway
2 / 31
Disclaimer
The following is intended to outline our general product direction. It is intended for information purposes only, and may not be incorporated into any contract. It is not a commitment to deliver any material, code, or functionality, and should not be relied upon in making purchasing decisions. The development, release, and timing of any features or functionality described for Oracle’s products remains at the sole discretion of Oracle.
Oracle Enterprise Gateway
3 / 31
Introduction ........................................................................................... 5 Reporting and Monitoring: ................................................................. 5 Prerequisites: .................................................................................... 5
OEG Service Monitor ............................................................................ 5 Prerequisites: .................................................................................... 5 Setup Overview: ................................................................................ 5 Install OEG Service Monitor 6.0: ....................................................... 6 Configure the MYSQL Database: ..................................................... 6 Configure OEG Service Monitor to use the MySQL Database: ........ 7 Start OEG Service Monitor: .............................................................. 9
OEG Gateway ...................................................................................... 10 Configure Logging ............................................................................. 11 Configure Monitoring Settings: .......................................................... 12
Reports, Real Time Monitoring and Audit Trails ................................... 13 Create a Process Node with the OEG Service Monitor Web Console: ............ 13 Viewing Real Time Monitoring: ......................................................... 16 Viewing Reports (Historical Static Data): .......................................... 17 Viewing Audit Trail Data: ................................................................... 20
Definition of Success, Failure and Fatal log level: .................................... 20
Configuration of Log Levels: ..................................................................... 20
Viewing Audit Trail Data using OEG Service Monitor: .............................. 22 Using Reporter to Monitor Watchdogs and Conditions ....................... 23
Configuring a HTTP Watchdog: ........................................................ 24 Configuring Conditions for HTTP Interfaces ..................................... 25
A Typical Deployment Scenario ............................................................... 25
Types of Conditions .................................................................................. 26
Adding a Condition to a HTTP Interface: .................................................. 27

Oracle Enterprise Gateway
4 / 31
Monitoring Watchdogs ..................................................................... 28 Monitoring Remote Hosts ................................................................. 29
Conclusion ............................................................................................ 30
Oracle Enterprise Gateway
5 / 31
Introduction
Reporting and Monitoring:
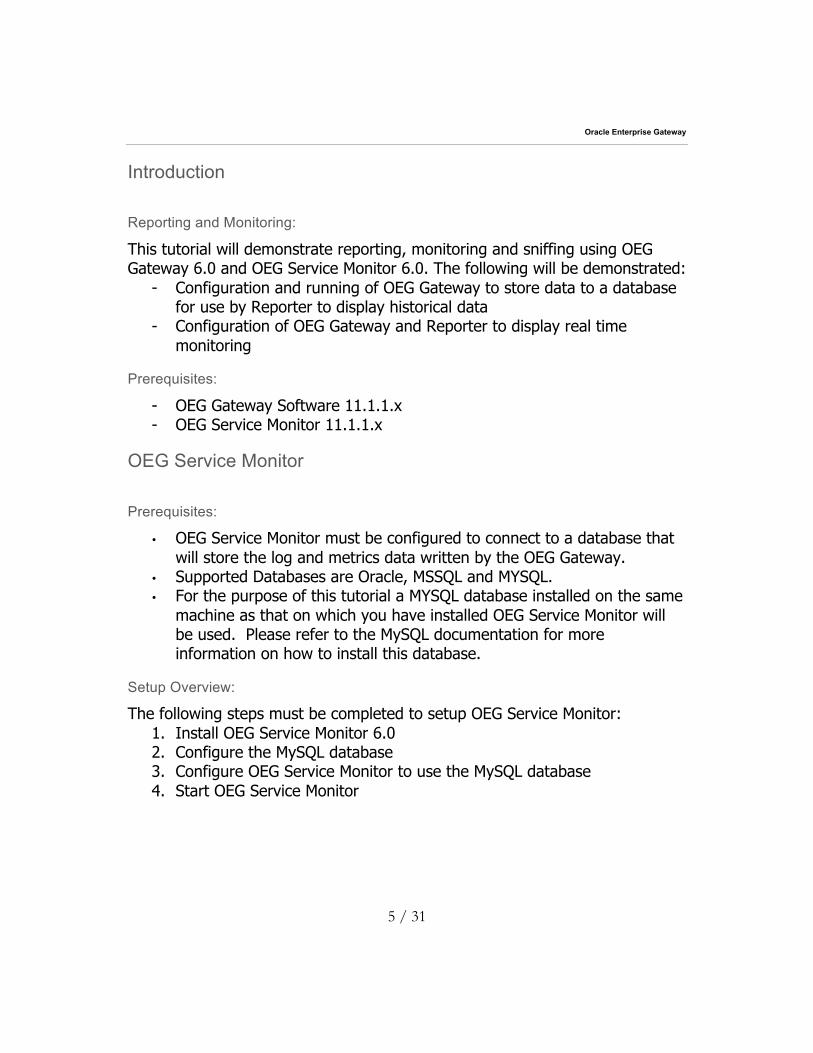
This tutorial will demonstrate reporting, monitoring and sniffing using OEG Gateway 6.0 and OEG Service Monitor 6.0. The following will be demonstrated:
- Configuration and running of OEG Gateway to store data to a database for use by Reporter to display historical data
- Configuration of OEG Gateway and Reporter to display real time monitoring
Prerequisites:
- OEG Gateway Software 11.1.1.x - OEG Service Monitor 11.1.1.x
OEG Service Monitor
Prerequisites:
• OEG Service Monitor must be configured to connect to a database that will store the log and metrics data written by the OEG Gateway.
• Supported Databases are Oracle, MSSQL and MYSQL. • For the purpose of this tutorial a MYSQL database installed on the same
machine as that on which you have installed OEG Service Monitor will be used. Please refer to the MySQL documentation for more information on how to install this database.
Setup Overview:
The following steps must be completed to setup OEG Service Monitor: 1. Install OEG Service Monitor 6.0 2. Configure the MySQL database 3. Configure OEG Service Monitor to use the MySQL database 4. Start OEG Service Monitor

Oracle Enterprise Gateway
6 / 31
Each of these steps will be discussed in detail in the following sections.
Install OEG Service Monitor 11.1.1.x:
- Obtain the install archive for the relevant platform that OEG Service Monitor will be running on, i.e. Windows, Linux or Solaris.
- Extract to a suitable directory of your choice.
Configure the MYSQL Database:
- Create a new database. For the purposes of this tutorial, we will create a database called “reports” using the following command:
mysql>create database reports; - Check that the database has been created:
mysql>show databases; - The next step is to create the necessary tables for the new database. - Change the current database to the new “reports” database using the
following command: mysql>use reports;
- The new database titled “reports” will now be the database in use. - The next step is to create the necessary tables for the new database. - The necessary database table scripts are located in the installation
directory of the OEG Gateway in the directory /VordelGateway_Install _Dir/system/conf/sql.
- There will be four directories containing the scripts for the Oracle, MYSQL, MSSQL and DB2 databases. Use the appropriate script depending on the database that you wish to use. For the purposes of this tutorial, you can use the “db_schema.sql” file in the /mysql folder, which contains the SQL commands required to create the relevant tables in the MySQL database. You can simply copy-and-paste the contents of this file into the mysql prompt to create the tables.
- Once the tables have been created, verify that the necessary tables exist using the following command:
mysql>show tables; The tables list for the reports database: o audit_log_points o audit_log_sign o audit_message_payload o metrics_alerts o metrics_data o persistent_stat_targets
Oracle Enterprise Gateway
7 / 31
o process_ids
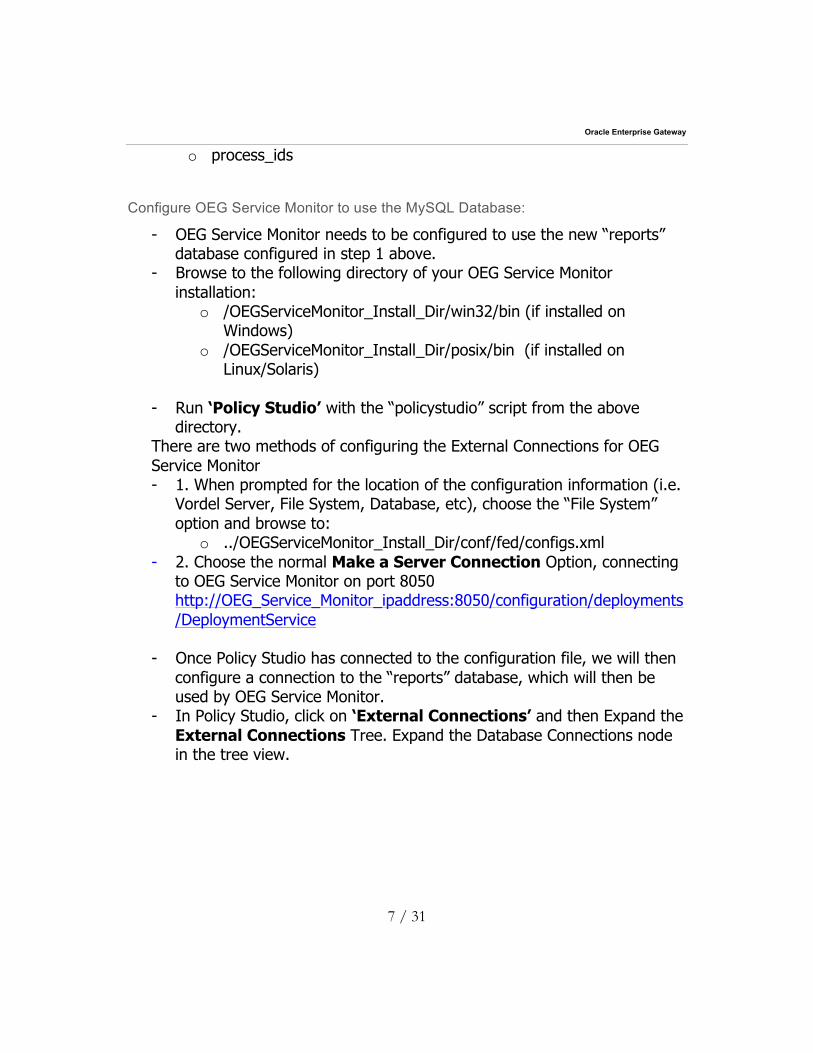
Configure OEG Service Monitor to use the MySQL Database:
- OEG Service Monitor needs to be configured to use the new “reports” database configured in step 1 above.
- Browse to the following directory of your OEG Service Monitor installation:
o /OEGServiceMonitor_Install_Dir/win32/bin (if installed on Windows)
o /OEGServiceMonitor_Install_Dir/posix/bin (if installed on Linux/Solaris)
- Run ‘Policy Studio’ with the “policystudio” script from the above
directory. There are two methods of configuring the External Connections for OEG Service Monitor - 1. When prompted for the location of the configuration information (i.e.
Vordel Server, File System, Database, etc), choose the “File System” option and browse to:
o ../OEGServiceMonitor_Install_Dir/conf/fed/configs.xml - 2. Choose the normal Make a Server Connection Option, connecting
to OEG Service Monitor on port 8050 http://OEG_Service_Monitor_ipaddress:8050/configuration/deployments/DeploymentService
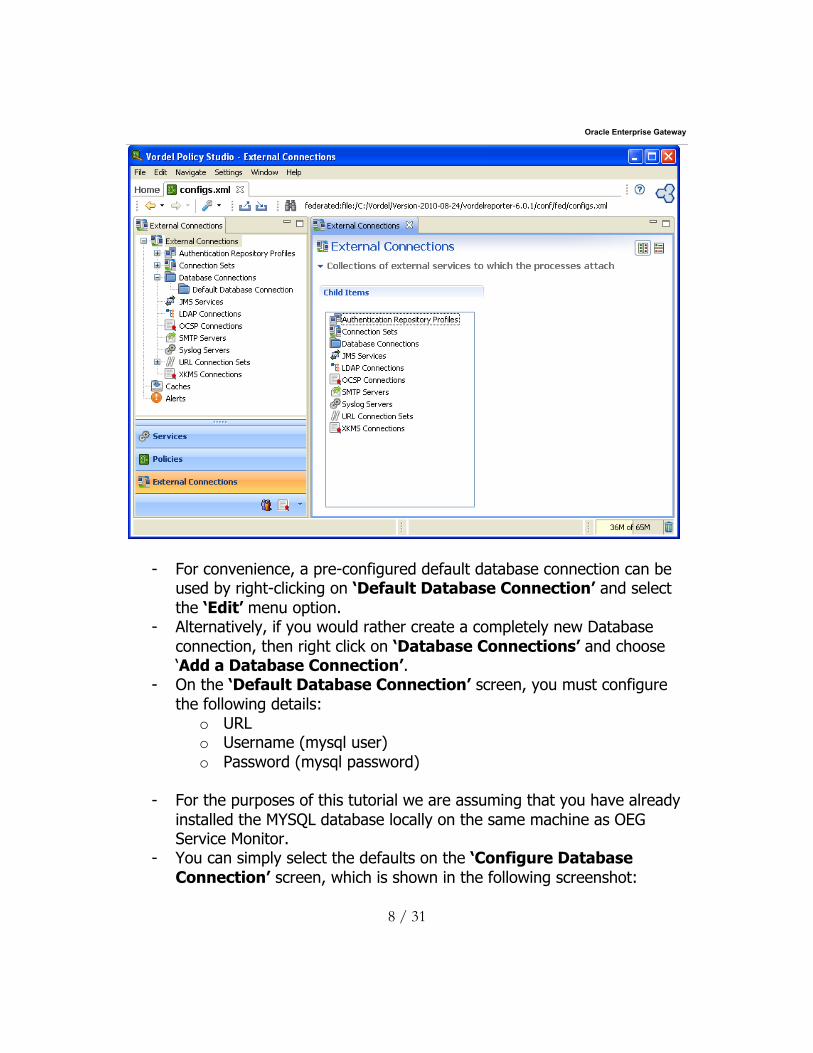
- Once Policy Studio has connected to the configuration file, we will then
configure a connection to the “reports” database, which will then be used by OEG Service Monitor.
- In Policy Studio, click on ‘External Connections’ and then Expand the External Connections Tree. Expand the Database Connections node in the tree view.
Oracle Enterprise Gateway
8 / 31
- For convenience, a pre-configured default database connection can be used by right-clicking on ‘Default Database Connection’ and select the ‘Edit’ menu option.
- Alternatively, if you would rather create a completely new Database connection, then right click on ‘Database Connections’ and choose ‘Add a Database Connection’.
- On the ‘Default Database Connection’ screen, you must configure the following details:
o URL o Username (mysql user) o Password (mysql password)
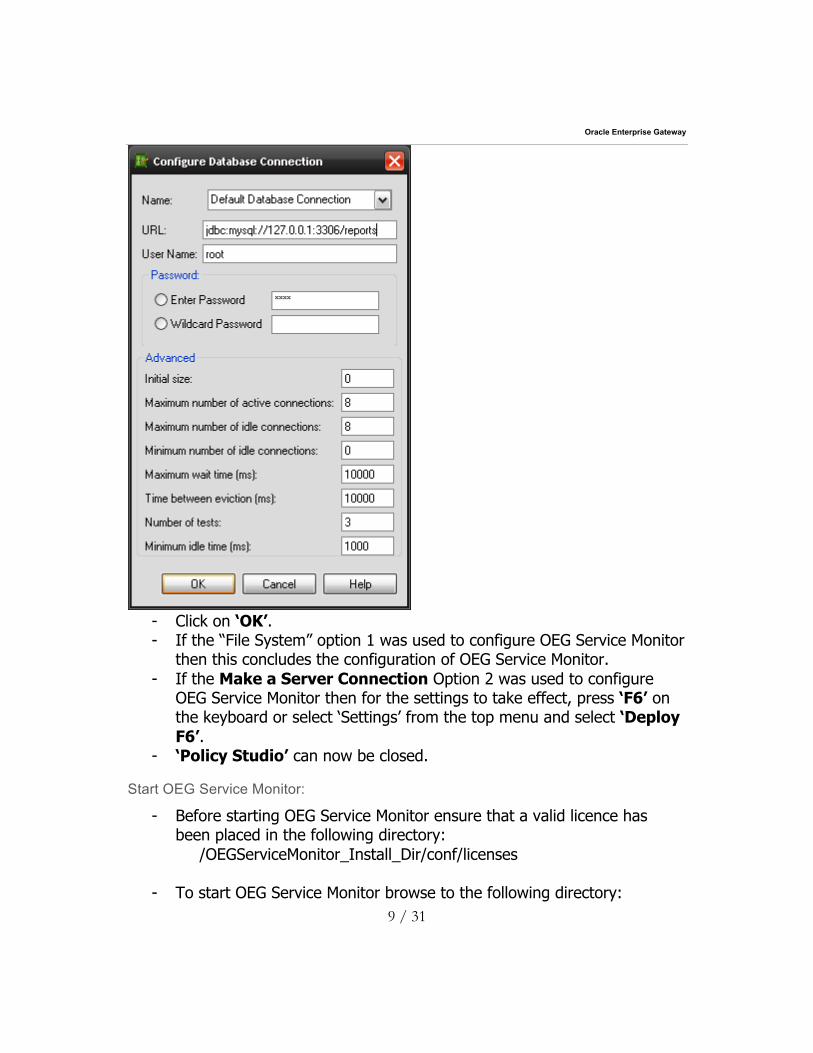
- For the purposes of this tutorial we are assuming that you have already
installed the MYSQL database locally on the same machine as OEG Service Monitor.
- You can simply select the defaults on the ‘Configure Database Connection’ screen, which is shown in the following screenshot:
Oracle Enterprise Gateway
9 / 31
- Click on ‘OK’. - If the “File System” option 1 was used to configure OEG Service Monitor
then this concludes the configuration of OEG Service Monitor. - If the Make a Server Connection Option 2 was used to configure
OEG Service Monitor then for the settings to take effect, press ‘F6’ on the keyboard or select ‘Settings’ from the top menu and select ‘Deploy F6’.
- ‘Policy Studio’ can now be closed.
Start OEG Service Monitor:
- Before starting OEG Service Monitor ensure that a valid licence has been placed in the following directory:
/OEGServiceMonitor_Install_Dir/conf/licenses
- To start OEG Service Monitor browse to the following directory:
Oracle Enterprise Gateway
10 / 31
/OEGServiceMonitor_Install_Dir/win32/bin (if installed on Windows) /OEGServiceMonitor_Install_Dir/posix/bin (if installed on Linux)
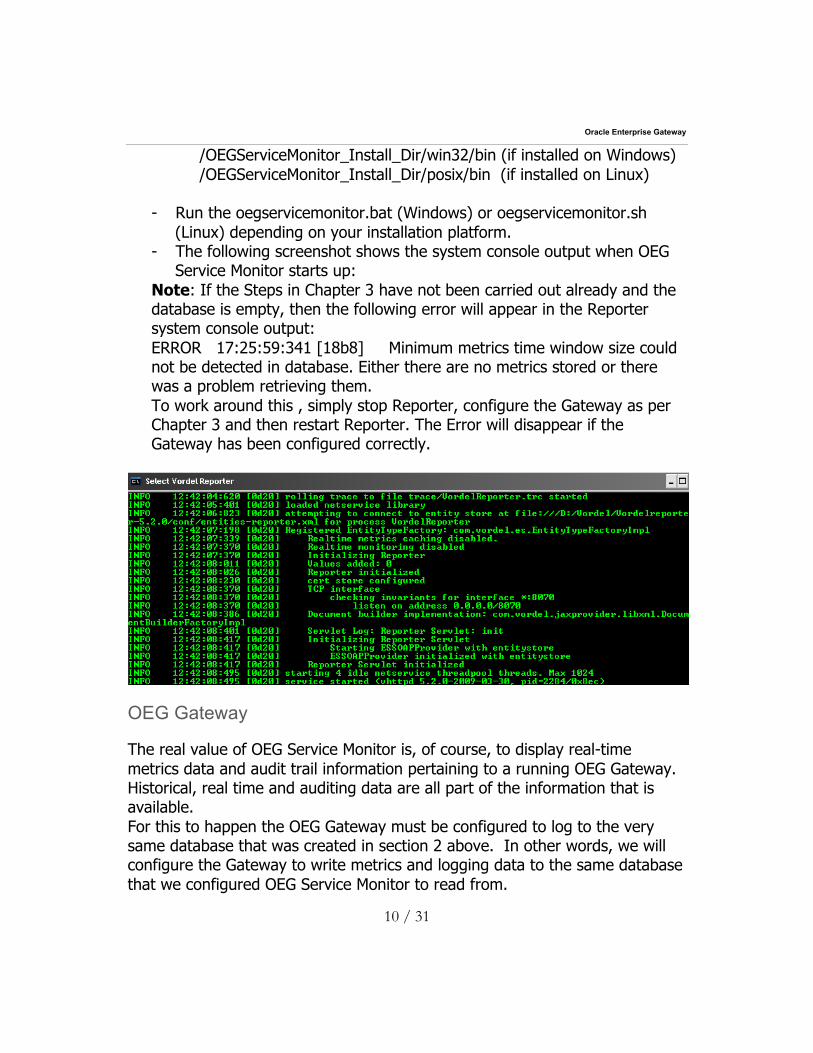
- Run the oegservicemonitor.bat (Windows) or oegservicemonitor.sh (Linux) depending on your installation platform.
- The following screenshot shows the system console output when OEG Service Monitor starts up:
Note: If the Steps in Chapter 3 have not been carried out already and the database is empty, then the following error will appear in the Reporter system console output: ERROR 17:25:59:341 [18b8] Minimum metrics time window size could not be detected in database. Either there are no metrics stored or there was a problem retrieving them. To work around this , simply stop Reporter, configure the Gateway as per Chapter 3 and then restart Reporter. The Error will disappear if the Gateway has been configured correctly.
OEG Gateway
The real value of OEG Service Monitor is, of course, to display real-time metrics data and audit trail information pertaining to a running OEG Gateway. Historical, real time and auditing data are all part of the information that is available. For this to happen the OEG Gateway must be configured to log to the very same database that was created in section 2 above. In other words, we will configure the Gateway to write metrics and logging data to the same database that we configured OEG Service Monitor to read from.
Oracle Enterprise Gateway
11 / 31
The instructions given below describe how to configure the Gateway to store logging and monitoring data to the database configured in section 2 above.
Configure Logging
- Start the OEG Gateway by running the “enterprisegateway” script from the following directory, depending on your installation platform:
/OEG_Gateway_Install_Dir/win32/bin (if installed on Windows) /OEG_Gateway_Install_Dir/posix/bin (if installed on Linux)
- Open ‘Policy Studio’ for the OEG Gateway by running the “policystudio” script from the following directory, depending on your installation platform:
/OEG_Gateway_Install_Dir/win32/bin (if installed on Windows) /OEG_Gateway_Install_Dir/posix/bin (if installed on Linux)
- When prompted for the location of the configuration information (i.e. Vordel Server, File System, Database, etc), choose the “Vordel Server” and then “Finish”.
- In ‘Policy Studio’, expand the ‘External Connections’ tree node and then select ‘Database Connections’.
- Right click on ‘Default Database Connection’ and click on ‘Edit’ - If the preference is to create a completely new Database connection,
then right click on ‘Database Connections’ and choose ‘Add a Database Connection’
- Alternatively, you can use the pre-configured default database connection by selecting the ‘Default Database Connection’ and configuring the following fields:
o URL o Username o Password
- In either case you must enter the details of the MySQL “reports”
database configured in Section 2 above. - Next the Gateway needs to be configured to log to the database. - Expand ‘Processes’ and right click on ‘OEG Gateway’. - Select ‘Logging’ and choose ‘Custom’. - Click on the ‘Database’ tab and tick the ‘Enable logging to
database’ checkbox.

Oracle Enterprise Gateway
12 / 31
- Click on ‘OK’.
Configure Monitoring Settings:
- In Policy Studio, right click on ‘OEG Gateway’ and select ‘Real Time Monitoring’.
- Tick the ‘Enable real time Monitoring’ and ‘Store real time monitoring data for Reporter’ boxes.
- Choose the ‘Time Window’ value desired. Permitted values are 1 hour, 5 minutes or 5 seconds.
- Choose the database configured earlier from the ‘Database’ drop down list.
- Click on ‘OK’.

Oracle Enterprise Gateway
13 / 31
- The OEG Gateway is now set up to log to the created database. - For the settings to take effect, press ‘F6’ on the keyboard or select
‘Settings’ from the top menu and select ‘Deploy F6’.
Reports, Real Time Monitoring and Audit Trails
The Gateway and ServiceMonitor are now properly configured to log data and display this data via the OEG Service Monitor Web Console.
Create a Process Node with the OEG Service Monitor Web Console:
We must register an interest in a running instance of the Gateway for which we want to generate reports and view monitoring data. We can do this by adding a “Node” with the Web Console, as outlined in the following steps:
- Make sure that OEG Service Monitor is started. - Open a web browser and type in the following URL:
http://ip_addr_ServiceMonitor:8040/reporter/ NOTE: By default the ServiceMonitor is configured to listen on port 8040 and uses a default path of /reporter/.
- The home page of the Reporter Web Console should now display as follows:

Oracle Enterprise Gateway
14 / 31
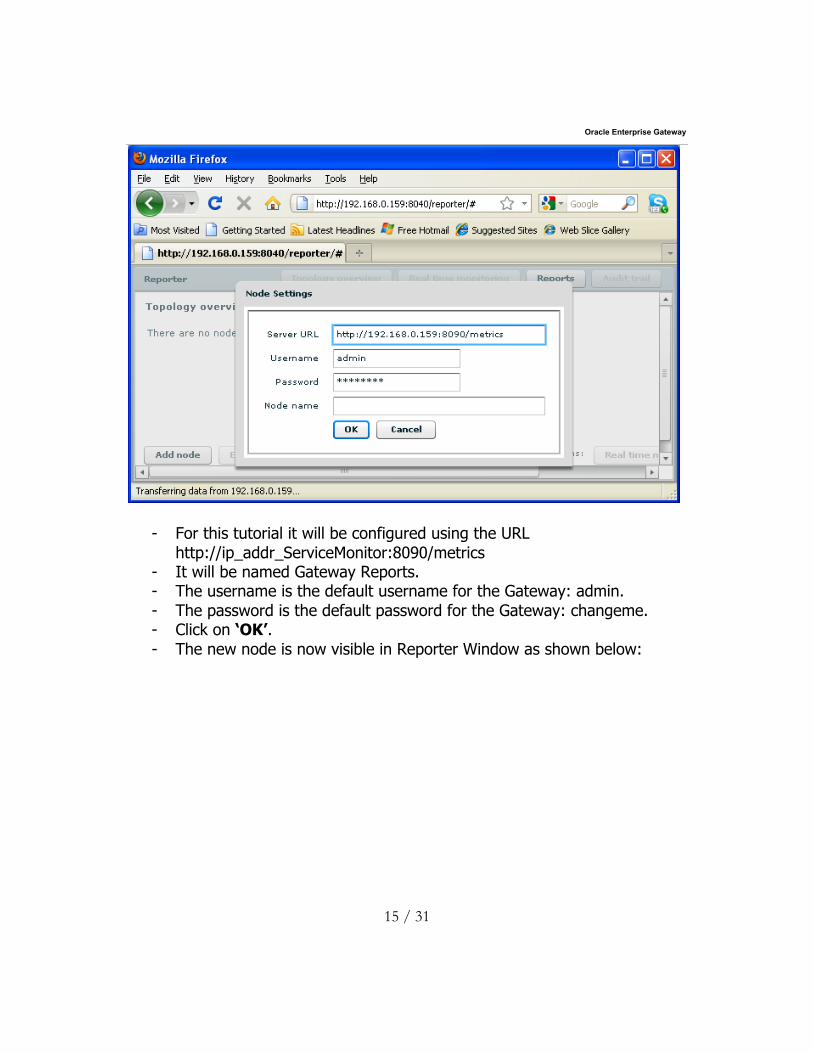
- Click on ‘Add Node’. - Use the “Node Settings” interface to monitor real time data for traffic
received on a particular relative path configured on the Gateway.
Oracle Enterprise Gateway
15 / 31
- For this tutorial it will be configured using the URL http://ip_addr_ServiceMonitor:8090/metrics
- It will be named Gateway Reports. - The username is the default username for the Gateway: admin. - The password is the default password for the Gateway: changeme. - Click on ‘OK’. - The new node is now visible in Reporter Window as shown below:

Oracle Enterprise Gateway
16 / 31
- Note: The Node URL always needs to use the management port number of the Gateway. By default this is 8090. However, it is possible to change the port that the Management Services use via Policy Studio.
Viewing Real Time Monitoring:
Once the new node representing a live Gateway has bee added, it is possible to start viewing and monitoring live traffic passing through the Gateway. To view Real Time Monitoring:
- Right click on the created Node and select ‘Real Time Monitoring’. - This will open a new screen as shown below:
Oracle Enterprise Gateway
17 / 31
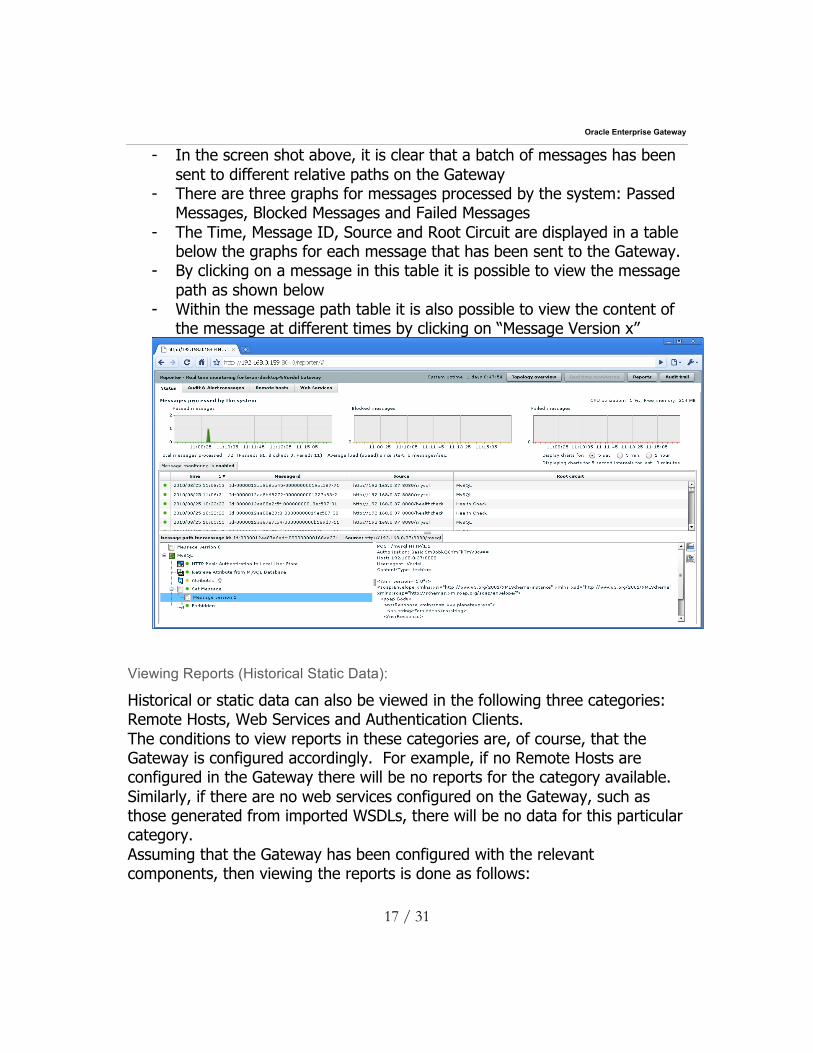
- In the screen shot above, it is clear that a batch of messages has been sent to different relative paths on the Gateway
- There are three graphs for messages processed by the system: Passed Messages, Blocked Messages and Failed Messages
- The Time, Message ID, Source and Root Circuit are displayed in a table below the graphs for each message that has been sent to the Gateway.
- By clicking on a message in this table it is possible to view the message path as shown below
- Within the message path table it is also possible to view the content of the message at different times by clicking on “Message Version x”
Viewing Reports (Historical Static Data):
Historical or static data can also be viewed in the following three categories: Remote Hosts, Web Services and Authentication Clients. The conditions to view reports in these categories are, of course, that the Gateway is configured accordingly. For example, if no Remote Hosts are configured in the Gateway there will be no reports for the category available. Similarly, if there are no web services configured on the Gateway, such as those generated from imported WSDLs, there will be no data for this particular category. Assuming that the Gateway has been configured with the relevant components, then viewing the reports is done as follows:
Oracle Enterprise Gateway
18 / 31
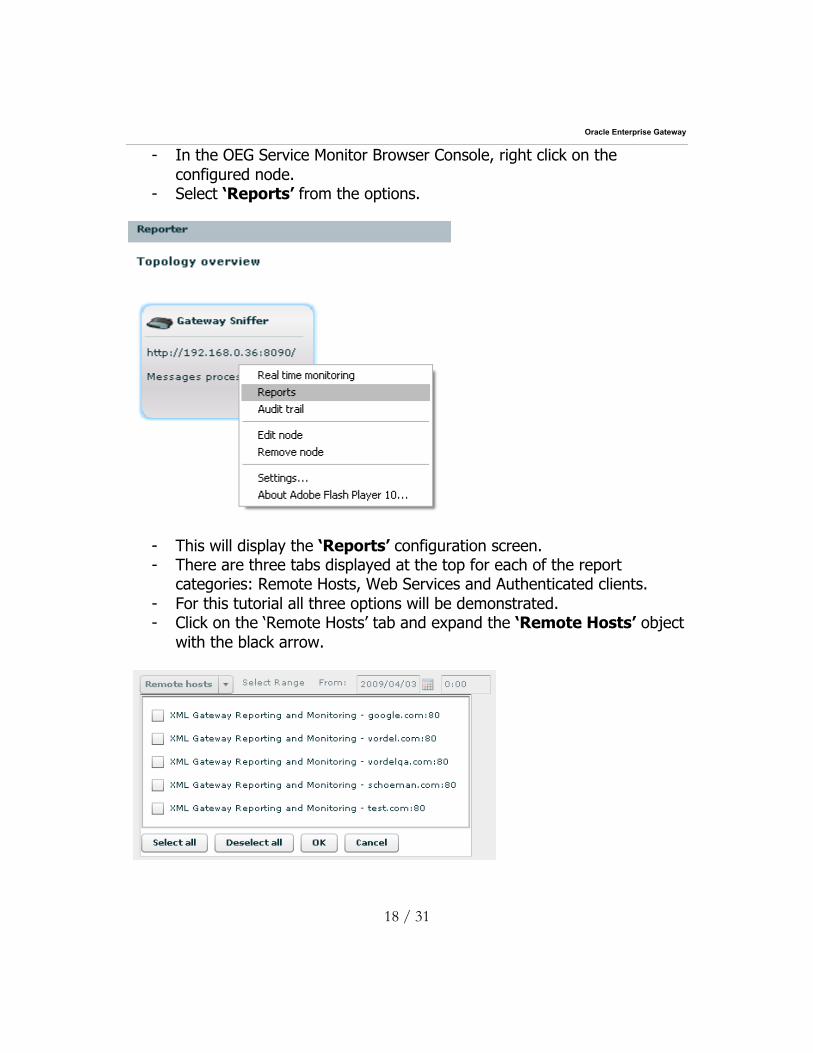
- In the OEG Service Monitor Browser Console, right click on the configured node.
- Select ‘Reports’ from the options.
- This will display the ‘Reports’ configuration screen. - There are three tabs displayed at the top for each of the report
categories: Remote Hosts, Web Services and Authenticated clients. - For this tutorial all three options will be demonstrated. - Click on the ‘Remote Hosts’ tab and expand the ‘Remote Hosts’ object
with the black arrow.

Oracle Enterprise Gateway
19 / 31
- If there are multiple remote hosts configured in the Gateway, they will all be displayed here. Select an available remote host and click on ‘OK’.
- Then make sure that the Date and time range is set appropriately to view the desired reports.
- Select the desired Time Windows Metrics value. 1 hour is the default value. 5 minutes or 5 seconds are only available if it has been configured in Policy Studio for the Gateway. See Time Window value* in section 3.
- Select ‘Aggregated Metrics’ and Click ‘View Report’ (this will display a trend based chart) as below:
- Or select ‘Totals’ and Click ‘View Report’ that will display a volume chart and statistics:
Oracle Enterprise Gateway
20 / 31
- This process can be repeated for Web Services. - For Authenticated clients, select the web service and then choose the
client.
Viewing Audit Trail Data:
It is possible to view audit trails via the Reporter Web console. Audit trail data is derived from the log level set on each filter in the Policy Studio for policies in the Gateway. There are three log levels to select:
- Success - Failure - Fatal
Definition of Success, Failure and Fatal log level:
Success:
A filter will succeed if it returns a true result after carrying out its processing. For example, if the LDAP directory returns an "authorized" result to the authorization filter, the filter will succeed. Failure:
A filter will fail if it returns a false result after carrying out its security processing. Using the authorization example above, the authorization filter will return false if the LDAP directory returns a "not authorized" result to the filter. Fatal:
A filter will abort when it cannot make the decision it was asked to make. For example, if an LDAP-based authorization filter cannot connect to the LDAP directory it will abort, since it can neither authorize nor refuse access. This is regarded as a fatal error.
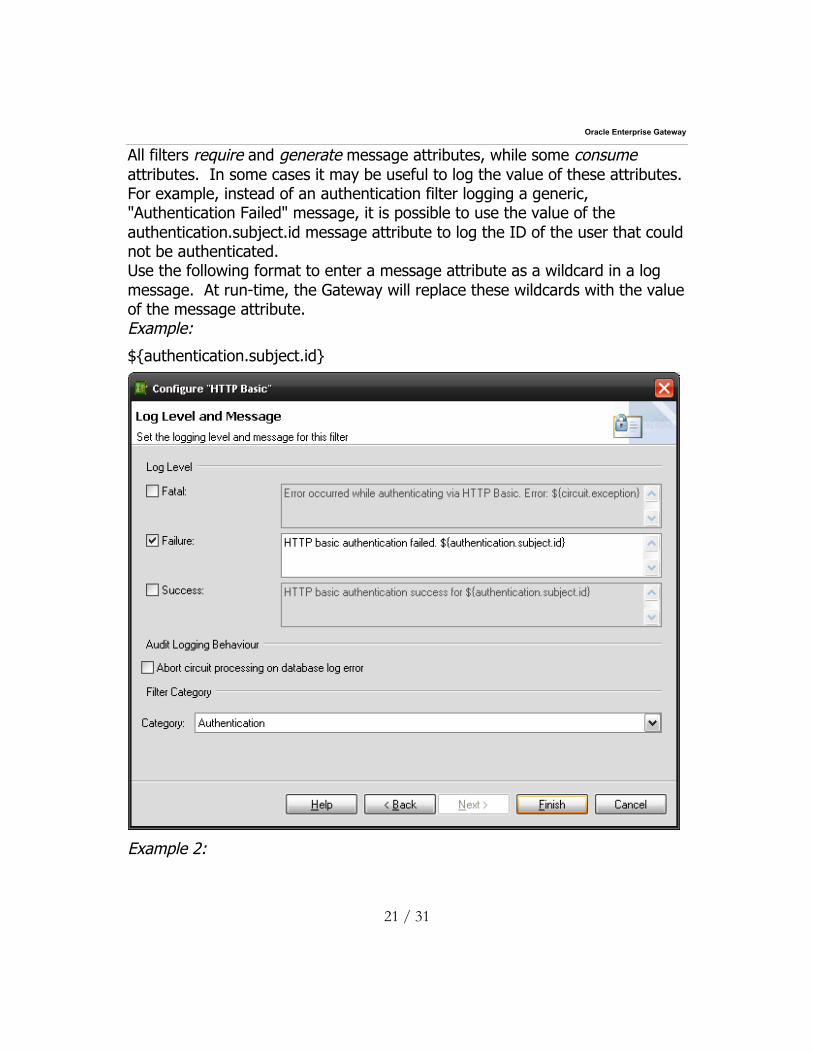
Configuration of Log Levels:
The Log Level and Message configuration screen is available by clicking the Next button on the main screens of all filters in Policy Studio. As stated earlier, it is possible to log messages when the filter succeeds, fails, and/or aborts (fatal). Select the Success, Failure, and/or Fatal checkbox(es) to configure the filter to log at the respective level(s). Default values are provided at each level for all filters. Simply check the checkbox for a particular level to use the default log message for that level. It is possible to specify an alternative log message by entering the message into the text field provided.
Oracle Enterprise Gateway
21 / 31
All filters require and generate message attributes, while some consume attributes. In some cases it may be useful to log the value of these attributes. For example, instead of an authentication filter logging a generic, "Authentication Failed" message, it is possible to use the value of the authentication.subject.id message attribute to log the ID of the user that could not be authenticated. Use the following format to enter a message attribute as a wildcard in a log message. At run-time, the Gateway will replace these wildcards with the value of the message attribute. Example:
${authentication.subject.id}
Example 2:
Oracle Enterprise Gateway
22 / 31
For example, to make sure the ID of a non-authenticated user is logged in the message, enter something like the following in the text field for the Failure case:
The user '${authentication.subject.id}' could not be authenticated. Now if a user with ID "vordel" cannot be authenticated by the Gateway (i.e. a "fail" case), the following message will be logged: The user 'vordel' could not be authenticated.
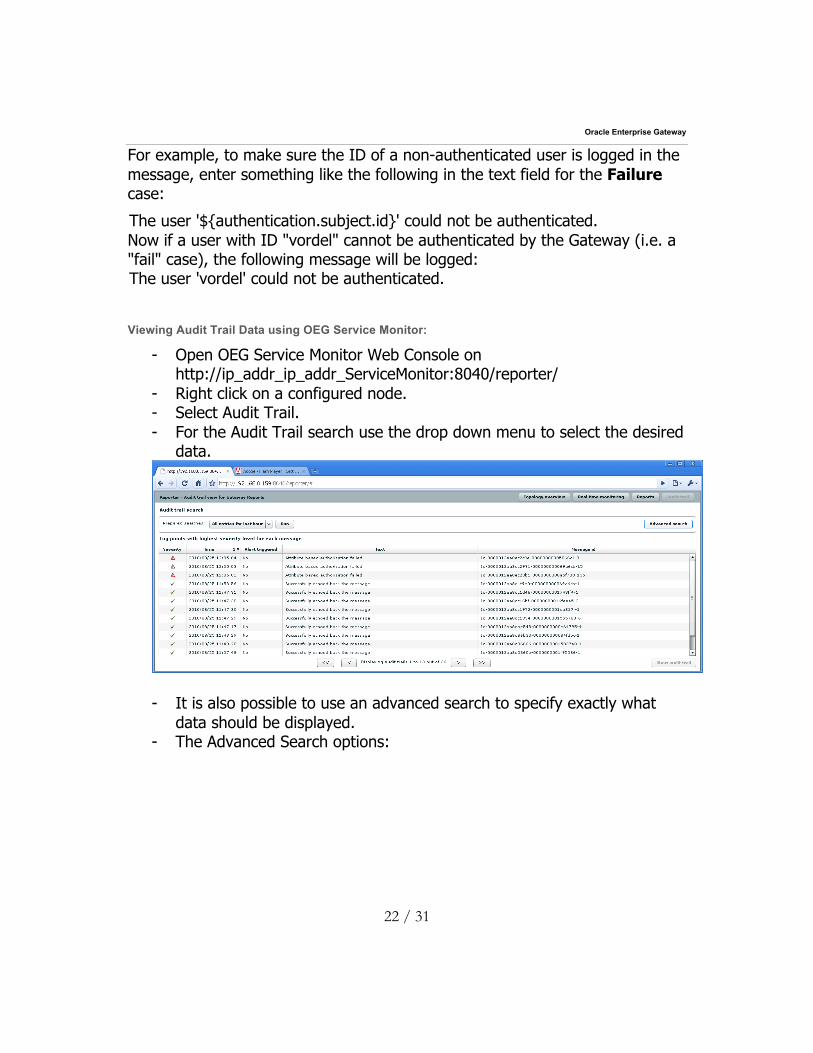
Viewing Audit Trail Data using OEG Service Monitor:
- Open OEG Service Monitor Web Console on http://ip_addr_ip_addr_ServiceMonitor:8040/reporter/
- Right click on a configured node. - Select Audit Trail. - For the Audit Trail search use the drop down menu to select the desired
data.
- It is also possible to use an advanced search to specify exactly what
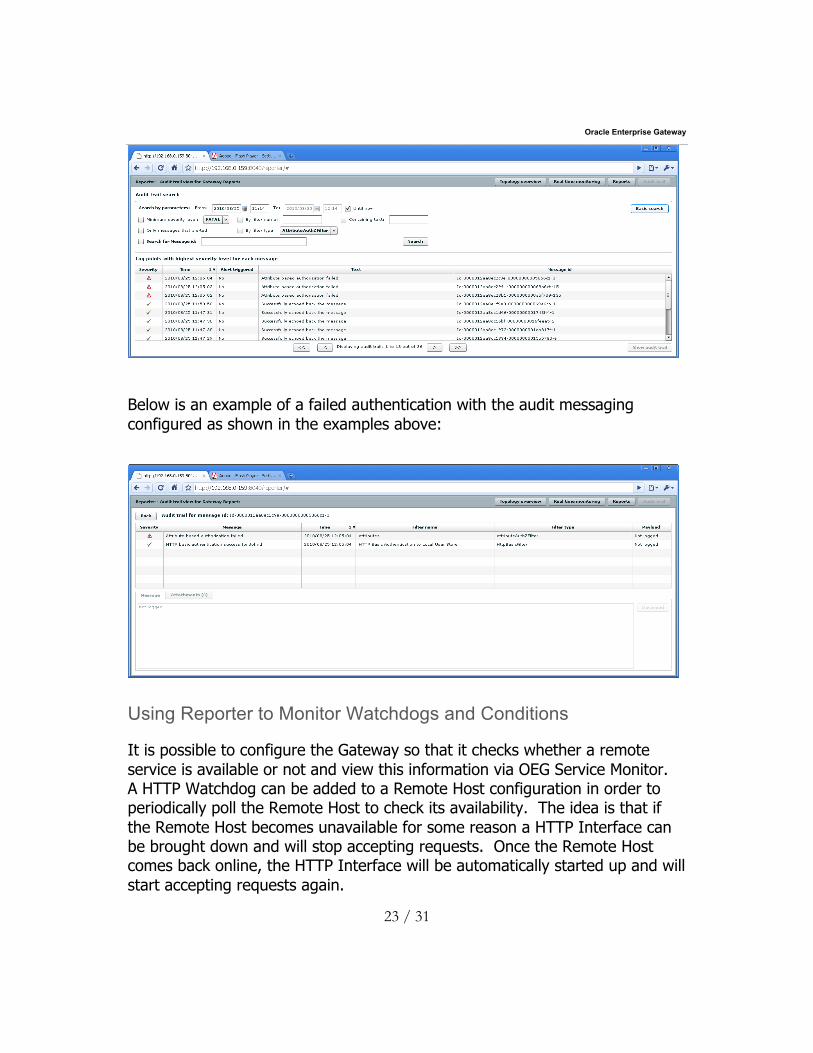
data should be displayed. - The Advanced Search options:
Oracle Enterprise Gateway
23 / 31
Below is an example of a failed authentication with the audit messaging configured as shown in the examples above:
Using Reporter to Monitor Watchdogs and Conditions
It is possible to configure the Gateway so that it checks whether a remote service is available or not and view this information via OEG Service Monitor. A HTTP Watchdog can be added to a Remote Host configuration in order to periodically poll the Remote Host to check its availability. The idea is that if the Remote Host becomes unavailable for some reason a HTTP Interface can be brought down and will stop accepting requests. Once the Remote Host comes back online, the HTTP Interface will be automatically started up and will start accepting requests again.

Oracle Enterprise Gateway
24 / 31
This information can be viewed via the Reporter as Real Time Data and as a static Report.
Configuring a HTTP Watchdog:
- Open ‘Policy Studio’.
- To add a Remote Host, expand the Processes tree view of Policy Studio and right-click on OEG Gateway. Select Add Remote Host.
Host name: Enter the Remote Host Name
Port: Enter the Remote Host Port (default is 80)
- Right-click on a previously configured Remote Host in the tree view of the Policy Studio.
- Select the Watchdog -> Add menu option. Configure the following sections on the Configure HTTP Watchdog dialog.
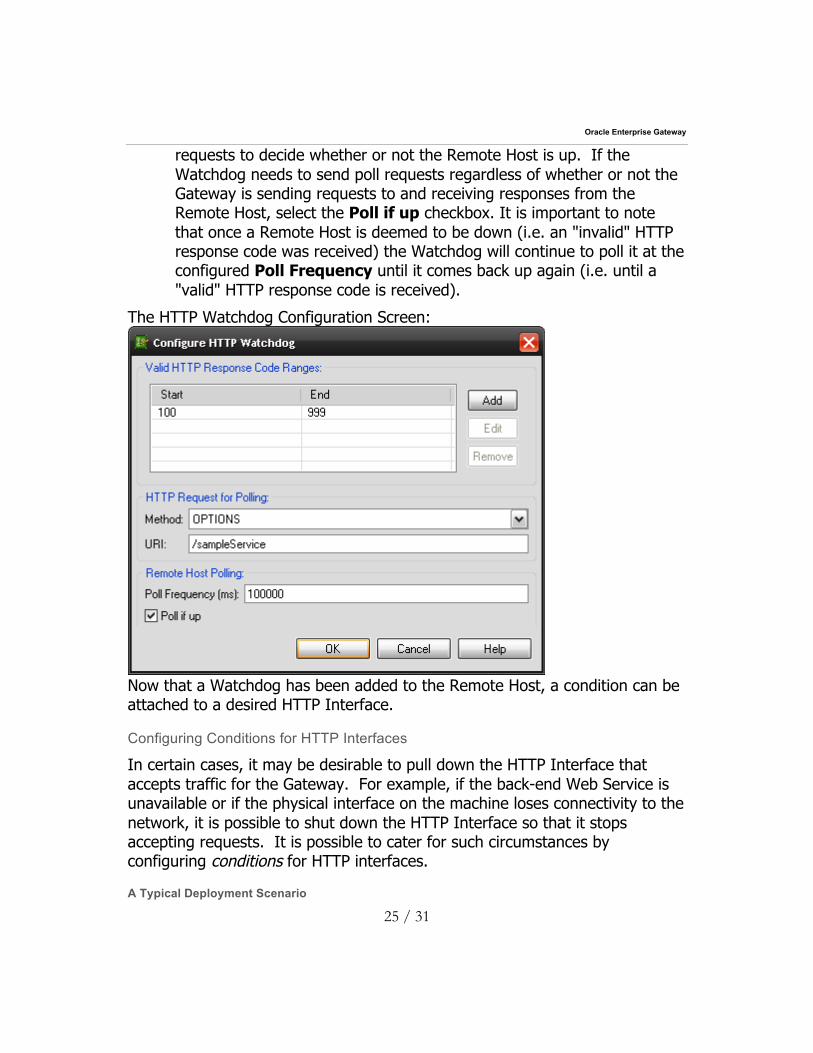
- Valid HTTP Response Code Ranges: This specifies the HTTP response codes that will be regarded as proof that the Remote Host is available. For example, if a 200 OK HTTP response is received for the poll request, the Remote Host can be considered available. To specify a range of HTTP status codes, click the Add button and enter the Start and End of the range of HTTP response codes in the fields provided. An exact response code can be specified by entering the response code in both fields, e.g. "200".
- HTTP Request for Polling: This allows the configuration for the type and URI of the HTTP request to use to poll the Remote Host with. The default option is to use the Options HTTP command with a URI of "*", which is typically used to retrieve status information about the HTTP server. If an alternative HTTP request method is desired to poll the Remote Host, select a HTTP request method from the Method dropdown and then specify the URI to use in the URI field.
- Remote Host Polling: This determines when and how the HTTP Watchdog polls the Remote Host. The Poll Frequency determines how often the Watchdog is to send the polling request to the Remote Host. By default, the Watchdog uses "real" HTTP requests to the Remote Host to determine its availability. In other words, if the Gateway is sending a batch of requests to the Remote Host it will use the response codes from these
Oracle Enterprise Gateway
25 / 31
requests to decide whether or not the Remote Host is up. If the Watchdog needs to send poll requests regardless of whether or not the Gateway is sending requests to and receiving responses from the Remote Host, select the Poll if up checkbox. It is important to note that once a Remote Host is deemed to be down (i.e. an "invalid" HTTP response code was received) the Watchdog will continue to poll it at the configured Poll Frequency until it comes back up again (i.e. until a "valid" HTTP response code is received).
The HTTP Watchdog Configuration Screen:
Now that a Watchdog has been added to the Remote Host, a condition can be attached to a desired HTTP Interface.
Configuring Conditions for HTTP Interfaces
In certain cases, it may be desirable to pull down the HTTP Interface that accepts traffic for the Gateway. For example, if the back-end Web Service is unavailable or if the physical interface on the machine loses connectivity to the network, it is possible to shut down the HTTP Interface so that it stops accepting requests. It is possible to cater for such circumstances by configuring conditions for HTTP interfaces.
A Typical Deployment Scenario
Oracle Enterprise Gateway
26 / 31
It may be desirable to configure conditions in the following typical deployment scenario:
- A load balancer sits in front of several running instances of the Gateway and round-robins requests between them all.
- A client sends SSL requests through the load balancer, which forwards them opaquely to one of the Gateway instances.
- The Gateway terminates the SSL connection, processes the message with the configured policy, and forwards the request on to the back-end Web Service.
In this deployment scenario, the load balancer does not want to keep sending requests to an instance of the Gateway if it has either lost connectivity to the network or if the back-end Web Service is unavailable. If either of these conditions holds, the load balancer should stop attempting to route requests through this instance of the Gateway and use the other instances instead. So then, how can the load balancer determine the availability of the Web Service and also the connectivity of the machine hosting the Gateway to the network on which the Web Service resides? Given that the request from the client to the Gateway is over SSL, the load balancer has no way of decrypting the encrypted SSL data to determine whether or not a SOAP Fault, for example, has been returned from the Gateway to indicate a connection failure. The solution is to configure certain conditions for each HTTP Interface, which must hold in order for the HTTP Interface to remain available and accept requests. If any of the associated conditions fail, the Interface will be brought down and will not accept any more requests until the failed condition becomes true and the HTTP Interface is restarted. Once the load balancer receives a connection failure from the Gateway (which it will when the HTTP Interface is down) it will stop sending requests to this Gateway and will choose to round-robin requests amongst the other instances instead.
Types of Conditions
The following conditions can be configured on the HTTP Interface: Requires Endpoint: The HTTP Interface will remain up only if the Remote Host is available. The Remote Host is polled periodically to determine availability so that the HTTP Interface can be brought back up automatically when the Remote Host becomes available again. Requires Link:

Oracle Enterprise Gateway
27 / 31
The HTTP Interface will remain up only if a named physical interface has connectivity to the network. As soon as a "down" physical interface regains connectivity, the HTTP Interface will automatically come back up again.
Adding a Condition to a HTTP Interface:
Conditions can be configured for a HTTP Interface by completing the following steps:
- Right clicking on the HTTP Interface (e.g. "*:8080") node under Processes -> Default Services node in the Processes tree view of Policy Studio.
- Select the Add Condition menu option and then either the Requires Endpoint or Requires Link option depending on your requirements.
- The sections below describe how to configure these conditions.
Requires Endpoint Condition:
A Requires Endpoint Condition can be configured in cases where you only want to keep the HTTP Interface up if the back end Web Service (i.e. the Remote Host) is available. A HTTP Watchdog can be configured for the Remote Host, which is then responsible for polling the Remote Host periodically to ensure that the Web Service is available. Take a look at the Remote Hosts and Configuring HTTP Watchdogs help pages for more information. Remote Host:
The HTTP Interface will be shut down if the Remote Host selected here is deemed to be unavailable. The Remote Host can be continuously polled so that the Interface can be brought up again when the Remote Host becomes available again.
Requires Link Condition:
The Requires Link Condition is used to bring down the HTTP Interface if a named physical network interface is no longer connected to the network. For example, if the cable is removed from the Ethernet switch, the dependent HTTP Interface will be brought down immediately. The HTTP Interface will only start listening again once the physical interface is connected to the network again (i.e. when the Ethernet cable is plugged back in).
Oracle Enterprise Gateway
28 / 31
Note: The Requires Link Condition is only available on Linux and Solaris platforms. Interface Name:
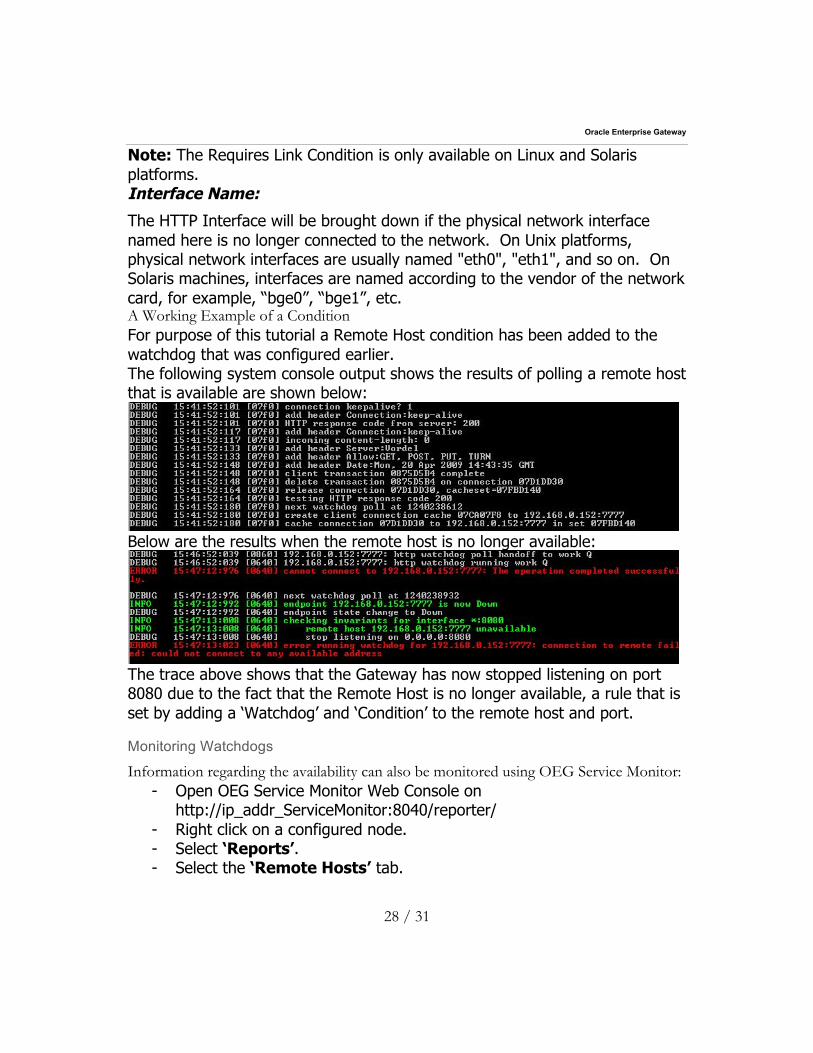
The HTTP Interface will be brought down if the physical network interface named here is no longer connected to the network. On Unix platforms, physical network interfaces are usually named "eth0", "eth1", and so on. On Solaris machines, interfaces are named according to the vendor of the network card, for example, “bge0”, “bge1”, etc. A Working Example of a Condition For purpose of this tutorial a Remote Host condition has been added to the watchdog that was configured earlier. The following system console output shows the results of polling a remote host that is available are shown below:
Below are the results when the remote host is no longer available:
The trace above shows that the Gateway has now stopped listening on port 8080 due to the fact that the Remote Host is no longer available, a rule that is set by adding a ‘Watchdog’ and ‘Condition’ to the remote host and port.
Monitoring Watchdogs
Information regarding the availability can also be monitored using OEG Service Monitor: - Open OEG Service Monitor Web Console on
http://ip_addr_ServiceMonitor:8040/reporter/ - Right click on a configured node. - Select ‘Reports’. - Select the ‘Remote Hosts’ tab.

Oracle Enterprise Gateway
29 / 31
- Select the Remote Host in the list that has been configured with a ‘Watchdog’.
- Select ‘Aggregated Metrics’ and click ‘View Report’ - This will show successful and failed hits to the remote service and give
an overview of when the remote host was not available or when it became available again as shown below:
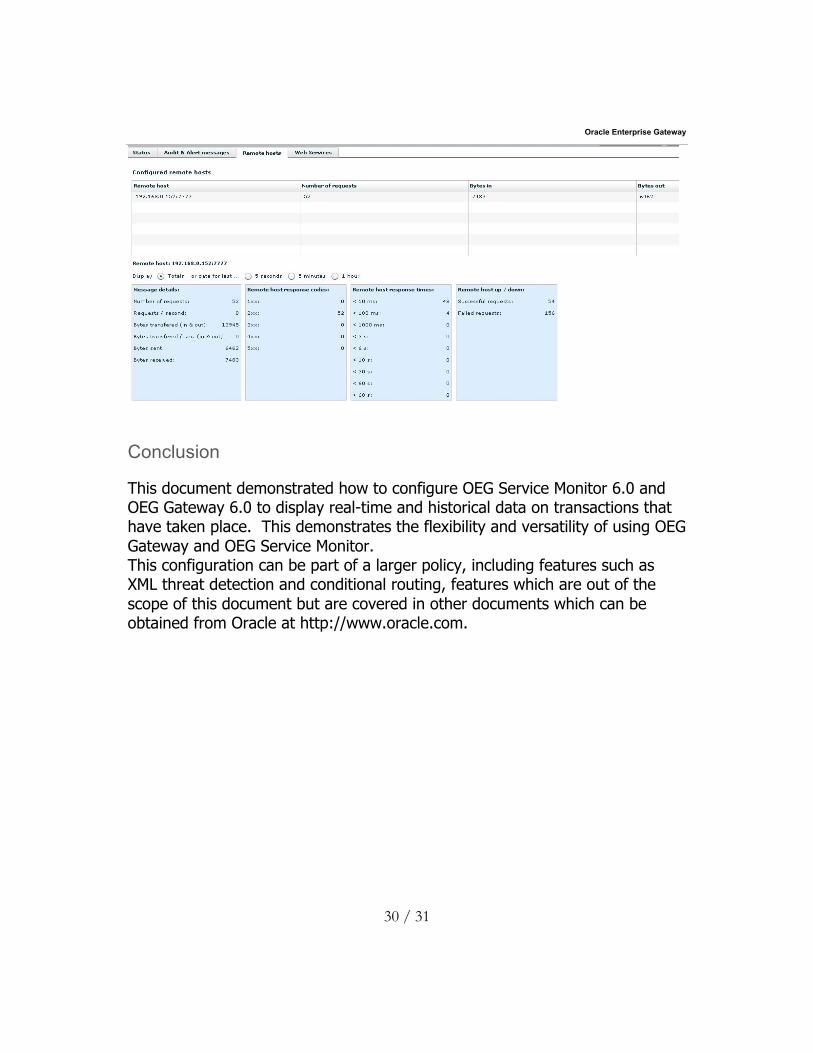
Monitoring Remote Hosts
To view real time data regarding configured remote hosts: - Open OEG Service Monitor Web Console on
http://ip_addr_ServiceMonitor:8040/reporter/ - Right click on a configured node. - Select ‘Real Time Monitoring’. - Click on the ‘Remote Hosts’ tab. - This screen will show all configured Remote Hosts in the list with
information on that particular Remote Host as shown below. The tables will display all successful and failed request information.
Oracle Enterprise Gateway
30 / 31
Conclusion
This document demonstrated how to configure OEG Service Monitor 6.0 and OEG Gateway 6.0 to display real-time and historical data on transactions that have taken place. This demonstrates the flexibility and versatility of using OEG Gateway and OEG Service Monitor. This configuration can be part of a larger policy, including features such as XML threat detection and conditional routing, features which are out of the scope of this document but are covered in other documents which can be obtained from Oracle at http://www.oracle.com.
Oracle Enterprise Gateway
31 / 31
\
Oracle Enterprise Gateway May 2011 Author: Oracle Corporation World Headquarters 500 Oracle Parkway Redwood Shores, CA 94065 U.S.A. Worldwide Inquiries: Phone: +1.650.506.7000 Fax: +1.650.506.7200 oracle.com
Copyright © 2011, Oracle and/or its affiliates. All rights reserved. This document is provided for information purposes only and the contents hereof are subject to change without notice. This document is not warranted to be error-free, nor subject to any other warranties or conditions, whether expressed orally or implied in law, including implied warranties and conditions of merchantability or fitness for a particular purpose. We specifically disclaim any liability with respect to this document and no contractual obligations are formed either directly or indirectly by this document. This document may not be reproduced or transmitted in any form or by any means, electronic or mechanical, for any purpose, without our prior written permission. Oracle and Java are registered trademarks of Oracle and/or its affiliates. Other names may be trademarks of their respective owners. AMD, Opteron, the AMD logo, and the AMD Opteron logo are trademarks or registered trademarks of Advanced Micro Devices. Intel and Intel Xeon are trademarks or registered trademarks of Intel Corporation. All SPARC trademarks are used under license and are trademarks or registered trademarks of SPARC International, Inc. UNIX is a registered trademark licensed through X/Open Company, Ltd. 0410


