40
Best Practices Recommendations on Sustainability Reporting September 2011 European Public Real Estate Association REPORTING

Best Practices Recommendations on Sustainability Reporting September 2011
European Public Real Estate Association
REPORTING

EPRA Sustainability Reporting Committee
Committee members:
Olivier Elamine, Alstria
Sanderpaul Van Tongeren, APG
Justin Snoxall, British Land
Malin Eengelbrecht, Castellum
Kirsi Borg, Citycon
Gareth Lewis, EPRA
Paul Edwards, Hammerson
Warren Austin, Hammerson (Chairman)
Hans Veld, PGGM
Claudine Blamey, SEGRO
François Cantin, Unibail-Rodamco
Joost Bomhoff, Unibail-Rodamco
For any questions or feedback related to this survey, please contact:
Gareth LewisDirector of Finance
EPRASquare de Meeus 23B-1000 BrusselsBelgium
Email: [email protected]+32 (0)2 739 1010
Table of contents
1. Introduction 5
2. Executive Summary 6
2.1 Introduction 6
2.2 Scope of EPRA BPR 6
2.3 EPRA Sustainability Performance Measures 7
2.4 Overarching Recommendations 8
3. EPRA Sustainability Performance Measures 10
3.1 Total energy consumption from electricity 10
3.2 Total energy consumption from district heating and cooling 11
3.3 Total energy consumption from fuels 13
3.4 Building energy intensity 14
3.5 Total direct greenhouse gas (GHG) emissions 16
3.6 Total indirect greenhouse gas (GHG) emissions 17
3.7 Greenhouse gas intensity from building energy 18
3.8 Total water withdrawal by source 20
3.9 Building water intensity 22
3.10 Total weight of waste by disposal route 23
3.11 Proportion of waste by disposal route 24
4. Overarching Recommendations 26
4.1 Organisational boundaries 26
4.2 Boundaries – Reporting on landlord and tenant consumption 27
4.3 Analysis - Normalisation 28
BEST PRAcTIcES REcOMMENdATIONS ON SuSTAINABIlITy REPORTING

REPORTING
4.4 Analysis - Like-for-like approach for absolute
Sustainability Performance Measures 29
4.5 Analysis - Segmental analysis (by property type, geography) 30
4.6 Analysis – Narrative on performance 31
4.7 Location of EPRA Sustainability Performance Measures
in companies’ reports 32
5. Other issues to consider 34
5.1 Transport 34
5.2 Refrigerant gases 34
5.3 Financial indicators related to sustainability performance 34
5.4 Assurance 35
6. Definitions - Glossary of Terms 36
6.1 General 36
6.2 Energy 36
6.3 Carbon 37
6.4 Water 38
6.5 Waste 38
6.6 Financial 38
4
1. Introduction We are pleased to publish the first edition of EPRA Best Practices Recommendations on Sus-tainability Reporting. The practice of voluntary sustainability reporting has become increas-ingly common in the European real estate sector – particularly among larger listed real estate companies. An area of growing European Union and national policy debate over the past year, however, has been the introduction of mandatory sustainability reporting regulation.
It is EPRA’s role as a trade body representing listed companies in the real estate sector to prepare our members for the likely introduction of more stringent mandatory sustainability reporting regulations, which are already in place in a number of European countries such as France and Denmark. We therefore embarked on a programme to develop EPRA Best Practices Recommendations on Sustainability Reporting – building upon relevant mandatory reporting requirements and voluntary initiatives, in particular the Global Reporting Initiative’s Con-struction and Real Estate Sector Supplement (GRI CRESS)1 which we will refer to throughout this document.
EPRA Sustainability BPR complement and, where applicable, cross reference the existing and well established EPRA Financial BPR2 which, over the years, have become a widely recogn-ised source of guidance on financial reporting by the European real estate industry. It is our hope that with the introduction of Sustainability BPR the bar will be raised in terms of sustain-ability disclosure, and not just among the largest listed companies. The first edition of the Sus-tainability BPR intentionally focuses only on environmental issues as these were identified as currently the most relevant and material to the sector in a review by the EPRA Sustainability Reporting Committee. Future editions may incorporate social indicators as we seek to reflect emerging consensus on sustainability performance measurement.
Throughout this document we have sought to be as clear as possible when explaining issues and using technical terminology. It is not our intention to add to the burden of reporting for companies. Rather, we hope that the process of reporting will facilitate a greater understand-ing of the environmental impacts of your companies and the opportunities to reduce operat-ing costs through efficiency.
To encourage knowledge sharing and reward best practice, we will be introducing an annual Sustainability BPR Award in 2012 to recognise the efforts of those companies who adopt the BPR and innovate in their measurement and reporting of performance.
Warren AustinGroup Financial Controller, Hammerson plcChairman, EPRA Sustainability Reporting CommitteeJune 2011
1 EPRA Sustainability Performance Measures also align with those identified by the Green Property Alliance (a uK focused real estate industry initiative). Please visit http://www.bpf.org.uk/en/files/bpf_documents/common_Metrics_Paper_FINAl.pdf to download Green Property Alliance report ‘Establishing the Ground Rules for Property’.
2 http://www.epra.com/media/EPRA_2010_BPR.pdf
BEST PRAcTIcES REcOMMENdATIONS ON SuSTAINABIlITy REPORTING
5

REPORTING
2. Executive Summary
2.1 Introduction
The Sustainability Performance Measures and accompanying principles which underpin EPRA Sustainability BPR have been developed by the EPRA Sustainability Reporting Committee (‘the Committee”) in consultation with the wider EPRA membership. These measures are based on the GRI Construction and Real Estate Sector Supplement (CRESS).
This document contains a number of CORE recommendations for sustainability reporting which should be reported by all EPRA members, alongside ADDITIONAL recommendations which are based on the Committee’s observations of good practice. These additional indicators are especially relevant to companies with a long standing track record of sustainability report-ing. Throughout this BPR document, core recommendations will be clearly stated and addi-tional recommendations will be outlined for members to consider in their reporting (either now, or in the future).
2.2 Scope of EPRA BPR
The scope of the sustainability BPR covers companies’ investment activities and own occupa-tion3 (e.g. environmental impacts from a company’s head quarters) as shown in head quar-ters.
Figure 1 – Activities within the scope of EPRA Sustainability BPR
development activities (construction)
Property investment portfolio (existing
buildings in operation)
company’s own office occupation (e.g. Head Office)
EPR
A S
usta
inab
ility
BPR
The EPRA BPR do not cover real estate development activities (e.g. environmental impacts from construction sites)4.
3 companies’ own occupation environmental impacts (energy, water etc) should be itemised when reported as part of EPRA indicators. They should not be mixed together with consumption from investment portfolios.
4 Should companies choose to report separately on their development activities in their sustainability reports, EPRA recom-mends that they consult the relevant sections of the GRI cRESS.
6

2.3 EPRA Sustainability Performance Measures
The EPRA Sustainability Performance Measures5 should relate to the BPR scope as shown in Figure 1.
Table 1 (Absolute measures) and Table 2 (Intensity measures) below outline the performance measures which EPRA has identified as core measures and which should be reported by EPRA members where data is available. Intensity and absolute metrics are complementary but dis-tinct and are used by stakeholders for different purposes.
Absolute utility consumption and waste production in the reporting year represent measures of the company’s exposure to risk (including regulatory risks, such as the CRC Energy Effi-ciency Scheme in the UK) as well as indicating the company’s impact on the environment (i.e. environmental footprint). Table 1 - EPRA Sustainability Performance Measures – Absolute Measures
Broad Issue Type Sustainability Performance Measure Units of measurement
Energy
Total energy consumption from electricity [GRI: EN4] kWh
Total energy consumption from district heating and cooling [GRI: EN4]
kWh
Total energy consumption from fuels [GRI: EN3] kWh
Greenhouse gas emissionsTotal direct GHG emissions [GRI: EN16] metric tonnes cO2e
Total indirect GHG emissions [GRI: EN16] metric tonnes cO2e
Water Total water withdrawal by source [GRI: EN8] cubic metres (m3)
WasteTotal weight of waste by disposal route [GRI: EN22] metric tonnes
Percentage of waste by disposal route proportion by weight (%)
Intensity indicators enable companies to compare the relative efficiency of different portfolios and over time. Intensity indicators also allow for changes over time to reflect acquisitions, disposals and developments/major refurbishments, without the need to exclude any proper-ties from aggregation in any year.
Table 2 - EPRA Sustainability Performance Measures – Intensity Measures
Broad Issue Type Sustainability Performance Measure Intensity Indicator
Energy Building energy intensity [GRI: cRESS – cRE1]kWh / m2 / year kWh / person / year
Greenhouse gas emissionsGreenhouse gas intensity from building energy [GRI: cRESS – cRE3]
kg cO2e / m2 / year kg cO2e / person / year
Water Building water intensity [GRI: cRESS - cRE2]m3 / m2 / year litres / person / day
5 EPRA Sustainability Performance Measures are broadly based on GRI cRESS indicators, hence reference to the GRI cRESS indicators is used throughout the BPR.
BEST PRAcTIcES REcOMMENdATIONS ON SuSTAINABIlITy REPORTING
7
Executive Summary
REPORTING
2.4 Overarching Recommendations
Section 4 of this document provides ‘Overarching Recommendations’ – principles which should apply to the reporting of EPRA Sustainability Performance Measures. The following section briefly describes each of these principles. It is important that readers of this document familiarise themselves with Section 4 in detail before embarking on reporting on EPRA Sus-tainability Performance Measures since these principles underpin good quality disclosure.
Organisational boundaries (for full overarching recommendations, see section 4.1)
Organisational boundaries as defined by the GHG Protocol include Operational Control, Financial Control and Equity-share. Boundaries definition is important because it determines, amongst other things, which assets a reporter will include or exclude from its reporting. Defin-ing organisational boundaries should be preceded by defining one’s ownership structures (specifically, establishing whether assets are owned by subsidiaries, associates or joint ven-tures), in line with the GHG Protocol6. EPRA is not advocating at this stage for any specific organisational boundary (the Committee is aware that operational control is the preferred approach, whilst the financial approach is favoured by some of the national regulators – e.g. DEFRA in the UK).
Landlord and tenant consumption arrangements (for full overarching recommendations, see section 4.2)
There is no single, optimal way to report on base (landlord only) or whole building consump-tion. However, as a general rule, companies should report as follows:
Absolute consumption should only contain landlord-obtained• 7 energy/water.Where energy/water is obtained by the landlord but consumed in tenant areas, and sub-•metered – such consumption should be reported separately (but should not be excluded from the absolute totals).For the purposes of intensity indicators • only, if known, tenant-obtained consumption can be used in calculations, e.g. to achieve a situation where whole building consumption (tenant-obtained and landlord-obtained) is divided by the whole building floor area.
Intensity normalisation (for full overarching recommendations, see section 4.3)
Intensity indicators are discussed in detail as part of the individual EPRA Sustainability Per-formance Measures, Companies should ensure that the type of floor area and the associated consumption figures are as closely aligned as possible in their coverage of the building’s areas i.e. they should strive to achieve the ‘matching numerator and denominator’ scenario. As a minimum, companies should clearly state how their intensity indicators are calculated and what numerators and denominators have been used and why. Companies should be aware that intensity indicators are primarily intended to track changes over time for the reporters’ assets.
Outlined below are suggested types of floor area to be used while calculating intensity indica-tors – these suggestions are based on current best practice:
Normalisation per square metre of floor area•6 Please visit http://www.ghgprotocol.org/ for further information.7 landlord-obtained energy covers both that purchased (e.g. from the grid) and produced (e.g. onsite).
8

Coverage of known consumption data Suggested floor area denominator
If energy/water is supplied to common areas only common parts area
If landlord shared services, such as HVAC, are sup-plied to tenant demises but tenant-obtained energy is unknown
companies should state which floor area has been used where this applies – be it common parts area only or common parts plus lettable area, acknowledging that the intensity indicator is affected due to the mismatch between numerator and denominator
If energy/water consumption known for whole build-ing (even including tenant-obtained if applicable)
Whole building floor area (for example, net lettable area)
Normalisation per person•Property type Suggested person denominator
Office Number of workstations
Retail Number of visits per annum
Year-on-year like-for-like comparison (for full overarching recommendations, see section 4.4)
EPRA’s definition of ‘like-for-like’ in sustainability reporting is broadly in line with its financial BPRs and is as follows: a like-for-like portfolio is one that has been consistently in operation, and not under development, during the two full preceding periods that are described. Build-ings with a high variation in vacant rates should be included in the ‘like-for-like’ portfolios.
Segmental analysis (by property type, geography) (for full overarching recommendations, see section 4.5)
This should be in line with companies’ financial reporting, and include, where appropriate, analysis by regions of operations and property types.
Narrative on performance (for full overarching recommendations, see section 4.6)
Companies should provide, where appropriate, additional information and commentary/ explanation of their past performance, and outline their view on/plans for managing their future performance. Adjustments to the totals are not allowed simply based on the ‘special circumstances’ (weather patterns, age of building, etc.) although such factors can help explain the environmental performance of the buildings.
Location of EPRA Sustainability Performance Measures in companies’ reports (for full overarch-ing recommendations, see section 4.7)
Companies should report in detail on EPRA Sustainability Performance Measures in their annual Sustainability/Corporate Responsibility reports and clearly label EPRA measures as such. Additionally, companies should, as a minimum, include a summary table of EPRA Sus-tainability Performance Measures in their financial reports (Annual Report & Accounts). EPRA Performance Measures in the Annual Report & Accounts should be referenced to, and clearly identified within any published Sustainability Report. n
BEST PRAcTIcES REcOMMENdATIONS ON SuSTAINABIlITy REPORTING
9
Executive Summary

REPORTING
3. EPRA Sustainability Performance Measures
3.1 Total energy consumption from electricity - annual kWh
Issue:According to the United Nations Environment Programme Sustainable Buildings & Climate Ini-tiative8, 40% of global energy use comes from buildings. Electricity consumption represents a major source of organisations’ energy footprint and it is important to ensure consistent report-ing of this indicator in order for companies to improve their energy efficiency. Electricity is classified as indirect energy, as its primary fuels are combusted offsite.
Rationale:Reporting total energy consumption (such as purchased electricity) should encourage an investment property company to measure and manage its greenhouse gas emissions. The use of electricity should therefore be managed in a way that would drive down consumption on a like-for-like basis over time.
This indicator enables calculations of an electricity-related element of indirect greenhouse gas emissions which fall under Scope 2 of the WRI/WBCSD GHG Protocol9.
Recommendation:This indicator refers to the total amount of electricity used from indirect non-renewable sources and indirect renewable sources, in terms of electricity (‘indirect’ meaning that elec-tricity is generated off site and would most often be bought from the energy supplier).
cORE This indicator should be calculated as follows (based on GRI Indicator Protocol EN4):
Identify the amount of electricity purchased and consumed from indirect • non-renewable sources external to the reporting company. Identify the amount of electricity purchased and consumed from indirect • renewable sources external to the reporting company, such as:
Solar -Wind -Geothermal -Hydro energy -Biomass-based intermediate energy -Hydrogen-based intermediate energy -
Based on the two steps above, report total electricity consumption by indirect non-•renewable sources and indirect renewable sources.This Sustainability Performance Measure should be reported by meaningful segmenta-•tion, for example: portfolio, fund, location, asset type.Reporting on landlord and tenant consumption:•
clearly state if the landlord supplies electricity to common (i.e. landlord-controlled) -parts. Where electricity is supplied by the landlord to the common parts and tenant areas, -clearly state what is being reported (landlord consumption / base building only or whole building i.e. landlord & tenant) and why.Report on company’s own office occupation separately. -Please refer to Section 4.2 for further guidance. -
8 www.unepsbci.org9 http://www.ghgprotocol.org/files/ghgp/public/ghg-protocol-revised.pdf
10
AddITIONAl Companies should be aware that the GRI EN4 indicator not only requests companies to report on their electricity consumption at the point of use, but also corresponding primary energy required to produce the electricity used by the reporter.
EPRA does not currently consider the amount of primary energy used to produce electricity consumed by the reporter as a compulsory element of this Performance Measure, however, for those companies who are able to report this element, the following guidance will be of use:
To estimate the fuels consumed to produce purchased electricity, reporters can use •either:
Fuel consumption data acquired from the energy provider if these data are avail- -able.default data for electricity as provided by the recognised international bodies/initia- -tives such as the Intergovernmental Panel on climate change (IPcc).Estimations where default figures are not available, however, estimation assumptions -should be clearly outlined.
companies should be aware that the GRI also requests companies to report on electricity •produced on site and/or sold. If companies have on site renewable energy generation facilities, they can report on renewable electricity generation as follows:
Identify and report on electricity - produced (including extracting, harvesting, collect-ing, or converting it from other forms of energy) and sold (i.e. electricity exported outside the reporting boundary). Example technologies include roof-mounted photo-voltaic panels, wind turbines.For further guidance please refer to the GRI cRESS sections covering - EN3. Direct energy consumption by primary energy source.
Further guidance:Please refer to relevant GRI CRESS sections covering EN4. Indirect energy consumption by primary energy source.
Applying Overarching Recommendations:Companies should refer to Section 4 in reporting against the performance measure: Total energy consumption from electricity.
3.2 Total energy consumption from district heating and cooling - annual kWh
Issue:Although electricity and gas are often the only significant forms of indirect and direct energy for many companies, certain regions and countries may use other intermediate energy such as steam or chilled water provided from a district heating plant or chilled water plant. The availability of robust data to the users of district heating / cooling often presents a challenge and so does the accuracy of data specifying the primary energy used for production of district heating/ cooling.
Rationale:The total energy consumption from purchased heat or steam should encourage an investment property company to identify and manage its greenhouse gas emissions. The use of heat or steam should therefore be managed in a way that would drive down consumption on a like-for-like basis over time.
This indicator enables calculation of a district heating/cooling-related element of indirect greenhouse gas emissions which fall under Scope 2 of the WRI/WBCSD GHG Protocol10.
10 http://www.ghgprotocol.org/files/ghgp/public/ghg-protocol-revised.pdf
BEST PRAcTIcES REcOMMENdATIONS ON SuSTAINABIlITy REPORTING
11
EPRA Sustainability Performance Measures
REPORTING
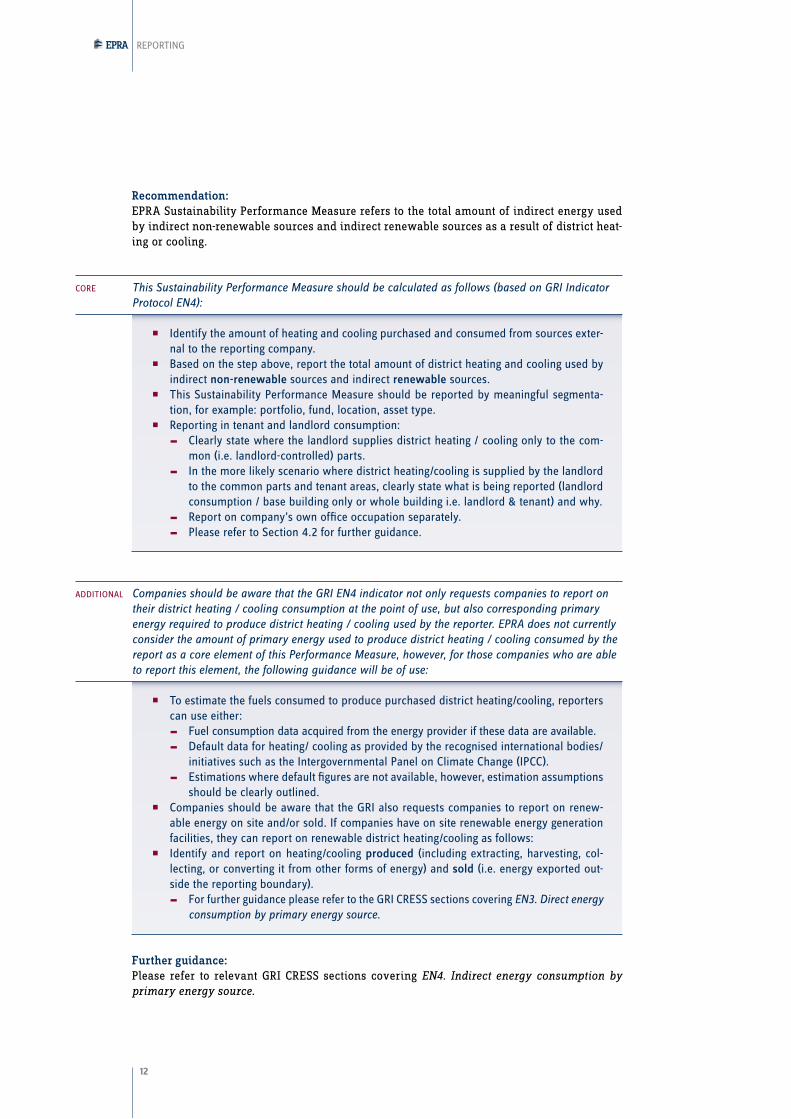
Recommendation:EPRA Sustainability Performance Measure refers to the total amount of indirect energy used by indirect non-renewable sources and indirect renewable sources as a result of district heat-ing or cooling.
cORE This Sustainability Performance Measure should be calculated as follows (based on GRI Indicator Protocol EN4):
Identify the amount of heating and cooling purchased and consumed from sources exter-•nal to the reporting company. Based on the step above, report the total amount of district heating and cooling used by •indirect non-renewable sources and indirect renewable sources. This Sustainability Performance Measure should be reported by meaningful segmenta-•tion, for example: portfolio, fund, location, asset type.Reporting in tenant and landlord consumption:•
clearly state where the landlord supplies district heating / cooling only to the com- -mon (i.e. landlord-controlled) parts.In the more likely scenario where district heating/cooling is supplied by the landlord -to the common parts and tenant areas, clearly state what is being reported (landlord consumption / base building only or whole building i.e. landlord & tenant) and why.Report on company’s own office occupation separately. -Please refer to Section 4.2 for further guidance. -
AddITIONAl Companies should be aware that the GRI EN4 indicator not only requests companies to report on their district heating / cooling consumption at the point of use, but also corresponding primary energy required to produce district heating / cooling used by the reporter. EPRA does not currently consider the amount of primary energy used to produce district heating / cooling consumed by the report as a core element of this Performance Measure, however, for those companies who are able to report this element, the following guidance will be of use:
To estimate the fuels consumed to produce purchased district heating/cooling, reporters •can use either:
Fuel consumption data acquired from the energy provider if these data are available. -default data for heating/ cooling as provided by the recognised international bodies/ -initiatives such as the Intergovernmental Panel on climate change (IPcc).Estimations where default figures are not available, however, estimation assumptions -should be clearly outlined.
companies should be aware that the GRI also requests companies to report on renew-•able energy on site and/or sold. If companies have on site renewable energy generation facilities, they can report on renewable district heating/cooling as follows: Identify and report on heating/cooling • produced (including extracting, harvesting, col-lecting, or converting it from other forms of energy) and sold (i.e. energy exported out-side the reporting boundary).
For further guidance please refer to the GRI cRESS sections covering - EN3. Direct energy consumption by primary energy source.
Further guidance:Please refer to relevant GRI CRESS sections covering EN4. Indirect energy consumption by primary energy source.
12

Applying Overarching Recommendations:Companies should refer to Section 4 in reporting against the performance measure Total energy consumption from district heating and cooling.
3.3 Total energy consumption from fuels - annual kWh
Issue:According to the United Nations Environment Programme Sustainable Buildings & Climate Initiative11, 40% of global energy use comes from buildings. Alongside electricity, fuels (such as natural gas) are one of the most widespread types of energy consumed in buildings. Gas is classified as direct energy, as it is burned onsite.
Rationale:Reporting total energy consumption from fuels (classified as direct energy) such as purchased natural gas should encourage an investment property company to identify and manage its greenhouse gas emissions. The use of fuels such as natural gas should therefore be managed in a way that would drive down fuel consumption on a like-for-like basis over time.
Recommendation:
cORE: This Sustainability Performance Measure should be calculated as follows (based on GRI Indicator Protocol EN3):
Identify and report fuels • purchased (consumption reported should be linked to metered or measured data). Reporters may itemise energy reallocated (preferably recharged according to metered consumption) to other parties who are the end users. Relevant fuels purchased by real estate companies include:
direct - non-renewable e.g. natural gas direct - renewable e.g. biofuel
This Sustainability Performance Measure should be reported by meaningful segmenta-•tion, for example: portfolio, fund, location, asset type.Reporting on tenant and landlord consumption:•
clearly state if the landlord supplies fuels (gas etc.) only to the common (i.e. landlord- -controlled) parts.In the more likely scenario where the landlord supplies fuels to the common parts -and tenant areas, clearly state what is being reported (landlord consumption/ base building only or whole building i.e. landlord & tenant) and why.Report on company’s own office occupation separately. -Please refer to Section 4.2 for further guidance. -
AddITIONAl: Companies should be aware that the GRI also requests companies to report on renewable fuels produced on site and/or sold. If companies have on site renewable energy generation facilities, they can report on renewable fuels as follows:
Identify and report on fuels • produced (including extracting, harvesting, collecting, or converting it from other forms of energy) and sold (i.e. energy exported outside the reporting boundary).
11 www.unepsbci.org
BEST PRAcTIcES REcOMMENdATIONS ON SuSTAINABIlITy REPORTING
13
EPRA Sustainability Performance Measures

REPORTING
Further guidance:Please refer to the relevant draft GRI CRESS sections covering EN3. Direct energy consumption by primary energy source.
Applying Overarching Recommendations:Companies should refer to Section 4 in reporting against the performance measure Total energy consumption from fuels.
3.4 Building energy intensity - kWh / m2 / year or kWh / person / year
Issue:Intensity indicators are widely used to report performance (alongside absolute values). How-ever, the variety of approaches used by companies to calculate intensity indicators represents a challenge for stakeholders to understand how to interpret data provided by reporters. Please refer to Section 4.3 of this document for a detailed explanation of the issues relating to the use of absolute metrics compared to intensity indicators.
Rationale:Building energy intensity is one of the most effective measures of a building’s overall energy efficiency during the occupation and operational phase of the building’s lifecycle and enables analysis of performance over time without the need to exclude acquired or sold properties. This indicator can be used for the energy intensity for both those buildings occupied by the reporter and those held in investment portfolios. Building energy intensity is primarily intended to track changes over time for the reporters’ assets.
Recommendation:
cORE: This Sustainability Performance Measure should be calculated (based on GRI Indicator Protocol CRE1) as the sum of energy consumption calculated for the three total energy EPRA Sustainability Performance Measures (electricity, gas and district heating and cooling), normalised using an appropriate denominator (floor area or numbers of people), as follows:
kWh / m2 / year Identify the number and type of buildings, total annual energy consumption (in kWh) and •corresponding floor area (in m2).calculate:•∑ (sum of) annual kWh energy consumption∑ (sum of) floor area (m2)
companies should decide on the most appropriate measure of floor area used in this Sus-tainability Performance Measure, clearly stating the rationale and calculation methodology. It is fairly common for a landlord to supply tenant areas with Heating Ventilation and Air conditioning (HVAc) services but not the rest of energy (i.e. tenants buy their own energy for lighting and small power supplies). In the absence of a standard approach, companies should include a note to state how they have treated buildings where this scenario applies, and what floor area they chose to apply to calculate intensity in such buildings.
14

Outlined below are suggested types of floor area to be used while calculating intensity indicators – these suggestions are based on current best practice: Coverage of known consumption data
Suggested floor area denominator
If energy supplied to common areas only common parts area
If landlord shared services, such as HVAC, are supplied to tenant demises but tenant-obtained energy is unknown*
companies should state which floor area has been used where this applies – be it common parts area only or common parts plus lettable area, acknowl-edging that the intensity indicator is affected due to the mismatch between numerator and denomina-tor. Where sub-metering allows for this, companies should consider itemising HVAc intensity separate to building energy intensity.
If energy known for whole building (even including tenant-obtained energy if applicable)
Whole building floor area (for example, net lettable area)
kWh / person / yearIdentify the number and type of buildings, total annual energy consumption (in kWh) and •corresponding number of persons.calculate:•∑ (sum of) annual kWh energy consumption∑ (sum of) persons
companies should decide on the most appropriate measure of persons used in this Sustain-ability Performance Measure, clearly stating the rationale and calculation methodology. current good practice for the use of per person denominators is as follows:
Property type Suggested person denominator
Office Number of workstations
Retail Number of visitors per annum
In regards to both types of normalisation (i.e. floor area and per person): Reporting organisations should report the method used to ensure that numerators and •denominators in the intensity indicator correspond – thereby taking account of different landlord and tenant metering scenarios. In particular, where the reporter does not know all energy consumption data within the whole building (i.e. it is missing or not known to the reporter) it is important to ensure that the intensity indicator is consistent and accurate. Possible approaches include: excluding such properties from the aggregation; adjusting the floor area to cover only the area serviced by known energy consumption; or adjusting the overall consumption data to take account of unknown data.For industrial properties and retail parks where the landlord only buys electricity for •the purposes of external/street lighting, companies should not use internal building area for the purposes of energy intensity Sustainability Performance Measures. Rather, they should normalise the consumption by either number of car park spaces, or m2 area cov-ering external areas (if available).
BEST PRAcTIcES REcOMMENdATIONS ON SuSTAINABIlITy REPORTING
15
EPRA Sustainability Performance Measures

REPORTING
Further guidance:Please refer to relevant sections of the draft GRI CRESS guidance on CRE1. Building energy inten-sity indicator. This section should be read in conjunction with Section 3 of this document.
Applying Overarching Recommendations:Companies should refer to Section 4.3 of this document in reporting against the performance measure Building energy intensity:
3.5 Total direct greenhouse gas (GHG) emissions - annual metric tonnes CO2e
Issue:According to the United Nations Environment Programme Sustainable Buildings & Climate Initiative, buildings give rise to about a third of global GHG emissions. Companies should have some control of these emissions as they originate directly at the point of use of fossil fuels such as gas. However, it remains challenging for companies to fully measure, and therefore reduce, the amount of direct GHG emissions. The importance for companies to ensure that conversion from energy units to GHG emissions is undertaken using robust methodology/conversion factors is also important.
Rationale:Reporting direct GHG emissions should encourage an investment property company to iden-tify and manage emissions from sources that are owned or controlled by the reporting com-pany. For example, direct emissions related to combustion would arise from burning fuel for energy within the company’s operational boundaries.
Recommendation:
cORE: This Sustainability Performance Measure should be calculated as follows (based on GRI Indicator Protocol EN16):
Identify • direct emissions of greenhouse gases arising from fuels burned on site (please use the amount of fuels burned on site as reported in EPRA Performance Measure Total energy consumption from fuels) as well as on site generation of electricity, heat, or steam (if such facilities exist). To calculate direct emissions, report kilograms of carbon dioxide equivalent (kgcO• 2e) emitted while burning fuel or generating electricity, heat/steam on site. use recognised conversion factors such as:
calculation based on site specific data available from energy supplier (e.g. for fuel -composition analysis etc.)calculation based on default data for example by the recognised international bod- -ies/initiatives such as the Intergovernmental Panel on climate change12 (IPcc) or International Energy Agency13.Estimations – if these are used due to a lack of actual data, indicate the basis of -estimates.
This Sustainability Performance Measure should be reported by meaningful segmenta-•tion, for example: portfolio, fund, location, asset type.Reporting on tenant and landlord emissions:•
clearly state if emissions only cover common (i.e. landlord-controlled) areas where -energy is supplied by the landlord.
12 http://www.ipcc-nggip.iges.or.jp/public/2006gl/index.html13 http://www.iea.org/co2highlights/
16
If emissions cover common parts and tenant areas (and the energy is supplied by the -landlord), clearly state what is being reported (landlord consumption/ base building only or whole building i.e. landlord & tenant) and why.Report on company’s own office occupation separately. -Please refer to Section 4.2 for further guidance. -
AddITIONAl: Companies should be aware that the GRI EN16 indicator requests companies to report on their fugi-tive emissions (such as refrigerant gases) and emissions from transportation of materials, products, and waste. Please refer to Section 5.1 and 5.2 of this document for further guidance on EPRA’s rec-ommended approach to these additional emissions sources.
Further guidance:Please refer to the relevant sections of the draft GRI CRESS covering EN16. Total direct and indirect greenhouse gas emissions by weight.
Applying Overarching Recommendations:Companies should refer to Section 4.3 and Section 5.2 of this document in reporting against the performance Total direct greenhouse gas (GHG) emissions.
3.6 Total indirect greenhouse gas (GHG) emissions - annual metric tonnes CO2e
Issue: According to the United Nations Environment Programme Sustainable Buildings & Climate Initiative14, buildings give rise to about a third of global GHG emissions. The key issue related to accurately calculating indirect GHG emissions is that of ensuring that conversion of energy units to GHG emission units is undertaken using robust methodology/conversion factors.
Rationale:Reporting indirect emissions should encourage an investment property company to identify and manage the emissions that result from its activities, but are generated at sources owned or controlled by another company. In the context of this Sustainability Performance Measure, indirect emissions refer to greenhouse gas emissions from the generation of electricity, heat, or steam that is imported and consumed by the reporting organisation.As such, indirect emissions are sufficiently influenced by the company that changes in its practices may lead to significant reductions. Measuring and reporting efforts to reduce indi-rect emissions can demonstrate leadership in combating climate change and can enhance the company’s reputation.
Greenhouse gas emissions are the main cause of climate change and are governed by the United Nations Framework Convention on Climate Change (UNFCC) and the subsequent Kyoto Protocol. As a result, different national and international regulations and incentive systems (such as trading climate certificates) aim to control the volume and reward the reduction of greenhouse gas emissions.
14 www.unepsbci.org
BEST PRAcTIcES REcOMMENdATIONS ON SuSTAINABIlITy REPORTING
17
EPRA Sustainability Performance Measures

REPORTING
Recommendation:
cORE: This Sustainability Performance Measure should be calculated as follows (based on GRI Indicator Protocol EN16):
Identify • indirect emissions of greenhouse gases resulting from the offsite generation of purchased electricity, heat, or steam (please use the amounts of purchased electricity, heat and steam as reported in EPRA Performance Measures Total energy consumption from electricity and Total energy consumption from district heating and cooling. Report kilograms of carbon dioxide equivalent (kgcO• 2e) emitted required for offsite gen-eration of electricity, heat or steam consumed. use recognised conversion factors such as:
calculation based on site specific data available from energy supplier (e.g. for fuel -composition analysis etc.)calculation based on default data for example by the recognised international bod- -ies/initiatives such as the Intergovernmental Panel on climate change15 (IPcc) or International Energy Agency16.Estimations – if these are used due to a lack of default figures indicate which basis -figures were obtained.
This Sustainability Performance Measure should be reported by meaningful segmenta-•tion, for example: portfolio, fund, location, asset type.Reporting on tenant and landlord emissions:•
clearly state if emissions only cover common (i.e. landlord-controlled) areas where -energy is supplied by the landlord. If emissions cover common parts and tenant areas (and all energy is obtained by the -landlord), clearly state what is being reported (landlord consumption/ base building only or whole building i.e. landlord & tenant) and why.Report on company’s own office occupation separately. -Please refer to Section 4.2 for further guidance. -
Further guidance:Please refer to the relevant sections of the draft GRI CRESS covering EN16. Total direct and indirect greenhouse gas emissions by weight.
Applying Overarching Recommendations:Companies should refer to Section 4.3 and Section 5.1 of this document in reporting against the performance measure Total indirect greenhouse gas (GHG) emissions as summarised below:
3.7 Greenhouse gas intensity from building energy - kg CO2e / m2 / year or kg CO2e / person /year
Issue:Intensity indicators have become a widely used to report performance (alongside the absolute consumption indicators). However, the variety of approaches used by companies to calculate intensity indicators represents a challenge for stakeholders to understand how to interpret these indicators. Please refer to Section 4.3 of this document for detailed explanation of the issue of absolute versus intensity metrics.
15 http://www.ipcc-nggip.iges.or.jp/public/2006gl/index.html16 http://www.iea.org/co2highlights/
18

Rationale:Building greenhouse gas intensity is an effective measure of efficiency during the occupation and operation phase of the building lifecycle and allows analysis of performance over time without the need to exclude acquired or sold properties. This indicator provides the opportu-nity for reporters to disclose GHG intensity for both those buildings occupied by the reporter and investment properties. GHG intensity from building energy is primarily intended to track changes over time for the reporters’ assets.
Recommendation:
cORE: This Sustainability Performance Measure should be calculated (based on GRI Indicator Protocol CRE3) as the sum of GHG emissions calculated for the three EPRA Sustainability Performance Mea-sures outlined in Sections 3.5 to 3.6 of this document, normalised using an appropriate denomina-tor (floor area or numbers of people), as follows:
kgCO2e / m2 /year Identify the number and type of buildings, total annual kgcO• 2e emissions and corre-sponding floor area (in m2).calculate:• ∑ (sum of) annual kg cO2e emissions
∑ (sum of) floor area (m2) companies should decide on the most appropriate measure of floor area used in this Sus-tainability Performance Measure, clearly stating the rationale and calculation methodology.
It is fairly common for a landlord to supply tenant areas with Heating Ventilation and Air conditioning (HVAc) services but not the rest of energy (i.e. tenants buy their own energy for lighting and small power supplies). In the absence of a standard approach, companies should include a note to state how they have treated buildings where this scenario applies, and what floor area they chose to apply to calculate intensity in such buildings.
Outlined below are suggested types of floor area to be used while calculating intensity indicators – these suggestions are based on current best practice: Coverage of known consumption data
Suggested floor area denominator
Emissions cover energy supplied to common areas only
common parts area
If landlord shared services, such as HVAC, are sup-plied to tenant demises but emissions arising from tenant-obtained energy are unknown
companies should state which floor area has been used where this applies – be it common parts area only or common parts plus lettable area, acknowl-edging that the intensity indicator is affected due to the mismatch between numerator and denominatorWhere sub-metering allows for this, companies should consider itemising HVAC intensity separate to building GHG intensity
If data available on emissions arising from energy for whole building (even including tenant-obtained energy if applicable)
Whole building floor area (for example, net lettable area)
BEST PRAcTIcES REcOMMENdATIONS ON SuSTAINABIlITy REPORTING
19
EPRA Sustainability Performance Measures

REPORTING
kWh / person / yearIdentify the number and type of buildings, total annual kgcO• 2e emissions and corre-sponding number of persons.calculate:• ∑ (sum of) annual kg cO2e emissions
∑ (sum of) persons
companies should decide on the most appropriate measure of persons used in this Sustain-ability Performance Measure, clearly stating the rationale and calculation methodology. current good practice for the use of per person denominators is as follows:
Property type Suggested person denominator
Office Number of workstations
Retail Number of visitors per annum
In regards to both types of normalisation (i.e. floor area and per person): Reporting organisations should report the method used to ensure that numerators and •denominators in the intensity indicator correspond – thereby taking account of different landlord and tenant metering scenarios. In particular, where the reporter does not know energy consumption data within the whole building (i.e. it is missing or not known to the reporter) it is important to ensure that the intensity indicator is consistent and accurate. Possible approaches include: excluding such properties from the aggregation; adjusting the floor area to cover only the area serviced by known energy consumption; or adjusting the overall consumption data to take account of unknown data.For industrial properties and retail parks where landlord only buys electricity for the •purposes of external/street lighting, companies should not use internal building area for the purposes of GHG emission intensity Sustainability Performance Measures. Rather, they should normalise the consumption by either number of car park spaces, or m2 area covering external areas (if available).
Further guidance:Please refer to relevant sections of the draft GRI CRESS guidance on CRE3. Greenhouse gas intensity from building energy. This section should be read in conjunction with Sections 3.5 - 3.6 of this document.
Applying Overarching Recommendations:Companies should refer to Section 4.3 of this document in reporting against the performance measure Greenhouse gas intensity from building energy.
3.8 Total water withdrawal by source - annual cubic metres (m3)
Issue:The built environment is responsible for 20% of water consumption, according to the United Nations Environment Programme Sustainable Buildings & Climate Initiative17. However, water reporting by the real estate sector is often limited in scope, accuracy and detail.
17 www.unepsbci.org
20

Rationale:Reporting the total volume of water withdrawn by source contributes to an understanding of the overall scale of potential impacts and risks associated with an investment company’s water use. The total volume withdrawn provides an indication of the company’s relative size and importance as a user of water, and provides a baseline figure for other calculations relat-ing to efficiency and use.
The systematic effort to monitor and improve the efficient use of water in the reporting organi-sation is directly linked to water consumption costs. Total water use can also indicate the level of risk posed by disruptions to water supplies or increases in the cost of water. In regions where water sources are highly restricted, the company’s water consumption patterns can also influence relations with other stakeholders.
Recommendation:
cORE: This Sustainability Performance Measure should be calculated as follows (based on GRI Indicator Protocol EN8):
Identify the total volume of water withdrawn from any water source (linked to metered •or measured utility data) that was either withdrawn directly by the company or through intermediaries such as water utilities. This includes the abstraction of cooling water. It should cover all water purchased/sourced and reporters may itemise water reallocated (preferably metered) to other parties who are the end users.Report the total volume of water withdrawn in cubic metres per year (m• 3/year) including the following sources:Municipal water supplies or other water utilities•This Sustainability Performance Measure should be reported by meaningful segmenta-•tion, for example: portfolio, fund, location, asset type.Reporting on tenant and landlord consumption:•
clearly state if the landlord supplies water only to common (i.e. landlord-controlled) -areas. If the landlord supplies water to common parts and tenant areas, clearly state what -is being reported (landlord consumption/ base building only or whole building i.e. landlord & tenant) and why.Report on company’s own office occupation separately. -Please refer to Section 4.2 for further guidance. -
AddITIONAl: The following sources may also be reported, provided reporters have accurate data and/or water collection installations on site:
Surface water, including water from wetlands, rivers, lakes, and oceans•Ground water•Rainwater collected directly and stored by the reporting organisation•Waste water from another organisation•Greywater•Blackwater•Treated waste water•desalination plant•Other water sources•
BEST PRAcTIcES REcOMMENdATIONS ON SuSTAINABIlITy REPORTING
21
EPRA Sustainability Performance Measures

REPORTING
Further guidance:For further guidance on this Sustainability Performance Measure, please refer to the relevant sections of the draft GRI CRESS covering EN8. Total water withdrawal by source.
Applying Overarching Recommendations:Companies should refer to Section 4 of this document in reporting against the performance measure Total water withdrawal by source.
3.9 Building water intensity - litres/ person/ day or m3/ m2/ year
Issue:Intensity indicators have become widespread measures of performance (alongside the abso-lute consumption indicators). However, the variety of approaches used by companies to cal-culate intensity indicators represents a challenge for stakeholders to understand how to inter-pret these indicators. Please refer to Section 4.3 of this document for a detailed explanation of the issue of absolute vs. intensity metrics.
Rationale:Building water intensity is one of the most effective measures of a building’s overall water efficiency during the occupation and operation phase of the building lifecycle and allows analysis of performance over time without the need to exclude acquired or sold properties. This indicator provides the opportunity for reporters to disclose water intensity for both those buildings occupied by the reporter and those held in investment portfolios. Water intensity is primarily intended to track changes over time for the reporters’ assets.
Recommendation:
cORE: Calculated (based on GRI Indicator Protocol CRE3) as the sum water consumption calculated as part of EPRA Sustainability Performance Measures outlined in the previous section (Total water withdrawal by source), normalised using an appropriate denominator (floor area or numbers of people), as follows:
m3 / m2 / year Identify the number and type of buildings, total annual m• 3 water consumption and cor-responding floor area (in m2).calculate:• ∑ (sum of) annual m3 water consumption
∑ (sum of) floor area (m2) companies should decide on the most appropriate measure of floor area used, clearly stat-ing the rationale and calculation methodology. current good practice for the use of floor area denominators is as follows:
Coverage of known consumption data Suggested floor area denominator
If water supplied to common areas only common parts area
If water consumption known for whole building (even including tenant-obtained water if appli-cable)
Whole building floor area (for example, net lettable area)
22

litres / person / dayWater use in some cases can be driven by building users or visitors. For this reason, inten-sity analysis may be based on the numbers of occupiers / users of a property.
Identify the number and type of buildings, total annual litres water consumption and •corresponding number of persons.calculate:• ∑ (sum of) annual litres water consumption
∑ (sum of) person days
companies should decide on the most appropriate measure of persons used in this Sustain-ability Performance Measure, clearly stating the rationale and calculation methodology. current good practice for the use of per person denominators is as follows:
Property type Suggested person denominator
Office Number of workstations
Retail Number of visitors per annum
In regards to both types of normalisation (i.e. floor area and per person): Reporting organisations should report the method used to ensure that numerators and •denominators in the intensity indicator correspond – thereby taking account of different landlord and tenant metering scenarios. In particular, where the reporter does not know water consumption data within the whole building (i.e. it is missing or not known to the reporter) it is important to ensure that the intensity indicator is consistent and accurate. Possible approaches include: excluding such properties from the aggregation; adjusting the floor area to cover only the area serviced by known energy consumption; or adjusting the overall consumption data to take account of unknown data.
Further guidance:Please refer to relevant sections of the draft GRI CRESS guidance on CRE2. Building water intensity. This section should be read in conjunction with Sections 3.8 of this document.
Applying Overarching Recommendations:Companies should refer to Section 4.3 of this document in reporting against the performance measure Building water intensity.
3.10 Total weight of waste by disposal route - annual metric tonnes
Issue:The built environment is responsible for 30% of total solid waste generation, according to United Nations Environment Programme Sustainable Buildings and Climate Initiative18. How-ever, waste reporting by the real estate sector is often limited in scope, accuracy and detail.
Rationale:Reporting data on waste generation figures over several years should encourage an invest-ment property company to identify waste and manage its reduction. It can also indicate poten-tial improvements in process efficiency and productivity. From a financial perspective, the reduction of waste contributes directly to lower costs for materials, processing, and disposal.Information about the disposal destination reveals the extent to which a company has man-
18 www.unepsbci.org
BEST PRAcTIcES REcOMMENdATIONS ON SuSTAINABIlITy REPORTING
23
EPRA Sustainability Performance Measures

REPORTING
aged the balance between disposal options and environmental impacts. For example, landfill and recycling create very different types of environmental impacts and residual effects. Most waste minimisation strategies prioritise options for recovery, reuse, or recycling over other disposal options.
Recommendation:
cORE: This Sustainability Performance Measure should be calculated as follows (based on GRI Indicator Protocol EN22):
Identify the amount of waste created by its operations, by:•Hazardous waste (as defined by national legislation at the point of generation); and -Non-hazardous waste (all other forms of solid or liquid waste excluding wastewa- -ter).
If no weight data are available, estimate the weight using available information on waste •density and volume collected, mass balances, or similar information. Estimation assump-tions and methodology should be clearly stated.Report the total amount of waste in tonnes by type as identified above:•
Reuse -Recycling -composting -Recovery -Incineration (including with energy recovery) -landfill -Other (e.g. Materials Recovery Facility) -
Waste services are often, but not always, provided by the landlord for the whole building. •companies should explicitly state the coverage of their waste data in terms of landlord and tenant control/ responsibility. Please refer to Section 4.2 for further guidance.
Applying Overarching Recommendations:Companies should refer to Section 4 of this document in reporting against the performance measure Total weight of waste by disposal.
3.11 Proportion of waste by disposal route - % of total by weight
Issue:Reporting on total waste generated is not always sufficient for stakeholders to assess a com-pany’s success in managing waste reduction. Stakeholders also need to understand the rela-tive proportion of each waste disposal route in the waste hierarchy.
Rationale:Proportions of waste by disposal route can provide a useful overview of waste management practices, as well as showing efforts to divert waste from landfill (disposal to landfill being considered the least desirable waste disposal method). Percentages can also be a useful indi-cator for stakeholders to compare companies’ successes at sustainable waste management when compared to their peers.
24

Recommendations:
cORE: This Sustainability Performance Measure should be calculated as follows (based on GRI Indicator Protocol EN22):
Identify the amount of waste created by its operations, by:•Hazardous waste (as defined by national legislation at the point of generation); and -Non-hazardous waste (all other forms of solid or liquid waste excluding waste- -water).
If no weight data are available, estimate the weight using available information on waste •density and volume collected, mass balances, or similar information. Estimation assump-tions and methodology should be clearly stated.Report the proportion of waste by type:•
Reuse -Recycling -composting -Recovery -Incineration (including with energy recovery) -landfill -Other (e.g. Materials Recovery Facility) -
Report proportion of waste diverted from landfill. •Although waste services are typically provided for the whole building (building manage-•ment + tenants), companies should explicitly state the coverage of their waste data in terms of landlord and tenant control/ responsibility. Please refer to Section 4.2 for further guidance.
Further guidance:Please refer to the relevant sections of the draft GRI CRESS covering EN22. Total weight of waste by type and disposal method.
Applying Overarching Recommendations:Companies should refer to Section 4 of this document in reporting against the performance measure of this document in reporting against the performance measure Proportion of waste by disposal route. n
BEST PRAcTIcES REcOMMENdATIONS ON SuSTAINABIlITy REPORTING
25
EPRA Sustainability Performance Measures

REPORTING
4. Overarching Recommendations
The following recommendations are overarching principles which should be applied to a number of Sustainability Performance Measures addressed in Section 3.
4.1 Organisational boundaries
Issue:Boundaries determine the extent of reporting according to assets or organisational activities that are owned or controlled by the reporting company. Boundary assessments allow a com-pany to establish which operations should be in and out of reporting scope. It is important that reporters clearly articulate how boundaries are defined so that stakeholders can understand the extent of operations and activities included in performance analysis.
Rationale:Definition of the company’s organisational boundaries represents a key step in sustainability reporting. To date, the GHG Protocol, developed by the World Resources Institute and the World Business Council for Sustainable Development, has been a key reference for the com-panies to inform their decisions on what approach to adopt – Operational Control, Financial Control or Equity share 19.
EPRA’s research has shown that operational control approach has been the most frequently adopted by listed real estate companies in Europe. The operational control approach is defined as follows:“…A company has operational control over an operation if the former or one of its subsidiaries […] has the full authority to introduce and implement its operating policies at the operation…”20
The operational control approach should not be considered a default or ‘perfect fit’ for real estate companies. Indeed, there are justifications for other approaches such as equity share where the issue of co-ownership can be addressed by determining which assets are either included or excluded from reporting.
Recommendation:
cORE: It should be noted that prior to making a choice which type of boundary approach a company should choose, it should carefully consider the following:
companies should map their organisational structure, specifically, due consideration •should be made as to whether assets are subsidiaries, associates, incorporated or unin-corporated joint ventures.The issue of financial/ operational leases is important to consider as part of the boundary •approach definition. It should be noted that the GHG Protocol treats differently assets leased on financial leases (as opposed to operational leases). It should be noted that under the current IASB proposal, financial leases may be phased out. Therefore, due consideration will need to be given to this issue in the future, including its impact on boundaries definitions.
19 http://www.ghgprotocol.org/files/ghg-protocol-revised.pdf20 Ibid.
26

As a minimum, companies should explain why they have chosen a certain boundary approach over others available i.e. clarify for each Sustainability Performance Measure which boundary approach is used and the value or number (absolute or % of portfolio) of buildings in the portfolio which they are reporting on. This decision remains at the discre-tion of the reporter, as long as an explanation is provided.
Although adopting operational approach is not mandatory, companies should aim to report 100% of all assets where they have operational control.
Further guidance:Please refer to the GRI Guidance on setting the organisational boundary and the GHG Protocol for further guidance on this.21
4.2 Boundaries – Reporting on landlord and tenant consumption
Issue:Addressing tenant and landlord consumption scenarios in a building’s energy, water consump-tion and to an extent waste generation, remains a challenge for real estate companies. Data on tenant consumption is not always available to the landlord, and when it is, the landlord has traditionally had little control over tenants’ usage of energy/water obtained on their behalf and then subsequently recharged. Water and waste have traditionally presented limited opportuni-ties for establishing baselines for consumption in common parts and tenant areas.
Rationale:Clarity on what is being reported as part of overall consumption can help stakeholders to assess the level of control that a reporter has over performance e.g. if data presented in the report only covers landlord-controlled areas, then the landlord will be expected to be solely accountable for the sustainability performance shown in the report.
Recommendation:
cORE: There is no single, optimal way to report on base (landlord only) or whole building consumption. As a minimum, companies should report on consumption that they are responsible for obtaining themselves in the first instance. The longer-term goal should be to report the entire impact arising within a building, irrespective of the arrangements between landlord and tenant. As a general rule, the following principles will apply:
Absolute• consumption should only contain landlord-obtained energy/water.Where energy/water is obtained by the landlord but consumed in tenant areas, and is •sub-metered – such consumption should be itemised (but should be included in the absolute totals).Exclusion of consumption that is obtained by the landlord but sub-metered to the tenant •may present a number of issues, such as:
distortions of intensity Sustainability Performance Measures due to a likely mismatch -between numerator (e.g. kWh) and denominator (e.g. floor area).distortions of the absolute Sustainability Performance Measures required for regula- -tory compliance with legislation such as the cRc Energy Efficiency Scheme in the uK
21 http://www.globalreporting.org/ReportingFramework/G3Online/SettingReportBoundary and the GHG Protocol recom-mendations on ‘Setting Organizational Boundaries’ in http://www.ghgprotocol.org/files/ghg-protocol-revised.pdf
BEST PRAcTIcES REcOMMENdATIONS ON SuSTAINABIlITy REPORTING
27
Overarching Recommendations

REPORTING
(this Scheme looks at the total energy obtained by the landlord, irrespective of the end user).despite these exemptions, excluding tenant consumption may be necessary for the -purposes of corporate sustainability target setting and monitoring, as most real estate companies currently set their targets based on consumption over which the landlord has direct and full operational control.
Where data that is being reported is a mix of landlord obtained tenant and landlord •consumption, companies should distinguish between what they have control over and where this is not the case. There should be a clear explanation as to choice of the level of reporting (landlord only, landlord and tenant, etc).For the purposes of • intensity Sustainability Performance Measures only, if known, ten-ant-obtained consumption can be used in calculations, e.g. to achieve a situation where whole building consumption (tenant-obtained and landlord-obtained) is divided by the whole building floor area.There will be cases where landlords will have access to information on tenant consump-•tion obtained by the tenant. If this is the case and this data is being reported, compa-nies should explicitly state such instances and ensure that the correct denominators are used when calculating the intensity Sustainability Performance Measures (e.g. where companies choose to report whole building consumption - where it is a combination of landlord-obtained consumption, and tenant-obtained consumption, the corresponding floor area to be used in order to arrive at an intensity Sustainability Performance Mea-sure, should be whole building floor area – net lettable area can be a good proxy for this purpose). We anticipate tenant data to become increasingly available to the landlords in the future, in the light of tightening legislation and the increased need to share consump-tion data. Future versions of the BPR will provide additional guidance on how to deal with tenant-obtained consumption which appears in the landlords’ annual reports.Waste reporting should be in line with the operational control approach.•A distinction should be made between consumption arising from the company’s own •occupation and that of its property investment portfolios.
4.3 Analysis - Normalisation
Issue:Absolute consumption represents a good measure of a company’s exposure to risk (including regulatory risks, fiscal liability etc.) and provides stakeholders with a measure of its envi-ronmental footprint. However, absolute Sustainability Performance Measures often present limited insight when assessing the company’s success in reducing its relative energy, GHG or water intensity. This makes intensity (normalised) indicators a useful complementary tool for stakeholders to assess companies’ performance.
Rationale:Intensity is one of the most effective measures of a building’s overall efficiency during the occupation and operation phase of the building lifecycle.
Some advantages of intensity Sustainability Performance Measures include:Ability to compare the relative intensity of different portfolios (e.g. an office portfolio ver-•sus a retail warehouse portfolio).Aggregated intensity Sustainability Performance Measures enable changes over time to •reflect the influence of acquisitions, disposals and developments/major refurbishments, without the need to exclude any properties from aggregation in any year (see Section 4.4 for further explanation of the like-for-like approach).
28
Recommendation:Intensity indicators are best suited to compare a company’s performance over time, rather than for comparison between companies over time.
Energy, GHG emissions, water and waste require different types of intensity indicators, as different factors may drive consumption.
CORE: As a general rule, companies should define the exact denominator used in the intensity indicator, as well as the method of matching numerator and denominator to account for different landlord and tenant scenarios.
Intensity Sustainability Performance Measures should be reported separately for the •reporting organisation’s operations (companies’ own offices occupation) and for their property investment portfolios.Recommended Sustainability Performance Measure denominators are as follows:•1. Floor area
Although floor areas used in sustainability reporting vary between and within differ- -ent regions, these should be consistent with those used in financial reports (reporters to use the same type of area in their sustainability and financial reporting). companies should ensure that the type of floor area and the associated consumption -figures are as closely aligned as possible in their coverage of the building’s areas, i.e. match numerator and denominator.
2. OccupancyAs per the draft GRI cRESS guidelines, occupancy refers to the use of a building mea- -sured in numerous ways, including: Number of occupiers; density of operation (e.g. floor area per worker); and visitors. companies may use numbers of people (e.g. visitors) as a denominator as long as -they clearly state how they have defined and measured it. Please note that water benefits most from the use of a ‘per person’ indicator as its consumption is driven by people and users of the building.
4.4 Analysis - Like-for-like approach for absolute Sustainability Performance Measures
Issue:When using absolute indicators such as energy consumption or GHG emissions, various fac-tors (other than the actual performance of the buildings) can impact on the overall levels of consumption. These include acquisitions, disposals, major refurbishments and develop-ments.
Rationale:In order for stakeholders to understand whether a company is successful in reducing its envi-ronmental impact, information on energy/water/GHG emissions/waste should cover a set of assets that have not been affected by any significant changes such as disposals or acquisitions.
The advantages of the like-for-like approach are also acknowledged by the draft GRI CRESS: The use of like-for-like analyses can be used to show portfolio-level improvements over a limited time period without needing complex adjustments or normalisations.
Although more generally used for absolute indicators, like-for-like can also be a useful approach to ensure comparability for intensity indicators.
BEST PRAcTIcES REcOMMENdATIONS ON SuSTAINABIlITy REPORTING
29
Overarching Recommendations
REPORTING
Recommendation:
cORE: Like-for-like energy/water/GHG/waste comparison looks at the change in trend of a portfolio that has been consistently in operation, and not under development, during the two full preceding periods that are described. For example, the 2010 like-for-like change in consumption compares the impact of the stabilised portfolio in 2010 and 2009.
The like-for-like definition for rental growth reporting outlined in EPRA Financial BPR pro-vides a useful basis for the like-for-like approach in sustainability reporting, notably:
companies should describe the size, in value, of the total portfolio or investment portfo-•lio on which the like-for-like consumption is based.companies should disclose the basis and assumptions underlying the like-for-like infor-•mation.companies should disclose the like-for-like consumption for each significant sector of the •portfolio and each geographical business segment.High variation in vacancy rates: while companies can use significant changes in vacancy •rates as an explanation (akin to ‘special events’) of unusual consumption trends, such cases should be explicitly stated and consumption should not be excluded from the totals simply because a building had a high variation in vacancy rates.
4.5 Analysis - Segmental analysis (by property type, geography)
Issue:Building types and their location may have a significant impact on buildings’ environmental performance therefore aggregated environmental statistics can make it challenging for stake-holders to understand what region or asset class might be under/outperforming against other regions or assets groups in the portfolio.
Rationale:Comparison between geographies and property types can help explain trends in environmen-tal performance.
Geographical segmentation can be a helpful way to analyse resource consumption, although •reporters should be mindful when making comparisons between absolute and intensity performance across geographical borders (e.g. explaining weather factors which affect con-sumption in the accompanying narrative). Property types provide another useful way to analyse consumption, as property types •have different consumption patterns and drivers for resource use.
The draft GRI CRESS also encourages comparison by location (geographical position of a building according to climatic zone) and building types (function or form of a building and can include high level categorisations such as commercial and residential, as well as more detailed categorisations of these, such as commercial office, retail warehouse and shopping centre).
Please refer to the relevant sections in the draft GRI CRESS on CRE1. Building energy intensity for an example of the segmental analysis approach applied to energy reporting.
30

Recommendation:
cORE: It is important that segmental reporting and analysis is adopted in line with the approach selected by companies in their financial reporting.
companies should use the property typologies adopted in their financial reporting. Where •additional typologies are used, an explanation for this should be provided. Mixed use developments represent a special case where it should be clear whether mixed •use properties are listed as one asset or broken down by types of use (e.g. office and retail unit element). In all cases, the approach towards mixed use developments should be in line with companies’ financial reporting.Segmental reporting and analysis should apply to both absolute and intensity Sustain-•ability Performance Measures.
4.6 Analysis – Narrative on performance
Issue:Similarly to financial performance, the environmental performance and position of real estate companies often requires additional narrative information.
Rationale:Explaining the context of the company’s operations and management decisions can enhance stakeholders’ assessment and analysis of non-financial performance in the same way as it can help evaluate financial performance.
Recommendation:
cORE: Adjustments to the totals should not be made when reporting on EPRA Performance Measures. Companies should provide, where appropriate, additional information and commentary/ explana-tion of their past performance, and outline their view on/plans for managing their future perfor-mance.
When looking at the environmental performance of a portfolio, it may be useful to under-stand what factors, other than building management and tenant behaviour, might explain consumption trends. The most frequently used factors which influence environmental performance include weather patterns (e.g. adjustment for degree days), levels of building occupancy, ‘special uses’ (e.g. higher consumption in buildings where tenants undertake trading activities) and age of the building.
BEST PRAcTIcES REcOMMENdATIONS ON SuSTAINABIlITy REPORTING
31
Overarching Recommendations
REPORTING
4.7 Location of EPRA Sustainability Performance Measures in companies’ reports
Recommendation:
cORE: EPRA Sustainability Performance Measures should be included in companies’ annual sustainability/Corporate Responsibility report, and specific EPRA Sustainability Performance Measures should be clearly stated within the report. It is EPRA’s view that companies should include sustainability/Corporate Responsibility coverage in their Annual Report & Accounts, and support the transition towards integrated reporting22
In their Annual Report & Accounts, companies should therefore strive to include a comprehen-sive (even if succinct) review of their sustainability performance. As a minimum, companies will be expected to include a summary table of EPRA Sustainability Performance Measures in their financial report. Any EPRA Performance Measures in the Annual Report & Accounts should be referenced to, and clearly identified within any published Sustainability Report.
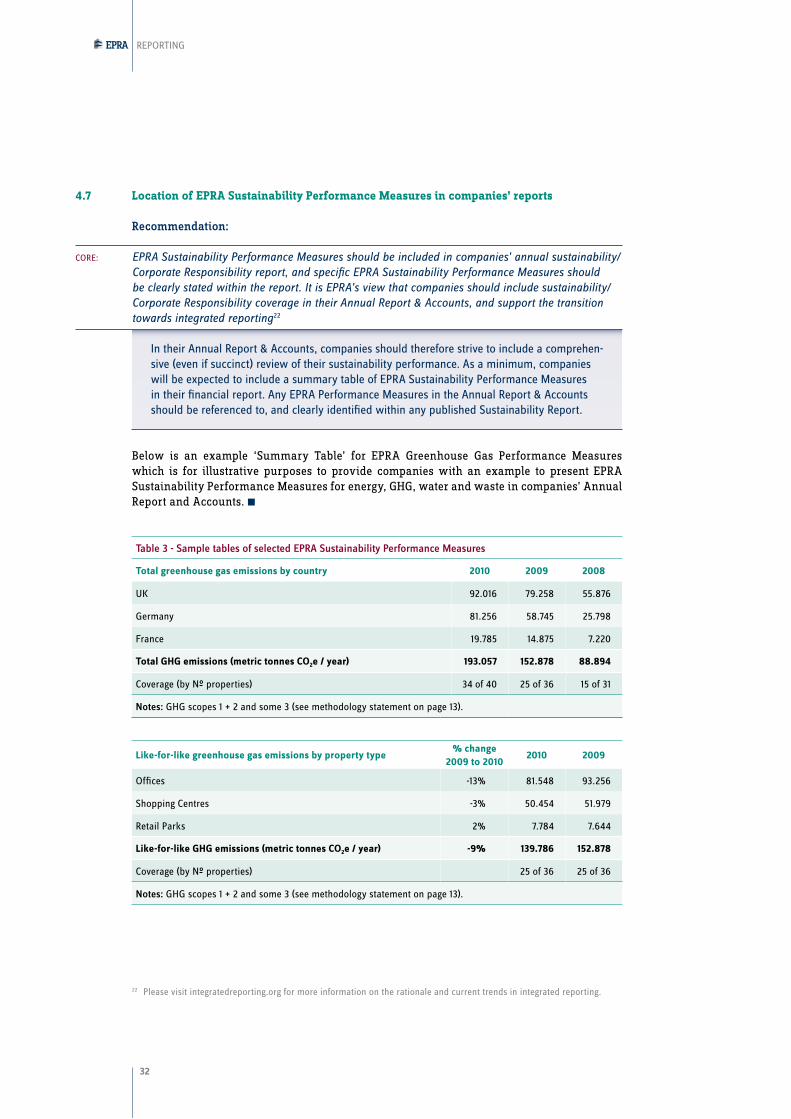
Below is an example ‘Summary Table’ for EPRA Greenhouse Gas Performance Measures which is for illustrative purposes to provide companies with an example to present EPRA Sustainability Performance Measures for energy, GHG, water and waste in companies’ Annual Report and Accounts. n
Table 3 - Sample tables of selected EPRA Sustainability Performance Measures
Total greenhouse gas emissions by country 2010 2009 2008
uK 92.016 79.258 55.876
Germany 81.256 58.745 25.798
France 19.785 14.875 7.220
Total GHG emissions (metric tonnes CO2e / year) 193.057 152.878 88.894
coverage (by N° properties) 34 of 40 25 of 36 15 of 31
Notes: GHG scopes 1 + 2 and some 3 (see methodology statement on page 13).
Like-for-like greenhouse gas emissions by property type% change
2009 to 20102010 2009
Offices -13% 81.548 93.256
Shopping centres -3% 50.454 51.979
Retail Parks 2% 7.784 7.644
Like-for-like GHG emissions (metric tonnes CO2e / year) -9% 139.786 152.878
coverage (by N° properties) 25 of 36 25 of 36
Notes: GHG scopes 1 + 2 and some 3 (see methodology statement on page 13).
22 Please visit integratedreporting.org for more information on the rationale and current trends in integrated reporting.
32

Building greenhouse gas intensity (per floor area) by property type
% change 2008 to 2010
2010 2009 2008
Offices (kg cO2e / m2 / year) -8% 307 321 334
Shopping centres (kg cO2e / m2 / year) -1% 148 152 148
Retail Parks (kg cO2e / car park space / year) 2% 97 96 95
coverage (by N° properties) 34 of 40 25 of 36 15 of 31
Notes: GHG scopes 1 + 2 and some 3 (see methodology statement on page 13). In all of our offices the floor area used - lettable area - corresponds with the energy consumption data we know as we obtain all energy used in the buildings. In 4 of our 10 shopping centres, the energy we obtain services just the common parts, so common parts floor area is the denominator for these properties. In 6 of our 10 shopping centres, we supply HVAc into tenant areas, but we do not know the data for energy con-sumption that tenants obtain themselves, so the numerator and denominator in the intensity indicator does not fully correspond - so caution should be taken especially in comparing the shopping centre intensity shown with other portfolios. We have not estimated missing tenant-obtained energy consumption in these 6 shopping centres. In retail parks the energy we obtain services external common parts (mostly car park lighting) so denominator used is number of car park spaces. It is not suitable to aggregate the different property types into a single intensity indicator.
BEST PRAcTIcES REcOMMENdATIONS ON SuSTAINABIlITy REPORTING
33
Overarching Recommendations
REPORTING
5. Other issues to consider
Issues discussed in this section do not currently warrant separate Best Practices Recommen-dations. However, the topics below represent important issues to consider in the future, in light of the likely direction of reporting trends and stakeholder expectations.
5.1 Transport
Issue:The emissions from employee commuting and business travel patterns, and emissions arising from the end users of assets (e.g. visitors or occupiers) can often be significant although dif-ficult to measure accurately on an ongoing basis.
Likely future direction:Transport emissions arising from a company’s activities (such as staff travel) as well emis-sions arising from the users of the buildings owned by the company (tenants’ staff and visi-tors) should be accounted for in the company’s GHG statements as they cause indirect emis-sions.
Companies looking to report on transport emissions should consult the GRI CRESS guidance on EN16. Total direct and indirect greenhouse gas emissions by weight, EN17. Other relevant indirect greenhouse gas emissions by weight and EN29. Significant environmental impacts of transporting products and other goods and materials used for the organisation’s operations, and transporting members of the workforce.
EPRA will closely monitor the reporting trend on transport emissions and future versions of the BPR may incorporate guidance on reporting transport related issues.
5.2 Refrigerant gases
Issue:Fugitive emissions, such as refrigerant gases, remain difficult to measure accurately on an ongoing basis.
Likely future direction:Fugitive emissions arising from a company’s activities (such as building operation) should be accounted for in the company’s GHG statements as they cause direct emissions.
Companies looking to report on refrigerant gases should consult the GRI CRESS guidance on EN16.Total direct and indirect greenhouse gas emissions by weight, which provides com-mentary on common fugitive emissions from real estate include refrigerant gas from HVAC equipment, such as R22.
EPRA will closely monitor the reporting trend on refrigerant gases and future versions of the BPR may incorporate guidance on reporting refrigerant gases.
34
5.3 Financial indicators related to sustainability performance
Issue:Sustainability performance is still largely expressed in non-financial terms, despite increasing recognition that sustainability can have a clear and direct impact on financial performance. More emphasis therefore needs to be given towards quantifying the financial value of sustain-ability performance.
Likely future direction:In the spirit of the increasingly influential idea of integrated reporting and calls for a more ‘concise, clear, comprehensive and comparable integrated reporting framework’23, compa-nies are expected to increasingly report non-financial performance alongside financial perfor-mance. It is up to the companies to consider what financial metrics to report on. For reference, below are some of the most commonly used indicators:
Costs (e.g. annual expenditure on utilities)•Liabilities (e.g. carbon or landfill taxes)•Savings (e.g. from energy efficiency initiatives or tax aversion)•Revenues (e.g. from Feed- in Tariffs or carbon trading)•
Please refer to the Economic Section of the draft GRI CRESS for further guidance. Addition-ally, please consult pp.22-29 of “Connected reporting: A practical guide with worked”24 for a worked example of connected reporting incorporating financial sustainability key perfor-mance indicators for a fictional real estate company.
EPRA will closely monitor the reporting trend on financial indicators related to sustainability performance and future versions of the BPR may incorporate guidance on financial indica-tors.
5.4 Assurance
Issue:Assurance of sustainability reports by independent third-parties is likely to become increas-ingly common practice. The credibility of sustainability data increases when third party assurance is carried out and the assurance provider is independent and objective. Assurance credibility is, in turn, enhanced if it is undertaken in accordance with recognised standards such as AA100025 or ISAE300026.
The choice to assure a sustainability report currently is at individual companies’ discretion and is not a legal requirement across all countries in Europe.
Likely future direction:The practice of seeking external data verification/ assurance in sustainability reporting will become more widespread over time (similarly to valuations which are now mostly provided by external valuers), and EPRA encourages this. Assurance engagements should be carefully planned and internal governance and quality management/ control should remain a primary means of ensuring robust and comparable performance data. n
23 http://www.integratedreporting.org/node/324 exampleshttp://www.accountingforsustainability.org/files/pdf/connected%20Reporting.pdf25 http://www.accountability.org/standards/index.html26 http://www.accountability21.net/uploadedFiles/Issues/ISAE_3000.pdf
BEST PRAcTIcES REcOMMENdATIONS ON SuSTAINABIlITy REPORTING
35
Other issues to consider

REPORTING
6. Definitions - Glossary of Terms
6.1 General
Common partsAreas which are shared with other occupants in multi-let buildings, including entrance areas, corridors, lifts, staircases, waste storage stores, communal kitchen or breakout facilities and any other parts within the asset and outside which are intended for the use of the occupiers of that asset.
Floor areacodes for defining floor areas vary by location, building type and landlord-tenant arrangement, for example: common parts area, lettable / leasable area, internal area, usable area, occupied area, conditioned/treated area.
Mandatory disclosure requirementslegally binding reporting requirements for listed or non-listed companies. In the Eu, these require-ments include the European Accounts Modernisation directive, which is interpreted in different ways by different countries.
HVAC – Heating, Ventilation, Air conditioning
Building types categorisation based on the function or form of a building for example: offices, shopping centres, retail warehouses, industrial, multi-family housing, hotels.
PersonsThe average number of persons used as a denominator of a building energy intensity indicator. For example: visits in shopping centres, workstations in offices, workers in industrial, residents in multifamily housing, guests in hotels.
Vacancy ratesThe proportion of lettable / leasable area that is unoccupied.
6.2 Energy
Building energy intensity The amount of energy used per unit of an appropriate denominator (e.g. floor area, persons).
Absolute energyThe total amount of energy consumed by an entity and those deemed to be within its organisa-tional boundaries.
District heating and coolingdistrict heating and cooling is a system for distributing hot or cold steam and water generated in a centralised location for residential and commercial heating requirements such as space heating and water heating. The heat is often obtained from a cogeneration plant burning fossil fuels but increasingly biomass. Heat-only boiler stations, geothermal heating and central solar heating are also used.
36

Renewable energyEnergy sources and specific clean energy technologies that emit fewer GHG emissions relative to other sources of energy that supply the electric grid. Includes solar photovoltaic panels, solar thermal energy, geothermal energy, landfill gas, low-impact hydropower and wind turbines.
6.3 Carbon
Greenhouse gas (GHG) emissionsGreenhouse gases (sometimes abbreviated to GHG) are gas in the Earth’s atmosphere that is the fundamental cause of the greenhouse effect which can greatly affect the temperature of the Earth. GHGs are the six gases listed in the Kyoto Protocol: carbon dioxide (cO2); methane (cH4); nitrous oxide (N2O); hydrofluorocarbons (HFcs); perfluorocarbons (PFcs); and sulphur hexafluo-ride (SF6). Since the beginning of the Industrial revolution, the burning of fossil fuels has substan-tially increased carbon dioxide (cO2) emissions into the atmosphere thereby contributing to the greenhouse gas effect.
Carbon Disclosure ProjectThe carbon disclosure Project (cdP) works with shareholders and corporations to disclose the greenhouse gas emissions of major corporations.
BoundariesThe boundaries that determine the direct and indirect emissions associated with operations owned or controlled by the reporting company. This assessment allows a company to establish which operations and sources cause direct and indirect emissions, and to decide which indirect emissions to include that are a consequence of its operations. See also the following definitions on financial control, operational control and equity share.
Financial control used to define organisational boundaries for financial and sustainability (and especially GHG emissions) reporting. Operational control relates to where the organisation has the ability to direct the financial and operating policies of the operation with a view to gaining economic ben-efits from its activities.
Operational control used to define organisational boundaries for financial and sustainability (and especially GHG emis-sions) reporting. Operational control relates to where the organisation or one of its subsidiaries has the full authority to introduce and implement its operating policies at the operation.
Equity-share used to define organisational boundaries for financial and sustainability (and especially GHG emissions) reporting. Equity share reflects economic interest, which is the extent of rights a com-pany has to the risks and rewards flowing from an operation. Typically, the share of economic risks and rewards in an operation is aligned with the company’s percentage ownership of that operation, and equity share will normally be the same as the ownership percentage.
Building GHG intensity The amount of carbon used per unit of an appropriate denominator (e.g. floor area, persons).
Total direct GHG emissionsdirect GHG emissions come from sources that are owned or controlled by the reporting organisa-tion. All direct emission sources are classified as scope 1 under the GHG Protocol.
BEST PRAcTIcES REcOMMENdATIONS ON SuSTAINABIlITy REPORTING
37
definitions - Glossary of Terms

REPORTING
Total indirect GHG emissionsIndirect GHG emissions are those that are a consequence of the activities of the organisation, but that occur at sources owned or controlled by another organisation or company. Indirect emission sources are classified as either scope 2 or scope 3 under the GHG Protocol.
Fugitive emissionsFugitive emissions are emissions of gases or vapours from pressurised equipment such as air conditioning due to leaks and various other unintended or irregular releases of gases.
6.4 Water
Building water intensity The amount of water used per unit of an appropriate denominator (e.g. floor area, persons).
6.5 Waste
Waste by disposal route The method by which waste is treated or disposed, including composting, reuse, recycling, recov-ery, incineration, landfill, deep well injection, and on-site storage.
6.6 Financial
Feed-in-Tariffs A feed-in-tariff is a policy mechanism designed to encourage the adoption of renewable energy sources.
Carbon tradingcarbon emissions trading (also known as cap and trade) is a market-based approach used to control pollution by providing economic incentives for achieving reductions in the emissions of pollutants. n
38


Square de Meeus 23
B-1000 Brussels
Belgium
T +32 (0)2 739 1010
F +32 (0)2 739 1020
www.epra.com


