Kopito Calamini, Richard I. Morimoto and Ron R. Kirill Bersuker, Mark S. Hipp, Barbara Cellular Model of Huntington Disease a Exacerbates Inclusion Body Formation in Heat Shock Response Activation Reports: doi: 10.1074/jbc.C113.481945 originally published online July 9, 2013 2013, 288:23633-23638. J. Biol. Chem. 10.1074/jbc.C113.481945 Access the most updated version of this article at doi: . JBC Affinity Sites Find articles, minireviews, Reflections and Classics on similar topics on the Alerts: When a correction for this article is posted • When this article is cited • to choose from all of JBC's e-mail alerts Click here http://www.jbc.org/content/288/33/23633.full.html#ref-list-1 This article cites 22 references, 9 of which can be accessed free at at NORTHWESTERN UNIV LIBRARY on February 6, 2014 http://www.jbc.org/ Downloaded from at NORTHWESTERN UNIV LIBRARY on February 6, 2014 http://www.jbc.org/ Downloaded from
Transcript
KopitoCalamini, Richard I. Morimoto and Ron R. Kirill Bersuker, Mark S. Hipp, Barbara Cellular Model of Huntington Disease
aExacerbates Inclusion Body Formation in Heat Shock Response ActivationReports:
doi: 10.1074/jbc.C113.481945 originally published online July 9, 20132013, 288:23633-23638.J. Biol. Chem.
10.1074/jbc.C113.481945Access the most updated version of this article at doi:
.JBC Affinity SitesFind articles, minireviews, Reflections and Classics on similar topics on the
Alerts:
When a correction for this article is posted•
When this article is cited•
to choose from all of JBC's e-mail alertsClick here
Heat Shock Response ActivationExacerbates Inclusion BodyFormation in a Cellular Modelof Huntington Disease*
Received for publication, April 30, 2013, and in revised form, July 5, 2013Published, JBC Papers in Press, July 9, 2013, DOI 10.1074/jbc.C113.481945
Kirill Bersuker‡1, Mark S. Hipp‡2, Barbara Calamini§3,Richard I. Morimoto§, and Ron R. Kopito‡4
From the ‡Department of Biology, Stanford University, Stanford, California94305 and the §Department of Molecular Biosciences, Rice Institute forBiomedical Research, Northwestern University, Evanston, Illinois 60208
Background:Aggregationofmutanthuntingtin into inclu-sion bodies is a pathogenic feature of Huntington disease.Results: Genetic and pharmacological activation of theheat shock stress response (HSR) promotes inclusionbody formation.Conclusion:Activation of theHSR contributes tomutanthuntingtin aggregation.Significance: HSR activation as a therapeutic strategymay promote rather than suppress aggregation of pro-teins implicated in neurodegenerative disease.
The cellular heat shock response (HSR) protects cells fromtoxicity associated with defective protein folding, and this path-way is widely viewed as a potential pharmacological target totreat neurodegenerative diseases linked to protein aggregation.Here we show that the HSR is not activated by mutant hunting-tin (HTT) even in cells selected for the highest expression levelsand for the presence of inclusion bodies containing aggregatedprotein. Surprisingly, HSR activation by HSF1 overexpressionor by administration of a small molecule activator lowers theconcentration threshold at which HTT forms inclusion bodiesin cells expressing aggregation-prone, polyglutamine-expandedfragments of HTT. These data suggest that the HSR does notmitigate inclusion body formation.
Inclusion bodies (IB)5 containing aggregated forms of dis-ease-associated proteins are histopathological features of most
neurodegenerative diseases, suggesting an intimate linkagebetween disease pathogenesis and impaired protein homeosta-sis (1). This relationship is exemplified in Huntington disease(HD),where the disease-causingmutation results in the synthe-sis of huntingtin protein (HTT) containing expanded polyglu-tamine (poly(Q)) tracts that are highly prone to aggregate andaccumulate in cytoplasmic and nuclear IB (2–4). The strongcorrelation between IB formation and disease pathology in HDand other neurodegenerative disorders has spawned interest inpotential therapeutic strategies designed to mitigate proteinaggregation by activating cellular stress response systems (5).The heat shock response (HSR) is one pathway that has been
proposed to play a protective role in neurodegenerative disease(6, 7). At its core, the HSR is a transcriptional program thatcontrols the expression of a large number of genes, includingthose encoding molecular chaperones that help to protect cellsfrom the consequences of protein misfolding in response toproteotoxic stress (8). Up-regulation of the HSR by genetic orpharmacological activation of heat shock factor 1 (HSF1), themaster transcriptional regulator of the HSR, decreases proteinaggregate burden in cell and animal models of poly(Q) andother diseases associated with protein aggregation (9). Expo-sure to geldanamycin and 17-allylamino-17-demethoxygel-danamycin (10, 11), drugs that activate the HSR indirectly byinhibitingHsp90, andmore recently to “F1,” a smallmolecule thatactivatesHSRby anHsp90-independentmechanism (12), reducesthe fraction of cells with IB in cell culture models of HD.Because experimental activation of HSR appears to amelio-
rate protein aggregate pathology, it seems likely that cells copewith protein aggregation by turning on this endogenousresponse. However, previous studies failed to detect HSR acti-vation in HD models by chromatin immunoprecipitation(ChIP) of HSF1 (13, 14). Indeed, HTT expression is associatedwith decreased levels of HSF1-regulated chaperones in striatalneuron (15) and mouse (16) HD models. One possible reasonfor the failure to detect HSR activation in these models is thatthe level of HTT aggregation in those studies was insufficient toactivate theHSR. Here, we report that cells expressingHTT failto activate theHSR irrespective of concentration or aggregationstatus. Surprisingly, our results show that activation of the HSRfavors IB formation, suggesting that this pathway does notfunction to prevent IB pathology.
EXPERIMENTAL PROCEDURES
DNA Constructs—HSE::GFP plasmid was created by insert-ing the HSP70 promoter from the Hsp70.1-pr-Luciferase plas-mid into modified pEGFP-C3 lacking a promoter (Clontech).Plasmids for HTT(Q25)-mCherry and HTT(Q91)-mCherrywere previously described (17). The plasmid for mCherry wascreated by insertingmCherry (a gift fromR.Tsien,University ofCalifornia, San Diego, La Jolla, CA) into pcDNA3.1 (Invitro-gen). The plasmid for human HSF1 was a kind gift from R.Voellmy (University of Miami, Miami, FL).Cell Lines—HSE::GFP cells were created by transfection of
U2OS Tet-On cells (Clontech) or HEK293 cells with HSE::GFP
* This work was supported, in whole or in part, by National Institutes of HealthGrant 5R01NS042842-10 from the NINDS (to R. R. K.).
1 The recipient of National Institutes of Health Predoctoral Grant2T32HG000044-16.
2 Supported in part by a fellowship from the Deutsche Forschungsgemein-schaft. Present address: Dept. of Cellular Biochemistry, Max Planck Instituteof Biochemistry, Am Klopferspitz 18, 82152 Martinsried, Germany.
3 Supported by the National Institutes of Health Training Grant in SignalTransduction and Cancer (T32 CA70085) and the National Institutes ofHealth Training Grant in Drug Discovery in Age Related Diseases (T32AG000260). Present address: Dept. of Neurobiology and Center for DrugDiscovery, Duke University, Durham, NC 27704.
4 To whom correspondence should be addressed. Tel.: 650-723-7581; Fax:650-723-0155; E-mail: [email protected].
plasmid. U2OS cells were cotransfected with linear puromycinmarker (Clontech). Transfection for 72 hwas followed by selec-tion of transformed cells in DMEM containing 1 mg/ml G418or 1 �g/ml puromycin for HEK293 and U2OS lines, respec-tively. U2OS cells were cultured in DMEM supplemented with10% fetal bovine serum (FBS) and L-glutamine. 10% animalserum was used in place of FBS for HEK293 cells. Followingselection, a population of cells expressing low HSE::GFP wassorted by FACS using a sorter equipped with a 488-nm laser(Digital Vantage, BD Biosciences).Flow Cytometry and Cell Sorting—Cells were harvested 72 h
after transfection and analyzed on an LSRII flow cytometerequipped with 488- and 535-nm lasers (BD Biosciences). Aninterval gate was set at �103-a.u. mCherry intensity, and�20,000 cells in this gate were analyzed for each condition.Data were analyzed using FlowJo (version 8.8.6; Tree Star). Agreen fluorescent protein (GFP) fluorescence histogram forparental U2OS cells was used to define a GFP-positive intervalgate. The mCherry axis was subdivided into 41 bins of equalwidth, and the percentage of GFP-positive cells was calculatedfor each bin (see Fig. 1C). For analysis of the fraction of cellswith IB by pulse-shape analysis (PulSA), cells with IBwere iden-tified using a mCherry peak width versus peak height scatterplot, and a lasso gate was drawn around the IB population. Thefraction of cells with IB was plotted against mCherry bin num-ber (see Fig. 3A). In all cases, bins containing �100 cells werenot included in the analysis. For cells treated with MG132(Enzo Life Sciences), celastrol (Sigma-Aldrich), or F1 (12), cellswere treated 48 h after transfection and analyzed by flowcytometry.DMSOwas used as a negative control. To isolate lowand high HTT(Q91)-mCherry-expressing populations, cellswere harvested 72 h after transfection and sorted according toHTT(Q91)-mCherry levels using a sorter equipped with a 575–590-nm tunable laser (Digital Vantage, BD Biosciences). Todefine low and high populations, the photomultiplier tube volt-age was set to center the nonexpressing population over the102-a.u. intensity mark, and an interval gate defining the low-expressing population was set in the 102-103-a.u. interval,whereas an interval gate defining the high-expressing popula-tion was set at �103-a.u. 1–2 � 106 cells were collected in eachgate and flash-frozen in liquid N2.EMSA—Electrophoretic mobility shift assay (EMSA) was
performed using a 32P-labeled probe containing the proximalheat shock element from the human Hsp70 promoter, asdescribed previously (18). The mixtures containing nuclearextracts and the 32P-labeled probewere incubated at room tem-perature for 20 min and analyzed by native electrophoresis on
4% polyacrylamide gels. The intensities of the shifted bandswere quantified on a PhosphorImager (GE Healthcare).Microscopy—Live-cell imaging was performed on U2OS
cells, plated inDMEMwith 10%FBS and incubated at 37 °C and5% CO2 in glass bottom 4-well chambered cover glass (Matek).Cells were transfected after 4–6 h with HTT(Q91)-mCherry orcotransfected with HTT(Q91)-mCherry and HSF1 and incu-bated for an additional 48 h. For F1 imaging experiments, cellswere treated with compound F1 for 6 h prior to the start ofimaging. Cells were imaged by time-lapse fluorescence videomicroscopy using an inverted microscope (Zeiss Axiovert200M) encased in a Perspex chamber that was heated to 37 °C.The chambered cover glass was placed in a secondary chamberperfused with humidified 5% CO2. A motorized stage allowedimaging of multiple fields. Images were acquired with a cooledcharge-coupled device (Cool-SNAP HQ) and UV light source(X-Cite; LumenDynamics), filters for visualization ofmCherry,and a 20� air objective. MetaMorph software was used to con-trol image acquisition, and ImageJ (v1.6, National Institutes ofHealth) was used for image analysis. Mean fluorescence levels
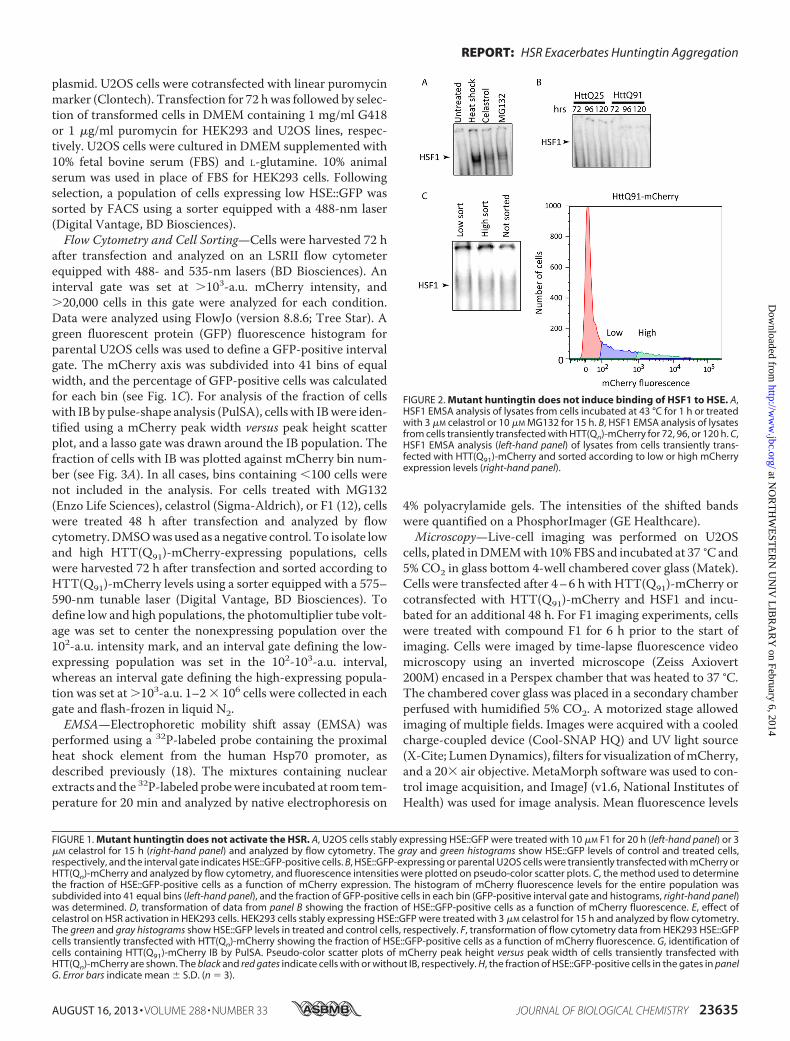
FIGURE 2. Mutant huntingtin does not induce binding of HSF1 to HSE. A,HSF1 EMSA analysis of lysates from cells incubated at 43 °C for 1 h or treatedwith 3 �M celastrol or 10 �M MG132 for 15 h. B, HSF1 EMSA analysis of lysatesfrom cells transiently transfected with HTT(Qn)-mCherry for 72, 96, or 120 h. C,HSF1 EMSA analysis (left-hand panel) of lysates from cells transiently trans-fected with HTT(Q91)-mCherry and sorted according to low or high mCherryexpression levels (right-hand panel).
FIGURE 1. Mutant huntingtin does not activate the HSR. A, U2OS cells stably expressing HSE::GFP were treated with 10 �M F1 for 20 h (left-hand panel) or 3�M celastrol for 15 h (right-hand panel) and analyzed by flow cytometry. The gray and green histograms show HSE::GFP levels of control and treated cells,respectively, and the interval gate indicates HSE::GFP-positive cells. B, HSE::GFP-expressing or parental U2OS cells were transiently transfected with mCherry orHTT(Qn)-mCherry and analyzed by flow cytometry, and fluorescence intensities were plotted on pseudo-color scatter plots. C, the method used to determinethe fraction of HSE::GFP-positive cells as a function of mCherry expression. The histogram of mCherry fluorescence levels for the entire population wassubdivided into 41 equal bins (left-hand panel), and the fraction of GFP-positive cells in each bin (GFP-positive interval gate and histograms, right-hand panel)was determined. D, transformation of data from panel B showing the fraction of HSE::GFP-positive cells as a function of mCherry fluorescence. E, effect ofcelastrol on HSR activation in HEK293 cells. HEK293 cells stably expressing HSE::GFP were treated with 3 �M celastrol for 15 h and analyzed by flow cytometry.The green and gray histograms show HSE::GFP levels in treated and control cells, respectively. F, transformation of flow cytometry data from HEK293 HSE::GFPcells transiently transfected with HTT(Qn)-mCherry showing the fraction of HSE::GFP-positive cells as a function of mCherry fluorescence. G, identification ofcells containing HTT(Q91)-mCherry IB by PulSA. Pseudo-color scatter plots of mCherry peak height versus peak width of cells transiently transfected withHTT(Qn)-mCherry are shown. The black and red gates indicate cells with or without IB, respectively. H, the fraction of HSE::GFP-positive cells in the gates in panelG. Error bars indicate mean � S.D. (n � 3).
REPORT: HSR Exacerbates Huntingtin Aggregation
AUGUST 16, 2013 • VOLUME 288 • NUMBER 33 JOURNAL OF BIOLOGICAL CHEMISTRY 23635
of all cells that formed inclusions or died during the time ofimaging were quantified immediately before inclusion forma-tion or cell death. Mean levels were determined by drawing amask around each cell, defined by the area of mCherry expres-sion, and calculating total fluorescence intensity divided by cellarea.
RESULTS AND DISCUSSION
To assess HSR activation inmammalian cells, we generated areporter cell line that stably expresses enhanced green fluores-cent protein (GFP) under transcriptional control of the heatshock element promoter (HSE::GFP). Treatment of these cellswith F1, a recently described (12) small molecule activator ofthe HSR, or the established HSR activator celastrol (Fig. 1A),increased the fraction of cells that exhibited elevated GFP fluo-rescence, establishing HSE::GFP cells as a valid reporter systemof HSR activation. To assess the effect of HTT expression onthe HSR, we expressed constructs encoding HTT exon 1 fusedto mCherry fluorescent protein (HTT(Qn)-mCherry) contain-ing an expanded (Q91) or wild-type (Q25) poly(Q) tract. Trans-fection of these HTT constructs into HSE::GFP cells resulted ina small increase in the fraction of GFP-positive cells that wasindistinguishable from that obtained by transfection ofmCherry alone (Fig. 1, B–F) and negligible when comparedwith the increase observed in cells treated with F1 or celastrol.To assess the possibility that the HSR is activated only in cellscontaining aggregated HTT, we used PulSA (19) to identifypopulations of cells with HTT IB. By analyzing the height andwidth of fluorescence emission profiles in individual cells pass-ing through the laser beam of the flow cytometer, PulSA pro-vides information about the spatial distribution of fluorescentlylabeled proteins and accurately identifies cells with IB formedby mutant HTT or other aggregation-prone disease-associatedproteins (19). We found that the fraction of HSE::GFP-positivecells in the HTT(Q91)-mCherry subpopulation with IB wasindistinguishable from the fraction of HSE::GFP-positive cellswith similar totalmCherry fluorescence but lacking IB (Fig. 1,GandH). Thus, HTT expression does not lead to detectable HSRactivation, irrespective of glutamine length, expression level, oraggregation status.To investigate the possibility that HTT overexpression could
promote increased HSF1 binding to HSE without transcrip-tional activation of the HSR, we used EMSA (18). Controlexperiments revealed robust DNA binding activity in lysates ofcells in which HSR was induced by heat shock or chemical acti-vators (Fig. 2A). In contrast, DNA binding activity was notdetected in lysates from cells transfected with HTT(Q25)-
mCherry or HTT(Q91)-mCherry (Fig. 2B), even after enrich-ment by fluorescence-activated cell sorting for cells expressingthe highest levels of HTT(Q91)-mCherry (Fig. 2C). Thus, over-expression ofHTT fails to activate theHSR and does not lead todetectable HSF1 DNA binding.Our inability to detect HSR activation in cells expressing
HTT is somewhat surprising in light of studies reportingdecreased incidence of IB following genetic and pharmacolog-ical activation of the HSR. This ameliorating effect of HSR acti-vation may reflect suppressed aggregation or enhanced clear-ance of HTT. To distinguish between these possibilities, weused PulSA to assess the effect of HSR activation on the con-centration dependence of HTT(Q91)-mCherry aggregation(Fig. 3, A and B). Although we expected that increased proteo-stasis capacity resulting fromHSR activation should reduce thefraction of cells with HTT IB at any given level of HTT(Q91)-mCherry expression, our data revealed that HSF1 overexpres-sion (Fig. 3, C–E) or treatment with compound F1 (Fig. 3F) hadthe opposite effect, causing the aggregation dose-responsecurve to shift to the left, similar to the effect observed withproteasome inhibitor (Fig. 3G). To confirm these findings, weused time-lapse fluorescence video microscopy to assess theeffect of HSR activation on the concentration at which diffuseHTT(Q91)-mCherry transitions into IB (Fig. 3H) (17). HTT lev-els prior to its aggregation into IB were significantly lower incells overexpressingHSF1 (Fig. 3I) or after cells were pretreatedwith F1 (Fig. 3J), confirming that HSR activation decreases theabsolute concentration at which HTT forms IB.How can we reconcile these findings with studies showing
that HSR activation decreases the cytotoxic effects of mutantHTT expression and decreases the frequency of cells contain-ing HTT IB? HSR activation could promote degradation orclearance of soluble (via the proteasome) or insoluble (viaautophagy) HTT, resulting in decreased IB formation orincreased IB turnover, respectively (11, 20). Alternatively,because HSR activators such as Hsp90 inhibitors increase pro-teotoxic stress in addition to activating the HSR (21), it is pos-sible that these compounds preferentially kill cells with thehighest HTT expression, thereby leading to artifactual under-estimation of incidence of IB. Our observation that HSF1 acti-vation decreases the concentration threshold at which HTTaggregates supports the view that the HSR operates mainly as ahomeostatic mechanism to oppose the effects of acute proteo-toxic stress like heat shock (6) and may not function to reducethe aggregation of proteins such as HTT. Indeed, we observethat prolonged treatment with F1 or HSF1 overexpression in
FIGURE 3. Activation of the HSR decreases the concentration at which mutant huntingtin forms IB. A, the method used to determine the fraction of cellswith IB as a function of mCherry expression. Cells with IB were identified using PulSA (red histogram), and the histogram of total mCherry fluorescence (grayhistogram) was subdivided into 41 equal bins. The fraction of cells in each bin that contained IB was determined by dividing the number of cells with IB by thenumber of total cells in that bin (enlarged histogram, right-hand panel). Note that the y axis of the enlarged histogram reports the absolute numbers of cells,whereas the y axis of the parent histograms is normalized to the total number of cells analyzed. B, the fraction of HTT(Qn)-mCherry-expressing cells with IB wasdetermined by PulSA and transformed from panel A. C, HSE::GFP cells were transiently transfected with HTT(Q91)-mCherry or HTT(Q91)-mCherry and HSF1, andthe fraction of cells that were GFP-positive was determined as a function of their mCherry fluorescence. D–G, the fraction of HTT(Q91)-mCherry-expressing cellswith IB, determined by PulSA following HSF1 overexpression (D and E) or treatment with F1 (F) or MG132 (G). H, the method used to determine the concen-tration at which HTT forms IB. Cells expressing HTT(Q91)-mCherry were imaged by time-lapse video microscopy, and a mask indicated in red was drawn in theframe preceding IB formation (white arrowhead). Elapsed time is indicated in minutes. I and J, effect of HSF1 overexpression (I, pcDNA: n � 43; HSF1: n � 51) or10 �M F1 treatment (J, DMSO: n � 9; F1: n � 22) on the concentration at which HTT(Q91)-mCherry forms IB, analyzed by time-lapse video microscopy. K, effectof HSF1 overexpression (pcDNA: n � 23; HSF1: n � 26) on the concentration of HTT(Q91)-mCherry at which cells die, analyzed by time-lapse video microscopy.The black diamond in the box plots indicates mean calculated value. p values were determined by Student’s t test. In I–K, error bars indicate mean � S.D.
REPORT: HSR Exacerbates Huntingtin Aggregation
AUGUST 16, 2013 • VOLUME 288 • NUMBER 33 JOURNAL OF BIOLOGICAL CHEMISTRY 23637
combination with HTT expression does not confer a survivaladvantage to cells with diffuse HTT(Q91)-mCherry (Fig. 3K)and leads to increased cytotoxicity (data not shown), possiblynegating a potential protective role of IB to prevent HTT-in-duced cell death (22). Therefore, although previous studies sug-gest that HSR activation, albeit by indirect means, can amelio-rate toxicity associated with protein aggregation (10–12),validation of this pathway as an effective therapeutic target inthe treatment of neurodegenerative disease awaits the develop-ment of small molecules that directly activate HSF1 and deepermechanistic insights into the physiological processes that reg-ulate the HSR.
Acknowledgments—Weare grateful toM. Brandeis for helpful discus-sions, J. Olzmann for critical reading of themanuscript, and the Stan-ford University Shared FACS Facility for access to instrumentation.
REFERENCES1. Ross, C. A., and Poirier, M. A. (2004) Protein aggregation and neurode-
generative disease. Nat. Med. 10, (suppl.) S10–S172. Davies, S.W., Turmaine,M., Cozens, B. A., DiFiglia,M., Sharp, A.H., Ross,
C. A., Scherzinger, E.,Wanker, E. E.,Mangiarini, L., and Bates, G. P. (1997)Formation of neuronal intranuclear inclusions underlies the neurologicaldysfunction in mice transgenic for the HD mutation. Cell 90, 537–548
3. DiFiglia, M., Sapp, E., Chase, K. O., Davies, S. W., Bates, G. P., Vonsattel,J. P., andAronin,N. (1997)Aggregation of huntingtin in neuronal intranu-clear inclusions and dystrophic neurites in brain. Science 277, 1990–1993
4. Scherzinger, E., Sittler, A., Schweiger, K., Heiser, V., Lurz, R., Hasenbank,R., Bates, G. P., Lehrach, H., and Wanker, E. E. (1999) Self-assembly ofpolyglutamine-containing huntingtin fragments into amyloid-like fibrils:implications for Huntington’s disease pathology. Proc. Natl. Acad. Sci.U.S.A. 96, 4604–4609
5. Calamini, B., and Morimoto, R. I. (2012) Protein homeostasis as a thera-peutic target for diseases of protein conformation.Curr. Top. Med. Chem.12, 2623–2640
6. Morimoto, R. I. (2011) The heat shock response: systems biology of pro-teotoxic stress in aging and disease.Cold SpringHarbor Symp.Quant. Biol.76, 91–99
7. Vabulas, R. M., Raychaudhuri, S., Hayer-Hartl, M., and Hartl, F. U. (2010)Protein folding in the cytoplasm and the heat shock response.Cold SpringHarb. Perspect. Biol. 2, a004390
8. Trinklein, N. D.,Murray, J. I., Hartman, S. J., Botstein, D., andMyers, R.M.(2004) The role of heat shock transcription factor 1 in the genome-wideregulation of the mammalian heat shock response. Mol. Biol. Cell 15,1254–1261
9. Nagai, Y., Fujikake, N., Popiel, H. A., and Wada, K. (2010) Induction ofmolecular chaperones as a therapeutic strategy for the polyglutamine dis-
eases. Curr. Pharm. Biotechnol. 11, 188–19710. Sittler, A., Lurz, R., Lueder, G., Priller, J., Lehrach, H., Hayer-Hartl, M. K.,
Hartl, F. U., andWanker, E. E. (2001) Geldanamycin activates a heat shockresponse and inhibits huntingtin aggregation in a cell culture model ofHuntington’s disease. Hum. Mol. Genet. 10, 1307–1315
11. Waza,M., Adachi, H., Katsuno,M.,Minamiyama,M., Sang, C., Tanaka, F.,Inukai, A., Doyu, M., and Sobue, G. (2005) 17-AAG, an Hsp90 inhibitor,ameliorates polyglutamine-mediated motor neuron degeneration. Nat.Med. 11, 1088–1095
12. Calamini, B., Silva, M. C., Madoux, F., Hutt, D. M., Khanna, S., Chalfant,M. A., Saldanha, S. A., Hodder, P., Tait, B. D., Garza, D., Balch, W. E., andMorimoto, R. I. (2012) Small-molecule proteostasis regulators for proteinconformational diseases. Nat. Chem. Biol. 8, 185–196
13. Labbadia, J., Cunliffe, H., Weiss, A., Katsyuba, E., Sathasivam, K., Sere-denina, T., Woodman, B., Moussaoui, S., Frentzel, S., Luthi-Carter, R.,Paganetti, P., and Bates, G. P. (2011) Altered chromatin architecture un-derlies progressive impairment of the heat shock response inmousemod-els of Huntington disease. J. Clin. Invest. 121, 3306–3319
14. Riva, L., Koeva, M., Yildirim, F., Pirhaji, L., Dinesh, D., Mazor, T., Duen-nwald,M. L., and Fraenkel, E. (2012) Poly-glutamine expanded huntingtindramatically alters the genome wide binding of HSF1. J. Huntingtons. Dis.1, 33–45
15. Chafekar, S. M., and Duennwald, M. L. (2012) Impaired heat shock re-sponse in cells expressing full-length polyglutamine-expanded hunting-tin. PLoS One 7, e37929
16. Hay, D. G., Sathasivam, K., Tobaben, S., Stahl, B., Marber, M., Mestril, R.,Mahal, A., Smith, D. L., Woodman, B., and Bates, G. P. (2004) Progressivedecrease in chaperone protein levels in a mouse model of Huntington’sdisease and induction of stress proteins as a therapeutic approach. Hum.Mol. Genet. 13, 1389–1405
17. Hipp,M. S., Patel, C.N., Bersuker, K., Riley, B. E., Kaiser, S. E., Shaler, T. A.,Brandeis, M., and Kopito, R. R. (2012) Indirect inhibition of 26S protea-some activity in a cellular model of Huntington’s disease. J. Cell Biol. 196,573–587
18. Mosser, D. D., Theodorakis, N. G., andMorimoto, R. I. (1988) Coordinatechanges in heat shock element-binding activity andHSP70 gene transcrip-tion rates in human cells.Mol. Cell. Biol. 8, 4736–4744
19. Ramdzan, Y. M., Polling, S., Chia, C. P., Ng, I. H., Ormsby, A. R., Croft,N. P., Purcell, A. W., Bogoyevitch, M. A., Ng, D. C., Gleeson, P. A., andHatters, D.M. (2012) Tracking protein aggregation andmislocalization incells with flow cytometry. Nat. Methods 9, 467–470
20. Gamerdinger, M., Kaya, A. M.,Wolfrum, U., Clement, A. M., and Behl, C.(2011) BAG3 mediates chaperone-based aggresome-targeting and selec-tive autophagy of misfolded proteins. EMBO Rep. 12, 149–156
21. Gupta, R., Kasturi, P., Bracher, A., Loew, C., Zheng, M., Villella, A., Garza,D., Hartl, F. U., and Raychaudhuri, S. (2011) Firefly luciferase mutants assensors of proteome stress. Nat. Methods 8, 879–884
22. Arrasate, M., Mitra, S., Schweitzer, E. S., Segal, M. R., and Finkbeiner, S.(2004) Inclusion body formation reduces levels of mutant huntingtin andthe risk of neuronal death. Nature 431, 805–810
REPORT: HSR Exacerbates Huntingtin Aggregation
23638 JOURNAL OF BIOLOGICAL CHEMISTRY VOLUME 288 • NUMBER 33 • AUGUST 16, 2013