Reports on tasks for scientific cooperation Report of experts participating in Task 3.2.13 October 2003 Assessment of the dietary exposure to organotin compounds of the population of the EU Member States Directorate-General Health and Consumer Protection
Transcript
Reports on tasks for scientific cooperation
Report of experts participating in Task 3.2.13
October 2003
Assessment of the dietary exposure to organotin compounds of the population
of the EU Member States
Directorate-General Health and Consumer Protection
INDEX
1 GENERAL PART 7
1.1 FOREWORD 8
1.2 SUMMARY 9
1.3 GLOSSARY 11
1.4 ABBREVIATION CODES FOR PARTICIPATING COUNTRIES 12
1.5 LIST OF PARTICIPANTS 13
1.6 INTRODUCTION 16
1.7 BACKGROUND ON ORGANOTIN COMPOUNDS 16
1.8 REFERENCES 18
1.9 ACTIVITY OF THE TASK 19
1.9.1 Background 19
1.9.2 Objective 19
1.9.3 Nature of the co-operation, resources and expertise required 19
1.10 QUESTIONNAIRE FOR DATA COLLECTION 20
1.10.1 Form 1 OTC Occurrence Data For Individual Food Samples 20
1.10.2 Form 2: Evidence of Analytical Quality Assurance 20
1.10.3 Form 3: Food Consumption data 20
1.10.4 Form 4: Dietary intakes 21
1.10.5 Table A Subgroups for fishery products 22
2 OVERVIEW OF SUBMITTED DATA: STATISTICS, SUMMARIZING TABLES AND DISCUSSION 24
2.1 OCCURRENCE DATA 25
2.1.1 Statistics 25
2.1.2 Summarizing Tables 26
3
Table 1. Submission of occurrence data on OTC .Distribution of the species in groups and correlation with submitting contry
28
2.1.2.1 OTC occurrence/food groups vs. submitting countries 31
Tables 2-7. Range of occurrence data on OTC.Distrubution of the species in groups and correlation with submitting country 33
Table 8. Fresh Molluscs and mussels 41
Table 9. Fresh Crustaceans 41
Table 10. Fresh Fish Marine waters 42
Table 11. Fresh Fish/Fresh Water (lake, Farm) 42
Table 12. Fresh Fish/Fresh Water (inland waterways, harbours, brackish) 43
Table 13. Fully preserved canned or fermented fish and fish products + semipreserved fish and fish products, including MCE 43
2.1.3 Discussion 41
2.1.3.1 Ranges of occurrence data vs food groups: 41
2.1.3.2 Origin and Quality of the Occurrence data 44
2.2 FOOD CONSUMPTION DATA 45
2.2.1 Statistics and Summarizing Tables 45
Table 14. Synoptic table for submitted food consumption data 45
2.2.2 Discussion 46
2.2.2.1 Food Consumption data for Food Species 46
2.2.2.2 Food Consumption data for Food Groups 46
2.2.2.3 Type of Survey to collect food consumption data 47
Table15. “Type of Survey used to collect food consumption data” 48
2.3 DIETARY INTAKE DATA 49
2.3.1 Statistics and general overview 49
2.3.2 Summarizing Tables 51
Table 16. Synoptic table for submitted otc intake data 49
Table 17. Fish food groups used to present daily intake data on OTC 53
Scientific Institute of Public Health Louis Pasteur Tel : +32-2-642 51 25 Fax : +32-2-642 56 91 e-mail :[email protected]
Dr. Lic. Jeannine Noyen Institut d’Expertise Vétérinaire Tel:+32-2-287 02 63 Fax: +32-2-287 02 01 e-mail: [email protected]. be
Denmark Ms. Hanne K, Hansen Danish Veterinary and Food Administration; Institute of Food Safety and Nutrition. Tel: (+45) 33 95 66 25 Fax: (+45) 33 95 60 01 E-mail [email protected]
France Dr. Thierry Guérin Agente FranÇaise de Sécurité Sanitaire des aliments Laboratoire d'études et de recherches sur l'hygiène et la qualité des aliments (LERQHA) Tel: +33 1 49 77 27 11 Fax: +33 1 49 77 26 95 E-mail: [email protected]
Germany Dr. Klaus Erich Appel Federal Institute for Risk Assessment Thielallee 88-92 14195 Berlin Germany Tel-No. +49 30 8412 3614 Fax-No +49 30 8412 3894 e-mail: [email protected]
Greece Dr Nikos Thomaidis Ministry Of Finance General Directorate General Chemical State Laboratory Chemical Service B' TEL : +3010-6479422 FAX : +3010-6425313
Italy Dr. Roberta Feliciani Istituto Superiore di Sanita' Laboratorio di Tossicologia Applicata Viale Regina Elena, 299 00161 Roma Italy tel ++39-06-49902379 fax ++39-06-49902379 e-mail [email protected]
Dr. Antonino Maggio Istituto Superiore di Sanita' Laboratorio di Tossicologia Applicata Viale Regina Elena, 299 00161 Roma Italy tel ++39-06-49902379 fax ++39-06-49902379 e-mail [email protected]
The Netherlands Dr R.Ritsema
State Institute for Public Health Tel 31.30.2742570 Fax 31.30.2744455 E-mail :[email protected]
Norway Marie Louise Wiborg Norwegian Food Control Authority Tel: +47 23 21 66 59 Fax: +47 23 21 70 01 E-mail: [email protected]
United Kingdom ( went out of the Task in MAY 2002)
Elizabeth Rippon Food Standards Agency Aviation House 125, Kingsway, London Tel +44 (0) 2072768726Fax + 44 (0) 2072768717 E-mail: [email protected]
EC COMMISSION DG SANCO
Dr. Martin Slayne European Commission
15
Directorate – General Healt and Consumer Protection Rue Belliard – Office G – 1 1/304 B – 1049 e-mail [email protected]
Ec Commission DG SANCO
Walter De Klerck EC Commission
COORDINATOR Dr.ssa Maria Rosaria Milana Istituto Superiore di Sanita' Laboratorio di Tossicologia Applicata Viale Regina Elena, 299 00161 Roma Italy tel ++39-06-49902379 fax ++39-06-49902379 e-mail [email protected]
SCIENTIFIC SECRETARY
Massimo Denaro Istituto Superiore di Sanita' Laboratorio di Tossicologia Applicata Viale Regina Elena, 299 00161 Roma Italy tel ++39-06-49902379 fax ++39-06-49902379 e-mail [email protected]
16
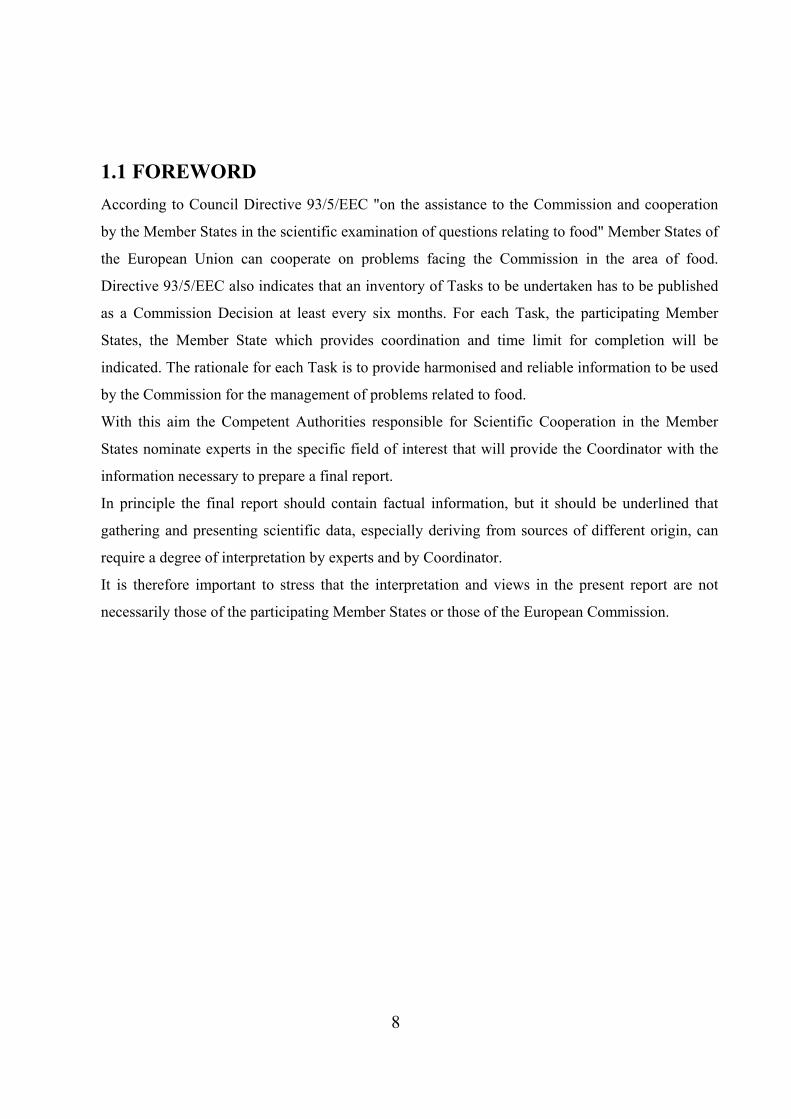
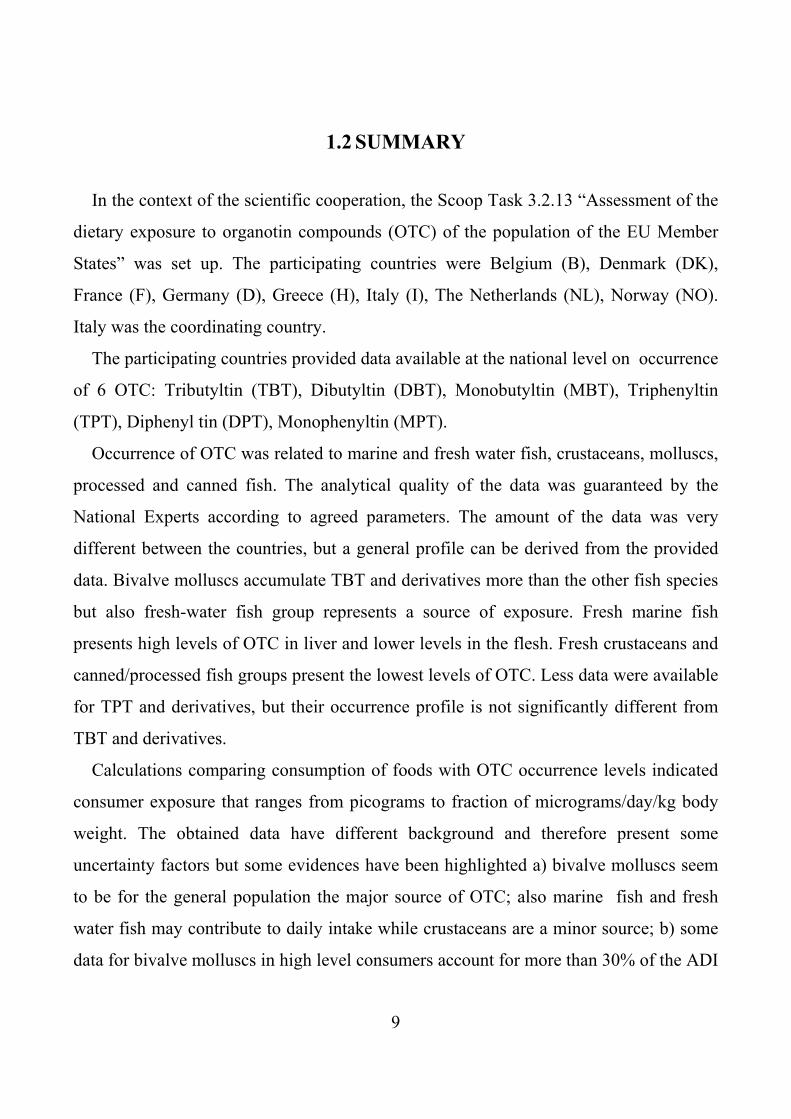
1.6 INTRODUCTION
The purpose of the present Report is to provide a scientific basis for the evaluation and
management of risk to public health arising from dietary exposure to OTC. In particular this
requires the identification of the major dietary sources of OTC and the estimation of the average
and upper range intakes by both the whole population and the consumers only and by any high risk
subgroups for each Member State.
In the context of the Scientific Cooperation a specific Task on OTC was proposed by the
Commission to the Member States and the coordination of the task was assigned to Italy, by the
Commission Decision 2001/773/EC of 26 October 2001 as updated in Commission Decision
2002/916/EC of 21 November 2002.
The participating countries in this task were: Belgium, Denmark, France, Germany, Greece,
Italy, The Netherlands and Norway. The list of participants is reported in the previous paragraph.
The United Kingdom withdrew from this Task in May 2002 because they declared not to have data
suitable for the purpose of the Task.
1.7 BACKGROUND ON ORGANOTIN COMPOUNDS (OTC)
In this last decade, there is a growing concern on the toxicological and ecotoxicological
aspects of organotins. The major uses of organotin for commercial applications are PVC Heat
Stabilizers, Biocides, Catalysts and Agrichemicals.
Organotin compounds reach humans primarily through the diet (in particular, fish and fish
products). Organotin compounds are widely diffused in the aquatic environment as a result of their
use as antifouling agents and as biocides in agricultural practices. The triorganotins (three tin-
carbon bonds) are primarily used for antifouling applications, with some use as a wood preservative
and as pesticides. The mono- and di- organotin compounds (one and two tin-carbon bonds
respectively) are used primarily as PVC stabilisers with a smaller but widespread use as catalyst for
certain chemical reactions. Certain mono- and dialkyltins have been approved as PVC stabilizers
for food contact (5). Since the 1960s, Triphenyltin (TPT) and tributyltin (TBT) compounds have
been used extensively as algicides and molluscicides in antifouling products. Use of triorganotins in
17
antifouling paints has been restricted in many countries because of their recognized effects on the
aquatic ecosystem. Triphenyltin is used as a non-systemic fungicide with mainly protective action
(4). Therefore, these chemicals occur mainly in aquatic organisms and intake of seafood may be an
important source of human exposure. From a toxicological standpoint, two groups of substances
may be recognized, tributyltin and triphenyltin compounds, both with immunotoxic properties.
Tributyltin compounds exhibit a strong endocrine disrupting potential in environmental biota as
well as in mammals. Phenyltin compounds affect various systems and functions including the
reproductive and developmental outcomes.
No official ADI/TDI values are universally agreed for TBT and derivatives. For TBT, the
ADI of 1.6 µg/kg/day is the one used in some scientific reports and adopted by the Japanese
authorities. According to the opinion of CSTEE (Scientific Committee Toxicity, Ecotoxicity and
Environment) expressed in 1998 (1) “ For human risk assessment a lower ADI (0.25 µg/kg/day) is
recommended. “1
For TPT a value of ADI for oral exposure was established by JMPR (FAO/WHO Joint
Meeting Pesticide Residues) (2) (3) in 0-0.5 µg/day/kg bw. 2
1 From CSTEE opinion (reference 1): (… the ADI of 1.6 ug/kg/day is the one adopted by the Japanese authorities. Perhaps a more cautionary level of 0.25 ug/kg/day should be used as the ADI. Such an ADI is recommended by the work of Vos. et al. (6) on the immune system in the rat. The WHO (7) considers that this endpoint is still controversial for human risk assessment. The US EPA in IRIS currently gives a Bench Mark Dose (BMD10) of 0.03 mg/Kg/day based on the work of Vos et al. (6) based on the immunotoxic response in rats; taking a safety factor of 100 this leads to an ADI of 0.30 ug/kg/day. IRIS goes on to state that no information was located regarding toxicity of TBTO in humans following oral exposure. Human data summarised by Boyer (8) suggest thaty tributyltin oxide is a potent non-allergenic dermal irritant. Indeed the effects of TBT in humans are not well documented, except for induction of apoptosis in granulocytes and human thymocytes. A value for an accurate ADI of TBT for man has not yet been universally agreed. The current acceptable values range from 5.0-0.25 ug/kg/day, (7, 8, 9):”
18
1.8 REFERENCES
1) Opinion on The report by WS Atkins International Ltd (vol. A) "Assessment of the Risks to Health and to the Environment of Tin Organic Compounds in Antifouling Paint and of the Effects of Further Restrictions on their Marketing and Use", opinion expressed at the 6th CSTEE plenary meeting, Brussels, 27 November 1998 http://europa.eu.int/comm/food/fs/sc/sct/outcome_en.html
2) Pesticide residues in food -- 1991 Report of the Joint Meeting of the FAO Panel of Experts on Pesticide Residues in Food and the Environment and a WHO Expert Group on Pesticide Residues. Rome, Food and Agriculture Organization of the United Nations, pp. 57-62 (FAO Plant Production and Protection Paper 111).
3) Pesticide residues in food -- 1991, Evaluations 1991 Part II -- Toxicology. Geneva, World Health Organization/PCS 92.52 , 1992, pp. 173-208.
4) Triphenyltin Compounds Concise International Chemical Assessment Document 13 WHO 1999
5) Directive 2001/62/EC and consolidated EEC Directive 2002/72/EC of 15 August 2002 on materials and articles in contact with foodstuffs.
6) Vos, J.G.; De Klerk, A. ; Krajnc, E.I ; Van Loveren, H. and Rozing, I. Toxicol. Appl.
Pharmacol. 105: 144-155, 1990 7) WHO. Environmental Health Criteria 116. Tributyltin Compounds. Genova 1990. 8) Boyer, I.J. Toxicology. 55: 253-298,1989 9) De Mora, S.J.; Pelletier, E. Environm. Technol. 18 : 1169-1177, 1997
2 evaluated as “Fentin compounds”
19
20
1.9 ACTIVITY OF THE TASK
1.9.1 Background: The Scoop task 3.2.13 - Assessment of the dietary exposure to organotin
compounds (OTC) of the population of the EU Member States - was undertaken within the
framework of Cooperation by Member States in the scientific examination of questions relating to
food (Commission Decision of 94/652/EC).The participating countries were Belgium, Denmark,
France, Germany, Greece, Italy, The Netherlands and Norway Italy was the coordinating country.
The United Kingdom withdrew from the Task in May 2002
1.9.2 Objective: The purpose of the activity was to provide a scientific basis for the evaluation and
management of risks to public health arising from dietary exposure to OTC. Therefore, the task was
devoted to collect all the available information on the occurrence and dietary intake of OTC in the
EU Member States In particular, this required the identification of the major dietary sources of
these compounds and the estimations of the average and upper range intakes by the whole
population for each member state. Furthermore, information on the dietary intake of any high risk
sub-group would have been be desiderable.
1.9.3 Nature of the co-operation, resources and expertise required The participating national institutes aimed to provide the latest national information in accordance
with the agreed format. Any relevant information collected over the last five years, i.e. from 1996,
was to be included. However, also earlier data were acceptable if others were not available.
The information to be collated should have been primarily concerned with:
levels of OTC (preferably of specific compounds) in foodstuffs;
food consumption data at the national level;
dietary intake and relevant exposure data for OTC at the national level.
21
1.10 QUESTIONNAIRE FOR DATA COLLECTION
In order to collect the required data, a Questionnaire was developed
The Questionnaire is composed by four different Forms:
Form 1 OTC Occurrence data for individual food samples
Form 2: Evidence of analytical Quality Assurance
Form 3: Food Consumption Data
Form 4: Dietary intakes
and an Instruction sheet
A short synthesis of the Questionnaire is presented below, while in Annex 2 to this Report the full
Questionnaire is reported.
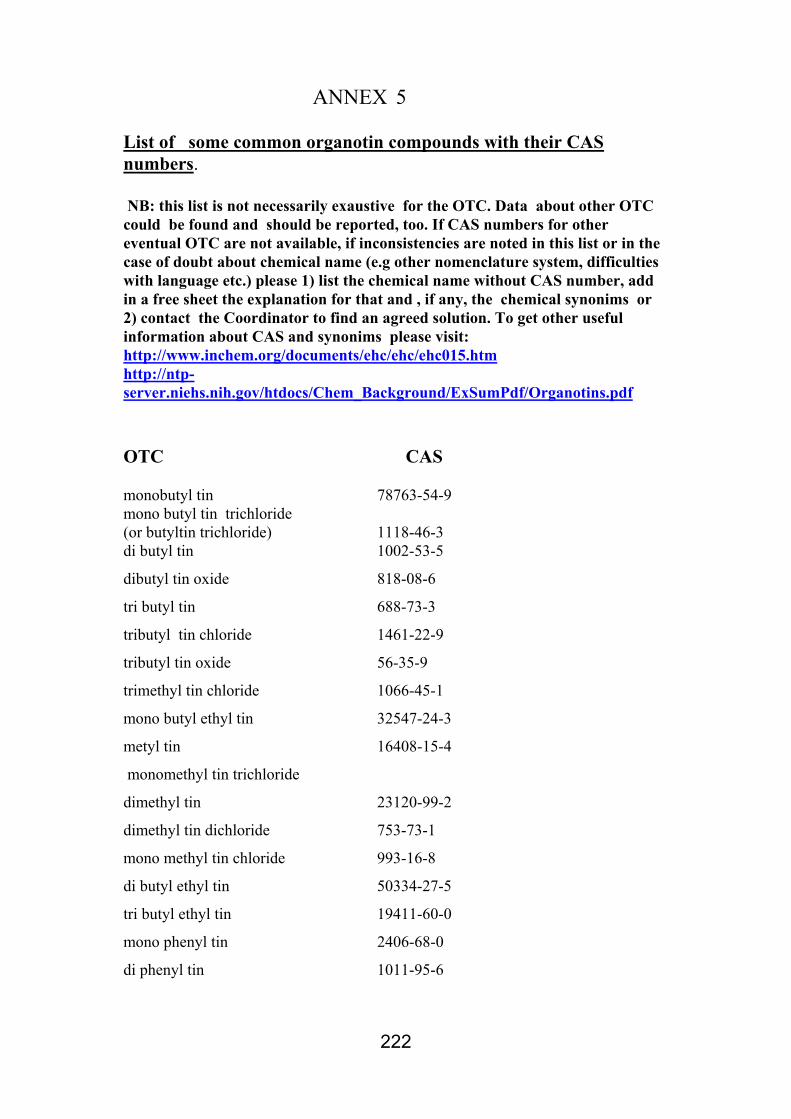
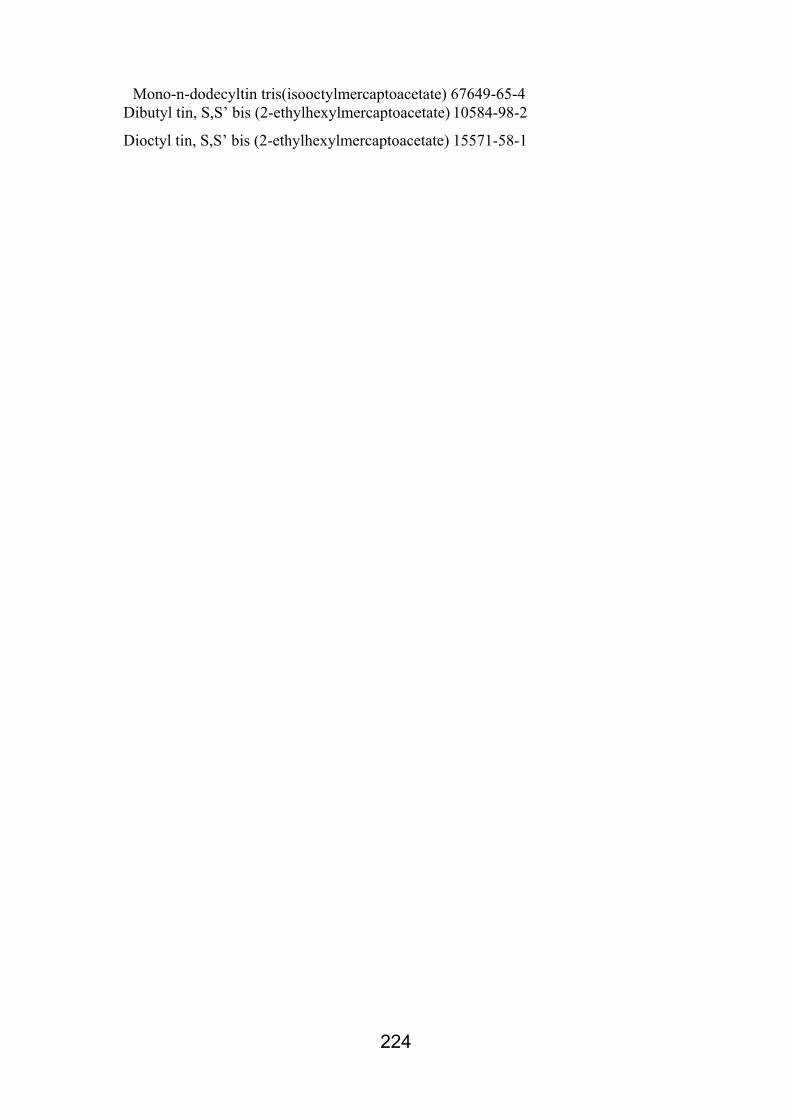
1.10.1 FORM 1 OTC OCCURRENCE DATA FOR INDIVIDUAL FOOD SAMPLES : It reports information about Organotin compounds (OTCs) detected in individual foodstuffs; the concentration found (in µg/kg) should be provided for each individual food analysed, with the results given as fresh weight. The calculations are referred to the cationic form, in the case of salts. The mean (median if not available) minimum and maximum values could be provided, too. Information is required for each specific organotin compound, but, if available, information on total OTC can be supplied in free sheets or in any other way. To perform unequivocal attribution of the OTC compounds, a list of chemicals name and their CAS numbers has been provided, too. (Annex 2 to this Report) Bearing in mind the possible degradation of the analytes, a particular attention has been posed on the description of the collection and treatment of samples prior to the analysis. 1.10.2 FORM 2: EVIDENCE OF ANALYTICAL QUALITY ASSURANCE: The relevant template reports information about quality assurance of the analytical laboratory for each item included in the occurrence template General information about Method Validation, Accreditation, Proficiency test, use of Certified Reference Materials are collected, too.
1.10.3 FORM 3: FOOD CONSUMPTION DATA :The dedicated Table reports estimates of the food consumption for the food items for which occurrence data are available. The difficulties in obtaining food consumption data which are exactly relevant to the particular food are well known. Therefore, it has been suggested that the experts provide any information that they have available to them on consumption of relevant foods and beverages together with sufficient information to allow the limitations of the data to be assessed. To this aim, a separate sheet (infosheet 02 Food consumption data – Description of survey methods) without a predefinite format has been provided to be filled with relevant information. These data are the necessary tool to perform a comparison between particularly to identify the main dietary sources of organotin compounds in each country. For each of the food items or groups of foods the experts have been required to give:
the best estimate of the mean consumption (expressed as g/person/day) for the whole population;
the best estimate of high consumption (95th percentile as a rule, but also 90th or 97.5th percentile can be reported);
In order to organize the collection, main groups of foods have been distinguished, on the basis of the food classification adapted from a CODEX system.
22
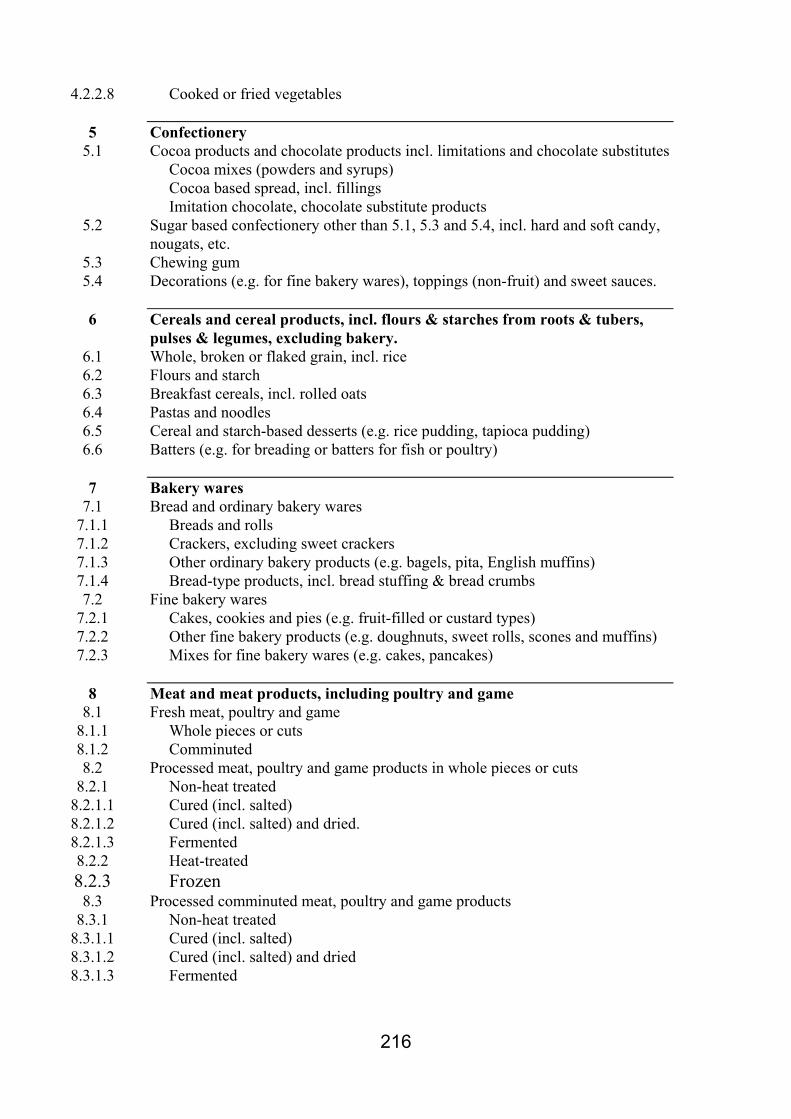
The main groups of food are: 1) Dairy products 2) Fats and oils, and fat emulsions (type water-in-oil) 3) Edible ices, including sherbet and sorbet 4) Fruits and vegetables (incl. mushrooms & fungi, roots and tubers, pulses and
legumes), and nuts & seeds 5) Confectionery 6) Cereals and cereal products, incl. flours & starches from roots & tubers, pulses &
legumes, excluding Cereals, cereal products 7) Bakery wares 8) Meat and meat products, including poultry and game 9) Fish and fish products, including molluscs, crustaceans and echinoderms (MCE) 10) Eggs and egg products 11) Sweeteners, including honey 12) Salts, spices, soups, sauces, salads, protein products, etc 13) Foodstuffs intended for particular nutritional uses 14) Beverages, excluding dairy products 15) Ready-to-eat savouries 16) Composite foods (e.g. casseroles, meat pies) - foods that could not be placed in
categories 1-15.
Taking into account the existing information, and thus expecting that the major amount of OTC
occurrence data would have been collected for fish, molluscs and similars, further subdivision was made for the group number 9 “Fish and fish products, including molluscs, crustaceans and echinoderms (MCE)”. Table A reports the subgroups for fish foods. The complete classification is reported in Annex 2 to this Report.
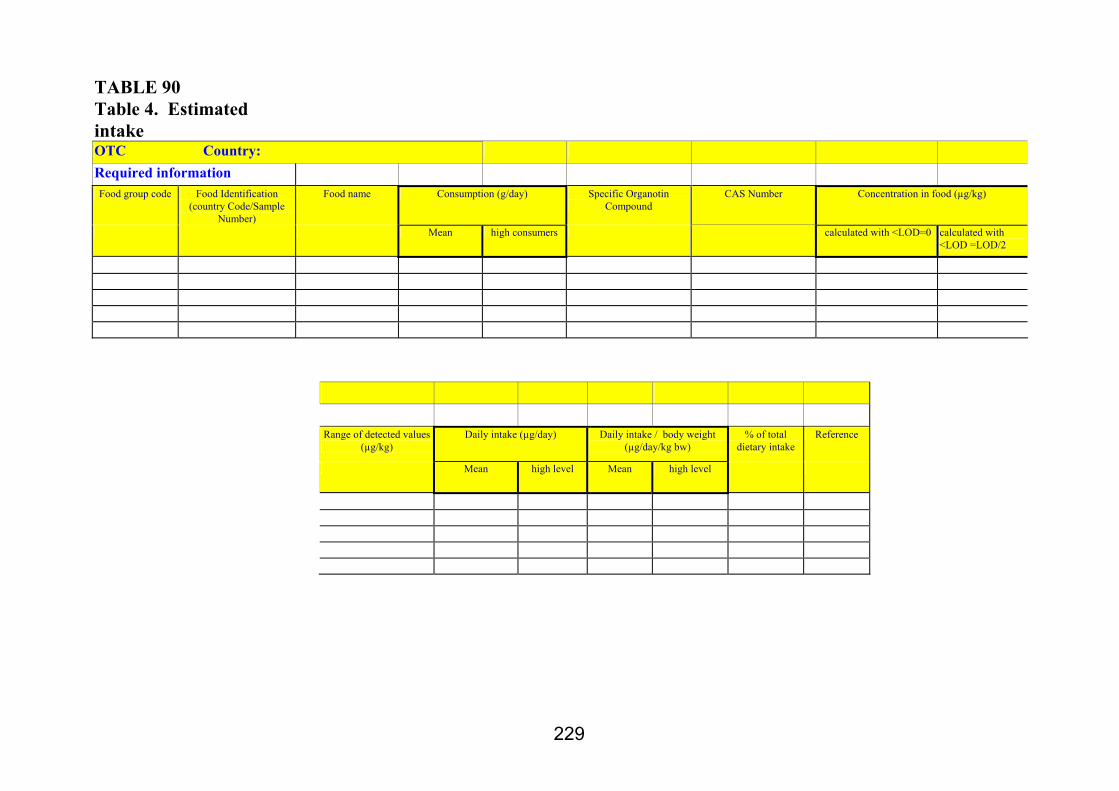
1.10.4 FORM 4: DIETARY INTAKES: This form resumes the mean OTC occurrence data from Form 1 and the food consumption data from Form 3. These data shall be properly combined in order to estimate dietary intake for each OTC compound For occurrence data below the LOD a values of LOD/2 should be used. The procedure used to estimate mean and high level intake should be clearly described in a separate sheet, (infosheet 02 Dietary intakes – Description of assumptions and calculation criteria). It has been indicated as particularly helpful if the intake data allow to identify the major food sources of the organotin compounds in the diet. Experts have been also requested to provide estimates of intakes for specific population groups and especially high-risk groups.
23
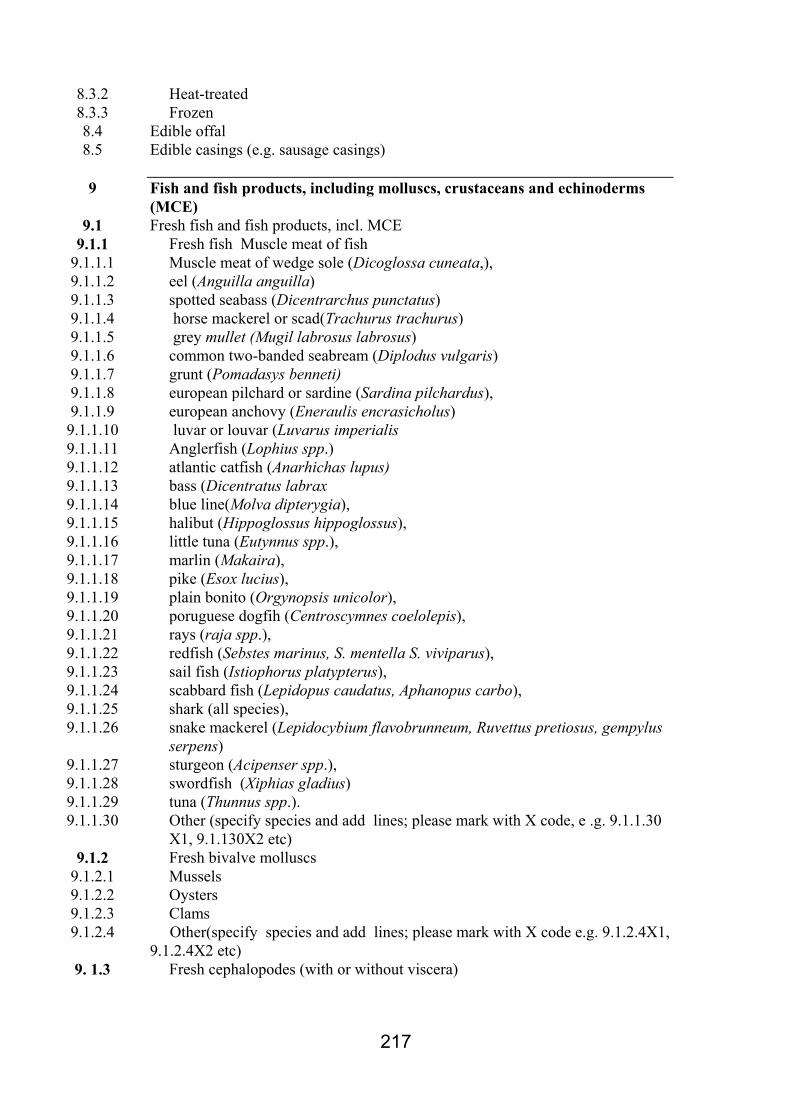
. 1.10.5 TABLE A SUBGROUPS FOR FISHERY PRODUCTS (…extract from food
cathegorisatren)
9 Fish and fish products, including molluscs, crustaceans and echinoderms (MCE)
9.1 Fresh fish and fish products, incl. MCE
9.1.1 Fresh fish Muscle meat of fish 9.1.1.1 Muscle meat of wedge sole (Dicoglossa cuneata,), 9.1.1.2 eel (Anguilla anguilla) 9.1.1.3 spotted seabass (Dicentrarchus punctatus) 9.1.1.4 horse mackerel or scad(Trachurus trachurus) 9.1.1.5 grey mullet (Mugil labrosus labrosus) 9.1.1.6 common two-banded seabream (Diplodus vulgaris) 9.1.1.7 grunt (Pomadasys benneti) 9.1.1.8 european pilchard or sardine (Sardina pilchardus), 9.1.1.9 european anchovy (Eneraulis encrasicholus) 9.1.1.10 luvar or louvar (Luvarus imperialis 9.1.1.11 Anglerfish (Lophius spp.) 9.1.1.12 atlantic catfish (Anarhichas lupus) 9.1.1.13 bass (Dicentratus labrax 9.1.1.14 blue line(Molva dipterygia), 9.1.1.15 halibut (Hippoglossus hippoglossus), 9.1.1.16 little tuna (Eutynnus spp.), 9.1.1.17 marlin (Makaira), 9.1.1.18 pike (Esox lucius), 9.1.1.19 plain bonito (Orgynopsis unicolor), 9.1.1.20 poruguese dogfih (Centroscymnes coelolepis), 9.1.1.21 rays (raja spp.), 9.1.1.22 redfish (Sebstes marinus, S. mentella S. viviparus), 9.1.1.23 sail fish (Istiophorus platypterus), 9.1.1.24 scabbard fish (Lepidopus caudatus, Aphanopus
9.1.2.3 Clams 9.1.2.4 Other(specify species and add lines; please mark
with X code e.g. 9.1.2.4X1, 9.1.2.4X2 etc)
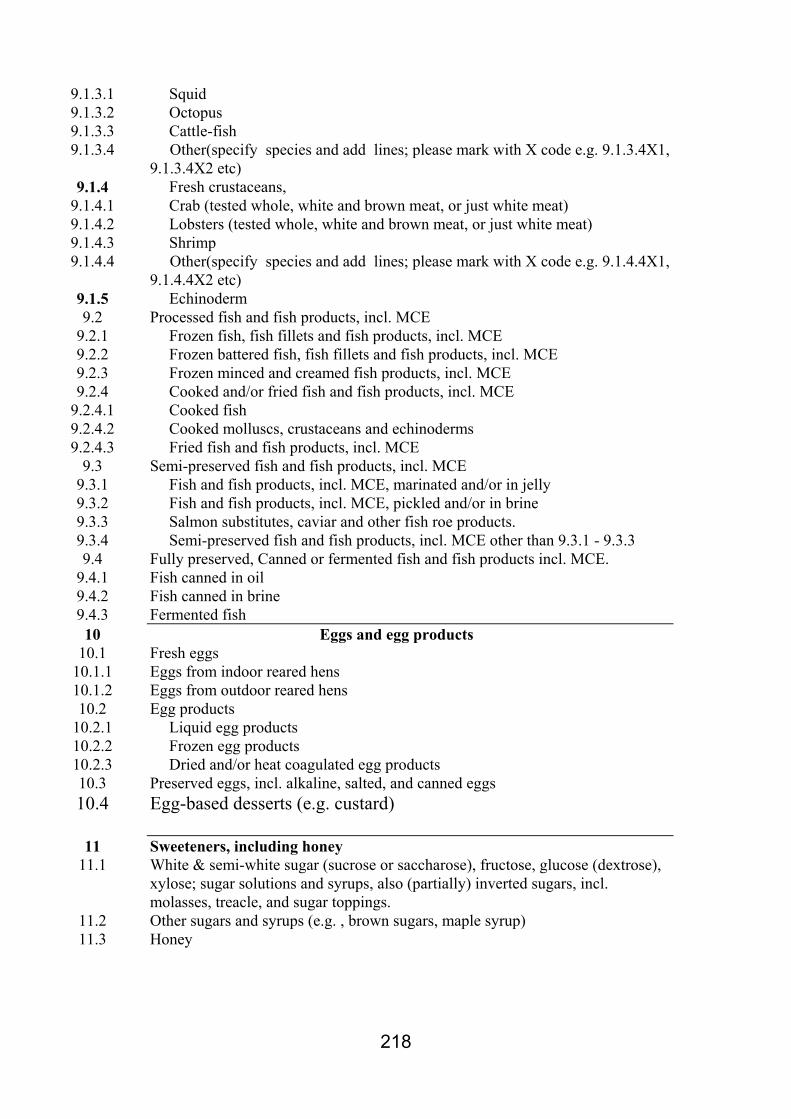
9. 1.3 Fresh cephalopodes (with or without viscera) 9.1.3.1 Squid 9.1.3.2 Octopus 9.1.3.3 Cattle-fish 9.1.3.4 Other(specify species and add lines; please mark
with X code e.g. 9.1.3.4X1, 9.1.3.4X2 etc)
9.1.4 Fresh crustaceans, 9.1.4.1 Crab (tested whole, white and brown meat, or just
white meat) 9.1.4.2 Lobsters (tested whole, white and brown meat,
or just white meat) 9.1.4.3 Shrimp 9.1.4.4 Other(specify species and add lines; please mark
with X code e.g. 9.1.4.4X1, 9.1.4.4X2 etc)
9.1.5 Echinoderm
9.2 Processed fish and fish products, incl. MCE 9.2.1 Frozen fish, fish fillets and fish products, incl. MCE 9.2.2 Frozen battered fish, fish fillets and fish products,
incl. MCE 9.2.3 Frozen minced and creamed fish products, incl. MCE 9.2.4 Cooked and/or fried fish and fish products, incl. MCE
9.2.4.1 Cooked fish 9.2.4.2 Cooked molluscs, crustaceans and echinoderms 9.2.4.3 Fried fish and fish products, incl. MCE
9.3 Semi-preserved fish and fish products, incl. MCE
9.3.1 Fish and fish products, incl. MCE, marinated and/or in jelly
9.3.2 Fish and fish products, incl. MCE, pickled and/or in brine
9.3.3 Salmon substitutes, caviar and other fish roe products. 9.3.4 Semi-preserved fish and fish products, incl. MCE other
than 9.3.1 - 9.3.3 9.4 Fully preserved, Canned or fermented fish and fish
products incl. MCE. 9.4.1 Fish canned in oil 9.4.2 Fish canned in brine 9.4.3 Fermented fish
25
2. OVERVIEW OF SUBMITTED DATA:
STATISTICS, SUMMARIZING TABLES AND DISCUSSION
26
2.1 OCCURRENCE DATA
2.1.1 STATISTICS
8 Countries submitted data on OTC occurrence in various species of fish, and mollusc
groups. United Kingdom went out of the Task in May 2002.
The countries which submitted occurrence data are: Belgium, Denmark, France, Germany,
Greece, Italy, The Netherlands, Norway.
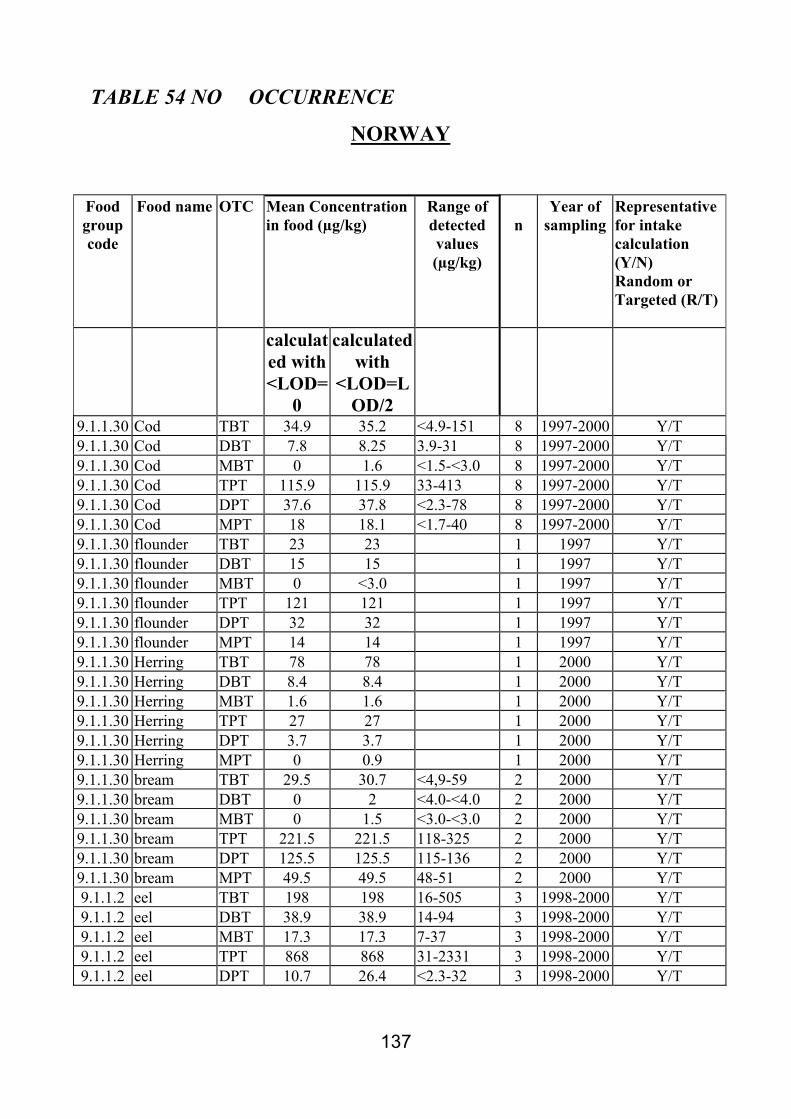
The occurrence data sent by the various countries have been summarized in Annex 1 where
is reported, for each Country, a brief description of the data and Tables resuming for each
detected compound the mean concentrations, the minimum and the maximum detected levels, the
year and the number of samples. In the Technical Annex on CD all the raw data are reported, fully
traceable with respect to all the necessary details (Analytical Methods,.Analytical Quality
Assurance, References etc.,)
The comparative examination of the available OTC occurrence data, highlighted the big
differences existing in the data send by the 8 Countries; therefore, a comparison between the
amount and the type of data send by the Countries would have been difficult without a further
grouping of the fish species.
In fact, only for mussels, or more generally for molluscs, OTC data were send by all the 8
Countries, while for the majority of the reported fish species, the data were send by only one
Country. (DE) For other common fish species ( e.g. eel, cod, crab, flounder, etc.) data were send
by 3-4 Countries.
The OTC compounds for which the major number of the participating Countries submitted
However, it must be said that for TBT and derivatives all the Countries submitted data
while data on TPT and derivatives were submitted by 5/8 countries. Data on Tetrabutyltin and
Tetraphenyltin were submitted only by Germany and are reported in ANNEX 2 (Table 50, Tables
67-74).
Occurrence data on MOT, (Monoctyltin) DOT, (Dioctyltin) and TOT (Trioctyltin)
in fish and fish products were submitted only by Germany, but in limited number of samples
and always <LOD. For these reasons these compounds will be no more considered in this
Report. On the other hand, Germany itself did not use these data to calculate intake.
2.1.2 SUMMARIZING TABLES With the unique purpose to describe the submissions for OTC occurrence data, the following re-
grouping of the foods have been done:
1) Mussels 2) Fresh molluscs and bivalve molluscs other than mussels 3) Fresh Fish /Marine water 4) Fresh Fish /Fresh water(Farm, Lake) 5) Fresh Fish/ Fresh water(Inland waterways, harbour, brackish water) 6) Fresh crustaceans 7) Fresh Cephalopodes 8) Semipreserved fish and fish products including Molluscs, Crustaceans Echinoderms (MCE)
28
9) Fully preserved, Canned or fermented fish and fish products including MCE 10) Other foods (fish oil, birds etc)
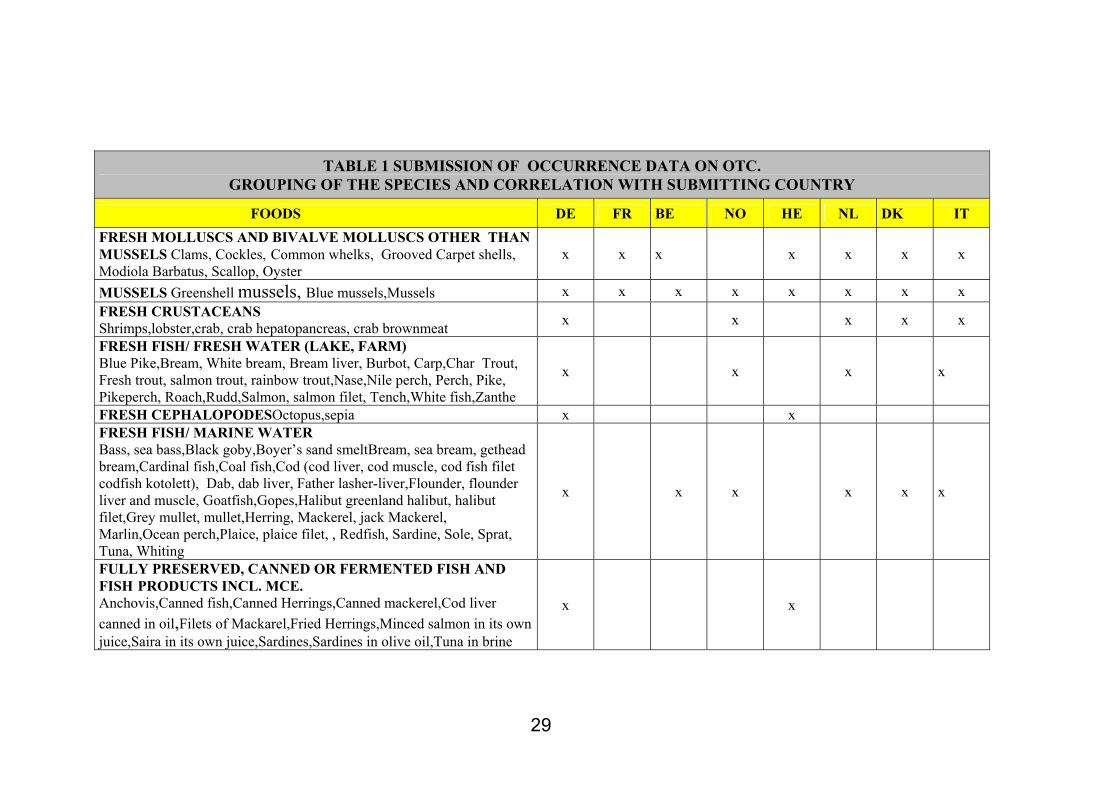
Table 1 ”Submission of occurrence” data on otc reports all the fishery foods send by the 8
Countries, re- grouped according to the above ten classes and the Country that send data for each
group. It must be underlined that the “x” mark in the Table 1 means that a Country send OTC data
about the group (at least about one of the species in that class) and not that each Country send OTC
data for all the fish species reported in the group.
29
TABLE 1 SUBMISSION OF OCCURRENCE DATA ON OTC.
GROUPING OF THE SPECIES AND CORRELATION WITH SUBMITTING COUNTRY
FOODS DE FR BE NO HE NL DK IT FRESH MOLLUSCS AND BIVALVE MOLLUSCS OTHER THAN MUSSELS Clams, Cockles, Common whelks, Grooved Carpet shells, Modiola Barbatus, Scallop, Oyster
x x x x x x x
MUSSELS Greenshell mussels, Blue mussels,Mussels x x x x x x x x FRESH CRUSTACEANS Shrimps,lobster,crab, crab hepatopancreas, crab brownmeat x x x x x
FRESH FISH/ FRESH WATER (LAKE, FARM) Blue Pike,Bream, White bream, Bream liver, Burbot, Carp,Char Trout, Fresh trout, salmon trout, rainbow trout,Nase,Nile perch, Perch, Pike, Pikeperch, Roach,Rudd,Salmon, salmon filet, Tench,White fish,Zanthe
x x x x
FRESH CEPHALOPODESOctopus,sepia x x FRESH FISH/ MARINE WATER Bass, sea bass,Black goby,Boyer’s sand smeltBream, sea bream, gethead bream,Cardinal fish,Coal fish,Cod (cod liver, cod muscle, cod fish filet codfish kotolett), Dab, dab liver, Father lasher-liver,Flounder, flounder liver and muscle, Goatfish,Gopes,Halibut greenland halibut, halibut filet,Grey mullet, mullet,Herring, Mackerel, jack Mackerel, Marlin,Ocean perch,Plaice, plaice filet, , Redfish, Sardine, Sole, Sprat, Tuna, Whiting
x x x x x x
FULLY PRESERVED, CANNED OR FERMENTED FISH AND FISH PRODUCTS INCL. MCE. Anchovis,Canned fish,Canned Herrings,Canned mackerel,Cod liver canned in oil,Filets of Mackarel,Fried Herrings,Minced salmon in its own juice,Saira in its own juice,Sardines,Sardines in olive oil,Tuna in brine
x x
30
DE FR BE NO HE NL DK IT SEMIPRESERVED FISH AND FISH PRODUCTS INCL MCE Mixed seafood,Mussels marinated,herring marinated,smoked herring,smoked eel, Smoked salmon
x
GASTEROPODS x FRESH FISH, FRESH WATER(INLAND HARBOUR, BRACKISH WATER Barbel,Bream, White bream, Carp, Chub, Eel, salmon trout, Nase,Perch, Pike,Pikeperch,Plaice,Rau,Roach, Salmon, Tench
x
OTHER Oily fish, x
Fish oil x
BIRDS Mute swan – liver,Eider – liver ,Greater black – backed gull – liver x
31
The above Table 1 shows a synoptic view about the situation and the availability of OTC
occurrence data, but other topics need to be stressed.
1) The contribution of each country is very different in the number of the food species for
which data were submitted
Germany submitted occurrence data on 69 species, The Netherlands on 14 species, Denmark
on 12 species, Italy on 10 species, Norway on 9 species, Greece on 7 species, Belgium on 5
species, France on 3 species.
2) For the same species, the amount of occurrence data submitted by the 8 Countries is very
different, too.
The representativity of the occurrence data could be strongly influenced by the amount of
samples reported. In fact, when data are not generated during a monitoring programme or in a
targeted study, just a high number of spot samples could represent a solid base for
representativity, otherwise the amount of detected OTC could be scarcely significant. Except
for FR and BE that declared to have few occurrence data, the National Experts considered the
presented data as suitable to represent OTC occurrence profile. In some cases (IT, DK) the
National Experts marked a part of the presented OTC occurrence data as not representative of
the situation of food actually eaten (old data, harbour area, highly industrial region and fish
do not destined to be eaten).
3) For the same fish species, more than a cluster of data was provided by some Countries
This makes not easy a comparison between the occurrence data from the different Countries.
However, a unique figure with a total mean (with minimum and maximum) for each country,
preferable for the purpose of this Scoop, is difficult to get in the case of different studies.
4) Generally, 7/8 Countries did not perform the calculation of the mean of OTC occurrence in
the individual fish species that they have submitted.
a) when food consumption data were not available at the national level for these
species, neither as single species nor in a group (DK,)
b) when food groups were established at the national level for calculating the
dietary intake (DE, HE, NO, IT) or
32
c) when data were deemed by the National Experts not representative for intake
calculations (BE, DK, FR, IT).
Only NL submitted mean calculations for occurrence for all the samples they submitted,
independently from the availability of food consumption data. NO made assumptions for
some food groups and, in the meantime presented mean data for some single fish species.
2.1.2.1 OTC occurrence / food groups vs. submitting countries.
On the basis of the above considerations, to describe and to collate occurrence data, summarizing
tables are shown; in these tables the ranges of OTC occurrence are correlated to seven food groups
(6 fish food + 1 other) and to the submitting country.
The following criteria have been selected to extract and to collect the data from the raw data tables
(see Annex on CD-ROM):
1) The data have been grouped separately for each OTC, therefore 6 separate Tables (Tables
2-7) have been reported;
2) The occurrence data marked by the National Experts as “not representative” have not been
reported in the Tables 2-7. Therefore, occurrence data for France and Belgium have not
been reported at all. In fact the National Experts deemed the whole set of their data “not
representative” being not enough in their amounts or being too old to describe the actual
situation; so these data will not be discussed here. However the data submitted by FR and
BE are reported in the summaries of occurrences data in this Report and in extended form in
the Technical Annex on CD-ROM.
3) Where available, the mean occurrence values calculated by the National Expert have been
used and the data have been marked in the Tables 2-7 with (*). The mean values calculated
with <LOD =LOD/2 have been reported in the Tables. The other data(<LOD=0) are
reported in Summaries (annex 1) or in the Technical Annex on CD
4) Where a mean value was not available, the range of the available experimental data have
been reported in the Tables 2-7 and the data have ben marked with (**) ; it must be said
that also where more than a cluster of occurrence data for the same species was provided by
a country, without calculating the mean, the data were reported as a range, too.
5) It was not possible to calculate a mean figure for occurrence in each one of the seven fish
groups because of the different background of the data. For an example, the mean data
presented by Germany are based on several hundreds or even 1 or 2 thousands of data,
33
while, in other cases, the data referred to the same fish group, for other countries, are
specific for just one-two species of the group and are based on less then 10 samples.
However, even with the above limitations, some indications can be derived from the data as
appears in summarizing Tables 2-7 reported in the following pages:
34
TABLE 2 RANGE OF OCCURRENCE DATA ON TRIBUTYLTIN (TBT) . GROUPING OF THE SPECIES AND CORRELATION WITH SUBMITTING COUNTRY (data in µg/kg)
* mean values for the group ** experimental ranges for one or more species DE NO HE NL DK IT
FRESH FISH/ FRESH WATER (LAKE, FARM) Blue Pike,Bream, White bream, Bream liver,Burbot,Carp,Char Eel, , Trout, Fresh trout, salmon trout, rainbow trout,Nase,Nile perch Perch, Pike,Pikeperch,Roach,Rudd,Salmon, salmon filet, Tench,White fish,Zanthe
22.34*
11**
FRESH FISH, FRESH WATER(INLAND HARBOUR, BRACKISH WATER Barbel,Bream, White bream, Carp,Chub,Eel, salmon trout, Nase,Perch, Pike,Pikeperch,PlaiceRau,Roach,Salmon, Tench
43.81* 198** only eel
7.8-18**
19.7-44**
FRESH CEPHALOPODES Octopus,sepia 2 (<lod)
FRESH FISH/ MARINE WATER Bass, sea bass,Black goby,Boyer’s sand smelt,Bream, sea bream, gilthead bream,Cardinal fish,Coal fish,Cod (cod liver, cod muscle, cod fish filet codfish kotolett), Dab, dab liver, Father lasher-liver,Flounder, flounder liver and muscle, Goatfish,Gopes,Halibut greenland halibut, halibut filet,Grey mullet, mullet,Herring, Mackerel, jack Mackerel, Marlin, Ocean perch, Plaice, plaice filet, Redfish,Sardine,Sole,Sprat,Tuna,Whiting
8.78* 6.1-96.5**
1-17**
31-43.1** 12.1-38 **
PROCESSED FISH, (Group A) SEMIPRESERVED FISH AND FISH PRODUCTS INCL MCE (Group B) Mixed seafood,Mussels marinated, herring marinated,smoked herring,smoked eel,Smoked salmon, canned fish
TABLE 3 SUBMISSION OF OCCURRENCE DATA ON DIBUTYLTIN (DBT)
GROUPING OF THE SPECIES AND CORRELATION WITH SUBMITTING COUNTRY (data in ug/kg) * mean values for the group ** experimental ranges for one or more species
FRESH FISH/ FRESH WATER (LAKE, FARM) Blue Pike,Bream, White bream, Bream liver,Burbot,Carp,Char, Eel , Trout, Fresh trout, salmon trout, rainbow trout,Nase,Nile perch Perch, Pike,Pikeperch,Roach,Rudd,Salmon, salmon filet, Tench,White fish,Zanthe
5.13* 0.5**
FRESH FISH, FRESH WATER(INLAND HARBOUR, BRACKISH WATER Barbel,Bream, White bream, Carp,Chub,Eel, salmon trout, Nase,Perch, Eel Pike,Pikeperch,PlaiceRau,Roach,Salmon, Tench
2.69* 38.9** only eel
0.8-2.1**
0.5-10.2**
FRESH CEPHALOPODES Octopus,sepia 5(<lod) FRESH FISH/ MARINE WATER Bass, sea bass,Black goby,Boyer’s sand smelt,Bream, sea bream, gilthead bream,Cardinal fish,Coal fish,Cod (cod liver, cod muscle, cod fish filet codfish kotolett), Dab, dab liver, Father lasher-liver,Flounder, flounder liver and muscle, Goatfish,Gopes,Halibut greenland halibut, halibut filet,Grey mullet, mullet,Herring, Mackerel, jack Mackerel, Marlin, Ocean perch, Plaice, plaice filet, Redfish,Sardine,Sole,Sprat,Tuna,Whiting
1.67* 2-48.4 **
0.1-2.5**
11.28-216.7 **
0.5-10 **
PROCESSED FISH, SEMIPRESERVED FISH AND FISH PRODUCTS INCL MCE Mixed seafood,Mussels marinated,herring marinated,smoked herring,smoked eel,Smoked salmon, canned fish
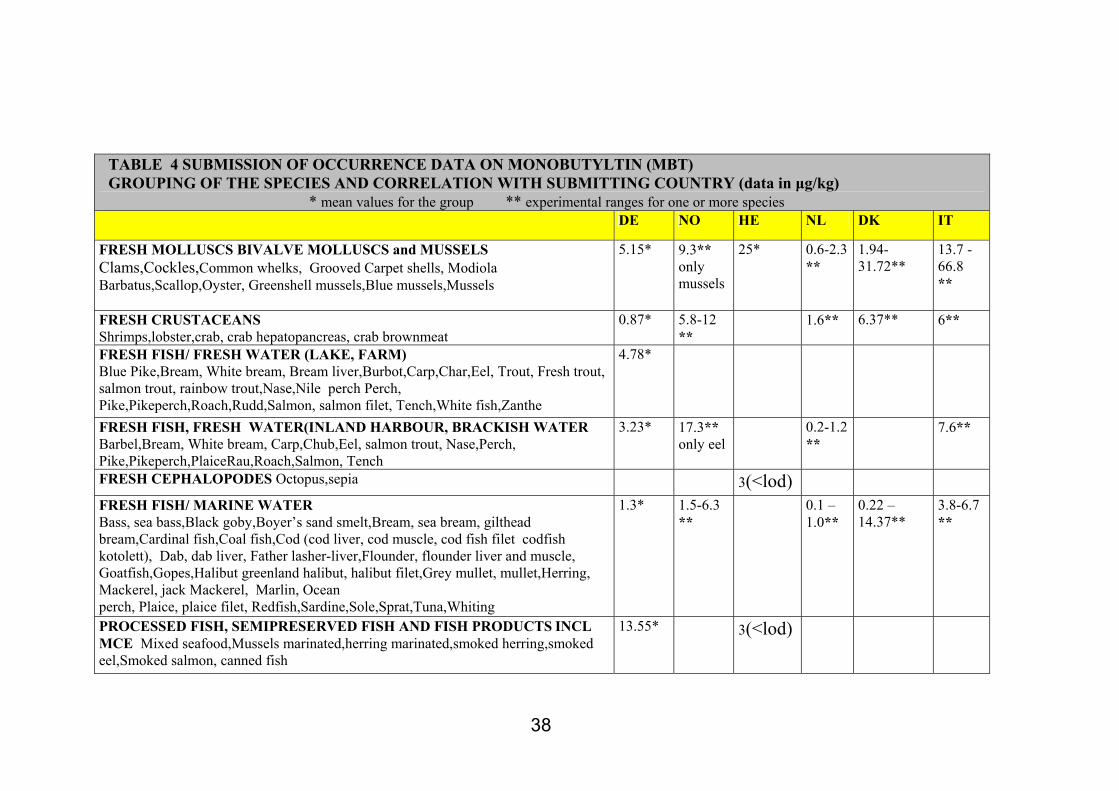
FRESH FISH/ FRESH WATER (LAKE, FARM) Blue Pike,Bream, White bream, Bream liver,Burbot,Carp,Char,Eel, Trout, Fresh trout, salmon trout, rainbow trout,Nase,Nile perch Perch, Pike,Pikeperch,Roach,Rudd,Salmon, salmon filet, Tench,White fish,Zanthe
4.78*
FRESH FISH, FRESH WATER(INLAND HARBOUR, BRACKISH WATER Barbel,Bream, White bream, Carp,Chub,Eel, salmon trout, Nase,Perch, Pike,Pikeperch,PlaiceRau,Roach,Salmon, Tench
3.23* 17.3** only eel
0.2-1.2**
7.6**
FRESH CEPHALOPODES Octopus,sepia 3(<lod)
FRESH FISH/ MARINE WATER Bass, sea bass,Black goby,Boyer’s sand smelt,Bream, sea bream, gilthead bream,Cardinal fish,Coal fish,Cod (cod liver, cod muscle, cod fish filet codfish kotolett), Dab, dab liver, Father lasher-liver,Flounder, flounder liver and muscle, Goatfish,Gopes,Halibut greenland halibut, halibut filet,Grey mullet, mullet,Herring, Mackerel, jack Mackerel, Marlin, Ocean perch, Plaice, plaice filet, Redfish,Sardine,Sole,Sprat,Tuna,Whiting
1.3* 1.5-6.3 **
0.1 – 1.0**
0.22 – 14.37**
3.8-6.7 **
PROCESSED FISH, SEMIPRESERVED FISH AND FISH PRODUCTS INCL MCE Mixed seafood,Mussels marinated,herring marinated,smoked herring,smoked eel,Smoked salmon, canned fish
13.55* 3(<lod)
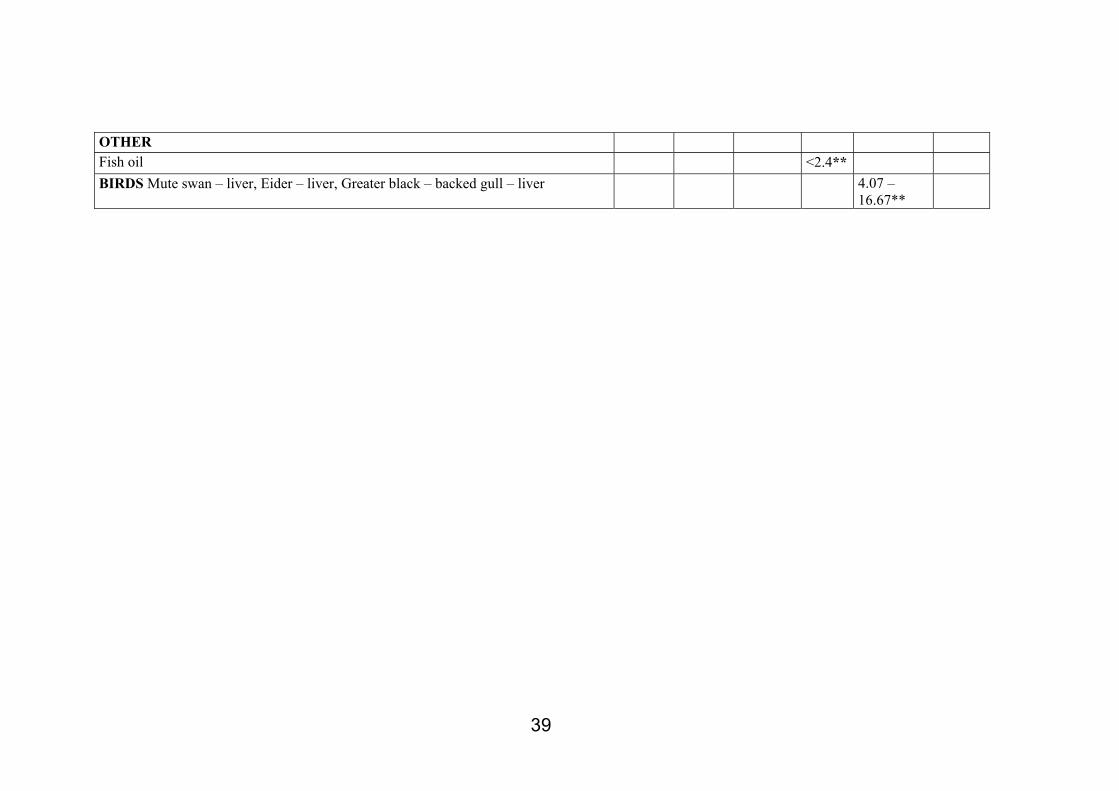
39
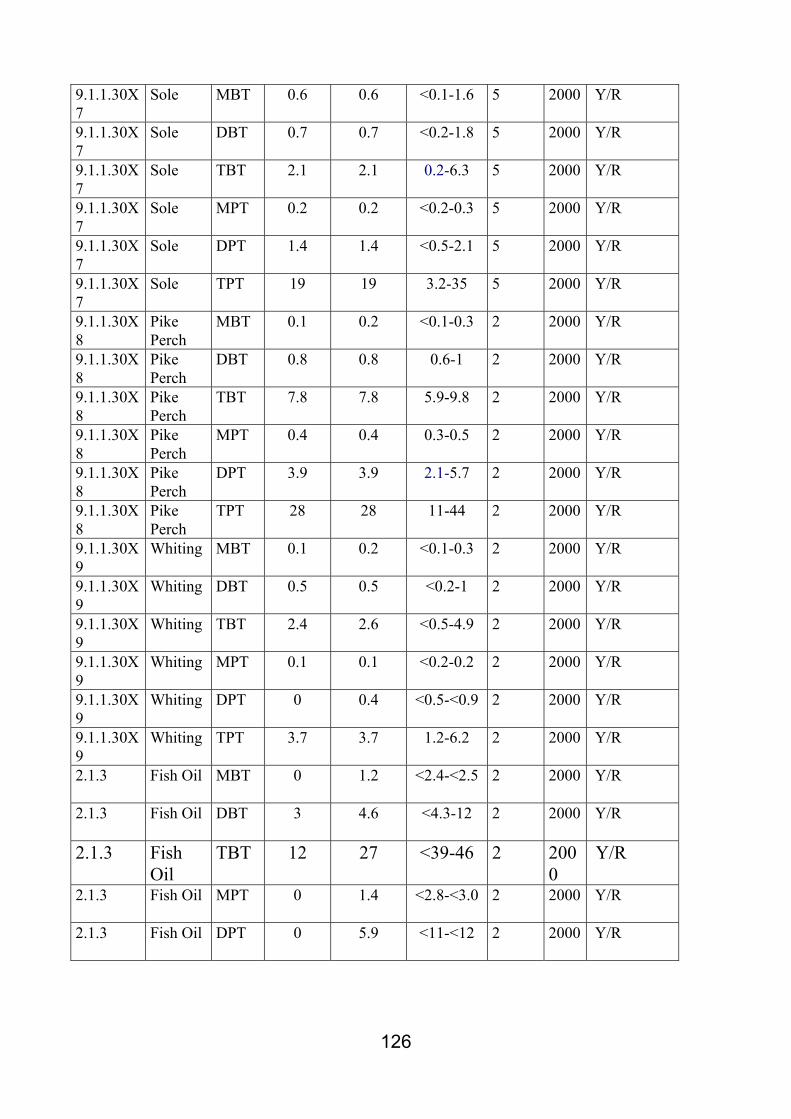
OTHER Fish oil <2.4** BIRDS Mute swan – liver, Eider – liver, Greater black – backed gull – liver 4.07 –
16.67**
40
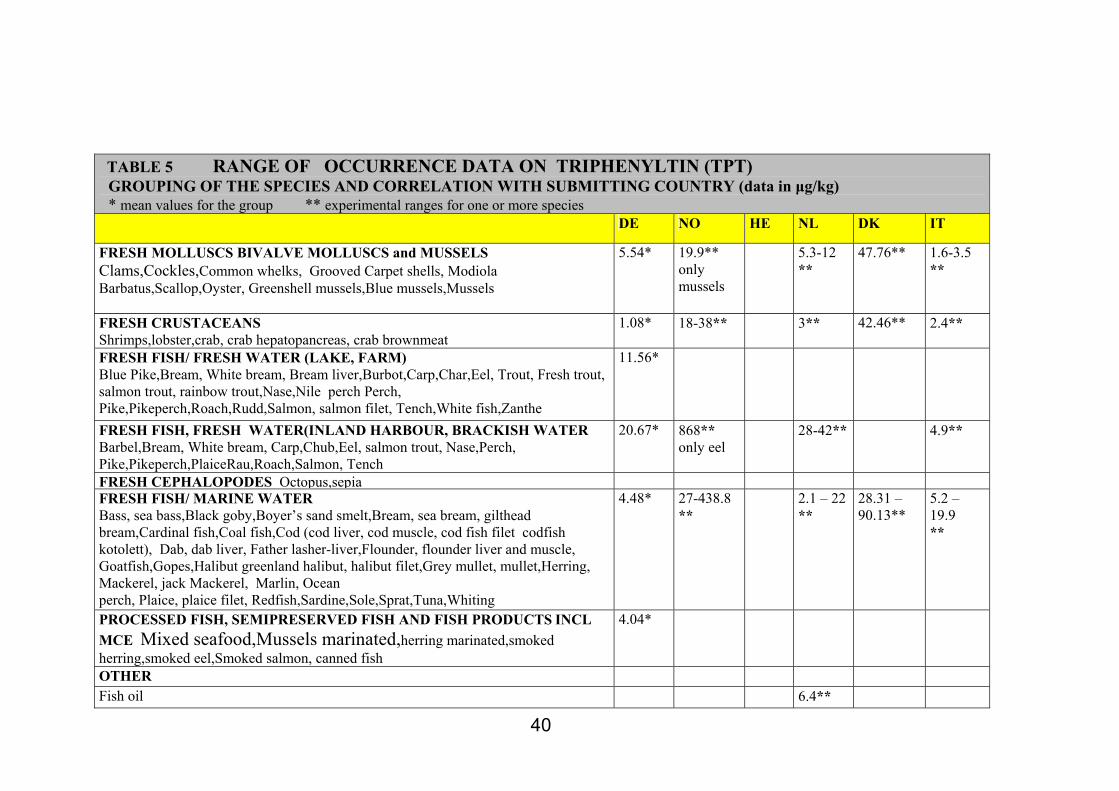
TABLE 5 RANGE OF OCCURRENCE DATA ON TRIPHENYLTIN (TPT)
GROUPING OF THE SPECIES AND CORRELATION WITH SUBMITTING COUNTRY (data in µg/kg) * mean values for the group ** experimental ranges for one or more species
FRESH FISH/ FRESH WATER (LAKE, FARM) Blue Pike,Bream, White bream, Bream liver,Burbot,Carp,Char,Eel, Trout, Fresh trout, salmon trout, rainbow trout,Nase,Nile perch Perch, Pike,Pikeperch,Roach,Rudd,Salmon, salmon filet, Tench,White fish,Zanthe
11.56*
FRESH FISH, FRESH WATER(INLAND HARBOUR, BRACKISH WATER Barbel,Bream, White bream, Carp,Chub,Eel, salmon trout, Nase,Perch, Pike,Pikeperch,PlaiceRau,Roach,Salmon, Tench
20.67* 868** only eel
28-42** 4.9**
FRESH CEPHALOPODES Octopus,sepia FRESH FISH/ MARINE WATER Bass, sea bass,Black goby,Boyer’s sand smelt,Bream, sea bream, gilthead bream,Cardinal fish,Coal fish,Cod (cod liver, cod muscle, cod fish filet codfish kotolett), Dab, dab liver, Father lasher-liver,Flounder, flounder liver and muscle, Goatfish,Gopes,Halibut greenland halibut, halibut filet,Grey mullet, mullet,Herring, Mackerel, jack Mackerel, Marlin, Ocean perch, Plaice, plaice filet, Redfish,Sardine,Sole,Sprat,Tuna,Whiting
4.48*
27-438.8 **
2.1 – 22 **
28.31 – 90.13**
5.2 – 19.9 **
PROCESSED FISH, SEMIPRESERVED FISH AND FISH PRODUCTS INCL MCE Mixed seafood,Mussels marinated,herring marinated,smoked herring,smoked eel,Smoked salmon, canned fish
TABLE 6 RANGE OF OCCURRENCE DATA ON DIPHENYLTIN (DPT)
GROUPING OF THE SPECIES AND CORRELATION WITH SUBMITTING COUNTRY (data in µg/kg) * mean values for the group ** experimental ranges for one or more species
FRESH FISH/ FRESH WATER (LAKE, FARM) Blue Pike,Bream, White bream, Bream liver,Burbot,Carp,Char,Eel, Trout, Fresh trout, salmon trout, rainbow trout,Nase,Nile perch Perch, Pike,Pikeperch,Roach,Rudd,Salmon, salmon filet, Tench,White fish,Zanthe
2.67*
FRESH FISH, FRESH WATER(INLAND HARBOUR, BRACKISH WATER Barbel,Bream, White bream, Carp,Chub,Eel, salmon trout, Nase,Perch, Pike,Pikeperch,PlaiceRau,Roach,Salmon, Tench
6.9* 26.4** only eel
3-3.9** 2.3**
FRESH CEPHALOPODES Octopus,sepia FRESH FISH/ MARINE WATER Bass, sea bass,Black goby,Boyer’s sand smelt,Bream, sea bream, gilthead bream,Cardinal fish,Coal fish,Cod (cod liver, cod muscle, cod fish filet codfish kotolett), Dab, dab liver, Father lasher-liver,Flounder, flounder liver and muscle, Goatfish,Gopes,Halibut greenland halibut, halibut filet,Grey mullet, mullet,Herring, Mackerel, jack Mackerel, Marlin, Ocean perch, Plaice, plaice filet, Redfish,Sardine,Sole,Sprat,Tuna,Whiting
0.82* 3.7 – 125.5 **
0.3 – 1.7**
2.99 – 8.12**
2.8 – 5.7 **
PROCESSED FISH, SEMIPRESERVED FISH AND FISH PRODUCTS INCL MCE Mixed seafood,Mussels marinated,herring marinated,smoked herring,smoked eel,Smoked salmon, canned fish
TABLE 7 RANGE OF OCCURRENCE DATA ON MONOPHENYLTIN (MPT) .
GROUPING OF THE SPECIES AND CORRELATION WITH SUBMITTING COUNTRY (data in µg/kg) * mean values for the group ** experimental ranges for one or more species
FRESH FISH/ FRESH WATER (LAKE, FARM) Blue Pike,Bream, White bream, Bream liver,Burbot,Carp,Char,Eel, Trout, Fresh trout, salmon trout, rainbow trout,Nase,Nile perch Perch, Pike,Pikeperch,Roach,Rudd,Salmon, salmon filet, Tench,White fish,Zanthe
2.5* (<lod)
FRESH FISH, FRESH WATER(INLAND HARBOUR, BRACKISH WATER Barbel,Bream, White bream, Carp,Chub,Eel, salmon trout, Nase,Perch, Pike,Pikeperch,PlaiceRau,Roach,Salmon, Tench
3.5* 10.8** only eel
0.4** 3.4**
FRESH CEPHALOPODES Octopus,sepia
FRESH FISH/ MARINE WATER Bass, sea bass,Black goby,Boyer’s sand smelt,Bream, sea bream, gilthead bream,Cardinal fish,Coal fish,Cod (cod liver, cod muscle, cod fish filet codfish kotolett), Dab, dab liver, Father lasher-liver,Flounder, flounder liver and muscle, Goatfish,Gopes,Halibut greenland halibut, halibut filet,Grey mullet, mullet,Herring, Mackerel, jack Mackerel, Marlin, Ocean perch, Plaice, plaice filet, Redfish,Sardine,Sole,Sprat,Tuna,Whiting
1.45* (<lod)
0.9 – 63.5 **
0.1-0.8**
1.07** 5.2 – 10.2**
PROCESSED FISH, SEMIPRESERVED FISH AND FISH PRODUCTS INCL MCE Mixed seafood,Mussels marinated,herring marinated,smoked herring,smoked eel,Smoked salmon, canned fish
2.5* (<lod)
45
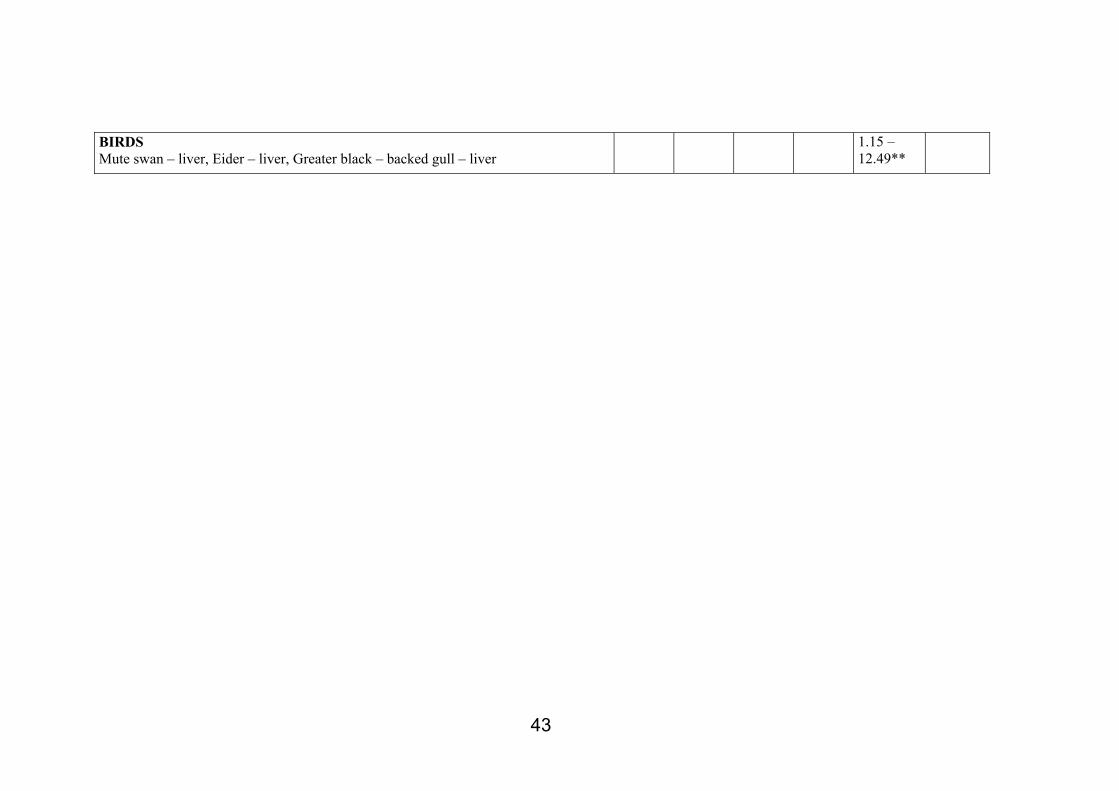
OTHER Fish oil <2.8** BIRDS Mute swan – liver, Eider – liver, Greater black – backed gull – liver
0.33**
46
2.1.3 DISCUSSION
2.1.3.1 Ranges of occurrence data vs food groups: In addition to the Tables collating data separately for each one of the OTC, the following
schemes with the collation of the ranges of occurrence data with respect to food groups have
been prepared, too.
TABLE 8 FRESH MOLLUSCS BIVALVE MOLLUSCS AND MUSSELS
In can be observed, as expected, that mollusc group accumulates TBT and derivatives more
than other groups. This behaviour is confirmed looking more in deepen in the raw data and in
the summarizing tables. Mussel and Clams show the higher levels.TPT and derivatives are
detected in molluscs in amounts lower than TBT and derivatives. The amount of data for
mussels is higher than the amount of data for all the other molluscs.
TABLE 9 FRESH CRUSTACEANS
TBT 2.97-145.4* ug/kg (5/6 countries ) DBT 0.87-28.4 ug/kg (5/6 countries ) MBT 0.87-12 ug/kg (5/6 countries ) TPT 1.08-42.46ug/kg (5/6 countries) DPT 0.5-3.8 ug/kg (5/6 countries ) MPT 0.1-3.3 ug/kg 5/6 countries)
47
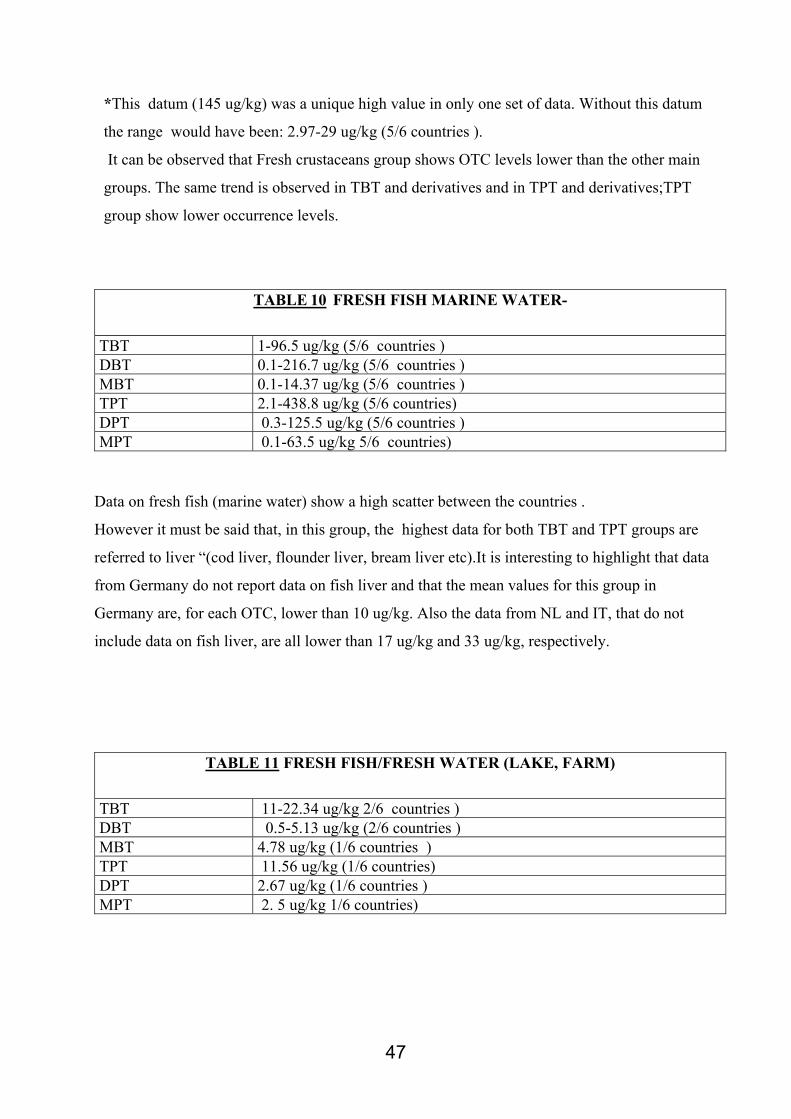
*This datum (145 ug/kg) was a unique high value in only one set of data. Without this datum
the range would have been: 2.97-29 ug/kg (5/6 countries ).
It can be observed that Fresh crustaceans group shows OTC levels lower than the other main
groups. The same trend is observed in TBT and derivatives and in TPT and derivatives;TPT
group show lower occurrence levels.
TABLE 10 FRESH FISH MARINE WATER-
TBT 1-96.5 ug/kg (5/6 countries ) DBT 0.1-216.7 ug/kg (5/6 countries ) MBT 0.1-14.37 ug/kg (5/6 countries ) TPT 2.1-438.8 ug/kg (5/6 countries) DPT 0.3-125.5 ug/kg (5/6 countries ) MPT 0.1-63.5 ug/kg 5/6 countries)
Data on fresh fish (marine water) show a high scatter between the countries .
However it must be said that, in this group, the highest data for both TBT and TPT groups are
referred to liver “(cod liver, flounder liver, bream liver etc).It is interesting to highlight that data
from Germany do not report data on fish liver and that the mean values for this group in
Germany are, for each OTC, lower than 10 ug/kg. Also the data from NL and IT, that do not
include data on fish liver, are all lower than 17 ug/kg and 33 ug/kg, respectively.
TABLE 11 FRESH FISH/FRESH WATER (LAKE, FARM)
TBT 11-22.34 ug/kg 2/6 countries ) DBT 0.5-5.13 ug/kg (2/6 countries ) MBT 4.78 ug/kg (1/6 countries ) TPT 11.56 ug/kg (1/6 countries) DPT 2.67 ug/kg (1/6 countries ) MPT 2. 5 ug/kg 1/6 countries)
48
In this case practically all the data came from Germany submission. In fact the means presented
by Germany came from more than 2000 raw data, and range from < LOD – 22,34 ug/kg (all the
OTC). But, as underlined in the submission from Germany, “high levels of TBT and TPT were
analysed in fresh fish from lakes” (e.g. TBT in bream, whitefish, carp or TPT in char, perch)
TABLE 12 FRESH FISH/FRESH WATER (INLAND, HARBOUR BRACKISH)
TBT 7.8-198 ug/kg 4/6 countries ) DBT 0.5-38. 9 ug/kg (4/6 countries ) MBT 0.2-17.3 ug/kg (4/6 countries ) TPT 4.9-868* ug/kg (4/6 countries) DPT 2.3-26.4 ug/kg (4/6 countries ) MPT 0.4-10.8ug/kg (4/6 countries)
*This datum 868* (µG/KG) is unique. Without this datum the range would be 4,9-42 ug/kg (3/6
countries)
This group, is composed by the submission of 4 countries : DE, NO, NL, IT. Also in this case it
must be said that mean data from DE came from more than 1300 data on 16 different fish
species, while the other countries submitted data on 1-2 species, essentially on eel.It must be
said that eel was introduced in this group, but it could be also in the group fresh fish/fresh water
(farm,lake). In this and in other similar cases (e.g pike perch) the grouping is not easy because
the data submitted are not specified and when both the allocations were possible, the species
have been introduced in this group. The data from Germany show in some cases high levels of
TBT and TPT in withe fish, pike perch, roach, but the mean values were for all the OTC from <
LOD to 43,81 ug/kg. (if values < LOD = LOD/2 the range is 2,5-43,81 ug/kg)
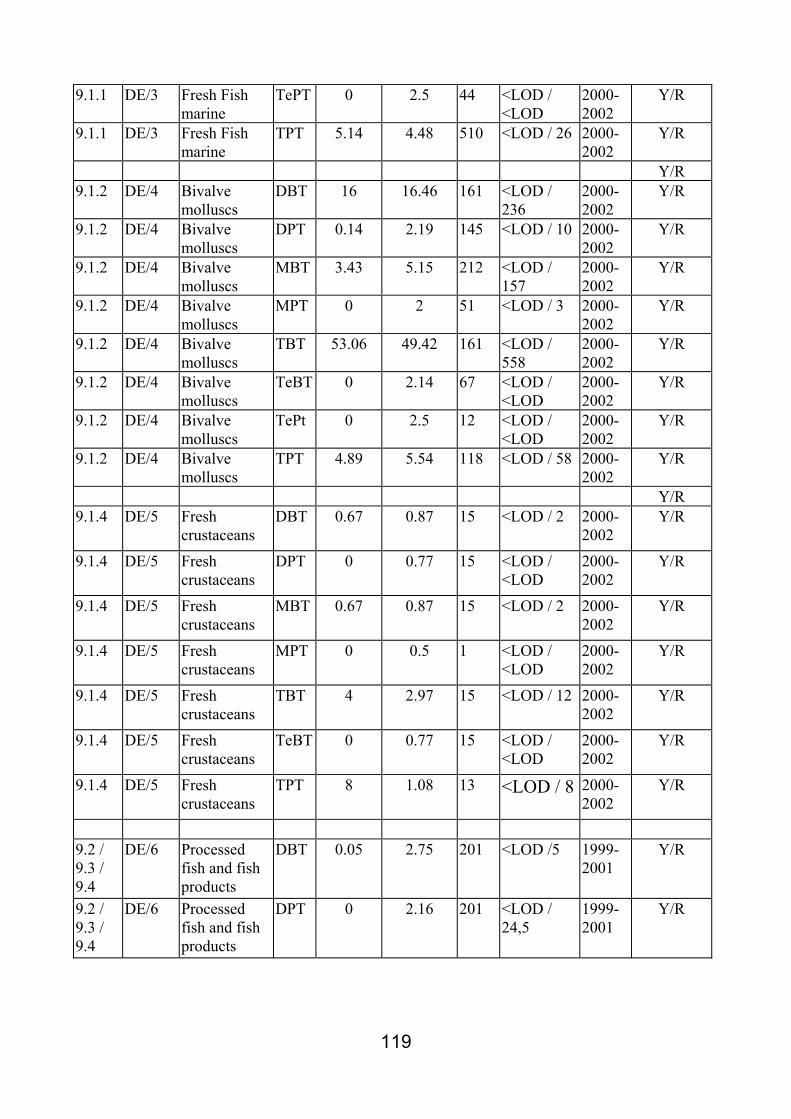
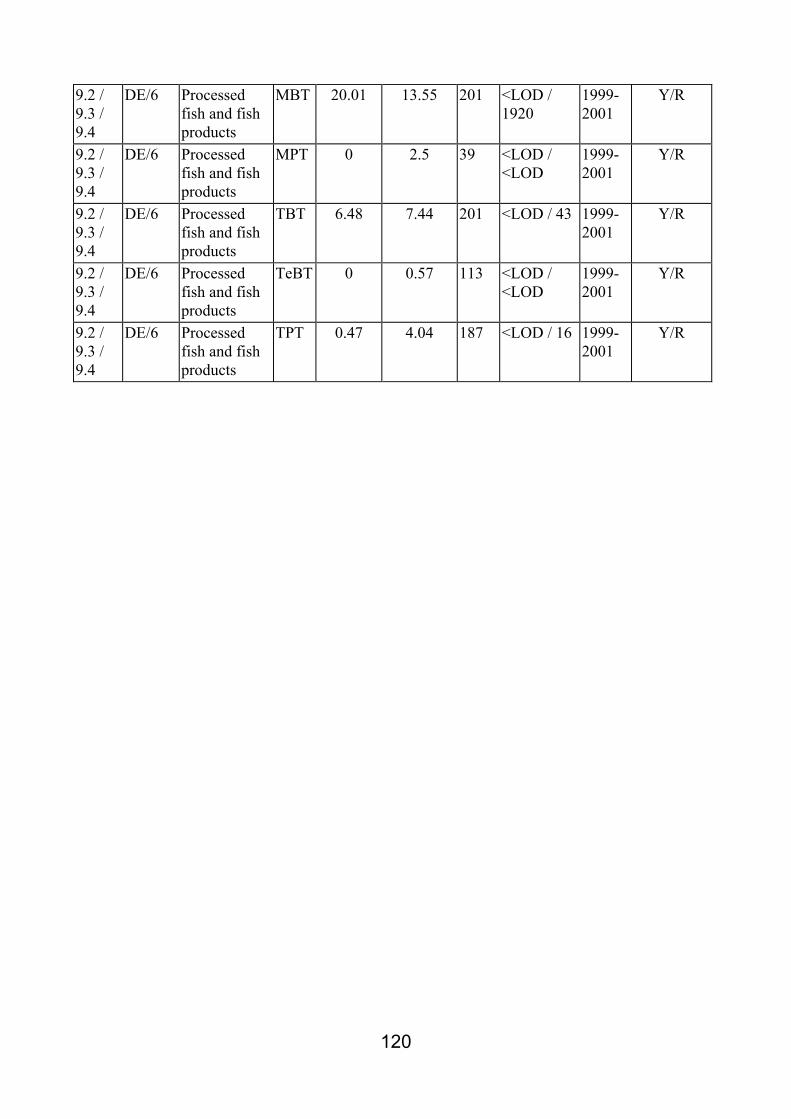
TABLE 13 FULLY PRESERVED CANNED OR FERMENTED FISH AND FISH PRODUCTS +
SEMIPRESERVED FISH AND FISH PRODUCTS, INCLUDING MCE TBT 2*-7.44 ug/kg ( 2/6 countries ) DBT 2.75-5* ug/kg (2/6 countries ) MBT 3*-13.55 ug/kg (2/6 countries ) TPT 4.04 ug/kg (1/6 countries) DPT 2.16 * ug/kg (1/6 countries ) MPT 2.5* ug/kg (1/6 countries )
49
The values marked with * are below the LOD. They have been calculated with the assumption:
<LOD=LOD/2. Once more, the group reports essentially the data from Germany, as clearly shown
in the Tables.The data show average low levels for all the OTC. The apparently high level for MBT
(13,55 ug/kg) is due to the presence of 1 unusually high value for a sample of “Canned Fish” (1920
ug/kg).
Group “”OTHER” : the data are reported in the Tables 2-7 , but are not discussed here because
they refer just to one country and one group (ex. birds, gasteropods, fish oil,).For the description of
these data, information can be found in the summaries in Annex 1 and details in the Annex on CD-
ROM.
2.1.3.2 Origin and Quality of the Occurrence data One important observation is referred to the origin of the occurrence data. In fact, a big part of the
presented occurrence data had been generated in the frame of environmental monitorings and
therefore they are not strictly representative of the food that is really eaten from the people, or they
represent just part of it.
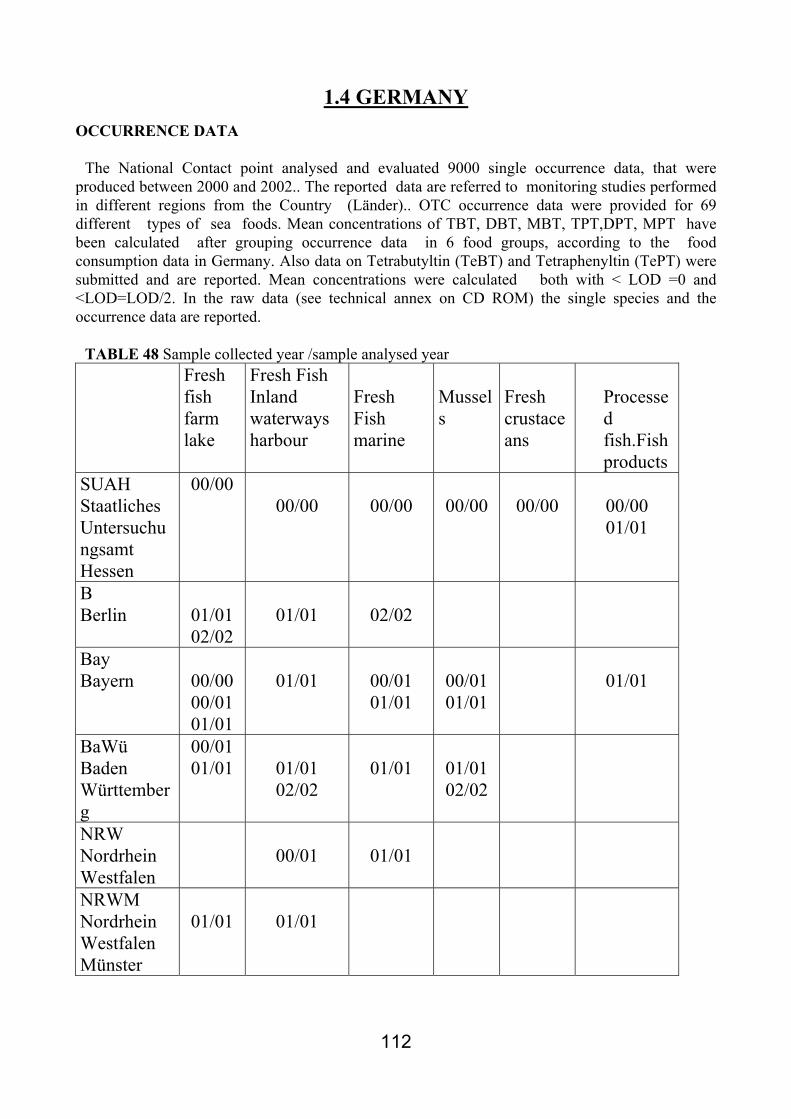
In the case of Germany the submitted data (more than 9000 raw data) came from a recent national
monitoring plan, specifically targeted, and therefore are a solid basis to describe an occurrence OTC
profile in food destined to the consumers. Also data from Norway, even more limited in numbers
with respect to Germany cover a wide range of fish products that are consumed by the Norwegian
population. In the other Countries, national public programs or research projects are still going on
to get available more complete information.
The analytical quality of the submitted data was guaranteed by the National Experts that had
previously selected the data according to agreed parameters (see Annex about Questionnaire) and
then had presented data togheter with the relevant and required details about Analytical Quality
Assurance (see Annex 1 for submitted data and details on CD-ROM).
Therefore, in those cases when OTC data in the occurrence tables from the Countries are marked
with “ NOT REPRESENTATIVE” it does not mean that data are analytically unacceptable, but that
they are not adequate to estimate intake and therefore they have not to be used for this purpose.
50
2.2. FOOD CONSUMPTION DATA
2.2.1 STATISTICS AND SUMMARIZING TABLES
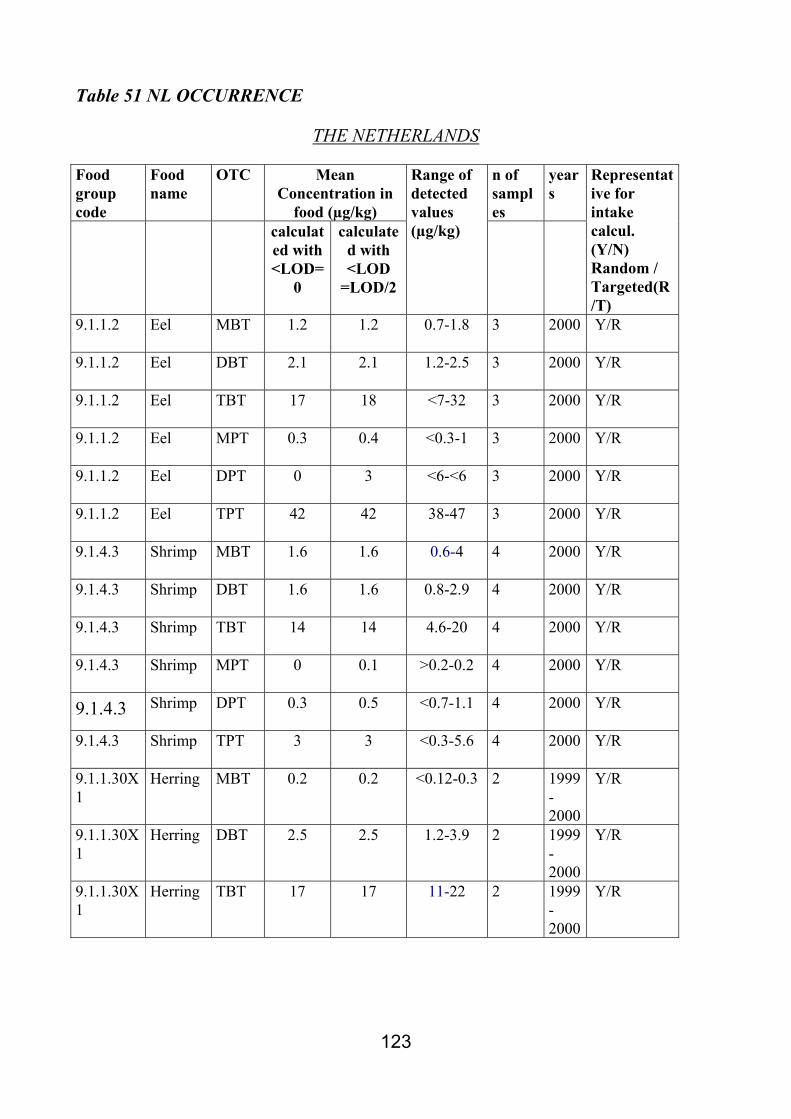
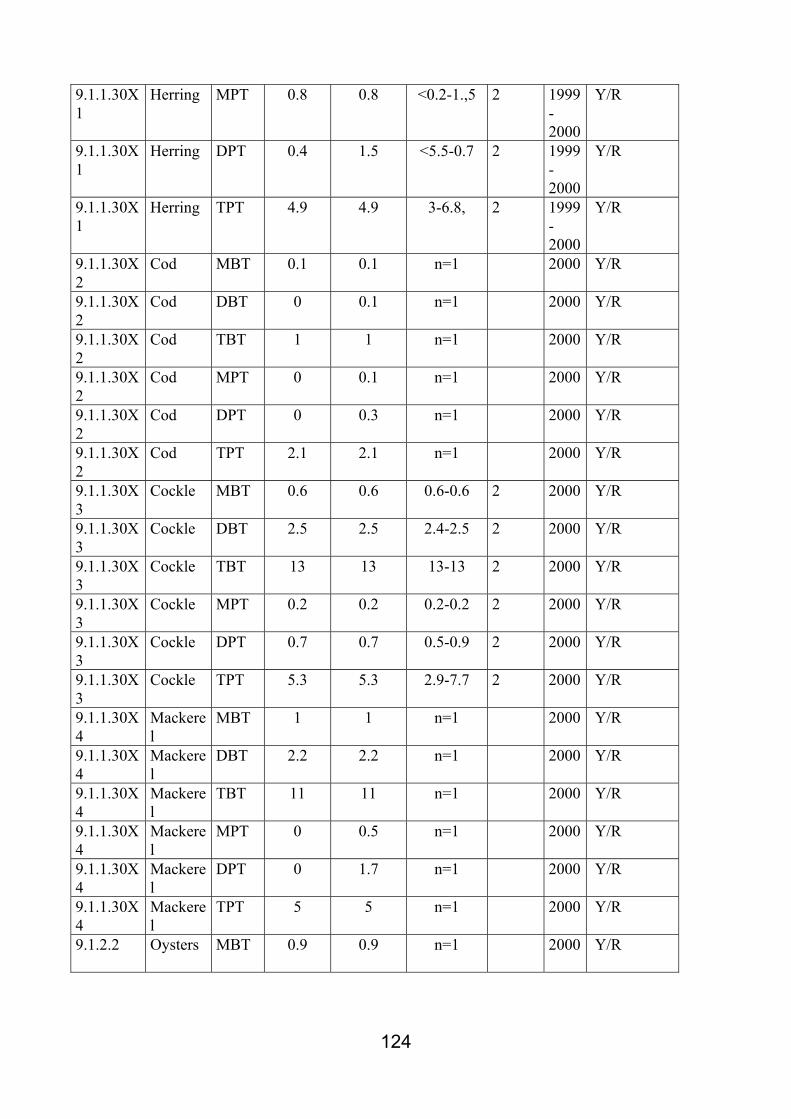
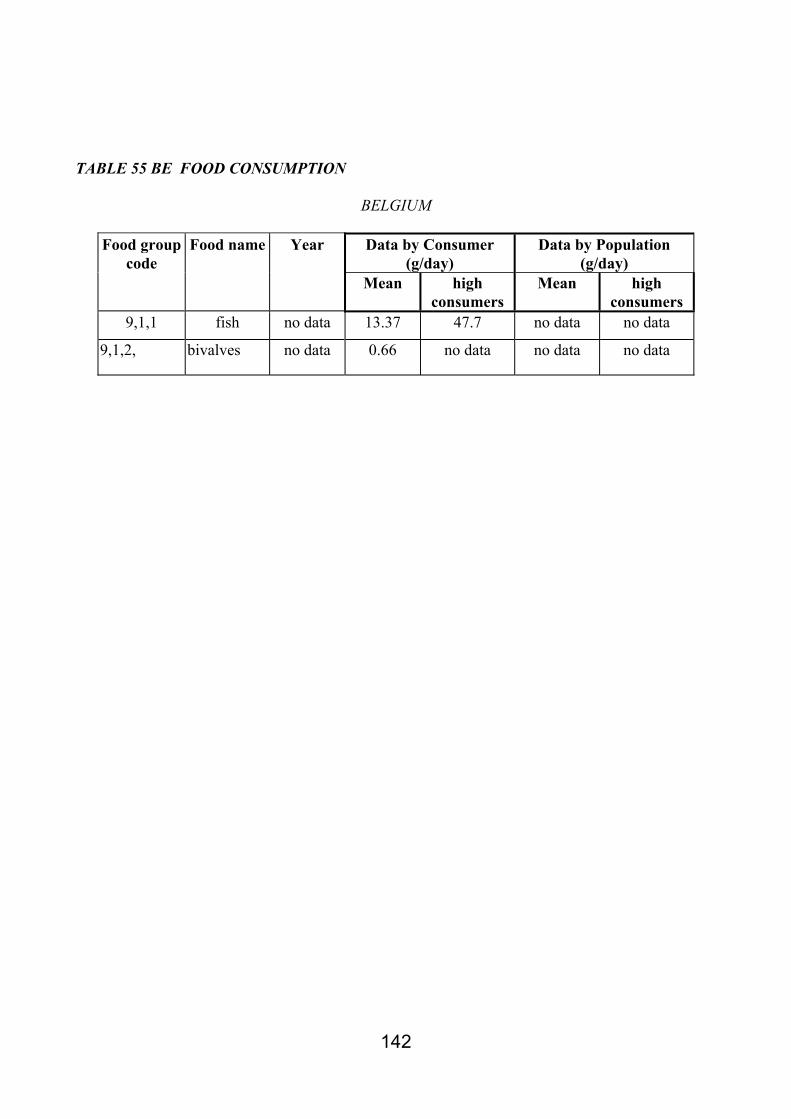
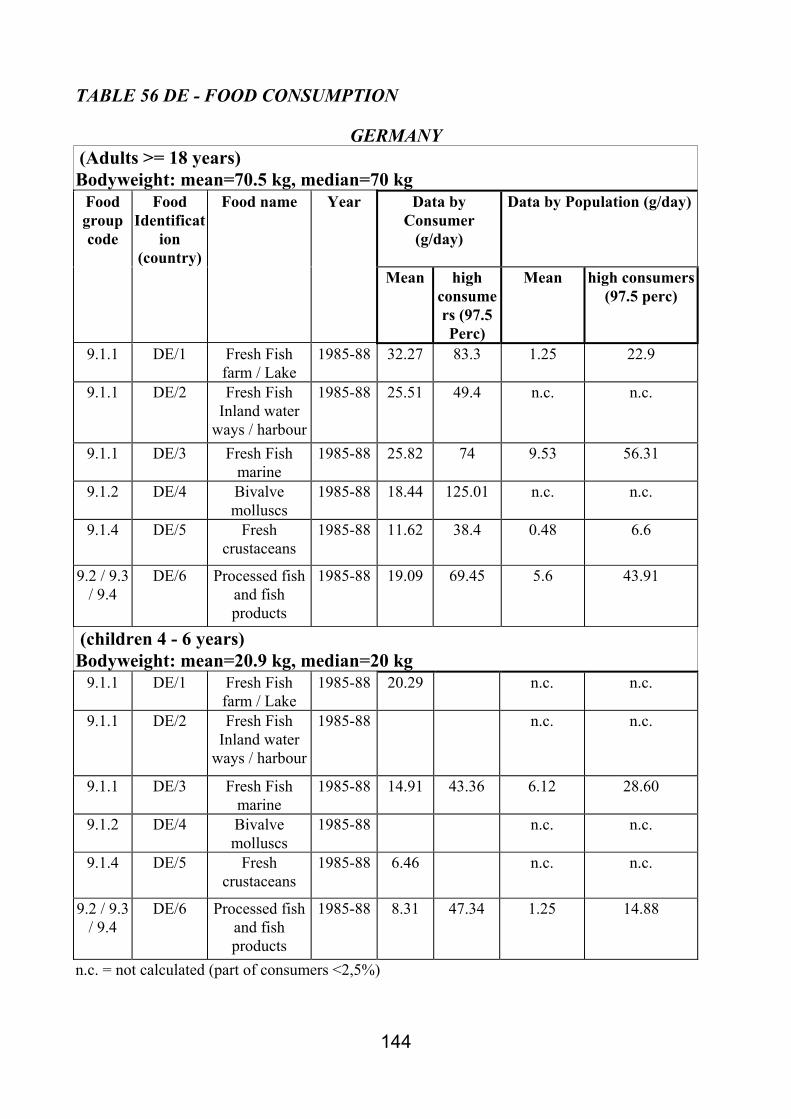
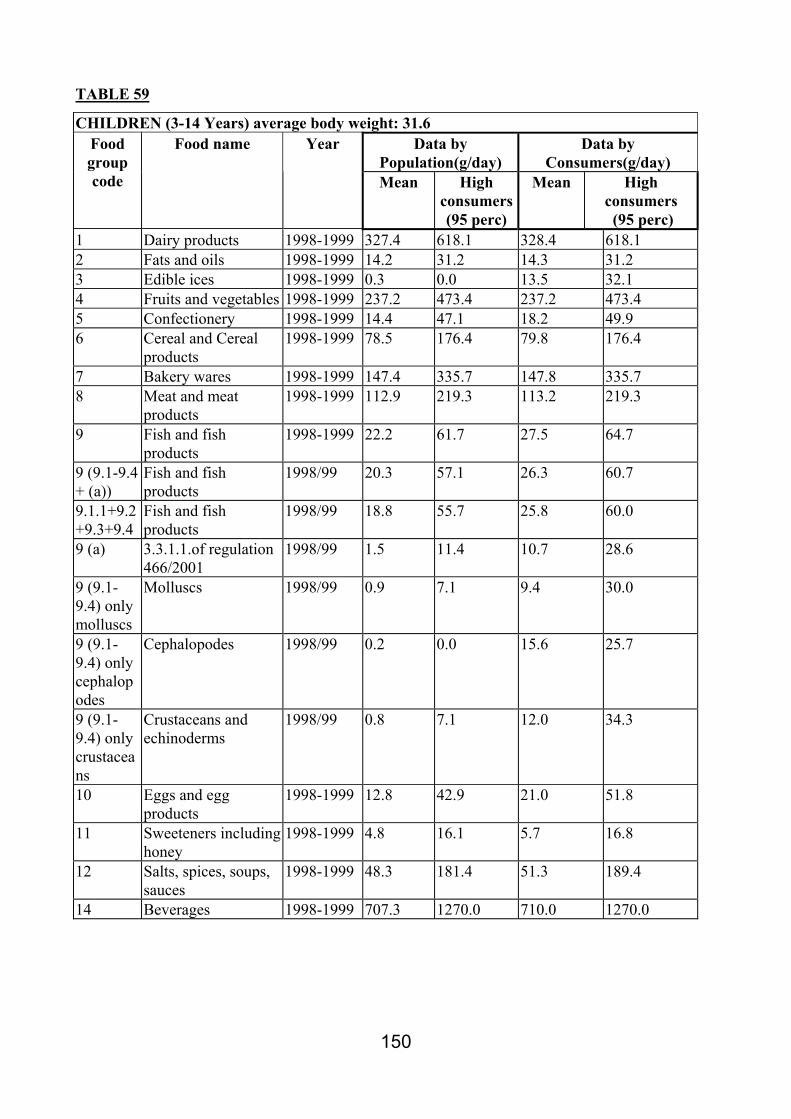
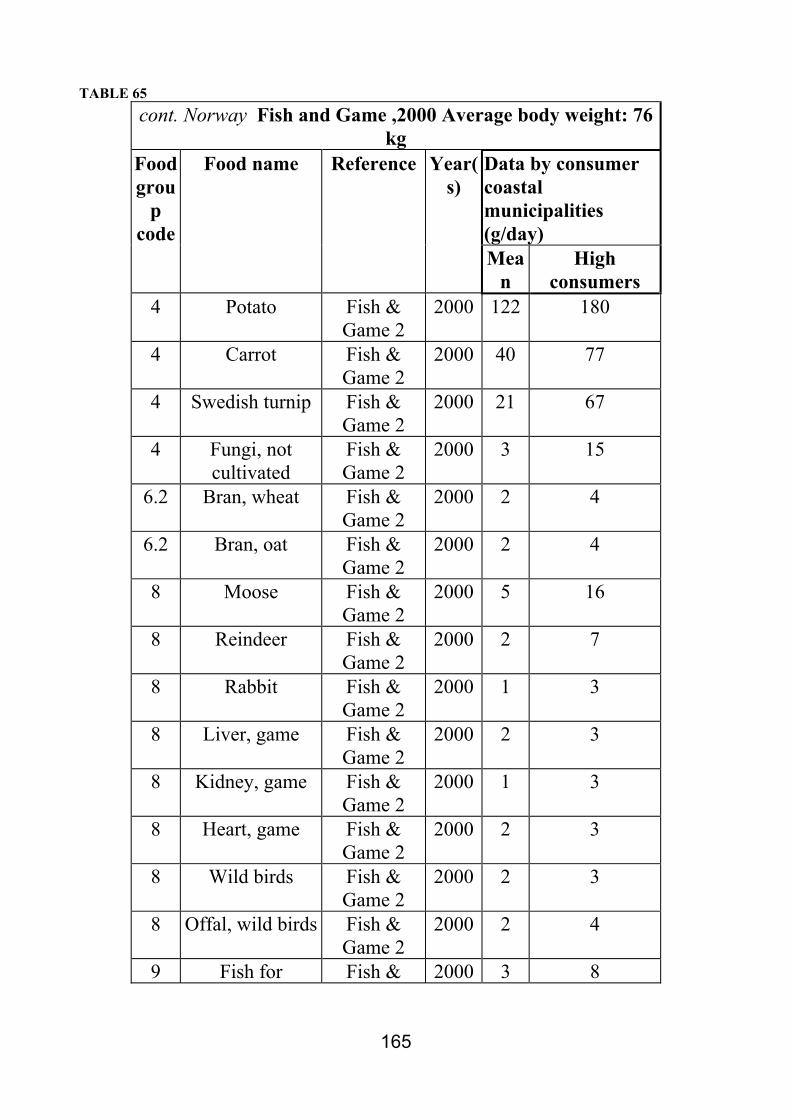
All the participating Countries presented data about Food consumption, obtained by national
surveys. The data have been summarized in Annex 1 where is reported, for each Country, a brief
description of food consumption data , the methods used to measure food consumption, the year of
the survey and Tables resuming for each fish group or fish species the food consumption data
expressed by consumer or by population (mean and high levels) (Tables 55-65). The whole set of
raw data is reported in the Technical Annex on CD-ROM.
This chapter presents only some general comments and remarks about the submitted food
consumption data. The following Table 14 reports a synoptic overview useful to compare the
data.
TABLE 14 SYNOPTIC TABLE FOR SUBMITTED FOOD CONSUMPTION DATA
FISH GROUP FISH SPECIES
by population by consumer by population by consumer
mean high 95-97perc
mean high 95-97 perc
mean high 95-97perc
mean high 95-97 perc
BE (2 groups)
x x
adult x x x x DE 6 groups child x x x x
DK x
adult x x x x FR child x x x x
HE (2 groups)
x x x x
IT(several groups)
x x
NL x x
x (1997) x (1997) x (1997) x (1997) x(1999) x(1999) x(1999) x(1999) NO coastal x(2000) x(2000)
51
2.2.2 DISCUSSION
From the comparative examination of the available food consumption data, some basic
differences existing in the data send by the 8 Countries can be stressed; in fact, also at a first glance
the above Table shows that the high majority of the food consumption data are just for food groups
and not for single species, with the following details:
2.2.2.1 Food Consumption data for Food Species
1. Only 3/8 Countries (DK, NL, NO) submitted food consumption data specific for the reported
fish species. 2. Only 1/8 Countries (NO) presented data for species referred both to consumers and to a
special section of them (coastal population, very high consumers of fish)
2.2.2.2 Food Consumption data for Food Groups:
1. The majority of the Countries (6/8 Countries : BE, DE, FR,HE,IT, NO) presented food
consumption studies referred to fish groups, without specifing consumption of single
species, but with the following differences :
2. 4/8 Countries (DE, FR ,HE, NO) presented food consumption data on fish groups,
expressed by population and by consumer ( both mean and high levels values)
3. 1/8 Countries (IT) presented only mean values for food consumption data on fish groups,
expressed by population and by consumers,
4. 1/8 Countries (BE) presented data on fish groups, but only by consumers (mean and high
values)
5. Only 2/8 Countries (DE, FR) presented food consumption data for both adults and
children
6. Fish groups developed for the surveys are different between the Member States. In fact,
there are not common rules or settled scientific criteria to group foods or, specifically, fish
foods and therefore the grouping has been made on the basis of national strategies.
Obviously, some similarities can be found between the grouping of the countries, (e.g
crustaceans, marine fresh fish) but the contribution of each individual species within the
group is not known. For example, a group in which appears “crustaceans” is present in
52
Table for DE (Fresh crustaceans), in HE (Fresh Bivalve molluscs, Cephalopodes,
Crustaceans and Echinoderm) and in FR ( Crustaceans and Echinoderms), but no more
specifications are available about the percentage of consumption to be allocated to
crustaceans within the group. Moreover, the allocation of single crustacean species (e.g.
shrimps, crab etc) within the group is at the same manner not known . Therefore, a
comparison between the groups is neither immediately feasible nor obtainable by
regrouping single species.
2.2.2.3 Type of Survey to collect food consumption data
Different methods exist to produce estimates of food consumption. Two main type of studies
have been performed with different instruments to carry out them:
Table 15“Type of survey” , in the following page describe the different methods used to collect the
food consumption data used for this Task. It must be reminded that to calculate OTC intakes the
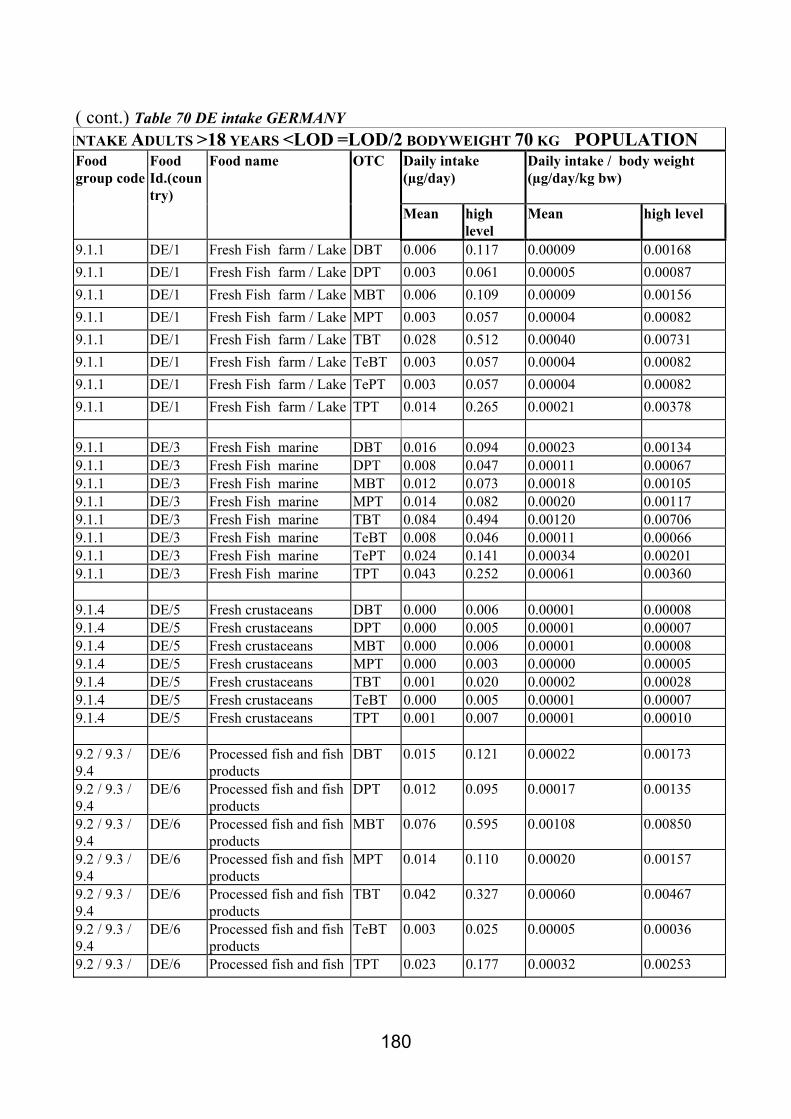
average body weight of 70 kg has been used by DK, HE,IT,NL,NO, while Germany used average
body weights laid down by the German Food Surveys of 70.5 kg (mean) for adults and 20.9 kg
(mean) for children.
53
TABLE 15
TYPE OF SURVEY USED TO COLLECT FOOD CONSUMPTION DATA
Adult Children Type of survey
Method participants body
weight (kg)
participants body weight (kg)
years
BE no info no info no info no info no info no info DE individual interview 19115> 18
years 70.5 (mean)
889 (4-6 years)
20.9 (mean)
1985-1988
DK household purchase questionnaire
2000 (6000 individuals)
1999-2000
FR individual diary record
1985 >15 years
66.4 1018 (3-14 years)
31.6 1998-1999
HE household purchase 6258 households
1998-1999
IT household mixed
questionnaire, purchase, individual record
1200 (2734 individuals)
1994-1996
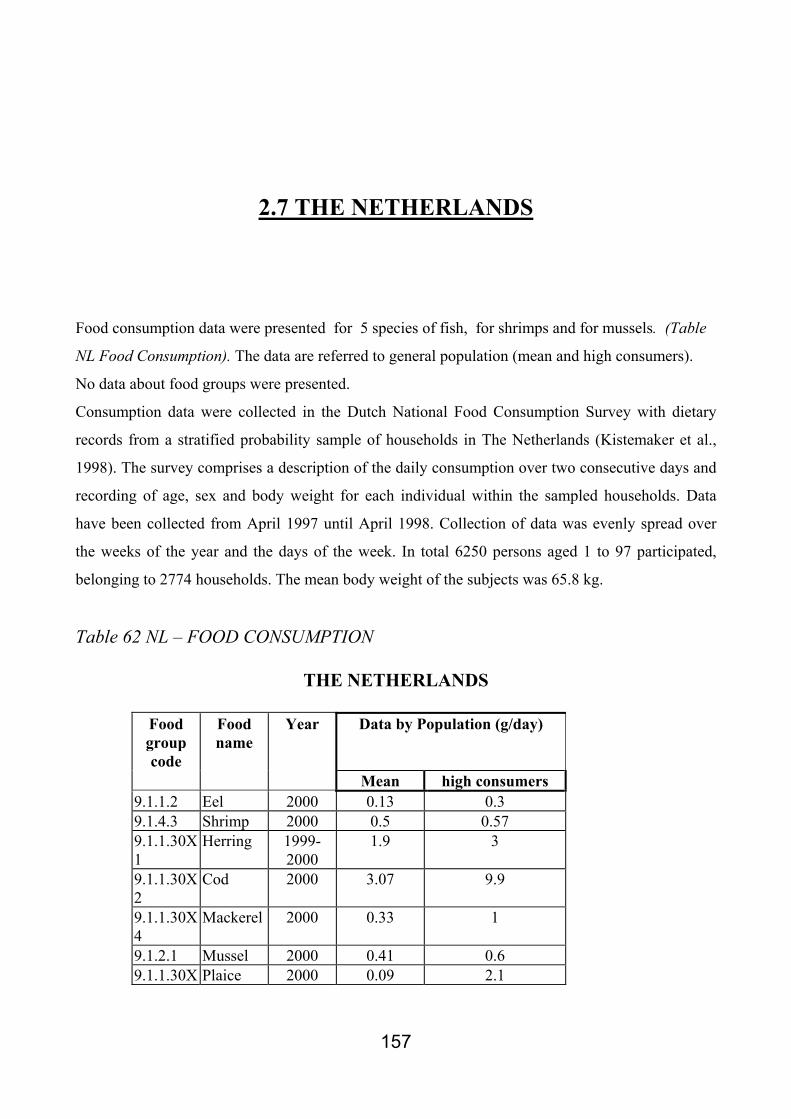
NL household dietary records
2774 (6250 individuals, age 1-97)
65.8 1997-1998
individual frequency questionnaire
6015 ( age 18-79)
74 1999 NO
individual (coastal municipalities)
frequency questionnaire
5502 ( age 18-79)
76 2000
54
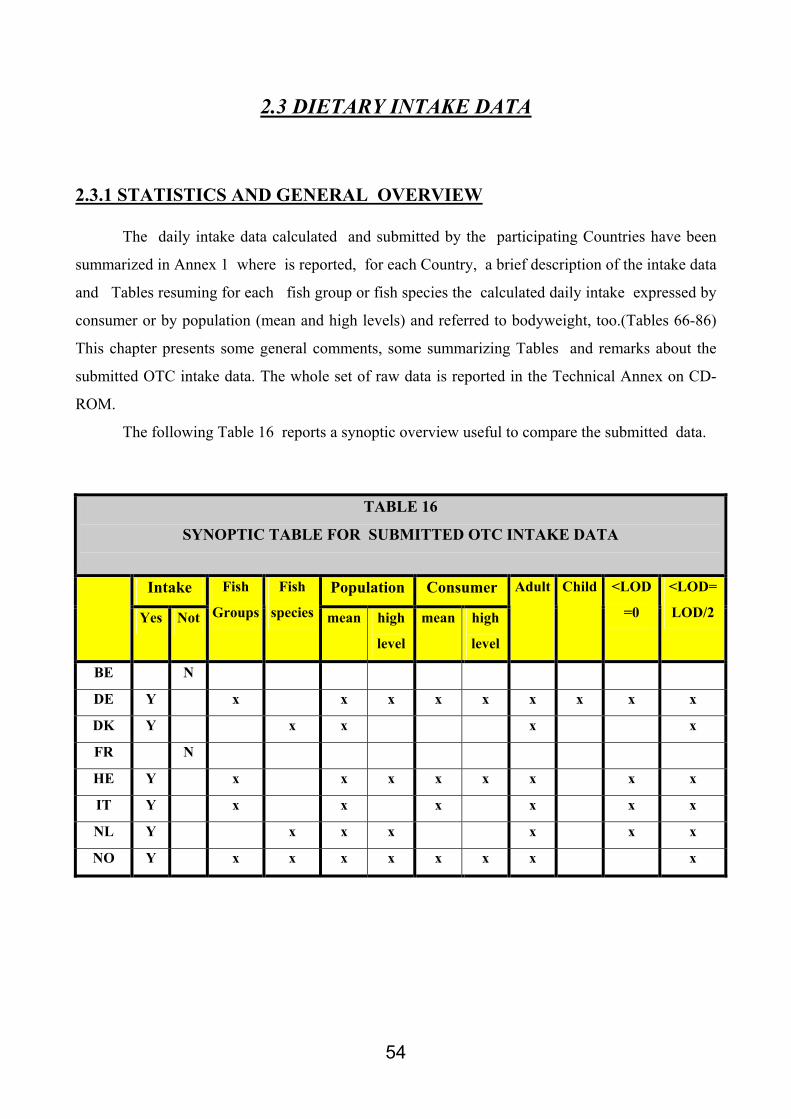
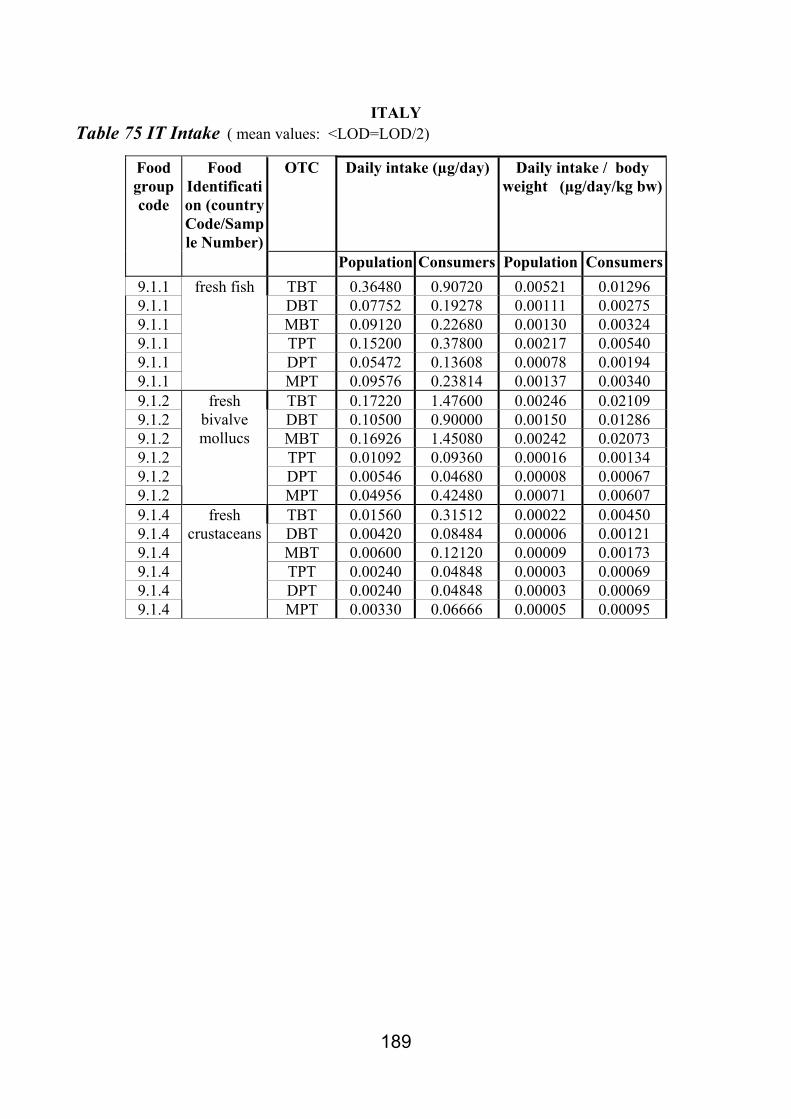
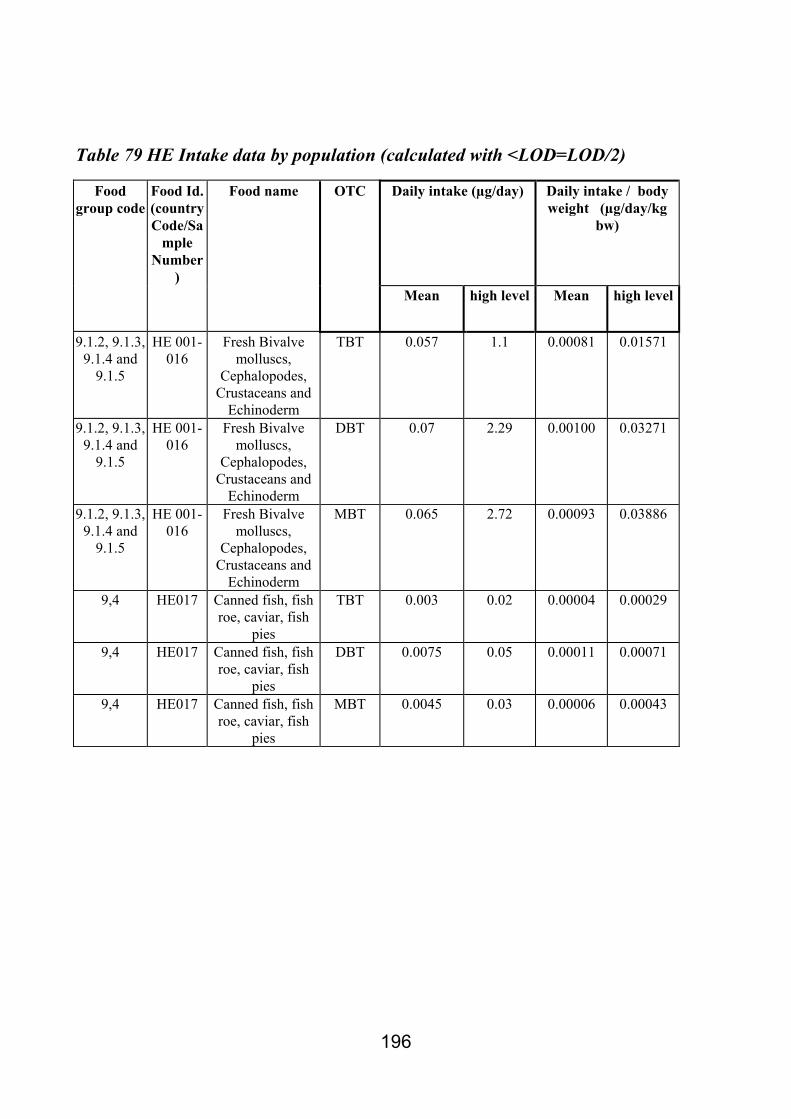
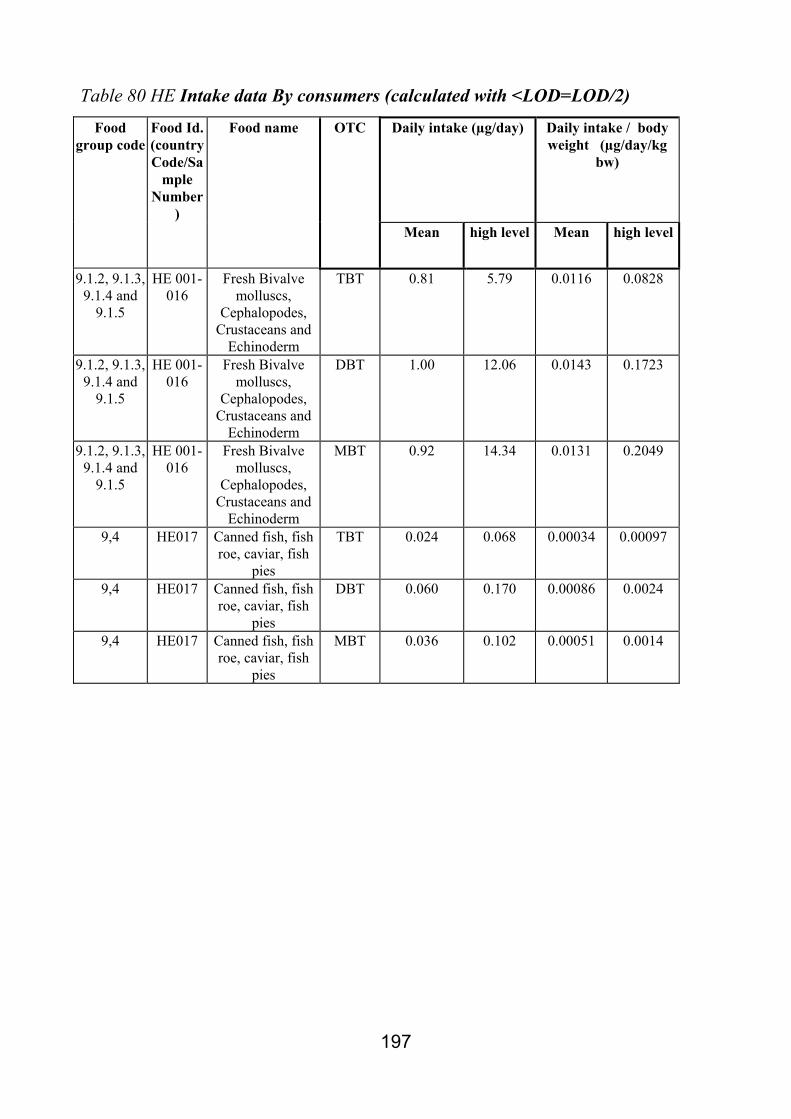
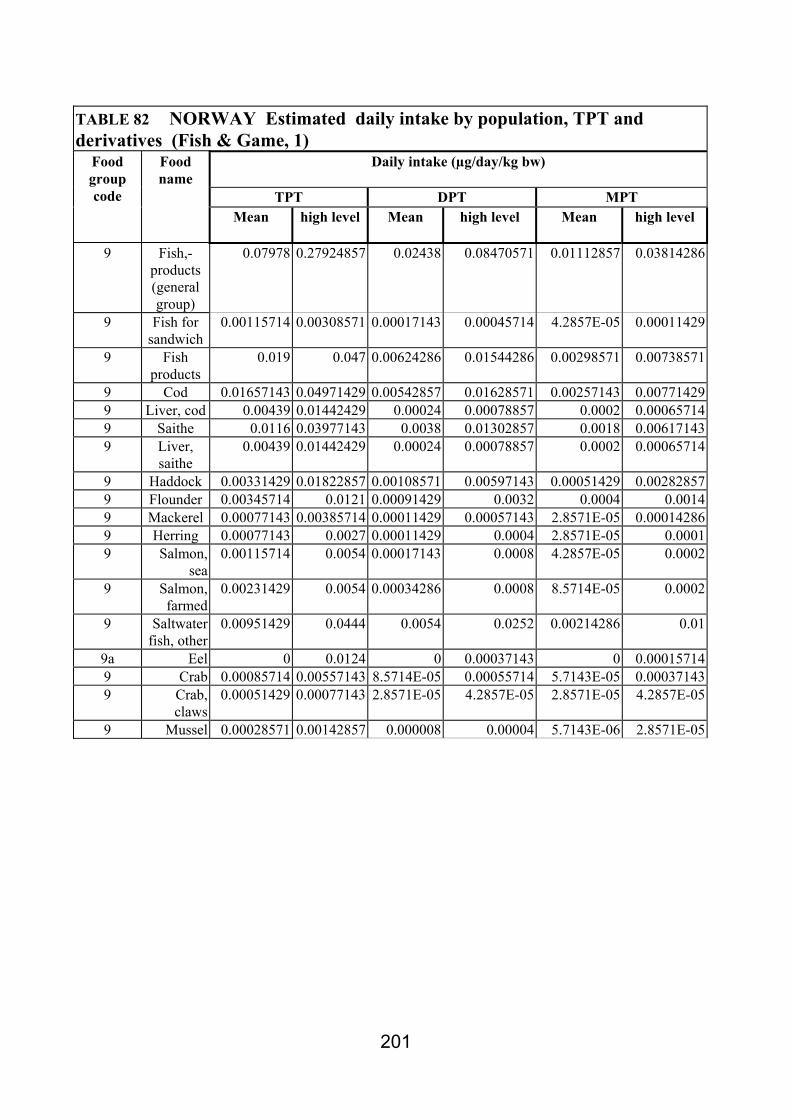
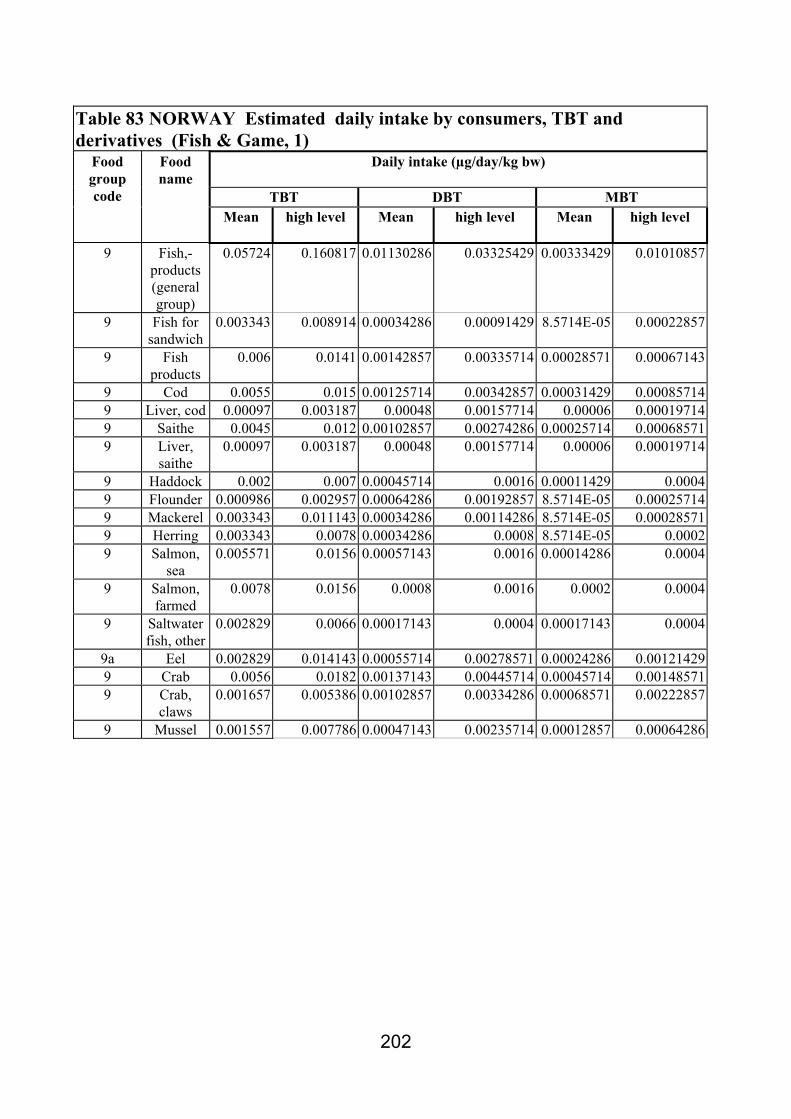
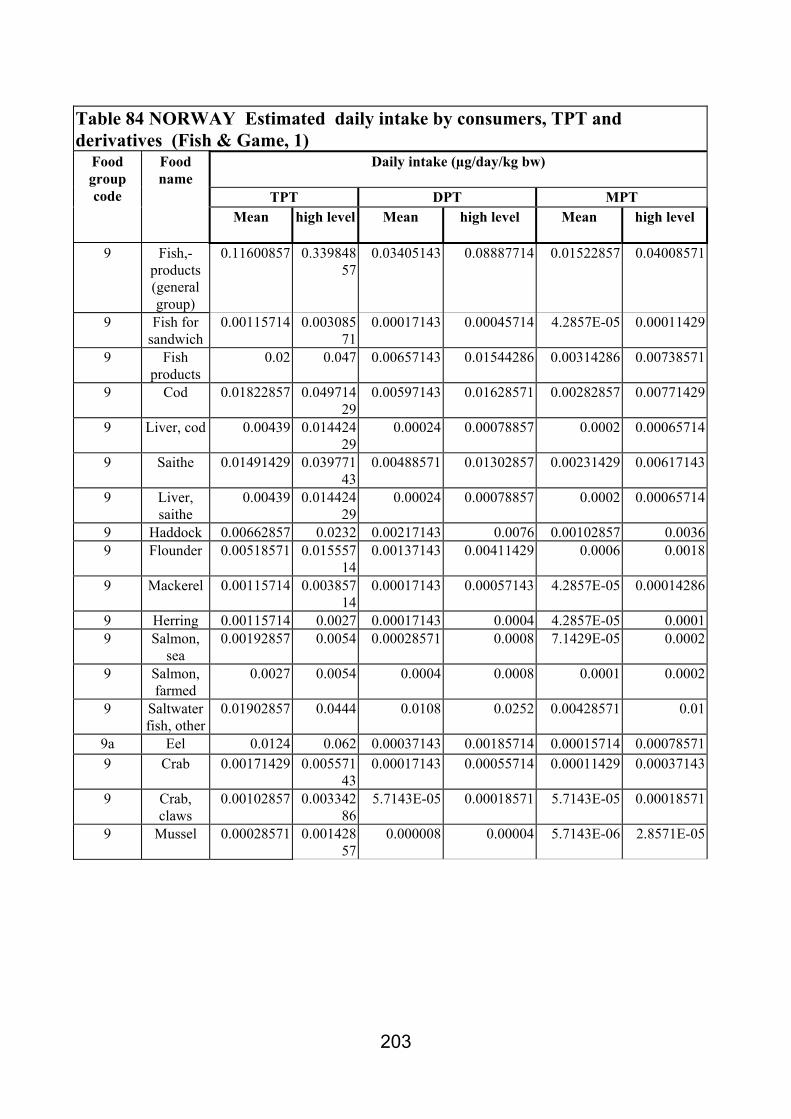
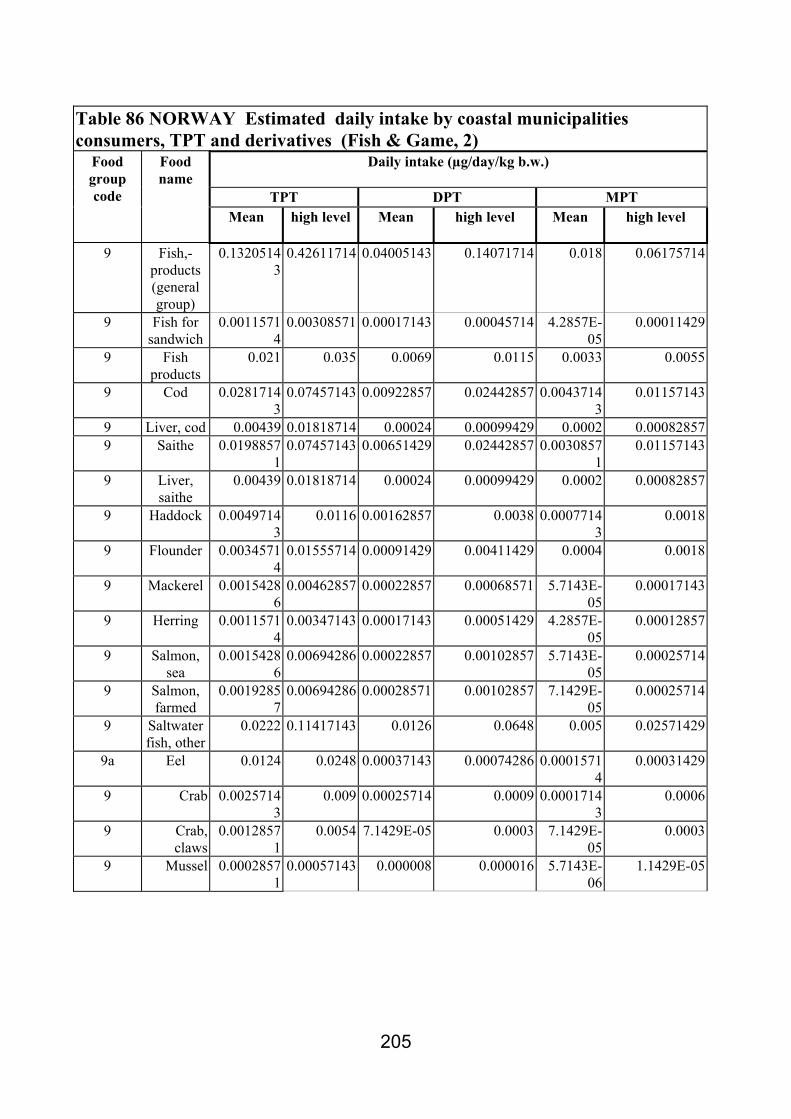
2.3 DIETARY INTAKE DATA 2.3.1 STATISTICS AND GENERAL OVERVIEW
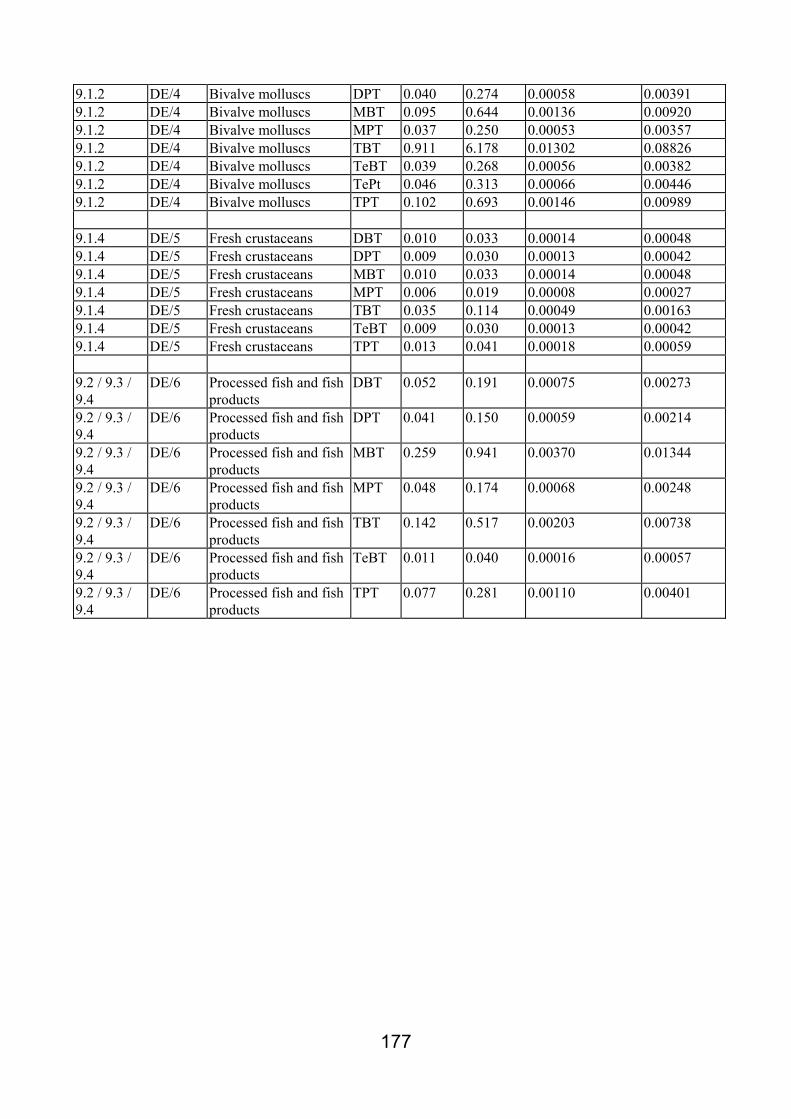
The daily intake data calculated and submitted by the participating Countries have been
summarized in Annex 1 where is reported, for each Country, a brief description of the intake data
and Tables resuming for each fish group or fish species the calculated daily intake expressed by
consumer or by population (mean and high levels) and referred to bodyweight, too.(Tables 66-86)
This chapter presents some general comments, some summarizing Tables and remarks about the
submitted OTC intake data. The whole set of raw data is reported in the Technical Annex on CD-
ROM.
The following Table 16 reports a synoptic overview useful to compare the submitted data.
TABLE 16
SYNOPTIC TABLE FOR SUBMITTED OTC INTAKE DATA
Intake Population Consumer
Yes Not
Fish
Groups
Fish
species mean high
level
mean high
level
Adult Child <LOD
=0
<LOD=
LOD/2
BE N
DE Y x x x x x x x x x
DK Y x x x x
FR N
HE Y x x x x x x x x
IT Y x x x x x x
NL Y x x x x x x
NO Y x x x x x x x x
55
As shown in the above Table, an immediate comparison between the submitted intake data allows
the following observations:,
intake data on OTC have been calculated by 6/8 Countries, (DE,DK,HE,IT,NL,NO),
2/8 (BE, FR) did not calculate intakes.
3/6 Countries have been provided intake data only with respect to fish food groups, while
2/6 Countries presented intake calculations referred only to fish species; l/6 country (NO)
calculated intake with respect to both groups and species.
6/6 Countries presented daily intake data calculated for adults
1/6 Countries (DE) presented intake data calculated for children
1/6 Countries (NO) presented intake data calculated for a potentially very high consumer
group (coastal municipalities).
Intake data have ben calculated by the National Experts on the basis of mean occurrence values, for
species or for groups. These mean values, just to calculate intakes, were obtained by assuming that
when occurrence values were below the LOD they were equal to LOD/2. This assumption was
agreed during the meeting with participating Countries as a worst case scenario and a reasonable
compromise between the overestimation for <LOD=100%LOD and the underestimation for
<LOD=0. However, it must be said that this option could lead to calculate never detected OTCs
as they were present . This is the case, for example, of Occurrence data for Canned Fish submitted
by Greece, or of DPT in Fresh Crustaceans and MPT in Processed fish and fish products submitted
by Germany. In these and in similar cases OTC intakes should be only considered as potential and
in the Tables a footnote marks these data.
Even tough 6/8 Countries presented intake data, a strict comparison betwen these data is
not possible. In fact, a different background exists behind the data; this appears clearly from the
comparison of raw data on CD ROM, but it is also evident from the occurence and food
consumption data described for each Country in Annex 1 in this Report .
In short,
for 3/6 Countries (DE, HE,IT) intake data came from occurrence experimental data on OTC
in fish species, grouped according to nationally available food consumption data and therefore
intake is referred to fish groups (no allocation of single species within the groups can be
done)
56
for 2/6 Countries (DK, NL) intake data came from occurrence experimental data on OTC
in fish species combined with nationally available food consumption data on single fish
species and therefore intake is referred only to these fish species.
for 1/6 Countries (NO) intake data are based not only on occurrence experimental data, but
some assumptions have been made (i.e. TBT in mackerel and salmon was assumed to be the
same as in herring) to estimate a complete figure of OTC intake from fish foods .
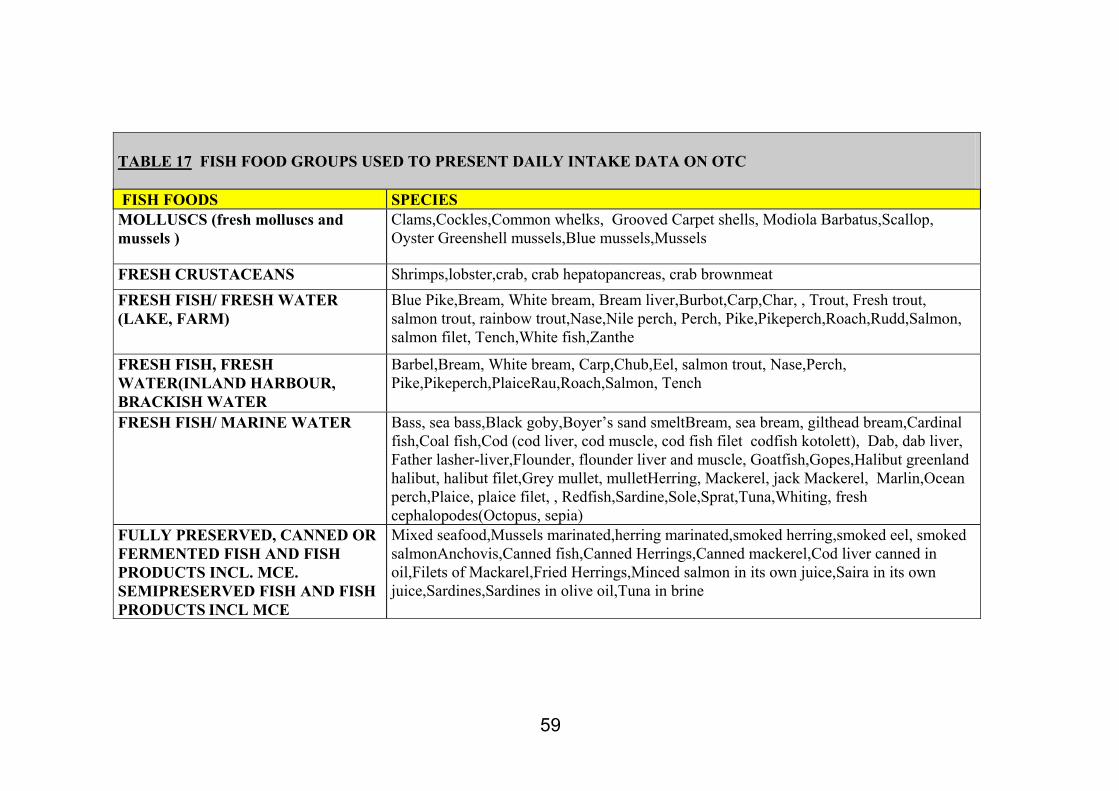
2.3.2 SUMMARIZING TABLES Bearing in mind what previously discussed, to get available a synoptic view of the submitted
intake data and to describe the range of the intakes calculated by the participating countries,
Tables referred to fish food groups have been prepared. ( see Table 17 FISH FOOD GROUPS
USED TO PRESENT DAILY INTAKE DATA ON OTC ) The following criteria have been used: 1) Six fish food groups practically similar to those indicated by DE have been used to
group data from all the countries, being this solution the most suitable to attribute the
species to the groups and to have always at least two submitting countries for each
group; however, it must be reminded that , even though the name of the groups is
similar to those given by DE, the composition of the group in the Tables 17 here
presented may be different. In fact, in some cases the assumptions made by the
Countries were different by those made by DE, e.g. HE grouped togheter molluscs and
crustaceans, while they are distinct for DE. In these cases, all the possible indications
have been given in the Tables 18-41 to identify the differences; on the other hand, as
already underlined, these Tables 18-41 for Intake should be used just as a raw
description of the profile of the reported intake data; 2) To the aim of an easy reading of the Tables 18-41, intake data have been reported in
the format “ng/ day/kg body weight “ and not as “0.00X ug/ day /kg body weight ”. It
should be noted during the reading of the text that ” ng/ day/kg body weight “ is the unit
for intake, while occurrence is expressed in µg/kg
3) In order not to overcrowd the Tables , only the daily intakes expressed in ng/ day /kg
body weight have been reported and, even though 4 Countries presented data
calculated both with <LOD= 0 and <LOD= LOD/2, only these last data have been
reported ; the other data are reported in the summaries of submitted intake data(Annex 1
57
in this Report) and all the details, fully traceable, are reported in Technical Annex on
CD. 4) The intake data have been reported as they were provided by the National Experts,
without calculating mean intake values, when the Expert did not deem it suitable; 5) On the basis of points 3) and 4) mean daily intake values were reported for DE, HE, IT,
while for DK and NL all the calculated daily intakes are reported. Therefore, for each
food group, in the same table, mean daily intake values (DE, HE, IT) appear togheter
with daily intakes for specific fish food species (DK, NL and in some cases NO). This
option , undoubtedly not rigorous, has been deemed the unique feasible to present the
available data in a usable format. 6) The last line of each of the Tables 18-41 shows the range of the reported daily intakes;
this range is simply the lowest and the highest daily intake of the Table, without any
treatment of the data. 7) Other relevant sudies for intakes have been summarized in separate Tables. These
studies are concerned with a) estimation of intakes for children, submitted by Germany, (Tables 42-43) b) estimation of intakes for coastal municipalities, submitted by Norway; these
groups have large avaiability of fish foods and are a special sections of consumers.
(Table 44) c) in take data about other OTC (TeBT, TePT)
59
TABLE 17 FISH FOOD GROUPS USED TO PRESENT DAILY INTAKE DATA ON OTC FISH FOODS SPECIES MOLLUSCS (fresh molluscs and mussels )
FRESH FISH, FRESH WATER(INLAND HARBOUR, BRACKISH WATER
Barbel,Bream, White bream, Carp,Chub,Eel, salmon trout, Nase,Perch, Pike,Pikeperch,PlaiceRau,Roach,Salmon, Tench
FRESH FISH/ MARINE WATER
Bass, sea bass,Black goby,Boyer’s sand smeltBream, sea bream, gilthead bream,Cardinal fish,Coal fish,Cod (cod liver, cod muscle, cod fish filet codfish kotolett), Dab, dab liver, Father lasher-liver,Flounder, flounder liver and muscle, Goatfish,Gopes,Halibut greenland halibut, halibut filet,Grey mullet, mulletHerring, Mackerel, jack Mackerel, Marlin,Ocean perch,Plaice, plaice filet, , Redfish,Sardine,Sole,Sprat,Tuna,Whiting, fresh cephalopodes(Octopus, sepia)
FULLY PRESERVED, CANNED OR FERMENTED FISH AND FISH PRODUCTS INCL. MCE. SEMIPRESERVED FISH AND FISH PRODUCTS INCL MCE
Mixed seafood,Mussels marinated,herring marinated,smoked herring,smoked eel, smoked salmonAnchovis,Canned fish,Canned Herrings,Canned mackerel,Cod liver canned in oil,Filets of Mackarel,Fried Herrings,Minced salmon in its own juice,Saira in its own juice,Sardines,Sardines in olive oil,Tuna in brine
61
TABLE 18 - MOLLUSCS- DAILY INTAKE/BODY WEIGHT –TBT/ DBT/MBT- DATA EXPRESSED BY POPULATION ng /day/kg bw
TBT DBT MBT
mean high mean high mean high
DE group
n. s. * n. s.* n. s.*
DK mussels
0.012 0.024 0.008 0.022
0.0076 0.0063 0.0032 0.0021
0.0008 0.0066 0.0049 0.0136
HE group3
0.81 15.7 1.0 32.7 0.9 38.9
IT group4
2.46
1.5
2.4
NL mussels
0.13 0.18 0.05 0.07 0.014 0.020
NO mussels
1.6 7.8 0.47 2.36 0.13 0.64
RANGE of the reported intake values
0.008 - 2.5 0.18-15.7 0.0021
- 1.5 0.07-32.7 0.0008 - 2.4 0.02-38.9
TABLE 19 -MOLLUSCS 3 HE group is for molluscs, crustaceans and echinoderms, but the experimental data are only on molluscs 4 Mussels and clams * not significant, very low data
62
-DAILY INTAKE/BODY WEIGHT– TPT/ DPT/MPT – DATA EXPRESSED BY POPULATION ng/day/kg bw
5 HE group is for molluscs, crustaceans and echinoderms, but the experimental data are only on molluscs 6 Mussels and clams * not significant, very low data.
63
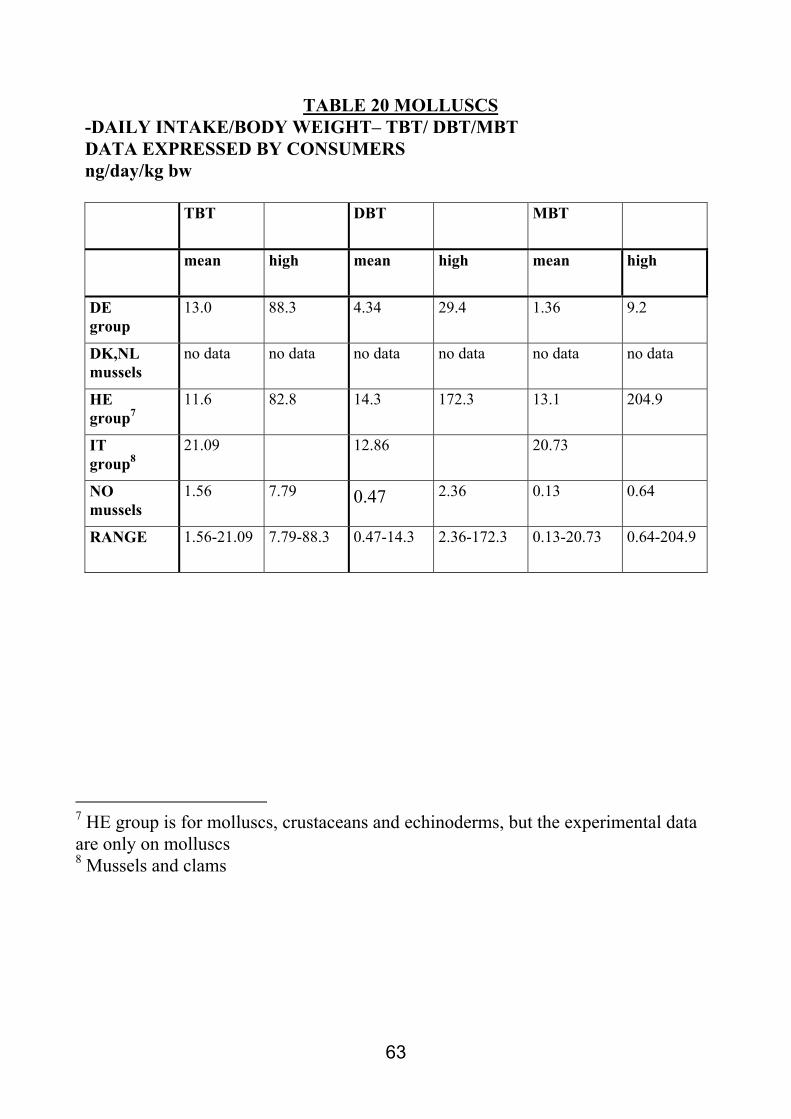
TABLE 20 MOLLUSCS -DAILY INTAKE/BODY WEIGHT– TBT/ DBT/MBT DATA EXPRESSED BY CONSUMERS ng/day/kg bw
TBT DBT MBT
mean high mean high mean high
DE group
13.0 88.3 4.34 29.4 1.36 9.2
DK,NL mussels
no data no data no data no data no data no data
HE group7
11.6 82.8 14.3 172.3 13.1 204.9
IT group8
21.09 12.86 20.73
NO mussels
1.56 7.79 0.47 2.36 0.13 0.64
RANGE 1.56-21.09 7.79-88.3 0.47-14.3 2.36-172.3 0.13-20.73 0.64-204.9
7 HE group is for molluscs, crustaceans and echinoderms, but the experimental data are only on molluscs 8 Mussels and clams
65
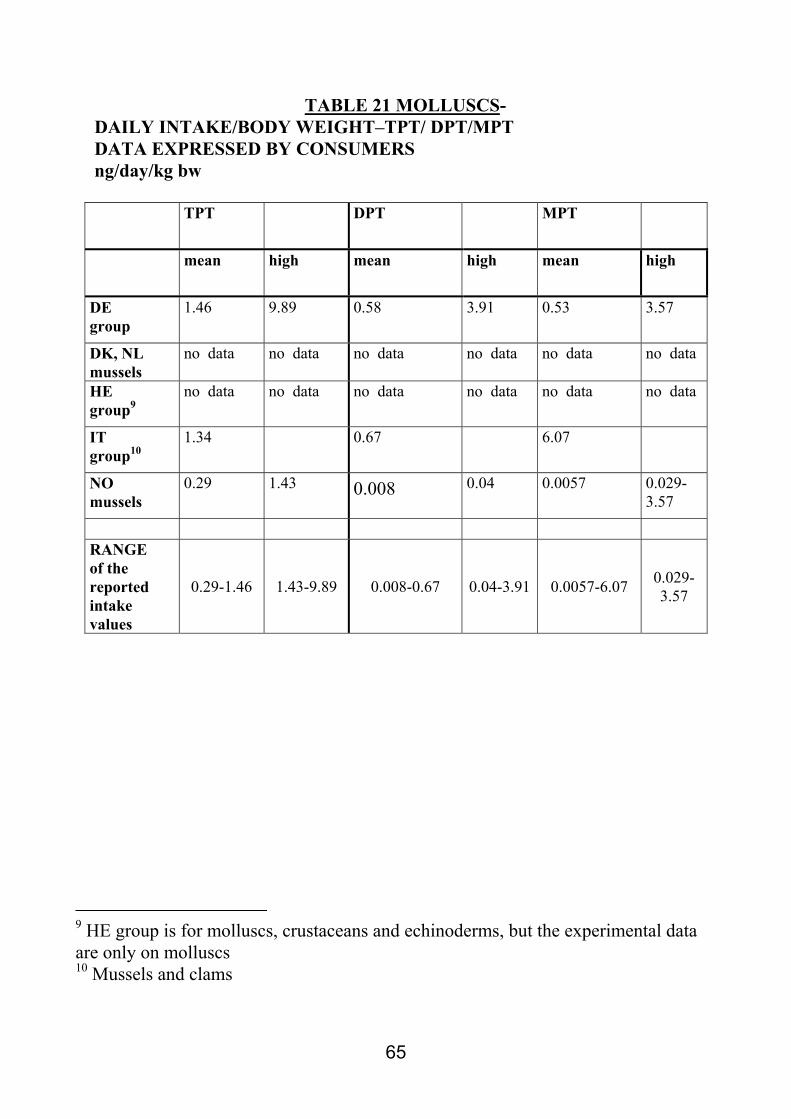
TABLE 21 MOLLUSCS- DAILY INTAKE/BODY WEIGHT–TPT/ DPT/MPT DATA EXPRESSED BY CONSUMERS ng/day/kg bw
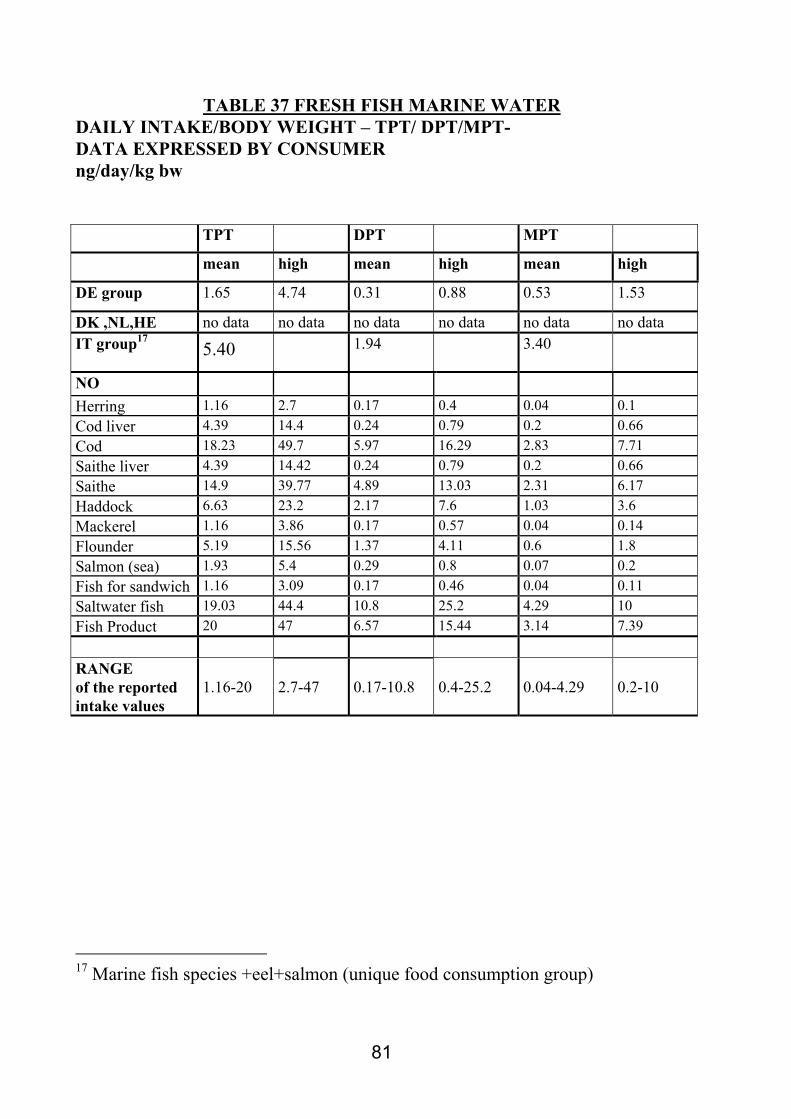
17 Marine fish species +eel+salmon (unique food consumption group)
82
TABLE 38 PRESERVED-FERMENTED-SEMIPRESERVED-PROCESSED-CANNED (etc) FISH – DAILY INTAKE/BODY WEIGHT – TBT/ DBT/MBT- DATA EXPRESSED BY POPULATION ng/day/kg bw
TBT DBT MBT
mean high mean high mean high DE group
0.60 4.67 0.22 1.73 1.08 8.50**
DK,IT,NL,NO
no data no data no data no data no data no data
HE group*
0.04* 0.29* 0.11* 0.71* 0.06* 0.43*
RANGE of the reported intake values
0.04*-0.60 0.29*-4.67 0.11*-0.22 0.71*-
1.73 0.06*-1.08 0.43*-8.50
* never detected, always <lod **this datum is generated from a group of data in which an unusually high value is present in only one sample (see comments in paragraph Ranges of occurrence data vs food groups Table “Fully preserved canned or fermented fish and fish products + semipreserved fish and fish products, including MCE”
83
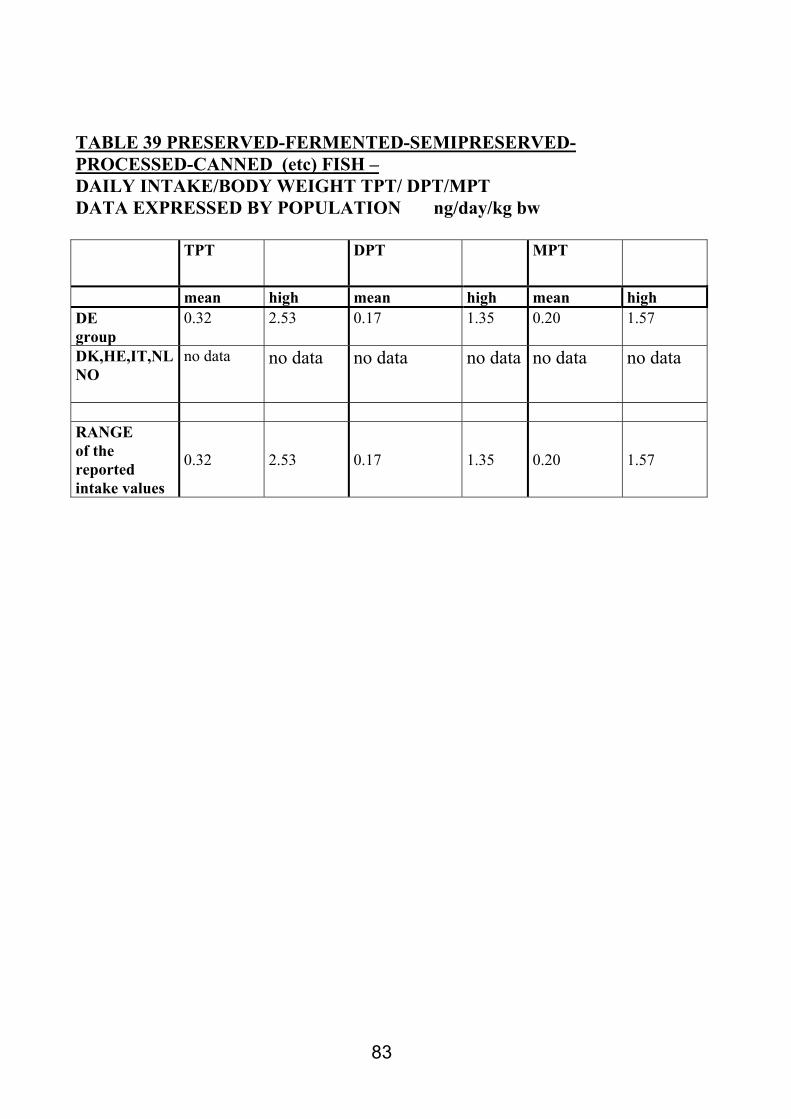
TABLE 39 PRESERVED-FERMENTED-SEMIPRESERVED-PROCESSED-CANNED (etc) FISH – DAILY INTAKE/BODY WEIGHT TPT/ DPT/MPT DATA EXPRESSED BY POPULATION ng/day/kg bw
TPT DPT MPT
mean high mean high mean high DE group
0.32 2.53 0.17 1.35 0.20 1.57
DK,HE,IT,NL NO
no data no data no data no data no data no data
RANGE of the reported intake values
0.32 2.53 0.17 1.35 0.20 1.57
84
TABLE 40 PRESERVED-FERMENTED-SEMIPRESERVED-PROCESSED-CANNED (etc) FISH – DAILY INTAKE/BODY WEIGHT FOR TBT/ DBT/MBT DATA EXPRESSED BY CONSUMERS ng/day/kg bw TBT DBT MBT
mean high mean high mean high DE group
2.03 7.38 0.75 2.73 3.70 13.44**
DK, IT, NL ,NO
no data no data no data no data no data no data
HE group*
0.34* 0.97* 0.86* 2.4* 0.51* 1.4*
RANGE 0.34*-2.03
0.97*-7.38
0.75-0.86* 2.4*2.73 0.51*-3.70 1.4*-13.44**
* never detected, always <lod **this datum is generated from a group of data in which an unusually high value is present in only one sample (see comments in paragraph Ranges of occurrence data vs food groups Table “Fully preserved canned or fermented fish and fish products + semipreserved fish and fish products, including MCE”
85
TABLE 41 PRESERVED-FERMENTED-SEMIPRESERVED-PROCESSED-CANNED (etc) FISH – DAILY INTAKE/BODY WEIGHT TPT/ DPT/MPT DATA EXPRESSED BY CONSUMERS ng/day/kg bw
TPT DPT MPT
mean high mean high mean high DE group
1.10 4.01 0.59 2.14 0.68 2.48
DK,HE,IT,NL NO
no data no data no data no data no data no data
RANGE of the reported intake values
1.10 4.01 0.59 2.14 0.68 2.48
86
2.3.3 DISCUSSION
Before starting to discuss the range of intakes, it shall be reminded that, for the reasons
previously explained, the available basis of intake data is inadequate for a rigorous
comparison between the Countries and therefore the following paragraphs should be read
just as a description of the reported data. In fact, the Member States agreed to discuss
intakes just from the general point of view, without a detailed comparison between the
situation in the different Countries.
2.3.3.1 OVERVIEW The daily intakes calculated by the participating countries ranged for each OTC from
picograms to fractions of micrograms/day/kg body weight; the data are scattered in 3-4
orders of magnitude in the data expressed by population and 1-2 orders of magnitude in
the data expressed by consumers. This different homogeneity reflects the different
background of the data. In fact, besides the scattering due to the different occurrence
levels in the food samples and to the different food consumption patterns between the
countries,other complicating factors are linked to the type of submitted data. The data
expressed by consumers came only from 4 Countries (DE, HE, IT, NO); these Countries
presented intake data calculated for fish groups based on averaged occurrence values. On
the contrary, the data expressed by population came from all the 6 Countries that submitted
daily intakes (mean levels by population for DE, HE,IT,NO,DK,NL) and the reported
ranges include also data on single species.
In addition, within each group the number of submitting countries is different and, as
previously discussed in the case of occurence data, in some cases the submitting countries
are just 1 or 2 in addition to Germany. Therefore it would be not correct to sum intakes for
each country and to compare the resulting total dietary intakes, because of the different
species and amount of species contributing to the group for each country.
2.3.3.2 POPULATION (Mean and High Level) From the reported intake data, the major source of TBT/DBT/MBT for the general
population seems to be bivalve molluscs (Table 18-19) and, generally, marine fish.
(Table 34-35)This can be recognized, with the limitations described above, on the basis of
87
the submitted data, that for these two groups, came from 6/6 Countries. Obviously,
differences can be observed between the intakes of the Countries and this is due not only to
different occurence OTC levels, but also to the different food consumptions. For an
example even though occurrence data for TBT (Table 2) are higher for DE (49 µg/kg) than
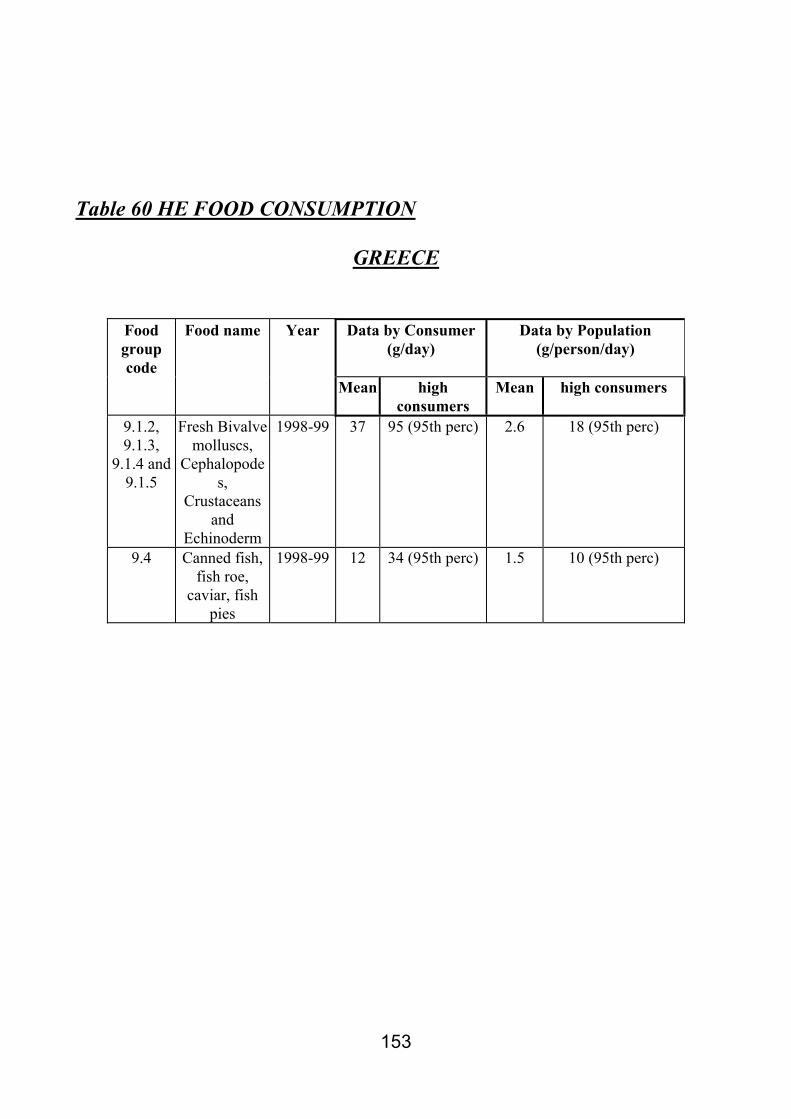
for HE (21.9 µg/kg), being the consumption of bivalve molluscs by general population
higher in HE (2.6 g/day) than in DE (0.14 g/day) (Table 60 and 56) the obtained intake
data are higher for HE (0.81 ng/day/kg b.w) than for DE (0.099 ng/day/kg b.w) . (Table
18) Another observation is that the occurrence OTC levels are generally higher in the
molluscs than in marine fish groups, but, it can be noted that the consumption patterns
show an opposite trend; therefore the intakes from these two groups are not so different as
it could be expected on the only basis of OTC occurrence.
In the case of TPT and derivatives, the major sources for the general population seems to
be marine fish (Table 35) and to a lesser extent, fresh water fish and molluscs. (Tables
27,31 and 19) But it must be said that intake data on TPT/DPT/MPT for marine fish were
submitted by 5/6 Countries, data on molluscs from 4/6 Countries and the other data from
1/6-3/6 Countries; therefore these indications are affected by a further margin of
uncertainty.
Fresh crustacean group (4/6 submitting Countries) seems to be not an important source
in the case of both TBT/DBT/MBT and TPT/DPT/MPT. (Tables 22-23) In fact the levels
of occurrence in crustaceans, especially for TBT and derivatives, are lower than for
molluscs and marine fish, and also the consumption of crustaceans with respect to mean
population, is lower than the consumption of marine fish. Also in the case of Germany
data, where crustacean consumption is higher than mollusc consumption (by population)
the resulting daily intake for crustaceans is lower than the daily intakes for molluscs.
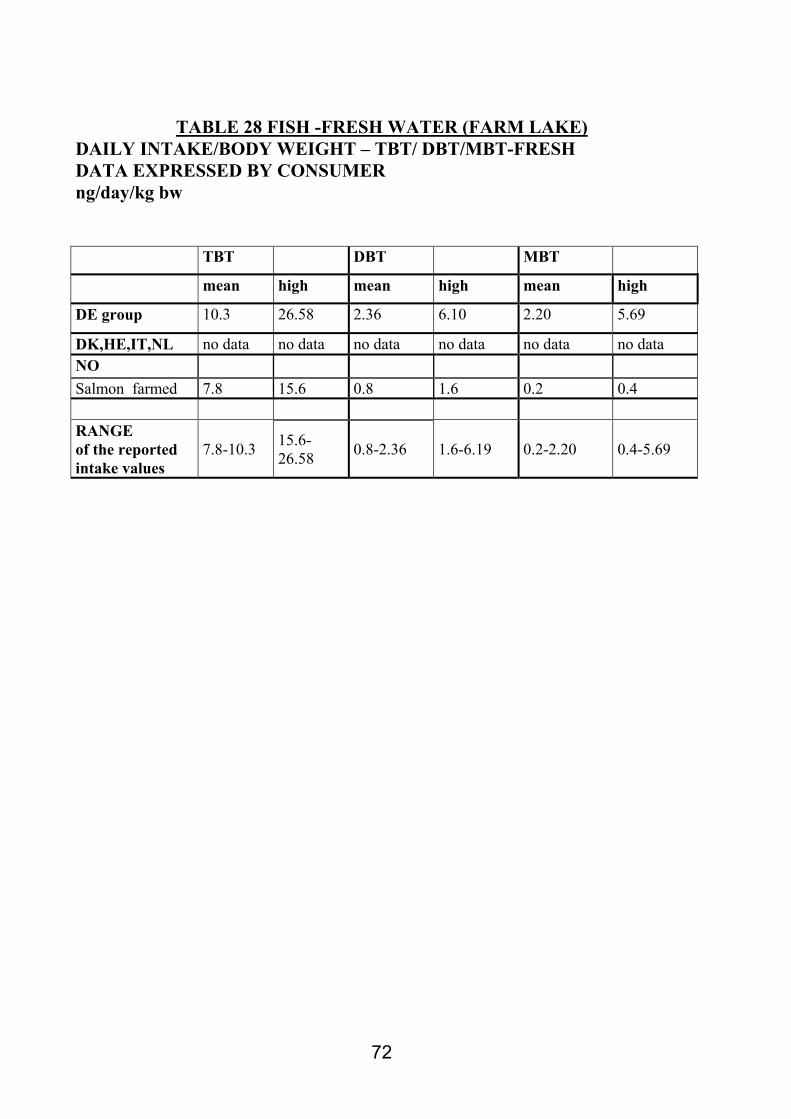
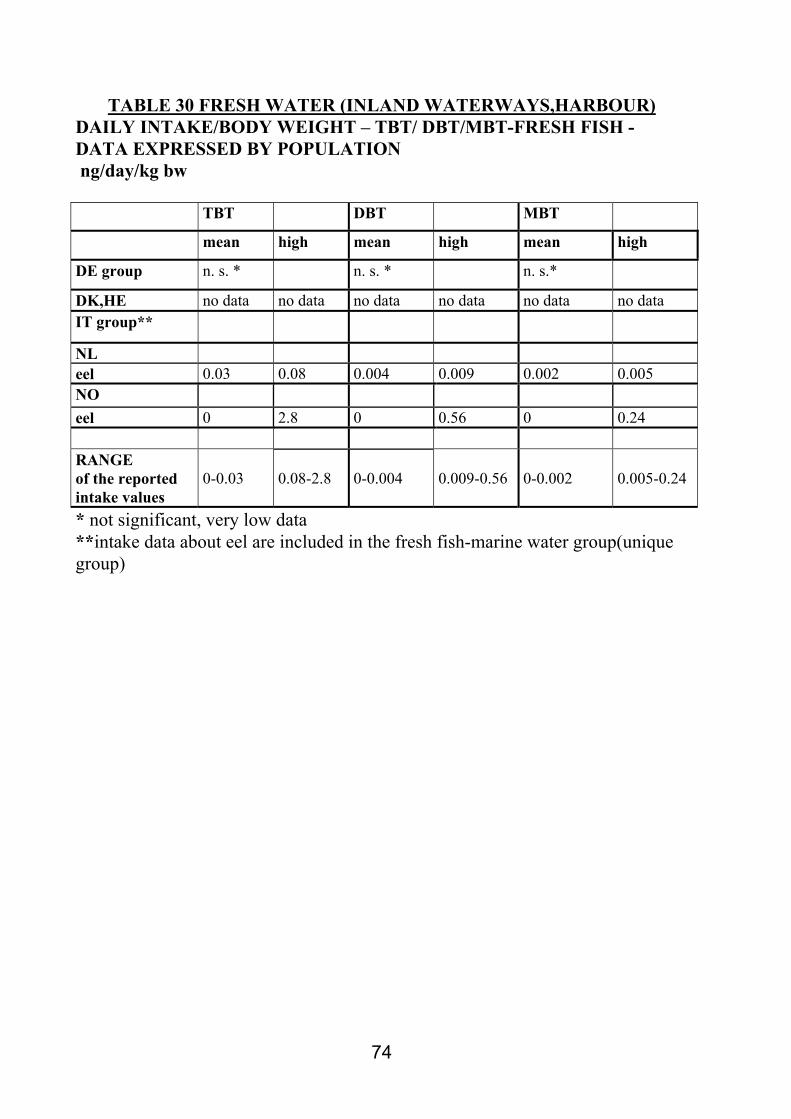
Intake data for fresh water fish from both “lake and farm” (Table 26-27) and “ inland
waterways, harbour, brackish” groups (Tables 30-31) are not easily handled because
they are submitted always by Germany and only by other 1 or 2 Countries. In addition, the
88
daily intakes submitted by the other Countries are generally referred to only one species
(salmon18 or eel).
However, also on this basis, it is possible to observe that this type of fish species are not
an important source of exposure to TBT/DBT/MBT and TPT/DPT/MPT, if these species
are not highly consumed. In fact, the occurrence values for these types of fresh water fish,
available for more Countries, are higher than occurrence values for marine fishes. This is
evident in the data from Germany, that are obtained from very high number of data
(>2000 for lake-farm group, and>1300 for the inland waterways, harbour, brackish
groups). In this case, the consumption habits of the population are fundamental; in fact the
very low level of daily consumption (by general population) of “inland waterways,
harbour, brackish” fish (0.05 g/day) and of farm-lake fish (1.25 g/day) keep the intakes at
levels lower than those of marine fish. (Table 56) This observation highlights the general
lacking of occurrence and consumption data for these type of fish that potentially
represent a source of exposure to TBT and derivatives.
The group of “preserved-fermented-semipreserved-processed-canned fish etc.” (Tables
38-39) is formed only by Germany submission and, for TBT and derivatives by Greece
submission. In the Greece data OTC were never detected; the German intake data are at
levels of subnanogram/day/kg b.w. or below.
2.3.3.3 CONSUMERS ONLY (mean and high levels)
Intake data expressed by consumers were provided by DE, HE,IT,NO; NL and DK did not
provided these data. Therefore in the discussion of this section of daily intake data, only
submissions from 4/6 Countries or less are available and consequently, there is a further
instability of the presented figures.
Neverthless, some useful information seems to be derivable from the available data
Firstly, the data show that in the case of daily intakes expressed by consumers, the major
sources of TBT and derivatives are bivalve molluscs. (Table 20) It is worth to note that
high level consumers, in the countries where molluscs consumption is high, could be
18 intake data for salmon from Norway are estimated and not experimental
89
exposed to levels that are in the order of magnitude of 80-100 ng/day/kg b.w, for TBT,
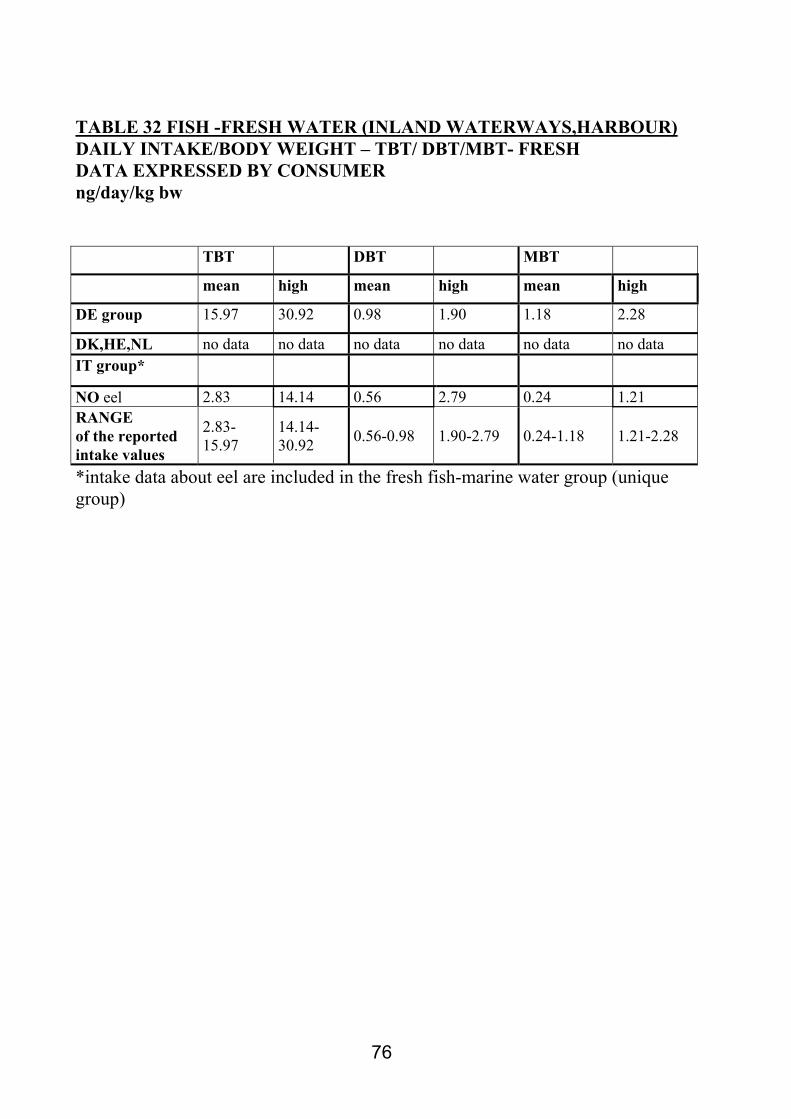
30-170 ng/day/kg b.w for DBT and 10-200 ng/day/kg b.w for MBT. Also fresh-water
fish groups seem to be, for consumers, a potential source of intake of TBT and
derivatives not less relevant than molluscs (Tables 28 and 32). However, it must be
reminded that the groups of fresh water fish (“lake and farm” and “ inland waterways,
harbour, brackish) are represented only by the German submission. Daily intakes from
marine fish were provided by 3/6 Countries (Table 36) . The intake levels of TBT and
derivatives are lower than intakes from fresh water-fish groups, but are in the same orders
of magnitude (1 – 60 ng/day/kg bw) groups.
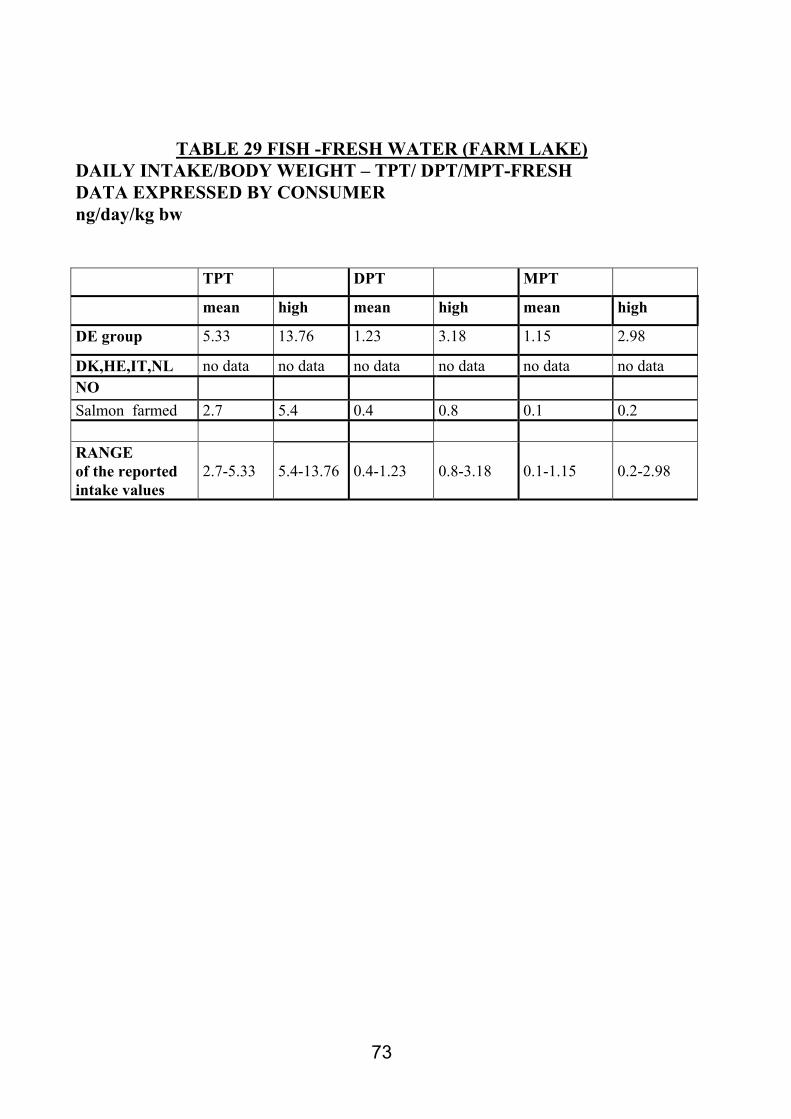
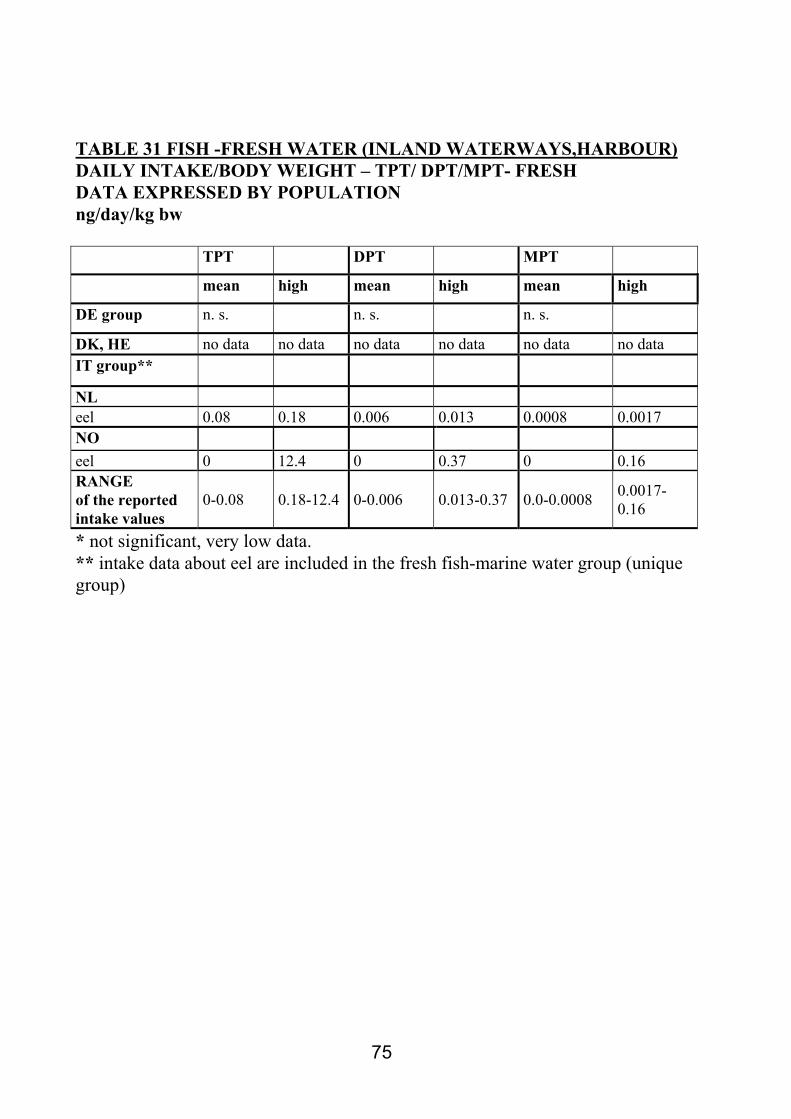
As regards TPT and derivatives (3/6submitting countries) the major source seems to be
marine fish, but it is worth to note that intake data from one Country(NO) are higher than
intake data from the other two submitting Countries(DE,IT) and that the limitating factor
of the low number of submitting Countries does not allow a precise interpretation of the
data.
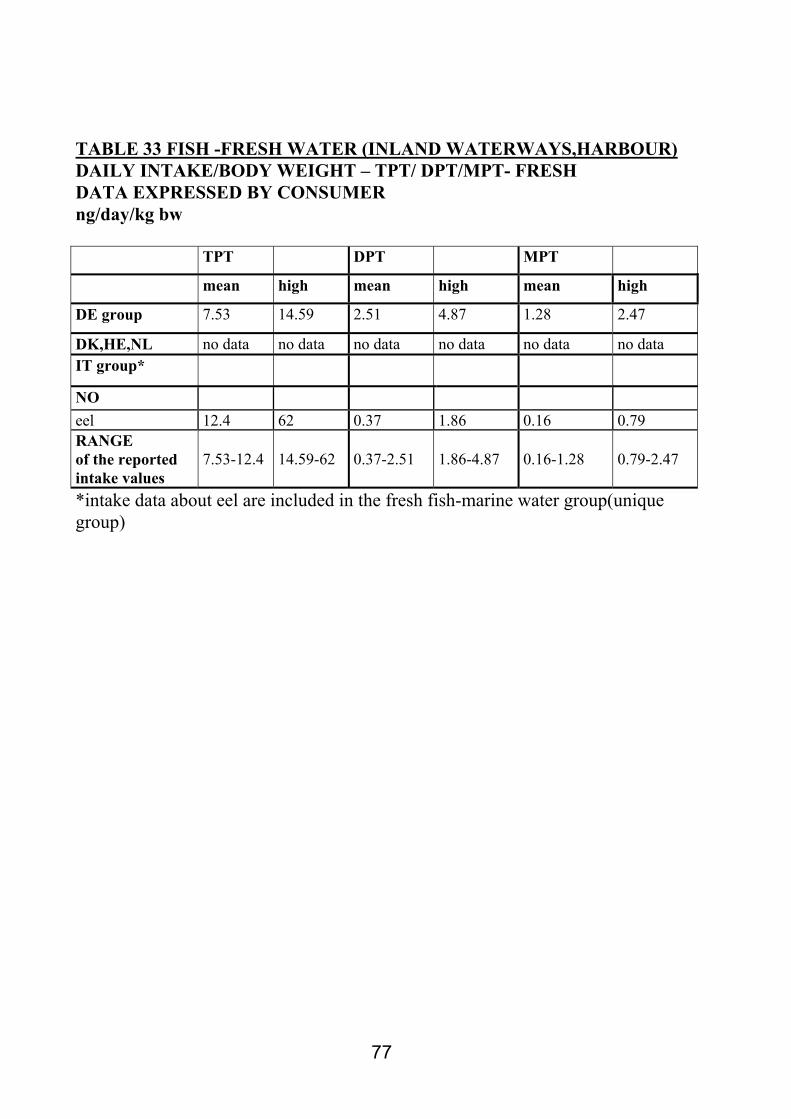
For TPT and derivatives the contribution to daily intake of the groups of fresh water fish
(“lake and farm” and “ inland waterways, harbour, brackish) (Tables 29 and 33) is
not significantly different to that of marine fish.(Table 37)
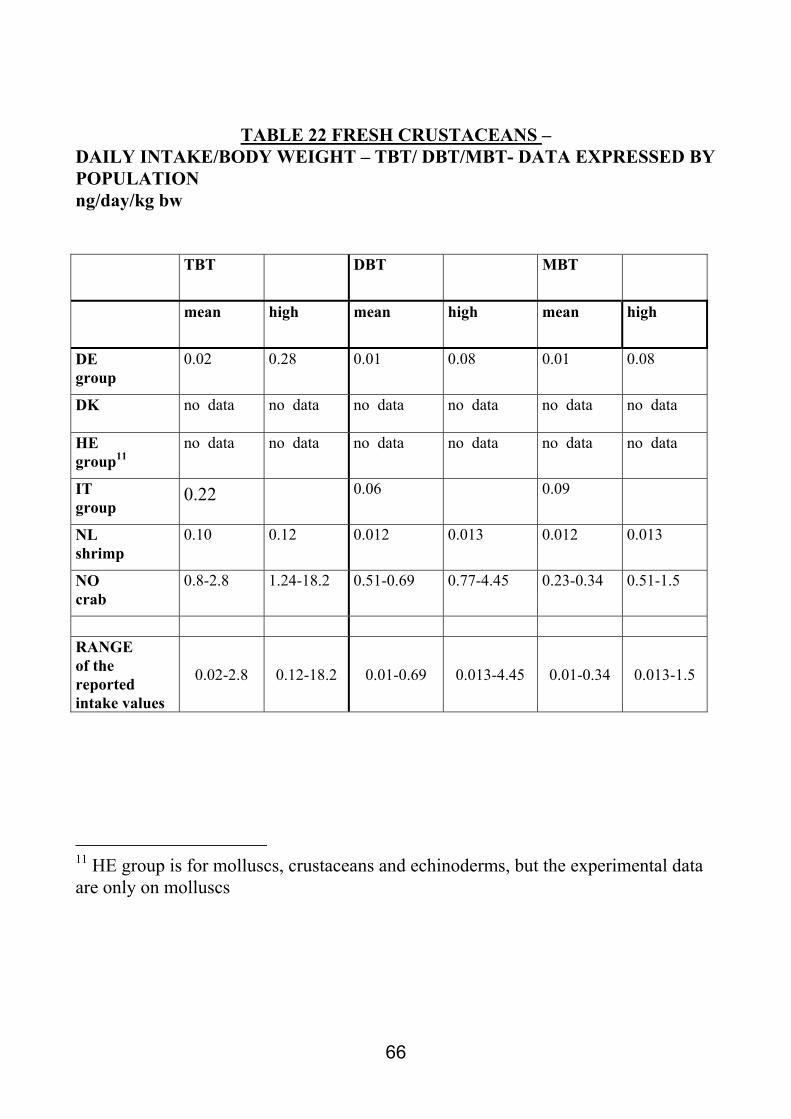
Daily intakes from fresh crustaceans were provided by 3/6 Countries for TBT and
derivatives and by 2/6 Countries for TPT and derivatives. (Table 24-25) As in the case of
data by population, the available data show that crustaceans are not an important source of
exposure to these OTC, for both mean and high level consumers.
The group of “preserved-fermented-semipreserved-processed-canned fish etc.” is
formed only by Germany submission and, for TBT and derivatives by Greek submission.
In the Greek data OTC were never detected; the German intake data were at levels of
subnanograms/day/kg b.w. or below. (Table 40-41)
2.3.3.4 OTHER STUDIES OF INTAKE
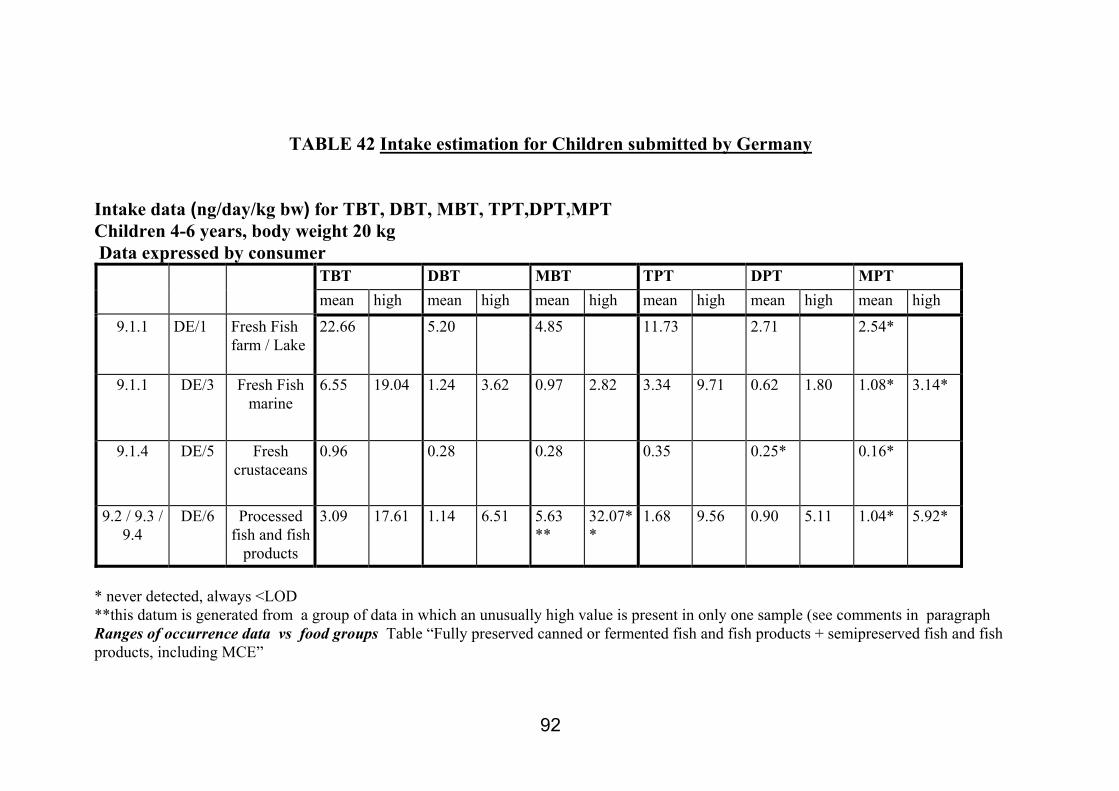
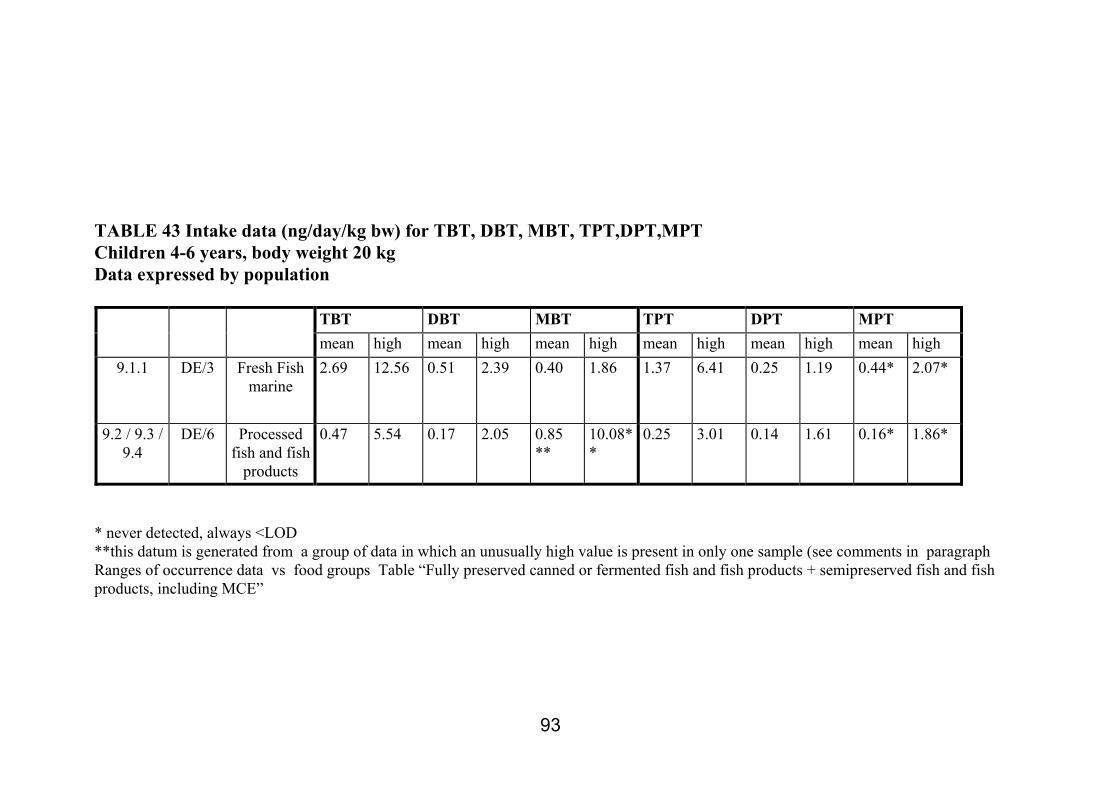
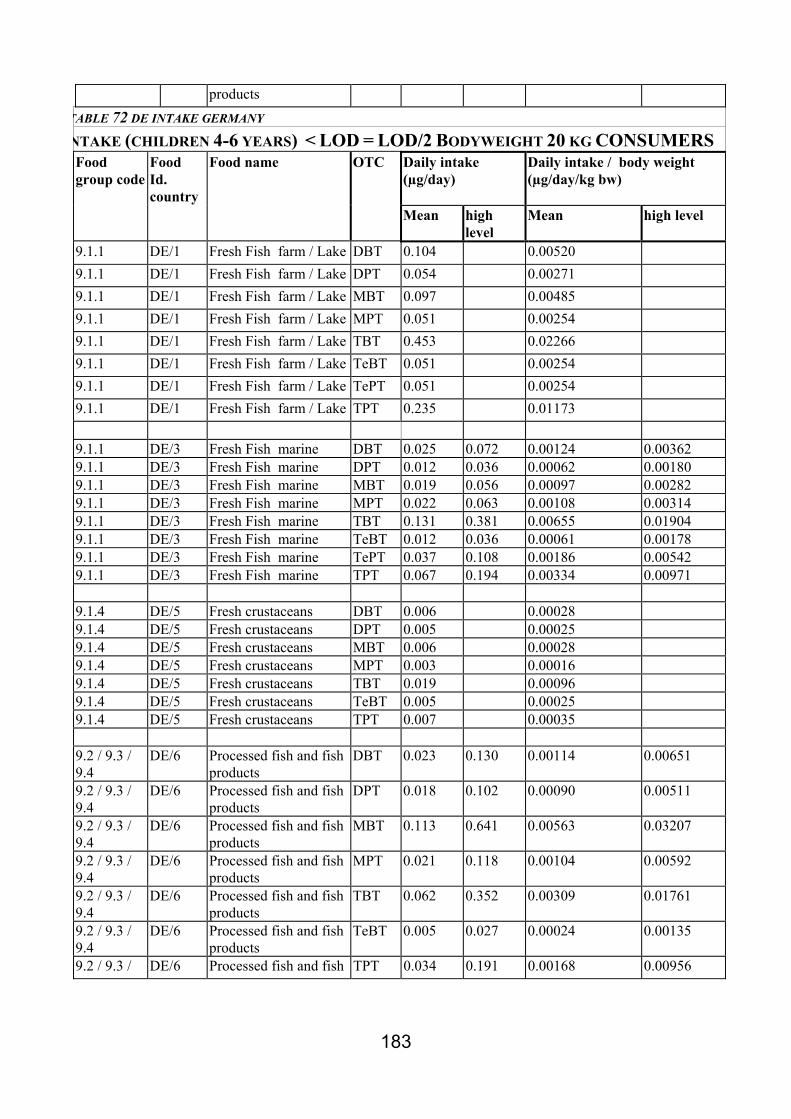
2.3.3.4.1 CHILDREN:
90
Daily intake/b.w. data referred to children (age 4-6 years, b.w. 20 kg) were provided by
Germany. (Table 42-43)The data were calculated by population and by consumers,
according to the available food consumption data. Intake data by population (mean and
high levels) on marine fish and processed fish groups were submitted; low levels of
intake of both TBT and derivatives and TPT and derivatives were reported (highest value:
12.56 ng/day/kg b.w, for TBT, high levels). Intake data by consumers on marine
fish(mean and high levels), fresh water fish (mean level), fresh crustaceans groups (mean
levels), processed fish (mean and high level). The highest daily intake (22.66 ng/day/kg
b.w ) was calculated for TBT in freshwater fish (lake-farm) group.
2.3.3.4.2 COASTAL POPULATION FROM NORWAY
Daily intake/b.w. data referred to special group of population (consumers only) were
provided by Norway. Consumption of fish are based on participants who live in coastal
municipalities. Table 44 reports the calculated data. According to Norway, “It is found that
the consumption of saltwater fish is significantly higher in the population who lives in
coastal areas and therefore they may be a group at risk having a high intake of TBT and
TPT and their derivatives” .
2.3.3.4.3 OTHER OTC
Daily intake data referred to TeBT and TePT were provided only by Germany. The data
are reported in the Tables 67-74 (Annex 1); it is worth to say that just in few cases (see
Table 50) TeBT was detected while TePT was never detected. Therefore the intake data
present a value when calculated with < LOD values equal to LOD/2, while the intake data
are equal to zero when < LOD values are assumed to be zero.
91
92
TABLE 42 Intake estimation for Children submitted by Germany Intake data (ng/day/kg bw) for TBT, DBT, MBT, TPT,DPT,MPT Children 4-6 years, body weight 20 kg Data expressed by consumer
TBT DBT MBT TPT DPT MPT mean high mean high mean high mean high mean high mean high
* never detected, always <LOD **this datum is generated from a group of data in which an unusually high value is present in only one sample (see comments in paragraph Ranges of occurrence data vs food groups Table “Fully preserved canned or fermented fish and fish products + semipreserved fish and fish products, including MCE”
93
TABLE 43 Intake data (ng/day/kg bw) for TBT, DBT, MBT, TPT,DPT,MPT Children 4-6 years, body weight 20 kg Data expressed by population
TBT DBT MBT TPT DPT MPT mean high mean high mean high mean high mean high mean high
* never detected, always <LOD **this datum is generated from a group of data in which an unusually high value is present in only one sample (see comments in paragraph Ranges of occurrence data vs food groups Table “Fully preserved canned or fermented fish and fish products + semipreserved fish and fish products, including MCE”
94
TABLE 44 Intake estimation for coastal municipalities (potentially very high consumers) submitted by Norway Intake data (ng/day/kg bw) for TBT, DBT, MBT, TPT,DPT,MPT Adults, b. w.70 kg;Data expressed by consumer
TBT DBT MBT TPT DPT MPT mean high mean high mean high mean high mean high mean high
3 CONCLUSIONS The 8 participating countries provided data available at the national levels on OTC occurrence,
related to marine and freshwater fishes, crustaceans, molluscs, processed and canned fish and
on their consumptions. The bulk of information allows to draw conclusions from different
points of view and to provide suggestions for future work.
3.1 OCCURRENCE
Data were submitted by 8/8 countries; the available information on the occurrence of 6 OTC
(TBT,DBT,MBT,TPT,DPT,MPT) was provided; the amount of submitted data was very
different between the countries (number of occurrence data, number of fish species, more than
a cluster of occurrence data for the same species, no mean values, different representativity of
the occurrence data etc).
Bivalve molluscs accumulate TBT and derivatives more than the other fish species but also
fresh-water fish groups may represent a source of exposure. Fresh marine fish presents high
levels of OTC in liver . Fresh crustaceans and canned/processed fish group present lower level
of OTC. Less data were available for TPT and derivatives, but the occurrence profile is not
significantly different from TBT and derivatives.
Only Germany submitted occurrence data, on other OTC compounds MOT (monoctyl tin)
DOT, (Dioctyltin) and TOT (Trioctyltin) in fish and fish products; the data are in a limited
number of samples and always <LOD. In addition only Germany submitted occurrence data for
TeBT (Tetrabutyltin) and TePT (Tetraphenyltin) in various fish species; but these were not
considered further.
3.1.1 Analytical Quality Assurance
The analytical quality of the submitted data was guaranteed by the National Experts that had
previously selected the data according to agreed parameters (reported in annexes to the
questionnaire) and then had presented data togheter with the relevant and required details
about Analytical Quality Assurance. Two Countries marked the whole set of their occurrence
data as not suitable to calculate intake because they are too old or in insufficient amount.
98
3.1.2 Origin of the occurrence data
A big part of the presented occurrence data had been generated in the frame of environmental
monitorings and therefore they are not strictly representative of the food that is really eaten
from the people, or they represent just part of it.
3.2 FOOD CONSUMPTION
The major amounts of food consumption data are referred to fish groups. Basic differences
exist in qualitative/quantitative composition of fish groups between the Member States. In fact,
there are not common rules or settled scientific criteria to group foods or, specifically, fish
foods and therefore the grouping has been made on the basis of national strategies. Therefore,
on the basis of the provided information, only “qualitative” allocation of single species within
the groups was possible. Consumption data were often not available for species for which
occurrence data were provided. Different methods were used to produce food consumption
data.
3.3 DIETARY INTAKE
The daily intakes submitted by the participating Countries ranged for each OTC from
picograms to fractions of micrograms/day/kg body weight; the data are scattered in 3-4 orders
of magnitude in the data expressed by population and in 1-2 orders of magnitude in the data
expressed by consumers. The available intake data is inadequate for a rigorous comparison
between the Countries, due to the different background of the intake data (difference in quali-
quantitative submission of occurrence data, origin of the occurrence data, differences in
methods to estimate food consumption etc). Even with the above limitations, some evidences
could be highlighted:
• once more it is confirmed that bivalve molluscs seem to be for the general population
the major source of OTC between fish foods ; also marine fish and fresh water fish
may contribute to daily intake, while crustaceans are a minor source of intake of OTC.
• daily intakes of OTC referred to consumers suggest that deeper studies should be
carried out on high level consumers. In fact taking into account the ADI proposed for
99
TBT by CSTEE in 1998 (1)19 ( 0.25 µg/day/kg bw) the data for bivalve molluscs in
high level consumers from HE and DE account for more than 30% of the value; it is
not agreed an ADI for DBT and MBT, but the contribution of these metabolites,
especially DBT, could be relevant. Also the cumulative data for both TBT and TPT
intake by coastal population in Norway (Fish, general product) approximate the values
of ADI proposed for TBT by CSTEE (1) and established for Triphenyltin (4) 20
compounds by WHO (0-0.5 µg/day/kg. bw).
Moreover, in the future, further studies data on real foods will be necessary to monitor
other OTC used as plastic stabilizers, too. In fact the recent approval of several Organotin
stabilizers in the EC Directive 2001/62/EC21, on material and articles in contact with
foodstufs harmonized the use of these substances at the EU level. Therefore, the eventual
occurrence of these other OTC in packaged foods could be deepened, being this source
different from the acquatic environment, until now the unique and monitored as major
source identified for exposure to OTC.
3.4 FINAL OBSERVATIONS
The National Experts agreed about the necessity for the future time to plan targeted actions
to produce OTC occurrence data on foods really eaten by consumers. The distinction
between environmental monitoring and food contamination monitoring could be one of the
keypoints for future strategies. Furthermore, it would be highly desirable to get
harmonized or agreed guidelines to perform the whole monitoring plan, from the
collection of the sample, to the measurements of OTC occurrence, to the production of
food consumption data, to data handling to calculate intakes.
19 Opinion on the report by WS Atkins International Ltd (vol.A) “Assessment of the Risks to Health and to the Environment of Tin Organic Compounds in Antifouling Paint and of the Effects of Further Restrictions on their Marketing and Use”, opinion expressed at the 6th CSTEE plenary meeting, Brussels, 27 November 1998 http://europa.eu.int/comm/food/fs/sc/sct/outcome_en.html. 20 Triphenyltin Compounds Concise International Chemical Assessment Document 13 WHO 1999 21 Commission Directive 2001/62/EC of 9 August 2001 amending Directive 90/128/EEC relating to plastic materials and articles intended to come into contact with foodstuffs.
100
A particular effort should be posed to produce daily intake data of OTC on consumers
and especially on high-level consumers that show a major risk to approximate or exceed
suggested ADI values. A special attention shoud be dedicated to the individuation of
geographic areas national or most probably subnational, where consumption of fish is
particularly high, to perform subgrouping for very high consumers.
4. ACKNOWLEDGEMENTS The coordinator Dr. Maria Rosaria Milana, wishes to thank Dr. Massimo Baldini for the
scientific support, Dr. Roberto Miniero for the useful discussion of the occurrence data,
Dr. Roberto Morabito for the advices in the quality assurance in the collection of data.
Furthermore, the coordinator would like to thank all the participating countries and contact
Experts for their cooperations and finally, Dr. Martin Slayne and Dr. Walter De Klerck for
their guidance and help during this task. A final acknowledgement to Mrs. Antonella Maini
for the typing of this Report.
101
ANNEX 1
1. SUMMARIES OF SUBMITTED OCCURRENCE DATA 2. SUMMARIES OF SUBMITTED FOOD CONSUMPTION DATA 3. SUMMARIES OF SUBMITTED INTAKE DATA
102
1. SUMMARIES OF SUBMITTED OCCURRENCE DATA
103
1.1 BELGIUM
Belgium submitted data generated in 2001. OTC occurrence data (TBT,DBT) were presented
for two fish species (sole, cod) ,gasteropods , mussels , and scallops . The unit used for the reported
OTC concentrations is µg/kg wet weight OTC . Minimum and maximum experimental values were
given , without other information.
Sampling procedures no information
Point of sampling
Marine Harbour. Treatment of samples no information Analysis of samples
GC/MS ( LOD was 20 µg/kg) and for mussels ,GC/FPD, (LOD 0.2 µg/kg)
Evidence of Analytical Quality Assurance The analytical method is in development and not yet validated Table BE-occurrence reports the food code and name, the OTC ,the year of sampling the detected
values and a remark about their use for calculation of intake.
104
TABLE 45 BE OCCURRENCE
BELGIUM
Food group code
Food name
Year of samplin
g
OTC Concentration of specific
OTC
Mean /Median level of specific OTC (M=mean; Me=median)
Min
ug/kg
Max
Representative for intake calcul. (Y/N) Random / Targeted(R/T)
The data provided, have been generated between 1998 and 2001. OTC occurrence data (TBT,DBT,MBT TPT,DPT,MPT) were presented for fresh fish (cod liver
and muscle, flounder liver and muscle) for Porpoise, for birds crabs and whelks, and for mussels (only TBT,DBT,MBT). The unit used for the reported OTC concentrations is µg/kg wet weight. The mean levels of OTC were calculated only for those foods for which food consumption data were available. Table DK-occurrence reports Food group codes and name, OTC, the mean concentrations calculated for the specific OTC ,the range of the experimentally detected values, the years, the number of samples, the representativity for intake calculations, and whether samples were taken on a random (R) or targeted (T) basis. The complete occurence raw data are reported in Technical Annex on CD ROM
Sampling Sampling was performed by the National Environmental Research Institute Denmark and Danish Forest and Nature Agency.
Fish: Samples of fish are taken by net between November and January. Fish are stored in water filled plastic containers filled with seawater until the arrival at the lab. No extra measures are done at sampling or transportation to minimize exposure of the fish to sunlight or ambient temperatures. At arrival to the lab, the fish are dissected and frozen at –20 dg. C. If unable to dissect all samples immediately, the samples are frozen and dissected later. Samples are kept in inert PE plastic bags at –20 dg C and darkness until analysis. Storage time is always below 3 months. Birds Samples of birds are obtained by hunting. Samples are kept in inert plastic bags until arrival at the lab, no extra measures are done at sampling or transportation to minimize exposure of the birds to sunlight or ambient temperatures. At arrival to the lab, the birds are dissected, tissues homogenized with a blender and frozen at –20 dg. C. If unable to dissect all samples immediately, the samples are frozen and dissected later. Samples are kept in inert PE plastic bags at –20 dg C and darkness until analysis. Storage time is always below 3 months. Porpoise: Samples of Porpoise are taking from accidental catches by fishing boats. No special measures are taken from the time of catch to the arrival at the lab. At arrival, the porpoise is dissected, and the liver samples are homogenized with a blender and frozen at –20 dg. C. Samples are kept in inert PE plastic bags at –20 dg C and darkness until analysis. Storage time is always below 3 months.
106
Crabs and whelks Crabs and whelks are collected at size-ranges from 55 to 70 mm. After collection they are transported to the lab in water-filled plastic containers. No extra measures are done at sampling or transportation to minimize exposure of the fish to sunlight or ambient temperatures. At arrival to the lab, the crabs and whelks are dissected, homogenized with a blender, pooled in sample sizes of 10 individuals per site and frozen at –20 dg. C. If unable to dissect all samples immediately, the samples are frozen and dissected later. Samples are kept in inert PE plastic bags at –20 dg C and darkness until analysis. Storage time is always below 3 months. Mussels Mussels are collected at size-ranges from 50 to 60 mm. After collection they are transported to the lab in water-filled plastic containers. No extra measures are done at sampling or transportation to minimize exposure of the mussels to sunlight or ambient temperatures. After arriving at the lab, the mussels are kept in running seawater for 12 h for depuration. After depuration, the mussels are dissected, homogenized with a blender, pooled in sample sizes of 25 individuals per site and frozen at –20 dg. C. Samples are kept in inert PE plastic bags at –20 dg C and darkness until analysis. Storage time is always below 3 months Chemical analysis
2 g (ww) of defrosted, homogenized tissue are treated with 1M HCL and ultrasonic treatment (US),
and adjusted to pH 5 with NaOH and NaAcetate. Organic tin compounds are then extracted using a
ethylation with NaEt4B and liquid extraction (LE) with Pentane. The extracts are reduced under N2
and detection is by GC-PFPD.
Analytical quality assurance (AQA)
In-house validation, CRM (BCR 646 and BCR 477and in-house reference material ) Proficiency
tests(Quasimeme biota, water and sediments) and accreditation (DANAK) are all performed.
Performances are satisfactory with recovery within certificate uncertainty thereby eliminating the
need for correcting the data based on recovery. Z-scores are within +/- 2.
107
TABLE 46 DK
OCCURRENCE
Denmark
Food group code
Food name OTC Concentration in food (µg/kg)
calculated with <LOD=0
calculated with <LOD =LOD/2
Range of detected values (µg/kg)
n of samples
year Representative for intake calcul. (Y/N) Random / Targeted(R/T)
9.1.2.1 Blue Mussel TBT no<LOD 28.75 18.57-41.54 2001 Y/T 9.1.2.1 Blue Mussel DBT no<LOD 17.75 8.44-25.51 2001 Y/T 9.1.2.1 Blue Mussel MBT no<LOD 1.94 0.22-5.48 2001 Y/T 9.1.2.1 Blue Mussel TBT no<LOD 56.64 6.38-332.79 2000 Y/T 9.1.2.1 Blue Mussel DBT no<LOD 14.71 0.98-76.41 2000 Y/T
108
9.1.2.1 Blue Mussel MBT no<LOD 15.30 1.08-130.08 2000 Y/T 9.1.2.1 Blue Mussel TBT no<LOD 18.61 3.52-70.94 1999 Y/T 9.1.2.1 Blue Mussel DBT no<LOD 7.43 0.29-26.29 1999 Y/T 9.1.2.1 Blue Mussel MBT no<LOD 11.39 0.83-107.33 1999 Y/T 9.1.2.1 Blue Mussel TBT no<LOD 50.65 4.56-230.31 1998 Y/T 9.1.2.1 Blue Mussel DBT no<LOD 4.91 0.65-17.70 1998 Y/T 9.1.2.1 Blue Mussel MBT no<LOD 31.72 3.32-186.90 1998 Y/T
109
1.3 GREECE
Greece submitted occurrence OTC data (TBT,DBT,MBT) in fresh bivalve molluscs, octopus and
canned tuna samples, generated between 2001 and 2002. The mean concentration of TBT, DBT,
MBT in the whole set of data for fresh seafood was calculated as a group, according to the
grouping of consumption data presented by Greece. Therefore, for the group “Fresh bivalve
molluscs, cephalopodes, crustaceans and echinoderm” the mean concentration was 21.9 µg/kg
(TBT) 27 µg/kg (DBT) and 25 µg/kg (MBT) with LOD/2 when the experimental values were
<LOD.
Occurrence data for Canned Tuna in Brine were presented, too; they were correlated to the group
“Canned fish, fish roe, caviar, fish pies “ . The experimental values were always <LOD, and the
mean concentrations, calculated as above, were 2 µg/kg (TBT), 5 µg/kg (DBT), 3 µg/kg (MBT).
Table HE reports Food group codes and name, OTC, the mean concentrations calculated 1) with
<LOD=0 and 2)with <LOD =LOD/2, the range of the experimentally detected values, the year,
the number of samples, the representativity for intake calculations, and whether samples were
taken on a random (R) or targeted (T) basis. The detailed occurence data are reported in in
Technical Annex on CD ROM Point of the sampling Fresh safood was from Open Sea and was collected both form Farm and from fishing ground of
the Greek area. Octopus samples were from fishing ground of Morocco and Canned tuna samples
were produced in Italy.
Treatment of the samples The individual samples were consisted of 50-70 fresh bivalve molluscs or 2.5 kg of octopus (3
individuals). Immediately after sampling, the samples were transported to the laboratory where all
the bivalves and approximately 1 kg of octopus were homogenized. Approximately 100 g of sub-
110
sample were removed from the homogenized sample and placed in a dark glass bottle and stored at
–20°C for analysis.
The canned tuna sample was consisted of 5 cans. They were opened and the brine was removed, the
content was homogenized and a sub-sample of 100 g was placed in dark glass bottle and stored at -
20°C for analysis.
Analysis of samples Approximately 0.5 – 1.0 g of wet homogenized sample was placed in a glass beaker, dissolved with
TMAH (25%), sonicated for 5 min, diluted with water (15 ml), transferred in a volumetric flask and
the pH of the solution was adjusted to 5 by adding 1 ml of acetic acid and 10 ml of an acetate
buffer. 1 ml of tetraethylborate solution (2%) was added, along with 1 ml of hexane and the flask
was shaken for 5 min. Then the flask was stood for 20 min and then centrifuged for 10 min to
separate the organic extract. 1 µl of this extract was injected into the GC-FPD instrument (column:
HP-1, id: 0.53 mm). Calibration was performed with high purity ethylated organotin standards in
hexane obtained by IVM, the The Netherlandss. CRM 477 was analyzed in parallel with samples. EVIDENCE OF AQA
The method was validated. The Laboratory uses certified reference materials for TBT, DBT, MBT
in mussels (CRM 477). Class 100 Clean room facilities are used
111
TABLE 47 HE MEAN OCCURRENCE GREECE
Mean Concentration in food group
(µg/kg)
Food group code
Food name OTC
calculated
with <LOD
=0
calculated
with <LOD =LOD/
2
Range of detected values (µg/kg)
n of sample
s
year Representative for intake calcul. (Y/N)
Random / Targeted(R/
T)
9.1.2, 9.1.3, 9.1.4 and
9.1.5
Fresh Bivalve molluscs,
Cephalopodes, Crustaceans
and Echinoderm
TBT 21.4 21.9 <4 - 61 16 2001-
2002
Y/R
9.1.2, 9.1.3, 9.1.4 and
9.1.5
Fresh Bivalve molluscs,
Cephalopodes, Crustaceans
and Echinoderm
DBT 25.6 27.1 <10 - 127
16 2001-
2002
Y/R
9.1.2, 9.1.3, 9.1.4 and
9.1.5
Fresh Bivalve molluscs,
Cephalopodes, Crustaceans
and Echinoderm
MBT 24.1 25 <6 - 151 16 2001-
2002
Y/R
9,4 Canned fish, fish roe,
caviar, fish pies
TBT 0 2 <4 1 2001-
2002
Y/R
9,4 Canned fish, fish roe,
caviar, fish pies
DBT 0 5 <10 1 2001-
2002
Y/R
9,4 Canned fish, fish roe,
caviar, fish pies
MBT 0 3 <6 1 2001-
2002
Y/R
112
1.4 GERMANY OCCURRENCE DATA
The National Contact point analysed and evaluated 9000 single occurrence data, that were
produced between 2000 and 2002.. The reported data are referred to monitoring studies performed in different regions from the Country (Länder).. OTC occurrence data were provided for 69 different types of sea foods. Mean concentrations of TBT, DBT, MBT, TPT,DPT, MPT have been calculated after grouping occurrence data in 6 food groups, according to the food consumption data in Germany. Also data on Tetrabutyltin (TeBT) and Tetraphenyltin (TePT) were submitted and are reported. Mean concentrations were calculated both with < LOD =0 and <LOD=LOD/2. In the raw data (see technical annex on CD ROM) the single species and the occurrence data are reported.
TABLE 48 Sample collected year /sample analysed year
Fresh fish farm lake
Fresh Fish Inland waterways harbour
Fresh Fish marine
Mussels
Fresh crustaceans
Processed fish.Fish products
SUAH Staatliches Untersuchungsamt Hessen
00/00 00/00
00/00
00/00
00/00
00/00 01/01
B Berlin
01/01 02/02
01/01
02/02
Bay Bayern
00/00 00/01 01/01
01/01
00/01 01/01
00/01 01/01
01/01
BaWü Baden Württemberg
00/01 01/01
01/01 02/02
01/01
01/01 02/02
NRW Nordrhein Westfalen
00/01
01/01
NRWM Nordrhein Westfalen Münster
01/01
01/01
113
RLP Rheinland Pfalz
00/00
99/00
00/00 01/01
00/00
99/00
SLH Schleswig Holstein
01/02
01/02
01;02/
02
01/02
CUX Cuxhaven
99/00
00/00 00/01 01/01
00/00
00/00
00/01 01/01
MV Mecklenburg Vorpommern
01/02
Sampling procedures , Point of sampling, sample pretreatment
DE/SUAH :All samples were homogenized in the laboratory and were stored cooled at –18 °C till they were analyzed.
DE/BAY /01:The fish of the monitoring were sampled by professional fishermen at the south-bavarian lakes (Ammersee, Bodensee, Chiemsee, Tegernsee a.o.) and could mostly come into commerce.All samples were stored at –20°C between sampling and analysis.
DE/BAY /02 :All samples were collected in shops in northern Bavaria. Transportation has been done under cooled conditions. Samples were stored at 4 °C between sampling and analysis (Fish products). Chemical Analysis Cux 001 (official German § 35 standard-procedure) Decomposition of the matrix by TMAH-reagent; Ethylation with NaB(Et)4; Simultaneous Extraction into n-hexane; Clean-up on a deactivated Florisil/ Al2O3 – Column; GC Conditions Column: 60 m / 0,25 mm / 0,25 µ DB-5; Carrier H2; Injection: 2 µl pss; Detection: FPD with enhanced oxidant (40 % O2); Quantification: using TPrT and DOcT as internal standards Control of GC-Results by means of GC-MS/MS (Ion trap). NRW/ 01 a) 1. Extraction: (DE 002) 5 g sample + ISTD tetrapentyltin+ 30 ml toluol;30 min shake and 5 min centrifugation;Filter by sodium sulfat and evaporate to 1 ml. 2. Derivatisation: (DE 003) Derivatisation with methylmagnesiumchloride
114
3. Cleaning: (DE 002) Cleaning by SPE: 10 g florisil, 10 g aluminiumoxide and 10 g sodium sulfat 4. Measuring:GC/LRMS, SIM, EI b) Method of the "Staatliche Veterinäruntersuchungsamt für Fisch und Fischereiwaren" Cuxhaven (preliminary method M/DE/Cux 001, 16.06.2000): 2 g sample + ISTD (TprT);Decomposition of the matrix with TMAH (tetramethylammoniumhydroxide);Derivatisation with sodium tetraethylborate;Cleaning with kieselgel;Measuring by GC/HRMS, SIM, EI SUAH Determination of Organotin compounds in fish and mussels with GC techniques. Method of the official German §35 standard-procedure (february 2002) BAY/01 Sample preparation for the speciation of OT-compounds in marine biomaterials is using a tetra-methylammoniumhydroxide solubilisation. Derivatisation and extraction is carried out in situ at pH 4.5 using tetraethylborate in the presence of isooctane after adding tripropyltin as internal standard. After shaking 30 min an aliquot of the isooctan-extract was directly injected into the GC-MS. BAY/02 Samples were homogenized and extracted with acetonitrile in the presence of tropolone after adding the internal Standards monoheptyltin, diheptyltin, and tripropyltin. Derivatisation is carried out at pH 4.2-4.5 using tetraethylborate in the presence of n-hexane. After shaking 15 min at roomtemperature an aliquot of the hexane-extract was directly injected into the GC-MS. RLP(Official German § 35 Standard procedure) Samples were homogenized. Decomposition of the matrix by the TMAH-reagent. Ethylation with NaB(Et)4. Simultaneous extraction into hexane. Clean-up and detection with GC-HRMS SH
Official German § 35 standard-procedure
BW Extraction Technique and Pretreatment:alkaline hydrolyse using 20 % tetramethylammonium hydroxide (1 hour at 60°C); LE with methanol/dichloromethane/tropolone by adjustment to pH 5; ethylation of ionic OTC with sodium tetraethylborate and extraction into n-hexene; Instrumental determination:GC-FPD, GC-MSD
115
TABLE 49 EVIDENCE FOR AQA
Proficiency testing
Certified Reference Material
Accreditation
In house validation National Intercomparison exercise
RLP BgVV for admission as a official German § 35 standard-procedure
SLH CRM477 (TBT,DBT,
MBT)
CUX BGVV Fish Mussels
Control of the results, reconfirmation GC/MS/MS ion trap
BgVV for admission as a official German § 35 standard-procedure
MV .
Table DE-occurrence
116
The Table DE -occurrence reports the food group code, identification and name, the detected
OTC, the calculated mean concentrations, the n of samples and the range of the detected values,
the year, the representativity for intake calculations, and whether samples were taken on a random
(R) or targeted (T) basis. The indication DE/1-6 in the second column is referred to the 6 food
groups developed in Germany.
117
TABLE 50 DE OCCURRENCE
GERMANY
Mean concentration in food group (µg/kg)
Range of detected values (µg/kg)
year Representative for intake calcul. (Y/N)
Random / Targeted(
R/T)
Food group code
Food Identification (country)
Food name OTC
calculated with <LOD=022
calculated with <LOD=LOD/223
n of samples
9.1.1 DE/1 Fresh Fish farm / Lake
DBT 0.85 5.13 359 <LOD / 88 2000-2002
Y/R
9.1.1 DE/1 Fresh Fish farm / Lake
DPT 0.13 2.67 291 <LOD / 12 2000-2002
Y/R
9.1.1 DE/1 Fresh Fish farm / Lake
MBT 0.55 4.78 358 <LOD / 116
2000-2002
Y/R
9.1.1 DE/1 Fresh Fish farm / Lake
MPT 0 2.5 68 <LOD / <LOD
2000-2002
Y/R
9.1.1 DE/1 Fresh Fish farm / Lake
TBT 19.79 22.34 362 <LOD / 125
2000-2002
Y/R
9.1.1 DE/1 Fresh Fish farm / Lake
TeBT
0 2.5 83 <LOD / <LOD
2000-2002
Y/R
9.1.1 DE/1 Fresh Fish farm / Lake
TePT
0 2.5 54 <LOD / <LOD
2000-2002
Y/R
9.1.1 DE/1 Fresh Fish farm / Lake
TPT 9.92 11.56 344 <LOD / 152
2000-2002
Y/R
22 mean concentrations calculated with <LOD=0 and <LOD=LOD/2 were calculated in some instances with different n 23 mean concentrations calculated with <LOD=0 and <LOD=LOD/2 were calculated in some instances with different n
118
9.1.1 DE/2 Fresh Fish
Inland water ways/ harbour
DBT 1.63 2.69 237 <LOD / 25 1999-2002
Y/R
9.1.1 DE/2 Fresh Fish Inland water ways / harbour
DPT 0.42 6.9 218 <LOD / 30 1999-2002
Y/R
9.1.1 DE/2 Fresh Fish Inland water ways / harbour
MBT 0.16 3.23 236 <LOD / 8 1999-2002
Y/R
9.1.1 DE/2 Fresh Fish Inland water ways / harbour
MPT 0.11 3.5 61 <LOD / 5 1999-2002
Y/R
9.1.1 DE/2 Fresh Fish Inland water ways / harbour
TBT 16.91 43.81 237 <LOD / 305
1999-2002
Y/R
9.1.1 DE/2 Fresh Fish Inland water ways / harbour
TeBT 0.10 5.79 203 <LOD / 8 1999-2002
Y/R
9.1.1 DE/2 Fresh Fish Inland water ways / harbour
TePT 0 2.5 41 <LOD / <LOD
1999-2002
Y/R
9.1.1 DE/2 Fresh Fish Inland water ways / harbour
TPT 10.05 20.67 224 <LOD / 67 1999-2002
Y/R
9.1.1 DE/3 Fresh Fish
marine DBT 0.32 1.67 529 <LOD / 15 2000-
2002 Y/R
9.1.1 DE/3 Fresh Fish marine
DPT 0.06 0.83 527 <LOD / 8 2000-2002
Y/R
9.1.1 DE/3 Fresh Fish marine
MBT 0.12 1.3 530 <LOD / 3 2000-2002
Y/R
9.1.1 DE/3 Fresh Fish marine
MPT 0 1.45 90 <LOD / <LOD
2000-2002
Y/R
9.1.1 DE/3 Fresh Fish marine
TBT 3.18 8.78 530 <LOD / 78 2000-2002
Y/R
9.1.1 DE/3 Fresh Fish marine
TeBT
0 0.82 493 <LOD / <LOD
2000-2002
Y/R
119
9.1.1 DE/3 Fresh Fish marine
TePT 0 2.5 44 <LOD / <LOD
2000-2002
Y/R
9.1.1 DE/3 Fresh Fish marine
TPT 5.14 4.48 510 <LOD / 26 2000-2002
Y/R
Y/R 9.1.2 DE/4 Bivalve
molluscs DBT 16 16.46 161 <LOD /
236 2000-2002
Y/R
9.1.2 DE/4 Bivalve molluscs
DPT 0.14 2.19 145 <LOD / 10 2000-2002
Y/R
9.1.2 DE/4 Bivalve molluscs
MBT 3.43 5.15 212 <LOD / 157
2000-2002
Y/R
9.1.2 DE/4 Bivalve molluscs
MPT 0 2 51 <LOD / 3 2000- 2002
Y/R
9.1.2 DE/4 Bivalve molluscs
TBT 53.06 49.42 161 <LOD / 558
2000-2002
Y/R
9.1.2 DE/4 Bivalve molluscs
TeBT 0 2.14 67 <LOD / <LOD
2000-2002
Y/R
9.1.2 DE/4 Bivalve molluscs
TePt 0 2.5 12 <LOD / <LOD
2000-2002
Y/R
9.1.2 DE/4 Bivalve molluscs
TPT 4.89 5.54 118 <LOD / 58 2000-2002
Y/R
Y/R 9.1.4 DE/5 Fresh
crustaceans DBT 0.67 0.87 15 <LOD / 2 2000-
2002 Y/R
9.1.4 DE/5 Fresh crustaceans
DPT 0 0.77 15 <LOD / <LOD
2000-2002
Y/R
9.1.4 DE/5 Fresh crustaceans
MBT 0.67 0.87 15 <LOD / 2 2000-2002
Y/R
9.1.4 DE/5 Fresh crustaceans
MPT 0 0.5 1 <LOD / <LOD
2000-2002
Y/R
9.1.4 DE/5 Fresh crustaceans
TBT 4 2.97 15 <LOD / 12 2000-2002
Y/R
9.1.4 DE/5 Fresh crustaceans
TeBT 0 0.77 15 <LOD / <LOD
2000-2002
Y/R
9.1.4 DE/5 Fresh crustaceans
TPT 8 1.08 13 <LOD / 8 2000-2002
Y/R
9.2 / 9.3 / 9.4
DE/6 Processed fish and fish products
DBT 0.05 2.75 201 <LOD /5 1999-2001
Y/R
9.2 / 9.3 / 9.4
DE/6 Processed fish and fish products
DPT 0 2.16 201 <LOD / 24,5
1999-2001
Y/R
120
9.2 / 9.3 / 9.4
DE/6 Processed fish and fish products
MBT 20.01 13.55 201 <LOD / 1920
1999-2001
Y/R
9.2 / 9.3 / 9.4
DE/6 Processed fish and fish products
MPT 0 2.5 39 <LOD / <LOD
1999-2001
Y/R
9.2 / 9.3 / 9.4
DE/6 Processed fish and fish products
TBT 6.48 7.44 201 <LOD / 43 1999-2001
Y/R
9.2 / 9.3 / 9.4
DE/6 Processed fish and fish products
TeBT 0 0.57 113 <LOD / <LOD
1999-2001
Y/R
9.2 / 9.3 / 9.4
DE/6 Processed fish and fish products
TPT 0.47 4.04 187 <LOD / 16 1999-2001
Y/R
121
1.5 THE NETHERLANDS
The Netherlands submitted occurrence OTC data for 15 types of food samples. generated
between 1999 and 2000. OTC occurrence data (TBT,DBT,MBT TPT,DPT and MPT) were
presented for fresh fish (herring, plaice, sole, cod, dab, mackerel, pike perch, whiting and eel)
crustaceans (shrimps) and for bivalve molluscs (mussels, oysters, cockle). Occurrence data on Fish
oil were presented, too.
NL calculated mean OTC concentrations for all the submitted food samples, independently from
their use for intake calculations. The mean values were calculated with both <LOD=0 and with <LOD=LOD/2.
Table NL occurrence reports the food code and name, the OTC, the calculated mean concentrations
and the detected ranges, (the number of samples, the year, the representativity for intake
calculations, and whether samples were taken on a random (R) or targeted (T) basis. The detailed
occurence raw data are reported in in Technical Annex on CD ROM
Point of sampling
Samples were collected on the fishing grounds in the North Sea, Wadden Sea, Scheldt Estuary and
“Markermeer” and “IJsselmeer”. This are the normal places were fish is caught for Dutch
consumption.
Treatment of samples Fish samples were cleaned and 25 filets were mixed to make 1 homogeneous sample. For shrimps
0.5 kg boiled and the pealed species were mixed make one homogeneous sample. For mussels 0.5
kg was mixed and homogenized. Samples analysed:3 Analysis of samples To maximal 5 g of sample (containing not more than 100 mg fat) 5 ml of water is added and the
mixture is homogenised during 15 minutes. The pH is adjusted tot 1.5 to 2.2 by adding hydrochloric
acid. The organotin compounds are extracted twice with 12 ml of a 0.02 % solution of tropolon in
diethyl ether. The combined ether fractions are dried over sodium sulphate and the volume is
reduced to 0.5 ml. After the addition of 0.1 ml of the internal standard solution (dibutyldihexyltin
and triphenylhexeyltin in n-hexane), the organotin compounds are pentylated by adding 7.5 ml of
122
pentylmagnesium bromide in n-hexane. The excess Grignard reagent is neutralised by adding 1 M
ammonium chloride in water. The organic fraction is separated and purified over a column filled
with 25 g of fully activated alumina. The organotin compounds are eluted with 75 ml of n-hexane /
diethyl ether (80/20). The elueate is concentrated to a volume of 1.1 ml and 3 µl is injected into a
Varian gas chromatograph equipped with a Varian Saturn IV ion-trap mass-selective detector. The
column is a SGE 25QC2 BPX-5 (25 m x 0.22 mm x 0.25 µm) protected by a deactivated fused
silica retention gap (2 m x 0.53 mm). Quantification is by peak height
recoveries: see performance characteristics for CRM (accuracy); data are corrected for recoveries
external calibration at three (nearest out of five) concentration levels
ANALYTICAL QUALITY ASSURANCE
The method was validated. The Laboratory participated to Proficiency testing and uses CRM.
123
Table 51 NL OCCURRENCE
THE NETHERLANDS
Food group code
Food name
OTC Mean Concentration in
food (µg/kg)
n of samples
years
calculated with <LOD=
0
calculated with <LOD
=LOD/2
Range of detected values (µg/kg)
Representative for intake calcul. (Y/N) Random / Targeted(R/T)
9.1.1.2 Eel MBT 1.2 1.2 0.7-1.8
3 2000 Y/R
9.1.1.2 Eel DBT 2.1 2.1 1.2-2.5
3 2000 Y/R
9.1.1.2 Eel TBT 17 18 <7-32
3 2000 Y/R
9.1.1.2 Eel MPT 0.3 0.4 <0.3-1
3 2000 Y/R
9.1.1.2 Eel DPT 0 3 <6-<6
3 2000 Y/R
9.1.1.2 Eel TPT 42 42 38-47
3 2000 Y/R
9.1.4.3 Shrimp MBT 1.6 1.6 0.6-4
4 2000 Y/R
9.1.4.3 Shrimp DBT 1.6 1.6 0.8-2.9
4 2000 Y/R
9.1.4.3 Shrimp TBT 14 14 4.6-20
4 2000 Y/R
9.1.4.3 Shrimp MPT 0 0.1 >0.2-0.2
4 2000 Y/R
9.1.4.3 Shrimp DPT 0.3 0.5 <0.7-1.1
4 2000 Y/R
9.1.4.3 Shrimp TPT 3 3 <0.3-5.6
4 2000 Y/R
9.1.1.30X1
Herring MBT 0.2 0.2 <0.12-0.3
2 1999-2000
Y/R
9.1.1.30X1
Herring DBT 2.5 2.5 1.2-3.9
2 1999-2000
Y/R
9.1.1.30X1
Herring TBT 17 17 11-22
2 1999-2000
Y/R
124
9.1.1.30X1
Herring MPT 0.8 0.8 <0.2-1.,5
2 1999-2000
Y/R
9.1.1.30X1
Herring DPT 0.4 1.5 <5.5-0.7
2 1999-2000
Y/R
9.1.1.30X1
Herring TPT 4.9 4.9 3-6.8,
2 1999-2000
Y/R
9.1.1.30X2
Cod MBT 0.1 0.1 n=1 2000 Y/R
9.1.1.30X2
Cod DBT 0 0.1 n=1 2000 Y/R
9.1.1.30X2
Cod TBT 1 1 n=1 2000 Y/R
9.1.1.30X2
Cod MPT 0 0.1 n=1 2000 Y/R
9.1.1.30X2
Cod DPT 0 0.3 n=1 2000 Y/R
9.1.1.30X2
Cod TPT 2.1 2.1 n=1 2000 Y/R
9.1.1.30X3
Cockle MBT 0.6 0.6 0.6-0.6
2 2000 Y/R
9.1.1.30X3
Cockle DBT 2.5 2.5 2.4-2.5
2 2000 Y/R
9.1.1.30X3
Cockle TBT 13 13 13-13
2 2000 Y/R
9.1.1.30X3
Cockle MPT 0.2 0.2 0.2-0.2
2 2000 Y/R
9.1.1.30X3
Cockle DPT 0.7 0.7 0.5-0.9
2 2000 Y/R
9.1.1.30X3
Cockle TPT 5.3 5.3 2.9-7.7
2 2000 Y/R
9.1.1.30X4
Mackerel
MBT 1 1 n=1 2000 Y/R
9.1.1.30X4
Mackerel
DBT 2.2 2.2 n=1 2000 Y/R
9.1.1.30X4
Mackerel
TBT 11 11 n=1 2000 Y/R
9.1.1.30X4
Mackerel
MPT 0 0.5 n=1 2000 Y/R
9.1.1.30X4
Mackerel
DPT 0 1.7 n=1 2000 Y/R
9.1.1.30X4
Mackerel
TPT 5 5 n=1 2000 Y/R
9.1.2.2 Oysters
MBT 0.9 0.9 n=1 2000 Y/R
125
9.1.2.2 Oysters
DBT 3.1 3.1 n=1 2000 Y/R
9.1.2.2 Oysters
TBT 32 32 n=1 2000 Y/R
9.1.2.2 Oysters
MPT 0.2 0.2 n=1 2000 Y/R
9.1.2.2 Oysters
DPT 1.1 1.1 n=1 2000 Y/R
9.1.2.2 Oysters
TPT 8.2 8.2 n=1 2000 Y/R
9.1.2.1 Mussel MBT 2.3 2.3 1.5-3
3 2000 Y/R
9.1.2.1 Mussel DBT 8.5 8.5 5.1-11
3 2000 Y/R
9.1.2.1 Mussel TBT 21 21 19-22
3 2000 Y/R
9.1.2.1 Mussel MPT 0.1 0.1 <0.2-02
3 2000 Y/R
9.1.2.1 Mussel DPT 0.7 0.7 <1.4-0.7
3 2000 Y/R
9.1.2.1 Mussel TPT 12 12 5.6-19
3 2000 Y/R
9.1.1.30X5
Dab MBT 0.3 0.3 <0.1-0.4
4 2000 Y/R
9.1.1.30X5
Dab DBT 0.5 0.6 <0.4-0.8
4 2000 Y/R
9.1.1.30X5
Dab TBT 2.4 2.5 <0.5-4.1
4 2000 Y/R
9.1.1.30X5
Dab MPT 0.3 0.5 <0.2-0.3
4 2000 Y/R
9.1.1.30X5
Dab DPT 1.7 1.7 0.7-2.8
4 2000 Y/R
9.1.1.30X5
Dab TPT 15 15 9.4-21
4 2000 Y/R
9.1.1.30X6
Plaice MBT 0.2 0.2 <0.1-0.4
5 2000 Y/R
9.1.1.30X6
Plaice DBT 0.8 0.9 <0.2-1.8
5 2000 Y/R
9.1.1.30X6
Plaice TBT 1.8 1.9 <0.5-3.9
5 2000 Y/R
9.1.1.30X6
Plaice MPT 0.3 0.5 <0.2-0.7
5 2000 Y/R
9.1.1.30X6
Plaice DPT 1.3 1.5 <0.5-4.1
5 2000 Y/R
9.1.1.30X6
Plaice TPT 22 22 4.7-44
5 2000 Y/R
126
9.1.1.30X7
Sole MBT 0.6 0.6 <0.1-1.6
5 2000 Y/R
9.1.1.30X7
Sole DBT 0.7 0.7 <0.2-1.8
5 2000 Y/R
9.1.1.30X7
Sole TBT 2.1 2.1 0.2-6.3
5 2000 Y/R
9.1.1.30X7
Sole MPT 0.2 0.2 <0.2-0.3
5 2000 Y/R
9.1.1.30X7
Sole DPT 1.4 1.4 <0.5-2.1
5 2000 Y/R
9.1.1.30X7
Sole TPT 19 19 3.2-35
5 2000 Y/R
9.1.1.30X8
Pike Perch
MBT 0.1 0.2 <0.1-0.3
2 2000 Y/R
9.1.1.30X8
Pike Perch
DBT 0.8 0.8 0.6-1
2 2000 Y/R
9.1.1.30X8
Pike Perch
TBT 7.8 7.8 5.9-9.8
2 2000 Y/R
9.1.1.30X8
Pike Perch
MPT 0.4 0.4 0.3-0.5
2 2000 Y/R
9.1.1.30X8
Pike Perch
DPT 3.9 3.9 2.1-5.7
2 2000 Y/R
9.1.1.30X8
Pike Perch
TPT 28 28 11-44
2 2000 Y/R
9.1.1.30X9
Whiting MBT 0.1 0.2 <0.1-0.3
2 2000 Y/R
9.1.1.30X9
Whiting DBT 0.5 0.5 <0.2-1
2 2000 Y/R
9.1.1.30X9
Whiting TBT 2.4 2.6 <0.5-4.9
2 2000 Y/R
9.1.1.30X9
Whiting MPT 0.1 0.1 <0.2-0.2
2 2000 Y/R
9.1.1.30X9
Whiting DPT 0 0.4 <0.5-<0.9
2 2000 Y/R
9.1.1.30X9
Whiting TPT 3.7 3.7 1.2-6.2
2 2000 Y/R
2.1.3 Fish Oil MBT 0 1.2 <2.4-<2.5
2 2000 Y/R
2.1.3 Fish Oil DBT 3 4.6 <4.3-12
2 2000 Y/R
2.1.3 Fish Oil
TBT 12 27 <39-46
2 2000
Y/R
2.1.3 Fish Oil MPT 0 1.4 <2.8-<3.0
2 2000 Y/R
2.1.3 Fish Oil DPT 0 5.9 <11-<12
2 2000 Y/R
127
2.1.3 Fish Oil TPT 3.5 6.4 <7.7-14
2 2000 Y/R
128
1.6 FRANCE
France submitted data generated in 1993. OTC occurrence data (TBT,DBT,MBT) were presented
for different species of molluscs (scallop , several sections) mussels and oysters. The unit used for
the reported OTC concentrations is µg/kg wet weight OTC . Table FR occurrence reports the food
code and name, the detected OTC the year of sampling the mean concentrations and the range of
the detected values, the representativity for intake calculations, and whether samples were taken
on a random (R) or targeted (T) basis.
The complete raw data are reported on technical Annex on CD-ROM
Origin of the samples Scallop and Mussel samples were from retail market, oyster from origin
Sampling procedure Point of samplingThe national contact point for consultation of details send to F. Pannier et al.,
Anal. Chim. Acta, 287 (1994) 17-24 F. Pannier et al., Anal. Chim. Acta, 327 (1996) 287-293
Treatment of samples The interval between sampling and analysis was 1 week Analysis of samples LE-US-HG-GC-QFAAS;(acid method, for oyster, mussels and scallops) EnzymaticE-HG-GC-QFAAS (enzymatic method for mussel and scallops)
Analytical Quality Assurance The Laboratory has neither general nor specific accreditation for OTC and did not attended to proficiency tests, but used CRM (NIES freeze-dried fish); the method was validated and spiked samples were analysed, too.
129
Table 52 FR OCCURRENCE
FRANCE
Food group code
Food name OTC Mean Conc. µg/kg
Range of detected values (µg/kg)
n of samples
Year Representative for intake calculation (Y/N) Random or Targeted (R/T)
9.1.2.2 Oyster MBT 119 no data 1 1993 N/T 9.1.2.2 Oyster DBT 109 no data 1 1993 N/T 9.1.2.2 Oyster TBT 400 no data 1 1993 N/T 9.1.2.1 Mussel MBT 105 no data 1 1993 N/T 9.1.2.1 Mussel DBT 212 no data 1 1993 N/T 9.1.2.1 Mussel TBT 483 no data 1 1993 N/T 9.1.2.1 Mussel MBT 95 no data 1 1993 N/T 9.1.2.1 Mussel DBT 202 no data 1 1993 N/T 9.1.2.1 Mussel TBT 494 no data 1 1993 N/T 9.1.2 Scallop
adductor muscle
MBT 101 no data 1 1993 N/T
9.1.2 Scallop adductor
DBT 129 no data 1 1993 N/T
9.1.2 Scallop adductor muscle
TBT 474 no data 1 1993 N/T
9.1.2 Scallop mantle and visceral mass
MBT 70 no data 1 1993 N/T
9.1.2 Scallop mantle and visceral mass
DBT 58 no data 1 1993 N/T
9.1.2 Scallop mantle and visceral mass
TBT 299 no data 1 1993 N/T
9.1.2 Scallop Gonad
MBT 46 no data 1 1993 N/T
9.1.2 Scallop DBT 52 no data 1 1993 N/T
130
Gonad 9.1.2 Scallop
Gonad TBT 244 no data 1 1993 N/T
9.1.2 Scallop whole animal
MBT 65 no data 1 1993 N/T
9.1.2 Scallop whole animal
DBT 69 no data 1 1993 N/T
9.1.2 Scallop whole animal
TBT 307 no data 1 1993 N/T
9.1.2 Scallop adductor muscle
MBT 124 no data 1 1993 N/T
9.1.2 Scallop adductor muscle
DBT 146 no data 1 1993 N/T
9.1.2 Scallop adductor muscle
TBT 444 no data 1 1993 N/T
9.1.2 Scallop adductor muscle
MBT 116 no data 1 1993 N/T
9.1.2 Scallop adductor muscle
DBT 136 no data 1 1993 N/T
9.1.2 Scallop adductor muscle)
TBT 458 no data 1 1993 N/T
9.1.2 Scallop mantle and visceral mass
MBT 81 no data 1 1993 N/T
9.1.2 Scallop mantle and visceral mass
DBT 74 no data 1 1993 N/T
9.1.2 Scallop mantle and visceral mass
TBT 274 no data 1 1993 N/T
9.1.2 Scallop mantle and visceral mass
MBT 76 no data 1 1993 N/T
9.1.2 Scallop mantle and visceral mass
DBT 69 no data 1 1993 N/T
9.1.2 Scallop mantle and visceral mass
TBT 280 no data 1 1993 N/T
9.1.2 Scallop Gonad
MBT 57 no data 1 1993 N/T
131
9.1.2 Scallop Gonad
DBT 54 no data 1 1993 N/T
9.1.2 Scallop Gonad
TBT 225 no data 1 1993 N/T
9.1.2 Scallop Gonad
MBT 55 no data 1 1993 N/T
9.1.2 Scallop Gonad
DBT 51 no data 1 1993 N/T
9.1.2 Scallop Gonad
TBT 236 no data 1 1993 N/T
132
1.7 ITALY
The data provided, have been generated between 1995 and 2000 in four different studies, individually reported . OTC occurrence data (TBT,DBT,MBT TPT,DPT,MPT) have been presented for fresh fish (gilthead breams, salmon fillets and trout gobies, atherina and eels ) for crabs and for mussels. The unit used for the reported OTC concentrations is µg/kg wet weight Sampling procedures, Point of the sampling, Treatment of the samples ref. IT-001: mussel samples were collected in five diffferent busy dockyard areas, one boat-
demolition site and two aquaculture areas in southern part of the lagoon of Venice . Samplings were made as follows: 60 individual mussels were collected and subsequently divided into two classes, the first with a maximum lenght of 2.7 ± 0.2 cm, the other with a maximum lenght of 4.9 ± 0.4 cm. These classes are respectively referred as YOUNGS and ADULTS. Samples were collected in June and November 1996. After collection, the mussels were removed from their shells, homogenized, frozen, lyophilised and stored at –20°C until analysis.
ref. IT-002: samples of mussels were collected between March and August 1995 from northern Adriatic harbours and coastal environments, then immediately frozen, homogenized and freeze-dried for 48 hours.
ref. IT-003: samples of mussels, gilthead breams, salmon fillets and trouts were collected at retail stores and/or from anglers in the Gulf of Naples. Specimens were collected in glass jars and immediately stored in ice until the arrival on the analytical laboratory. Upon arrival, all the samples were immediately processed. The samples were collected and analyzed between June 1997 and May 1998.
ref. IT-004: samples of mussels, clams, crabs, gobies, atherina and eels were collected in 12 different sites within the Lagoon of Venice. At least 500 g of each species were sampled, then divided into five 100 g subsamples. Each subsample was homogenized and frozen at –20°C until analysis. The samples were collected and analyzed within 1999.
Analysis of samples IT-001:( analysis performed by Dept. of Inorganic, Metallorganic and Analytical Chemistry, University of Padua, Italy):Approx. 0.2 g of homogenized and lyophilised sample were treated with tetramethylammonium hydroxide (25%) and digested at 60°C for 2 hours. Then, pH was adjusted to 4.5 with acetic acid. The resulting solution was made up to 250 mL. A 100 mL portion was withdrawn, added with 1 mL of 2% NaBEt4 solution and 2 mL of n-hexane, already containing an internal standard. The solution was vigorously stirred for 30 min. The organic phase was finally cleaned-up by filtering on alumina, and injected in the GC/MS.
133
IT-002: (analysis performed by Dept. of Pharmacology, Lab. of Toxicology, University of Padua, Italy):Approx. 10 g of homogenized sample were pentylated by reacting with a Grignard reaction with pentylmagnesium bromide in ethyl ether. The resulting solution was finally filtered through Florisil, then injected in the GC/MS. IT-003:( analysis performed by Dept. of Food Science, “Federico II” University, Naples – Italy):10 mussels or 100 g of fish meat specimens were pooled and homogenized, then derivatized and analysed by capillary gaschromatography – flame photometric detection.
IT-004: ( analysis performed by Agenzia Regionale per la Prevenzione e Protezione Ambientale del Veneto – Dip.to Provinciale di Venezia – Mestre – Italia) :Approx. 500 mg of lyophilised sample was treated with 15 mL of 0.03% tropolone in methanol and 1 mL of concentred HCl, by sonicating 15 min, taking care to mantain the solution above 40°C. The resulting solution was centrifuged at 3000 rpm for 10 min. The resulting solution was transferred in a separating funnel and added with 15 mL of CH2Cl2, then extracted twice with 100 mL of 5% aqueous NaCl. The organic phase was dried over anidrous sodium sulfate. The organic phase was then reduced to 1 mL and 1 mL of 2 M pentylmagnesium bromide in ethyl ether was added, together with an internal standard. After 5 min at ambient temperature, the solution was added with 2 mL of water, in order to destroy any excess of alkylating reagent. Finally, 2 mL of n-hexane and 5 mL of 1M aqueous H2SO4 were added, and vigorously shaked. After phase separation, the organic phase was transferred to a test tube, reduced to about 1 mL and loaded on a small column packed with SiO2, and eluted with n-hexane - toluene (1:1). The obtained solution was reduced to a small volume and injected in the gaschromatograph – mass spectrometer.
EVIDENCE OF AQA Laboratory IT 004 uses CRM 477 Rerefence material
TABLE IT OCCURRENCE The mean levels of OTC were calculated only for those foods for which food consumption data were available, even if as a group, and that were deemed as representative. Data were submitted for TBT, DBT, MBT, TPT, DPT, MPT. Table IT occurrence reports Food group codes and name, OTC, the mean concentrations calculated 1) with <LOD=0 and 2)with <LOD =LOD/2, the range of the experimentally detected values,the number of samples, the years , the representativity for intake calculations, and whether samples were taken on a random (R) or targeted (T) basis. The other occurence data are reported in Technical Annex on CD ROM
134
TABLE 53 IT OCCURRENCE
ITALY Food group code
Food name
OTC Concentration in food (µg/kg)
calculated with <LOD=0
calculated with <LOD =LOD/2
Range of detected values (µg/kg)
n of samples
years
Representative for intake calculation (Y/N) Random or Targeted (R/T)
9.1.1.2 eel MBT 7.6 7.6 3-20 27 1999 Y/R 9.1.1.2 eel DBT 10.2 10.2 2-29 26 1999 Y/R 9.1.1.2 eel DPT 1.7 2.3 <LOD - 4.5 26 1999 Y/R 9.1.1.2 eel MPT 2.8 3.4 <LOD - 6.5 26 1999 Y/R 9.1.1.2 eel TPT 4.7 4.9 <LOD - 8.5 26 1999 Y/R 9.1.1.2 eel TBT 19.7 19.7 11-31 26 1999 Y/R
136
1.8 NORWAY
Norway send OTC occurrence data (TBT,DBT,MBT TPT,DPT,MPT) for 9 types of food samples
that is , 7 species of fresh fish (cod liver and muscle, flounder herring, bream, dab, eel), crabs and
mussels. The unit used for the reported OTC concentrations is µg/kg wet weight. The data
provided, have been generated between 1997 and 2001
Analytical method The samples are added an internal standard and dissolved with an alkaline solution. After pH-adjustment, the organotin compounds are extracted with organic solutions and the samples are purified with gel permeation chromatography. The samples are analyzed with GC-AED (atomic emission detector).Equipment: Hewlett-Packard 5890 gas chromatograph with a HP 5921A Atomic emission detector. Reference: N. Følsvik, J.A. Berge, E.M. Brevik and M. Walday: Quantification of organotin compounds and determination of imposex in populations of dogwhelks (Nucella lapillus) from Norway. Chemosphere 1999, Vol 38 (3), 681-91. EVIDENCE OF AQA
NO/ 01 :The analyses are carried out at Norwegian Institute for Water Research (NIVA). The method is routinely used to determine butyl- and phenyl-organic tin compounds. NIVA is not accredited for this method.
Table NO occurrence
The Table reports Food group codes and name, OTC, the mean concentrations the range of the
experimentally detected values,the number of samples the years , the representativity for intake
calculations, and whether samples were taken on a random (R) or targeted (T) basis. . When
detected values were <LOD, the mean values were calculated with both <LOD=0 and with
<LOD=LOD/2.
Occurrence raw data, reporting more information about TBT DBT ,MBT,TPT,DPT,MPT, are
reported in the technical Annex on CD ROM
137
TABLE 54 NO OCCURRENCE
NORWAY
Food group code
Food name OTC Mean Concentration in food (µg/kg)
Range of detected values (µg/kg)
n
Year of sampling
Representative for intake calculation (Y/N) Random or Targeted (R/T)
Belgium submitted data about consumption of fish (9.1.1) and bivalves (9.1.2) expressed by
consumer and high consumers, reported in Table BE Food Consumption . The sources of
consumption data were not specified.No other information have been made available.
142
TABLE 55 BE FOOD CONSUMPTION
BELGIUM
Food group code
Food name Year Data by Consumer (g/day)
Data by Population (g/day)
Mean high consumers
Mean high consumers
9,1,1 fish no data 13.37 47.7 no data no data
9,1,2, bivalves no data 0.66 no data no data no data
143
2.2 GERMANY
According to the consumption data in Germany six food groups were established for calculating the dietary intake: 1. DE/1 Fresh fish from lakes and farms 2. DE/2 Fresh fish from inland waterways and harbours. These fish may be caught by anglers and
are used mainly for private consumption. 3. DE/3 Fresh fish from open sea, ocean etc. (marine water) 4. DE/4 Bivalve molluscs 5. DE/5 Crustaceans 6. DE/6 Fish products No data on consumption of specific foods were presented Frozen fish, fish fillets from marine water (open sea, ocean) which was originally categorized 9.2.1. was not listed in group DE/6 but was inserted in group DE/3. This is in accordance to the German food consumption data obtained from the German National Food Consumption Survey (DE 001). Mollusc products were combined with DE/4 fresh bivalve molluscs according to the German food consumption data. Data on food consumption were obtained from the German National Food Consumption Survey ( DE 001 ). This study was conducted in 1985-1988 in which 19.115 adults > 18 years and 889 children (4-6 years) were interviewed. The average body weight was 70.5 kg for adults (mean) and that for children was 20.9 kg (mean). Food consumption data for each food group DE/1 - DE/6 with regard to mean and high consumers (97.5 percentile) are presented in tables 3a for adults and 3b for children and are reported in Table DE Food Consumption.
144
TABLE 56 DE - FOOD CONSUMPTION
GERMANY (Adults >= 18 years) Bodyweight: mean=70.5 kg, median=70 kg
Food group code
Food Identificat
ion (country)
Food name Year Data by Consumer
(g/day)
Data by Population (g/day)
Mean high consumers (97.5 Perc)
Mean high consumers (97.5 perc)
9.1.1 DE/1 Fresh Fish farm / Lake
1985-88 32.27 83.3 1.25 22.9
9.1.1 DE/2 Fresh Fish Inland water
ways / harbour
1985-88 25.51 49.4 n.c. n.c.
9.1.1 DE/3 Fresh Fish marine
1985-88 25.82 74 9.53 56.31
9.1.2 DE/4 Bivalve molluscs
1985-88 18.44 125.01 n.c. n.c.
9.1.4 DE/5 Fresh crustaceans
1985-88 11.62 38.4 0.48 6.6
9.2 / 9.3 / 9.4
DE/6 Processed fish and fish products
1985-88 19.09 69.45 5.6 43.91
(children 4 - 6 years) Bodyweight: mean=20.9 kg, median=20 kg
9.1.1 DE/1 Fresh Fish farm / Lake
1985-88 20.29 n.c. n.c.
9.1.1 DE/2 Fresh Fish Inland water
ways / harbour
1985-88 n.c. n.c.
9.1.1 DE/3 Fresh Fish marine
1985-88 14.91 43.36 6.12 28.60
9.1.2 DE/4 Bivalve molluscs
1985-88 n.c. n.c.
9.1.4 DE/5 Fresh crustaceans
1985-88 6.46 n.c. n.c.
9.2 / 9.3 / 9.4
DE/6 Processed fish and fish products
1985-88 8.31 47.34 1.25 14.88
n.c. = not calculated (part of consumers <2,5%)
145
146
2.3 DENMARK
Denmark presented food consumption data expressed by population for cod liver and muscle, for
flounder muscle and for mussels.(Table DK food consumption)
Food consumption data arises from a consumer-scan. The survey was conducted as a household-
purchase study with a total number of 2000 households participating, thus representing approx.
6000 individuals with an even age and sex-distribution. Households were chosen to represent the
entire country.
Survey was performed over two years – 1999 to 2000. Participants reported purchased foods on a
weekly basis and using fixed questionnaires.
No data exists on the individual consumption of fish and fish-products in the Danish population,
and no estimates can therefore be provided as for the high consumers. All data reported are mean
levels.
147
TABLE 57 DK FOOD CONSUMPTION
DENMARK
Food group code
Food name
Year Data by Population (g/day)
Mean high consumers
9.1.1.30x1
Cod - liver 2000 0.04 no data
9.1.1.30x2
Cod-muscle
2000 1.33 no data
9.1.1.30x4
Flounder-muscle
2000 0.51 no data
9.1.2.1 Blue Mussel
2000 0.03 no data
148
2.4 FRANCE France presented food consumption data on 13 food groups. Data expressed by consumers (mean
and high consumers - 95th percentile) and by population (mean and high consumers - 95th
percentile were presented for both adults and children. Also consumption data for fish groups and
some seafood species were presented in the second submission.. The data are reported in Table
FR Food Consumption
The food consumption data are based on the INCA survey (Individual and national French food
intake survey). This national survey was conducted all over the country from August 1998 to June
1999, so it integrates the seasonal effects. The total sample (3003 persons) is composed of 1985
adults 15 years and over and 1018 children and young teenagers (3-14 years). The food
consumption reading was done with a diary record on 7 consecutive days. The identification of the
type of food and the portion size consumed were estimated with a validated photographic book. The
food nomenclature was based on the nomenclature used in the food composition tables and contains
about 1000 codes and 44 food groups.
According to the National Expert:”In this survey, we collected the body weight of almost all the
participants. So the calculation of intake of heavy metals or OTC by kg of body weight should be
done with the real weight of each person and not with a fixed weight.” (VOLATIER, J.-L.
(coordinator), Enquête INCA individuelle et nationale sur les consommations alimentaires. Paris:
TEC&DOC (Ed.), 2000).
Comment submitted by France on:
Why the data are / are not representative for the consumption of the food item in the member state:
The representativeness of the sample is assured by a geographic stratification (based on region of
residence, size of urban area) and by the quota sample method (with the factors age, sex, profession,
size of the household). The socio-demographic characteristics of the sub-samples (adults and
children) of the survey were compared with the national data from the population census (organised
by the INSEE: National Institute of Statistics and Economic Studies) and the difference was very
small. So the INCA survey is representative for the consumption of the food in France. Moreover
such a survey on individual consumption is the only one in France. A previous similar survey (but
with only 1500 persons) was made in 1994. The other food intake surveys cover only on a part of
the population (young or elderly people) or a local area.
149
TABLE 58 FR FOOD CONSUMPTION
FRANCE ADULTS (>15 Years) average body weight: 66.4
anthropometric cultural and life-style characteristics were recorded.
Table IT –Food Consumption reports the data by consumer and by population that were used by
the National Expert to calculate intake. Only mean data have been presented.
155
TABLE 61 IT – FOOD CONSUMPTION
ITALY
Data by Consumer (g/day)
Data by Population (g/day)
Food group code
Food name Year
Mean high consumers (median)
Mean high consumers (median)
9 fish and fish products, including molluscs,
crustaceans, echinoderms (MCE)
1994-1996 48.3 no data 31,8 no data
9.2 processed fish and fish products
1994-1996 15.7 no data 7,4 no data
9.1.1 fresh fish, muscle meat of fish
1994-1996 37.8 no data 15,2 no data
9.2.1 frozen fish, fish fillets and fish products
1994-1996 29.1 no data 3,9 no data
9.1.1.30x1
pelagic fish, fresh 1994-1996 27.9 no data 2,3 no data
9.2.1 pelagic fish, frozen 1994-1996 23.0 no data 0,1 no data 9.1.1.30x
2 freshwater fish, fresh 1994-1996 30.3 no data 2,4 no data
9.1.2 molluscs, fresh 1994-1996 36.0 no data 4,2 9.1.4 crustaceans, fresh 1994-1996 20.2 no data 1,0 no data 9.2.1 freshwater fish, frozen 1994-1996 24.9 no data 0,5 no data 9.2.1 molluscs, frozen 1994-1996 26.0 no data 2,0 no data 9.2.1 crustaceans, frozen 1994-1996 20.1 no data 0,4 no data 9.4 tuna, fully preserved 1994-1996 14.4 no data 5,6 no data 9.4 mackerel, fully
preserved 1994-1996 12.9 no data 0,1 no data
9.4 salmon, fully preserved 1994-1996 12.7 no data 0,5 no data 9.4 anchovies, fully
preserved 1994-1996 3.6 no data 0,2 no data
9.4 sardines, fully preserved
1994-1996 7.9 no data 0,0 no data
9.3.4 salted cod 1994-1996 28.2 no data 0,7 no data 9.3.4 dried fish 1994-1996 0.0 no data 0,0 no data 9.4 clams, fully preserved 1994-1996 10.2 no data 0,0 no data 9.4 other preserved fish
products 1994-1996 15.2 no data 0,2 no data
156
157
2.7 THE NETHERLANDS
Food consumption data were presented for 5 species of fish, for shrimps and for mussels. (Table
NL Food Consumption). The data are referred to general population (mean and high consumers).
No data about food groups were presented.
Consumption data were collected in the Dutch National Food Consumption Survey with dietary
records from a stratified probability sample of households in The Netherlands (Kistemaker et al.,
1998). The survey comprises a description of the daily consumption over two consecutive days and
recording of age, sex and body weight for each individual within the sampled households. Data
have been collected from April 1997 until April 1998. Collection of data was evenly spread over
the weeks of the year and the days of the week. In total 6250 persons aged 1 to 97 participated,
belonging to 2774 households. The mean body weight of the subjects was 65.8 kg.
Table 62 NL – FOOD CONSUMPTION
THE NETHERLANDS
Food group code
Food name
Year Data by Population (g/day)
Mean high consumers 9.1.1.2 Eel 2000 0.13 0.3 9.1.4.3 Shrimp 2000 0.5 0.57 9.1.1.30X1
Norway presented food consumption data on the whole diet, described in general groups, and for
what concerned with fish and seafood, food consumption data for single species both by
population (mean and high consumers) and by consumers(mean and high consumers).Two different
studies were presented. (Norkost, 1997 and Fish&Game 1999) Also data on food consumption of
coastal municipalities were presented, (Fish &Game 2000) thus representing a particular group of
consumers that have available large amount of seafoods Table NO –Food Consumption is therefore
splitted in the corresponding three sections.
NORKOST 1997: In the national representative dietary survey 2 672 persons in the age of 16 to 79 years participated (average body weight=73 kg). The method used in NORKOST was a quantitative food frequency questionnaire, which was distributed and collected in four different periods spread through the year. The survey tries to capture information about the usual diet during the prior year among the participants. Reference: Johansson, L, Solvoll K: NORKOST 1997. Landsomfattende kostholdsundersøkelse blant menn og kvinner i alder 16-79 år. Rapport nr.2/1999. Statens råd for ernæring og fysisk aktivitet. Oslo 1999 (In Norwegian There is a tendency that surveys using food frequency questionnaire overestimate the food consumption in relation to food records measures. NORKOST was also carried out in 1993/94, using the same kind of food questionnaire as the one used in NORKOST 1997. The average energy intake among men aged 16 to 19 years who participated in NORKOST 1993/94 was above the reference values for boys aged 15 to 18 years. This may indicate that this age group overestimates their consumption in some degree when filling out the questionnaire. However, the average energy intake among the men in the age group 30 to 79 years old was within the reference values. The female participants reported an energy intake below the reference values. This indicates that the women participating in this kind of study may underestimate their consumption. Fish and Game Study 1999 (In the tables “Fish and Game 1” was used): A dietary surveys were conducted, focusing on the consumption patterns of foods, such as saltwater fish, freshwater fish and game, which may contain environmental contaminants, primarily cadmium, mercury, polyclorinated biphenols (PCB) and dioxines. The survey encompassed a nation-wide postal qualitative food frequency questionnaire to 10 000 randomly chosen persons between 18 and 79 years old (average body weight=74 kg). About 60% answered the questionnaire (n=6015). To convert food frequencies into amounts consumed per day standard portion sizes, mainly based on the results from NORKOST 1997, for each of the food items included in the survey were used The survey tries to capture information about the food consumption during the prior year among the participants. Reference: Meltzer, HM, Bergsten, C, Stigum, H: Fisk- og viltundersøkelsen. Konsum av matvarer som kan ha betydning for inntaket av kvikksølv, kadmium og PCB/dioksin i norsk kosthold. SNT-rapport 6, 2002. (Summary in English)
160
Fish and Game Study 2000 (In the tables “Fish and Game 2” was used) (Report under process):: The objective with the study was to find out if the consumption of fish, shellfish and game is larger in areas of Norway where the availability of these foods are great. The study encompassed a postal quantitative food frequency questionnaire (similar to the one used in the 1999 study) to 10 000 randomly chosen persons between 18 and 79 years old from 14 coastal and 13 inland municipalities (average body weight=76 kg, which was the same for participants from the two areas). About 55 % answered the questionnaire (n=5502). To convert food frequencies into amounts consumed per day standard portion sizes, mainly based on the results from NORKOST 1997, for each of the food items included in the survey were used. The survey tries to capture information about the food consumption during the prior year among the participants.
161
Table 63 NO –Food Consumption
Norway
NORKOST STUDY Average body weight = 73 kg Food group code
Food name Reference Year Data by Population(g/day)
Fish and Game , 1999 Average body weight = 74 kg Food group code
Food name Reference Year Data by population (g/day)
Data by consumer (g/day)
Mean High consumers
Mean High consumer
s 4 Fungi, not cultivated Fish & Game
1 1999 1 5 2 5
6.2 Bran, wheat Fish & Game 1
1999 1 4 1 4
6.2 Bran, oat Fish & Game 1
1999 1 4 1 4
8 Moose Fish & Game 1
1999 1 2 10 28
8 Reindeer Fish & Game 1
1999 1 2 2 7
8 Rabbit Fish & Game 1
1999 <1 2 2 7
8 Liver, game Fish & Game 1
1999 <1 2 2 7
8 Kidney, game Fish & Game 1
1999 <1 0 3 7
8 Heart, game Fish & Game 1
1999 <1 2 2 2
8 Wild birds Fish & Game 1
1999 1 2 2 2
8 Offal, wild birds Fish & Game 1
1999 <1 0 2 7
9 Fish for sandwich Fish & Game 1
1999 3 8 3 8
9 Fish products Fish & Game 1
1999 19 47 20 47
9 Cod Fish & Game 1
1999 10 30 11 30
9 Liver, cod Fish & Game 1
1999 0.2 0.5 0.7 2.3
9 Roe, cod Fish & Game 1
1999 2 3 4 12
9 Saithe Fish & Game 1
1999 7 24 9 24
9 Liver, saithe Fish & Game 1
1999 0.1 0.5 0.7 2.3
9 Haddock Fish & Game 1
1999 2 11 4 14
164
9 Flounder Fish & Game 1
1999 2 7 3 9
9 Mackerel Fish & Game 1
1999 2 10 3 10
9 Herring Fish & Game 1
1999 2 7 3 7
9 Tuna Fish & Game 1
1999 2 10 5 18
9 Salmon, sea Fish & Game 1
1999 3 14 5 14
9 Salmon, farmed Fish & Game 1
1999 6 14 7 14
9 Saltwater fish, other Fish & Game 1
1999 3 14 6 14
9 Pike Fish & Game 1
1999 <1 2 3 10
9 Pearch Fish & Game 1
1999 <1 2 2 8
9 Powan Fish & Game 1
1999 <1 2 2 8
9 Charr Fish & Game 1
1999 1 2 3 8
9 Lake trout Fish & Game 1
1999 3 14 5 14
9 Freshwater fish, other
Fish & Game 1
1999 <1 2 3 10
9a Eel Fish & Game 1
1999 <1 1 1 5
9 Shrimp, self-peeled Fish & Game 1
1999 3 8 4 8
9 Shrimp, preserved Fish & Game 1
1999 3 8 3 8
9 Crab Fish & Game 1
1999 2 13 4 13
9 Crab, claws Fish & Game 1
1999 2 3 4 13
9 Mussel Fish & Game 1
1999 1 5 1 5
165
TABLE 65 cont. Norway Fish and Game ,2000 Average body weight: 76
kg Food name Reference Year(
s) Data by consumer coastal municipalities (g/day)
Food grou
p code
Mean
High consumers
4 Potato Fish & Game 2
2000 122 180
4 Carrot Fish & Game 2
2000 40 77
4 Swedish turnip Fish & Game 2
2000 21 67
4 Fungi, not cultivated
Fish & Game 2
2000 3 15
6.2 Bran, wheat Fish & Game 2
2000 2 4
6.2 Bran, oat Fish & Game 2
2000 2 4
8 Moose Fish & Game 2
2000 5 16
8 Reindeer Fish & Game 2
2000 2 7
8 Rabbit Fish & Game 2
2000 1 3
8 Liver, game Fish & Game 2
2000 2 3
8 Kidney, game Fish & Game 2
2000 1 3
8 Heart, game Fish & Game 2
2000 2 3
8 Wild birds Fish & Game 2
2000 2 3
8 Offal, wild birds Fish & Game 2
2000 2 4
9 Fish for Fish & 2000 3 8
166
sandwiches Game 2 9 Fish products Fish &
Game 2 2000 21 35
9 Cod Fish & Game 2
2000 17 45
9 Liver, cod Fish & Game 2
2000 0.7 2.9
9 Roe, cod Fish & Game 2
2000 3 6
9 Saithe Fish & Game 2
2000 12 45
9 Liver, saithe Fish & Game 2
2000 0.7 2.9
9 Haddock Fish & Game 2
2000 3 7
9 Flounder Fish & Game 2
2000 2 9
9 Mackerel Fish & Game 2
2000 4 12
9 Herring Fish & Game 2
2000 3 9
9 Tuna Fish & Game 2
2000 5 27
9 Salmon, sea Fish & Game 2
2000 4 18
9 Salmon, farmed Fish & Game 2
2000 5 18
9 Saltwater fish, other
Fish & Game 2
2000 7 36
9 Pike Fish & Game 2
2000 4 14
9 Pearch Fish & Game 2
2000 2 3
9 Powan Fish & Game 2
2000 2 4
9 Charr Fish & Game 2
2000 2 3
167
9 Lake trout Fish & Game 2
2000 4 18
9 Freshwater fish, other
Fish & Game 2
2000 4 18
9a Eel Fish & Game 2
2000 1 2
9 Shrimp, self-peeled
Fish & Game 2
2000 4 10
9 Shrimp, preserved
Fish & Game 2
2000 3 10
9 Crab Fish & Game 2
2000 6 21
9 Crab, claws Fish & Game 2
2000 5 21
9 Mussel Fish & Game 2
2000 1 2
14 Coffee Fish & Game 2
2000 809 1500
14 Tea Fish & Game 2
2000 331 1000
168
3. SUMMARIES OF SUBMITTED INTAKE DATA
169
3.1 BELGIUM
No calculation of intake was presented
170
3.2 DENMARK
Intake calculation is based primarily on the very limited consumption of mussels. Intake
calculations are therefore only valid as a guideline for the average intake of OTC in the Danish
population from that particular foodstuff. 70 kg bodyweight average is assumed. Only calculation
for mean values – no other assumptions Table DK Intake reports the presented calculations.
From the table it can be observed that four different clusters of data on intake of TBT/DBT/MBT
for mussels have been submitted, without a mean value. In fact the National Expert grouped the
data according to the year, as reported in Table DK occurrence
The intake for mussels are therefore referred to the relevant year.
The complete raw data are reported on technical Annex on CD ROM
171
Table 66 DK Intake
DENMARK (calculated with <LOD=LOD/2)
Food group code
Food name OTC Daily intake (µg/day) Daily intake / body weight (µg/day/kg bw)
Mean high level Mean high level 9.1.1.30x1 Cod - liver TBT 0.001241 no data 0.00001773 no data 9.1.1.30x1 Cod - liver DBT 0.000451 no data 0.00000645 no data 9.1.1.30x1 Cod - liver MBT 0.000009 no data 0.00000013 no data 9.1.1.30x1 Cod - liver TPT 0.002872 no data 0.00004103 no data 9.1.1.30x1 Cod - liver DPT 0.000120 no data 0.00000171 no data 9.1.1.30x1 Cod - liver MPT 0.000043 no data 0.00000061 no data 9.1.1.30x2 Cod-muscle TBT 0.003856 no data 0.00005509 no data 9.1.1.30x2 Cod-muscle DBT 0.038489 no data 0.00054984 no data 9.1.1.30x2 Cod-muscle MBT 0.007433 no data 0.00010619 no data 9.1.1.30x2 Cod-muscle TPT 0.002947 no data 0.00004210 no data 9.1.1.30x2 Cod-muscle DPT 0.001529 no data 0.00002184 no data 9.1.1.30x2 Cod-muscle MPT 0.000439 no data 0.00000627 no data 9.1.1.30x4 Flounder-muscle TBT 0.062116 no data 0.00088738 no data 9.1.1.30x4 Flounder-muscle DBT 0.023016 no data 0.00032880 no data 9.1.1.30x4 Flounder-muscle MBT 0.003703 no data 0.00005289 no data 9.1.1.30x4 Flounder-muscle TPT 0.006503 no data 0.00009290 no data 9.1.1.30x4 Flounder-muscle DPT 0.000586 no data 0.00000838 no data 9.1.1.30x4 Flounder-muscle MPT 0.000168 no data 0.00000240 no data
9.1.2.1 Blue Mussel 2001
TBT 0.000862 no data 0.00001232 no data
9.1.2.1 Blue Mussel 2001
DBT 0.000533 no data 0.00000761 no data
9.1.2.1 Blue Mussel 2001
MBT 0.000058 no data 0.00000083 no data
9.1.2.1 Blue Mussel 2000
TBT 0.001699 no data 0.00002427 no data
9.1.2.1 Blue Mussel 2000
DBT 0.000441 no data 0.00000630 no data
9.1.2.1 Blue Mussel 2000
MBT 0.000459 no data 0.00000656 no data
9.1.2.1 Blue Mussel 1999
TBT 0.000558 no data 0.00000798 no data
9.1.2.1 Blue Mussel 1999
DBT 0.000223 no data 0.00000318 no data
9.1.2.1 Blue Mussel 1999
MBT 0.000342 no data 0.00000488 no data
172
9.1.2.1 Blue Mussel 1998
TBT 0.001520 no data 0.00002171 no data
9.1.2.1 Blue Mussel 1998
DBT 0.000147 no data 0.00000210 no data
9.1.2.1 Blue Mussel 1998
MBT 0.000952 no data 0.00001359 no data
173
3.3 GERMANY On the basis of the mean occurrence data and of the food consumption data, daily intakes have been calculated. Estimated dietary intakes (mean and high consumers = 97.5 Percentile) for the various organotin compounds (OTCs) are presented in several Tables reported extensively in Technical Annex on CD-ROM. The tables there reported are :
• Tab 4a for adults using the consumption data by consumers and <LOD=0;
• Tab 4b for adults using the consumption data by consumers and <LOD=LOD/2;
• Tab 4c for adults using the consumption data by population and <LOD=0;
• Tab 4d for adults using the consumption data by population and <LOD=LOD/2;
• Tab 4e for children using the consumption data by consumers and <LOD=0;
• Tab 4f for children using the consumption data by consumers and <LOD=LOD/2; • Tab 4g for children using the consumption data by population and <LOD=0; • Tab 4h for children using the consumption data by population and <LOD=LOD/2. Tables DE Intake reports in the next pages splitted data for adults (bodyweight 70 kg ) and
children (bodyweight 20 kg) both referred by consumers and by population and both calculated
when <LOD occurrence data were assumed =0 or when they were assumed =LOD/2.
Some analytical measurements were made for detection of the organotin compounds MOT,
DOT and TOT in fish and fish products. But the numbers of the analytical data are low and no
concentrations above the LOD were obtained. For these reasons means were not calculated
and no dietary intakes for these specific OTCs were estimated by the National Expert.
It should be emphazised that the highest concentrations of OTCs were detected in certain molluscs
like clams (TBT/DBT) and fresh fish from inland water ways and harbours (TBT/TPT). In addition
in some instances high levels of TBT and TPT were also analysed in fresh fish from lakes
(TBT/TPT). The complete raw data are reported on the technical Annex on CD ROM.
174
Table 67 DE intake
GERMANY
Adults >= 18 years Bodyweight: =70 kg <LOD =0 CONSUMERS
Food group code
Food Id. (country)
Food name OTC Daily intake (µg/day)
Daily intake / body weight (µg/day/kg bw)
Mean high level
Mean high level
9.1.1 DE/1 Fresh Fish farm / Lake DBT 0.027 0.071 0.00039 0.00101 9.1.1 DE/1 Fresh Fish farm / Lake DPT 0.004 0.011 0.00006 0.00015 9.1.1 DE/1 Fresh Fish farm / Lake MBT 0.018 0.046 0.00025 0.00065 9.1.1 DE/1 Fresh Fish farm / Lake MPT 0 0 0 0 9.1.1 DE/1 Fresh Fish farm / Lake TBT 0.639 1.649 0.00912 0.02355 9.1.1 DE/1 Fresh Fish farm / Lake TeBT 0 0 0 0 9.1.1 DE/1 Fresh Fish farm / Lake TePT 0 0 0 0 9.1.1 DE/1 Fresh Fish farm / Lake TPT 0.320 0.826 0.00457 0.01180 9.1.1 DE/2 Fresh Fish Inland
water ways / harbour DBT 0.042 0.081 0.00059 0.00115
9.1.1 DE/2 Fresh Fish Inland water ways / harbour
DPT 0.011 0.021 0.00015 0.00030
9.1.1 DE/2 Fresh Fish Inland water ways / harbour
MBT 0.004 0.008 0.00006 0.00011
9.1.1 DE/2 Fresh Fish Inland water ways / harbour
MPT 0.003 0.005 0.00004 0.00008
9.1.1 DE/2 Fresh Fish Inland water ways / harbour
TBT 0.431 0.835 0.00616 0.01193
9.1.1 DE/2 Fresh Fish Inland water ways / harbour
TeBT 0.003 0.005 0.00004 0.00007
9.1.1 DE/2 Fresh Fish Inland water ways / harbour
TePT 0 0 0 0
9.1.1 DE/2 Fresh Fish Inland water ways / harbour
TPT 0.256 0.496 0.00366 0.00709
9.1.1 DE/3 Fresh Fish marine DBT 0.008 0.024 0.00012 0.00034 9.1.1 DE/3 Fresh Fish marine DPT 0.002 0.004 0.00002 0.00006 9.1.1 DE/3 Fresh Fish marine MBT 0.003 0.009 0.00004 0.00013 9.1.1 DE/3 Fresh Fish marine MPT 0 0 0 0 9.1.1 DE/3 Fresh Fish marine TBT 0.082 0.235 0.00117 0.00336 9.1.1 DE/3 Fresh Fish marine TeBT 0 0 0 0 9.1.1 DE/3 Fresh Fish marine TePT 0 0 0 0 9.1.1 DE/3 Fresh Fish marine TPT 0.133 0.380 0.00190 0.00543
Since consumption data is available for the fresh bivalve molluscs, cephalopodes, crustaceans and
echinoderm, as a group, the mean concentration of each specific organotin compound in the
samples HE001-HE016( the whole set of data for fresh seafood ) was calculated and used for the
estimation of the mean level of daily intake. The mean level of daily intake was calculated by
multiplying the mean concentration of each specific organotin compound with the mean
consumption.
The high level of daily intake was calculated by multiplying the highest concentration of the
specific organotin compound with the 95th perc. consumption value.
Both the data , by consumers and by population were calculated, both by asssuming < LOD
occurrence values =0 and <LOD occurrence values=LOD/2.
The intake data are reported in Table HE INTAKE. The complete raw data are reported on
technical Annex on CD ROM
196
Table 79 HE Intake data by population (calculated with <LOD=LOD/2)
Food group code
Food Id. (country Code/Sa
mple Number
)
Food name Daily intake (µg/day) Daily intake / body weight (µg/day/kg
bw)
OTC
Mean high level Mean high level
9.1.2, 9.1.3, 9.1.4 and
9.1.5
HE 001-016
Fresh Bivalve molluscs,
Cephalopodes, Crustaceans and
Echinoderm
TBT 0.057 1.1 0.00081 0.01571
9.1.2, 9.1.3, 9.1.4 and
9.1.5
HE 001-016
Fresh Bivalve molluscs,
Cephalopodes, Crustaceans and
Echinoderm
DBT 0.07 2.29 0.00100 0.03271
9.1.2, 9.1.3, 9.1.4 and
9.1.5
HE 001-016
Fresh Bivalve molluscs,
Cephalopodes, Crustaceans and
Echinoderm
MBT 0.065 2.72 0.00093 0.03886
9,4 HE017 Canned fish, fish roe, caviar, fish
pies
TBT 0.003 0.02 0.00004 0.00029
9,4 HE017 Canned fish, fish roe, caviar, fish
pies
DBT 0.0075 0.05 0.00011 0.00071
9,4 HE017 Canned fish, fish roe, caviar, fish
pies
MBT 0.0045 0.03 0.00006 0.00043
197
Table 80 HE Intake data By consumers (calculated with <LOD=LOD/2)
Food group code
Food Id. (country Code/Sa
mple Number
)
Food name Daily intake (µg/day) Daily intake / body weight (µg/day/kg
bw)
OTC
Mean high level Mean high level
9.1.2, 9.1.3, 9.1.4 and
9.1.5
HE 001-016
Fresh Bivalve molluscs,
Cephalopodes, Crustaceans and
Echinoderm
TBT 0.81 5.79 0.0116 0.0828
9.1.2, 9.1.3, 9.1.4 and
9.1.5
HE 001-016
Fresh Bivalve molluscs,
Cephalopodes, Crustaceans and
Echinoderm
DBT 1.00 12.06 0.0143 0.1723
9.1.2, 9.1.3, 9.1.4 and
9.1.5
HE 001-016
Fresh Bivalve molluscs,
Cephalopodes, Crustaceans and
Echinoderm
MBT 0.92
14.34 0.0131 0.2049
9,4 HE017 Canned fish, fish roe, caviar, fish
pies
TBT 0.024 0.068 0.00034 0.00097
9,4 HE017 Canned fish, fish roe, caviar, fish
pies
DBT 0.060 0.170 0.00086 0.0024
9,4 HE017 Canned fish, fish roe, caviar, fish
pies
MBT 0.036 0.102 0.00051 0.0014
198
3.8 Norway Estimated intake in the Norwegian population:
Data for the consumption of fish, shellfish and game were from the Fish and Game Study 1999-2000. The Fish and Game study was a representative study, making use of a food frequency questionnaire. A number of 6015 individuals participated in the survey carried out in 1999, whereas 5502 individuals participated in the survey carried out in 2000. The participants were asked to give information about how many time during the last year they had consumed specific fish and game and offal of such. Based on standard portion of the foods in question the food frequencies were converted into amount eaten per day (g/day). Three intake calculations were made for TBT and TPT and their derivatives:
The first one (TBT and TPT and their derivatives intake 1) is based on consumption data from Fish and Game Study 1999, all participants. The second one (TBT and TPT and their derivatives intake 2) is based on consumption data from Fish and Game Study 1999, consumers only. Estimated intake in sub-groups: The third one (TBT and TPT and their derivatives intake 3) is based on consumption data from Fish and Game Study 2000, consumers only. Consumption of fish are based on participants who live in coastal municipalities. It is found that the consumption of saltwater fish is significant higher in the population who live in coastal areas and therefore they may be a group at risk to have a high intake of TBT and TPT and their derivatives.
Assumptions being made: Fish It was assumed that fish used on sandwiches would be herring. The concentration of TBT and TPT and their derivatives in saithe, haddock and flounder, was assumed to be the same as in cod, whereas the concentration of TBT in mackerel and salmon was assumed to be the same as in herring. The TBT and TPT and their derivatives concentration in liver of saithe was assumed to be the same as in cod liver. The food group “Saltwater fish, other” was assumed to consist of equal parts of “skrubbe” and brosme. Shellfish Crab consists of so-called dark and white meat. The two types of meat contain different amounts of the contaminants in question. A study based on ten crabs showed that the crabs had an average content of 41% white meat (found in the claws), whereas 59% of the crabs
199
consisted of brown meat (unpublished data). The result was used when estimating the content of heavy metals in whole crabs. Proposed ratio: Major approximations performed on the total number of foods: TBT: 7 fish / 16 fish RAW data: the complete raw data an reported on the Technical Annex on CD-ROM
200
TABLE 81 NORWAY Estimated daily intake by population, TBT and derivatives (Fish & Game, 1)
9a Eel 0.0124 0.0248 0.00037143 0.00074286 0.00015714
0.00031429
9 Crab 0.00257143
0.009 0.00025714 0.0009 0.00017143
0.0006
9 Crab, claws
0.00128571
0.0054 7.1429E-05 0.0003 7.1429E-05
0.0003
9 Mussel 0.00028571
0.00057143 0.000008 0.000016 5.7143E-06
1.1429E-05
206
4. ANNEX 2: Questionnaire
207
4.1 Questionnaire for data submission
4.1.1 INSTRUCTIONS FOR COMPLETION OF FORMS Form 1: FOOD OCCURRENCE DATA FOR INDIVIDUAL FOOD SAMPLES Information about Organotin compounds (OTCs) in individual foodstuffs should be provided in Table 1 (infosheet 01) as shown in the examples reported in ANNEX 4., The concentration found (in µg/kg) should be provided for each individual food analysed, with the results given as fresh weight. Please refer the calculations to the cationic form, in the case of salts. The mean (median if not available) minimum and maximum values could be provided, too. Information is required for each specific organotin compound, but, if available, information on total OTC can be supplied in free sheets or in any other way. Food goup code In order to assist in the collation of data, enter the food code for the sample (see ANNEX 1) Food identification ( country code/sample no) Enter the country code (see ANNEX 2)and then assign a sample number, e.g. for data supplied by Belgium on a processed cheese sample which was the twentieth sample submitted by them a sample code of BE/020 would be assigned. Food name Indicate the specific food item for which you submit data, whit a brief description, if it is necessary . (see Example in ANNEX 4) Reference Details of where the information contained in the table has been published/can be obtained. In the column, each reference should be indicated by the country code and a progressive number (e.g., the first reference submitted by UK in a chronological order will be UK-001). Full references should be provided in a separate reference list (use infosheet 02 Reference), following the instruction reported in ANNEX 3. References to papers to be published can also be supplied in the reference list as “unpublished results” (see ANNEX 3).
208
Year of sampling If the sampling of the individual food analysed covered more than one year, please indicate the whole time period, e.g. 1998-2000. Date of sampling, Date of Analysis, Interval between sampling and analysis (if dates are not available These information are concerned with the eventual delay between sampling and analysis. It is a warning that successive information are required about the situation of the sample during the above interval. . The dates, if available, should be reported . If not available the month and the year, also the interval could be reported (e.g 6 months) A proper separate sheet (infosheet 02 Sample collection and Storage) is provided to report information relevant to trace the history of the sample from the sampling (e.g. fishing) to the analysis. Therefore the procedure used, from the “in situ” collection to the analytical testing, should be described. No predefined form is provided to let the Expert to report information as it is available. The following steps should be briefly reported: Collection: (in situ conditions) Sample handling after collection: :Give details about containers in direct contact with samples (.materials), storage time, temperature and dark/light exposure, eventual delay between collection and storage (e.g. 30 minutes under sunlight, immediate freezing etc) Transport conditions: The same type of information as above described Storage in the Laboratory: If information is available, please indicate the eventual operations on sample e.g. freezing (give temperature), dark or light and, most important of all, indicate the storage time (e.g. 1 month, 90 days, etc). COMPOSITE/INDIVIDUAL SAMPLE Specify whether individual samples were analysed separately or pooled to make up a composite sample. TYPE OF WATER (ONLY FOR FISH PRODUCTS) Report F for Fresh water, M for Marine water and B for Brackish
Analytical method It is suggested to use the following abbreviations for the description of sample treatment and analytical technique, respectively:
INSTRUMENTAL DETERMINATION: GC-MS Gas-Chromatography-Mass-Spectrometry (specify if quadrupole, ion trap, etc ); GC-FPD: Gas chromatography-Flame Photometric Detection; HPLC; High Performance Liquid Chromatography ;ICP-AES: Inductively Coupled Plasma - Atomic Emission Spectrometry; ICP-MS: Inductively Coupled Plasma - Mass Spectroscopy (specify high resolution or quadrupole, i.e. HR-ICP-MS or Q-ICP-MS); VM:
209
Voltammetric Methods; CV-AAS: Cold Vapour - Atomic Absorption Spectrometry; FAAS: Flame - Atomic Absorption Spectrometry; GC- QFAAS: Gas Chromatograpphy-Quartz furnace - Atomic Absorption Spectrometry; GF-AAS: Graphite furnace - Atomic Absorption Spectrometry; HG-AAS: Hydride Generation – Atomic Absorption Spectrometry. Other, eventually not included abbreviations can be proposed by the National Expert in the compilation of the Table
Please reference the method used to analyse the sample. Details of the validation of method, reproducibility, repeatability, normal recovery range, correction for recovery, interferences, etc., should be supplied as an additional paper for each method (use infosheet 02 Analytical Method description). Label such papers using the country code (ANNEX 2) and a method number, e.g. if Italy supplies data that have been obtained using three different methods of analysis these documents should be labeled MIT/01, MIT/02 and MIT/03 and the code included in the table. LOD The Limit of Detection for each method of analysis in the food matrix analysed should be given in the table and in the paper detailing the analytical method. The definition of LOD in the Commission Decision 90/515, i.e. LOD = 3 x SD for the mean of a large number of blanks, should be used. The quantity 6 x SD should be set as Limit of Quantification (LOQ = 2 x LOD), without reporting it in the tables. Specific Organotin Compound Specify the compound. Do not use class name in this field. If abbreviation is used, a separate list for abbreviation must be send. CAS NUMBER If available, CAS number can help with identification in the case of different chemical names from different Countries. A list of CAS numbers for some common OTC is reported in ANNEX 5. Obviously, the annexed list is not exhaustive and d ata about other OTC could be found and should be reported, too. If CAS numbers for other eventual OTC are not available, or in the case of doubt about chemical name (e.g other nomenclature system) please remark it in a separate free sheet or contact the Coordinator. (read NB note at the top of Annex 5) Level of the contaminant Report in the relevant columns for each individual food the concentration and if available , mean (or median), minimum and maximum values. Country of origin Country in which the foodstuff has been produced (or from which has been imported). Representative for intake calculation
210
Indicate if the sample is representativeof the food that consumers would eat and therefore for intake calculations (Y for yes and N for not) and whether samples were taken on a random (R) or targetted (T) basis Place of sampling Choose one of the followings: origin (i.e., farm, fishing ground, forest, etc.), producer (e.g. for transformed products), retail. Water area (only for fish products) It should be reported whether fish were caught in the open sea (O), in a harbour area (H) or in an inland waterway (I) or in a lake (L). Other eventual details, if deemed relevant, could be reported in the infosheet 02 Sample collection and storage. AIM OF THE SURVEY Indicate if samples are derived from control action (C) or monitoring plan (M)
211
Form 2: EVIDENCE OF ANALYTICAL QUALITY ASSURANCE Evidence of quality assurance of the analytical laboratory should be given in the relevant template ( table 2 infosheet 01) for each item included in the occurrence template. Accreditation If the laboratory is accredited, the relevant columns should be filled by indicating general accreditation or specific analysis/analyses accreditation relevant for the Scoop activity; please indicate the international norms to which the laboratory complies and the year of accreditation. Method validated Indicate whether the analytical method used is validated (Y=yes, N=no). Validation can be anything from an in-house to a full collaborative study. Details on method validation should be specified in the additional paper provided for each method used (use infosheet 02 Analytical method description).
PROFICIENCY TESTING If the laboratory participated in national or international proficiency test schemes during the period when samples were analysed, this should be indicated (Y= yes, N= no) If the answer is Y, please report in the separate sheet (infosheet 02 Additional Information about Quality Assurance) information about the proficiency test performed (provider, matrix, concentration, Z-score, ). Any other relevant information about quality assurance of the laboratory can be freely reported in this infosheet 02 Additional Information about Quality Assurance , after the table, without a predefined
format.
CERTIFIED REFERENCE MATERIALS The use of certified reference materials , if any, should be indicated in the columns under this heading (Y= yes, N= no); if the answer is Y, please report in the separate sheet (infosheet 02 Additional Information about Quality Assurance) information about the use of Certified Reference Materials. (identity of the CRM, the certified concentration and the found concentration).Any other relevant information about quality assurance of the laboratory can be freely reported
in this infosheet 02 Additional Information about Quality Assurance, after the table, without a predefined format. CLEAN ROOM FACILITIES If clean room facilities are available in the laboratory, the clean room class should be given.
Other Other QA measures adopted by the laboratory (e.g. in-house RMs, recovery corrections, etc.) should be specified in this
column or reported in Infosheet 02 Additional Information about Quality Assurance.
Form 3: FOOD CONSUMPTION DATA Where available, experts should provide estimates of the food consumption for the food items for which occurrence data are available (use infosheet 01 Table 3). The difficulties in obtaining food consumption data which are exactly relevant to the particular food are well known. Therefore, it is suggested that the experts provide any information that they have available to them on consumption of relevant foods and beverages together with sufficient information to allow the limitations of the data to be assessed. To this aim, a separate sheet (infosheet 02 Food consumption data – Description of survey methods) without a predefinite format is provided to be filled with relevant information.For example, sampling unit information on the individual units (specify A=age, S=sex), household (specify scope e.g. “all”, “single persons excluded”), Specify also sample size (N°=number of participants). Survey method information should be reported, too e.g if total diet study, dietary survey (dietary records/diary), duplicate diet, etc. Specify all relevant information
212
(e.g. period and frequency, weighted intake, interview, purchase records, etc.). The representativity of these data with respect to geographical level: e.g national, regional, urban, rural (specify geographical region covered) could be indicated, too. If you have other variables to report, please provide also these supplementary data (e.g. subject weight, other characteristics of the individuals sampled, socio-economic data) on infosheet 02 Food consumption data – Description of survey methods where you report all the relevant details about the consumption data provided and the survey method utilised. With this data, it is hoped that comparisons can be drawn between countries particularly to identify the main dietary sources of organotin compounds in each country. For each of the food items or groups of foods identified in ANNEX 1 the expert should give:
the best estimate of the mean consumption (expressed as g/person/day) for the whole population;
the best estimate of high consumption (95th percentile as a rule, but also 90th or 97.5th percentile can be reported);
a reference to the source of the consumption data (each reference should be indicated by the country code and a progressive number). Full references should be provided in a separate reference list (in infosheet 02 References), following the instructions reported in ANNEX 3.
Data for specific population sub-groups and especially high-risk groups (e.g. children, etc.) are particularly useful and are welcome if available. For each source of consumption data used in the subsequent intake calculations, the following information should be provided to the extent available using table 3 in infosheet 01: Year Period data collected over. Data by consumer’ and ‘Data by population: ’Mean, high consumers Mean and 95th percentile should be used for the subsequent intake calculations. However, also the median should be reported if available., but, in this case mark this information with the term “median” written directly into the cell, near the reported value. The same for 97 th or 90 th percentiles data, if available instead of 95th percentile.
Form 4: DIETARY INTAKES Occurrence data and consumption data should be properly combined to give the estimed dietary intake for each compound For occurrence data below the LOD a values of LOD/2 should be used. The procedure used to estimate mean and high level intake should be clearly described in a separate sheet, where all the relevant details not included in the template 4 , should be reported (use infosheet 02 Dietary intakes – Description of assumptions and calculation criteria). If intake data refer to already published investigations, the results of these works should be also summarised in table 4 and reference should be given in the reference list (infosheet 02 References) following the instructions reported in ANNEX 3. All other relevant information about estimed intakes (procedure and assumptions made, e.g. in estimating upper level of total intake by individuals, or correction for
213
body weight, whether based on total populations or on consumers only, etc) as well as considerations on the limitations of the estimates should be reported on infosheet 02 Dietary intakes – Description of assumptions and calculation criteria. It will be particularly helpful if the intake data allow to identify the major food sources of the organotin compounds in the diet. Where possible, experts should also provide estimates of intakes for specific population groups and especially high-risk groups. The following information should be provided in table 4 (infosheet 01): Concentration in food The concentration in food should be reported as µg/kg. For calculating the mean, where organotin levels were less than the LOD, the level should be taken as ‘zero’ in the first column and as half the LOD (LOD/2) in the second column. Range of detected values Please indicate the range of detected values (min-max levels). Daily intakes, Mean, high level These are reported on a “adult weight basis” (70 kg) and on a “per kg body weight basis”.Report the mean and 95th percentile to define mean and high-level consumption respectively. A different percentile can be used, but this should be clearly stated. % of total dietary intake Please calculate the % of total dietary intake, so that the relative contributions from different food groups/ fish groups can be estimated.
214
4.2. Food Categorisation System Code Description
0 Food in general, unless otherwise specified
1 Dairy products, excluding products of category 2 1.1 Milk and dairy-based drinks
eggnog) 1.2 Fermented and renneted milk products (plain) excluding drinks
1.2.1 Fermented milks (plain) 1.2.2 Non heat-treated after fermentation 1.2.3 Heat-treated after fermentation 1.2.4 Renneted milk 1.3 Condensed milk (plain) and analogues
1.3.1 condensed milk (plain) 1.3.2 Beverage whiteners 1.4 Cream (plain) and the like
1.4.1 Pasteurised cream 1.4.2 Sterilised, UHT, whipping or whipped cream and reduced fat creams 1.4.3 Clotted cream 1.4.4 Cream analogues 1.5 Milk powder and cream powder (plain)
1.5.1 Milk and cream powder 1.5.2 Powder analogues 1.6 Cheese
1.6.1 Unripened cheese 1.6.2 Ripened cheese 1.6.3 Total ripened cheese, includes rind 1.6.4 Rind of ripened cheese 1.6.5 Cheese powder (for reconstitution; e.g., for cheese sauces). 1.6.6 Whey cheese 1.6.7 Processed cheese 1.6.8 Cheese analogues 1.7 Dairy-based desserts (e.g. ice cream, ice milk, pudding, fruit or flavoured
yoghurt) 1.8 Whey and whey products, excl, whey cheese
2 Fats and oils, and fat emulsions (type water-in-oil)
2.1 Fats and oils essentially free from water 2.1.1 Butter oil, anhydrous milk fat, ghee 2.1.2 Vegetable oils and fats 2.1.3 Lard, tallow and fish oil, and other animal fats
215
2.2 Fat emulsions mainly of type water in oil 2.2.1 Emulsions containing at least 80% fat 2.2.2 Butter and concentrated butter 2.2.3 Margarine and similar products (e.g. butter-margarine blends) 2.2.4 Emulsions containing less than 80% fat (e.g. minarine) 2.3 Fat emulsions other than 2.2, incl. mixed and/or flavoured products based on fat
emulsions. 2.4 Fat based desserts (excl,. dairy based desserts)
3 Edible ices, including sherbet and sorbet
4 Fruits and vegetables (incl. mushrooms & fungi, roots and tubers, pulses
and legumes), and nuts & seeds
4.1 Fruit 4.1.1 Fresh fruit
Untreated fruit Surface-treated fruit Peeled or cut fruit
4.1.2 Processed fruit 4.1.2.1 Frozen fruit 4.1.2.2 Dried fruit 4.1.2.3 Fruit in vinegar, oil or brine 4.1.2.4 Canned or bottled (pasteurised) fruit 4.1.2.5 Jams, jellies, marmalades 4.1.2.6 Fruit-based spreads other than 4.1.2.5 (e.g. chutney) 4.1.2.7 Candied fruit 4.1.2.8 Fruit preparations, incl. pulp and fruit toppings 4.1.2.9 Fruit-based desserts, incl. fruit-flavoured water-based desserts 4.1.2.10 Fermented fruit products 4.1.2.11 Fruit fillings for pastries 4.1.2.12 Cooked or fried fruit
Untreated vegetables Surface-treated vegetables Peeled or cut vegetables
4.2.2 Processed vegetables, and nuts and seeds 4.2.2.1 Frozen vegetables 4.2.2.2 Dried vegetables 4.2.2.3 Vegetables in vinegar, oil or brine 4.2.2.4 Canned or bottled (pasteurised) vegetables 4.2.2.5 Vegetable, and nut & seed purees and spreads (e.g. peanut butter) 4.2.2.6 Vegetable, and nut & seed pulps and preparations other than 4.2.2.5 4.2.2.7 Fermented vegetable products
216
4.2.2.8 Cooked or fried vegetables
5 Confectionery 5.1 Cocoa products and chocolate products incl. limitations and chocolate substitutes
Cocoa mixes (powders and syrups) Cocoa based spread, incl. fillings Imitation chocolate, chocolate substitute products
5.2 Sugar based confectionery other than 5.1, 5.3 and 5.4, incl. hard and soft candy, nougats, etc.
5.3 Chewing gum 5.4 Decorations (e.g. for fine bakery wares), toppings (non-fruit) and sweet sauces.
6 Cereals and cereal products, incl. flours & starches from roots & tubers,
pulses & legumes, excluding bakery. 6.1 Whole, broken or flaked grain, incl. rice 6.2 Flours and starch 6.3 Breakfast cereals, incl. rolled oats 6.4 Pastas and noodles 6.5 Cereal and starch-based desserts (e.g. rice pudding, tapioca pudding) 6.6 Batters (e.g. for breading or batters for fish or poultry)
7 Bakery wares
7.1 Bread and ordinary bakery wares 7.1.1 Breads and rolls 7.1.2 Crackers, excluding sweet crackers 7.1.3 Other ordinary bakery products (e.g. bagels, pita, English muffins) 7.1.4 Bread-type products, incl. bread stuffing & bread crumbs 7.2 Fine bakery wares
7.2.1 Cakes, cookies and pies (e.g. fruit-filled or custard types) 7.2.2 Other fine bakery products (e.g. doughnuts, sweet rolls, scones and muffins) 7.2.3 Mixes for fine bakery wares (e.g. cakes, pancakes)
8 Meat and meat products, including poultry and game
8.1 Fresh meat, poultry and game 8.1.1 Whole pieces or cuts 8.1.2 Comminuted 8.2 Processed meat, poultry and game products in whole pieces or cuts
9 Fish and fish products, including molluscs, crustaceans and echinoderms
(MCE) 9.1 Fresh fish and fish products, incl. MCE
9.1.1 Fresh fish Muscle meat of fish 9.1.1.1 Muscle meat of wedge sole (Dicoglossa cuneata,), 9.1.1.2 eel (Anguilla anguilla) 9.1.1.3 spotted seabass (Dicentrarchus punctatus) 9.1.1.4 horse mackerel or scad(Trachurus trachurus) 9.1.1.5 grey mullet (Mugil labrosus labrosus) 9.1.1.6 common two-banded seabream (Diplodus vulgaris) 9.1.1.7 grunt (Pomadasys benneti) 9.1.1.8 european pilchard or sardine (Sardina pilchardus), 9.1.1.9 european anchovy (Eneraulis encrasicholus) 9.1.1.10 luvar or louvar (Luvarus imperialis 9.1.1.11 Anglerfish (Lophius spp.) 9.1.1.12 atlantic catfish (Anarhichas lupus) 9.1.1.13 bass (Dicentratus labrax 9.1.1.14 blue line(Molva dipterygia), 9.1.1.15 halibut (Hippoglossus hippoglossus), 9.1.1.16 little tuna (Eutynnus spp.), 9.1.1.17 marlin (Makaira), 9.1.1.18 pike (Esox lucius), 9.1.1.19 plain bonito (Orgynopsis unicolor), 9.1.1.20 poruguese dogfih (Centroscymnes coelolepis), 9.1.1.21 rays (raja spp.), 9.1.1.22 redfish (Sebstes marinus, S. mentella S. viviparus), 9.1.1.23 sail fish (Istiophorus platypterus), 9.1.1.24 scabbard fish (Lepidopus caudatus, Aphanopus carbo), 9.1.1.25 shark (all species), 9.1.1.26 snake mackerel (Lepidocybium flavobrunneum, Ruvettus pretiosus, gempylus
serpens) 9.1.1.27 sturgeon (Acipenser spp.), 9.1.1.28 swordfish (Xiphias gladius) 9.1.1.29 tuna (Thunnus spp.). 9.1.1.30 Other (specify species and add lines; please mark with X code, e .g. 9.1.1.30
X1, 9.1.130X2 etc) 9.1.2 Fresh bivalve molluscs
9.1.2.1 Mussels 9.1.2.2 Oysters 9.1.2.3 Clams 9.1.2.4 Other(specify species and add lines; please mark with X code e.g. 9.1.2.4X1,
9.1.2.4X2 etc) 9. 1.3 Fresh cephalopodes (with or without viscera)
218
9.1.3.1 Squid 9.1.3.2 Octopus 9.1.3.3 Cattle-fish 9.1.3.4 Other(specify species and add lines; please mark with X code e.g. 9.1.3.4X1,
9.1.3.4X2 etc) 9.1.4 Fresh crustaceans,
9.1.4.1 Crab (tested whole, white and brown meat, or just white meat) 9.1.4.2 Lobsters (tested whole, white and brown meat, or just white meat) 9.1.4.3 Shrimp 9.1.4.4 Other(specify species and add lines; please mark with X code e.g. 9.1.4.4X1,
9.1.4.4X2 etc) 9.1.5 Echinoderm 9.2 Processed fish and fish products, incl. MCE
9.2.1 Frozen fish, fish fillets and fish products, incl. MCE 9.2.2 Frozen battered fish, fish fillets and fish products, incl. MCE 9.2.3 Frozen minced and creamed fish products, incl. MCE 9.2.4 Cooked and/or fried fish and fish products, incl. MCE
9.2.4.1 Cooked fish 9.2.4.2 Cooked molluscs, crustaceans and echinoderms 9.2.4.3 Fried fish and fish products, incl. MCE
9.3 Semi-preserved fish and fish products, incl. MCE 9.3.1 Fish and fish products, incl. MCE, marinated and/or in jelly 9.3.2 Fish and fish products, incl. MCE, pickled and/or in brine 9.3.3 Salmon substitutes, caviar and other fish roe products. 9.3.4 Semi-preserved fish and fish products, incl. MCE other than 9.3.1 - 9.3.3 9.4 Fully preserved, Canned or fermented fish and fish products incl. MCE.
9.4.1 Fish canned in oil 9.4.2 Fish canned in brine 9.4.3 Fermented fish 10 Eggs and egg products
10.1 Fresh eggs 10.1.1 Eggs from indoor reared hens 10.1.2 Eggs from outdoor reared hens 10.2 Egg products
11.1 White & semi-white sugar (sucrose or saccharose), fructose, glucose (dextrose), xylose; sugar solutions and syrups, also (partially) inverted sugars, incl. molasses, treacle, and sugar toppings.
11.2 Other sugars and syrups (e.g. , brown sugars, maple syrup) 11.3 Honey
219
11.4 Table-top sweeteners, incl. those containing high-intensity sweeteners, other than 11.1 - 11.3
12 Salts, spices, soups, sauces, salads, protein products, etc. 12.1 Salt 12.2 Herbs, spices, seasonings (incl. salt substitutes), and condiments 12.3 Vinegars 12.4 Mustards 12.5 Soups and broths
12.5.1 Ready-to-eat soups and broths, incl. canned, bottled and frozen 12.5.2 Mixes for soups and broths 12.6 Sauces and like products
gravy) 12.6.3 Mixes for sauces and gravies 12.7 Salads (e.g. macaroni salad, potato salad) and sandwich spreads (excl. cocoa-
and nut-based spreads) 12.8 Yeast 12.9 Protein products
13 Foodstuffs intended for particular nutritional uses
13.1 Infant formulae and follow-on formulae 13.2 Foods for young children (weaning foods) 13.3 Dietetic foods intended for special medical purposes 13.4 Dietetic formulae for slimming purposes and weight reduction 13.5 Dietetic foods other than 13.1-13.4 13.6 Food supplements
14 Beverages, excluding dairy products
14.1 Non-alcoholic ("soft") beverages
14.1.1 Waters Natural mineral waters and source waters Table waters and soda waters
14.1.2 Fruit and vegetable juices Canned or bottles (pasteurised) fruit juice Canned or bottles (pasteurised) vegetable juice Concentrates (liquid or solid) for fruit juice Concentrates (liquid or solid) for vegetable juice
14.1.3 Fruit and vegetable nectars Canned or bottled (pasteurised) fruit nectar Canned or bottles (pasteurised) vegetable nectar Concentrates (liquid or solids) for fruit nectar Concentrates (liquid or solids) for vegetable nectar
14.1.4 Water-based flavoured drinks, incl. "sport" or "electrolyte" drinks 14.1.4.1 Carbonated drinks 14.1.4.2 Non-carbonated, incl. punches and ades
220
14.1.4.3 Concentrates (liquid or solid) for drinks 14.1.5 Coffee, coffee substitutes, tea, herbal infusions, and other hot cereal beverages,
excl cocoa.
14.2 Alcoholic beverages, incl. alcohol-free and low-alcoholic counterparts 14.2.1 Beer and malt beverages 14.2.2 Cider and perry 14.2.3 Wines
14.2.3.1 Still wine 14.2.3.2 Sparkling and semi-sparkling wines 14.2.3.3 Fortified wine and liqueur wine
14.2.3.4 Aromatized wine 14.2.4 Fruit wine 14.2.5 Mead 14.2.6 Spirituous beverages 14.3 Other alcoholic beverages (e.g. beer, wine, or spirit coolers. etc.)
15 Ready-to-eat savouries
15.1 Snacks - potato, cereal, flour or starch based (from roots & tubes, pulses & legumes)
16 Composite foods (e.g. casseroles, meat pies) - foods that could not be placed in categories 1-15.
221
4.3. REFERENCE INSTRUCTIONS
References should be reported using the provided template and numbered chronologically (start from 001). Citations should conform to the “Uniform Requirements for Manuscripts Submitted to Biomedical Journals” (“Vancouver style”, see www.icmje.org) with two variations: 1) The titles of journals and monographs should be written in italic; 2) Journal titles can be either written in full or shortened (please use the same criteria). If titles are shortened, please refer to the Index Medicus for abbreviations.
Journal papers Ysart G, Miller P, Croasdale M, Crews H, Robb P, Baxter M, de L’Argy C, Harrison N. 1997 UK total diet study – dietary exposures to aluminium, arsenic, cadmium, chromium, copper, lead, mercury, nickel, selenium, tin and zinc. Food Additives and Contaminants 2000;17(9):775-86.
Papers to be submitted Author 1, Author 2, Author 3 (…). Unpublished results. 2001.
Monographs Reilly C. (Ed.). Metal contamination of food. 2nd edition, London: Elsevier; 1991.
Ray S. Cadmium. In: Kiceniuk JW, Ray S (Ed.). Analysis of contaminants in edible aquatic resources. Weinhem: VCH; 1994. p. 91-113.
Technical Reports Cubadda F, Stacchini P, Baldini M. Organic and inorganic micro-pollutants in Adriatic seafood: contamination levels and evaluation of human potential intake [In Italian]. Rome: Istituto Superiore di Sanità; 1998. (Rapporti ISTISAN 98/11).
Documents available on Internet Available from: http//www/…; last visited 20/12/2001.
222
ANNEX 5 List of some common organotin compounds with their CAS numbers. NB: this list is not necessarily exaustive for the OTC. Data about other OTC could be found and should be reported, too. If CAS numbers for other eventual OTC are not available, if inconsistencies are noted in this list or in the case of doubt about chemical name (e.g other nomenclature system, difficulties with language etc.) please 1) list the chemical name without CAS number, add in a free sheet the explanation for that and , if any, the chemical synonims or 2) contact the Coordinator to find an agreed solution. To get other useful information about CAS and synonims please visit: http://www.inchem.org/documents/ehc/ehc/ehc015.htm http://ntp-server.niehs.nih.gov/htdocs/Chem_Background/ExSumPdf/Organotins.pdf OTC CAS monobutyl tin 78763-54-9 mono butyl tin trichloride (or butyltin trichloride) 1118-46-3 di butyl tin 1002-53-5
Mono-n-dodecyltin tris(isooctylmercaptoacetate) 67649-65-4 Dibutyl tin, S,S’ bis (2-ethylhexylmercaptoacetate) 10584-98-2
Dioctyl tin, S,S’ bis (2-ethylhexylmercaptoacetate) 15571-58-1
225
Table 1. Occurrence data for individual food samples TABLE 87
OTC Country: Units: microgram/kg Required information
Food group code
Food Identification
(country Code/Sample
Number)
Food name Reference
Year of sampli
ng
Date of Sampling
(month/year)
Date of Analysis (month/
year)
Interval between sampling and
analysis (if the dates are not
available)
Composite/ individual
sample
Type of water (only for fish products) F=
fresh; M=marine; B=Brackish
Analytical method
LOD Specific Organotin Compoun
d
CAS Number
for Specific
Compound
Concentration of specific
Organotin compounds
Mean /Median level of specific Organotin compounds (M=mean; Me=median)
Min
Max
Country of origin
Place of sampling
Water area (only for fish products) (H= harbour; O=
Open sea; I= Inland waterway ; L=lake; OT=
other, specify )
Representative for intake calculation (Y/N) Random or Targeted (R/T)
Aim of the survey (C=control) (M=monitoring)
226
227
TABLE 88 Table 2. Evidence of quality assurance of analytical occurrence data for
individual food samples OTC Country: Required information Food group code Food Identification
(country Code/Sample Number)
Food name Accreditation of the Lab Specific Organotin Compound
General Specific for OTC
Method validated Proficiency testing (Y/N)
Certified Reference Materials (Y/N)
Clean room facilities Other (specify)
228
TABLE 89 TABLE 3. ESTIMATED FOOD CONSUMPTION Country: Required information Food group code Food Identification
(country Code/Sample Number)
Food name Reference Year Data by Consumer (g/day) Data by Population (g/day)
Mean high consumers Mean high consumers
229
TABLE 90 Table 4. Estimated intake OTC Country: Required information Food group code Food Identification
(country Code/Sample Number)
Food name Consumption (g/day) Specific Organotin Compound
CAS Number Concentration in food (µg/kg)
Mean high consumers calculated with <LOD=0 calculated with <LOD =LOD/2
Range of detected values (µg/kg)
Daily intake (µg/day) Daily intake / body weight (µg/day/kg bw)
% of total dietary intake
Reference
Mean high level Mean high level
230
References Country
Code N° Reference
ADDITIONAL INFORMATION ON QUALITY ASSURANCE TABLE 91
PROFICIENCY TESTING CERTIFIED REFERENCE MATERIALS
Provider Matrix Concentration
Z-score From -2 to +2 (Y/N)
Identity Certified concentrati
on
Found concentration
231
Other: Sample collection and storage: for each set of samples, link this information with food identification(Country code/sample number) reported in the Table 1, 2nd column and the Reference reported in the 4th column of Table 1 (see instruction sheets) Analytical method description (add lines if necessary) M/Country code/01 M/Country code/02 M/Country code/03
232
233
Food consumption data – Description of survey methods
Dietary intakes – Description of assumptions and calculation criteria
234
5. ANNEX 3
235
5.1 REFERENCES FOR QUESTIONNAIRE DENMARK 02 001 Strand J, Jacobsen J A. Occurrence of Organic Tin compounds in plants and
animals from Danish waters. Accumulation and food chain relations. (In Danish). Report from NERI No. 135. www.dmu.dk. 2000.
02 002 Strand J , Jacobsen J A. Imposex in the sublitoral neogastropod common whelk (Buccinum undatum, L.) and Red whelk (Neptunea antiqua, L.) in Danish waters, accepted for Press in MEPS 2002.
02 003 NOVA program 2001. Un-published. NERI-Denmark www.dmu.dk 02 004 Henriksen, P. et al. 2000 – Environmental condition and
development. NOVA 2003. National Environmental Research Institute, Denmark. 110 pp. Report 375. (In Danish.) http://www.dmu.dk/1_viden/2_Publikationer/3_fagrapporter/default.asp
02 005 Hansen, J.L.S. et al 1999. Marine areas – status of the environmental condition in 1999. NOVA 2003. (In Danish) http://www.dmu.dk/1_viden/2_Publikationer/3_fagrapporter/default.asp
02 006 Markager, S. et al 1998. Marine areas – status of the environmental condition in 1998. NOVA 2003. 161 pp, (In Danish) http://www.dmu.dk/1_viden/2_Publikationer/3_fagrapporter/default.asp
02 007 Consummation of fish (In Danish) 1999-2000; GfK Danmark A/S, Consumer scan.
FRANCE FR 001 F. Pannier et al., Anal. Chim. Acta, 287 (1994) 17-24 FR 002 F. Pannier et al., Anal. Chim. Acta, 327 (1996) 287-293 FR 003 VOLATIER, J.-L. (coordinator), Enquête INCA individuelle et nationale sur
les consommations alimentaires. Paris: TEC&DOC (Ed.), 2000.
GERMANY DE 001 Adolf T., Schneider R., Eberhardt W., Hartmann S., Herwig A.,
Heseker H., Hünchen K., Kübler W., Matiaske B., Moch KJ., Rosenbauer J. (1995) Ergebnisse der Nationalen Verzehrsstudie (1985-1988) über die Lebensmittel- und Nährstoffaufnahme in der Bundesrepublik Deutschland. In : Kübler W., Anders Hj, Heeschen W. (Hrsg) VERA Schriftenreihe XI. Wissenschaftlicher Fachverlag Dr. Fleck, Niederkleen
DE 002 Anal. Chem. 1991, 63, 1506-1509
236
DE 003 Fresenius J. Anal. Chem. 1991, 339, 646-653
DE/ Cux
001 Kruse R. (2001) Statuserhebung zur Belastung von kommerziell bedeutsamen Fischarten, Garnelen und Muscheln durch Organozinn-Verbindungen. Zwischenbericht des Niedersächsischen Landesamtes für Verbraucherschutz und Lebensmittelsicherheit, Veterinärinstitut Cuxhaven, zum Forschungsvorhaben im Auftrag des Bundesministeriums für Verbraucherschutz, Ernährung und Landwirtschaft. (Study on the contamination grades of commercially important kinds of fish, crustaceans and molluscs by organotins. Intermediate report of the administrative office of Lower Saxony for consumer protection and food safety, veterinary institute Cuxhaven, sponsored by the federal ministry for consumer protection, food and agriculture)
002 LÖBF/LAfAO Dezernat für Fischereiwesen, (MUNLV) 003 IKSR-Monitoring
Internationales Komitee zum Schutz des Rheines 004 Lebensmittel-Monitoring
DE/ BW
001 Ministerium für Ernährung und Ländlichen Raum Baden-Württemberg, Jahresbericht Baden-Württemberg 2001, Überwachung von Lebensmitteln, Bedarfsgegenständen und Kosmetika, S. 109 –110, www.mlr.baden-wuerttemberg.de
DE/ RLP
001 Jahresbericht des Landesuntersuchungsamtes 2000
002 Jahresbericht des Landesuntersuchungsamtes 2001
GREECE HE 001 N. S. Thomaidis and A. S. Stasinakis, Unpublished results, 2002 HE 002 The Greek Household Budget Survey of 1998-1999, Data retrieved from the
DAFNE databank, Unpublished results. ITALY
237
IT 001
Gallina A, Magno F, Talladini L, passaier T, Caravello GU, Pastore P, Simple and effective gaschromatographic mass spectrometric procedure for the speciation analysis of organotin compounds in specimens of marine mussels. An evaluation of the organotin pollution of the Lagoon of Venice; Rapid Commun. Mass Spectrom. 2000; 14; 373-378
IT 002 Bressa G, Cima F, Fonti P, Sisti E, Accumulation of Organotin compounds in mussels from the Northern Adriatic coasts; Fresenius Envir. Bull. 1997; 6; 016-020
IT 003 Amodio-Cocchieri R, Cirillo T, Amorena M, Cavaliere M, Lucisano A, Del Prete U, Alkyltins in farmed and shellfish; Int. Jour. Food Sci. and Nutrition 2000; 51; 147-151
IT 004
Bortoli A, DaVilla G, Dariol S, Giannì B, Marconato E, Susanna S, Troncon A, Studio dell’accumulo di composti organostannici nell’ecosistema lagunare – Rapporto intermedio relativo al I° anno di indagine – Dicembre 2000 [in italian], Rapporto dell’Agenzia Regionale per la Protezione dell’Ambiente di Venezia (ARPAV)
IT 005 Turrini A, Saba A, Perronè D, Cialfa E, D’Amicis A, Food consumption patterns in Italy: the INN-CA study 1994-4996, European Jour. of Nutrition, 2001, 55, 571-288
IT 006 Turrini A, personal communication, 2002 NORWAY
NO 001 Knutzen J. Orienterende observasjoner av tinnorganiske forbindelser I fisk og krabbe – relasjon til spiselighet. (in Norwegian, summary in English). 2002. Source: Norwegian Institute for Water Research.
NO 002 Næs K, Knutzen J, Håvardstun J, Oug E, Moy F, Lie MC, Wiborg ML. Investigation of micro-pollutants in harbours in Telemark, Vestfold, Akershus and Østfold, PAHs, PCBs heavy metals and TBT in sediments and organisms (in Norwegian, summary in English). 2001. Source: Norwegian Institute for Water Research, ISBN No.: ISBN 82-577-4226-0.
THE NETHERLANDS NL 001 Leonards, P.E.G., Organotinverbindingen in visserijproducten. RIVO rapport,
2001(C013/02): p. 1-23 NL 005 Kistemaker, C., Bouman, M. and Hulshof, K.F.A.M. (1998) Consumption of
separate products by Dutch population groups - Dutch National Food Consumption Survey 1997 – 1998 (in Dutch). Zeist, TNO-Nutrition and Food Research Institute, TNO-report V98.812.