EVALUATION REPORT EV620 August 1999 DFID EVALUATION DEPARTMENT Project Completion Reports: A Review of Findings from Reports prepared on Projects Approved between 1983 and 1998 by Simon Robbins and Andrew Felton reports
Transcript
EVALUATION REPORT EV620August 1999
DFID EVALUATION DEPARTMENT
Project Completion Reports:A Review of Findings from Reports prepared on
Projects Approved between 1983 and 1998
by Simon Robbins and Andrew Felton
repo
rts
TABLE OF CONTENTS
Preface i
Abbreviations & Note iii
INTRODUCTION 1
ANALYSIS OF RESULTS 3
DIAGRAMS:
Figure 1: Distribution by Project Size 4
Figure 2: Average Project Size, by Region 5
Figure 3: Trends in Time Management Performance 6
Figure 4: Trends in Expenditure Management Performance 6
Figure 5: Delivery of Inputs (Donor and Overseas Partners) 7
Figure 6: Delivery of Outputs 8
Figure 7: Achievement of Purpose 9
Figure 8: Relationship between Achievement of Purpose
& Expenditure Management 10
Figure 9: Achievement of Goal 11
Appendix A: Main Data Tables (1-3), by Year of Approval 13
Appendix B: Other Statistical Tables (4-15) 17
Appendix C: The original PCR Form used for the data covered
by this analysis 25
Appendix D: The new PCR Form introduced in July 1999 31
Project Completion Reports Table of Contents
PREFACE
This study is an analysis of the findings of a collection of 617 Project Completion Reports (PCRs)prepared by project managers and received over the last five years. It is effectively an update of the reportissued in December 1998, which covered 492 reports. The main purpose of a PCR is to provide anassessment of the effectiveness of the project's implementation. It also provides an early estimate ofproject impact, as well as helping to identify projects which may be suitable for future ex post evaluation.
This study was undertaken by the following two members of Evaluation Department -
• Simon Robbins, Principal Administrator• Andrew Felton, Research Officer
in collaboration with Kim Bradford-Smith of Statistics Department, whose assistance and advice isgratefully acknowledged. The study involved the following stages:
- an analysis of all relevant PCRs;
- preparation of a draft report;
- submission of the report to DFID top management for consideration of the report findings andtheir possible implications for DFID’s current and future programmes;
- agreement on the final report for publication together with a separate summary sheet(EVSUM).
Evaluation DepartmentAugust 1999
Project Completion Reports Preface
i
ii
ABBREVIATIONS & ACRONYMS
DFID Department for International Development
PCR Project Completion Report
Note:
The former Overseas Development Administration (ODA) became the Department for
International Development (DFID) in May 1997. Although for convenience the acronym "DFID"
has been used throughout the report, it should be remembered that the projects it covers were
current almost entirely within the period of the ODA’s existence.
1. The purpose of this study is to highlight the main trends in performance of DFID’s projects overtime through an examination of data provided in Project Completion Reports (PCRs). It is the sixthreview Evaluation Department has undertaken of DFID PCRs, and effectively updates the fifth,similarly-structured report produced in December 1998. Analysis of PCRs is just one of a number ofother systems being developed by DFID to monitor and report on the performance of our portfolio.
2. PCRs are designed to provide both assessments of experience of project implementation andforecasts of expected success in achieving stated project objectives. They also provide one means ofidentifying projects suitable for subsequent evaluation. A PCR is required for every geographical
bilateral project with expenditure over £500,000. PCRs are optional below this threshold, andsimilarly are only voluntary for sectoral bilateral projects or multilateral aid. They become due oncedisbursement of allocated funds reaches 95% and are usually completed by the project manager in therelevant Geographical Department or Overseas Office. In contrast with ex post evaluation studies, whichare undertaken by independent consultants, preparation of PCRs is a project management function andtheir authors may be rating projects in which either they or - where staff have moved on - their immediatepredecessors were directly involved. Completed PCRs are submitted to the Evaluation Departmentwhich examines them closely for internal consistency and overall quality before finally accepting them.
3. The format used for all the PCRs covered by this report is shown in Appendix C. However, with effectfrom 1 July 1999 a revised and simplified PCR form came into use, and this is shown in Appendix D.
Project Completion Reports Introduction
1
Summary
Project Completion Reports (PCRs) cannot on their own provide a comprehensive picture of changesin project performance over time. Any analysis of them must be interpreted with caution. Acomparison of the performance ratings awarded in PCRs completed on projects approved during fourperiods (1983-89, 1990-91, 1992-93 and 1994-1998) suggests, roughly in line with the previousreport, that in most respects there has been a steady overall improvement, albeit with some variationsyear on year and between regions. It is difficult to attribute the improvements to any one influence,especially when the external environment can be so variable. But the findings continue to create anabiding impression that the progressive refinements to project management procedures over the yearsmay well have had a cumulatively beneficial effect.
4. This review follows the new format and approach introduced in the December 1998 report, themain features of which vis-à-vis previous practice were as follows:-
• The PCRs are analysed on the basis of year of project approval rather than year of completion,which enables us better to gauge how far changes in DFID’s operating procedures may havebrought about corresponding improvements in project management and overall success.
• The analysis covers virtually all PCRs incorporated into DFID’s Management InformationSystems database since the latter was set up, although in this case projects approved before 1983are excluded.
• Projects smaller than £500,000 are now covered where PCRs were prepared for them. At thesame time the analysis excludes two exceptionally large projects1 which otherwise distort theexpenditure data unduly.
• Wherever possible presentation is graphical or diagrammatic rather than tabular, with only theminimum of commentary.
• At present no analysis is made of lessons learned. This partly reflects the size of the task ofsynthesising entries of very varying length and quality from many hundred PCRs, and partlythe proven, more general difficulty of extracting lessons of substance and value even from smallnumbers. At the same time the potential of the PCR system as a source of useful lessons isconsiderable and it is hoped that the new simplified PCR form referred to in §3 will make theiranalysis easier and facilitate re-inclusion of a section on lessons in future issues of the Synthesis.This development would usefully complement the planned inclusion of PCRs in DFID’s newPerformance Reporting Information System for Management (PRISM), a centralised portfoliodatabase currently under development and intended, among other things, as a means offacilitating effective dissemination of the lessons of experience throughout the Office.
For now it remains our intention at present to follow the present format in future analyses, adding eachyear’s data to the existing population.
5. This report is accordingly based on a population of 617 PCRs which together
account for some £1.89 billion of expenditure. The projects covered by the PCRs were approvedbetween 1983 and 1998. Some projects over the £½m threshold lack PCRs, partly because certaincategories of expenditure create practical difficulties for completion reporting in its current format, andpartly because compliance with completion reporting requirements has often been low. But it is expectedthat the introduction of the new form will go a long way towards obviating these problems; and in thisregard it is noteworthy that, although many projects fall below the PCR expenditure threshold, projectsover the threshold cover well over 80% of geographical bilateral expenditure.
6. A sizeable proportion of PCRs (8½% by number, 27% by value) relate to Programme Aidinterventions, which are usually of shorter duration and often of higher value than the normal run ofprojects; where their inclusion in the analysis was found to affect the results appreciably, the material hasbeen disaggregated to make this clear.
Introduction Project Completion Reports
2
1 These projects are: Lake Rihand Coal-fired Power Station, India (approved 1982), and Hindustan Zinc Mining and Smelting Complex, India(approved 1987); expenditure on the two projects combined amounted to £210m in total. The PCRs for these projects show the former to havebeen partially successful in achieving its objectives, the latter largely unsuccessful.
7. As in the more recent studies, the analysis has been undertaken mainly on an aggregated basis. Keytrends by region have been drawn out. No formal analysis by sector has been included as the sample cellsizes often become too small to provide a reliable guide; but some raw data is provided in thesupplementary statistical breakdown presented in Appendix B, Tables 4-15. Judgements of success aremade on the basis of a rating scale of five, as follows: highly successful, successful, partially
successful, largely unsuccessful and wholly unsuccessful. A positive or successful performance isassumed if either of the top two ratings is assigned. The middle, partially successful rating is in thiscontext ambiguous, and has therefore been ignored in successive PCR analyses, including this one. Formore details on ratings, see the form at Appendix C.
Analysis of Results
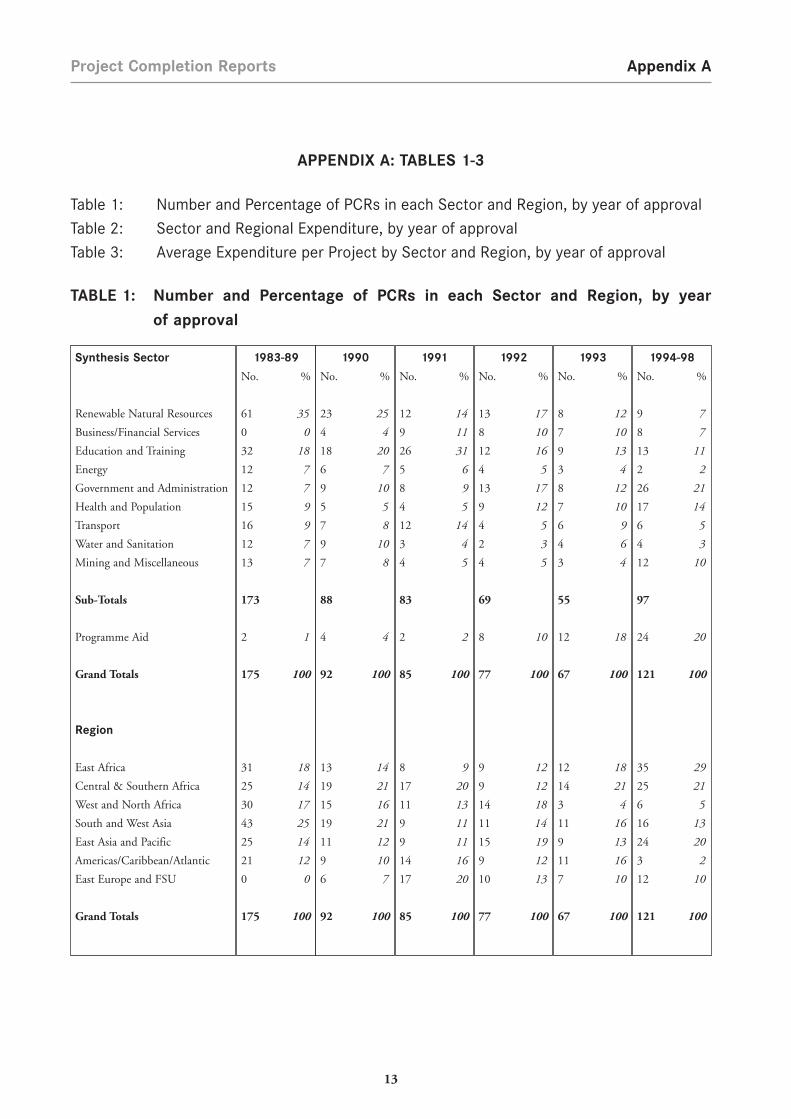
8. The basic data on the population of PCRs covered by this report is presented in Tables 1-3 (inAppendix A). The data show, on a year of approval basis and subdivided by sector and region, thedistribution of the PCRs on three bases: (i) number; (ii) corresponding total project expenditure;
and (iii) corresponding average project expenditure. The data are presented in both absolute andpercentage terms, and in current prices. For the approval year periods 1983-89 and 1994-98 the data areaggregated. This is partly to avoid inconveniently large tables. But partly also it was assumed that for theearlier period there is now less interest in a detailed breakdown in view of the extensive changes in projectcycle management procedures introduced in the 1990s; while for the most recent period, from 1994onwards, an increasing number of projects approved have yet to run their full course and be reported on,with consequently progressively smaller annual samples as well as a bias towards shorter projects.
9. The data is, as previously, further aggregated for the analysis covered by subsequent paragraphs andthe associated diagrams. Findings are compared for four approval periods: 1983-1989 (175 PCRs); 1990-1991 (177); 1992-1993 (144); and 1994-98 (121). These groupings avoid excessive disparities betweenthe sizes of the populations compared.
10. Tables 1-2 confirm earlier evidence of appreciable changes in the sectoral balance, for exampledeclines in the proportional numbers of Natural Resources, Energy and Education/Training projects, anda predictable increase in Programme Aid.
11. Project Size. Figure 1 shows the distribution of projects approved in each period by project size,including Programme Aid. The two bands comprising expenditure between £½m and £2½m, takentogether, continue to be dominant, but with a noticeable drop in the most recent period: this isconfirmed by Tables 2-3 which show that, when Programme Aid is excluded, the average overall size ofprojects fell appreciably up to 1994 but then rose sharply in the most recent period, mostly reflecting theadvent of one or two large projects in certain sectors, notably health. Even so, projects of less than £1maccounted for 30% of PCRs in the period 1994-98. Figure 2 presents an alternative breakdown of thesame information, by main region.
Project Completion Reports Introduction
3
Figure 1 (in current prices)
Introduction Project Completion Reports
4
Project Completion Reports Introduction
5
Figure 2 Average Overall Value of Projects for which PCRs were available (current prices)13.
12. Although the distribution of project size is of general background interest, our analysis indicatedvirtually no correlation between project performance and project size, such performance differences asexist between larger and smaller projects being for all intents and purposes negligible. This includesprojects below the £0.5 million PCR threshold, where completion of the forms is discretionary.
13. Time and Expenditure Management. Figures 3 and 4 show a steady improvement in thestandard of project management in terms of keeping project duration and expenditure within 10% ofthat planned. The previously reported decline in over-runs continues. The improvement in expenditurecontrol continues to be the most marked.
Figure 3
Figure 4
Introduction Project Completion Reports
6
14. Delivery of Project Inputs. The performance results for delivery of project inputs (for bothdonor and overseas partner) are shown in Figure 5. In terms of donor performance, Programme Aidoutperforms the normal run of projects, with 95% satisfactory in the 1994-98 period. But even whenProgramme Aid is excluded from the total, the trend has been strongly positive. The trend inperformance by overseas partners is also positive, albeit from a low base, over half of projects recordingsatisfactory accomplishment of agreed inputs in 1994-98.
Figure 5
Project Completion Reports Introduction
7
15. Delivery of Project Outputs. As Figure 6 shows, project performance in terms of outputdelivery has shown no clear trend between successive approval periods, although there appears to be adegree of underlying stability over time, despite quite wide regional fluctuations (see Appendix B,table 12).
Figure 6
16. Expected Achievement of Project Purpose. Figure 7 shows the trend in achievement ofproject purpose (formerly referred to as "immediate objectives") over time, including a regionalbreakdown. Performance of Programme Aid has generally outstripped that of projects, but even when it
Introduction Project Completion Reports
8
is excluded from the totals, about three-quarters of projects approved in the1990s are judged likely tofulfil their purpose. There were considerable regional variations, however.
Figure 7
African projects have exhibited the most steady improvement in expected achievement of purpose. Thedata for the Americas and Caribbean suggest there has been a sharp recent decline from a high base, butit is probably still too early to conclude that this is a firm trend.
Regional analysis excluding Programme Aid
Project Completion Reports Introduction
9
17. There are some positive correlations between achievement of project purpose and some otheraspects of performance. For example, projects in which overseas partners broadly complied with agreedconditions were more likely to achieve their objectives than those in which compliance rates were lower.In another respect, Figure 8 shows that projects in which expenditure was held within 10% of thatplanned performed have performed consistently better than those in which underspends occurred,although overspending projects also performed well. The corresponding data for time management weremuch less conclusive.
Figure 8
Introduction Project Completion Reports
10
18. Expected Achievement of Project Goal. The trends for achievement of goal (i.e. the wider,longer-term objectives to which the project purpose is directed), albeit only forecast, are shown in Figure9, for all projects combined and by region, but excluding Programme Aid. There are considerableregional variations, and overall the expected success rate is around the 60% mark. It should, however, benoted that project managers are not always inclined to make forecasts, and it was found that ratingforecasts were offered in under three-quarters of PCRs received.
Figure 9
Project Completion Reports Introduction
11
19. Sustainability. Many PCRs include no rating for sustainability, the project managersmaintaining that it was too early to make a judgement. But in those cases where a rating for sustainabilitywas given, it was found that, where satisfactory ratings were allocated for expected achievement ofpurpose or goal, a positive sustainability rating was awarded in over 85% of all cases, both overall and inall regions. Even where less flattering achievement ratings were awarded, those objectives that were stillexpected to be achieved, however partially, were largely also expected to be sustainable.
20. Sectoral Data. As mentioned earlier, Appendix B provides supplementary statistical dataincluding some disaggregation by sector. It is reiterated that the results should be interpreted with care.In particular it should be noted that in a number of cases the breakdown of the data results in small cellsizes yielding results which should be interpreted with special caution. Where the cell size consists ofbetween one and five PCRs, the result is shown in parentheses.
21. The raw data suggests at first sight that improvements in overall portfolio performance over timeare reflected rather less evenly by sector than by region. But the great variation in the size of the individualcells still precludes the possibility of a rigorous sectoral analysis complementary to the regional analysis,as the findings could well be misleading and unrepresentative in some respects, and open tomisinterpretation. Nonetheless it remains our intention that sectoral analyses should feature in futurestudies, just as soon as the cell size constraint has diminished sufficiently to enable useful, statisticallysignificant comparisons to be made.
Introduction Project Completion Reports
12
Project Completion Reports Appendix A
APPENDIX A: TABLES 1-3
Table 1: Number and Percentage of PCRs in each Sector and Region, by year of approval
Table 2: Sector and Regional Expenditure, by year of approval
Table 3: Average Expenditure per Project by Sector and Region, by year of approval
TABLE 1: Number and Percentage of PCRs in each Sector and Region, by year
of approval
13
Synthesis Sector
Renewable Natural Resources
Business/Financial Services
Education and Training
Energy
Government and Administration
Health and Population
Transport
Water and Sanitation
Mining and Miscellaneous
Sub-Totals
Programme Aid
Grand Totals
Region
East Africa
Central & Southern Africa
West and North Africa
South and West Asia
East Asia and Pacific
Americas/Caribbean/Atlantic
East Europe and FSU
Grand Totals
1983-89
No. %
61 35
0 0
32 18
12 7
12 7
15 9
16 9
12 7
13 7
173
2 1
175 100
31 18
25 14
30 17
43 25
25 14
21 12
0 0
175 100
1990
No. %
23 25
4 4
18 20
6 7
9 10
5 5
7 8
9 10
7 8
88
4 4
92 100
13 14
19 21
15 16
19 21
11 12
9 10
6 7
92 100
1991
No. %
12 14
9 11
26 31
5 6
8 9
4 5
12 14
3 4
4 5
83
2 2
85 100
8 9
17 20
11 13
9 11
9 11
14 16
17 20
85 100
1992
No. %
13 17
8 10
12 16
4 5
13 17
9 12
4 5
2 3
4 5
69
8 10
77 100
9 12
9 12
14 18
11 14
15 19
9 12
10 13
77 100
1993
No. %
8 12
7 10
9 13
3 4
8 12
7 10
6 9
4 6
3 4
55
12 18
67 100
12 18
14 21
3 4
11 16
9 13
11 16
7 10
67 100
1994-98
No. %
9 7
8 7
13 11
2 2
26 21
17 14
6 5
4 3
12 10
97
24 20
121 100
35 29
25 21
6 5
16 13
24 20
3 2
12 10
121 100
Appendix A Project Completion Reports
TABLE 2: Sector and Regional Expenditure, by year of approval
14
Synthesis Sector
Renewable Natural Resources
Business/Financial Services
Education and Training
Energy
Government and Administration
Health and Population
Transport
Water and Sanitation
Mining and Miscellaneous
Sub-Totals
Programme Aid
Grand Totals
Region
East Africa
Central & Southern Africa
West and North Africa
South and West Asia
East Asia and Pacific
Americas/Caribbean/Atlantic
East Europe and FSU
Grand Totals
1983-89
£K %
101,124 18
0 0
39,820 7
151,411 27
14,413 3
24,151 4
119,490 21
16,821 3
48,334 9
515,564
45,960 8
561,524 100
81,016 14
56,009 10
71,505 13
163,356 29
160,945 29
28,693 5
0 0
561,524 100
1990
£K %
67,476 29
10,139 4
21,939 9
33,483 14
7,506 3
8,843 4
20,631 9
10,570 5
19,416 8
200,003
34,500 15
234,503 100
24,742 11
28,013 12
30,871 13
63,582 27
75,405 32
6,786 3
5,104 2
234,503 100
1991
£K %
22,345 15
5,931 4
27,369 18
8,616 6
7,899 5
5,355 4
44,838 30
3,532 2
5,659 4
131,544
19,663 13
151,207 100
26,597 18
24,440 16
12,471 8
25,148 17
31,512 21
20,317 13
10,722 7
151,207 100
1992
£K %
25,326 16
9,393 6
14,726 9
17,997 11
7,473 5
10,386 6
15,169 9
2,970 2
2,713 2
106,153
56,483 35
162,636 100
27,304 17
10,768 7
23,845 15
32,964 20
43,999 27
14,948 9
8,808 5
162,636 100
1993
£K %
6,566 4
15,359 9
5,954 3
1,903 1
23,995 14
7,422 4
7,142 4
4,565 3
4,026 2
76,932
93,558 55
170,490 100
44,903 26
69,879 41
8,154 5
11,747 7
14,800 9
12,646 7
8,361 5
170,490 100
1994-98
£K %
10,355 2
28,174 5
29,746 5
2,034 0
73,453 12
116,618 19
23,952 4
3,554 1
58,956 10
346,842
263,080 43
609,922 100
240,798 39
166,370 27
8,457 1
123,763 20
40,204 7
14,072 2
16,258 3
609,922 100
Project Completion Reports Appendix A
15
TABLE 3: Average Expenditure per Project by Sector and Region, by year of approval
Synthesis Sector
Renewable Natural Resources
Business/Financial Services
Education and Training
Energy
Government and Administration
Health and Population
Transport
Water and Sanitation
Mining and Miscellaneous
Sub-Total Averages
Programme Aid
Grand Total Averages
Region
East Africa
Central & Southern Africa
West and North Africa
South and West Asia
East Asia and Pacific
Americas/Caribbean/Atlantic
East Europe and FSU
Grand Total Averages
1983-89
£K
1,658
-
1,244
12,618
1,201
1,610
7,468
1,402
3,718
2,980
22,980
3,209
2,613
2,240
2,384
3,799
6,438
1,366
-
3,209
1990
£K
2,934
2,535
1,219
5,581
834
1,769
2,947
1,174
2,774
2,273
8,625
2,549
1,903
1,474
2,058
3,346
6,855
754
851
2,549
1991
£K
1,862
659
1,053
1,723
987
1,339
3,737
1,177
1,415
1,585
9,832
1,779
3,325
1,438
1,134
2,794
3,501
1,451
631
1,779
1992
£K
1,948
1,174
1,227
4,499
575
1,154
3,792
1,485
678
1,538
7,060
2,112
3,034
1,196
1,703
2,997
2,933
1,661
881
2,112
1993
£K
821
2,194
662
634
2,999
1,060
1,190
1,141
1,342
1,399
7,797
2,545
3,742
4,991
2,718
1,068
1,644
1,150
1,194
2,545
1994-98
£K
1,151
3,522
2,288
1,017
2,825
6,860
3,992
889
4,913
3,576
10,962
5,041
6,880
6,655
1,410
7,735
1,675
4,691
1,355
5,041
Appendix A Project Completion Reports
1616
Project Completion Reports Appendix B
APPENDIX B: OTHER STATISTICAL TABLES (4-15)
NB: please see the introductory note below and the main text from paragraph 22.
Table 4: Time Management Performance: Proportion of Projects completed within 10% of
the Allocated Time, by Main Region
Table 5: Time Management Performance: Proportion of Projects completed within 10% of
the Allocated Time, by Sector
Table 6: Expenditure Management Performance: Proportion of Projects completed within
10% of the Allocated Expenditure, by Main Region
Table 7: Expenditure Management Performance: Proportion of Projects completed within
10% of the Allocated Expenditure, by Sector
Table 8: Percentage of Donor Inputs Successfully Delivered, by Main Region
Table 9: Percentage of Donor Inputs Successfully Delivered, by Sector
Table 10: Percentage of Recipient Inputs Successfully Delivered, by Main Region
Table 11: Percentage of Recipient Inputs Successfully Delivered, by Sector
Table 12: Percentage of Outputs Successfully Delivered, by Main Region
Table 13: Percentage of Outputs Successfully Delivered, by Sector
Table 14: Percentage of Purpose-level Objectives Successfully Achieved, by Sector
Table 15: Percentage of Goal-level Objectives Successfully Achieved, by Sector
Important Note: In some cases the breakdowns given in the following tables result in relatively smallsub-populations or "cells". In such cases the results must be treated with particular care. Where thedata consisted of between one and five PCRs, the result is shown in parentheses. Where no PCRs at allwere available, this is indicated in the relevant cells by " - ".
17
Appendix B Project Completion Reports
TABLE 4: Time Management Performance: Proportion of Projects completed within
10% of the Allocated Time, by Main Region (%)
TABLE 5: Time Management Performance: Proportion of Projects completed within
10% of the Allocated Time, by Sector (%)
18
Year of Approval Period:
Region:
AfricaAsiaLatin America, Caribbean and AtlanticEastern Europe
1983-89
291735-
1990-91
30312557
1992-93
50334775
1994-98
4955
(33)50
Year of Approval Period:
Region:
Renewable Natural ResourcesBusiness and Financial ServicesEducation and TrainingEnergyGovernment and AdministrationHealth and PopulationTransportWater and SanitationMining, Manufacturing and all otherProgramme Aid
1983-89
32-
3202332590
(50)
1990-91
27544320122235176040
1992-93
4740710572540176758
1994-98
445073(0)4824
(40)(67)4073
Project Completion Reports Appendix B
19
TABLE 6: Expenditure Management Performance: Proportion of Projects completed
within 10% of the Allocated Expenditure, by Main Region (%)
TABLE 7: Expenditure Management Performance: Proportion of Projects completed
within 10% of the Allocated Expenditure, by Sector (%)
Year of Approval Period:
Region:
(i) including Programme Aid
AfricaAsiaLatin America, Caribbean and AtlanticEastern Europe
(ii) excluding Programme Aid
AfricaAsiaLatin America, Caribbean and AtlanticEastern Europe
(iii) Programme Aid only
AfricaAsiaLatin America, Caribbean and AtlanticEastern Europe
1983-89
464638-
454538-
(100)(100)
--
1990-91
41603948
41603648
(50)(100)(100)
-
1992-93
57608441
51578141
79(100)(100)
-
1994-98
7070
(33)67
6368
(33)60
74(100)
-(100)
Year of Approval Period:
Region:
Renewable Natural ResourcesBusiness and Financial ServicesEducation and TrainingEnergyGovernment and AdministrationHealth and PopulationTransportWater and SanitationMining, Manufacturing and all otherProgramme Aid
1983-89
35-
32673367695838
(100)
1990-91
34545064414442505567
1992-93
52474567486980507185
1994-98
443862
(100)6571100(50)6788
Appendix B Project Completion Reports
20
TABLE 8: Percentage of Donor Inputs Successfully Delivered, by Main Region
TABLE 9: Percentage of Donor Inputs Successfully Delivered, by Sector
Year of Approval Period:
Region:
(i) including Programme Aid
AfricaAsiaLatin America, Caribbean and AtlanticEastern Europe
(ii) excluding Programme Aid
AfricaAsiaLatin America, Caribbean and AtlanticEastern Europe
(iii) Programme Aid only
AfricaAsiaLatin America, Caribbean and AtlanticEastern Europe
1983-89
636675-
636575-
-(100)
--
1990-91
73898091
74898091
(67)(100)
--
1992-93
88739482
89719382
83(100)(100)
-
1994-98
9184
(100)80
9083
(100)75
94(100)
-(100)
Year of Approval Period:
Region:
Renewable Natural ResourcesBusiness and Financial ServicesEducation and TrainingEnergyGovernment and AdministrationHealth and PopulationTransportWater and SanitationMining, Manufacturing and all otherProgramme Aid
1983-89
71-
65758336565069
(100)
1990-91
75907682758994839075
1992-93
90100793375671001008389
1994-98
4486100(50)9010067
(75)10095
Project Completion Reports Appendix B
21
TABLE 10: Percentage of Recipient Inputs Successfully Delivered, by Main Region
TABLE 11: Percentage of Recipient Inputs Successfully Delivered, by Sector
Year of Approval Period:
Region:
(i) including Programme Aid
AfricaAsiaLatin America, Caribbean and AtlanticEastern Europe
(ii) excluding Programme Aid
AfricaAsiaLatin America, Caribbean and AtlanticEastern Europe
(iii) Programme Aid only
AfricaAsiaLatin America, Caribbean and AtlanticEastern Europe
1983-89
243356-
243356-
----
1990-91
33544167
33544167
----
1992-93
47396731
43396431
(100)(50)(100)
-
1994-98
5161
(100)(40)
4763
(100)25
71(0)-
(100)
Year of Approval Period:
Region:
Renewable Natural ResourcesBusiness and Financial ServicesEducation and TrainingEnergyGovernment and AdministrationHealth and PopulationTransportWater and SanitationMining, Manufacturing and all otherProgramme Aid
1983-89
38-
3020189472238-
1990-91
317142302063695050-
1992-93
245041
(20)444071675083
1994-98
14(33)70
(50)448750
(50)4567
Appendix B Project Completion Reports
22
TABLE 12: Percentage of Outputs Successfully Delivered, by Main Region
TABLE 13: Percentage of Outputs Successfully Delivered, by Sector
Year of Approval Period:
Region:
(i) including Programme Aid
AfricaAsiaLatin America, Caribbean and AtlanticEastern Europe
(ii) excluding Programme Aid
AfricaAsiaLatin America, Caribbean and AtlanticEastern Europe
(iii) Programme Aid only
AfricaAsiaLatin America, Caribbean and AtlanticEastern Europe
1983-89
817190-
817090-
(100)(100)
--
1990-91
729187100
739186100
33(100)(100)
-
1992-93
72738571
65718271
93(100)(100)
-
1994-98
7985
(67)75
7286
(67)70
95(50)
-(100)
Year of Approval Period:
Region:
Renewable Natural ResourcesBusiness and Financial ServicesEducation and TrainingEnergyGovernment and AdministrationHealth and PopulationTransportWater and SanitationMining, Manufacturing and all otherProgramme Aid
1983-89
84-
81838367695877
(100)
1990-91
76100798265100100839160
1992-93
678760577153901007195
1994-98
676377
(100)739467
(75)7392
Project Completion Reports Appendix B
23
TABLE 14*: Percentage of Purpose-level Objectives Successfully Achieved, by Sector
TABLE 15*: Percentage of Goal-level Objectives(†) Successfully Achieved, by Sector
* See text, paragraphs 17 and 20, for information on regional breakdowns at both purpose and goal levels.
† Where a rating was given. In many cases those completing the forms considered it too soon to give ratings.
Year of Approval Period:
Region:
Renewable Natural ResourcesBusiness and Financial ServicesEducation and TrainingEnergyGovernment and AdministrationHealth and PopulationTransportWater and SanitationMining, Manufacturing and all otherProgramme Aid
1983-89
45-
52574742373343(0)
1990-91
518367351829737567
(100)
1992-93
50845250656978406753
1994-98
(0)4385-
656025(0)5658
Year of Approval Period:
Region:
Renewable Natural ResourcesBusiness and Financial ServicesEducation and TrainingEnergyGovernment and AdministrationHealth and PopulationTransportWater and SanitationMining, Manufacturing and all otherProgramme Aid
1983-89
71-
61833338636462
(50)
1990-91
7910079806256897380
(60)
1992-93
70807057706388838389
1994-98
507569
(100)8082
(80)(75)7582
Appendix B Project Completion Reports
24
Project Completion Reports Appendix C
APPENDIX C
The original PCR Form used for the data covered by this analysis
PROJECT COMPLETION REPORT(If Logical Framework is attached to the PCR, questions marked `(*)' need not be completed)
A: BASIC DATA
COUNTRY: SECTOR: MIS CODE:
PROJECT/PROGRAMME TITLE:
BRIEF DESCRIPTION:
LEVEL APPROVED BY: DATE APPROVED:
MANAGED BY: HQ
B: OUTPUTS OF IMPLEMENTATION PHASE
1: INITIAL(*): (if there is a Logical Framework (LF), extract from outputs line; for Programme Aid or ATP, extract fromappropriate approval document; for Process Projects, insert whatever outputs existed at start of project -if this is not possible insert earliest available outputs.)
2: AMENDMENTS: (where outputs have been revised over the lifetime of the project insert the most recently revised set
of outputs).
3: IF OUTPUTS HAVE BEEN AMENDED GIVE REASONS WHY:
4: ACHIEVEMENT: (mark with an 'x'. If outputs have been amended give two ratings: one against the initial output (I) and oneagainst the latest revised outputs (R))
Printed: 09/07/99 09:35 GAP M 1 Annex 1PCR Ver. 29 September 1995
Appendix C Project Completion Reports
C: FINANCIAL PROFILE
1: INITIALLY APPROVED ODA TOTAL COMMITMENT:
2: TOTAL ODA COMMITMENT AFTER ANY SUBSEQUENT AMENDMENTS:
3: EXPENDITURE PROFILE (by financial year in £'000s):
Financial Year Actual Expenditure Initial Commitment,(£'000s) Forecast
Total
Current MIS Project Commitment
Actual Expenditure as % of currentproject commitment
4: WHEN COMMITMENT CHANGES WERE SOUGHT, WERE THEY PROPERLY JUSTIFIED ANDEXPLAINED? (select Yes or No): Yes
EXPLAIN AND COMMENT:
5: ACTUAL EXPENDITURE AS % OF INITIALLY APPROVED COMMITMENT:
6. ACTUAL EXPENDITURE AS % OF COMMITMENT AFTER AMENDMENTS:
26
Printed: 09/07/99 09:35 GAP M 1 Annex 1PCR Ver. 29 September 1995
Project Completion Reports Appendix C
D: MONITORING AND PHYSICAL PROGRESS REPORT
1.
PROPOSED MONITORING ACTUAL MONITORING
Monitoring Date Monitoring Date
By Whom By Whom
WAS MONITORING ADEQUATE? (select Yes or No):
EXPLAIN AND COMMENT:
2: IN ORDER TO ACHIEVE THE OUTPUTS OF THE IMPLEMENTATION PHASE WEREACTIVITIES/INPUTS: (enter a rating between 1 and 5; 1 = very good, 5 = very poor)
To achieve initially intended outputs To achieve revised outputs (if applicable, (up to the time of any change) subsequent to any change)
ODA Recipient ODA RecipientActivities/Inputs Government Activities/Inputs Government
Activities/Inputs Activities/Inputs
(a) Appropriate?
(b) Sufficient?
(c) Timely?
(d) Well-coordinated?
(e) Efficiently procuredand delivered?
EXPLAIN AND COMMENT:
Initial Outputs:
Revised Outputs:
27
Printed: 09/07/99 09:35 GAP M 1 Annex 1PCR Ver. 29 September 1995
Appendix C Project Completion Reports
3: INITIALLY PLANNED PHYSICAL COMPLETION DATE:
4: ACTUAL PHYSICAL COMPLETION DATE:
5: ACTUAL IMPLEMENTATION TIME AS % OF INITIALLY PLANNED IMPLEMENTATION TIME:
EXPLAIN AND COMMENT:
E: CONDITIONS
(Set out each individual project condition - initial and subsequent amendments - in the table below and for each rate whetherthe condition was:
1 = Wholly met 2 = Largely met 3 = Partially met4 = Largely unmet 5 = Not met at all
For ratings 1 and 2 only assess to what extent compliance had on the achievement of objectives, and for 3-5 only assess towhat extent the lack of compliance had on the achievement of objectives:
A = Major Positive Effect B = Significant Positive Effect C = Minor/Negligible EffectD = Significant Negative Effect E = Major Negative Effect
Conditions can be extracted from intergovernmental agreement, Logical Framework, or approval document.
Additional space will be created within the table if insufficient space exists).
CONDITIONS COMPLIANCE For Rating:(1-5)
1,2 3,4,5
Effect Effect(A-E) (A-E)
Initial:
(a)
(b)
(c)
Subsequent Amendments:
(a)
(b)
(c)
EXPLAIN AND COMMENT:
28
Printed: 09/07/99 09:35 GAP M 1 Annex 1PCR Ver. 29 September 1995
Project Completion Reports Appendix C
F: ACHIEVEMENT OF PURPOSE, GOAL AND PIMS MARKERS
1. LIKELY ACHIEVEMENT OF OBJECTIVES (Set out in the table below: each individual objective against purposeand goal, both initial and subsequent amendment; each individual ODA priority objective assigned together with its PIMSmarker {1-4}; and for each rate whether it is:1 = likely to be completely achieved 4 = only likely to be achieved to a very limited extent2 = likely to be largely achieved 5 = unlikely to be realised3 = likely to be partially achieved X = too early to judge the extent of achievement
Purpose: Immediate Objectives Rating [1-X]
Initial:
Subsequent Amendment:
Goal: Wider Objectives
Initial:
Subsequent Amendment:
PIMS Markers assigned to ODA Priority Objectives
Priority Objectives: Marker 1-4 Marker 1-4
EXPLAIN AND COMMENT (even if X-rated):
2. OVERALL ACHIEVEMENT OF IMMEDIATE OBJECTIVES/PURPOSE(given the ratings in question 1 give an overall rating of immediate objectives/purpose):
29
Printed: 09/07/99 09:35 GAP M 1 Annex 1PCR Ver. 29 September 1995
Appendix C Project Completion Reports
3: LIST THE CONDITIONS NECESSARY FOR SUSTAINABILITY TO BE ACHIEVED:
4: DO YOU EXPECT THAT THE PROJECT WILL BE SUSTAINABLE? (select Yes, No or Don't know): Yes
EXPLAIN AND COMMENT: (for example, is project likely to achieve impact not originally envisaged; should thejudgement on sustainability be qualified?)
G: PARTICULAR LESSONS FROM IMPLEMENTATION PHASE
WHAT ARE THE MAIN LESSONS ODA CAN LEARN FROM THE IMPLEMENTATION PHASE OFTHIS PROJECT?
(a) Positive aspects which may be replicable:
(b) Negative aspects which may be avoided in future:
(c) Other/General lessons:
H: EX-POST EVALUATION
IS THIS PROJECT/ PROGRAMME CONSIDERED PARTICULARLY USEFUL FOR FURTHEREVALUATION? (select Yes or No): Yes
(If yes, place an "x" in box(es) which apply)
(a) Innovative �
(b) Particular relevance to achieving ODA's priority objectives �
(c) Rapidly increasing involvement in sector �
(d) Replicable project �
(e) Continuing project �
(f) Other (please specify): �
EXPLAIN AND COMMENT:
PCR FINALISED BY:
PCR APPROVED BY:
DATE:
30
Printed: 09/07/99 09:35 GAP M 1 Annex 1PCR Ver. 29 September 1995
Project Completion Reports Appendix D
APPENDIX D
The new PCR Form (introduced July 1999)
PROJECT COMPLETION REPORT (PCR)
What?
Project Completion Reports (PCRs) provide a useful record of what has been achieved by your projectand of key lessons for future application. They are required for all projects costing £500,000 or more.
Why?
PCRs, like Output-to-Purpose Reviews (OPRs), are part of the sequence of reports which chart projectprogress, achievement and impact, and so contribute to good Project Cycle Management; and theycontain lessons which may well be valuable when designing projects with similar characteristics.
Who?
You and your colleagues know more about this project than anyone else in DFID. Share your knowledge!Evaluation Department stores all PCRs received on a central database and submits an annual synthesisreport to the Projects and Evaluation Committee (PEC). PCRs are also used in evaluation studies. Indue course, access to PCRs will be available through PRISM.
How?
The form attached provides the basic format for PCRs, recording the minimum information required. � Consult your colleagues and project partners� Complete the form in full, including the spaces provided for comment� Use the scoring system outlined below for rating all aspects of performance� If you wish, attach a supplementary report or supporting papers to provide more detail� Return the completed form to Evaluation Department
Guide to Performance Ratings: Any queations?
Very Good: fully achieved, very few or no shortcomings �Consult EvaluationSatisfactory: largely achieved, despite a few shortcomings �DepartmentFair: only partially achieved, benefits and shortcomings finely balancedPoor: very limited achievement, extensive shortcomingsFailure: not achieved
Too Early: too soon to give an adequately reliable rating forecast (for Goaland Sustainability only, and then only when absolutely necessary) PCR Form Version 2.1
31
Appendix D Project Completion Reports
SECTION I: BASIC DATA (to be completed from Project Header Sheet apart from last
three rows)
NOW USE THE SPACE BELOW TO EXPLAIN OR COMMENT BRIEFLY ON ANY NOTEWORTHY ASPECT OF THE DATA GIVENABOVE (In particular recording and explaining any formal changes in financial, time or other constraints which were madeduring the course of the project/programme):
32
COUNTRY: SECTOR (INC. CODE): MIS CODE(S):
Project/programme title:
Managed by (DFID dept/overseas office):
Brief description: I
Poverty aim markers (pam):
Poverty objective markers (pom):
Policy information markers (pims): principal (p) or significant (s)
Level approved by:
Date approved:
Completion date originally envisaged:
DFID financial commitment finally approved (i.e. after any amendments):
DFID financ'l commitment originally approved (if different from above):
Actual completion date (dd/mm/yyyy) :
Actual dfid expenditure:
Actual dfid expenditure as % of finally approved commitment:
Project Completion Reports Appendix D
SECTION II: PERFORMANCE ASSESSMENT
Rating GuideVery Good: fully achieved, very few or no shortcomings Poor: very limited achievement, extensive shortcomings Satisfactory: largely achieved, despite a few shortcomings Failure: not achievedFair: only partially achieved, benefits and shortcomings Too Early: too soon to give an adequately reliable rating forecast
finely balanced (Goal and Sustainability only)
33
LogFrame Level
GOAL (state below, then provide arating forecast with commentary):
PURPOSE (state below, then rate &comment):
WHETHER SUSTAINABLE (provideforecast & comment):
Achievement Rating
(forecast only)<--Please Rate-->
<--Please Rate-->
<--Please Select-->
Comments
LogFrame Level (&c)
OUTPUTS (list the main outputs below,rate against each, then give an overallrating):
1
2
3
4
5
6
7
8
9
10
Overall Assessment of OutputDelivery :-
Performance Rating
1<--Please Rate-->
2<--Please Rate-->
3<--Please Rate-->
4<--Please Rate-->
5<--Please Rate-->
6<--Please Rate-->
7<--Please Rate-->
8<--Please Rate-->
9<--Please Rate-->
10<--Please Rate-->
<--Please Rate-->
Comments
Appendix D Project Completion Reports
34
(*) including conditionality aspects where relevant
SECTION III: LESSONS LEARNED
Please summarise below any lessons arising from this project that may help DFID perform better in future(ifnone please state):
i. Project/Programme Level Lessons
ii. Sector Level or Thematic Lessons
iii. General Developmental Lessons
iv. Finally, do you think there are issues arising from this project or programme which wouldmake further research (e.g. an ex-post evaluation) useful? <--Please Select-->
If your answer is yes, please give brief reasons below:
PCR FINALISED BY: PCR APPROVED BY:
DATE (dd/mm/yyyy):
LogFrame Level (&c)
INPUTS/ACTIVITIES (see footnote*):
(a) Appropriateness (quality):
(b) Sufficiency (quantity):
(c) Efficiency (timeliness &c):
OVERALL ASSESSMENT*:
MONITORING AND REVIEW (give anoverall rating for the standard ofmonitoring and output-to-purposereviewing; then, where available, list theproject/programme OPR dates (year)along with the corresponding scores atoutput and purpose levels) :
The Department for International Development (DFID)is the British government department responsible forpromoting development and the reduction of poverty. Thegovernment elected in May 1997 increased its commitmentto development by strengthening the department andincreasing its budget.
The policy of the government was set out in the White Paperon International Development, published in November 1997.The central focus of the policy is a commitment to theinternationally agreed target to halve the proportion of peopleliving in extreme poverty by 2015, together with the associatedtargets including basic health care provision and universalaccess to primary education by the same date.
DFID seeks to work in partnership with governments whichare committed to the international targets, and seeks to workwith business, civil society and the research community toencourage progress which will help reduce poverty. We alsowork with multilateral institutions including the World Bank,United Nations agencies and the European Commission. Thebulk of our assistance is concentrated on the poorest countriesin Asia and sub-Saharan Africa.
We are also contributing to poverty elimination and sustainabledevelopment in middle income countries, and helping thetransition countries in Central and Eastern Europe to try toensure that the widest number of people benefit from theprocess of change.
As well as its headquarters in London and East Kilbride, DFIDhas offices in New Delhi, Bangkok, Nairobi, Harare, Pretoria,Dhaka, Kathmandu, Suva and Bridgetown. In other parts of theworld, DFID works through staff based in British embassiesand high commissions.
DFID DFID94 Victoria Street Abercrombie HouseLondon Eaglesham RoadSW1E 5JL East KilbrideUK Glasgow G75 8EA