16
Reprint 1149 Global Warming - Present and Future Challenges C.M. Shun & S.M. Lee Symposium on eCO2 Management - A Paradigm Shift 25 May 2012

Reprint 1149
Global Warming - Present and Future Challenges
C.M. Shun & S.M. Lee
Symposium on eCO2 Management -
A Paradigm Shift
25 May 2012

- 1 -
Global Warming - Present and Future Challenges
SHUN Chi Ming
Director
Hong Kong Observatory
LEE Sai Ming
Acting Senior Scientific Officer
Hong Kong Observatory
Abstract
The Fourth Assessment Report (AR4) of the Intergovernmental Panel on Climate
Change (IPCC) clearly indicated that the increase in the atmospheric greenhouse gas
concentration due to human activities are very likely responsible for the observed global
warming since the middle of the 20th
century. In this paper, we will review the current
situation of global temperature, atmospheric carbon dioxide (CO2) concentration and CO2
emission. We will also discuss some of the impacts of a warming climate, and highlight the
work by the IPCC Working Group III in studying the mitigation potential of renewable
energy.
- 2 -
1 A WARMING WORLD
1.1 Temperatures in 2011
The year 2011 would probably be remembered by the public as a rather cold year in
Hong Kong as we experienced two La Niña events in the same year, one near the start of the
year while the other near the end. Previous studies show that La Niña is usually associated
with cold weather in Hong Kong during the winter months [18]. We also experienced the
coldest January since 1977 with 14 cold days, doubling the normal figure of 7. December
2011 was also cold with a mean temperature almost 1℃ below normal. Although the
average temperature of 2011 in Hong Kong was slightly below normal with reference to the
30-year (1981-2010) climatology, an examination of Hong Kong's annual temperatures in La
Niña years (Fig. 1) reveals that the temperature has been on a rising trend in the recent
decades.
In March 2012, the World Meteorological Organization (WMO) released its
statement on the status of the global climate in 2011 [37], announcing that 2011 ranks as the
world's 11th warmest year in records dating back to 1880. The 10-year average temperature
for 2002-2011 equals that for 2001-2010 as the warmest 10-year period on record. The
global climate was influenced by La Niña, which has a cooling effect through heat exchange
between the atmosphere and the cooler-than-normal equatorial Pacific ocean. Yet, global
temperatures in 2011 were warmer than any previous moderate/strong La Niña year (Fig. 2).
1.2 Undeniable evidence of global warming
Temperature data around the world are collected and disseminated by the national
meteorological services of WMO members and collaborating research institutions. These
data feed three main global climate data and analysis centres, which develop and maintain
homogeneous global climate datasets based on peer-reviewed methodologies. The WMO
global temperature analysis is principally based on these three complementary datasets.
One dataset is the combined dataset in the UK maintained jointly by the Hadley Centre of the
Met Office and the Climatic Research Unit, University of East Anglia. The other two datasets
are maintained in the US: at the National Oceanic and Atmospheric Administration (NOAA)
and the Goddard Institute of Space Studies (GISS) of the National Aeronautics and Space
Administration (NASA) respectively. As shown in Fig. 3, these three datasets clearly show
the long-term increasing trend of global temperatures in the last century especially in the
recent decades.
In October 2011, a team of independent scientists including Saul Perlmutter, the
winner of the 2011 Nobel Prize in Physics, statisticians, physicists and climatologists,
published on the Internet the results of an independent study entitled "Berkeley Earth Surface
Temperature" [3]. The aim of the study was to resolve criticism of temperature analyses
raised by climate change skeptics. The investigators of the study examined 1.6 billion
temperature records from 39,000 stations, more than five times of the stations considered in
previous climate studies. To merge existing surface station temperature datasets into a new
comprehensive dataset, the investigators developed new and more advanced statistical
algorithms to process the temperature data, taking nearly all available data into account, with
due consideration given to data quality, instead of simply dropping short and discontinuous
data records. What they found was a rise in the average world land surface temperature of
approximately 1℃ since the mid-1950s. This finding agrees very well with the previous

- 3 -
studies of the three global centres mentioned above (Fig. 3). The Berkeley study also
concluded that the urban heat island effect does not contribute significantly to the average
land surface temperature rise because urban regions of the Earth only amount to less than 1%
of the land area. The comprehensive dataset and statistical algorithms resulted from the
study are all open to public scrutiny (http://berkeleyearth.org/).
It is well known that El Niño/Southern Oscillation (ENSO) can affect atmospheric
temperatures by exchanging ocean heat content with the atmosphere; aerosols from volcanic
eruption can reduce sunlight reaching the ground and therefore lowering the temperature [12];
and variation in solar activity can also affect the global temperature. Foster and Rahmstorf
[7] recently analyzed five datesets of global temperatures for the period 1979-2010: three
surface temperature datasets from NASA's GISS, NOAA and the Hadley Centre, and two
lower troposphere temperature datasets based on satellite observations, and identified the
impact of ENSO, volcanic aerosols and solar activity on the surface and lower troposphere
temperature by statistical methods. With the effects of ENSO, volcanic activity and solar
variability removed, they found a clear and consistent warming signal in the five adjusted
datasets (Fig. 4), without any cessation or slowing down in warming in the last decade.
The summer sea ice melting season in the Arctic normally ends in September.
According to the US National Snow and Ice Data Center (NSIDC), the Arctic sea ice extent
in September 2011 reached the second lowest on record since measurements began in 1979
[24]. The lowest extent was recorded in 2007, when both the atmospheric and oceanic
conditions were favourable for melting of Arctic sea ice. The continuing trend of decreasing
extent is obvious in Fig. 5, indicating the continuation of our warming climate. Fig. 6a and
6b show the satellite-derived image of Arctic perennial ice (ice that has survived at least one
summer) in 1980 and 2012 respectively. It is evident that the perennial ice has declined
significantly in the last 30 years. Moreover, the multi-year ice (i.e. thicker and older ice) is
diminishing at a rate of -15.1 percent per decade, faster that the younger and thinner ice at the
edges of the Arctic Ocean's floating ice cap [23].
2 IMPACTS OF A WARMING CLIMATE
2.1 Extreme weather events
In a changing climate, a relatively small shift in the climatic distribution can result
in substantial changes in the frequency of extreme events [13]. Over the last 50 years, there
were widespread changes in extreme temperatures and precipitation around the world. In
many places, hot days/nights and heat waves as well as heavy rain have become more
frequent, and cold days/nights have become rarer [1, 9, 14, 32, 36]. The Special Report on
Managing the Risks of Extreme Events and Disasters to Advance Climate Change Adaptation
(SREX) released in late March 2012 by the IPCC [16] and post-AR4 studies have reaffirmed
the assessments made in the IPCC AR4 about the general trend towards more warm extremes
and precipitation extremes, the general trend towards less cold extremes, and the
anthropogenic influence in these observed changes. A recent study shows that the
anomalously warm summers of 2003 in western and central Europe and of 2010 in eastern
Europe and Russia broke the 500-year long seasonal temperature record over 50% of Europe.
Using simulations from global climate models, Zwiers et al. [38] detected both anthropogenic
influence and the combined influence of anthropogenic and natural forcing in temperature
extremes at the global scale over land area (Fig. 7). Hansen et al. [11] investigated the
systematic shift of seasonal temperature distribution towards the warm side and the change in

- 4 -
probability of unusually warm seasons in recent decades. They highlighted the emergence
and importance of the "3-sigma" (i.e. 3 standard deviations) warmer-than-climatology
extremely hot events in recent summers. Consistent with a warming climate, the probability
of these "3-sigma" events increased significantly in recent decades (Fig. 8). The global land
area covered by these "3-sigma" events in recent summers was more than 10 times several
decades ago. Examples of these "3-sigma" extremely hot events include the heat waves in
Texas and Oklahoma in 2011 and in Moscow in 2010. Rahmstorf et al. [28] also
investigated the role of a warming climate in the 2010 Moscow heat wave and concluded that
there was a probability of 80% that the July 2010 high temperature record was due to climate
warming.
Nevertheless, not every region in the world exhibits temperature trend fully
consistent with the overall behaviour. In recent years, cold winters were experienced in
some parts of the northern continents. Scientific understanding of such phenomenon has
recently advanced. Liu et al. [21] found that a warming Arctic with diminishing sea ice – a
clear manifestation of global warming – can cause more occurrences of blocking patterns in
the atmospheric circulation over the Northern Hemisphere. In winter, these blocking
patterns will lead to more cold air outbreaks from the Arctic to mid-latitudes, thus bringing
cold conditions to the affected areas. These findings reconcile with the study of Cohen et al.
[5] which showed that in the past decades the extratropics of the Northern Hemisphere
experienced significant warming trends for all seasons except winter, even though the overall
annual trend was for a rising temperature. These findings are also corroborated by the
results of Francis and Vavrus [8] which reveal that the warming Arctic with decreasing sea ice
has played an important role in affecting the large-scale atmospheric circulation to favour the
occurrence of persistent weather patterns, which are usually associated with weather extremes
such as cold spells and heat waves.
Observed changes in precipitation extremes were less spatially coherent and
statistically significant compared with observed changes in temperature extremes.
Post-AR4 studies with more regional results have updated the assessments of AR4. Overall
speaking, more locations show an increase rather than a decrease in extreme precipitation,
although there are wide regional and seasonal variations. A recent example in extreme
precipitation is the heavy downpour in Seoul in July 2011, in which more than 300 mm of
rainfall was received in a single day, the highest since 1907 [37]. New research since the
AR4 has provided more evidence of anthropogenic influence on various aspects of the global
hydrological cycle relevant to extreme precipitation changes.
Post-AR4 studies have used more simulations of global climate models to
investigate extreme temperature and rainfall projections for the 21st century in terms of
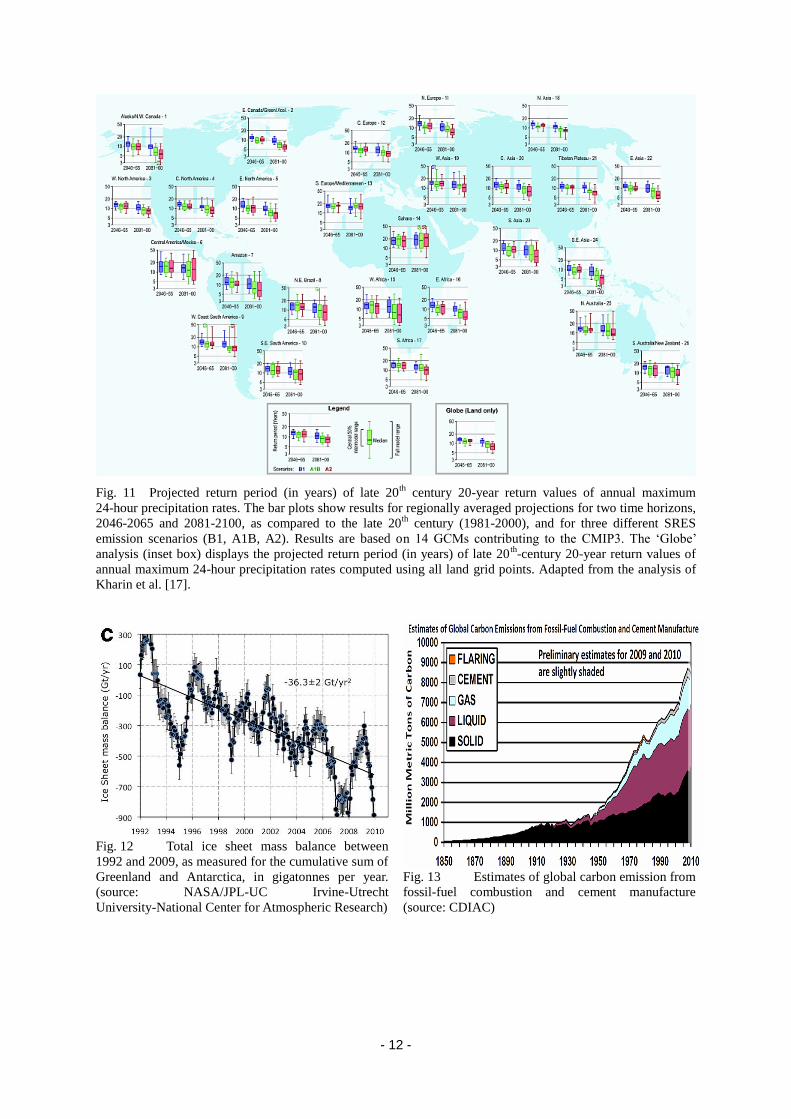
various extreme indices, return value and return period. Fig. 9, adapted from Orlowsky and
Seneviratne [25], shows a projected annual and seasonal changes in three indices for daily
maximum temperature for 2081-2100 with respect to 1980-1999. It depicts an increasing (a
decreasing) trend of warm (cold) index towards the end of the current century. Kharin et al.
[17] projected the return period of late 20th
-century 20-year return values of the annual
maximum of the daily maximum temperature (Fig. 10). Under certain greenhouse gas
emission scenarios, a 1-in-20 year extremely hot day event in the late 20th
century is likely to
become a 1-in-2 to 1-in-5 year event by the end of the 21st century. Meanwhile, a 1-in-20
year extreme daily rainfall event is likely to become a 1-in-5 or 1-in-15 year event in many
regions of the world (Fig. 11). A decrease in return period implies more frequent
occurrences of the extreme event.

- 5 -
Here in Hong Kong, studies of past occurrences of extreme temperature and rainfall
events have also found that cold episodes have become rarer while very hot days and heavy
rain events are becoming more frequent over the past 120 years or so [33]. The
corresponding return periods of heavy rain and very hot days are decreasing while that of
very cold days is increasing. The trends in temperature extremes that have been observed
during the 20th
century are expected to continue into the 21st century with a significant
increase in the number of very hot days and a significant decrease in the number of cold days
[19]. The rainfall in Hong Kong in the 21st century may become more variable and extreme.
The number of rain days is expected to decrease while the daily rainfall intensity and the
number of days with extreme rainfall will increase [20].
2.2 Sea level rise
The World Glacier Monitoring Service (WGMS) and its predecessor organizations
have been compiling and disseminating standardized data on glacier fluctuations for more
than a century. The Glacier Mass Balance Bulletin No. 11 (2008-2009) [34] published by
WGMS in late 2011 confirmed the total disappearance of the Chacaltaya glacier in Bolivia,
which was previously predicted to last until 2015 [2]. Melting of glaciers should be
expected in a warming world. In order to produce long-term statistics for analysis, the
WGMS monitors a set of 37 reference glaciers in ten mountain ranges continuously for the
period 1980-2009. Its statistics show that the 37 glaciers, on average, are losing more and
more weight during the 30-year period. When mountain glaciers melt, part of the water will
flow to the oceans.
Earlier in 2011, a NASA-funded satellite study [22] revealed that the Greenland
and Antarctic ice sheets are losing mass at an accelerating pace (Fig. 12), three times faster
than that of mountain glaciers and ice caps. The study compared two independent
measurement techniques to track the ice mass on Greenland and Antarctica, and found the
two techniques in good agreement, both for total amount and rate of mass loss, over the
period from 1992 to 2009. It also found that the Greenland and Antarctic ice sheets lost a
combined mass of 475 gigatonnes a year on average, which can raise the global sea level by
an average of 1.3 millimeters a year. Melting of mountain glacier and ice sheets on
Greenland and Antarctica, together with thermal expansion of water will cause the sea level
to rise. The IPCC AR4 estimated that global sea level rise relative to the 1980-1999 average
could reach 0.59 m in the late 21st century. Some recent research studies found that future
sea level rise may be higher than the IPCC AR4 projection [27, 29]. According to the
SREX [16], it is very likely that mean sea level rise will contribute to upward trends of
extreme coastal high water levels in future.
3 CURRENT SITUATION OF CO2 EMISSION AND CONCENTRATION
Greenhouse gases (GHG) trap the incoming solar radiation within the Earth’s
atmosphere, causing it to warm. The WMO, through its Global Atmosphere Watch
Programme, coordinates the observations of GHG in the atmosphere through a network of
stations located in more than 50 countries. According to the WMO's Greenhouse Gas
Bulletin released in late 2011 [35], the amount of GHG in the atmosphere had reached a new
high in 2010 since pre-industrial time. CO2 is the single most important man-made GHG in
the atmosphere and contributes about 64% to the total increase in climate forcing by GHG.
Since the start of the industrial era in 1750, its atmospheric abundance has increased by 39%
- 6 -
to 389 parts per million (number of molecules of the gas per million molecules of dry air) in
2010. This is also believed to be the highest atmospheric CO2 concentration in the past
800,000 years as revealed by ice coring studies in Antarctica [26].
Increase in anthropogenic CO2 emission is primarily due to combustion of fossil
fuels, deforestation and changes in land-use. According to the preliminary estimates made
by the US Carbon Dioxide Information Analysis Center (CDIAC), 2010 saw a record high
global CO2 emissions from fossil fuel combustion and cement manufacture [4]. The 2010
figure exceeded the previous record made in 2008 (Fig. 13). The slight drop in 2009 is
believed to be due to the global financial and economic crisis that started in 2008 [10].
4 FUTURE CHALLENGES
Since the United Nations Framework Convention on Climate Change (UNFCCC)
entered into force in 1995, the Conference of the Parties (COP) to the UNFCCC has been
meeting annually to assess progress in dealing with climate change. The 17th
Conference of
the Parties (COP17) was held in Durban, South Africa late last year. The outcomes of
COP17 included a decision by the Parties to adopt a universal legal agreement on climate
change as soon as possible, no later than 2015, and to have it implemented from 2020. We
will have to wait a few more years, hopefully, before a global agreement on CO2 emission is
reached. Yet, even if the Parties would agree to implement a very stringent restriction on
CO2 emission or even to manage to halt CO2 emission, the CO2 already in the atmosphere
will continue to linger around for many decades to come.
4.1 Renewable energy
As combustion of fossil fuel is a major source of GHG emission, renewable energy
naturally becomes a potential substitute for fossil-fuel-based energy if reduction of GHG
emission is to be achieved. The IPCC Working Group III has recently released the Special
Report on Renewable Energy Sources and Climate Change Mitigation (SRREN) [15]. The
SRREN provides an assessment and thorough analysis of renewable energy technologies and
their current and potential roles in the mitigation of GHG emissions. Based on an extensive
assessment of scientific literature, the SRREN indicates that renewable energy has a large
potential to mitigate GHG emissions.
In countries like Germany, renewable energy deployment has already been put into
practice in daily lives. According to a recent media report [39], there are already eight
million people in Germany totally relying on renewable energy and a total of 74 "green"
cities and villages. These figures are expected to further increase. For example, China has
pledged to reduce CO2 emissions per unit of GDP by 40 to 45 percent by 2020 compared to
2005 levels and the increasing use of renewable energy. According to the United Nations
Environment Programme (UNEP) [31], China invested in 2010 US$48.9 billion (+28% from
2009) in renewable energy and has become the world leader. Similar increases in other
Asian developing countries were also reported (India: +25%; others excluding China and
India: +31%).
4.2 What can we do as an individual?
In Hong Kong, GHG emission per capita was 6 tonnes of CO2-e in 2008 [6],
against the world average of about 5 tonnes of CO2 per capita [30]. To combat climate
- 7 -
change and global warming, we believe every individual has his/her share of responsibility to
reduce the carbon footprint of Hong Kong. The Observatory will continue its research on
climate change and will engage the community, stakeholders and other users of climate
services to provide the best available and reliable scientific information to support their
decision-making in mitigating the effects of climate change. We will also sustain our active
public education activities to promote the public's awareness on global and local climate
change. We have produced an educational package on climate change which can be used in
classroom teaching. We have organized a speaker team on climate change to conduct talks
for schools and organizations. The climate change FAQs on our website
(http://www.hko.gov.hk/climate_change/climate_change_e.htm) are regularly updated with
new entries and there is a collection of blog articles on climate change authored by
Observatory’s colleagues. Just recently, we have released an online climate quiz which
helps promote climate science. Participants will learn more about climate and climate
change while having fun. All in all, everyone will have a part to play and to work together
in combating climate change and in pursuing greener living. The Observatory will continue
to be a proactive, supportive and credible partner to work with everybody to make a
difference.

- 8 -
Fig. 1 Annual temperature (℃) of Hong Kong in La
Niña years
Fig. 2 Annual global temperature anomaly, La Niña in
blue, others in red. (source: WMO)
Fig. 3 Annual land-surface average temperature
(source: Berkeley Earth Surface Temperature)
Fig. 4 Temperature data of 1979-2010 with influences
from ENSO, volcanoes and solar variation removed
(source: Foster and Rahmstorf [7])
Fig. 5 Average monthly Arctic sea ice extent of September 1979-2011
(source: National Snow and Ice Data Center, University of Colorado)

- 9 -
Fig. 6a Perennial Arctic sea ice in 1980 (source:
NASA)
Fig. 6b Perennial Arctic sea ice in 2012 (source:
NASA)
Fig. 7 Estimated return periods (years) and their 5% and 95% uncertainty limits for 1960s 20-year return values
of annual extreme daily temperatures in the 1990s climate. ANT refers to model simulated responses with only
anthropogenic forcing and ALL is both natural and anthropogenic forcing. Error bars are for annual minimum
daily minimum temperature (red: TNn), annual minimum daily maximum temperature (green: TXn), annual
maximum daily minimum temperature (blue: TNx), and annual maximum daily maximum temperature (pink:
TXx), respectively. Grey areas have insufficient data. Source: Zwiers et al. [38].

- 10 -
Fig. 8 Frequency of occurrence of local temperature anomalies in units of the local standard deviation.
Anomalies are relative to the 1951-1980 base period. (Source: Hansen et al. [11])
Fig. 9 Projected annual and seasonal changes in three indices for daily Tmax for 2081-2100 with respect to
1980-1999, based on 14 GCMs contributing to the CMIP3. Left column: fraction of warm days (days in which
Tmax exceeds the 90th percentile of that day of the year, calculated from the 1961-1990 reference period);
middle column: fraction of cold days (days in which Tmax is lower than the 10th percentile of that day of the
year, calculated from the 1961-1990 reference period); right column: percentage of days with Tmax >30°C. The
changes are computed for the annual time scale (top row) and two seasons (December-January-February, DJF,
middle row, and June-July-August, JJA, bottom row) as the fractions/percentages in the 2081-2100 period
(based on simulations for emission scenario SRES A2) minus the fractions/percentages of the 1980-1999 period
(from corresponding simulations for the 20th century). Warm day and cold day changes are expressed in units of
standard deviations, derived from detrended per year annual or seasonal estimates, respectively, from the three
20-year periods 1980-1999, 2046-2065, and 2081-2100 pooled together. Tmax >30°C changes are given directly
as differences in percentage points. Color shading is only applied for areas where at least 66% (i.e., 10 out of 14)
of the GCMs agree on the sign of the change; stippling is applied for regions where at least 90% (i.e.,13 out of
14) of the GCMs agree on the sign of the change. Adapted from Orlowsky and Seneviratne [25].

- 11 -
Fig. 10 Projected return period (in years) of late 20th-century 20-year return values of the annual maximum of
the daily maximum temperature. The bar plots show results for regionally averaged projections for two time
horizons, 2046-2065 and 2081-2100, as compared to the late 20th century (1981-2000), and for three different
SRES emission scenarios (B1, A1B, A2). Results are based on 12 GCMs contributing to the CMIP3. The
‘Globe’ analysis (inset box) displays the projected return period (in years) of late 20th-century 20-year return
values of the annual maximum of the daily maximum temperature computed using all land grid points. Adapted
from the analysis of Kharin et al. [17].
- 12 -
Fig. 11 Projected return period (in years) of late 20
th century 20-year return values of annual maximum
24-hour precipitation rates. The bar plots show results for regionally averaged projections for two time horizons,
2046-2065 and 2081-2100, as compared to the late 20th
century (1981-2000), and for three different SRES
emission scenarios (B1, A1B, A2). Results are based on 14 GCMs contributing to the CMIP3. The ‘Globe’
analysis (inset box) displays the projected return period (in years) of late 20th
-century 20-year return values of
annual maximum 24-hour precipitation rates computed using all land grid points. Adapted from the analysis of
Kharin et al. [17].
Fig. 12 Total ice sheet mass balance between
1992 and 2009, as measured for the cumulative sum of
Greenland and Antarctica, in gigatonnes per year.
(source: NASA/JPL-UC Irvine-Utrecht
University-National Center for Atmospheric Research)
Fig. 13 Estimates of global carbon emission from
fossil-fuel combustion and cement manufacture
(source: CDIAC)

- 13 -
References:
[1] Alexander, L.V., X. Zhang, T.C. Peterson, J. Caesar, B. Gleason, A.M.G. Klein Tank, M. Haylock, D.
Collins, B. Trewin, F. Rahimzadeh, A. Tagipour,,K. Rupa Kumar, J. Revadekar, G. Griffiths, L. Vincent,
D.B. Stephenson, J. Burn, E. Aguilar, M. Brunet, M. Taylor, M. New, P. Zhai, M. Rusticucci and J.L.
Vazquez-Aguirre, 2006: Global observed changes in daily climate extremes of temperature and
precipitation, J. Geophys. Res., 111, doi:10.1029/2005JD006290.
[2] BBC: http://news.bbc.co.uk/2/hi/americas/6496429.stm
[3] Berkeley Earth Surface Temperature, http://berkeleyearth.org/
[4] CDIAC: Record High 2010 Global Carbon Dioxide Emissions from Fossil-Fuel Combustion and Cement
Manufacture Posted on CDIAC Site, http://cdiac.ornl.gov/trends/emis/perlim_2009_2010_estimates.html.
[5] Cohen, J. L., J. C. Furtado, M. Barlow, V. A. Alexeev, and J. E. Cherry (2012), Asymmetric seasonal
temperature trends, Geophys. Res. Lett., 39, L04705, doi:10.1029/2011GL050582.
[6] Environment Bureau, HKSAR Government, 2010:Hong Kong's Climate Change Strategy and Action
Agenda - Consultation Document,
http://www.epd.gov.hk/epd/english/climate_change/files/Climate_Change_Booklet_E.pdf
[7] Foster G., S. Rahmstorf, 2011: Global Temperature Evolution 1979-2010, Environmental Research Letters
6 (October-December 2011) 044022, online at http://iopscience.iop.org/1748-9326/6/4/044022/
[8] Francis, J. A. and S. J. Vavrus (2012), Evidence linking Arctic amplification to extreme weather in
mid-latitudes, Geophys. Res. Lett., 39, L06801, doi:10.1029/2012GL051000.
[9] Frich, P., L.V. Alexander, P. Della-Marta, B. Gleason, M. Haylock, A.M.G. Klein Tank, and T. Peterson,
2002: Observed coherent changes in climate extremes during the second half of the twentieth century.
Climate Res., 19, 193-212.
[10] Friedlingstein P., R.A. Houghton, G. Marland, J. Hacker, T.A. Boden, et al. 2010. Update on CO2
emissions. Nature Geoscience. 3 811-812, doi 10-1038/ngeo1022.
[11] Hansen, J., M. Sato, R. Ruedy, 2012: Public Perceptions of Climate Change and the New Climate Dice,
submitted to the Proceedings of the National Academy of Sciences, http://arxiv.org/abs/1204.1286
[12] Hong Kong Observatory: Volcanoes, Weather and Climate, Hong Kong Observatory Blog,
http://www.hko.gov.hk/blog/en/archives/00000107.htm
[13] Houghton, J.T., 2009: Global warming: the complete briefing. Cambridge University Press, Cambridge,
UK, 438pp.
[14] IPCC, 2007: Climate Change 2007: The Physical Science Basis. Contribution of Working Group I to the
Fourth Assessment Report of the Intergovernmental Panel on Climate Change [Solomon, S., D. Qin, M.
Manning, Z. Chen, M. Marquis, K. B. Averyt, M. Tignor and H. L. Miller (eds.)]. Cambridge University
Press, Cambridge, United Kingdom and New York, NY, USA.
[15] IPCC, 2011: IPCC Special Report on Renewable Energy Sources and Climate Change Mitigation.
Prepared by Working Group III of the Intergovernmental Panel on Climate Change [O. Edenhofer, R.
Pichs-Madruga, Y. Sokona, K. Seyboth, P. Matschoss, S. Kadner, T. Zwickel, P. Eickemeier, G. Hansen, S.
Schlömer, C. von Stechow (eds)]. Cambridge University Press, Cambridge, United Kingdom and New
York, NY, USA, 1075 pp.
[16] IPCC, 2012: Managing the Risks of Extreme Events and Disasters to Advance Climate Change Adaptation.
A Special Report of Working Groups I and II of the Intergovernmental Panel on Climate Change [Field,
C.B., V. Barros, T.F. Stocker, D. Qin, D.J. Dokken, K.L. Ebi, M.D. Mastrandrea, K.J. Mach, G.-K. Plattner,
S.K. Allen, M. Tignor, and P.M. Midgley (eds.)]. Cambridge University Press, Cambridge, UK, and New
York, NY, USA, 582 pp.

- 14 -
[17] Kharin, V., F.W. Zwiers, X. Zhang, and G.C. Hegerl, 2007: Changes in temperature and precipitation
extremes in the IPCC ensemble of global coupled model simulations. Journal of Climate, 20(8),
1419-1444.
[18] Lee S. M., Y. L. Cheng, 2011: An Examination of ENSO's Effect on the Monthly and Seasonal Climate of
Hong Kong from a Statistical Perspective, ACTA Meteorologica Sinica, Vol.25(1) , p34-50, HKO Reprint
No. 928.
[19] Lee T.C., K.Y. Chan and E.W.L. Ginn, 2011: Projections for extreme temperatures in Hong Kong in the
21st Century, Acta Meteorologica Sinica, 25(1):1-20.
[20] Lee T.C., K.Y. Chan, H.S. Chan and M.H. Kok, 2011: Projections for Extreme Rainfall in Hong Kong in
the 21st Century, Acta Meteorologica Sinica 25(6): 691-709.
[21] Liu J., Judith A. Curry, Huijun Wang, Mirong Song, and Radley M. Horton, 2012: Impact of declining
Arctic sea ice on winter snowfall, PNAS 2012 : 1114910109v1-6.
[22] NASA, 2011: News & Features, Jet Propulsion Laboratory, NASA,
http://www.jpl.nasa.gov/news/news.cfm?release=2011-070
[23] NASA, 2012: News & Features, http://www.nasa.gov/topics/earth/features/thick-melt.html
[24] NSIDC, 2011: Arctic Sea Ice News & Analysis, National Snow and Ice Data Center, University of
Colorado, http://nsidc.org/arcticseaicenews/2011/100411.html
[25] Orlowsky, B. and S.I. Seneviratne, 2011: Global changes in extremes events: Regional and seasonal
dimension. Climatic Change, doi:10.1007/s10584-011-0122-9.
[26] Parrenin, F., Barnola, J.-M., Beer, J., Blunier, T., Castellano, E., Chappellaz, J., Dreyfus, G., Fischer, H.,
Fujita, S., Jouzel, J., Kawamura, K., Lemieux-Dudon, B., Loulergue, L., Masson-Delmotte, V., Narcisi, B.,
Petit, J.-R., Raisbeck, G., Raynaud, D., Ruth, U., Schwander, J., Severi, M., Spahni, R., Steffensen, J. P.,
Svensson, A., Udisti, R., Waelbroeck, C., and Wolff, E.: The EDC3 chronology for the EPICA Dome C ice
core, Clim. Past, 3, 485-497, doi:10.5194/cp-3-485-2007, 2007.
[27] Rahmstorf S., A new view on sea level rise: nature reports climate change, doi:10.1038/climate.2010.29
[28] Rahmstorf, S. and Coumou, D., 2011: Increase of extreme events in a warming world. Proc. Natl. Acad.
Sci., 108, 17905-17909.
[29] Rignot, E., I. Velicogna, M. R. van den Broeke, A. Monaghan, and J. Lenaerts (2011), Acceleration of the
contribution of the Greenland and Antarctic ice sheets to sea level rise, Geophys. Res. Lett., 38, L05503,
doi:10.1029/2011GL046583.
[30] The World Bank: http://data.worldbank.org/indicator/EN.ATM.CO2E.PC/countries/1W?display=graph
[31] UNEP, 2011: http://www.unep.org/newscentre/default.aspx?DocumentID=2647&ArticleID=8805
[32] Wang, Y. and L. Zhou, 2005: Observed trends in extreme precipitation events in China during 1961––2001
and the associated changes in large-scale circulation, Geophys. Res. Lett., 32, L0970
[33] Wong, M. C., H. Y. Mok and T.C. Lee, 2010: Observed changes in extreme weather indices in Hong Kong,
International Journal of Climatology, October 2010.
[34] World Glacier Monitoring Service: Glacier Mass Balance Bulletin No. 11 (2008-2009,)
http://www.geo.uzh.ch/microsite/wgms/gmbb.html
[35] World Meteorological Organization, 2011: Greenhouse Gas Concentrations Continue Climbing,
http://www.wmo.int/pages/mediacentre/press_releases/pr_934_en.html

- 15 -
[36] World Meteorological Organization, 2011: Weather extremes in a changing climate: hindsight on foresight,
WMO-No. 1075.
[37] World Meteorological Organization, 2011: WMO statement on the status of the global climate in 2011,
http://www.wmo.int/pages/prog/wcp/wcdmp/documents/1085_en.pdf.
[38] Zwiers, F.W., X. Zhang, and Y. Feng, 2011: Anthropogenic influence on long return period daily
temperature extremes at regional scales. Journal of Climate, 24(3), 881-892.
[39] 陳 美 慧 , 2012: 走 訪 德 國 百 分 百 綠 能 小 鎮 , 亞 洲 週 刋 ,
http://www.yzzk.com/cfm/Content_Archive.cfm?Channel=bk&Path=3135034291/07bk.cfm


![[PPT]DD FORM 1149 - Under Secretary of Defense for · Web viewWhen to use the DD Form 1149 Use the DD 1149 only when shipments are being routed through the sea port (SPOD) at Norfolk,](https://static.documents.pub/doc/80x56/5aa514a77f8b9a517d8cc7d5/pptdd-form-1149-under-secretary-of-defense-for-viewwhen-to-use-the-dd-form.jpg)


