DOCUMENT RESUME
ED 469 243 TM 034 465
AUTHOR Wightman, Linda F.
TITLE Analysis of LSAT Performance and Patterns of Application forMale and Female Law School Applicants. LSAC Research ReportSeries.
INSTITUTION Law School Admission Council, Newtown, PA.REPORT NO LSAC-RR-94-02PUB DATE 1994-12-00
NOTE 67p.
PUB TYPE Numerical/Quantitative Data (110) Reports Research (143)EDRS PRICE EDRS Price MF01/PC03 Plus Postage.DESCRIPTORS *College Applicants; College Entrance Examinations; Grade
Point average; Higher Education; *Law Schools; *SexDifferences; *Test Results; Undergraduate Students
IDENTIFIERS *Law School Admission Test
ABSTRACT
This study investigated differences in performance on the LawSchool Admission Test (LSAT) and subsequent applications and admissiondecisions separately for men and women. Data were drawn from the 1990-1991law school applicant pool, a total of 83,336 applicants, who generated417,103 applications at 178 law schools. The undergraduate grade pointaverage data presented in this study are consistent with hundreds of studiesthat report that women earn higher grades than men at both the high schooland undergraduate levels. Data do not support a need for concern that femaletest takers are differentially selecting themselves out of the applicantpool. Nor do data support concerns about negative social consequencesresulting from women's slightly lower LSAT scores. An appendix showsundergraduate majors of the sample. (Contains 11 figures, 26 tables, and 16references.) (SLD)
Reproductions supplied by EDRS are the best that can be madefrom the original document.
LSAC RESEARCH REPORT SERIES
PERMISSION TO REPRODUCE ANDDISSEMINATE THIS MATERIAL HAS
BEEN GRANTED BY
J. VASELECK
TO THE EDUCATIONAL RESOURCESINFORMATION CENTER (ERIC)
1
U.S. DEPARTMENT OF EDUCATIONOffice of Educational Research and Improvement
EDUCATIONAL RESOURCES INFORMATIONCENTER (ERIC)
his document has been reproduced asreceived from the person or organizationoriginating it.
Minor changes have been made toimprove reproduction quality.
Points' f view or opinions stated in thisdocument do not necessarily representofficial OERI position or policy.
I J
Analysis of LSAT Performance andPatterns of Application for Male andFemale Law School Applicants
Linda F. Wightman
Law School Admission CouncilResearch Report 94-02December 1994
BEST COPY AVAILABLE
LAW. 7.;z-rrrta:=
A Publication of the Law School Admission Council
2
The Law School Admission Council is a nonprofit corporation whosemembers are United States and Canadian law schools that provideservices to the legal education community.
LSAT® and the Law Services logo are registered by the Law SchoolAdmission Council, Inc. Law School Forum is a service mark of theLaw School Admission Council, Inc. The Official LSAT Prep Test;LSAT: The Official Triple Prep; LSAT: The Official Triple Prep Plus;and The Whole Law School Package are trademarks of Law SchoolAdmission Council, Inc.
Copyright© 1995 by Law School Admission Council, Inc.
All rights reserved. This book may not be reproduced or transmitted,in whole or in part. by any means, electronic or mechanical, includingphotocopying, recording, or by any information storage and retrievalsystem, without permission of the publisher. For information, write:Communications, Law School Admission Council, Box 40, 661 PennStreet, Newtown, PA 18940-0040.
This study is published and distributed by the Law School AdmissionCouncil (LSAC). The opinions and conclusions contained in thisreport are those of the author and do not necessarily reflect theposition or policy of the Law School Admission Council.
3
Contents
LIST OF TABLES ii
LIST OF FIGURES iv
INTRODUCTION 1
METHODS 6Description of the Sample 6Test Performance Data 7Law School Application Data 9Law School Admission Data 9
RESULTS AND DISCUSSION 12Test Performance Data 12Law School Application Data 32Law School Admission Data 47
SUMMARY AND CONCLUSIONS 54
REFERENCES 59
APPENDIX 60
Tables ii
Table 1 Standardized Mean Score Difference Between Men and Women in SelectedAdmission Testing Programs 4
Table 2 LSAT Score Distribution by Gender for 1989-90 and 1990-91 Test Takers 13
Table 3 LSAT Score Distribution by Gender for 1990-91 Law School Applicants 16
Table 4 Mean LSAT Scores and Score Differences for Men and Women Applicants atSelected Percentile Ranks 18
Table 5 Distribution of 1990-91 Law School Applicants on SelectedDemographic Variables 19
Table 6 LSAT Means and Standard Deviations for 1990-91 Applicants byAge Group and Gender 22
Table 7 UGPA Means and Standard Deviations for 1990-91 Applicants byAge Group and Gender 23
Table 8 LSAT Means and Standard Deviations for 1990-91 Applicants byEthnic Group and Gender 25
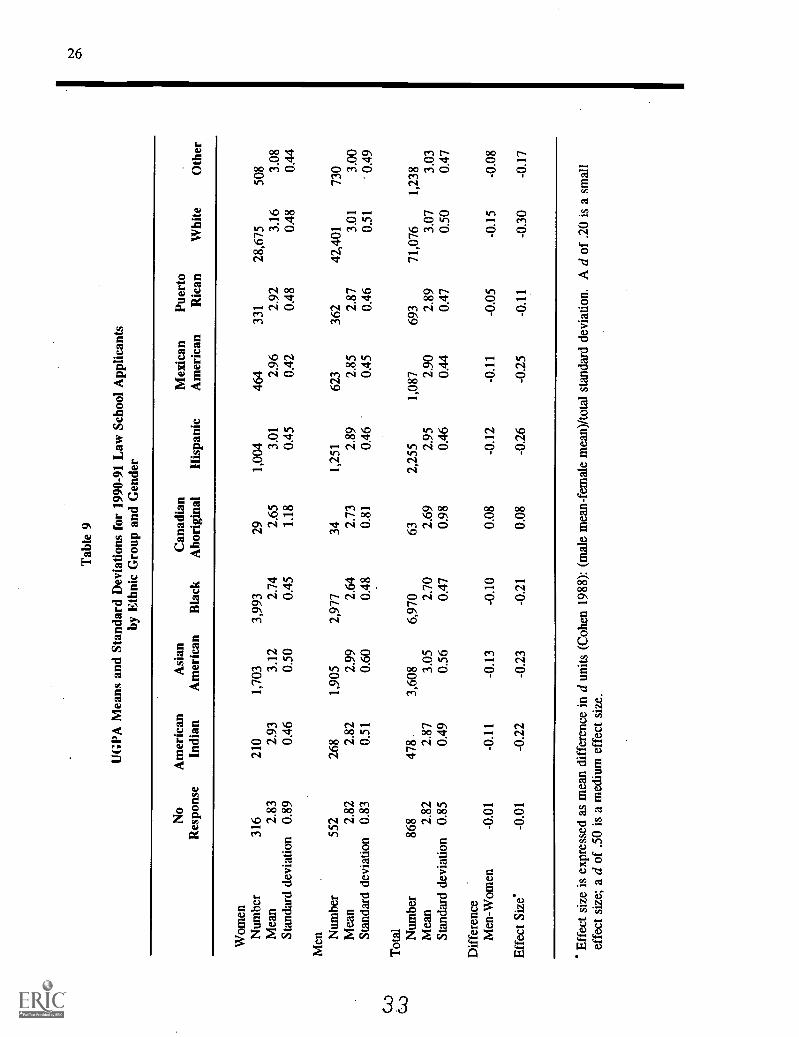
Table 9 UGPA Means and Standard Deviations for 1990-91 Law SchoolApplicants by Ethnic Group and Gender 26
Table 10 LSAT Means and Standard Deviations for 1990-91 Law School Applicantsby Undergraduate Major and Gender 28
Table 11 UGPA Means and Standard Deviations for 1990-91 Law School Applicantsby Undergraduate Major and Gender 29
Table 12 Adjusted Mean LSAT Score Differences Between Men and WomenFrom Adding Selected Main Effect Demographic Variables to a MultipleRegression Model 31
Table 13 Contribution to Adjustment of LSAT Gender Differences byIndividual Variables 32
Table 14 Mean Difference in LSAT Score and UGPA Between Male andFemale Applicants to the Same U. S. Law Schools 33
Table 15 Distributions of 1990-91 LSAT Scores for Male and Female ApplicantsWithin Law Schools Grouped by Mean Scores of Accepted Applicants 39
Table 16 Value of Applicant's LSAT Minus School's Mean LSAT for AcceptedStudents by LSAT Score Group and Gender 40
Table 17 Mean of Applicant's LSAT Minus School's Mean LSAT for AcceptedStudents by Number of Applications, LSAT Score Group, and Gender 41
Tables iii
Table 18 Distributions of 1990-91 UGPAs for Male and Female Applicantsfor Law Schools Grouped by Mean UGPAs of Accepted Applicants 42
Table 19 Value of Applicant's UGPA Minus School's Mean UGPA for AcceptedStudents by UGPA Score Group and Gender 43
Table 20 Mean of Applicant's UGPA Minus School's Mean UGPA for AcceptedStudents by Number of Applications, UGPA Score Group, and Gender 44
Table 21 Correlation Between Number of Applications and LSAT Score by Gender 45
Table 22 1990-91 Male and Female Applicants Accepted by at Least One Law School 48
Table 23 Correlations of Admission Decisions with Predicted Admission,LSAT, and UGPA by Gender 49
Table 24 Predicted Versus Actual Admission Rates by Gender for the1990-91 Admission Year 50
Table 25 Predicted Versus Actual Admission Rates by Gender and Ethnicityfor the 1990-91 Admission Year 51
Table 26 Predicted Versus Actual Admission Rates for Female Applicantsby Ethnicity and School Control 1990-91 Admission Year 53
Figures iv
Figure la Distribution of LSAT Scores by Gender 1989-90 Test Takers 14
Figure lb Distribution of LSAT Scores by Gender 1990-91 Test Takers 14
Figure 2 Distribution of LSAT Score by Gender All 1990-91 Applicants 17
Figure 3 Cumulative Frequency Distribution of LSAT Scores for Male andFemale Applicants 17
Figure 4 Male-Female LSAT for Applicants by Within School MeanLSAT for Accepted 35
Figure 5 Male-Female UGPA for Applicants by Within School MeanLSAT for Accepted 36
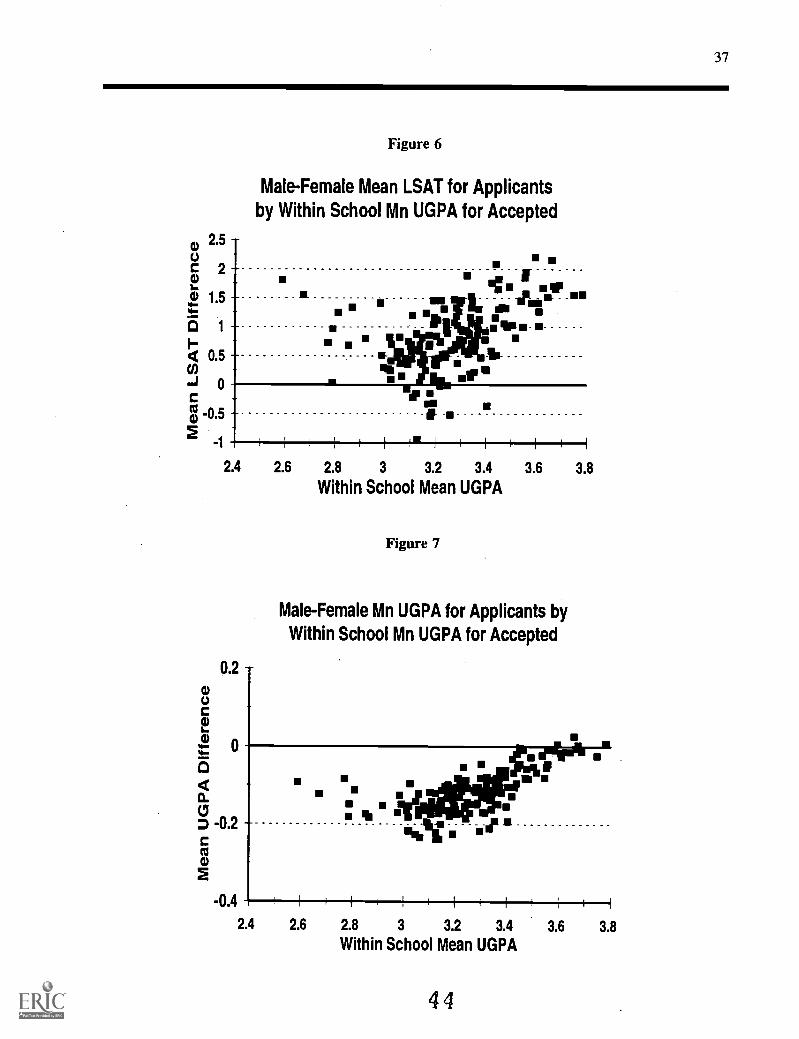
Figure 6 Male-Female Mean LSAT for Applicants by Within School MeanUGPA for Accepted 37
Figure 7 Male-Female Mean UGPA for Applicants by Within School MeanUGPA for Accepted 37
Figure 8 Distribution of Number of Schools to Which Males and Females Apply 45
Figure 9 Ratio of Male and Female Applicants/Total Accepted by Mean LSATfor Accepted 47
Figure 10 Predicted and Actual Admission Rates by Gender and Ethnic Subgroup 52
Figure 11 Predicted and Actual Admission Rates for Women by Ethnicity andSchool Control 53
ANALYSIS OF LSAT PERFORMANCE AND PATTERNS OF APPLICATIONFOR MALE AND FEMALE LAW SCHOOL APPLICANTS
INTRODUCTION
In recent years, virtually all higher education admission testing programs have reported small but
consistent differences favoring men's over women's scores on multiple-choice tests of verbal reasoning
ability. Unlike the more substantial differences in quantitative performance that have been reported for
many years, typically, differences in verbal scores tend to be neither large nor of apparent practical
significance. Nevertheless, the consistency of these differences both within and across different testing
programs demands that the phenomenon be understood to the extent possible. More importantly, little is
known about the impact of even slightly lower scores earned by women on their subsequent decisions
about applying to and attending college, graduate school, or professional school.
With regard to the latter point, the research literature supporting differential tendencies toward risk-taking
behaviors between men and women suggests that women's response to the lower admission test scores,
in terms of patterns of application, deserves special study. A series of studies about gender differences
in risk taking tended to find greater evidence of risk taking among boys than among girls (e.g., Kass,
1964; McManis & Bell, 1968; Slovic. 1966). More recently, Ben- Shakhar and Sinai (1991) considered
the theory of higher risk-taking tendency among males as an explanation for differential guessing behavior
between men and women. In support of their hypothesis of differential guessing as a consequence of a
differential personality dimension of risk taking. the authors found evidence of differential guessing among
high school and college students even on tests where students explicitly were advised to guess. The
support in the literature for lesser risk taking among women raises the question of whether even slightly
lower test scores among female Law School Admission Test (LSAT) takers might either (1) discourage
8
2
lower-scoring women from applying to college, graduate school, or professional school at all or (2)
discourage women from applying to the better or more competitive schools.
One purpose of this study is to investigate differences between men and women in performance on the
LSAT. A second purpose is to investigate the possible social consequences of the slightly lower scores
earned by women. More specifically, the uniqueness of the database maintained by the Law School
Admission Council allows the investigation to be extended beyond differences in test performance to
explore what role, if any, these slightly lower test scores earned by women might play in their subsequent
law school application processes and decisions. The phenomena that precipitated this investigation
include:
o a small but persistent difference in performance on the LSAT between men and women,
o continued underrepresentation of women in professional schools, and
o documented disparities between test performance and academic achievement at the
undergraduate level.
The LSAT is a half-day standardized test required for admission to most U.S. and Canadian law schools.
It consists of four 35-minute sections of multiple-choice questions designed to measure skills considered
essential for success in law school. The three item types included in the LSAT are reading
comprehension, logical reasoning, and analytical reasoning. The average LSAT score for women is
approximately one scaled score point below the average score for men on the 120-180 LSAT scale that
has been in use since June 1991, and .8 scaled score point on the 10-48 LSAT scale used between June
1982 and February 1991. It is the persistence rather than the magnitude of these differences that warrants
investigation. A compelling cause for concern is the consistency of the LSAT findings with the disparity
9
3
found in other paper and pencil multiple-choice admission tests that measure the same kinds of skills.
Men traditionally have scored higher than women on the SAT-M. but recent trends show men now scoring
higher on both sections of the SAT (Burton, Lewis, & Robertson, 1988). Burton et al. reported a change
from equal scores for men and women on the SAT verbal test in 1975 to a 12-point disparity in favor of
men in 1985. Looking, only at college bound seniors, an 8- to 10-point verbal score difference persists
in the 1990 through 1992 data. Quantitative score differences are considerably larger for these
populations. GRE verbal score differences are much smaller, ranging from a 1.4-score point advantage
for women in 1989-90 to a 1.6-point advantage for men in 1991-92. As is the case for SAT quantitative
scores, the male-female differences for GRE quantitative scores are considerably larger in favor of males.
The GRE analytical score differences show an 11- to 13-point advantage for men during the same time
period. The analytical reasoning (AR) difference is particularly relevant to the LSAT investigation
because the AR test contains item types that are parallel to the logical reasoning and analytical reasoning
items that make up approximately 75 percent of the LSAT. The GMAT also reports total score mean
scores for men that exceed those of women by 19 to 27 points across the period 1986-87 through 1990-91
(Graduate Management Admission Council, 1992). The GMAT total score is a combination of 70 verbal
items and 65 quantitative items. Most of the total score difference is attributable to differences in
performance on the quantitative sections. The Medical College Admission Test (MCAT) reports higher
test scores for men in the physical science and biological science scores, but virtually identical scores for
verbal reasoning.
In absolute terms, the differences between men and women seem to be substantially larger for these other
testing programs than they are for the LSAT. However, the different testing programs report scores on
a variety of different score scales. A more meaningful way to compare the differences is first to convert
them to standard deviation units. The data in Table 1 show male-female differences in standard deviation
units for the admission tests previously discussed. These data suggest that the male-female differences
found in the LSAT are approximately equal to those found in the GRE Analytical and the SAT Verbal
1 0
4
measures and larger than the differences found in the GRE Verbal, GMAT Verbal, and the MCAT Verbal
Reasoning measures.
Table 1
Standardized Mean Score Difference Between Men and Womenin Selected Admission Testing Programs
(Men Minus Women)
Testing Program
Year
1989-90 1990-91 1991-92
LSAT Total 0.14 0.09 0.13
SAT Verbal 0.09 0.07 0.08Quantitative 0.36 0.36 0.35
GRE Verbal -0.01 0.01 0.01Quantitative 0.66 0.68 0.66Analytical 0.11 0.08 0.09
MCAT Biology 0.28 0.33 NAPhysical Science 0.43 0.43 NAVerbal Reasoning 0.00 0.04 NA
GMAT Total 0.26 0.26 0.28Verbal 0.02 0.02 NAQuantitative 0.43 0.42 NA
As noted previously, one reason to be concerned about these differences is their consistency; another is
that women continue to be underrepresented in professional schools. Although 53 percent of the
bachelor's degrees conferred in 1989-90 were awarded to women, only 39 percent of the professional
degrees conferred in 1992 were awarded to women. Consistent with the pattern found among all
professional degrees, 42.7 percent of the J.D./LL.B degrees conferred in 1992 by ABA-approved schools
were awarded to women (ABA, Section of Legal Education, 1993.) These figures are inconsistent with
expectations based on the reported 4.6 percent of women compared with 4.1 percent of men from the fall
11
5
1991 entering college freshmen who identify LL.B or J.D. as the highest degree they plan to obtain (The
Chronicle of Higher Education Almanac, 1992). That is, female aspirants are somehow beimg lost along
the way.
This study will focus on the 1991 law school applicants and will begin to address questions related to the
above general observations. More specifically,
o Are the differences in LSAT scores between male and female test takers also evidenced
in the pool of applicants in a given application year?
o Are the differences between test scores earned by men and women still observed when
men and women are matched on certain demographic and educational characteristics
(e.g., age, ethnicity, undergraduate major)?
o Do lower scoring women disproportionately remove themselves from the applicant pool?
o What role do test scores play in the law school application and selection process? That
is:
(1) Is gender a significant variable in a model of the probability of admission to
a particular school'? What happens when background variables such as ethnicity
are taken into account?
(2) Are women applying to lesser quality law schools as a consequence of lower
test scores?
12
6
This report provides two distinct areas of comparison between male and female law school applicants.
First, the two standard quantifiable variables that are considered in most admission processesLSAT
score and undergraduate grade point average (UGPA)are examined to better understand the magnitude
and nature of the differences. In this regard, not only are score distributions studied, but differences are
reexamined in the context of the demographic breakdowns within a gender group. Second. information
about law school applications and admission decisions is provided, including development of a model of
the probability of women gaining admission to a particular law school. The results from these probability
calculations are compared with the actual admission rates for male and female applicants to the same
schools.
METHODS
Description of the Sample
The data reported in this study were drawn from the 1990-91 law school applicant pool. More
specifically, the data represent applicants and applications to 173 U. S. American Bar Association (ABA) -
approved law schools plus five Canadian law schools that provide application and decision data to the Law
School Admission Council. The Law School Admission Council maintains a database that includes not
only the standard application credentials (LSAT score and UGPA) and demographic variables, but also
information about which test takers applied to law school, where they applied, and what admission
decision was made by each school. Only applicants who completed their application to at least one law
school and for whom an admission decision was reported by the law school are included. Those 2,551
applicants who did not report gender on their application for the LSAT nor on the application for the Law
School Data Assembly Service (LSDAS) are not included in the analyses, leaving 88,336 applicants in
13
7
the study sample. The 88,336 applicants included in these analyses generated 417.103 applications to the
178 studied law schools.
Test Performance Data
This portion of the study presents data about LSAT scores and undergraduate GPAs for men and women,
taking into account other demographic differences between these two groups. First, the distributions of
LSAT scores for male and female law school applicants were compared with the distributions by gender
of scores for all 1989-90 and 1990-91 test takers.
Approximately 22 percent of law school applicants took the LSAT more than one time. For those
applicants who tested multiple times, their test scores are averaged in all the analyses reported in this
study.
The 1989-90 and 1990-91 testing years produced the test scores for the vast majority of 1990-91
applicants. The data allowed comparison of differences in performance between male and female test
takers and between male and female applicants. They also allowed evaluation of the presence of
differential self selection into the applicant pool. Next, the applicant distributions were compared one to
the other at selected centile points across the scaled score range to determine whether there is any
interaction between gender and ability level. Some recent work with scores on the Iowa Tests of Basic
Skills (Han & Hoover, 1994) demonstrated that, although on average males scored only slightly higher
than females on math, social studies, and science measures, at the means (1) males outperformed females
at the upper achievement levels considerably more than at the median and below, and (2) females were
slightly better than males at low percentile rank levels. Centile rank comparisons were made to determine
whether similar patterns could be found among law school applicants.
14
8
Finally, demographic variables were examined to determine whether some of the observed difference in
performance on the LSAT could be accounted for by differences in the demographic makeup of the two
groups. Three variables were studied: age, ethnicity, and undergraduate major area. These variables were
selected because each was hypothesized to be related to LSAT score and to be distributed differently for
males than for females. There is some support in the literature for the proposition that these three
variables also are related to each other. For example, black and Hispanic students tend to be relatively
overrepresented in social science majors and underrepresented in humanities and physical science majors
(Brown, 1987). Additionally, the proportions of black, American Indian, and Hispanic high school
graduates who delay entry to postsecondary institutions or stop out for some period tend to exceed the
proportions for white students (National Center for Educational Statistics, 1985). These data are consistent
with law school data showing that law students from these ethnic groups tend to be older than white
students.
Ordinary least squares multiple linear regression was used to estimate the impact of each of the three
variables on the observed LSAT score difference.' The goal was to determine whether some of the
differences that are observed between male and female test takers would be adjusted by taking account
of these variables. To attempt to address this issue, gender plus one or more of the demographic variables
served as the independent variables and LSAT score served as the dependent variable in a least squares
multiple regression model. The adjustments were made singly and then in combination. To aid in the
interpretation of the results, gender was coded -1 for females and 1 for males in each model. The
consequence of this dummy coding is that two times the unstandardized regression weight for gender is
the adjusted mean difference between men and women on the dependent variable. Interactions among the
demographic variables were included in the models for some preliminary analyses, but the resulting
multiple Rs were essentially unchanged so analysis models including interactions were not pursued.
15
9
Law School Application Data
This section of the study provides information about law school applications and acceptances separately
for male and female applicants. One purpose of this part of the investigation was to determine whether
men and women demonstrate different patterns of applying to law school. The primary variables used to
study these patterns for male and female applicants were LSAT scores and undergraduate grade point
averages (UGPAs). Both are important factors in admission decisions for most law schools and for the
purpose of these analyses are the only universally used quantifiable variables. Additionally, both of these
measures have been validated for use in the admission process at all law schools included in this study.
The number of applications submitted and selected characteristics of the law schools also were considered
in the analyses included in this study. More specifically, differences between male and female applicants
in LSAT score and UGPA were examined between and within law schools. The number of applications
generated by men and women and the application credentials of the applicants relative to the credentials
of the accepted students at the schools of application also were studied.
Law School Admission Data
A second purpose of the study of law school application and admission data was to determine whether
applicants with similar application credentials have a differential probability of gaining acceptance to law
school if they are women than if they are men. If differences exist between the proportion predicted to
be accepted and the proportion actually accepted, it would suggest that law schools use different standards
in reaching admission decisions for women than for men. These analyses are germane to evaluating
concerns about potential gender bias, either conscious or unconscious, in the admission process, in contrast
to the previous analyses that focus on the application decisions made by women themselves.
16
10
The methodology adopted to evaluate differential probability is logistic regression. Separate regression
models were estimated for each law school. First, a logistic regression model was used to determine the
probability of admission to a particular law school for a male applicant with a given LSAT score and
undergraduate grade point average. The next step was to determine whether a female applicant with the
same LSAT score and undergraduate grade point average had the same probability of admission.
The probability-of-admission model was produced for each law school using a binary-response model
logistic-regression procedure. That is, the response variable only was allowed to take on one of two
possible valuesaccepted or not accepted. For the data analyzed in this study, Y = 1 if the applicant is
accepted and Y = 2 if the applicant is not accepted. The linear logistic model has the form
logit(p) = log(p/(1-p)) = a + 13'x
where, for the model specific to this study,
x is a vector of LSAT scores and UGPAs
p is the probability that the applicant is accepted given his or her LSAT score and UGPA
(Pr(Y = 11x))
a is the intercept parameter
is the vector of slope parameters
Using the logit estimate produced by the logistic model described above, the probability of each individual
applicant being accepted is calculated as follows:
eiosito,) / (1 elogio))
The analysis of data for male and female law school applicants followed a model used by Willingham
(1988) to evaluate admission decisions for undergraduate school applicants with disabilities. First, the
group of female applicants is identified within each law school. Next, the likelihood that each female
17
11
applicant will be admitted to law school is estimated using the logistic function calculated for the law
school being studied. The logistic regression weights were obtained using data from male applicants to
that school. Finally, the likelihood estimates are summed to obtain the proportion of female applicants
who would be expected to be admitted based exclusively on LSAT scores and undergraduate grade point
averages. This estimated proportion is compared with the proportion of female applicants who, in fact,
were admitted. The statistic of primary interest is the residual selection rate. The residual selection rate
is calculated by subtracting the proportion actually admitted from the proportion expected to be admitted.
If the residual is a negative number, the percentage actually admitted exceeds the percentage expected to
be admitted. Conversely, if fewer female applicants are admitted than would be projected based on their
LSAT scores and undergraduate grade point averages, the residual selection rate will be positive.
The probability models for male applicants were developed using data from 1991-92 applicants for whom
LSAT scores, UGPAs, and final admission decisions were available. Decision data were provided by law
schools as part of the LSAS decision entry process. The LSAT scores and undergraduate grade point
averages were obtained from the Law Services' LSDAS applicant tiles. The undergraduate grade point
average is computed either by the LSDAS or according to LSDAS procedures, following the computing
options selected from the undergraduate school the student attended. Grades computed in this manner are
expressed on a scale of 0.00 to 4.33. The UGPA used in this part of the study is the same as the UGPA
reported to the law school by Law Services for each applicant. LSAT scores for the 1990-91 application
year all were reported on the 10-48 LSAT score scale.
Applicants to a law school who withdrew their applications prior to an admission decision were eliminated
from the analyses, as were those with law school decisions of "other." All other applicant decisions were
recoded to either accepted or not accepted.
18
12
In addition to working with admission data summed across all law schools, data were examined within
law schools that are similar in control. More specifically, schools were identified as public or private, and
residuals were examined for public schools compared with private schools both across and within gender
and ethnic group.
RESULTS AND DISCUSSION
Test Performance Data
The distribution of LSAT scores is shown separately for men and for women for the 1989-90 and the
1990-91 testing years in Table 2. These data include all test takers, and each test taker is represented one
time only within the testing year. The average score is used for men and women who tested at more than
one administration. The data in this table show that the distribution is fairly consistent across the two
years. It also shows that the percent below is larger for women than for men at every score point across
the score range. The proportions of male and female test takers at each scaled score point are shown
separately for 1989-90 and 1990-91 test takers in Figures la and lb, respectively. These figures illustrate
that a slightly larger proportion of women than men score in the lower range of the scale and a slightly
larger proportion of men than women score in the upper range. The shapes of the curves and the relative
position of male and female test takers are essentially the same across the two years.
19
13
Table 2
LSAT Score Distribution by Gender for 1989-90 and 1990-91 Test Takers
LSAT1989-90
Men Women
Percent Below1990-91
Men Women
48 99.0 99.4 99.4 99.647 98.2 98.8 98.6 99.146 96.9 97.9 97.8 98.645 95.7 97.1 96.5 97.744 93.7 95.5 94.9 96.443 91.5 93.7 93.3 95.142 89.1 91.8 90.5 92.541 85.7 88.8 87.5 90.140 81.9 85.5 84.1 86.739 78.0 82.0 80.1 83.038 74.8 79.1 76.3 79.537 70.0 74.7 71.4 74.936 65.3 70.4 66.7 70.335 60.6 65.9 61.8 65.534 55.5 60.9 56.9 60.533 50.4 56.1 50.9 54.432 45.6 51.4 46.1 49.431 40.7 46.5 41.3 44.530 36.3 41.6 36.7 39.929 32.4 37.5 32.0 34.928 28.4 33.2 27.1 30.127 24.9 29.4 23.1 25.926 21.1 25.1 19.8 22.225 18.1 21.8 16.8 18.924 15.3 18.6 14.4 16.123 13.4 16.5 11.9 13.622 11.2 13.9 9.8 11.121 9.5 11.7 8.0 9.020 7.8 9.6 6.5 7.219 6.5 8.1 5.2 5.718 5.4 6.6 4.2 4.517 4.3 5.1 3.2 3.416 3.5 4.1 2.6 2.615 2.8 3.3 1.9 1.914 2.2 2.5 1.5 1.513 1.7 1.9 1.2 1.112 1.3 1.4 0.8 0.711 1.0 1.0 0.7 0.610 0.0 0.0 0.0 0.0
Number 62,304 47,926 67,968 52,734Mean 31.78 30.69 31.76 31.09Standard deviation 8.08 8.07 7.59 7.47
20
-I- Male Female I
-I- Male Female I
14
2 0.08a)2
0.06tr;
*86 0.04
0It 0.020a.20. o
Figure la
Distribution of LSAT Scores by Gender1989-90 Test Takers
0.08
2ca
0.06
a)
0.04
0E. 0.02Oo.0
o
10 12 14 16 18 20 22 24 26 28 30 32 34 36 38 40 42 44 46 48LSAT Score
Figure lb
Distribution of LSAT Scores by Gender1990-91 Test Takers
10 12 14 16 18 20 22 24 26 28 30 32 34 36 38 40 42 44 46 48
LSAT Score
21
15
Table 3 shows the LSAT score distributions separately for men and women who became law school
applicants during the 1990-91 application year. The first comparison of interest is between male and
female applicants. The data in Table 3 show that the mean LSAT score difference between men and
women is about the same (.12 in standard score units) as the difference between men and women who
took the test in 1989-90 or in 1990-91 (.14 and .09 in standard score units). The second comparison of
interest is between test takers and applicants, that is, between Table 2 and Table 3. One question of
interest is whether women selected themselves out of the application process differentially from the
selection exercised by men. The data in Tables 2 and 3 fail to support that hypothesis. Although the
LSAT mean for applicants is larger than the mean for all test takers, the difference between male test
takers and male applicants is slightly larger than the difference between female applicants and female test
takers (1.7 for males compared with 1.25 for females.) The proportion of male and female law school
applicants at each LSAT score point is shown in Figure 2. The relative position of male and female
applicants is essentially identical to the positions observed for test takers. For both male and female
applicants, the curves are shifted to the right, reflecting the increased means in both male and female
applicant scores relative to the test taker groups. The cumulative distribution reported in Table 3 is
illustrated in Figure 3.
22
16
Table 3
LSAT Score Distribution by Gender for 1990-91 Law School Applicants
LSATPercent Below
Men Women
48 99.0 99.447 98.0 98.746 96.8 97.845 95.2 96.644 93.0 94.943 90.8 93.042 87.2 89.941 83.3 86.540 78.9 82.239 74.1 77.838 69.6 73.537 64.1 68.236 58.6 62.935 52.9 57.334 47.3 51.633 41.2 45.432 36.0 40.131 31.1 35.030 26.5 30.329 22.3 25.928 18.3 21.827 15.1 18.326 12.4 15.225 10.2 12.724 8.4 10.423 6.8 8.522 5.4 6.721 4.2 5.320 3.3 4.119 2.5 3.318 2.0 2.517 1.4 1.916 1.1 1.415 0.8 1.014 0.6 0.713 0.4 0.512 0.2 0.311 0.2 0.210 0.0 0.0
Number 51,103 37,233Mean 33.60 32.78Standard deviation 6.99 7.04
17
to 0.08
co
0.06o.a.4is 0.04
0E 0.020a.2a. 0
co
Figure 2
Distribution of LSAT Score by GenderAll 1990-91 Applicants
10 12 14 16 18 20 22 24 26 28 30 32 34 36 38 40 42 44 46 48
LSAT Score
a.Q
0.750
0
o 0.5
0.0
a.cu 0.25
zE o
40- Female Male
Figure 3
Cumulative Frequency Distribution of
LSAT Scores for Male & Female Apps.
10 20 30
LSAT Score
-+- Male Female
24
40 50.
18
An important consideration is whether the mean difference between male and female applicants masks an
interaction between ability and differential performance between men and women. The data in Table 4
show the mean LSAT score for men and women at selected percentile points representing the high,
middle, and low ability levels of the distribution. These data clearly confirm that the slight differential
performance favoring men on the LSAT is consistent throughout the score range. The differences between
men and women at the 90th and 95th percentiles are nearly identical to the difference observed at the
middle of the distribution (i.e., 50th percentile.) The largest differences are observed at the very bottom
of the distribution, but the difference between the largest difference, observed at the 10th percentile and
the smallest difference, observed at the 90th percentile is less than five hundredths of a standard deviation
unit. These results are inconsistent with those reported by Han and Hoover (1994.) One explanation may
be the self-selection of the students who elect to become law school applicants. Another may be the age
difference between the subjects in the two studies. That is, whatever development lags are reflected in
the Han and Hoover data may be closed by the time students graduate from college and select themselves
into the competitive professional school admission process.
Table 4
Mean LSAT Scores and Score Differences for Menand Women Applicants at Selected Percentile Ranks
Mean LSAT Difference
Centile Rank Men Women Raw SD Units
c10 24.376 23.300 1.076 0.152c25 29.141 28.292 0.850 0.120c50 33.963 33.239 0.724 0.102c75 38.659 37.850 0.809 0.114c90 42.233 41.540 0.693 0.098c95 44.330 43.578 0.752 0.106
25
19
Demographic Distribution Data
The distributions of male and female applicants by age group, gender, and undergraduate major are shown
in Table 5. The data are shown both as raw numbers and percentages. The x2 for each of the distributions
is statistically significant. However, the number of applicants is so large that determinations of statistical
significance between male and female distributions are not meaningful. An estimation of effect size
provides more useful information. Table 5 shows the difference between the percentage distributions for
each of the three demographic variables in w units (Cohen, 1988). As a rule of thumb. a w of .10 is
considered a small effect and a w of .30 is considered a medium effect. Only the ethnic group and major
group distributions show small effect sizes.
Table 5
Distribution of 1990-91 Law School Applicants on Selected Demographic Variables
NumberMen
NumberWomen
PercentageMen
PercentageWomen Difference'
Age GroupLT23 18,620 15,595 36.44 41.88 0.0623-25 6,298 3,966 12.32 10.6526-29 11,124 6,910 21.77 18.5630PLUS 15,061 10,762 29.47 28.90
EthnicNo Response 552 316 1.08 0.85 0.10American Indian 268 210 0.52 0.56Asian American 1,905 1,703 3.73 4.57Black 2,977 3,993 5.83 10.72Canadian Aboriginal 34 29 0.07 0.08.Hispanic 1,251 1,004 2.45 2.70Mexican American 623 464 1.22 1.25Other 730 508 1.43 1.36Puerto Rican 362 331 0.71 0.89White 42,401 28,675 82.97 77.02
MajorsBusiness 14,436 6,793 28.25 18.27 0.20Computer Science 372 173 0.73 0.46Engineering 2,690 461 5.27 1.23Health Professions 397 978 0.79 2.65Humanities 7,804 9,391 14.09 23.05Natural Sciences 2,359 1,379 4.64 3.71Social Sciences 21,450 16,753 42.95 46.98Other 431 390 0.86 1.07Missine 1,164 915 2.39 2.58
*The difference between the percentage distributions is in w units (Cohen, 1988): x27/ .
A w of .10 is a small effect; w of .30 is a medium effect.
26
20
Age Group Distributions. The number of male applicants is larger than the number of female applicants
in each of the four age groups. Looking between gender groups, the percentage of women who are
younger than 23 years old is somewhat larger (41.88 versus 36.44) than the percentage of men in that age
group. In contrast, the percentage of male applicants and the percentage of female applicants who are 30
years old or older are nearly identical. Despite the differences in the proportion of applicants who are
younger than 23 years old, examination of the effect size for the gender by age group distributions
confirms that overall there is essentially no meaningful difference between male and female applicants in
their age group distributions.
Ethnic Group Distributions. In all ethnic groups except blacks, the number of male applicants is larger
than the number of female applicants. The number of female black applicants exceeds the number of male
black applicants by more than 1000. Looking between gender groups, the percentage of female applicants
who are members of an ethnic minority group exceeds the percentage of male applicants in every named
group. The most striking difference is between female black applicants, who make up 10.72 percent of
the female applicant pool, and male black applicants, who make up only 5.83 percent of the male applicant
pool. Only about 1 percent each of the male and female applicants declined to report the ethnic group
to which they belong. The nonresponse rate is very small and is not likely to bias analyses and data
interpretation for ethnic groups.
The number of male and female applicants who identified themselves as Canadian Aboriginal is very small
(34 and 29, respectively). Because analyses using these small numbers are likely to be unstable, this
ethnic group is not included in the regression analyses. Means and standard deviations of LSAT scores
and UGPAs are reported because the numbers represent the entire population of Canadian Aboriginal
applicants to schools included in this study.
Undergraduate Major Group Distributions. The large variety of undergraduate majors reported by law
school applicants was collapsed into eight categories. The specific majors that comprise each category
are listed in the Appendix.
27
21
The number of male applicants exceeds the number of female applicants in every undergraduate major
category except health professions and humanities. A relatively small percentage of both female and male
applicants comes from health professions majors, while humanities is the second largest major category
for female applicants. Social science is the largest major category for both male and female applicants.
but a slightly larger proportion of women than men reported a social science major. When comparing the
percentage distributions, the largest effect size is observed for the distribution by majors (w = .20), but
even this effect size is not quite large enough to be considered a medium effect.
Test Performance and UGPAs
Age Group Performance. Tables 6 and 7 present LSAT and UGPA means and standard deviations for
1990-91 law school applicants by gender and age group. The data in Table 6 show that male applicants
earn higher LSAT scores than female applicants across each of the age groups. The largest difference is
found between the youngest applicants, and the smallest between the oldest. Again, an effect size is
included to assist in interpretation. Effect size is shown in d units (Cohen, 1988), where d is the male
mean minus the female mean divided by the standard deviation for the total group. A d of .20 usually
is considered to be a small effect size and a d of .50 a medium effect size. Even the largest difference
is not quite large enough to be considered a small effect. Again, it is the consistency rather than the
magnitude of the differences that is striking. For both male applicants and female applicants, the highest
average LSAT scores are earned by the youngest applicants and the lowest are earned by the oldest. The
standard deviations are slightly larger for women than for men in all age groups except the 30 Plus Group.
For both males and females, the standard deviation is smallest for the youngest applicants and largest for
those who are 30 and over.
28
22
Table 6
LSAT Means and Standard Deviations for 1990-91 Applicantsby Age Group and Gender
LT23 23-25 26-29 30 PLUS
WomenNumberMeanStandard deviation
Men
15,59533.856.66
3,96633.20
7.00
6,91032.69
7.09
10,76231.15
7.27
Number 18,620 6,298 11,124 15,061Mean 35.00 33.89 33.60 31.76Standard deviation 6.52 6.74 6.72 7.43
TotalNumber 34,215 10,264 18,034 25,823Mean 34.47 33.62 33.25 31.51Standard deviation 6.60 6.84 6.88 7.37
DifferenceMen-Women 1.15 0.69 0.91 0.61
Effect Size" 0.18 0.11 0.14 0.09
Effect size is expressed as mean difference in d units (Cohen, 1988): (male mean-female mean)/total standarddeviation. A d of .20 is a small effect size; a d of .50 is a medium effect size.
29
23
Table 7
UGPA Means and Standard Deviations for 1990-91 Applicantsby Age Group and Gender
LT23 23-25 26-29 30 PLUS
WomenNumberMeanStandard Deviation
Men
15,5953.220.46
3,9663.060.50
6,9102.990.51
10,7623.000.52
Number 18,620 6,298 11,124 15,061Mean 3.15 2.96 2.89 2.83Standard Deviation 0.46 0.50 0.51 0.54
TotalNumber 34,215 10,264 18,034 25,823Mean 3.18 3.00 2.93 2.91Standard Deviation 0.46 0.50 0.52 0.54
DifferenceMen-Women -0.07 -0.10 -0.10 -0.17
Effect Size' -0.15 -0.20 -0.19 -0.31
Effect size is expressed as mean difference in d units (Cohen. 1988): (female mean-male mean)/total standarddeviation. A d of .20 is a small effect size: a d of .50 is a medium effect size.
24
In contrast to Table 6, the data in Table 7 show that female applicants earn higher UGPAs than male
applicants across all age categories. The effect size is larger for UGPA differences than for LSAT
differences. For both the 23-25 age group and the 30 Plus age group, d meets or exceeds the value of
a small effect size. Consistent with the findings for LSAT scores, the highest UGPAs both for male
applicants and for female applicants are found among the youngest age group. Male applicants show the
same linear trend for mean UGPAs across age groups as was found for LSAT score. UGPAs for women
are more consistent with each other across the other age groups. The standard deviations are quite similar
between men and women, and again are smallest for the youngest applicants and largest for those who
are 30 and over.
Ethnic Group Performance. Tables 8 and 9 show LSAT score and UGPA means and standard deviations
by gender and ethnic group. The LSAT score difference is positive, indicating that men earned higher
LSAT scores than women, for every ethnic group except Asian Americans. A positive difference also is
observed for those men and women who failed to report ethnicity.
31
Tab
le 8
LSA
T M
eans
and
Sta
ndar
d D
evia
tions
for
199
0-91
App
lican
tsby
Eth
nic
Gro
up a
nd G
ende
r
No
Am
eric
anA
sian
Can
adia
nM
exic
anPu
erto
Res
pons
eIn
dian
Am
eric
anB
lack
Abo
rigi
nal
His
pani
cA
mer
ican
Ric
anW
hite
Oth
er
Wom
enN
umbe
r31
621
01,
703
3,99
329
1,00
446
433
128
,675
508
Mea
n32
.64
29.5
833
.25
24.8
431
.79
29.7
629
.55
25.0
434
.16
31.5
6St
anda
rd d
evia
tion
8.03
7.20
6.98
6.78
6.16
7.20
7.12
8.29
6.14
7.46
Men N
umbe
r55
226
81,
905
2,97
734
1,25
162
336
242
,401
730
Mea
n34
.61
30.8
433
.19
25.1
432
.24
30.3
029
.73
27.1
234
.45
32.3
1St
anda
rd d
evia
tion
7.37
7.05
7.56
7.43
6.86
7.22
7.25
8.62
6.37
8.00
Tot
alC
CN
umbe
r86
847
83,
608
6,97
063
2,25
51,
087
693
71,0
7612
38tO
Mea
n33
.89
30.2
933
.22
24.9
732
.03
30.0
629
.65
26.1
234
.33
32.0
0St
anda
rd d
evia
tion
7.67
7.14
7.29
7.06
6.50
7.21
7.19
8.53
6.28
7.79
Dif
fere
nce
Men
-Wom
en1.
971.
26-0
.06
0.30
0.45
0.54
0.18
2.08
0.29
0.75
Eff
ect S
ize.
0.26
0.18
-0.0
10.
040.
070.
070.
030.
240.
050.
10
Eff
ect s
ize
is e
xpre
ssed
as
mea
n di
ffer
ence
in d
uni
ts (
Coh
en 1
988)
: (m
ale
mea
n-fe
mal
e m
ean)
/tota
l sta
ndar
d de
viat
ion.
A d
of
.20
is a
sm
all e
ffec
t siz
e;a
d of
.50
is a
med
ium
eff
ect s
ize.
Tab
le 9
UG
PA M
eans
and
Sta
ndar
d D
evia
tions
for
199
0-91
Law
Sch
ool A
pplic
ants
by E
thni
c G
roup
and
Gen
der
No
Am
eric
anA
sian
Can
adia
nM
exic
anPu
erto
Res
pons
eIn
dian
Am
eric
anB
lack
Abo
rigi
nal
His
pani
cA
mer
ican
Ric
anW
hite
Oth
er
Wom
enN
umbe
rM
ean
Stan
dard
dev
iatio
n
316 2.
830.
89
210 2.
930.
46
1,70
3 3.12
0.50
3,99
3 2.74
0.45
29 2.65
1.18
1,00
4 3.01
0.45
464 2.
960.
42
331 2.
920.
48
28,6
75 3.16
0.48
508 3.
080.
44
Men N
umbe
r55
226
81,
905
2,97
734
1,25
162
336
242
,401
730
Mea
n2.
822.
822.
992.
642.
732.
892.
852.
873.
013.
00St
anda
rd d
evia
tion
0.83
0.51
0.60
0.48
0.81
0.46
0.45
0.46
0.51
- 0.
49
Tot
al Num
ber
868
478
3,60
86,
970
632,
255
1,08
769
371
,076
1,23
8M
ean
2.82
2.87
3.05
2.70
2.69
2.95
2.90
2.89
3.07
3.03
Stan
dard
dev
iatio
n0.
850.
490.
560.
470.
980.
460.
440.
470.
500.
47
Dif
fere
nce
Men
-Wom
en-0
.01
-0.1
1-0
.13
-0.1
00.
08-0
.12
-0.1
1-0
.05
-0.1
5-0
.08
Eff
ect S
ize'
-0.0
1-0
.22
-0.2
3-0
.21
0.08
-0.2
6-0
.25
-0.1
1-0
.30
-0.1
7
Eff
ect s
ize
is e
xpre
ssed
as
mea
n di
ffer
ence
ind
units
(C
ohen
198
8): (
mal
e m
ean-
fem
ale
mea
n) /t
otal
sta
ndar
d de
viat
ion.
Ad
of .2
0 is
a s
mal
lef
fect
siz
e; a
dof
.50
is a
med
ium
eff
ect s
ize.
/7
The largest LSAT difference between male and female applicants is observed for Puerto Rican applicants
and the smallest difference for Asian American applicants. Among the named ethnic groups, only the
difference for Puerto Rican applicants is large enough to constitute a small effect size. The data reported
for the Puerto Rican group in Tables 8 and 9 represent only applicants to U. S. mainland law schools.
Data from Spanish-speaking Puerto Rican law schools are not included in the study. For both men and
women, the smallest standard deviation is found for white applicants and the largest for Puerto Rican
applicants.
Again, the pattern for UGPA data is quite different. The data in Table 9 show that women earned higher
UGPAs than men in every group except Canadian Aboriginal. Additionally, the effect sizes for UGPA
differences are larger than the effect sizes for LSAT differences for each ethnic group except Puerto
Ricans. The largest difference is found between white men and white women.
Undergraduate Major Group Performance. Tables 10 and 11 preseni LSAT and UGPA means and
standard deviations by gender and undergraduate major group. Again, the majority of the groups show
a positive LSAT score difference, indicating that men in those majors earned higher LSAT scores than
women. The major exception is engineering, where women earned higher LSAT scores than men. There
is essentially no difference in mean LSAT scores between men and women who majored in the natural
sciences or in health professions. Among those applicants who reported a major, the largest differences
are observed for computer science and humanities majors. There is not much variation in the standard
deviations across the different major groups.
34
Tab
le 1
0
LSA
T M
eans
and
Sta
ndar
d D
evia
tions
for
199
0-91
Law
Scho
ol A
pplic
ants
by U
nder
grad
uate
Maj
or a
nd G
ende
r
Com
pute
rH
ealth
Nat
ural
Soci
alN
oB
usin
ess
Scie
nce
Eng
inee
ring
Prof
essi
ons
Hum
aniti
esSc
ienc
eSc
ienc
eO
ther
Res
pons
e
Wom
en Num
ber
6,79
317
346
197
89,
391
1,37
916
,753
390
915
Mea
n33
.16
33.8
636
.04
30.4
833
.15
34.8
932
.33
31.5
631
.07
Stan
dard
dev
iatio
n6.
797.
306.
246.
217.
046.
537.
187.
287.
73C
AD
C.1
7M
enN
umbe
r14
,436
372
2,69
039
77,
804
2,35
921
,450
431
1,16
4M
ean
33.7
034
.82
35.2
330
.49
34.3
534
.85
33.0
432
.55
32.5
8St
anda
rd d
evia
tion
6.63
7.03
6.60
6.76
6.86
6.94
'
7.18
7.85
7.68
Tot
al Num
ber
21,2
2954
53,
151
1,37
517
,195
3,73
838
,203
821
2,07
9M
ean
33.5
334
.51
35.3
630
.48
33.7
734
.87
32.7
332
.08
31.9
1St
anda
rd d
evia
tion
6.68
7.12
6.55
6.37
6.90
6.79
7.19
7.60
7.74
Dif
fere
nce
Men
-Wom
en0.
540.
96-0
.81
0.01
1.20
-0.0
40.
710.
991.
51
Eff
ect
0.08
0.13
-0.1
20.
000.
17-0
.01
0.10
0.13
0.21
Eff
ect s
ize
is e
xpre
ssed
as
mea
n di
ffer
ence
ind
units
(C
ohen
198
8): (
mal
e m
ean-
fem
ale
mea
n)/to
tal s
tand
ard
devi
atio
n. A
dof
.20
is a
sm
all
effe
ct s
ize;
ad
of .5
0 is
a m
ediu
m e
ffec
t siz
e.
Tab
le 1
1
UG
PA M
eans
and
Sta
ndar
d D
evia
tions
for
199
0-91
Law
Sch
ool
App
lican
tsby
Und
ergr
adua
te M
ajor
and
Gen
der
Com
pute
rH
ealth
Nat
ural
Soci
alN
oB
usin
ess
Scie
nce
Eng
inee
ring
Prof
essi
ons
Hum
aniti
esSc
ienc
eSc
ienc
eO
ther
Res
pons
e
Wom
en Num
ber
6,79
317
346
197
89,
391
1,37
916
,753
390
915
Mea
n3.
123.
112.
973.
073.
143.
083.
113.
102.
35St
anda
rd d
evia
tion
0.46
0.44
0.48
0.44
0.44
0.46
0.45
0.46
1.28
Men
Num
ber
14,4
3637
22,
690
397
7,80
42,
359
21,4
5043
11,
164
Mea
n3.
013.
012.
942.
903.
032.
962.
992.
972.
13St
anda
rd d
evia
tion
0.48
0.50
0.48
0.45
0.47
0.49
0.47
0.50
1.32
C..0
Tot
alC
)N
umbe
r21
,229
545
3,15
11,
375
17,1
953,
738
38,2
0382
12,
079
Mea
n3.
043.
042.
943.
023.
093.
003.
043.
032.
23St
anda
rd d
evia
tion
0.47
0.48
0.48
0.45
0.46
0.48
0.46
0.48
1.31
Dif
fere
nce
Men
-Wom
en-0
.11
-0.1
0-0
.03
-0.1
7-0
.11
-0.1
2-0
.12
-0.1
3-0
.22
Eff
ect
-0.2
3-0
.21
-0.0
6-0
.38
-0.2
4-0
.25
-0.2
6-0
.27
-0.1
7
Eff
ect s
ize
is e
xpre
ssed
as
mea
n di
ffer
ence
in d
uni
ts (
Coh
en 1
988)
: (m
ale
mea
n-fe
mal
em
ean)
/tota
l sta
ndar
d de
viat
ion.
A d
of
.20
is a
sm
all e
ffec
tsi
ze; a
d o
f .5
0 is
a m
ediu
m e
ffec
t siz
e.
30
Unlike the mixed pattern of positive and negative differences observed for LSAT score, all of the UGPA
differences between men and women are negative. The largest difference is found between men and
women who majored in health professions and the smallest between engineering majors. These results.
showing women earning higher UGPAs than men when they are matched on undergraduate major. are
contrary to the often-cited explanation that the higher UGPAs earned by women are a consequence of
women choosing less rigorous undergraduate curricula. The differences represent a small effect size for
every major group except engineering.
Regression Analyses
The results of the adjustment to male-female LSAT score differences using multiple linear regression are
presented in Table 12. For each combination of variables, the table shows the LSAT score difference and
the multiple correlation coefficient (R). The first row in Table 12 shows the observed score difference
between male and female applicants. The next three rows show the adjusted score difference that results
from including each of the demographic variables of age, ethnicity, or undergraduate major singly in the
regression equation with gender. These data show that adding age results in no adjustment to the
difference, while adding undergraduate major results in a modest difference. In contrast, adding ethnicity
results in a fairly dramatic reduction in the difference between the test scores of men and women.
Because age had no affect on the observed score difference, it was not included in any additional models.
The final line of Table 12 shows the results of adjusting for both major and ethnicity. The additional
reduction beyond ethnicity alone is again fairly modest, but even so, the total difference between male and
female applicants is almost totally eliminated when differences are adjusted by ethnicity and undergraduate
major.
37
31
Table 12
Adjusted Mean LSAT Score Differences Between Men and WomenFrom Adding Selected Main Effect Demographic Variables to a Multiple Regression Model
VariablesMale-FemaleDifference
Multiple
Gender 0.822 0.055
Gender, age 0.822 0.195Gender, undergraduate major 0.700 0.124Gender, ethnicity 0.332 0.383
Gender, major, ethnicity 0.214 0.395
Another way to think about the individual contributions of age and ethnicity to the adjustment in the
LSAT score difference between men and women is to compare the unadjusted difference (that is, the
observed difference between men and women of .82) with the difference that results from including each
of the variables alone in an adjustment equation. For example, the data in Table 12 show that the
unadjusted or observed difference between male and female LSAT scores is .82 and that the difference
after adjusting for undergraduate major is .70. Thus, the simple contribution of undergraduate major is
.12. The simple contribution of each variable to the adjustment of the LSAT score difference between
men and women is shown in Table 13.
38
32
Table 13
Contribution to Adjustment of LSAT Gender Differencesby Individual Variables
Variable Simple Contribution
Age 0.00Ethnicity 0.49Undergraduate Major 0.12
These data suggest that more than half of the observed differences in LSAT scores between men and
women are attributable to ethnicity.
Law School Application Data
One concern about the persistently lower LSAT scores earned by female test takers is that these lower
scores might impact on women's decisions about if and where to apply to law school. The LSAT score
distribution data for applicants shown in Table 3 and Figure 2 do not support the speculation that women
differentially select themselves out of the applicant pool. Thus, the next issue for investigation is whether
women self-select themselves into less prestigious law schools in the process of determining where their
applications will be competitive. If LSAT scores are an important factor in women's decisions about
where to apply to law school, we might expect to find that the difference between male and female
applicants within the more competitive law schools' applicant pools is considerably smaller than the
difference observed between male and female applicants overall. Because the U.S. legal education system
includes a more diverse range of law schools in terms of control (public and private), cost of attending,
and perceived differences in quality and prestige than does the Canadian system, analyses designed to
evaluate differential application patterns are based only on data from U.S. law schools.
39
33
Table 14 shows the overall mean differences between male and female 1990-91 applicants to 173 U. S.
ABA-approved law schools for LSAT scores and undergraduate grade point averages. In these analyses.
the mean LSAT score and UGPA for female applicants was subtracted from the mean LSAT score and
UGPA, respectively, for male applicants to the same school. Thus a positive difference indicates that the
mean for males was higher than the mean for females, and a negative difference indicates that the mean
for females was higher than the mean for males. Also included in Table 14 are the minimum and
maximum mean differences across the 173 schools and the standard deviations of the mean differences.
Both LSAT score differences and UGPA differences are reported on their respective scales. Standardizing
the differences reveals that LSAT scores for male applicants are .13 standard deviation higher than LSAT
scores for female applicants, while UGPAs for female applicants are on average one half standard
deviation higher than UGPAs for male applicants.
Table 14
Mean Difference in LSAT Score and UGPA Between Maleand Female Applicants to the Same U.S. Law Schools
(Men's Mean Minus Women's Mean)
Difference
LSATMean .81Standard deviation .58Minimum -.94Maximum 2.20
UGPAMean -.12Standard deviation .06Minimum -.24Maximum .03
Number of schools 173
34
As suggested earlier, if women take a more conservative approach to the law school application process
and if women feel discouraged from making application to the more competitive law schools as a response
to their slightly lower LSAT scores, we would expect the size of the malefemale LSAT difference to
decrease and perhaps even reverse itself within the applicant pools of the more competitive schools. One
way to determine whether the data support this proposition is to examine the magnitude of the within-
school malefemale difference across schools after sorting schools on some measure of competitiveness
or admission standard. Figure 4 shows for each law school the within-school malefemale LSAT score
difference for applicants plotted against the mean LSAT score of the accepted applicants to that school.
If women differentially select themselves out of the applicant pools of schools that admit the highest-
scoring applicants, we would expect the malefemale difference to decrease as the mean of the accepted
students increases. If the LSAT score were not a factor, we would expect the distribution of differences
to be fairly constant across law school, regardless of its LSAT mean. In fact, Figure 4 portrays a fairly
strong positive relationship between malefemale differences and the mean LSAT scores of accepted
students. That is, as the LSAT mean increases, so does the size of the difference between male and
female applicants' scores. At schools with the highest mean LSAT scores for these accepted students, the
mean LSAT score for female applicants is more than two points lower than the mean for male applicants.
This phenomenon may contribute to a perception that the malefemale differential is larger than it actually
is. The correlation between malefemale LSAT score difference and mean LSAT of accepted students
within each law school is .50. The data in Figure 4 show that the four schools with mean LSAT scores
less than 31 do not follow the linear trend observed for the other 169 schools. If these schools are treated
as outliers and are eliminated from the analysis, the correlation between malefemale LSAT score
difference and mean LSAT of accepted students within each law school increases to .64.
41
35
2.5a)c.)c 2 meI) liqp
.:1-
2 1.5%
Nr1 sm.-
u i- ifti 111 IL10al
0 1--111w 111r4l''
< 0.5coI 0
Figure 4
Male-Female LSAT for Applicants byWithin School Mn LSAT for Accepted
ow -0.5
2
25 30 35 40 45 50
Within School LSAT Mean
One possible explanation for the trend observed in Figure 4 is that female applicants with lower LSAT
scores believe that their UGPA's are sufficiently high to compensate for their test scores. In other words,
we might expect to see that the difference in UGPA favoring females would increase in much the same
way that the difference in LSAT scores favoring males increased. The data presented in Figure 5 do not
support this speculation. The higher UGPA's presented by women in the applicant pools of schools with
mean LSAT scores of approximately 30 virtually disappears (i.e., becomes zero) for schools with mean
LSAT scores above 42. The relationship between malefemale UGPA difference and mean LSAT of
accepted students within each law school is even stronger than the comparable relationship for LSAT
difference. The correlation between mean UGPA difference and mean LSAT for accepted students is .73
for all schools, and .82 when the five lowest mean LSAT schools are excluded.
`4 2
36
0.2
a)
a)
ai
5
(.1
3 -0.2
taa)
2
-0.4
25
Figure 5
Male-Female UGPA for Applicants by
Within School Mn LSAT for Accepted
30 35 40 45
Within School Mean LSAT50
Replacing mean LSAT for accepted students with mean UGPA for accepted students as an indication of
school admission standards does not change the observed relationships. Figures 6 and 7 show the male
minus female LSAT score difference and the male minus female UGPA difference by mean UGPA for
accepted students, respectively.
43
37
Figure 6
Male-Female Mean LSAT for Applicants
by Within School Mn UGPA for Accepted
- 2.5
c 26 is a IF
=0 1
4 0.5.
EDI in irme "
lIIPil
o
-0.5
0IF
2.4 2.6 2.8 3 3.2 3.4 3.6
Within School Mean UGPA
0.2
0
ar
a)
O%I
O.
D -0.2
co
-0.4
2.4
Figure 7
Male-Female Mn UGPA for Applicants by
Within School Mn UGPA for Accepted
3.8
2.6 2.8 3 3.2 3.4 3.6
Within School Mean UGPA
44
3.8
38
To evaluate more completely the law school application patterns of female applicants compared with male
applicants, the distributions of male and female applicants' LSAT scores were examined within law
schools grouped by the mean of the LSAT score of the students they admit. Summary data are presented
in Table 15. The distributions are shown separately for different values of mean LSAT score of accepted
students to allow trends across schools as well as across gender to be examined. The mean LSAT scores
for male applicants and for female applicants differ substantially across schools, suggesting that men and
women each take into consideration both their own LSAT score and the mean LSAT for accepted students
at the schools of interest when deciding to apply to a school. Consistently across the levels of means of
accepted applicants, the mean for all female applicants is lower than the mean for all male applicants.
Additionally, the mean LSAT score for both male and female applicants is lower than the mean for
accepted students across the score range, indicating that in general both men and women tend to aspire
to schools with admission standards somewhat above their application credentials, although the level of
negative skewness at the highest level schools suggests that the means at least somewhat are affected by
the few relatively extreme scores in the lower tail of the distribution. Even so, the applicants' medians,
though higher than the means, also are lower than the means of the accepted students. At schools with
the highest mean LSAT scores for accepted students, women seem to be even more aggressive than men,
resulting in a lower mean LSAT for female applicants than for male applicants at those schools. Table
15 also reports the proportion of men and women in the different applicant pools, and the standard
deviations and the skewness of the distributions. Looking across schools, the data show that the
proportion of female applicants is higher among schools with higher mean LSAT scores and tends to
decrease as the mean LSAT of the accepted students decreases. The data also show that the LSAT scores
for both male and female applicants is highly negatively skewed for the higher mean LSAT schools and
relatively normally distributed for schools with the lowest mean LSAT scores. The negative skewness
results partly from the fact that a few applicants with much lower LSAT scores applied to those schools
and partly because the mean LSAT for those schools is very close to the top of the LSAT score scale.
The distribution of LSAT scores for male applicants tends to be slightly more negatively skewed than is
the distribution for female applicants to schools with higher mean LSAT scores.
45
39
Table 15
Distributions of 1990-91 LSAT Scores for Male and Female ApplicantsWithin Law Schools Grouped by Mean Scores of Accepted Applicants
Accepted All Applicants
Mean Proportion Proportion Male Standard Female StandardLSAT Males Females Mean Deviation Skew Mean Deviation Skew
45-44 0.58 0.42 40.11 5.96 -1.24 38.35 6.74 -1.0443-42 0.57 0.43 38.28 5.96 -0.99 36.78 6.43 -0.8341-40 0.58 0.42 36.29 5.93 -0.83 35.15 6.21 -0.7239-38 0.58 0.42 33.88 6.03 -0.58 33.02 6.17 -0.5037-36 0.61 0.39 32.37 5.73 -0.45 31.74 5.90 -0.4235-34 0.64 0.36 30.56 5.68 -0.35 30.14 5.80 -0.3233-32 0.65 0.35 29.37 5.58 -0.22 28.93 5.76 -0.2531-30 0.66 0.34 28.33 5.82 -0.02 27.54 5.94 0.0929-28 0.70 0.30 28.20 4.92 0.00 28.16 5.42 0.0427-26 0.66 0.34 24.43 6.23 -0.02 23.07 6.61 0.27
Next, the difference between the applicant's LSAT score and the average of the mean LSAT scores of all
the schools to which the applicant applied was calculated separately for each applicant. These data
provide an indication of where the applicant stands relative to the admission standards of the schools to
which she applied. A negative difference indicates that the applicant was selecting schools with admission
standards that tended to be higher than the applicant's credentials, while a positive difference indicates that
the applicant's score exceeds the admission standard of the schools to which she applied. A summary of
this analysis for applicants with different ranges of LSAT scores is shown separately for men and women
in Table 16. The general pattern is the same for men and women. That is, applicants with the lowest
LSAT scores applied to schools well above their scores, and the size of the difference decreased as the
LSAT score of the applicants increased. The data in Table 16 also show that the magnitude of the
negative difference is consistently larger for female applicants than for male applicants, again confirming
that female applicants tend to apply to schools farther above their LSAT scores than do male applicants.
46
40
Table 16
Value of Applicant's LSAT Minus School's Mean LSAT forAccepted Students by LSAT Score Group and Gender
LT28 28-32 33-37 38-41 42-48
Men
Number 9,302 11,671 14,410 8,880 6,520Mean -12.71 -6.24 -2.60 0.04 2.71Standard deviation 4.77 2.85 2.60 2.55 2.59
Women
Number 8,035 8,787 10,385 6,044 3,751Mean -13.69 -6.89 -3.12 -0.18 2.57Standard deviation 4.75 2.84 2.57 2.50 2.57
Table 17 presents the same data as Table 16, but further broken down by the number of applications
submitted. Again, the general pattern for men and women is parallel. First, both men and women
applying to only one school apply to a school closer to their LSAT score than do applicants applying to
more than one school. Across score levels, for number of applications up to seven or eight, as the number
of applications increases, so does the size of the difference between LSAT score of the applicant and the
average of the mean LSAT scores of accepted students at the schools of application. These data suggest
that when applicants increase the number of applications, the additional applications are sent to schools
to which the applicant has a lesser chance of gaining admission, using mean LSAT of admitted students
as the estimate of admission standards. The data further suggest that applications beyond seven or eight
tend to be more random and have little additional impact on the size of the difference. The trend of
increasing the size of the difference is more extended for applicants in the middle ranges than for
applicants at the high or low end of the LSAT score scale. Comparing the differences for female
applicants with the differences for male applicants, the data show that female applicants exhibit a
consistently larger difference regardless of number of applications.
41
Table 17
Mean of Applicant's LSAT Minus School's Mean LSATfor Accepted Students by Number of Applications,
LSAT Score Group, and Gender
NumAMFsLT 28
Men Women28-32
Men Women33-37
Men Women Men38-41
Women42-48
Men Women
1 -11.98 -12.67 -5.77 -5.77 -1.59 -1.92 1.44 1.25 3.94 4.012 -12.80 -13.62 -6.43 -6.43 -2.07 -2.51 0.89 0.79 3.68 3.643 -12.76 -13.96 -6.98 -6.98 -2.44 -3.08 0.58 0.38 3.06 3.064 -13.39 -14.08 -7.36 -7.36 -2.85 -3.48 -0.13 -0.44 2.80 2.445 -13.01 -14.55 -7.54 -7.54 -3.07 -3.66 -0.40 -0.51 2.35 2.436 -13.31 -14.55 -7.80 -7.80 -2.99 -3.74 -0.57 -0.87 2.29 2.087 -12.91 -14.63 -7.72 -7.72 -3.19 -4.01 -0.45 -1.10 2.26 1.988 -12.94 -14.23 -7.99 -7.99 -3.35 -3.92 -0.76 -0.97 2.11 1.869 -13.31 -14.18 -7.61 -7.61 -3.49 -4.19 -0.96 -1.23 2.10 1.69
10 -13.24 -14.69 -7.98 -7.98 -3.54 -4.11 -0.81 -1.40 2.05 1.8711 -12.88 -14.87 -7.78 -7.78 -3.30 -4.39 -1.30 -1.24 1.82 1.7512 -13.33 -14.16 -7.68 -7.68 -3.70 -4.24 -1.17 -1.43 1.93 1.66
Among the highest scoring applicants, that is 42 to 48, both men and women apply to schools with mean
LSAT scores lower than their own scores. This result is a necessary consequence of the distribution of
law school means. Within this score level, there is essentially no difference between men and women
whose number of applications ranges from one to live. When the number of applications exceeds five,
men tend to be slightly further above the school's means than are women.
Another question of interest is whether women's application patterns suggest that they attempt to
compensate for lower LSAT scores with higher UGPAs. Analyses parallel to those summarized in Tables
15 through 17 are replicated in Tables 18 through 20. using UGPA rather than LSAT to define both the
admission standards for the law schools and the entering credentials of interest for the applicant.
Table 18 shows the distributions of 1990-91 male and female law school applicants' UGPAs for different
levels of within school mean UGPAs for accepted students. As was the case when LSAT 'scores were
used as the sorting variable, the proportion of female applicants relative to male applicants is largest at
48
42
the schools with the highest mean UGPAs and tends to decrease as mean UGPA decreases. Unlike the
pattern observed for LSAT scores, the mean UGPAs for male and female applicants are approximately
equal among applicants to schools with the highest means UGPAs. For the remaining schools. the mean
UGPA for female applicants is higher than the mean for male applicants to the same schools. Again. like
the distributions of applicants' LSAT scores, the distributions for both male and female applicants tend
to be negatively skewed, suggesting that the pools include some applicants with much lower UGPAs.
Table 18
Distributions of 1990-91 UGPAs for Male and Female Applicantsfor Law Schools Grouped by Mean UGPAs of Accepted Applicants
Accepted All Applicants
MeanUGPA
ProportionMales
ProportionFemales
MalesMean
StandardDeviation Skew
FemalesMean
StandardDeviation Skew
3.8 0.59 0.41 3.42 0.42 -1.36 3.43 0.39 -1.253.7 0.58 0.42 3.36 0.40 -0.94 3.36 0.40 -0.993.6 0.58 0.42 3.28 0.41 -0.98 3.31 0.39 -0.733.5 0.57 0.43 3.19 0.41 -0.72 3.23 0.40 -0.633.4 0.59 0.41 2.94 0.43 -0.19 3.07 0.42 -0513.3 0.58 0.42 2.97 0.43 -0.25 3.10 0.42 -0.323.2 0.59 0.41 2.91 0.42 -0.12 3.04 0.42 -0.263.1 0.64 0.36 2.82 0.41 0.04 3.00 0.42 -0.123.0 0.63 0.37 2.74 0.42 0.11 2.90 0.44 -0.052.9 0.68 0.32 2.73 0.46 -0.14 2.90 0.42 -0.052.8 0.66 0.34 2.65 0.41 0.06 2.79 0.42 0.072.7 0.65 0.35 2.53 0.46 -0.74 2.65 0.50 -1.232.6 0.68 0.32 2.59 0.39 0.38 2.68 0.43 0.18
Next, paralleling the analyses presented in Table 16, the difference between each applicant's UGPA and
the average of the mean UGPAs for accepted students at all of the law schools to which the applicant
applied was calculated. The results are presented in Table 19. A negative difference results when the
applicant's UGPA is lower than the average of the mean at the schools to which she applied. Again, the
largest negative difference is observed for those applicants in the lowest UGPA category (less than 2.8)
and the largest positive difference for those in the highest category. These extremes again are necessitated
by the position of these applicants relative to the mean UGPA for the majority of law schools. Of note
43
in this table is the comparison between the average differences for male and female applicants. In the
highest UGPA groups, the positive female difference is slightly larger than the positive male difference.
In the lower two groups, the male and female differences are identical.
Table 19
Value of Applicant's UGPA Minus School's Mean UGPA forAccepted Students by UGPA Score Group and Gender
LT 2.8 2.8-3.1 3.2-3.5 3.6-4.2
Men
Number 17,376 15,392 12,463 5,551Mean -0.74 -0.28 0.01 0.30
Standard deviation 0.31 0.18 0.18 0.20
Women
Number 8,903 11,276 11,207 5,616Mean -0.74 -0.27 0.04 0.35
Standard deviation 0.30 0.17 0.18 0.20
Table 20 shows the data from Table 19 further broken down by number of applications. The same general
trends observed for LSAT scores also are apparent for UGPAs. That is, applicants who submit multiple
applications tend to be further below, or in the case of the highest UGPA applicants, not so far above, the
mean of students accepted at the schools to which they send applications than are applicants who submit
only one application. Additionally, the distance tends to increase as the number of applications increases.
Except in the highest UGPA category, the data for men and women are virtually identical. In the highest
UGPA category the positive difference for women is slightly larger than the positive difference for men
regardless of number of applications.
44
Table 20
Mean of Applicant's UGPA Minus School's Mean UGPA for Accepted Students byNumber of Applications. UGPA Score Group, and Gender
UGPA Score Group
Number ofApplications Men
LT 2.8
Women Men
2.8-3.1
Women Men
3.2-3.5
Women Men
3.6-4.2
Women
1 -0.74 -0.71 -0.22 -0.22 0.08 0.11 0.39 0.442 -0.74 -0.73 -0.26 -0.25 0.06 0.09 0.38 0.423 -0.74 -0.74 -0.26 -0.27 0.03 0.07 0.34 0.384 -0.75 -0.74 -0.29 -0.28 0.02 0.03 0.29 0.335 -0.75 -0.75 -0.30 -0.30 0.00 0.01 0.26 0.316 -0.74 -0.75 -0.31 -0.31 -0.01 0.00 0.26 0.287 -0.73 -0.78 -0.31 -0.31 -0.02 -0.02 0.25 0.288 -0.73 -0.76 -0.30 -0.31 -0.04 -0.03 0.23 0.279 -0.74 -0.74 -0.33 -0.32 -0.04 -0.03 0.22 0.2510 -0.75 -0.73 -0.32 -0.32 -0.04 -0.04 0.25 0.2511 -0.76 -0.79 -0.32 -0.33 -0.06 -0.04 0.20 0.2612 -0.76 -0.75 -0.32 -0.32 -0.05 -0.03 0.23 0.26
Evidence that women tend to apply to schools at which their LSAT scores are not only lower than the
mean for accepted students but further below than is observed for male applicants raises questions about
whether women protect themselves in the application process by generating more applications per person
than do their male counterparts. A related question is whether there is a relationship between LSAT score
and number of applications. More specifically, do applicants with lower LSAT scores submit more
applications than applicants with higher scores? Information about number of applications is shown in
Table 21. These data show that, on average, men generate a slightly but not significantly larger number
of applications than women. The correlation between number of applications and LSAT score is virtually
the same for men and women. These correlation coefficients of .1 fail to provide evidence that there is
a relationship between these two variables.
5 1.
Female Lj Male I
45
Table 21
Correlation Between Number of Applications and LSAT Score by Gender
Men Women
Mean number of applications 4.94 4.70Standard deviation 4.22 4.01Correlation
LSAT/Number of applications .10 .12Number 51,104 37,233
In a related analysis, Figure 8 shows the actual distribution of the number of schools to which 1990-91
male and female applicants applied. Approximately 24 percent of women and 22 percent of men apply
to only one school. A slightly higher percentage of women than men also apply to two schools. In
contrast, when the number of applications reaches seven or more, the percentage of men slightly exceeds
the percentage of women who submitted the same number of applications. The data considered in this
study suggest that women do not respond to their slightly lower LSAT scores by producing additional
30%
Figure 8
Distribution of Number of Schools toWhich Males and Females Apply
5 7 9 11 13 15 17 19 21 23 25 27Number of Applications
52
46
applications. Further, it does not appear that women portray a greater aversion to risk than do men by
generating additional applications nor by applying to schools with lower admission standards relative to
their own application credentials.
A final study of application patterns examined number of applications as a function of the mean LSAT
of accepted students at each school separately for men and women. In order to adjust for variation in the
size of the schools, the ratio of number of applicants to number of accepted students was used instead of
a single count of total applicants. Figure 9 shows the plot of the ratio of applicants to accepted students
against the mean LSAT score for accepted students separately for male and female applicants. These data
demonstrate a tendency for larger numbers of applicants per available place to apply to schools with
higher LSAT scores. The trends are similar for men and for women, but the correlation between the
applicant/accepted ratio and mean LSAT score for accepted applicants is higher for women than for men
(.58 vs .46). Note that the plus signs for male applicants fall higher than the oval symbols for female
applicants on the ratio axis because the number of male applicants is larger than the number of female
applicants. These data again confirm that both male and female applicants tend to aspire to schools with
the highest admission standards even when those standards exceed their own application credentials. If
instead, applicants were applying to schools whose LSAT scores were in a narrow range of their own
LSAT scores and UGPAs, schools with LSAT scores in the middle range would have the largest ratio of
applicants per place because that is where the largest number of applicants fall. If female applicants were
more conservative in their application selection process than men, the positive correlation might be evident
for male applicants, while a more rectangular distribution, or a distribution that peaks in the middle would
be seen for female applicants.
47
8
a.a)
0006-
141.to
cc 4
1111
Figure 9
Ratio of Male and Female Applicants /
Total Accepted by Mn LSAT for Accepted4-
+
+ Ito4- 4"'"
+ + I++ ++1++ + + ii-+,_
72. '+ . 4* . + . w44,4-,
4+ .+44 r _N.*. * .. .4-El + + 4..t +
+ 1-4" -litf++.914,+4
...Q2+ ! ..1/4-"+.+
leefill.0 . + + obiliL
tade
+.41, 411/4
Et .
25 30 35 40 45 50
Mean LSAT for Accepted Applicants
Female Male
Law School Admission Data
The next analyses are directed toward assessing what happens to these female applicants in the admission
process. Table 22 presents the number and percentage of male and female applicants who were accepted
to at least one law school. Fifty-seven percent each of the 1990-91 male and female applicants received
at least one acceptance. Because women make up only 42 percent of the total applicant pool, accepting
equal proportions of male and female applicants helps to perpetuate the higher proportion of male law
school students.
54
48
Table 22
1990-91 Male and Female Applicants Acceptedby at Least One Law School
Accepted Not Accepted Total Applicants
Men
Number 29,063 22,040 51,103Row percent 56.87% 43.13%Column percent 57.85%
WomenNumber 21,378 15,855 37,233Row percent 57.42% 42.58%Column percent 42.15%
A final objective of this study is to evaluate whether the same standards are used to admit or deny
applicants regardless of their gender. Logistic regression equations that used LSAT scores and. UGPAs
to predict admission decisions were employed for that purpose. The logistic regression model is
reasonable if there is a relationship between each of these variables and admission. For the schools
included in this study, the correlation between LSAT score and admission decisions is .31; the correlation
between UGPA and admission decisions is .26. In a similar study conducted to evaluate admission
decisions for undergraduate schools, Willingham (1988) found a correlation of .37 between SAT score and
undergraduate admission decisions and .36 between high school grade point average and undergraduate
admission decisions. These data suggest that high school grades are somewhat more important in
undergraduate admission than college grades are in law school admission, although the lower correlation
between grades and law school admission decisions also might be a consequence of more severe restriction
of range. Regardless, the data support that LSAT score and UGPA are useful measures to include in the
logistic regression model.
If the same standards are applied to all applicants when making admission decisions, the logistic
regression model estimated from data for male applicants should predict admission equally well for women
49
as for men. The correlations between the predicted admission decisions based on the logistic regression
model for each law school and the actual decision are shown in Table 23. Overall, the correlation both
for male applicants and for female applicants is .71. The correlations between predicted and actual
admission decisions are very high, indicating that half of the variance in admission decisions is accounted
for by these two variables. Another way to think about these correlations is that the higher the composite
of LSAT and UGPA, the greater the probability of gaining admission. The data in Table 23 show the
correlations separately by ethnic group for female applicants. These data show that the correlation is
lowest for black applicants and highest for white applicants. The lower correlations for several ethnic
groups reported in Table 23 suggest that factors other than LSAT score and UGPA play an important role
in the decision process for those applicants. This is especially relevant for these applicants because their
average LSAT scores and UGPAs, as presented in Tables 8 and 9, tend to be considerably lower than
those presented by white and Asian American applicants.
Table 23
Correlations of Admission Decisions with Predicted Admission,LSAT, and UGPA by Gender
Applicants
Correlations of Admission Decision With
PredictedAdmission LSAT UGPA
All Men .71 .30 .25
All Women .71 .34 .27American Indian .48 .31 .18Asian American .70 .31 .24Black .43 .46 .32Hispanic .63 .36 .31Mexican American .52 .45 .32Puerto Rican .53 .37 .32White .77 .36 .28
56
50
As noted previously, one calculation of interest in these analyses is the difference between predicted
admission and actual admission for female applicants. Table 24 presents the proportion of applicants
predicted to be admitted, the proportion actually admitted, and the residual by gender. Note that because
a separate prediction equation was estimated and applied for each law school, those men and women who
applied to more than one law school had their probability of admission evaluated separately within each
school. Those applicants are counted more than once in the total number of applicants. In other words,
the total number of applicants reported in Table 24 is the total number of applicants whose admission
decision was evaluated against a prediction model. It corresponds to the total number of applications
submitted and acted upon at the 178 schools included in this study. A negative residual indicates that the
proportion actually admitted exceeded the proportion predicted to be admitted. The residual is negative
for female applicants, but the size of the residual is very small and is not ofany practical significance.
These data do not suggest that female applicants are treated differently from male applicants in the
admission decision process.
Table 24
Predicted Versus Actual Admission Rates byGender for the 1990-91 Admission Year
Number Proportion Proportionof Predicted to Actually Residual
Applicants Applicants be Admitted Admitted (Predicted-Actual)
Men 238,161 .25 .25 .00Women 165,148 .25 .28 -.03
Because the data in Table 23 suggest that the prediction decision based on LSAT score and UGPA do
not correlate as highly with actual admission decisions for women of color as they do for white women,
predicted versus actual admission rates were examined separately by gender and ethnicity for the 1990-91
admission year. In order to determine not only the admission decision results for women of color
compared with white women, but women of color compared with men of color, both male and female
applicant groups were examined separately by ethnic group membership. The prediction model based on
5I
all male applicants was used to evaluate each of the groups. The proportions predicted to be admitted and
actually admitted, as well as the residuals are reported in Table 25. The proportions predicted and actually
admitted also are shown in Figure 10. These data show that the proportions predicted and admitted are
almost identical by ethnic group across gender group. For example, five percent of black female
applicants are predicted, based on LSAT score and UGPA, to be admitted and 26 percent actually were
admitted. Likewise, five percent of black male applicants are predicted, based on LSAT score and UGPA,
to be admitted and 26 percent actually were admitted.
Table 25
Predicted Versus Actual Admission Rates byGender and Ethnicity for the 1990-91 Admission Year
ApplicantsNumber ofApplicants
ProportionPredicted tobe Admitted
ProportionActually
AdmittedResidual
(Predicted-Actual)
WomenAmerican Indian 835 0.13 0.32 -0.19Asian American 10,790 0.17 0.26 -0.09Black 16,404 0.05 0.26 -0.21Hispanic 4,697 ' 0.15 0.28 -0.13Mexican American 2,208 0.11 0.34 -0.23Puerto Rican 1,390 0.09 0.26 -0.17White 124,424 0.30 0.29 0.01
MenAmerican Indian 1,202 0.15 0.29 -0.14Asian American 11,662 0.17 0.25 -0.08Black 12,336 0.05 0.26 -0.21Hispanic 6,320 0.14 0.26 -0.12Mexican American 3,042 0.11 0.30 -0.19Puerto Rican 1,649 0.10 0.26 -0.15White 195,405 0.28 0.25 0.03
58
52
Figure 10
Predicted and Actual Admission RatesBy Gender and Ethnic Subgroup
AIM AIF AsAM AsAF BIM BIF HspM HspF MxAM MxAF PRM PRF WhM WhF
Ethnic Subgroup and GenderPredicted /1 Actual
The data also show that the residuals are negative for each group except white males and white females.
Negative residuals result when the proportion actually admitted is larger than the proportion predicted to
be admitted. The residuals for white men and for white women are essentially zero, suggesting that white
female applicants whose application credentials, as measured by LSAT and UGPA, met the school's
criteria for admission are not being disproportionately denied.
The actual and predicted admission rates also were examined separately for public and private law schools
for each of the ethnic groups for female applicants. The proportions predicted and admitted, and the
residuals are presented in Table 26 and in Figure 11. Again, the residuals are negative regardless of
school category for every ethnic group except white. There does not appear to be a pattern for the relative
size of the negative residuals between private and public schools. That is, the negative residual is larger
53
Table 26
Predicted Versus Actual Admission Rates for FemaleApplicants by Ethnicity and School Control 1990-91 Admission Year
ApplicantsLaw School
ControlNumber ofApplicants
ProportionPredicted tobe Admitted
ProportionActuallyAdmitted
Residual(Predicted-Actual)
American Indian Private 473 0.15 0.30 -0.15Public 359 0.11 0.35 -0.24
Asian American Private 7,076 0.18 0.28 -0.10Public 3,604 0.15 0.23 -0.08
Black Private 9,751 0.05 0.26 -0.21Public 6,647 0.04 0.25 -0.21
Hispanic Private 3,191 0.17 0.30 -0.13Public 1,498 0.11 0.24 -0.13
Mexican American Private 1,310 0.13 0.35 -0.22Public 895 0.08 0.33 -0.25
Puerto Rican Private 911 0.09 0.27 -0.18Public 432 0.06 0.20 -0.14
White Private 79,335 0.32 0.31 0.01Public 44,706 0.26 0.25 0.01
0.4
0.3
oc
00.20.2
2
0.1
Figure 11
Predicted & Actual Admission Rates for
Women by Ethnicity & School Control
0AIPu AIPr BIPu BIPr WhPu WhPr MxPu MxPr 1 HsPu HsPr AAPu AAPr PRPu PRPr
Ethnic Group and School Control
Predicted I Actual
60
54
for public than for private schools for American Indian and Puerto Rican female applicants, but larger for
private than for public, for Asian American and for Mexican American applicants. Thus, the public
schools are admitting a slightly larger proportion of Asian American and Puerto Rican female applicants
than are predicted to be admitted while the private schools are admitting a slightly larger proportion of
Asian American and Mexican American applicants than predicted. The residuals for public and private
law schools are identical for black and Hispanic female applicants.
SUMMARY AND CONCLUSIONS
This study used data from the law school application and admission process to investigate the issue of
differential test performance between men and women from two different perspectives. The analyses
focussed initially on factors that might explain the phenomenon of lower test scores that is persistently
observed. The possible social consequences that might result from the lower scores were explored next.
The main questions of concern were (1) whether women differentially selected themselves out of the
applicant pool as a response to their lower test scores, (2) whether women elected to apply to less
competitive and less demanding schools as a consequence of their lower scores, and (3) whether the
probability of gaining admission to law school is related to the sex of the applicant.
The data do not support a need for concern that female test takers are differentially selecting themselves
out of the applicant pool. The shape and position of the distribution of test scores for female law school
applicants relative to male applicants are parallel to the shape and position of the distribution for female
test takers relative to male test takers. There is some self-selection out of the applicant pool by both low
scoring male and low scoring female test takers. As a result, the mean LSAT for both male and female
applicants is approximately two score scale points higher than the mean for male and female test takers.
However, the magnitude of the difference between men and women remains fairly constant, not only at
the means but throughout the score range. Additionally, the standard deviations for women's score
distributions are approximately equal to those for men's distributions. Finally, the proportion of women
55
in the applicant pool is approximately the same as the proportion of women in the population of test
takers.
Demographic characteristics for male and female applicants were examined to determine whether
differences in demographic distributions might account for some of the differences in test performance
between men and women. These data revealed that
o a larger proportion of women fall within the youngest age group category,
o a larger proportion of women applicants are nonwhite,
o approximately 70 percent of women, compared with 57 percent of men, report humanities
or social sciences as their undergraduate majors, and
o social sciences is the most frequently cited major for both men and women, but a larger
proportion of women than men were social science majors.
Both LSAT performance and performance in undergraduate school, as measured by UGPA, were examined
by age group, ethnic group, and undergraduate major category group separately for men and for women.
General findings from these analyses are
o men tend to earn higher LSAT scores than women regardless of demographic group. The
most salient exception is that female engineering majors earned LSAT scores .8 higher
than male engineering majors.
o women earned higher UGPAs than men, regardless of demographic group. This is
particularly striking in the analyses in which men and women are matched on
undergraduate majors. The higher UGPAs earned by women frequently are attributed to
62
56
the fact that women select easier majors in college. These data dispute that claim at least
for men and women who apply to law school.
o the effect sizes, expressed as mean difference in d units, are larger for the UGPA
differences than for the LSAT score differences.
These three demographic variables were added to a multiple linear regression model in which gender was
the initial independent variable in order to estimate the adjustment to the mean LSAT score difference
between men and women that might result from taking them into account. The largest adjustment is
associated with ethnicity. Adding age had no impact, while adding undergraduate major resulted in a
small adjustment. When adjusted for both ethnicity and major, the magnitude of difference between test
scores for men and women was reduced from .82 to .21. These results are consistent with the finding that
a substantially larger proportion of women than men are members of ethnic minority groups.
The data analyzed in this study also do not support concerns about negative social consequences resulting
from women's slightly lower LSAT scores. Although the data do confirm that male applicants have higher
LSAT scores, on average, than female applicants both within and across law schools, there is no support
for the hypothesis that women fail to make application to the more prestigious law schools as a
consequence of their lower test scores. In fact, the data suggest just the opposite! When the data are
examined after schools are sorted by the mean LSAT or the mean UGPA of their accepted students, the
difference in LSAT scores increases as the means for accepted students increase even more sharply for
women than for men. The data also show that the percentage of female applicants in the school's
applicant pool increases as the mean LSAT or mean UGPA of their accepted students increases.
Interestingly, this same pattern was observed regardless of whether LSAT or UGPA was analyzed relative
to the schools to which individual women applied.. That is, women seem more likely than men to apply
to law schools at which the admission standards defined by LSAT score and UGPA exceed their own
credentials.
63
57
There also is no evidence to suggest that women compensate for their higher risk taking in their
application patterns either by adding more safety schools or by generating more applications than male
applicants. The data show
o women tend to be further below the average LSAT of accepted students across all the
schools to which they apply,
o women submit, on average, slightly fewer applications per person than do men (4.70 vs.
4.94), and
o a larger proportion of women than men submit only one or two applications.
Finally, data on admission decisions were evaluated. The data show that an equal percentage of male and
female applicants (57 percent) were accepted by at least one law school. Given that the total applicant
pool is approximately 58 percent male, accepting equal percentages of male and female applicants helps
to perpetuate the approximately 60/40 ratio of men to women in legal education.
A logistic regression model to predict the probability of acceptance to law school based on LSAT score
and UGPA was developed using data from male applicants. The resulting equations were applied to data
for female applicants. If gender were not a factor in the admission process, we would expect the model
to predict as well for female applicants as for male applicants. The data supported equally good prediction
for women.
Evaluation of the utility of the male prediction model for women separately by ethnic group revealed that
white women were admitted in the same proportions as predicted by the model. In contrast, women of
color were admitted in substantially higher proportions than predicted. In a parallel analysis, the same
pattern was observed for white men and men of color, suggesting that these results are not gender specific.
64
58
The final analyses looked separately at public and private schools. Again, the same general admission
prediction patterns were observed regardless of type of school.
Future Research
This study investigated differences in test performance and subsequent application and admission decisions
separately for men and women. The next step is to examine performance in law school by those who
were admitted and who chose to attend. The UGPA data presented in this study are consistent with
hundreds of studies that report that women earn higher grades than men at both the high school and the
undergraduate school levels (e.g., see Astin, Dey, Korn, & Riggs, 1991; McCormack & McLeod, 1988;
Young, 1991). The initial research question is whether this same pattern of better academic performance
by women is exhibited in law school.
A second question is whether the standard predictors, LSAT score and UGPA, predict as well for women
as for men. Additionally, studies are needed not only to evaluate the academic performance of these men
and women in law school, but also the kinds of factors that may have impacted their performance. A
large proportion of the 1990-91 applicants entered law school in fall 1991. A vast amount of data about
these students is available through the Bar Passage Study data collection effort. The Bar Passage Study
data will be used to address these questions in a future study.
65
59
REFERENCES
American Bar Association Section of Legal Education. ( 1993). A review of legal education in the UnitedStates. Chicago, IL: Author.
Astin, A. W., Dey, E. L., Korn, W. S., & Riggs. E. R. (1991). The American freshman: Nationalnorms for fall 1991. Los Angeles, CA: Higher Education Research Institute, UCLA.
Ben-Shakhar, G., & Sinai, Y. ( 1991). Gender differences in multiple-choice tests: The role ofdifferential guessing tendencies. Journal of Educational Measurement, 21i, 23-35.
Burton, N. W., Lewis, C., & Robertson, N. (1988). Sex differences in SAT scores. (College Board ReportNo. 88-9, ETS Research Report No. 88-58). New York: College Entrance Examination Board.
Brown, S. V. (1987). Minorities in the graduate education pipeline. Princeton, NJ: Educational TestingService.
Cohen, J. (1988). Statistical power analysis for the behavioral sciences. (2nd ed.). Hillsdale, NJ:Lawrence Erlbaum Associates.
Graduate Management Admission Council. (1992). An admissions office profile of candidates taking theGraduate Management Admission Test 1986-87 through 1990-91.
Han, L., & Hoover, H. D. (1994, April). Gender differences in achievement test scores. Paper presentedat the annual meeting of the National Council on Measurement in Education, New Orleans, LA.
Kass, N. (1964). Risk in decision-making as a function of age, sex ancfprobability preference. ChildDevelopment, 11, 577-582.
McCormack, R. L., & McLeod M. M. (1988). Gender bias in the prediction of college courseperformance. Journal of Educational Measurement. 25. 321-331.
McManis, D. L., & Bell, D. R. (1968). Risk-taking by reward-seekina. punishment-avoiding, or mixedorientation retardates. American Journal of Mental Deficiency. 71. 267-272.
National Center for Education Statistics. (1985). The condition of education. Washington, DC: U.S.Government Printing Office.
Slovic, P. (1966). Risk-taking in children: Age and sex differences. Child Development, 37, 169-176.
The Chronicle of Higher Education Almanac. (1992. August). Washington. DC: The Chronicle of HigherEducation, Inc.
Willingham, W. W. (1988). Admissions decisions. In W. W. Willingham. M. Ragosta, R. E. Bennett,H. Braun, D. A. Rock, & D. E. Powers (Eds.), Testing handicapped people (pp. 71-81). Boston,MA: Allyn and Bacon, Inc.
Young, J. W. (1991). Gender bias in predicting college academic performance: A new approach usingitem response theory. Journal of Educational Measurement. 28, 37-47.
60
APPENDIX
Undergraduate Majors Included in Each of Eight Undergraduate Major Categories
Humanities
'Architecture/Environmental DesignArt/Design
Art History
Classics
Communications
Drama/Theatre Arts
English
Fine Arts
Foreign LanguagesFrench
German
Home Economics
JournalismLiberal Arts
Library Studies
Linguistics
Literature
Music
Performing ArtsPhilosophy
Practical Arts
Religion/Religious StudiesSpanish
Theology
Other
Business
Accounting
Advertising
Business Administration
Business Education
Business Management
Business Management/Administration
Business and Commerce, GeneralEconomicsFinance
Hotel/Restaurant Management
Industrial Management
Industrial Relations
Marketing
Personnel ManagementReal Estate
Sales/Retail
Transportation and CommerceOther
Computer Science
Computer Science. GeneralComputer Programming
Database Management
Information Sciences
Systems AnalysisOther
Engineering
Aerospace and Aerobautical
Bio/Biomedical
Chemical Engineering
Civil Engineering
Construction Engineering
Electrical Engineering
Electronic Engineering
Engineering Technologies/DesignIndustrial Engineering
Mechanical Engineering
Mining Engineering
Nuclear Engineering
Petroleum EngineeringOther
Health Professions
Animal Sciences/Veterinary Medicine
Dietetics/Nutritional Science
Hospital/Health Care Administration
Medical Laboratory Technology/RadiologyNursing
Occupational Therapy
Pharmacy
Physical Therapy
Predentistry/Dentistry
Premedical/Medicine
Speech Pathology/AudiologyOther
67
Natural Sciences
Agriculture
Astronomy
Biology. General
Biology. SpecializationBotany
Chemistry, General
Chemistry, Specialization
Environmental SciencesGeography
Geology\Earth SciencesMarine Studies
Mathematics
Physical Sciences
Physics, General
Physics, SpecializationOther
Social Sciences
African American StudiesAmerican Civilization
Anthropology
Archaeology
Criminal Justice
Criminology
Education, General
Education/Administration
Educational Psychology
Family Relations/Child Development
Government/Service
Guidance/CounselingHistory
International Relations
Law Enforcement
Military Science
Physical Education
Political SciencePrelaw
Psychology
Public Affairs/Services/AdministrationSocial Science
Social Work
Sociology
Special Education/Disabilities/Handicapped
Urban Studies/Regional PlanningWomen's StudiesOther
DA=
Any area not listed
U.S. Department of Education
Office of Educational Research and Improvement (OERI)
National Library of Education (NLE)
Educational Resources Information Center (ERIC)
NOTICE
Reproduction Basis
41)
ENucallmal Sumo hUirrutite Cmtei
This document is covered by a signed "Reproduction Release (Blanket)"
form (on file within the ERIC system), encompassing all or classes of
documents from its source organization and, therefore, does not require a
"Specific Document" Release form.
This document is Federally-funded, or carries its own permission toreproduce, or is otherwise in the public domain and, therefore, may be
reproduced by ERIC without a signed Reproduction Release form (either
"Specific Document" or "Blanket").
EFF-089 (1/2003)