DOCUMENT RESUME ED 468 569 UD 035 248 AUTHOR Fairlie, Robert W. TITLE Private Schools and "Latino Flight" from Black Schoolchildren. JCPR Working Paper. INSTITUTION Joint Center for Poverty Research, IL. SPONS AGENCY Spencer Foundation, Chicago, IL. REPORT NO JCPR-WP-308 PUB DATE 2002-07-00 NOTE 40p.; Also funded by the University of California, Institute for Mexico and the United States. AVAILABLE FROM University of Chicago, Joint Center for Poverty Research, 1155 E. 60th Street, Chicago, IL 60637. Tel: 773-702-0472; Fax: 773-702-0926; Web site: http://wwww.jcpr.org. PUB TYPE Reports Research (143) EDRS PRICE EDRS Price MF01/PCO2 Plus Postage. DESCRIPTORS *Black Students; Family Income; *Hispanic American Students; *Private Schools; Public Schools; *Racial Attitudes; *Racial Composition; Secondary Education IDENTIFIERS *Latinos ABSTRACT Several recent studies provide evidence that the choice between private and public schooling among white students is influenced by the racial composition of the local student population. None of these studies, however, examine whether Latinos are also fleeing to private schools in response to black schoolchildren. This study explores the "Latino flight" hypothesis using data from the National Educational Longitudinal Study and a recently released confidential dataset from the National Center for Education Statistics. In probit regressions for the probability of attending private school among Latinos, the study finds a large, positive, and statistically significant coefficient on the black share of the school-age population. The coefficient estimates imply that a 10 percentage point increase in the black share increases the probability of private school attendance by 25.7 to 33.2 percent among Latino 8th graders and 35.2 to 52.2 percent among Latino 10th graders. These results provide evidence of "Latino flight" from public schools into private schools. An appendix presents means of selected variables. (Contains 34 references.) (Author/SM) Reproductions supplied by EDRS are the best that can be made from the original document.
Transcript
DOCUMENT RESUME
ED 468 569 UD 035 248
AUTHOR Fairlie, Robert W.
TITLE Private Schools and "Latino Flight" from BlackSchoolchildren. JCPR Working Paper.
INSTITUTION Joint Center for Poverty Research, IL.SPONS AGENCY Spencer Foundation, Chicago, IL.
REPORT NO JCPR-WP-308
PUB DATE 2002-07-00NOTE 40p.; Also funded by the University of California, Institute
for Mexico and the United States.AVAILABLE FROM University of Chicago, Joint Center for Poverty Research,
1155 E. 60th Street, Chicago, IL 60637. Tel: 773-702-0472;Fax: 773-702-0926; Web site: http://wwww.jcpr.org.
PUB TYPE Reports Research (143)
EDRS PRICE EDRS Price MF01/PCO2 Plus Postage.DESCRIPTORS *Black Students; Family Income; *Hispanic American Students;
*Private Schools; Public Schools; *Racial Attitudes; *RacialComposition; Secondary Education
IDENTIFIERS *Latinos
ABSTRACT
Several recent studies provide evidence that the choicebetween private and public schooling among white students is influenced bythe racial composition of the local student population. None of thesestudies, however, examine whether Latinos are also fleeing to private schoolsin response to black schoolchildren. This study explores the "Latino flight"hypothesis using data from the National Educational Longitudinal Study and arecently released confidential dataset from the National Center for EducationStatistics. In probit regressions for the probability of attending privateschool among Latinos, the study finds a large, positive, and statisticallysignificant coefficient on the black share of the school-age population. Thecoefficient estimates imply that a 10 percentage point increase in the blackshare increases the probability of private school attendance by 25.7 to 33.2percent among Latino 8th graders and 35.2 to 52.2 percent among Latino 10thgraders. These results provide evidence of "Latino flight" from publicschools into private schools. An appendix presents means of selectedvariables. (Contains 34 references.) (Author/SM)
Reproductions supplied by EDRS are the best that can be madefrom the original document.
Private Schools and "Latino Flight" from Black Schoolchildren
JCPR Working Paper
Robert W. Fair lieDepartment of Economics; University of California, Santa Cruz and Joint Center for Poverty
Research, Northwestern University and University of Chicago
July 2002
This research was funded by grants from the Spencer Foundation and the University of CaliforniaInstitute for Mexico and the United States. The data presented, the statements made, and theviews expressed are solely the responsibility of the author. I would like to thank Manuel Pastorfor helpful comments. Bill Koch and Garima Vasishtha provided excellent research assistance.
BEST COPY AVAILABLE.
U.S. DEPARTMENT OF EDUCATIONOffice of Educational Research and Improvement
EDUCATIONAL RESOURCES INFORMATIONCENTER (ERIC)
Vhis document has been reproduced aseceived from the person or organization
originating it.
Minor changes have been made toimprove reproduction quality.
Points of view or opinions stated in thisdocument do not necessarily representofficial OERI position or policy.
PERMISSION TO REPRODUCE ANDDISSEMINATE THIS MATERIAL HAS
BEEN GRANTED BY
r) 7__\1I'k t .(601111
L4i.O' 1 1q 1,
TO THE EDUCATIOINFORMATION CENTER (ERIC)
1
ES
Abstract
Several recent studies provide evidence that the choice between private and public schoolamong white students is influenced by the racial composition of the local student population.None of these studies, however, examines whether Latinos are also fleeing to private schools inresponse to black schoolchildren. I explore the "Latino flight" hypothesis using data from theNational Educational Longitudinal Study (NELS) and a recently released confidential datasetfrom the National Center for Educational Statistics (NCES). In probit regressions for theprobability of attending private school among Latinos, I find a large, positive and statisticallysignificant coefficient on the black share of the school-age population. The coefficient estimatesimply that a 10 percentage point increase in the black share increases the probability of privateschool attendance by 25.7 to 33.2 percent among Latino 8th graders and 35.2 to 52.2 percentamong Latino 10th graders. I interpret these results as providing evidence of "Latino flight" frompublic schools into private schools. I do not find evidence that Latinos respond differently toblack schoolchildren than do whites.
Robert W. Fair lieDepartment of EconomicsUniversity of CaliforniaSanta Cruz, CA 95604(831) [email protected]://econ.ucsc.edut--fairlie
INTRODUCTION
Critics of private school tuition vouchers contend that vouchers will lead to more racial
segregation in the nation's schools. Perhaps contributing to these concerns, several recent studies
provide evidence that the choice between private and public school among white students is
influenced by the racial composition of the local student population. For example, Conlon and
Kimenyi (1991), Lankford, Lee, and Wyckoff (1995), Lankford and Wyckoff (1992, 1997),
Fair lie and Resch (2002), and Andrews (2002) provide evidence of "white flight" from minorities
or blacks, supporting the findings of earlier studies such as Clotfelter (1976) and Coleman,
Hoffer, and Kilgore (1982). Although there is a little direct evidence on causes, these studies
generally speculate that "white flight" may be due to prejudice, assumptions about the preferences
of black schoolchildren and their parents, and the use of the racial composition of a school as a
signal of academic quality.
To be sure, however, no consensus has been reached in the literature on the existence of
white flight. Buddin, Cordes and Kirby (1998) and Figlio and Stone (1999) find that the
probability of attending private school among all students in insensitive to the minority share of
the population. In addition, Lankford and Wyckoff (1992) find that white children are more
likely to attend public high school when these schools have larger concentrations of black
students)
Perhaps, the attention drawn to this question in recent years is not surprising given the
threat to school integration posed by "white flight" from minority or black schoolchildren into
private schools.2 Overlooked, however, is that flight by other ethnic and racial groups to private
schools may also be detrimental to integration efforts. In particular, an important question is
whether Latinos, who represent a rapidly growing proportion of the school-age population, are
fleeing to private schools in response to black schoolchildren. The share of the school-age
They find a negative relationship, however, for public elementary students.
4
population that is Latino is expected to grow from 11.9 percent in 1990 to 21.5 percent by 2020,
whereas the white, non-Latino share is projected to decline from 69.3 percent to 55.1 percent
(U.S. Bureau of the Census, 1996). None of the previous studies in the literature, however,
explores whether the racial composition of the local student population influences private school
choice among Latino schoolchildren.
Although there is evidence that black schoolchildren have similarly small or non-existent
effects on the academic achievement of white and Latino public school students (Hanushek, Kain,
and Rivkin, 2001), there are several other factors suggesting that Latinos may respond differently
than whites to the presence of black schoolchildren. First, Latino schoolchildren have a higher
likelihood of interacting with black schoolchildren than white schoolchildren. Part of this is
driven by patterns of geographical segregation with lower levels of segregation between blacks
and Latinos than between blacks and whites.3 Examining schools directly, the average Latino
student attends a school with 11.8 percent black and the average white student attends a school
with 8.6 percent black (Orfield and Yun, 1999). I provide additional evidence below of higher
levels of integration between Latinos and blacks than between whites and blacks even after
controlling for the racial composition of the metropolitan area. Although this comparison
suggests that the conditions for flight differ between Latinos and whites, however, it does not
provide any intuition on whether Latinos are more or less likely than whites to respond to black
schoolchildren.
Related to the issue of segregation, the contact hypothesis posits that close and sustained
contact between ethnic and racial groups promotes tolerance by removing negative stereotypes
(Allport 1954, Jackman and Crane 1986, and Sigelman and Welch 1993, Stephan 1987, and
Powers and Ellison 1995). At a first pass, the contact hypothesis suggests that the higher levels
2 Additional threats to school integration include residential flight from blacks (Clotfelter 2001, Crowder2000) and flight to charter schools (Weiher and Tedin 2002).
5
of integration between Latinos and blacks than between whites and blacks should lead to more
racial tolerance. This interpretation, however, depends on the assumption that Latinos and whites
have the same underlying level of tolerance, which may or may not be the case.
Comparisons between white and Latinos in their reported attitudes towards blacks
provide mixed results. For example, whites and Latinos report similarly low levels of objections
to residential integration with blacks (Bobo and Zubrinsky 1996), but Latinos report more often
than whites that blacks were "hard to get along with" relative to how they viewed their own group
(Massagli 2000). An examination of whether racial similarity is an important factor in school
choice is also unrevealing. Very few students report racial similarity as an important factor in
school choice (Schneider, Marscall, Teske and Roch, 1998, and Weiher and Tedin, 2002).
Interestingly, however, Weiher and Tedin (2002) find that race is a powerful predictor of which
charter schools are actually attended. In the end, it is difficult to compare reported racial attitudes
between Latinos and whites because of the social stigma of expressing intolerant views and the
subjectivity of questions, but differences between the two groups in economic competition,
school and residential integration, and historical relationships with blacks suggest that differences
in racial attitudes may exist.
White and Latino schoolchildren may also differ in their ability to attend private school
because of high tuition costs or proximity. The average tuition is $2,138 for private elementary
schools and $4,578 for private secondary schools (U.S. Department of Education, 2000). Low
levels of income are likely to limit the opportunities of many Latino schoolchildren to attend
private school relative to white schoolchildren.4 The median family income among Latino
families in 1989 was $25,064, compared to $37,628 among white, non-Latino families (U.S.
3 The black/Latino dissimilarity index is more than 10 percentage points lower than the black/whitedissimilarity index, and the average Latino lives in a neighborhood in which blacks comprise 10.8 percentof the population compared to 6.7 percent for whites (Logan, 2001).4 Using 1990 Census data, Betts and Fairlie (2001) find that ethnic/racial differences in household incomeexplain roughly 30 to 35 percent of the gap in private school attendance rates between native-born whitesand all minorities.
BEST COPY AVAILABLE
Bureau of the Census 1993). Working in the opposite direction, however, I provide evidence
below that Latino schoolchildren live closer to private schools on average than white
schoolchildren.
Finally, Latinos and whites may have different attitudes about private school. For
example, Latinos are more likely to support private school tuition vouchers than are non-Latinos.
Surveys leading up to the November 2000 California ballot conducted by the Public Policy
Institute of California indicated that Latinos were less likely to oppose Proposition 38, the 'school
vouchers' initiative than were non-Latinos (Baldassare, 2000). In addition, a national poll taken
by the Joint Center for Political and Economic Studies indicates that 65 percent of Latinos
supported private school tuition vouchers, compared to 48 percent of whites (JCPES, 1997).
Taken together, these dissimilarities suggest that inferences about the existence and/or magnitude
of "Latino flight" cannot be inferred from the findings for "white flight."
In this paper, I explore the "Latino flight" hypothesis using data from the National
Educational Longitudinal Study (NELS) and a recently released confidential dataset from the
National Center for Educational Statistics (NCES). This special release, unlike the standard
restricted-use version of the NELS, allows one to identify the exact residential location of all
members of the National Educational Longitudinal Study (NELS).5 The NELS is an
exceptionally rich data source providing information on many student and parental
characteristics, including detailed geographical location, religious affiliation, school
characteristics, and racial attitudes, that are not available in other sources, such as the Census or
Current Population Survey. Furthermore, the NELS oversamples Latino students.
5 The standard restricted-use version of the NELS only contains information on the student's state ofresidence and the location of attended public schools. Therefore, it has been impossible to identify theexact residential locations of all respondents. The recently released dataset that I use, however, containsdemographic data from the 1990 Census at the zip code level for each student in the NELS. Withpermission from the NCES, l used data from the 1990 Census STF 3B Files and a special matching routineto identify each respondent's residential zip code.
WEg COPY AVAILABLE7
I use these data to first compare levels of exposure to black schoolchildren among
Latinos and whites attending public schools. I then compare income levels, racial attitudes, and
distances to private schools. I also document racial differences in private school attendance rates
and examine how these patterns contribute to the racial composition of the private and public
school systems. To explore the "Latino flight" hypothesis, I examine whether Latinos are
choosing to attend private schools in response to the presence of black schoolchildren in the
public schools. I also make comparisons to levels of "white flight" from black schoolchildren.
DATA
I use data from the National Educational Longitudinal Study (NELS) and a recently
released confidential dataset from the National Center for Educational Statistics (NCES). The
NELS follows a national sample of American youths who were enrolled in the eighth grade in
1988 at two-year intervals.6 In this analysis, I use data from the 1988 base year and the 1990 first
follow-up. These two years of data allow me to examine the determinants of attending private
school at both the 8th and 10th grade levels.
The data include detailed information on the student and his/her family. In addition to
measures of family income and parental education, I use information on religion and racial
attitudes, which are not available in most other national data sources. I also append school and
community characteristics from various sources to these individual-level data. As noted above,
the restricted-use version of NELS that has been available for several years does not allow one to
identify the residential location of respondents below the state level. Although the restricted-use
version identifies the public schools attended by NELS respondents, it does not identify private
schools. This information, however, would be less useful as many private school students are
likely to attend schools outside of their immediate residential area.
6 See Huang, et al. (1996) for more details on the NELS.
To identify residential locations, I use a recently released dataset from the NCES that
contains 1990 Census demographic data at the zip code level for each NELS respondent. This
dataset, however, does not identify actual zip codes. With permission from the NCES, I use data
from the 1990 Census STF 3B Files to match to this dataset, and thus identify each student's zip
code. The zip codes are used to calculate distances to private schools and to identify each
student's county of residence.' After identifying the county of residence I identify the student's
PMSA by using the county-based definitions of PMSAs provided on the 1994 USA Counties
CDROM.
In the main analysis sample, I include only Latino children who are currently enrolled in
school. The categories for race/ethnicity in NELS are mutually exclusive. Thus, there are
separate responses for "Hispanic" and "white, non-Hispanic." In most of the analyses, I do not
differentiate between Catholic, other religious, and secular private schools due to small sample
sizes. I also do not differentiate between religious and secular private schools because both are
alternatives to public schooling and the key question in this study is whether Latino children
choose to opt out of the public school system in response to large concentrations of black
schoolchildren. I am motivated by how this affects the resulting racial composition of the public
schools and am less concerned with the type of private school these students attend.
INTERACTION WITH BLACK SCHOOLCHILDREN
Before directly testing the "Latino flight" hypothesis, it is useful to compare levels of
racial interaction in the public schools. In particular, within the public school system, are levels
of Latino/black segregation higher than levels of white/black segregation? In particular, do
7 Identifying counties from zip codes, however, is not straightforward as many zip codes cross countyboundaries. I therefore use the following algorithm to identify the county of residence. First, I eliminatecounties in which the zip code only captures non-residential parts of that county. This step allowsassignment of a unique county of residence to approximately 90 percent of the total sample. Second, forthe remaining public school students I use the county of the student's school. Third, for the remaining
9BEST COPY AVAILABLE
Latino schoolchildren have a higher likelihood of interacting with black schoolchildren than do
white schoolchildren? The level of interaction with black schoolchildren may have implications
for the existence and level of private school flight among Latinos and whites.
To explore these issues, I examine the racial composition of public schools attended by
Latinos and make comparisons to the racial composition of public schools attended by whites. It
is important to note, however, that the racial composition of a school must be measured relative to
the racial composition of the surrounding area. For example, a school located in the Washington,
D.C. metropolitan area with the same percentage of black students as a school located in the
Minneapolis metropolitan area implies a different level of segregation. Therefore, I use the
difference between the black share of the student's school and the black share of the student's
PMSA as a measure of school segregation.' I calculate this measure for Latino and white 8th and
10th-grade students and report the results in Figures 1-2.
The results presented in Figures 1-2 paint a clear picture: Latino schoolchildren are more
likely to interact with black schoolchildren than are white schoolchildren. For example, 9.9 to
12.3 percent of Latinos attend public schools that have substantially larger concentrations of
blacks than their PMSAs (defined as having black shares that are at least 15 percentage points
greater than the share of blacks in the PMSA). In contrast, only 4.2 to 4.9 percent of white public
school students attend schools with this level of interaction with black schoolchildren. At the
other end of the distribution, Latinos are much less likely than whites to attend public schools
with relatively low percentages of black students. Only 11.0 to 11.4 percent of Latinos attend
public schools that have a black share difference of less than 15 percentage points, whereas 23.1
to 24.7 percent of whites attend these types of schools.
private school students I use the county that represents the largest fraction of the total population for thatzip code.8 Previous studies argue that racial integration should be measured at the class level due to the presence oftracking (see Chubb and Moe 1996 and Greene 1999 for example). I do not follow this approach becauseof small black and Latino sample sizes.
10
Overall, these results indicate that Latinos are more likely than whites to interact with
blacks in the public school system holding constant the racial composition of the metropolitan
area. Although these results do not suggest whether Latinos are more or less likely to respond to
blacks than whites, they indicate the possibility that Latinos may respond differently to black
schoolchildren than whites. Of course, there may be many other factors that differ between
Latinos and whites, and that have an important effect on racially motivated flight to private
schools. I examine a few relevant factors below.
LATINO/WHITE DIFFERENCES IN INCOME, PROXIMITY TO PRIVATE SCHOOLS,
AND RACIAL ATTITUDES
Latinos may have fewer opportunities to flee to private schools than whites. Perhaps the
most important constraint is that Latinos have lower levels of family income than whites. In
Table 1, I report estimates of family income in 1987-88 for Latino and white 8th graders. Only
categorical responses are available in the NELS. The results clearly indicate that Latino
schoolchildren live in families with substantially lower levels of income. For example, 37.5
percent of Latino schoolchildren have family incomes of less than $15,000, whereas only 14.1
percent of white schoolchildren have family incomes at this level. Furthermore, whites are more
than two and a half times as likely to have family incomes of at least $50,000 than are Latinos
and are nearly 4 times as likely as Latinos to have family incomes of at least $100,000. The
lower levels of family income may limit racially motivated private school flight among Latinos.
Another potential constraint to private school flight is that private schools are less likely
to be located in the geographical areas in which Latinos live. Concerns about the accessibility of
private schools across different racial groups have been important in debates over private school
tuition vouchers. In Table 1, I report the average distance to the closest school for both Latinos
and whites. I create this variable by first identifying the longitude and latitude of all zip codes in
the United States. For each NELS respondent I then calculate the distance to every private school
11
with at least 100 students.9 Surprisingly, Latinos live closer to private schools on average than do
whites. They live an average of 5.3 kilometers away from the closest private school, which is
nearly half the average distance for whites. Therefore, racially motivated flight to private schools
among Latino schoolchildren should not be limited by a lack of proximity to private schools.
Previous studies speculate that one of the underlying causes of "white flight" may be
personal prejudice against black or minority schoolchildren (Conlon and Kimenyi 1991 and
Lankford and Wycoff 1997). I° Latinos and whites may differ in their levels of personal
prejudice toward black schoolchildren. The NELS contains a variable that provides some
suggestive evidence related to this hypothesis. Students were asked the following question on the
10th grade survey: "How often do you feel it is 'OK' for you to make racist remarks?""
Respondents were allowed to choose one of the following responses: (i) "Often", (ii)
"Sometimes", (iii) "Rarely", and (iv) "Never." I report estimates of the percentages of Latinos
and whites providing each of these possible responses. Interestingly, Latino and white 10th
graders do not differ substantially in their responses to this question. Slightly more white
schoolchildren than Latino schoolchildren report feeling that it is okay to make racist remarks
"often," "sometimes," or "rarely." Although the "racist remarks" question in the NELS is very
subjective and much caution is warranted in interpreting these results, they do not provide
evidence suggesting that Latino and white schoolchildren have different racial attitudes. In the
end, however, it is difficult to make comparisons as Latinos and whites may differ in how they
view what constitutes a "racist remark" and how they react to the social stigma of the question.
9 I thank Todd Elder for providing a Matlab program that calculates the distance between any two pointsgiven their longitude and latitude. A Fortran version of the program is available at the National Oceanicand Atmospheric Administration, National Geodetic Survey web page:ftp://ftp.ngs.noaa.gov/pub/pcsoft/for inv.3d/sourcelinverse.for. Private school zip codes are obtained fromoriginal records of the 1989-90 Private School Survey. I obtained a special listing from Steve Broughmanat the NCES.I° Fairlie and Resch (2002) examine whether racially motivated private school flight is stronger amongwhite children who "feel it's okay to make racist remarks" than among other white children. All of theirestimates, however, are statistically insignificant at conventional levels.II The parents are likely to make the school sector choice, but we expect that a child's response to thisquestion partly reflects his/her parents' attitudes towards race.
SST COPY AVAILABLE12
PRIVATE SCHOOL ENROLLMENT RATES BY RACE
In Table 2, I report private school enrollment rates by race for 8th grade students in 1987-
88 and 10th grade students in 1989-90. By using sample weights provided by the NELS, the
estimates are representative of the U.S. population of 8th and 10th graders in 1987-88 and 1989-
90, respectively. The estimates indicate that Latino schoolchildren are less likely to attend private
school than white schoolchildren, but are more likely to attend private school than black
schoolchildren:2 Among Latino 8th and 10th graders, 9.5 and 8.4 percent attend private schools,
respectively. In contrast, only 7.1 percent of black 8th graders and 6.9 percent of black 10th
graders attend private school. Slightly more than 13 percent of white 8th graders and 11 percent
of white 10th graders attend private school.
These estimates imply that black schoolchildren are underrepresented in the private
school system relative to the public school system. Table 3 also reports aggregate racial
compositions in public and private schools. As expected from the patterns in private school rates,
the black share of all private schoolchildren is much smaller than the black share of all public
schoolchildren. Blacks comprise 12.5 to 14.0 percent of all public schools students, but only 7.7
to 7.8 percent of all private school students. Latinos also comprise a lower percentage of all
private school students than public school students, but the difference is not as large.
The racial composition of Catholic schools is also reported. From 83.1 to 88.6 percent of
Latinos attending private schools attend Catholic schools. The results indicate that blacks remain
underrepresented in Catholic schools relative to public schools, although the difference is not as
large as for all private schools. The results for Latinos, however, differ from above. Latinos
comprise 10.8 and 9.3 percent of all 8th- and 10th-grade Catholic school students, respectively.
These shares of all Catholic school students are similar to those for all public school students.
12 The relative patterns are similar for estimates of primary and secondary private school rates for an urbansample from the 1990 Census as reported in Betts and Fairlie (2001).
13
At the aggregate level there appears to be a high level of racial sorting into the private
and public school systems. From these patterns, we might suspect that if "Latino flight" from
black schoolchildren occurs it should be, on average, from public schools into private schools.
PRIVATE SCHOOL FLIGHT AMONG LATINOS
To test the "Latino flight" hypothesis, I first create and estimate a reduced-form equation
for private school attendance. I assume that private school is determined by an unobserved latent
variable,
(6.1) Y,* = X,'fl + ,
where X, includes student, parental, school and geographical area characteristics, and e, is the
disturbance term. Only the dichotomous variable, Y,, is observed, however. It equals 1 if Y,"
(denoting private school attendance) and equals 0 otherwise (denoting public school attendance).
If we take e1 to be normally distributed, the assumptions imply that the data are described by a
probit model. Although the normality assumption should only be taken as an approximation, the
probit model provides a useful descriptive model for the binary event that a student attends
private school.
A complication arises, however, in the use of a standard probit regression because the
NELS includes an oversample of private school students. To correct for this problem I use a
choice-based sampling maximum likelihood estimator (CBSMLE).13 The likelihood function for
this estimator is weighted to account for the oversample of ones for the dependent variable.
Observations in which Y=0 and Y=1 are given weights of Pw/Pu and (1-Pw)/(1-Pu), respectively,
where 13V11 is the private school rate calculated using sample weights provided by the NELS, and
Pu is the unweighted private school rate.
13 See Amemiya (1985) for more details.
14
I estimate several choice-based sample corrected probit regressions for the probability of
attending private school using a sample of Latino students. In addition to measures of student,
parental, school and geographical area characteristics, I include the black share of the school-age
population. The coefficient on this variable provides evidence on whether the private/public
school choices of Latino schoolchildren are sensitive to the pres'ence of black schoolchildren.
I measure the black share of the population at both the county and PMSA-levels. The
main advantage to using the county-level measure is that it captures a smaller geographical area,
and is thus less likely to suffer from problems associated with aggregating heterogeneous areas.
There are a few disadvantages, however, to using the county-level measure. The first of these is
particularly important. Suppose that Latinos respond to high concentrations of blacks not by
enrolling their children in private school, but instead by moving to other neighborhoods where the
public schools have fewer black students. This may cause an upward bias on the coefficient
estimate for the black proportion of the population if one focuses on narrow geographic areas
such as counties. Specifically, any movement from high-black school districts to low-black
school districts increases the private school rate in the sending district and decreases the private
school rate in the receiving district, thus implying a larger positive correlation between the private
school rate and the minority share. In contrast, the use of PMSAs as the unit of analysis greatly
reduces this problem because these areas typically encompass many neighborhoods:4
A second but related rationale for using PMSAs concerns the endogeneity of households'
location more generally. Families are more likely to move between districts or counties within a
PMSA as a result of variations in school quality than they are to move between PMSAs. Moves
between PMSAs are likely to be influenced mainly by factors apart from schooling, such as the
availability of jobs or the presence of family members. This suggests that the simultaneity of
14 It would also be interesting to examine whether Latino families move to alternative school districts orcounties in response to black schoolchildren. However, it is difficult to distinguish between whether thelocational choices of Latinos are determined by the presence of blacks in the public schools or by thepresence of blacks in the neighborhood. These issues are beyond the scope of this paper.
BEST COPY AVAILABLE15
location decisions and school sector choices poses less of a problem when the unit of analysis is
the PMSA than when it is a smaller geographical area, such as a county.
The third justification for using PMSAs as the unit of analysis is that they more
accurately represent markets for private schools than do counties or school districts. Certainly,
many families send their children across county lines to private schools.
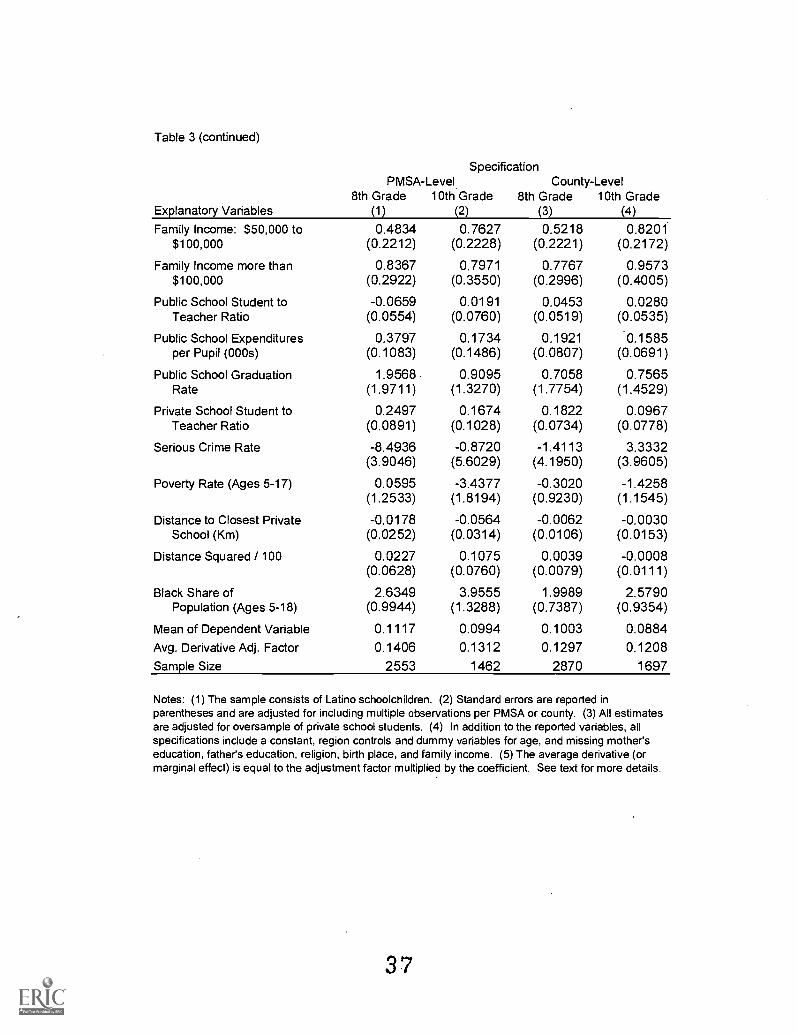
Taking these arguments into consideration, I estimate separate regressions using PMSA
and county-level measures of the black share of the school-age population.I5 I first discuss the
results for the PMSA-level measures (reported in Specifications 1 and 2 of Table 3). I estimate
separate regressions for the samples of 8th- and 10th-grade students. In addition to the black
share variable, I include controls for age, sex, country of birth, number of siblings, religion,
parental education, family income, distance to the closest private school, private and public
school quality, poverty rate, and crime:6 The coefficients on the individual-level variables
generally have the expected signs. The probability of attending private school increases sharply
with mother's and father's education level, and family income. Surprisingly, the main exception
is that religion appears to have little effect on the private school attendance probability. The
coefficient on the Catholic religion dummy variable is statistically insignificant in both
specifications. The coefficient estimates on the school and geographical area variables are
generally statistically insignificant. The standard errors on these variables are adjusted for
including multiple observations per PMSA. This is important in an individual-level equation that
includes aggregate market variables because the downward bias in OLS standard errors can be
extremely large (Moulton 1986). 1 estimate Huber-White corrected standard errors.
15 The NELS sample of Latino eighth-graders resides in 155 different PMSAs and 333 different counties inthe United States: The Latino tenth-graders reside in 132 different PMSAs and 272 different counties.These observations are fairly spread out across PMSAs and counties as roughly 75 and 85 percent of thePMSAs and counties represented in the sample contain 10 or fewer observations, respectively.16 Means are reported in the Appendix. The public school student to teacher ratio, expenditures per pupiland graduation rate variables are from the Common Core of Data (CCD). The state-level private student toteacher variable is from the 1989-90 Private School Survey as reported in the 1993 Digest of EducationStatistics. The serious crime rates for 1987 and 1989 are from the 1994 USA Counties CDROM.
16 BEST COPY AVAILABLE
I now turn to the results for the black share of the school-age population." In both
specifications, the coefficient estimate is positive and statistically significant. The estimates also
imply fairly large effects. Among Latino 8th graders, a 10 percentage point increase in the black
share increases the probability of private school attendance by 0.037, which represents 33.2
percent of the Latino private school rate:8 The effect among Latino 10th graders is even larger.
A 10 percentage point increase in the black share increases the private school rate by 0.052 or
52.2 percent. These results are consistent with "Latino flight" to private schools in response to
large concentrations of black schoolchildren.
I also estimate probit regressions that include county-level measures of the black share of
the population, public school student to teacher ratio, public school expenditures per pupil, public
school graduation rate, poverty rate and crime rate (reported in Specifications 3 and 4). The
number of observations used in these regressions is larger because many NELS respondents live
in counties that are located outside of PMSAs. The coefficient estimates on the controls do not
differ substantially from the PMSA-level regressions. More importantly, however, the coefficient
estimates on the black share are large, positive and highly significant:9 The coefficients using
the county-level measures imply that a 10 percentage point increase in the black share increases
the private school probability by 0.026 (25.7 percent) among 8th graders and 0.031 (35.2 percent)
17 This variable is obtained from the Census STF 3C files. I define the school-age population as ages 5-18in both specifications. I also estimate probit regressions in which I measure the black share for ages 5-14using the 8th-grade sample and the black share for ages 14 to 18 using the 10th grade sample. Thecoefficient estimates are very similar to the reported estimates (due to the high degree of collinearitybetween the measures). I argue that the entire age range is a more appropriate measure as Latino parentsmay simply use the race of all children in the local area to make inferences about the racial composition ofthe public schools.18 These estimates are calculated by multiplying the coefficient estimate by the average derivativeadjustment factor reported at the bottom of Table 4. The average derivative adjustment factor isL'Aca(X,WN, where fi, is the coefficient on the minority share and 0 is the normal probability densityfunction. The effect of a one unit increase in any of the independent variables on the private schoolprobability can be estimated by multiplying the coefficient on that variable by the average derivativeadjustment factor.19 These estimates and those using the PMSA-level measure are not sensitive to outliers. I removed allobservations in which the black share was less than 0.01 and greater than 0.50 (which represents 9 to 27percent of the original samples) and found similar coefficient estimates.
17
among 10th graders. Thus, the county-level regressions provide additional evidence of "Latino
flight" from black schoolchildren.
As a check of the robustness of these results, I estimate three additional sets of probit
regressions. Table 4 reports results for the black share coefficients.2° First, I estimate regressions
that do not include the distance variables because of the potential endogeneity issues associated
with this variable. The black share coefficient estimates are very similar. They remain
statistically significant and range from 2.0230 to 3.9309. Second, as noted above many values for
religion and family income variables are missing for the NELS sample. In the main
specifications, I include dummy variables for these missing values to increase the sample size.
As a robustness check, I estimate a set of probit regressions that exclude these observations.
Although the sample sizes decline by 18 to 23 percent, the coefficients do not change appreciably
and three of the four remain statistically significant at conventional levels. The coefficients range
from 2.1667 to 3.7622. Finally, I estimate 10th-grade regressions that include 8th-grade test
scores. The coefficient on the PMSA-level black share is 4.6478, and the coefficient on the
county-level black share is 2.8247. Both of these coefficients are statistically significant and
larger than in the main specification.
To summarize, I find that the black share of the school-age population measured at both
the PMSA and county levels has a positive and statistically significant effect on the probability of
private school attendance among Latino schoolchildren. These results are robust to alternative
specifications and samples, and provide evidence that Latino students enroll in private schools in
response to large concentrations of black students.
I should note, however, that as with any cross-sectional analysis these results are
potentially biased due to omitted variables. Although I have included a long list of individual and
family characteristics, geographical controls, school-quality measures, and local area
characteristics, there may exist additional factors that are correlated with both the black share of
18
the population and the private/public school choices of Latinos. In particular, my regressions
may not have completely controlled for difference in school quality. The main concern is the
possibility that Latinos are simply trying to avoid low-quality school systems in which blacks
may disproportionately attend. To be sure, I include several measures of school quality, such as
the student to teacher ratio, expenditures per pupil and high school completion rate, however,
these may not be enough. In particular, it would be useful to include a measure of average
changes in test scores in public schools. Unfortunately, no national standard test scores were
available in 1990. NELS includes a standardized test score, but this is only for individual
students in the sample. NELS does not provide information on average test scores for students'
schools.
Transitions from Private to Public School
Another empirical approach to examining the "Latino flight" hypothesis is to identify the
determinants of transitions between the private and public school systems. In particular, the
finding that the black share increases the probability that a student switches from public to private
school or decreases the probability that a student switches from private to public school is
consistent with the "Latino flight" hypothesis. The NELS contains observations for the same
students in both the 8th and 10th grades. I examine whether the black share of the school-age
population affects the probability that a student switches from private school in the 8th grade to
public school in the 10th grade. I would also like to examine the determinants of transitions from
public school in 8th grade to private school in 10th grade, however, there are only 8 out of 1628
public 8th graders making this transition. The sample sizes for the transition from private school
to public school are higher (52 out of 185), but remain relatively small.
I estimate several probits for the probability of a transition from private to public school.
The dependent variable in these probit regressions equals 1 if the student switches from a private
20 Although not reported, I also check the sensitivity of results to outliers.
19
school in 8th grade to a public school in 10th grade and equals 0 if the student remains in a
private school in both grades. I briefly discuss the results. As expected, many of the coefficients
have the opposite sign as those reported in Table 3. For example, the estimates indicate that the
probability of a transition from private to public school decreases with family income and father's
education. This is consistent with the positive coefficients found in the cross-sectional
regressions. Turning to the results for the black share of the school-age population, I find
negative point estimates for the black share in both the PMSA-level and county-level
specifications. However, the coefficient in the county-level specification is not statistically
significant, and the coefficient in the PMSA-level specification is not robust to alternative
specifications.21 With the standard set of controls the coefficient in the PMSA-level specification
equals -14.3673. After removing the high school completion rate, crime rate and poverty rate it
drops to -5.3672. The sensitivity of this estimate may have to do with the small sample sizes and
high level of correlation between these measures and the black share.
Although these results are only suggestive, they are useful in checking the robustness of
the signs of my cross-sectional estimates. For both levels of analysis, the point estimates are
negative, which is consistent with the positive coefficients found earlier and with the "Latino
flight" hypothesis.
Comparison to Estimates of "White Flight"
As noted above, several recent studies provide evidence of "white flight" from
black schoolchildren (see Conlon and Kimenyi 1991, Lankford, Lee, and Wyckoff 1995,
Lankford and Wyckoff 1992, 1997 and Fairlie and Resch 2002, Andrews 2002 for example).
Using data from the NELS, I estimate several choice-based sample corrected probit regressions
21 The black share coefficient in the county-level probit regression is -1.936 with a standard error of 2.808.The point estimate implies that a 10 percentage point increase in the black share decreases the private topublic transition probability (mean=0.279) by 0.046.
for the probability of attending private school among a pooled sample of white, non-Latino, black
and Latino students. I include an interaction between white race and the black share to examine
whether Latinos and whites differ in how they respond to black schoolchildren. Panel I of Table
5 reports estimates. For brevity, I only report estimates for race dummies, the black share, and
race/black share interactions although all controls are included.
I generally find large positive and statistically significant coefficients on the white race
dummy variable. White children are more likely to attend private school, even after controlling
for parental education, family income, school-quality, and other characteristics. The main effect,
represented by the black share coefficient, remains large, positive and statistically significant in
all specifications. Therefore, the pooled estimates do not change the conclusions regarding the
effect of the black share on private/public school choices of Latinos.
Of most interest, however, are the white race/black share interaction coefficients. The
coefficients provide an estimate of the difference between the effect of the black share on the
probability of private school attendance among whites and the effect of the black share on the
probability of private school attendance among Latinos. In all of the specifications, the
white/black share interaction coefficient is statistically insignificant. Furthermore, the point
estimates are positive in two specifications and negative in two specifications. Overall, these
estimates do not provide evidence that Latinos and whites respond differently to large
concentrations of black schoolchildren.
The probit regressions reported in Panel I of Table 5 also include a black race and black
race/black share interaction variable. The interaction coefficient is large and negative in all
specifications, but is statistically insignificant. The lack of statistical significance makes these
results difficult to interpret. The large and negative point estimates may suggest that blacks are
less likely to respond to the black school-age population than are Latinos, which is consistent
with "Latino flight" being partly driven by prejudice. On the other hand, the sum of the main
effect and black interaction point estimates remains positive in all specifications suggesting that
other factors may be partly responsible for flight. The total effect for blacks, however, is not
statistically different from zero in any of the specifications. Overall, these findings are
interesting, but unfortunately do not shed light on the existence or causes of "Latino flight."
"Latino Flight" among more Advantaged Students
Do more-advantaged Latinos respond differently to black schoolchildren than their less-
advantaged counterparts? Similar to the motivation for comparing levels of "white flight" to
"Latino flight" these groups may differ in their response to black schoolchildren in the public
schools. In particular, advantaged and disadvantaged Latinos may have different racial attitudes
towards blacks due to differences in levels of integration and perceived competition with blacks.
The estimates reported above indicate that higher levels of family income and parental education
have a strong positive effect on the probability of private school attendance among Latinos.
These estimates, however, do not tell us whether advantaged Latinos respond more to large
concentrations of black schoolchildren than do disadvantaged Latinos. Socioeconomic
differences in Latino flight may be especially troubling for public school administrators and
teachers in large urban school districts. If the most advantaged Latino students along with white
students increasingly opt to attend private schools then the remaining schoolchildren may be
denied important opportunities for positive peer group effects. In addition, public support for
these schools may erode, resulting in fewer resources.
I examine this hypothesis by interacting the black share of the school-age population
variable with the student's family income and parental education level. Results are reported in
Panels II and III of Table 5. I first discuss the results in which I include an interaction between
the black share and a dummy variable for family income of $35,000 or more. I find positive
coefficients in two of the specifications and negative coefficients in the remaining specifications.
None of the coefficients, however, is statistically significant. Therefore, the estimates do not
provide evidence that "Latino flight" differs by family income.
22
In Panel II of Table 5, I also include an interaction between the black share and a dummy
variable indicating whether the student has at least one college-educated parent. Similar to the
results for family income, none of the interaction coefficients is statistically significant.
Apparently, Latinos who have college-educated parents do not respond more to large
concentrations of black schoolchildren.
The coefficient estimates on the family income and parental education interactions are
statistically insignificant in all cases and small in magnitude in most cases. The signs on these
coefficients are also inconsistent. Therefore, the estimates do not provide evidence suggesting
that advantaged and disadvantaged Latinos differ in their response to black schoolchildren.
CONCLUSIONS
Using data from the National Educational Longitudinal Study (NELS) and a recently
released confidential dataset from the National Center for Educational Statistics (NCES), I
explore the "Latino flight" hypothesis. I find a large, positive and statistically significant
coefficient on the black share of the school-age population in probit regressions for the
probability of attending private school among Latinos. The coefficient estimates imply that a 10
percentage point increase in the black share increases the probability of private school attendance
by 25.7 to 33.2 percent among Latino 8th graders and 35.2 to 52.2 percent among Latino 10th
graders. I also estimate probit regressions using a sample of non-Latino whites. I do not find
evidence that Latinos respond differently to black schoolchildren than do whites.
I interpret these results as providing evidence of "Latino Flight" from public schools into
private schools. Although the results are fairly robust to alternative specifications and samples,
nevertheless, they are potentially biased due to omitted variables. In particular, it is very difficult
to completely control for differences in school quality. The regressions include several of the
measures of school quality used in the literature, however, the positive estimates may be partially
due Latinos avoiding low-quality school systems in which blacks may disproportionately attend.
23
Further research using alternative methodologies and data may shed light on this possibility and is
needed before a definitive conclusion can be reached.
Although several previous studies focus on whether the choice between private and
public schools among white students is influenced by the racial composition of the local student
population, similar choices among Latino students also pose a threat to school integration. It is
especially important in light of the rapidly growing share of the school-age population
represented by Latinos and the higher likelihood of Latinos than whites interacting with blacks in
the nation's public schools. Furthermore, Latinos show strong support for voucher programs
suggesting that "Latino flight" into private schools may increase substantially if these programs
become widespread. Assuming that the results of this study are due to race (i.e. racism, peer
group effects, etc...) and are not due to a spurious correlation, they provide suggestive evidence
that the introduction of private school vouchers may lead to increased segregation as families
have increased opportunities to enroll their children in homogenous schools. The impact on
segregation is an especially important concern given the 2002 Zelman v. Simmons-Harris
Supreme Court decision allowing private school tuition vouchers to be used at religious schools.
In the end, however, a definitive answer to whether private school vouchers will increase or
decrease racial and specifically Latino/black segregation in the nation's schools is only possible
after several large-scale and long-term experimental programs are implemented and evaluated.
24
REFERENCES
Allport, Gordon W. 1954. The Nature of Prejudice, Beacon Press.
Amemiya, Takeshi. (1985). Advanced Econometrics, Cambridge: Harvard University
Andrews, Kenneth T. 2002. "Movement-Countermovement Dynamics and the Emergence of
New Institutions: The Case of "White Flight" Schools in Mississippi," Social Forces 80(3): 911-
936.
Baldassare, Mark (2000). PPIC Statewide Survey: Californians and Their Government, Public
Policy Institute of California.
Betts, Julian R., and Robert W. Fairlie. 2001. "Explaining Ethnic, Racial, and Immigrant
Differences in Private School Attendance," Journal of Urban Economics, 50: 26-51.
Bobo, Lawrence, and Camille L. Zubrinsky. 1996. "Attitudes on Residential Integration:
Perceived Status Differences, Mere In-Group Preference, or Racial Prejudice?" Social Forces,
74(3): 883-909.
Buddin, Richard J., Joseph J. Cordes, and Sheila Nataraj Kirby. 1998. "School Choice in
California: Who Chooses Private Schools?," Journal of Urban Economics, 44: 110-134.
Clotfelter, Charles T. 1976. "School Desegregation, 'Tipping,' and Private School Enrollment,"
Journal of Human Resources 22: 29-50.
25
Clotfelter, Charles T. 2001. "Are Whites Still Fleeing? Racial Patterns and Enrollment Shifts in
Urban Public Schools, 1987-1996." Journal of Policy Analysis and Management, 20(2): 199-221.
Coleman, James S., Thomas Hoffer, and Sally Kilgore. 1982. High School Achievement : Public,
Catholic, and Private Schools Compared, New York : Basic Books.
Conlon, John R. and Mwangi S. Kimenyi. 1991. "Attitudes towards Race and Poverty in the
Demand for Private Education: The Case of Mississippi," Review of Black Political Economy
20:5-22.
Crowder, Kyle. 2000. "The Racial Context of White Mobility: An Individual-Level Assessment
of the White Flight Hypothesis." Social Science Research. 29(2): 223-257.
Fairlie, Robert W., and Alexandra M. Resch. 2002. "Is There White Flight into Private Schools?
Evidence from the National Educational Longitudinal Survey," Review of Economics &
Statistics, 84(1): 21-33.
Figlio, David N., and Joe A. Stone. 1999. "Can Public Policy Affect Private-School Cream
Skimming?," University of Florida and University of Oregon working paper.
Greene, Jay P. 1999. "The Racial, Economic, and Religious Context of Parental Choice in
Cleveland," Paper Prepared for the 1999 APPAM Meetings.
Hanushek, Eric A., John F. Kain, and Steven G. Rivkin. 2001. "New Evidence about Brown v.
Board of Education: The Complex Effects of School Racial Composition on Achievement,"
Working Paper.
n6
Huang, Gary, Sameena Salvucci, Samuel Peng, and Jeffrey Owings. 1996. "National Education
Longitudinal Study of 1988 (NELS: 88) Research Framework and Issues" National Center for
Education Statistics Working Paper No. 96-03.
Jackman, Mary R., and Marie Crane. 1986. "'Some of My Best Friends are Black': Interracial
Friendship and Whites' Racial Attitudes." Public Opinion Quarterly, 50: 459-86.
Joint Center for Political and Economic Studies. 1997. "1997 National Opinion Poll--Children's
Issues."
Lankford, Hamilton and James Wyckoff. 1992. "Primary and Secondary School Choice Among
Public and Religious Alternatives," Economics of Education Review, 11(4): 317-37.
Lankford, Hamilton and James Wyckoff. 1997. "The Effect of School Choice and Residential
Location on the Racial Segregation of Elementary Students," State University of New York -
Albany working paper.
Lankford, Hamilton, E.S. Lee, and James Wyckoff. 1995. "An Analysis of Elementary and
Secondary School Choice," Journal of Urban Economics, 38: 236-51.
Black Share of 2.6349 3.9555 1.9989 2.5790Population (Ages 5-18) (0.9944) (1.3288) (0.7387) (0.9354)
Mean of Dependent Variable 0.1117 0.0994 0.1003 0.0884Avg. Derivative Adj. Factor 0.1406 0.1312 0.1297 0.1208Sample Size 2553 1462 2870 1697
Notes: (1) The sample consists of Latino schoolchildren. (2) Standard errors are reported inparentheses and are adjusted for including multiple observations per PMSA or county. (3) All estimatesare adjusted for oversample of private school students. (4) In addition to the reported variables, allspecifications include a constant, region controls and dummy variables for age, and missing mother'seducation, father's education, religion, birth place, and family income. (5) The average derivative (ormarginal effect) is equal to the adjustment factor multiplied by the coefficient. See text for more details.
37
Table 4. Additional Probit Regressions for Probability of Attending Private School
Notes: (1) See notes to Table 3. (2) All specifictaions include the same control variables as thoseincluded in the specifications reported in Table 3. The specifications in panel (II) do not include missingbirth place, religion and family income.
33
Table 5Interaction Probit Regressions for Probability of Attending Private School Specification
Explanatory Variables
PMSA-Level8th Grade 10th Grade
(1) (2)
County-Level8th Grade 10th Grade
(3) (4)
(I) White 0.5012 0.3443 0.2869 0.1317(0.1963) (0.1722) (0.1374) (0.1450)
Black 0.1877 0.3069 0.3140 0.4037(0.2572) (0.2667) (0.2203) (0.2637)
Black Share of 2.8504 3.0049 1.6941 1.8943Population (Ages 5-18) (0.9346) (0.8801) (0.5167) (0.7484)
Black Share * White -1.1000 -0.3765 0.5138 1.0836(0.9223) (0.7238) (0.4790) (0.7081)
Black Share*Black -0.8782 -1.1026 -1.0844 -1.2714(1.0027) (1.0986) (0.7274) (0.8653)
Mean of Dependent Variable 0.1530 0.1371 0.1227 0.1052
Notes: (1) The sample consists of Latino, black and white schoolchildren in Panel (1), and the sampleconsists of Latino schoolchildren in Panels (II) and (III). (2) See notes to Table 3. (3) All specifictaionsinclude the same control variables as those included in the specifications reported in Table 3.
Appendix. Means of Selected Variables
SpecificationPMSA-Level County-Level
8th 10th 8th 10thGrade Grade Grade Grade
(1) (2) (3) (4)Female 0.5256 0.5195 0.5096 0.5077Number of Siblings 2.8139 2.7369 2.7920 2.7048Born Abroad 0.1215 0.1231 0.1254 0.1223Catholic 0.5970 0.6556 0.5965 0.6459Other Christian 0.1858 0.1778 0.1953 0.1914Mother Graduated from High School 0.2009 0.2055 0.2002 0.1988Mother Has some College 0.2881 0.2815 0.2937 0.2917Mother Graduated from College 0.0733 0.0808 0.0664 0.0730Father Graduated from High School 0.1690 0.1633 0.1745 0.1686Father Has some College 0.2368 0.2541 0.2461 0.2573Father Graduated from College 0.1222 0.1261 0.1087 0.1096Family Income: $15,000 to $25,000 0.1913 0.1980 0.1977 0.2075Family Income: $25,000 to $35,000 0.1364 0.1569 0.1377 0.1588Family Income: $35,000 to $50,000 0.1216 0.1298 0.1159 0.1208Family Income: $50,000 to $100,000 0.0798 0.0966 0.0737 0.0839Family Income more than $100,000 0.0121 0.0147 0.0111 0.0134Public School Student-Teacher Ratio 19.3323 19.2087 19.2429 19.0260Public School Expenditures per Pupil 5.3212 5.2330 5.1822 5.0928Public School Graduation Rate 0.9364 0.9572 0.9367 0.9551Private School Student-Teacher Ratio 14.5817 14.5295 14.4760 14.4267Serious Crime Rate 0.0712 0.0756 0.0686 0.0710Poverty Rate (Ages 5-17) 0.2254 0.2316 0.2450 0.2458Dist. to Closest Private School (Km) 2.3935 2.5528 5.3410 6.5620Distance Squared / 100 0.3377 0.3322 3.3560 4.5496Black Share 0.1336 0.1228 0.1265 0.1093Sample Size 2553 1462 2870 1697Note: Samples are the same as those used in Table 3.
40
U.S. Department of EducationOffice of Educational Research and Improvement (OERI)
National Library of Education (NLE)
Educational Resources Information Center (ERIC)
NOTICE
Reproduction Basis
Ebullient!' Resoluta Inlornmilon Centel
This document is covered by a signed "Reproduction Release (Blanket)"form (on file within the ERIC system), encompassing all or classes ofdocuments from its source organization and, therefore, does not require a"Specific Document" Release form.
This document is Federally-funded, or carries its own permission toreproduce, or is otherwise in the public domain and, therefore, may bereproduced by ERIC without a signed Reproduction Release form (either"Specific Document" or "Blanket").